Recensione del MIni PC Impact Display Solutions IMP-3654-B1-R: Core i9 con raffreddamento passivo
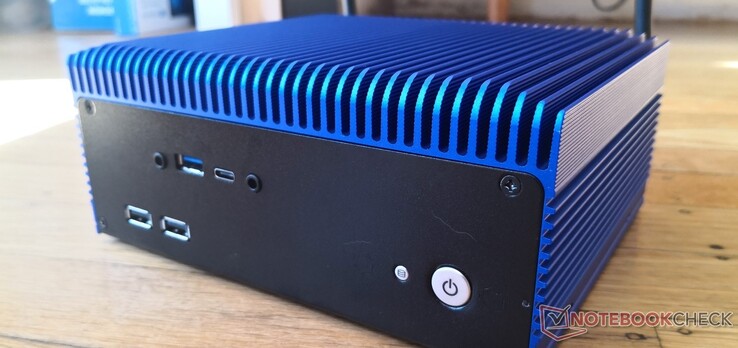
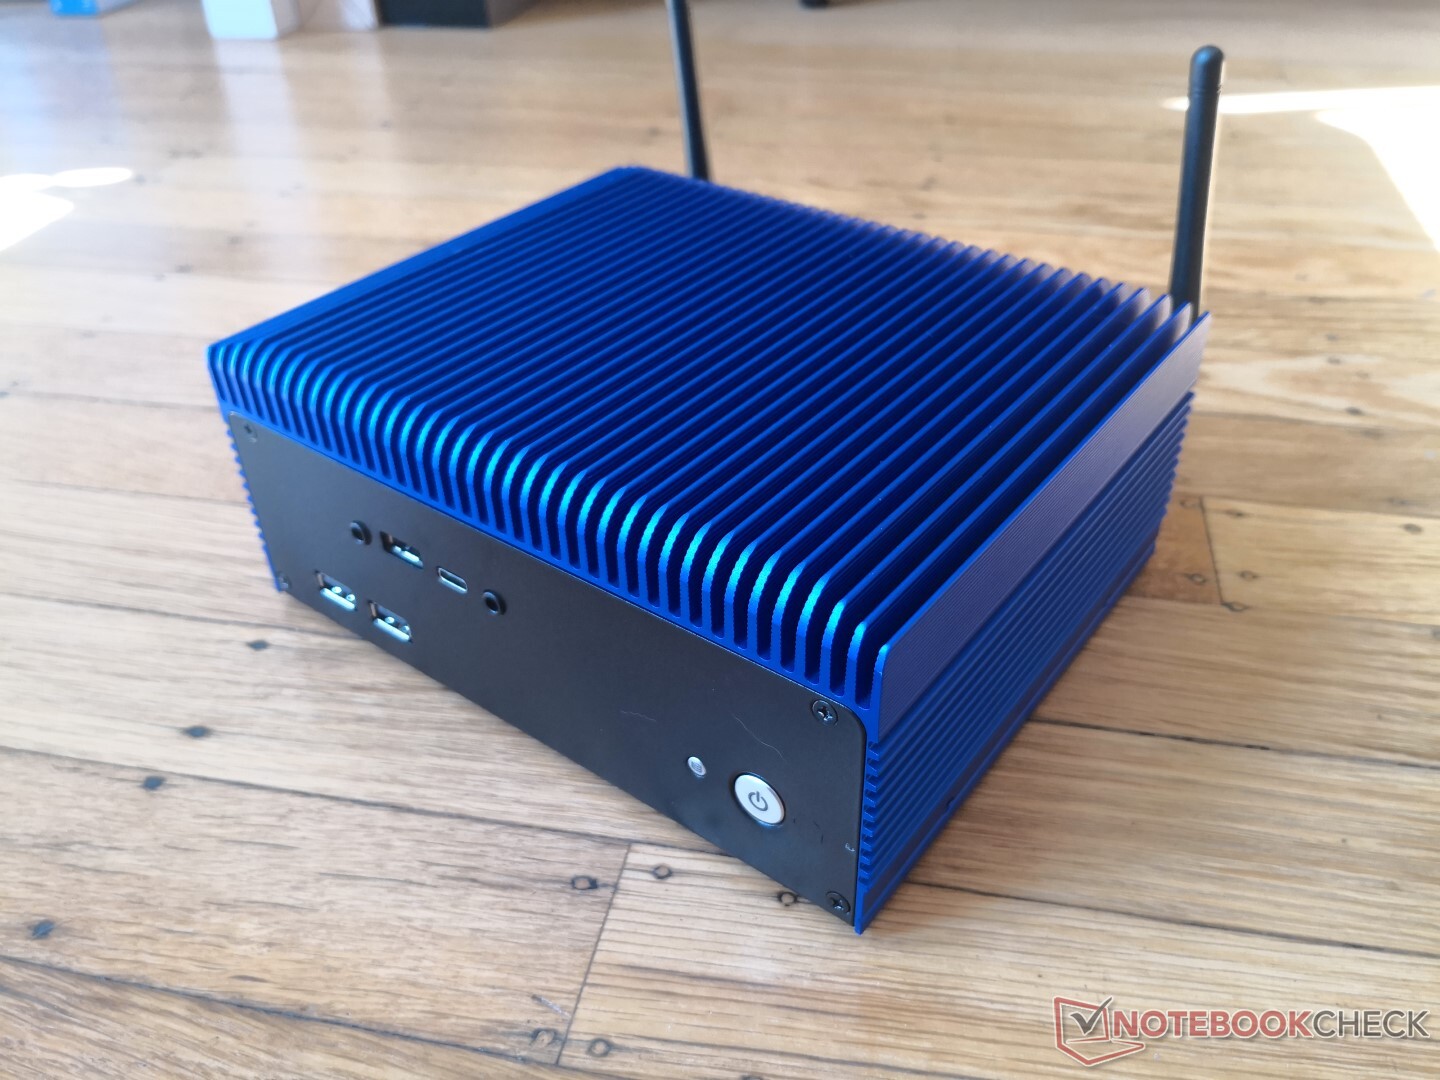
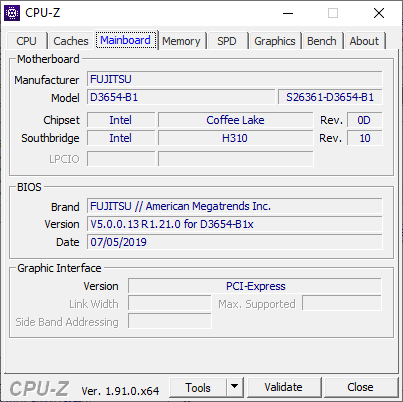
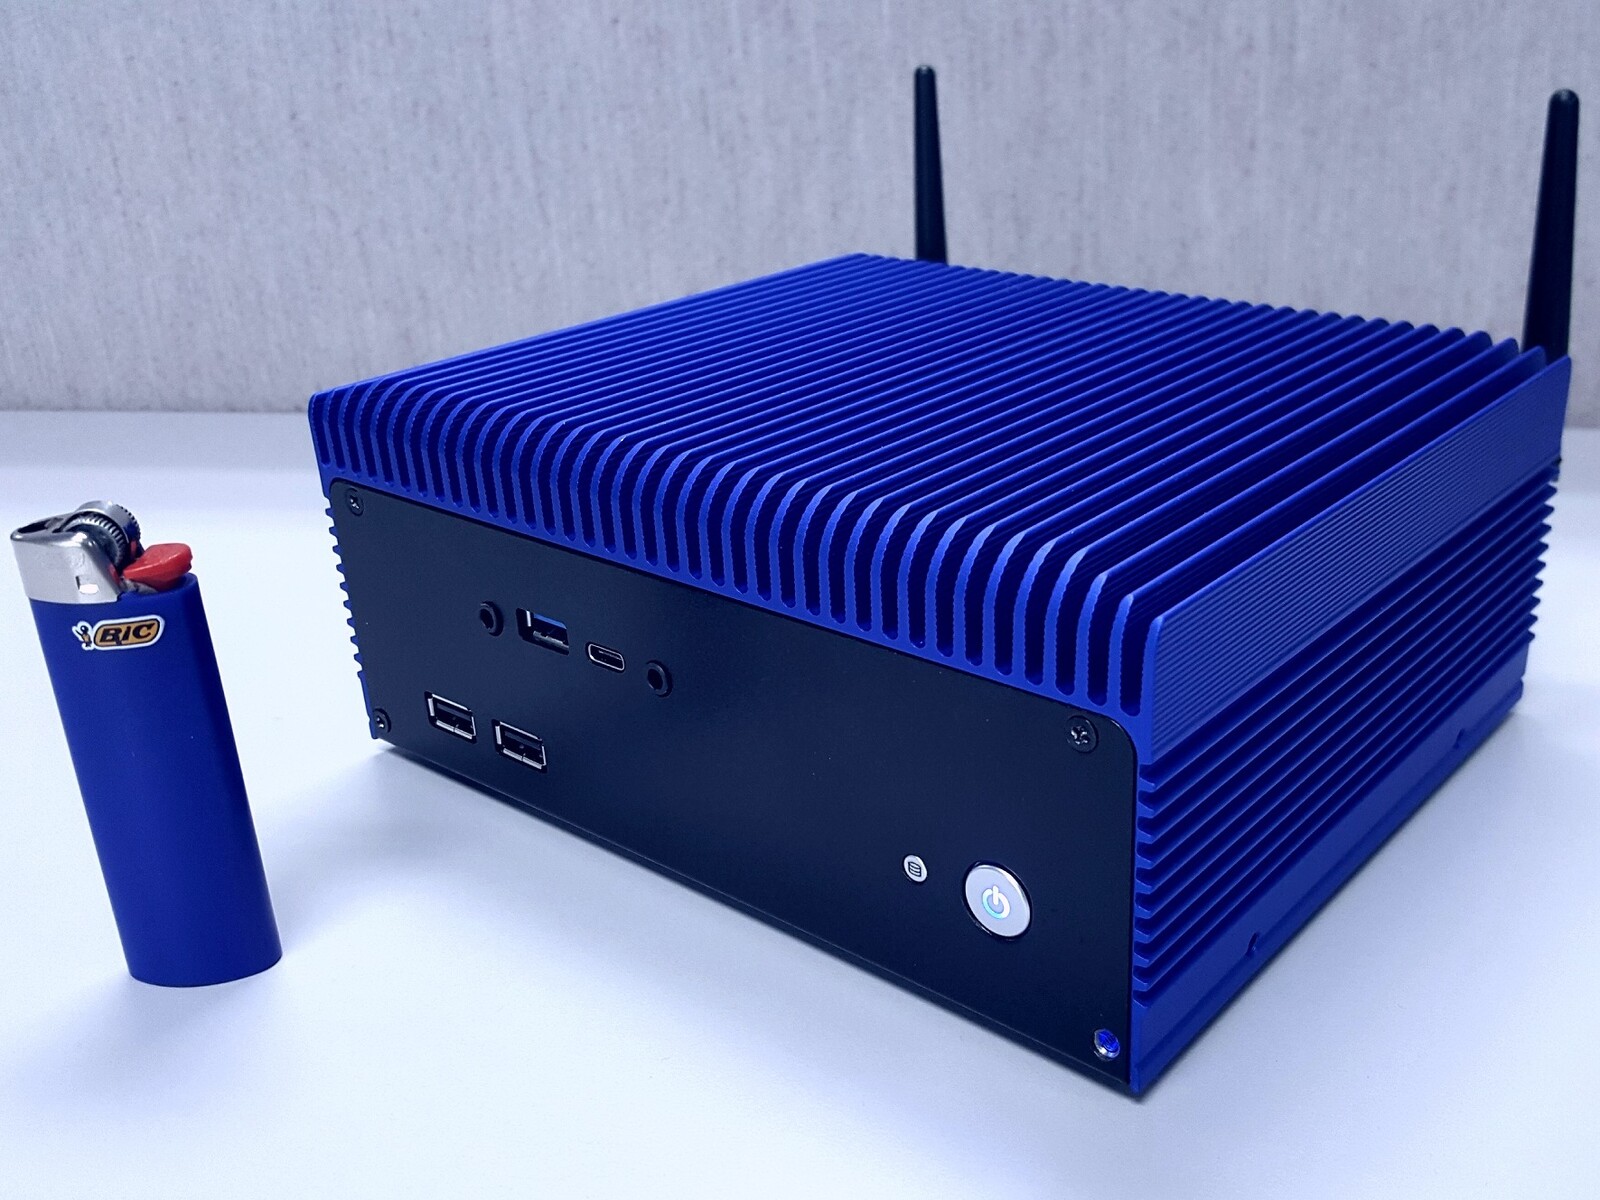
L'IMP-3654-B1-B è un mini PC senza ventola di Impact Display Solutions basato sulla scheda madre mini-STX D3654-B di Kontron. Utilizza un grande dissipatore di calore al posto di una ventola per un'esperienza completamente silenziosa, non dissimile dallo Zotac ZBox CI660 Nano.
Ulteriori informazioni sull'IMP-3654-B1-B si trovano nella pagina delle specifiche ufficiali e nella pagina del prdotto. Un elenco di altri mini PC di Impact Display Solutions si trova qui. Per questa recensione, ci concentreremo sulle prestazioni del mini PC e su come gestisce una CPU Core i9-9900T senza usare alcuna ventola.
Comunicazioni
| Networking | |
| iperf3 transmit AX12 | |
| Impact Display Solutions IMP-3654-B1-R Core i9-9900T | |
| iperf3 receive AX12 | |
| Impact Display Solutions IMP-3654-B1-R Core i9-9900T | |
Prestazioni
Processore
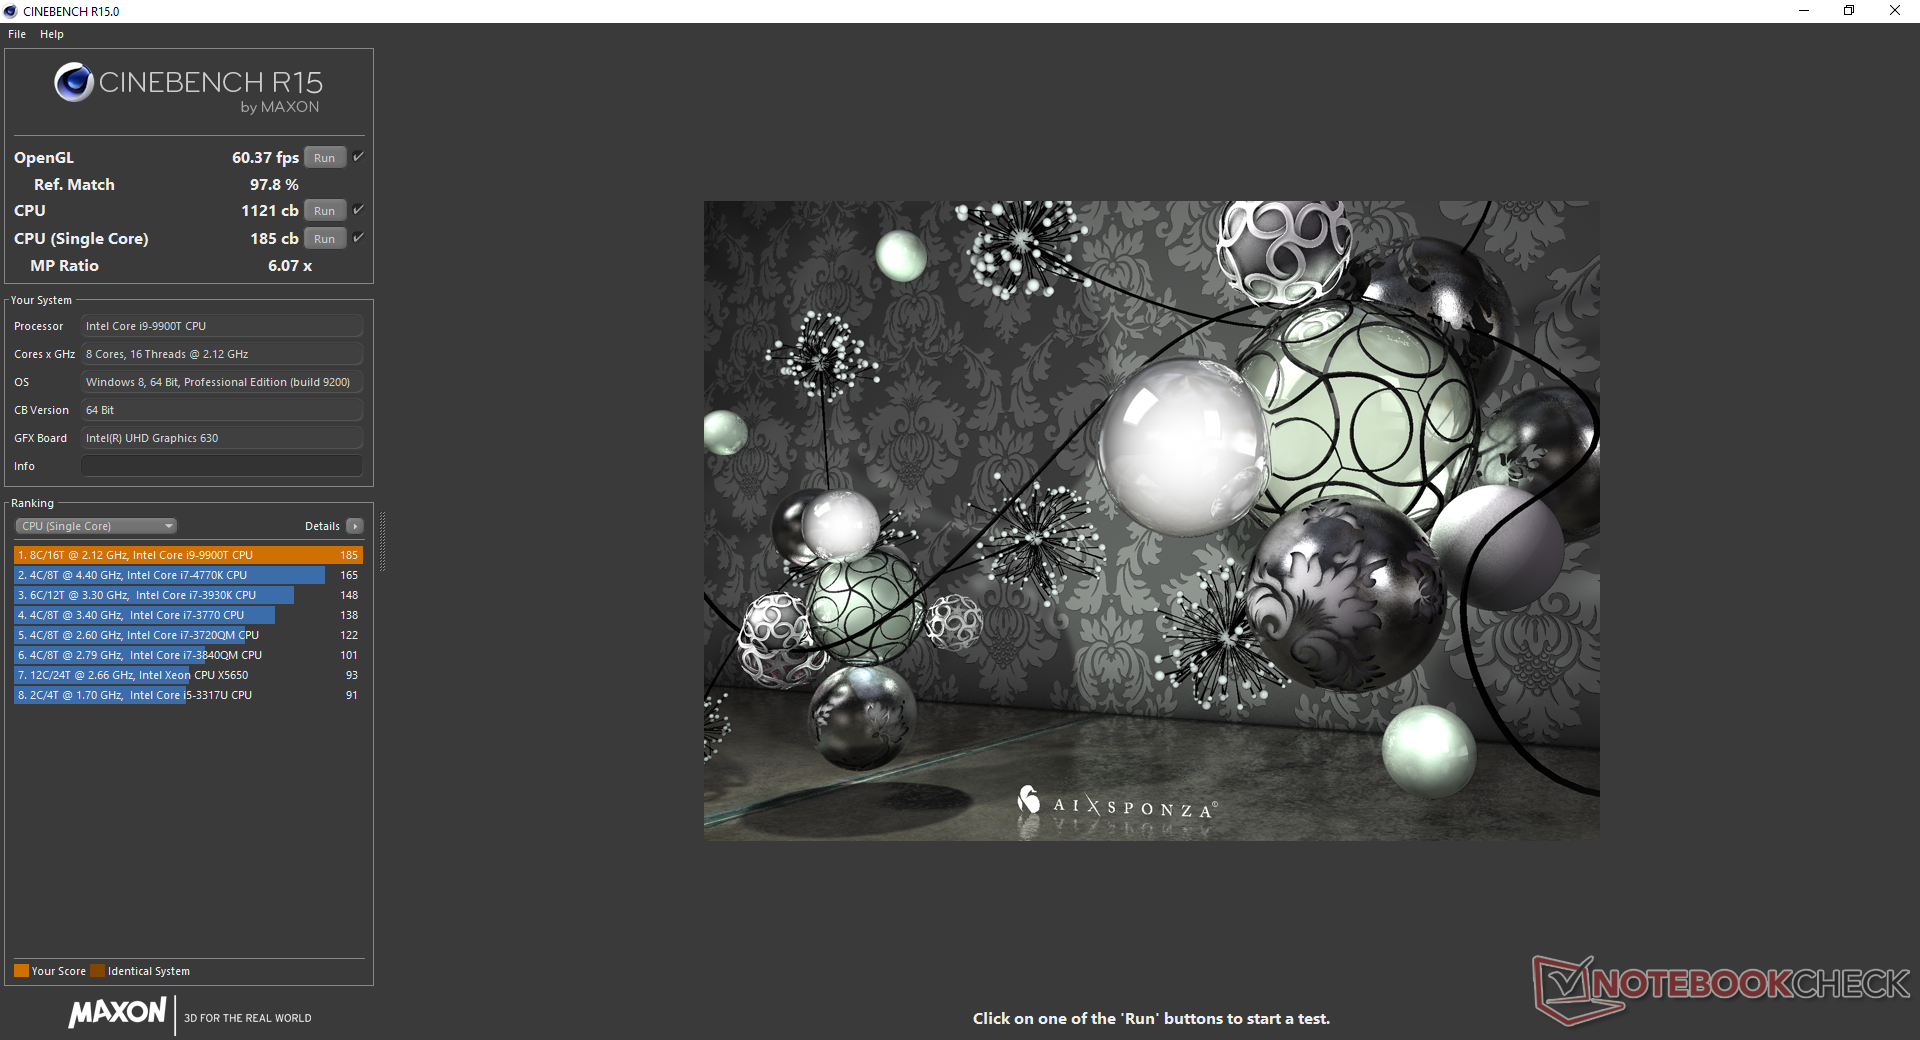
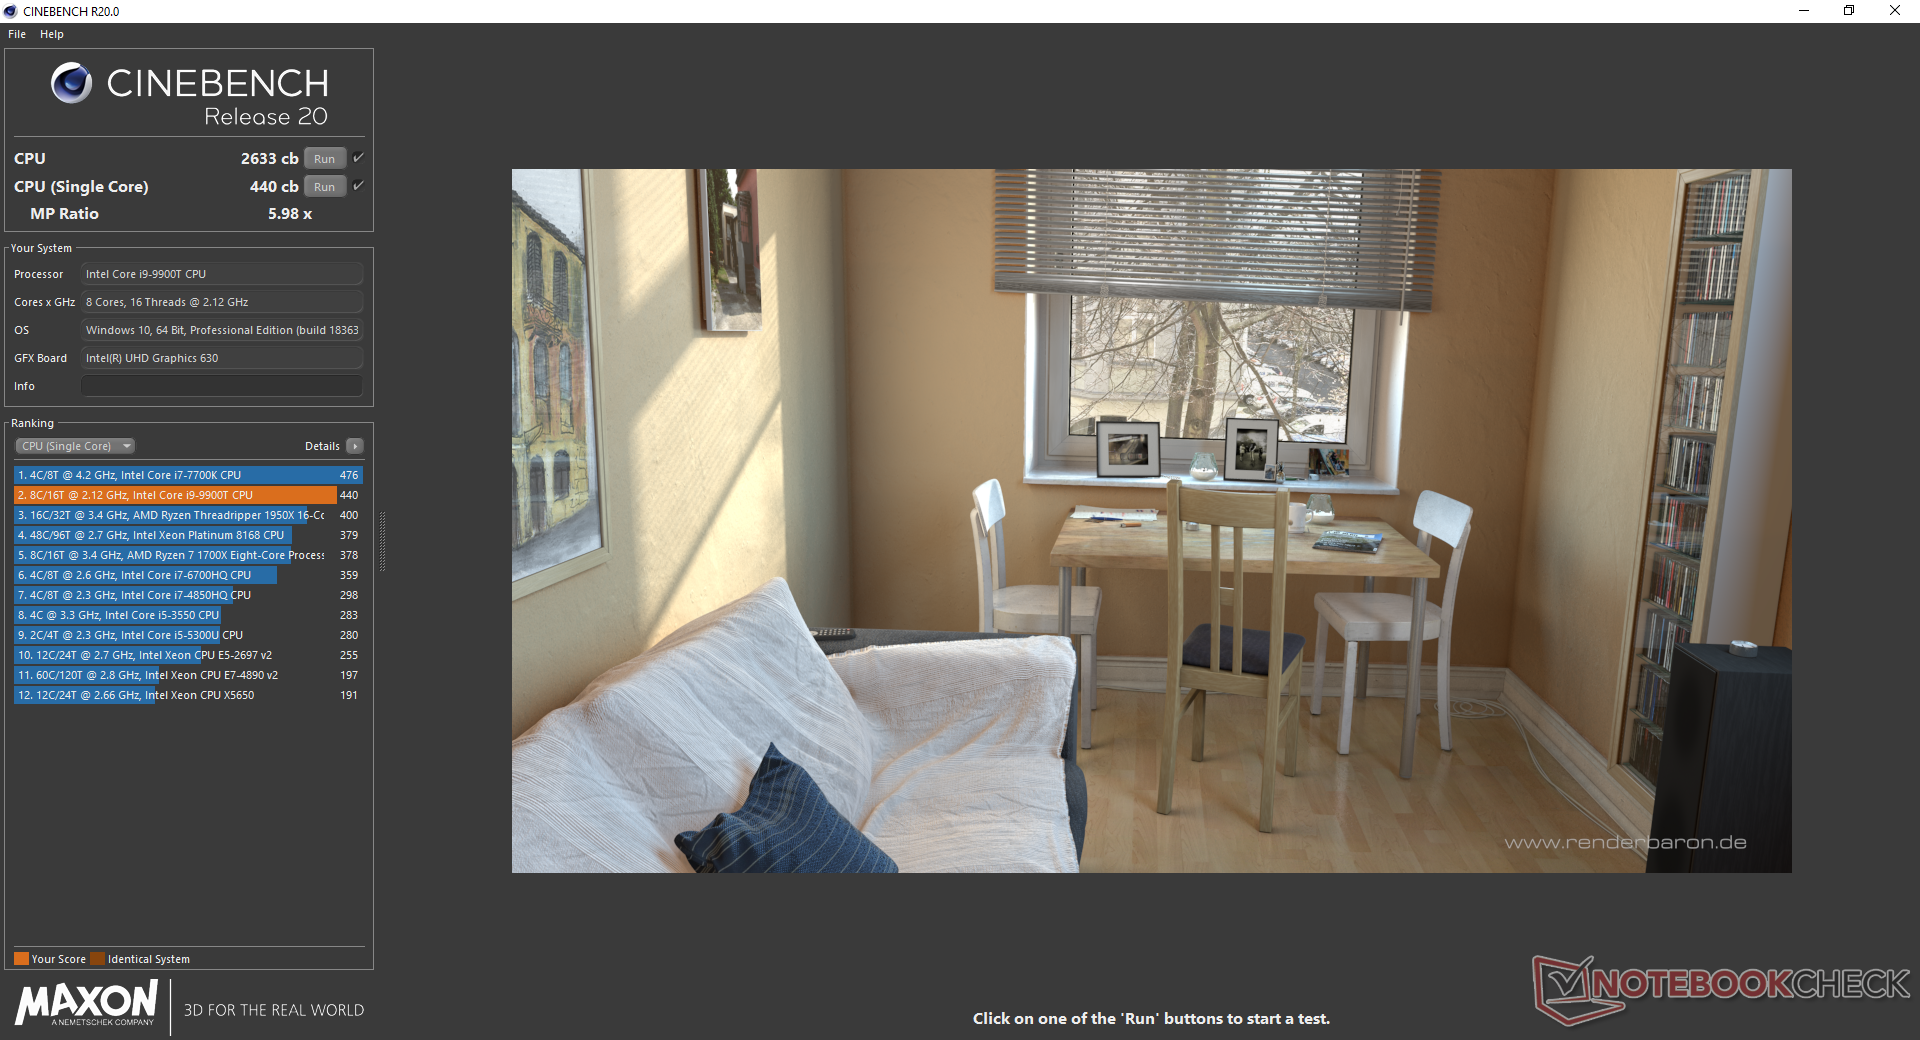
Siamo in grado di valutare le prestazioni della CPU nel tempo eseguendo CineBench R15 Multi-Thread in loop. Le prestazioni rimangono stabili ad un punteggio di circa 1100 punti fino ad un brusco calo a 390 punti come mostrato dal grafico sottostante. Stranamente, le prestazioni tornano di nuovo alla normalità verso la fine del test. Analizziamo ulteriormente questo fenomeno nella nostra sezione Stress Test.
| wPrime 2.10 - 1024m | |
| Intel Hades Canyon NUC8i7HVK | |
| Intel NUC10i7FNH | |
| Impact Display Solutions IMP-3654-B1-R Core i9-9900T | |
| Corsair One i160 | |
| Asus Zephyrus G14 GA401IV | |
* ... Meglio usare valori piccoli
Prestazioni di sistema
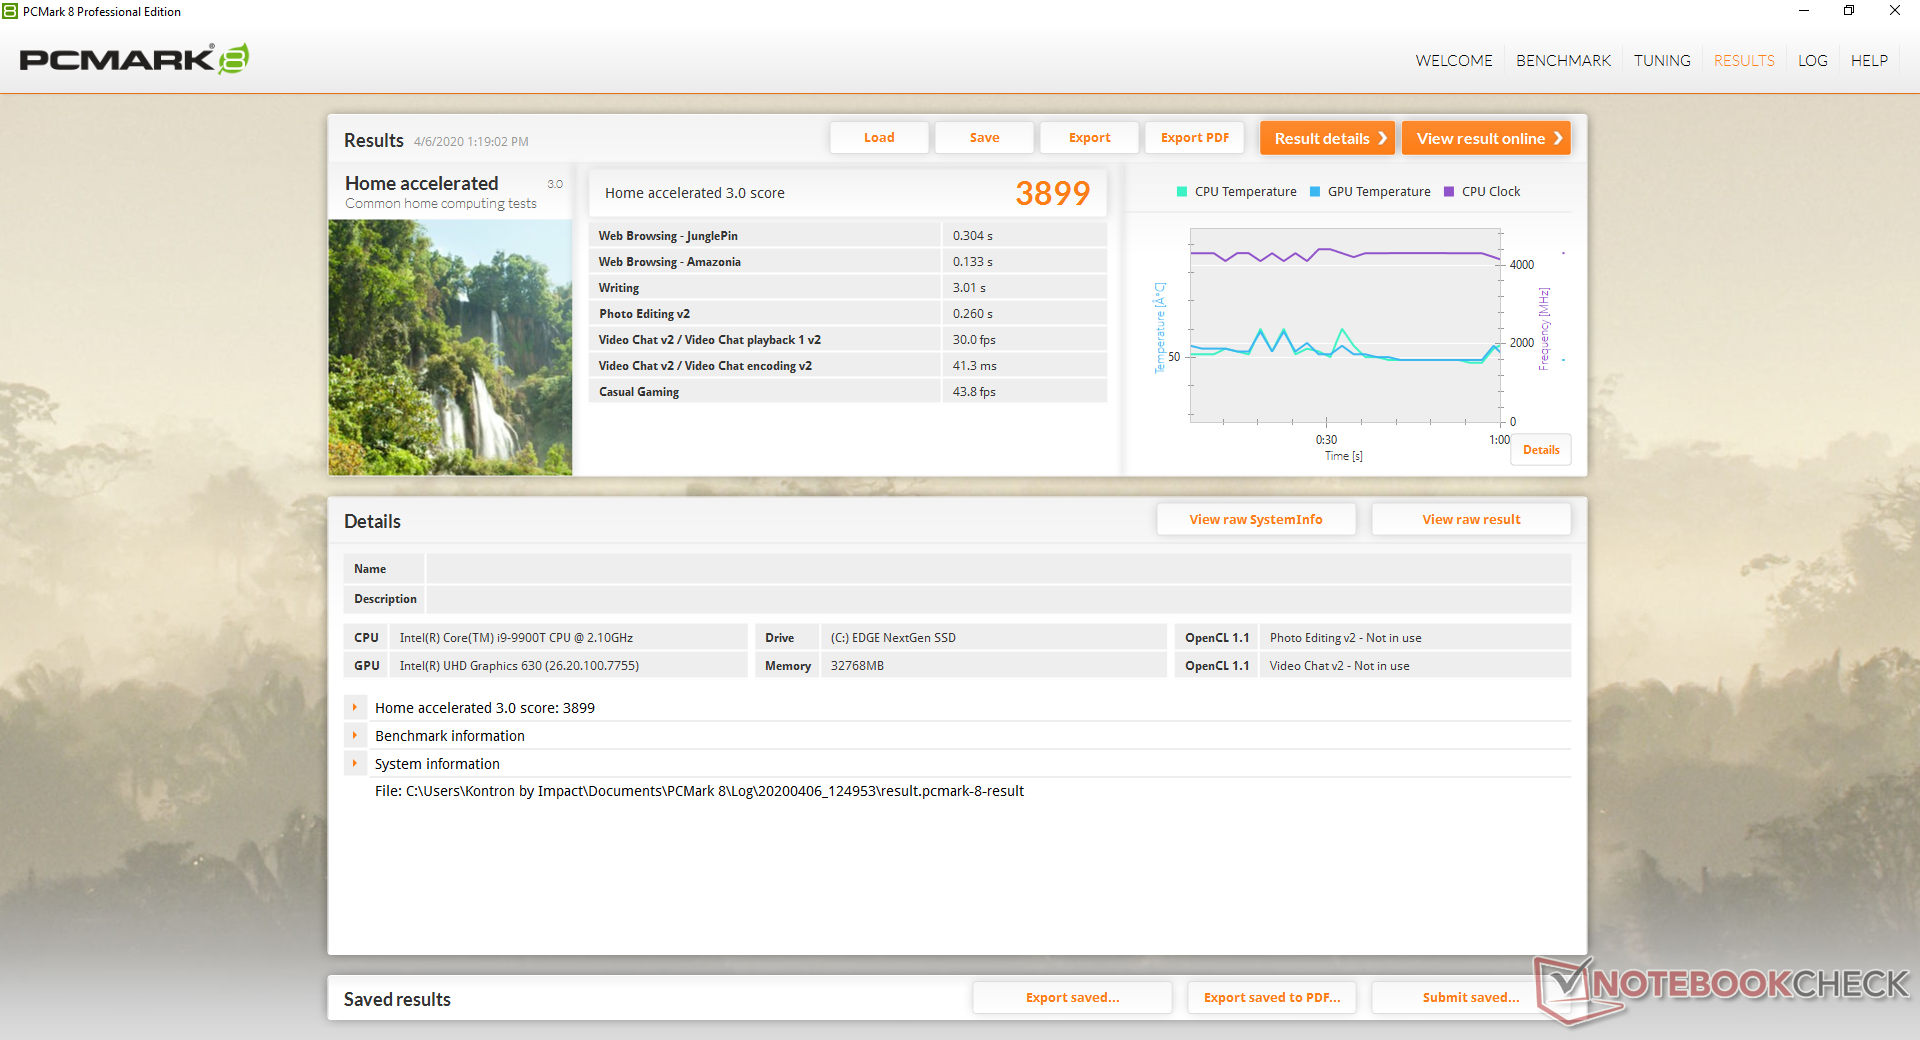
| PCMark 8 Home Score Accelerated v2 | 3899 punti | |
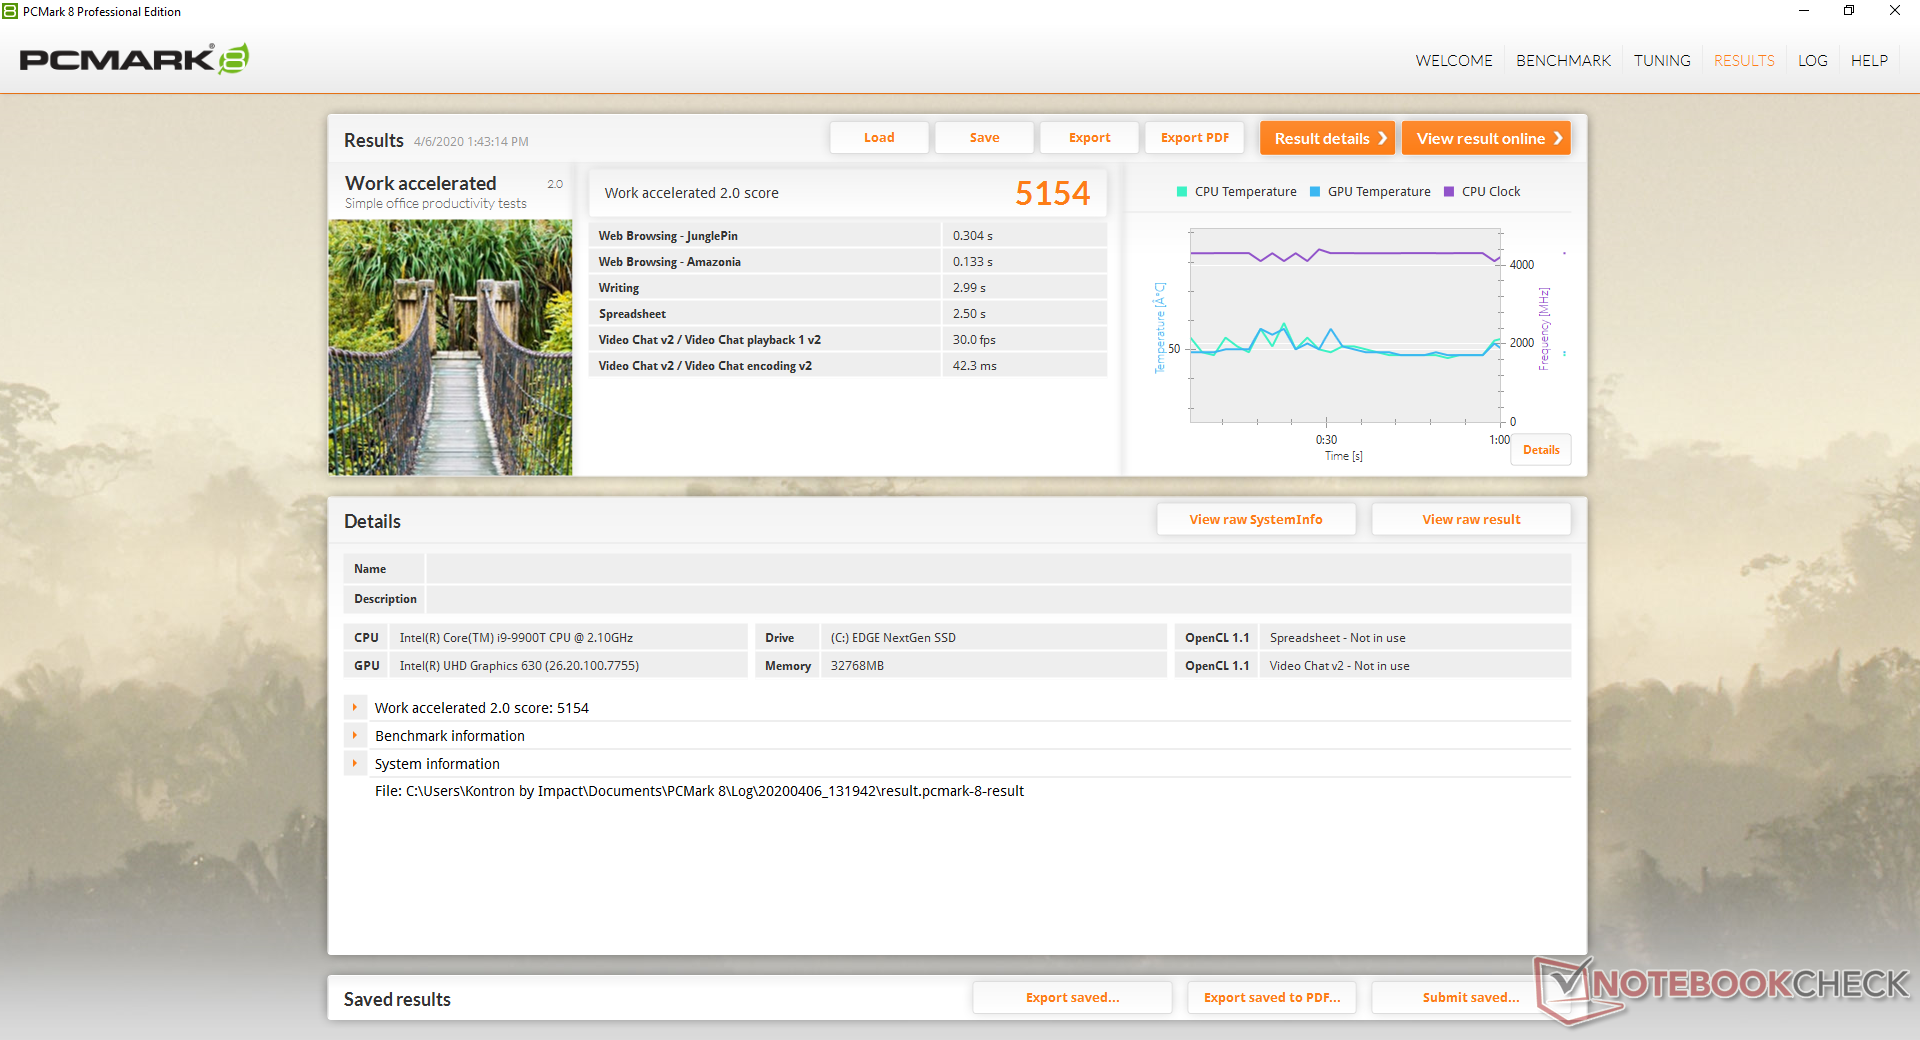
| PCMark 8 Work Score Accelerated v2 | 5154 punti | |
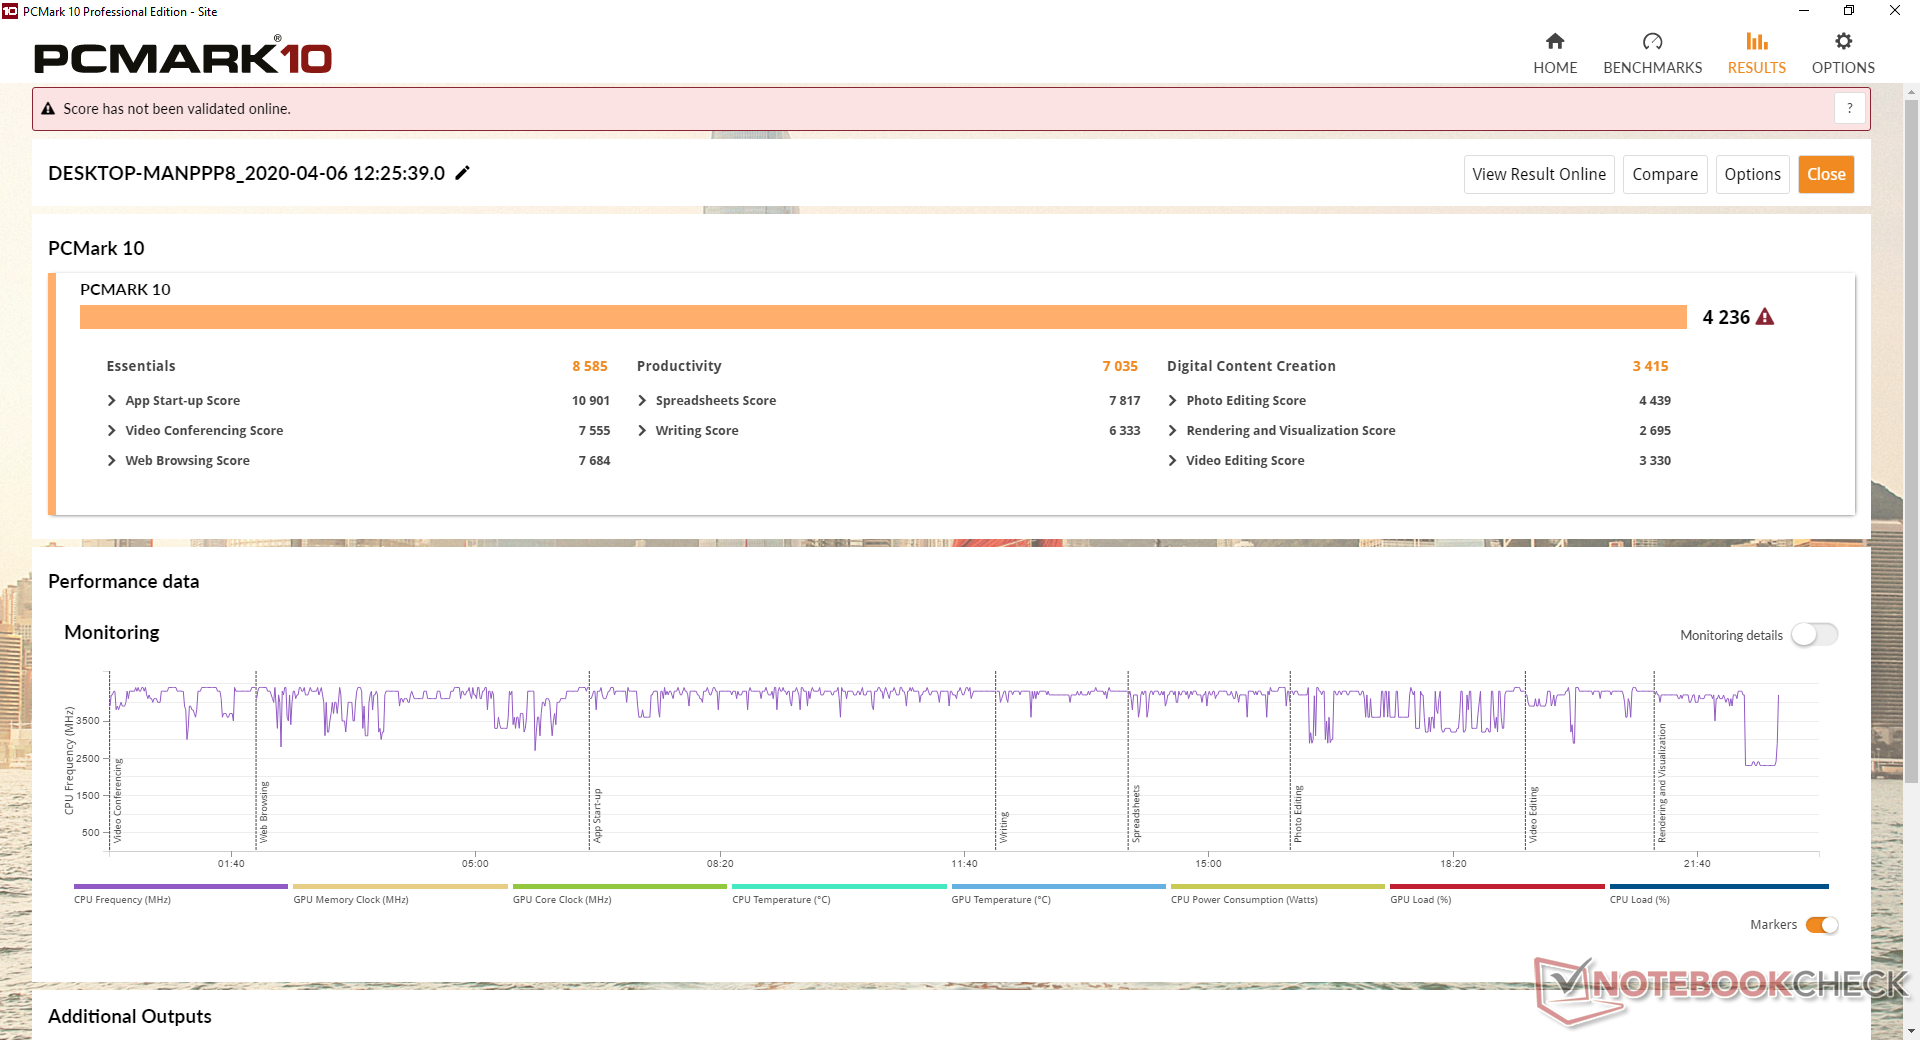
| PCMark 10 Score | 4236 punti | |
Aiuto | ||
Dispositivi di archiviazione
| Impact Display Solutions IMP-3654-B1-R Core i9-9900T EDGE NextGen SSD 1TB | Intel Hades Canyon NUC8i7HVK Intel Optane 120 GB SSDPEK1W120GA | Intel NUC10i7FNH Kingston RBUSNS8154P3256GJ1 | Zotac ZBOX Magnus EK71080 Samsung PM961 MZVLW256HEHP | Intel NUC7CJYH SanDisk Ultra II | |
|---|---|---|---|---|---|
| AS SSD | 62% | 0% | 46% | -37% | |
| Seq Read (MB/s) | 1218 | 1379 13% | 1306 7% | 2119 74% | 480 -61% |
| Seq Write (MB/s) | 1306 | 553 -58% | 611 -53% | 1205 -8% | 464.8 -64% |
| 4K Read (MB/s) | 25.97 | 127.9 392% | 21.53 -17% | 46.69 80% | 26.98 4% |
| 4K Write (MB/s) | 43.25 | 103.5 139% | 53.5 24% | 105.2 143% | 47.43 10% |
| 4K-64 Read (MB/s) | 578 | 1258 118% | 652 13% | 1170 102% | 420.5 -27% |
| 4K-64 Write (MB/s) | 520 | 556 7% | 648 25% | 443.8 -15% | 174.6 -66% |
| Access Time Read * (ms) | 0.118 | 0.025 79% | 0.114 3% | 0.06 49% | 0.115 3% |
| Access Time Write * (ms) | 0.286 | 0.033 88% | 0.07 76% | 0.04 86% | 0.089 69% |
| Score Read (Points) | 726 | 1524 110% | 804 11% | 1429 97% | 498 -31% |
| Score Write (Points) | 694 | 714 3% | 762 10% | 669 -4% | 268 -61% |
| Score Total (Points) | 1800 | 3023 68% | 1944 8% | 2791 55% | 1025 -43% |
| Copy ISO MB/s (MB/s) | 2082 | 1125 -46% | 976 -53% | 1649 -21% | 197 -91% |
| Copy Program MB/s (MB/s) | 422.8 | 342.4 -19% | 346 -18% | 468 11% | 102 -76% |
| Copy Game MB/s (MB/s) | 1072 | 768 -28% | 735 -31% | 1010 -6% | 175.5 -84% |
| CrystalDiskMark 5.2 / 6 | 7% | 94% | 9% | -64% | |
| Write 4K (MB/s) | 111.8 | 133.7 20% | 442.4 296% | 132.7 19% | 61.1 -45% |
| Read 4K (MB/s) | 56.8 | 178.6 214% | 371.1 553% | 44.48 -22% | 31.99 -44% |
| Write Seq (MB/s) | 1148 | 608 -47% | 900 -22% | 1193 4% | 421.7 -63% |
| Read Seq (MB/s) | 1522 | 1428 -6% | 1582 4% | 1371 -10% | 427.4 -72% |
| Write 4K Q32T1 (MB/s) | 399.7 | 323.6 -19% | 373.8 -6% | 398.5 0% | 97 -76% |
| Read 4K Q32T1 (MB/s) | 570 | 282.3 -50% | 374.9 -34% | 483.5 -15% | 121.9 -79% |
| Write Seq Q32T1 (MB/s) | 1375 | 627 -54% | 893 -35% | 1202 -13% | 504 -63% |
| Read Seq Q32T1 (MB/s) | 1626 | 1521 -6% | 1582 -3% | 3388 108% | 551 -66% |
| Write 4K Q8T8 (MB/s) | 399.1 | 183.1 | |||
| Read 4K Q8T8 (MB/s) | 688 | 221.3 | |||
| Media totale (Programma / Settaggio) | 35% /
42% | 47% /
34% | 28% /
32% | -51% /
-47% |
* ... Meglio usare valori piccoli

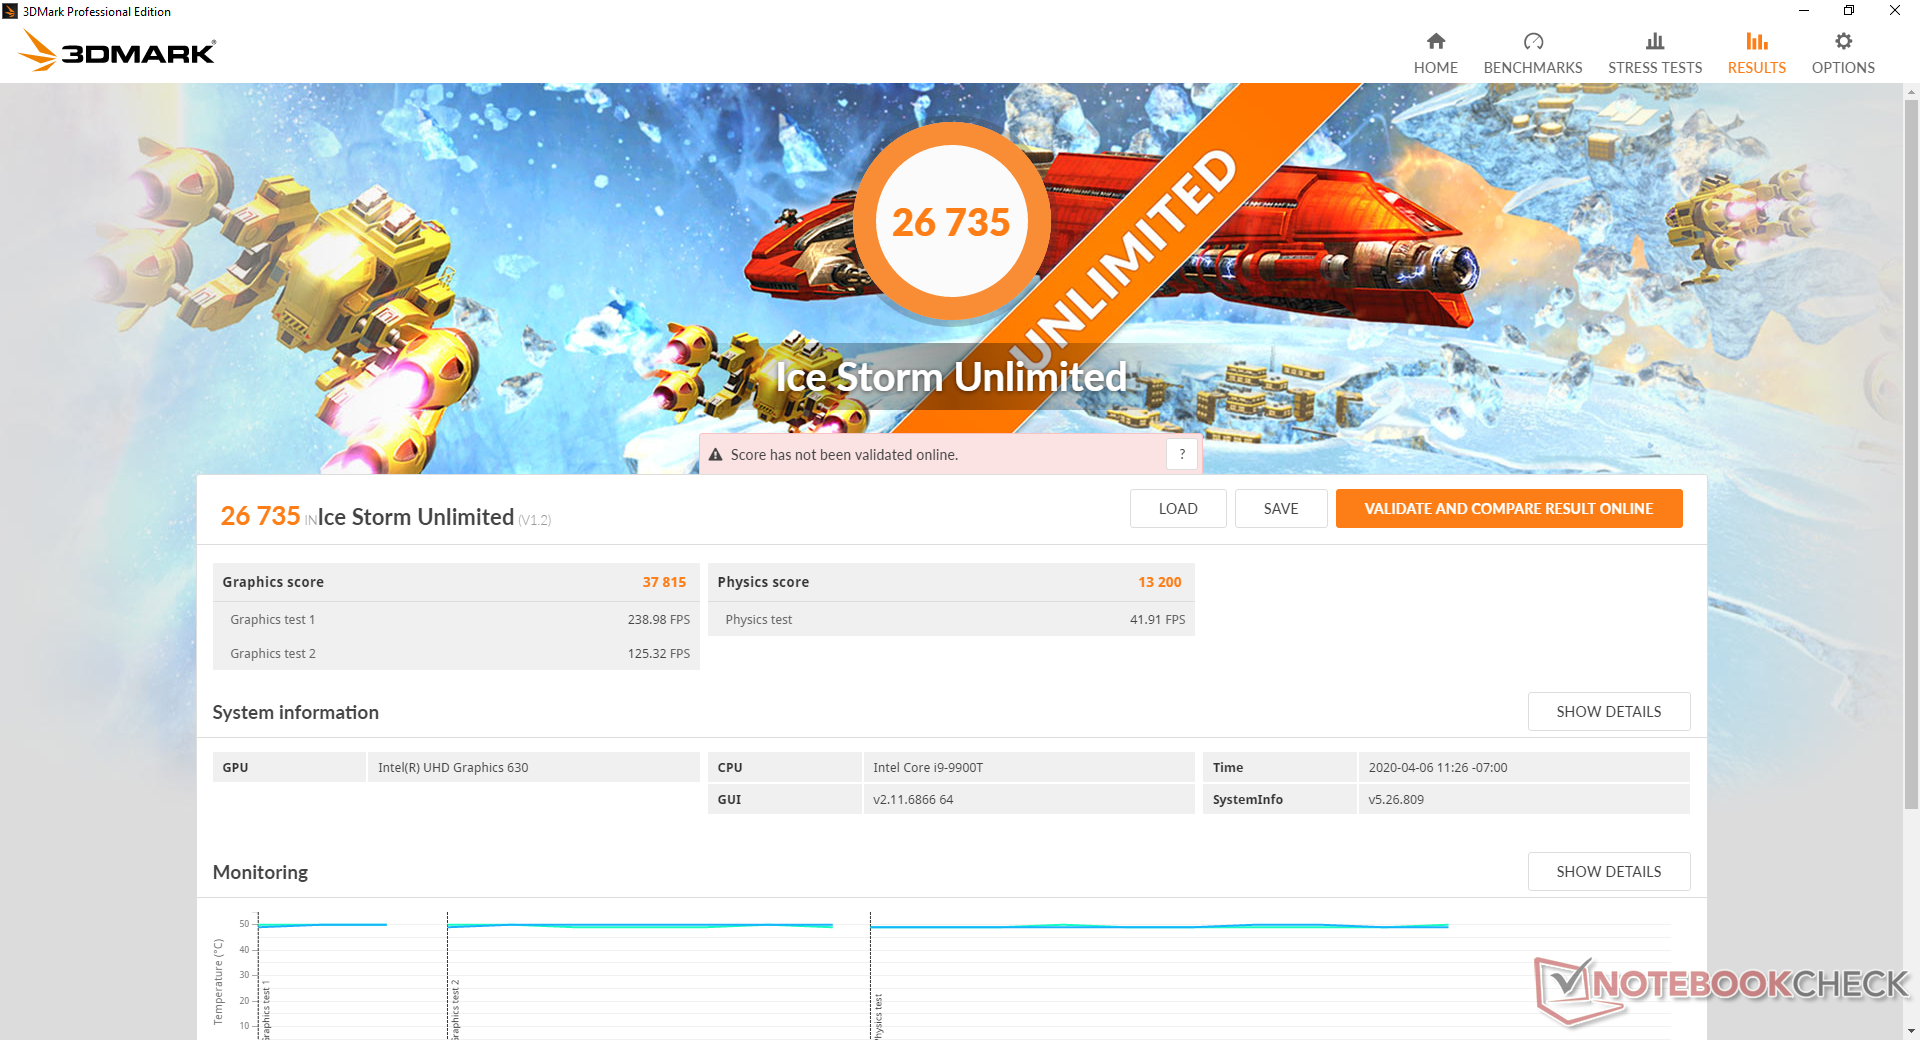
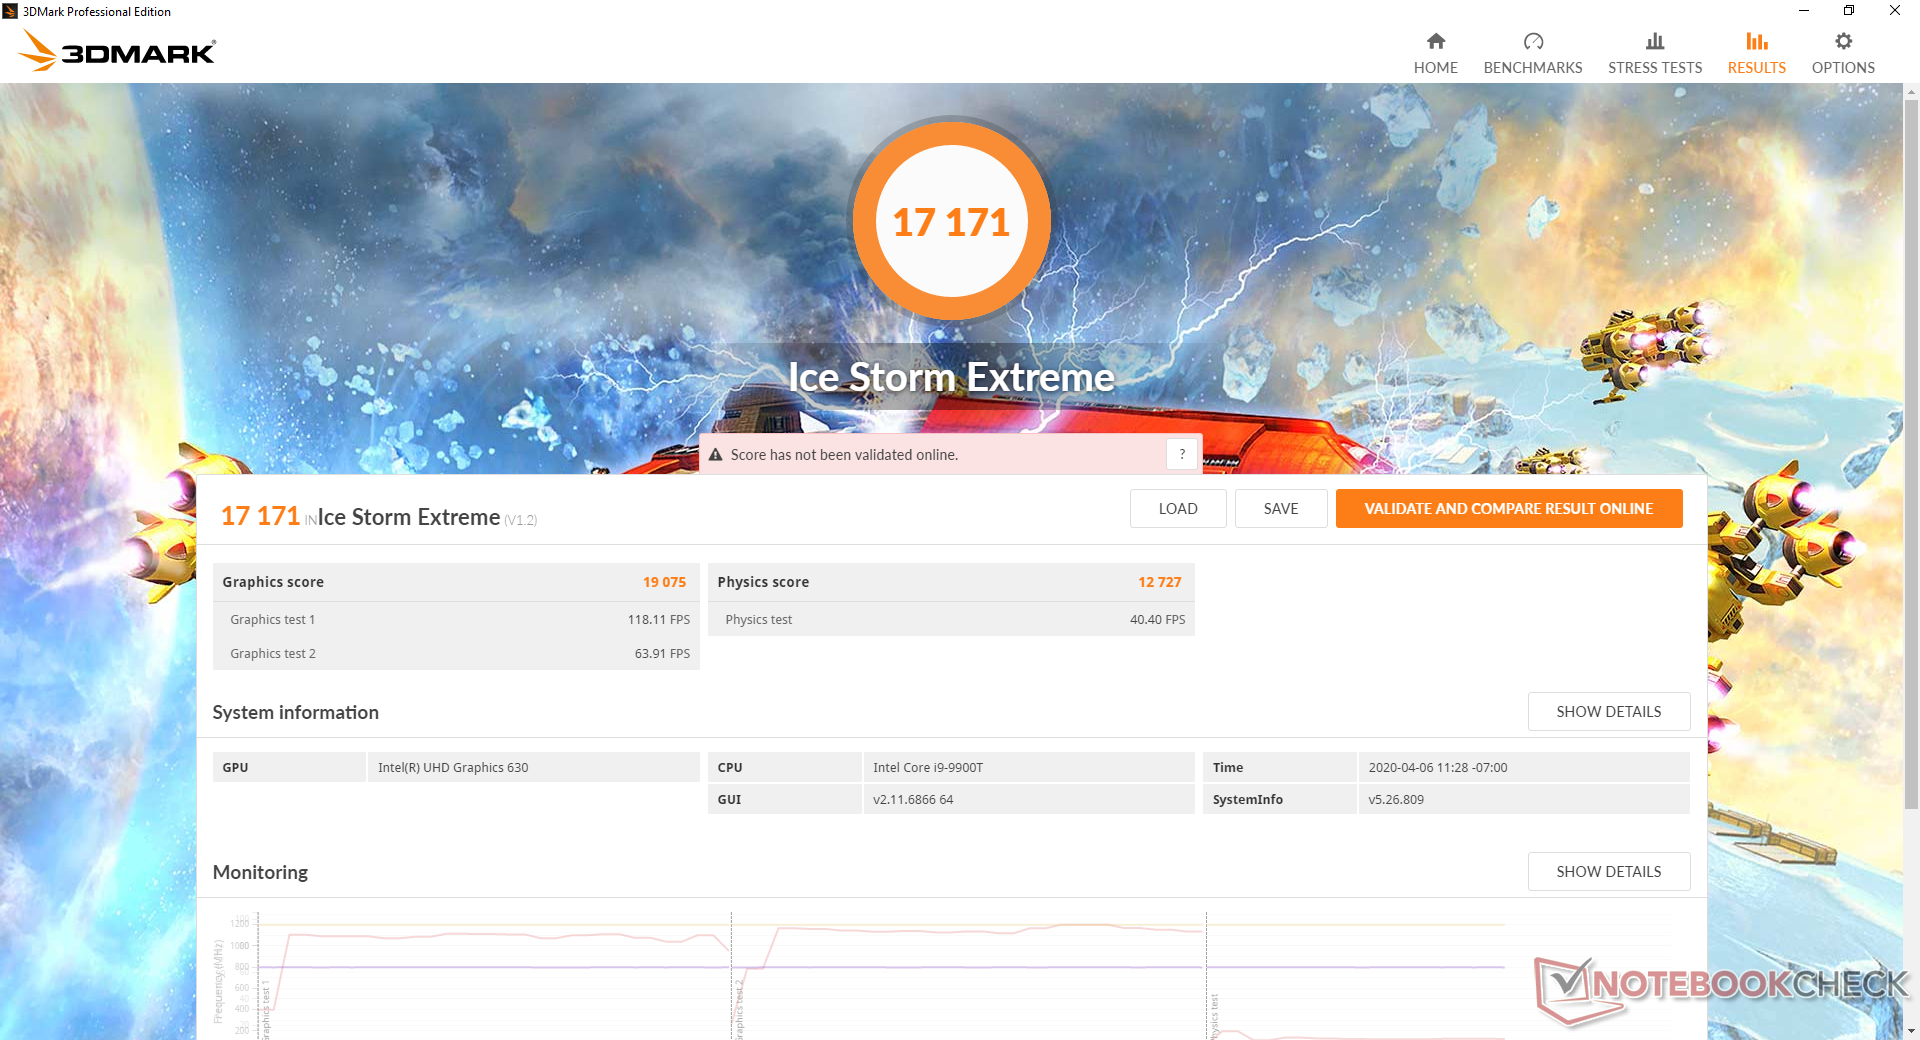
Prestazioni GPU
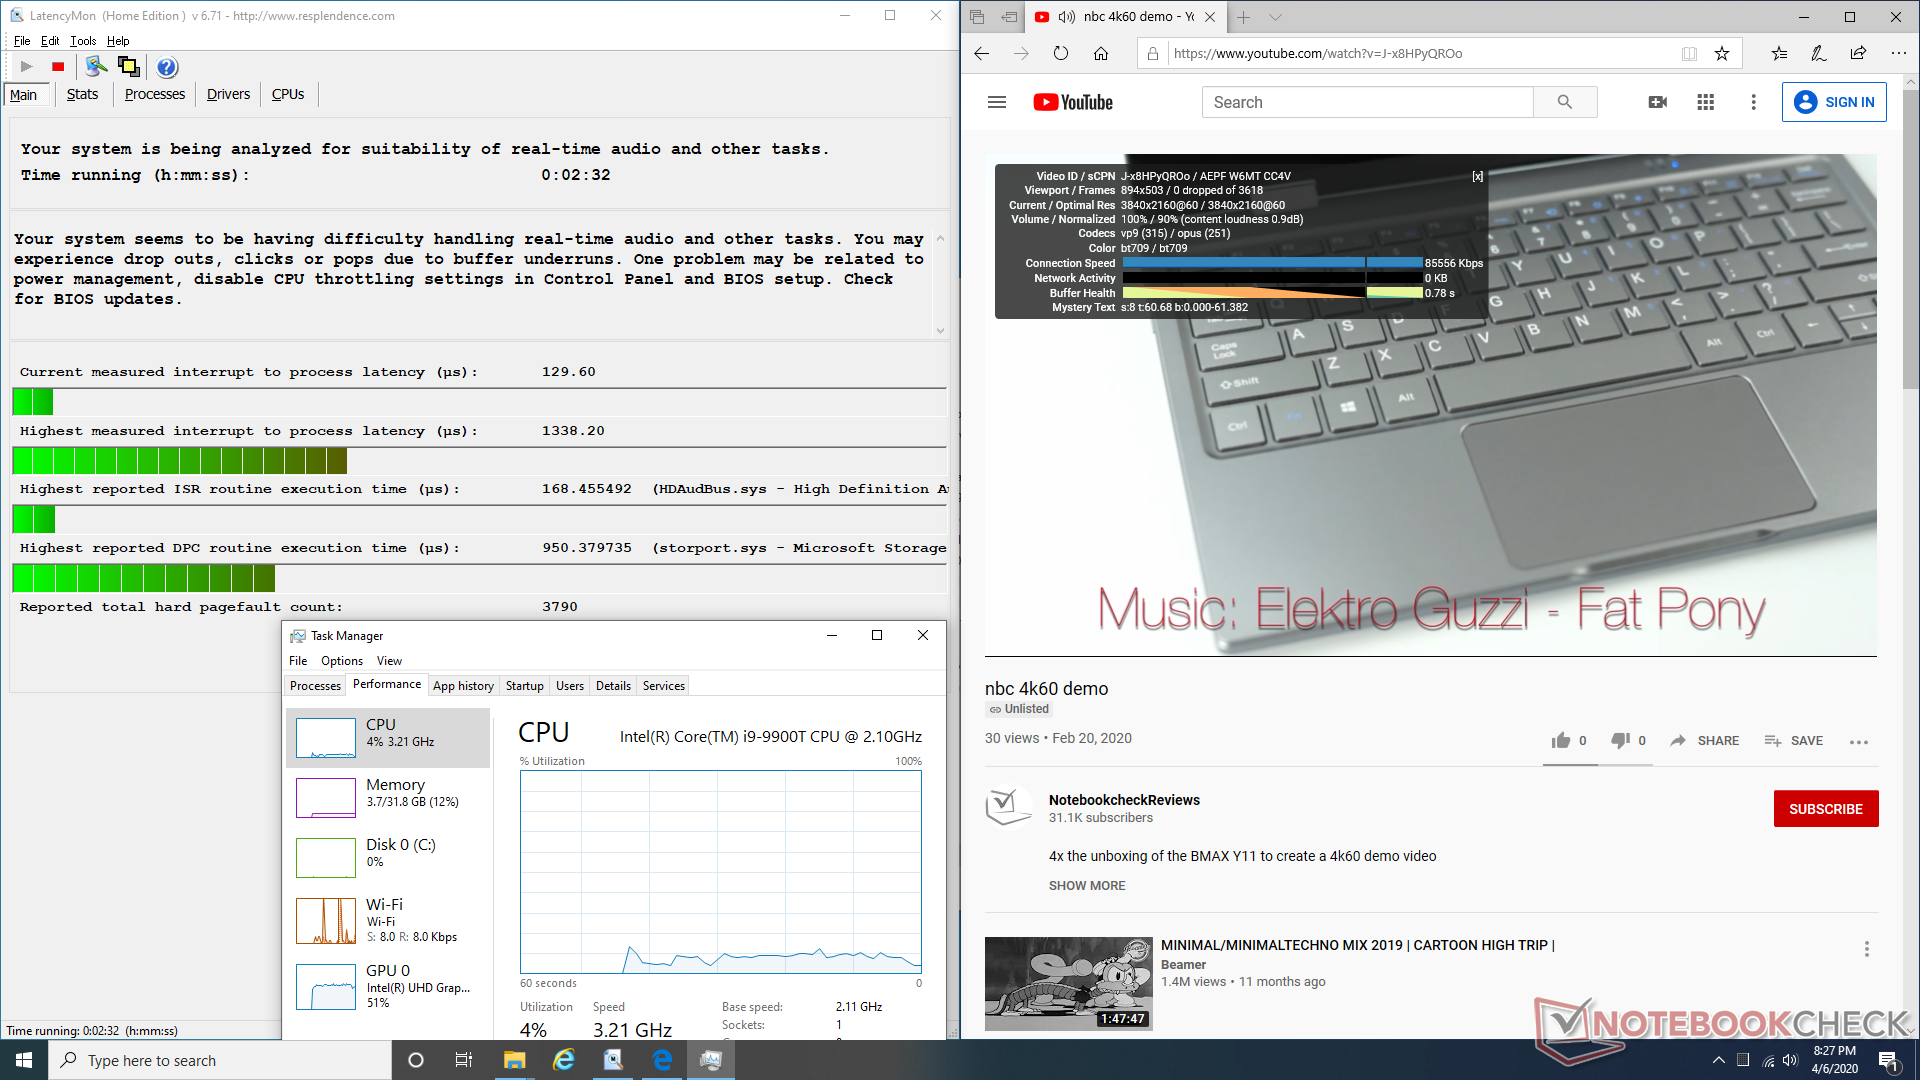
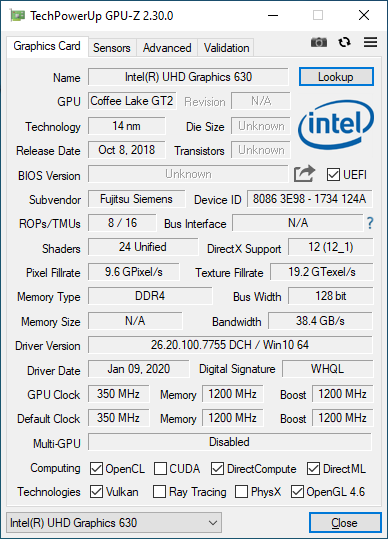
La serie UHD Graphics di Intel risale ad anni fa ed è obsoleta nel 2020. Gli utenti alla ricerca di una maggiore potenza grafica integrata dovrebbero invece prendere in considerazione la serie Iris Plus o la serie concorrente RX Vega, che può offrire prestazioni quasi due volte superiori allo stesso livello di potenza termica o meno. Per la navigazione web standard e la riproduzione 4K, tuttavia, sarà sufficiente la UHD Graphics. Non siamo in grado di registrare alcun calo di fotogramma durante la riproduzione del nostro video di prova 4K UHD YouTube da un minuto.
| 3DMark 06 Standard Score | 13646 punti | |
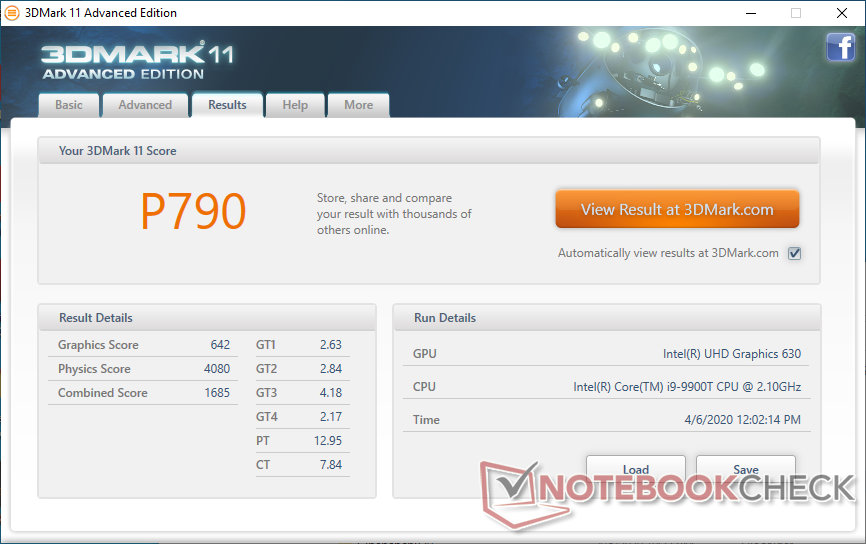
| 3DMark 11 Performance | 790 punti | |
| 3DMark Ice Storm Standard Score | 28176 punti | |
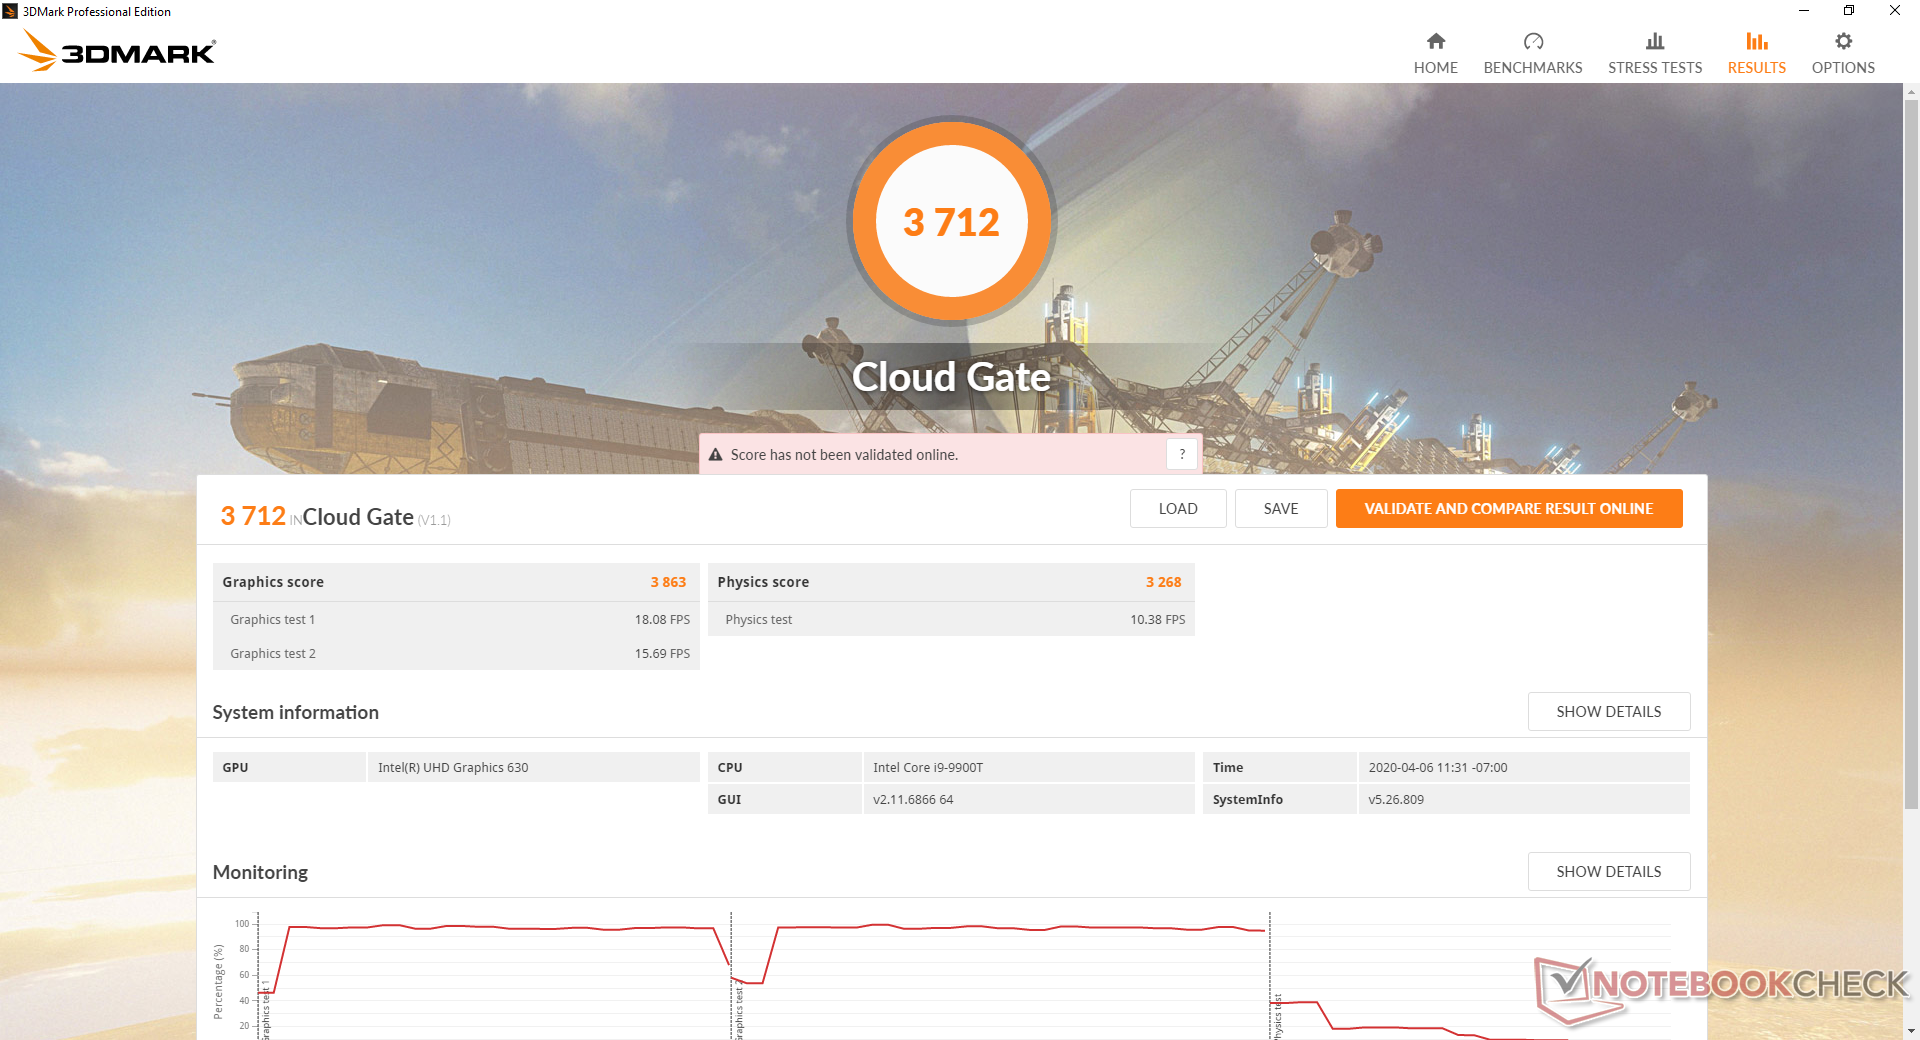
| 3DMark Cloud Gate Standard Score | 3712 punti | |
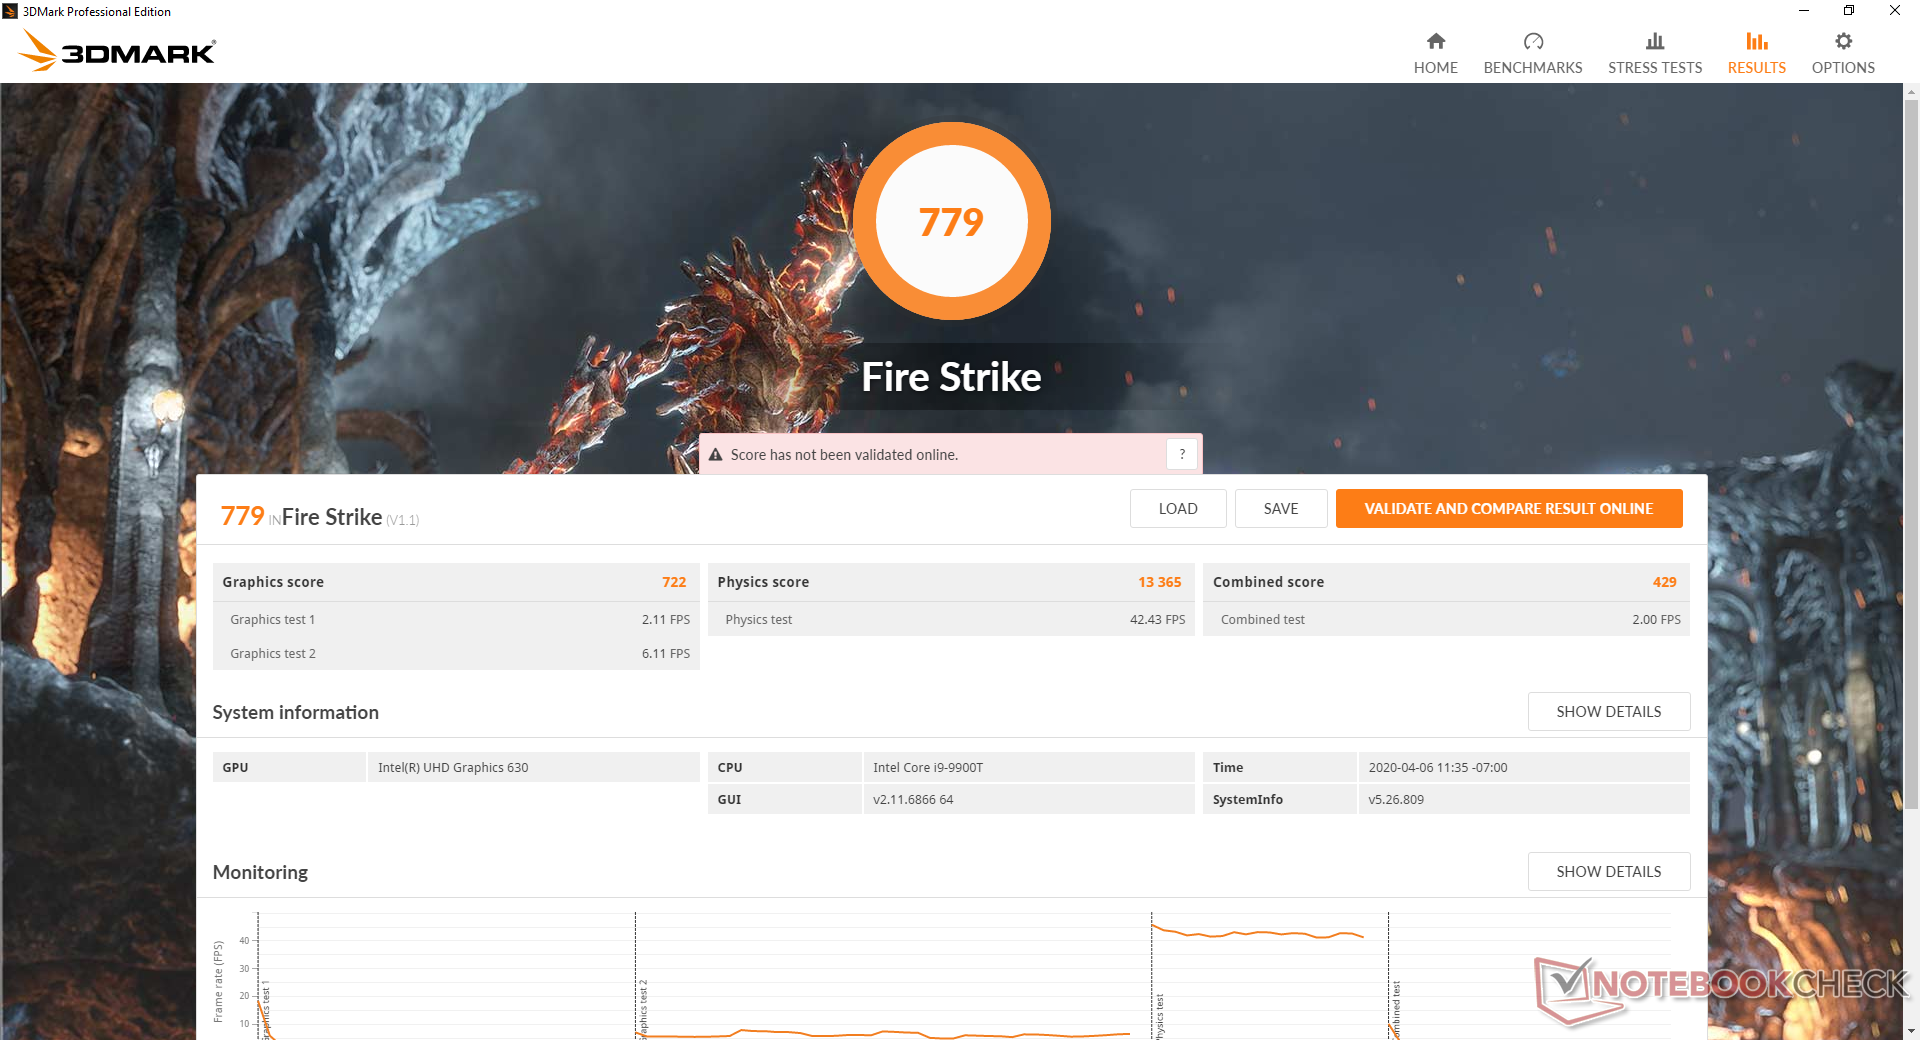
| 3DMark Fire Strike Score | 779 punti | |
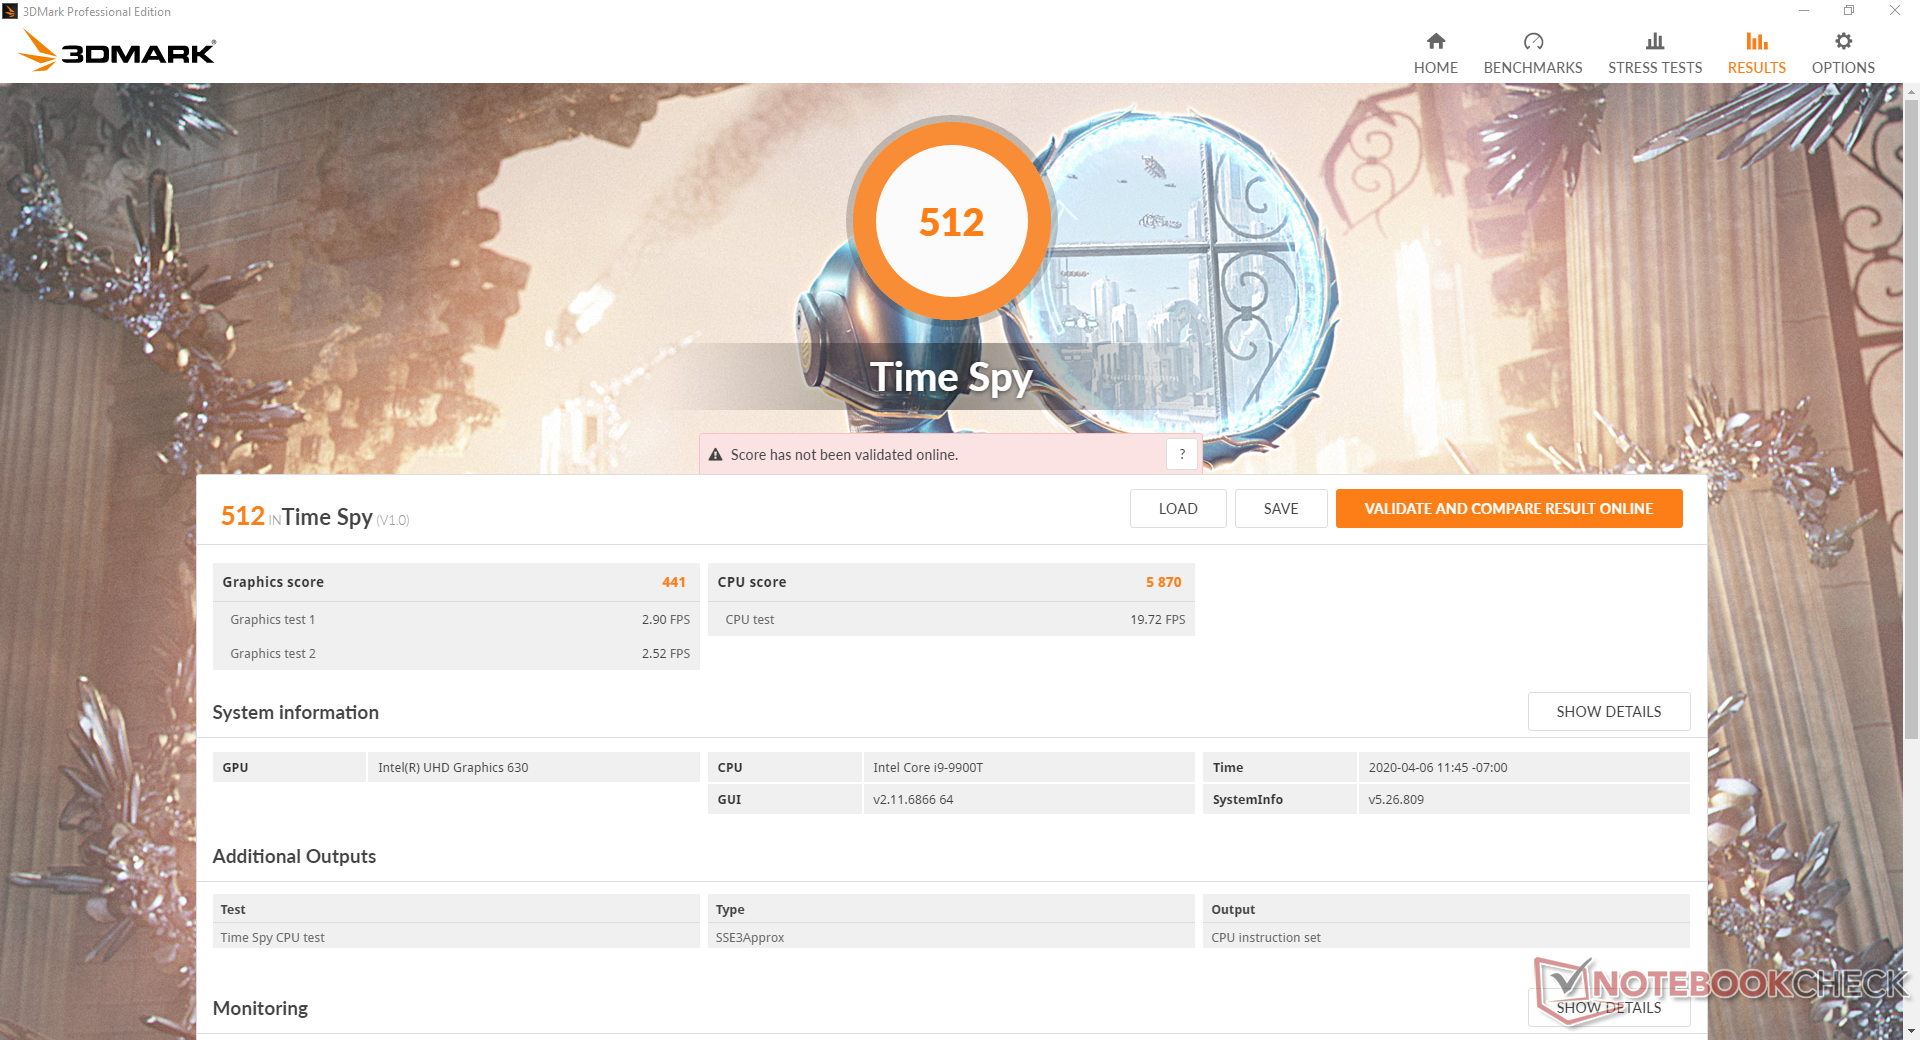
| 3DMark Time Spy Score | 512 punti | |
Aiuto | ||
| basso | medio | alto | ultra | |
|---|---|---|---|---|
| Dota 2 Reborn (2015) | 70.4 | 44.8 | 7.8 | 6.8 |
| X-Plane 11.11 (2018) | 12.7 | 11 | 11 |
Emissioni
Temperature
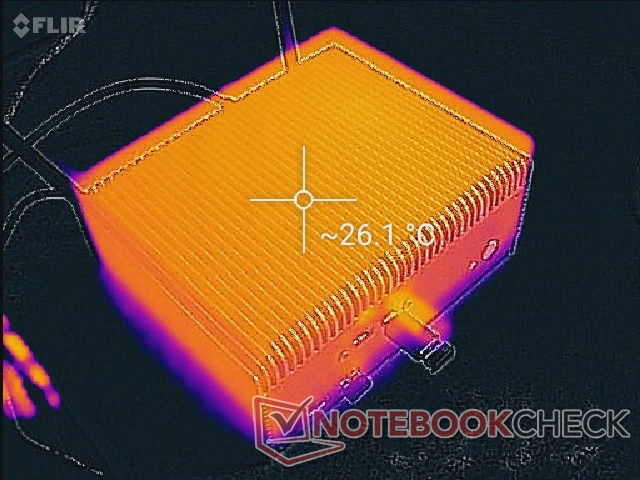
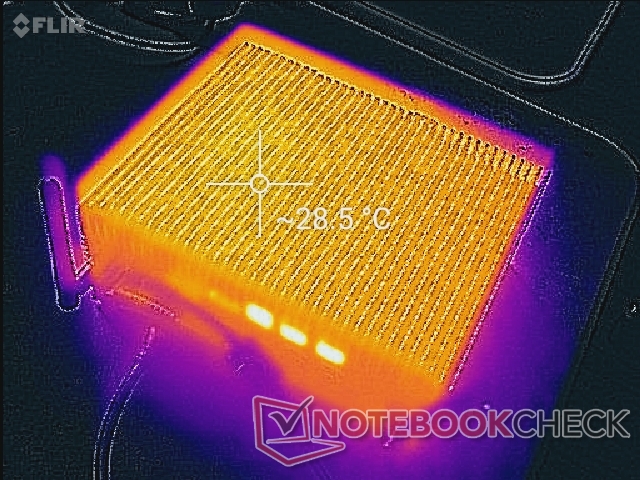
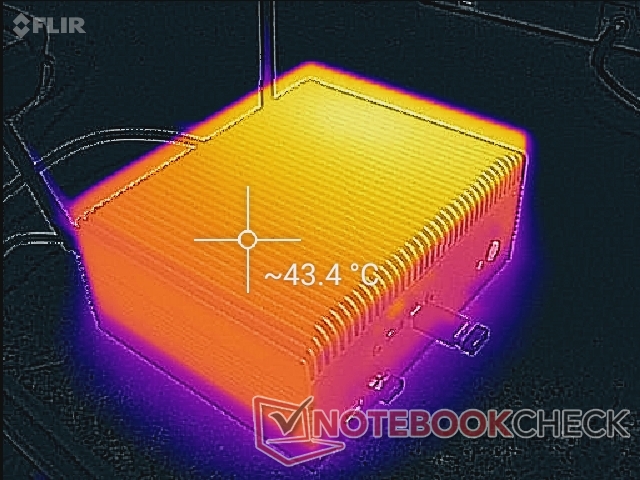
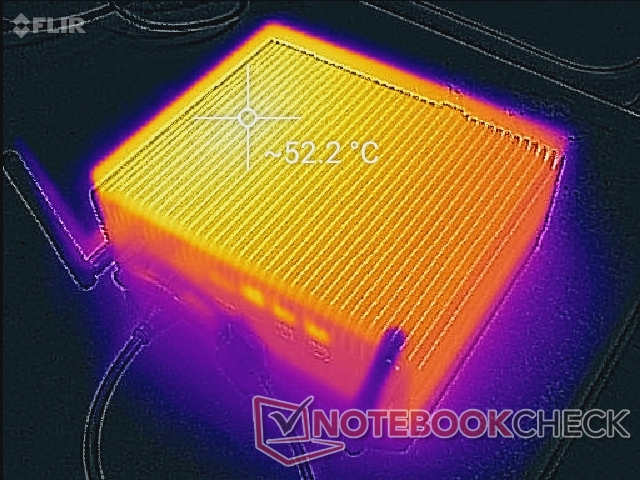
Siamo in grado di registrare temperature di superficie di poco meno di 30 °C quando rimaniamo al minimo per poco più di un'ora. Quando è sotto il massimo stress del processore, il grande dissipatore di calore può diventare arrivare a 43 °C - 53 °C, come mostrato dalle nostre mappe di temperatura qui sotto. Il lato destro del mini PC sarà notevolmente più caldo di quello sinistro a causa del modo in cui la CPU è posizionata al di sotto. Naturalmente, non è consigliabile mettere libri o novità sopra il sistema, come potrebbero fare i proprietari di altri mini PC.
A causa del throttling del sistema, tuttavia, le temperature di superficie alla fine scenderanno e si stabilizzeranno dai 53 °C di cui sopra a soli 39 °C.
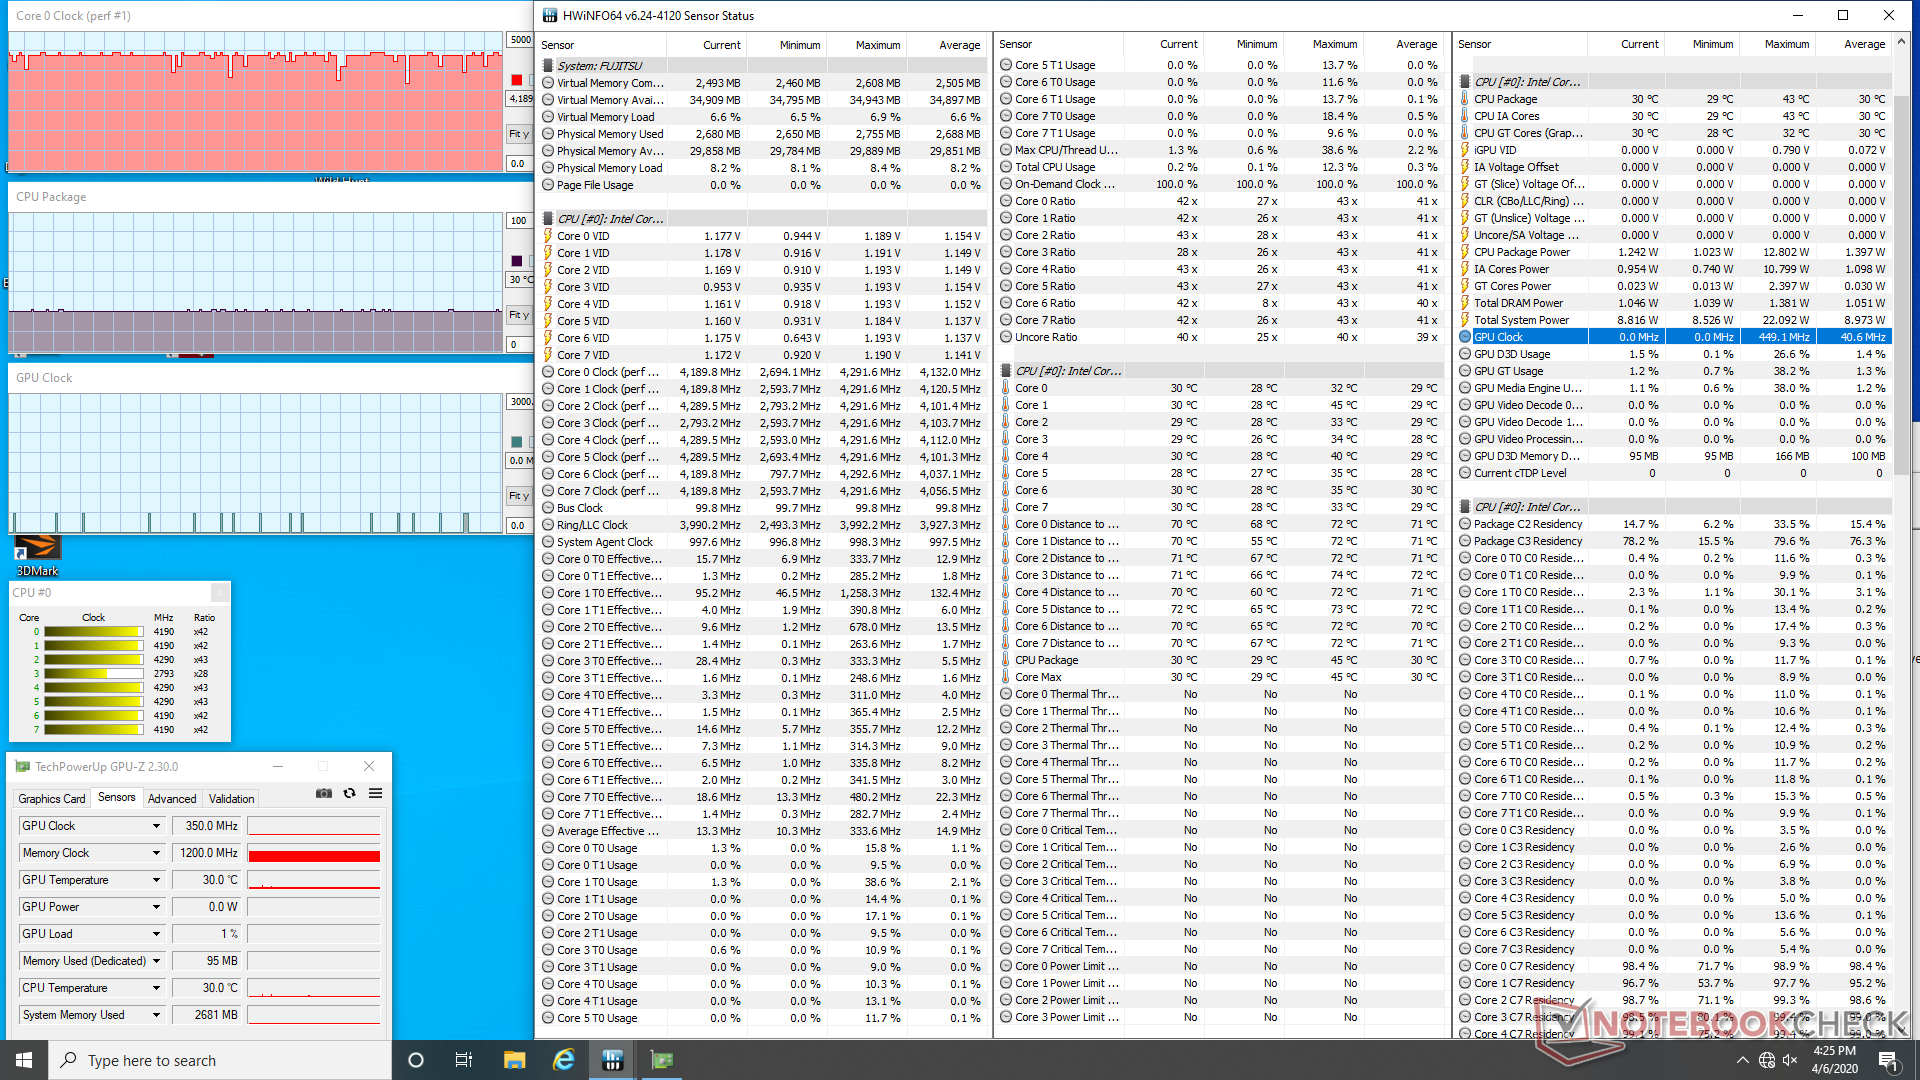
Stress Test
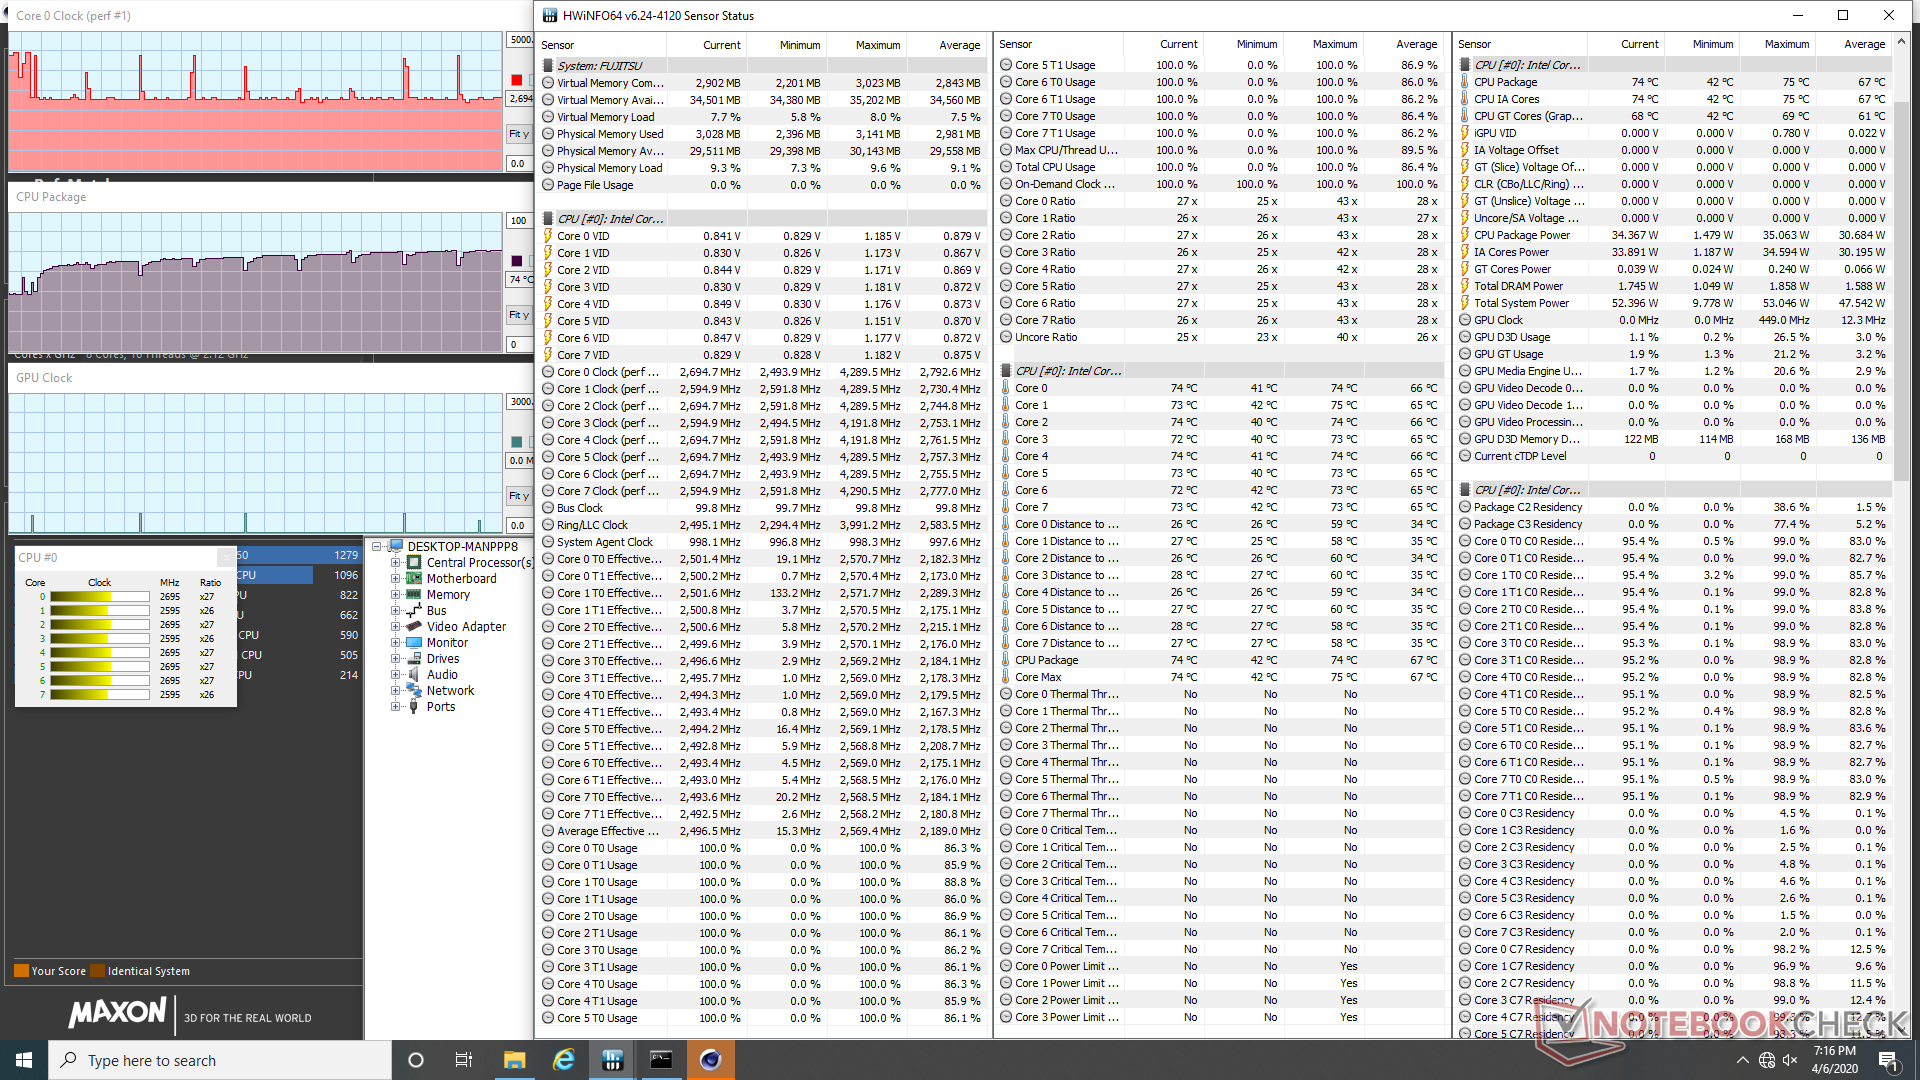
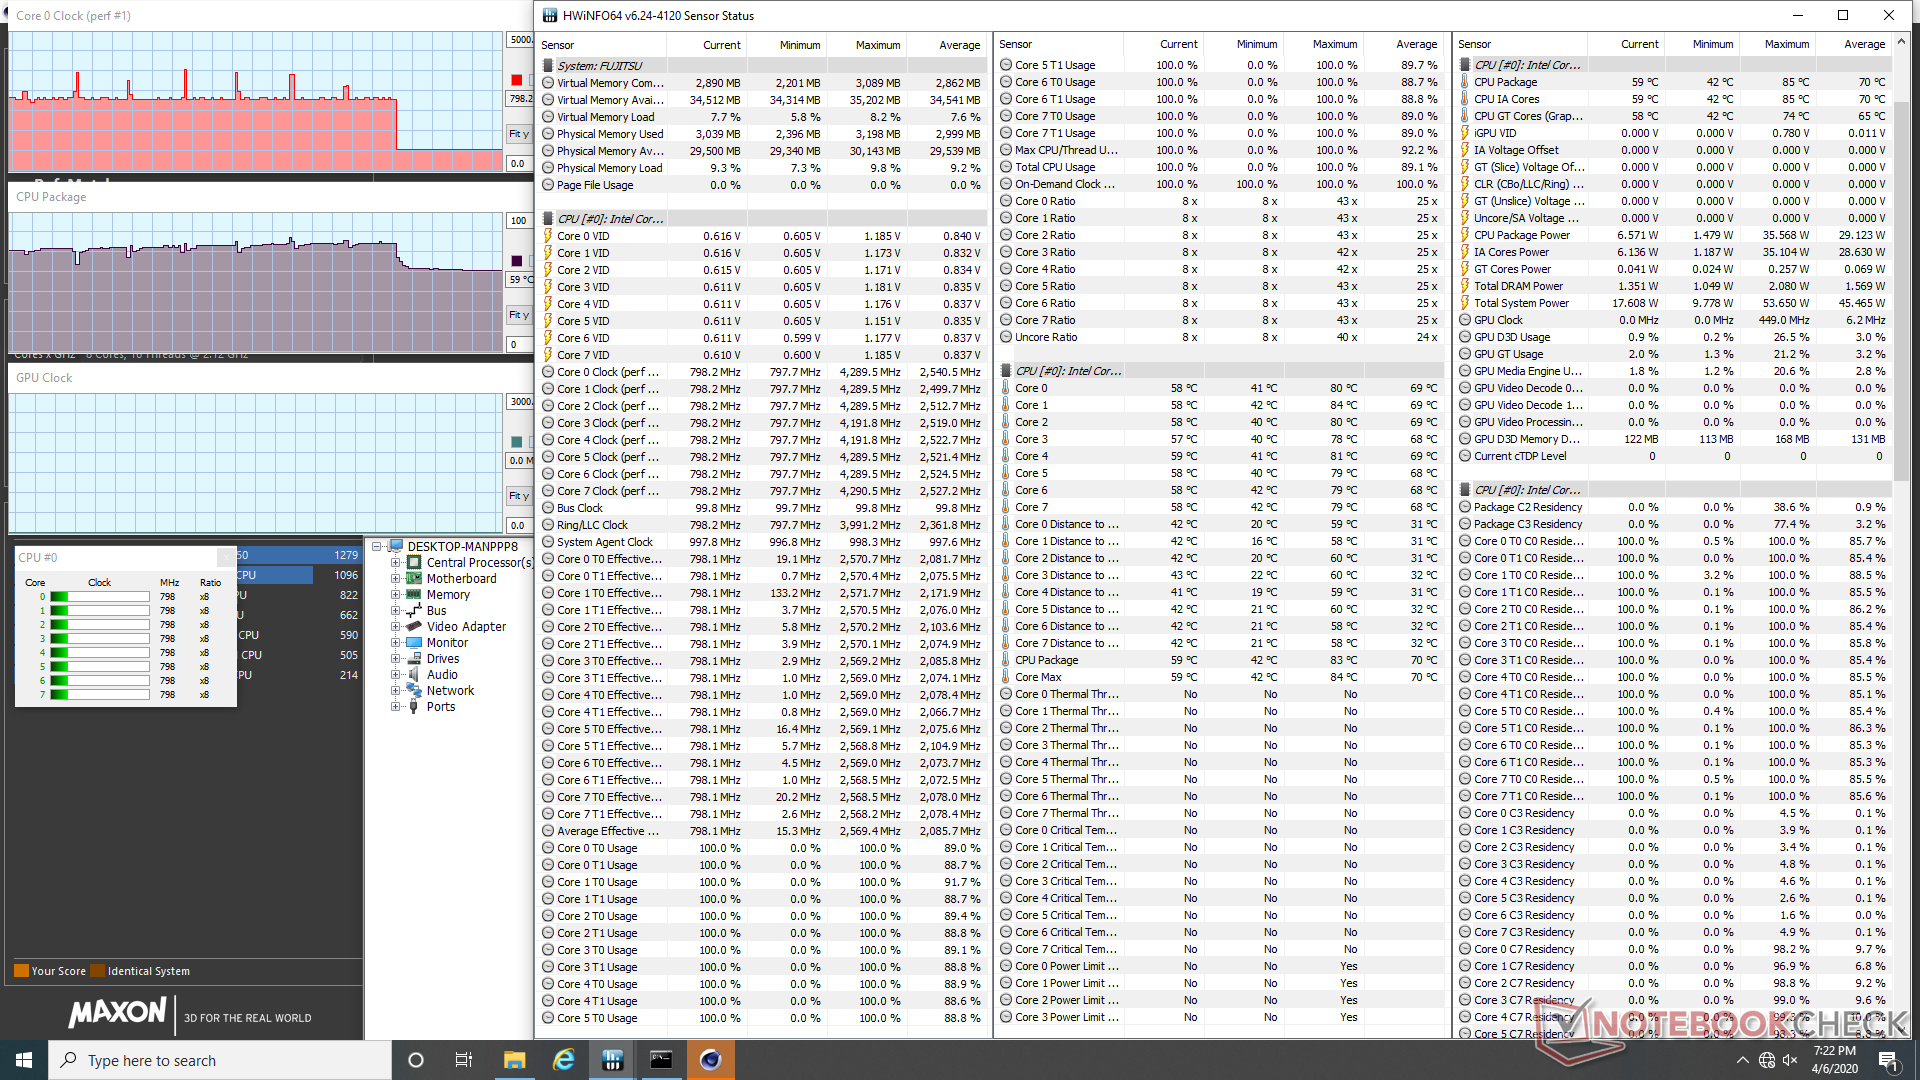
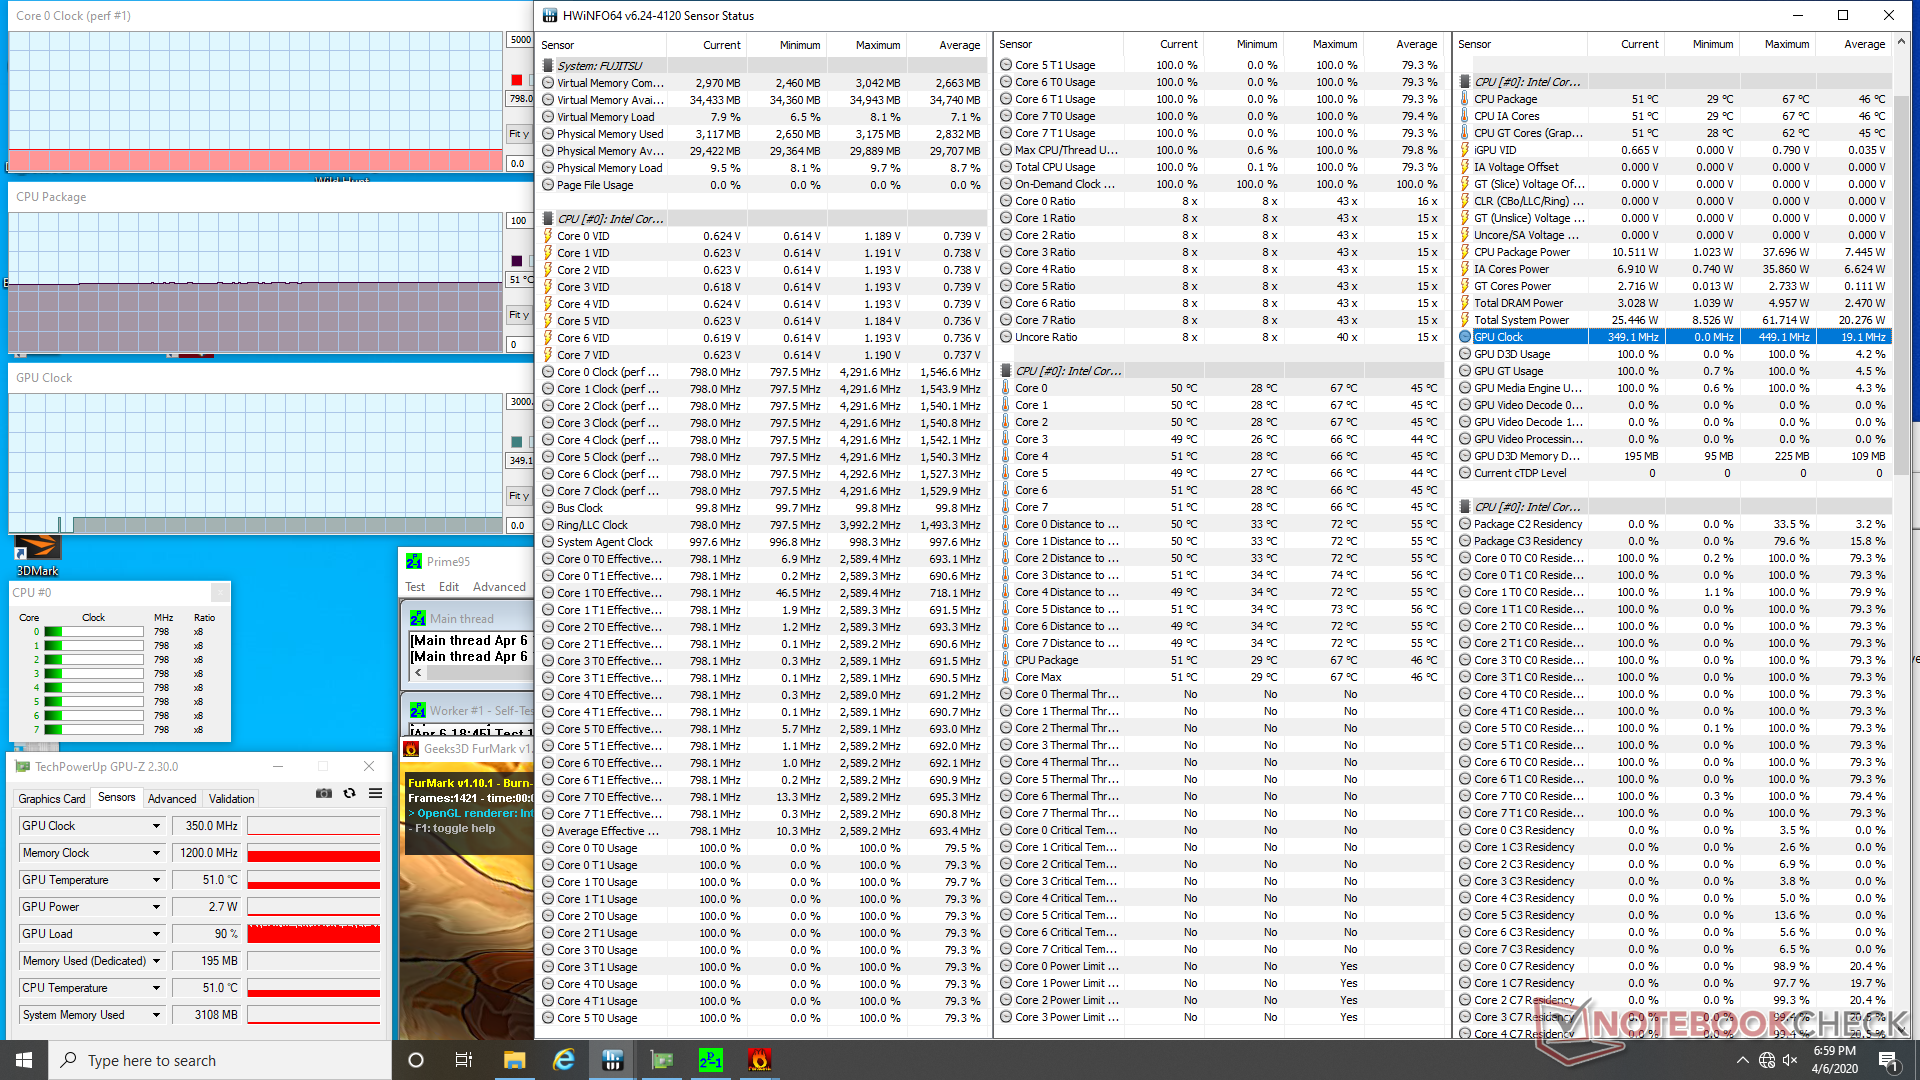
Stressiamo il mini PC con carichi sintetici e monitoriamo i segni vitali del sistema con HWiNFO per identificare eventuali problemi di strozzamento. Quando si esegue Prime95, la velocità di clock della CPU aumenterà fino a 2,6 GHz per circa 20 secondi prima di scendere leggermente nella gamma da 2,3 a 2,4 GHz. La temperatura del core aumenterà lentamente fino a raggiungere 67 °C, dove il clock rate scenderà a soli 800 MHz per una temperatura del core più fredda di 48 °C. Risultati simili possono essere osservati quando si esegue CineBench R15 Multi-Thread in loop; il clock rate andrà a circa 2,5-2,7 GHz fino a raggiungere un limite di temperatura di 79 °C. In seguito, il clock rate scenderà a soli 800 MHz per mantenere una temperatura del core più bassa.
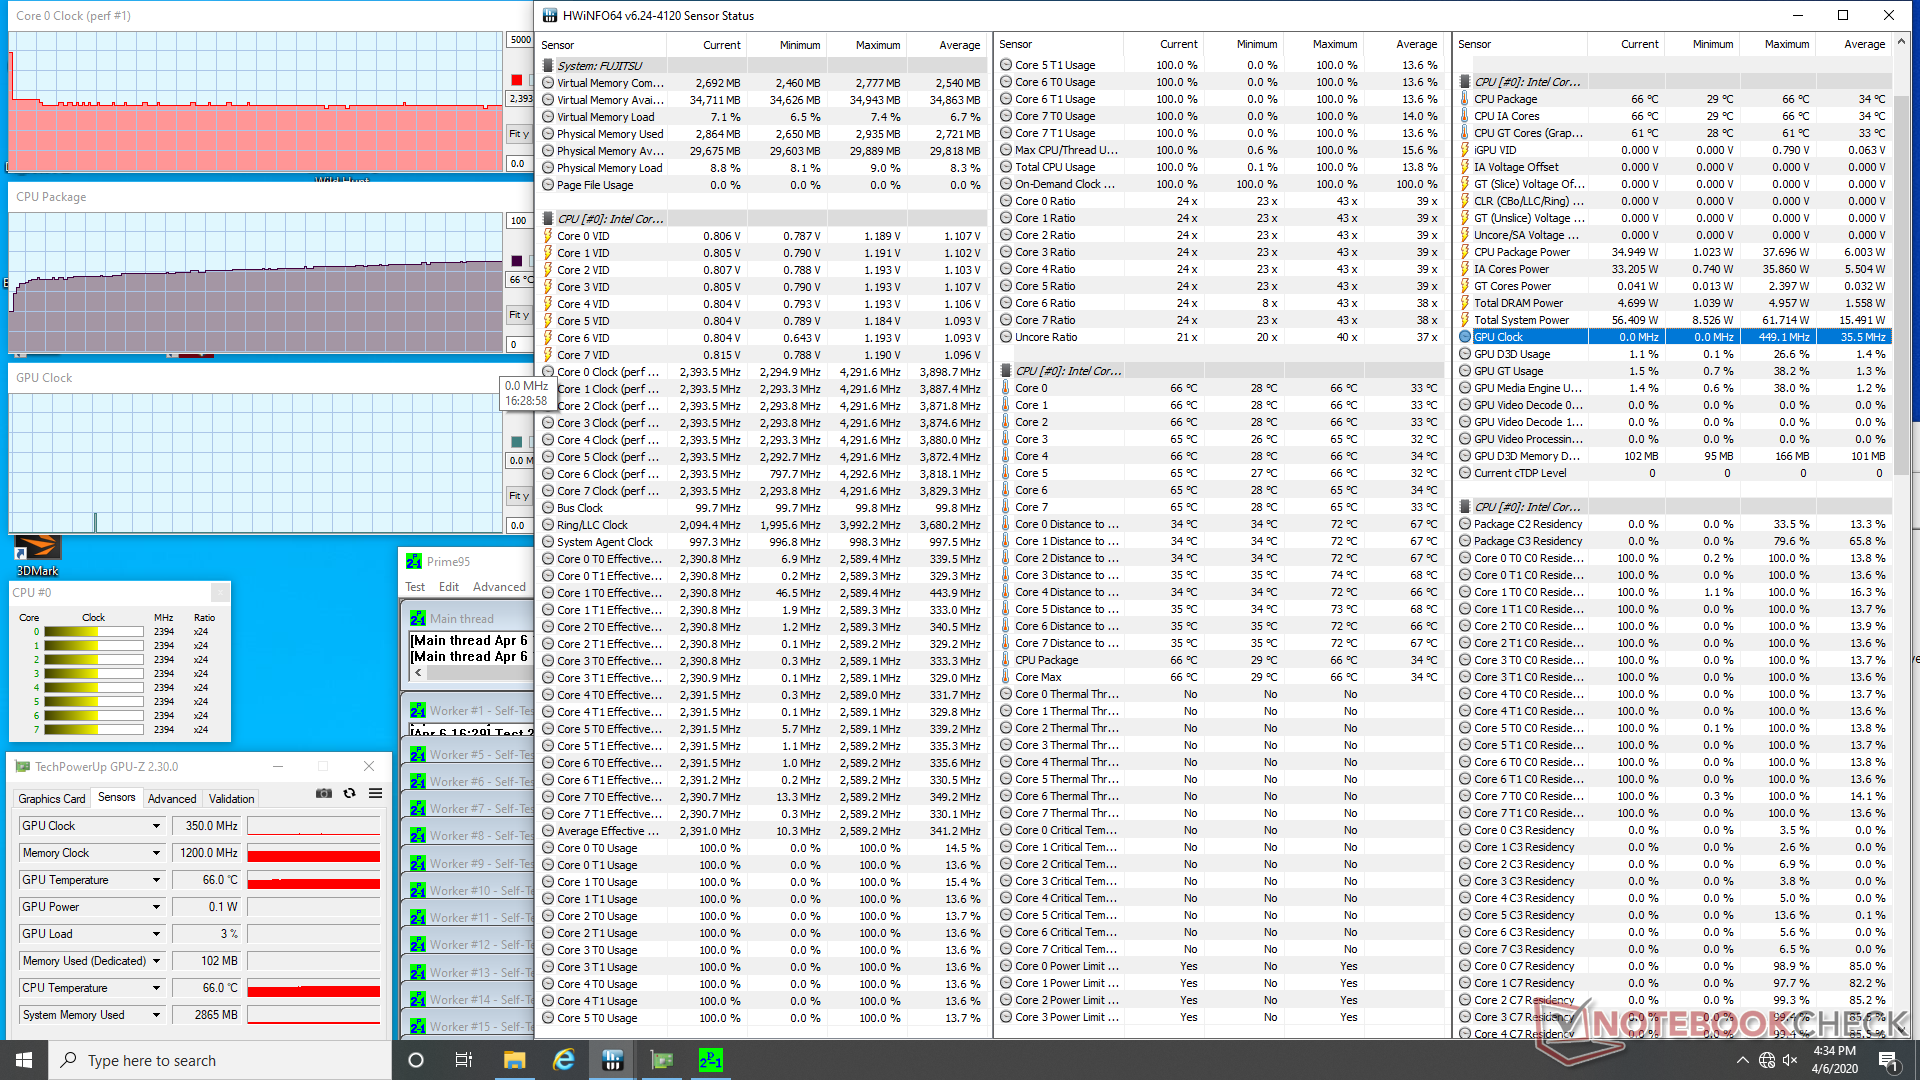
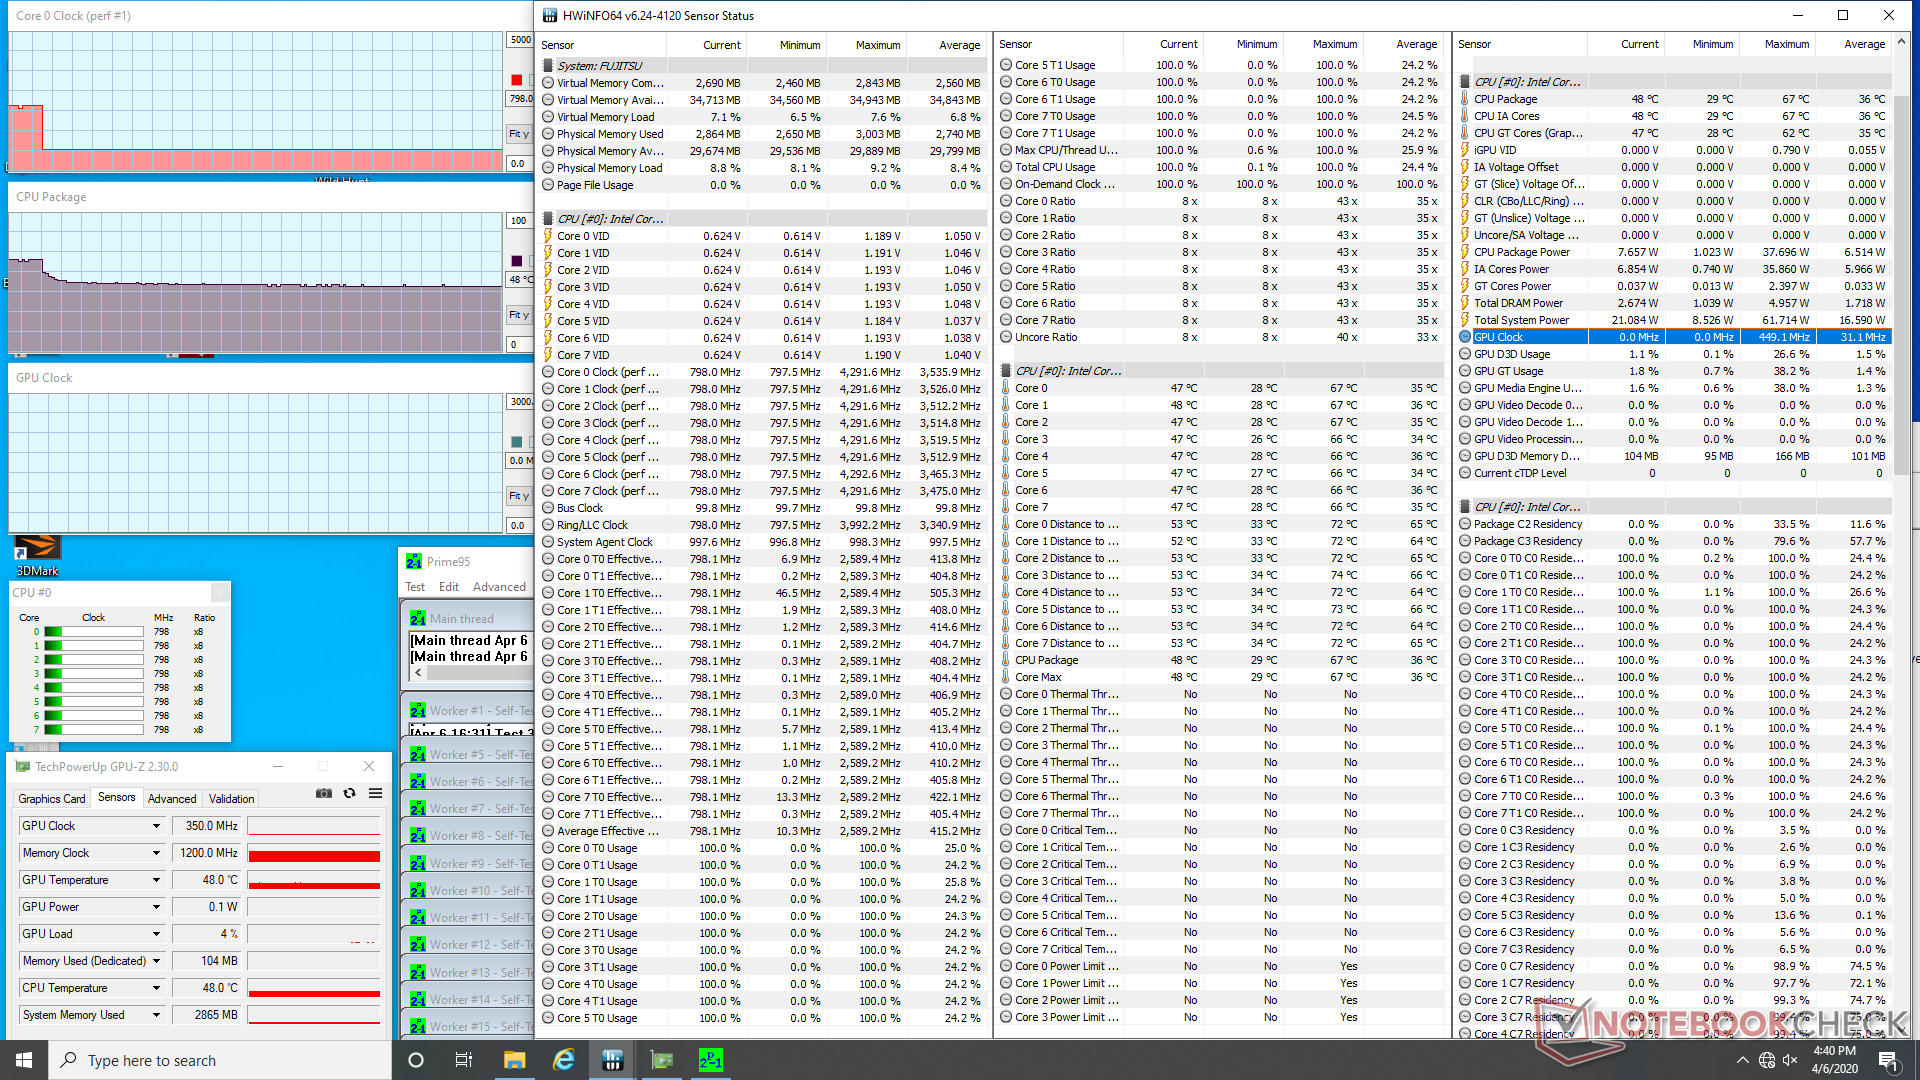
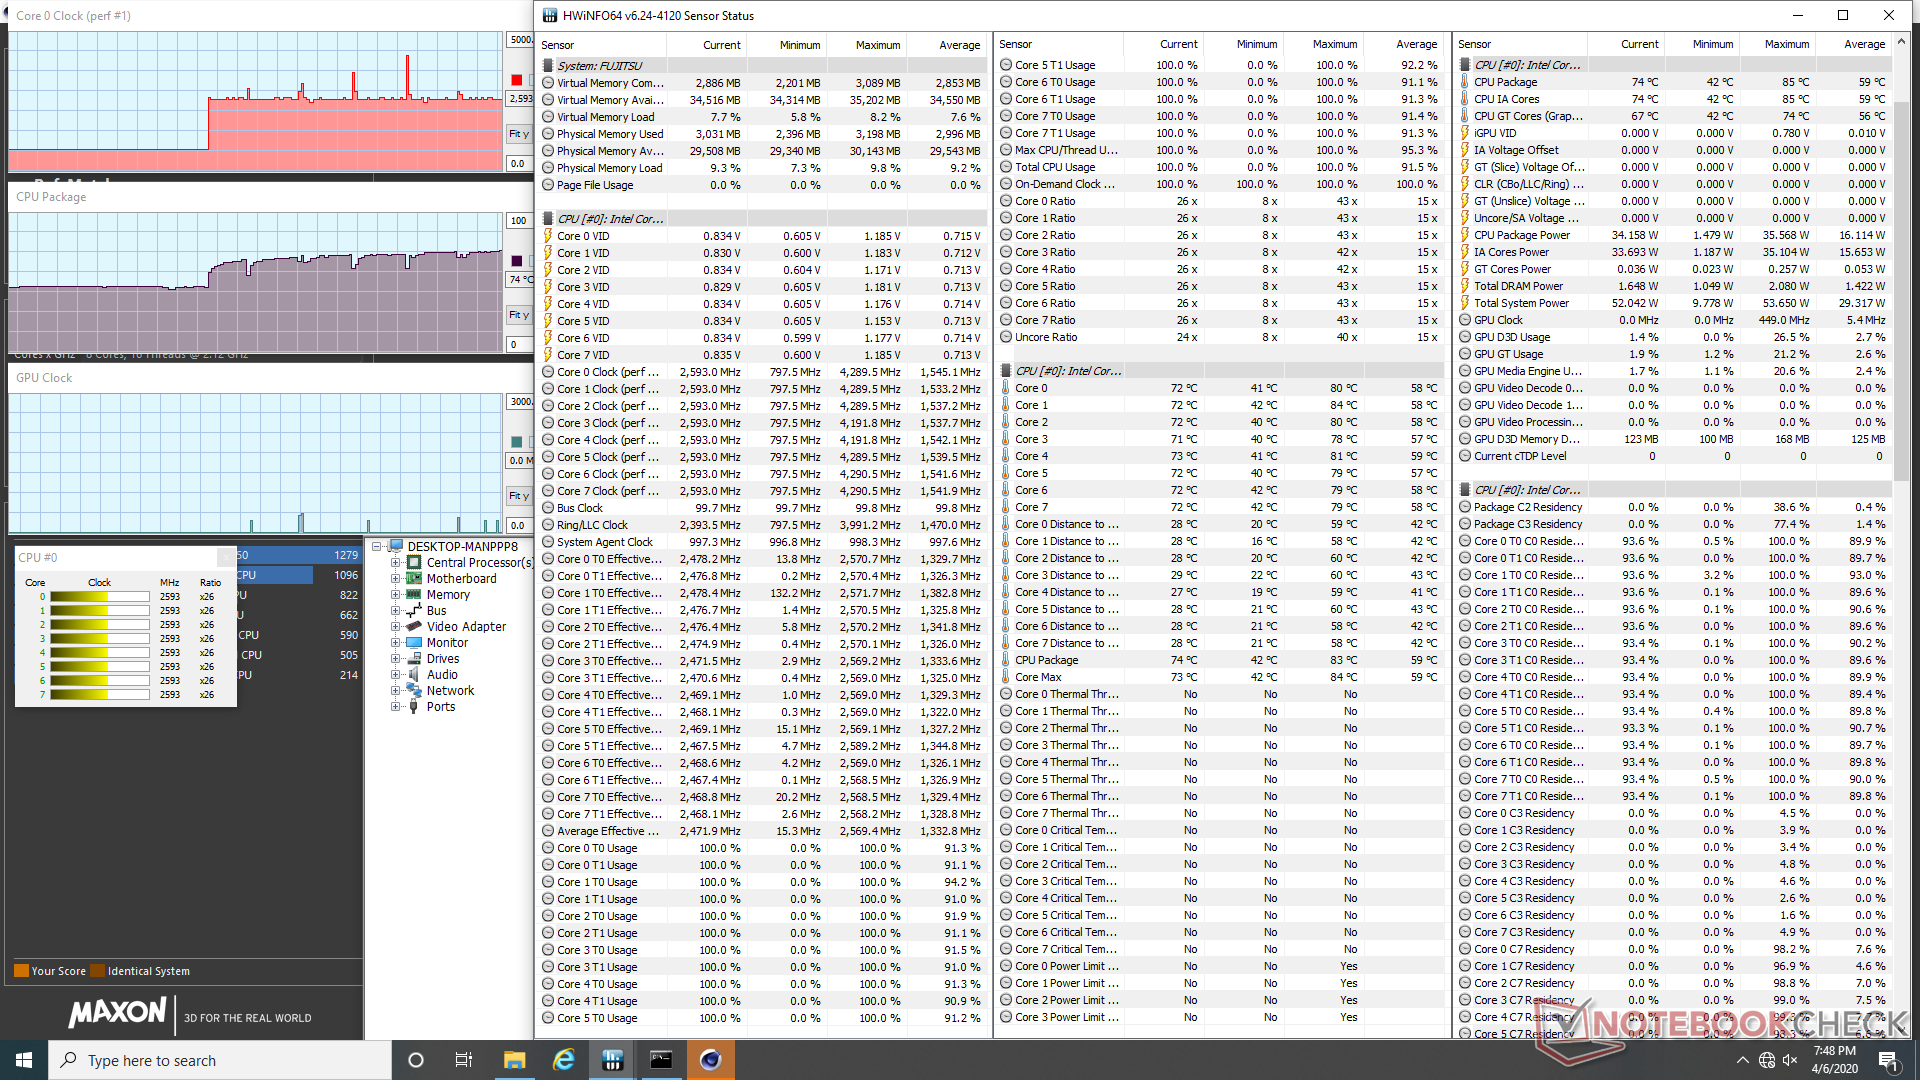
| CPU Clock (GHz) | GPU Clock (MHz) | Average CPU Temperature (°C) | |
| System Idle | -- | -- | 30 |
| Prime95 Stress | 0.8 - 2.4 | -- | 59 - 77 |
| Prime95 + FurMark Stress | 0.8 | 350 | 51 |
Gestione Energetica
Consumo Energetico
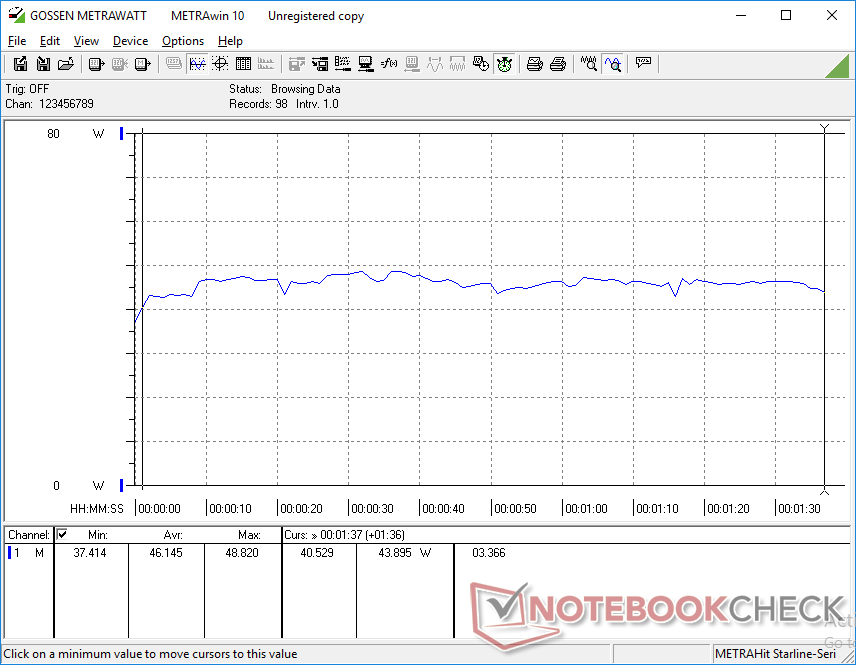
La richiesta di un minimo tra i 6 W e i 9 W è molto simile a quella che abbiamo registrato sull'ultimo Intel Frost Canyon NUC. L'esecuzione di carichi più stressanti come 3DMark 06 richiederà più di 46 W.
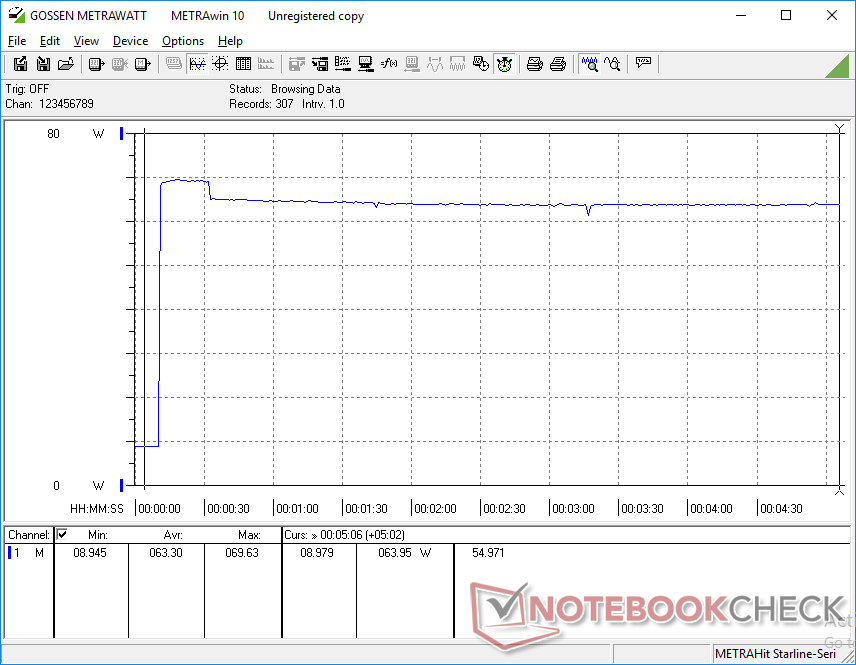
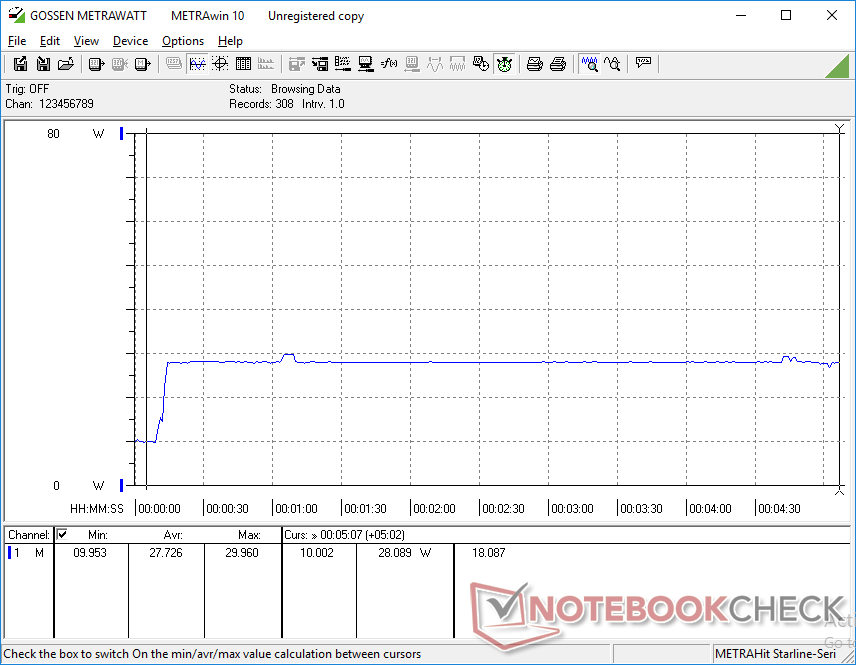
Siamo in grado di registrare un assorbimento massimo di 69,7 W dal piccolo (10,5 x 4,5 x 3 cm) adattatore da 65 W dopo aver avviato Prime95. Tuttavia, questo picco di consumo dura solo 20 secondi prima di scendere leggermente a 64 W, come mostrato dai nostri grafici qui sotto. La spinta iniziale corrisponde alle nostre osservazioni del test di stress Prime95 di cui sopra, dove anche la massima frequenza di clock di 2,6 GHz era raggiungibile solo per circa 20 secondi.
Se il clock della CPU accelera a 800 MHz, come menzionato in precedenza nella recensione, il consumo di energia scenderà ancora di più a soli 28 W.
| Off / Standby | |
| Idle | |
| Sotto carico |
|
Leggenda:
min: | |
| Impact Display Solutions IMP-3654-B1-R Core i9-9900T i9-9900T, UHD Graphics 630, EDGE NextGen SSD 1TB, , x, | Zotac ZBOX-QK7P3000 i7-7700T, Quadro P3000, Samsung SSD 960 Pro 512 GB m.2, , x, | Zotac ZBOX Magnus EK71080 i7-7700HQ, GeForce GTX 1080 (Desktop), Samsung PM961 MZVLW256HEHP, , x, 0" | Intel Hades Canyon NUC8i7HVK i7-8809G, Vega M GH, Intel Optane 120 GB SSDPEK1W120GA, , x, | Lenovo Yoga C940-15IRH i7-9750H, GeForce GTX 1650 Max-Q, Intel Optane Memory H10 with Solid State Storage 32GB + 512GB HBRPEKNX0202A(L/H), IPS, 1920x1080, 15.6" | Apple MacBook Pro 16 2019 i9 5500M i9-9880H, Radeon Pro 5500M, Apple SSD AP1024 7171, IPS, 3072x1920, 16" | |
|---|---|---|---|---|---|---|
| Power Consumption | -137% | -211% | -109% | -74% | -48% | |
| Idle Minimum * (Watt) | 6.6 | 19.9 -202% | 27.1 -311% | 15.5 -135% | 5.2 21% | 3.7 44% |
| Idle Average * (Watt) | 8.3 | 20.3 -145% | 27.4 -230% | 16.2 -95% | 10.7 -29% | 12.1 -46% |
| Idle Maximum * (Watt) | 8.8 | 27.6 -214% | 28.8 -227% | 16.5 -87% | 24.3 -176% | 17 -93% |
| Load Average * (Watt) | 46.2 | 86.2 -87% | 100.4 -117% | 83.4 -81% | 84.4 -83% | 91.5 -98% |
| Load Maximum * (Watt) | 69.7 | 96.3 -38% | 186.7 -168% | 173.5 -149% | 142.8 -105% | 102.3 -47% |
| Witcher 3 ultra * (Watt) | 114.4 | 243.1 | 121.7 | 83.9 | 103 |
* ... Meglio usare valori piccoli
Giudizio Complessivo
Il Mini PC Impact IMP-3654-B1-R può gestire una CPU Core i9 con un semplice dissipatore di calore? La risposta è sì, ma solo per un tempo limitato. Quando il sistema è stressato per lunghi periodi di tempo, le frequenze di clock finiscono per rallentare e precipitare, come abbiamo dimostrato in più occasioni in precedenza. Al suo meglio, i clock rates si stabilizzeranno a circa 2,5 GHz per un livello di prestazioni complessive multi-core simile a quello del Core i7-9750H da 45 W hexa-core, anche se il Core i9-9900T è una componente octa-core da 35 W. Si tratta di uno dei mini PC silenziosi più veloci che si possano trovare a questo proposito.
Se non si prevede di eseguire carichi di elaborazione estremi per periodi prolungati e si desidera solo l'occasionale aumento delle prestazioni di una CPU Core i9, allora il mini PC silenzioso IMP-3654-B1-R dovrebbe essere adatto. Una porta Thunderbolt 3 o un lettore SD avrebbero ampliato la versatilità di questo mini PC.
