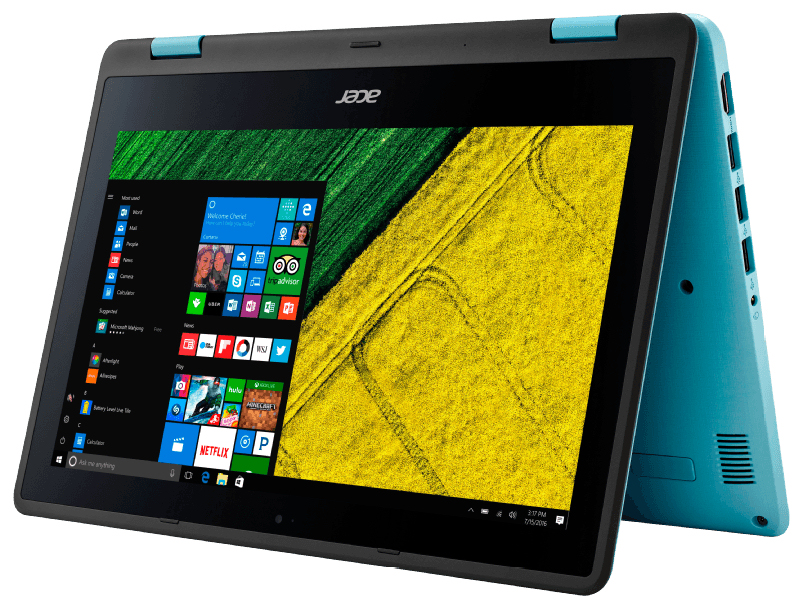
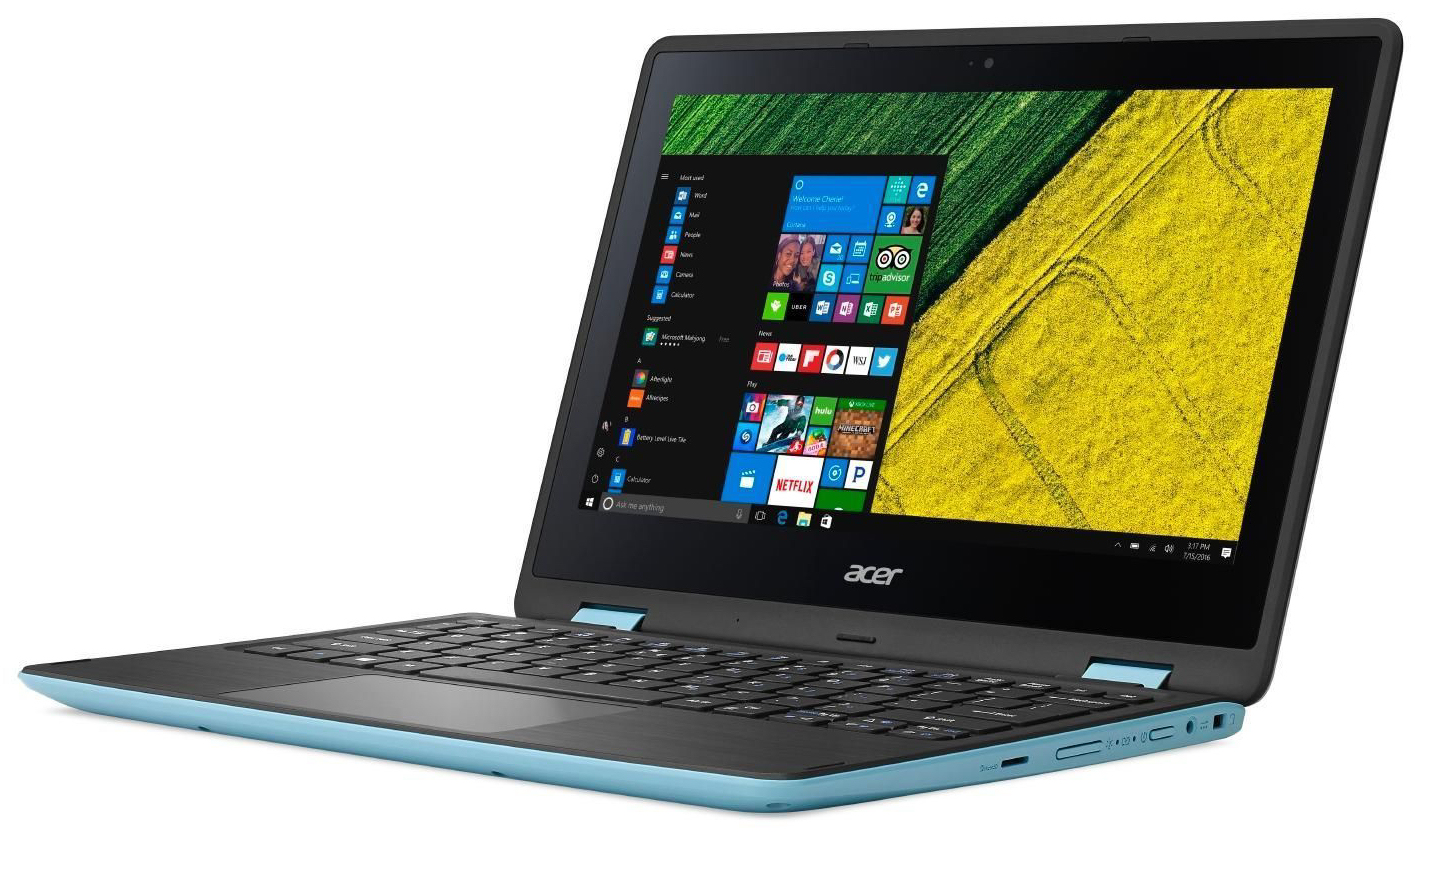
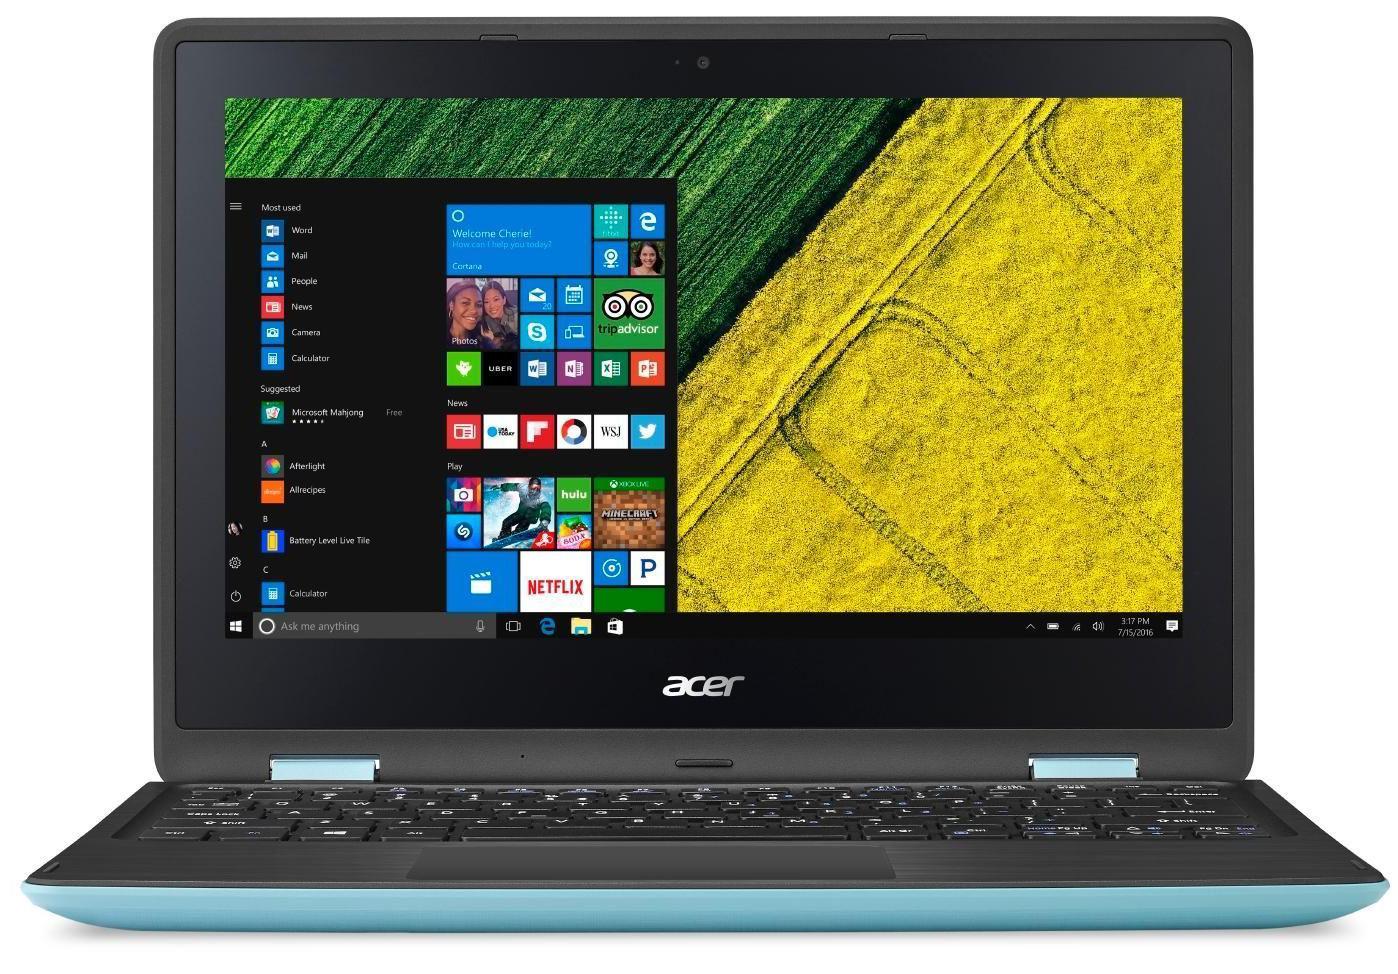
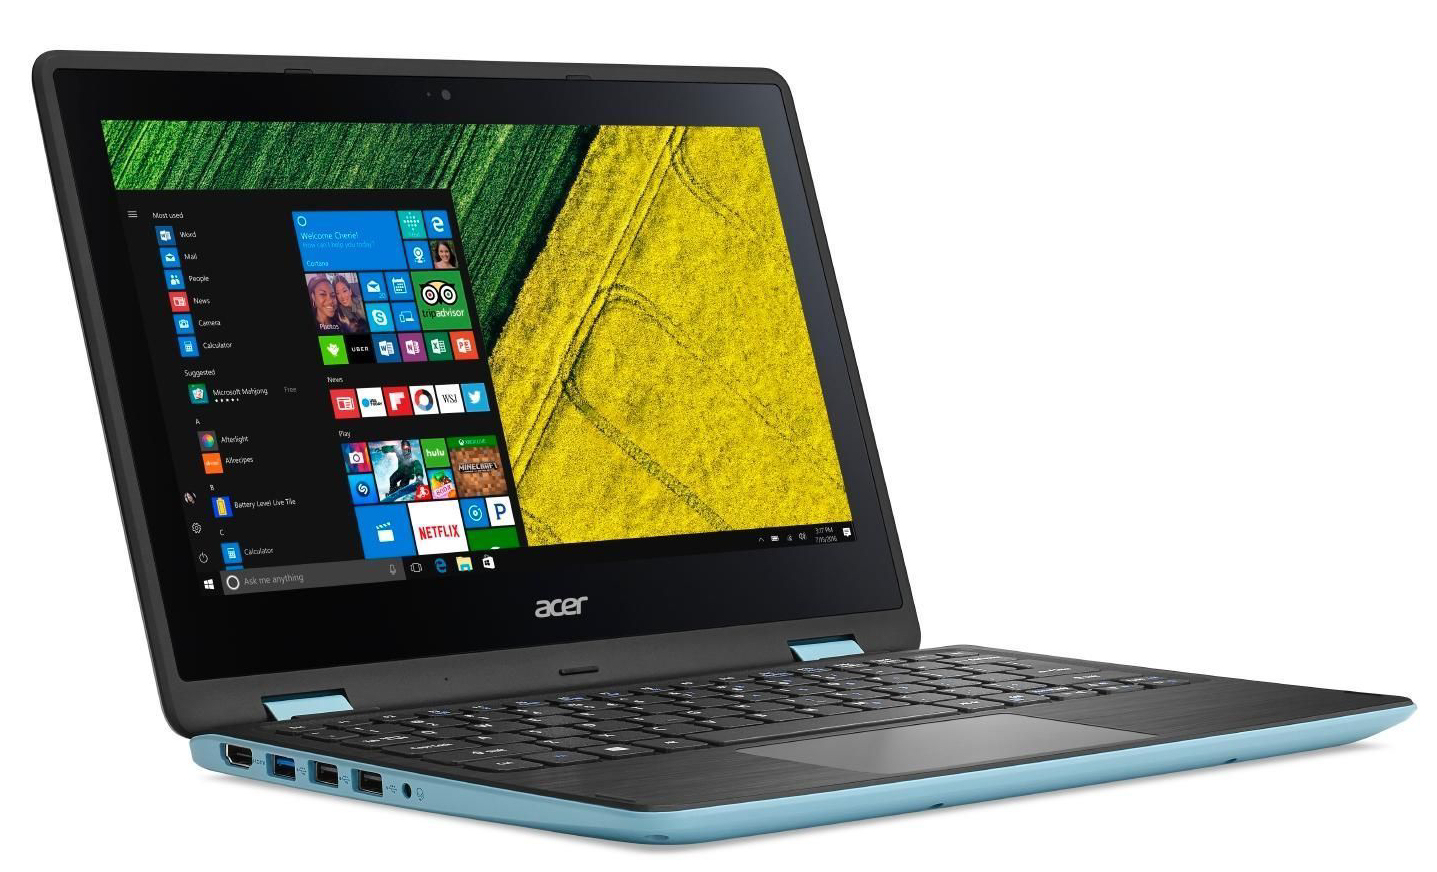
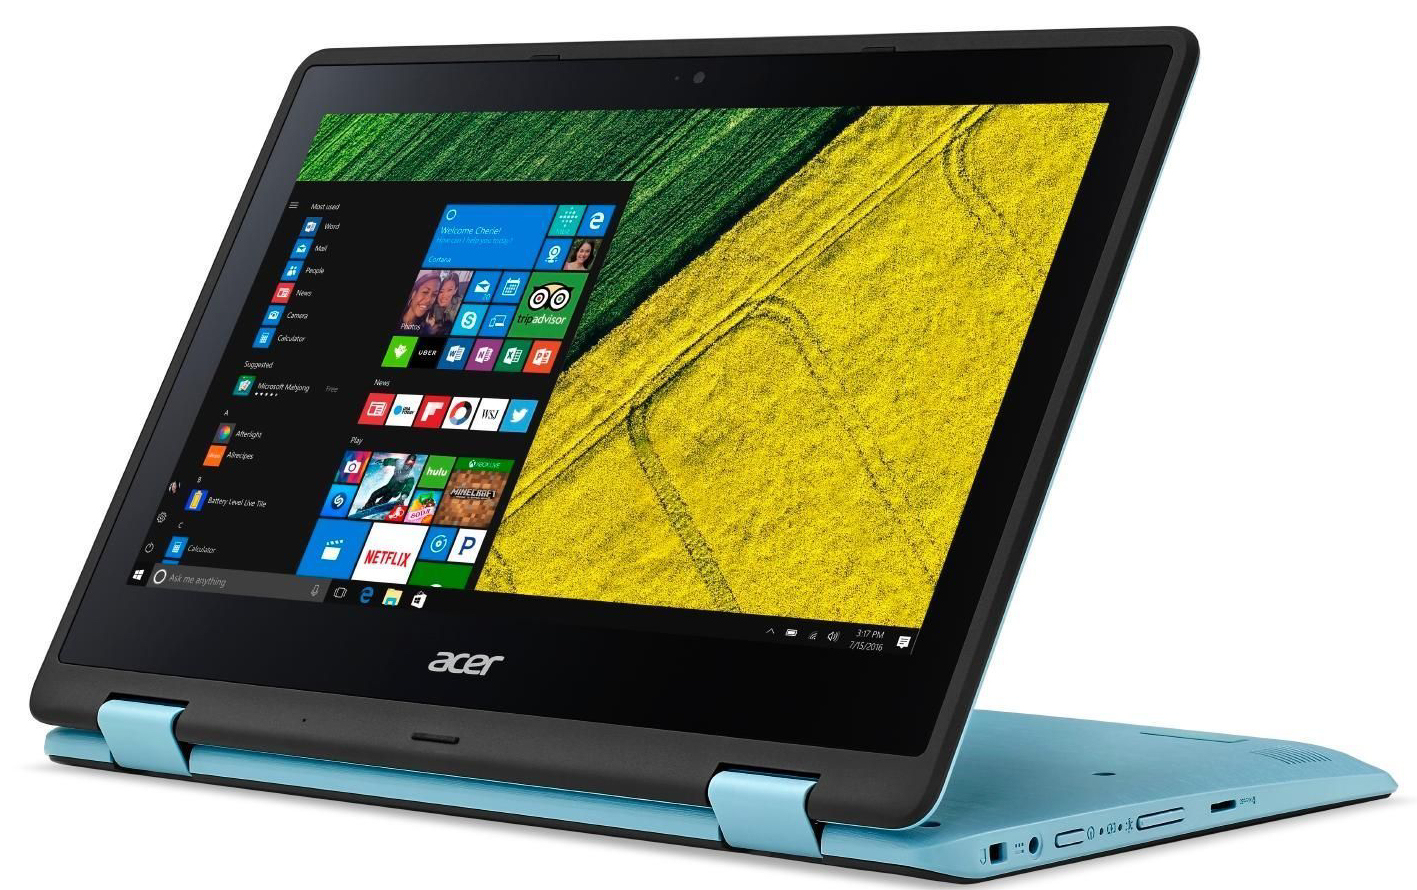
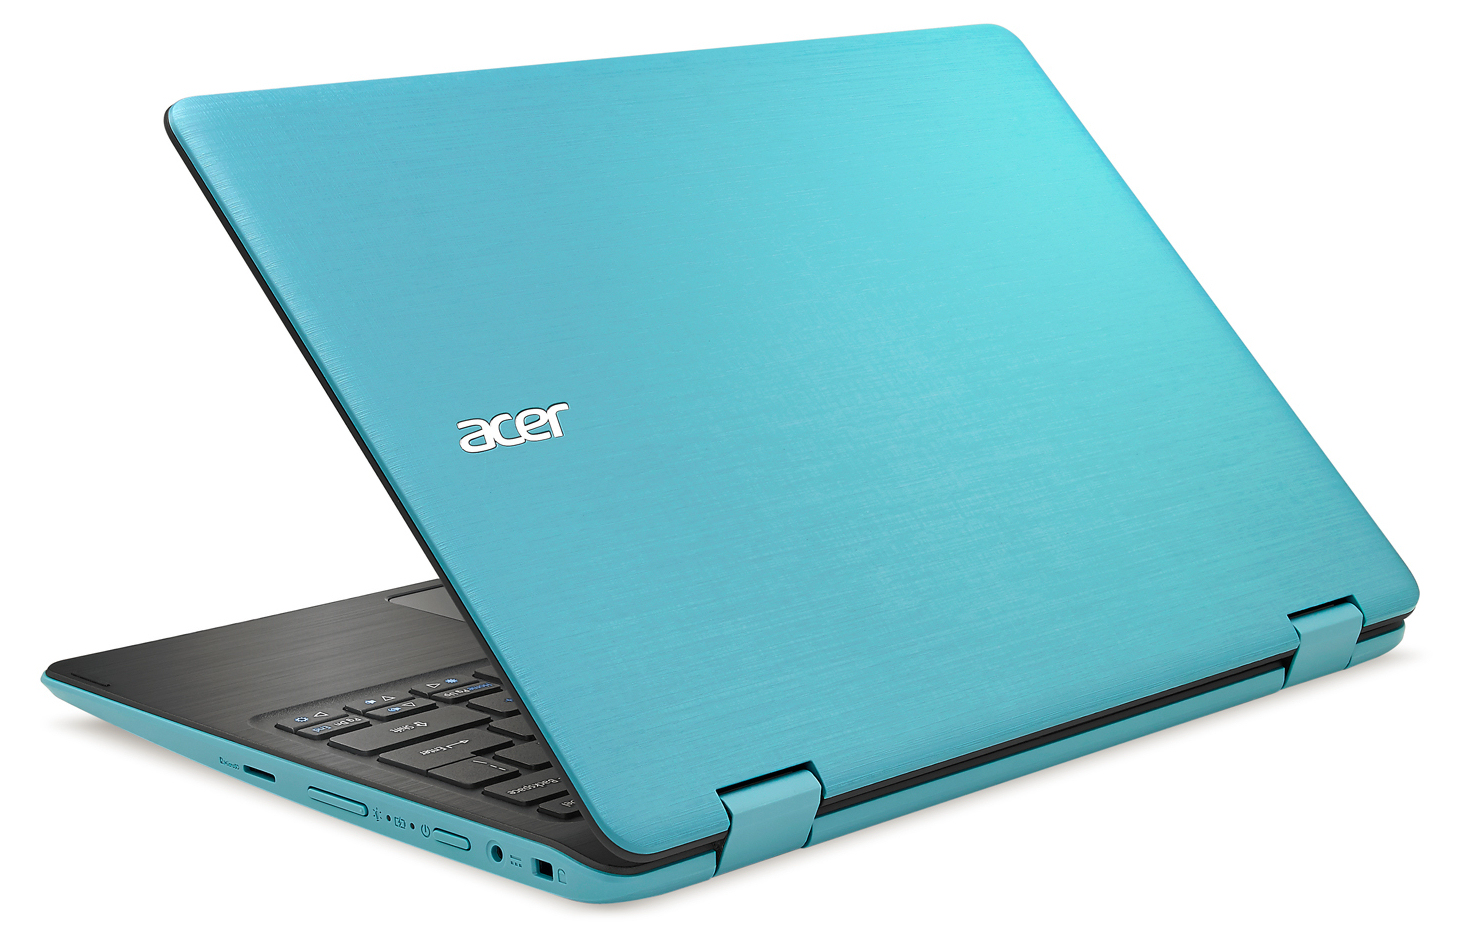
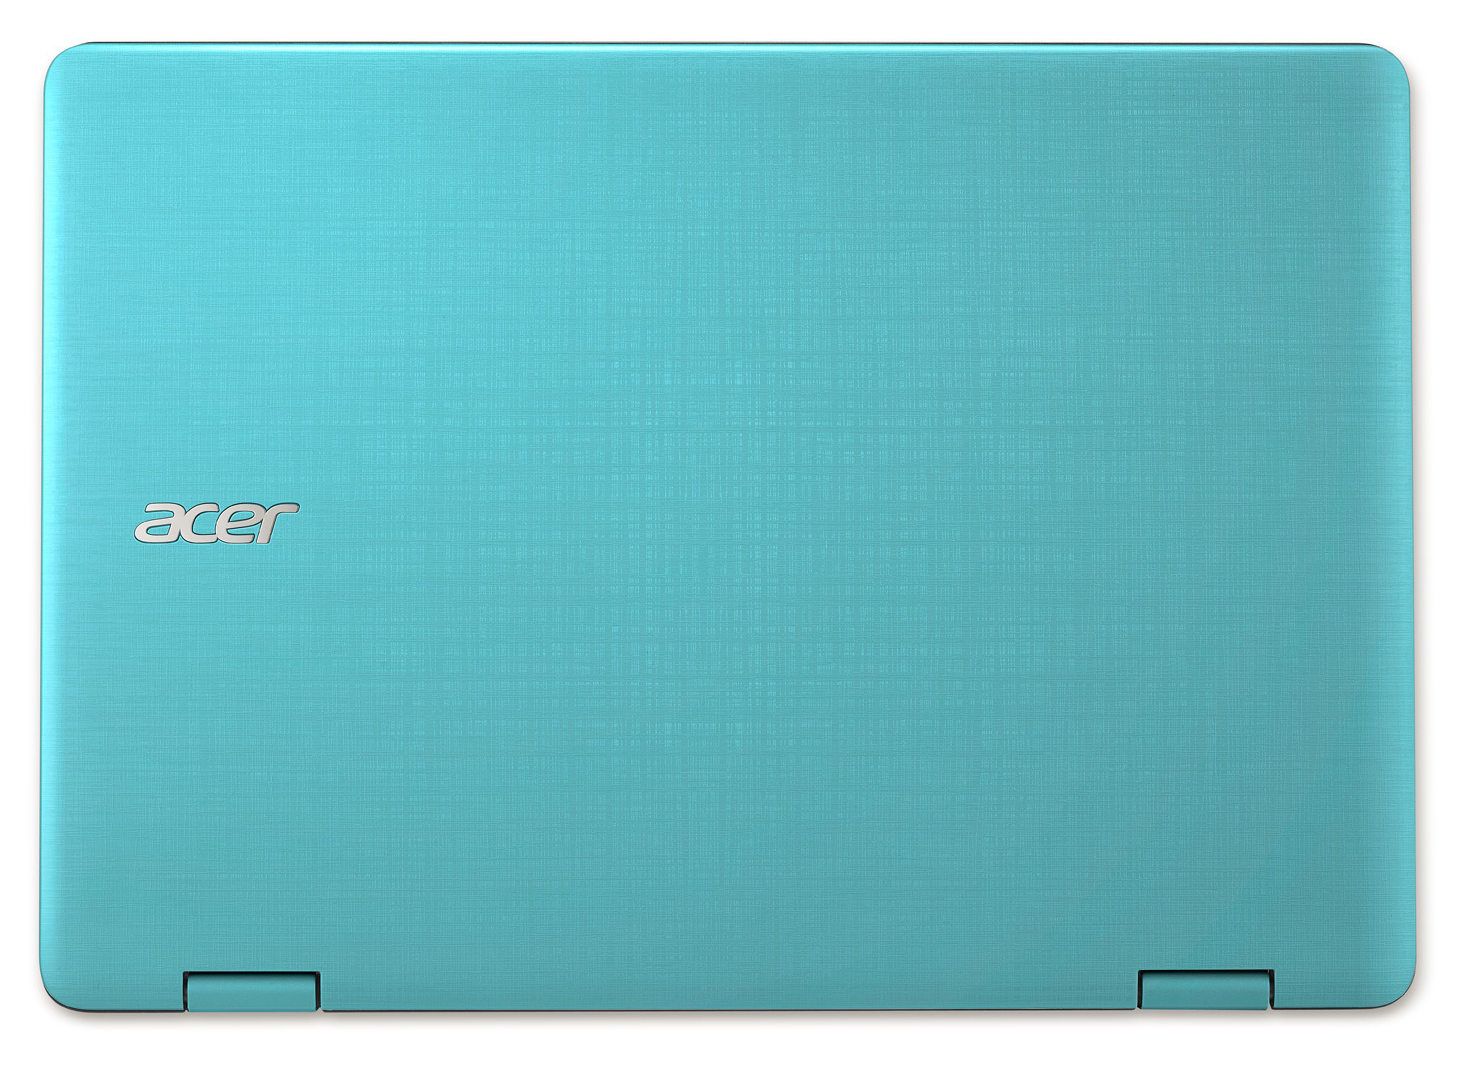
Recensione Breve del Convertibile Acer Spin 1 (N3450, FHD)
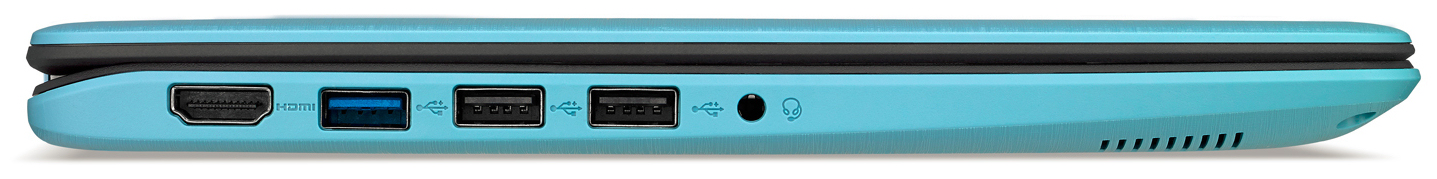
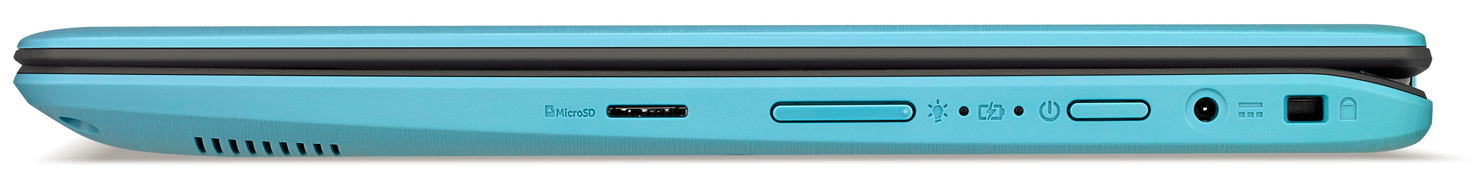
Connections
| SD Card Reader | |
| maximum SDCardreader Maximum Transfer Rate | |
| average SDCardreader Average Transfer Rate |
| Networking | |
| iperf3 transmit AX12 | |
| Dell Latitude 3189 | |
| Asus VivoBook Flip 12 TP203NAH-BP049T | |
| Acer Spin 1 SP111-31-C79E | |
| iperf3 receive AX12 | |
| Dell Latitude 3189 | |
| Asus VivoBook Flip 12 TP203NAH-BP049T | |
| Acer Spin 1 SP111-31-C79E | |
| |||||||||||||||||||||||||
Distribuzione della luminosità: 86 %
Al centro con la batteria: 251 cd/m²
Contrasto: 1195:1 (Nero: 0.21 cd/m²)
ΔE ColorChecker Calman: 4.27 | ∀{0.5-29.43 Ø4.73}
ΔE Greyscale Calman: 3.77 | ∀{0.09-98 Ø4.97}
72% sRGB (Argyll 1.6.3 3D)
47% AdobeRGB 1998 (Argyll 1.6.3 3D)
51.4% AdobeRGB 1998 (Argyll 3D)
72.6% sRGB (Argyll 3D)
49.67% Display P3 (Argyll 3D)
Gamma: 2.26
CCT: 6524 K
| Acer Spin 1 SP111-31-C79E IPS, 1920x1080, 11.6" | Asus VivoBook Flip 12 TP203NAH-BP049T IPS, 1366x768, 11.6" | Dell Latitude 3189 IPS, 1366x768, 11.6" | Medion Akoya E2215T IPS, 1920x1080, 11.6" | HP Pavilion 11-k103ng x360 IPS, 1366x768, 11.6" | |
|---|---|---|---|---|---|
| Display | -10% | -9% | -2% | -8% | |
| Display P3 Coverage (%) | 49.67 | 44.23 -11% | 44.96 -9% | 48.12 -3% | 45.21 -9% |
| sRGB Coverage (%) | 72.6 | 66.3 -9% | 67.3 -7% | 71.7 -1% | 67.8 -7% |
| AdobeRGB 1998 Coverage (%) | 51.4 | 45.73 -11% | 46.49 -10% | 49.78 -3% | 46.73 -9% |
| Response Times | -6% | -19% | 3% | 26% | |
| Response Time Grey 50% / Grey 80% * (ms) | 36 ? | 39 ? -8% | 40 ? -11% | 31 ? 14% | 18.8 ? 48% |
| Response Time Black / White * (ms) | 24 ? | 25 ? -4% | 30.4 ? -27% | 26 ? -8% | 23.2 ? 3% |
| PWM Frequency (Hz) | 50 ? | ||||
| Screen | 10% | 18% | -2% | 2% | |
| Brightness middle (cd/m²) | 251 | 253 1% | 291 16% | 338 35% | 194 -23% |
| Brightness (cd/m²) | 247 | 245 -1% | 284 15% | 309 25% | 186 -25% |
| Brightness Distribution (%) | 86 | 65 -24% | 92 7% | 76 -12% | 86 0% |
| Black Level * (cd/m²) | 0.21 | 0.17 19% | 0.16 24% | 0.39 -86% | 0.22 -5% |
| Contrast (:1) | 1195 | 1488 25% | 1819 52% | 867 -27% | 882 -26% |
| Colorchecker dE 2000 * | 4.27 | 3.17 26% | 3.4 20% | 3.94 8% | 3.06 28% |
| Colorchecker dE 2000 max. * | 11 | 8.13 26% | 9.6 13% | 9.96 9% | 8.81 20% |
| Greyscale dE 2000 * | 3.77 | 2 47% | 1.8 52% | 2.54 33% | 1.42 62% |
| Gamma | 2.26 97% | 2.43 91% | 2.14 103% | 2.38 92% | 2.34 94% |
| CCT | 6524 100% | 6850 95% | 6544 99% | 6902 94% | 6432 101% |
| Color Space (Percent of AdobeRGB 1998) (%) | 47 | 42 -11% | 42.8 -9% | 46 -2% | 42.98 -9% |
| Color Space (Percent of sRGB) (%) | 72 | 66 -8% | 67 -7% | 71 -1% | 67.56 -6% |
| Media totale (Programma / Settaggio) | -2% /
4% | -3% /
8% | -0% /
-1% | 7% /
3% |
* ... Meglio usare valori piccoli
Sfarfallio dello schermo / PWM (Pulse-Width Modulation)
| flickering dello schermo / PWM non rilevato | ||
In confronto: 52 % di tutti i dispositivi testati non utilizza PWM per ridurre la luminosita' del display. Se è rilevato PWM, una media di 7794 (minimo: 5 - massimo: 343500) Hz è stata rilevata. | ||
Tempi di risposta del Display
| ↔ Tempi di risposta dal Nero al Bianco | ||
|---|---|---|
| 24 ms ... aumenta ↗ e diminuisce ↘ combinato | ↗ 14 ms Incremento | 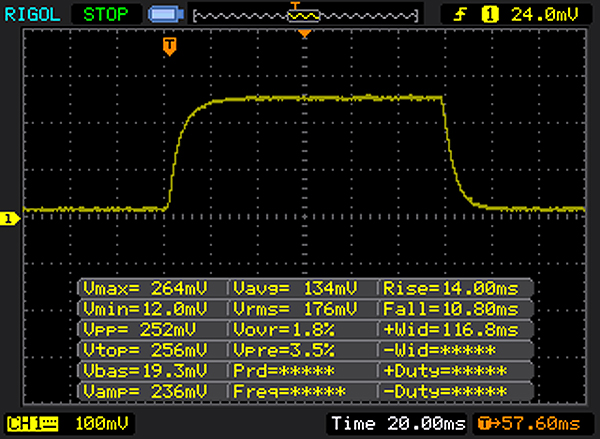 |
| ↘ 10 ms Calo | ||
| Lo schermo mostra buoni tempi di risposta durante i nostri tests, ma potrebbe essere troppo lento per i gamers competitivi. In confronto, tutti i dispositivi di test variano da 0.1 (minimo) a 240 (massimo) ms. » 54 % di tutti i dispositivi è migliore. Questo significa che i tempi di risposta rilevati sono peggiori rispetto alla media di tutti i dispositivi testati (19.9 ms). | ||
| ↔ Tempo di risposta dal 50% Grigio all'80% Grigio | ||
| 36 ms ... aumenta ↗ e diminuisce ↘ combinato | ↗ 19 ms Incremento | 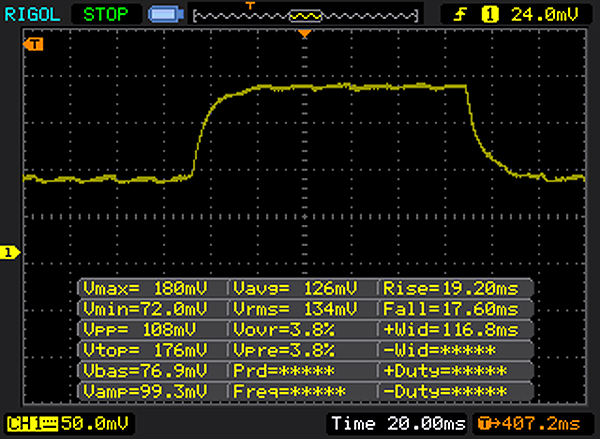 |
| ↘ 17 ms Calo | ||
| Lo schermo mostra tempi di risposta lenti nei nostri tests e sarà insoddisfacente per i gamers. In confronto, tutti i dispositivi di test variano da 0.165 (minimo) a 636 (massimo) ms. » 50 % di tutti i dispositivi è migliore. Questo significa che i tempi di risposta rilevati sono peggiori rispetto alla media di tutti i dispositivi testati (31.1 ms). | ||
| Geekbench 4.0 | |
| 64 Bit Multi-Core Score | |
| Asus VivoBook Flip 12 TP203NAH-BP049T | |
| Acer Spin 1 SP111-31-C79E | |
| Acer Swift 1 SF114-31-P6F6 | |
| 64 Bit Single-Core Score | |
| Asus VivoBook Flip 12 TP203NAH-BP049T | |
| Acer Spin 1 SP111-31-C79E | |
| Acer Swift 1 SF114-31-P6F6 | |
| Geekbench 4.4 | |
| 64 Bit Multi-Core Score | |
| Asus VivoBook Flip 12 TP203NAH-BP049T | |
| Acer Spin 1 SP111-31-C79E | |
| 64 Bit Single-Core Score | |
| Asus VivoBook Flip 12 TP203NAH-BP049T | |
| Acer Spin 1 SP111-31-C79E | |
| PCMark 8 Home Score Accelerated v2 | 1530 punti | |
| PCMark 10 Score | 1181 punti | |
Aiuto | ||
| PCMark 8 - Home Score Accelerated v2 | |
| Dell Latitude 3189 | |
| Asus VivoBook Flip 12 TP203NAH-BP049T | |
| HP Pavilion 11-k103ng x360 | |
| Acer Spin 1 SP111-31-C79E | |
| Medion Akoya E2215T | |

| Acer Spin 1 SP111-31-C79E Toshiba MQ01ABF050 | Asus VivoBook Flip 12 TP203NAH-BP049T Seagate Mobile HDD 1TB ST1000LM035 | Dell Latitude 3189 Liteonit CV3-8D128 | Medion Akoya E2215T 64 GB eMMC Flash | HP Pavilion 11-k103ng x360 Hitachi Travelstar Z5K500 HTS545050A7E680 | |
|---|---|---|---|---|---|
| CrystalDiskMark 3.0 | -28% | 3912% | 729% | -7% | |
| Read Seq (MB/s) | 109.1 | 53.9 -51% | 408.4 274% | 169.6 55% | 106 -3% |
| Write Seq (MB/s) | 107.3 | 66.4 -38% | 214.3 100% | 39.77 -63% | 106.1 -1% |
| Read 512 (MB/s) | 35.89 | 22.62 -37% | 243.7 579% | 155.3 333% | 33.53 -7% |
| Write 512 (MB/s) | 45.28 | 67.3 49% | 170.6 277% | 27.45 -39% | 39.03 -14% |
| Read 4k (MB/s) | 0.482 | 0.378 -22% | 8.864 1739% | 13.09 2616% | 0.407 -16% |
| Write 4k (MB/s) | 1.037 | 0.263 -75% | 49.14 4639% | 7.915 663% | 1.026 -1% |
| Read 4k QD32 (MB/s) | 1.003 | 0.998 0% | 132.2 13080% | 15.11 1406% | 0.898 -10% |
| Write 4k QD32 (MB/s) | 1.043 | 0.518 -50% | 111.7 10609% | 10.05 864% | 1.003 -4% |
| 3DMark 11 Performance | 414 punti | |
Aiuto | ||
| basso | medio | alto | ultra | |
|---|---|---|---|---|
| Dirt 3 (2011) | 40.1 | 14.7 | ||
| Deus Ex Human Revolution (2011) | 22.9 | 11.1 | ||
| The Elder Scrolls V: Skyrim (2011) | 11.2 | 7.6 | ||
| Anno 2070 (2011) | 27.8 | 12.2 | ||
| Dead Space 3 (2013) | 19.3 | 9.1 | ||
| Tomb Raider (2013) | 21.5 | 9.3 | ||
| BioShock Infinite (2013) | 16.2 | 8.8 | 7.9 | |
| GRID 2 (2013) | 29.3 | 14.4 | ||
| GRID: Autosport (2014) | 43.8 | 19.1 | ||
| Risen 3: Titan Lords (2014) | 10 | 6.3 | ||
| Sims 4 (2014) | 71.6 | 13.7 | ||
| F1 2014 (2014) | 22 | 16 | ||
| Dirt Rally (2015) | 28.5 | 12.5 | ||
| Metal Gear Solid V (2015) | 16.4 | 9.7 | ||
| Rocket League (2017) | 18.1 | 6.2 | ||
| Dirt 4 (2017) | 10 | 5.6 |
Rumorosità
| Idle |
| 30.3 / 30.6 / 30.6 dB(A) |
| HDD |
| 31.1 dB(A) |
| Sotto carico |
| 30.6 / 30.6 dB(A) |
 | ||
30 dB silenzioso 40 dB(A) udibile 50 dB(A) rumoroso |
||
min: | ||
(+) La temperatura massima sul lato superiore è di 38.5 °C / 101 F, rispetto alla media di 35.4 °C / 96 F, che varia da 19.6 a 60 °C per questa classe Convertible.
(-) Il lato inferiore si riscalda fino ad un massimo di 46.4 °C / 116 F, rispetto alla media di 36.9 °C / 98 F
(+) In idle, la temperatura media del lato superiore è di 27.4 °C / 81 F, rispetto alla media deld ispositivo di 30.3 °C / 87 F.
(+) I poggiapolsi e il touchpad sono piu' freddi della temperatura della pelle con un massimo di 26.9 °C / 80.4 F e sono quindi freddi al tatto.
(±) La temperatura media della zona del palmo della mano di dispositivi simili e'stata di 28 °C / 82.4 F (+1.1 °C / 2 F).
Acer Spin 1 SP111-31-C79E analisi audio
(-) | altoparlanti non molto potenti (68 dB)
Bassi 100 - 315 Hz
(±) | bassi ridotti - in media 13.2% inferiori alla media
(+) | bassi in lineaa (6.2% delta rispetto alla precedente frequenza)
Medi 400 - 2000 Hz
(+) | medi bilanciati - solo only 2.9% rispetto alla media
(+) | medi lineari (6% delta rispetto alla precedente frequenza)
Alti 2 - 16 kHz
(+) | Alti bilanciati - appena 4.3% dalla media
(+) | alti lineari (6.4% delta rispetto alla precedente frequenza)
Nel complesso 100 - 16.000 Hz
(±) | la linearità complessiva del suono è media (17.5% di differenza rispetto alla media
Rispetto alla stessa classe
» 34% di tutti i dispositivi testati in questa classe è stato migliore, 8% simile, 58% peggiore
» Il migliore ha avuto un delta di 6%, medio di 20%, peggiore di 57%
Rispetto a tutti i dispositivi testati
» 34% di tutti i dispositivi testati in questa classe è stato migliore, 8% similare, 58% peggiore
» Il migliore ha avuto un delta di 4%, medio di 24%, peggiore di 134%
Apple MacBook 12 (Early 2016) 1.1 GHz analisi audio
(+) | gli altoparlanti sono relativamente potenti (83.6 dB)
Bassi 100 - 315 Hz
(±) | bassi ridotti - in media 11.3% inferiori alla media
(±) | la linearità dei bassi è media (14.2% delta rispetto alla precedente frequenza)
Medi 400 - 2000 Hz
(+) | medi bilanciati - solo only 2.4% rispetto alla media
(+) | medi lineari (5.5% delta rispetto alla precedente frequenza)
Alti 2 - 16 kHz
(+) | Alti bilanciati - appena 2% dalla media
(+) | alti lineari (4.5% delta rispetto alla precedente frequenza)
Nel complesso 100 - 16.000 Hz
(+) | suono nel complesso lineare (10.2% differenza dalla media)
Rispetto alla stessa classe
» 7% di tutti i dispositivi testati in questa classe è stato migliore, 2% simile, 91% peggiore
» Il migliore ha avuto un delta di 5%, medio di 18%, peggiore di 53%
Rispetto a tutti i dispositivi testati
» 5% di tutti i dispositivi testati in questa classe è stato migliore, 1% similare, 94% peggiore
» Il migliore ha avuto un delta di 4%, medio di 24%, peggiore di 134%
| Off / Standby | |
| Idle | |
| Sotto carico |
|
Leggenda:
min: | |
| Battery Runtime - WiFi Websurfing | |
| Acer Spin 1 SP111-31-C79E | |
| Medion Akoya E2215T | |
| Asus VivoBook Flip 12 TP203NAH-BP049T | |
| HP Pavilion 11-k103ng x360 | |
Pro
Contro
Il processore Apollo Lake quad-core dello Spin 1 offre potenza sufficiente per applicazioni da ufficio e internet. Il decoder integrato nella GPU consente di giocare con tutti i consueti formati video.
Non manca spazio di archiviazione, in quanto Acer inserisce un hard drive da 500 GB. Per sostituire l'HDD con un SSD, occorre aprire il case. Non ci sono cover di manutenzione.
Lo Spin 1 si rivela un'instancabile macchina per scrivere e navigare.
Questo piccolo computer brilla in termini di autonomia della batteria. Nel nostro test pratico WLAN, il convertibile ha un'autonomia di circa 9,5 ore. La tastiera fa una buona impressione ed è adatta anche a chi scrive molto. Il display Full HD IPS piace per gli angoli di visuale stabili, il buon contrasto e la buona riproduzione del colore. La luminosità, tuttavia, potrebbe essere superiore.
Nota: si tratta di una recensione breve, con alcune sezioni non tradotte, per la versione integrale in inglese guardate qui.
Acer Spin 1 SP111-31-C79E
- 07/05/2017 v6 (old)
Sascha Mölck