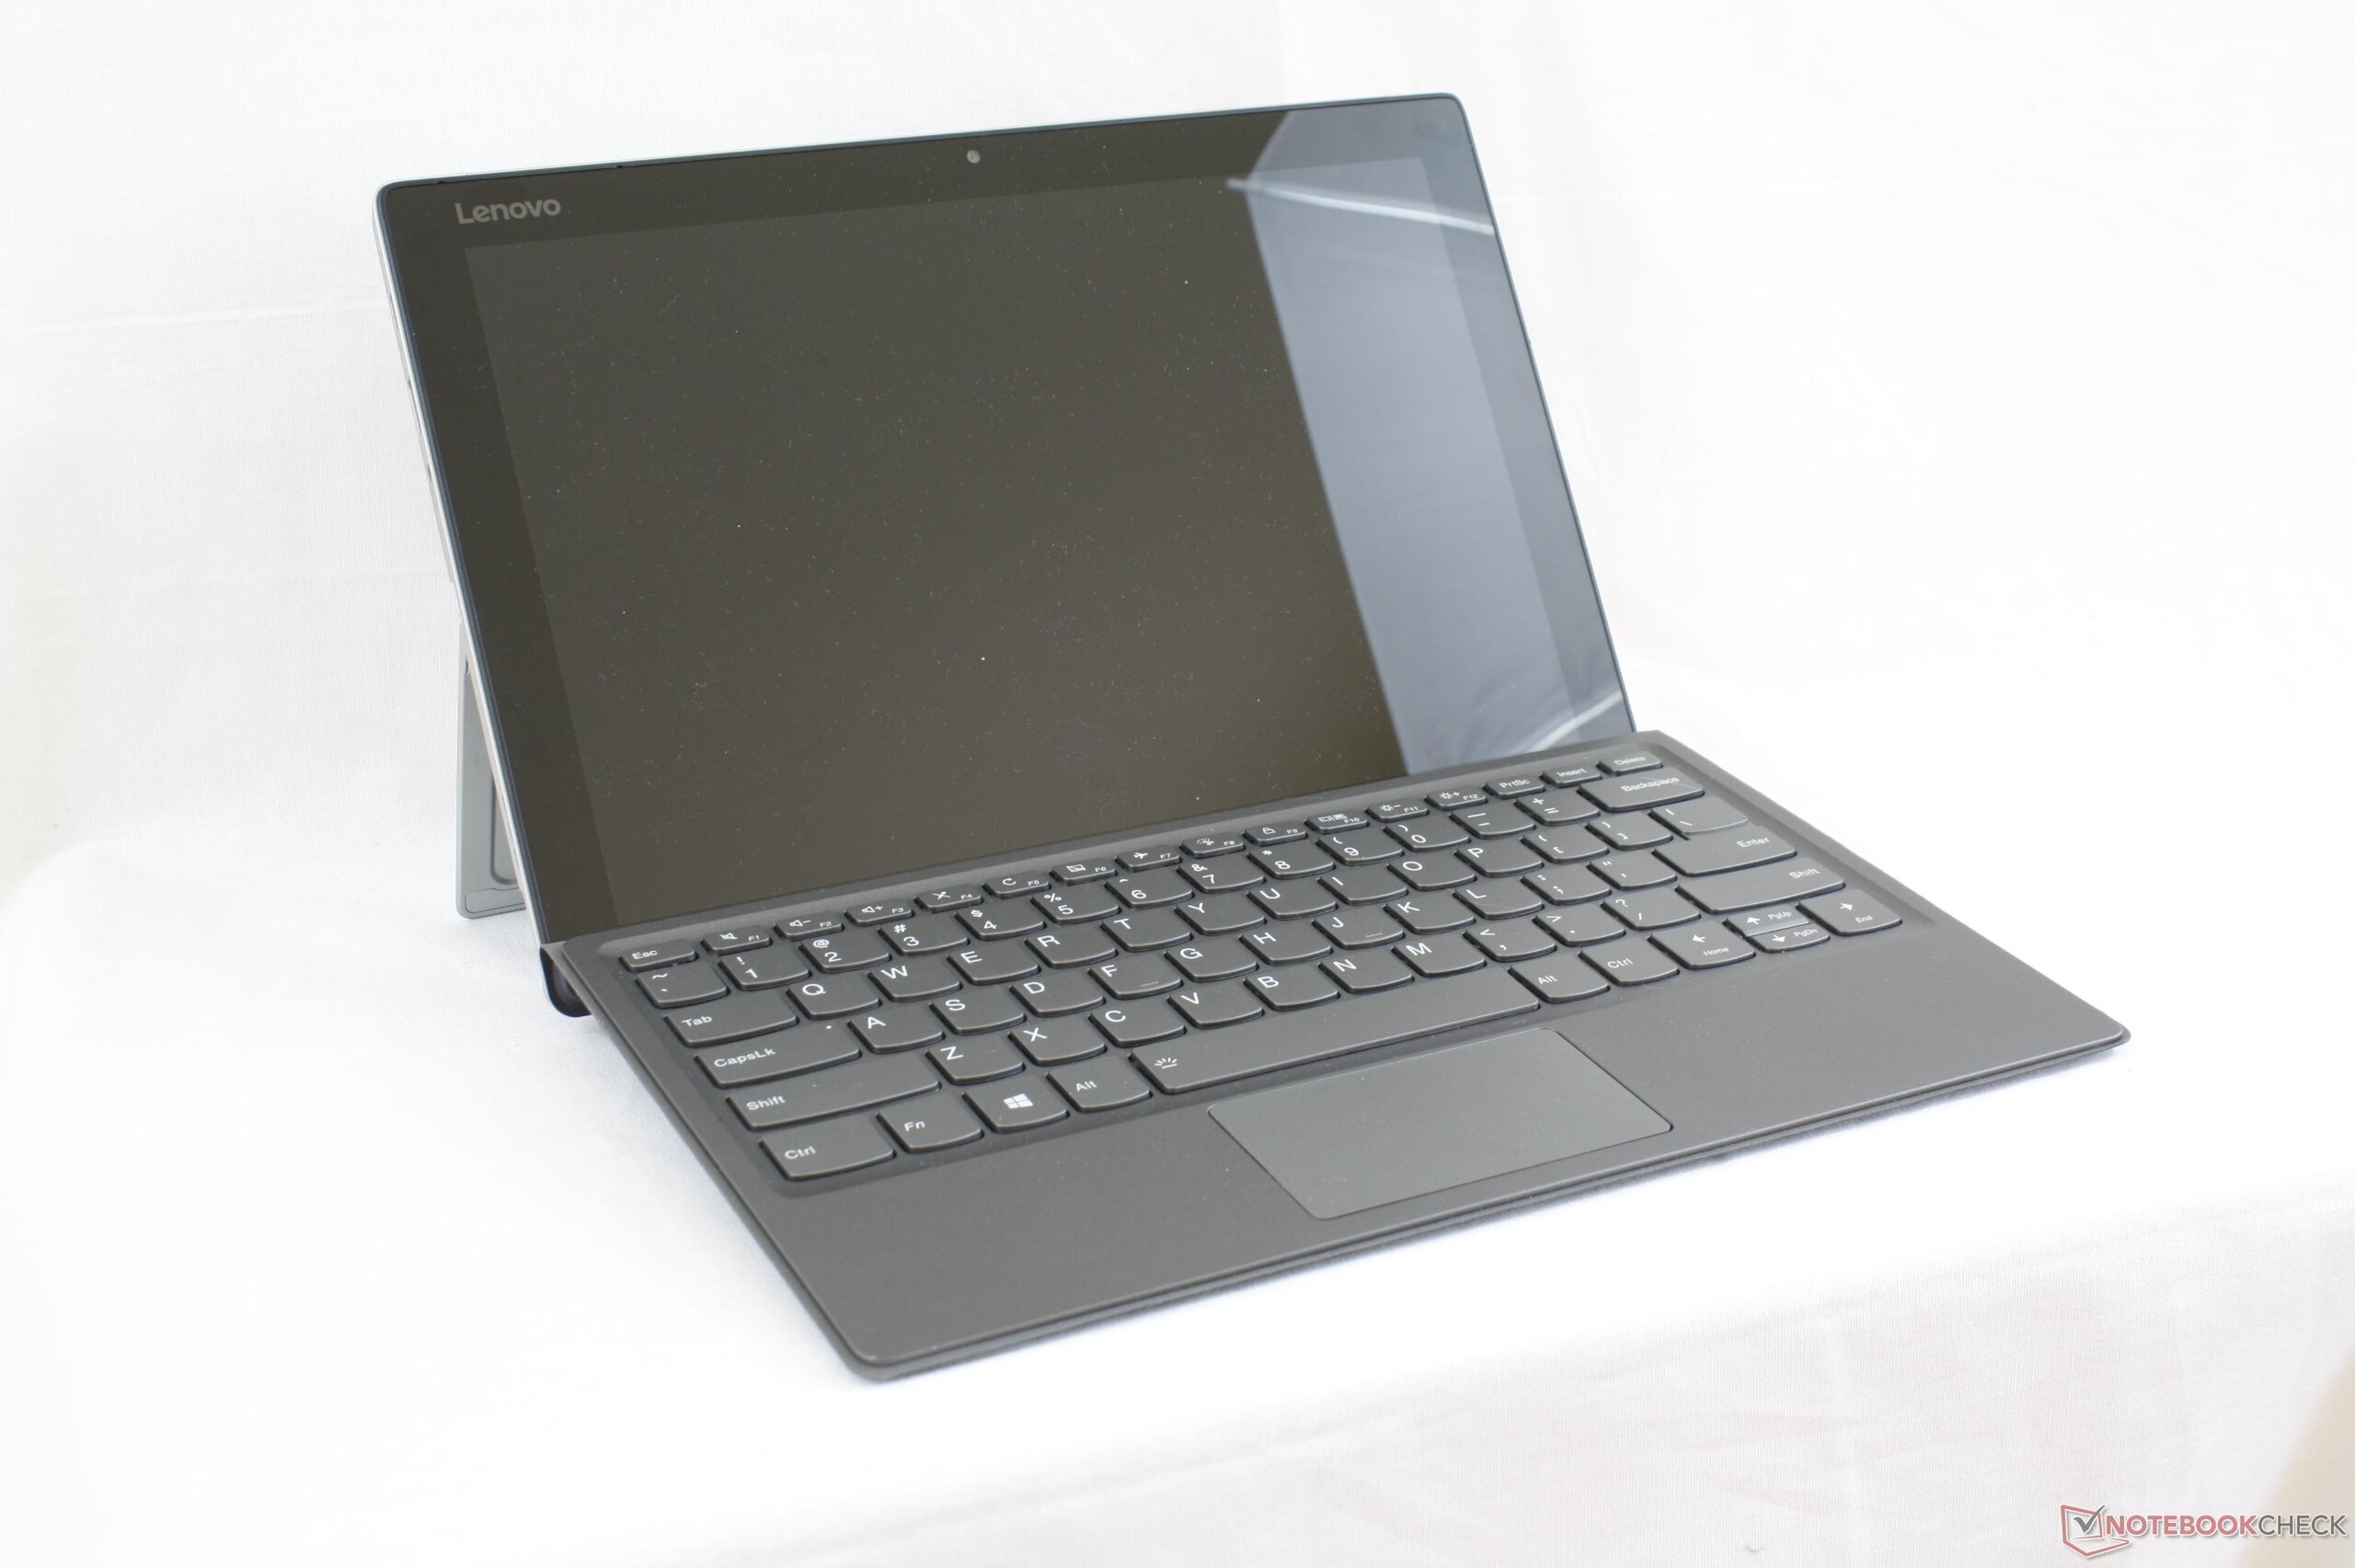
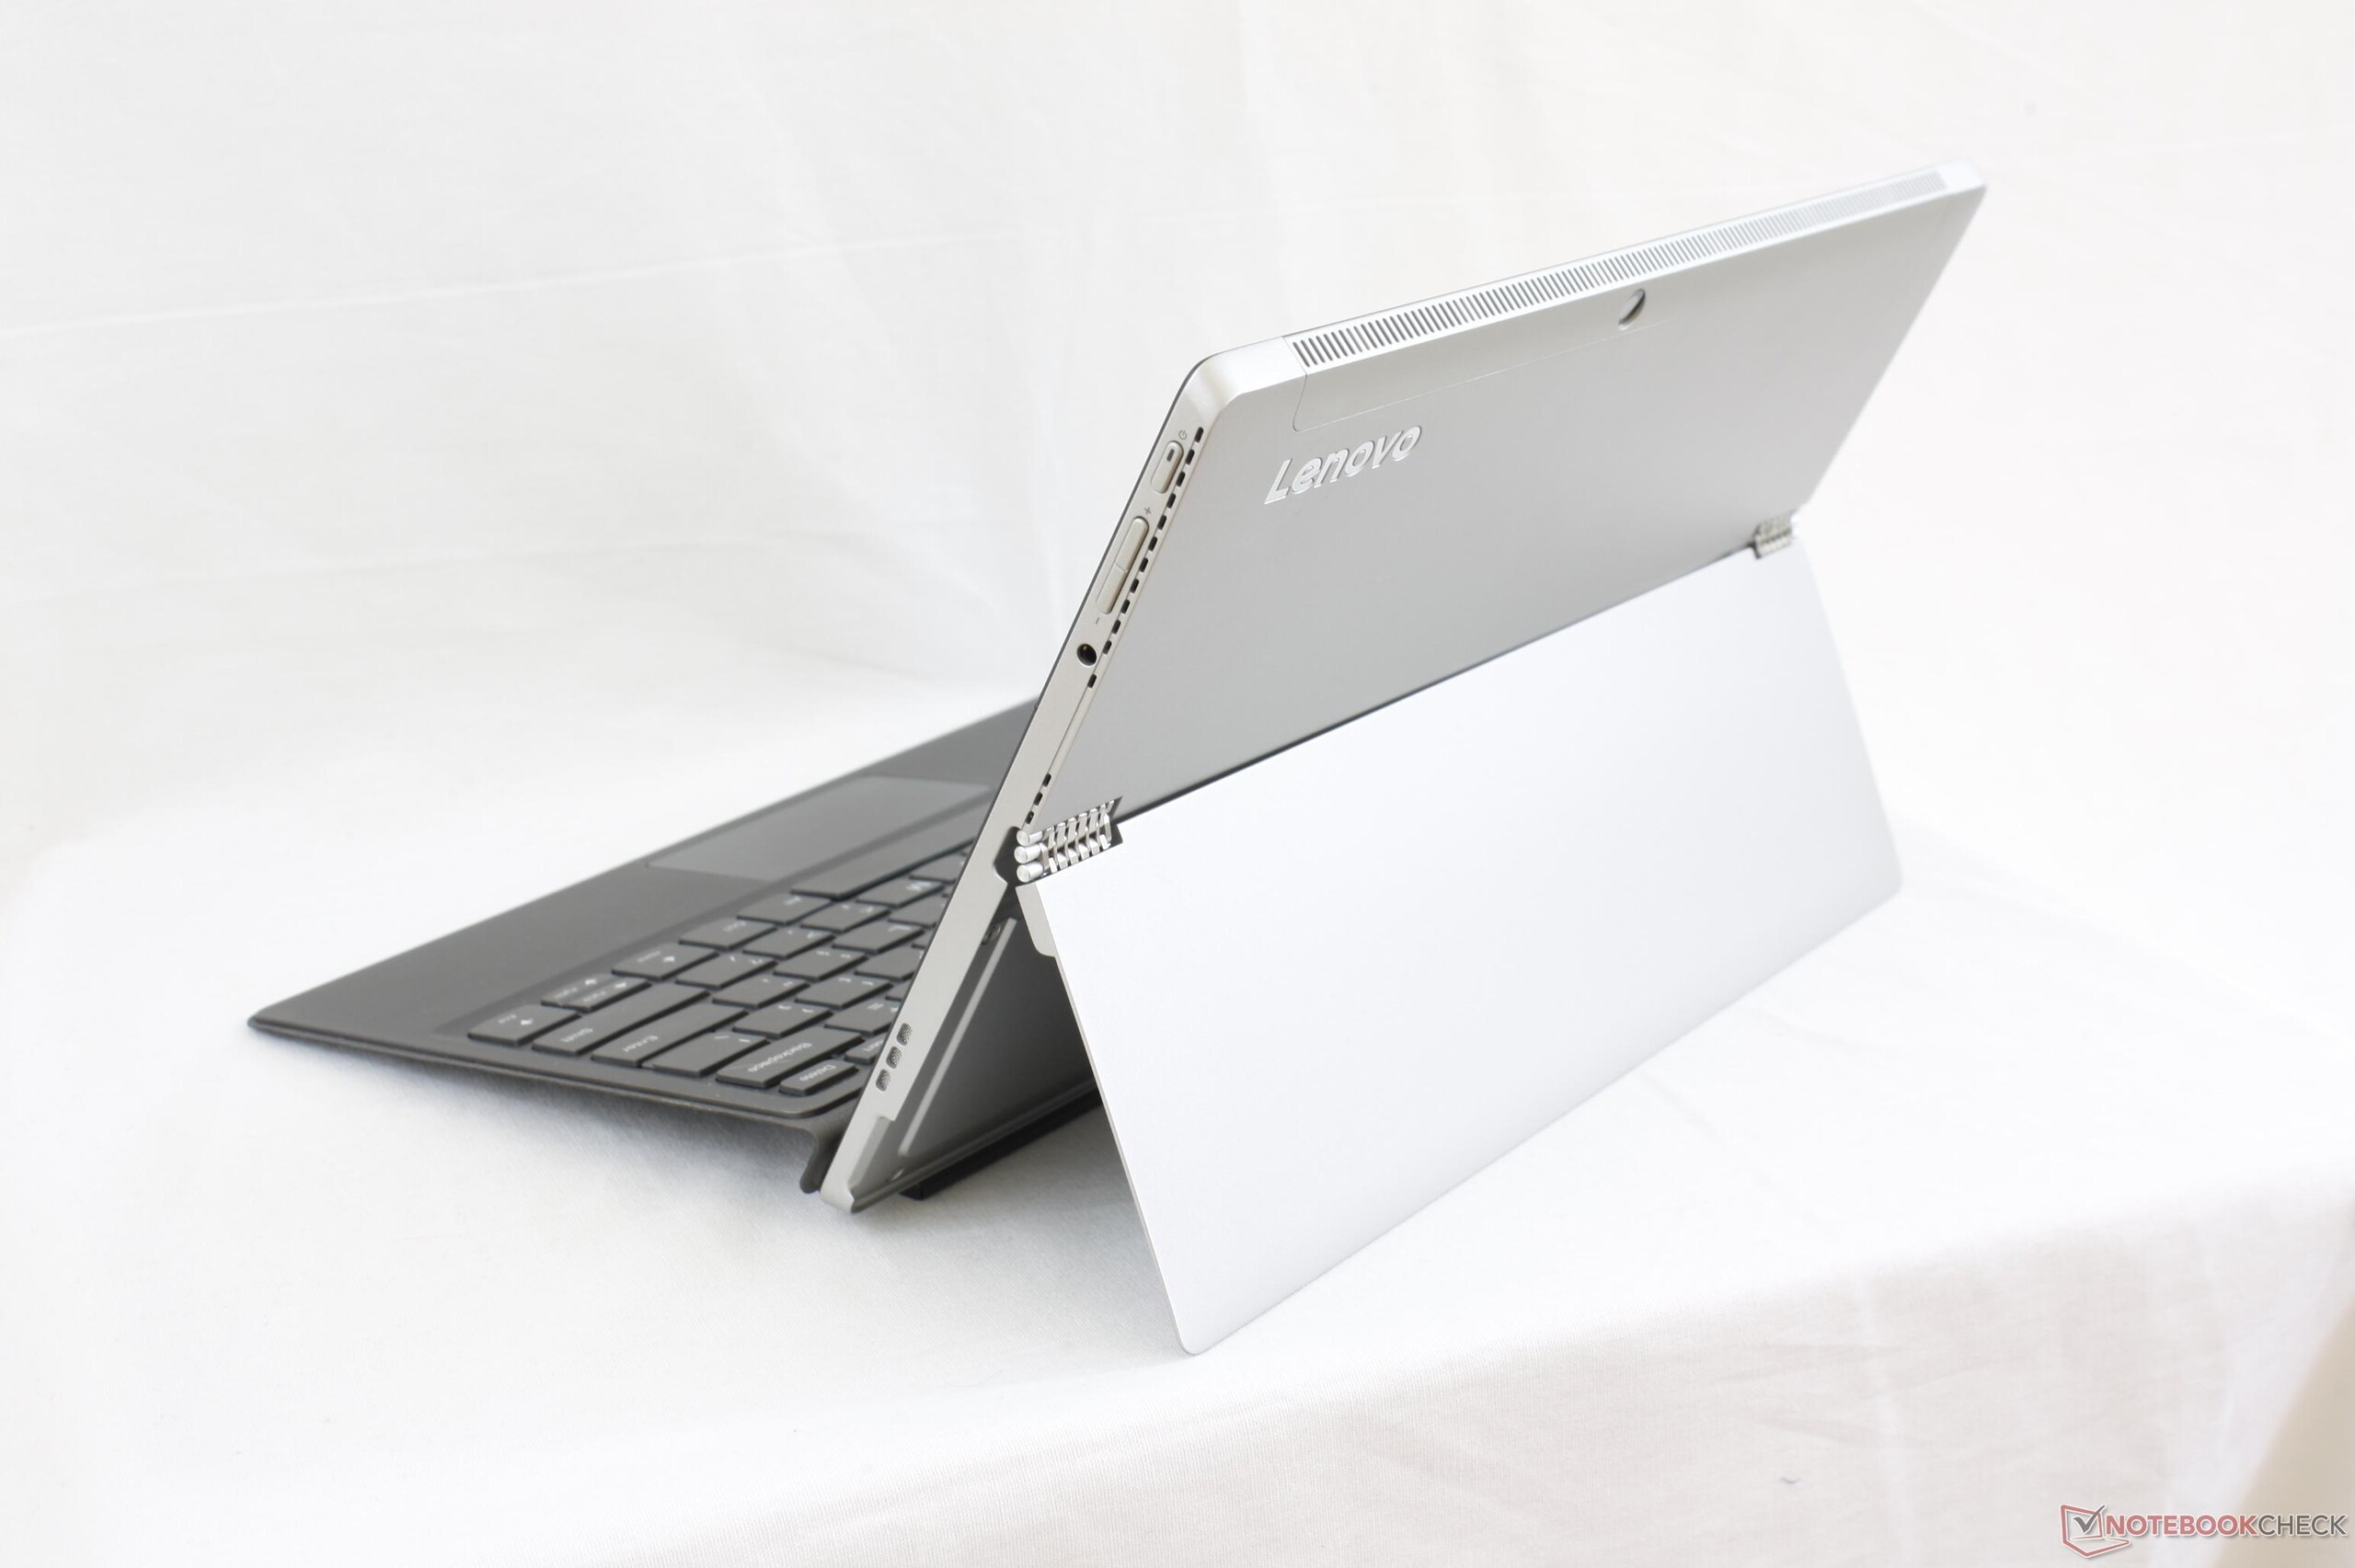
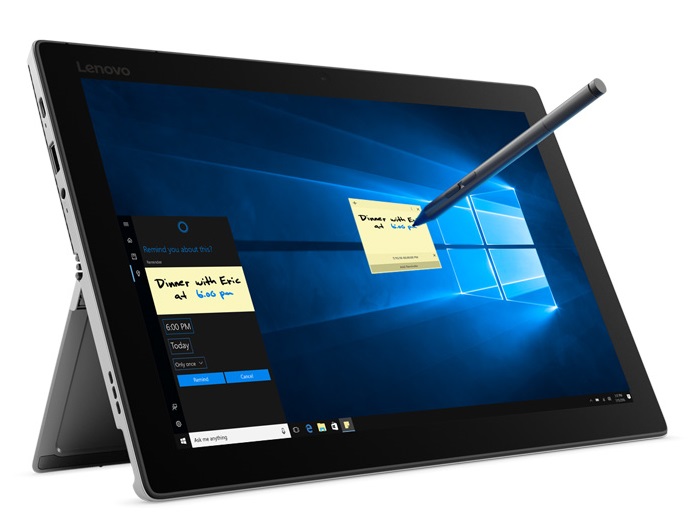
Recensione breve del Convertibile Lenovo Miix 520 (i5-8250U, FHD)
| SD Card Reader | |
| average JPG Copy Test (av. of 3 runs) | |
| HP Elite x2 1012 G2-1LV76EA | |
| Lenovo Miix 520-12IKB 81CG | |
| Lenovo ThinkPad X1 Tablet Gen 2 | |
| maximum AS SSD Seq Read Test (1GB) | |
| Lenovo ThinkPad X1 Tablet Gen 2 | |
| HP Elite x2 1012 G2-1LV76EA | |
| Lenovo Miix 520-12IKB 81CG | |
| Networking | |
| iperf3 transmit AX12 | |
| Lenovo Miix 520-12IKB 81CG | |
| Lenovo Miix 510 Pro 80U10006GE (jseb) | |
| Dell XPS 13-9365 2-in-1 | |
| HP Elite x2 1012 G2-1LV76EA | |
| iperf3 receive AX12 | |
| Lenovo Miix 510 Pro 80U10006GE (jseb) | |
| HP Elite x2 1012 G2-1LV76EA | |
| Lenovo Miix 520-12IKB 81CG | |
| Dell XPS 13-9365 2-in-1 | |
| |||||||||||||||||||||||||
Distribuzione della luminosità: 87 %
Al centro con la batteria: 348.8 cd/m²
Contrasto: 872:1 (Nero: 0.4 cd/m²)
ΔE ColorChecker Calman: 7 | ∀{0.5-29.43 Ø4.71}
ΔE Greyscale Calman: 10.1 | ∀{0.09-98 Ø4.96}
90.9% sRGB (Argyll 1.6.3 3D)
58.7% AdobeRGB 1998 (Argyll 1.6.3 3D)
65.4% AdobeRGB 1998 (Argyll 3D)
90.8% sRGB (Argyll 3D)
64.4% Display P3 (Argyll 3D)
Gamma: 2.22
CCT: 9065 K
| Lenovo Miix 520-12IKB 81CG Unknown, IPS, 12.2", 1920x1200 | Microsoft Surface Pro (2017) m3 LG Display LP123WQ112604, IPS, 12.3", 2736x1826 | Lenovo Miix 510 Pro 80U10006GE Unknown, IPS, 12.2", 1920x1200 | HP Elite x2 1012 G2-1LV76EA Samsung SDC4A49, IPS, 12.3", 2716x1824 | Dell XPS 13 9365-4537 2-in-1 Sharp LQ133Z1, IPS, 13.3", 3200x1800 | Lenovo ThinkPad X1 Tablet Gen 2 LSN120QL01L01, IPS, 12", 2160x1440 | |
|---|---|---|---|---|---|---|
| Display | 7% | 0% | 6% | 1% | ||
| Display P3 Coverage (%) | 64.4 | 68.5 6% | 64.5 0% | 66.7 4% | 64.4 0% | |
| sRGB Coverage (%) | 90.8 | 99.2 9% | 92 1% | 98 8% | 92.9 2% | |
| AdobeRGB 1998 Coverage (%) | 65.4 | 70.1 7% | 65.5 0% | 68.7 5% | 66.1 1% | |
| Response Times | -9% | 13% | -3% | -18% | 20% | |
| Response Time Grey 50% / Grey 80% * (ms) | 35.6 ? | 42 ? -18% | 33 ? 7% | 45.6 ? -28% | 48 ? -35% | 28.4 ? 20% |
| Response Time Black / White * (ms) | 28 ? | 28 ? -0% | 23 ? 18% | 21.6 ? 23% | 28 ? -0% | 22.8 ? 19% |
| PWM Frequency (Hz) | 198.4 ? | 125 ? | 2119 ? | 221.2 ? | ||
| Screen | 35% | 3% | 31% | 33% | 14% | |
| Brightness middle (cd/m²) | 348.8 | 461 32% | 327 -6% | 443 27% | 348 0% | 388.1 11% |
| Brightness (cd/m²) | 339 | 444 31% | 324 -4% | 446 32% | 306 -10% | 344 1% |
| Brightness Distribution (%) | 87 | 93 7% | 88 1% | 88 1% | 78 -10% | 78 -10% |
| Black Level * (cd/m²) | 0.4 | 0.34 15% | 0.35 13% | 0.41 -2% | 0.2 50% | 0.39 2% |
| Contrast (:1) | 872 | 1356 56% | 934 7% | 1080 24% | 1740 100% | 995 14% |
| Colorchecker dE 2000 * | 7 | 3.43 51% | 6.54 7% | 2.6 63% | 2.79 60% | 4.6 34% |
| Colorchecker dE 2000 max. * | 16.2 | 5.55 66% | 15.59 4% | 4 75% | 5.53 66% | 9.1 44% |
| Greyscale dE 2000 * | 10.1 | 3.08 70% | 9.52 6% | 3 70% | 3.47 66% | 6.1 40% |
| Gamma | 2.22 99% | 3.03 73% | 2.35 94% | 2.38 92% | 2.54 87% | 2.07 106% |
| CCT | 9065 72% | 7014 93% | 8802 74% | 6780 96% | 6564 99% | 7104 91% |
| Color Space (Percent of AdobeRGB 1998) (%) | 58.7 | 64 9% | 59 1% | 62.6 7% | 60 2% | 59 1% |
| Color Space (Percent of sRGB) (%) | 90.9 | 99 9% | 92 1% | 98 8% | 93 2% | 91 0% |
| Media totale (Programma / Settaggio) | 11% /
23% | 5% /
4% | 11% /
21% | 5% /
20% | 17% /
15% |
* ... Meglio usare valori piccoli
Tempi di risposta del Display
| ↔ Tempi di risposta dal Nero al Bianco | ||
|---|---|---|
| 28 ms ... aumenta ↗ e diminuisce ↘ combinato | ↗ 14.8 ms Incremento | 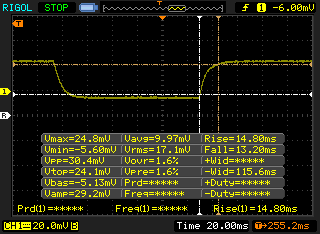 |
| ↘ 13.2 ms Calo | ||
| Lo schermo mostra tempi di risposta relativamente lenti nei nostri tests e potrebbe essere troppo lento per i gamers. In confronto, tutti i dispositivi di test variano da 0.1 (minimo) a 240 (massimo) ms. » 71 % di tutti i dispositivi è migliore. Questo significa che i tempi di risposta rilevati sono peggiori rispetto alla media di tutti i dispositivi testati (19.8 ms). | ||
| ↔ Tempo di risposta dal 50% Grigio all'80% Grigio | ||
| 35.6 ms ... aumenta ↗ e diminuisce ↘ combinato | ↗ 17.2 ms Incremento | 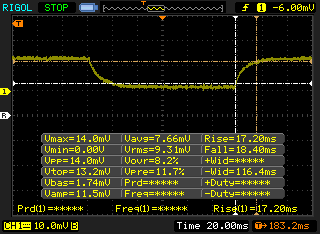 |
| ↘ 18.4 ms Calo | ||
| Lo schermo mostra tempi di risposta lenti nei nostri tests e sarà insoddisfacente per i gamers. In confronto, tutti i dispositivi di test variano da 0.165 (minimo) a 636 (massimo) ms. » 50 % di tutti i dispositivi è migliore. Questo significa che i tempi di risposta rilevati sono peggiori rispetto alla media di tutti i dispositivi testati (30.9 ms). | ||
Sfarfallio dello schermo / PWM (Pulse-Width Modulation)
| flickering dello schermo / PWM rilevato | 198.4 Hz | ≤ 99 % settaggio luminosita' | 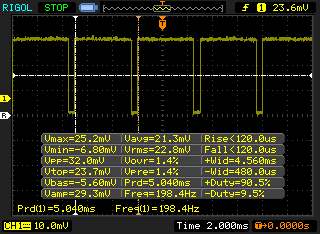 |
Il display sfarfalla a 198.4 Hz (Probabilmente a causa dell'uso di PWM) Flickering rilevato ad una luminosita' di 99 % o inferiore. Non dovrebbe verificarsi flickering o PWM sopra questo valore di luminosita'. La frequenza di 198.4 Hz è relativamente bassa, quindi gli utenti sensibili potrebbero notare il flickering ed accusare stanchezza agli occhi a questo livello di luminosità e a livelli inferiori. In confronto: 52 % di tutti i dispositivi testati non utilizza PWM per ridurre la luminosita' del display. Se è rilevato PWM, una media di 7744 (minimo: 5 - massimo: 343500) Hz è stata rilevata. | |||
| wPrime 2.10 - 1024m | |
| Microsoft Surface Pro (2017) i7 | |
| HP Spectre x360 15t-bl100 | |
| Dell Inspiron 15 7000 7577 | |
| Lenovo Miix 520-12IKB 81CG | |
| HP Envy x360 15m-bq121dx | |
| MSI GF62VR 7RF-877 | |
* ... Meglio usare valori piccoli
| PCMark 8 | |
| Home Score Accelerated v2 | |
| Lenovo Miix 520-12IKB 81CG | |
| HP Elite x2 1012 G2-1LV76EA | |
| Lenovo Miix 510 Pro 80U10006GE | |
| Microsoft Surface Pro (2017) m3 | |
| Work Score Accelerated v2 | |
| Lenovo Miix 510 Pro 80U10006GE | |
| HP Elite x2 1012 G2-1LV76EA | |
| Microsoft Surface Pro (2017) m3 | |
| Lenovo Miix 520-12IKB 81CG | |
| Creative Score Accelerated v2 | |
| Lenovo Miix 520-12IKB 81CG | |
| HP Elite x2 1012 G2-1LV76EA | |
| Microsoft Surface Pro (2017) m3 | |
| PCMark 10 - Score | |
| Lenovo Miix 520-12IKB 81CG | |
| HP Elite x2 1012 G2-1LV76EA | |
| Microsoft Surface Pro (2017) m3 | |
| PCMark 8 Home Score Accelerated v2 | 3733 punti | |
| PCMark 8 Creative Score Accelerated v2 | 4869 punti | |
| PCMark 8 Work Score Accelerated v2 | 2699 punti | |
| PCMark 10 Score | 3295 punti | |
Aiuto | ||
| Lenovo Miix 520-12IKB 81CG Samsung PM961 MZVLW256HEHP | Microsoft Surface Pro (2017) m3 Samsung PM971 KUS020203M | Lenovo Miix 510 Pro 80U10006GE Samsung PM951 NVMe MZVLV256 | HP Elite x2 1012 G2-1LV76EA Samsung PM961 MZVLW256HEHP | Dell XPS 13 9365-4537 2-in-1 Toshiba NVMe THNSN5256GPUK | |
|---|---|---|---|---|---|
| AS SSD | -22% | -146% | 48% | -11% | |
| Copy Game MB/s (MB/s) | 410.8 | 140.7 -66% | 379.9 -8% | 457.8 11% | |
| Copy Program MB/s (MB/s) | 310.4 | 83.8 -73% | 198.2 -36% | 264.7 -15% | |
| Copy ISO MB/s (MB/s) | 659 | 173.2 -74% | 791 20% | 714 8% | |
| Score Total (Points) | 2378 | 1847 -22% | 1190 -50% | 4653 96% | 1388 -42% |
| Score Write (Points) | 572 | 284 -50% | 60 -90% | 879 54% | 389 -32% |
| Score Read (Points) | 1200 | 1053 -12% | 777 -35% | 2545 112% | 681 -43% |
| Access Time Write * (ms) | 0.33 | 0.04 88% | 4.206 -1175% | 0.027 92% | 0.041 88% |
| Access Time Read * (ms) | 0.49 | 0.074 85% | 0.053 89% | 0.041 92% | 0.169 66% |
| 4K-64 Write (MB/s) | 345.5 | 144.3 -58% | 43.14 -88% | 657 90% | 249.4 -28% |
| 4K-64 Read (MB/s) | 999 | 891 -11% | 611 -39% | 2280 128% | 512 -49% |
| 4K Write (MB/s) | 107.9 | 88.6 -18% | 0.96 -99% | 132.2 23% | 85.8 -20% |
| 4K Read (MB/s) | 48.69 | 38.82 -20% | 39.6 -19% | 45.24 -7% | 34.77 -29% |
| Seq Write (MB/s) | 1182 | 514 -57% | 158.3 -87% | 897 -24% | 543 -54% |
| Seq Read (MB/s) | 1523 | 1226 -20% | 1260 -17% | 2197 44% | 1342 -12% |
* ... Meglio usare valori piccoli

| 3DMark 11 | |
| 1280x720 Performance GPU | |
| Intel Skull Canyon NUC6i7KYK | |
| Lenovo IdeaPad 320S-13IKB | |
| Microsoft Surface Laptop i7 | |
| Microsoft Surface Laptop i7 | |
| Razer Blade Stealth QHD i7-8550U | |
| Dell XPS 13 i5-8250U | |
| Toshiba Tecra X40-D | |
| Lenovo Miix 520-12IKB 81CG | |
| Acer TravelMate P249-M-5452 | |
| Lenovo Miix 510 Pro 80U10006GE | |
| 1280x720 Performance Combined | |
| Lenovo IdeaPad 320S-13IKB | |
| Intel Skull Canyon NUC6i7KYK | |
| Microsoft Surface Laptop i7 | |
| Microsoft Surface Laptop i7 | |
| Razer Blade Stealth QHD i7-8550U | |
| Dell XPS 13 i5-8250U | |
| Toshiba Tecra X40-D | |
| Lenovo Miix 520-12IKB 81CG | |
| Acer TravelMate P249-M-5452 | |
| Lenovo Miix 510 Pro 80U10006GE | |
| 3DMark | |
| 1280x720 Cloud Gate Standard Graphics | |
| Lenovo IdeaPad 320S-13IKB | |
| Intel Skull Canyon NUC6i7KYK | |
| Microsoft Surface Laptop i7 | |
| Razer Blade Stealth QHD i7-8550U | |
| Dell XPS 13 i5-8250U | |
| Toshiba Tecra X40-D | |
| Lenovo Miix 520-12IKB 81CG | |
| Acer TravelMate P249-M-5452 | |
| Lenovo Miix 510 Pro 80U10006GE | |
| 1920x1080 Fire Strike Graphics | |
| Lenovo IdeaPad 320S-13IKB | |
| Intel Skull Canyon NUC6i7KYK | |
| Microsoft Surface Laptop i7 | |
| Toshiba Tecra X40-D | |
| Lenovo Miix 520-12IKB 81CG | |
| Acer TravelMate P249-M-5452 | |
| 1920x1080 Ice Storm Extreme Graphics | |
| Intel Skull Canyon NUC6i7KYK | |
| Lenovo Miix 520-12IKB 81CG | |
| Acer TravelMate P249-M-5452 | |
| 3DMark 11 Performance | 1800 punti | |
| 3DMark Ice Storm Standard Score | 65197 punti | |
| 3DMark Cloud Gate Standard Score | 7775 punti | |
| 3DMark Fire Strike Score | 952 punti | |
| 3DMark Fire Strike Extreme Score | 437 punti | |
Aiuto | ||
| basso | medio | alto | ultra | |
|---|---|---|---|---|
| BioShock Infinite (2013) | 54.3 | 29.3 | 24.1 | 7.4 |
| Rise of the Tomb Raider (2016) | 21.3 | 11 |
Rumorosità
| Idle |
| 28.2 / 28.2 / 29.6 dB(A) |
| Sotto carico |
| 34 / 36 dB(A) |
 | ||
30 dB silenzioso 40 dB(A) udibile 50 dB(A) rumoroso |
||
min: | ||
| Lenovo Miix 520-12IKB 81CG UHD Graphics 620, i5-8250U, Samsung PM961 MZVLW256HEHP | Microsoft Surface Pro (2017) i7 Iris Plus Graphics 640, i7-7660U, Samsung PM971 KUS040202M | Lenovo Miix 510 Pro 80U10006GE HD Graphics 520, 6200U, Samsung PM951 NVMe MZVLV256 | HP Elite x2 1012 G2-1LV76EA HD Graphics 620, i5-7200U, Samsung PM961 MZVLW256HEHP | Dell XPS 13 9365-4537 2-in-1 HD Graphics 615, i5-7Y54, Toshiba NVMe THNSN5256GPUK | Lenovo ThinkPad X1 Tablet Gen 2 HD Graphics 615, i5-7Y54, Samsung PM961 MZVLW256HEHP | |
|---|---|---|---|---|---|---|
| Noise | -1% | -5% | 1% | |||
| off /ambiente * (dB) | 28.2 | 29.6 -5% | 30.15 -7% | 29.5 -5% | ||
| Idle Minimum * (dB) | 28.2 | 29.6 -5% | 30.15 -7% | 29.5 -5% | ||
| Idle Average * (dB) | 28.2 | 29.6 -5% | 30.8 -9% | 29.5 -5% | ||
| Idle Maximum * (dB) | 29.6 | 29.6 -0% | 31 -5% | 29.5 -0% | ||
| Load Average * (dB) | 34 | 33.4 2% | 36.8 -8% | 30.6 10% | ||
| Load Maximum * (dB) | 36 | 34.1 5% | 33.8 6% | 32.5 10% | ||
| Witcher 3 ultra * (dB) | 33.4 |
* ... Meglio usare valori piccoli
(±) La temperatura massima sul lato superiore è di 44.8 °C / 113 F, rispetto alla media di 35.4 °C / 96 F, che varia da 19.6 a 60 °C per questa classe Convertible.
(±) Il lato inferiore si riscalda fino ad un massimo di 44.2 °C / 112 F, rispetto alla media di 36.9 °C / 98 F
(+) In idle, la temperatura media del lato superiore è di 28 °C / 82 F, rispetto alla media deld ispositivo di 30.3 °C / 87 F.
(+) I poggiapolsi e il touchpad raggiungono la temperatura massima della pelle (35 °C / 95 F) e quindi non sono caldi.
(-) La temperatura media della zona del palmo della mano di dispositivi simili e'stata di 28 °C / 82.4 F (-7 °C / -12.6 F).
Lenovo Miix 520-12IKB 81CG analisi audio
(-) | altoparlanti non molto potenti (61.3 dB)
Bassi 100 - 315 Hz
(-) | quasi nessun basso - in media 18.1% inferiori alla media
(±) | la linearità dei bassi è media (12.5% delta rispetto alla precedente frequenza)
Medi 400 - 2000 Hz
(+) | medi bilanciati - solo only 4% rispetto alla media
(±) | linearità dei medi adeguata (9.9% delta rispetto alla precedente frequenza)
Alti 2 - 16 kHz
(±) | alti elevati - circa 5.1% superiori alla media
(±) | la linearità degli alti è media (10.9% delta rispetto alla precedente frequenza)
Nel complesso 100 - 16.000 Hz
(-) | suono nel complesso non lineare (31% di differenza rispetto alla media
Rispetto alla stessa classe
» 90% di tutti i dispositivi testati in questa classe è stato migliore, 2% simile, 8% peggiore
» Il migliore ha avuto un delta di 6%, medio di 20%, peggiore di 57%
Rispetto a tutti i dispositivi testati
» 90% di tutti i dispositivi testati in questa classe è stato migliore, 2% similare, 8% peggiore
» Il migliore ha avuto un delta di 4%, medio di 23%, peggiore di 134%
Apple MacBook 12 (Early 2016) 1.1 GHz analisi audio
(+) | gli altoparlanti sono relativamente potenti (83.6 dB)
Bassi 100 - 315 Hz
(±) | bassi ridotti - in media 11.3% inferiori alla media
(±) | la linearità dei bassi è media (14.2% delta rispetto alla precedente frequenza)
Medi 400 - 2000 Hz
(+) | medi bilanciati - solo only 2.4% rispetto alla media
(+) | medi lineari (5.5% delta rispetto alla precedente frequenza)
Alti 2 - 16 kHz
(+) | Alti bilanciati - appena 2% dalla media
(+) | alti lineari (4.5% delta rispetto alla precedente frequenza)
Nel complesso 100 - 16.000 Hz
(+) | suono nel complesso lineare (10.2% differenza dalla media)
Rispetto alla stessa classe
» 7% di tutti i dispositivi testati in questa classe è stato migliore, 2% simile, 90% peggiore
» Il migliore ha avuto un delta di 5%, medio di 18%, peggiore di 53%
Rispetto a tutti i dispositivi testati
» 5% di tutti i dispositivi testati in questa classe è stato migliore, 1% similare, 94% peggiore
» Il migliore ha avuto un delta di 4%, medio di 23%, peggiore di 134%
| Off / Standby | |
| Idle | |
| Sotto carico |
|
Leggenda:
min: | |
| Lenovo Miix 520-12IKB 81CG i5-8250U, UHD Graphics 620, Samsung PM961 MZVLW256HEHP, IPS, 1920x1200, 12.2" | Microsoft Surface Pro (2017) i7 i7-7660U, Iris Plus Graphics 640, Samsung PM971 KUS040202M, IPS, 2736x1824, 12.3" | Microsoft Surface Pro (2017) i5 i5-7300U, HD Graphics 620, Samsung PM971 KUS030202M, IPS, 2736x1824, 12.3" | Lenovo Miix 510 Pro 80U10006GE 6200U, HD Graphics 520, Samsung PM951 NVMe MZVLV256, IPS, 1920x1200, 12.2" | HP Elite x2 1012 G2-1LV76EA i5-7200U, HD Graphics 620, Samsung PM961 MZVLW256HEHP, IPS, 2716x1824, 12.3" | Dell XPS 13 9365-4537 2-in-1 i5-7Y54, HD Graphics 615, Toshiba NVMe THNSN5256GPUK, IPS, 3200x1800, 13.3" | |
|---|---|---|---|---|---|---|
| Power Consumption | -2% | 26% | 6% | -0% | -3% | |
| Idle Minimum * (Watt) | 5.5 | 4.2 24% | 3.6 35% | 4.2 24% | 4.1 25% | 8.2 -49% |
| Idle Average * (Watt) | 8.3 | 10.1 -22% | 8.1 2% | 11.5 -39% | 9.2 -11% | 10.8 -30% |
| Idle Maximum * (Watt) | 11.5 | 14 -22% | 8.7 24% | 11.7 -2% | 11.1 3% | 12.7 -10% |
| Load Average * (Watt) | 38.3 | 37.4 2% | 25.5 33% | 31 19% | 33.8 12% | 22.6 41% |
| Load Maximum * (Watt) | 37.7 | 34 10% | 23.5 38% | 27.4 27% | 49.2 -31% | 24.6 35% |
| Witcher 3 ultra * (Watt) | 38.1 |
* ... Meglio usare valori piccoli
| Lenovo Miix 520-12IKB 81CG i5-8250U, UHD Graphics 620, 38 Wh | Microsoft Surface Pro (2017) i5 i5-7300U, HD Graphics 620, 45 Wh | Lenovo Miix 510 Pro 80U10006GE 6200U, HD Graphics 520, 50 Wh | HP Elite x2 1012 G2-1LV76EA i5-7200U, HD Graphics 620, 47 Wh | Dell XPS 13 9365-4537 2-in-1 i5-7Y54, HD Graphics 615, 46 Wh | Lenovo ThinkPad X1 Tablet Gen 2 i5-7Y54, HD Graphics 615, 37 Wh | |
|---|---|---|---|---|---|---|
| Autonomia della batteria | 106% | 21% | 45% | 21% | 40% | |
| Reader / Idle (h) | 12.3 | 17.6 43% | 11.6 -6% | 13.9 13% | 11 -11% | |
| WiFi v1.3 (h) | 5.6 | 12.4 121% | 5.4 -4% | 6.3 13% | 6.8 21% | 7.4 32% |
| Load (h) | 1.1 | 2.8 155% | 1.9 73% | 2.3 109% | 2.2 100% |
Pro
Contro
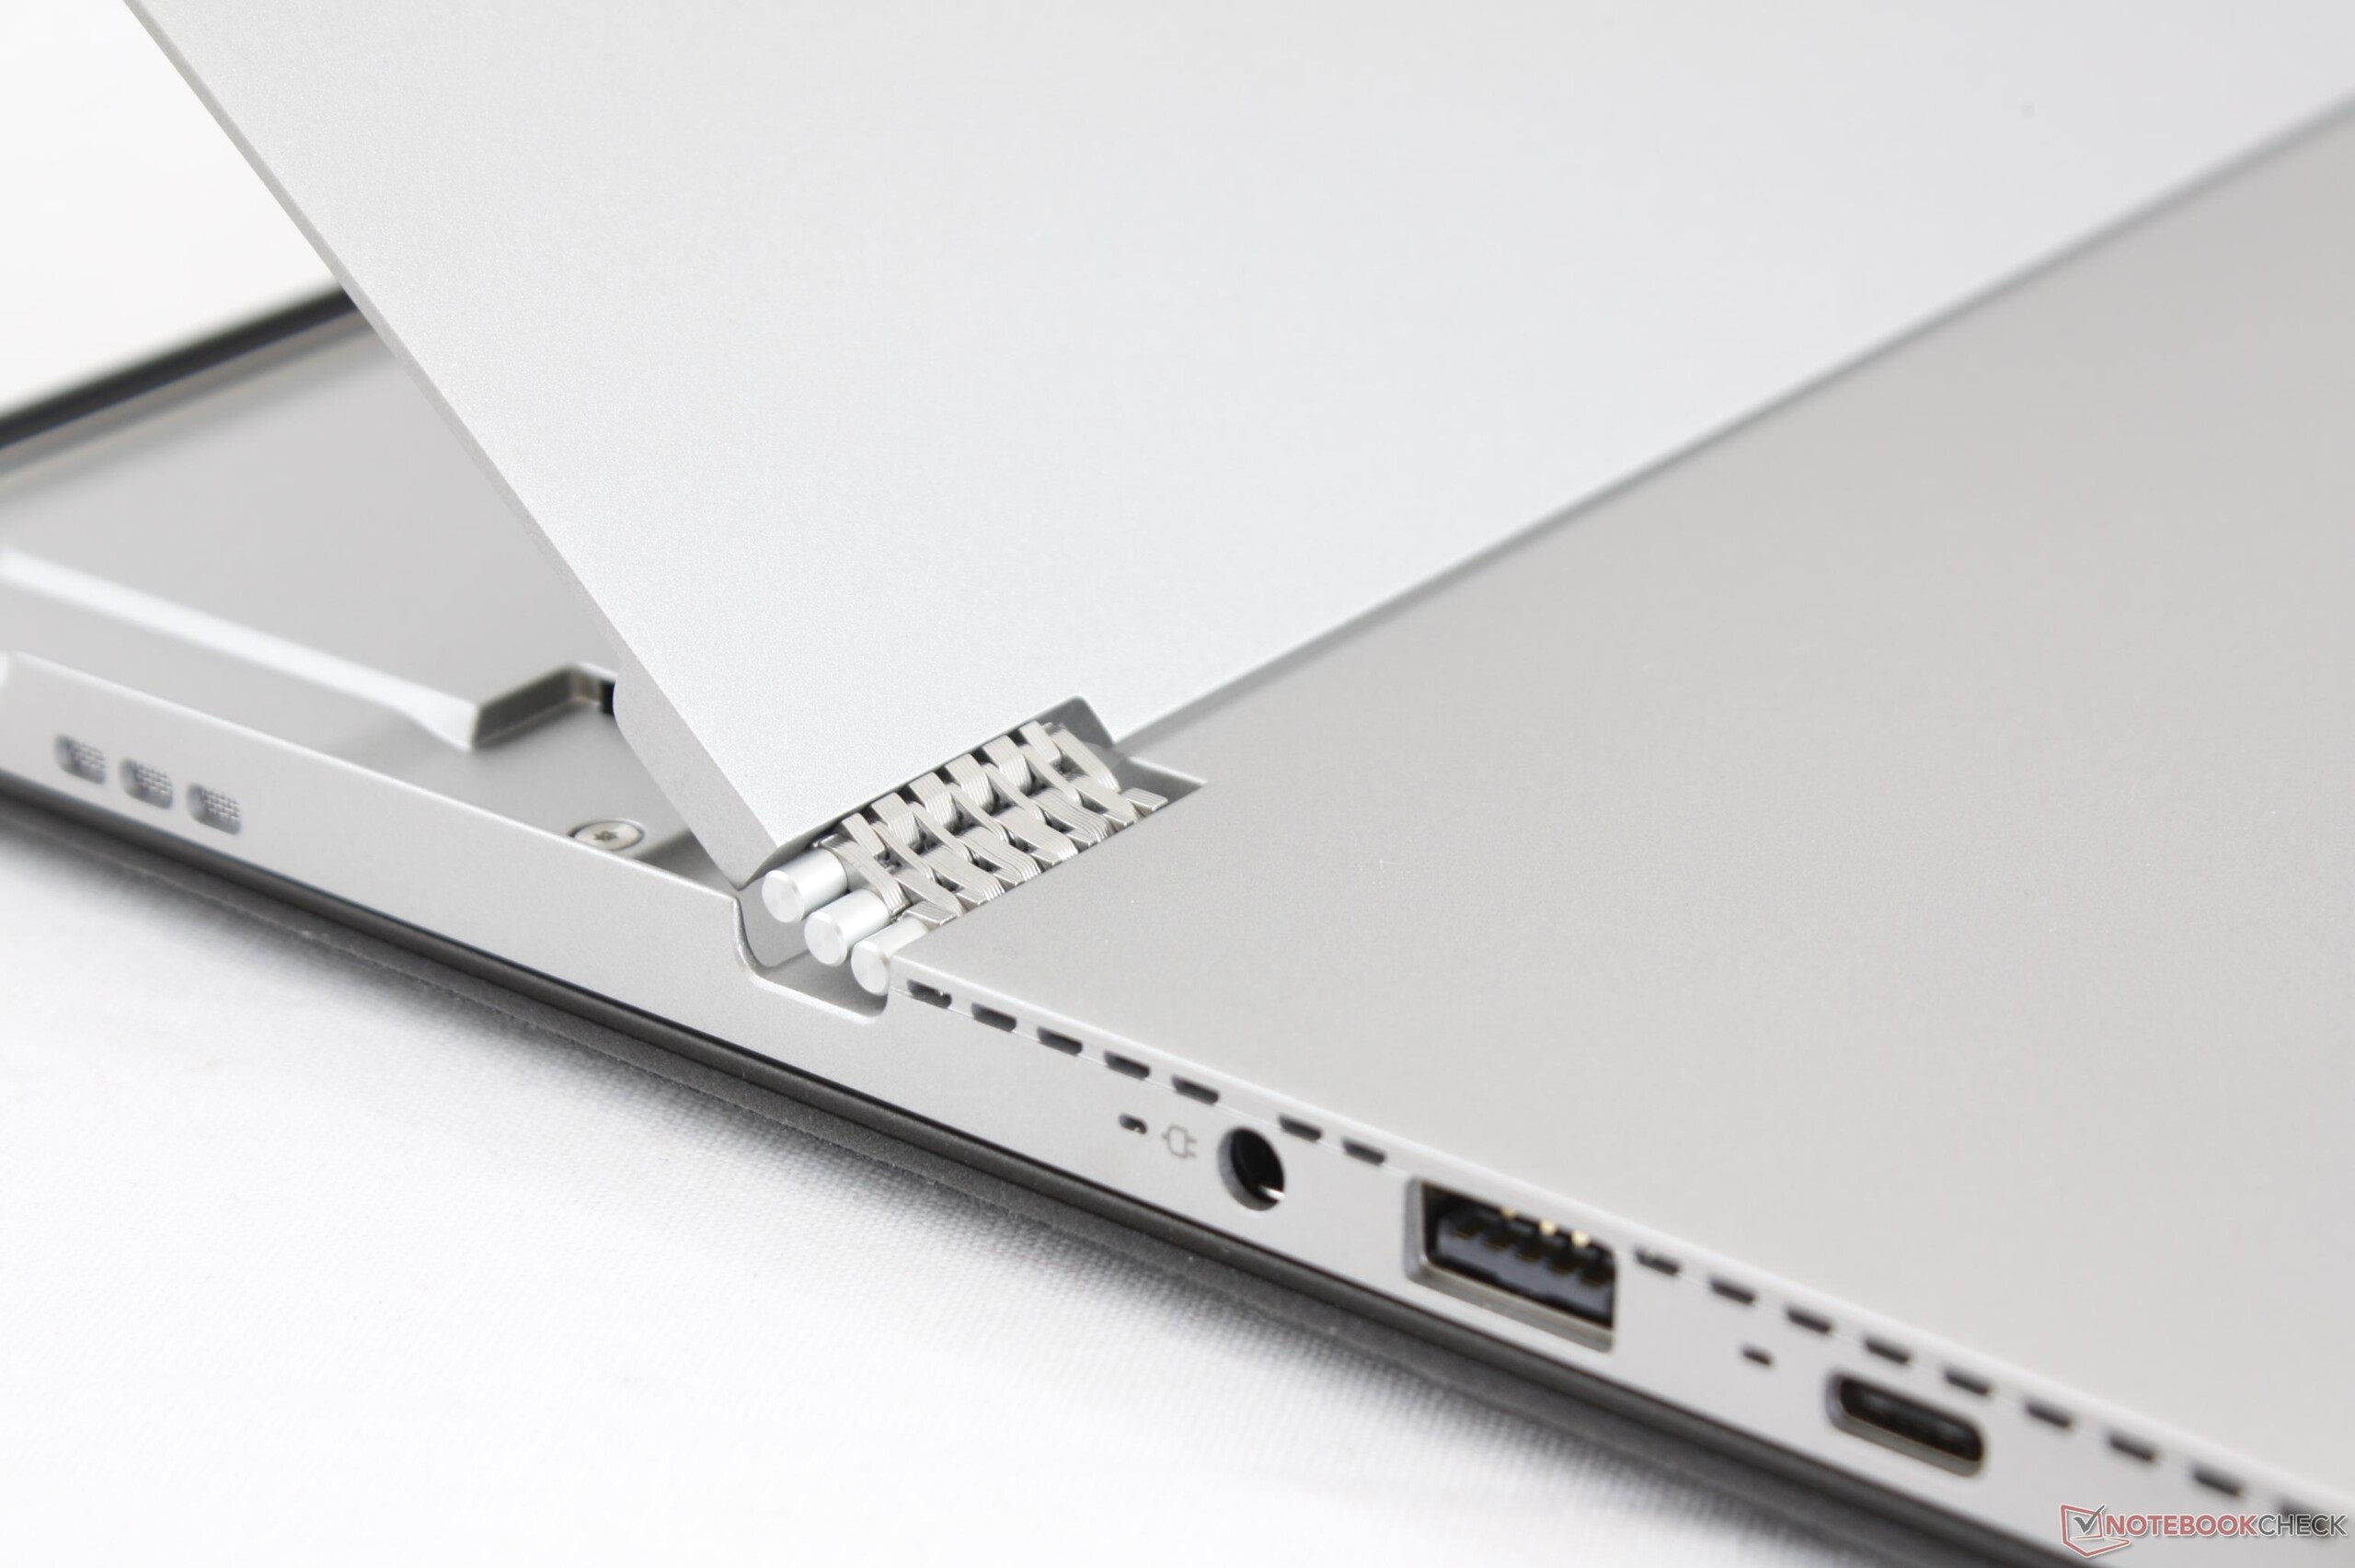
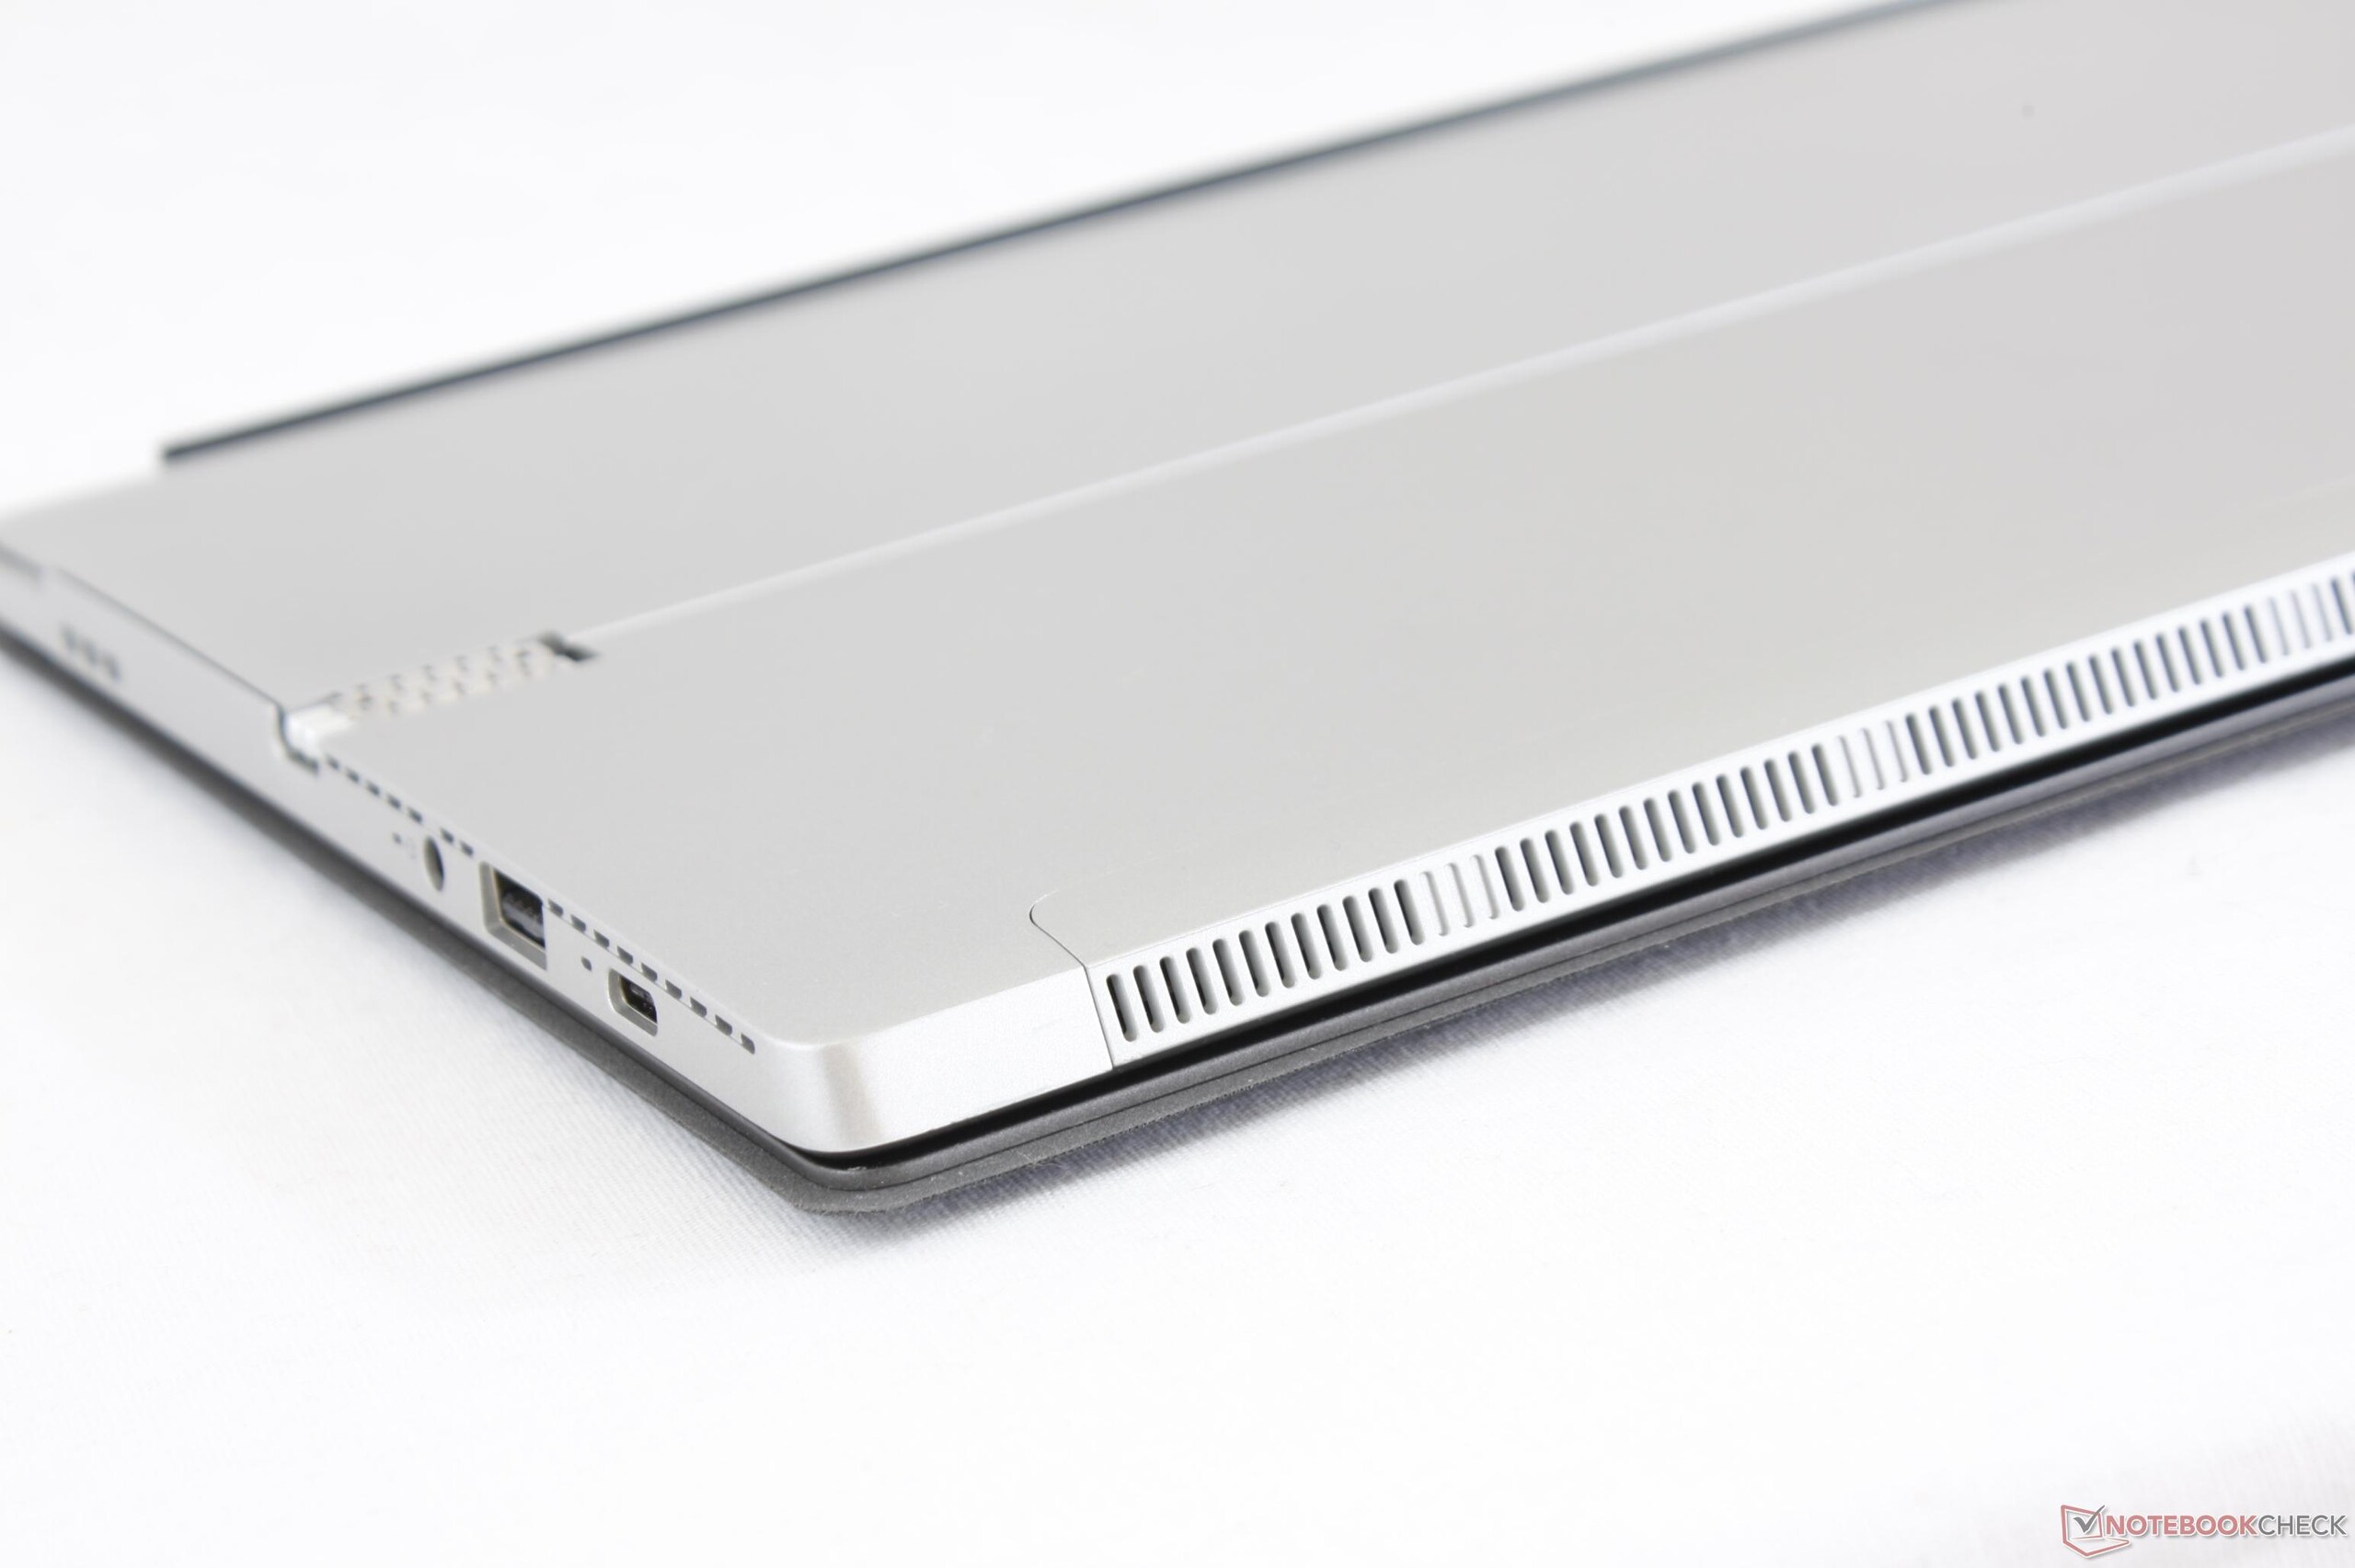
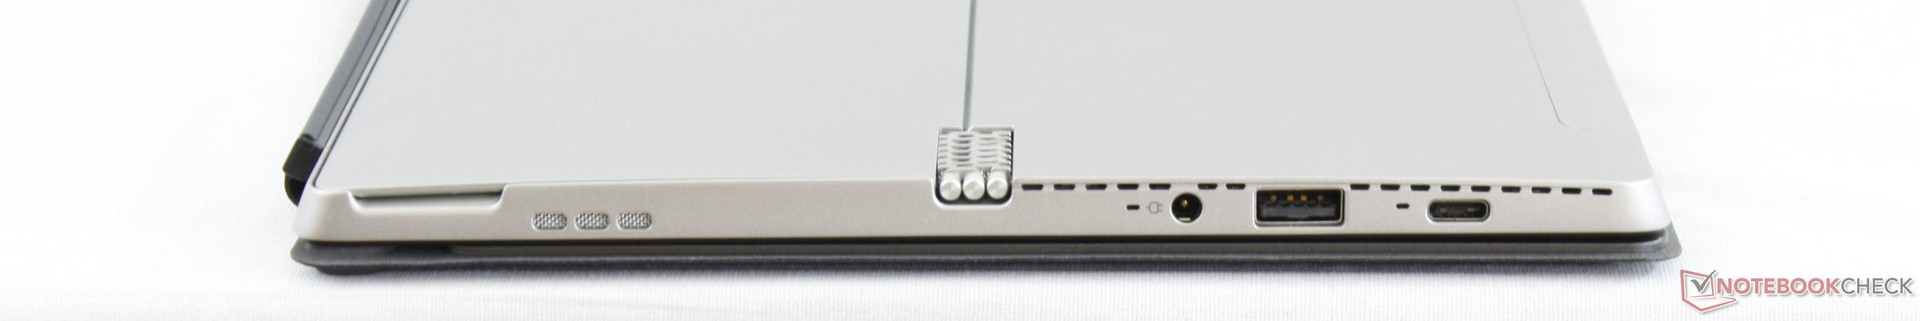
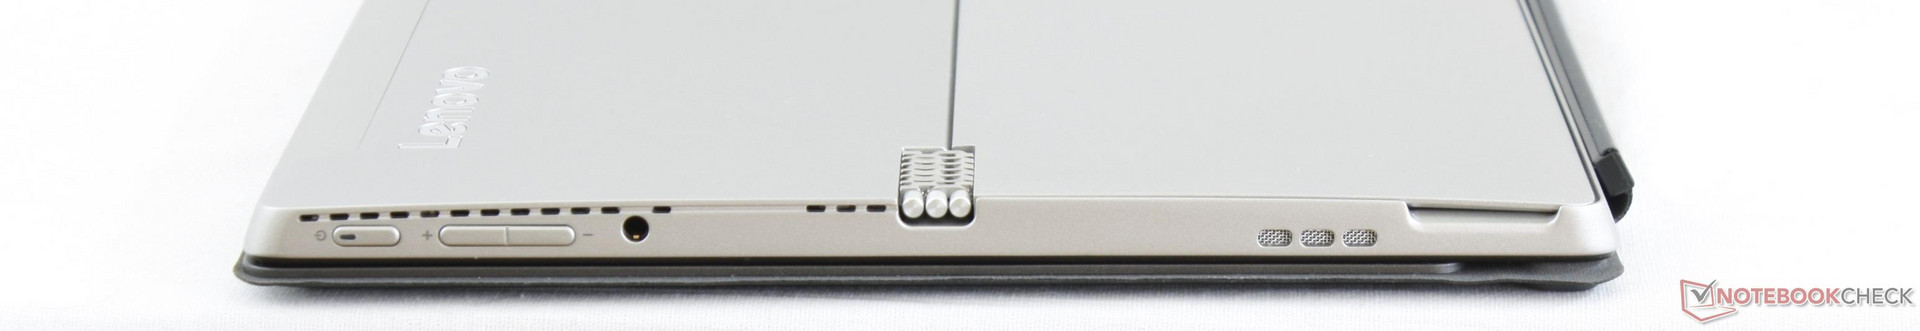
I punti di forza del Miix 520 sono le prestazioni del processore, le prestazioni dell'SSD, la versatiltà delle porte, e il prezzo. Il rapporto prezzo- prestazioni è uno dei migliori sul mercato al momento, in quanto la maggioranza di tablets Windows monta ancora opzioni di Core Y o settima generazione. Coloro che possono sfruttare la potenza aggiuntiva troveranno nel Miix 520 un finto Ultrabook adatto ai viaggi.
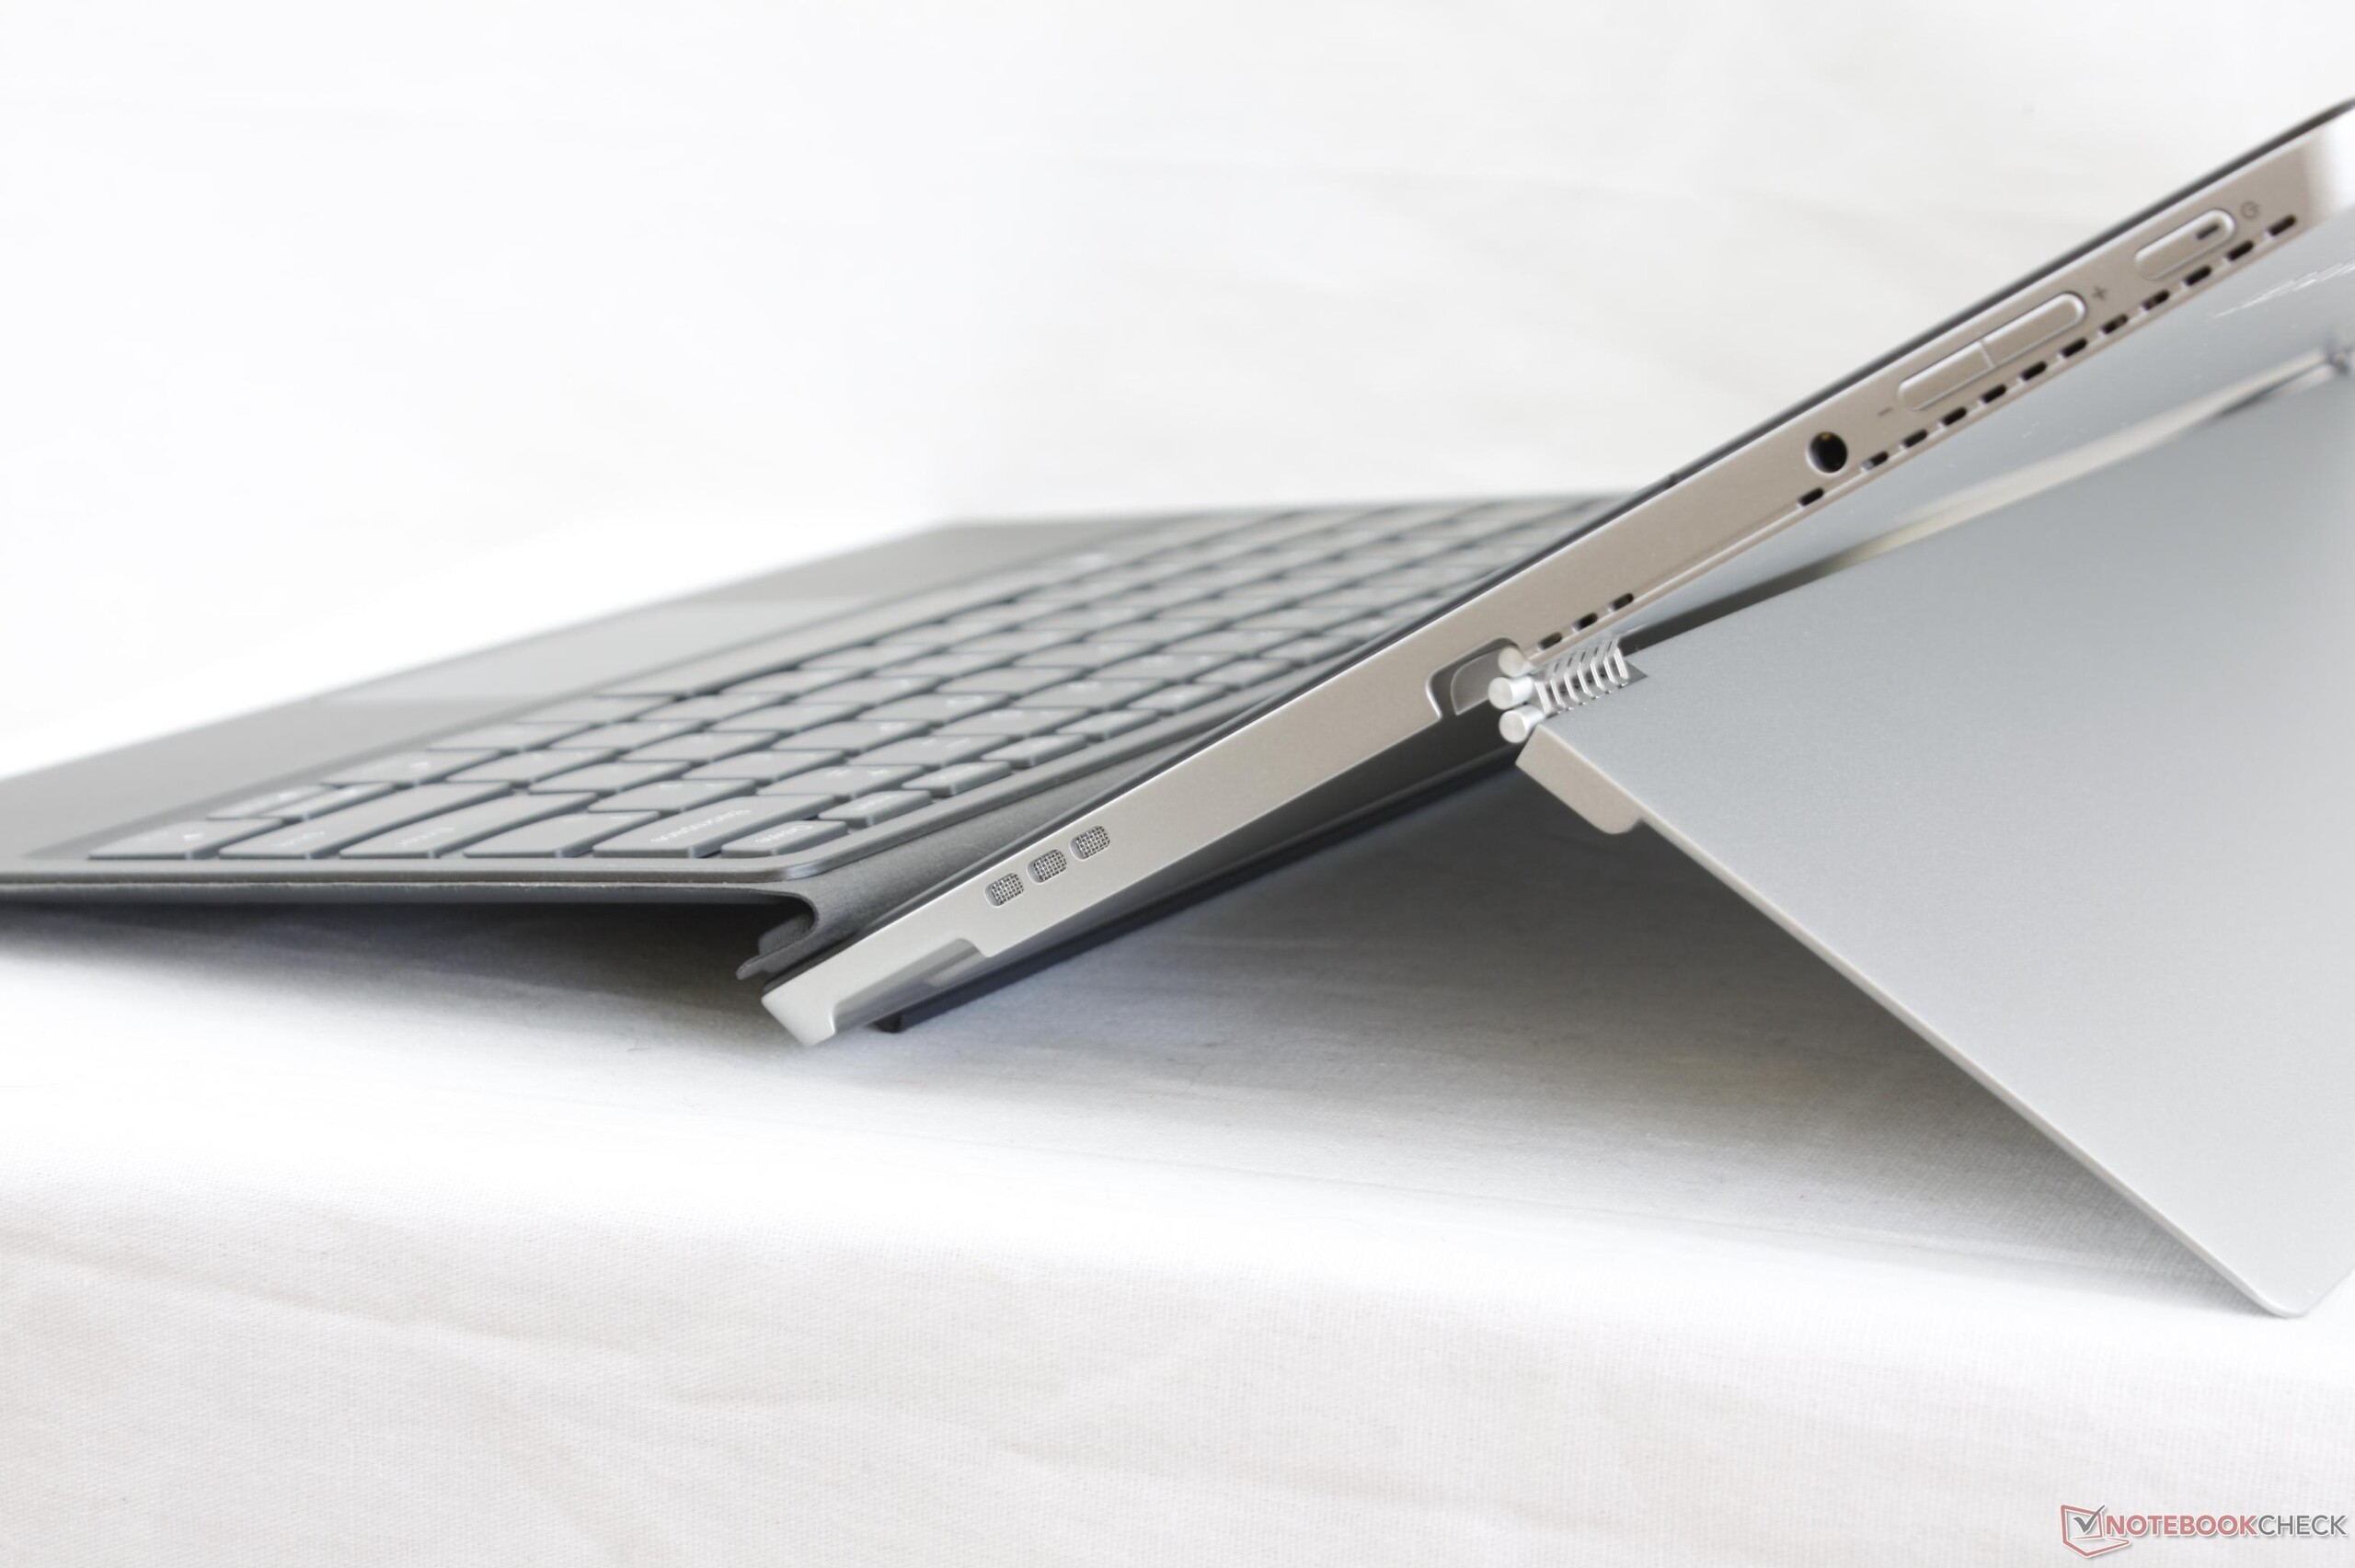
Per tutto il resto questo Lenovo è nella media, ma di certo ci sono margini di miglioramento rispetto alla concorrenza. Il Surface Pro e l'Elite x2 sono più robusti nel design, hanno display con risoluzione e luminosità maggiori, colori più precisi, e una autonomia maggiore. Il tablet HP in particolare ha anche una Thunderbolt 3 che amplia le possibilità di connessione. Una tastiera con base più salda per il Lenovo avrebbe migliorato l'esperienza di digitazione, che è più spugnosa rispetto alle tastiere di altri Ultrabooks.
La principale pecca delle prestazioni del processore è la rumorosità della ventola.La ventola è leggermente più rumorosa rispetto al Surface Pro e si farà sentire spesso durante l'utilizzo quotidiano. Non è rumorosa quanto quella della serie di convertibili HP Spectre, ma tuttavia si fa sentire per essere un tablet di queste dimensioni.
Il Miix 520 è un ottimo acquisto se tenete conto dei punti deboli. La veloce CPU comporta una maggiore rumorosità. Speriamo che con futuri aggiornamenti sia rivisto il display e sia incorporata una Thunderbolt 3 in modo da rendere più competitiva la serie Miix contro Microsoft.
Nota: si tratta di una recensione breve, con alcune sezioni non tradotte, per la versione integrale in inglese guardate qui.
Lenovo Miix 520-12IKB 81CG
- 12/10/2017 v6 (old)
Allen Ngo
Price comparison
