Recensione breve del Portatile Toshiba Tecra X40-D (i7-7600U, FHD)
| SD Card Reader | |
| average JPG Copy Test (av. of 3 runs) | |
| Dell XPS 13 9360 FHD i7 Iris | |
| Toshiba Tecra X40-D | |
| Lenovo ThinkPad T470s-20HF0012US | |
| Lenovo ThinkPad X1 Carbon 2017-20HR0021GE | |
| Toshiba Portege X30-D (PT274U-01N001) | |
| maximum AS SSD Seq Read Test (1GB) | |
| Dell XPS 13 9360 FHD i7 Iris | |
| Lenovo ThinkPad T470s-20HF0012US | |
| Toshiba Portege X30-D (PT274U-01N001) | |
| Lenovo ThinkPad X1 Carbon 2017-20HR0021GE | |
| Toshiba Tecra X40-D | |
| |||||||||||||||||||||||||
Distribuzione della luminosità: 85 %
Al centro con la batteria: 283.9 cd/m²
Contrasto: 1136:1 (Nero: 0.25 cd/m²)
ΔE ColorChecker Calman: 6.4 | ∀{0.5-29.43 Ø4.72}
ΔE Greyscale Calman: 6.3 | ∀{0.09-98 Ø4.97}
60% sRGB (Argyll 1.6.3 3D)
38% AdobeRGB 1998 (Argyll 1.6.3 3D)
41.89% AdobeRGB 1998 (Argyll 3D)
61% sRGB (Argyll 3D)
40.55% Display P3 (Argyll 3D)
Gamma: 2.39
CCT: 6511 K
| Toshiba Tecra X40-D Toshiba TOS508F, IPS, 14", 1920x1080 | Toshiba Portege X30-D (PT274U-01N001) Toshiba TOS508F, IPS, 13.3", 1920x1080 | Lenovo ThinkPad X1 Carbon 2017-20HR0021GE B140HAN03_1, IPS, 14", 1920x1080 | Lenovo ThinkPad T470s-20HF0012US LEN40A9 (R140NWF5 R1), IPS, 14", 1920x1080 | HP Spectre 13-v131ng CMN1374, IPS UWVA, 13.3", 1920x1080 | |
|---|---|---|---|---|---|
| Display | 59% | 48% | -0% | 53% | |
| Display P3 Coverage (%) | 40.55 | 66.4 64% | 61.6 52% | 40.35 0% | 64.6 59% |
| sRGB Coverage (%) | 61 | 93.5 53% | 87.6 44% | 60.3 -1% | 88.8 46% |
| AdobeRGB 1998 Coverage (%) | 41.89 | 66.6 59% | 62.6 49% | 41.72 0% | 64.8 55% |
| Response Times | -4% | -20% | -7% | -22% | |
| Response Time Grey 50% / Grey 80% * (ms) | 38 ? | 36.8 ? 3% | 48 ? -26% | 40.8 ? -7% | 46 ? -21% |
| Response Time Black / White * (ms) | 26.8 ? | 29.6 ? -10% | 30.4 ? -13% | 28.8 ? -7% | 33 ? -23% |
| PWM Frequency (Hz) | 20410 ? | 219.3 ? | |||
| Screen | 34% | 33% | 0% | 22% | |
| Brightness middle (cd/m²) | 283.9 | 332.6 17% | 278 -2% | 271.6 -4% | 404 42% |
| Brightness (cd/m²) | 261 | 323 24% | 271 4% | 264 1% | 382 46% |
| Brightness Distribution (%) | 85 | 86 1% | 91 7% | 88 4% | 91 7% |
| Black Level * (cd/m²) | 0.25 | 0.28 -12% | 0.16 36% | 0.24 4% | 0.35 -40% |
| Contrast (:1) | 1136 | 1188 5% | 1738 53% | 1132 0% | 1154 2% |
| Colorchecker dE 2000 * | 6.4 | 2.6 59% | 4.5 30% | 6.1 5% | 5.37 16% |
| Colorchecker dE 2000 max. * | 18.7 | 6.7 64% | 8.4 55% | 28.6 -53% | 9.46 49% |
| Greyscale dE 2000 * | 6.3 | 2.5 60% | 3.2 49% | 3.4 46% | 6.44 -2% |
| Gamma | 2.39 92% | 2.12 104% | 2.02 109% | 2.12 104% | 2.52 87% |
| CCT | 6511 100% | 6720 97% | 7042 92% | 6077 107% | 6738 96% |
| Color Space (Percent of AdobeRGB 1998) (%) | 38 | 62 63% | 57 50% | 38 0% | 58 53% |
| Color Space (Percent of sRGB) (%) | 60 | 94 57% | 87.5 46% | 60 0% | 89 48% |
| Media totale (Programma / Settaggio) | 30% /
34% | 20% /
29% | -2% /
-1% | 18% /
22% |
* ... Meglio usare valori piccoli
Tempi di risposta del Display
| ↔ Tempi di risposta dal Nero al Bianco | ||
|---|---|---|
| 26.8 ms ... aumenta ↗ e diminuisce ↘ combinato | ↗ 16.4 ms Incremento | 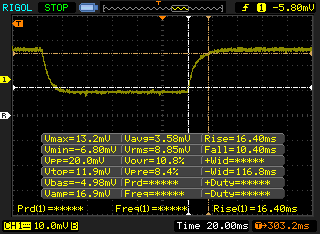 |
| ↘ 10.4 ms Calo | ||
| Lo schermo mostra tempi di risposta relativamente lenti nei nostri tests e potrebbe essere troppo lento per i gamers. In confronto, tutti i dispositivi di test variano da 0.1 (minimo) a 240 (massimo) ms. » 67 % di tutti i dispositivi è migliore. Questo significa che i tempi di risposta rilevati sono peggiori rispetto alla media di tutti i dispositivi testati (19.9 ms). | ||
| ↔ Tempo di risposta dal 50% Grigio all'80% Grigio | ||
| 38 ms ... aumenta ↗ e diminuisce ↘ combinato | ↗ 19.6 ms Incremento | 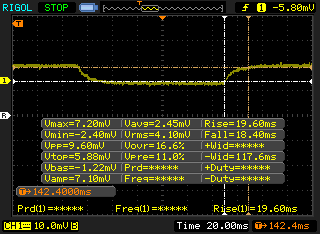 |
| ↘ 18.4 ms Calo | ||
| Lo schermo mostra tempi di risposta lenti nei nostri tests e sarà insoddisfacente per i gamers. In confronto, tutti i dispositivi di test variano da 0.165 (minimo) a 636 (massimo) ms. » 55 % di tutti i dispositivi è migliore. Questo significa che i tempi di risposta rilevati sono peggiori rispetto alla media di tutti i dispositivi testati (31.1 ms). | ||
Sfarfallio dello schermo / PWM (Pulse-Width Modulation)
| flickering dello schermo / PWM rilevato | 20410 Hz | ≤ 99 % settaggio luminosita' | 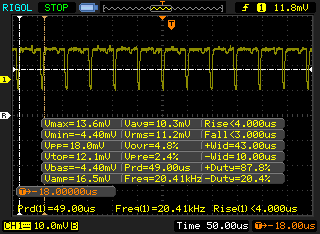 |
Il display sfarfalla a 20410 Hz (Probabilmente a causa dell'uso di PWM) Flickering rilevato ad una luminosita' di 99 % o inferiore. Non dovrebbe verificarsi flickering o PWM sopra questo valore di luminosita'. La frequenza di 20410 Hz è abbastanza alta, quindi la maggioranza degli utenti sensibili al PWM non dovrebbero notare alcun flickering. In confronto: 52 % di tutti i dispositivi testati non utilizza PWM per ridurre la luminosita' del display. Se è rilevato PWM, una media di 7784 (minimo: 5 - massimo: 343500) Hz è stata rilevata. | |||
| Cinebench R15 | |
| CPU Single 64Bit | |
| Dell XPS 13 9360 FHD i7 Iris | |
| Lenovo ThinkPad X270 20HN0012PB | |
| Toshiba Tecra X40-D | |
| Lenovo ThinkPad T470s-20HF0012US | |
| HP Spectre 13-v131ng | |
| Lenovo ThinkPad X1 Carbon 2017-20HR0021GE | |
| Toshiba Portege X30-D (PT274U-01N001) | |
| CPU Multi 64Bit | |
| Lenovo ThinkPad T470s-20HF0012US | |
| Toshiba Tecra X40-D | |
| Toshiba Portege X30-D (PT274U-01N001) | |
| Dell XPS 13 9360 FHD i7 Iris | |
| Lenovo ThinkPad X270 20HN0012PB | |
| Lenovo ThinkPad X1 Carbon 2017-20HR0021GE | |
| HP Spectre 13-v131ng | |
| Cinebench R10 | |
| Rendering Multiple CPUs 32Bit | |
| Toshiba Tecra X40-D | |
| Toshiba Portege X30-D (PT274U-01N001) | |
| HP Spectre 13-v131ng | |
| Lenovo ThinkPad X1 Carbon 2017-20HR0021GE | |
| Rendering Single 32Bit | |
| Toshiba Portege X30-D (PT274U-01N001) | |
| HP Spectre 13-v131ng | |
| Lenovo ThinkPad X1 Carbon 2017-20HR0021GE | |
| wPrime 2.10 - 1024m | |
| Lenovo ThinkPad X270 20HN0012PB | |
| Toshiba Portege X30-D (PT274U-01N001) | |
| Toshiba Tecra X40-D | |
| Lenovo ThinkPad T470s-20HF0012US | |
* ... Meglio usare valori piccoli
| PCMark 7 Score | 5979 punti | |
| PCMark 8 Home Score Accelerated v2 | 3738 punti | |
| PCMark 8 Creative Score Accelerated v2 | 4784 punti | |
| PCMark 8 Work Score Accelerated v2 | 4963 punti | |
| PCMark 10 Score | 2464 punti | |
Aiuto | ||
| Toshiba Tecra X40-D Samsung PM961 MZVLW256HEHP | Toshiba Portege X30-D (PT274U-01N001) Samsung PM961 MZVLW256HEHP | Lenovo ThinkPad X1 Carbon 2017-20HR0021GE Toshiba THNSF5256GPUK | Lenovo ThinkPad X270 20HN0012PB Toshiba THNSF5256GPUK | Lenovo ThinkPad T470s-20HF0012US Samsung PM961 MZVLW256HEHP | HP Spectre 13-v131ng Samsung PM961 NVMe MZVLW512HMJP | |
|---|---|---|---|---|---|---|
| AS SSD | -678% | -46% | -43% | 9% | 14% | |
| Copy Game MB/s (MB/s) | 229 | 309.9 | 397.9 | |||
| Copy Program MB/s (MB/s) | 172.4 | 291 | 426 | |||
| Copy ISO MB/s (MB/s) | 623 | 797 | 720 | |||
| Score Total (Points) | 3576 | 2687 -25% | 1398 -61% | 1638 -54% | 3875 8% | 3617 1% |
| Score Write (Points) | 675 | 162 -76% | 337 -50% | 442 -35% | 803 19% | 1115 65% |
| Score Read (Points) | 1963 | 1723 -12% | 726 -63% | 802 -59% | 2083 6% | 1654 -16% |
| Access Time Write * (ms) | 0.028 | 2.01 -7079% | 0.034 -21% | 0.033 -18% | 0.025 11% | 0.026 7% |
| Access Time Read * (ms) | 0.061 | 0.05 18% | 0.102 -67% | 0.113 -85% | 0.06 2% | 0.042 31% |
| 4K-64 Write (MB/s) | 438.4 | 125.8 -71% | 149.6 -66% | 264 -40% | 538 23% | 862 97% |
| 4K-64 Read (MB/s) | 1663 | 1483 -11% | 526 -68% | 633 -62% | 1765 6% | 1465 -12% |
| 4K Write (MB/s) | 124.8 | 1.2 -99% | 109.4 -12% | 100 -20% | 147.9 19% | 134.4 8% |
| 4K Read (MB/s) | 51.6 | 42.8 -17% | 34.34 -33% | 38.8 -25% | 48.84 -5% | 56.4 9% |
| Seq Write (MB/s) | 1117 | 352.7 -68% | 775 -31% | 777 -30% | 1170 5% | 1190 7% |
| Seq Read (MB/s) | 2479 | 1972 -20% | 1649 -33% | 1294 -48% | 2691 9% | 1325 -47% |
* ... Meglio usare valori piccoli

| 3DMark 11 | |
| 1280x720 Performance GPU | |
| Acer Aspire 5 A515-51G-51RL | |
| Asus Zenbook UX3430UQ-GV012T | |
| Dell XPS 13 9360 FHD i7 Iris | |
| Toshiba Tecra X40-D | |
| Lenovo ThinkPad T470s-20HF0012US | |
| HP Spectre 13-v131ng | |
| Lenovo ThinkPad X1 Carbon 2017-20HR0021GE | |
| Lenovo ThinkPad X270 20HN0012PB | |
| Toshiba Portege X30-D (PT274U-01N001) | |
| 1280x720 Performance Combined | |
| Acer Aspire 5 A515-51G-51RL | |
| Dell XPS 13 9360 FHD i7 Iris | |
| Asus Zenbook UX3430UQ-GV012T | |
| Lenovo ThinkPad T470s-20HF0012US | |
| Toshiba Tecra X40-D | |
| Lenovo ThinkPad X1 Carbon 2017-20HR0021GE | |
| HP Spectre 13-v131ng | |
| Toshiba Portege X30-D (PT274U-01N001) | |
| Lenovo ThinkPad X270 20HN0012PB | |
| 3DMark | |
| 1280x720 Cloud Gate Standard Graphics | |
| Acer Aspire 5 A515-51G-51RL | |
| Dell XPS 13 9360 FHD i7 Iris | |
| Lenovo ThinkPad T470s-20HF0012US | |
| Toshiba Tecra X40-D | |
| Asus Zenbook UX3430UQ-GV012T | |
| HP Spectre 13-v131ng | |
| Lenovo ThinkPad X1 Carbon 2017-20HR0021GE | |
| Lenovo ThinkPad X270 20HN0012PB | |
| Toshiba Portege X30-D (PT274U-01N001) | |
| 1920x1080 Fire Strike Graphics | |
| Acer Aspire 5 A515-51G-51RL | |
| Asus Zenbook UX3430UQ-GV012T | |
| Dell XPS 13 9360 FHD i7 Iris | |
| Toshiba Tecra X40-D | |
| Lenovo ThinkPad T470s-20HF0012US | |
| Lenovo ThinkPad X1 Carbon 2017-20HR0021GE | |
| HP Spectre 13-v131ng | |
| Lenovo ThinkPad X270 20HN0012PB | |
| Toshiba Portege X30-D (PT274U-01N001) | |
| 1920x1080 Ice Storm Extreme Graphics | |
| Lenovo ThinkPad X1 Carbon 2017-20HR0021GE | |
| HP Spectre 13-v131ng | |
| Acer Aspire 5 A515-51G-51RL | |
| Lenovo ThinkPad X270 20HN0012PB | |
| Toshiba Portege X30-D (PT274U-01N001) | |
| 3DMark 11 Performance | 1789 punti | |
| 3DMark Cloud Gate Standard Score | 6655 punti | |
| 3DMark Fire Strike Score | 980 punti | |
Aiuto | ||
| BioShock Infinite - 1920x1080 Ultra Preset, DX11 (DDOF) (ordina per valore) | |
| Toshiba Tecra X40-D | |
| Lenovo ThinkPad X1 Carbon 2017-20HR0021GE | |
| Lenovo ThinkPad X270 20HN0012PB | |
| Lenovo ThinkPad T470s-20HF0012US | |
| Dell XPS 13 9360 FHD i7 Iris | |
| Acer Aspire 5 A515-51G-51RL | |
| Asus Zenbook UX3410UQ-GV077T | |
| HP Spectre 13-v131ng | |
| Ashes of the Singularity - 1920x1080 high (ordina per valore) | |
| Toshiba Tecra X40-D | |
| Acer Aspire 5 A515-51G-51RL | |
| Rise of the Tomb Raider - 1920x1080 Very High Preset AA:FX AF:16x (ordina per valore) | |
| Toshiba Tecra X40-D | |
| Acer Aspire 5 A515-51G-51RL | |
| basso | medio | alto | ultra | |
|---|---|---|---|---|
| BioShock Infinite (2013) | 27 | 17 | ||
| Rise of the Tomb Raider (2016) | 5 | 2 | ||
| Ashes of the Singularity (2016) | 7 | 6 |
| CPU Clock (GHz) | GPU Clock (MHz) | Average CPU Temperature (°C) | |
| Prime95 Stress | 3.0 | - | 75 |
| FurMark Stress | 1.5 | 900 | 69 |
| Prime95 + FurMark Stress | 2.2 | 650 | 65 |
Rumorosità
| Idle |
| 28 / 28 / 28.2 dB(A) |
| Sotto carico |
| 33.2 / 39.9 dB(A) |
 | ||
30 dB silenzioso 40 dB(A) udibile 50 dB(A) rumoroso |
||
min: | ||
| Toshiba Tecra X40-D HD Graphics 620, i7-7600U, Samsung PM961 MZVLW256HEHP | Toshiba Portege X30-D (PT274U-01N001) HD Graphics 620, i7-7600U, Samsung PM961 MZVLW256HEHP | Lenovo ThinkPad X1 Carbon 2017-20HR0021GE HD Graphics 620, i5-7200U, Toshiba THNSF5256GPUK | Lenovo ThinkPad X270 20HN0012PB HD Graphics 620, i7-7500U, Toshiba THNSF5256GPUK | Lenovo ThinkPad T470s-20HF0012US HD Graphics 620, i5-7300U, Samsung PM961 MZVLW256HEHP | Dell XPS 13 9360 FHD i7 Iris Iris Plus Graphics 640, i7-7560U, Toshiba XG4 NVMe (THNSN5512GPUK) | HP Spectre 13-v131ng HD Graphics 620, i7-7500U, Samsung PM961 NVMe MZVLW512HMJP | |
|---|---|---|---|---|---|---|---|
| Noise | 0% | -4% | -8% | -1% | -3% | -9% | |
| off /ambiente * (dB) | 28 | 28.4 -1% | 29.6 -6% | 27.8 1% | 29.9 -7% | 30.4 -9% | |
| Idle Minimum * (dB) | 28 | 28.4 -1% | 29.6 -6% | 30 -7% | 27.8 1% | 29.9 -7% | 30.4 -9% |
| Idle Average * (dB) | 28 | 28.4 -1% | 29.6 -6% | 30 -7% | 27.8 1% | 29.9 -7% | 30.4 -9% |
| Idle Maximum * (dB) | 28.2 | 28.4 -1% | 32.2 -14% | 33.2 -18% | 27.8 1% | 30.3 -7% | 30.4 -8% |
| Load Average * (dB) | 33.2 | 33.2 -0% | 34.2 -3% | 37.2 -12% | 34.8 -5% | 33.9 -2% | 40 -20% |
| Load Maximum * (dB) | 39.9 | 37.9 5% | 36.1 10% | 37.9 5% | 42 -5% | 34.9 13% | 40 -0% |
| Witcher 3 ultra * (dB) | 42 |
* ... Meglio usare valori piccoli
Toshiba Tecra X40-D analisi audio
(±) | potenza degli altiparlanti media ma buona (77.3 dB)
Bassi 100 - 315 Hz
(-) | quasi nessun basso - in media 15.2% inferiori alla media
(±) | la linearità dei bassi è media (7.2% delta rispetto alla precedente frequenza)
Medi 400 - 2000 Hz
(+) | medi bilanciati - solo only 3.6% rispetto alla media
(+) | medi lineari (5.7% delta rispetto alla precedente frequenza)
Alti 2 - 16 kHz
(±) | alti elevati - circa 5.6% superiori alla media
(+) | alti lineari (5.2% delta rispetto alla precedente frequenza)
Nel complesso 100 - 16.000 Hz
(±) | la linearità complessiva del suono è media (22% di differenza rispetto alla media
Rispetto alla stessa classe
» 57% di tutti i dispositivi testati in questa classe è stato migliore, 8% simile, 35% peggiore
» Il migliore ha avuto un delta di 7%, medio di 21%, peggiore di 53%
Rispetto a tutti i dispositivi testati
» 63% di tutti i dispositivi testati in questa classe è stato migliore, 6% similare, 30% peggiore
» Il migliore ha avuto un delta di 4%, medio di 24%, peggiore di 134%
Lenovo ThinkPad T470s-20HF0012US analisi audio
(±) | potenza degli altiparlanti media ma buona (72 dB)
Bassi 100 - 315 Hz
(-) | quasi nessun basso - in media 15.3% inferiori alla media
(±) | la linearità dei bassi è media (14.1% delta rispetto alla precedente frequenza)
Medi 400 - 2000 Hz
(+) | medi bilanciati - solo only 3.2% rispetto alla media
(±) | linearità dei medi adeguata (11% delta rispetto alla precedente frequenza)
Alti 2 - 16 kHz
(+) | Alti bilanciati - appena 4.4% dalla media
(±) | la linearità degli alti è media (12.5% delta rispetto alla precedente frequenza)
Nel complesso 100 - 16.000 Hz
(±) | la linearità complessiva del suono è media (24.8% di differenza rispetto alla media
Rispetto alla stessa classe
» 73% di tutti i dispositivi testati in questa classe è stato migliore, 7% simile, 20% peggiore
» Il migliore ha avuto un delta di 7%, medio di 21%, peggiore di 53%
Rispetto a tutti i dispositivi testati
» 76% di tutti i dispositivi testati in questa classe è stato migliore, 5% similare, 19% peggiore
» Il migliore ha avuto un delta di 4%, medio di 24%, peggiore di 134%
| Toshiba Tecra X40-D i7-7600U, HD Graphics 620, Samsung PM961 MZVLW256HEHP, IPS, 1920x1080, 14" | Toshiba Portege X30-D (PT274U-01N001) i7-7600U, HD Graphics 620, Samsung PM961 MZVLW256HEHP, IPS, 1920x1080, 13.3" | Lenovo ThinkPad X1 Carbon 2017-20HR0021GE i5-7200U, HD Graphics 620, Toshiba THNSF5256GPUK, IPS, 1920x1080, 14" | Lenovo ThinkPad X270 20HN0012PB i7-7500U, HD Graphics 620, Toshiba THNSF5256GPUK, , 1920x1080, 12.5" | Lenovo ThinkPad T470s-20HF0012US i5-7300U, HD Graphics 620, Samsung PM961 MZVLW256HEHP, IPS, 1920x1080, 14" | HP Spectre 13-v131ng i7-7500U, HD Graphics 620, Samsung PM961 NVMe MZVLW512HMJP, IPS UWVA, 1920x1080, 13.3" | |
|---|---|---|---|---|---|---|
| Power Consumption | -1% | -16% | -6% | -19% | -9% | |
| Idle Minimum * (Watt) | 5.2 | 4.6 12% | 3.8 27% | 3.8 27% | 4.8 8% | 3.6 31% |
| Idle Average * (Watt) | 6.9 | 7.6 -10% | 7.1 -3% | 7.3 -6% | 6.6 4% | 6.4 7% |
| Idle Maximum * (Watt) | 7 | 8.2 -17% | 8.3 -19% | 10 -43% | 7 -0% | 9.2 -31% |
| Load Average * (Watt) | 24.6 | 23.8 3% | 34.2 -39% | 28.1 -14% | 39.2 -59% | 34 -38% |
| Load Maximum * (Watt) | 30.1 | 28 7% | 43.3 -44% | 29 4% | 44.8 -49% | 34.4 -14% |
* ... Meglio usare valori piccoli
| Toshiba Tecra X40-D i7-7600U, HD Graphics 620, 48 Wh | Toshiba Portege X30-D (PT274U-01N001) i7-7600U, HD Graphics 620, 48 Wh | Lenovo ThinkPad X1 Carbon 2017-20HR0021GE i5-7200U, HD Graphics 620, 57 Wh | Lenovo ThinkPad T470s-20HF0012US i5-7300U, HD Graphics 620, 51 Wh | HP Spectre 13-v131ng i7-7500U, HD Graphics 620, 38 Wh | |
|---|---|---|---|---|---|
| Autonomia della batteria | 6% | 14% | 31% | -15% | |
| Reader / Idle (h) | 14.6 | 15 3% | 13.7 -6% | 17.7 21% | 12 -18% |
| WiFi v1.3 (h) | 6 | 7.2 20% | 9.1 52% | 8.1 35% | 6.6 10% |
| Load (h) | 2.1 | 2 -5% | 2 -5% | 2.9 38% | 1.3 -38% |
Pro
Contro
Giudizio Complessivo
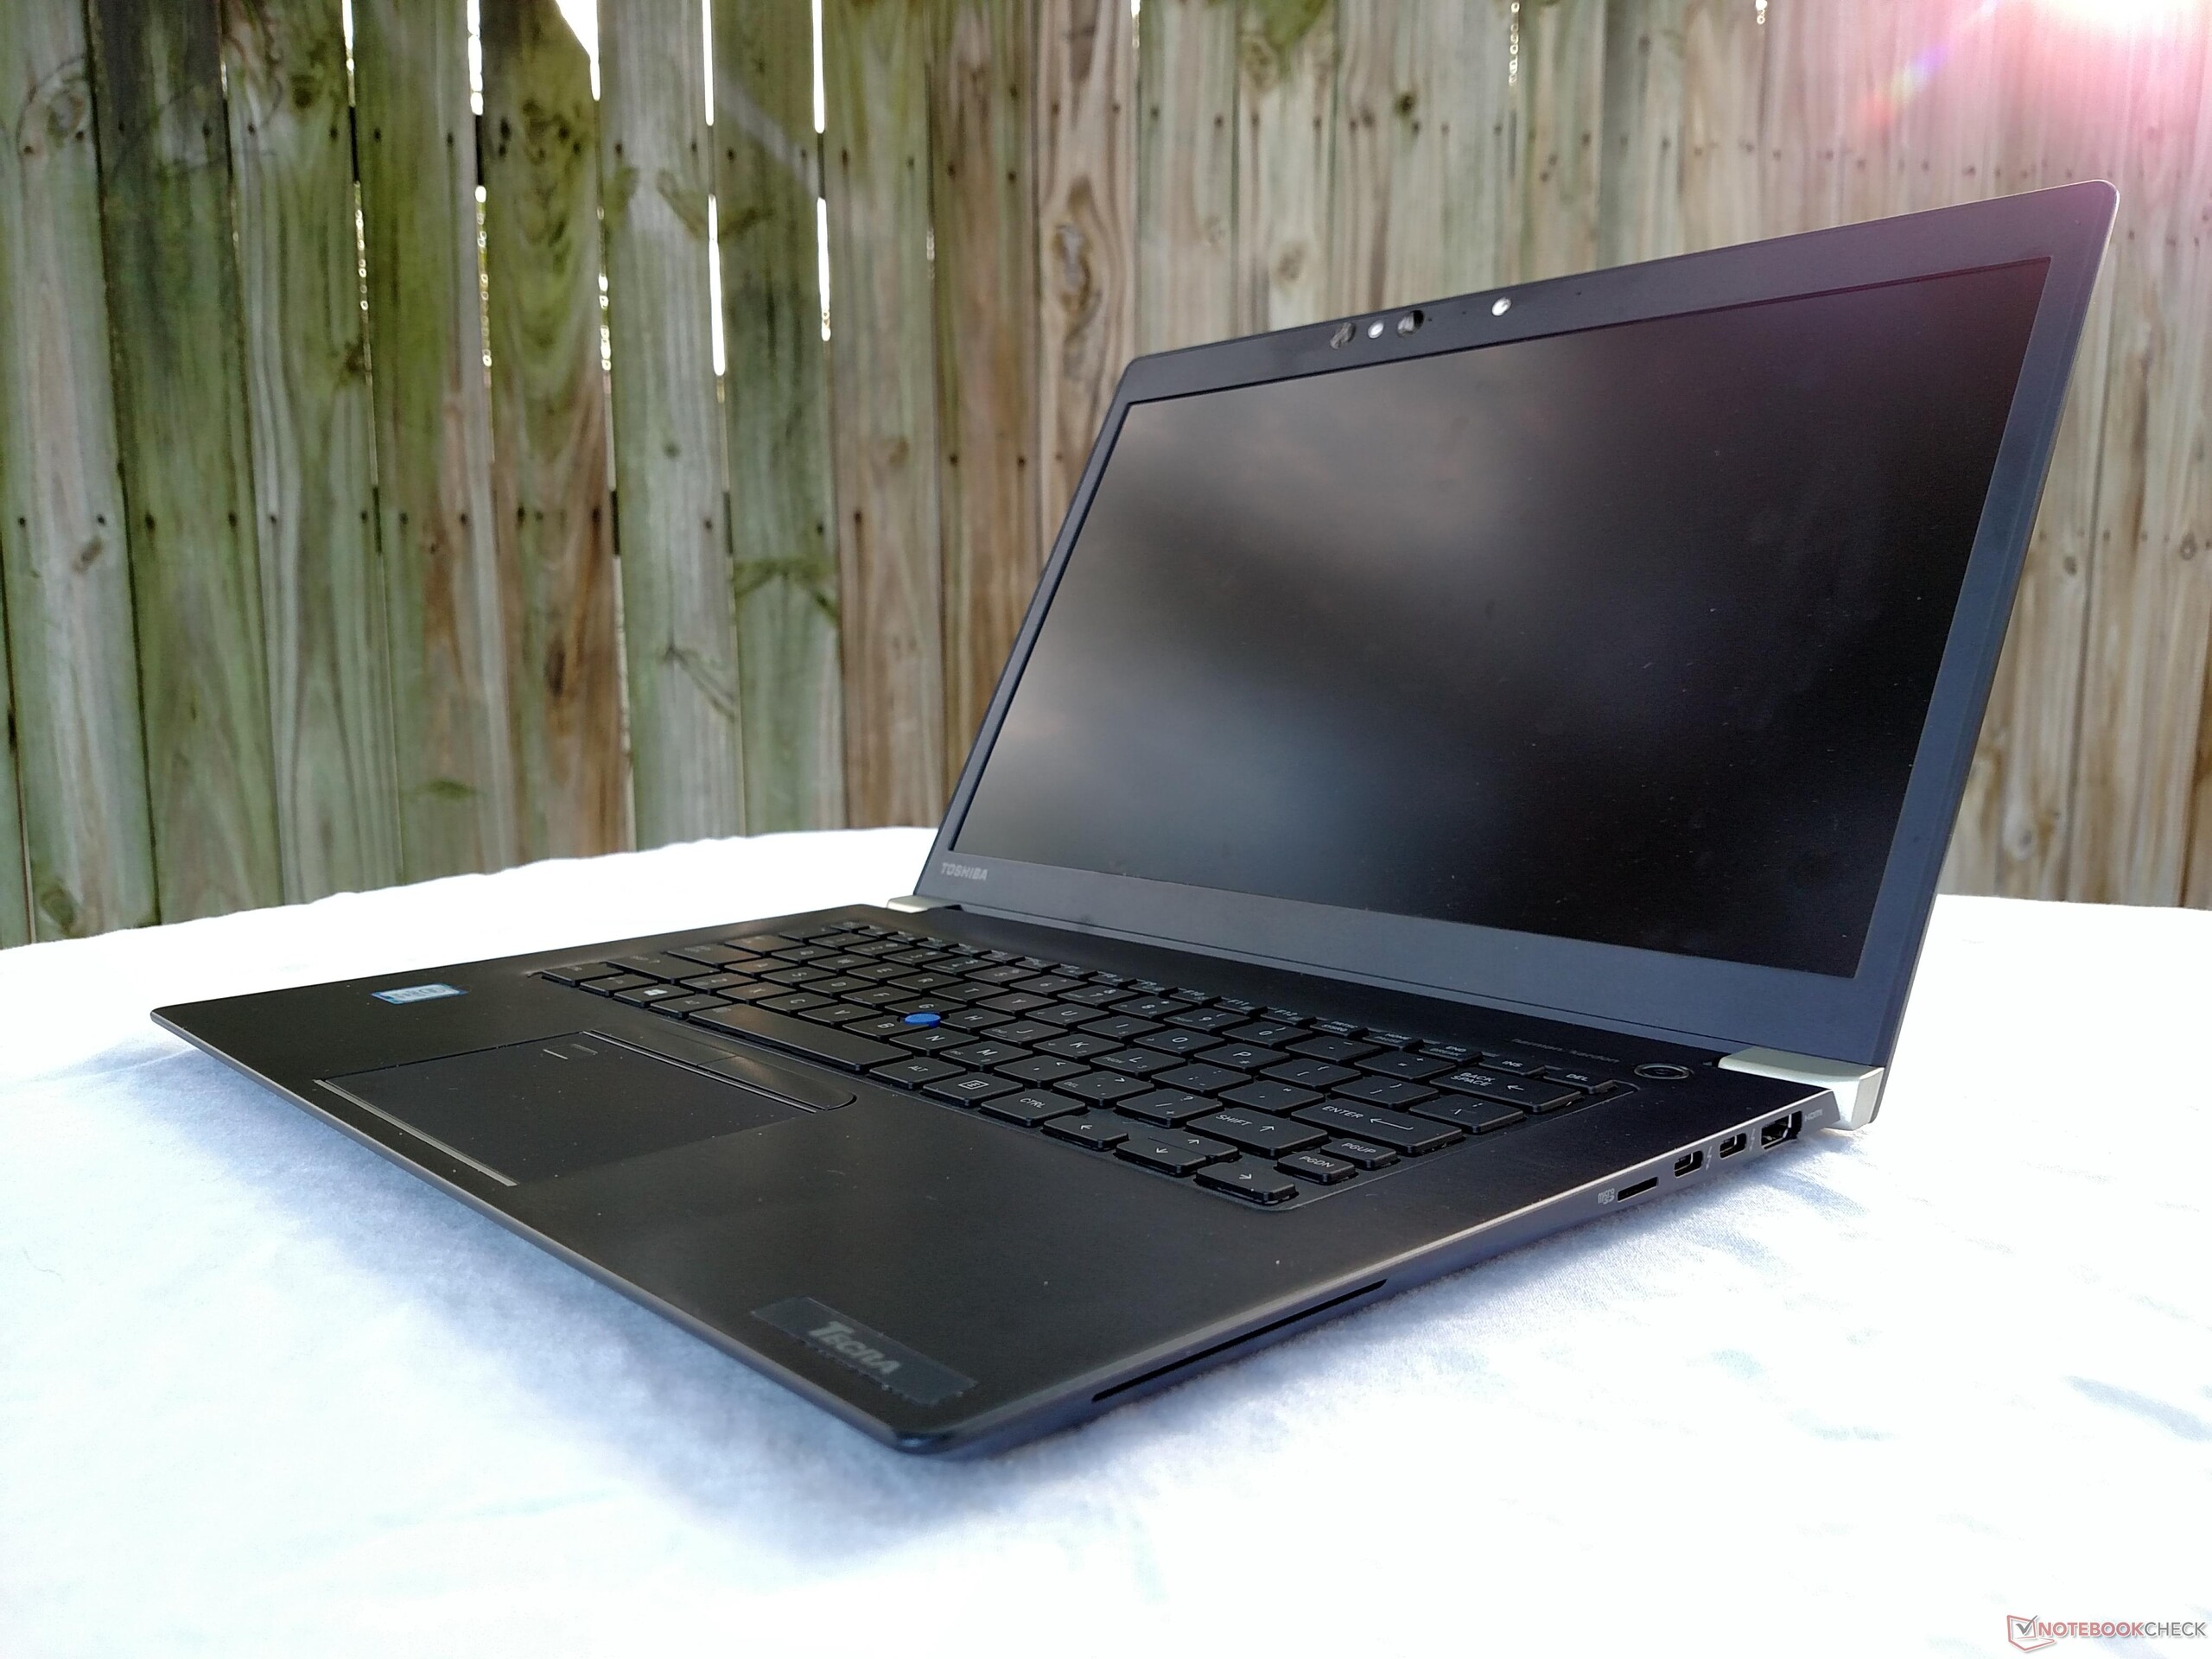
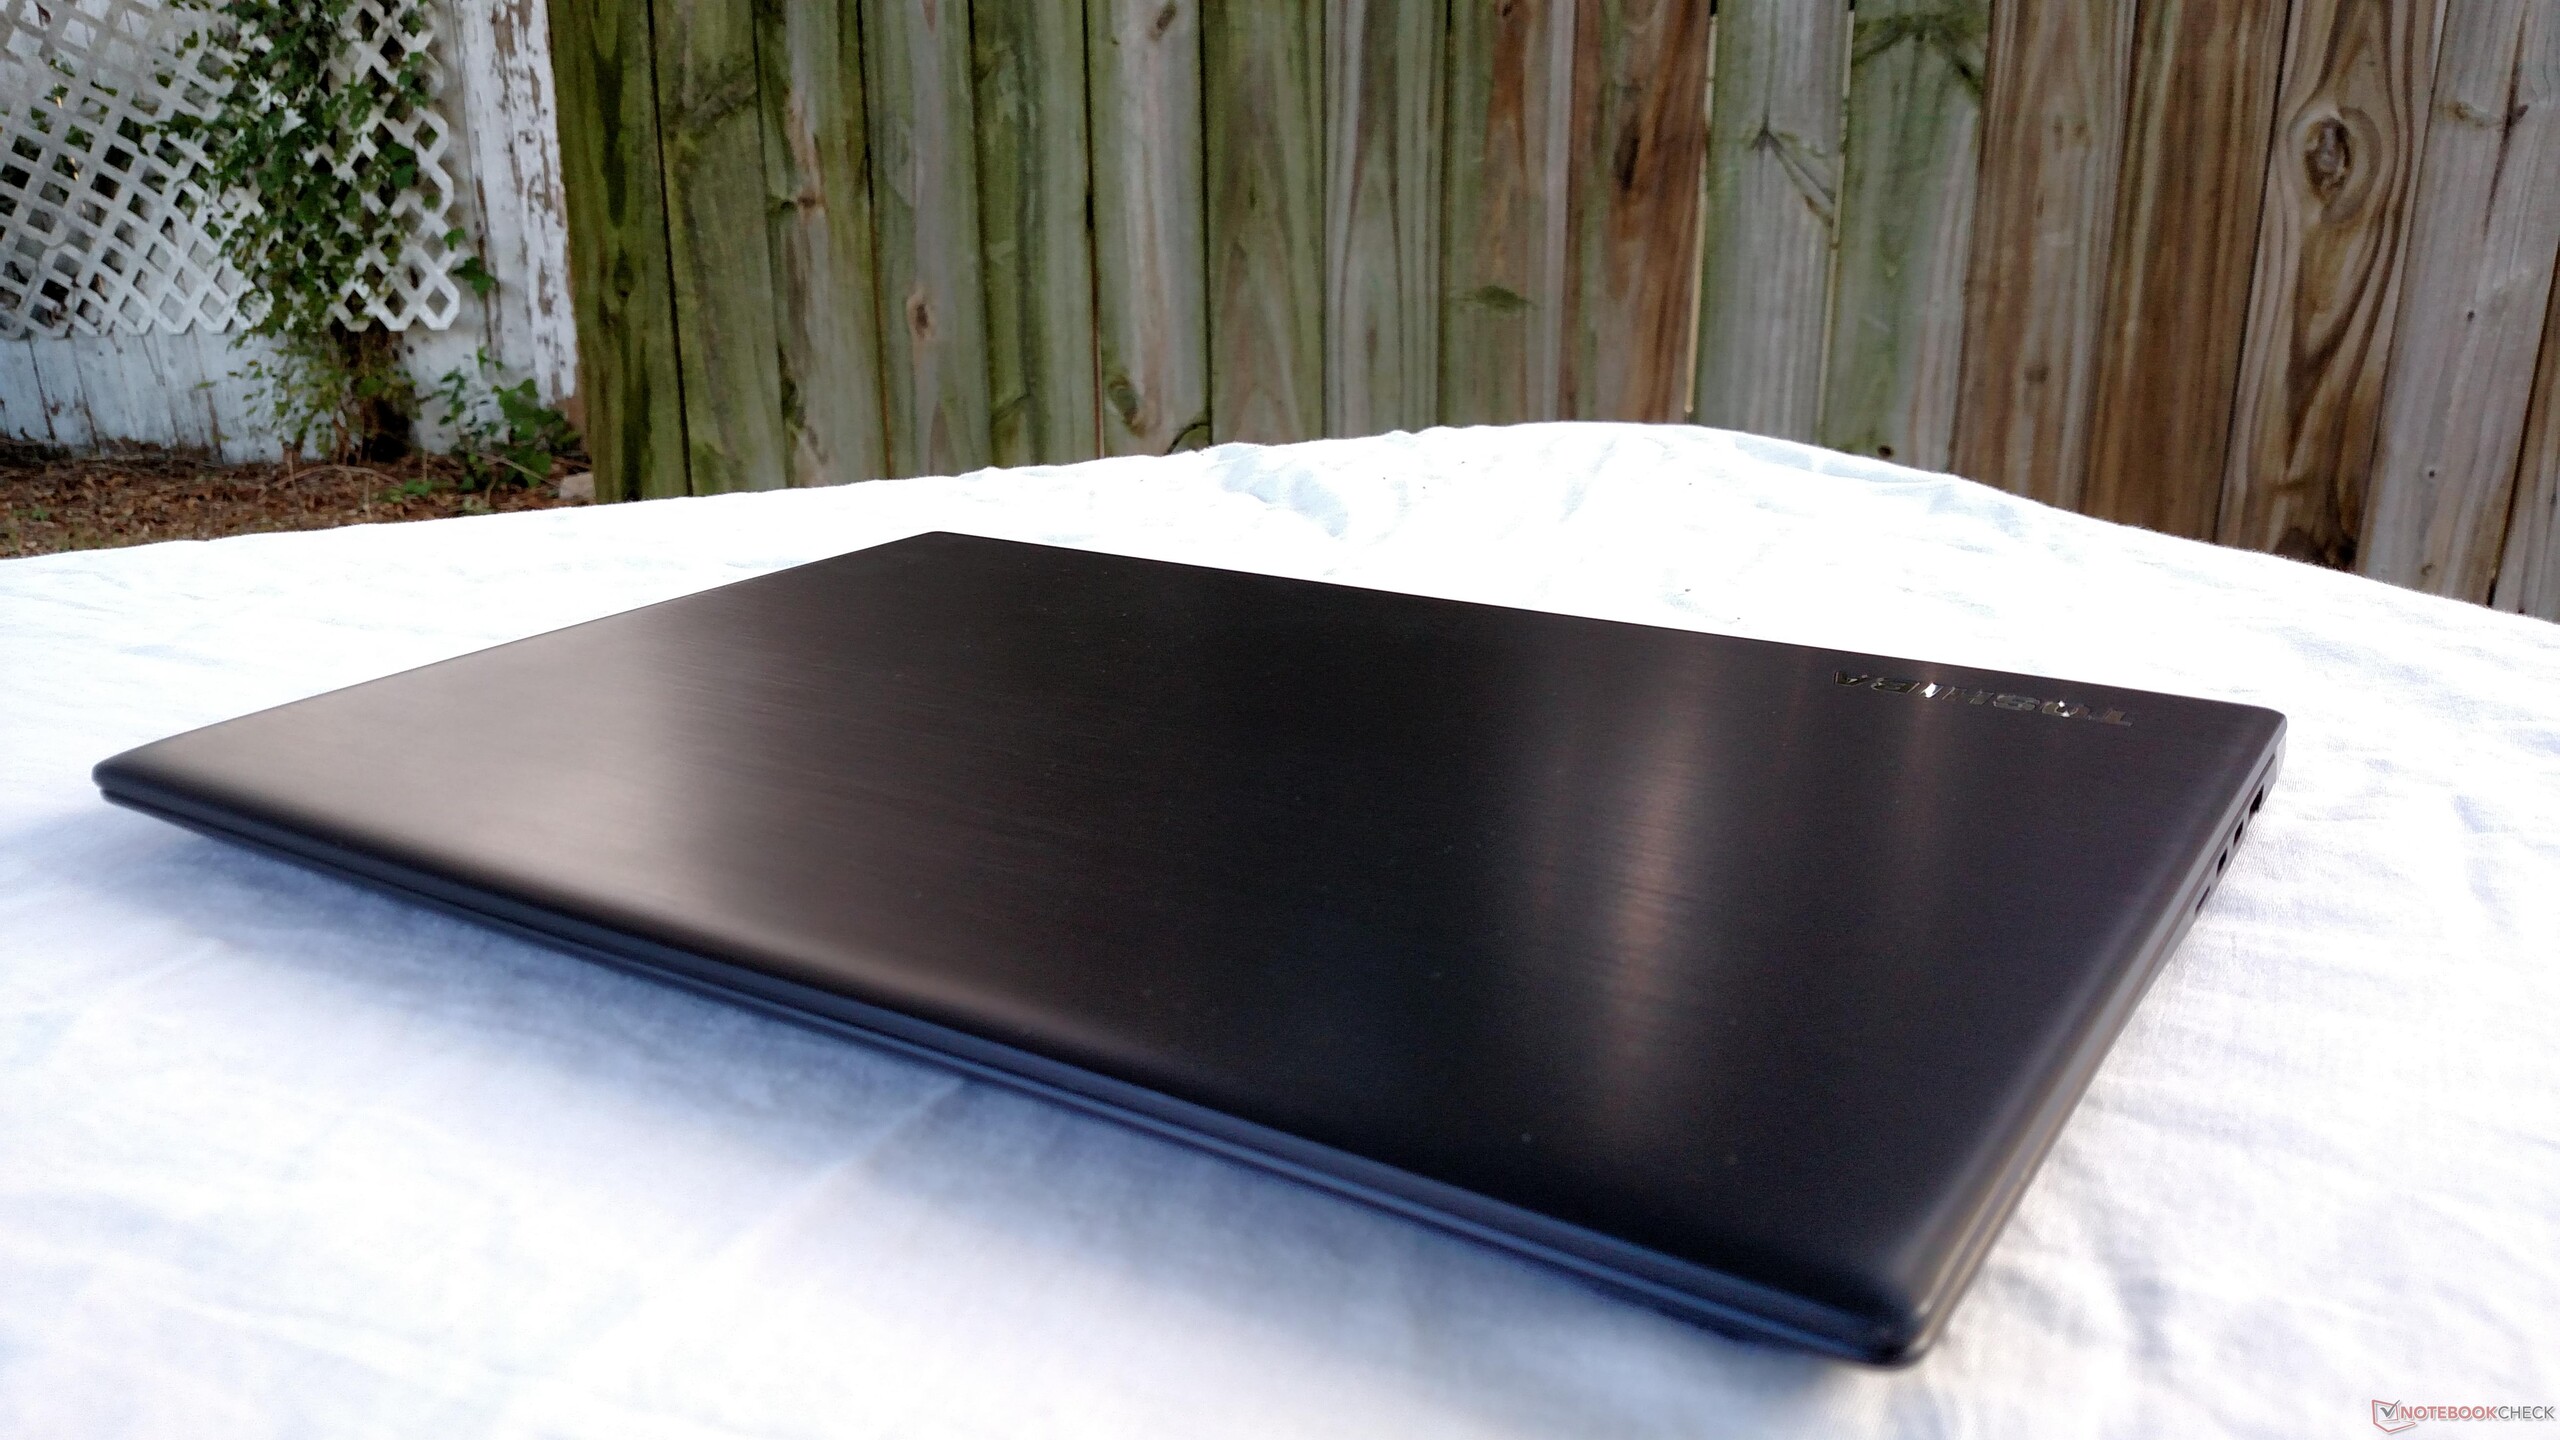
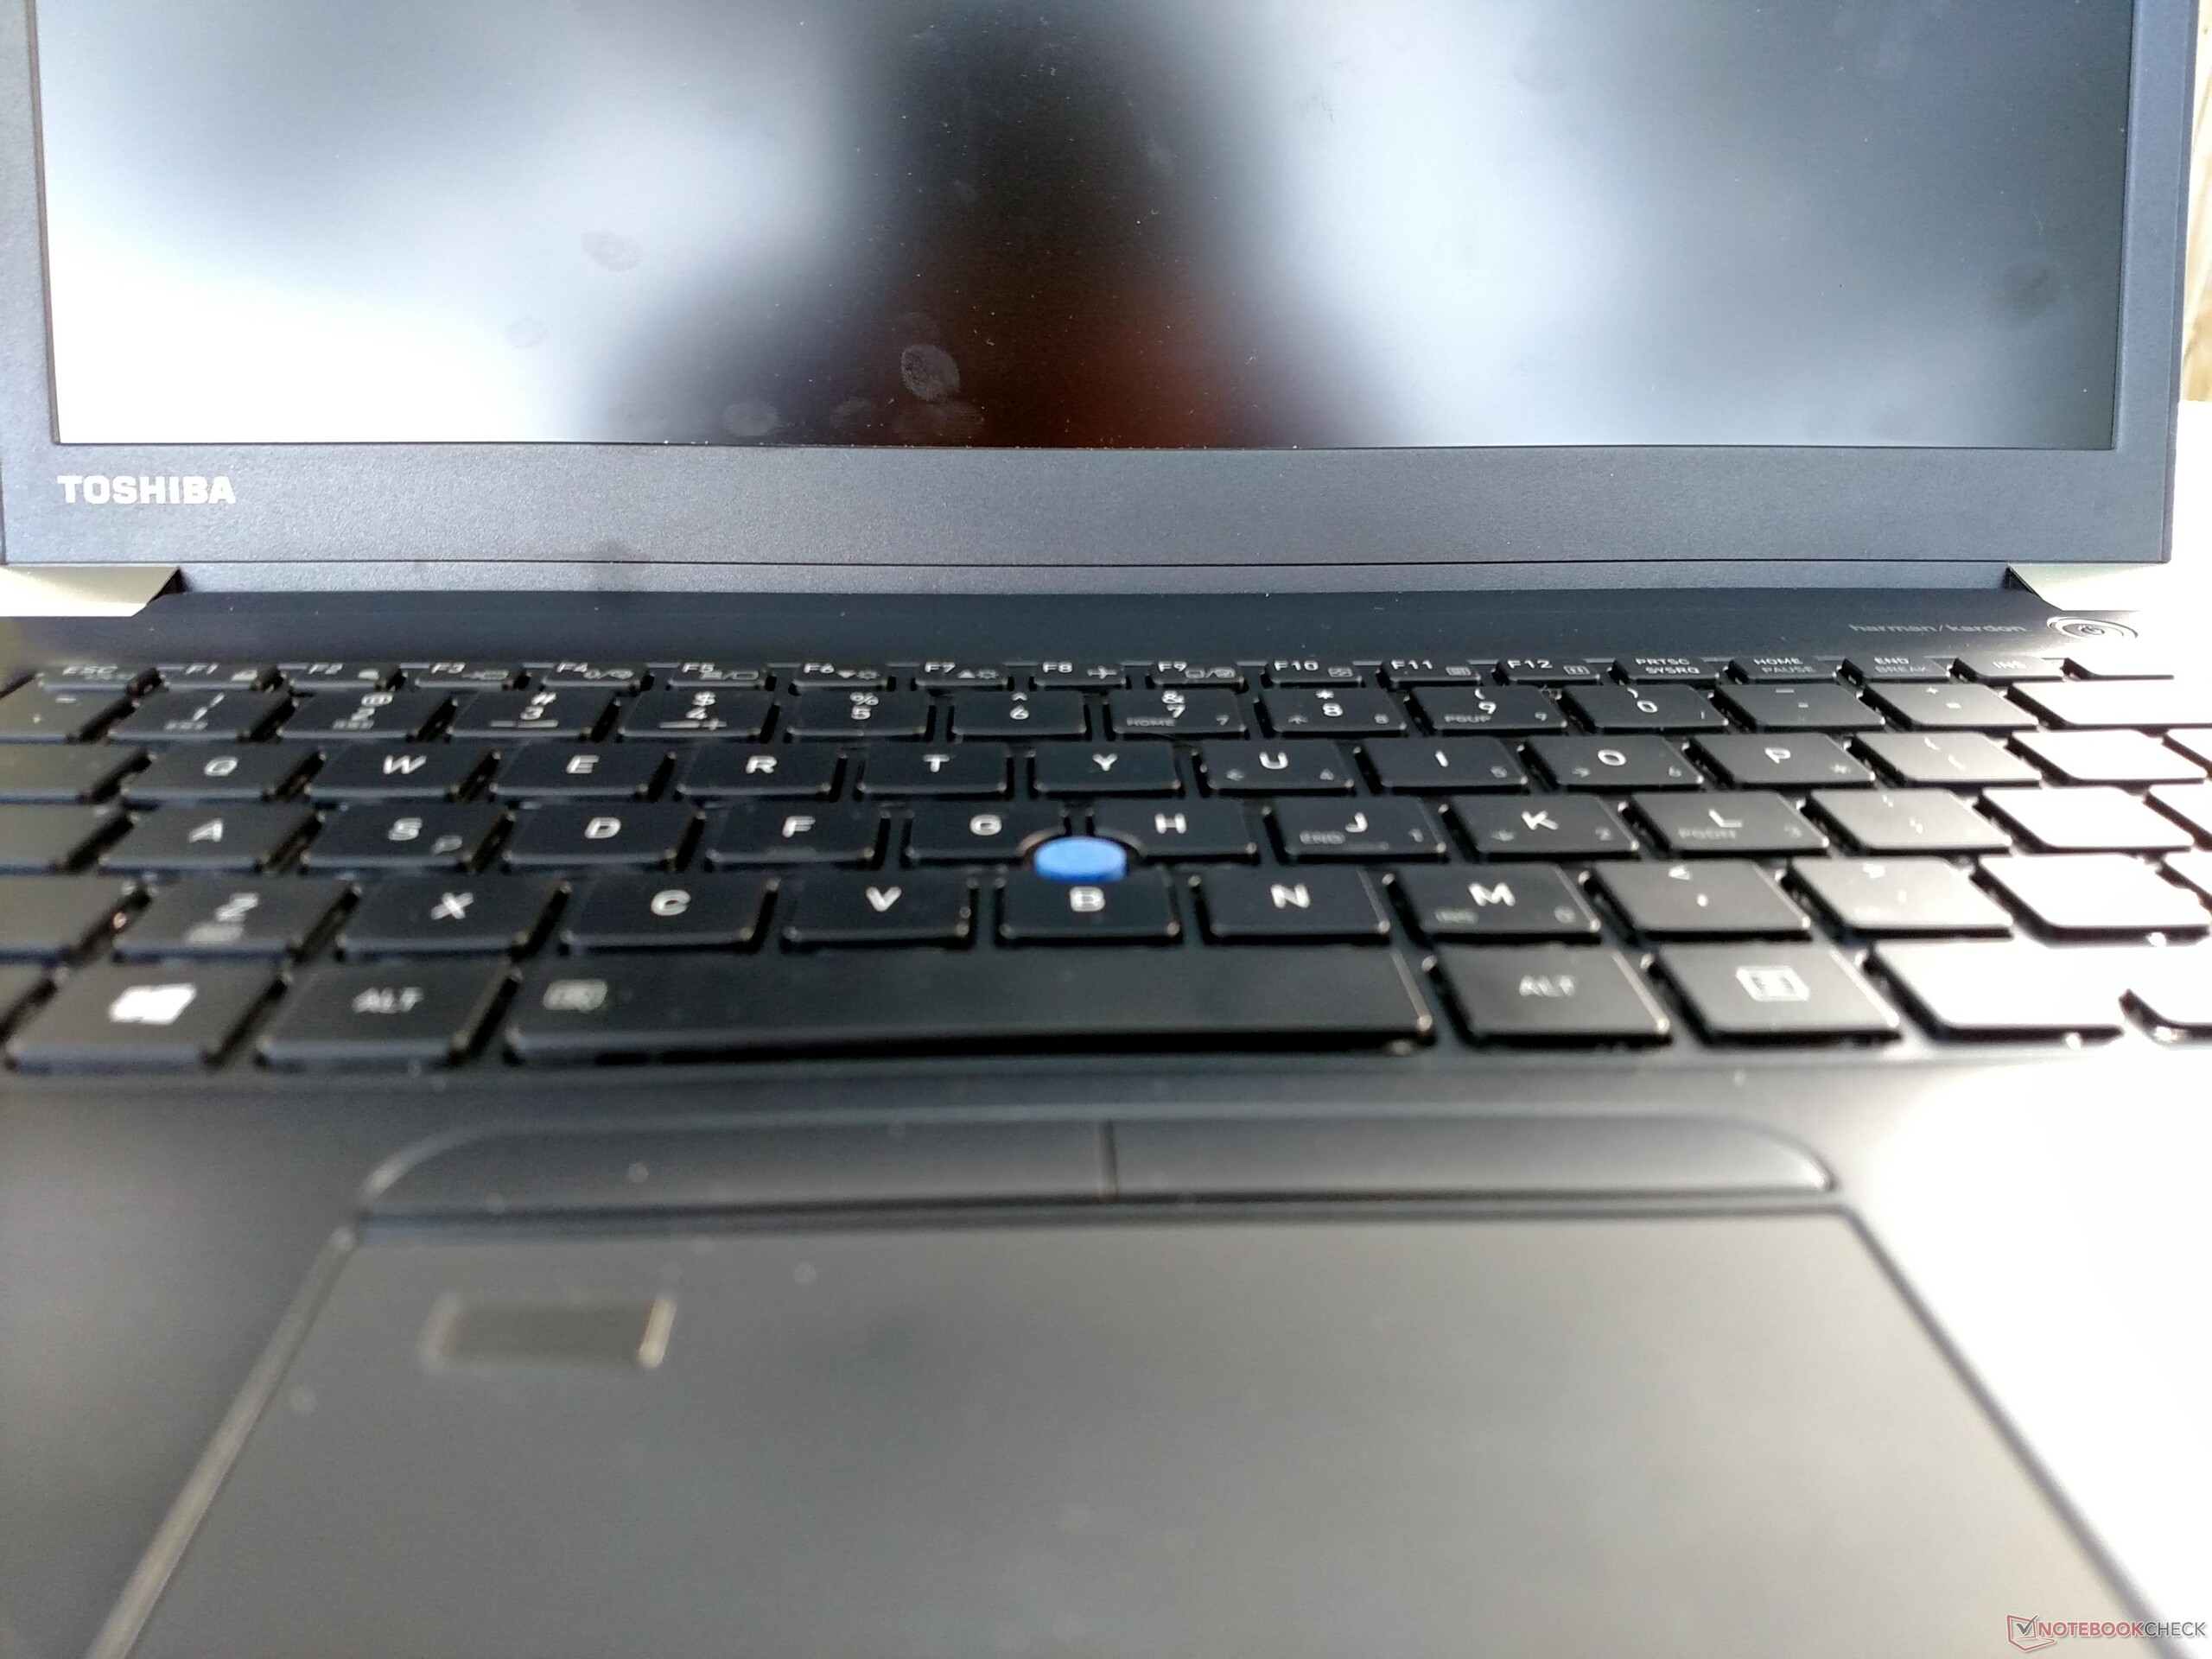
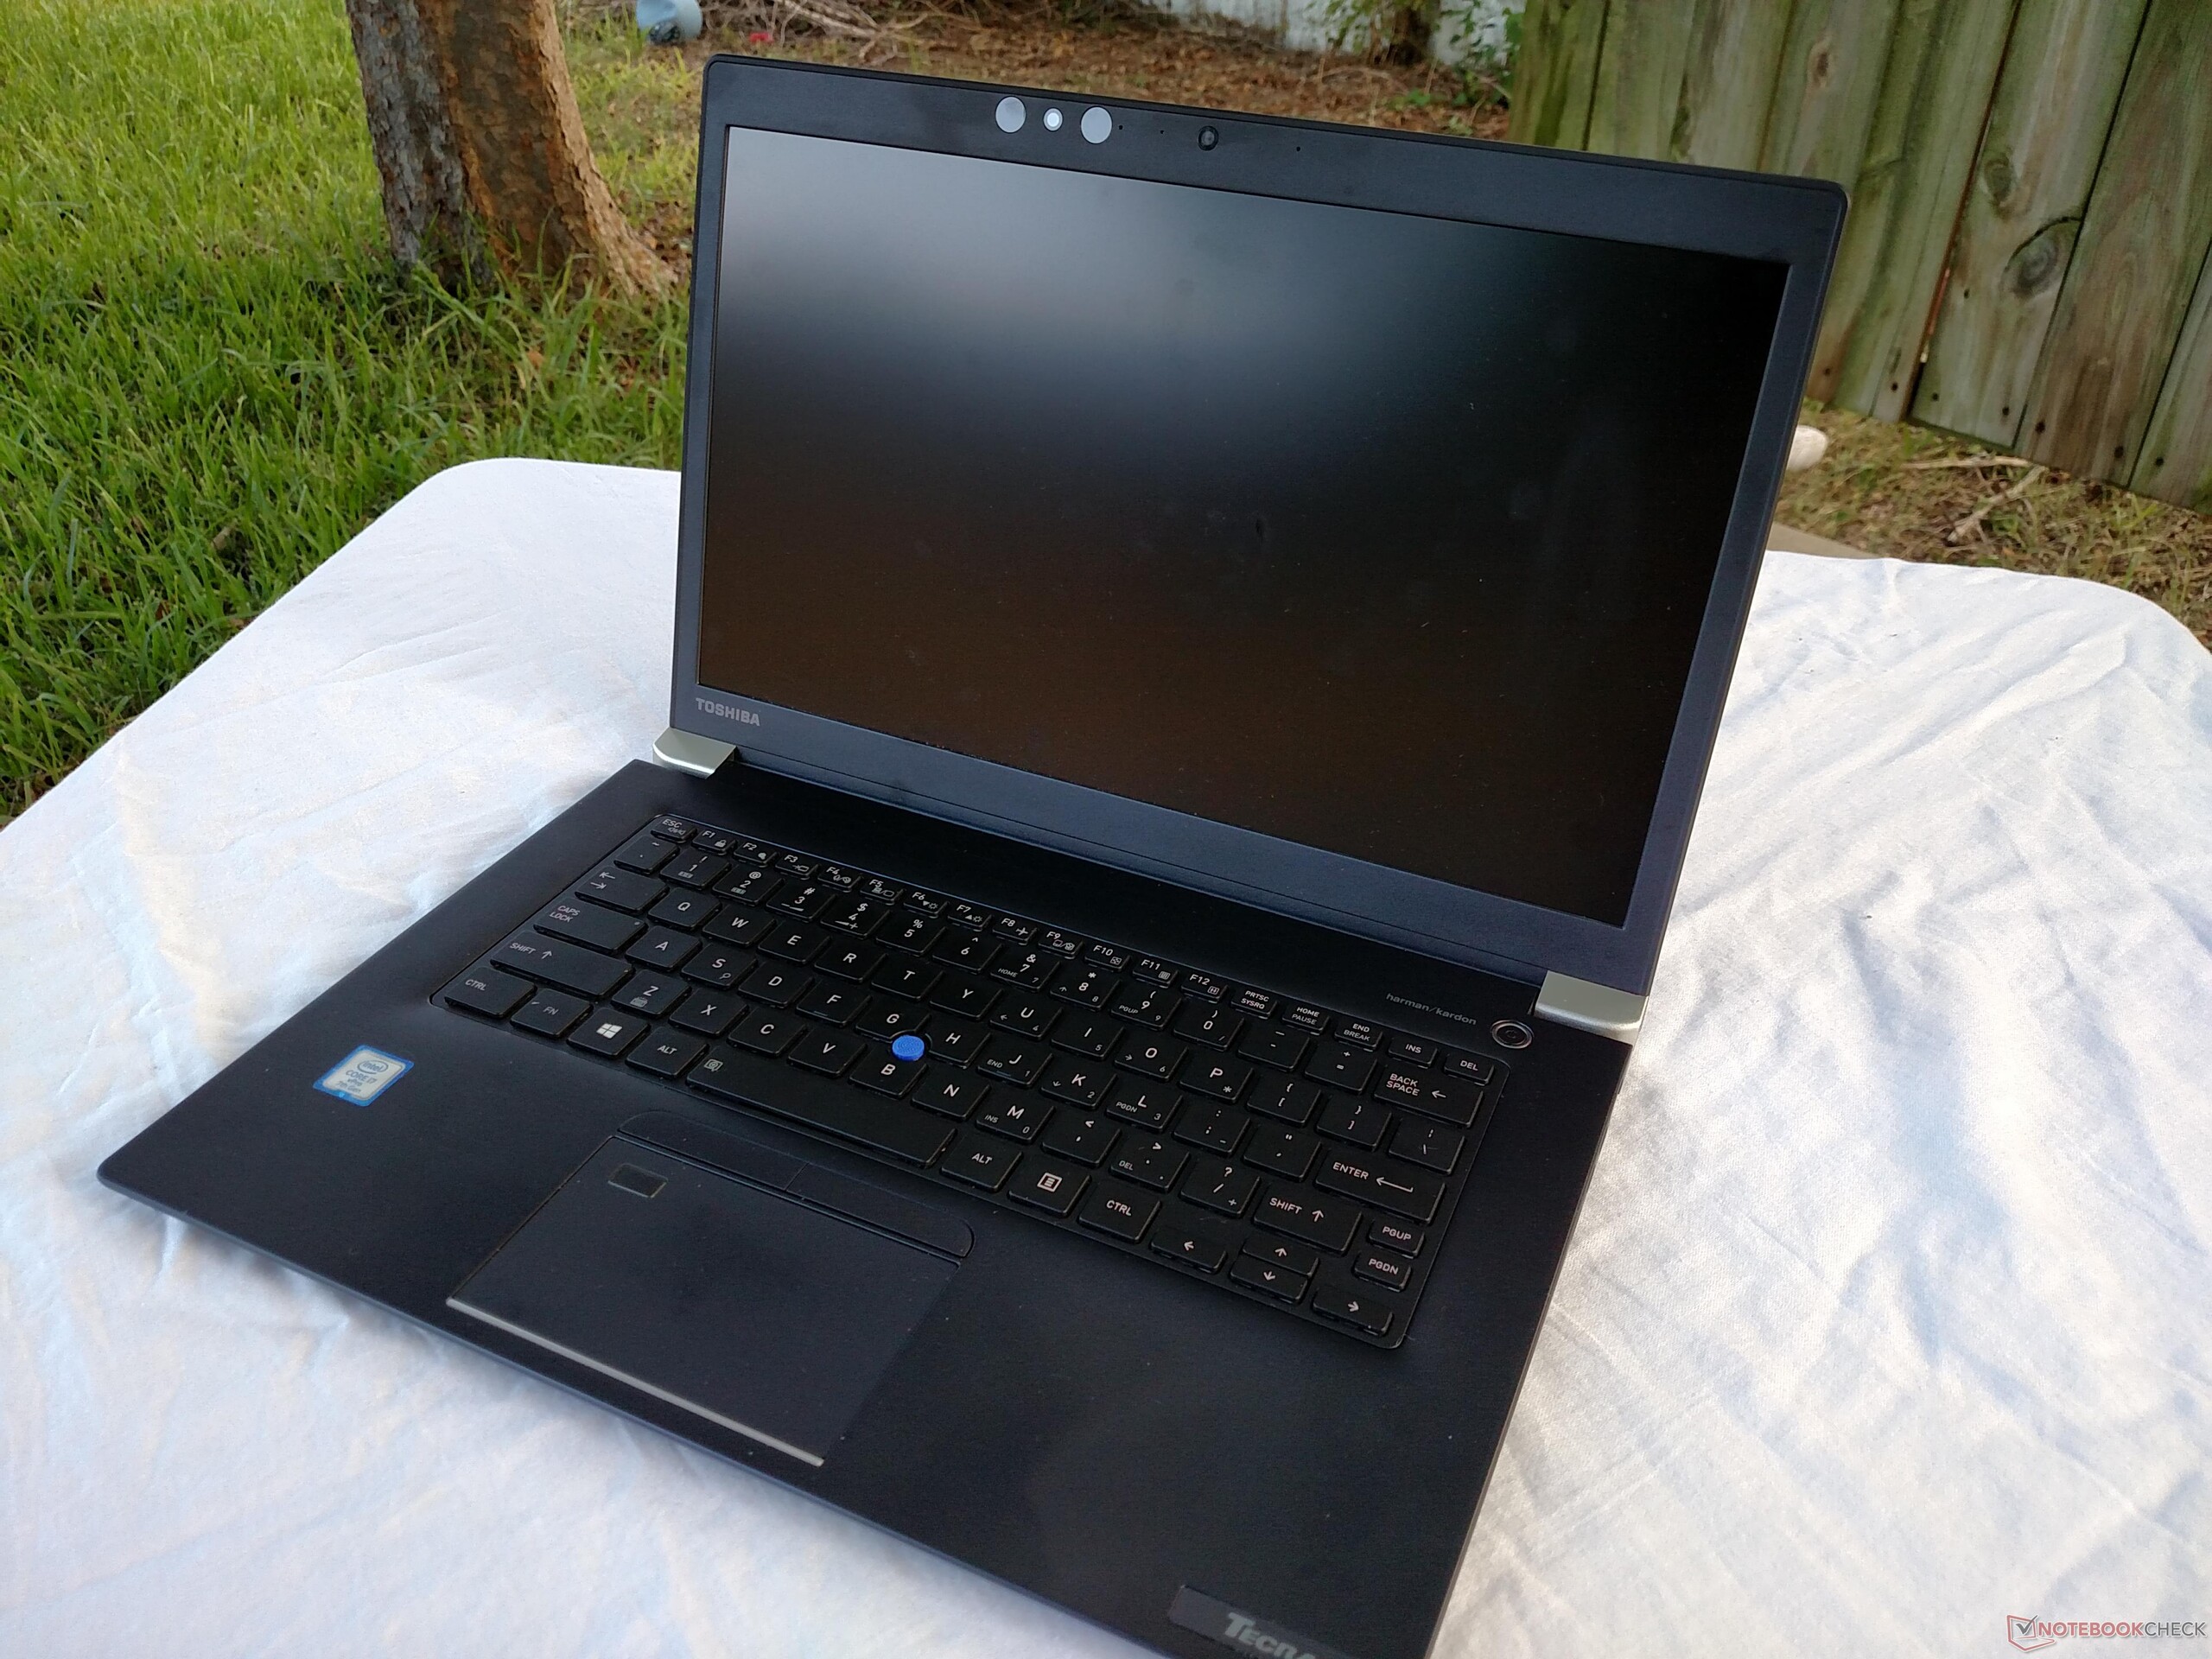
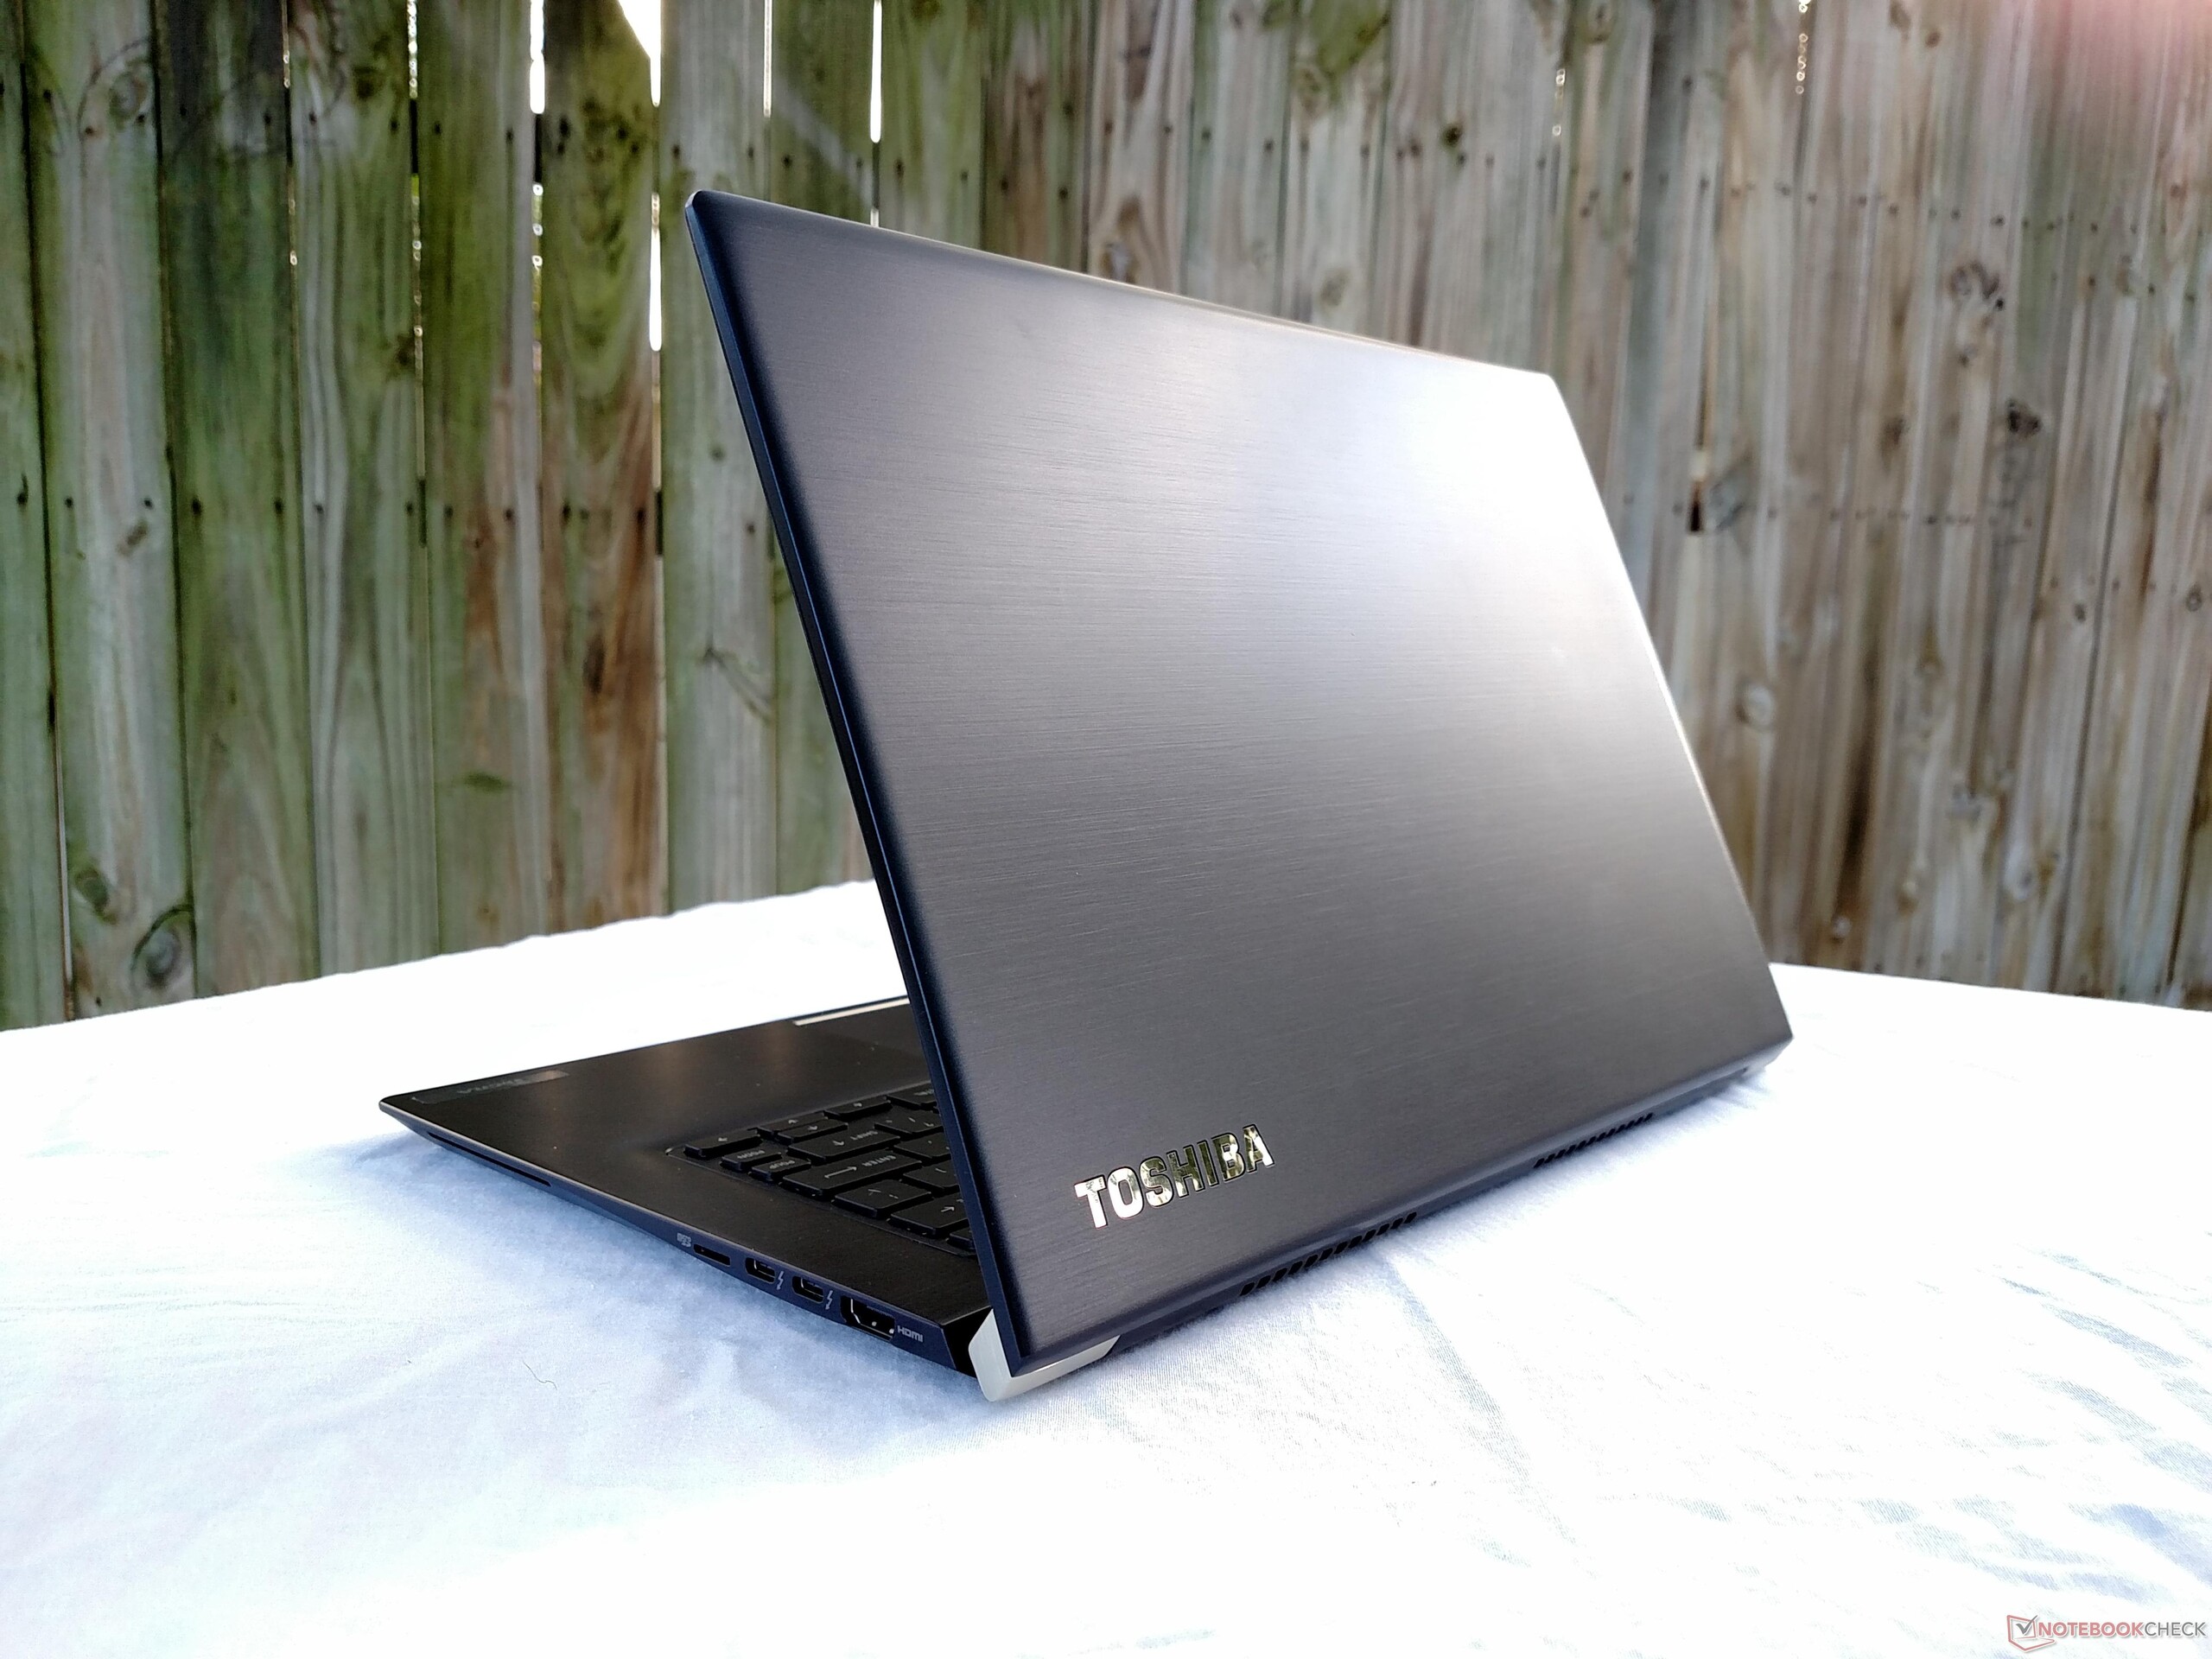
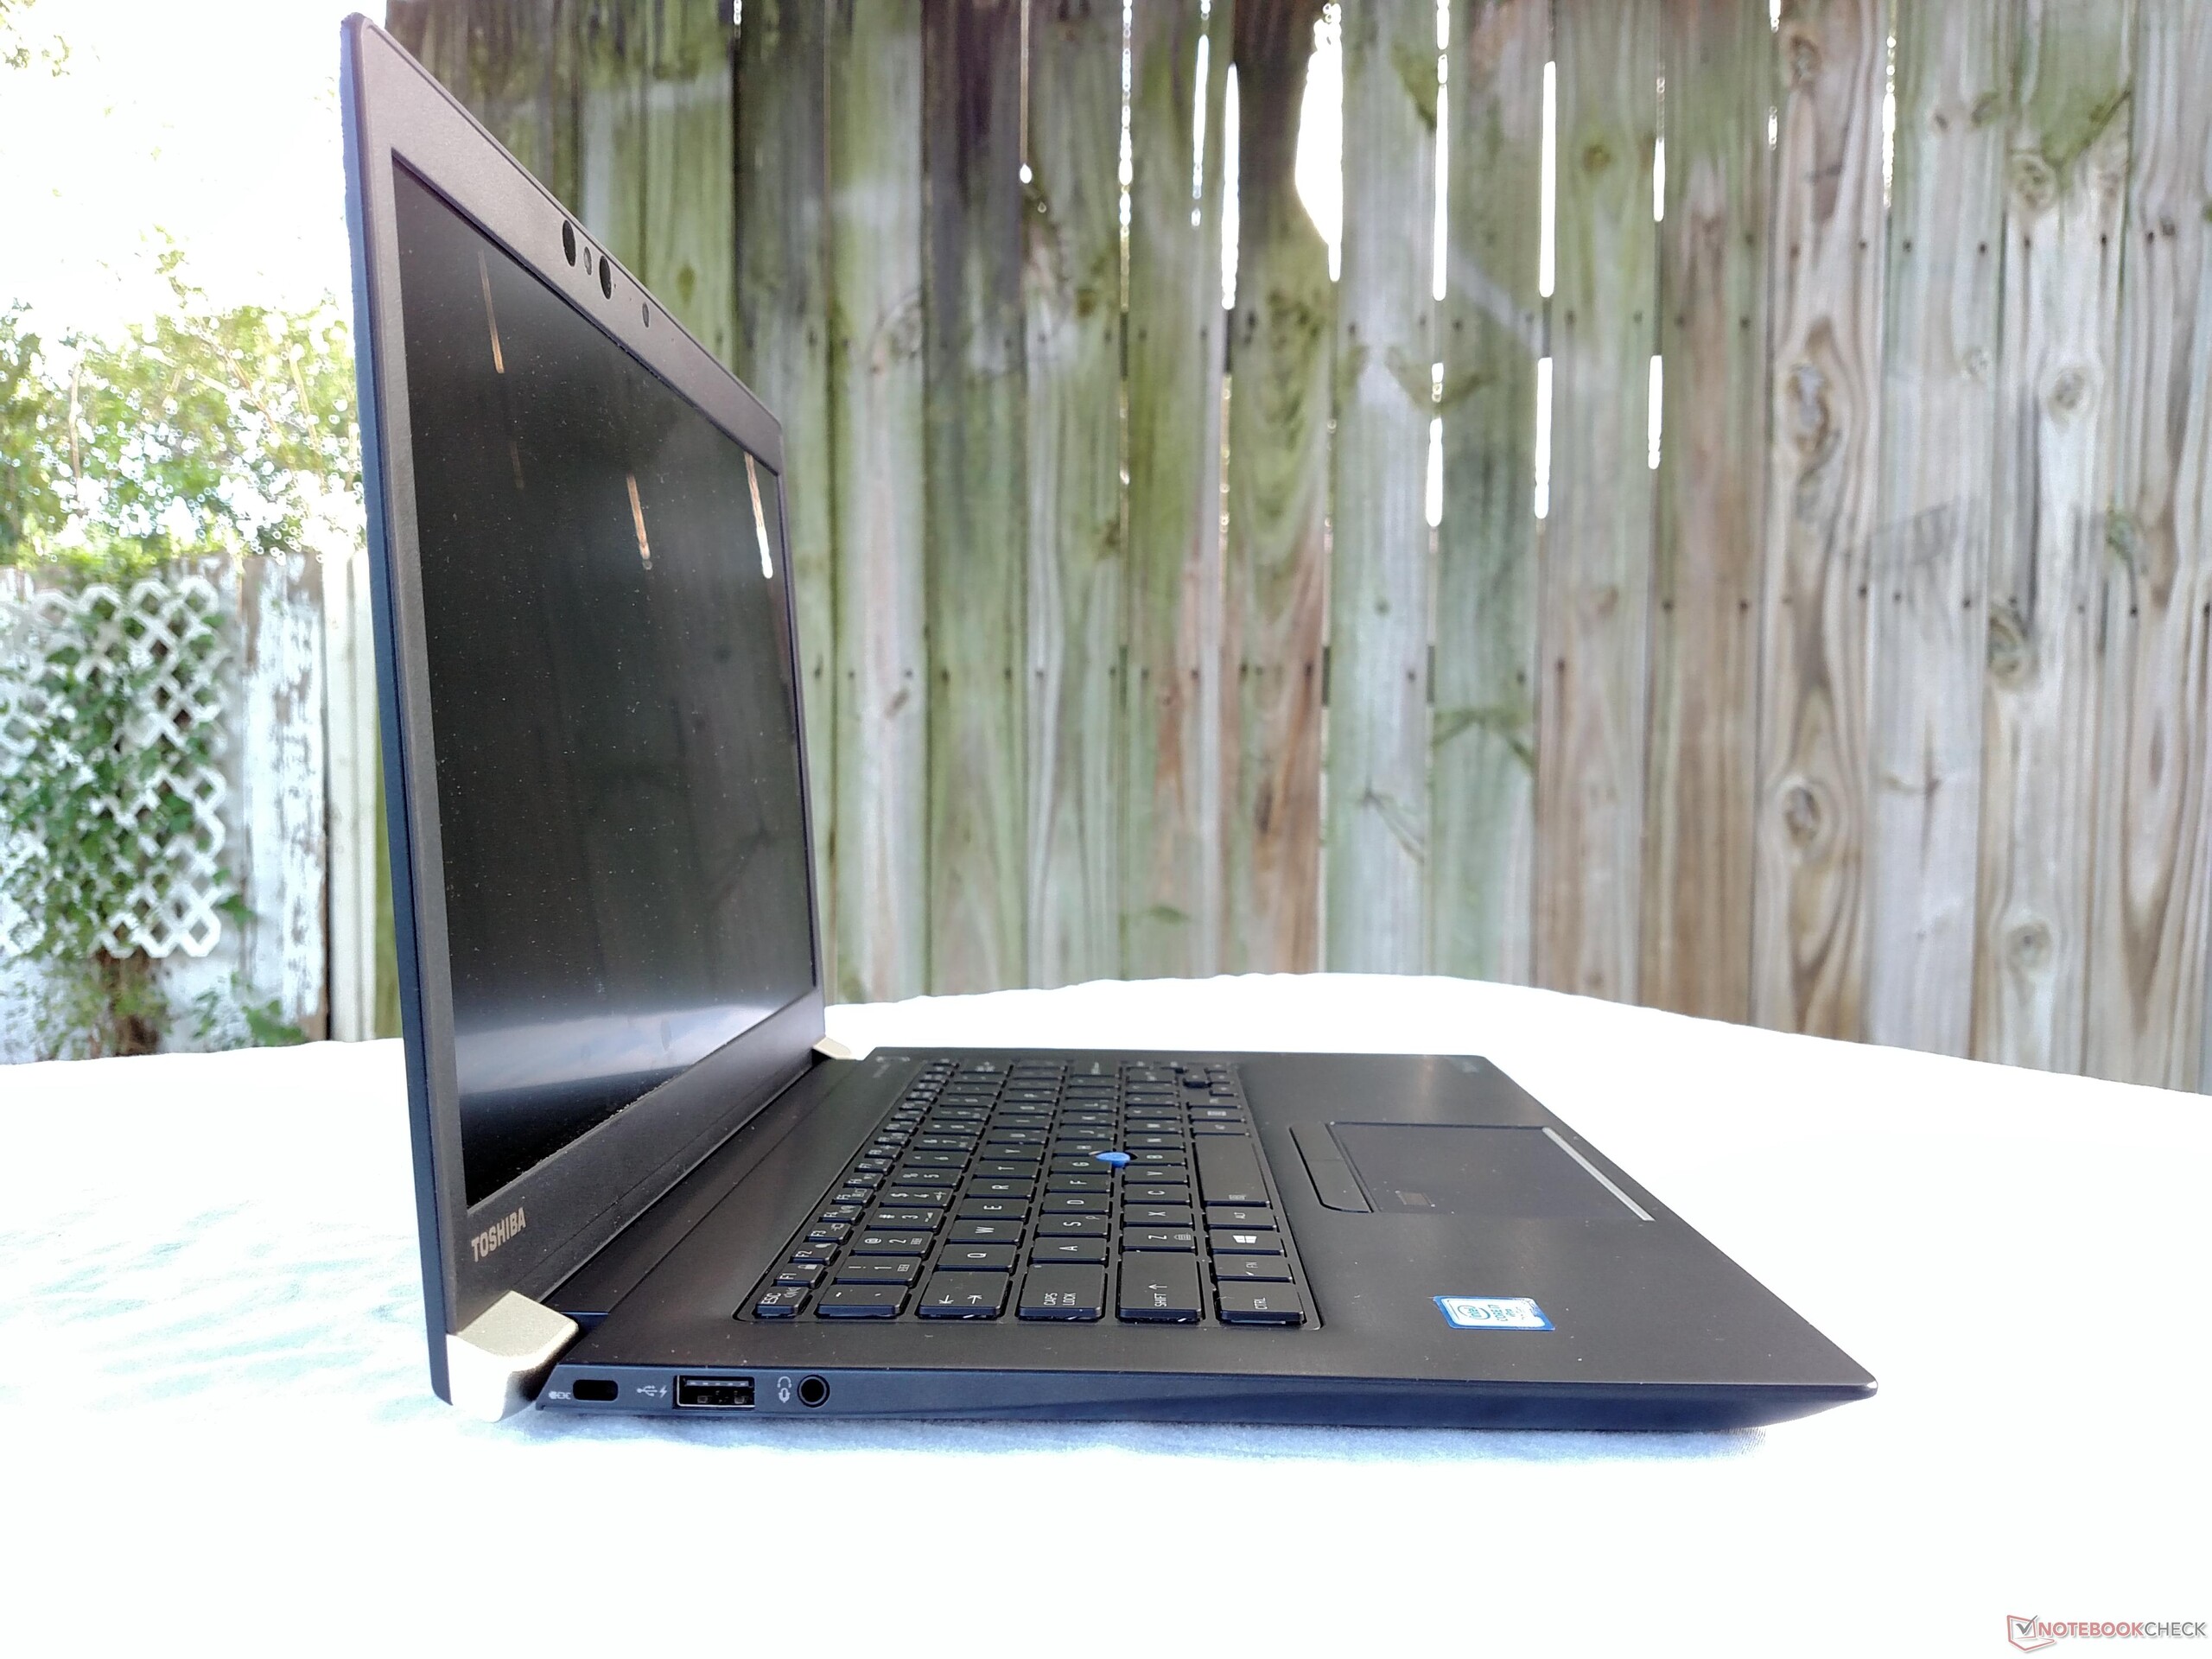
Il Toshiba Tecra X40 è essenzialmente un Portègè X30 con schermo da 14". Pertanto punti di forza e punti deboli sono gli stessi. Lo chassis elegante è ben costruito e molto robusto, inoltre è leggero per un 14". I sensori biometrici sono veloci, affidabili e facili da usare. L'SSD NVMe è scattante e rende il sistema molto reattivo. Insieme alla CPU Core i7-7600U, il Tecra X40 è una veloce macchina da ufficio, in un contenitore eccellente.
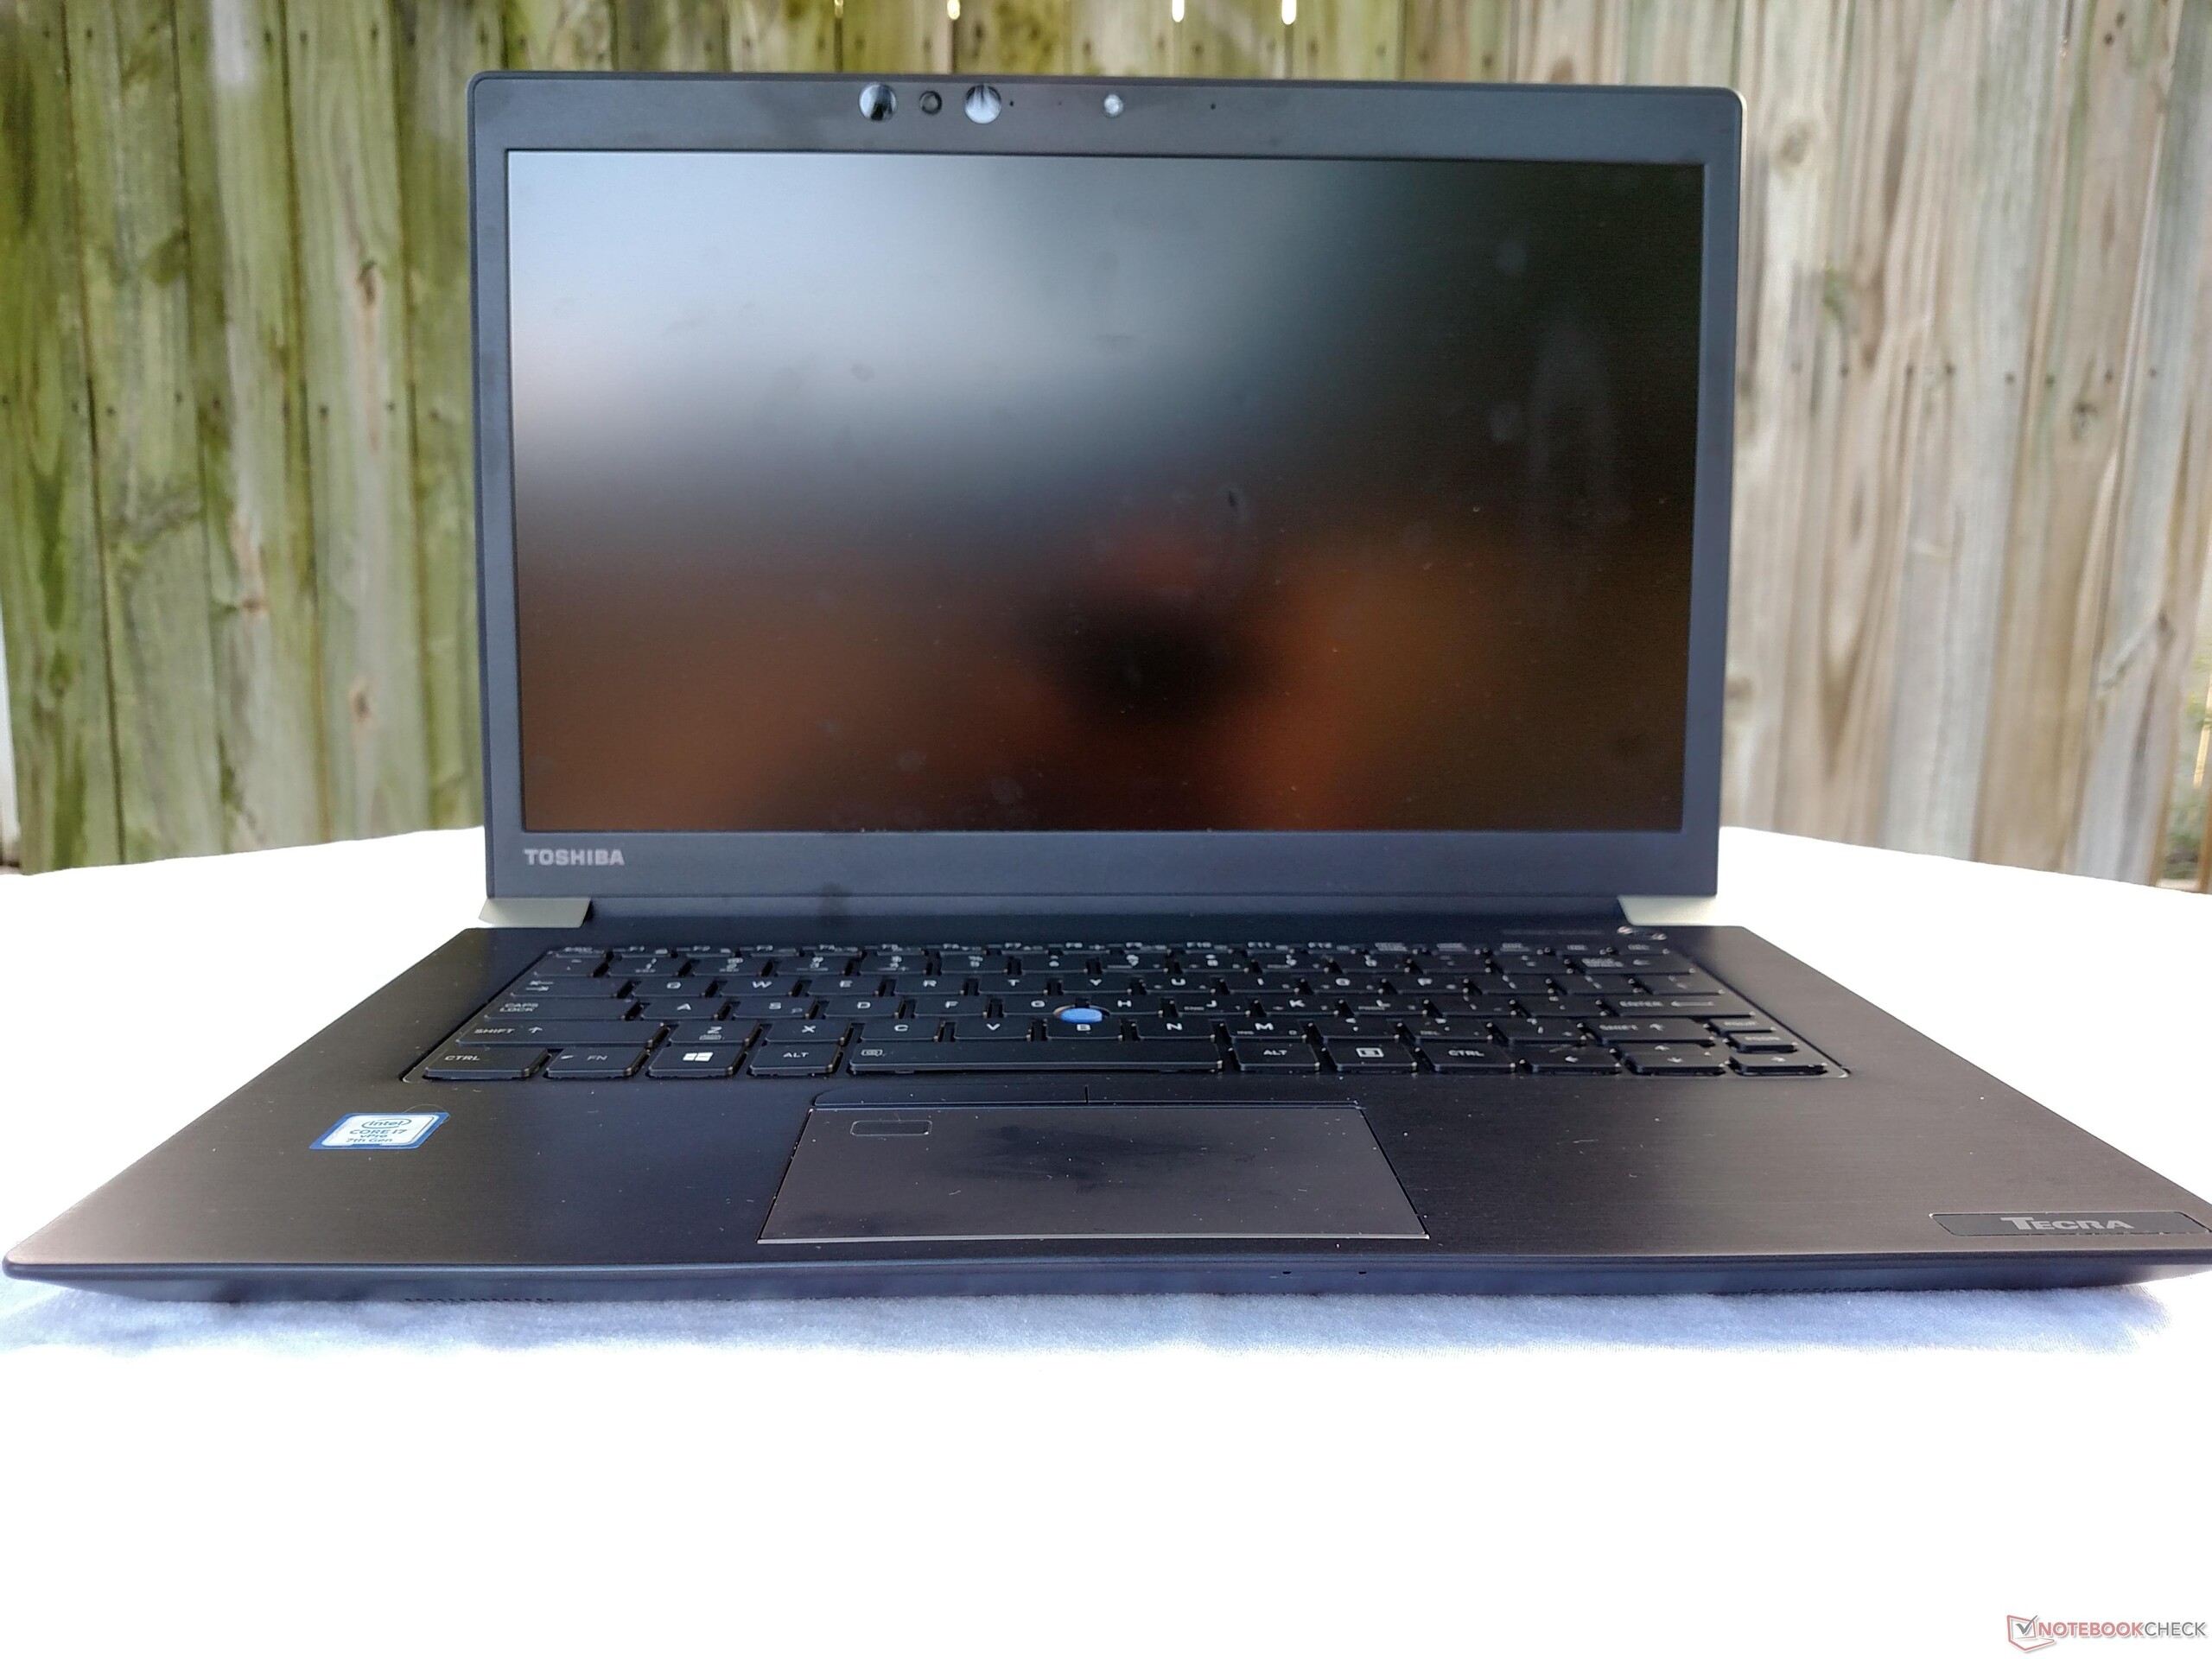
Tuttavia, la cover si flette troppo e la tastiera non ci piace. I tasti sono rumorosi, e la barra spaziatrice fa un fastidioso rumore. Anche il display non è vibrante o ricco come altri portatili business ma è più che accettabile per l'utilizzo quotidiano.
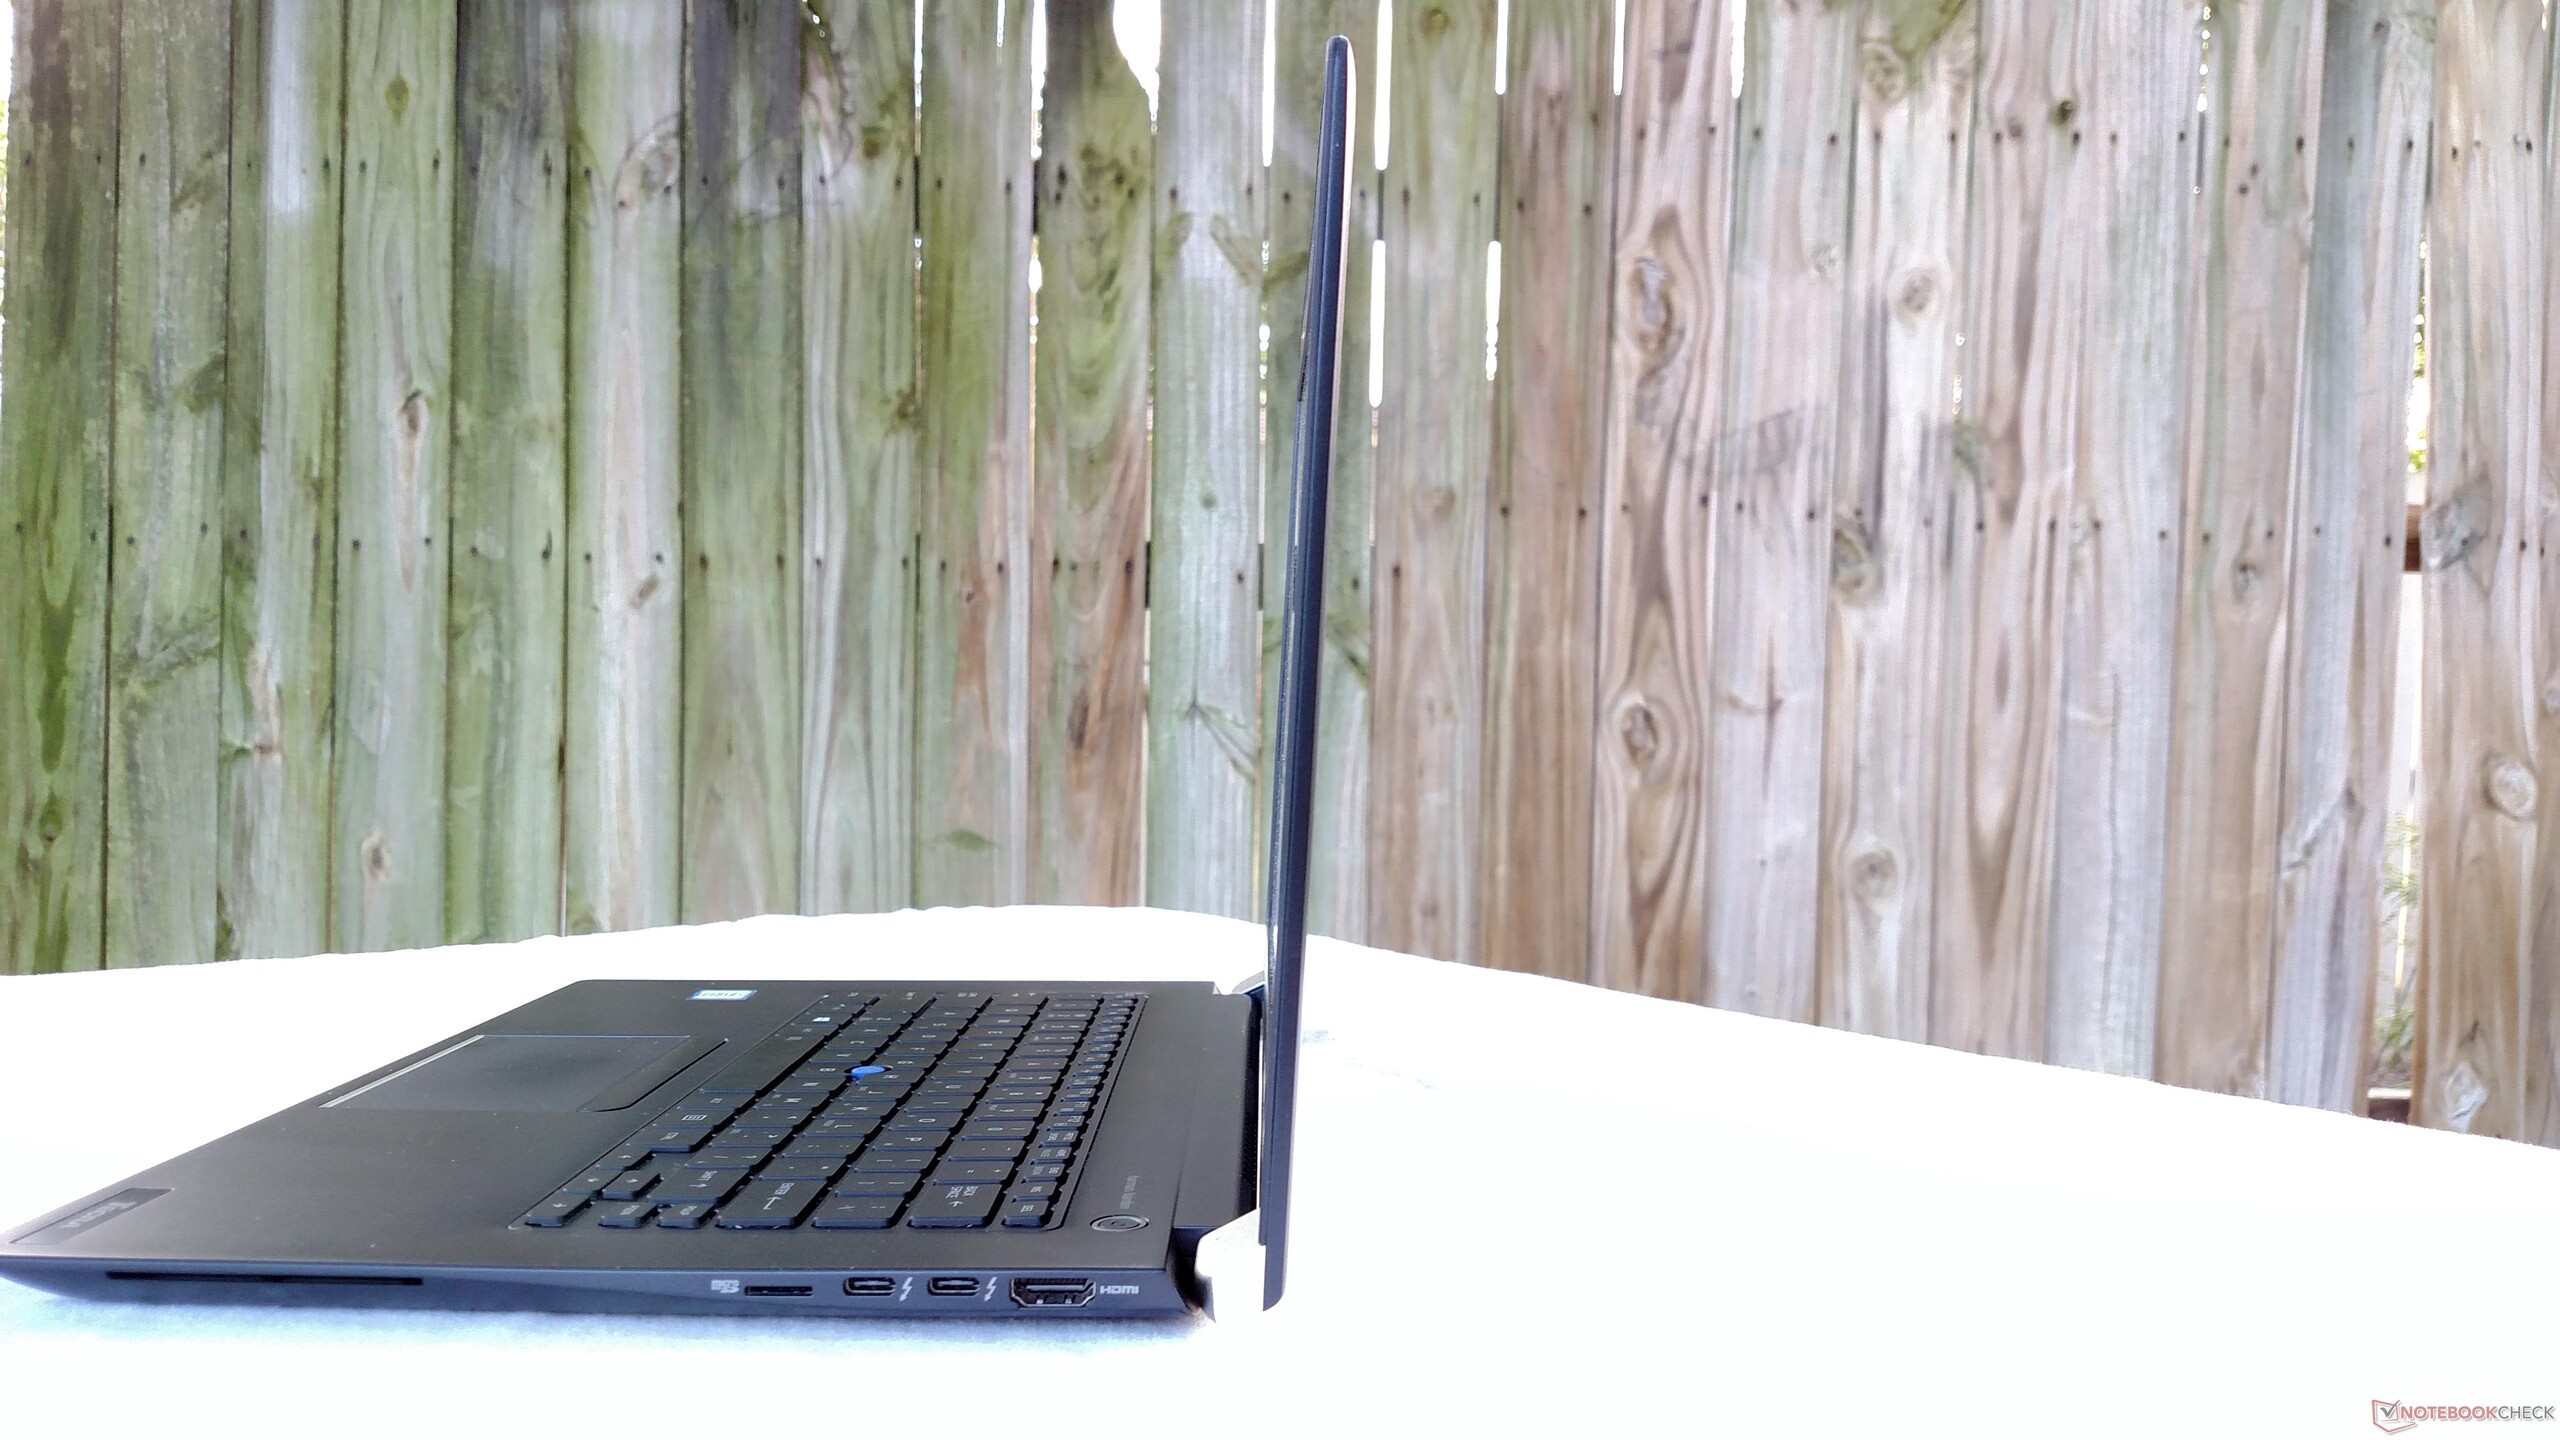
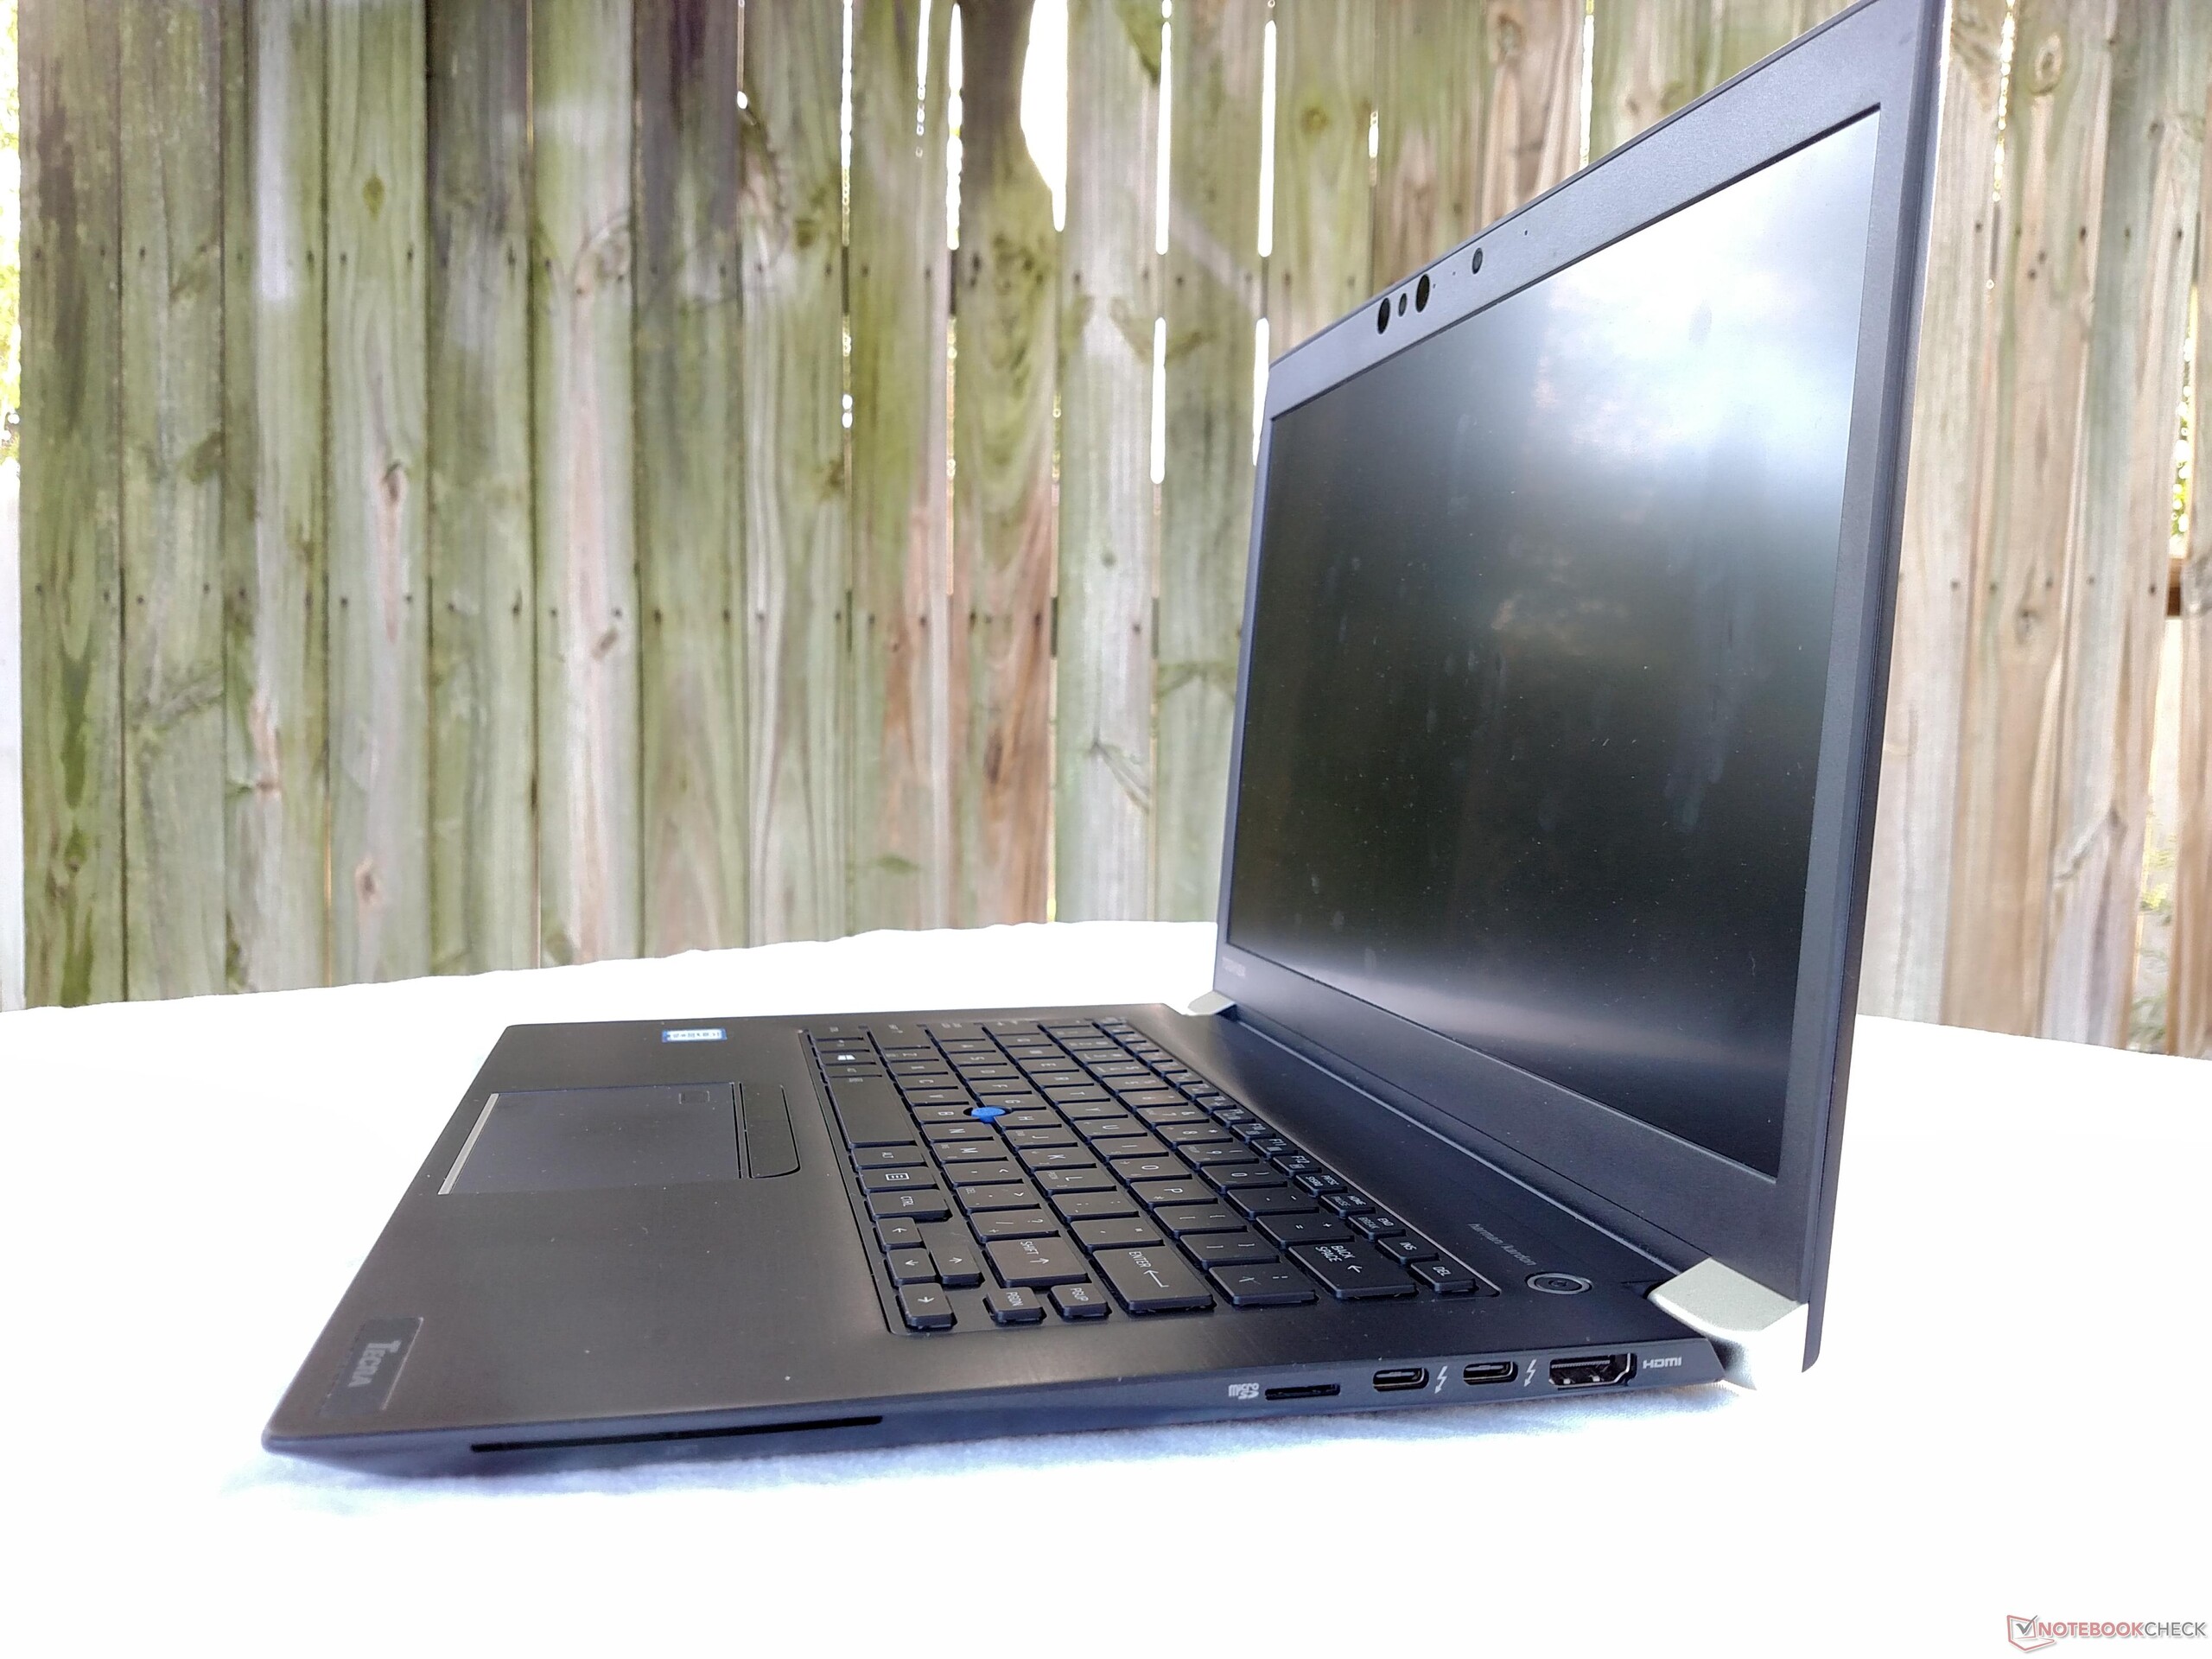
Il Toshiba Tecra X40 è un buon portatile business di dimensioni medie. Non raggiunge il livello dell'eccellente Lenovo X1 Carbon, ma sia avvicina molto considerando il prezzo inferiore. Se non vi importa di sacrificare porte e vi va bene una tastiera di qualità media, il Tecra X40 merita uno sguardo. Il fatto che costi molto meno dell'X1 Carbon lo rende ancora più appetibile.
Nota: si tratta di una recensione breve, con alcune sezioni non tradotte, per la versione integrale in inglese guardate qui.
Toshiba Tecra X40-D
- 08/28/2017 v6 (old)
Sam Medley
Price comparison
