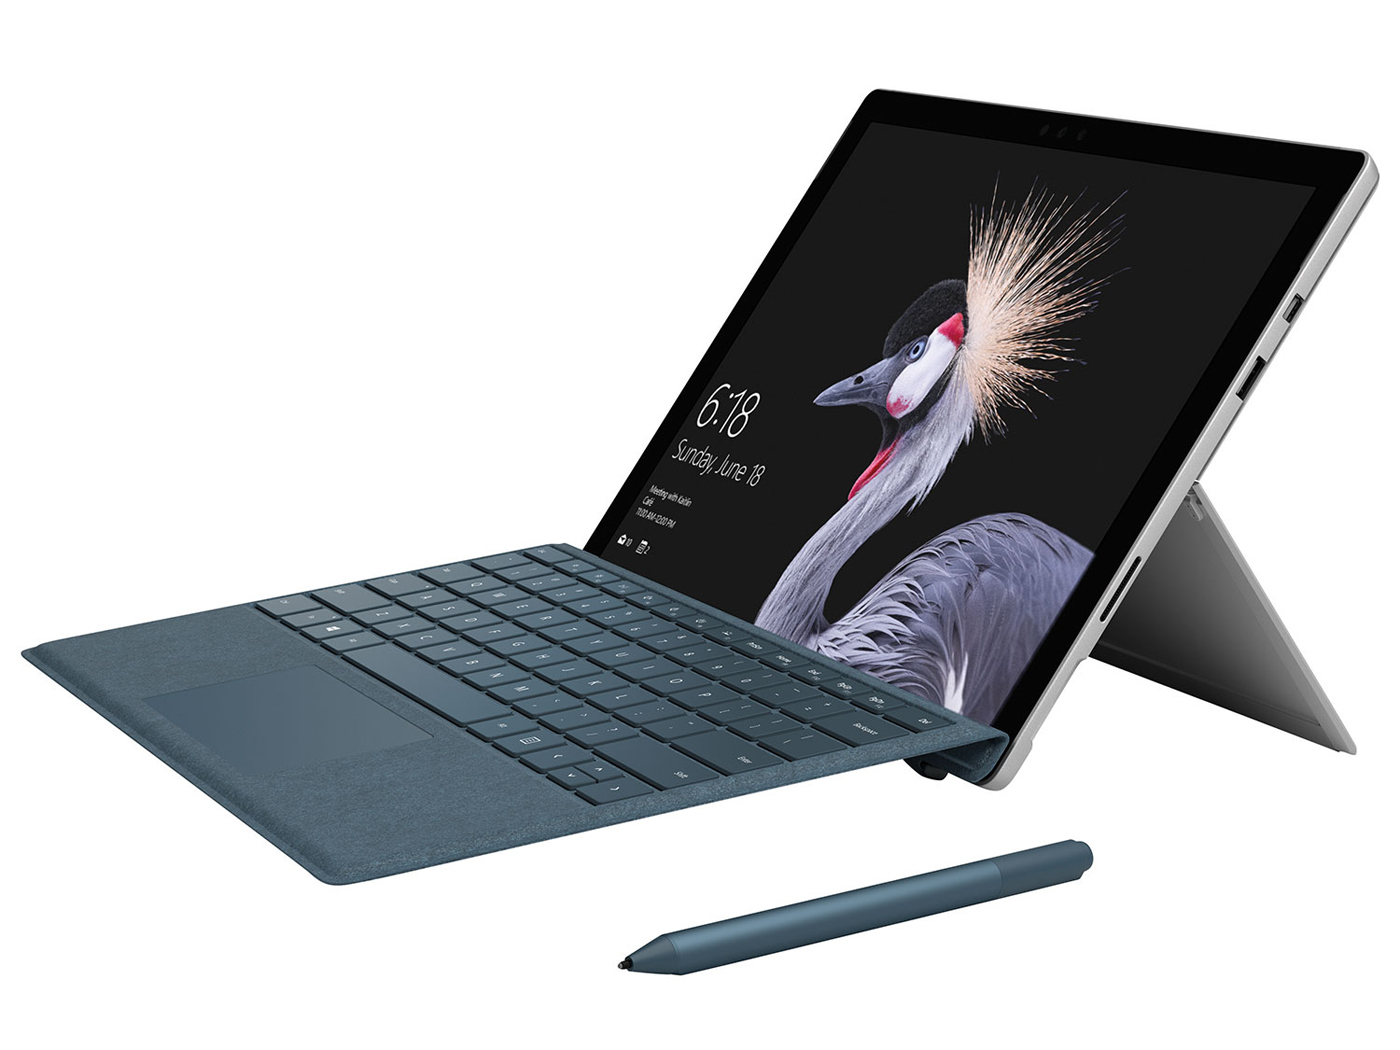
Recensione breve del Convertibile Microsoft Surface Pro (2017) (i7, 512 GB, 16 GB)
| |||||||||||||||||||||||||
Distribuzione della luminosità: 92 %
Al centro con la batteria: 482 cd/m²
Contrasto: 1220:1 (Nero: 0.395 cd/m²)
ΔE ColorChecker Calman: 4 | ∀{0.5-29.43 Ø4.71}
ΔE Greyscale Calman: 5.7 | ∀{0.09-98 Ø4.96}
98.7% sRGB (Calman 2D)
96% sRGB (Argyll 1.6.3 3D)
62% AdobeRGB 1998 (Argyll 1.6.3 3D)
67.8% AdobeRGB 1998 (Argyll 3D)
96.5% sRGB (Argyll 3D)
66.6% Display P3 (Argyll 3D)
Gamma: 2.28
CCT: 7950 K
| Microsoft Surface Pro (2017) i7 LG Display LP123WQ112604, , 2736x1824, 12.3" | Microsoft Surface Pro (2017) i5 LG Display LP123WQ112604, , 2736x1824, 12.3" | Lenovo Ideapad Miix 720-12IKB AUO B120YAN01 / AUO106F, , 2880x1920, 12" | Asus Transformer 3 Pro T303UA-GN050T BOE BOE06AC (NV126A1M-N51), , 2880x1920, 12.6" | Dell Latitude 12 5285 2-in-1 BOE06DC, , 1920x1280, 12.3" | Acer Switch 5 SW512-52-5819 WST KL.1200w.004, , 2160x1440, 12" | Toshiba Portege X30-D (PT274U-01N001) Toshiba TOS508F, , 1920x1080, 13.3" | |
|---|---|---|---|---|---|---|---|
| Display | 2% | -4% | 15% | -5% | -11% | -2% | |
| Display P3 Coverage (%) | 66.6 | 67.6 2% | 65.2 -2% | 81.8 23% | 62.8 -6% | 58.8 -12% | 66.4 0% |
| sRGB Coverage (%) | 96.5 | 99 3% | 91 -6% | 98.3 2% | 94 -3% | 87.5 -9% | 93.5 -3% |
| AdobeRGB 1998 Coverage (%) | 67.8 | 69.1 2% | 66.1 -3% | 82.2 21% | 64.7 -5% | 60.6 -11% | 66.6 -2% |
| Response Times | -15% | -9% | 2% | -19% | -2% | -9% | |
| Response Time Grey 50% / Grey 80% * (ms) | 37 ? | 42 ? -14% | 45 ? -22% | 30 ? 19% | 42.4 ? -15% | 37 ? -0% | 36.8 ? 1% |
| Response Time Black / White * (ms) | 25 ? | 29 ? -16% | 24 ? 4% | 29 ? -16% | 30.8 ? -23% | 26 ? -4% | 29.6 ? -18% |
| PWM Frequency (Hz) | 22130 ? | 21000 | 200 ? | 210.1 ? | |||
| Screen | 10% | -10% | -4% | 0% | -23% | 5% | |
| Brightness middle (cd/m²) | 482 | 417 -13% | 406 -16% | 316 -34% | 523.2 9% | 369 -23% | 332.6 -31% |
| Brightness (cd/m²) | 466 | 401 -14% | 396 -15% | 307 -34% | 522 12% | 331 -29% | 323 -31% |
| Brightness Distribution (%) | 92 | 88 -4% | 88 -4% | 91 -1% | 88 -4% | 75 -18% | 86 -7% |
| Black Level * (cd/m²) | 0.395 | 0.29 27% | 0.3 24% | 0.29 27% | 0.42 -6% | 0.46 -16% | 0.28 29% |
| Contrast (:1) | 1220 | 1438 18% | 1353 11% | 1090 -11% | 1246 2% | 802 -34% | 1188 -3% |
| Colorchecker dE 2000 * | 4 | 3.63 9% | 5.28 -32% | 3.91 2% | 4 -0% | 5.52 -38% | 2.6 35% |
| Colorchecker dE 2000 max. * | 7.2 | 6.74 6% | 9.83 -37% | 7.9 -10% | 8.6 -19% | 9.29 -29% | 6.7 7% |
| Greyscale dE 2000 * | 5.7 | 2.18 62% | 6.71 -18% | 5.37 6% | 5.5 4% | 6.95 -22% | 2.5 56% |
| Gamma | 2.28 96% | 3.09 71% | 2.29 96% | 2.36 93% | 2.16 102% | 2.58 85% | 2.12 104% |
| CCT | 7950 82% | 6767 96% | 6532 100% | 7812 83% | 7546 86% | 7009 93% | 6720 97% |
| Color Space (Percent of AdobeRGB 1998) (%) | 62 | 63 2% | 59 -5% | 72 16% | 64.86 5% | 56 -10% | 62 0% |
| Color Space (Percent of sRGB) (%) | 96 | 99 3% | 91 -5% | 98 2% | 93.97 -2% | 88 -8% | 94 -2% |
| Media totale (Programma / Settaggio) | -1% /
5% | -8% /
-8% | 4% /
1% | -8% /
-3% | -12% /
-18% | -2% /
2% |
* ... Meglio usare valori piccoli
Tempi di risposta del Display
| ↔ Tempi di risposta dal Nero al Bianco | ||
|---|---|---|
| 25 ms ... aumenta ↗ e diminuisce ↘ combinato | ↗ 13 ms Incremento | 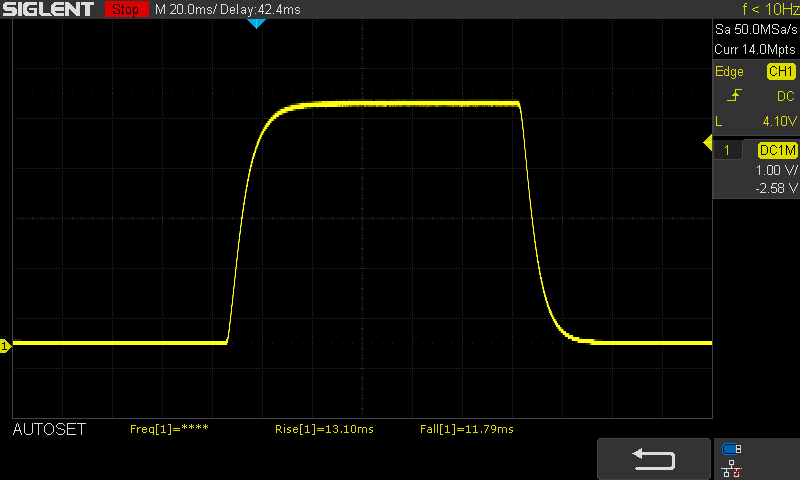 |
| ↘ 12 ms Calo | ||
| Lo schermo mostra tempi di risposta relativamente lenti nei nostri tests e potrebbe essere troppo lento per i gamers. In confronto, tutti i dispositivi di test variano da 0.1 (minimo) a 240 (massimo) ms. » 59 % di tutti i dispositivi è migliore. Questo significa che i tempi di risposta rilevati sono peggiori rispetto alla media di tutti i dispositivi testati (19.8 ms). | ||
| ↔ Tempo di risposta dal 50% Grigio all'80% Grigio | ||
| 37 ms ... aumenta ↗ e diminuisce ↘ combinato | ↗ 16 ms Incremento | 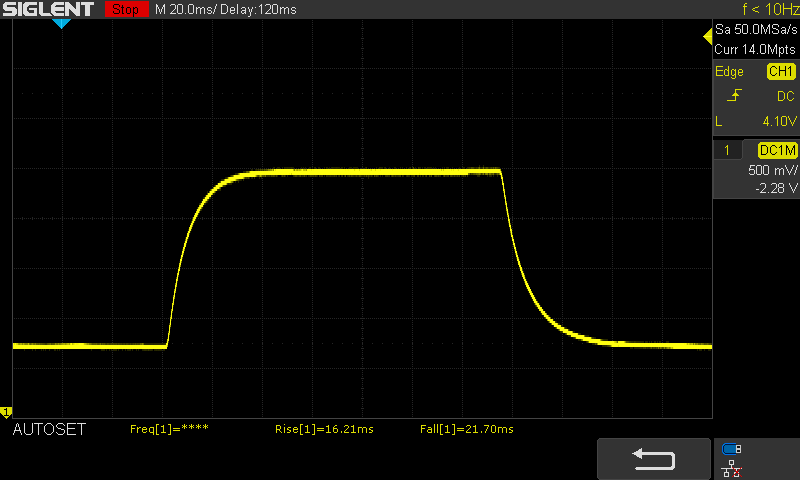 |
| ↘ 21 ms Calo | ||
| Lo schermo mostra tempi di risposta lenti nei nostri tests e sarà insoddisfacente per i gamers. In confronto, tutti i dispositivi di test variano da 0.165 (minimo) a 636 (massimo) ms. » 53 % di tutti i dispositivi è migliore. Questo significa che i tempi di risposta rilevati sono peggiori rispetto alla media di tutti i dispositivi testati (31 ms). | ||
Sfarfallio dello schermo / PWM (Pulse-Width Modulation)
| flickering dello schermo / PWM rilevato | 22130 Hz | ≤ 55 % settaggio luminosita' | 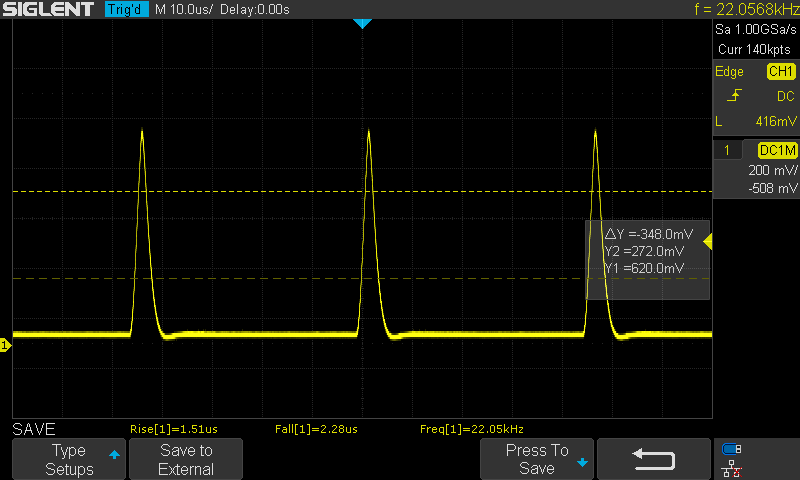 |
Il display sfarfalla a 22130 Hz (Probabilmente a causa dell'uso di PWM) Flickering rilevato ad una luminosita' di 55 % o inferiore. Non dovrebbe verificarsi flickering o PWM sopra questo valore di luminosita'. La frequenza di 22130 Hz è abbastanza alta, quindi la maggioranza degli utenti sensibili al PWM non dovrebbero notare alcun flickering. In confronto: 52 % di tutti i dispositivi testati non utilizza PWM per ridurre la luminosita' del display. Se è rilevato PWM, una media di 7747 (minimo: 5 - massimo: 343500) Hz è stata rilevata. | |||
Cinebench R15 CPU Multi 64 Bit - Surface Pro 2017 i7-7660U cooling fan
Cinebench R15 CPU Multi 64 Bit - Surface Pro 2017 i5-7300U fanless
Cinebench R15 CPU Multi 64 Bit - Switch 5 SW512 i7-7500U Liquid Loop
| PCMark 8 Home Score Accelerated v2 | 4095 punti | |
| PCMark 8 Creative Score Accelerated v2 | 5540 punti | |
| PCMark 8 Work Score Accelerated v2 | 4431 punti | |
| PCMark 10 Score | 3909 punti | |
Aiuto | ||
| Microsoft Surface Pro (2017) i7 Samsung PM971 KUS040202M | Microsoft Surface Pro (2017) i5 Samsung PM971 KUS030202M | Microsoft Surface Pro 4, Core i5, 128GB Samsung MZFLV128 NVMe | Lenovo Ideapad Miix 720-12IKB Samsung SSD PM961 1TB M.2 PCIe 3.0 x4 NVMe (MZVLW1T0) | Lenovo ThinkPad X1 Tablet Gen 2 Samsung PM961 MZVLW256HEHP | Asus Transformer 3 Pro T303UA-GN050T SK Hynix Canvas SC300 512GB M.2 (HFS512G39MND) | Dell Latitude 12 5285 2-in-1 Samsung PM961 MZVLW256HEHP | Acer Switch 5 SW512-52-5819 Intel SSD 600p SSDPEKKW512G7 | |
|---|---|---|---|---|---|---|---|---|
| CrystalDiskMark 3.0 | -19% | -45% | 90% | 22% | -44% | -5% | 7% | |
| Read Seq (MB/s) | 1308 | 723 -45% | 666 -49% | 2408 84% | 1739 33% | 398.9 -70% | 1294 -1% | 1066 -19% |
| Write Seq (MB/s) | 961 | 853 -11% | 154.2 -84% | 1702 77% | 1259 31% | 402 -58% | 865 -10% | 593 -38% |
| Read 512 (MB/s) | 227.5 | 225 -1% | 266.3 17% | 1301 472% | 698 207% | 303.1 33% | 406 78% | 653 187% |
| Write 512 (MB/s) | 792 | 445 -44% | 154.2 -81% | 1288 63% | 869 10% | 320.3 -60% | 589 -26% | 535 -32% |
| Read 4k (MB/s) | 53.6 | 46 -14% | 28.51 -47% | 53.6 0% | 52.3 -2% | 26.11 -51% | 31.75 -41% | 35.92 -33% |
| Write 4k (MB/s) | 136.3 | 125 -8% | 101.5 -26% | 162.2 19% | 120 -12% | 57.7 -58% | 72.2 -47% | 128.3 -6% |
| Read 4k QD32 (MB/s) | 485.6 | 423 -13% | 368.3 -24% | 504 4% | 247.9 -49% | 245.8 -49% | 493.3 2% | 460.6 -5% |
| Write 4k QD32 (MB/s) | 421.5 | 373 -12% | 153.6 -64% | 420.8 0% | 259 -39% | 253.8 -40% | 434.5 3% | 425.4 1% |

| 3DMark 06 Standard Score | 15071 punti | |
| 3DMark 11 Performance | 2664 punti | |
| 3DMark Cloud Gate Standard Score | 8067 punti | |
| 3DMark Fire Strike Score | 1310 punti | |
| 3DMark Time Spy Score | 513 punti | |
Aiuto | ||
| The Witcher 3 - 1024x768 Low Graphics & Postprocessing | |
| Asus Zenbook UX3430UQ-GV012T | |
| Lenovo Ideapad 310-15ISK | |
| Microsoft Surface Pro (2017) i7 | |
| Microsoft Surface Pro (2017) i5 | |
| Rise of the Tomb Raider - 1024x768 Lowest Preset | |
| Microsoft Surface Pro (2017) i7 | |
| Asus X302UV-FN016T | |
| Asus Transformer 3 Pro T303UA-GN050T | |
| Acer Switch 5 SW512-52-5819 | |
| Lenovo Ideapad Miix 720-12IKB | |
| Microsoft Surface Pro (2017) i5 | |
| Deus Ex Mankind Divided - 1280x720 Low Preset AF:1x | |
| Microsoft Surface Pro (2017) i7 | |
| Battlefield 1 - 1280x720 Low Preset | |
| Microsoft Surface Pro (2017) i7 | |
| Huawei MateBook X | |
| Rocket League - 1920x1080 High Quality AA:High FX | |
| Microsoft Surface Pro (2017) i7 | |
| Acer Switch 5 SW512-52-5819 | |
| Warhammer 40.000: Dawn of War III - 1280x720 Minimum / Off (100 % Gameplay Resolution) | |
| Acer TravelMate P658-G2-MG-7327 | |
| Microsoft Surface Pro (2017) i7 | |
| For Honor - 1280x720 Low Preset | |
| Microsoft Surface Pro (2017) i7 | |
| Huawei MateBook X | |
| Farming Simulator 17 - 1920x1080 High Preset AA:2xMS AF:2x | |
| Asus Zenbook UX3430UQ-GV012T | |
| Microsoft Surface Pro (2017) i7 | |
| Huawei MateBook X | |
| The Division - 1280x720 Low Preset AF:1x | |
| Asus X302UV-FN016T | |
| Microsoft Surface Pro (2017) i7 | |
| Rainbow Six Siege - 1366x768 Medium Preset AA:T AF:2x | |
| Asus X302UV-FN016T | |
| Microsoft Surface Pro (2017) i7 | |
| Thief - 1024x768 Very Low Preset | |
| Lenovo Ideapad Miix 720-12IKB | |
| Microsoft Surface Pro (2017) i5 | |
| Diablo III - 1366x768 High AA:on | |
| Asus Zenbook UX3430UQ-GV012T | |
| Asus X302UV-FN016T | |
| basso | medio | alto | ultra | |
|---|---|---|---|---|
| Sims 4 (2014) | 20.8 | |||
| GTA V (2015) | 56.7 | 28.9 | 11.8 | |
| The Witcher 3 (2015) | 21.7 | |||
| Dota 2 Reborn (2015) | 92 | 63.7 | 29.5 | 19.8 |
| Rainbow Six Siege (2015) | 45 (windowed) | 30 (windowed) | 16 (windowed) | |
| Rise of the Tomb Raider (2016) | 23.5 | 16.7 | 9.1 | |
| Far Cry Primal (2016) | 28 | 13 | ||
| The Division (2016) | 24.9 | |||
| Overwatch (2016) | 63.3 | 41 | 15.9 | |
| Deus Ex Mankind Divided (2016) | 20.2 | |||
| Battlefield 1 (2016) | 26.6 | 19.6 | 9.2 | |
| Farming Simulator 17 (2016) | 121 | 91 | 31.6 | 17.8 |
| For Honor (2017) | 33.5 | 12.7 | ||
| Ghost Recon Wildlands (2017) | 16 | |||
| Mass Effect Andromeda (2017) | 20.4 | |||
| Warhammer 40.000: Dawn of War III (2017) | 33.8 | |||
| Prey (2017) | 45.4 | 18.1 | ||
| Rocket League (2017) | 103 | 42.6 | 29.3 | |
| Dirt 4 (2017) | 27 |
Rumorosità
| Idle |
| 29.6 / 29.6 / 29.6 dB(A) |
| Sotto carico |
| 33.4 / 34.1 dB(A) |
 | ||
30 dB silenzioso 40 dB(A) udibile 50 dB(A) rumoroso |
||
min: | ||
| Microsoft Surface Pro (2017) i7 Iris Plus Graphics 640, i7-7660U, Samsung PM971 KUS040202M | Microsoft Surface Pro 4, Core i5, 128GB HD Graphics 520, 6300U, Samsung MZFLV128 NVMe | Lenovo Ideapad Miix 720-12IKB HD Graphics 620, i7-7500U, Samsung SSD PM961 1TB M.2 PCIe 3.0 x4 NVMe (MZVLW1T0) | Asus Transformer 3 Pro T303UA-GN050T HD Graphics 520, 6500U, SK Hynix Canvas SC300 512GB M.2 (HFS512G39MND) | Dell Latitude 12 5285 2-in-1 HD Graphics 620, i7-7600U, Samsung PM961 MZVLW256HEHP | Toshiba Portege X30-D (PT274U-01N001) HD Graphics 620, i7-7600U, Samsung PM961 MZVLW256HEHP | |
|---|---|---|---|---|---|---|
| Emissions | ||||||
| Fan Noise (dB(A)) | 36.3 | 37.1 | 38.4 | |||
| Noise | -12% | -6% | -6% | 5% | 1% | |
| off /ambiente * (dB) | 29.6 | 30.4 -3% | 30.7 -4% | 28.2 5% | 28.4 4% | |
| Idle Minimum * (dB) | 29.6 | 31.5 -6% | 30.4 -3% | 30.7 -4% | 28.2 5% | 28.4 4% |
| Idle Average * (dB) | 29.6 | 31.5 -6% | 32.4 -9% | 30.7 -4% | 28.2 5% | 28.4 4% |
| Idle Maximum * (dB) | 29.6 | 31.5 -6% | 32.4 -9% | 30.7 -4% | 28.2 5% | 28.4 4% |
| Load Average * (dB) | 33.4 | 40.5 -21% | 36 -8% | 37 -11% | 30.4 9% | 33.2 1% |
| Witcher 3 ultra * (dB) | 33.4 | |||||
| Load Maximum * (dB) | 34.1 | 40.7 -19% | 36.3 -6% | 37.1 -9% | 34 -0% | 37.9 -11% |
| Media totale (Programma / Settaggio) | -12% /
-12% | -6% /
-6% | -6% /
-6% | 5% /
5% | 1% /
1% |
* ... Meglio usare valori piccoli
(±) La temperatura massima sul lato superiore è di 42 °C / 108 F, rispetto alla media di 35.4 °C / 96 F, che varia da 19.6 a 60 °C per questa classe Convertible.
(±) Il lato inferiore si riscalda fino ad un massimo di 42 °C / 108 F, rispetto alla media di 36.9 °C / 98 F
(+) In idle, la temperatura media del lato superiore è di 28.6 °C / 83 F, rispetto alla media deld ispositivo di 30.3 °C / 87 F.
(±) I poggiapolsi e il touchpad possono diventare molto caldi al tatto con un massimo di 38 °C / 100.4 F.
(-) La temperatura media della zona del palmo della mano di dispositivi simili e'stata di 28 °C / 82.4 F (-10 °C / -18 F).
| Off / Standby | |
| Idle | |
| Sotto carico |
|
Leggenda:
min: | |
| Microsoft Surface Pro (2017) i7 i7-7660U, Iris Plus Graphics 640, Samsung PM971 KUS040202M, IPS, 2736x1824, 12.3" | Microsoft Surface Pro (2017) i5 i5-7300U, HD Graphics 620, Samsung PM971 KUS030202M, IPS, 2736x1824, 12.3" | Microsoft Surface Pro 4, Core i5, 128GB 6300U, HD Graphics 520, Samsung MZFLV128 NVMe, IPS, 2736x1824, 12.3" | Lenovo Ideapad Miix 720-12IKB i7-7500U, HD Graphics 620, Samsung SSD PM961 1TB M.2 PCIe 3.0 x4 NVMe (MZVLW1T0), IPS, 2880x1920, 12" | Asus Transformer 3 Pro T303UA-GN050T 6500U, HD Graphics 520, SK Hynix Canvas SC300 512GB M.2 (HFS512G39MND), IPS, 2880x1920, 12.6" | Dell Latitude 12 5285 2-in-1 i7-7600U, HD Graphics 620, Samsung PM961 MZVLW256HEHP, IPS, 1920x1280, 12.3" | Acer Switch 5 SW512-52-5819 i7-7500U, HD Graphics 620, Intel SSD 600p SSDPEKKW512G7, IPS, 2160x1440, 12" | Huawei MateBook X i5-7200U, HD Graphics 620, LITEON CB1-SD256, , 2160x1440, 13.3" | |
|---|---|---|---|---|---|---|---|---|
| Power Consumption | 27% | 24% | 24% | -3% | 24% | 23% | -3% | |
| Idle Minimum * (Watt) | 4.2 | 3.6 14% | 4.4 -5% | 3.5 17% | 6.7 -60% | 2.85 32% | 3.86 8% | 4.6 -10% |
| Idle Average * (Watt) | 10.1 | 8.1 20% | 9 11% | 7.2 29% | 10.3 -2% | 6.76 33% | 6.4 37% | 11 -9% |
| Idle Maximum * (Watt) | 14 | 8.7 38% | 10.7 24% | 7.9 44% | 13.5 4% | 6.91 51% | 7.17 49% | 12 14% |
| Load Average * (Watt) | 37.4 | 25.5 32% | 19.6 48% | 29.6 21% | 26 30% | 32.88 12% | 30.5 18% | 39.5 -6% |
| Witcher 3 ultra * (Watt) | 38.1 | |||||||
| Load Maximum * (Watt) | 34 | 23.5 31% | 19.9 41% | 30.8 9% | 28.8 15% | 37.41 -10% | 32.4 5% | 34.6 -2% |
* ... Meglio usare valori piccoli
| Microsoft Surface Pro (2017) i7 i7-7660U, Iris Plus Graphics 640, 45 Wh | Microsoft Surface Pro (2017) i5 i5-7300U, HD Graphics 620, 45 Wh | Microsoft Surface Pro 4, Core i5, 128GB 6300U, HD Graphics 520, 38 Wh | Lenovo Ideapad Miix 720-12IKB i7-7500U, HD Graphics 620, 41 Wh | Lenovo ThinkPad X1 Tablet Gen 2 i5-7Y54, HD Graphics 615, 37 Wh | Asus Transformer 3 Pro T303UA-GN050T 6500U, HD Graphics 520, 39 Wh | Dell Latitude 12 5285 2-in-1 i7-7600U, HD Graphics 620, 42 Wh | Acer Switch 5 SW512-52-5819 i7-7500U, HD Graphics 620, Wh | Huawei MateBook X i5-7200U, HD Graphics 620, 40 Wh | |
|---|---|---|---|---|---|---|---|---|---|
| Autonomia della batteria | 49% | -7% | -15% | 3% | -44% | -3% | -22% | 5% | |
| H.264 (h) | 10.2 | 3.4 -67% | |||||||
| WiFi v1.3 (h) | 8.2 | 12.4 51% | 7.1 -13% | 5.8 -29% | 7.4 -10% | 3.7 -55% | 8.1 -1% | 5.9 -28% | 5.6 -32% |
| Witcher 3 ultra (h) | 1.9 | ||||||||
| Load (h) | 1.9 | 2.8 47% | 1.9 0% | 1.9 0% | 2.2 16% | 1.7 -11% | 1.8 -5% | 1.6 -16% | 2.7 42% |
| Reader / Idle (h) | 17.6 | 15 | 11.9 | 11 | 7.1 | 17.9 | 11.9 | 8.5 |
Pro
Contro
Con il i7 2017 Surface Pro, Microsoft ha creato un tablet convertibile che mantiene molte, ma non tutte le promesse. Costruzione, display ed autonomia, sono senza dubbio, allo stato dell'arte. I concorrenti, come l'Acer Switch 5, non reggono il confronto.
Se lo guardiamo come possibile laptop replacement, notiamo throttling simile alla versione (fanless) i5. Non va molto male (-17% nel primo round dell'i7 vs. -33% dell'i5). Il throttling si fa notare tuttavia nei PCMarks: il Surface Pro i7 (2017) non è in testa al gruppo dei convertibili Acer e Dell superano il Surface Pro.
Ma abbiamo dato al Surface Pro i7 un buon punteggio del 90%, per le performance (il problema resta il throttling) che sono uno degli aspetti che consideriamo. La rumorosità è bassa grazie al sistema di raffreddamento e la ventola spenta in idle. Il dispositivo ha casse buone così come i dispositivi di input, e la Type Cover, è estremamente utile per un convertibile.
Alternative
Il Dell Latitude 12 5285 offre performance simili con meno throttling (-9%). Lo schermo è lo stesso come qualità (luminosità, contrasto, distribuzione luminosità, copertura colore), ma ha solo un Full HD. Ma il Dell si scalda molto.
Lo stesso vale per l'Acer Switch 5 SW512-52, le cui performance scendono solo del 9% e quindi non può essere considerato throttling. Ma l'autonomia è nettamente inferiore con sei ore. Lo schermo non regge il confronto con il Surface Pro, né quello del Latitude 12 5285, nonostante la risoluzione 2160x1440 pixels.
Se volete autonomia maggiore di 10 ore, dovrete considerare la versione i5 o anche la versione Core M del nuovo Surface Pro 2017. Se il SoC non gestisce carichi costanti, perché non prendere un modello più economico Core M? Probabilmente supererà le 12,5 ore in Wi-Fi del modello i5. Attualmente stiamo testando il dispositivo ed aggiorneremo i risultati.
Nota: si tratta di una recensione breve, con alcune sezioni non tradotte, per la versione integrale in inglese guardate qui.
Microsoft Surface Pro (2017) i7
- 07/21/2017 v6 (old)
Sebastian Jentsch