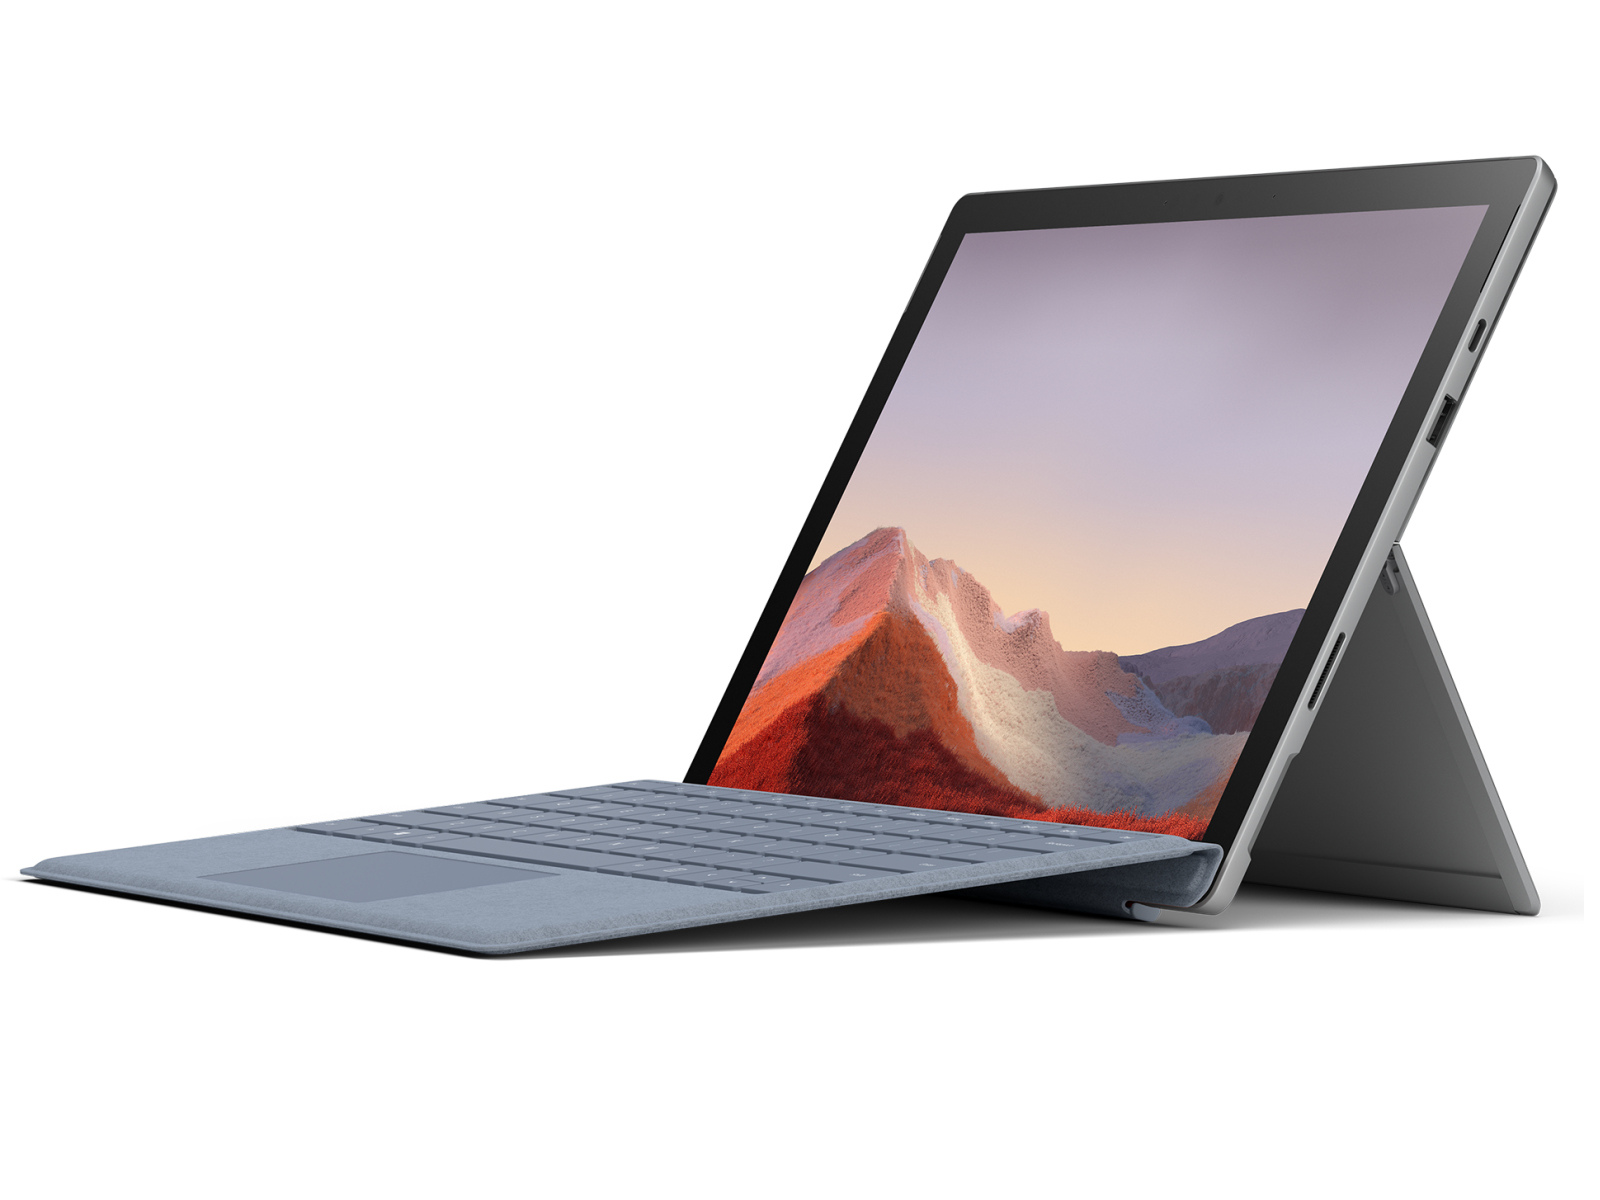
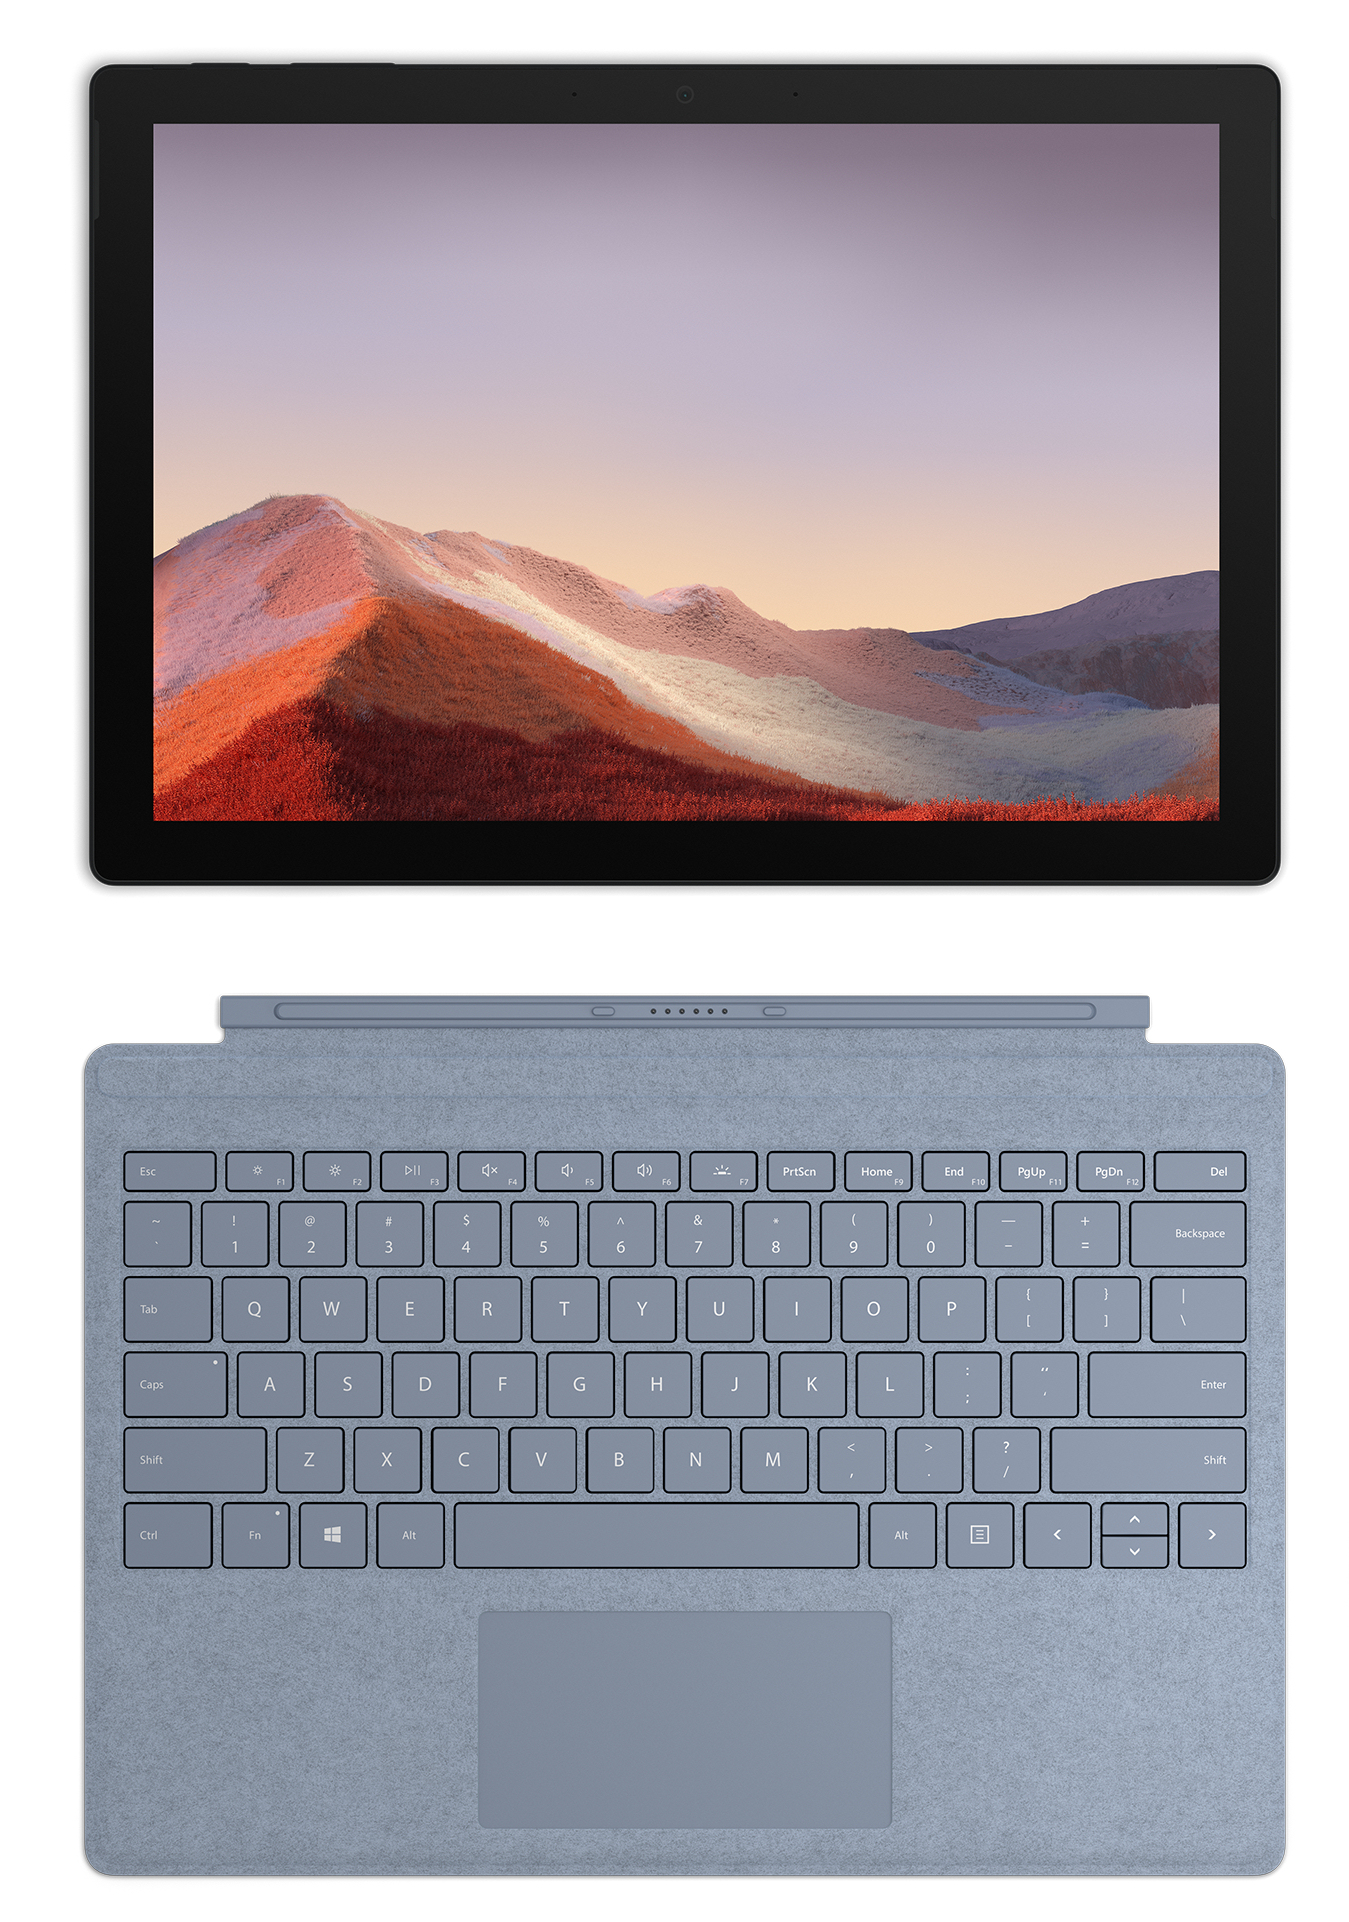
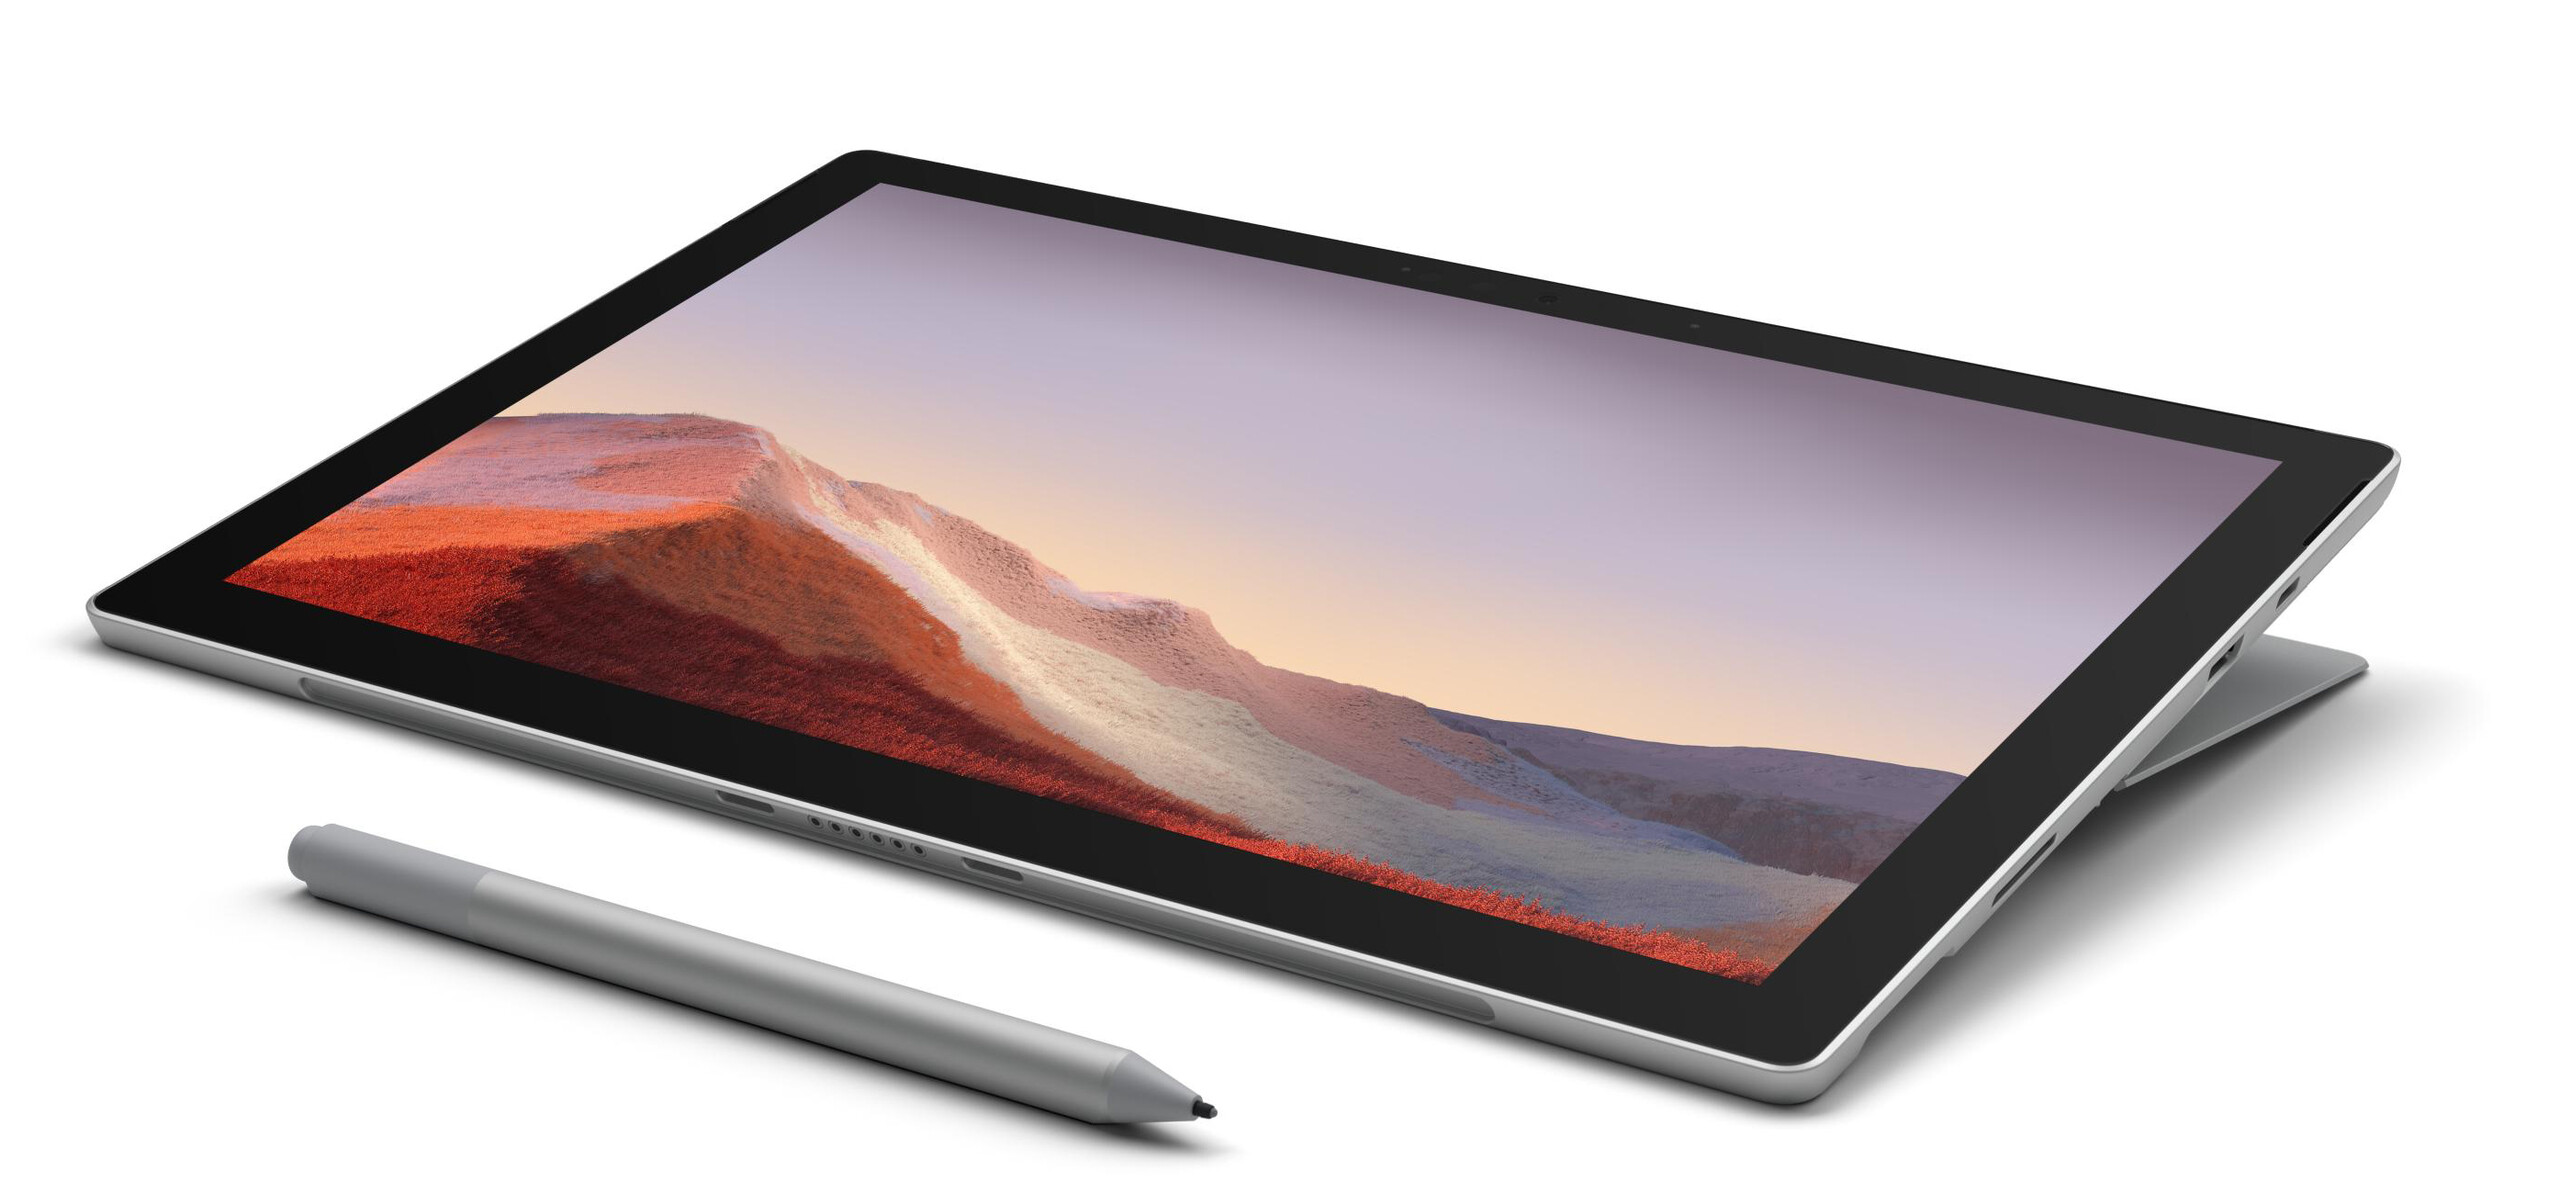
Recensione del Microsoft Surface Pro 7 Plus: Tiger Lake fornisce un aumento delle prestazioni

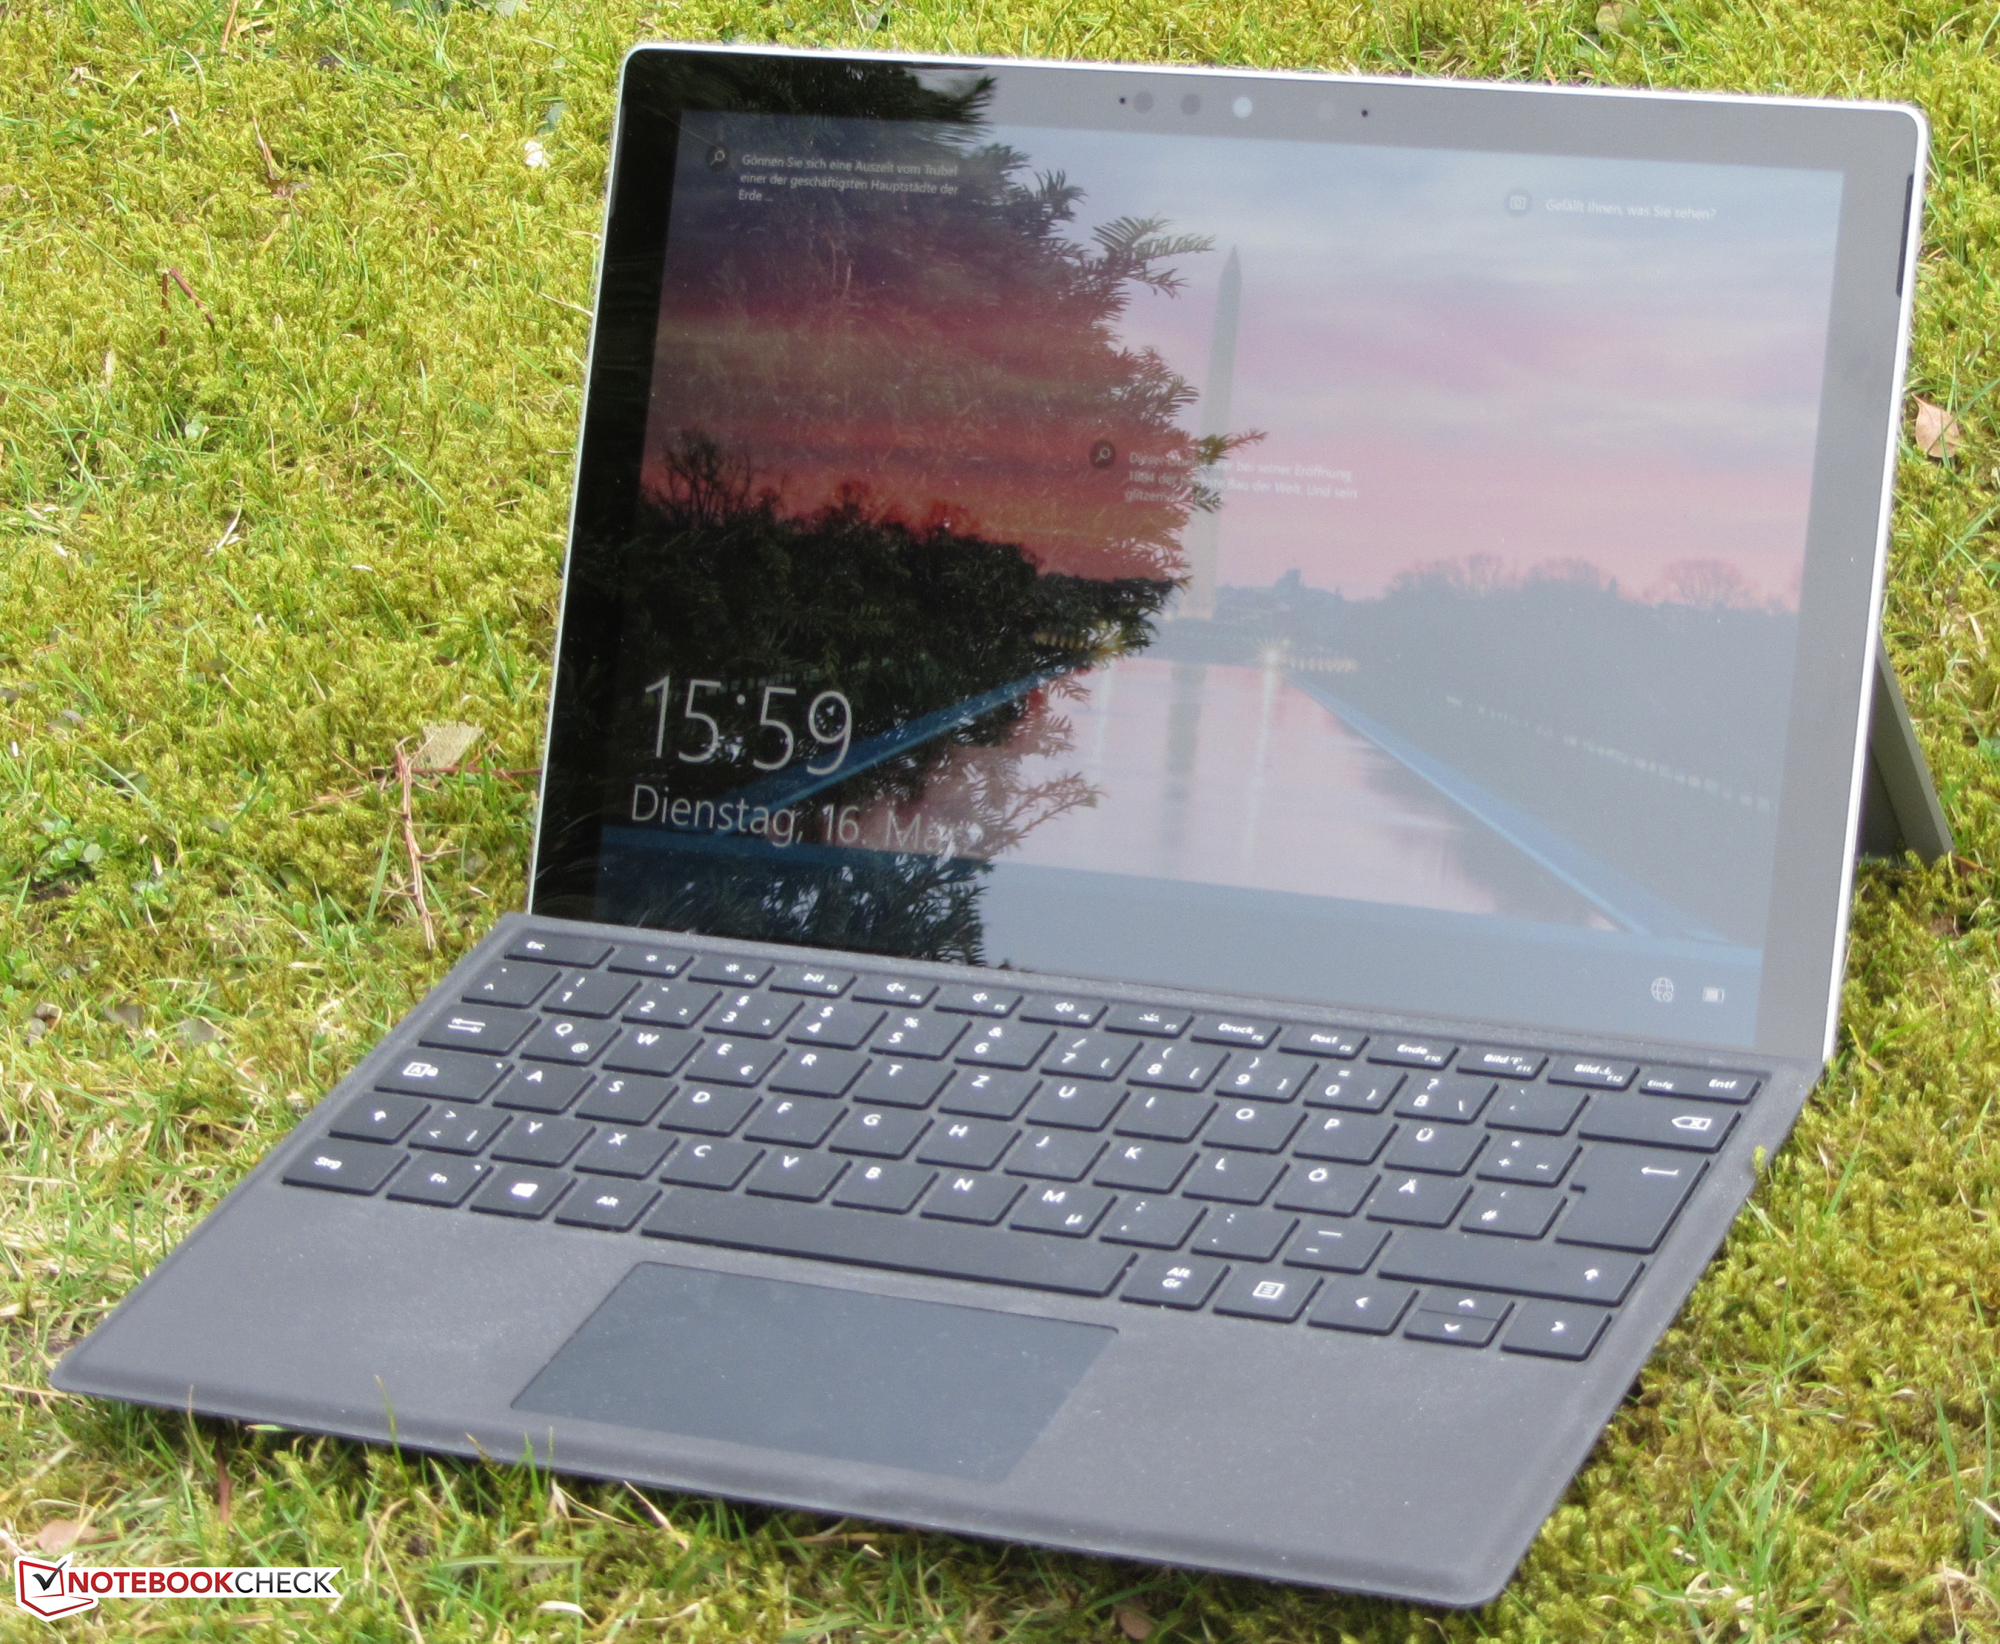
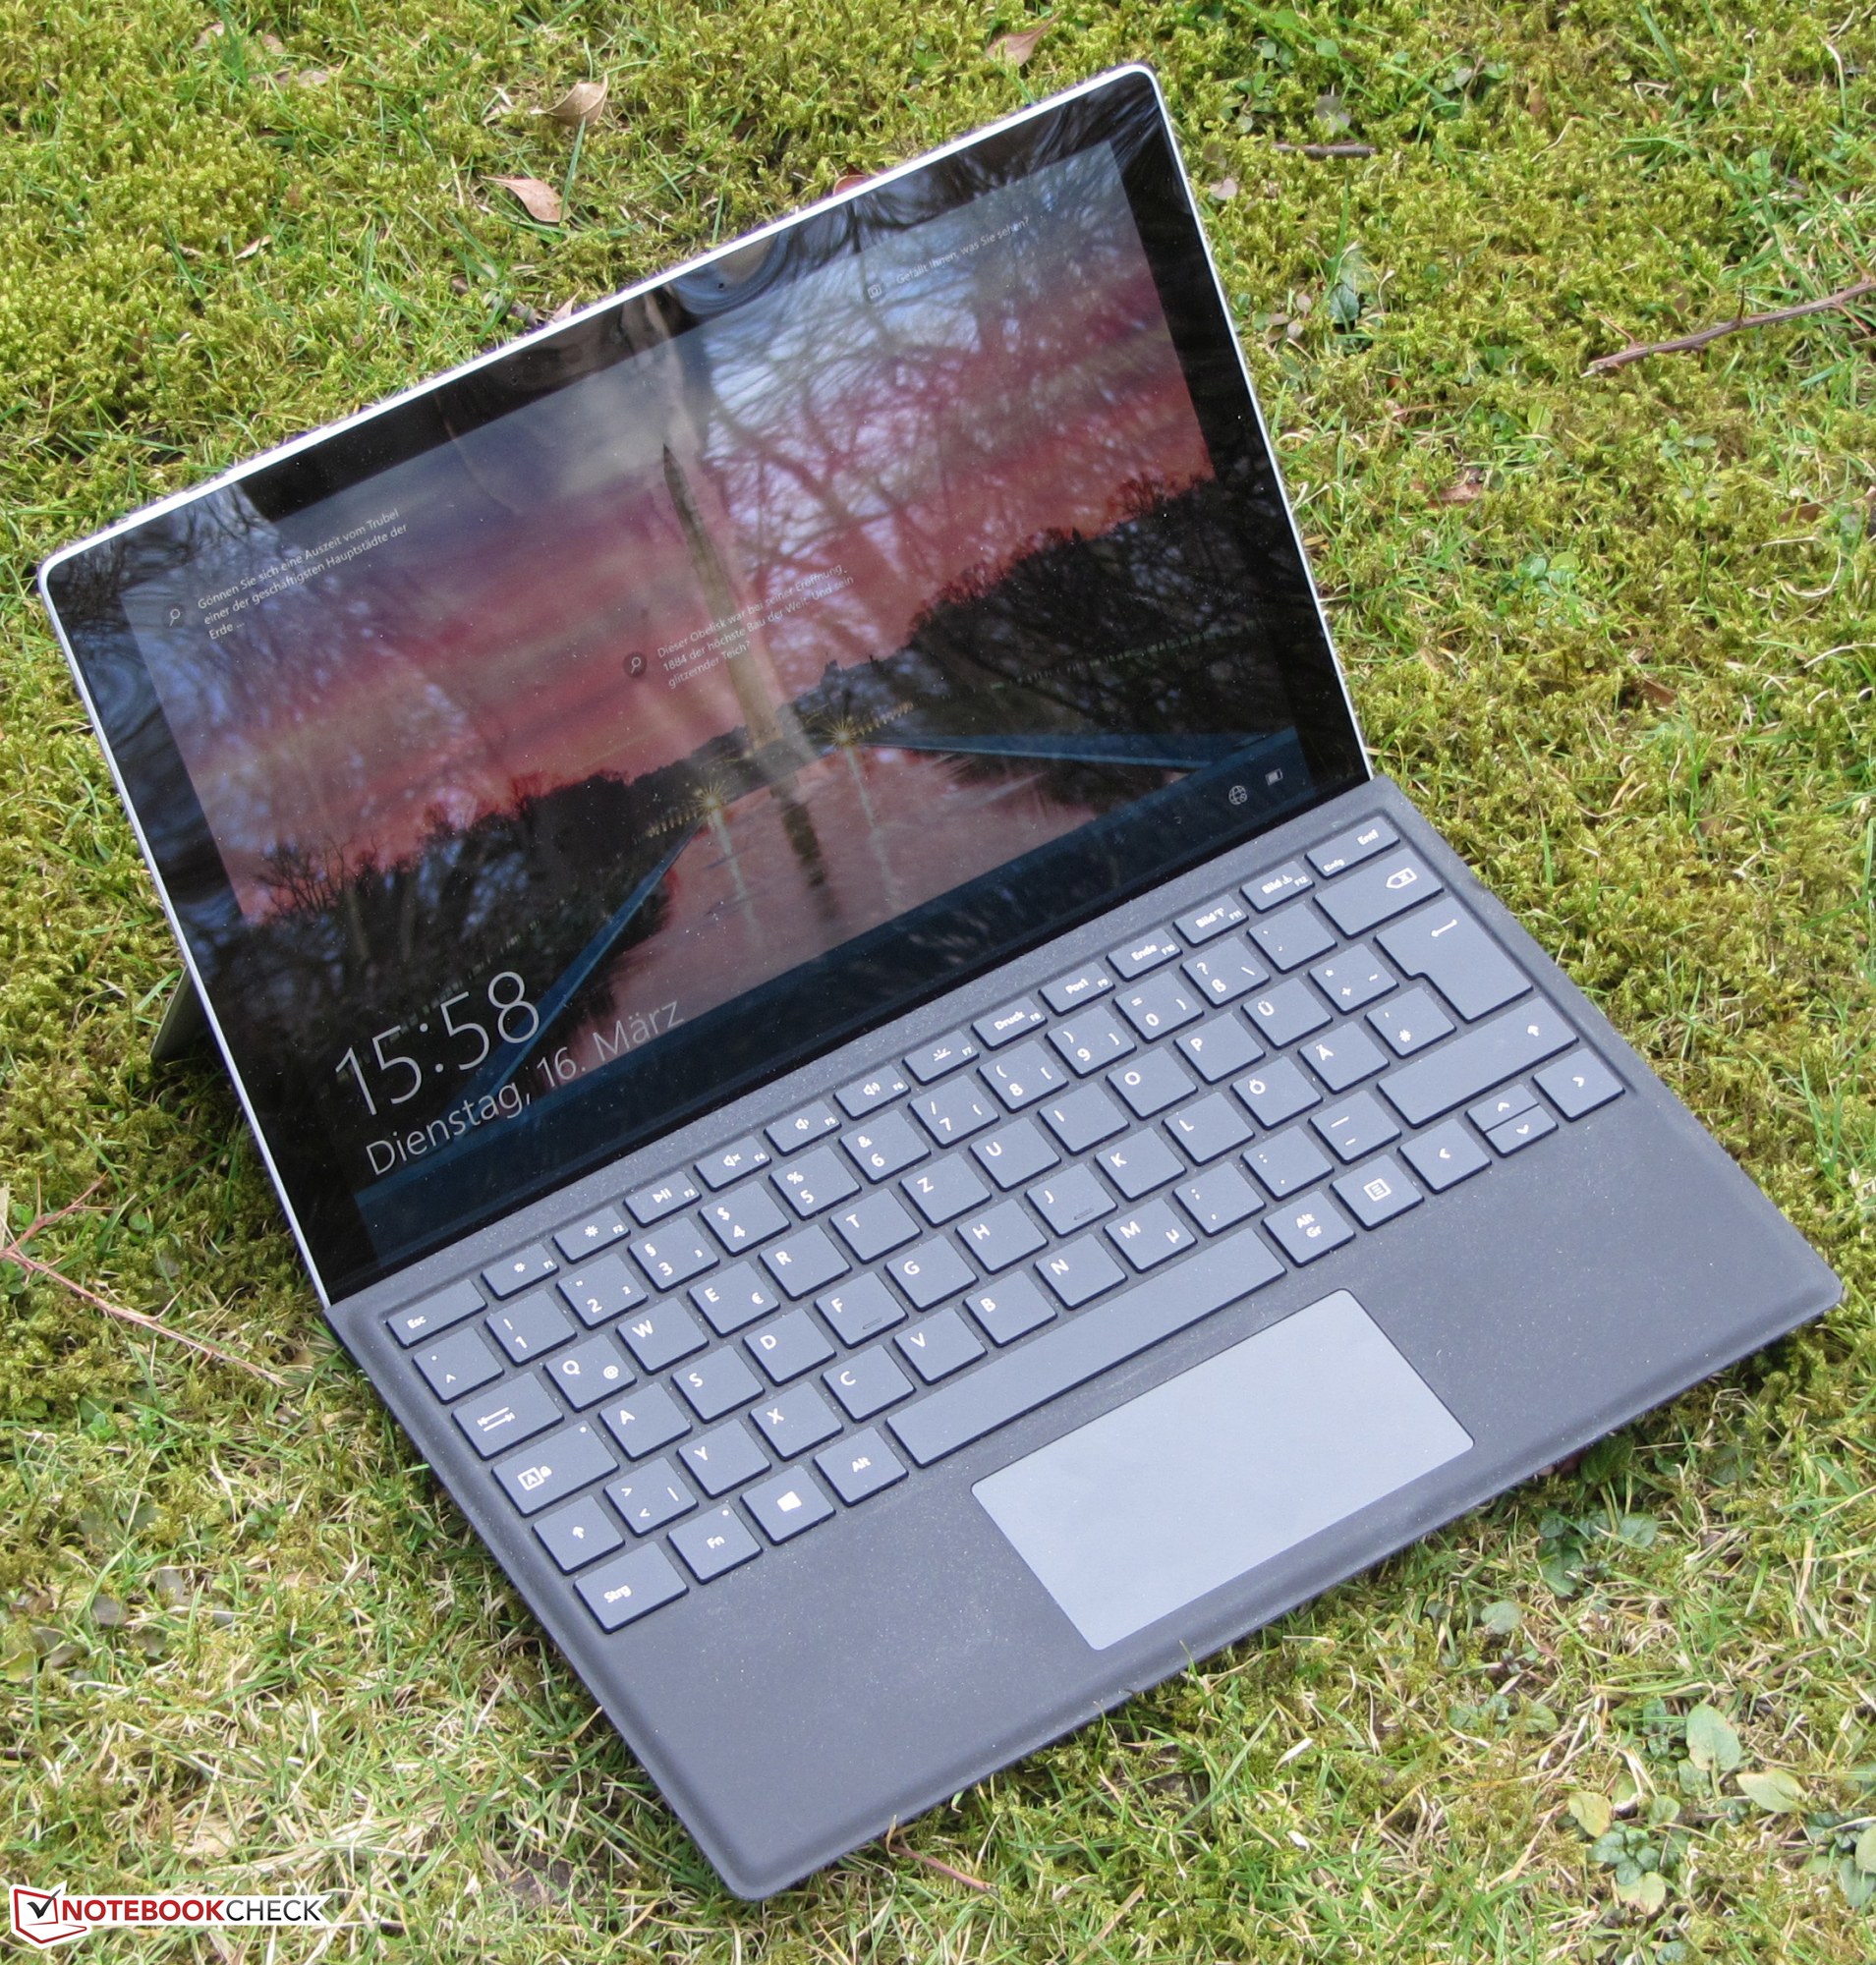
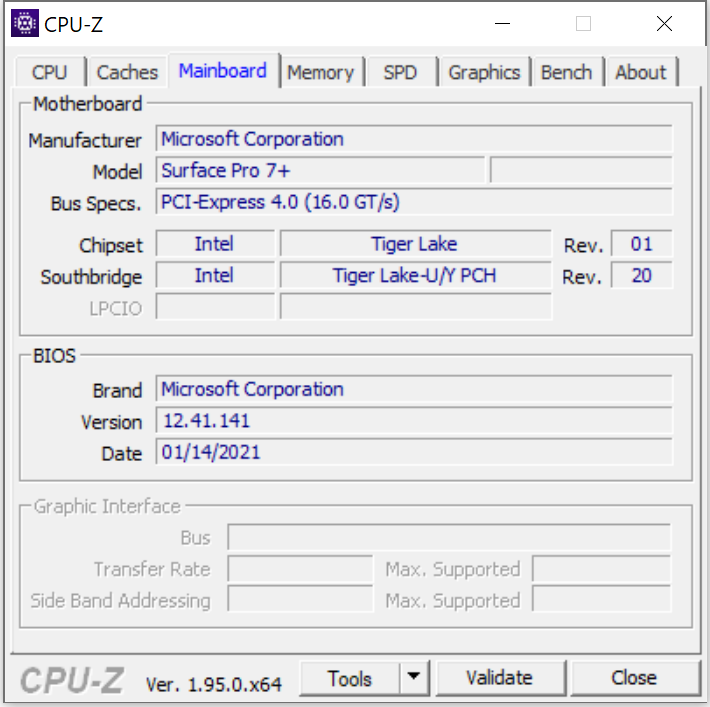
Il Surface Pro 7 è disponibile dal 2019. Pertanto, Microsoft ritiene che sia giunto il momento di introdurre alcuni aggiornamenti. All'interno, ora ci sono processori Tiger Lake invece di Ice Lake, l'SSD può essere sostituito, la capacità della batteria è aumentata un po' e un modem LTE è disponibile opzionalmente - quest'ultimo solo in combinazione con un processore Core i5. Esternamente, praticamente nulla è cambiato rispetto ai normali modelli del Surface Pro 7. Il Surface Pro 7 Plus compete con il Dell Latitude 12 7210 e ilLenovo Yoga Duet 7.
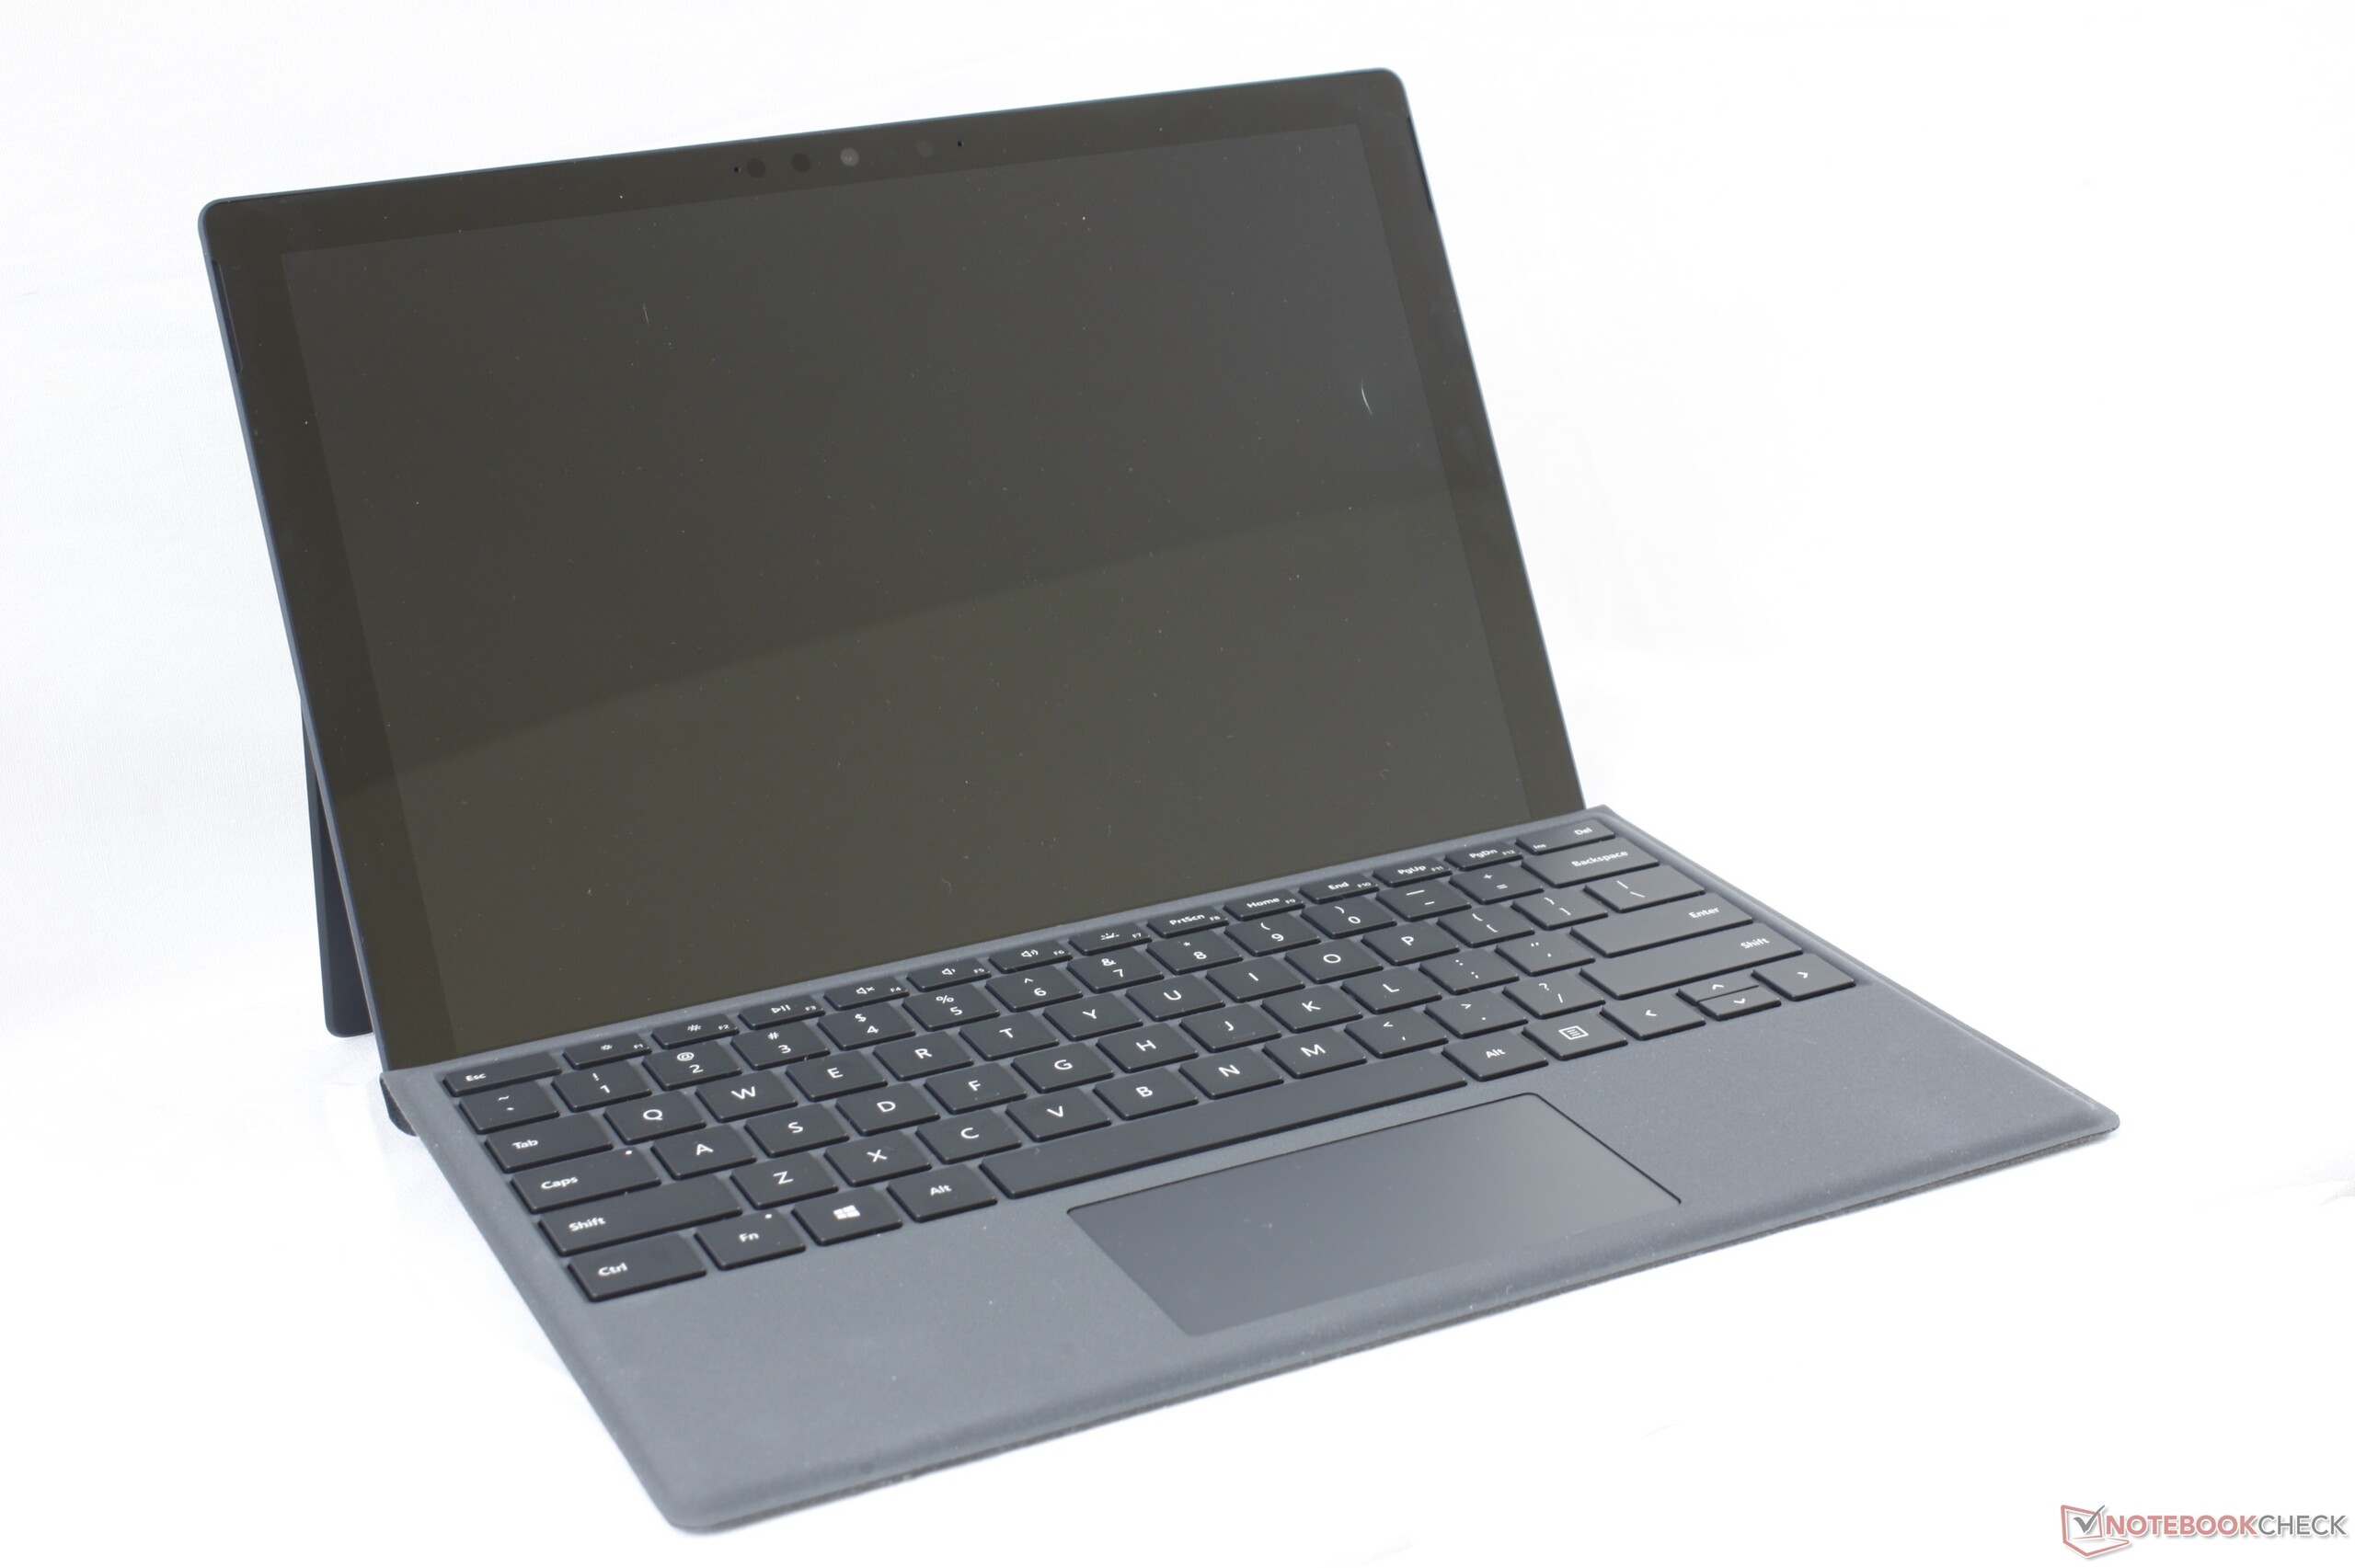
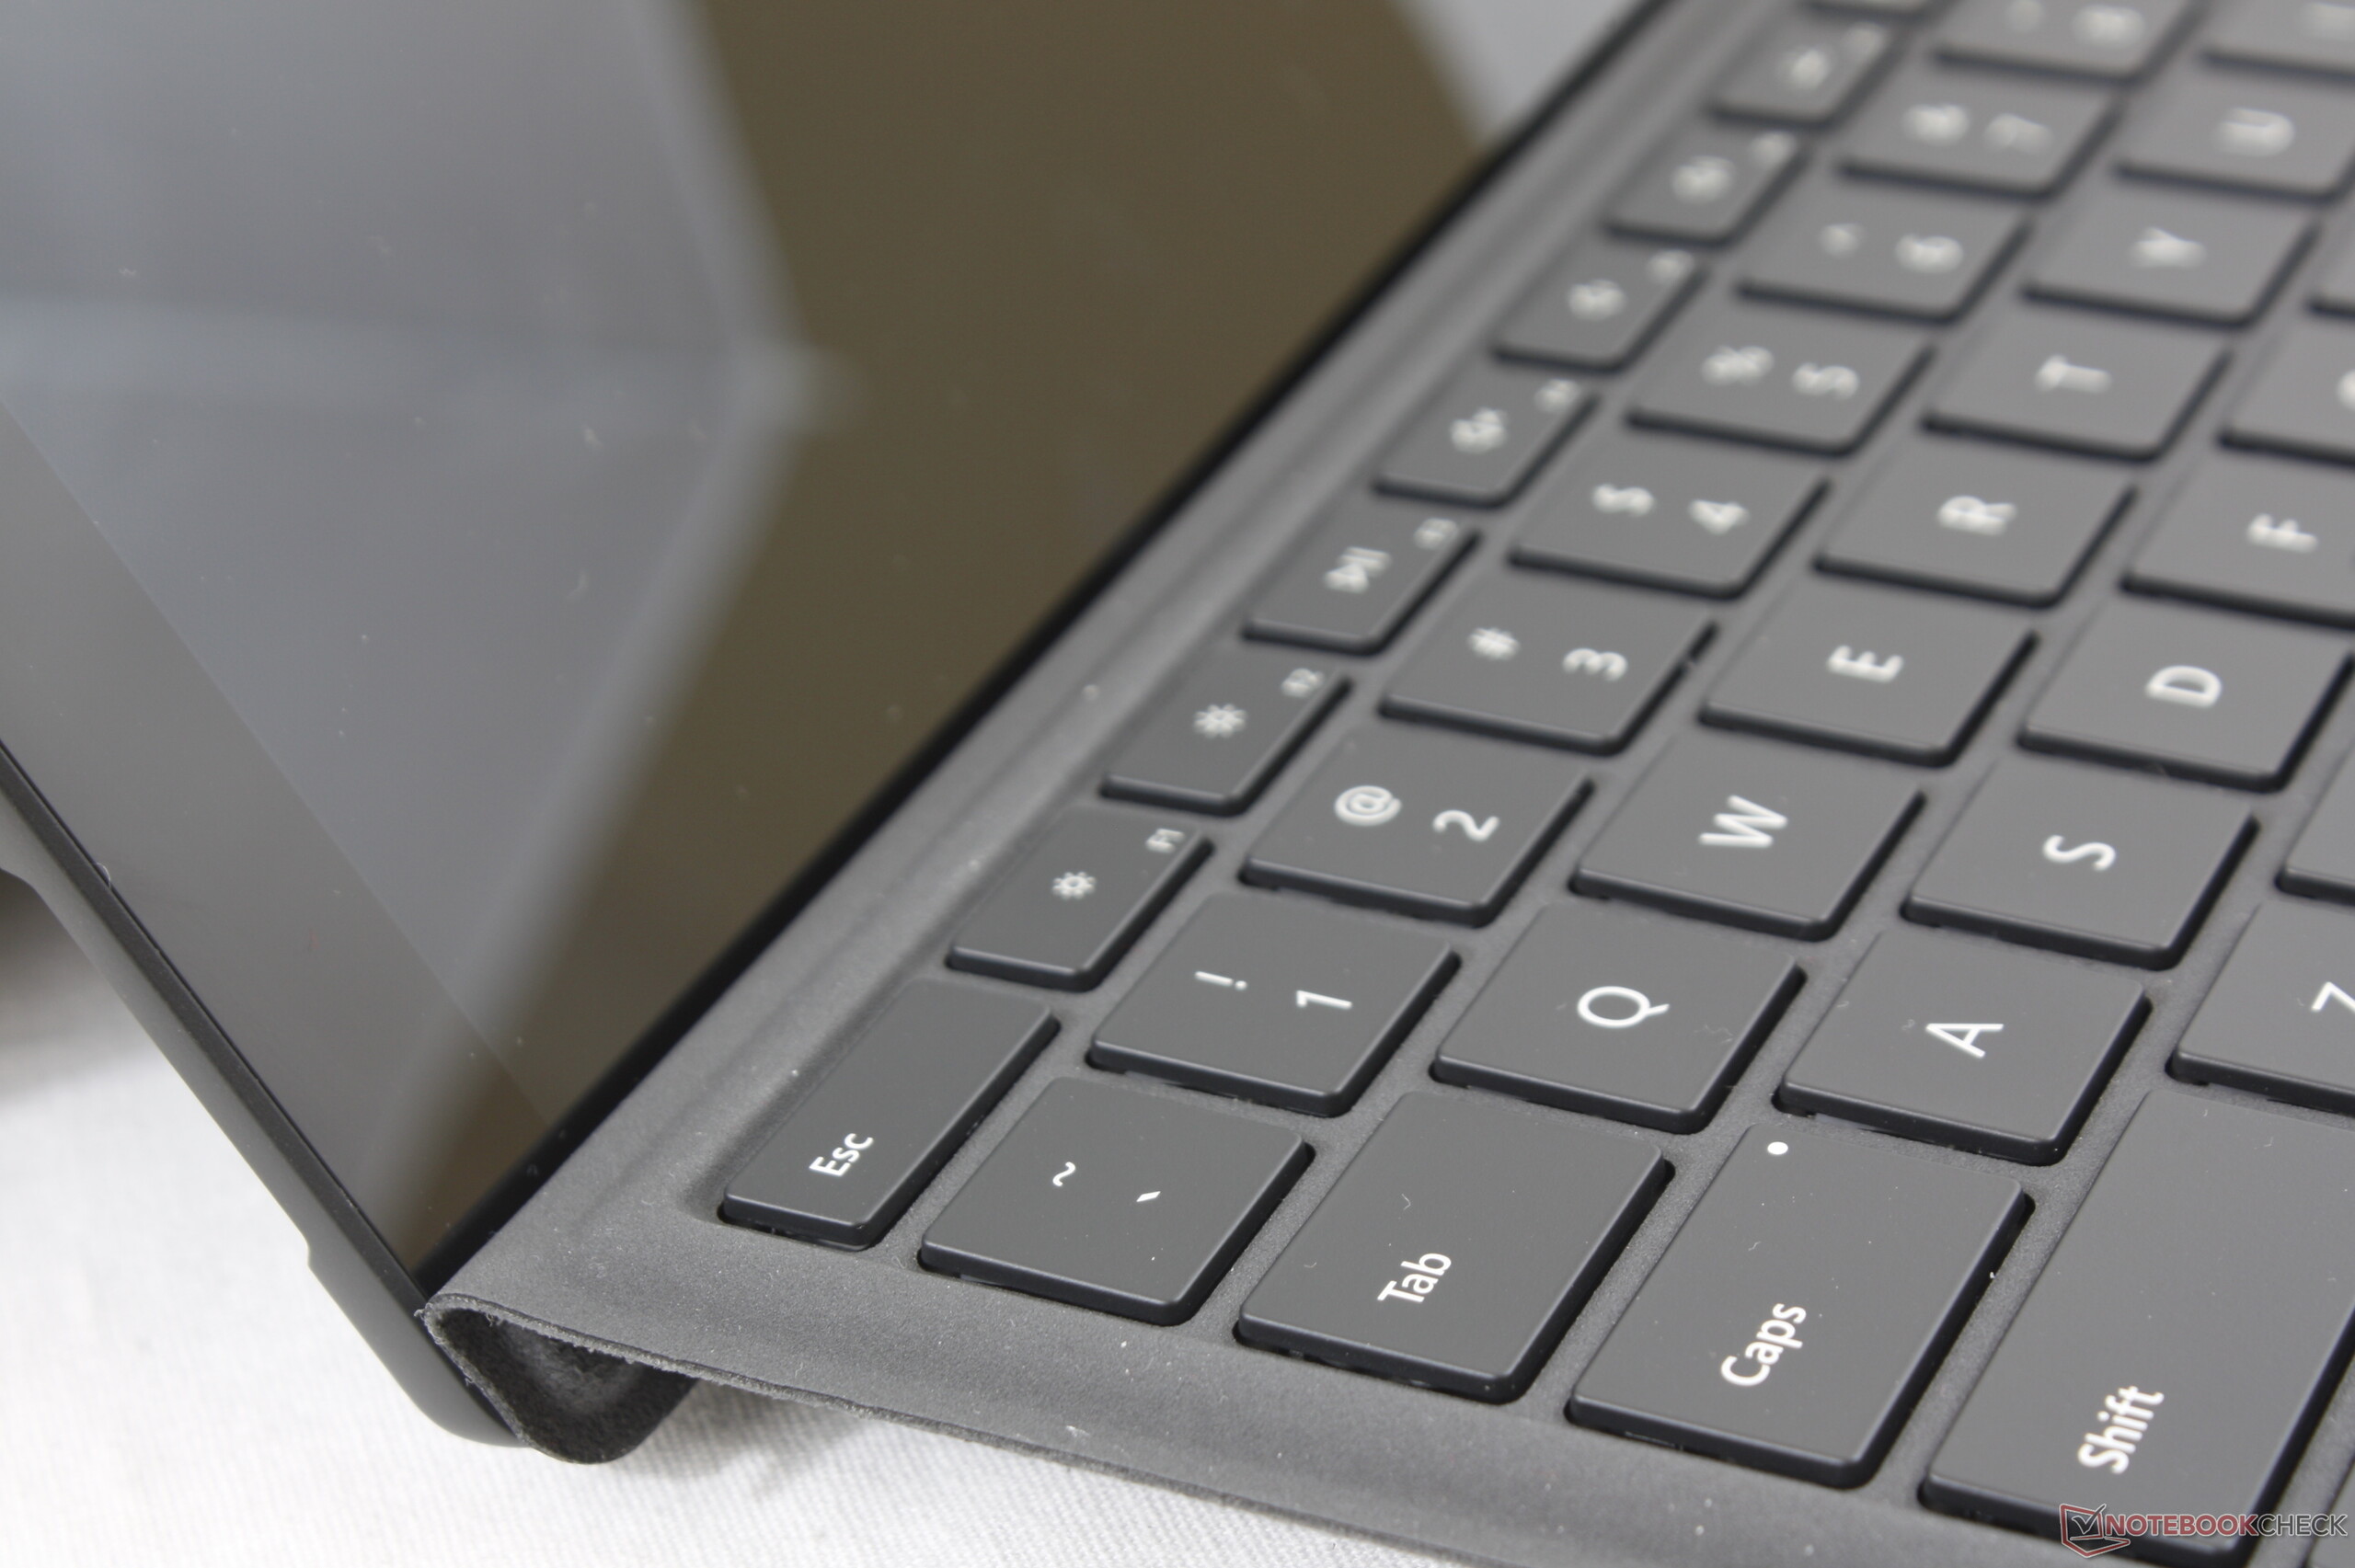
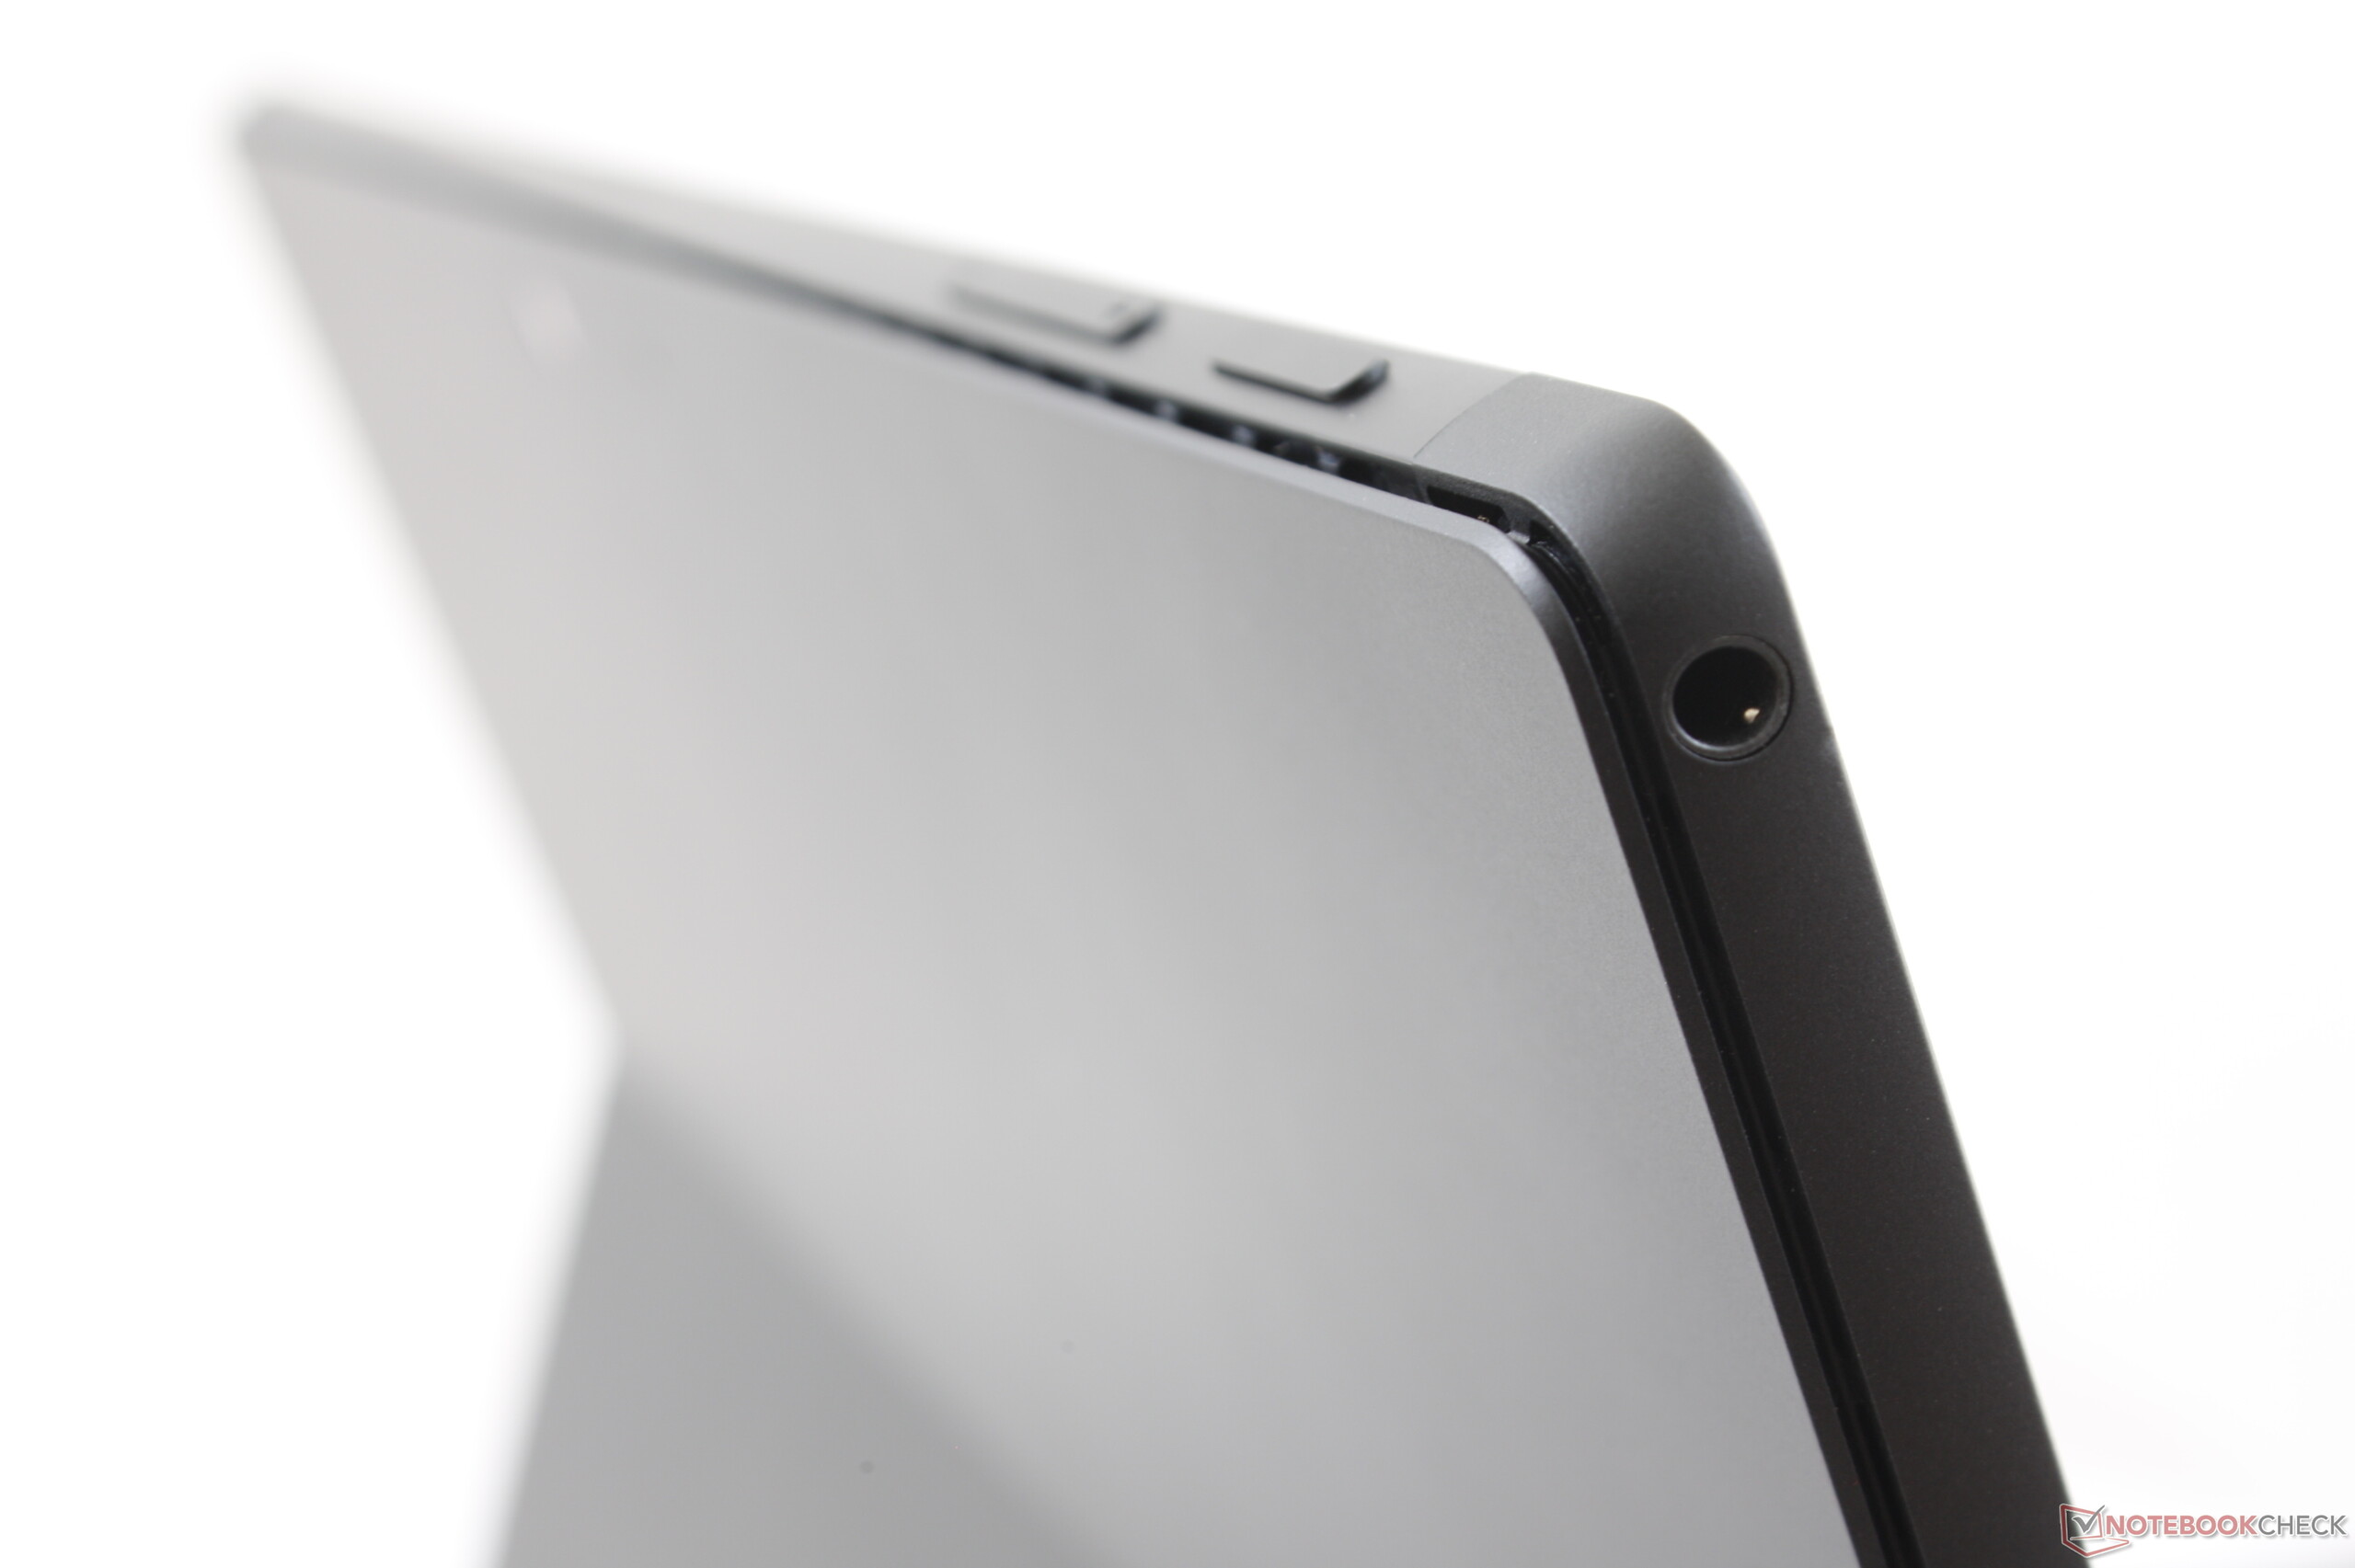
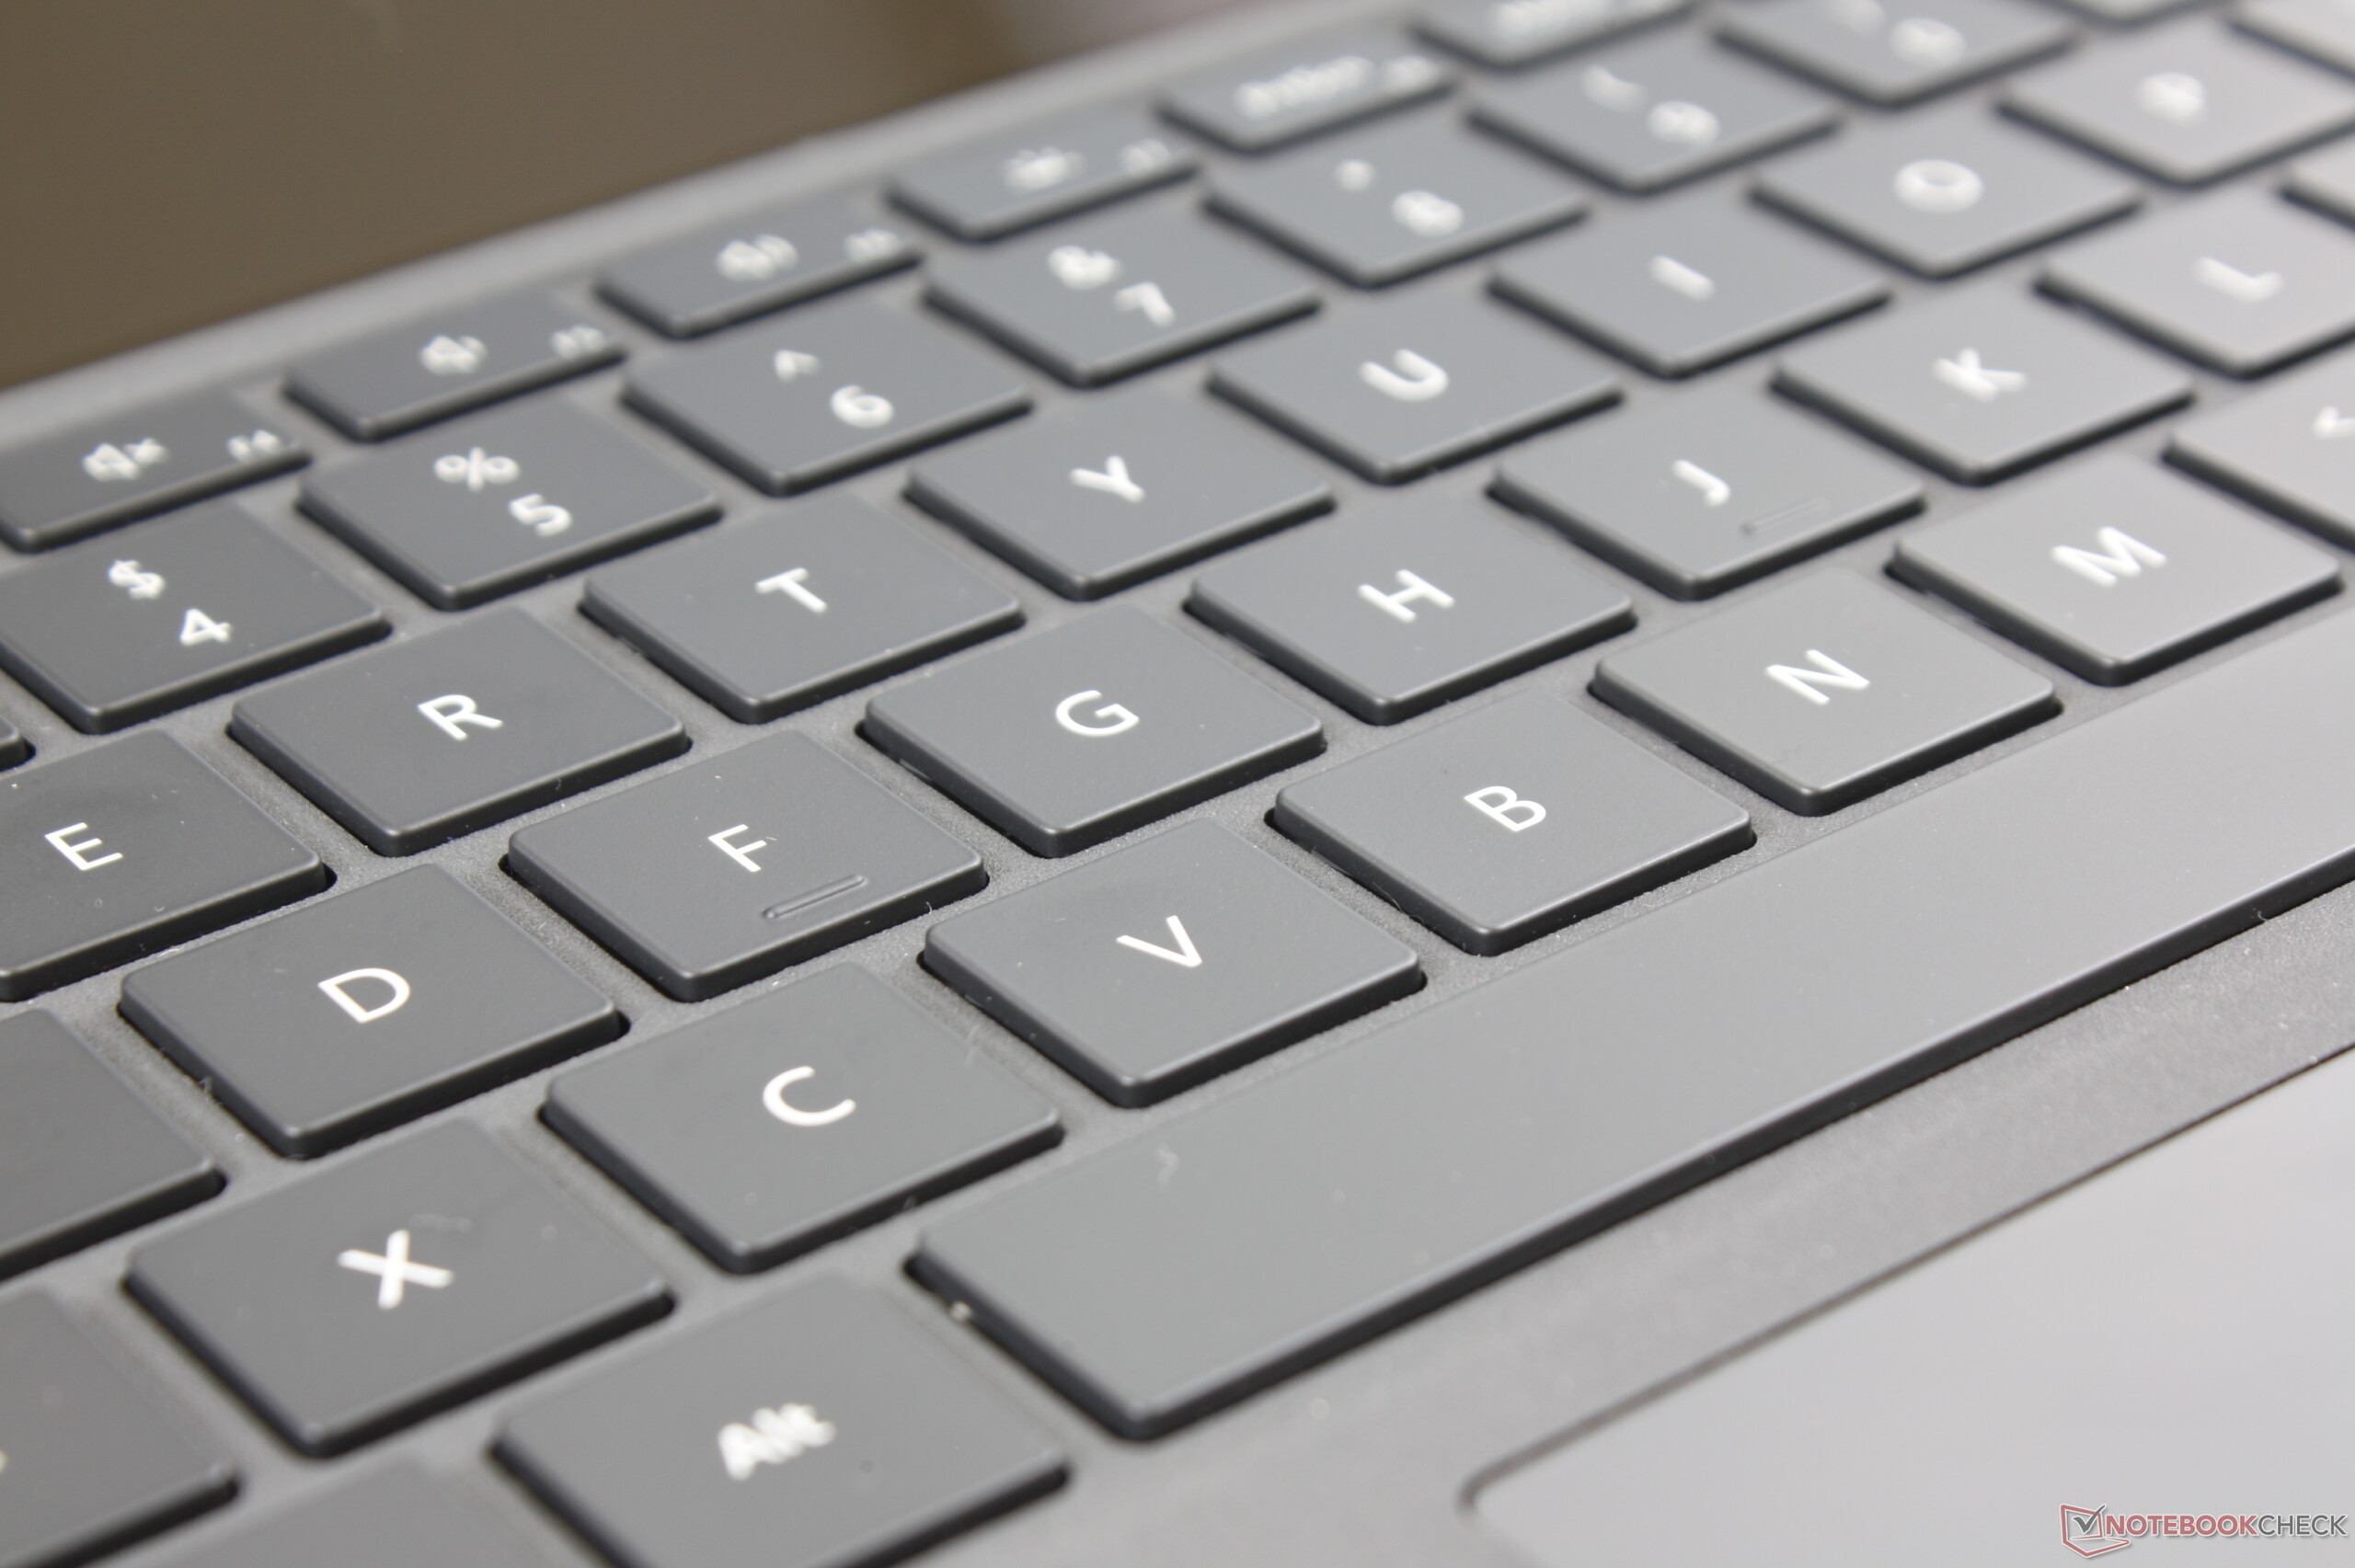
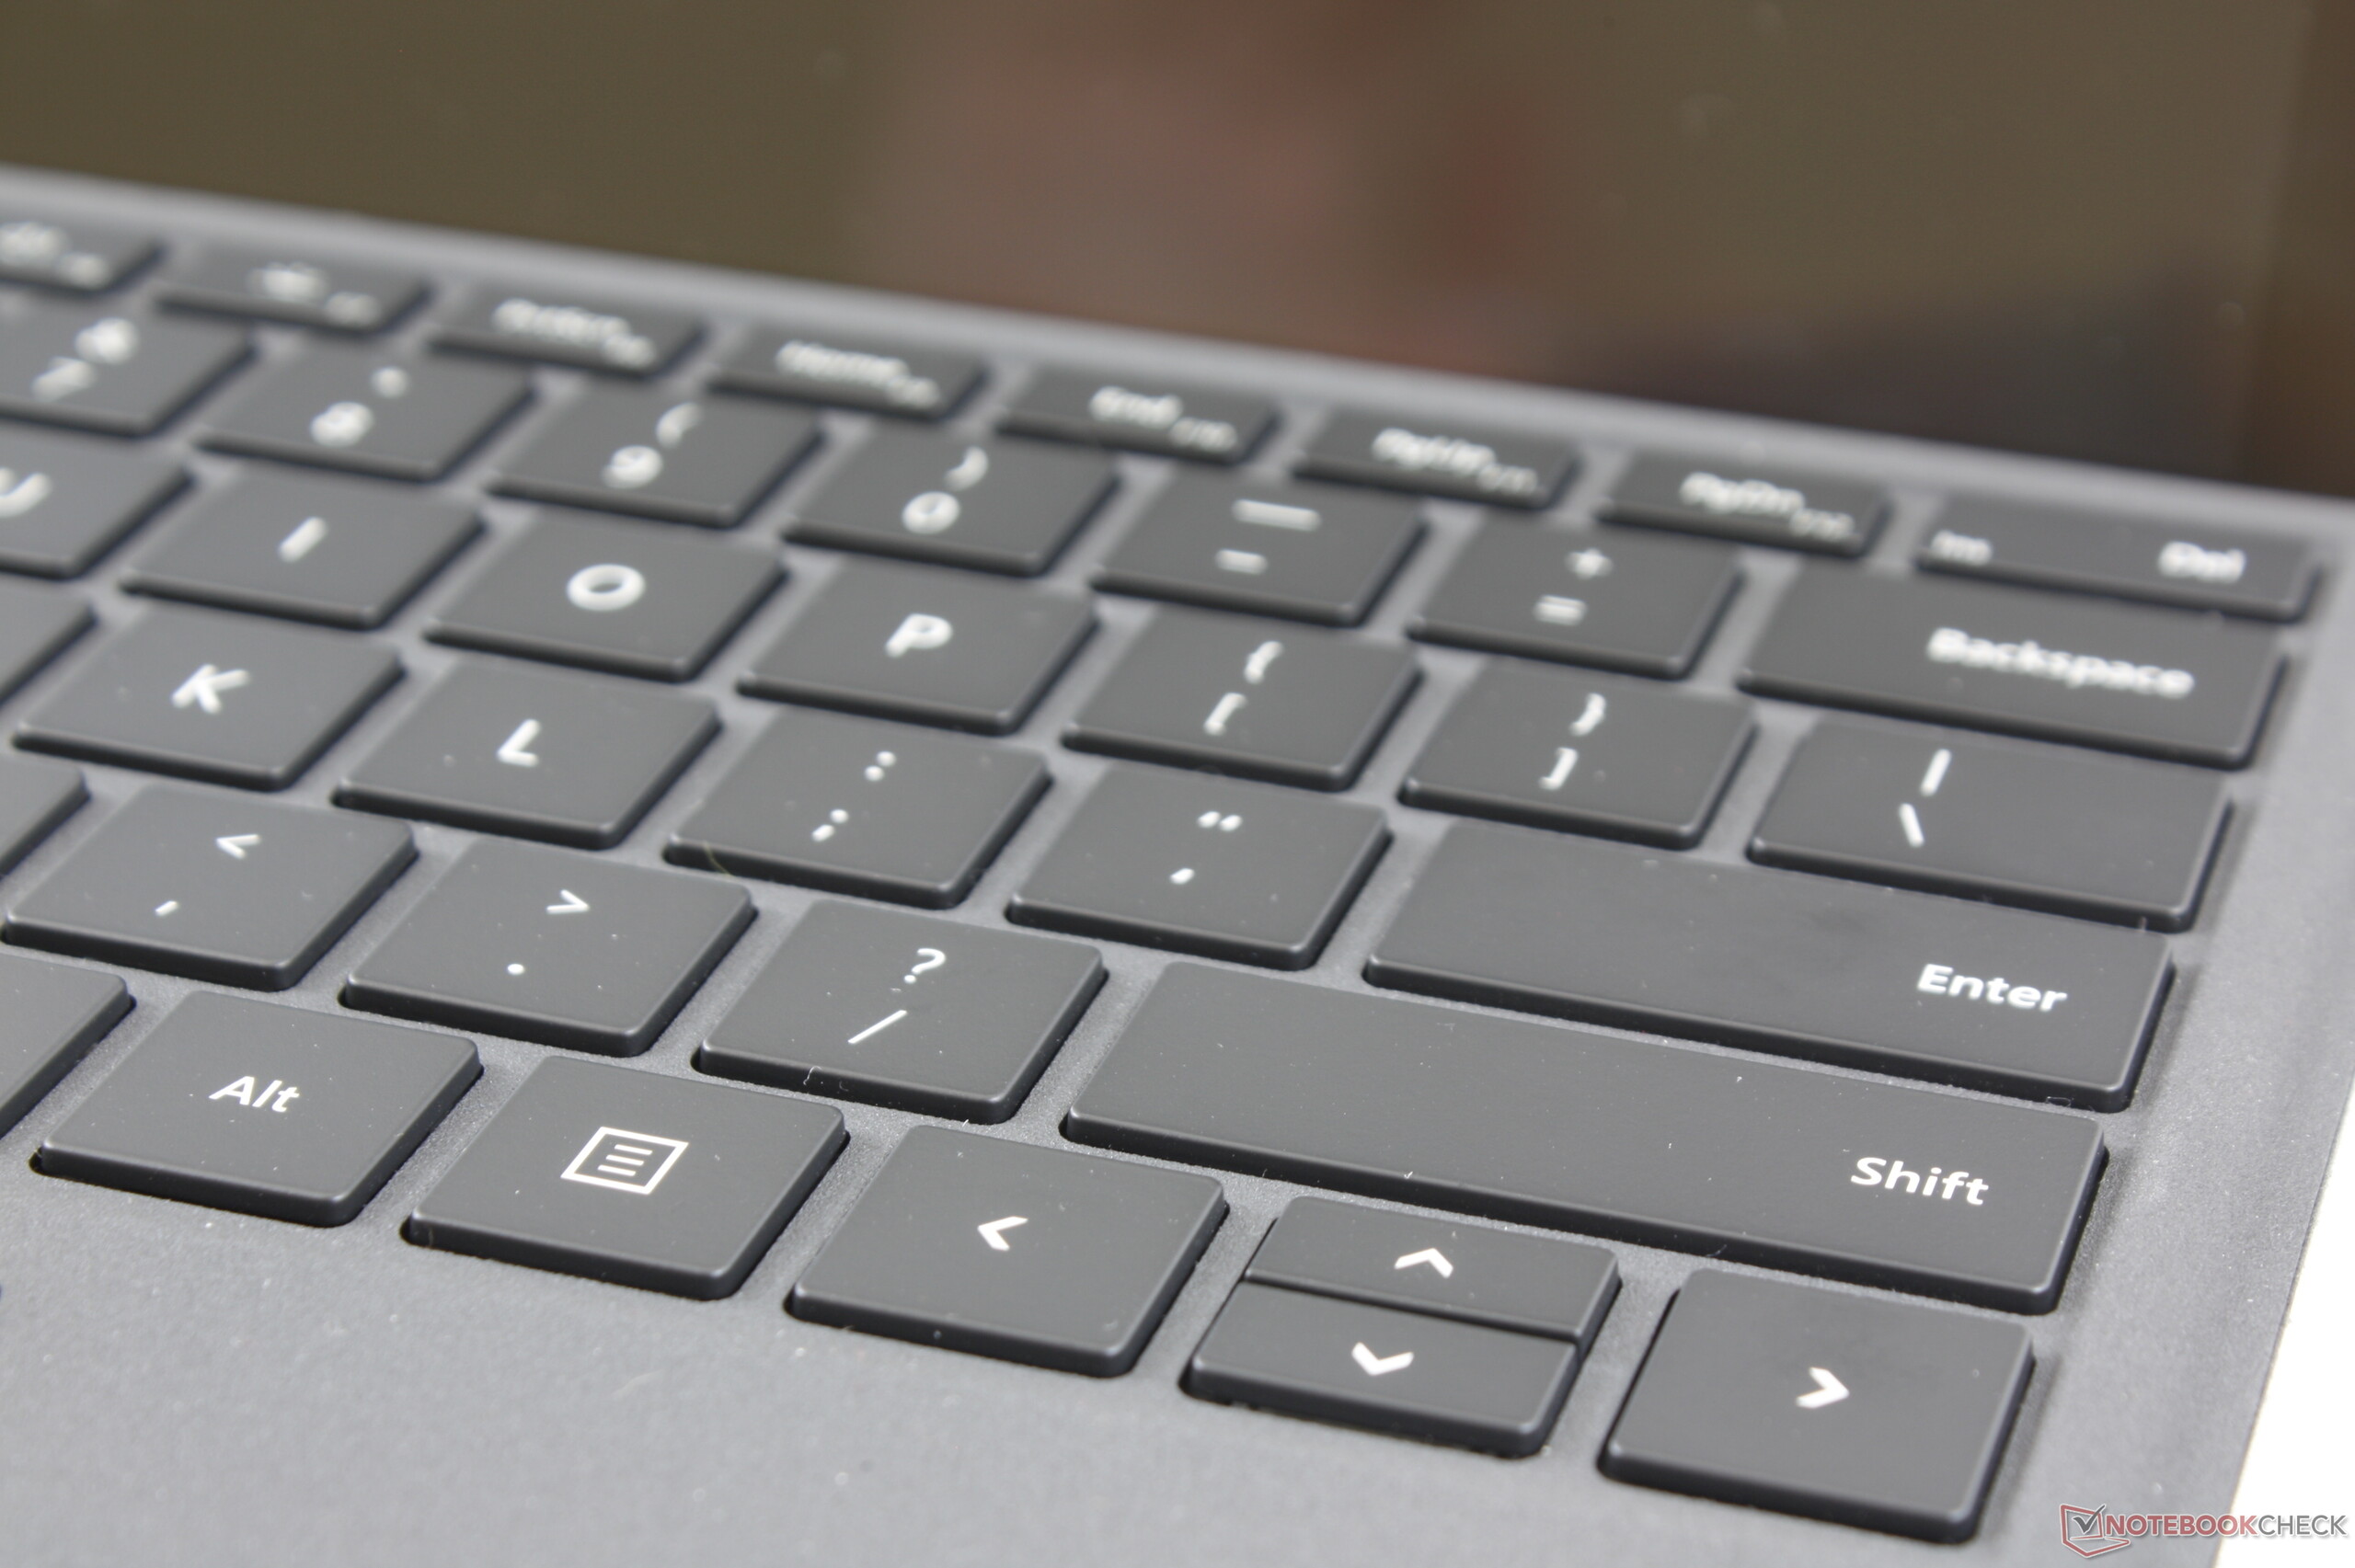
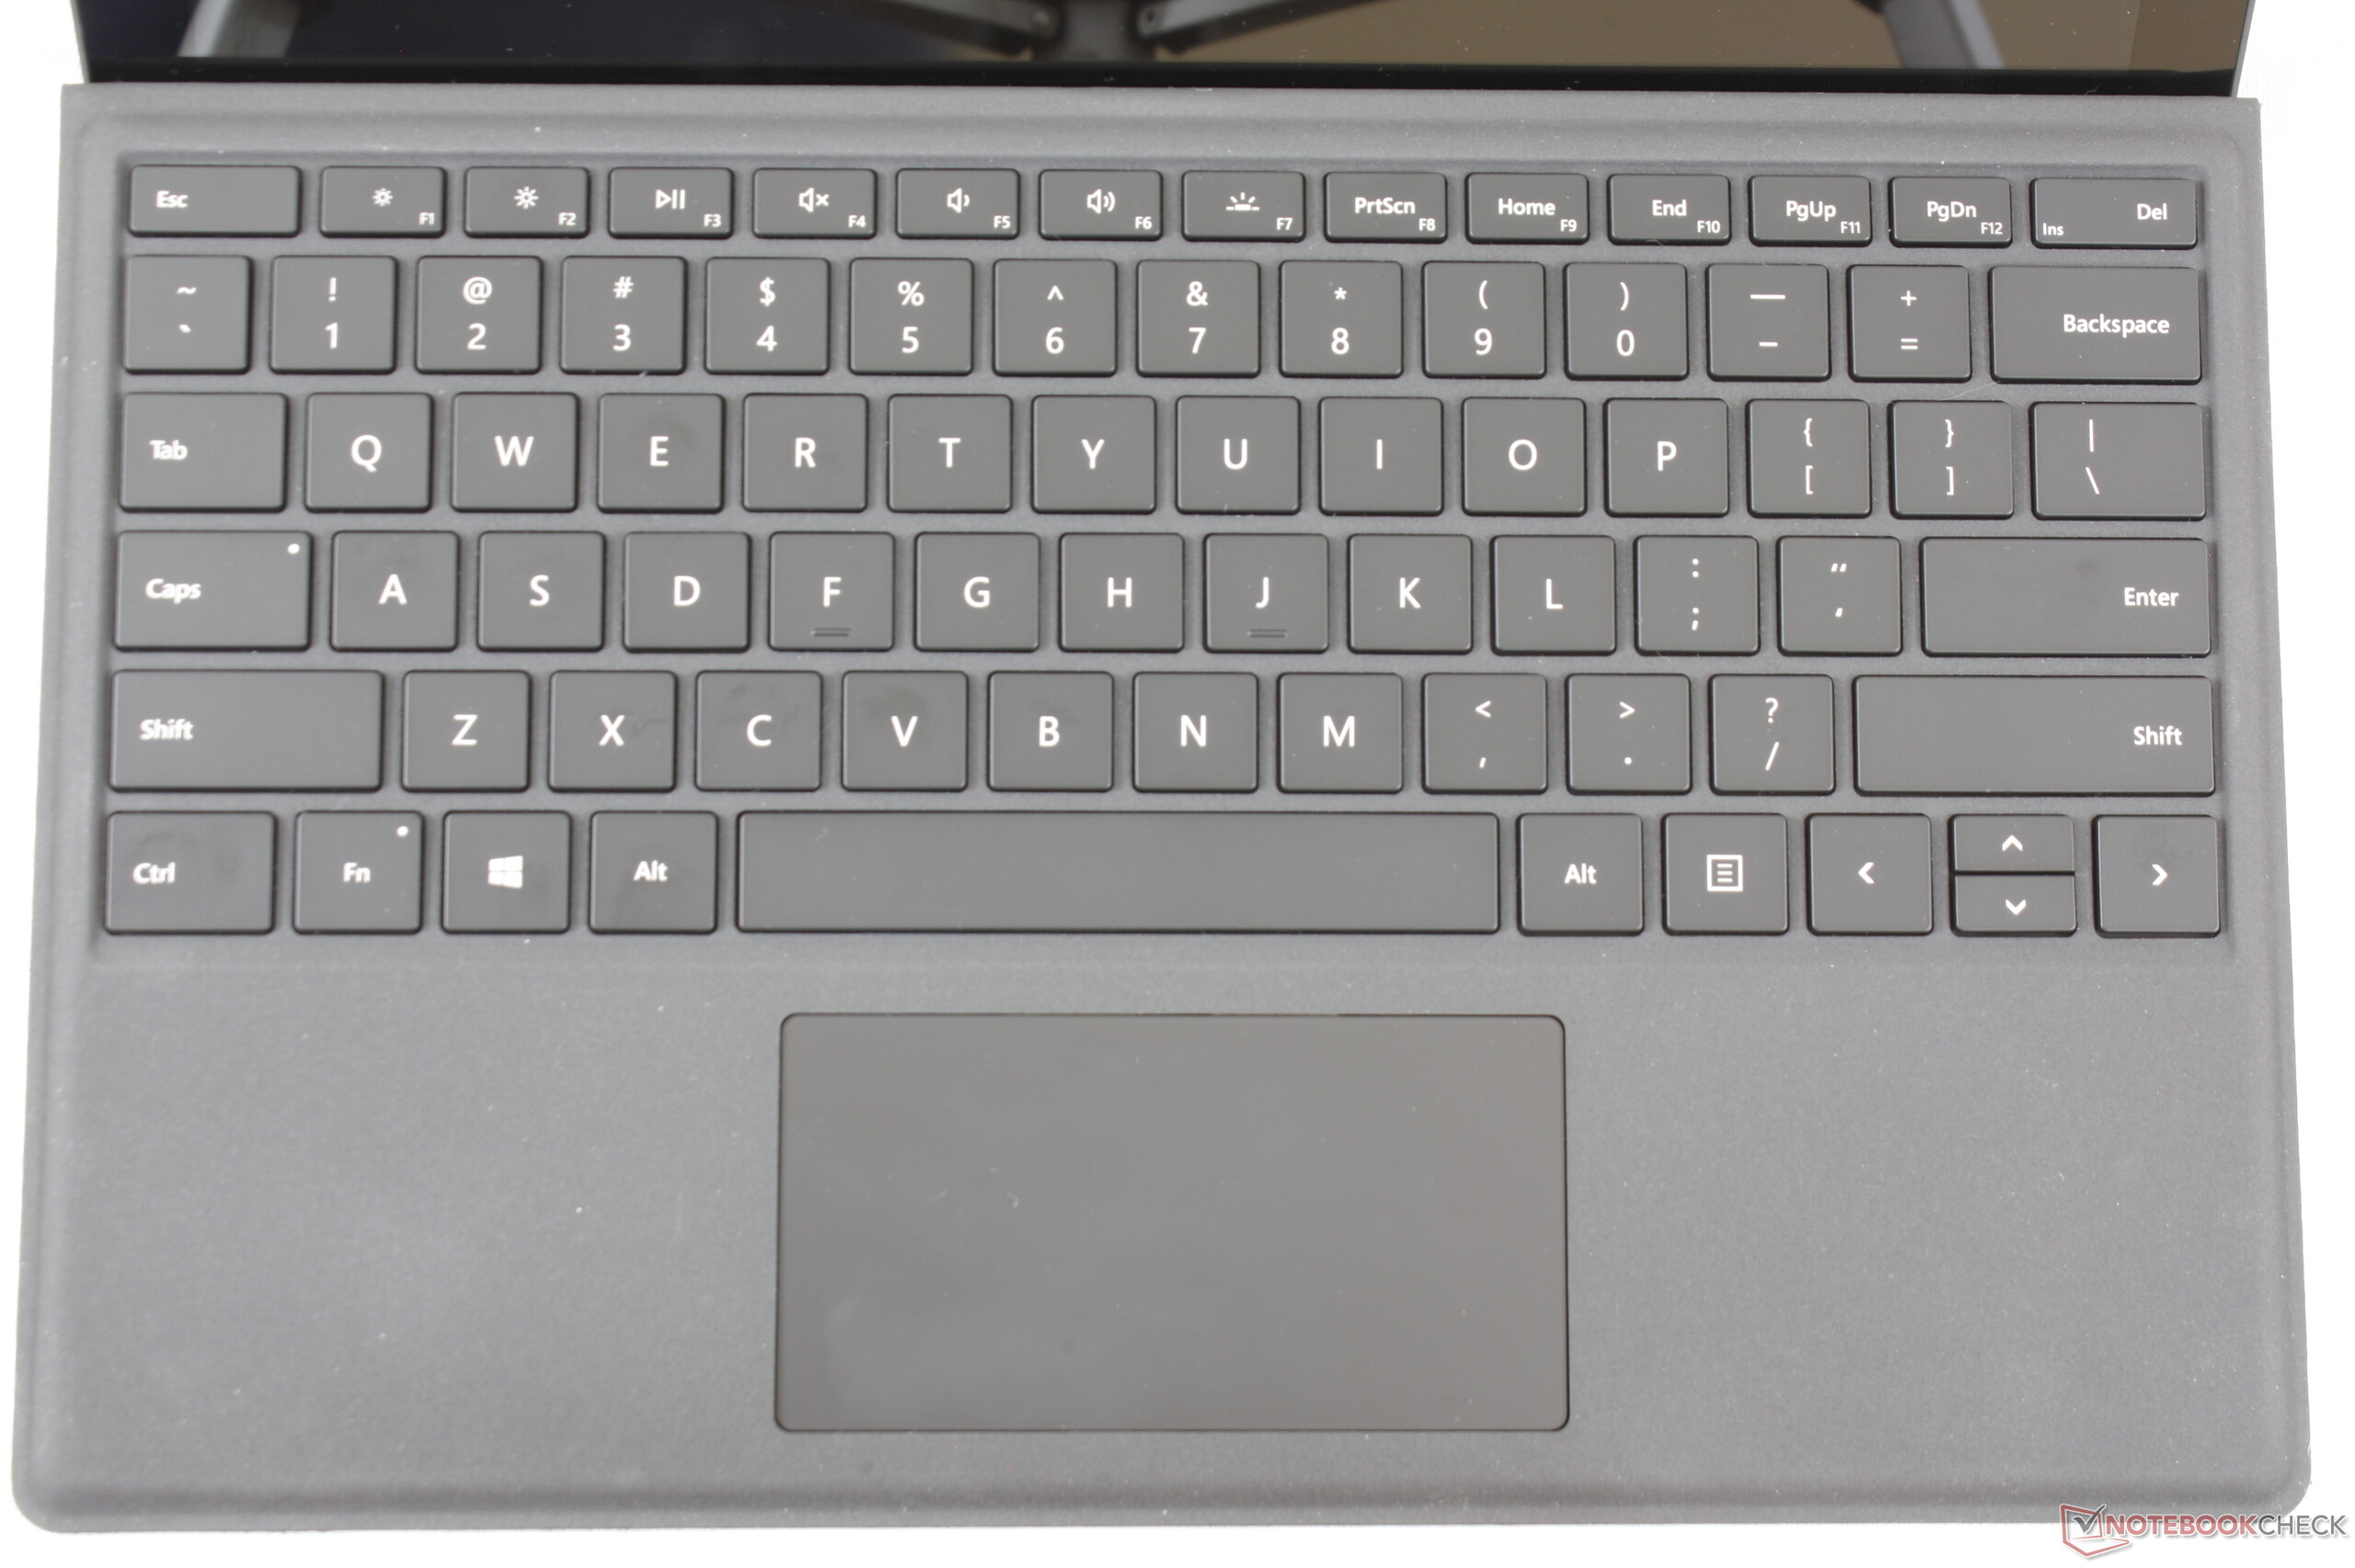
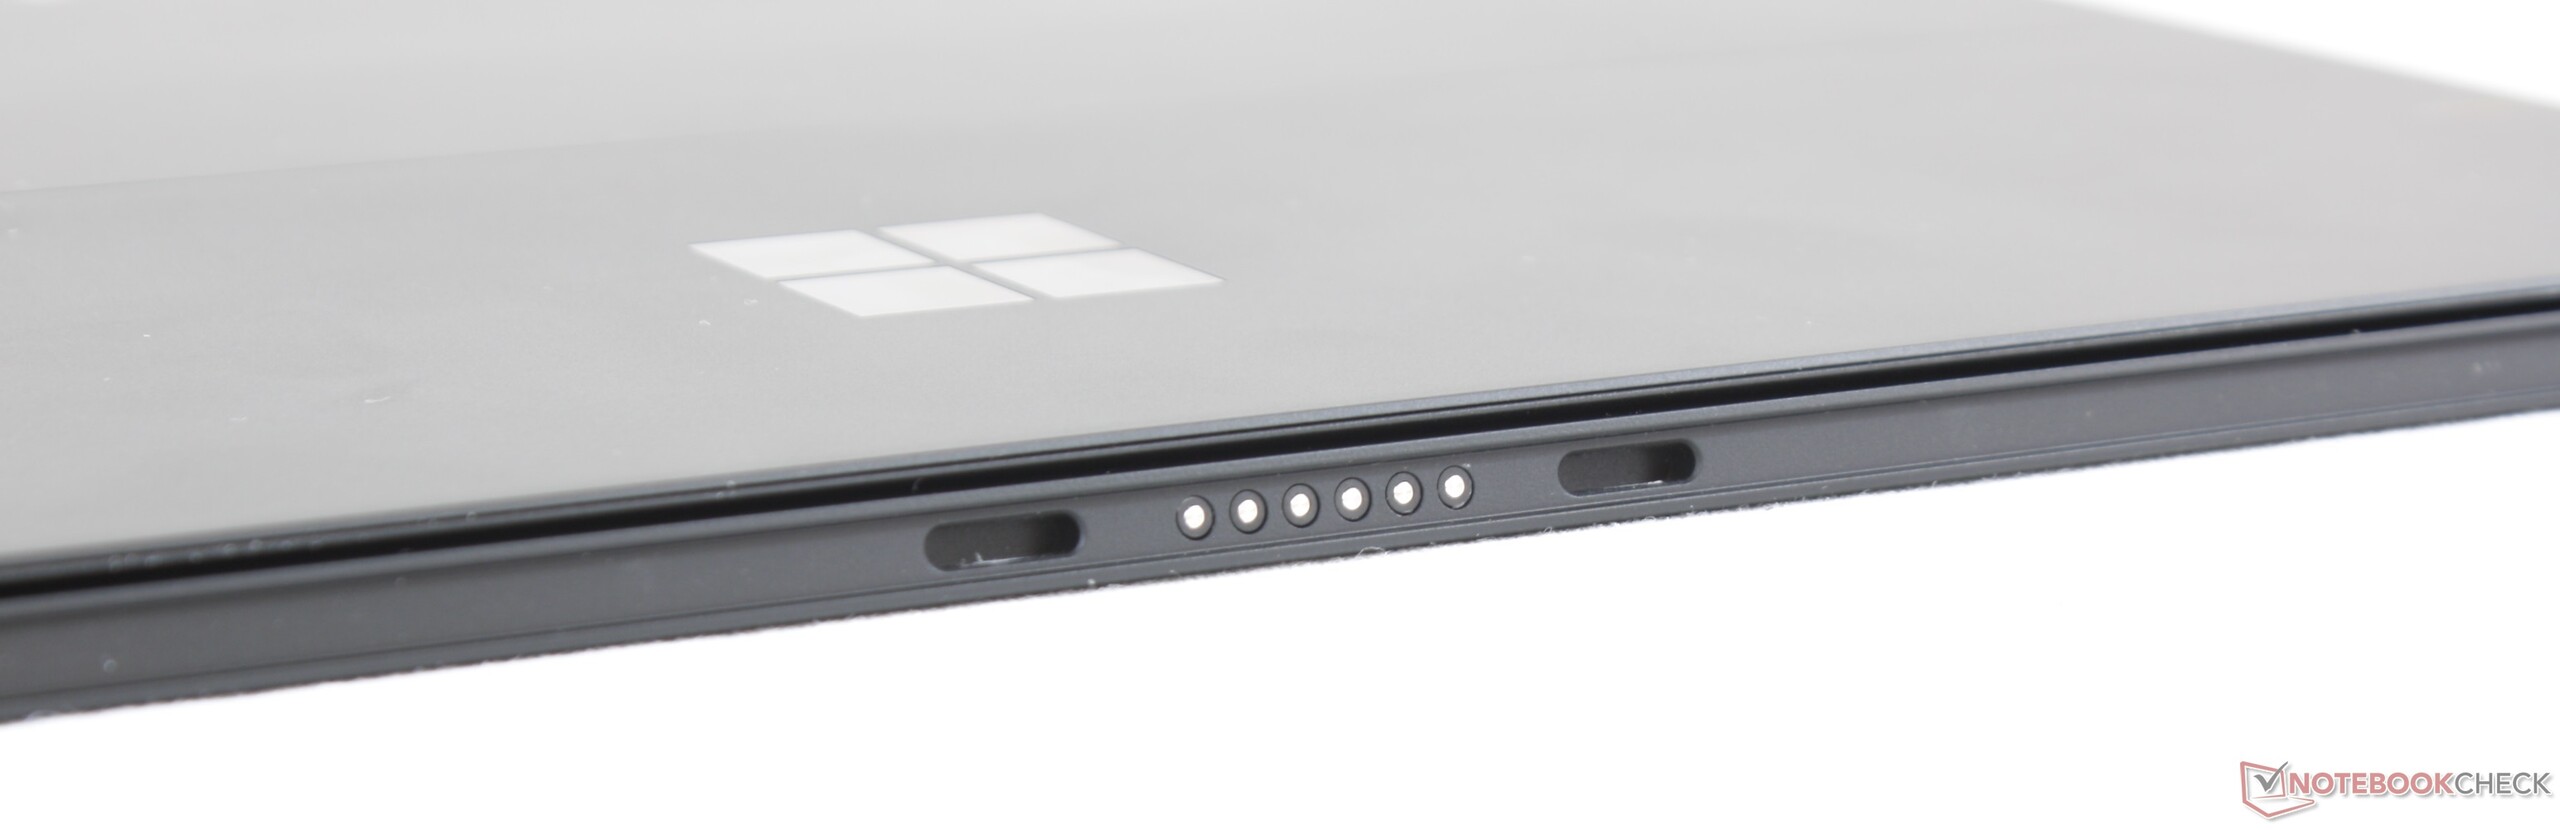
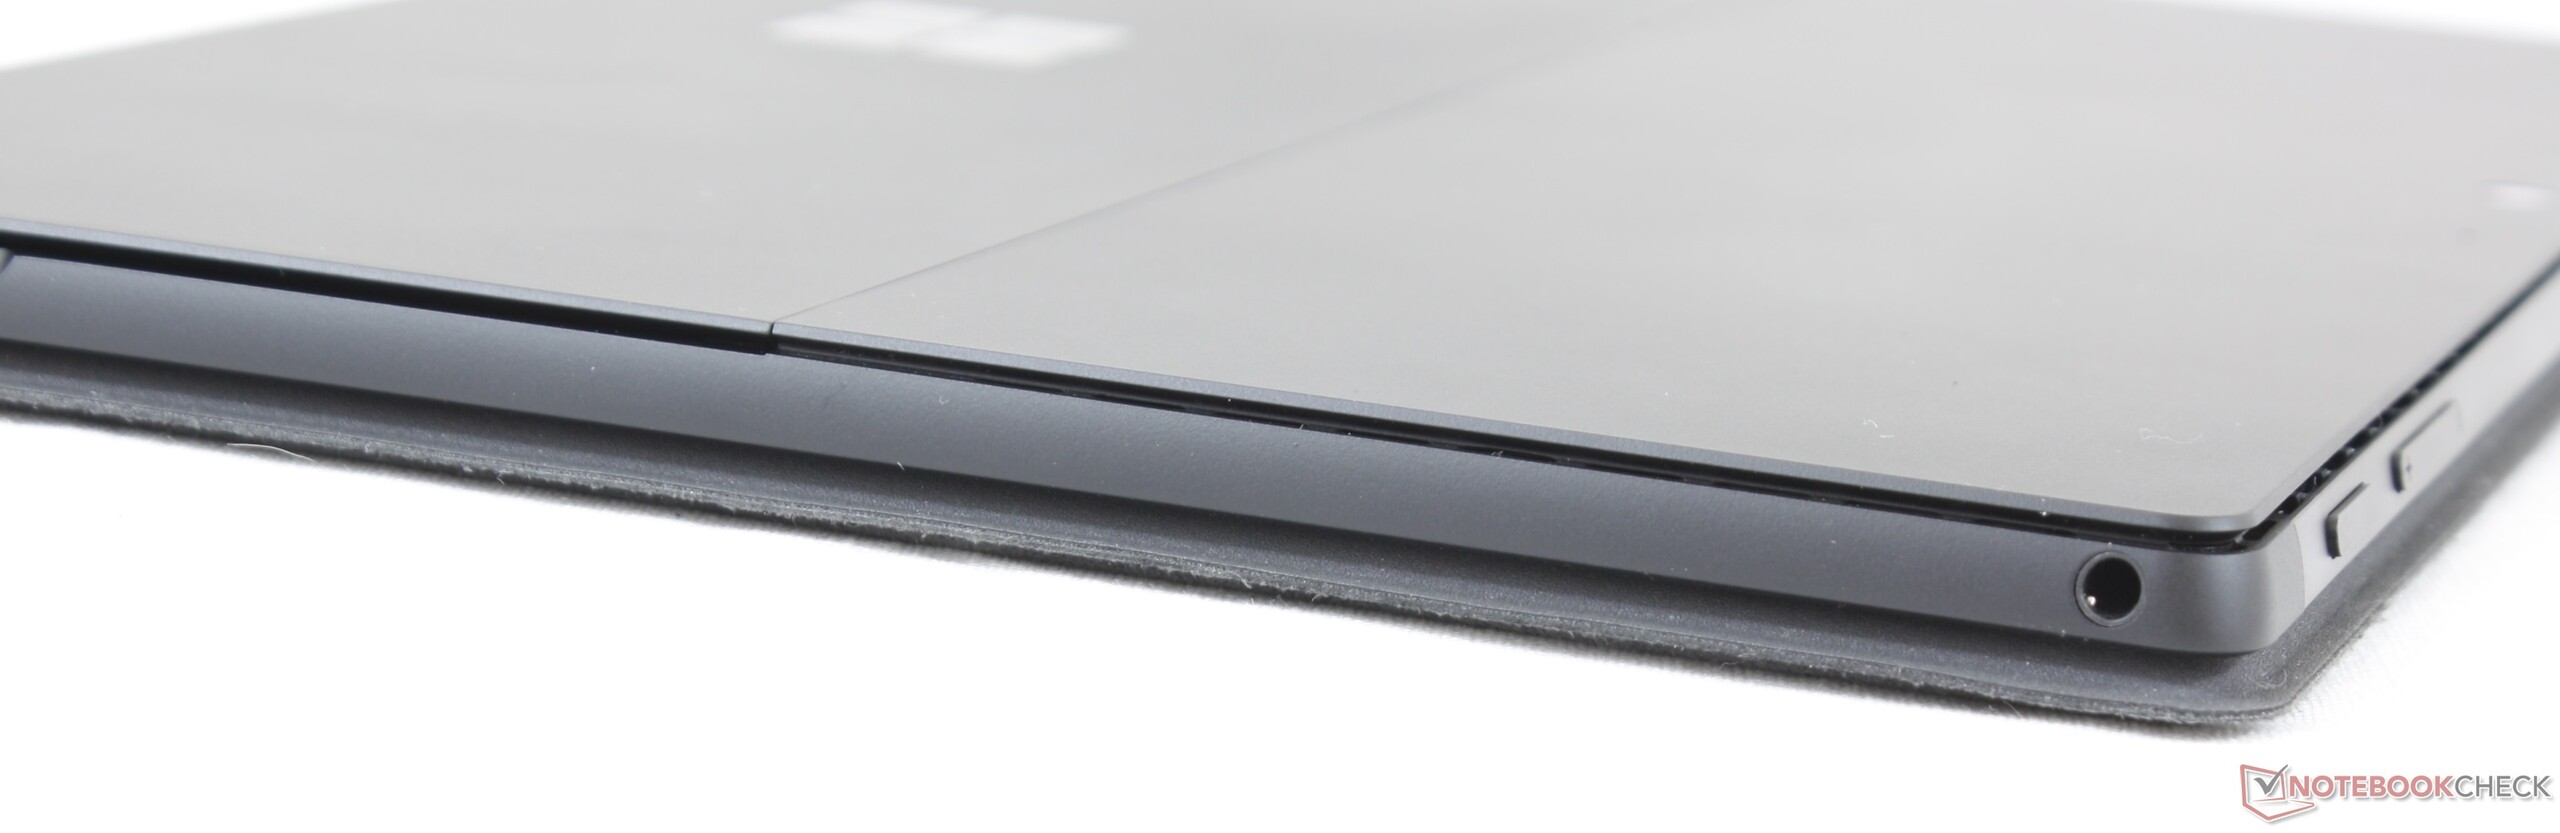
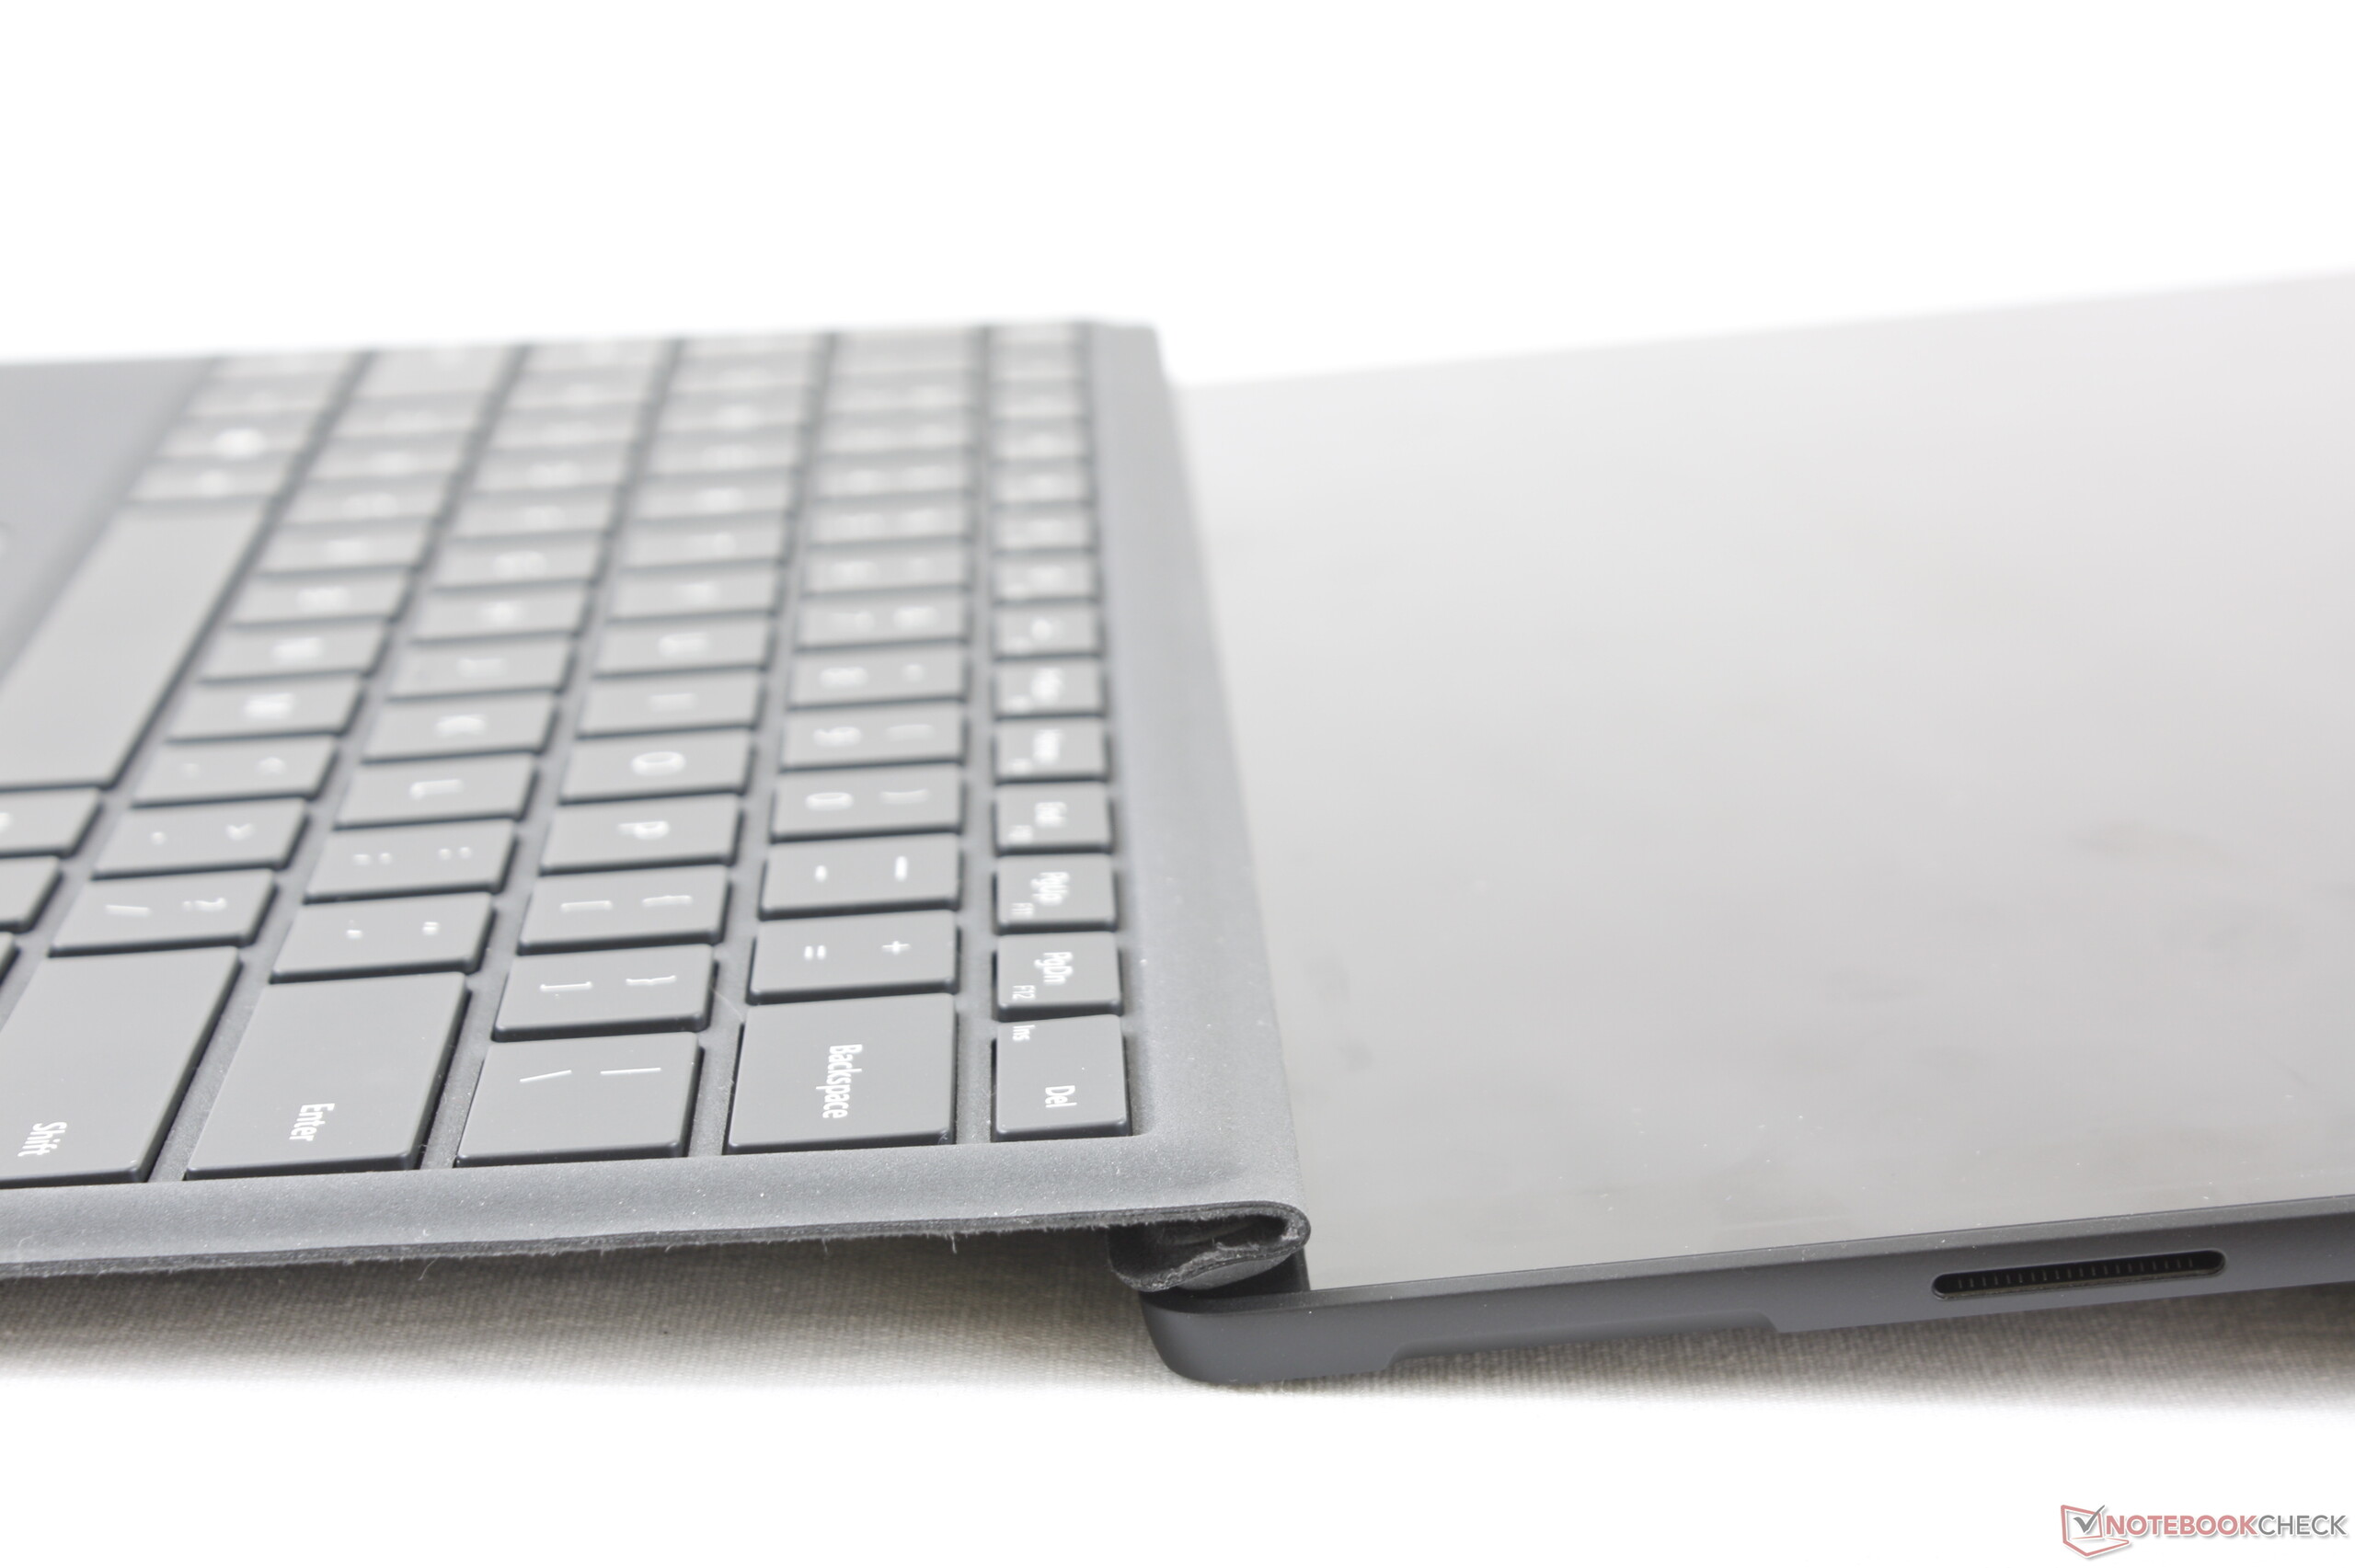
Dato che abbiamo già recensito due modelli di Surface Pro 7, non ci addentreremo ulteriormente nel case, nella connettività, nei dispositivi di input e negli altoparlanti in questa recensione. Le informazioni informazioni a riguardo possono essere trovate nel recensione del Core i5 Surface Pro 7.
Confronto con i possibili concorrenti
Punteggio | Data | Modello | Peso | Altezza | Dimensione | Risoluzione | Prezzo |
|---|---|---|---|---|---|---|---|
| 88.5 % v7 (old) | 03/2021 | Microsoft Surface Pro 7 Plus i5-1135G7, Iris Xe G7 80EUs | 796 gr | 8.5 mm | 12.30" | 2736x1824 | |
| 87.1 % v7 (old) | 11/2020 | Lenovo Yoga Duet 7 13IML05-82AS000WGE i5-10210U, UHD Graphics 620 | 1.2 kg | 9.2 mm | 13.00" | 2160x1350 | |
| 89.5 % v7 (old) | 03/2021 | Dell Latitude 12 7210 2-in-1 i7-10610U, UHD Graphics 620 | 850 gr | 9.35 mm | 12.30" | 1920x1280 |
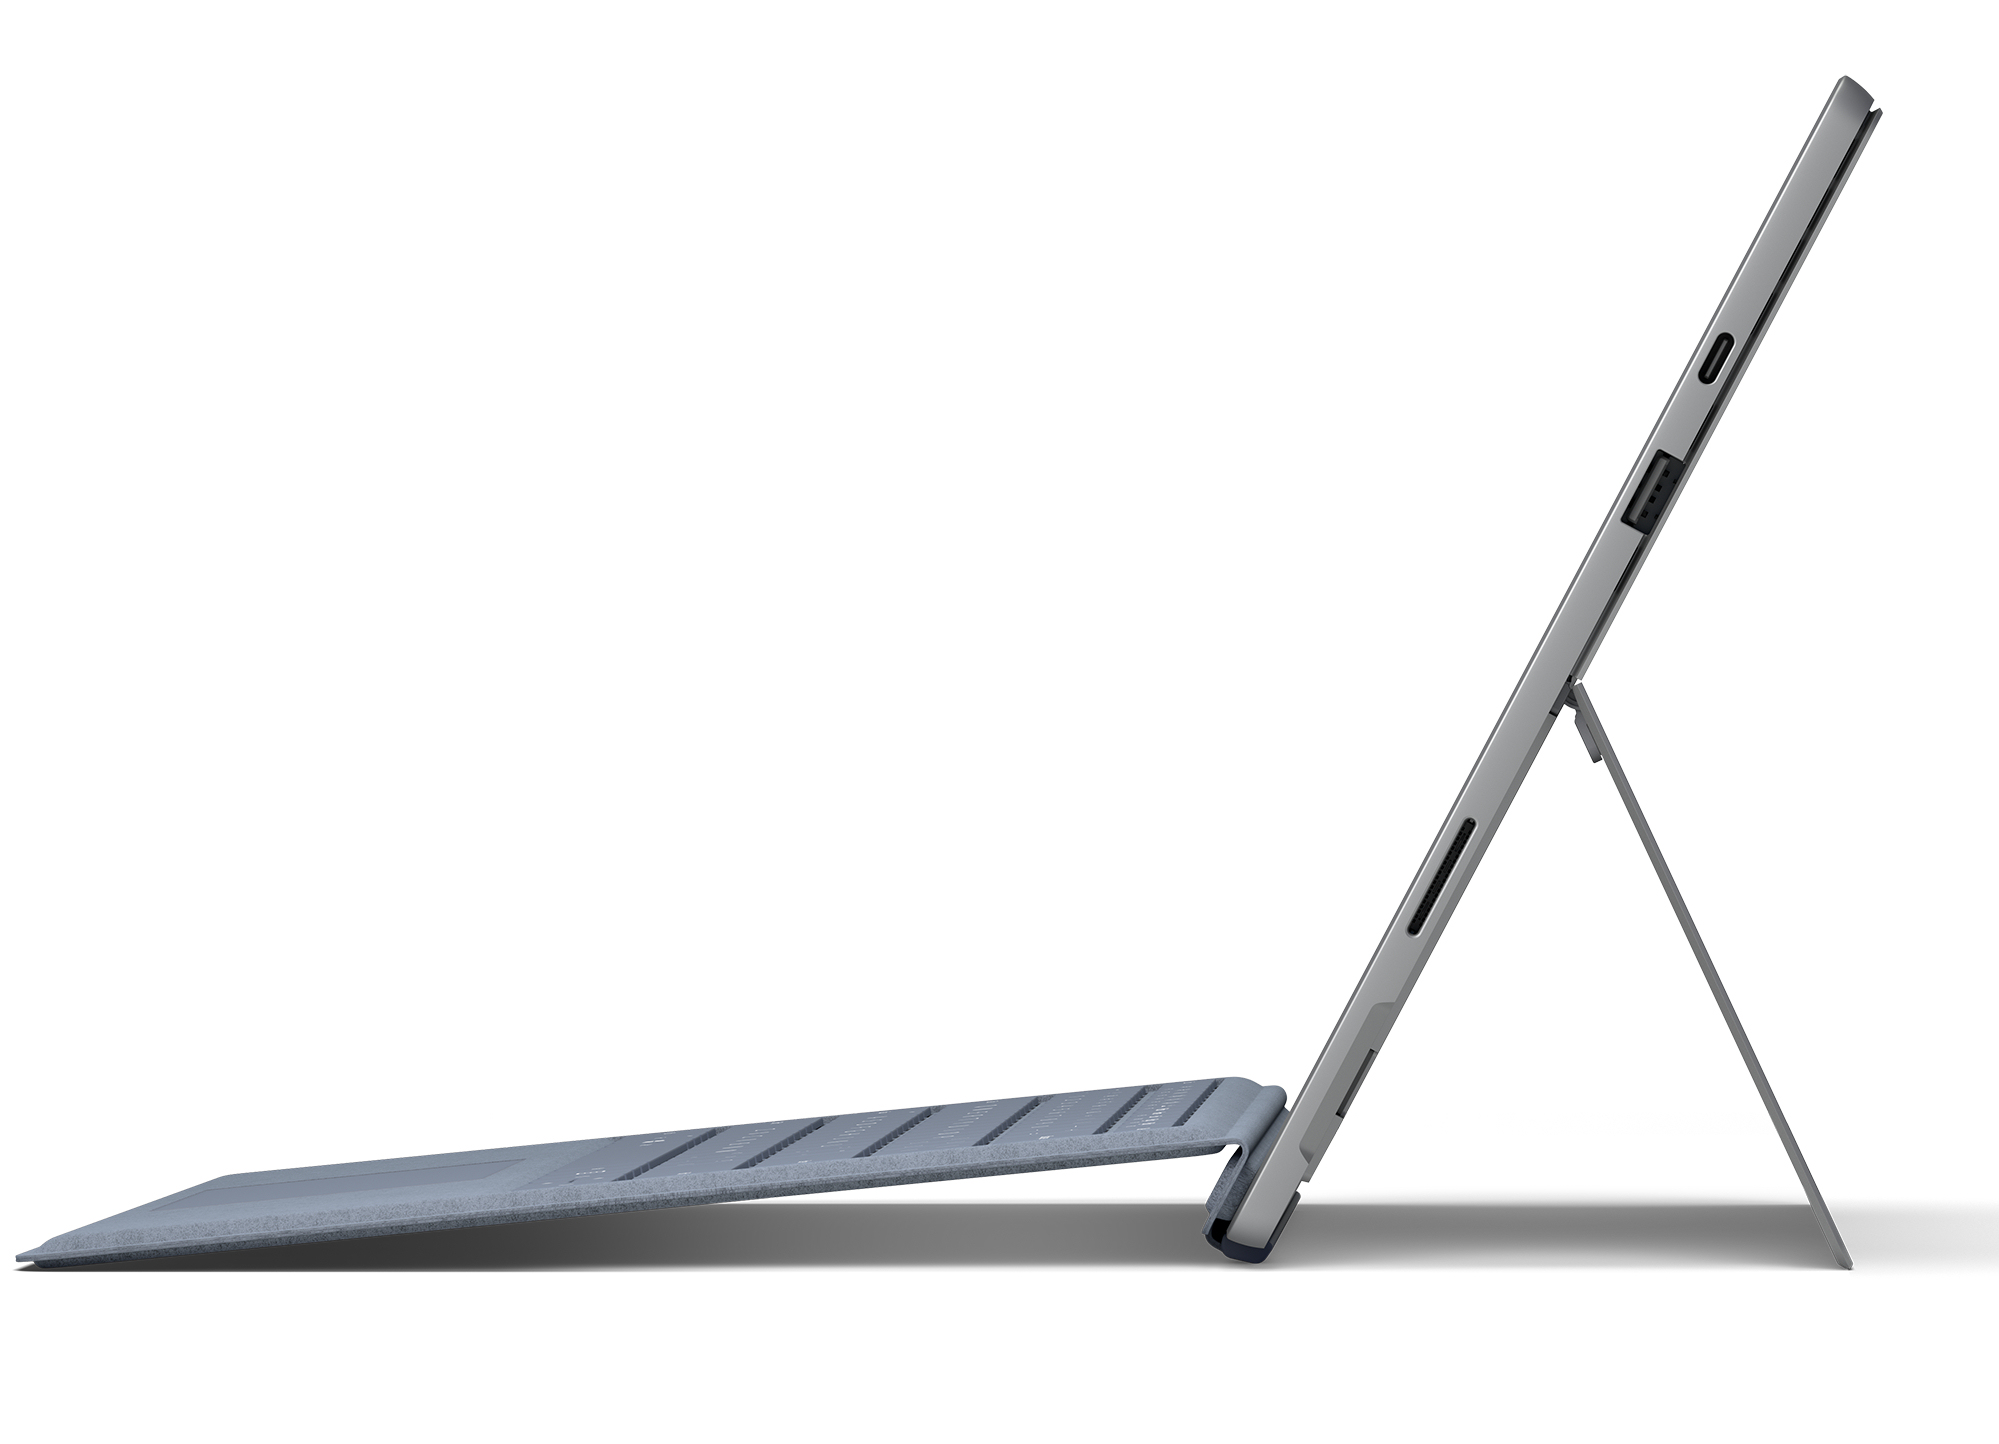
Connettività - Un modem LTE è opzionale ora
Snapdragon X20
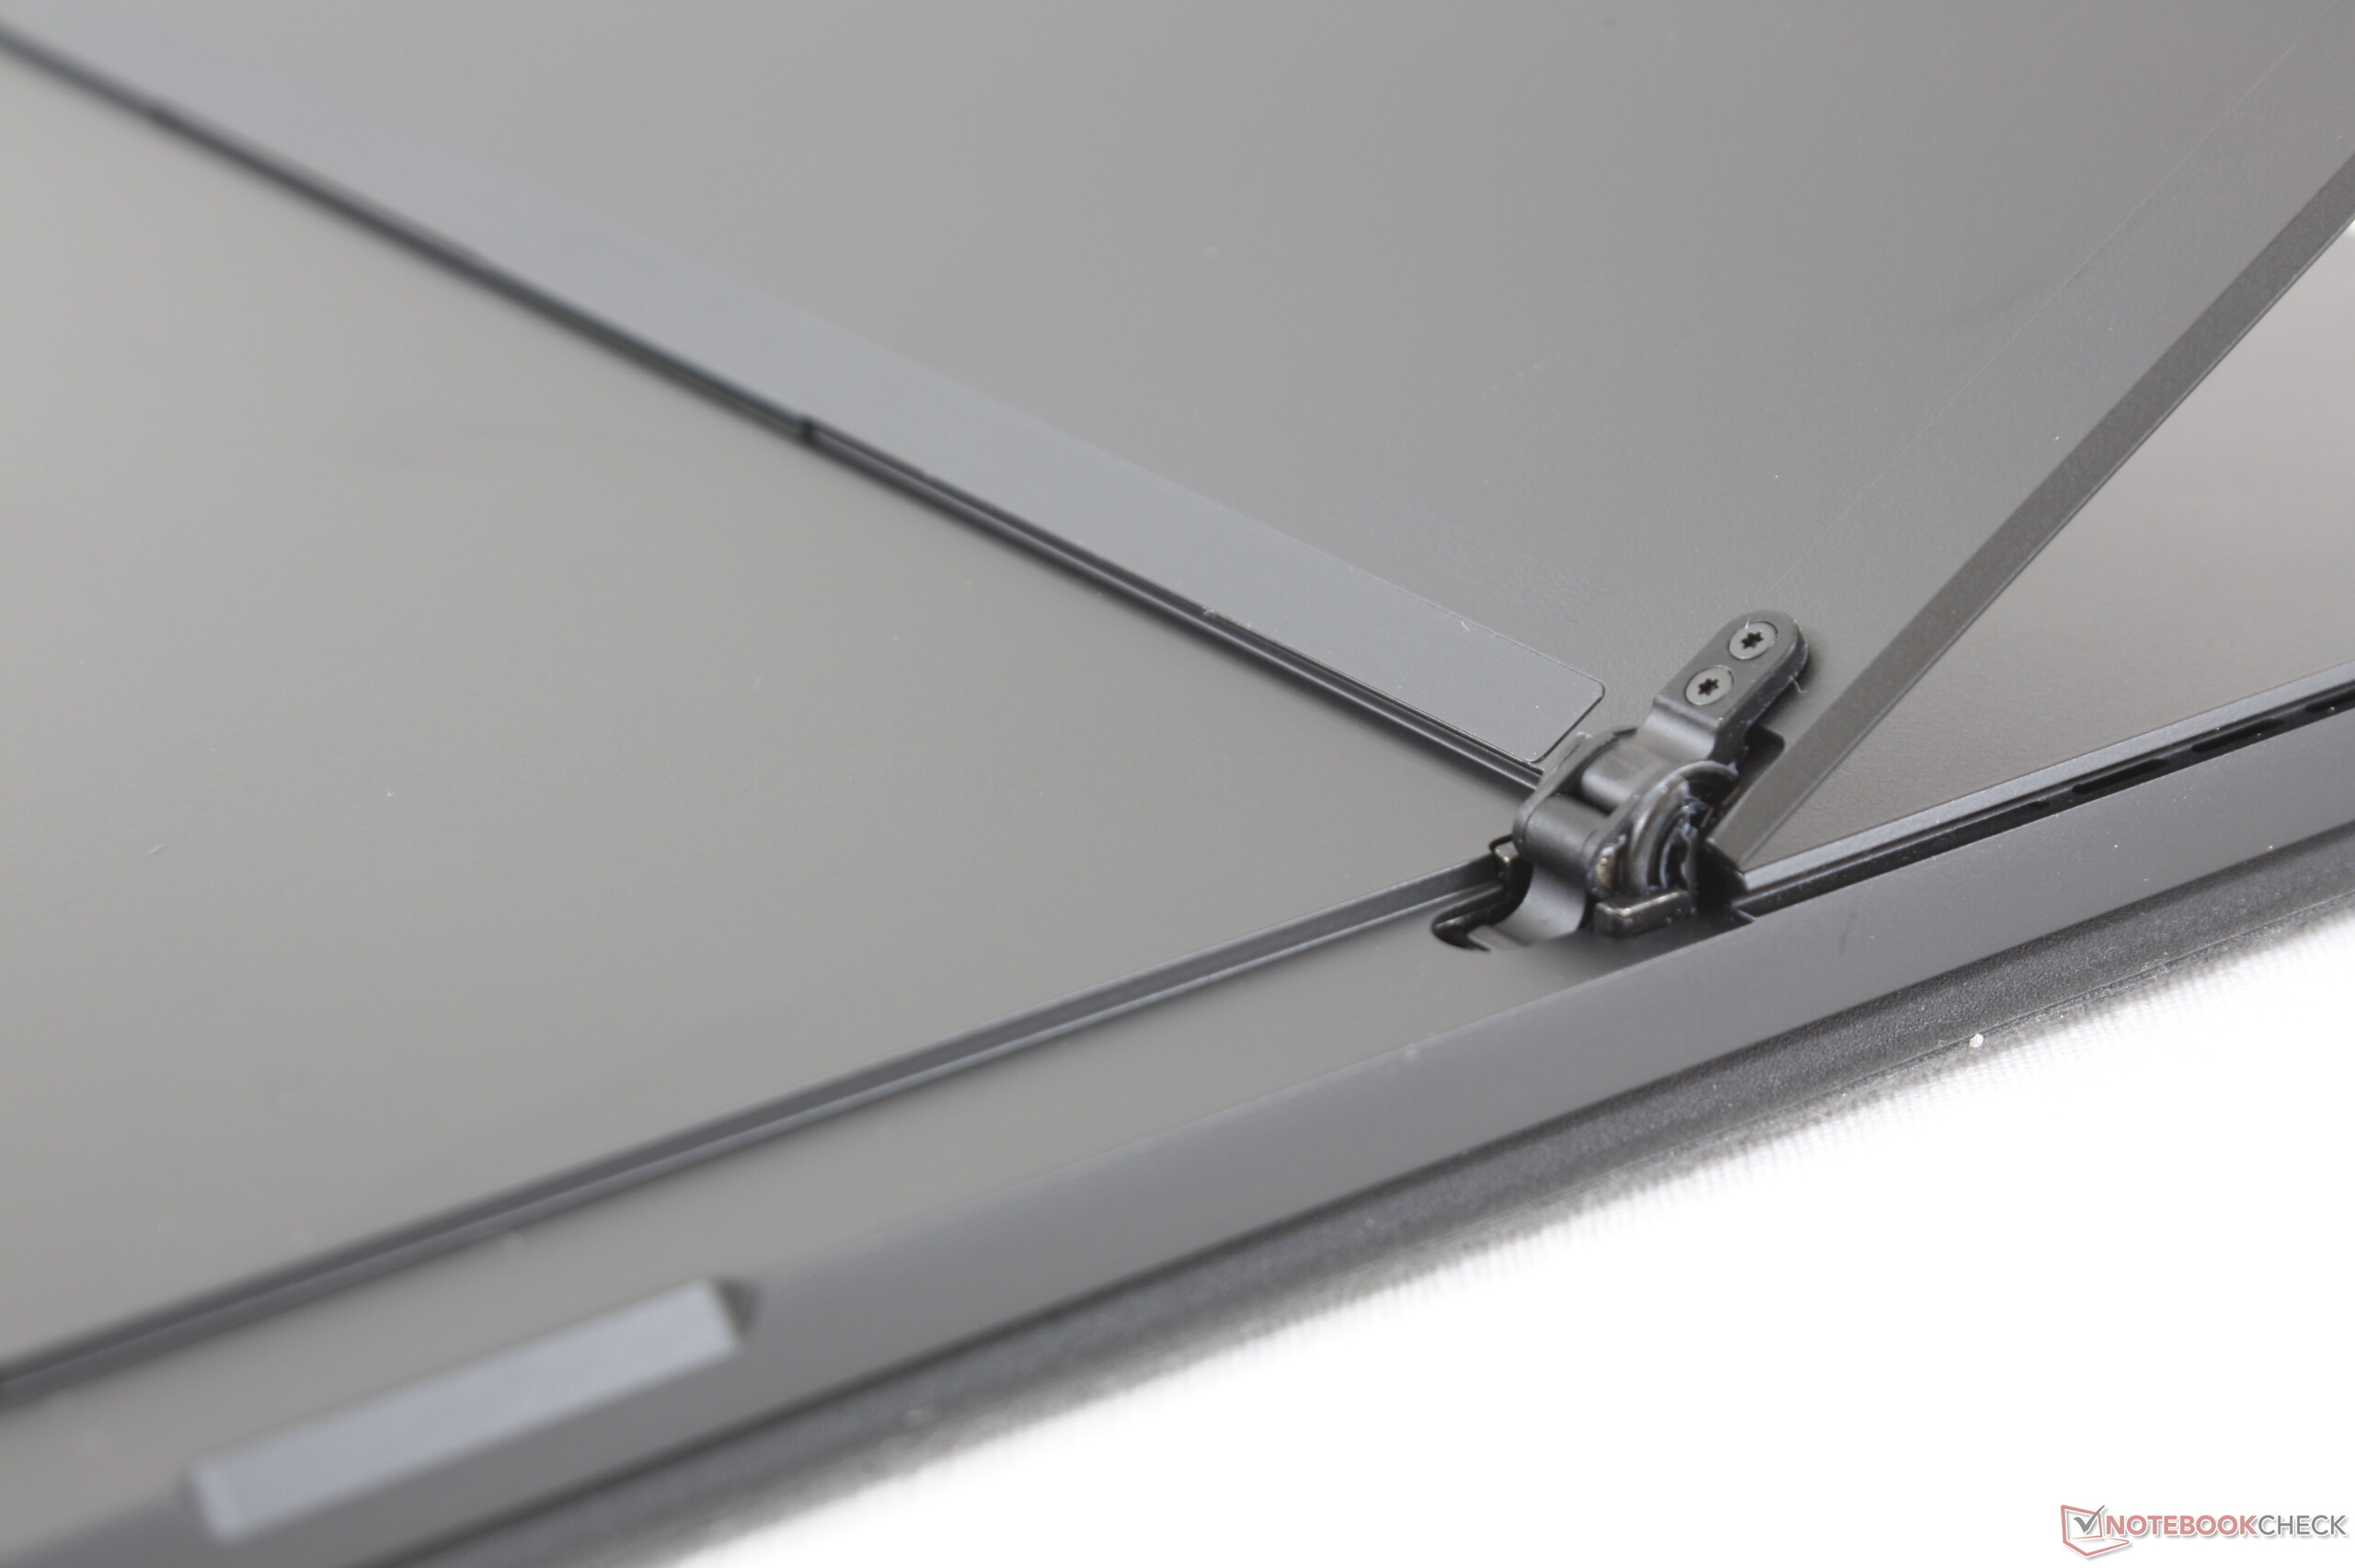
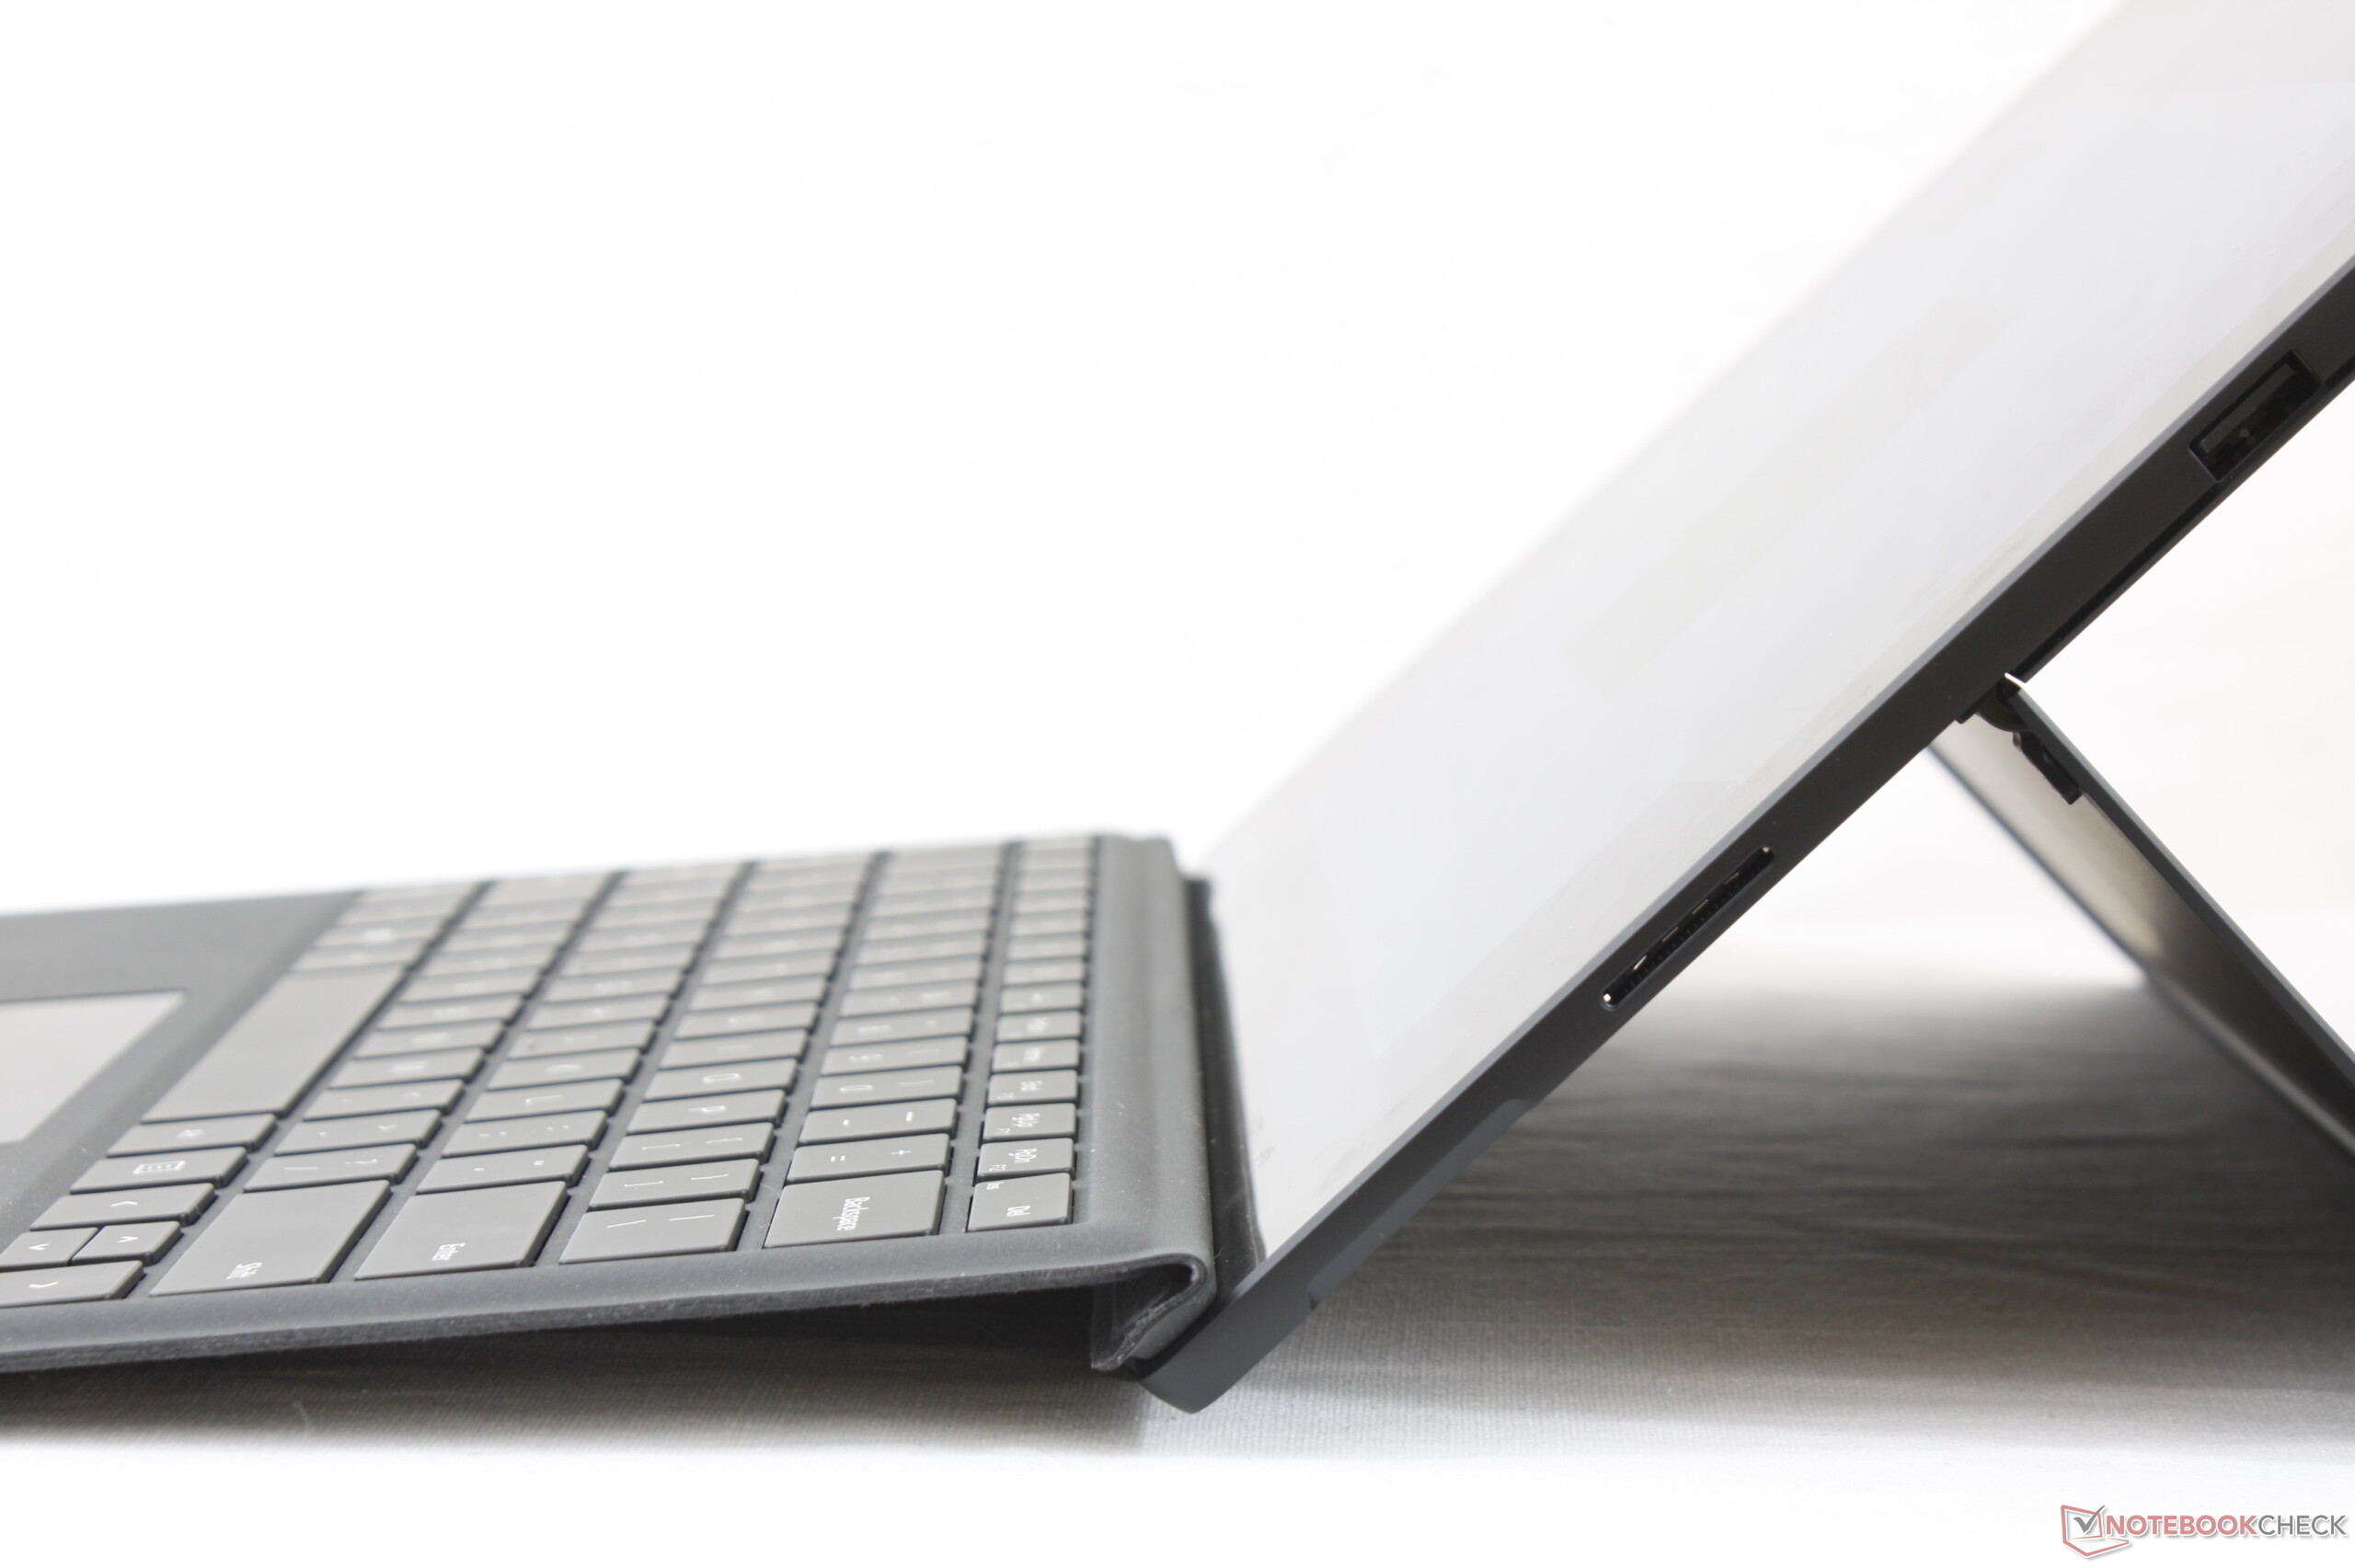
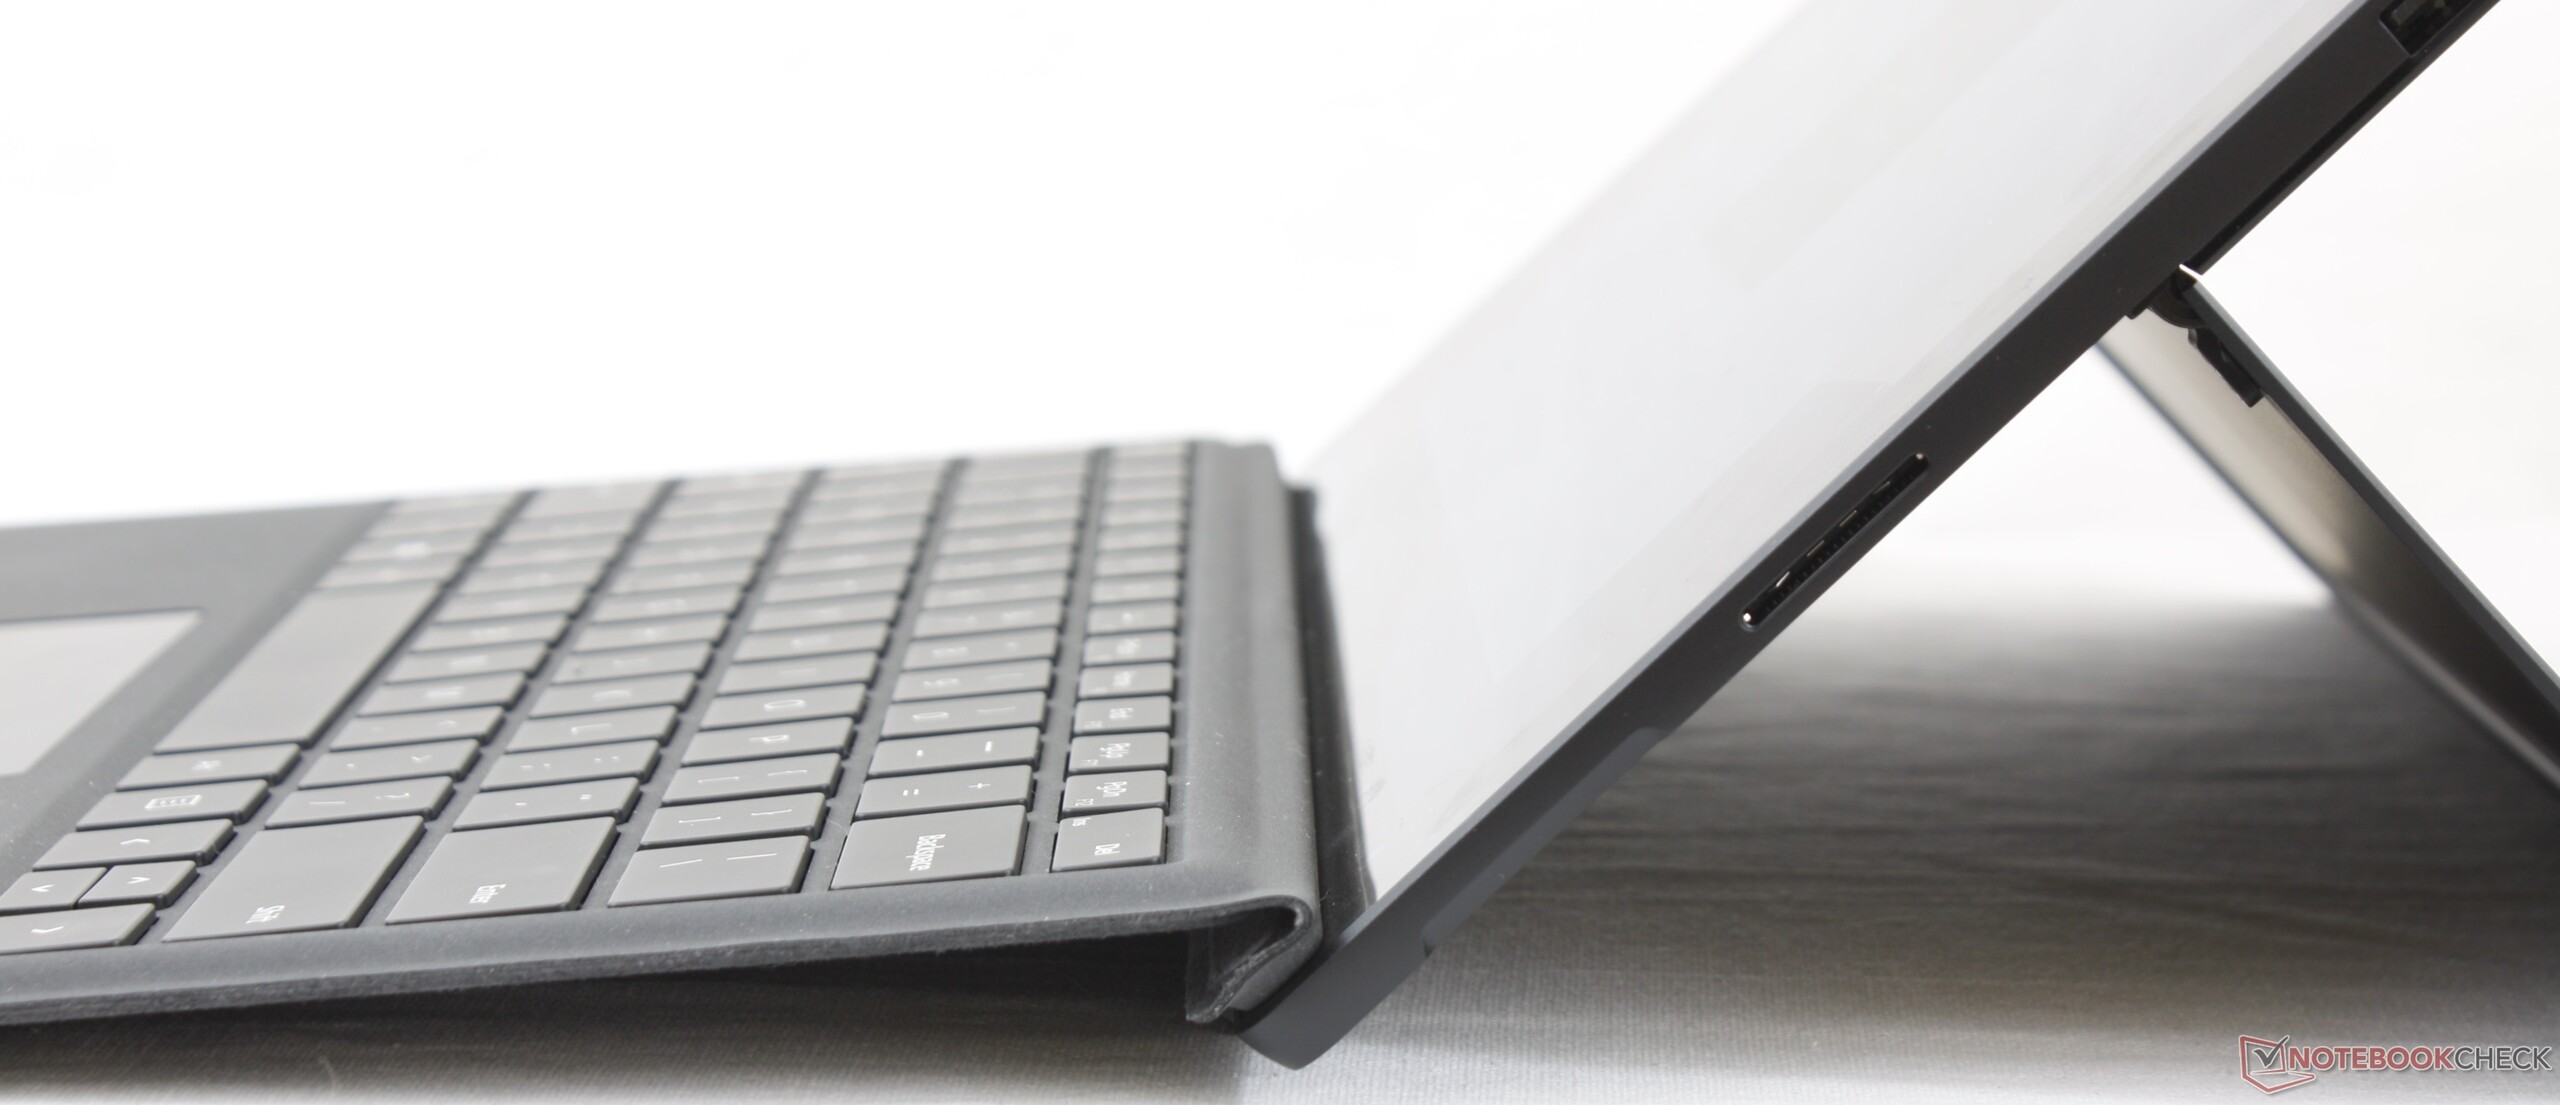
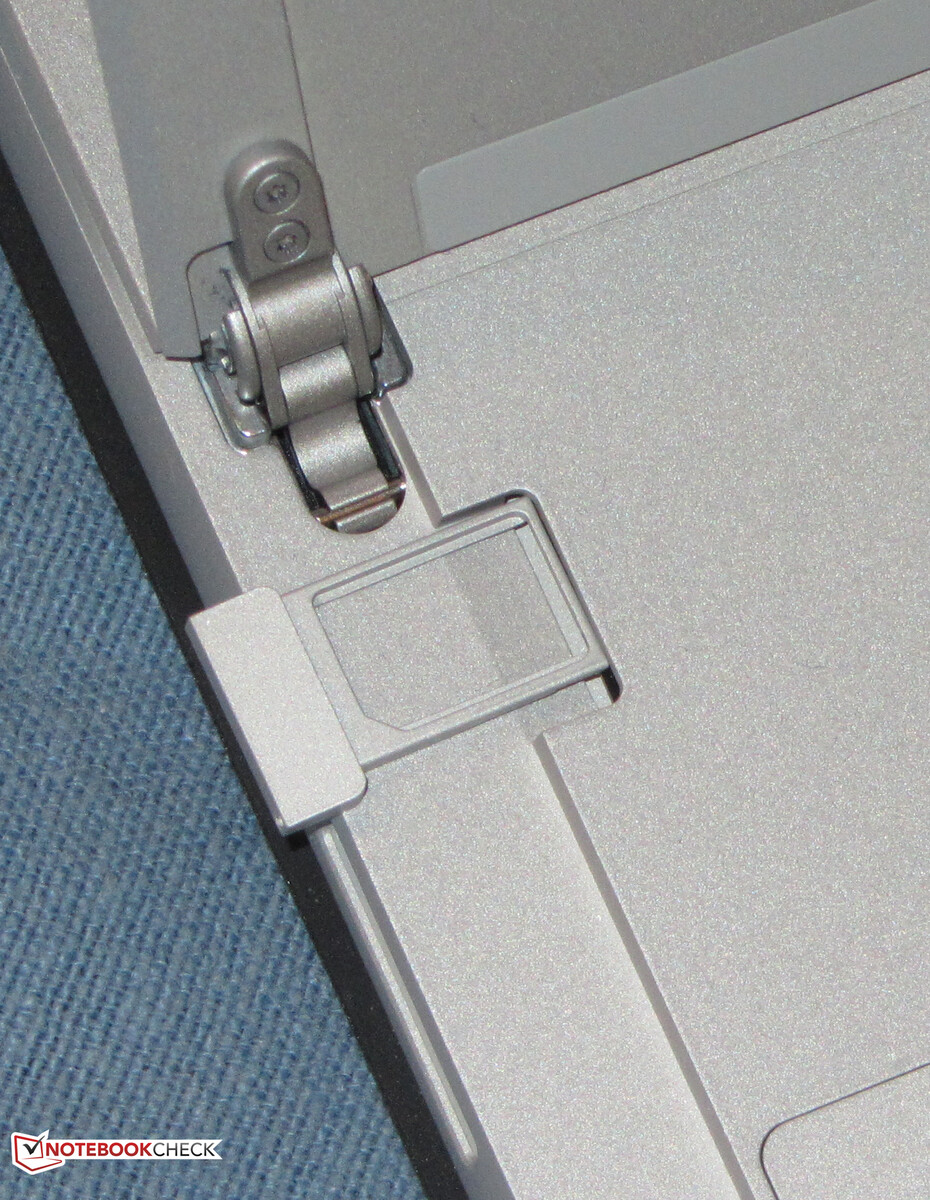
Microsoft installa il modem Qualcomm Snapdragon X20 nel Surface. Lo slot per la scheda SIM è dietro il supporto. Il lettore di schede di memoria ha dovuto essere rimosso. Inoltre, il modem LTE è disponibile solo in combinazione con un processore Core i5


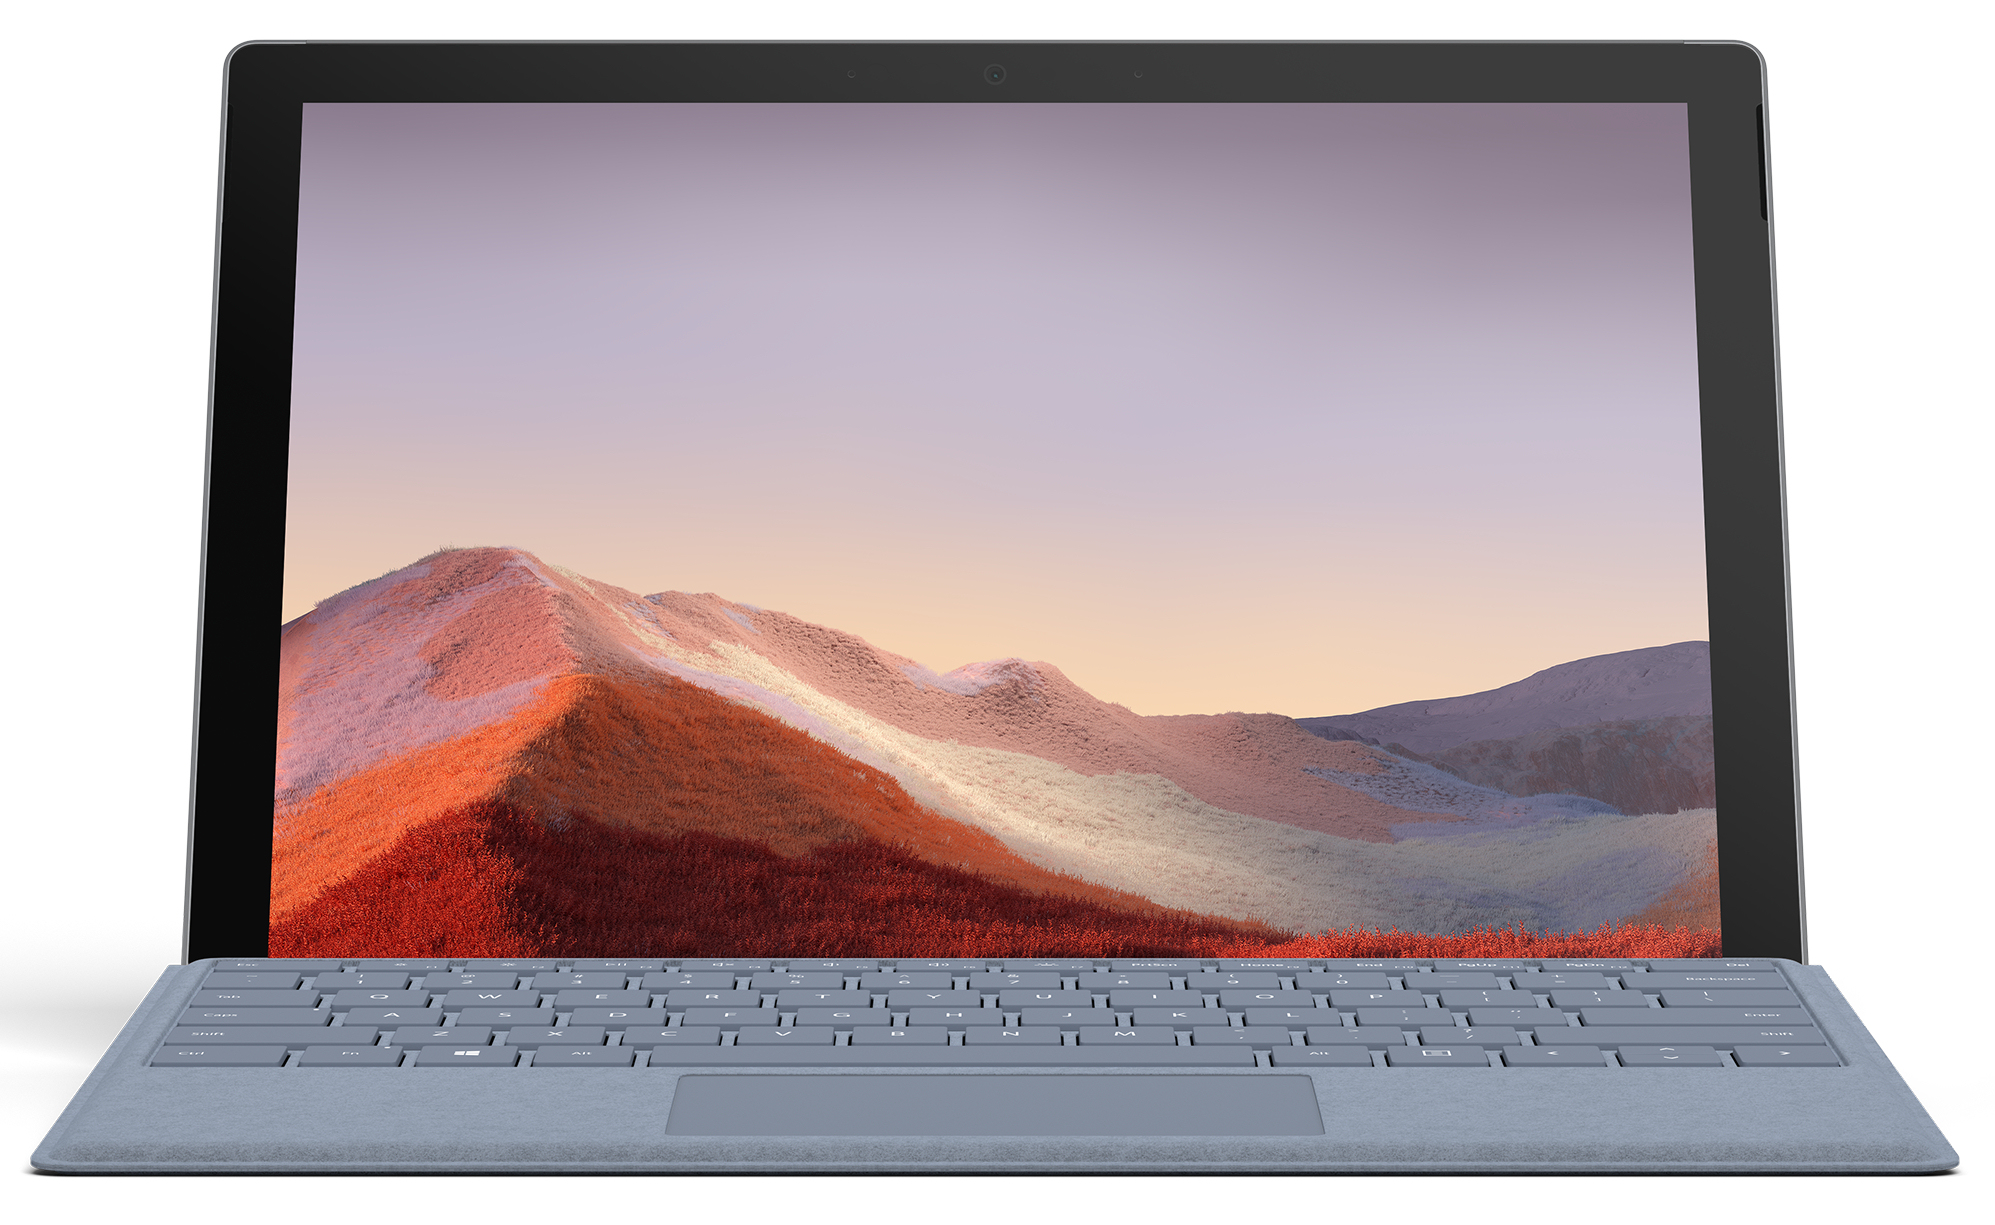
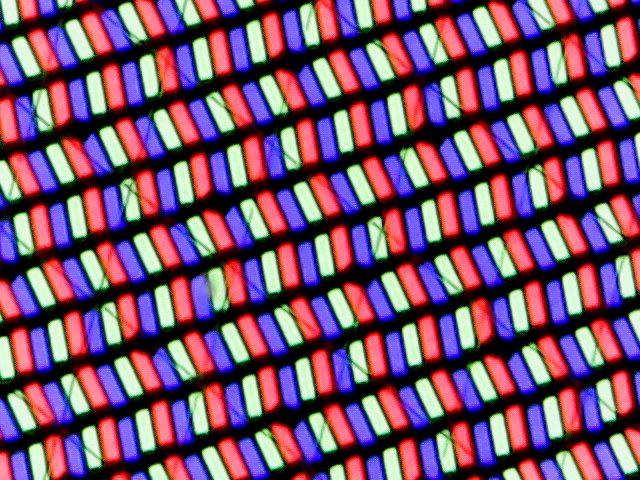
Display - IPS nel formato 3:2
Il display touchscreen da 12,3 pollici ha una risoluzione nativa di 2736x1824 pixel. La luminosità (425,4 cd/m²) e il contrasto (1.200:1) sono buoni. Inoltre, il display sfarfalla ad una frequenza di 199,2 Hz a livelli di luminosità del 57% (equivalente a circa 119 cd/m²) e inferiori. A causa della bassa frequenza, gli utenti sensibili potrebbero avere mal di testa e/o problemi agli occhi.
| |||||||||||||||||||||||||
Distribuzione della luminosità: 85 %
Al centro con la batteria: 407 cd/m²
Contrasto: 1200:1 (Nero: 0.34 cd/m²)
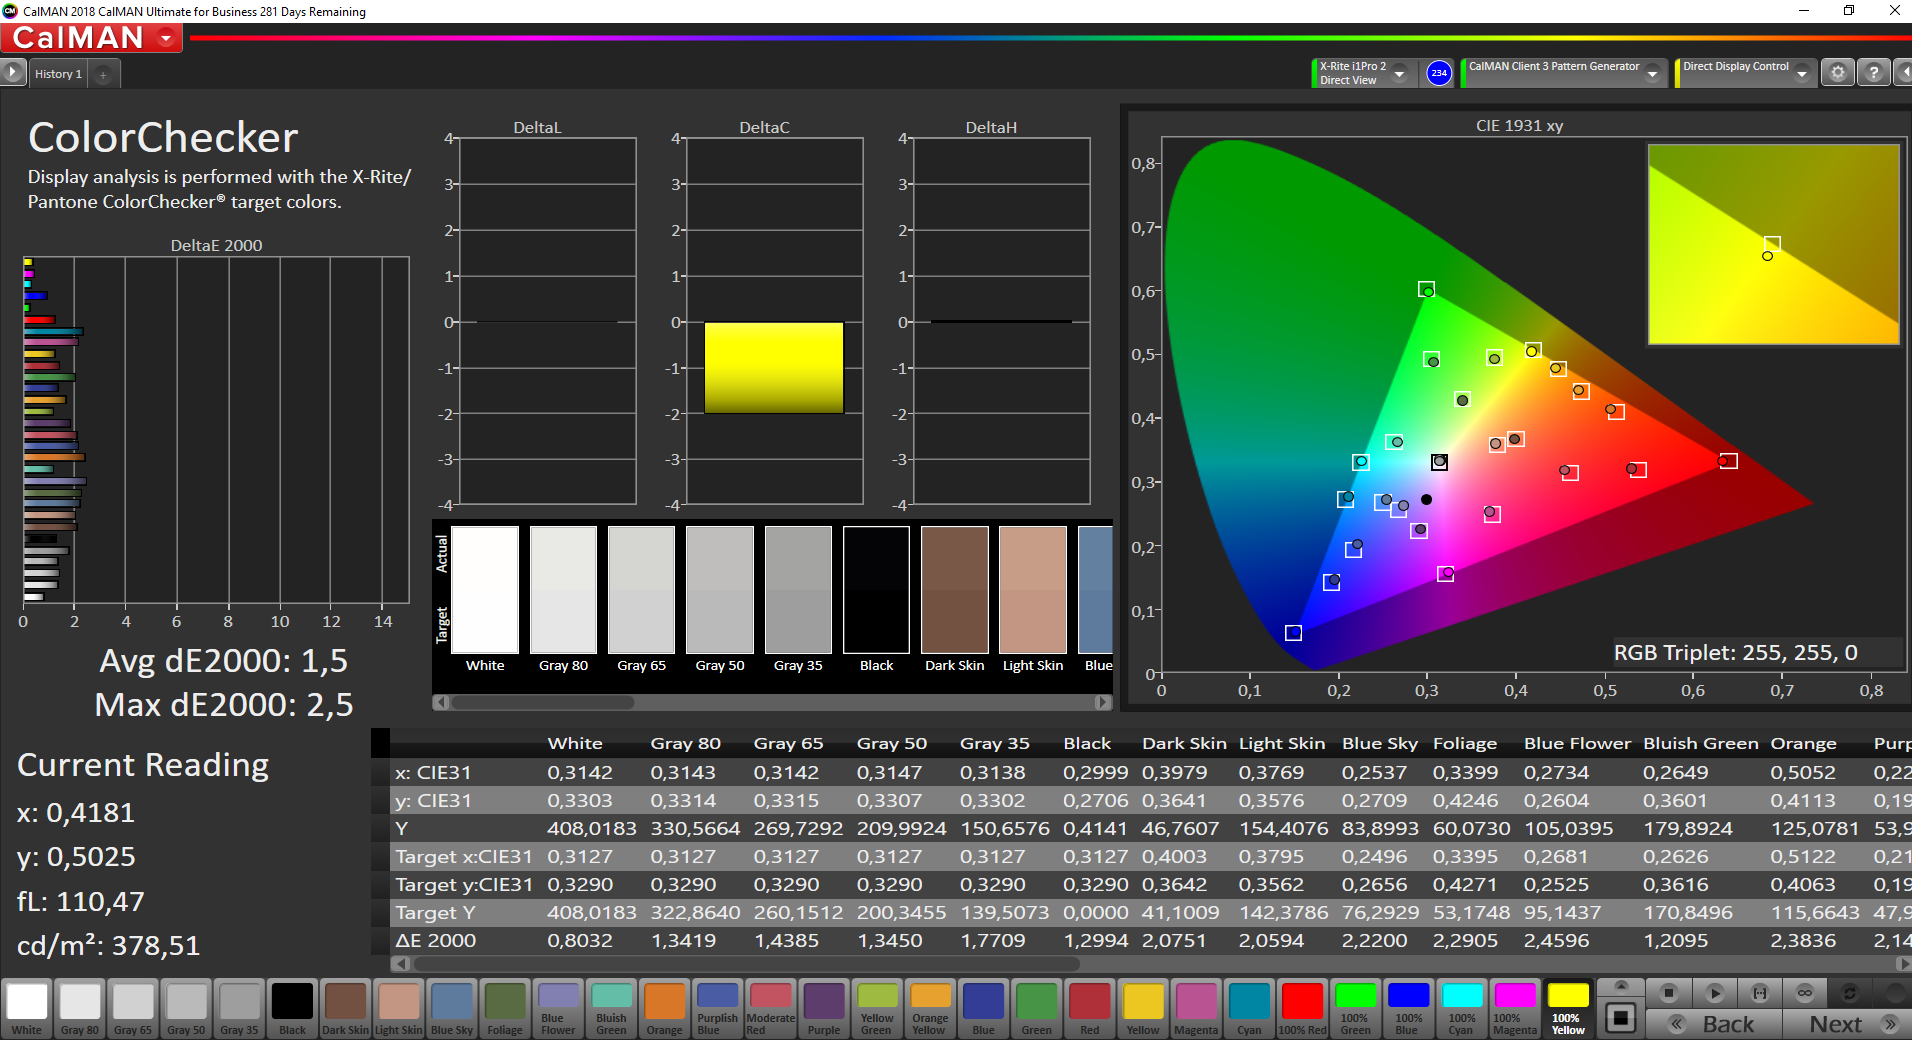
ΔE ColorChecker Calman: 1.5 | ∀{0.5-29.43 Ø4.72}
calibrated: 1.4
ΔE Greyscale Calman: 1.6 | ∀{0.09-98 Ø4.97}
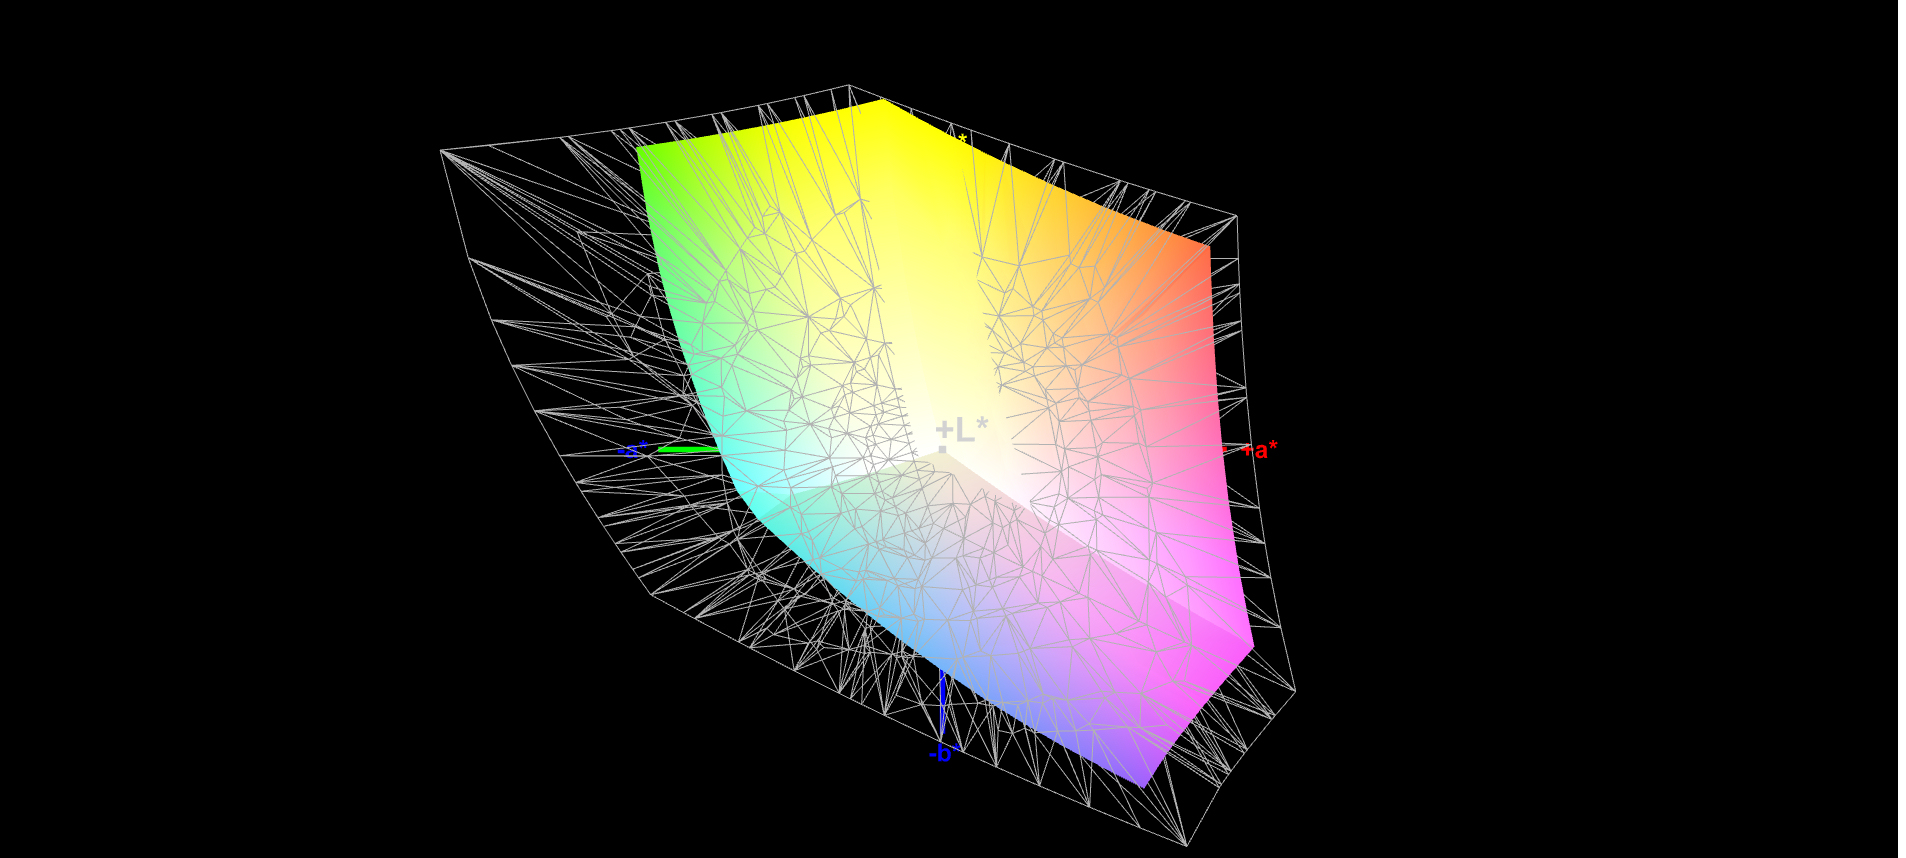
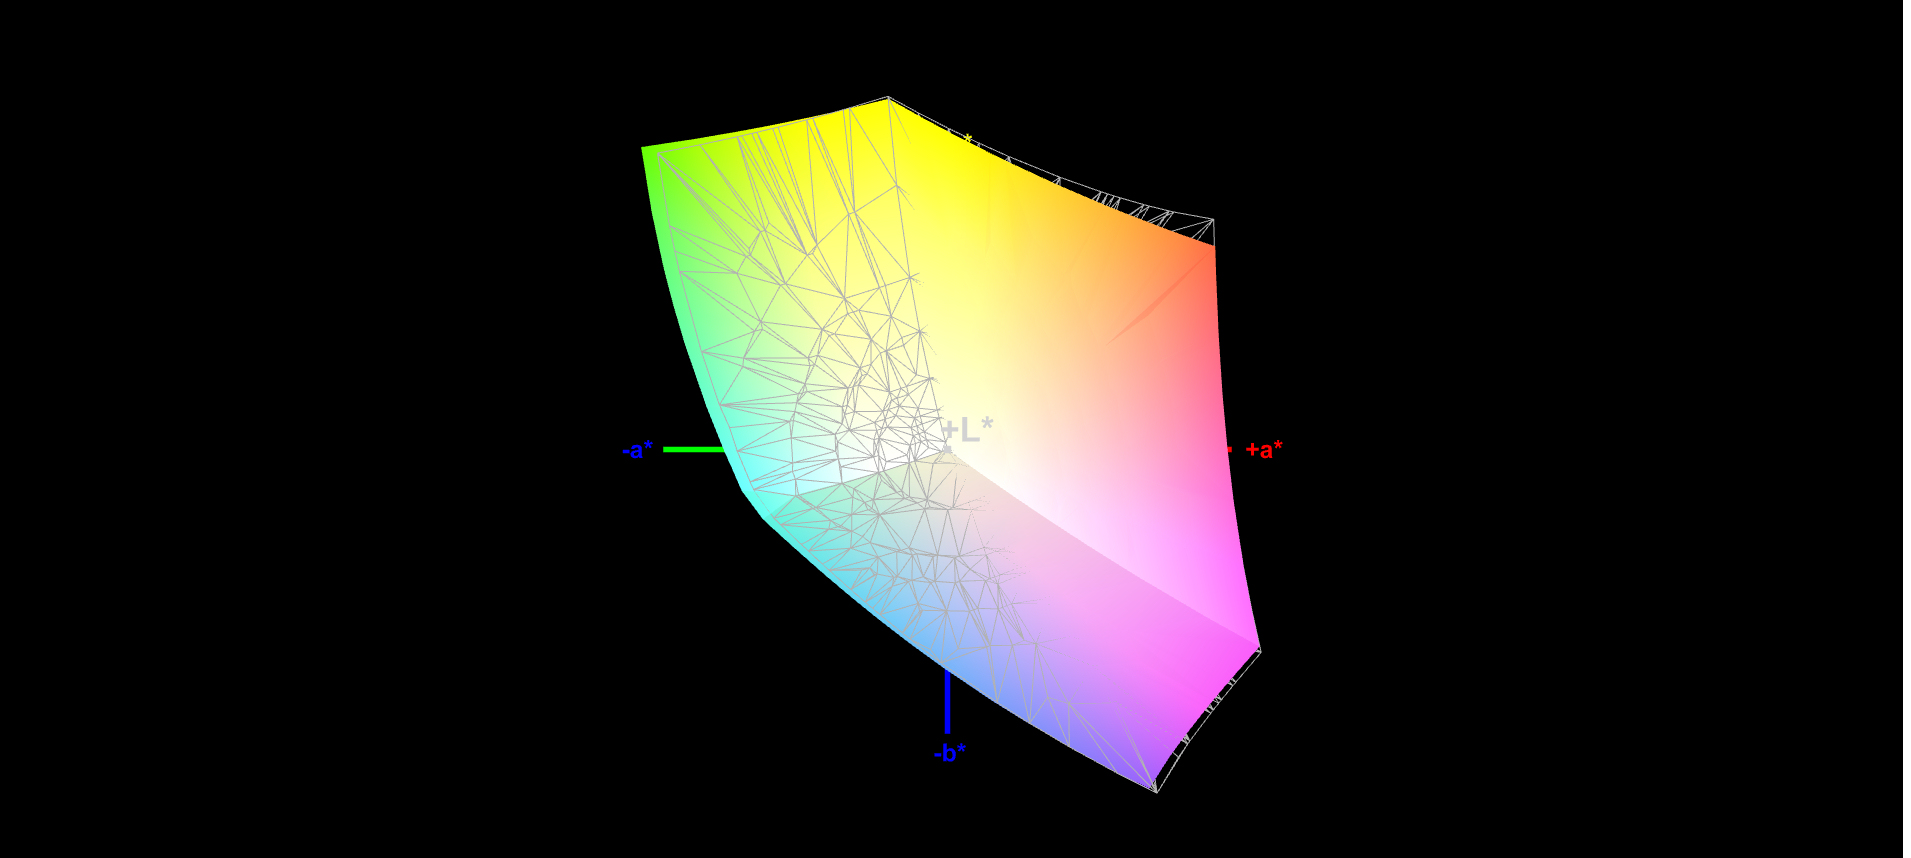
96.8% sRGB (Argyll 1.6.3 3D)
63.7% AdobeRGB 1998 (Argyll 1.6.3 3D)
69.1% AdobeRGB 1998 (Argyll 3D)
96.7% sRGB (Argyll 3D)
66.9% Display P3 (Argyll 3D)
Gamma: 2.05
CCT: 6432 K
| Microsoft Surface Pro 7 Plus LG Philips LP123WQ332684, IPS, 2736x1824, 12.3" | Lenovo Yoga Duet 7 13IML05-82AS000WGE CSOT T3 LEN8290, IPS, 2160x1350, 13" | Dell Latitude 12 7210 2-in-1 Sharp LQ123N1, IPS, 1920x1280, 12.3" | Microsoft Surface Pro 7 LG Philips LP123WQ112604, IPS, 2736x1824, 12.3" | Microsoft Surface Pro 7 Core i5-1035G4 LG Philips LP123WQ112604, IPS, 2736x1824, 12.3" | |
|---|---|---|---|---|---|
| Display | 3% | 0% | -4% | -2% | |
| Display P3 Coverage (%) | 66.9 | 68.9 3% | 67.9 1% | 63.7 -5% | 66 -1% |
| sRGB Coverage (%) | 96.7 | 98.2 2% | 96.8 0% | 95.8 -1% | 93.8 -3% |
| AdobeRGB 1998 Coverage (%) | 69.1 | 71.1 3% | 68.8 0% | 65.7 -5% | 66.9 -3% |
| Response Times | 5% | 48% | 19% | 26% | |
| Response Time Grey 50% / Grey 80% * (ms) | 50.8 ? | 58 ? -14% | 29 ? 43% | 40 ? 21% | 34.8 ? 31% |
| Response Time Black / White * (ms) | 33.6 ? | 26 ? 23% | 16 ? 52% | 28 ? 17% | 26.4 ? 21% |
| PWM Frequency (Hz) | 199.2 ? | 1250 ? | 250 ? | 21550 ? | |
| Screen | -65% | -13% | -6% | -74% | |
| Brightness middle (cd/m²) | 408 | 450 10% | 380 -7% | 435 7% | 480.4 18% |
| Brightness (cd/m²) | 425 | 411 -3% | 378 -11% | 422 -1% | 485 14% |
| Brightness Distribution (%) | 85 | 83 -2% | 86 1% | 90 6% | 91 7% |
| Black Level * (cd/m²) | 0.34 | 0.22 35% | 0.31 9% | 0.32 6% | 0.48 -41% |
| Contrast (:1) | 1200 | 2045 70% | 1226 2% | 1359 13% | 1001 -17% |
| Colorchecker dE 2000 * | 1.5 | 4.15 -177% | 2.28 -52% | 1.18 21% | 5 -233% |
| Colorchecker dE 2000 max. * | 2.5 | 11.49 -360% | 3.93 -57% | 2.27 9% | 7.72 -209% |
| Colorchecker dE 2000 calibrated * | 1.4 | 1.09 22% | 0.97 31% | 3.49 -149% | 2.44 -74% |
| Greyscale dE 2000 * | 1.6 | 6.66 -316% | 2.56 -60% | 1.12 30% | 5.9 -269% |
| Gamma | 2.05 107% | 2.42 91% | 2.32 95% | 2.3 96% | 2.38 92% |
| CCT | 6432 101% | 6043 108% | 6130 106% | 6502 100% | 7805 83% |
| Color Space (Percent of AdobeRGB 1998) (%) | 63.7 | 65 2% | 63 -1% | 60 -6% | 60.3 -5% |
| Color Space (Percent of sRGB) (%) | 96.8 | 98 1% | 97 0% | 96 -1% | 93.2 -4% |
| Media totale (Programma / Settaggio) | -19% /
-44% | 12% /
-3% | 3% /
-2% | -17% /
-48% |
* ... Meglio usare valori piccoli
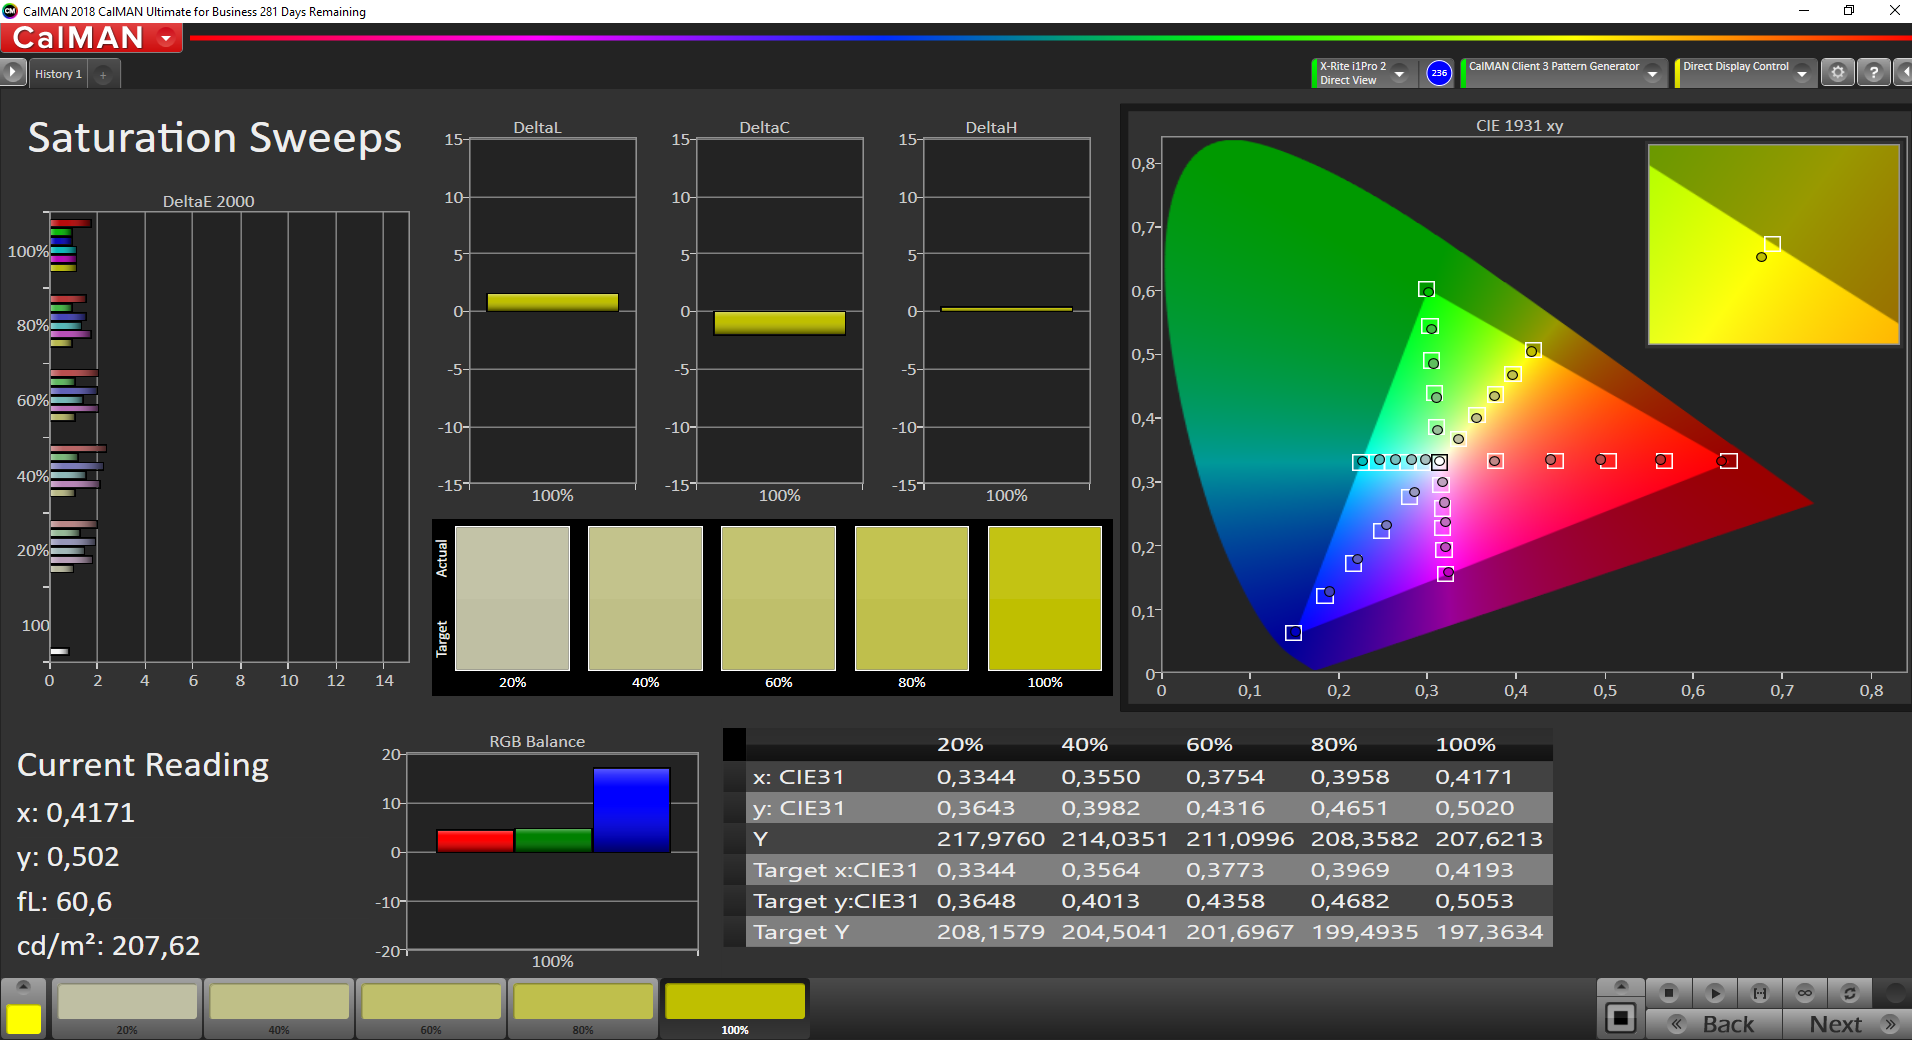
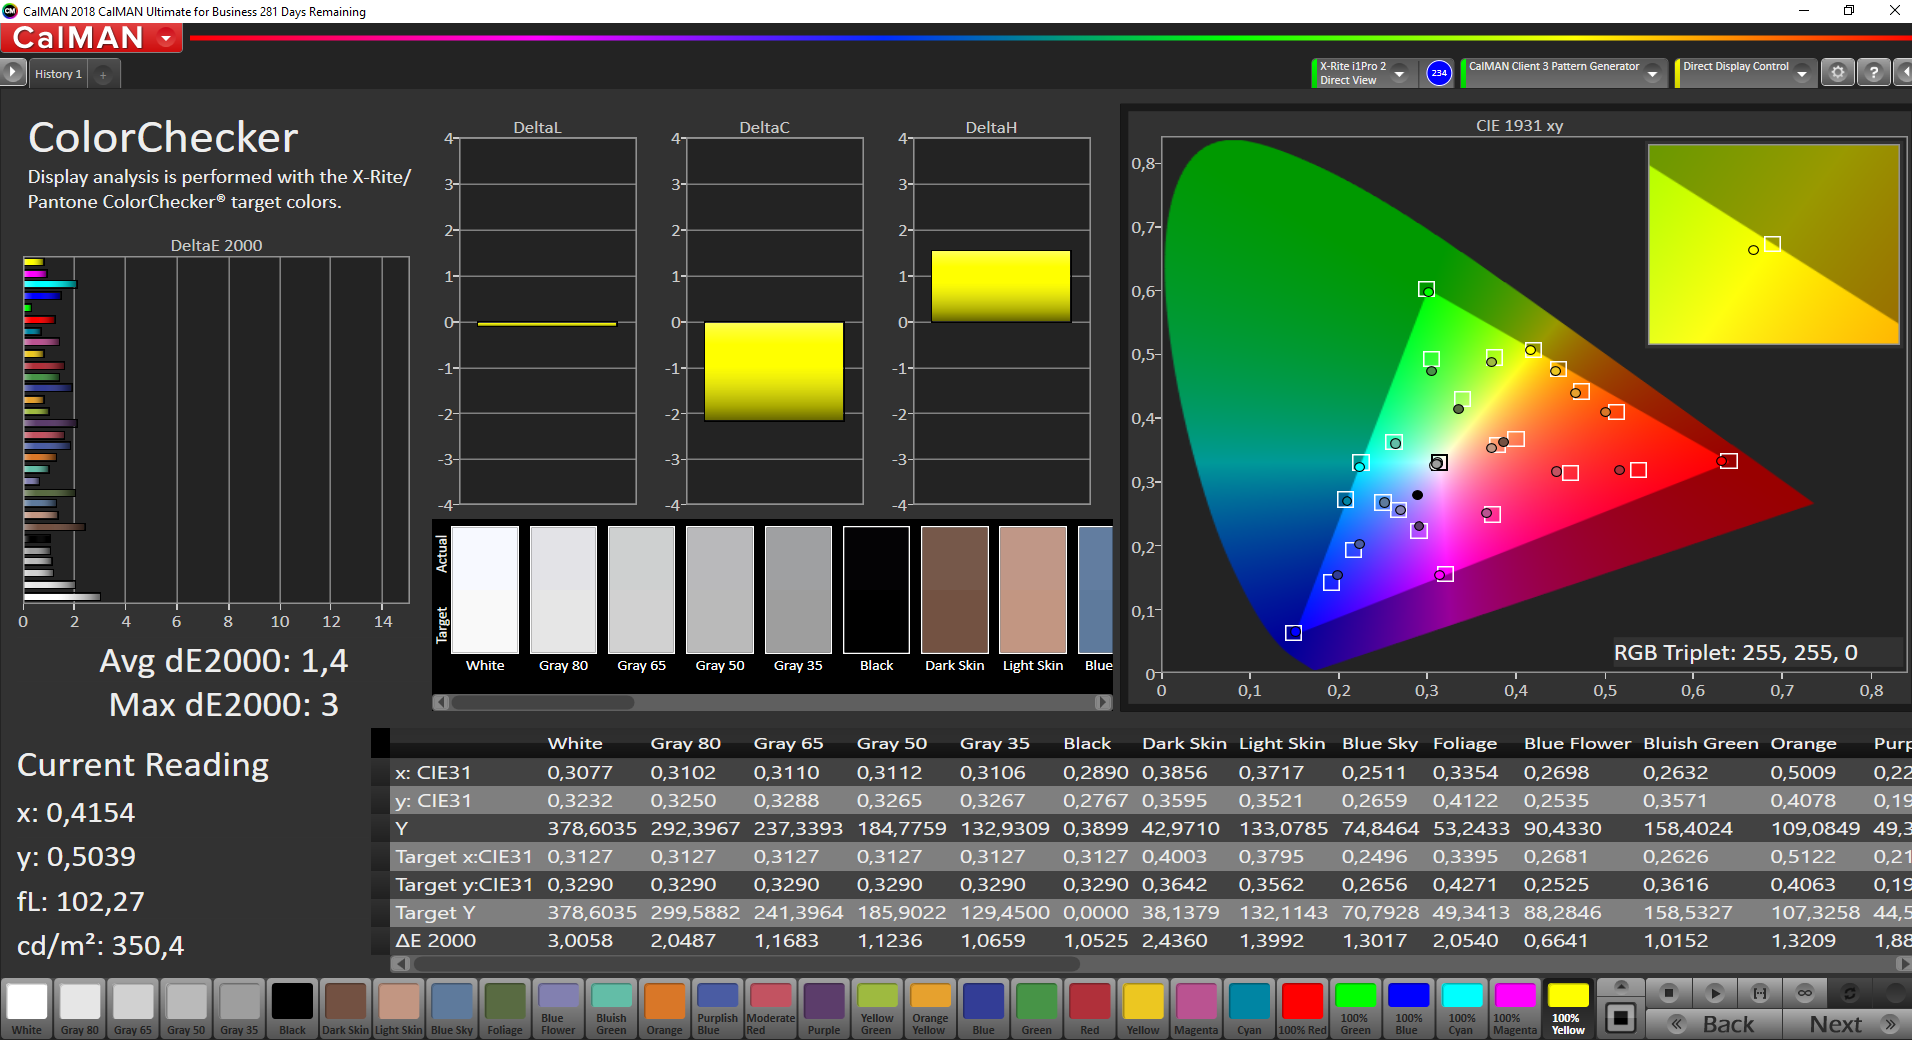
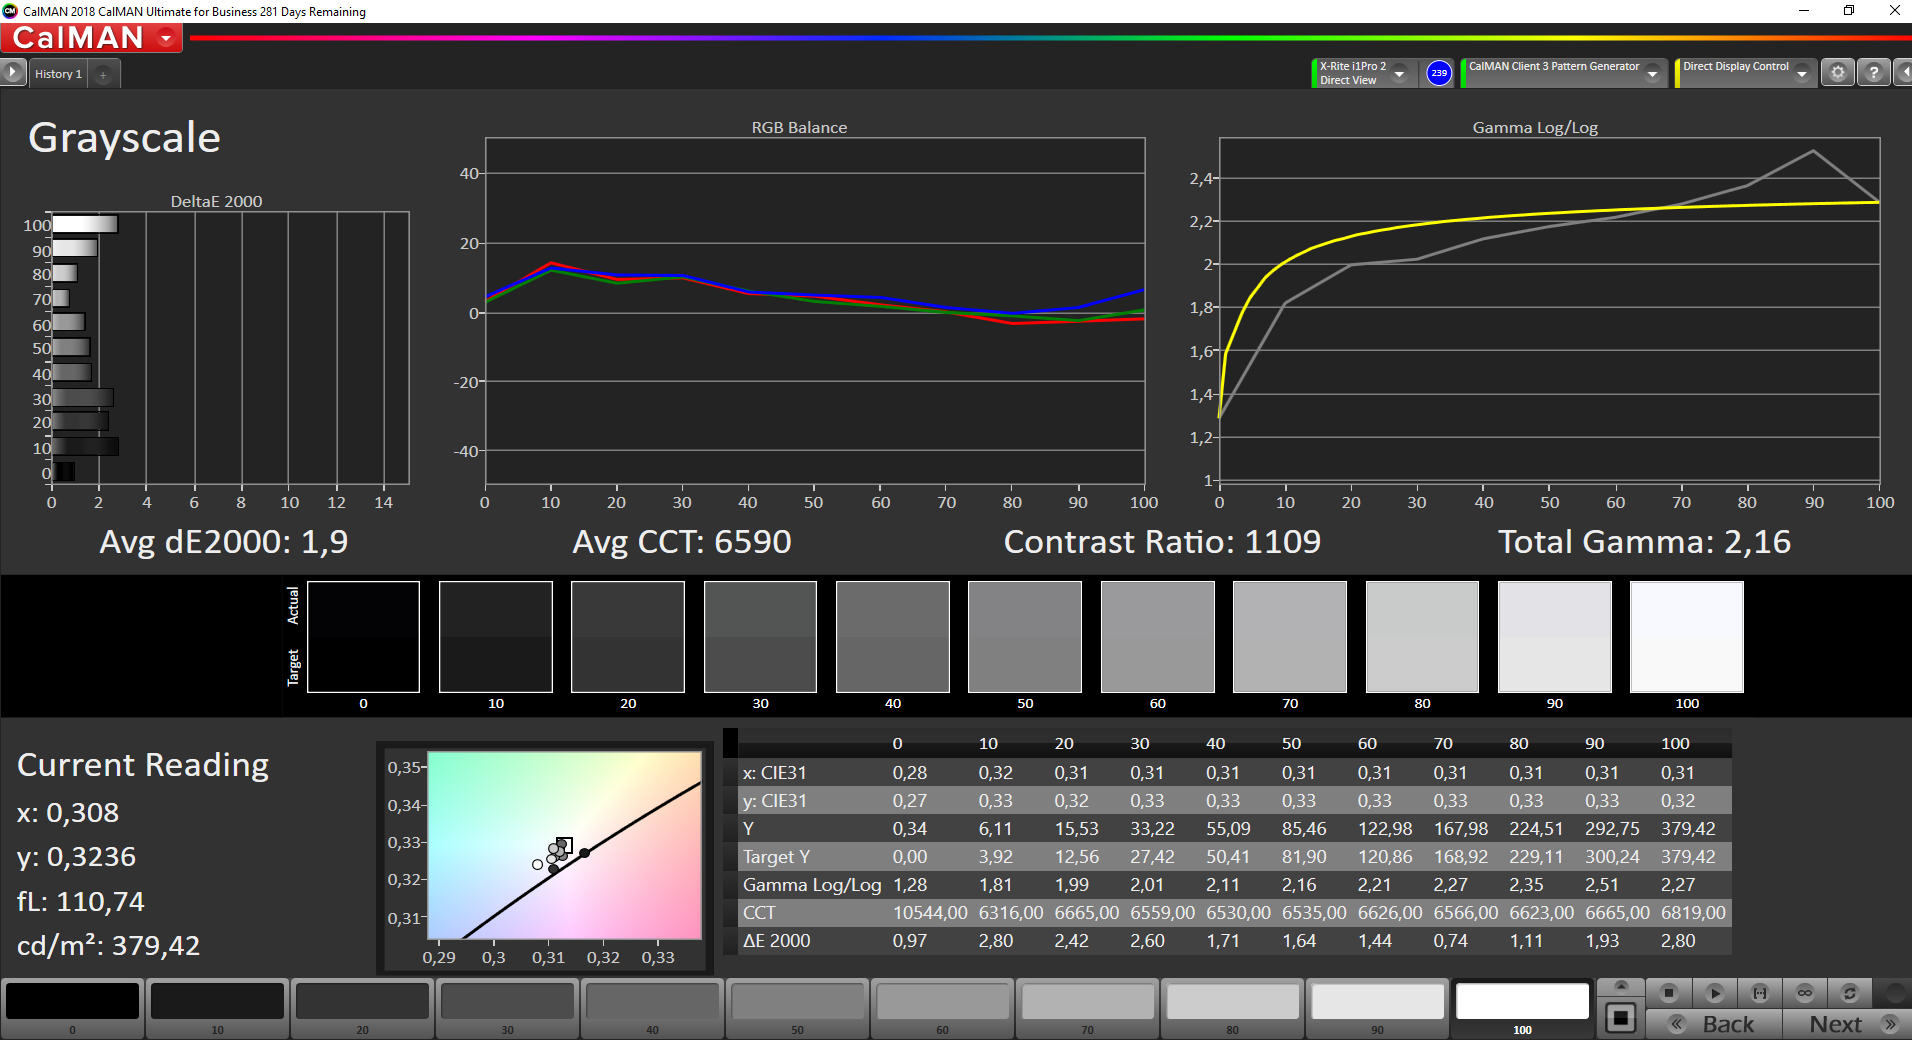
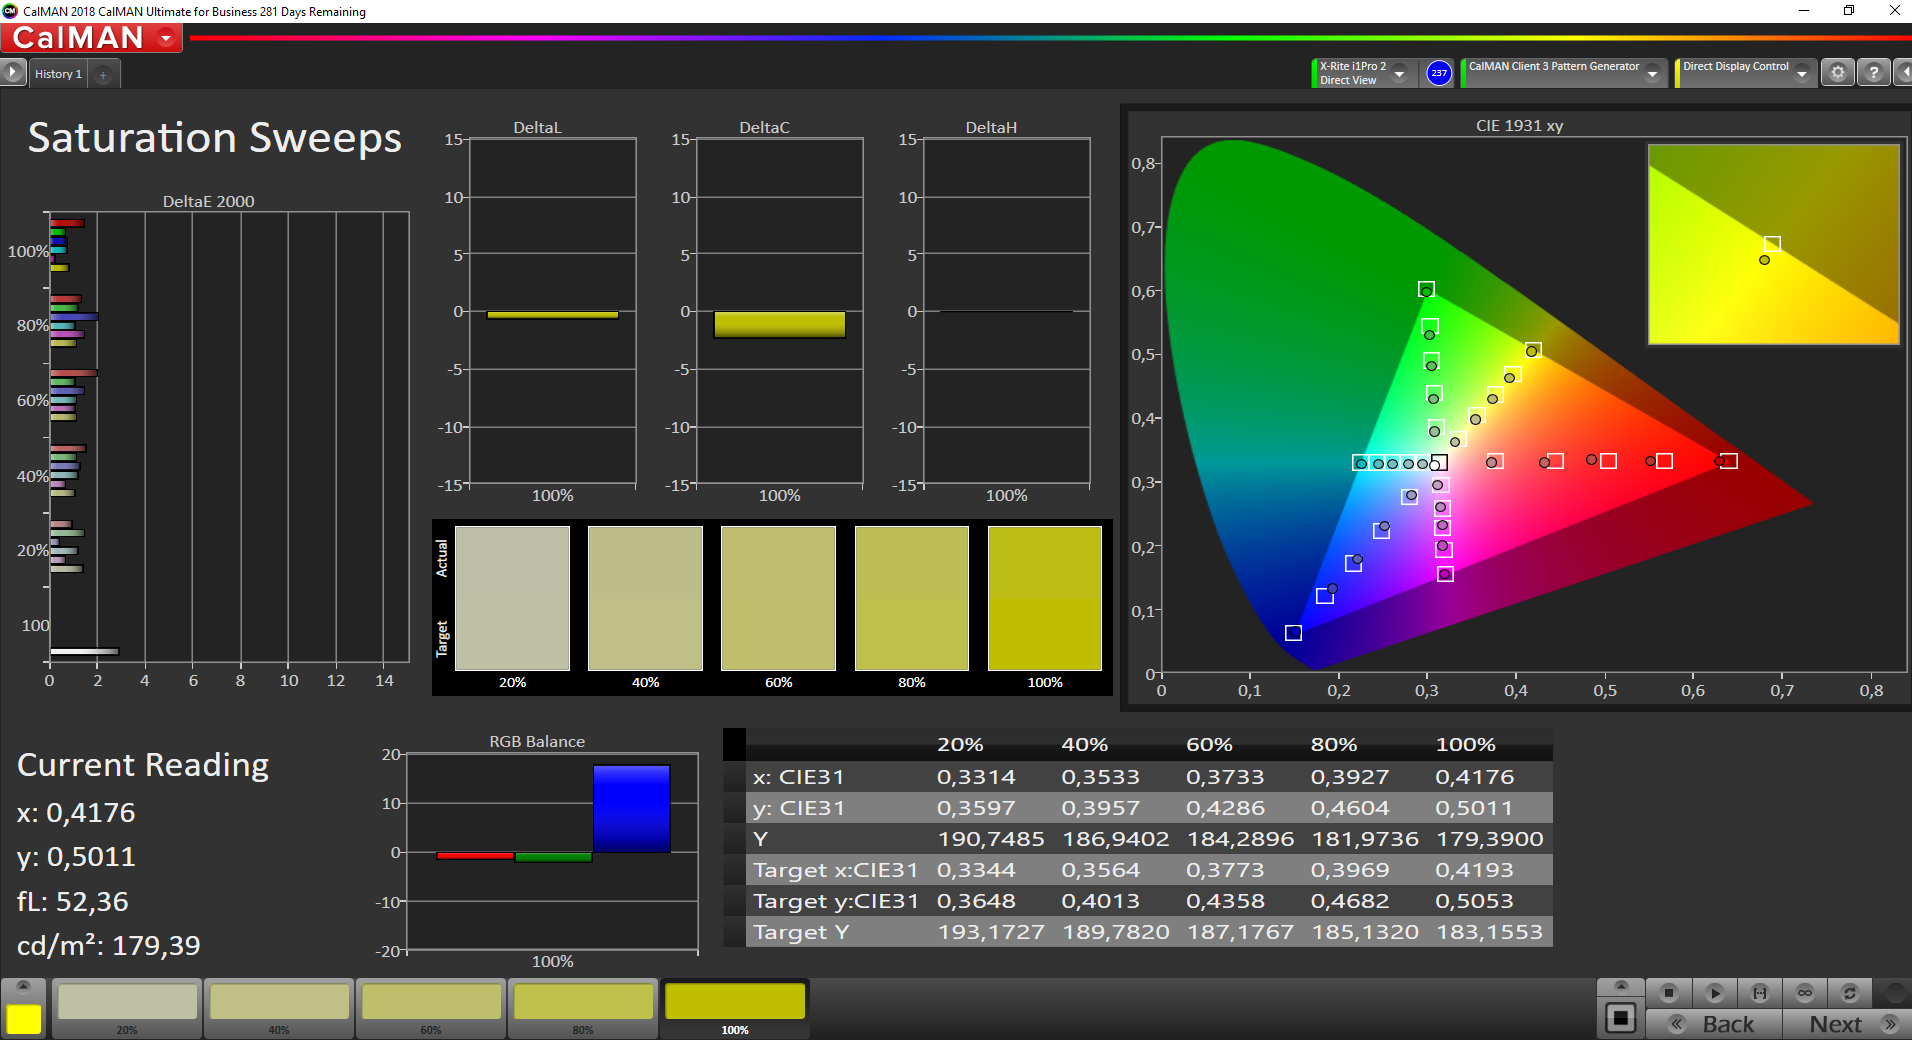
Il display mostra una buona riproduzione dei colori e soddisfa l'obiettivo (Delta E inferiore a 3) con una deviazione di colore di 1,5. Il display non soffre nemmeno di una sfumatura blu. Inoltre, la calibrazione fornisce leggeri miglioramenti: La deviazione del colore scende a 1,4, e le scale di grigio sono visualizzate in modo più equilibrato. Il display non può riprodurre completamente gli spazi colore AdobeRGB (63,7%) e sRGB (96,8%).

Tempi di risposta del Display
| ↔ Tempi di risposta dal Nero al Bianco | ||
|---|---|---|
| 33.6 ms ... aumenta ↗ e diminuisce ↘ combinato | ↗ 18.8 ms Incremento | 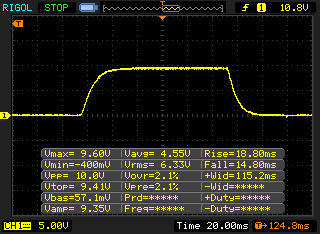 |
| ↘ 14.8 ms Calo | ||
| Lo schermo mostra tempi di risposta lenti nei nostri tests e sarà insoddisfacente per i gamers. In confronto, tutti i dispositivi di test variano da 0.1 (minimo) a 240 (massimo) ms. » 90 % di tutti i dispositivi è migliore. Questo significa che i tempi di risposta rilevati sono peggiori rispetto alla media di tutti i dispositivi testati (19.9 ms). | ||
| ↔ Tempo di risposta dal 50% Grigio all'80% Grigio | ||
| 50.8 ms ... aumenta ↗ e diminuisce ↘ combinato | ↗ 25.2 ms Incremento | 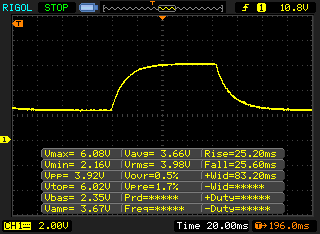 |
| ↘ 25.6 ms Calo | ||
| Lo schermo mostra tempi di risposta lenti nei nostri tests e sarà insoddisfacente per i gamers. In confronto, tutti i dispositivi di test variano da 0.165 (minimo) a 636 (massimo) ms. » 87 % di tutti i dispositivi è migliore. Questo significa che i tempi di risposta rilevati sono peggiori rispetto alla media di tutti i dispositivi testati (31.1 ms). | ||
Sfarfallio dello schermo / PWM (Pulse-Width Modulation)
| flickering dello schermo / PWM rilevato | 199.2 Hz | ≤ 57 % settaggio luminosita' | 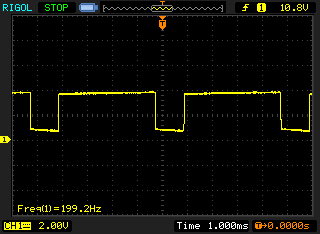 |
| ≤ 119 luminosita' cd/m² | |||
Il display sfarfalla a 199.2 Hz (Probabilmente a causa dell'uso di PWM) Flickering rilevato ad una luminosita' di 57 % (119 cd/m²) o inferiore. Non dovrebbe verificarsi flickering o PWM sopra questo valore di luminosita'. La frequenza di 199.2 Hz è relativamente bassa, quindi gli utenti sensibili potrebbero notare il flickering ed accusare stanchezza agli occhi a questo livello di luminosità e a livelli inferiori. Il flickering di verifica con settaggi di luminosita' relativamente bassa, quindi un utilizzo prolungato a questi livelli o a livelli ingeriori potrebbe causare stanchezza agli occhi. In confronto: 52 % di tutti i dispositivi testati non utilizza PWM per ridurre la luminosita' del display. Se è rilevato PWM, una media di 7784 (minimo: 5 - massimo: 343500) Hz è stata rilevata. | |||
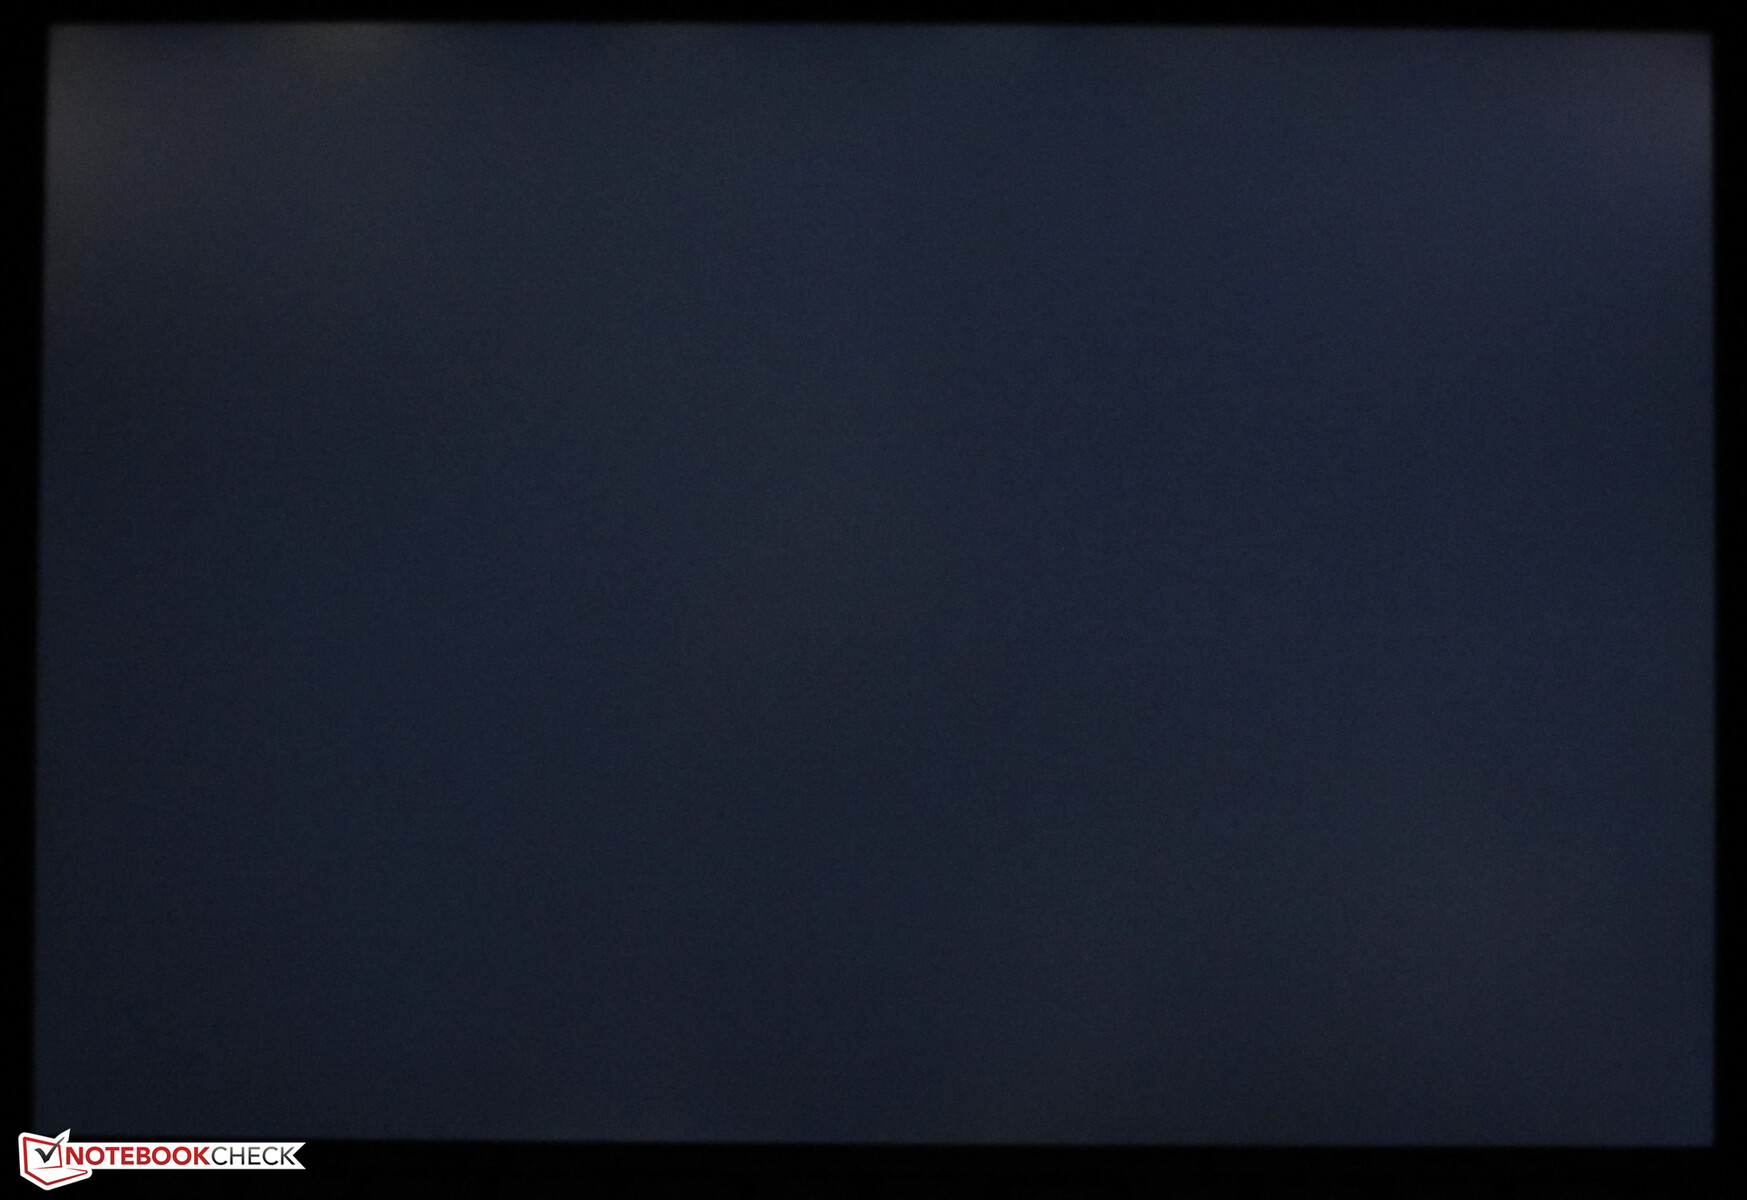
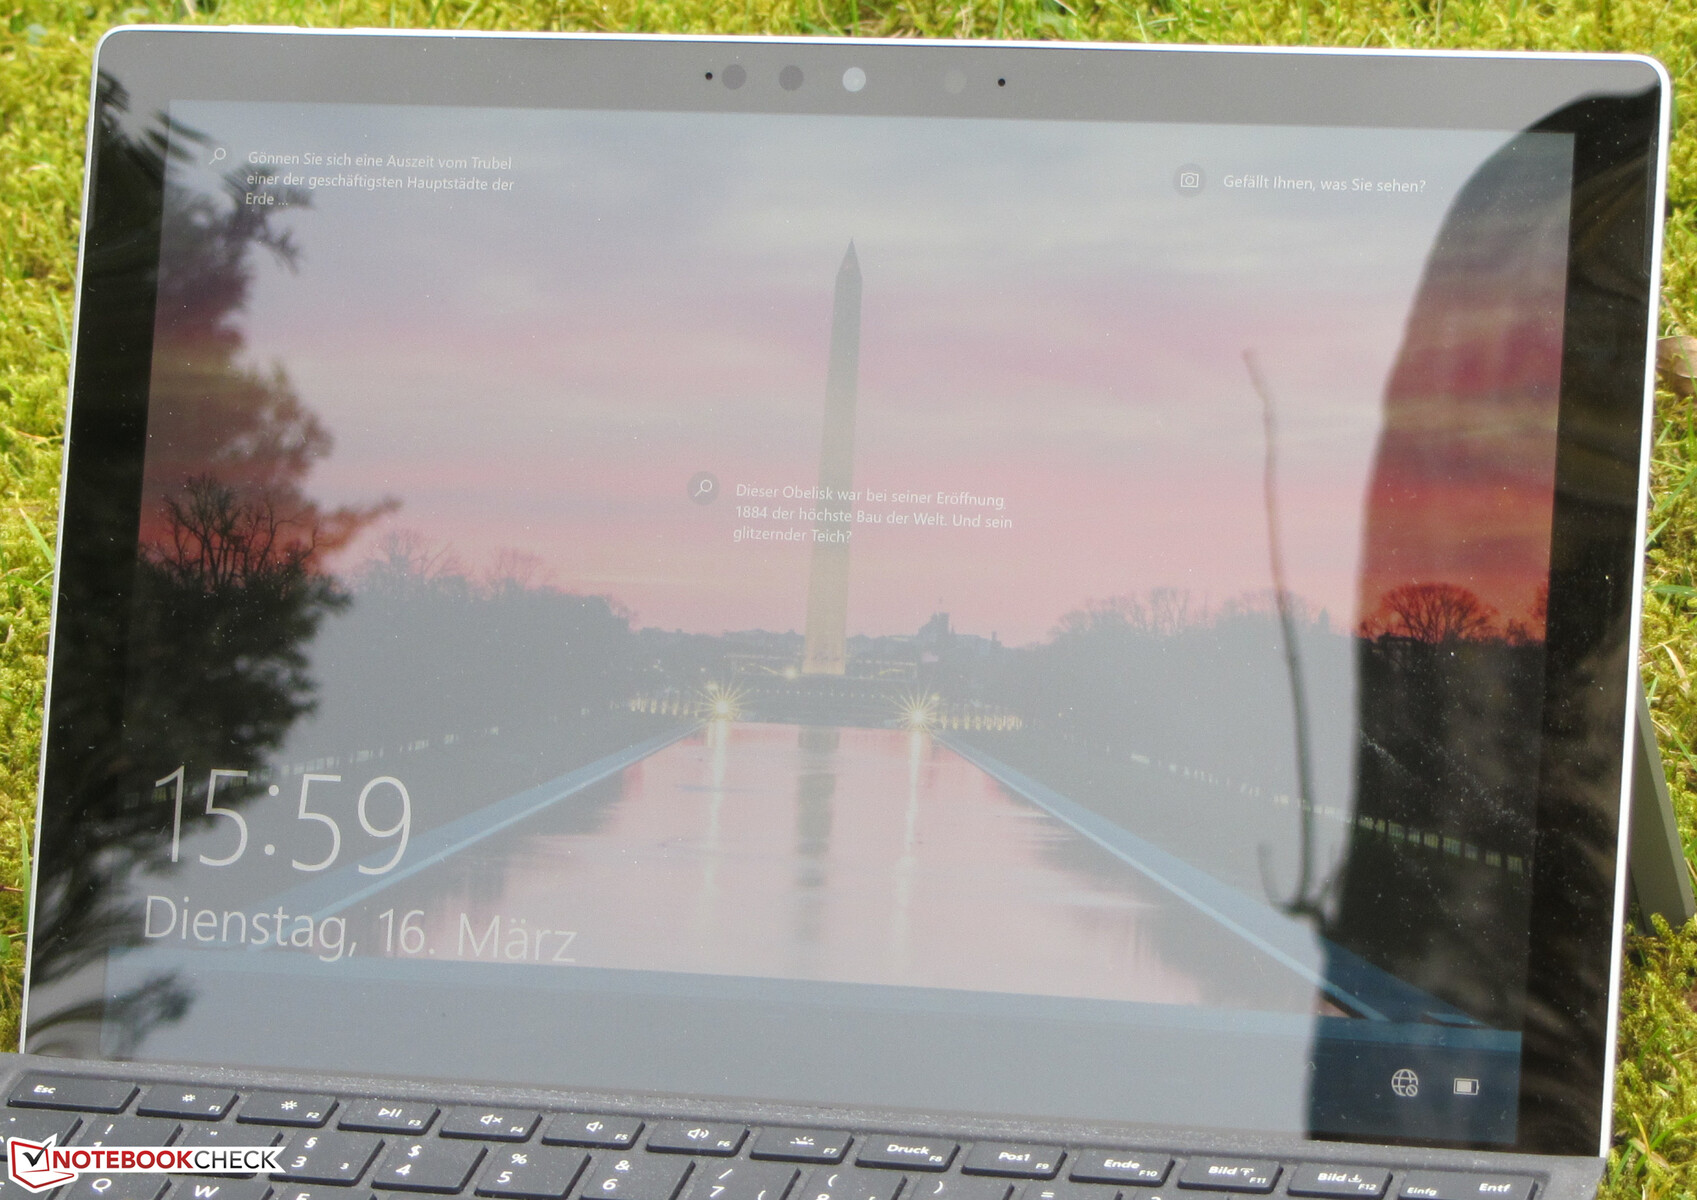
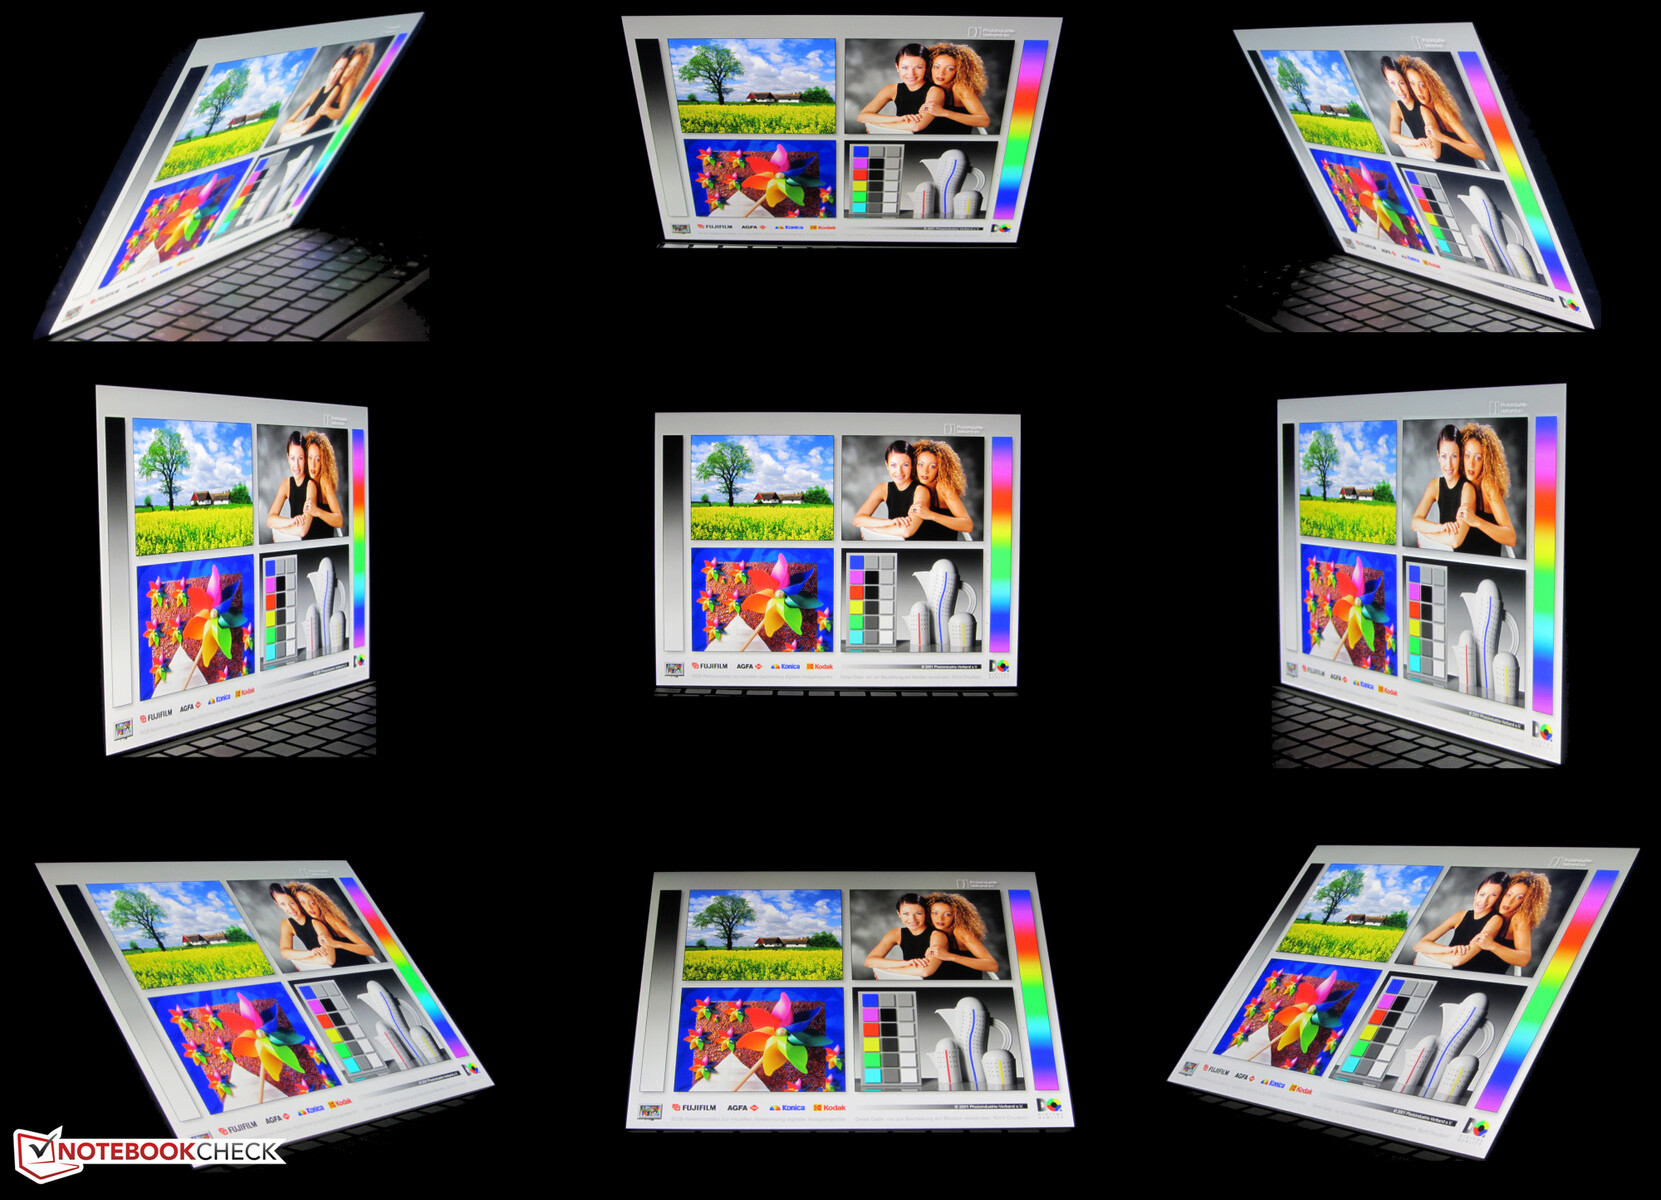
Il pannello IPS ha uno stabile nell'angolo di visione e può essere letto da qualsiasi posizione. Offre abbastanza luminosità per essere visto anche all'aperto. Tuttavia, la superficie lucida del display spesso ostacola la leggibilità
Prestazioni - Più prestazioni grazie al Tiger Lake
Il Surface Pro 7 Plus di Microsoft è un dispositivo 2-in-1 da 12,3" per le imprese e le scuole che offre abbastanza potenza di calcolo per l'ufficio e le applicazioni Internet. Sono disponibili una varietà di configurazioni.
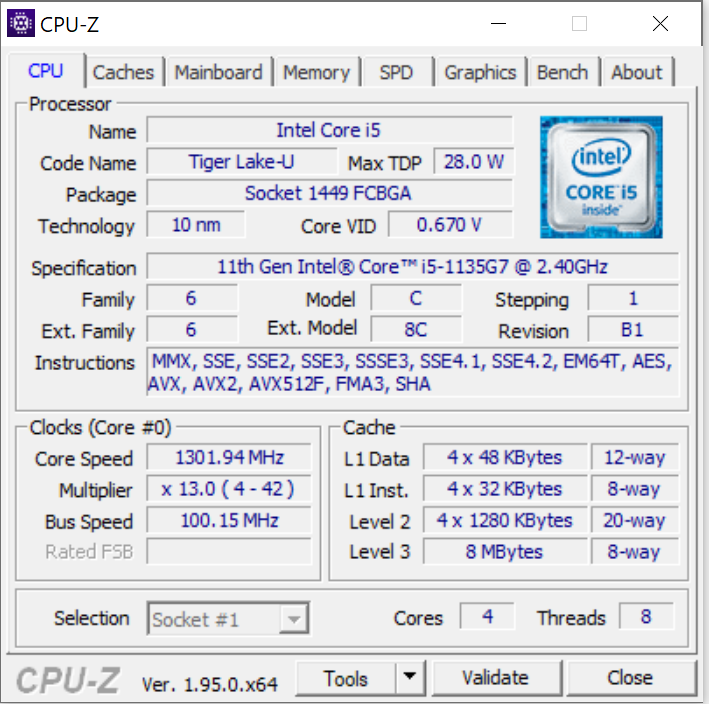
Processore
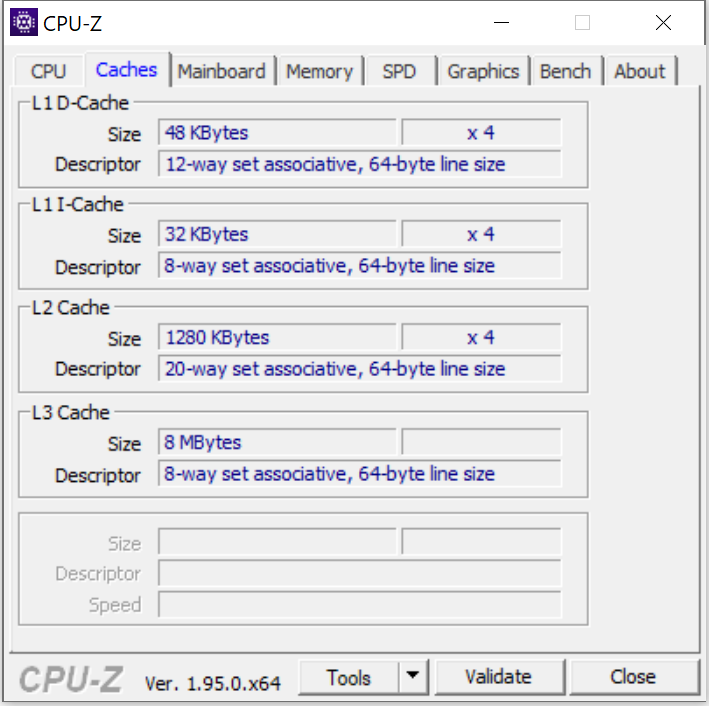
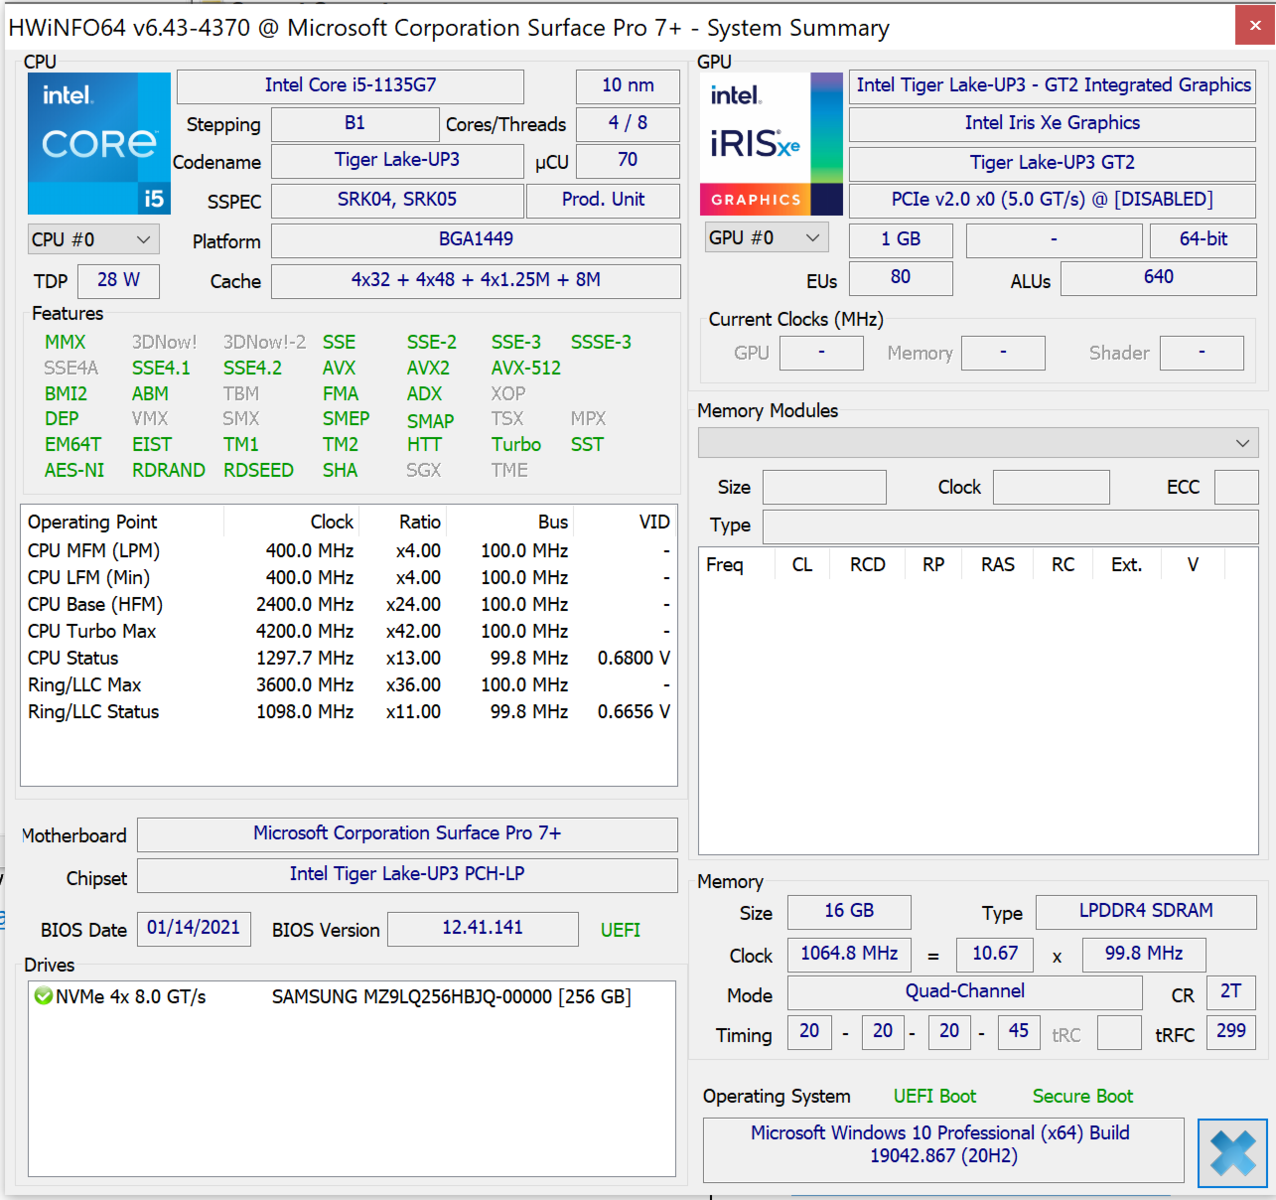
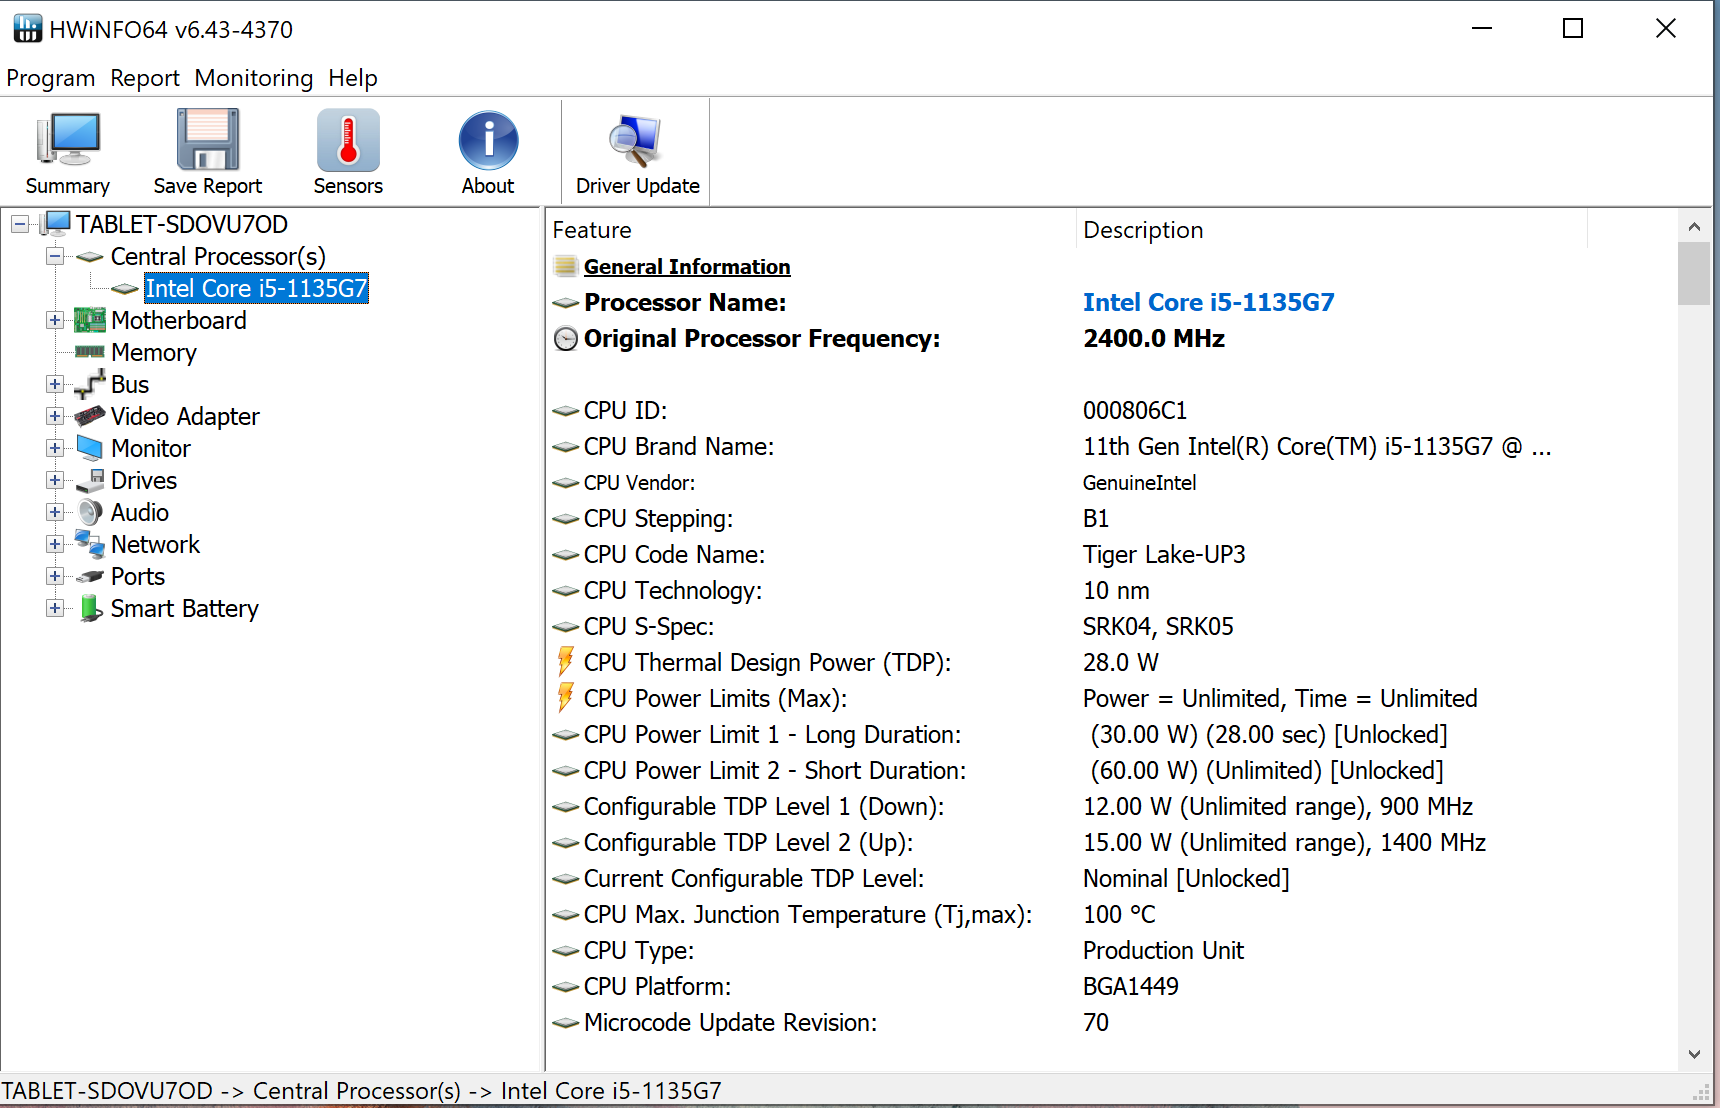
Microsoft ha optato per la CPU Tiger Lake per il modello Plus del Surface Pro 7. Il nostro esemplare in prova è dotato di un processore quad-core Core i5-1135G7 che funziona ad una velocità di clock di base di 2,4 GHz. Un aumento a 3.8 GHz (tutti i cores) o 4.2 GHz (un core) è possibile tramite Turbo. L'Hyper-Threading (due threads per core) è supportato.
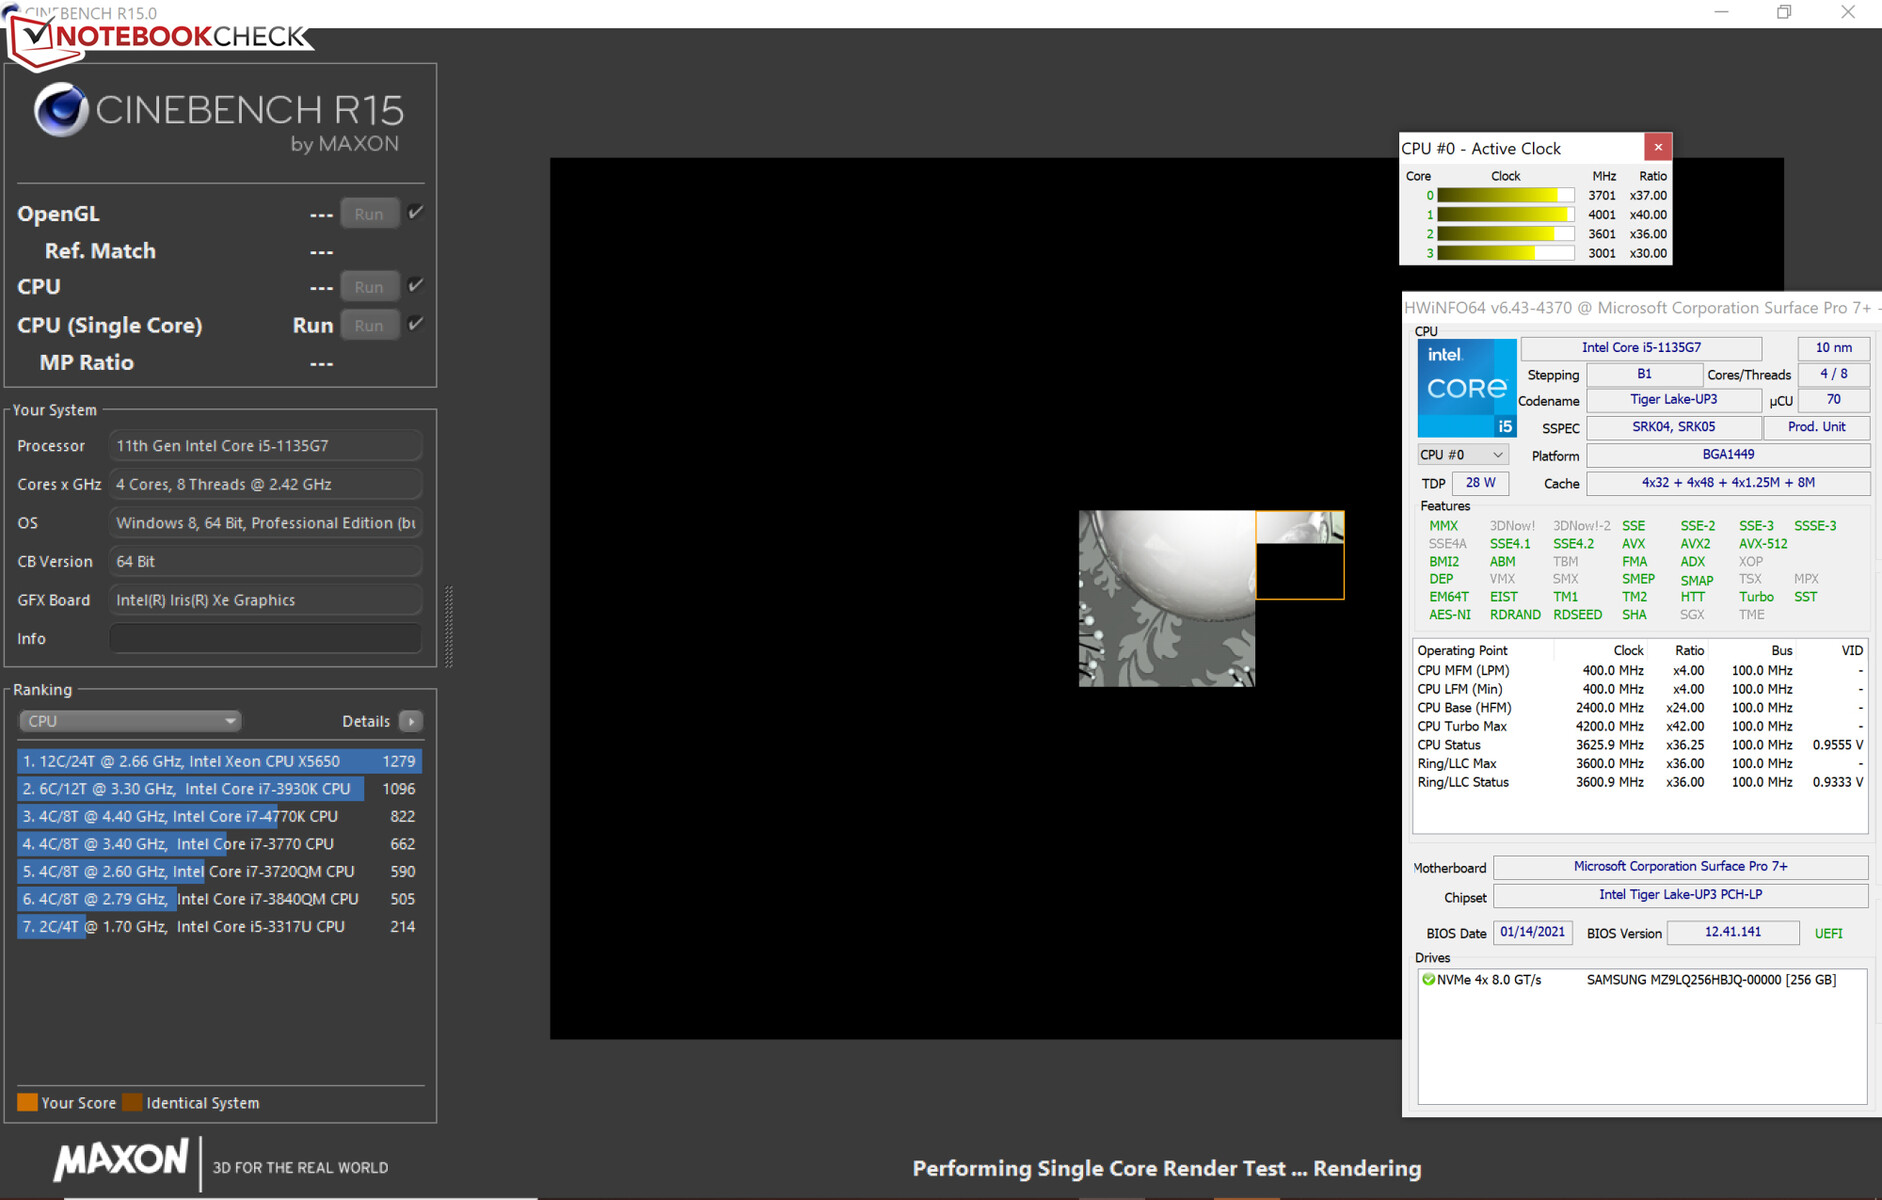
I test multithread dei benchmarks Cinebench sono eseguiti a 3 - 3.5 GHz, mentre i test single-thread sono eseguiti a 3.1 - 4.1 GHz. A batteria, le frequenze di clock sono da 2,4 a 2,8 GHz (multithread) e da 1,5 a 2,5 GHz (single-thread), rispettivamente.
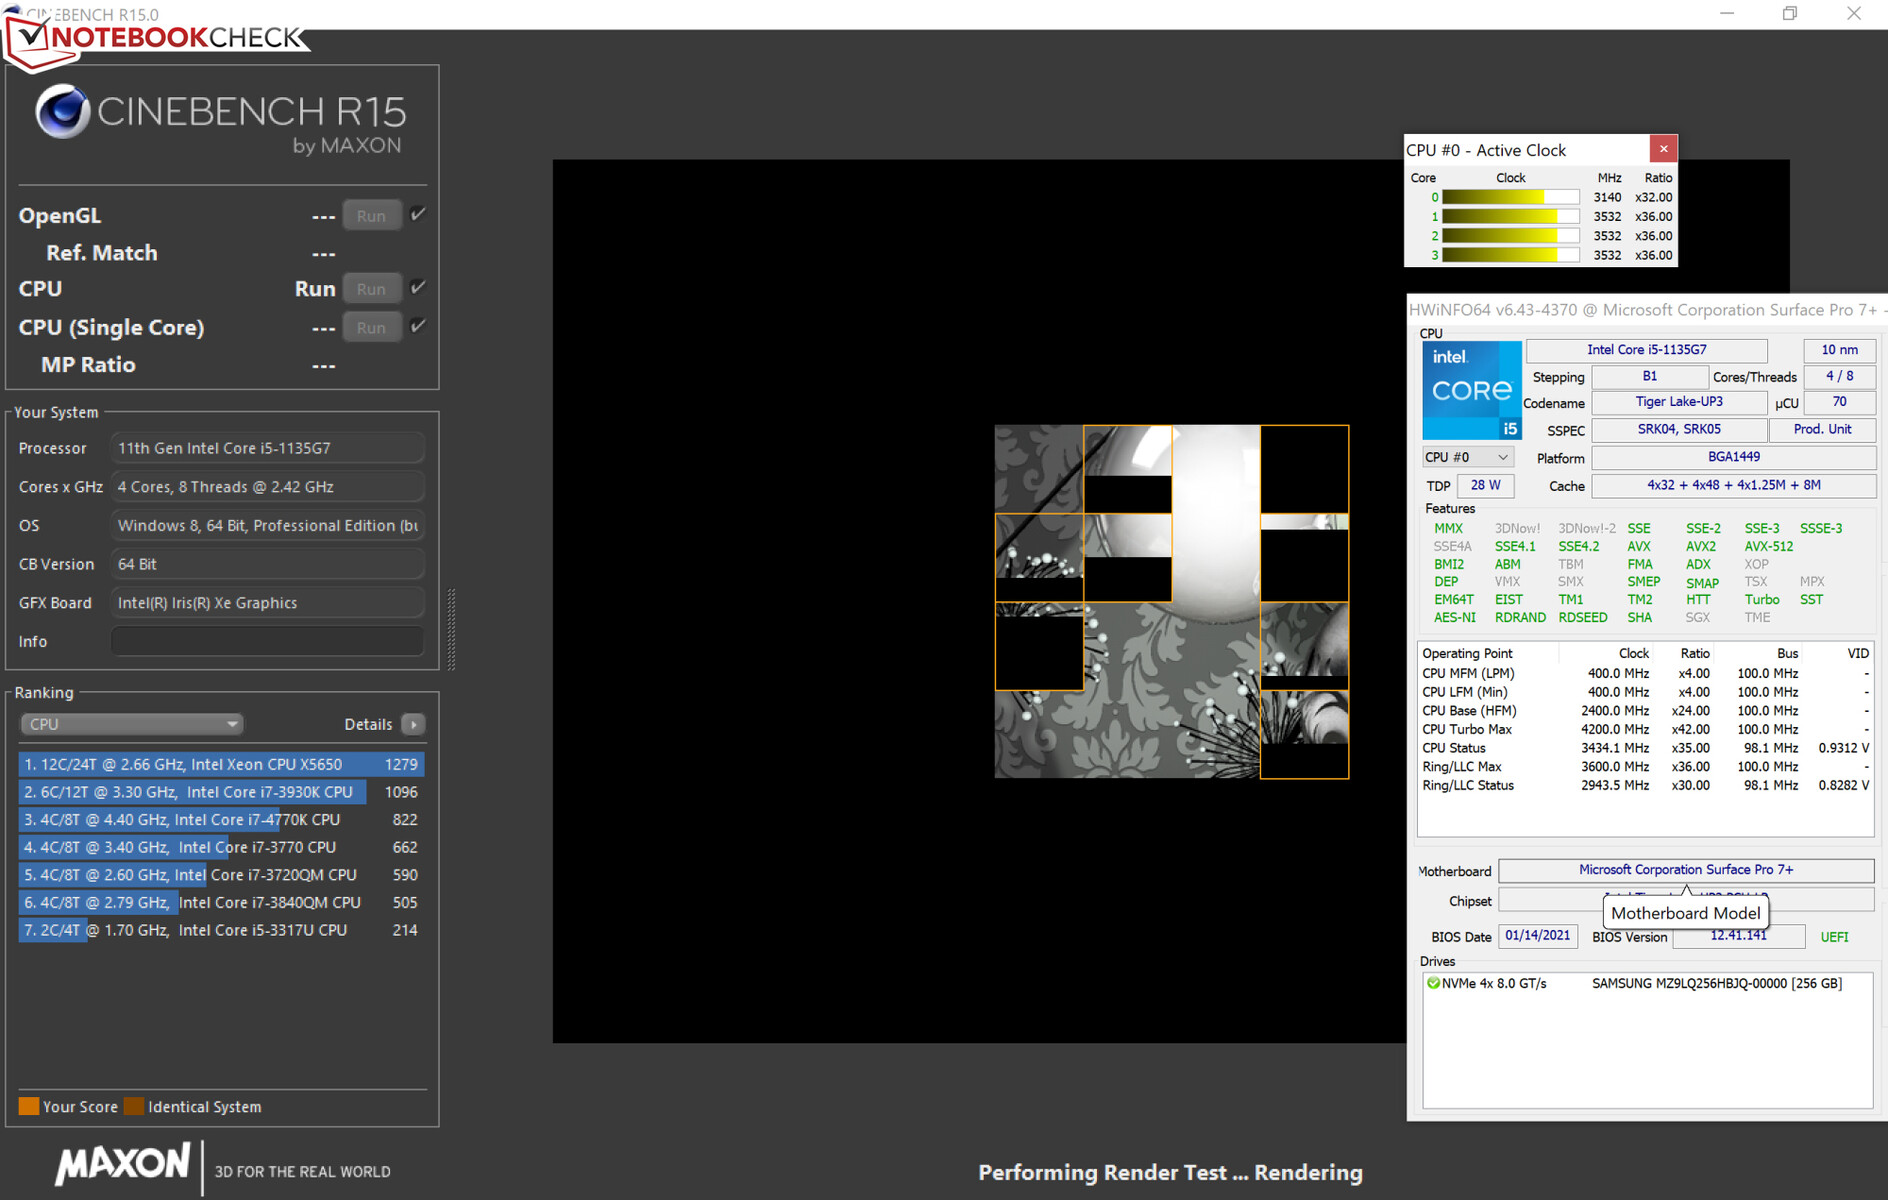
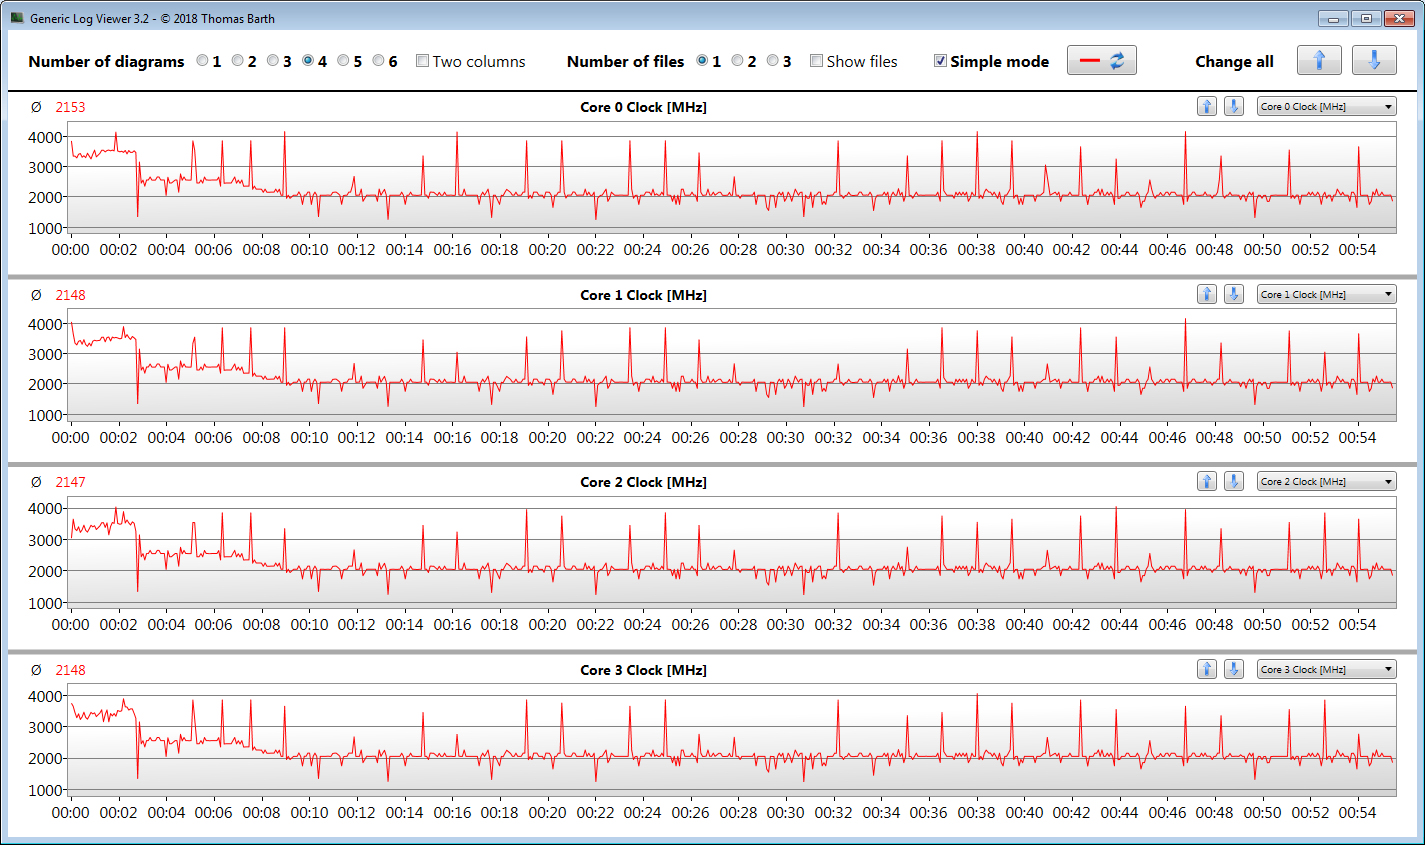
Verifichiamo se la CPU Turbo è utilizzata in modo costante quando è collegata, eseguendo il test multithread del benchmark Cinebench R15 in un ciclo continuo per almeno 30 minuti. Le velocità di clock oltre i 3 GHz sono raggiunte solo nei primi tre minuti del test. Nel corso successivo, la CPU deve essere limitata e scende sotto la sua velocità di clock di base - il raffreddamento passivo diventa evidente in questo caso.
Tutto sommato, i risultati del benchmark sono buoni. Il processore Tiger Lake risponde a brevi picchi di carico con molta potenza di calcolo e supera il processore Ice Lake Core i5 del Surface Pro 7. Tuttavia, le prestazioni sono messe in ginocchio sotto un carico prolungato.
* ... Meglio usare valori piccoli
Prestazioni di sistema
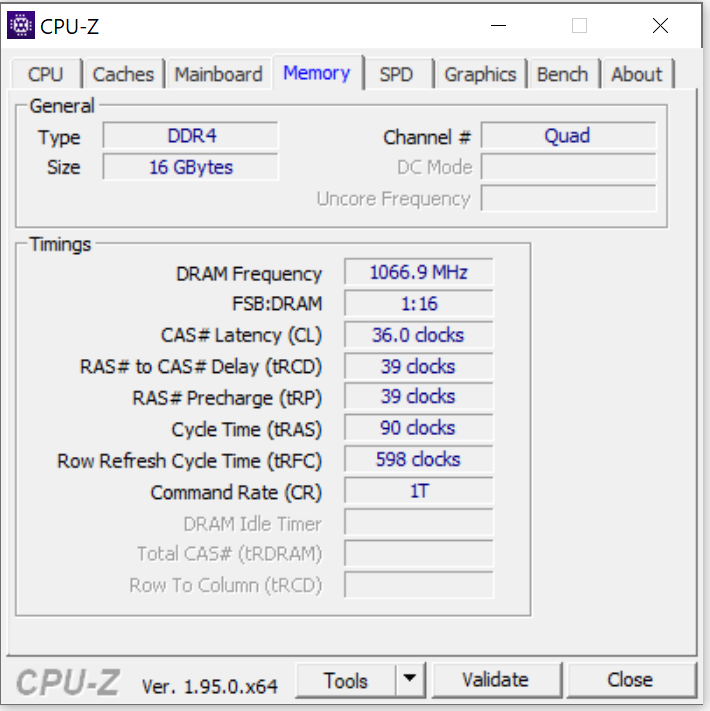
Il sistema fluido e veloce non ha causato alcun problema. Offre una potenza di calcolo più che sufficiente per le applicazioni d'ufficio e Internet. Questo è completato da buoni risultati PCMark. La RAM di questo 12.3" (16 GB, LPDDR4X, on-board) funziona in modalità quad-channel. Non è possibile espandere la memoria.
| PCMark 8 Home Score Accelerated v2 | 3472 punti | |
| PCMark 8 Creative Score Accelerated v2 | 4157 punti | |
| PCMark 8 Work Score Accelerated v2 | 2473 punti | |
| PCMark 10 Score | 4026 punti | |
Aiuto | ||
Latenze DPC
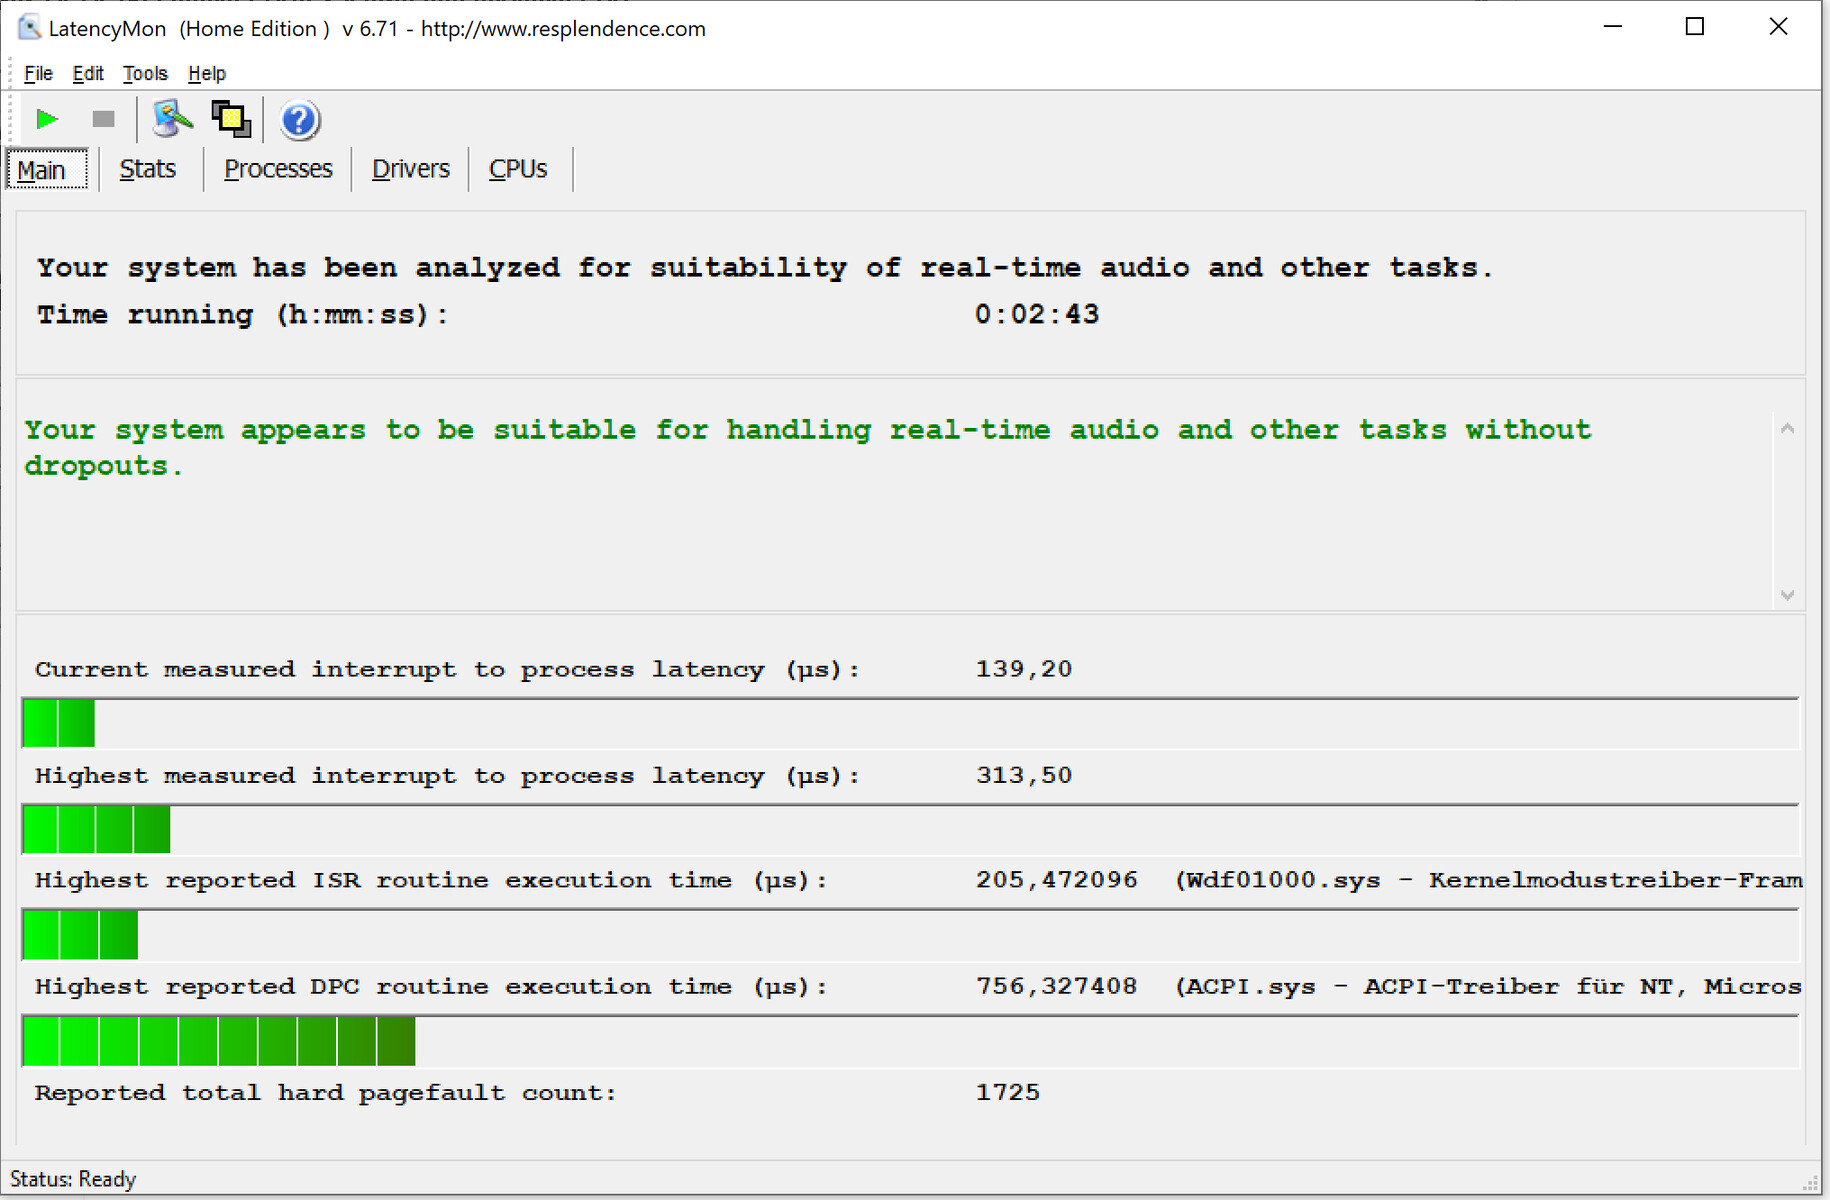
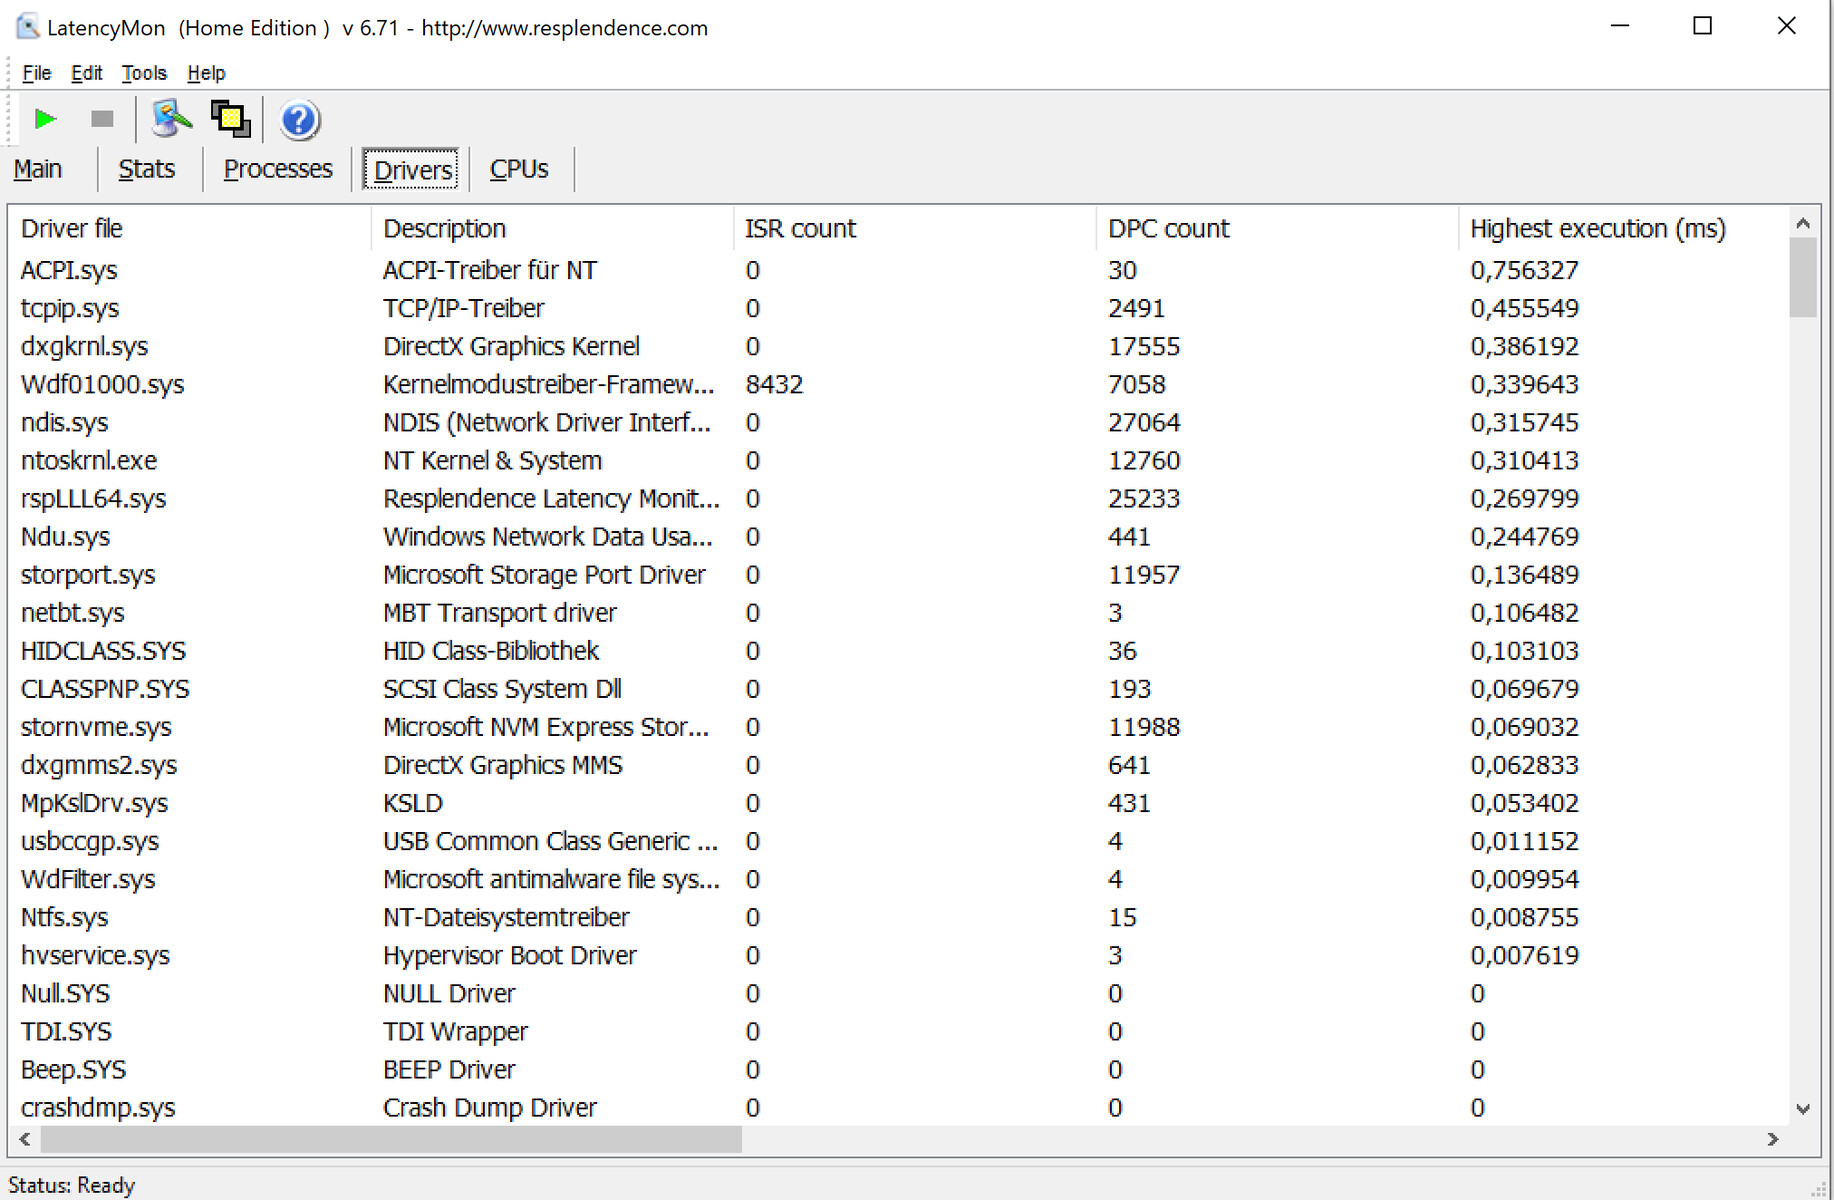
Nel nostro test standardizzato di monitoraggio della latenza (navigazione web, riproduzione video 4K, alto carico Prime95), non abbiamo notato alcun problema con le latenze DPC. Il sistema sembra essere adatto per l'editing video e audio in tempo reale.
| DPC Latencies / LatencyMon - interrupt to process latency (max), Web, Youtube, Prime95 | |
| Lenovo Yoga Duet 7 13IML05-82AS000WGE | |
| Dell Latitude 12 7210 2-in-1 | |
| Microsoft Surface Pro 7 Plus | |
* ... Meglio usare valori piccoli
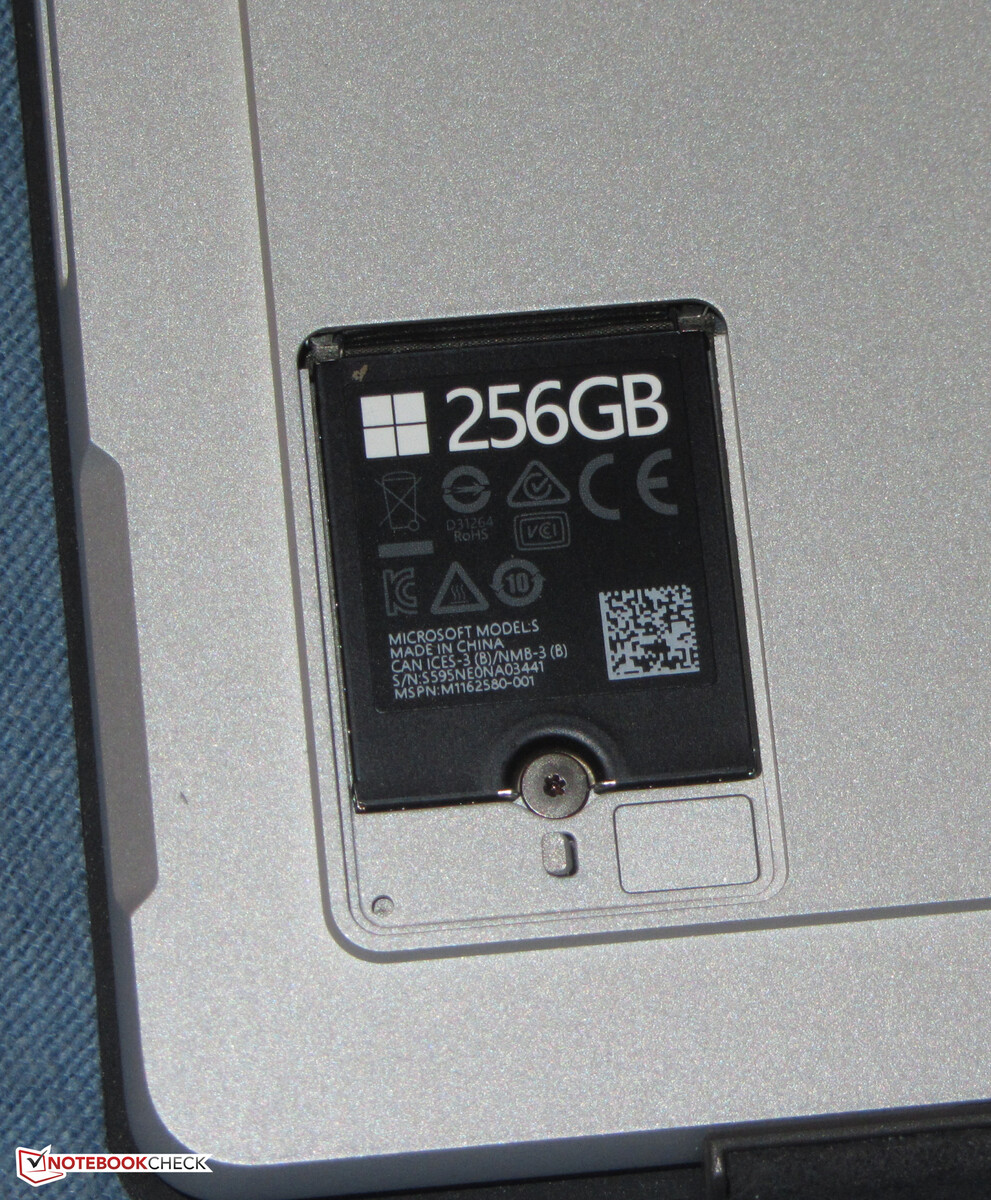
Dispositivi di archiviazione
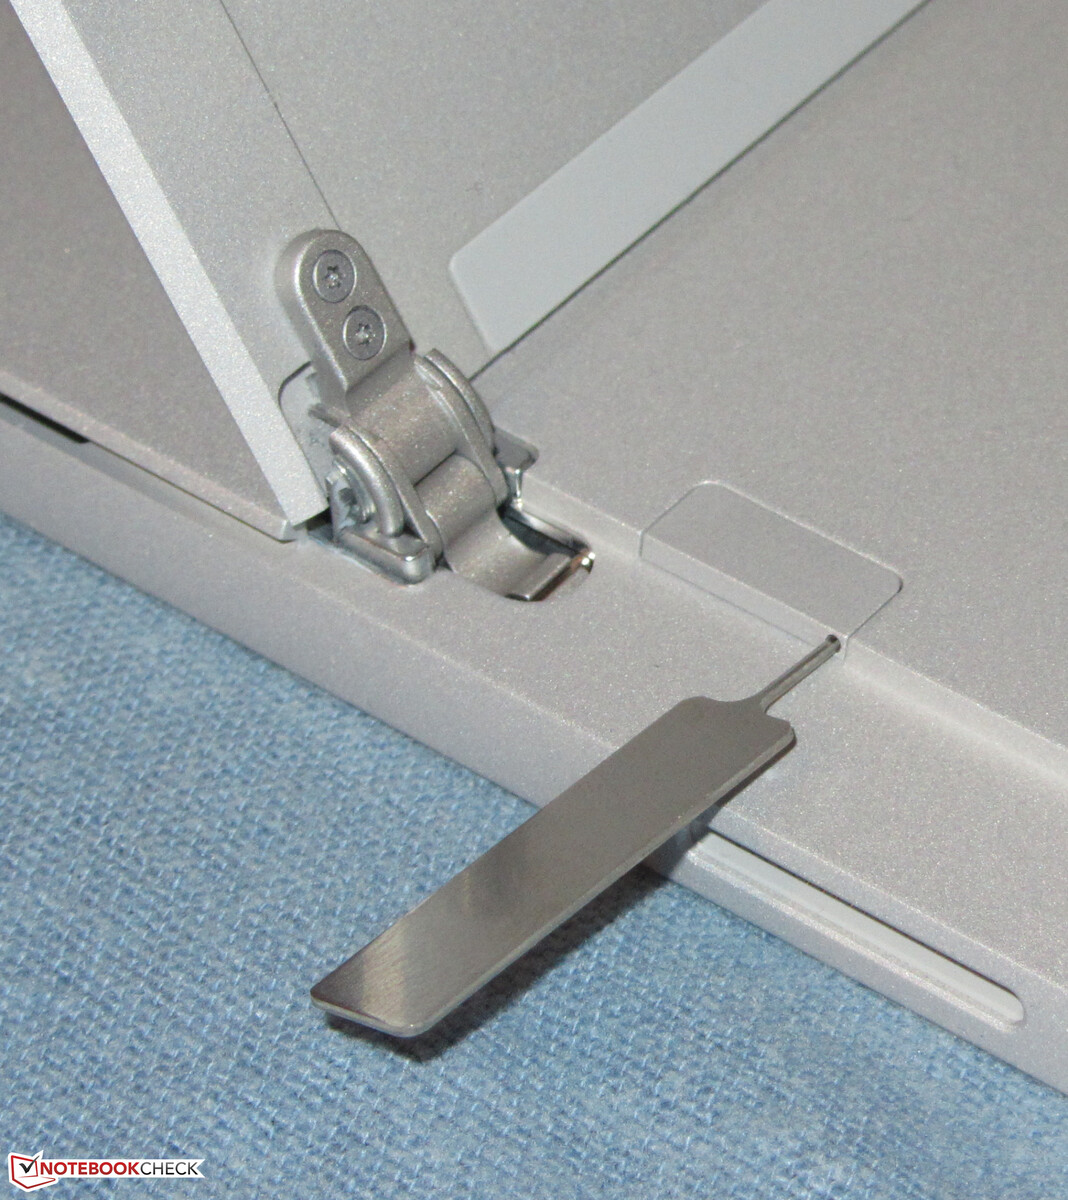
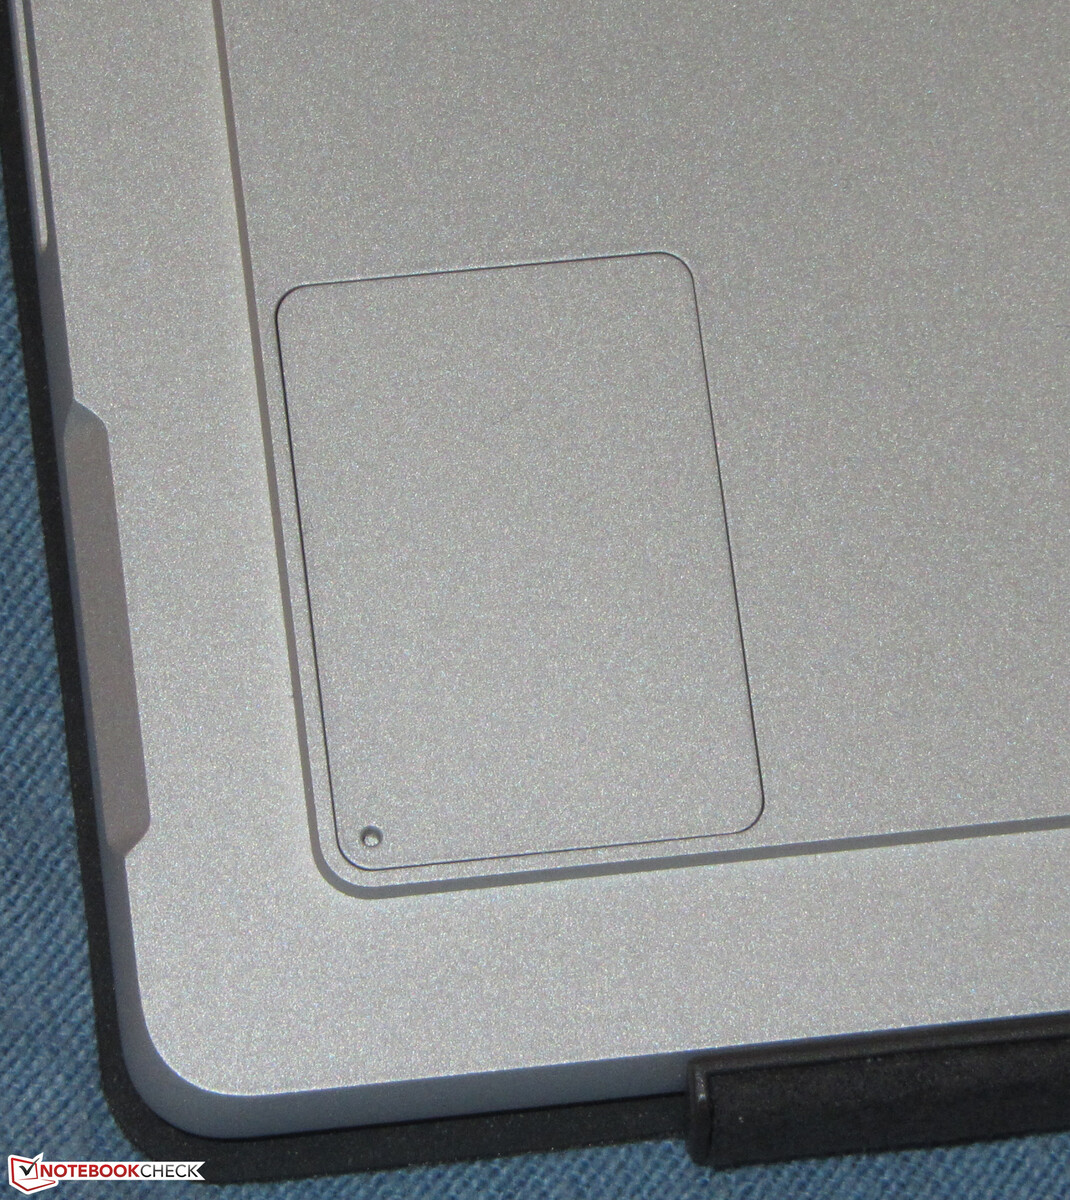
Un SSD NVMe da 256 GB (M.2-2230) di Samsung serve come unità di sistema, e offre buone velocità di trasferimento. Non è uno dei migliori modelli di SSD, però. La sostituzione dell'SSD può essere fatta facilmente grazie a un piccolo sportello di manutenzione, ma la gamma di SSD nel formato M.2-2230 è (ancora) limitata. Lo sportello è tenuto magneticamente e può essere aperto utilizzando lo strumento SIM incluso o dotazioni simili.

| Microsoft Surface Pro 7 Plus Samsung PM991 MZ9LQ256HBJQ | Lenovo Yoga Duet 7 13IML05-82AS000WGE Lenovo UMIS RPJTJ256MEE1OWX | Dell Latitude 12 7210 2-in-1 WDC PC SN530 SDBPTPZ-512G | Microsoft Surface Pro 7 Toshiba KBG40ZNS256G NVMe | Microsoft Surface Pro 7 Core i5-1035G4 Toshiba BG4 KBG40ZPZ256G | Media Samsung PM991 MZ9LQ256HBJQ | |
|---|---|---|---|---|---|---|
| CrystalDiskMark 5.2 / 6 | 11% | 25% | 29% | 16% | -10% | |
| Write 4K (MB/s) | 165.3 | 118 -29% | 182.7 11% | 131.3 -21% | 118.5 -28% | 122.1 ? -26% |
| Read 4K (MB/s) | 42.95 | 53 23% | 51.4 20% | 52.4 22% | 54.1 26% | 35.4 ? -18% |
| Write Seq (MB/s) | 955 | 1208 26% | 1303 36% | 1613 69% | 1166 22% | 849 ? -11% |
| Read Seq (MB/s) | 867 | 1625 87% | 1450 67% | 1613 86% | 1676 93% | 854 ? -1% |
| Write 4K Q32T1 (MB/s) | 423.5 | 431 2% | 342.9 -19% | 411.6 -3% | 330.5 -22% | 394 ? -7% |
| Read 4K Q32T1 (MB/s) | 479.2 | 356 -26% | 523 9% | 415.6 -13% | 393.1 -18% | 398 ? -17% |
| Write Seq Q32T1 (MB/s) | 1060 | 1278 21% | 1776 68% | 2340 121% | 1569 48% | 1059 ? 0% |
| Read Seq Q32T1 (MB/s) | 2251 | 1949 -13% | 2378 6% | 1568 -30% | 2390 6% | 2254 ? 0% |
| Write 4K Q8T8 (MB/s) | 410.9 | |||||
| Read 4K Q8T8 (MB/s) | 1033 | |||||
| AS SSD | -9% | 32% | -31% | -169% | -1% | |
| Seq Read (MB/s) | 1725 | 1629 -6% | 2185 27% | 1881 9% | 1590 -8% | 1706 ? -1% |
| Seq Write (MB/s) | 931 | 694 -25% | 1731 86% | 703 -24% | 714 -23% | 803 ? -14% |
| 4K Read (MB/s) | 50.1 | 47.87 -4% | 46.28 -8% | 52.3 4% | 50.7 1% | 45.1 ? -10% |
| 4K Write (MB/s) | 136.9 | 107 -22% | 161.6 18% | 154.1 13% | 109.4 -20% | 123.6 ? -10% |
| 4K-64 Read (MB/s) | 870 | 411 -53% | 1021 17% | 1048 20% | 924 6% | 773 ? -11% |
| 4K-64 Write (MB/s) | 762 | 377 -51% | 1125 48% | 703 -8% | 294.6 -61% | 721 ? -5% |
| Access Time Read * (ms) | 0.279 | 0.068 76% | 0.069 75% | 0.069 75% | 0.066 76% | 0.229 ? 18% |
| Access Time Write * (ms) | 0.028 | 0.035 -25% | 0.046 -64% | 0.221 -689% | 0.697 -2389% | 0.0315 ? -13% |
| Score Read (Points) | 1093 | 614 -44% | 1286 18% | 1288 18% | 1133 4% | 989 ? -10% |
| Score Write (Points) | 992 | 550 -45% | 1460 47% | 927 -7% | 475 -52% | 925 ? -7% |
| Score Total (Points) | 2616 | 1441 -45% | 3389 30% | 2826 8% | 2157 -18% | 2386 ? -9% |
| Copy ISO MB/s (MB/s) | 1174 | 1074 -9% | 1555 32% | 1160 -1% | 1177 0% | 1085 ? -8% |
| Copy Program MB/s (MB/s) | 262.8 | 532 102% | 468.5 78% | 454.7 73% | 406 54% | 389 ? 48% |
| Copy Game MB/s (MB/s) | 562 | 730 30% | 841 50% | 991 76% | 923 64% | 687 ? 22% |
| Media totale (Programma / Settaggio) | 1% /
-1% | 29% /
30% | -1% /
-9% | -77% /
-102% | -6% /
-4% |
* ... Meglio usare valori piccoli
Carico di lettura continuo: DiskSpd Read Loop, Queue Depth 8
Scheda grafica
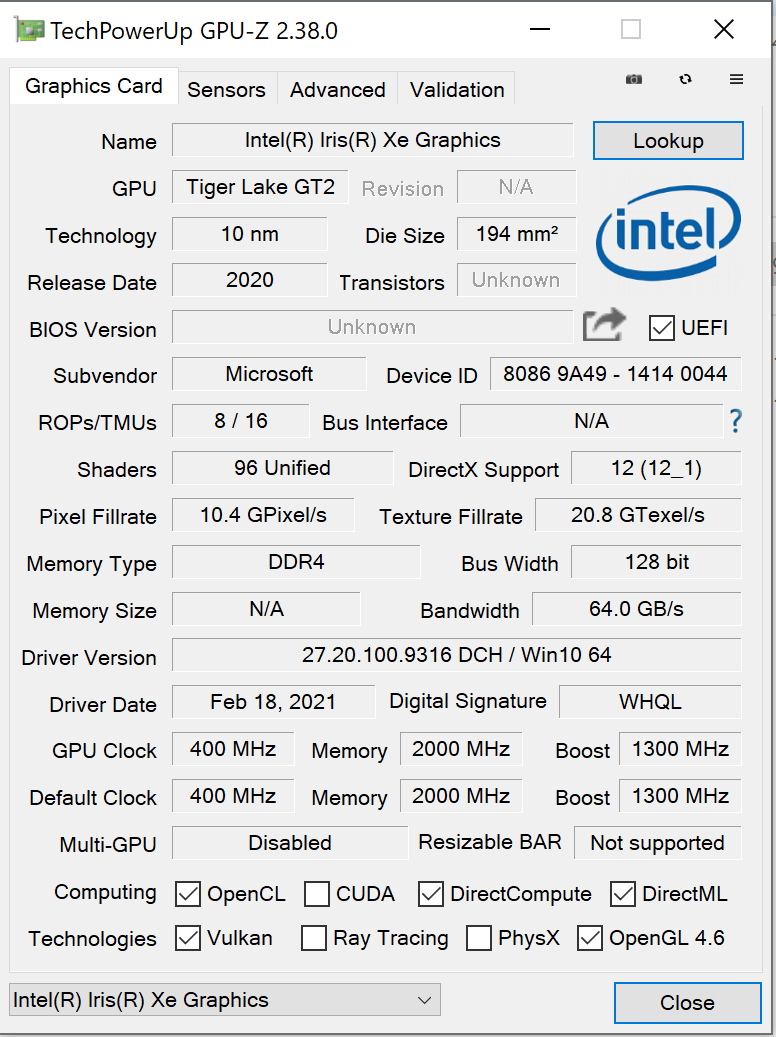
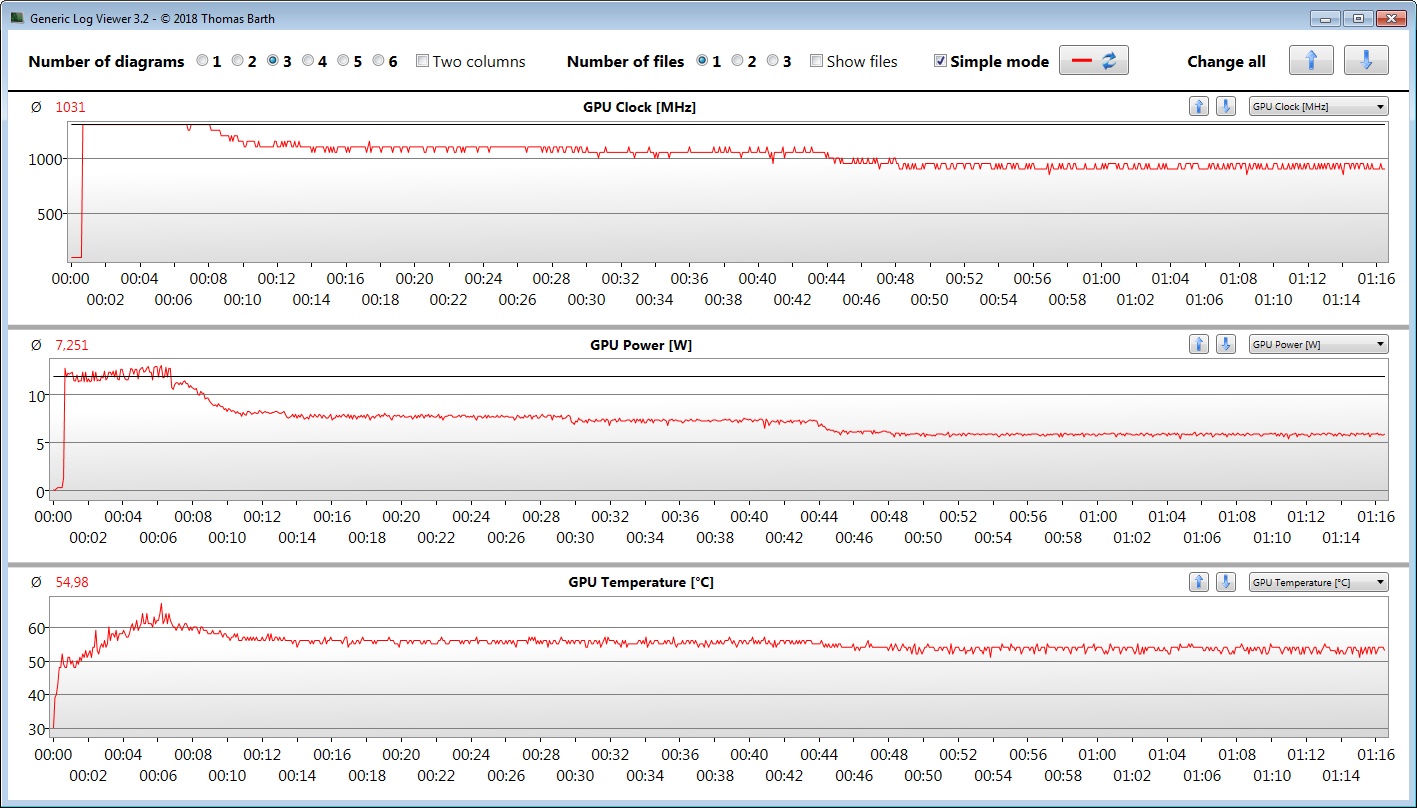
La GPU integrata Intel IrisXe Graphics G7 80EUs è responsabile dell'output grafico. Supporta DirectX 12 e raggiunge una velocità di clock operativa fino a 1.300 MHz. Il testi The Witcher 3 mostra che la GPU Tiger Lake può lavorare a piena velocità per circa sette minuti. Dopo, il raffreddamento passivo si fa sentire.
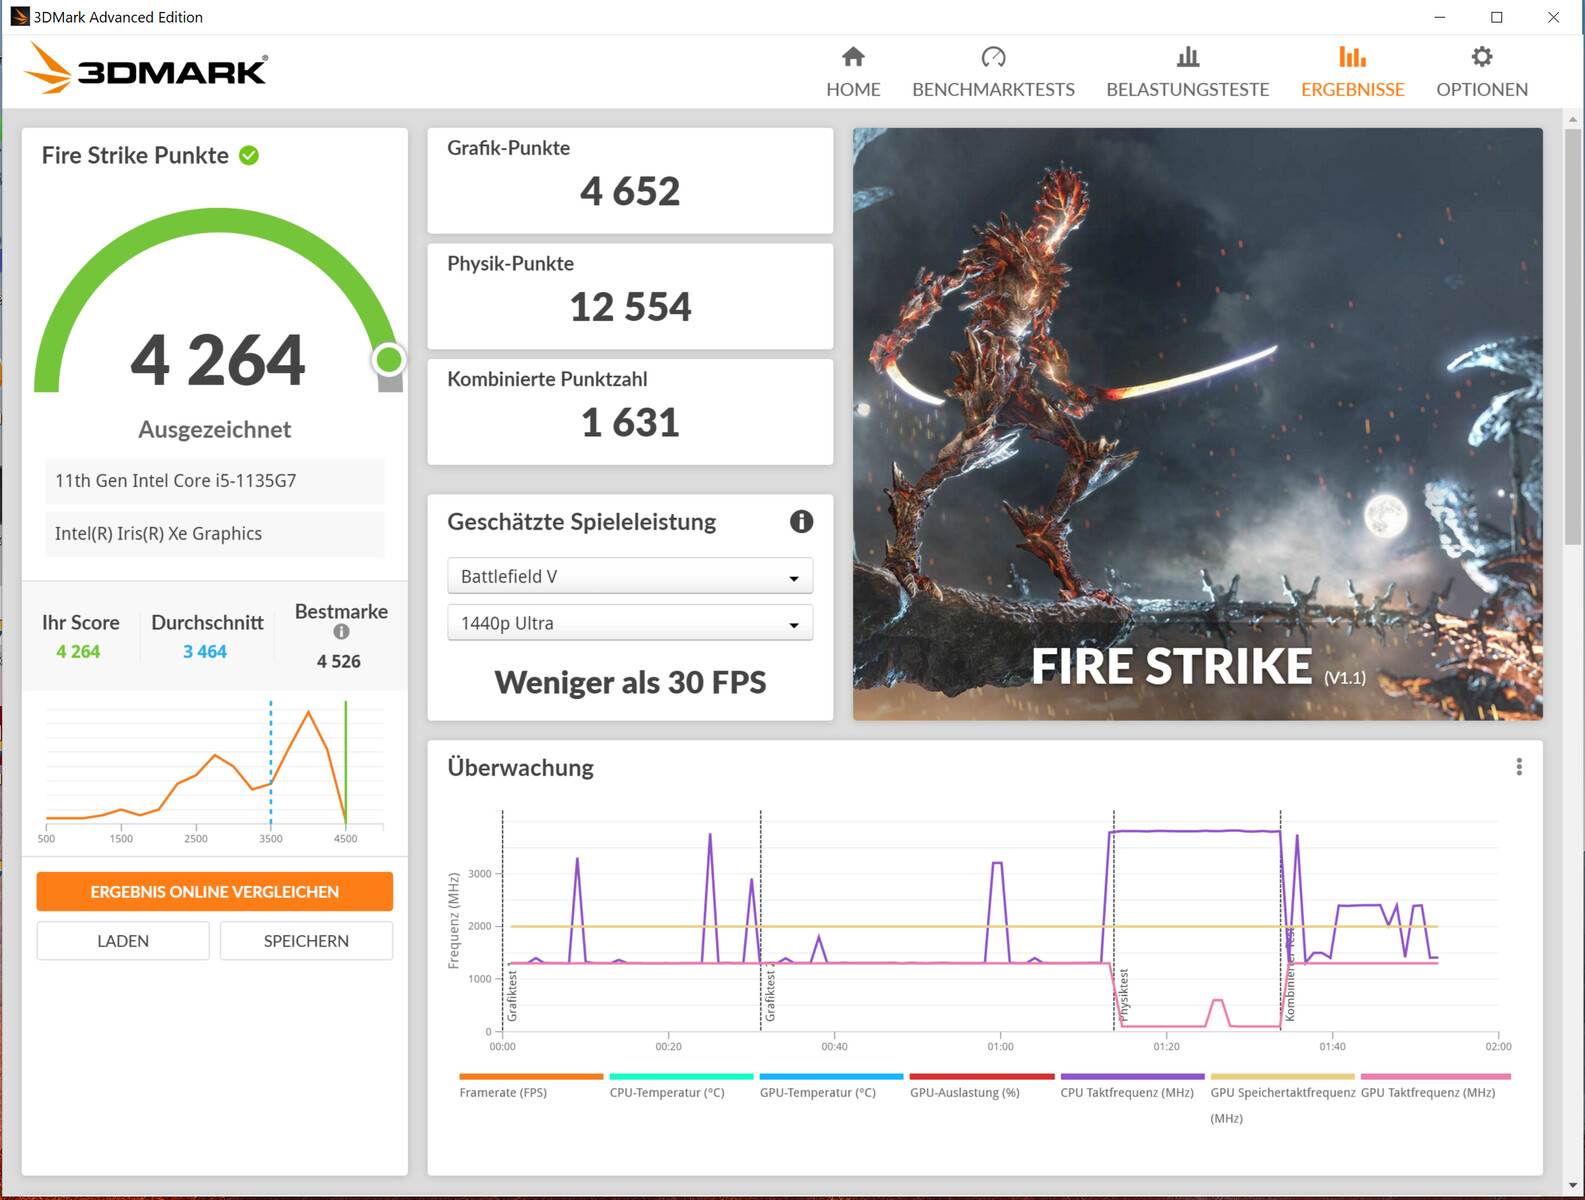
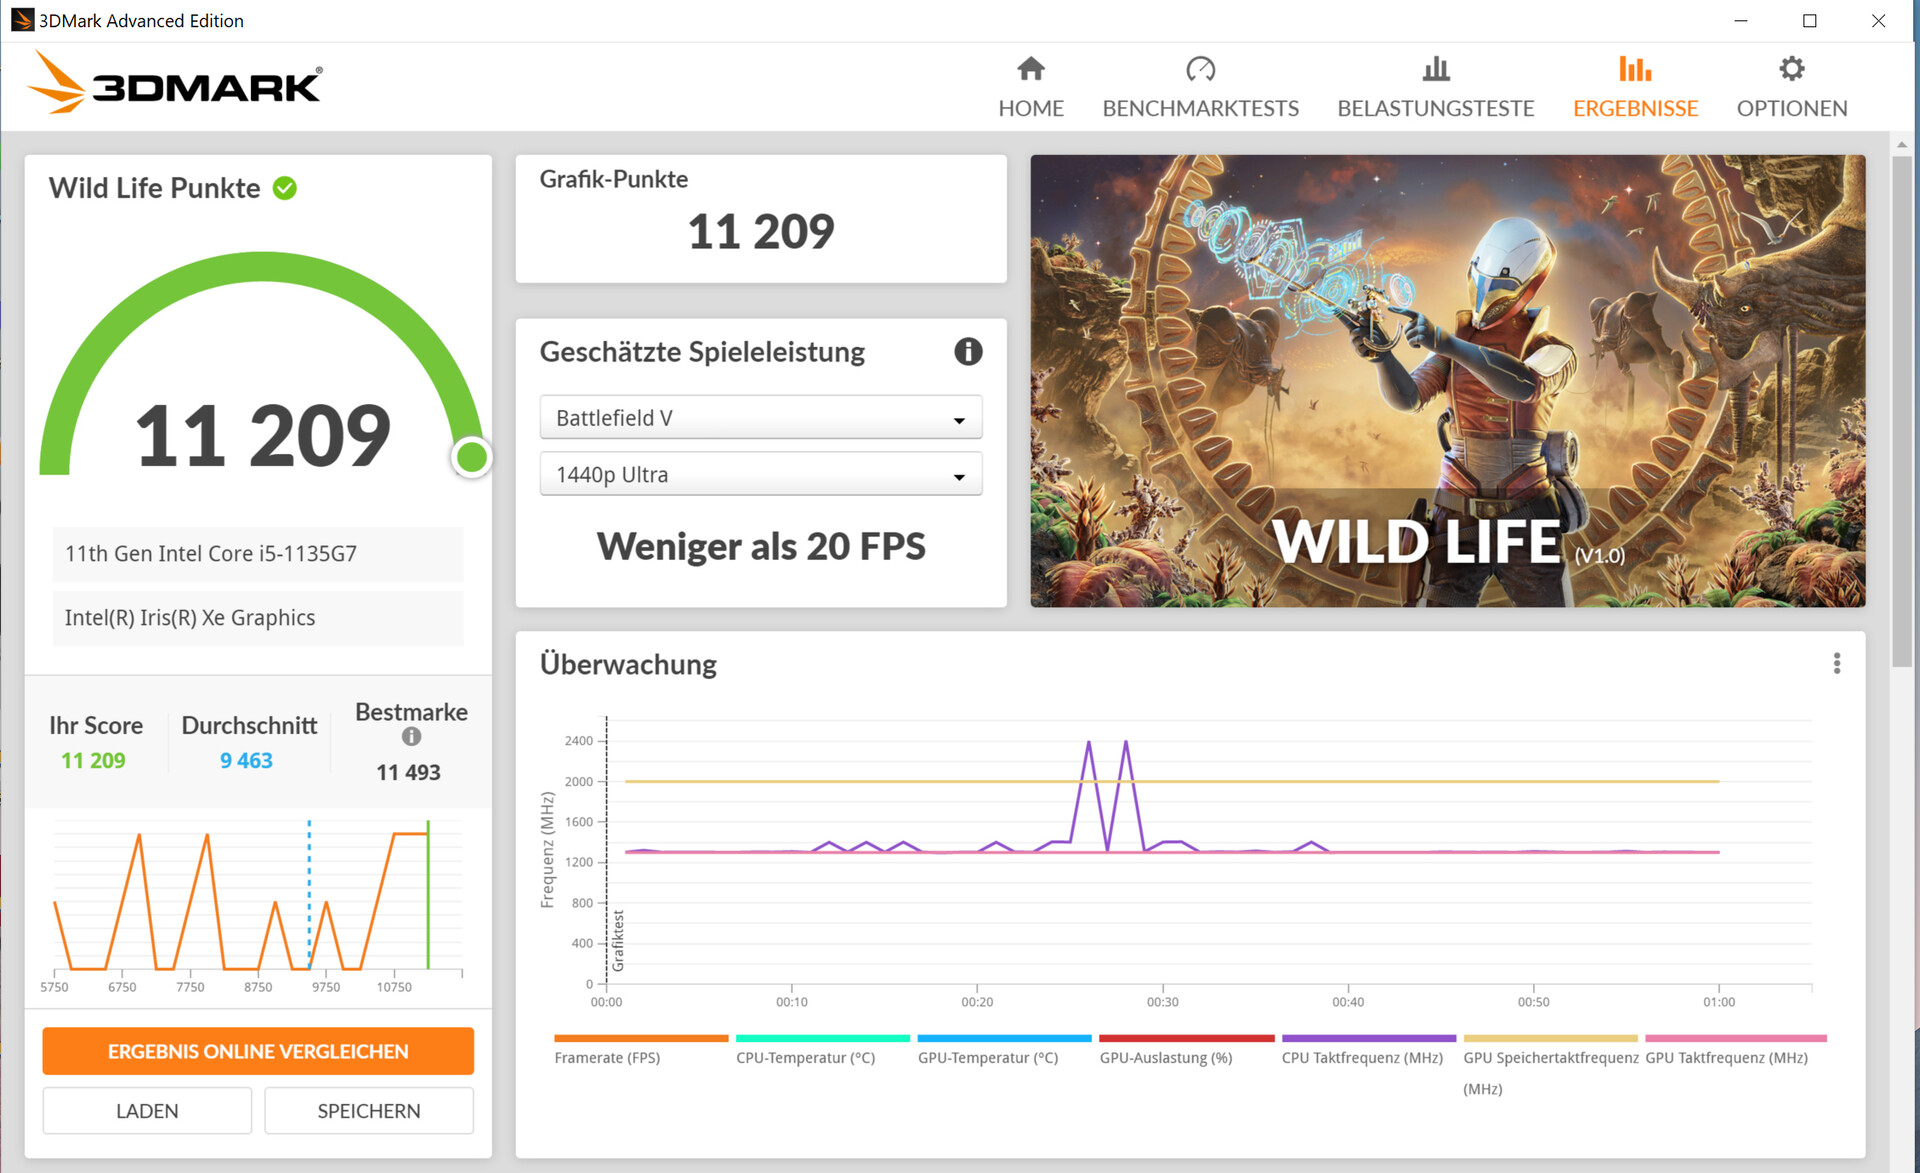
I risultati di 3DMark sono tra i migliori valori che abbiamo determinato per la GPU installata qui finora. Rispetto ai modelli Ice Lake Surface Pro 7, c'è un significativo aumento delle prestazioni grafiche.

| 3DMark 11 Performance | 6343 punti | |
| 3DMark Ice Storm Standard Score | 81444 punti | |
| 3DMark Cloud Gate Standard Score | 17777 punti | |
| 3DMark Fire Strike Score | 4264 punti | |
| 3DMark Time Spy Score | 1537 punti | |
Aiuto | ||
| GFXBench (DX / GLBenchmark) 2.7 | |
| 1920x1080 T-Rex Offscreen | |
| Media della classe Convertible (83 - 495, n=3, ultimi 2 anni) | |
| Microsoft Surface Pro 7 Plus | |
| Media Intel Iris Xe Graphics G7 80EUs (220 - 257, n=3) | |
| T-Rex Onscreen | |
| Media della classe Convertible (n=1ultimi 2 anni) | |
| Microsoft Surface Pro 7 Plus | |
| Media Intel Iris Xe Graphics G7 80EUs (55 - 236, n=3) | |
| GFXBench 3.0 | |
| 1920x1080 1080p Manhattan Offscreen | |
| Microsoft Surface Pro 7 Plus | |
| Media della classe Convertible (48 - 290, n=3, ultimi 2 anni) | |
| Media Intel Iris Xe Graphics G7 80EUs (101.5 - 170.4, n=3) | |
| on screen Manhattan Onscreen OGL | |
| Media della classe Convertible (n=1ultimi 2 anni) | |
| Microsoft Surface Pro 7 Plus | |
| Media Intel Iris Xe Graphics G7 80EUs (44 - 100.4, n=3) | |
| GFXBench 3.1 | |
| 1920x1080 Manhattan ES 3.1 Offscreen | |
| Media della classe Convertible (34 - 229, n=3, ultimi 2 anni) | |
| Microsoft Surface Pro 7 Plus | |
| Media Intel Iris Xe Graphics G7 80EUs (69 - 108.6, n=3) | |
| on screen Manhattan ES 3.1 Onscreen | |
| Media della classe Convertible (n=1ultimi 2 anni) | |
| Media Intel Iris Xe Graphics G7 80EUs (46.5 - 69.4, n=3) | |
| Microsoft Surface Pro 7 Plus | |
| Unigine Heaven 2.1 - 1280x1024 high, Tesselation (normal), DirectX11 AA:off AF:1x | |
| Microsoft Surface Pro 7 Plus | |
| Media Intel Iris Xe Graphics G7 80EUs (n=1) | |
| Unigine Heaven 3.0 | |
| 1920x1080 OpenGL, Normal Tessellation, High Shaders AA:Off AF:Off | |
| Microsoft Surface Pro 7 Plus | |
| Media Intel Iris Xe Graphics G7 80EUs (n=1) | |
| 1920x1080 DX 11, Normal Tessellation, High Shaders AA:Off AF:Off | |
| Microsoft Surface Pro 7 Plus | |
| Media Intel Iris Xe Graphics G7 80EUs (n=1) | |
| Unigine Superposition | |
| 1920x1080 1080p High | |
| Media della classe Convertible (1450 - 2770, n=2, ultimi 2 anni) | |
| Media Intel Iris Xe Graphics G7 80EUs (1907 - 2216, n=2) | |
| Microsoft Surface Pro 7 Plus | |
| 1280x720 720p Low | |
| Media della classe Convertible (4558 - 9507, n=2, ultimi 2 anni) | |
| Media Intel Iris Xe Graphics G7 80EUs (6057 - 6928, n=2) | |
| Microsoft Surface Pro 7 Plus | |
| Unigine Valley 1.0 | |
| 1920x1080 Extreme HD DirectX AA:x8 | |
| Media della classe Convertible (21.5 - 53.5, n=2, ultimi 2 anni) | |
| Microsoft Surface Pro 7 Plus | |
| Media Intel Iris Xe Graphics G7 80EUs (14.6 - 17.4, n=4) | |
| 1920x1080 Extreme HD Preset OpenGL AA:x8 | |
| Media della classe Convertible (19.3 - 51.7, n=2, ultimi 2 anni) | |
| Microsoft Surface Pro 7 Plus | |
| Media Intel Iris Xe Graphics G7 80EUs (14.1 - 18.8, n=4) | |
Prestazioni gaming
Il Surface Pro 7 Plus non è un dispositivo per il gaming. Tuttavia: La combinazione CPU-GPU installata è generalmente in grado di gestire molti dei giochi nel nostro database senza problemi sullo schermo - a basse risoluzioni e impostazioni di bassa qualità.
Poiché la CPU e la GPU vengono limitate dopo alcuni minuti, i frame rates calano di conseguenza. Pertanto, raccomandiamo titoli che non hanno requisiti hardware eccessivamente elevati e che comunque girano senza problemi anche a velocità di clock inferiori.
| The Witcher 3 - 1024x768 Low Graphics & Postprocessing | |
| Media della classe Convertible (22 - 141.5, n=6, ultimi 2 anni) | |
| Microsoft Surface Pro 7 Plus | |
| Media Intel Iris Xe Graphics G7 80EUs (30.2 - 97.4, n=101) | |
| Microsoft Surface Pro 7 Core i5-1035G4 | |
| Lenovo Yoga Duet 7 13IML05-82AS000WGE | |
| Shadow of the Tomb Raider - 1280x720 Lowest Preset | |
| Media della classe Convertible (24 - 180, n=2, ultimi 2 anni) | |
| Media Intel Iris Xe Graphics G7 80EUs (31 - 62.8, n=6) | |
| Microsoft Surface Pro 7 Plus | |
| Microsoft Surface Pro 7 | |
| Microsoft Surface Pro 7 Core i5-1035G4 | |
| F1 2020 - 1280x720 Ultra Low Preset | |
| Microsoft Surface Pro 7 Plus | |
| Media Intel Iris Xe Graphics G7 80EUs (45 - 76.6, n=10) | |
| Serious Sam 4 - 1280x720 Lowest (DX12) | |
| Microsoft Surface Pro 7 Plus | |
| Media Intel Iris Xe Graphics G7 80EUs (n=1) | |
| Hitman 3 - 1280x720 Minimum Settings | |
| Microsoft Surface Pro 7 Plus | |
| Media Intel Iris Xe Graphics G7 80EUs (56.3 - 82.3, n=2) | |
Al fine di verificare se il frame rate rimane in gran parte costante per un periodo di tempo prolungato, abbiamo lasciato il gioco The Witcher 3 in esecuzione per circa 60 minuti a risoluzione Full HD e impostazioni di qualità massima. Il personaggio non viene mosso. La velocità di clock della GPU viene ridotta da 1.300 MHz a circa 1.000 MHz dopo circa sette minuti. Di conseguenza, c'è un calo del frame rate.
Dato che non sono stati raggiunti frame rates giocabili, abbiamo ripetuto il nostro test di The Witcher 3 a impostazioni minime. Si è visto lo stesso comportamento, ma i frame rates sono ancora all'interno di un intervallo giocabile anche dopo che il throttling che si è verificato.
| basso | medio | alto | ultra | |
|---|---|---|---|---|
| The Witcher 3 (2015) | 81.9 | 55.8 | 29 | 13.5 |
| Dota 2 Reborn (2015) | 80.4 | 60.5 | 38.7 | 36.8 |
| X-Plane 11.11 (2018) | 37.4 | 29.9 | 27.7 | |
| Far Cry 5 (2018) | 54 | 23 | 21 | 19 |
| Shadow of the Tomb Raider (2018) | 37 | 17 | 14 | 9 |
| Battlefield V (2018) | 51.7 | 25.8 | 23.3 | 22.6 |
| Apex Legends (2019) | 82 | 37.7 | 28.2 | 25.3 |
| Metro Exodus (2019) | 28 | 13.7 | 10.5 | 8.7 |
| Control (2019) | 57.9 | 17.3 | 11.6 | |
| Borderlands 3 (2019) | 46.6 | 20.6 | 12.6 | 9.34 |
| Red Dead Redemption 2 (2019) | 49.2 | 22.7 | 12.9 | |
| F1 2020 (2020) | 76.6 | 38.7 | 26.8 | 17.5 |
| Death Stranding (2020) | 42.2 | 23.4 | 20.7 | 19.8 |
| Crysis Remastered (2020) | 54.9 | 24.9 | 8.49 | |
| Serious Sam 4 (2020) | 99.4 | 14.6 | 10.1 | 6.67 |
| Assassin´s Creed Valhalla (2020) | 31 | 19 | 16 | |
| Yakuza Like a Dragon (2020) | 32.5 | 16.3 | 14.6 | 12.4 |
| Immortals Fenyx Rising (2020) | 36 | 22 | 19 | 17 |
| Cyberpunk 2077 1.0 (2020) | 23.8 | 10.5 | ||
| Hitman 3 (2021) | 82.3 | 35.2 | 28.5 | 23.9 |
Emissioni - Questo dispositivo 2-in-1 di Microsoft è raffreddato passivamente
Rumorosità
Il dispositivo non ha una ventola e nessun azionamento meccanico. Tuttavia, non è completamente silenzioso. Occasionalmente, si può sentire un suono elettronico proveniente dall'interno.
Temperature
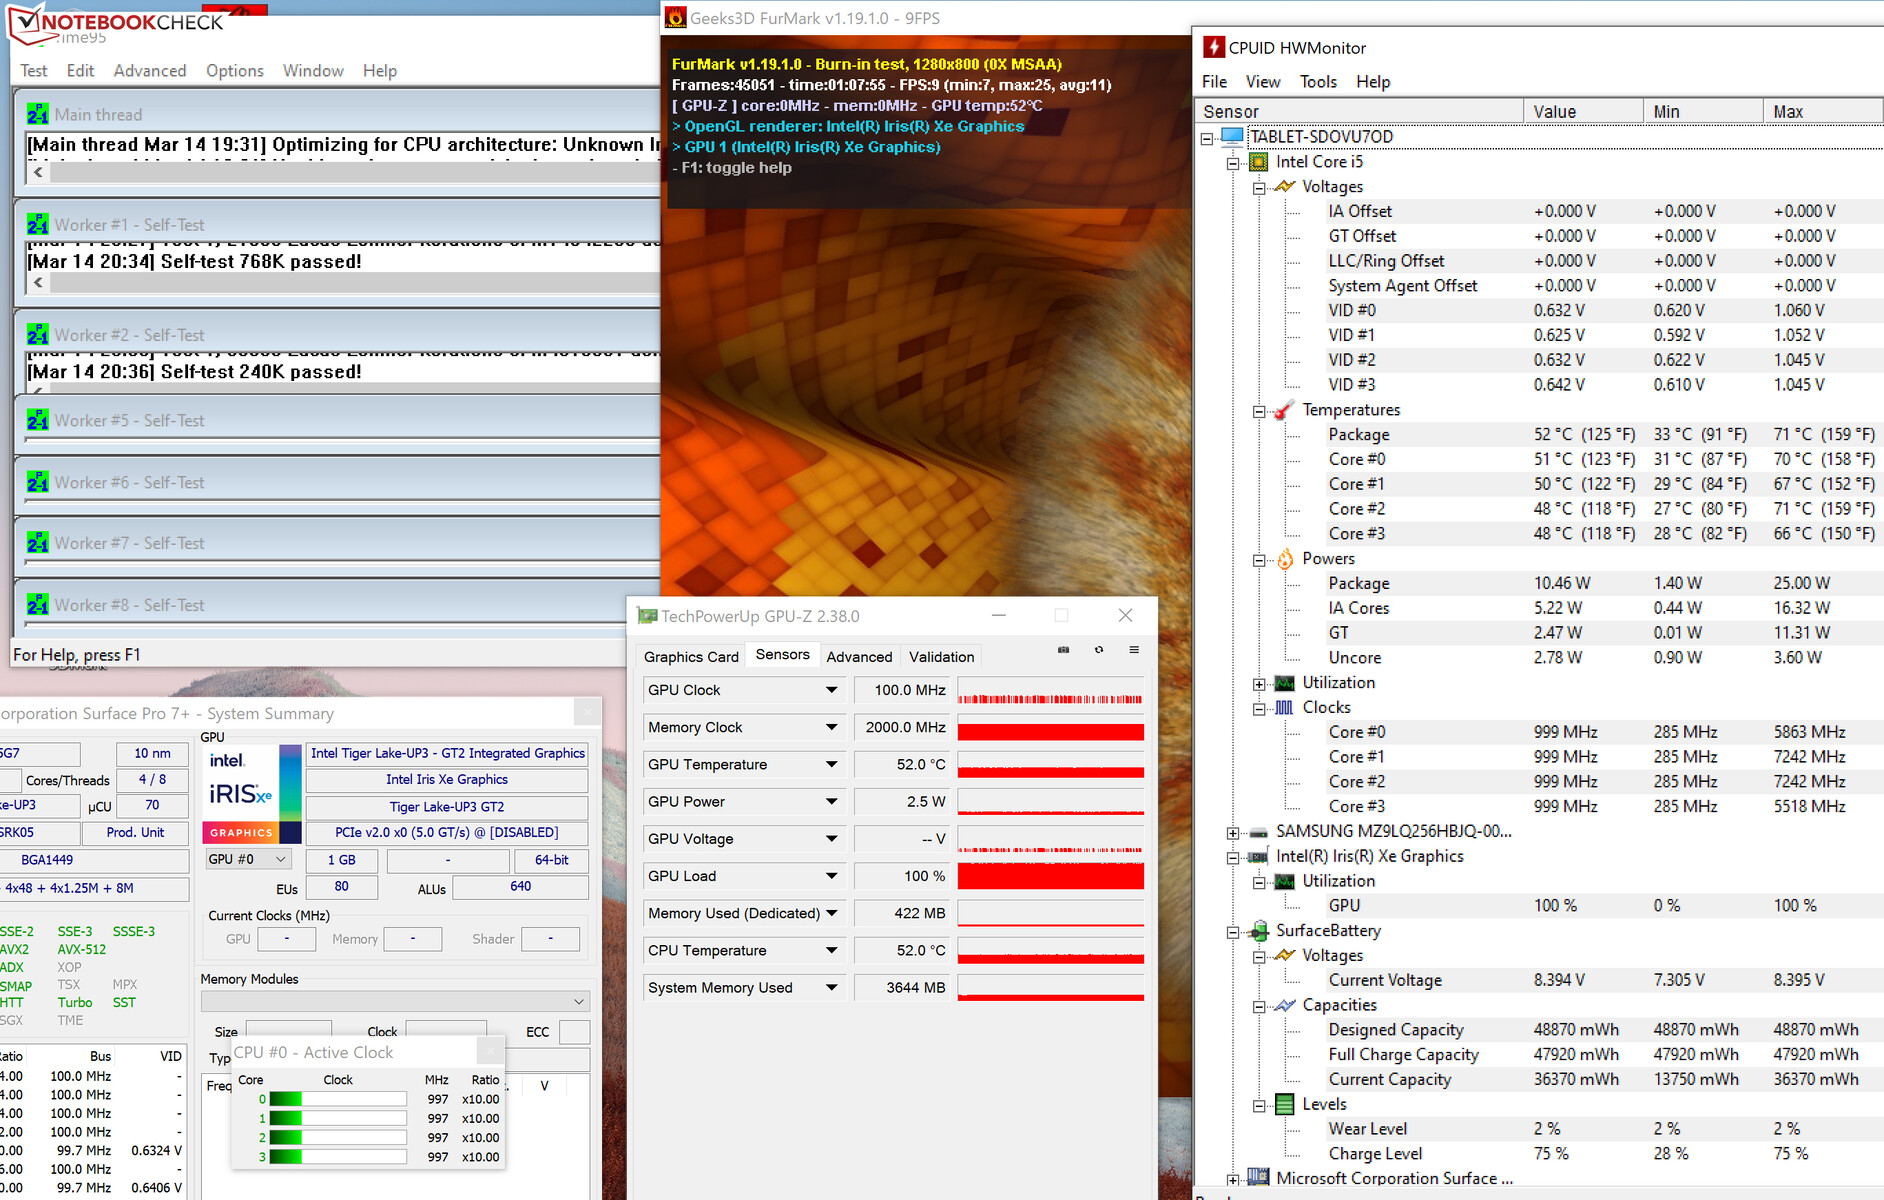
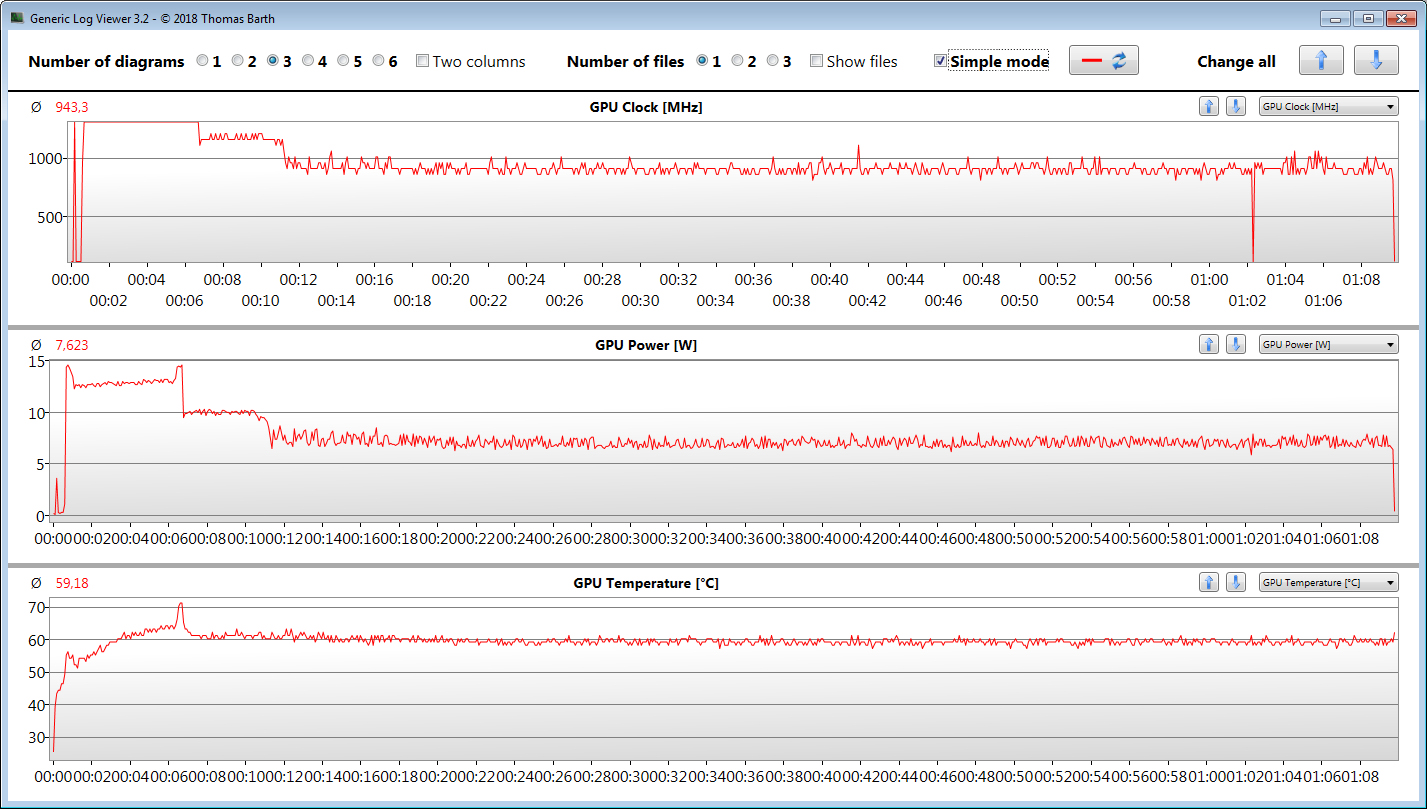
Nei primi minuti del nostro stress test (Prime95 e FurMark durano almeno un'ora), la CPU e la GPU vanno da 900 a 2.000 MHz e da 700 a 750 MHz, rispettivamente. Nel corso del test, le velocità scendono a 900-1.000 MHz (CPU) e 100 MHz (GPU). Lo stress test rappresenta però uno scenario estremo. Usiamo questo test per verificare che il sistema rimanga stabile anche sotto pieno carico.
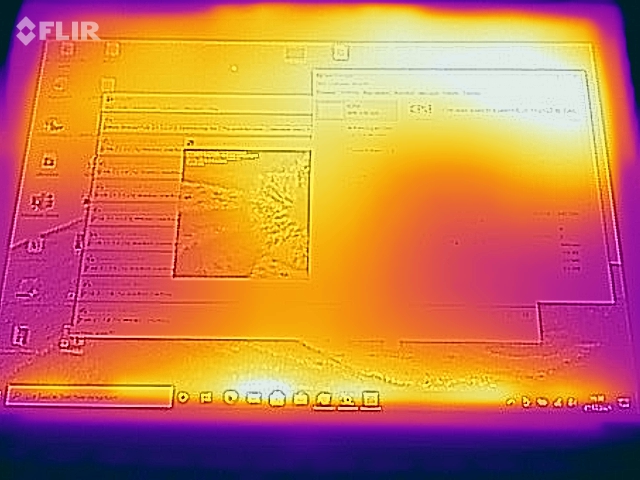
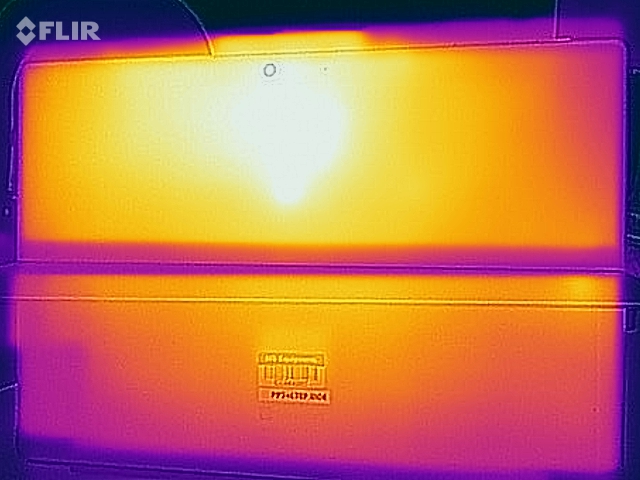
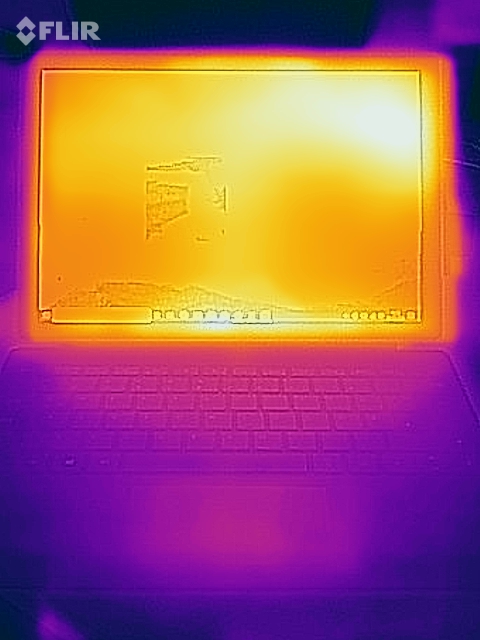
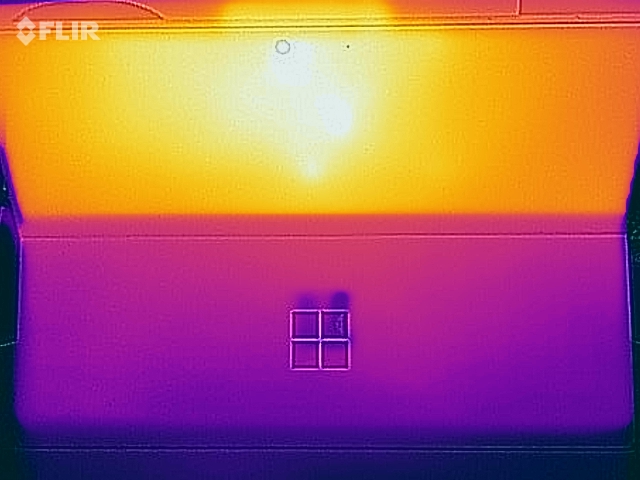
Non è sorprendente che il Surface si riscaldi notevolmente sotto carico. Dopo tutto, il dispositivo è raffreddato passivamente. Durante lo stress test, registriamo temperature nella fascia bassa e media dei 40 °C (~104 °F) in diversi punti di misurazione. Inoltre, i valori sono all'interno della gamma verde nell'uso quotidiano.
(±) La temperatura massima sul lato superiore è di 42.9 °C / 109 F, rispetto alla media di 35.4 °C / 96 F, che varia da 19.6 a 60 °C per questa classe Convertible.
(±) Il lato inferiore si riscalda fino ad un massimo di 44.8 °C / 113 F, rispetto alla media di 36.9 °C / 98 F
(+) In idle, la temperatura media del lato superiore è di 25.3 °C / 78 F, rispetto alla media deld ispositivo di 30.3 °C / 87 F.
(-) I poggiapolsi e il touchpad possono diventare molto caldi al tatto con un massimo di 41.1 °C / 106 F.
(-) La temperatura media della zona del palmo della mano di dispositivi simili e'stata di 28 °C / 82.4 F (-13.1 °C / -23.6 F).
| Microsoft Surface Pro 7 Plus i5-1135G7, Iris Xe G7 80EUs | Lenovo Yoga Duet 7 13IML05-82AS000WGE i5-10210U, UHD Graphics 620 | Dell Latitude 12 7210 2-in-1 i7-10610U, UHD Graphics 620 | Microsoft Surface Pro 7 i7-1065G7, Iris Plus Graphics G7 (Ice Lake 64 EU) | Microsoft Surface Pro 7 Core i5-1035G4 i5-1035G4, Iris Plus Graphics G4 (Ice Lake 48 EU) | Media Intel Iris Xe Graphics G7 80EUs | Media della classe Convertible | |
|---|---|---|---|---|---|---|---|
| Heat | 16% | 12% | -2% | -12% | -1% | -0% | |
| Maximum Upper Side * (°C) | 42.9 | 33.6 22% | 37.5 13% | 40.1 7% | 43.6 -2% | 40.5 ? 6% | 42.1 ? 2% |
| Maximum Bottom * (°C) | 44.8 | 33.9 24% | 36.2 19% | 41 8% | 47.8 -7% | 43.7 ? 2% | 43.5 ? 3% |
| Idle Upper Side * (°C) | 28.8 | 24.8 14% | 25.7 11% | 31.7 -10% | 32 -11% | 27.9 ? 3% | 27.7 ? 4% |
| Idle Bottom * (°C) | 25.8 | 25.4 2% | 24.3 6% | 28.8 -12% | 32.4 -26% | 29.2 ? -13% | 28.4 ? -10% |
* ... Meglio usare valori piccoli
Altoparlanti
Microsoft Surface Pro 7 Plus analisi audio
(±) | potenza degli altiparlanti media ma buona (75.2 dB)
Bassi 100 - 315 Hz
(±) | bassi ridotti - in media 14.7% inferiori alla media
(±) | la linearità dei bassi è media (10.2% delta rispetto alla precedente frequenza)
Medi 400 - 2000 Hz
(+) | medi bilanciati - solo only 4.9% rispetto alla media
(+) | medi lineari (6.1% delta rispetto alla precedente frequenza)
Alti 2 - 16 kHz
(+) | Alti bilanciati - appena 4.1% dalla media
(±) | la linearità degli alti è media (9% delta rispetto alla precedente frequenza)
Nel complesso 100 - 16.000 Hz
(±) | la linearità complessiva del suono è media (17.4% di differenza rispetto alla media
Rispetto alla stessa classe
» 33% di tutti i dispositivi testati in questa classe è stato migliore, 8% simile, 59% peggiore
» Il migliore ha avuto un delta di 6%, medio di 20%, peggiore di 57%
Rispetto a tutti i dispositivi testati
» 33% di tutti i dispositivi testati in questa classe è stato migliore, 8% similare, 59% peggiore
» Il migliore ha avuto un delta di 4%, medio di 24%, peggiore di 134%
Consumo energetico - Il Surface Pro Plus offre una buona durata della batteria
Consumo energetico
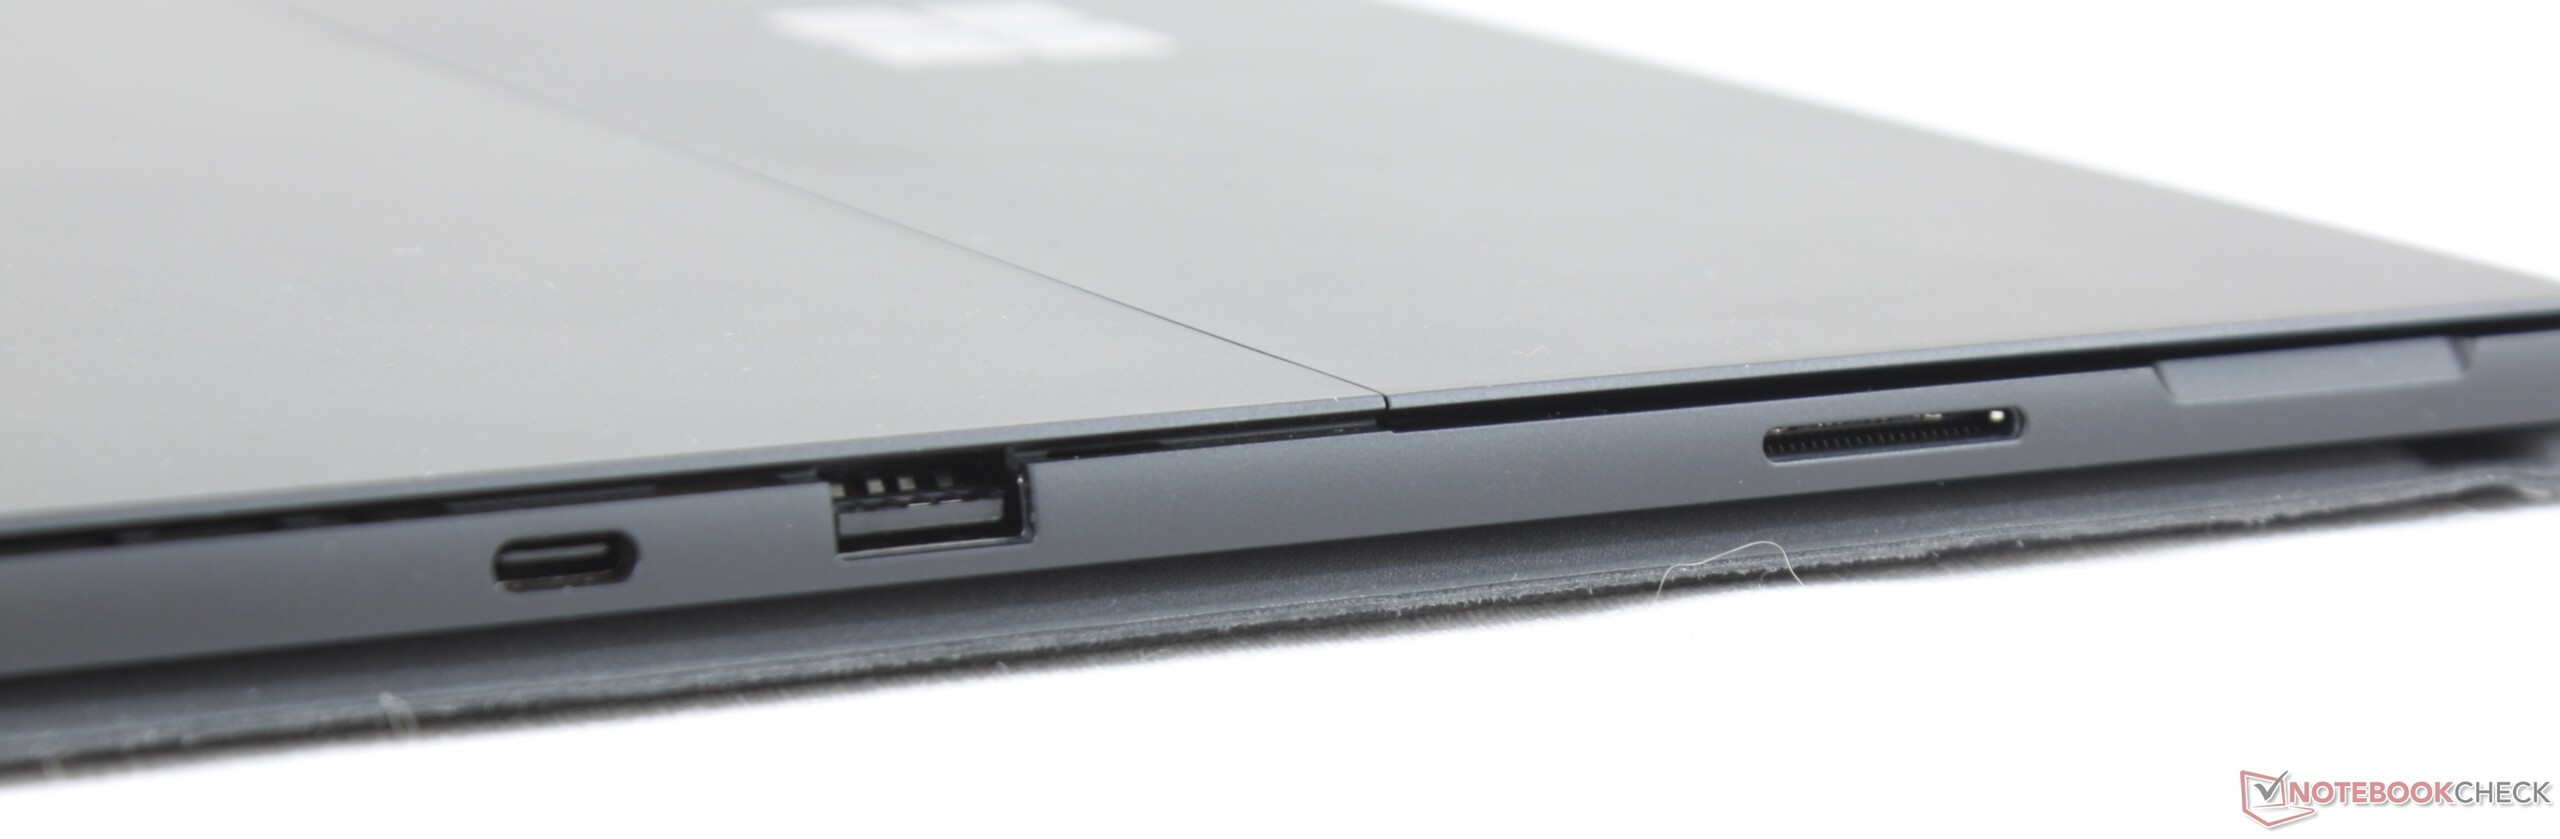
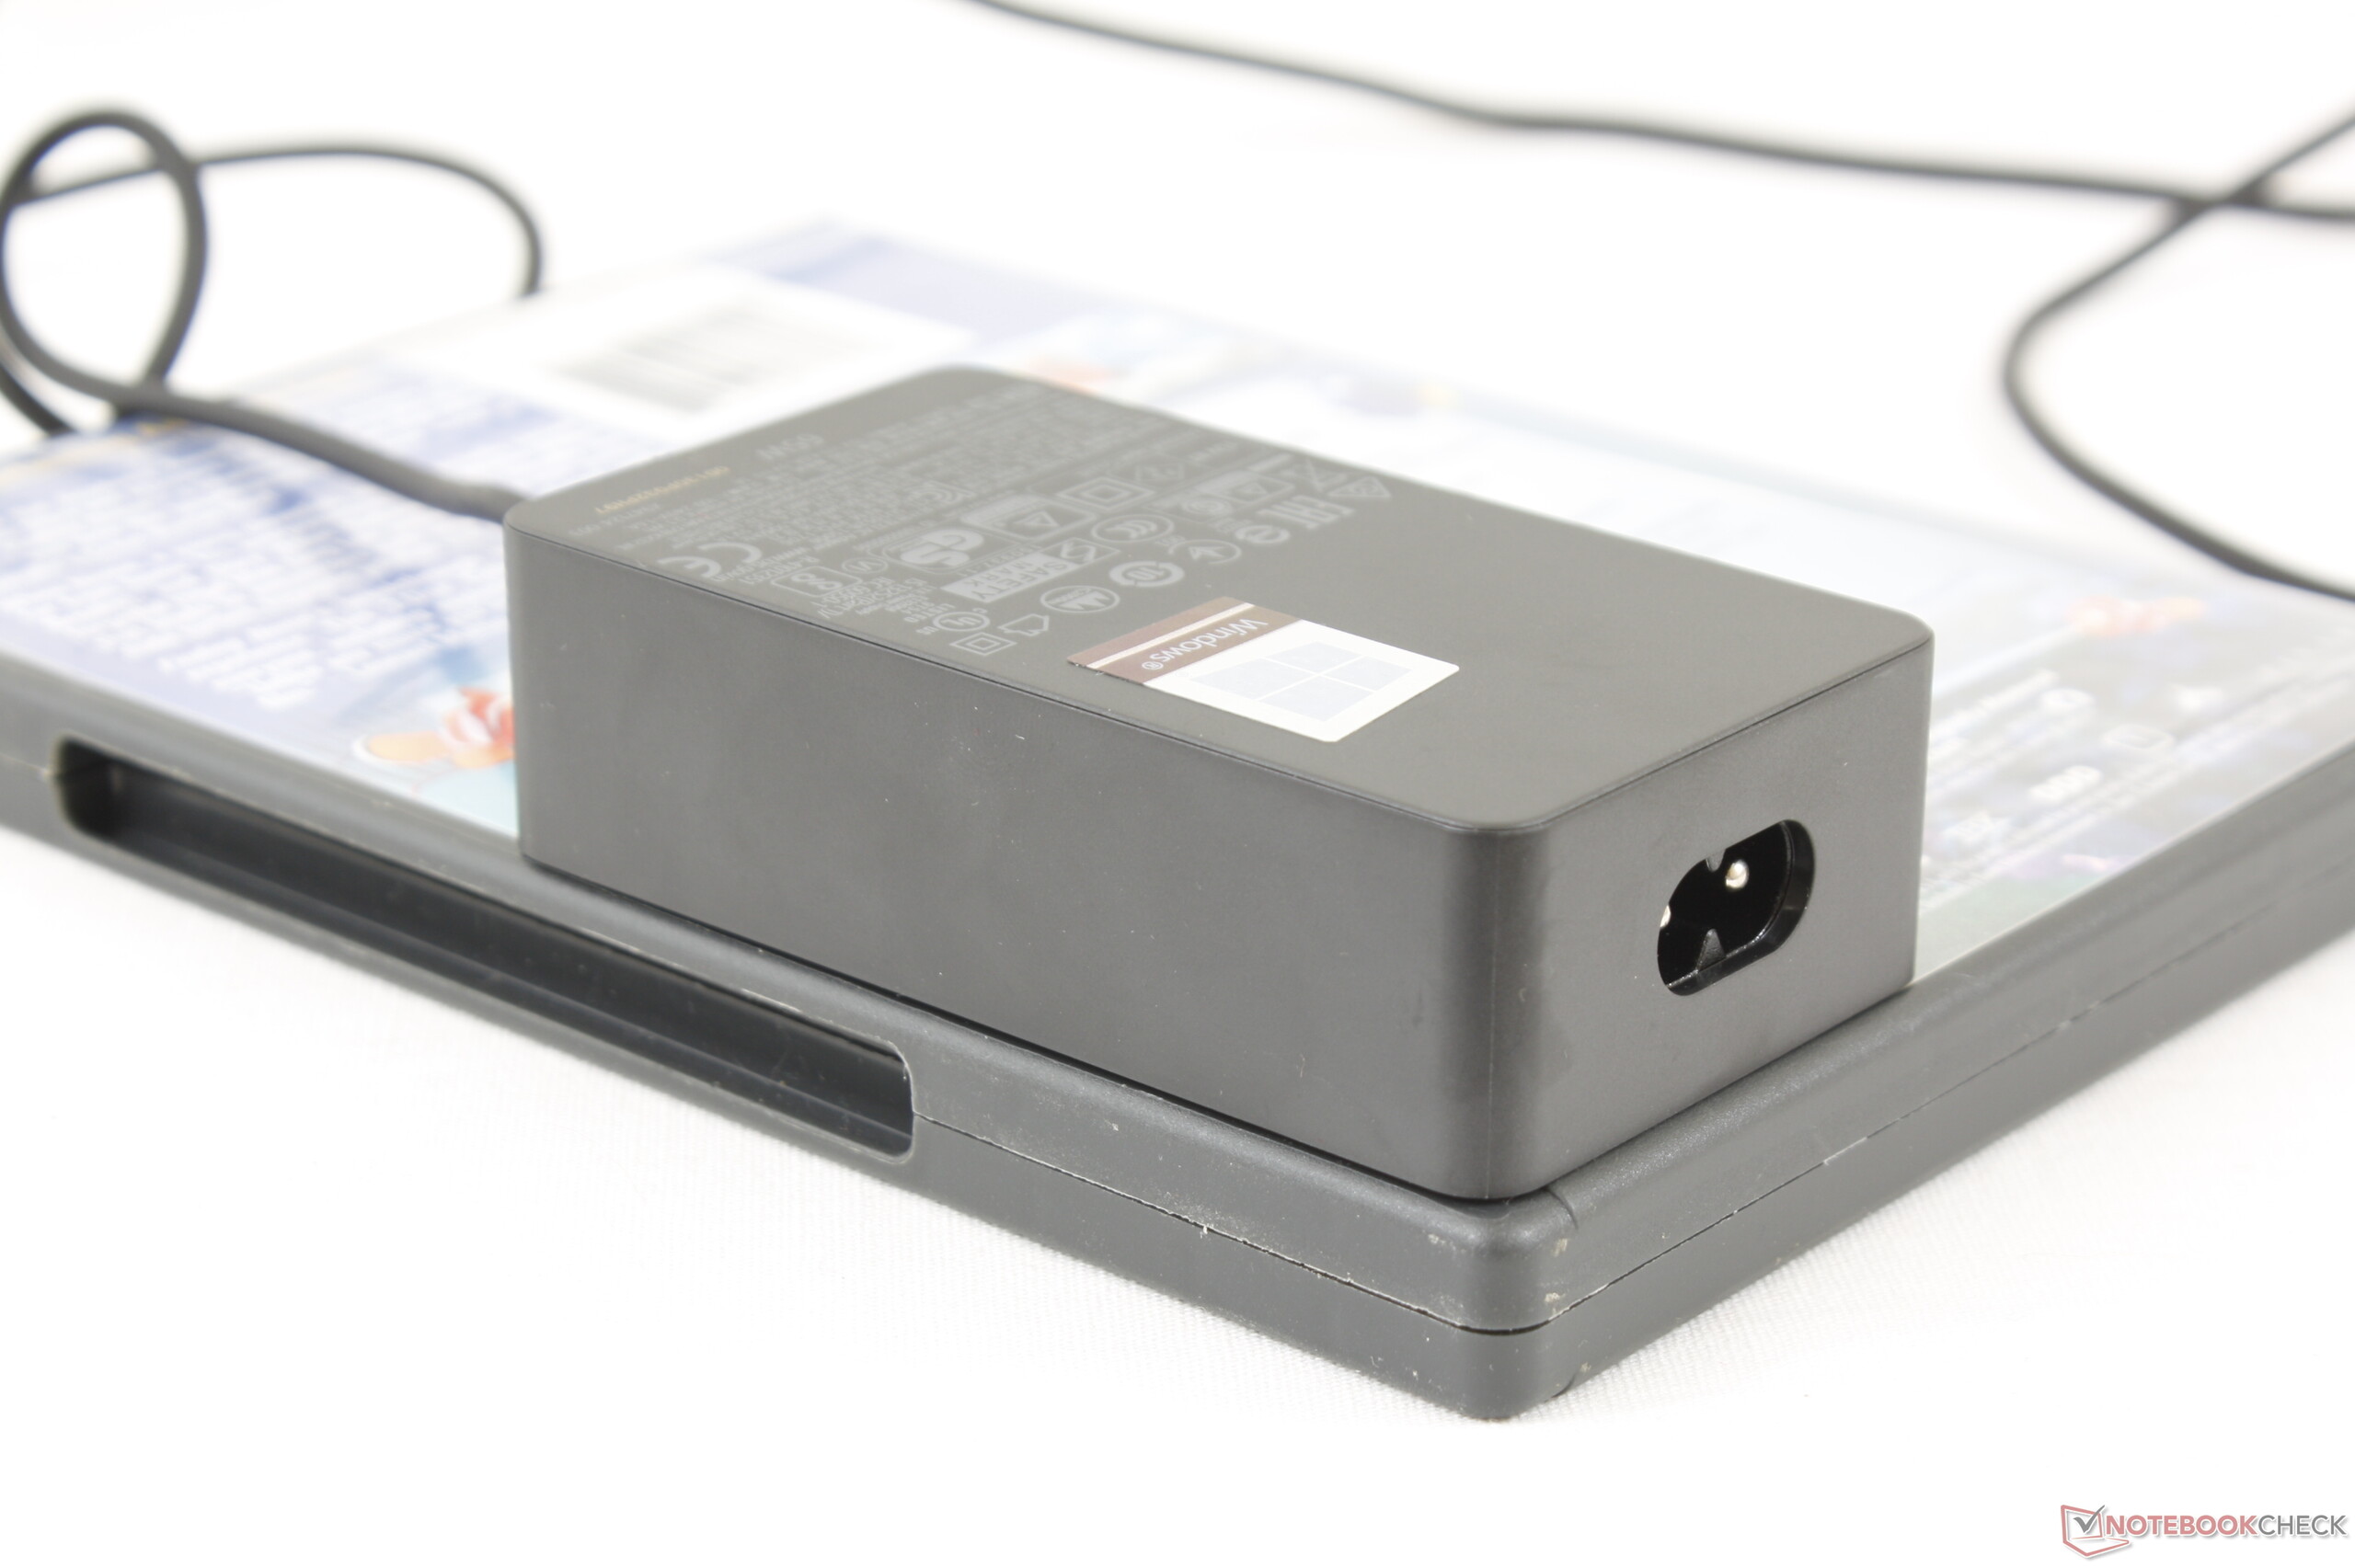
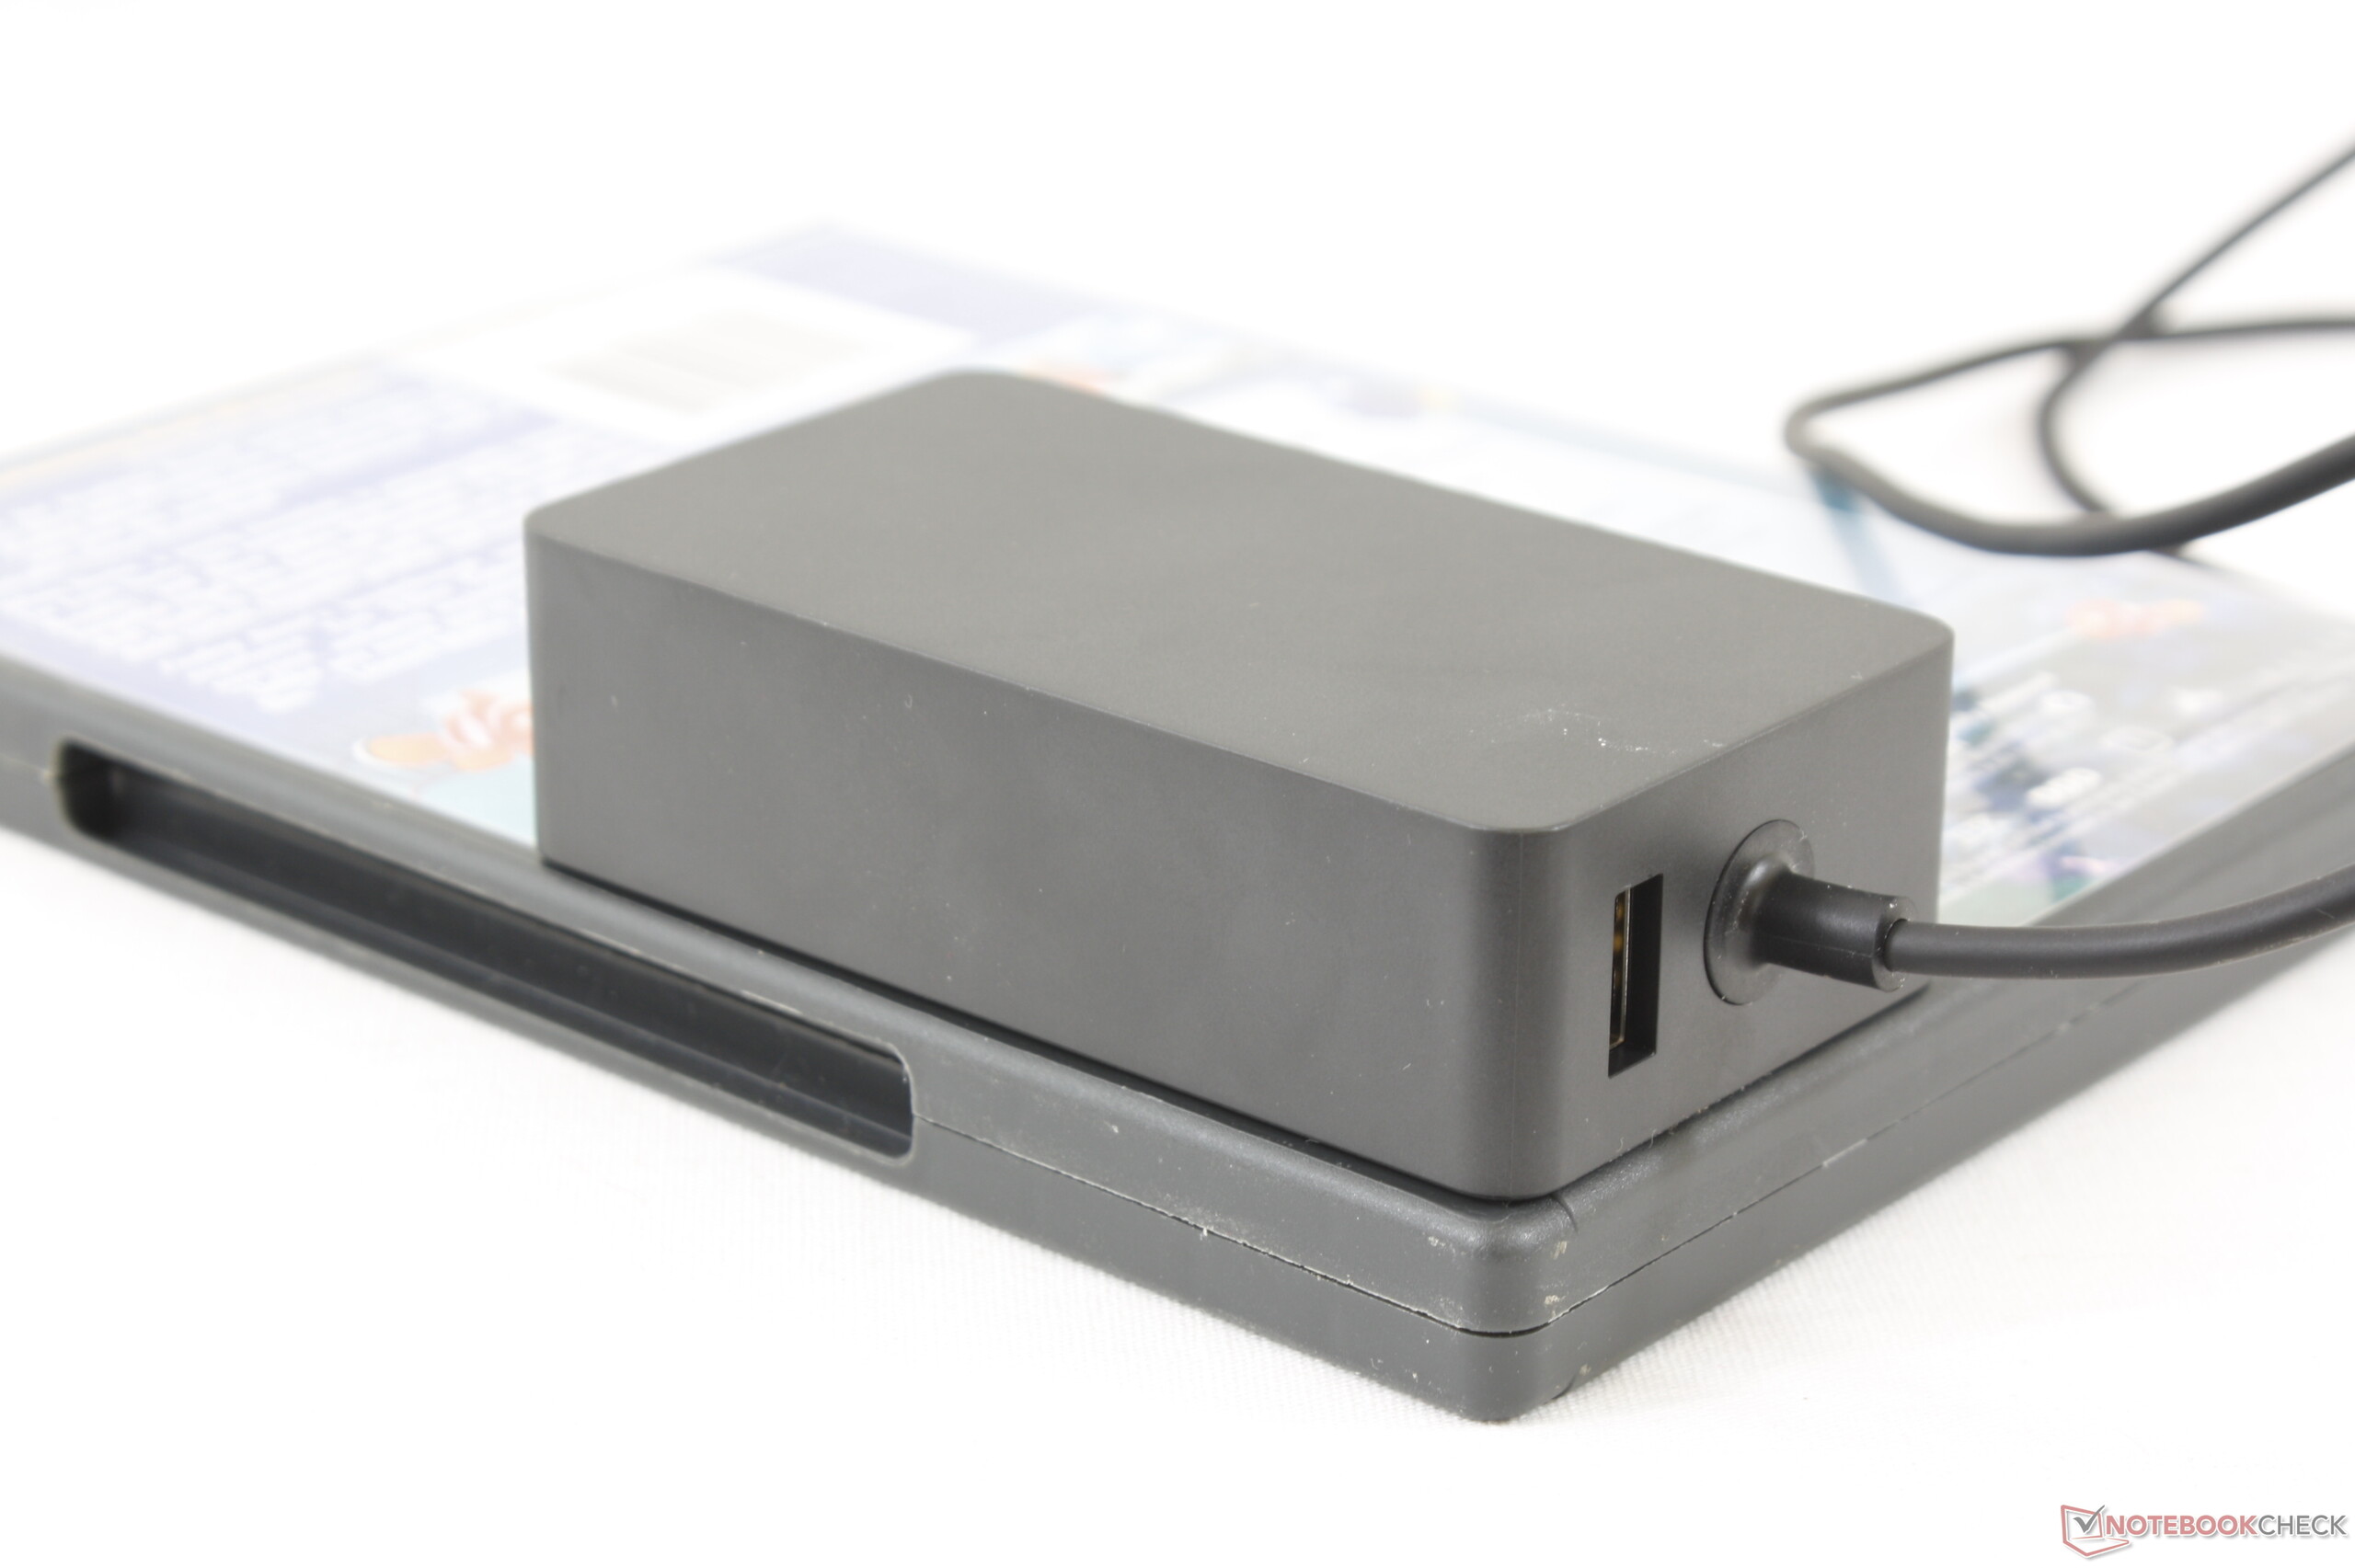
Il dispositivo non rivela alcun problema in termini di consumo energetico. Il consumo di energia è alla pari con i modelli Ice Lake Surface Pro 7. Inoltre, l'uscita dell'adattatore di alimentazione USB Type-C incluso è di 65 watt.
| Off / Standby | |
| Idle | |
| Sotto carico |
|
Leggenda:
min: | |
| Microsoft Surface Pro 7 Plus i5-1135G7, Iris Xe G7 80EUs | Lenovo Yoga Duet 7 13IML05-82AS000WGE i5-10210U, UHD Graphics 620 | Dell Latitude 12 7210 2-in-1 i7-10610U, UHD Graphics 620 | Microsoft Surface Pro 7 i7-1065G7, Iris Plus Graphics G7 (Ice Lake 64 EU) | Microsoft Surface Pro 7 Core i5-1035G4 i5-1035G4, Iris Plus Graphics G4 (Ice Lake 48 EU) | Media Intel Iris Xe Graphics G7 80EUs | Media della classe Convertible | |
|---|---|---|---|---|---|---|---|
| Power Consumption | 42% | 32% | 5% | 4% | 12% | 9% | |
| Idle Minimum * (Watt) | 5.5 | 3.1 44% | 3.2 42% | 4.4 20% | 4.5 18% | 4.49 ? 18% | 4.24 ? 23% |
| Idle Average * (Watt) | 9.1 | 5.7 37% | 5.3 42% | 8.7 4% | 9.2 -1% | 7.4 ? 19% | 7.03 ? 23% |
| Idle Maximum * (Watt) | 10.8 | 8.7 19% | 8.4 22% | 9.6 11% | 9.6 11% | 9.26 ? 14% | 8.61 ? 20% |
| Load Average * (Watt) | 39.2 | 20.5 48% | 27 31% | 44 -12% | 42 -7% | 36.6 ? 7% | 43.9 ? -12% |
| Load Maximum * (Watt) | 62.5 | 22.6 64% | 46.9 25% | 61 2% | 63.5 -2% | 61.7 ? 1% | 67.2 ? -8% |
* ... Meglio usare valori piccoli
Durata della batteria
Microsoft promette una durata massima della batteria di 15 ore - siamo stati in grado di determinare una autonomia massima in idle di 13:36 ore. Il test Wi-Fi (accesso a siti web tramite uno script) e il test video (il cortometraggio Big Buck Bunny (H.264, Full HD) in esecuzione in un loop) sono completati dal dispositivo dopo 8:03 ore e 10:50 ore, rispettivamente. Durante i test, le funzioni di risparmio energetico del 2-in-1 sono disabilitate, e la luminosità del display è impostata a circa 150 cd/m². Anche i moduli wireless sono disabilitati durante il test video.
| Microsoft Surface Pro 7 Plus i5-1135G7, Iris Xe G7 80EUs, 48.9 Wh | Lenovo Yoga Duet 7 13IML05-82AS000WGE i5-10210U, UHD Graphics 620, 39 Wh | Dell Latitude 12 7210 2-in-1 i7-10610U, UHD Graphics 620, 38 Wh | Microsoft Surface Pro 7 i7-1065G7, Iris Plus Graphics G7 (Ice Lake 64 EU), 45 Wh | Microsoft Surface Pro 7 Core i5-1035G4 i5-1035G4, Iris Plus Graphics G4 (Ice Lake 48 EU), 45 Wh | Media della classe Convertible | |
|---|---|---|---|---|---|---|
| Autonomia della batteria | -21% | 6% | -21% | 12% | 35% | |
| Reader / Idle (h) | 13.6 | 12.8 -6% | 22.8 68% | 11.5 -15% | 22.3 64% | 27.7 ? 104% |
| H.264 (h) | 10.8 | 8.2 -24% | 11.3 5% | 6.7 -38% | 15.3 ? 42% | |
| WiFi v1.3 (h) | 8.1 | 8.7 7% | 8.2 1% | 9.8 21% | 10 23% | 12.1 ? 49% |
| Load (h) | 3.9 | 1.6 -59% | 1.9 -51% | 1.9 -51% | 1.9 -51% | 1.779 ? -54% |
Pro
Contro
Valutazione complessiva del Surface Pro 7 Plus
Il Surface Pro 7 Plus è la variante 2-in-1 più completa rispetto al Surface Pro 7. La piattaforma Tiger Lake utilizzata offre maggiori prestazioni complessive rispetto all'Ice Lake - le prestazioni della GPU aumentano significativamente più di quelle della CPU. Un piccolo sportello di manutenzione permette una facile sostituzione dell'SSD. Il dispositivo può anche connettersi al mondo esterno via LTE.
Non è ancora chiaro se molti utenti potranno acquistare il Surface Pro 7 Plus. Per ora, sarà venduto solo ad aziende e scuole.
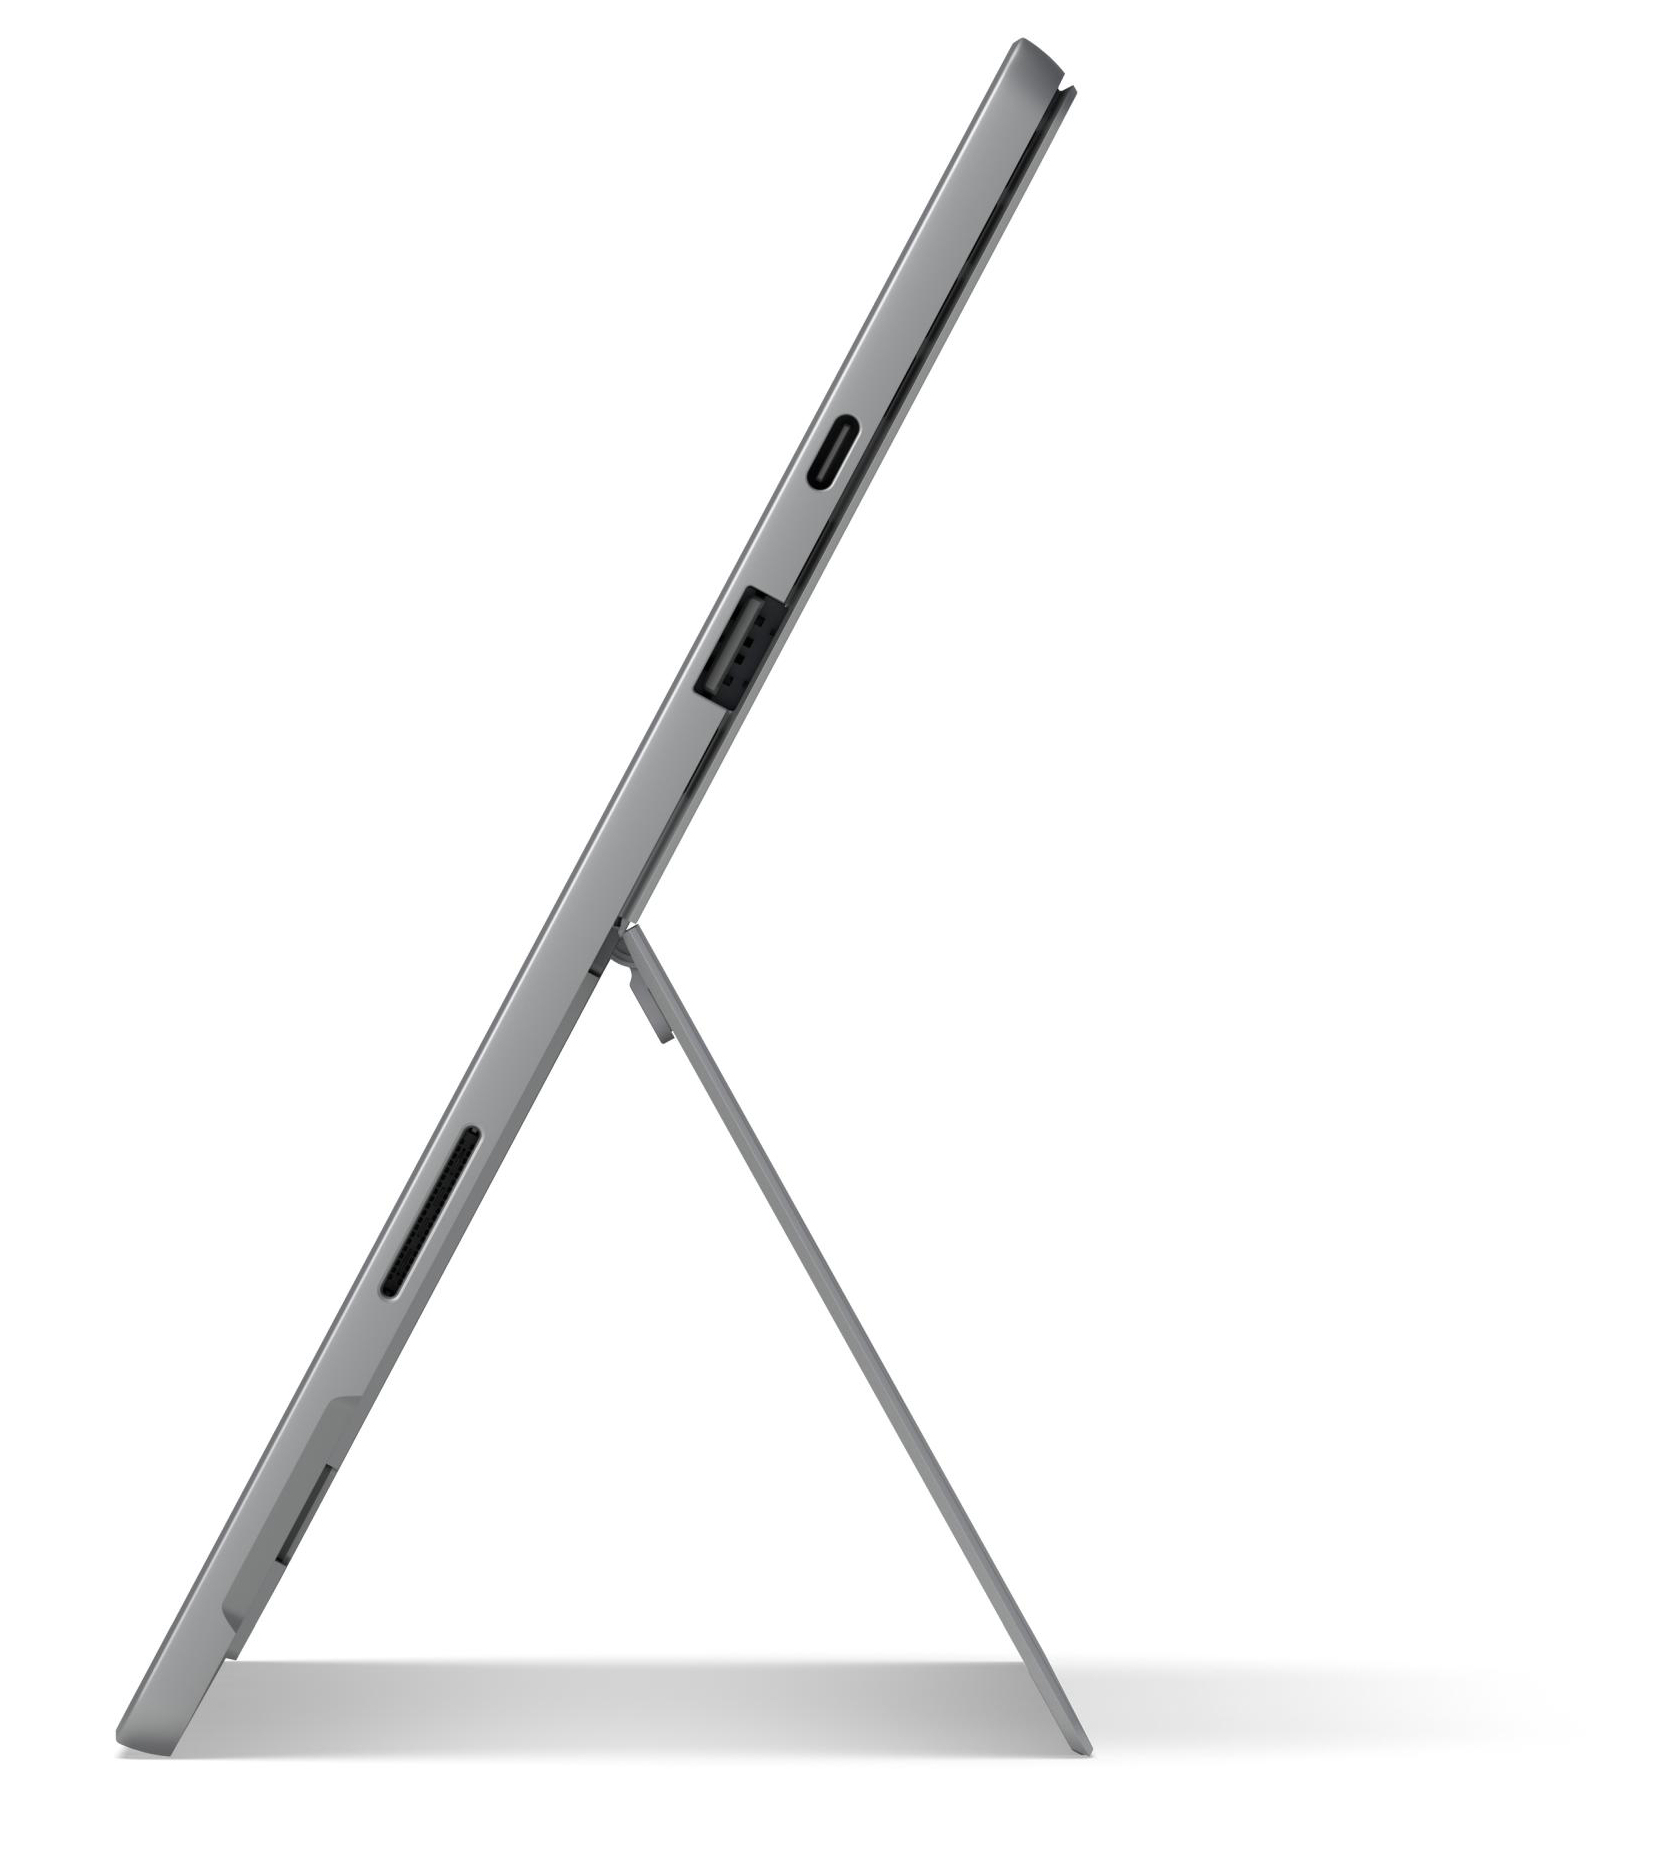
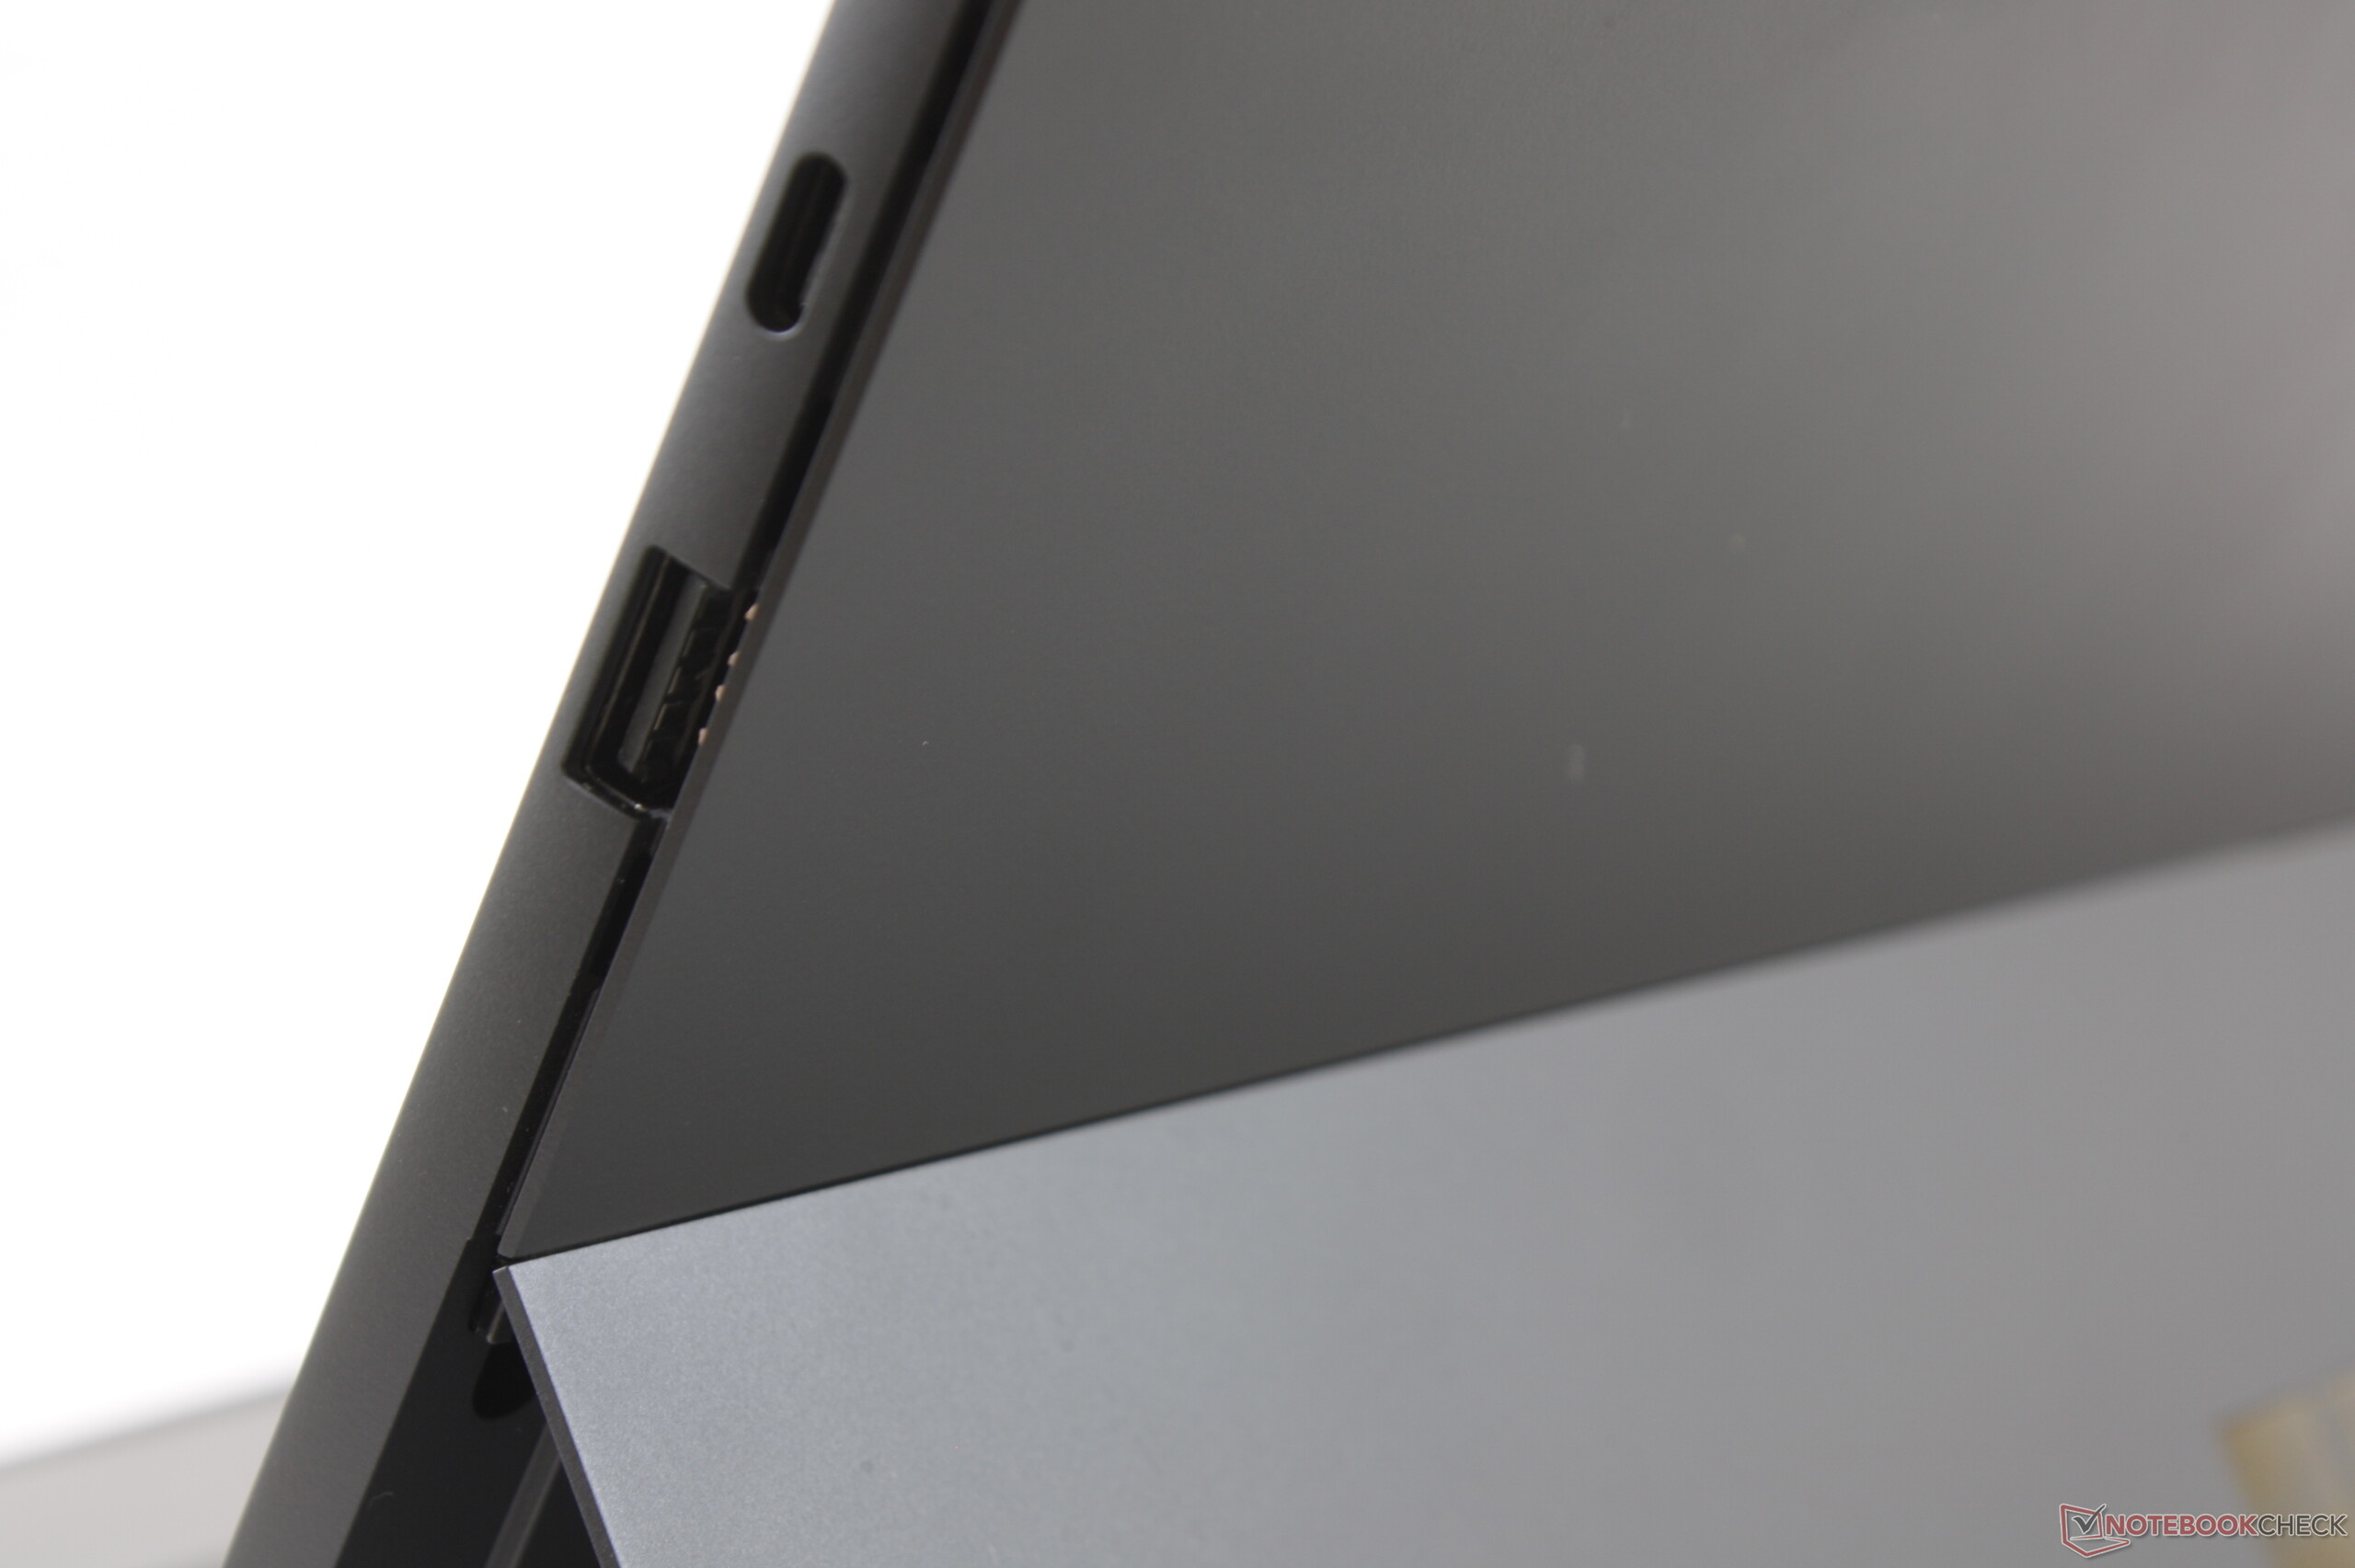
La capacità della batteria leggermente aumentata (48,9 Wh contro 45 Wh) non ha un vero impatto. Il Surface Pro 7 Plus raggiunge tempi di autonomia nel mondo reale da 8 a 11 ore ed è più o meno alla pari con i valori del Surface Pro 7. La porta USB-C integrata (DisplayPort, Power Delivery) funziona ancora secondo lo standard USB 3.2 Gen. 1. L'opportunità di passare alla Thunderbolt 4/USB 4 è stata persa in questo caso.
Alcune debolezze del Surface normale sono state riportate: Nonostante sia raffreddato passivamente, il dispositivo 2-in-1 di Microsoft non è completamente silenzioso. Di tanto in tanto, si può sentire un tintinnio elettronico dall'interno. Il display touchscreen sfarfalla ad una frequenza di 199,2 Hz a livelli di luminosità del 57% (corrisponde a circa 119 cd/m²) e sotto.
Anche se il Surface si rivolge alle aziende e alle scuole, manca un lettore di impronte digitali. Se necessario, si deve usare una tastiera (Microsoft Surface Pro Type Cover con Fingerprint ID). Infine, il periodo di garanzia di un anno non è appropriato per un dispositivo in questa fascia di prezzo.
Prezzo e disponibilità
Il Microsoft Store propone il Surface Pro 7 Plus a prezzi a partire da 899,99 dollari. Ci sono diverse configurazioni disponibili così come un "Business Essentials Bundle" che include la Type Cover e un piano di protezione a scelta. Il bundle parte da circa 1.100 dollari.
Microsoft Surface Pro 7 Plus
- 03/19/2021 v7 (old)
Sascha Mölck
Price comparison
