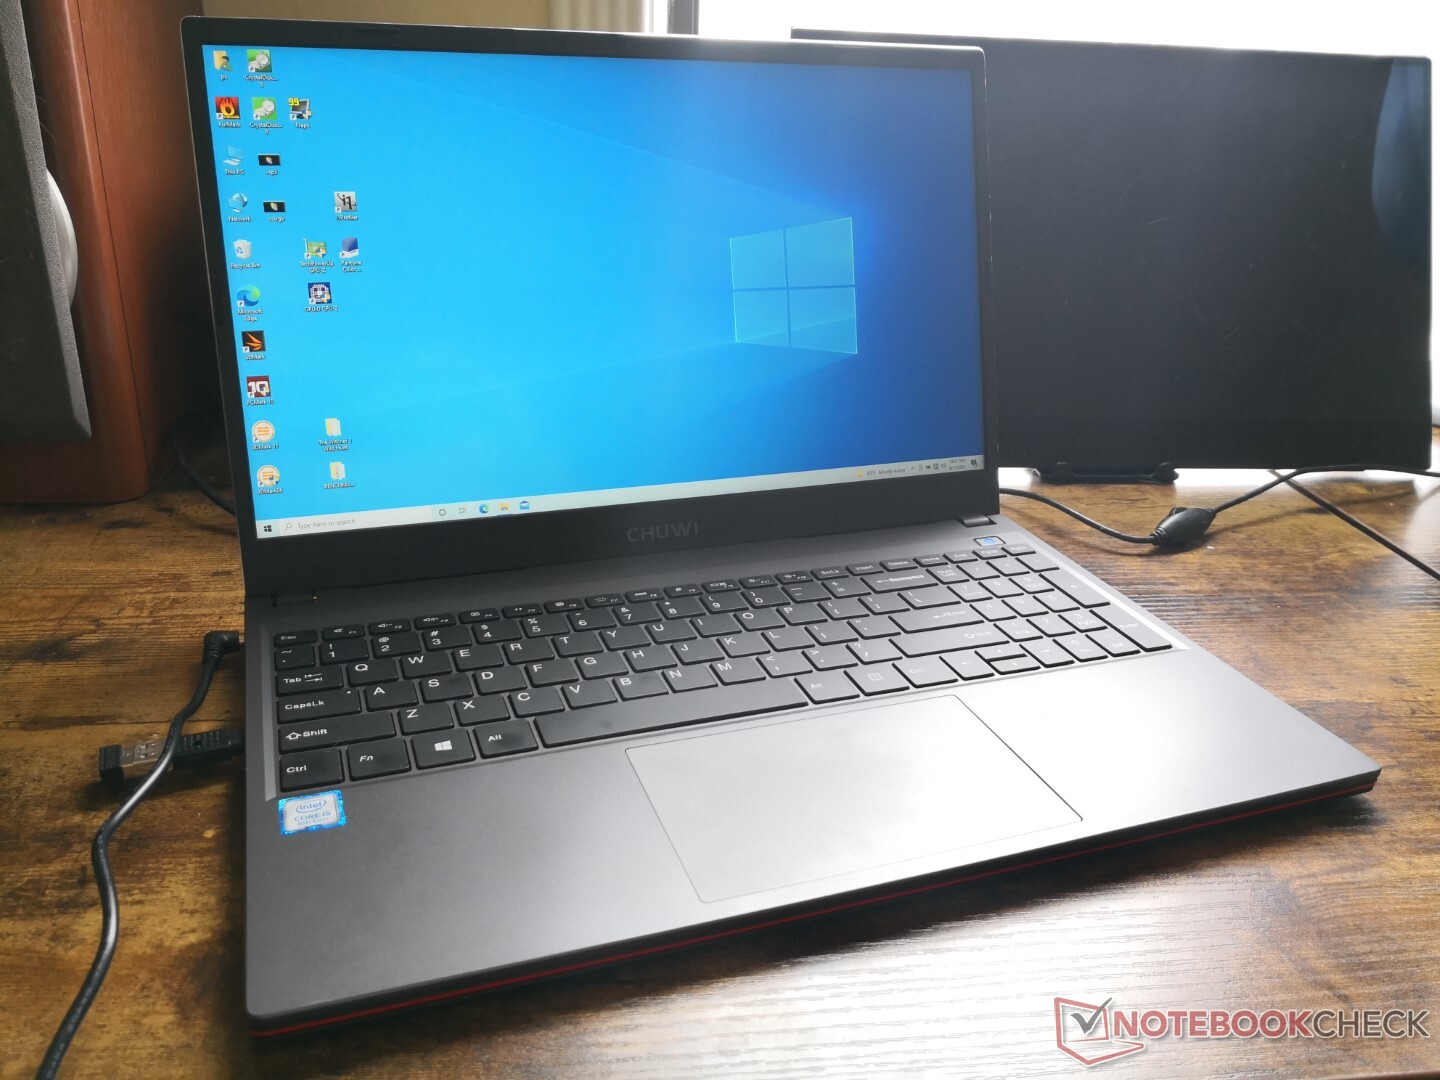
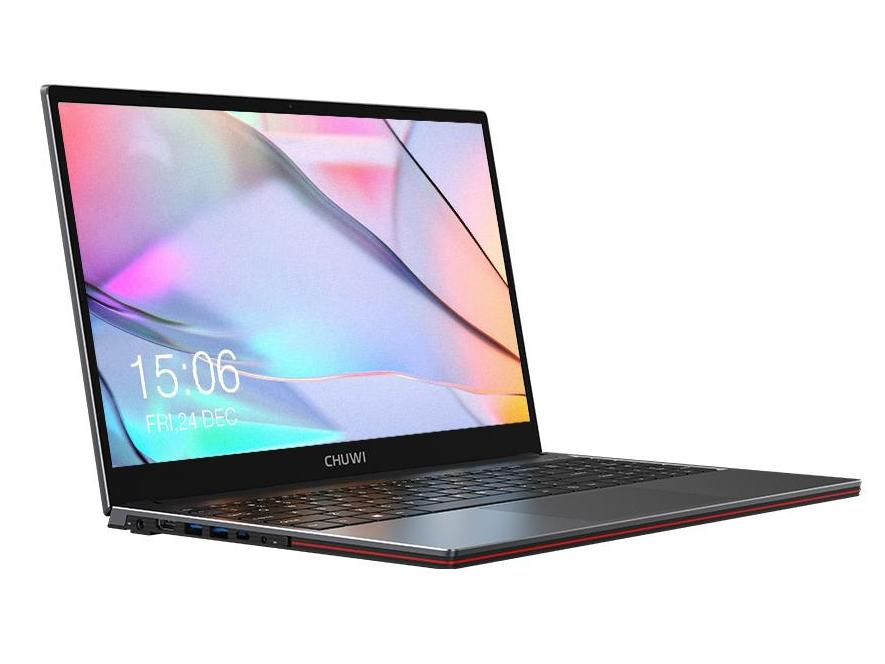
Recensione del portatile Chuwi CoreBook X Pro: Display da 120 Hz a buon mercato
Confronto con i potenziali concorrenti
Punteggio | Data | Modello | Peso | Altezza | Dimensione | Risoluzione | Prezzo |
|---|---|---|---|---|---|---|---|
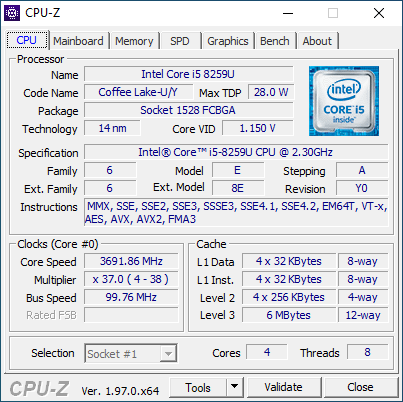
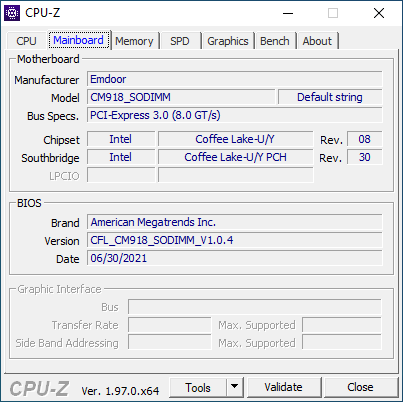
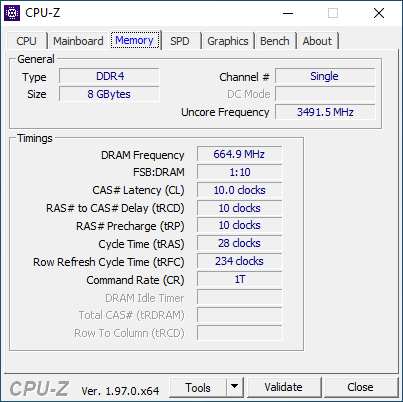
| 74.8 % v7 (old) | 09/2021 | Chuwi CoreBook X Pro i5-8259U, Iris Plus Graphics 655 | 1.8 kg | 17.9 mm | 15.60" | 1920x1080 | |
| 77 % v7 (old) | 09/2021 | Teclast TBOLT F15 Pro i3-1005G1, UHD Graphics G1 (Ice Lake 32 EU) | 1.9 kg | 20.5 mm | 15.60" | 1920x1080 | |
| 82.1 % v7 (old) | 07/2021 | Asus VivoBook S15 D533UA R7 5700U, Vega 8 | 1.8 kg | 16.1 mm | 15.60" | 1920x1080 | |
| 83.3 % v7 (old) | Tuxedo Aura 15 Gen1 R7 4700U, Vega 7 | 1.7 kg | 19.9 mm | 15.60" | 1920x1080 | ||
| 82.8 % v7 (old) | 07/2020 | Honor MagicBook 15 R5 3500U, Vega 8 | 1.5 kg | 16.9 mm | 15.60" | 1920x1080 | |
| 86.8 % v7 (old) | 05/2020 | Dell XPS 15 9500 Core i5 i5-10300H, UHD Graphics 630 | 1.8 kg | 18 mm | 15.60" | 1920x1200 |
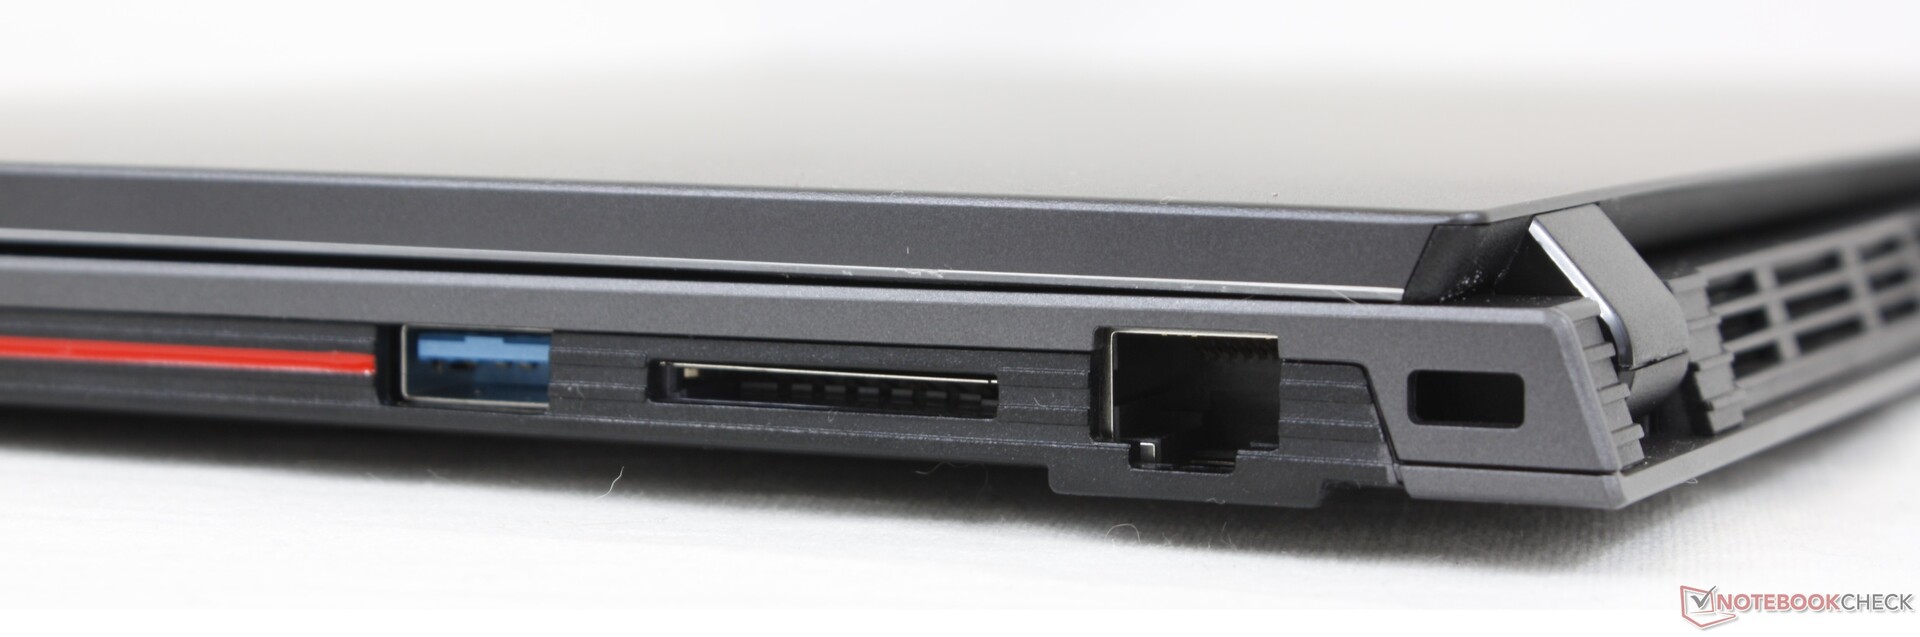
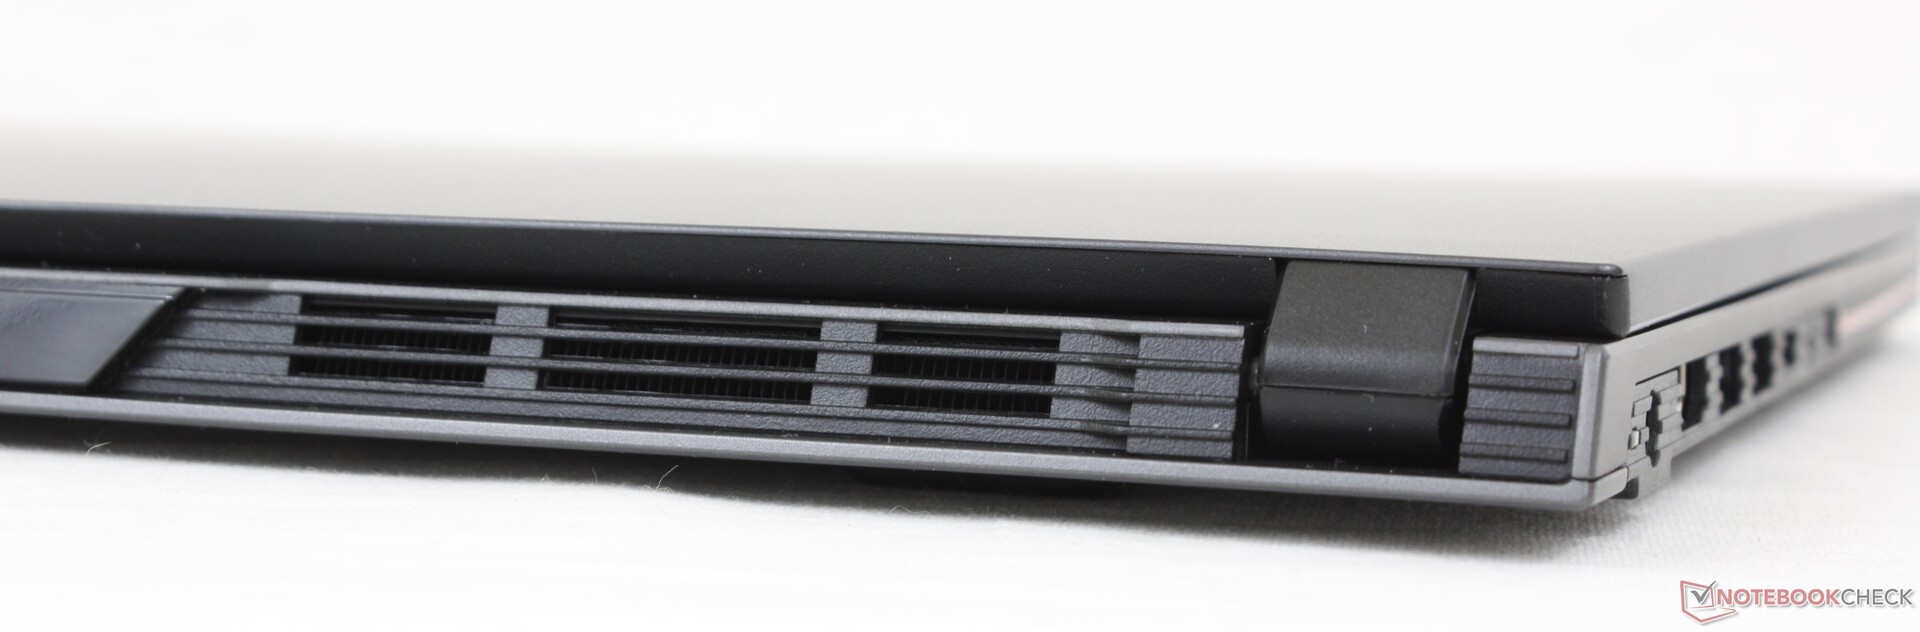
| SD Card Reader | |
| average JPG Copy Test (av. of 3 runs) | |
| Dell XPS 15 9500 Core i5 (Toshiba Exceria Pro SDXC 64 GB UHS-II) | |
| Tuxedo Aura 15 Gen1 (AV Pro V60) | |
| Asus VivoBook S15 D533UA (AV PRO microSD 128 GB V60) | |
| Teclast TBOLT F15 Pro (AV Pro v60) | |
| Chuwi CoreBook X Pro (AV Pro V60) | |
| maximum AS SSD Seq Read Test (1GB) | |
| Dell XPS 15 9500 Core i5 (Toshiba Exceria Pro SDXC 64 GB UHS-II) | |
| Tuxedo Aura 15 Gen1 (AV Pro V60) | |
| Asus VivoBook S15 D533UA (AV PRO microSD 128 GB V60) | |
| Teclast TBOLT F15 Pro (AV Pro v60) | |
| Chuwi CoreBook X Pro (AV Pro V60) | |
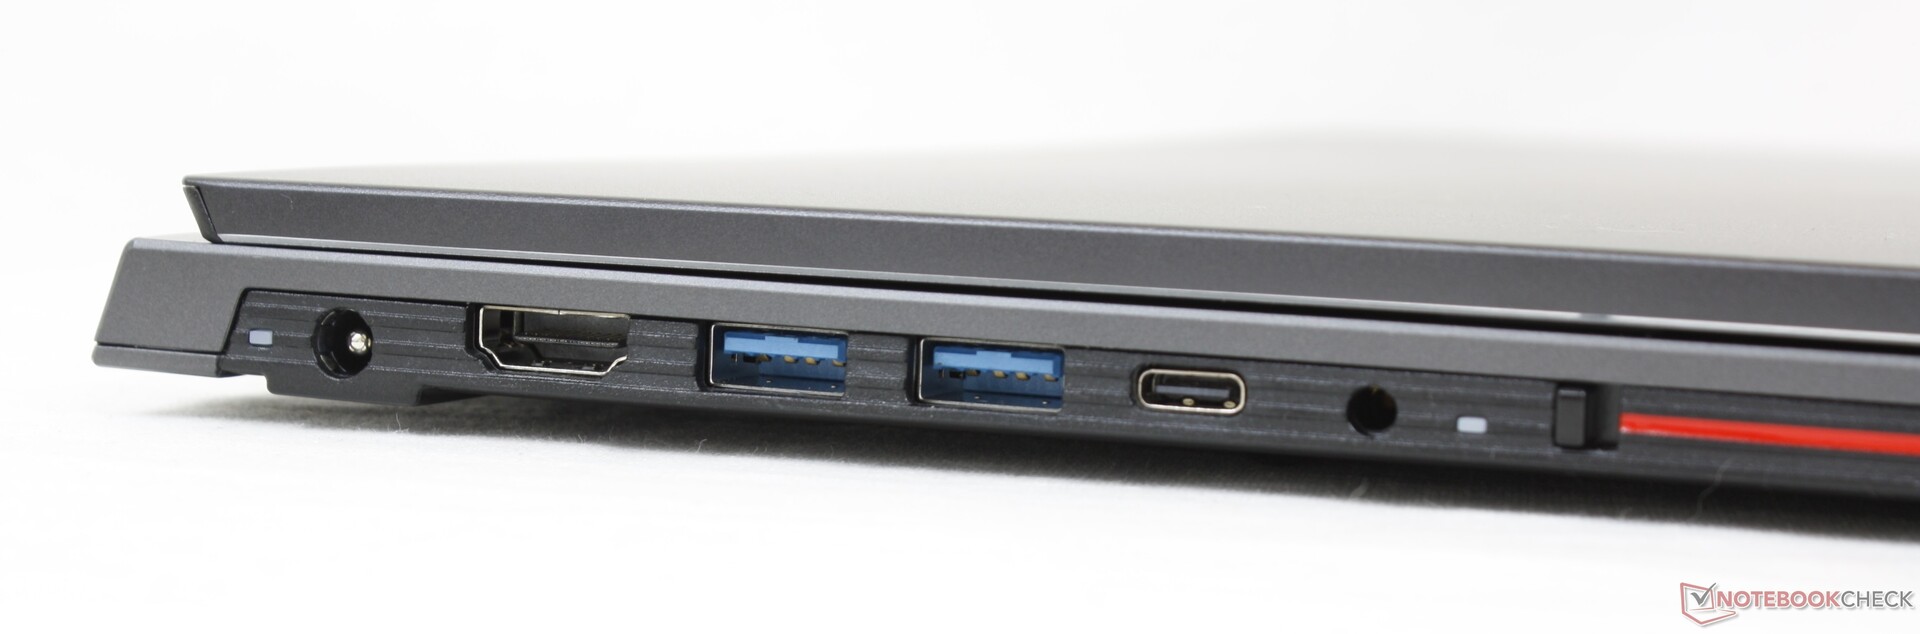
| Networking | |
| iperf3 transmit AX12 | |
| Tuxedo Aura 15 Gen1 | |
| Asus VivoBook S15 D533UA | |
| Dell XPS 15 9500 Core i5 | |
| Honor MagicBook 15 | |
| Chuwi CoreBook X Pro | |
| Teclast TBOLT F15 Pro | |
| iperf3 receive AX12 | |
| Dell XPS 15 9500 Core i5 | |
| Asus VivoBook S15 D533UA | |
| Tuxedo Aura 15 Gen1 | |
| Honor MagicBook 15 | |
| Teclast TBOLT F15 Pro | |
| Chuwi CoreBook X Pro | |


| |||||||||||||||||||||||||
Distribuzione della luminosità: 87 %
Al centro con la batteria: 269.7 cd/m²
Contrasto: 1348:1 (Nero: 0.2 cd/m²)
ΔE ColorChecker Calman: 3.9 | ∀{0.5-29.43 Ø4.73}
calibrated: 1.61
ΔE Greyscale Calman: 3.5 | ∀{0.09-98 Ø4.97}
43.4% AdobeRGB 1998 (Argyll 3D)
62.9% sRGB (Argyll 3D)
41.9% Display P3 (Argyll 3D)
Gamma: 2.27
CCT: 7045 K
| Chuwi CoreBook X Pro Chi Mei N156HRA-EA1, IPS, 15.6", 1920x1080 | Teclast TBOLT F15 Pro N156HCA-EN1, IPS, 15.6", 1920x1080 | Asus VivoBook S15 D533UA Chi Mei N156HCA-EAB, IPS, 15.6", 1920x1080 | Tuxedo Aura 15 Gen1 N156HCA-EA1, IPS, 15.6", 1920x1080 | Honor MagicBook 15 AU Optronics B156HAN02.8, IPS, 15.6", 1920x1080 | Dell XPS 15 9500 Core i5 Sharp LQ156N1, IPS, 15.6", 1920x1200 | |
|---|---|---|---|---|---|---|
| Display | 56% | 4% | 52% | -5% | 79% | |
| Display P3 Coverage (%) | 41.9 | 65.6 57% | 43.6 4% | 65.9 57% | 39.96 -5% | 81.5 95% |
| sRGB Coverage (%) | 62.9 | 98.1 56% | 65.2 4% | 91.9 46% | 59.7 -5% | 100 59% |
| AdobeRGB 1998 Coverage (%) | 43.4 | 67.8 56% | 45 4% | 66.7 54% | 41.29 -5% | 79.6 83% |
| Response Times | -22% | 30% | -32% | -12% | -30% | |
| Response Time Grey 50% / Grey 80% * (ms) | 31.2 ? | 39.6 ? -27% | 18 ? 42% | 42 ? -35% | 36 ? -15% | 42 ? -35% |
| Response Time Black / White * (ms) | 23.2 ? | 26.8 ? -16% | 19 ? 18% | 29.6 ? -28% | 25 ? -8% | 28.8 ? -24% |
| PWM Frequency (Hz) | 25510 ? | |||||
| Screen | 20% | -22% | -7% | -9% | 17% | |
| Brightness middle (cd/m²) | 269.7 | 293 9% | 289 7% | 351 30% | 251 -7% | 592 120% |
| Brightness (cd/m²) | 253 | 266 5% | 267 6% | 337 33% | 247 -2% | 565 123% |
| Brightness Distribution (%) | 87 | 84 -3% | 85 -2% | 91 5% | 85 -2% | 85 -2% |
| Black Level * (cd/m²) | 0.2 | 0.21 -5% | 0.56 -180% | 0.29 -45% | 0.205 -2% | 0.46 -130% |
| Contrast (:1) | 1348 | 1395 3% | 516 -62% | 1210 -10% | 1224 -9% | 1287 -5% |
| Colorchecker dE 2000 * | 3.9 | 2.1 46% | 3.96 -2% | 4.5 -15% | 3.94 -1% | 3.19 18% |
| Colorchecker dE 2000 max. * | 15.77 | 5 68% | 6.76 57% | 9.4 40% | 7.87 50% | 5.45 65% |
| Colorchecker dE 2000 calibrated * | 1.61 | 0.7 57% | 1.9 -18% | 3.42 -112% | 2.03 -26% | |
| Greyscale dE 2000 * | 3.5 | 3.5 -0% | 3.43 2% | 6.3 -80% | 3.42 2% | 3.9 -11% |
| Gamma | 2.27 97% | 2.21 100% | 2.28 96% | 2.25 98% | 2.44 90% | 2.25 98% |
| CCT | 7045 92% | 6681 97% | 7191 90% | 6601 98% | 6319 103% | 6522 100% |
| Color Space (Percent of AdobeRGB 1998) (%) | 42 | 59.7 | 38 | 71.6 | ||
| Color Space (Percent of sRGB) (%) | 65 | 91.8 | 59 | 100 | ||
| Media totale (Programma / Settaggio) | 18% /
22% | 4% /
-8% | 4% /
2% | -9% /
-9% | 22% /
24% |
* ... Meglio usare valori piccoli
Tempi di risposta del Display
| ↔ Tempi di risposta dal Nero al Bianco | ||
|---|---|---|
| 23.2 ms ... aumenta ↗ e diminuisce ↘ combinato | ↗ 12.4 ms Incremento | 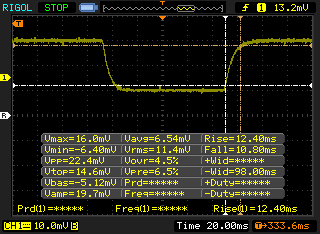 |
| ↘ 10.8 ms Calo | ||
| Lo schermo mostra buoni tempi di risposta durante i nostri tests, ma potrebbe essere troppo lento per i gamers competitivi. In confronto, tutti i dispositivi di test variano da 0.1 (minimo) a 240 (massimo) ms. » 53 % di tutti i dispositivi è migliore. Questo significa che i tempi di risposta rilevati sono peggiori rispetto alla media di tutti i dispositivi testati (19.9 ms). | ||
| ↔ Tempo di risposta dal 50% Grigio all'80% Grigio | ||
| 31.2 ms ... aumenta ↗ e diminuisce ↘ combinato | ↗ 17.2 ms Incremento | 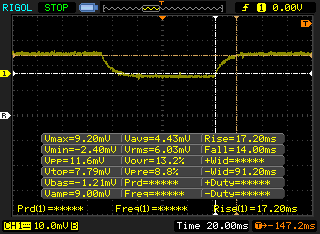 |
| ↘ 14 ms Calo | ||
| Lo schermo mostra tempi di risposta lenti nei nostri tests e sarà insoddisfacente per i gamers. In confronto, tutti i dispositivi di test variano da 0.165 (minimo) a 636 (massimo) ms. » 42 % di tutti i dispositivi è migliore. Questo significa che i tempi di risposta rilevati sono simili alla media di tutti i dispositivi testati (31.1 ms). | ||
Sfarfallio dello schermo / PWM (Pulse-Width Modulation)
| flickering dello schermo / PWM non rilevato |  | ||
In confronto: 52 % di tutti i dispositivi testati non utilizza PWM per ridurre la luminosita' del display. Se è rilevato PWM, una media di 7798 (minimo: 5 - massimo: 343500) Hz è stata rilevata. | |||
Cinebench R15 Multi Loop
Cinebench R23: Multi Core | Single Core
Cinebench R15: CPU Multi 64Bit | CPU Single 64Bit
Blender: v2.79 BMW27 CPU
7-Zip 18.03: 7z b 4 -mmt1 | 7z b 4
Geekbench 5.5: Single-Core | Multi-Core
HWBOT x265 Benchmark v2.2: 4k Preset
LibreOffice : 20 Documents To PDF
R Benchmark 2.5: Overall mean
| Cinebench R20 / CPU (Multi Core) | |
| Tuxedo Aura 15 Gen1 | |
| Honor MagicBook 15 4500U | |
| HP Pavilion 15-eg | |
| HP Pavilion x360 15-er0155ng | |
| Chuwi CoreBook X Pro | |
| Media Intel Core i5-8259U (1385 - 1567, n=5) | |
| HP 15s-fq1440ng | |
| HP 250 G7-15S40ES | |
| Dynabook Satellite Pro C50-E-105 | |
| HP Pavilion x360 15-dq0065cl | |
| Cinebench R20 / CPU (Single Core) | |
| HP Pavilion 15-eg | |
| HP Pavilion x360 15-er0155ng | |
| Tuxedo Aura 15 Gen1 | |
| HP 15s-fq1440ng | |
| Honor MagicBook 15 4500U | |
| HP 250 G7-15S40ES | |
| HP Pavilion x360 15-dq0065cl | |
| Chuwi CoreBook X Pro | |
| Media Intel Core i5-8259U (369 - 386, n=5) | |
| Dynabook Satellite Pro C50-E-105 | |
| Cinebench R23 / Multi Core | |
| Tuxedo Aura 15 Gen1 | |
| HP Pavilion 15-eg | |
| HP Pavilion x360 15-er0155ng | |
| Chuwi CoreBook X Pro | |
| Media Intel Core i5-8259U (3592 - 4025, n=5) | |
| Cinebench R23 / Single Core | |
| HP Pavilion 15-eg | |
| HP Pavilion x360 15-er0155ng | |
| Tuxedo Aura 15 Gen1 | |
| Chuwi CoreBook X Pro | |
| Media Intel Core i5-8259U (959 - 991, n=4) | |
| Cinebench R15 / CPU Multi 64Bit | |
| Tuxedo Aura 15 Gen1 | |
| Honor MagicBook 15 4500U | |
| HP Pavilion 15-eg | |
| HP Pavilion x360 15-er0155ng | |
| HP 15s-fq1440ng | |
| Chuwi CoreBook X Pro | |
| Media Intel Core i5-8259U (575 - 687, n=7) | |
| HP 250 G7-15S40ES | |
| Dynabook Satellite Pro C50-E-105 | |
| HP Pavilion x360 15-dq0065cl | |
| Cinebench R15 / CPU Single 64Bit | |
| HP Pavilion 15-eg | |
| HP Pavilion x360 15-er0155ng | |
| Tuxedo Aura 15 Gen1 | |
| HP 15s-fq1440ng | |
| HP Pavilion x360 15-dq0065cl | |
| Honor MagicBook 15 4500U | |
| HP 250 G7-15S40ES | |
| Chuwi CoreBook X Pro | |
| Media Intel Core i5-8259U (132 - 154, n=6) | |
| Dynabook Satellite Pro C50-E-105 | |
| Blender / v2.79 BMW27 CPU | |
| HP 15s-fq1440ng | |
| HP 250 G7-15S40ES | |
| Dynabook Satellite Pro C50-E-105 | |
| Media Intel Core i5-8259U (688 - 769, n=6) | |
| Chuwi CoreBook X Pro | |
| HP Pavilion x360 15-er0155ng | |
| HP Pavilion 15-eg | |
| Honor MagicBook 15 4500U | |
| Tuxedo Aura 15 Gen1 | |
| 7-Zip 18.03 / 7z b 4 -mmt1 | |
| HP Pavilion 15-eg | |
| HP Pavilion x360 15-er0155ng | |
| HP 15s-fq1440ng | |
| Tuxedo Aura 15 Gen1 | |
| Honor MagicBook 15 4500U | |
| HP 250 G7-15S40ES | |
| Chuwi CoreBook X Pro | |
| Media Intel Core i5-8259U (3753 - 4022, n=6) | |
| Dynabook Satellite Pro C50-E-105 | |
| 7-Zip 18.03 / 7z b 4 | |
| Tuxedo Aura 15 Gen1 | |
| Honor MagicBook 15 4500U | |
| HP Pavilion 15-eg | |
| HP Pavilion x360 15-er0155ng | |
| Media Intel Core i5-8259U (17799 - 28824, n=6) | |
| Chuwi CoreBook X Pro | |
| Dynabook Satellite Pro C50-E-105 | |
| HP 15s-fq1440ng | |
| HP 250 G7-15S40ES | |
| Geekbench 5.5 / Single-Core | |
| HP Pavilion x360 15-er0155ng | |
| HP 15s-fq1440ng | |
| Honor MagicBook 15 4500U | |
| HP 250 G7-15S40ES | |
| Tuxedo Aura 15 Gen1 | |
| Media Intel Core i5-8259U (948 - 984, n=3) | |
| Dynabook Satellite Pro C50-E-105 | |
| Geekbench 5.5 / Multi-Core | |
| Tuxedo Aura 15 Gen1 | |
| Honor MagicBook 15 4500U | |
| HP Pavilion x360 15-er0155ng | |
| HP 15s-fq1440ng | |
| Media Intel Core i5-8259U (3359 - 3839, n=3) | |
| Dynabook Satellite Pro C50-E-105 | |
| HP 250 G7-15S40ES | |
| HWBOT x265 Benchmark v2.2 / 4k Preset | |
| Tuxedo Aura 15 Gen1 | |
| Honor MagicBook 15 4500U | |
| HP Pavilion 15-eg | |
| HP Pavilion x360 15-er0155ng | |
| Chuwi CoreBook X Pro | |
| Media Intel Core i5-8259U (4.72 - 5.49, n=6) | |
| Dynabook Satellite Pro C50-E-105 | |
| HP 15s-fq1440ng | |
| HP 250 G7-15S40ES | |
| LibreOffice / 20 Documents To PDF | |
| Dynabook Satellite Pro C50-E-105 | |
| Chuwi CoreBook X Pro | |
| Media Intel Core i5-8259U (62.7 - 76, n=5) | |
| Honor MagicBook 15 4500U | |
| HP 250 G7-15S40ES | |
| Tuxedo Aura 15 Gen1 | |
| HP 15s-fq1440ng | |
| HP Pavilion x360 15-er0155ng | |
| HP Pavilion 15-eg | |
| R Benchmark 2.5 / Overall mean | |
| Dynabook Satellite Pro C50-E-105 | |
| Media Intel Core i5-8259U (0.738 - 0.818, n=5) | |
| HP 250 G7-15S40ES | |
| Chuwi CoreBook X Pro | |
| HP 15s-fq1440ng | |
| HP Pavilion x360 15-er0155ng | |
| Honor MagicBook 15 4500U | |
| Tuxedo Aura 15 Gen1 | |
| HP Pavilion 15-eg | |
* ... Meglio usare valori piccoli
| PCMark 10 / Score | |
| Asus VivoBook S15 D533UA | |
| Tuxedo Aura 15 Gen1 | |
| Dell XPS 15 9500 Core i5 | |
| Honor MagicBook 15 | |
| Media Intel Core i5-8259U, Intel Iris Plus Graphics 655 (3284 - 4132, n=6) | |
| Chuwi CoreBook X Pro | |
| Teclast TBOLT F15 Pro | |
| PCMark 10 / Essentials | |
| Dell XPS 15 9500 Core i5 | |
| Tuxedo Aura 15 Gen1 | |
| Asus VivoBook S15 D533UA | |
| Teclast TBOLT F15 Pro | |
| Media Intel Core i5-8259U, Intel Iris Plus Graphics 655 (7364 - 8351, n=6) | |
| Honor MagicBook 15 | |
| Chuwi CoreBook X Pro | |
| PCMark 10 / Productivity | |
| Asus VivoBook S15 D533UA | |
| Tuxedo Aura 15 Gen1 | |
| Dell XPS 15 9500 Core i5 | |
| Chuwi CoreBook X Pro | |
| Media Intel Core i5-8259U, Intel Iris Plus Graphics 655 (4390 - 6400, n=6) | |
| Honor MagicBook 15 | |
| Teclast TBOLT F15 Pro | |
| PCMark 10 / Digital Content Creation | |
| Asus VivoBook S15 D533UA | |
| Tuxedo Aura 15 Gen1 | |
| Honor MagicBook 15 | |
| Media Intel Core i5-8259U, Intel Iris Plus Graphics 655 (2679 - 3902, n=6) | |
| Dell XPS 15 9500 Core i5 | |
| Chuwi CoreBook X Pro | |
| Teclast TBOLT F15 Pro | |
| PCMark 10 Score | 3580 punti | |
Aiuto | ||
| DPC Latencies / LatencyMon - interrupt to process latency (max), Web, Youtube, Prime95 | |
| Dell XPS 15 9500 Core i5 | |
| Honor MagicBook 15 | |
| Teclast TBOLT F15 Pro | |
| Chuwi CoreBook X Pro | |
| Asus VivoBook S15 D533UA | |
| Tuxedo Aura 15 Gen1 | |
* ... Meglio usare valori piccoli
| Chuwi CoreBook X Pro Kingston RBUSNS8154P3512GJ | Teclast TBOLT F15 Pro Teclast BD256GB | Asus VivoBook S15 D533UA WDC PC SN530 SDBPNPZ-1T00 | Honor MagicBook 15 Samsung SSD PM981a MZVLB256HBHQ | Dell XPS 15 9500 Core i5 Toshiba KBG40ZNS256G NVMe | |
|---|---|---|---|---|---|
| AS SSD | -54% | 54% | 33% | -35% | |
| Seq Read (MB/s) | 1404 | 523 -63% | 2082 48% | 2830 102% | 1423 1% |
| Seq Write (MB/s) | 962 | 443 -54% | 1844 92% | 2187 127% | 766 -20% |
| 4K Read (MB/s) | 36.5 | 23.12 -37% | 44.33 21% | 45.36 24% | 42.21 16% |
| 4K Write (MB/s) | 97.5 | 97 -1% | 157.5 62% | 88.6 -9% | 74.8 -23% |
| 4K-64 Read (MB/s) | 776 | 202.4 -74% | 1039 34% | 732 -6% | 973 25% |
| 4K-64 Write (MB/s) | 685 | 264.1 -61% | 1556 127% | 1199 75% | 218.8 -68% |
| Access Time Read * (ms) | 0.066 | 0.122 -85% | 0.05 24% | 0.055 17% | 0.125 -89% |
| Access Time Write * (ms) | 0.136 | 0.171 -26% | 0.065 52% | 0.037 73% | 0.552 -306% |
| Score Read (Points) | 953 | 278 -71% | 1292 36% | 1060 11% | 1157 21% |
| Score Write (Points) | 879 | 405 -54% | 1898 116% | 1506 71% | 370 -58% |
| Score Total (Points) | 2304 | 830 -64% | 3845 67% | 3087 34% | 2094 -9% |
| Copy ISO MB/s (MB/s) | 961 | 1441 50% | 1151 20% | 1151 20% | |
| Copy Program MB/s (MB/s) | 442.2 | 484.9 10% | 239.3 -46% | 499.4 13% | |
| Copy Game MB/s (MB/s) | 898 | 1098 22% | 635 -29% | 733 -18% | |
| CrystalDiskMark 5.2 / 6 | -9% | 85% | 99% | 42% | |
| Write 4K (MB/s) | 52.1 | 109.4 110% | 116.8 124% | 136.1 161% | 93.3 79% |
| Read 4K (MB/s) | 27.74 | 38.89 40% | 43.92 58% | 42.88 55% | 45.9 65% |
| Write Seq (MB/s) | 799 | 405.2 -49% | 1990 149% | 2335 192% | 1211 52% |
| Read Seq (MB/s) | 814 | 529 -35% | 1959 141% | 2183 168% | 1633 101% |
| Write 4K Q32T1 (MB/s) | 306.6 | 284.2 -7% | 373.3 22% | 261.2 -15% | 273.1 -11% |
| Read 4K Q32T1 (MB/s) | 373.2 | 337.8 -9% | 524 40% | 328.1 -12% | 356 -5% |
| Write Seq Q32T1 (MB/s) | 1042 | 436.5 -58% | 1985 90% | 2348 125% | 1198 15% |
| Read Seq Q32T1 (MB/s) | 1612 | 560 -65% | 2456 52% | 3564 121% | 2269 41% |
| Media totale (Programma / Settaggio) | -32% /
-35% | 70% /
65% | 66% /
57% | 4% /
-7% |
* ... Meglio usare valori piccoli

Throttling disco: DiskSpd Read Loop, Queue Depth 8
| 3DMark 11 Performance | 1548 punti | |
| 3DMark Cloud Gate Standard Score | 6769 punti | |
| 3DMark Fire Strike Score | 852 punti | |
| 3DMark Time Spy Score | 348 punti | |
Aiuto | ||
| Final Fantasy XV Benchmark - 1280x720 Lite Quality | |
| HP Pavilion 15-eg | |
| Asus VivoBook S15 D533UA | |
| HP Pavilion x360 15-er0155ng | |
| Honor MagicBook 15 4500U | |
| Media Intel Iris Plus Graphics 655 (9.11 - 18.1, n=8) | |
| Chuwi CoreBook X | |
| Teclast TBOLT F15 Pro | |
| Chuwi CoreBook X Pro | |
| basso | medio | alto | ultra | |
|---|---|---|---|---|
| Dota 2 Reborn (2015) | 51.4 | 37.1 | 15.8 | 13.4 |
| Final Fantasy XV Benchmark (2018) | 9.11 | |||
| X-Plane 11.11 (2018) | 13.8 | 9.75 | 8.55 |
| Chuwi CoreBook X Pro Iris Plus Graphics 655, i5-8259U, Kingston RBUSNS8154P3512GJ | Teclast TBOLT F15 Pro UHD Graphics G1 (Ice Lake 32 EU), i3-1005G1, Teclast BD256GB | Asus VivoBook S15 D533UA Vega 8, R7 5700U, WDC PC SN530 SDBPNPZ-1T00 | Honor MagicBook 15 Vega 8, R5 3500U, Samsung SSD PM981a MZVLB256HBHQ | Dell XPS 15 9500 Core i5 UHD Graphics 630, i5-10300H, Toshiba KBG40ZNS256G NVMe | |
|---|---|---|---|---|---|
| Noise | 9% | -18% | -18% | -10% | |
| off /ambiente * (dB) | 24.3 | 24.2 -0% | 26 -7% | 30.7 -26% | 28 -15% |
| Idle Minimum * (dB) | 24.3 | 24.2 -0% | 26 -7% | 30.7 -26% | 28 -15% |
| Idle Average * (dB) | 24.3 | 24.2 -0% | 26 -7% | 30.7 -26% | 28 -15% |
| Idle Maximum * (dB) | 24.3 | 24.2 -0% | 28.8 -19% | 30.7 -26% | 28 -15% |
| Load Average * (dB) | 27.9 | 24.2 13% | 45 -61% | 32.7 -17% | 28 -0% |
| Load Maximum * (dB) | 43 | 25.3 41% | 45 -5% | 38.4 11% | 41.9 3% |
* ... Meglio usare valori piccoli
Rumorosità
| Idle |
| 24.3 / 24.3 / 24.3 dB(A) |
| Sotto carico |
| 27.9 / 43 dB(A) |
 | ||
30 dB silenzioso 40 dB(A) udibile 50 dB(A) rumoroso |
||
min: | ||
(+) La temperatura massima sul lato superiore è di 35.6 °C / 96 F, rispetto alla media di 36.8 °C / 98 F, che varia da 21 a 71 °C per questa classe Multimedia.
(-) Il lato inferiore si riscalda fino ad un massimo di 49 °C / 120 F, rispetto alla media di 39.1 °C / 102 F
(+) In idle, la temperatura media del lato superiore è di 25.2 °C / 77 F, rispetto alla media deld ispositivo di 31.3 °C / 88 F.
(+) I poggiapolsi e il touchpad sono piu' freddi della temperatura della pelle con un massimo di 24.2 °C / 75.6 F e sono quindi freddi al tatto.
(+) La temperatura media della zona del palmo della mano di dispositivi simili e'stata di 28.7 °C / 83.7 F (+4.5 °C / 8.1 F).
Chuwi CoreBook X Pro analisi audio
(-) | altoparlanti non molto potenti (68.7 dB)
Bassi 100 - 315 Hz
(-) | quasi nessun basso - in media 29.7% inferiori alla media
(±) | la linearità dei bassi è media (8.8% delta rispetto alla precedente frequenza)
Medi 400 - 2000 Hz
(±) | medi ridotti - circa 9.3% inferiori alla media
(±) | linearità dei medi adeguata (13.6% delta rispetto alla precedente frequenza)
Alti 2 - 16 kHz
(+) | Alti bilanciati - appena 3.1% dalla media
(+) | alti lineari (4.1% delta rispetto alla precedente frequenza)
Nel complesso 100 - 16.000 Hz
(-) | suono nel complesso non lineare (33.8% di differenza rispetto alla media
Rispetto alla stessa classe
» 98% di tutti i dispositivi testati in questa classe è stato migliore, 0% simile, 2% peggiore
» Il migliore ha avuto un delta di 5%, medio di 17%, peggiore di 45%
Rispetto a tutti i dispositivi testati
» 93% di tutti i dispositivi testati in questa classe è stato migliore, 1% similare, 6% peggiore
» Il migliore ha avuto un delta di 4%, medio di 24%, peggiore di 134%
Apple MacBook 12 (Early 2016) 1.1 GHz analisi audio
(+) | gli altoparlanti sono relativamente potenti (83.6 dB)
Bassi 100 - 315 Hz
(±) | bassi ridotti - in media 11.3% inferiori alla media
(±) | la linearità dei bassi è media (14.2% delta rispetto alla precedente frequenza)
Medi 400 - 2000 Hz
(+) | medi bilanciati - solo only 2.4% rispetto alla media
(+) | medi lineari (5.5% delta rispetto alla precedente frequenza)
Alti 2 - 16 kHz
(+) | Alti bilanciati - appena 2% dalla media
(+) | alti lineari (4.5% delta rispetto alla precedente frequenza)
Nel complesso 100 - 16.000 Hz
(+) | suono nel complesso lineare (10.2% differenza dalla media)
Rispetto alla stessa classe
» 7% di tutti i dispositivi testati in questa classe è stato migliore, 2% simile, 91% peggiore
» Il migliore ha avuto un delta di 5%, medio di 18%, peggiore di 53%
Rispetto a tutti i dispositivi testati
» 5% di tutti i dispositivi testati in questa classe è stato migliore, 1% similare, 94% peggiore
» Il migliore ha avuto un delta di 4%, medio di 24%, peggiore di 134%
| Off / Standby | |
| Idle | |
| Sotto carico |
|
Leggenda:
min: | |
| Chuwi CoreBook X Pro i5-8259U, Iris Plus Graphics 655, Kingston RBUSNS8154P3512GJ, IPS, 1920x1080, 15.6" | Teclast TBOLT F15 Pro i3-1005G1, UHD Graphics G1 (Ice Lake 32 EU), Teclast BD256GB, IPS, 1920x1080, 15.6" | Asus VivoBook S15 D533UA R7 5700U, Vega 8, WDC PC SN530 SDBPNPZ-1T00, IPS, 1920x1080, 15.6" | Tuxedo Aura 15 Gen1 R7 4700U, Vega 7, Kingston SA2000M81000G, IPS, 1920x1080, 15.6" | Honor MagicBook 15 R5 3500U, Vega 8, Samsung SSD PM981a MZVLB256HBHQ, IPS, 1920x1080, 15.6" | Dell XPS 15 9500 Core i5 i5-10300H, UHD Graphics 630, Toshiba KBG40ZNS256G NVMe, IPS, 1920x1200, 15.6" | |
|---|---|---|---|---|---|---|
| Power Consumption | 35% | 19% | 19% | 32% | 17% | |
| Idle Minimum * (Watt) | 12.6 | 7.3 42% | 5 60% | 4.5 64% | 4.6 63% | 2.9 77% |
| Idle Average * (Watt) | 15 | 9.9 34% | 7.7 49% | 8.6 43% | 8.5 43% | 7.6 49% |
| Idle Maximum * (Watt) | 15.3 | 10.9 29% | 12.2 20% | 11.6 24% | 9.1 41% | 8 48% |
| Load Average * (Watt) | 34.2 | 22 36% | 41 -20% | 44 -29% | 38 -11% | 41.7 -22% |
| Load Maximum * (Watt) | 56.5 | 38 33% | 65 -15% | 59.7 -6% | 44 22% | 94.8 -68% |
| Witcher 3 ultra * (Watt) | 23.3 | 43 | 43.6 |
* ... Meglio usare valori piccoli
Consumo Energetico The Witcher 3 / Stresstest
| Chuwi CoreBook X Pro i5-8259U, Iris Plus Graphics 655, 70 Wh | Teclast TBOLT F15 Pro i3-1005G1, UHD Graphics G1 (Ice Lake 32 EU), 53.8 Wh | Asus VivoBook S15 D533UA R7 5700U, Vega 8, 50 Wh | Tuxedo Aura 15 Gen1 R7 4700U, Vega 7, 49 Wh | Honor MagicBook 15 R5 3500U, Vega 8, 42 Wh | Dell XPS 15 9500 Core i5 i5-10300H, UHD Graphics 630, 56 Wh | |
|---|---|---|---|---|---|---|
| Autonomia della batteria | -20% | 22% | 4% | -19% | 26% | |
| WiFi v1.3 (h) | 7.4 | 5.9 -20% | 9 22% | 7.7 4% | 6 -19% | 9.3 26% |
| Reader / Idle (h) | 26.4 | |||||
| Load (h) | 1.6 |
Pro
Contro
Valutazione complessiva - hanno fatto tagli in abbondanza
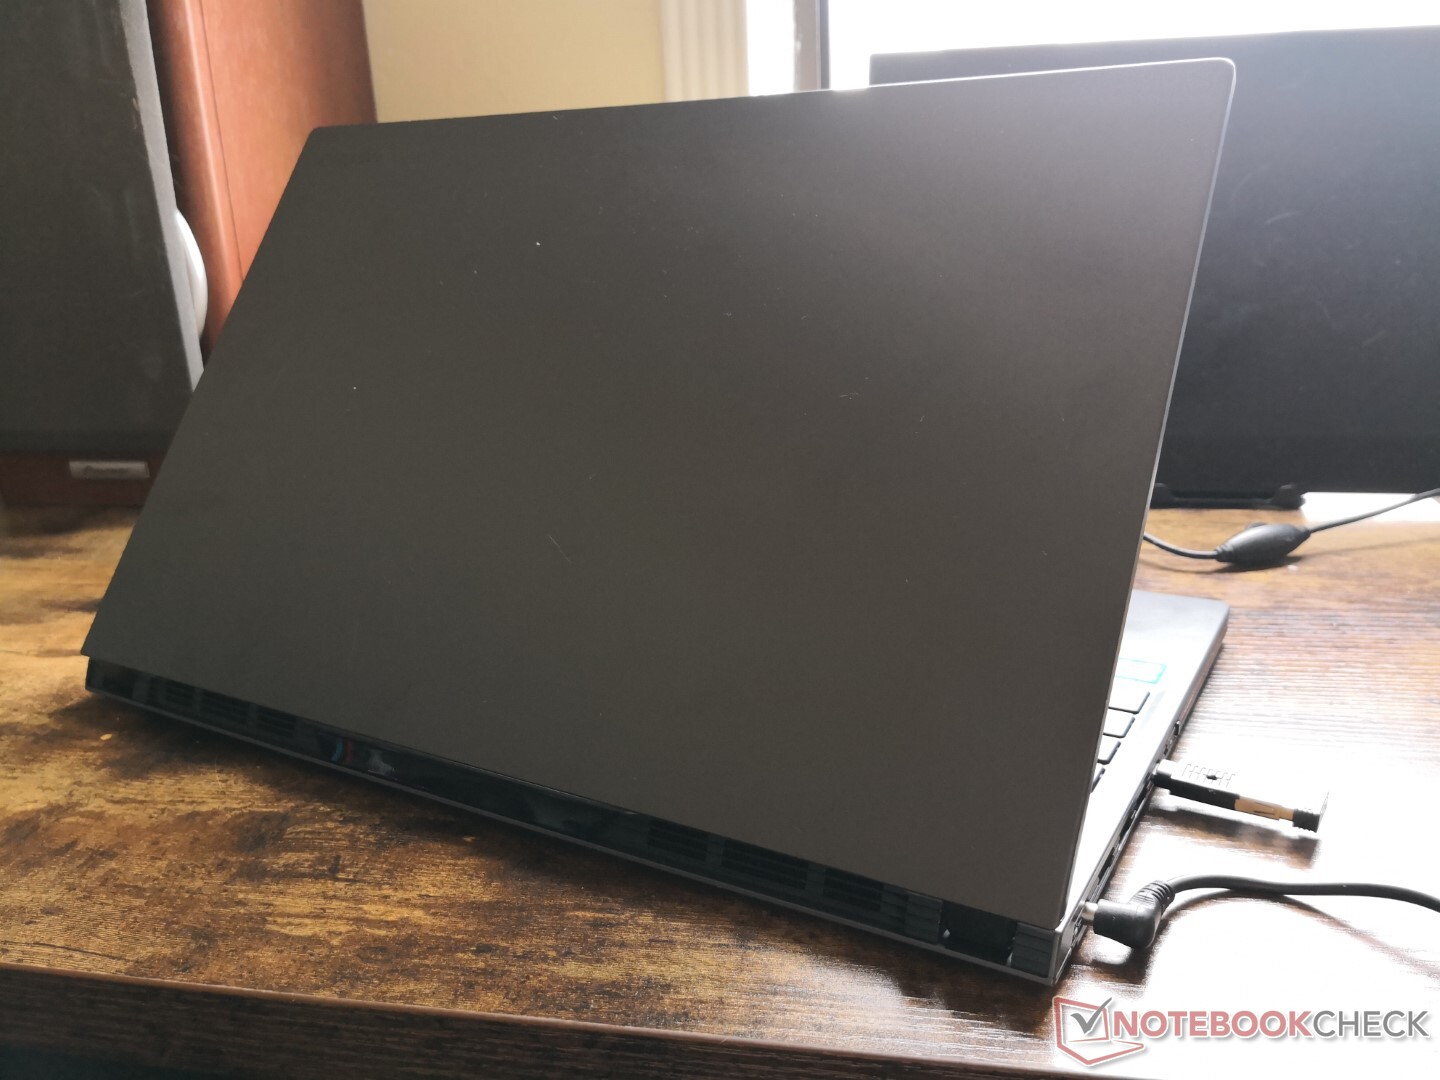
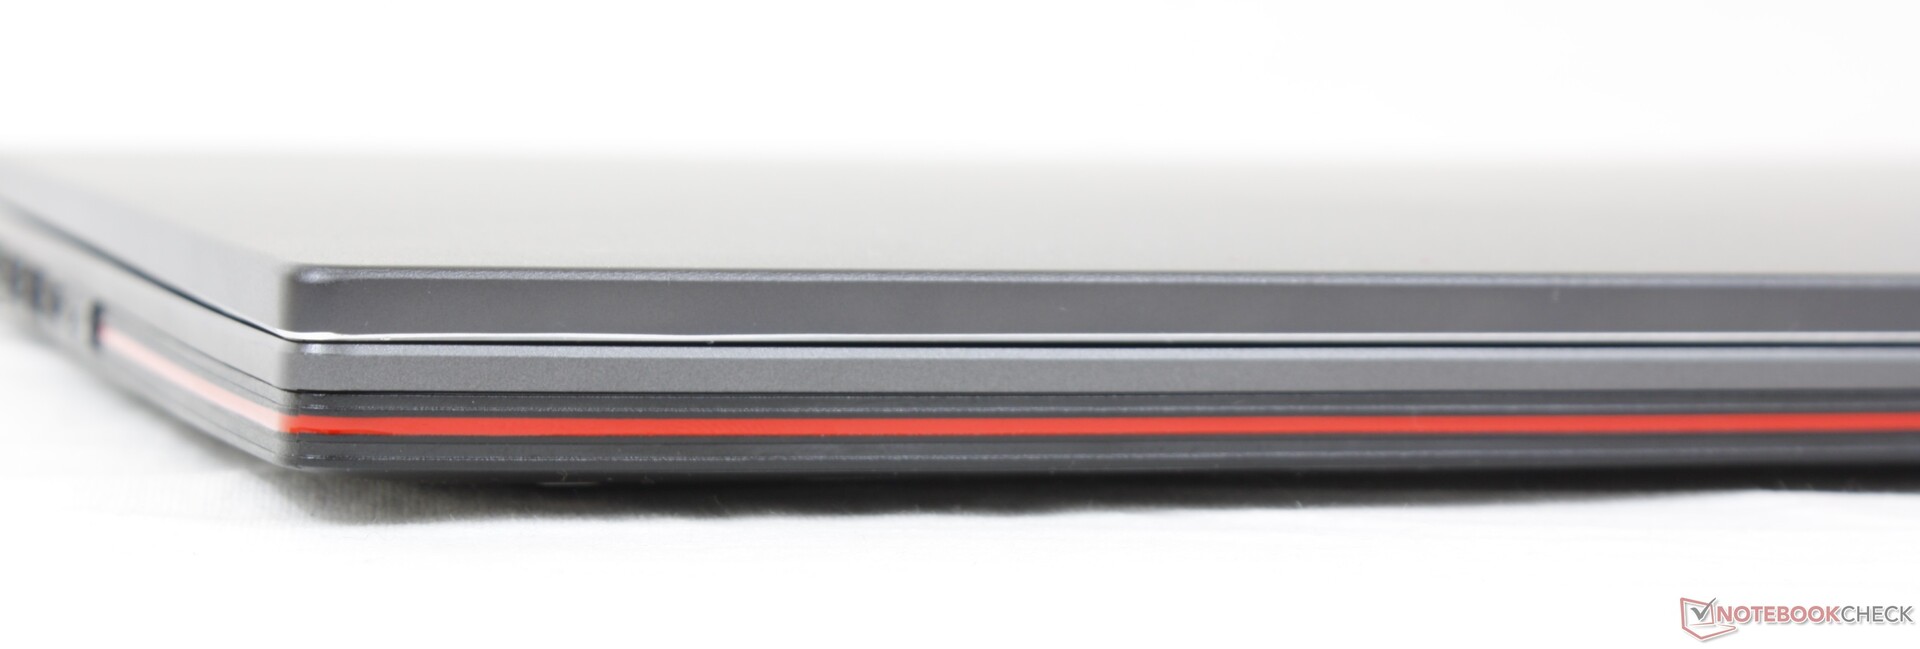
I portatili Chuwi hanno tutti punti di forza e debolezze simili. Dobbiamo lodare il CoreBook X Pro per il suo design attraente, il display ad alta frequenza di aggiornamento, e una CPU Core serie U adeguata in contrasto con l'eccessiva plastica, i display a 60 Hz, o le alternative Intel Atom o Celeron che sono troppo comuni in questa fascia di prezzo. La facile manutenibilità e la RAM e lo storage aggiornabili sono anche delle belle sorprese.
L'impressionante display a 120 Hz e l'attraente design estetico non significano quasi nulla se la tastiera, il clickpad, la qualità costruttiva e le cerniere potrebbero richiedere del lavoro.
Quasi tutto il resto del sistema lascia a desidere. Le cerniere deboli, il telaio traballante, il clickpad appiccicoso, gli altoparlanti molli, la webcam molto povera, e i tasti della tastiera che non rispondono ci danno l'impressione che il portatile non possa durare più di un paio d'anni. Se la longevità è una preoccupazione, allora vi consigliamo di optare per un vecchio Lenovo Yoga o Dell Inspiron con CPU Intel di 8a generazione dove le garanzie sono più facili da richiedere. L'ultima versione HP Pavilion 15 Core i3 pure è un'alternativa eccellente e più affidabile.
Chuwi CoreBook X Pro
- 09/15/2021 v7 (old)
Allen Ngo
Price comparison
