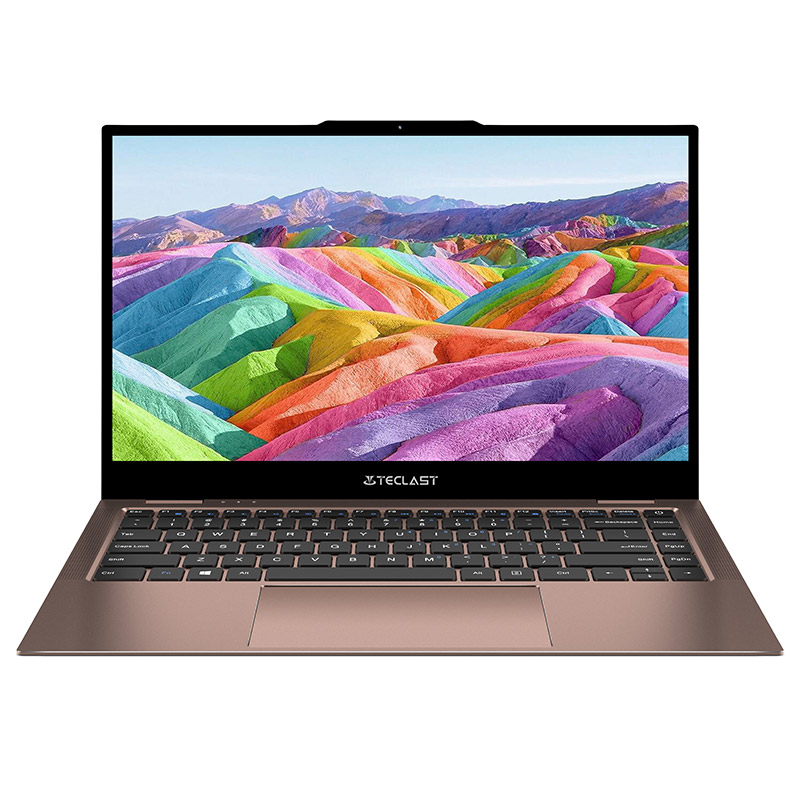
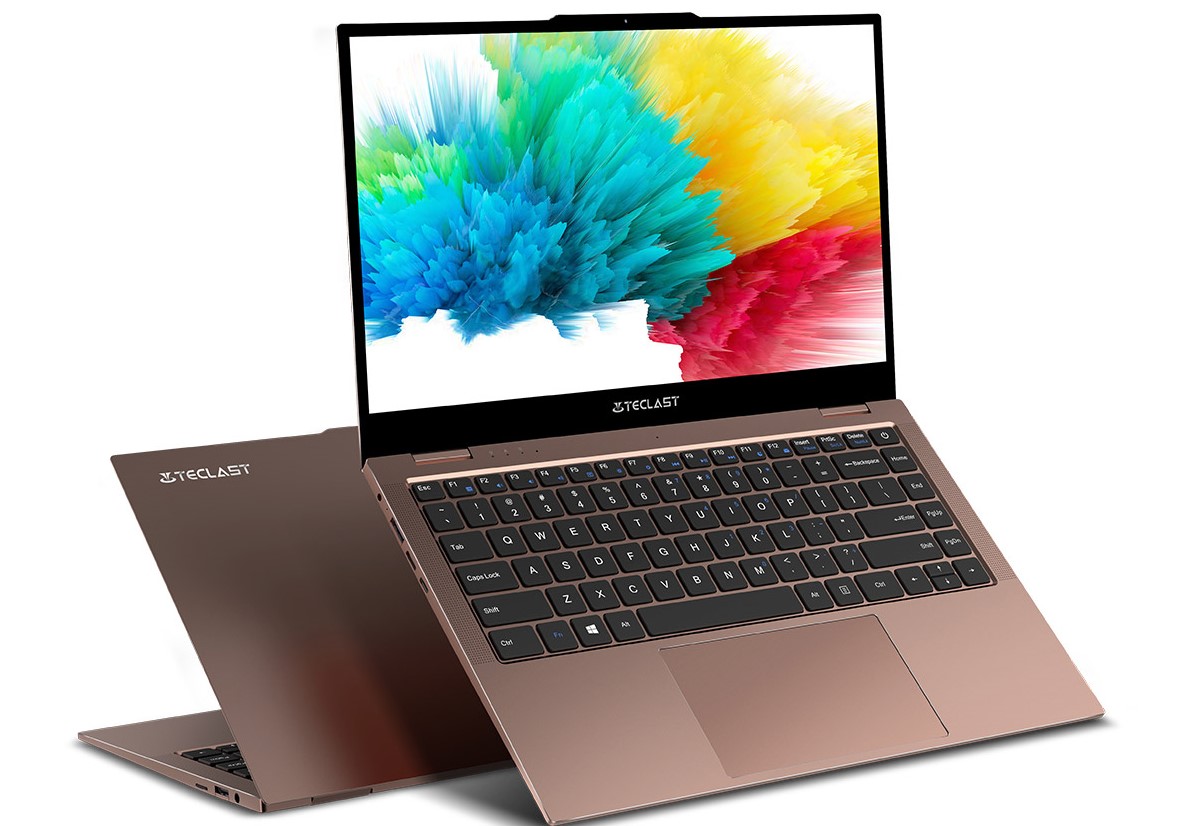
Recensione del portatile Teclast F7 Air
Confronto con i potenziali concorrenti
Punteggio | Data | Modello | Peso | Altezza | Dimensione | Risoluzione | Prezzo |
|---|---|---|---|---|---|---|---|
| 75.4 % v7 (old) | 02/2021 | Teclast F7 Air Celeron N4120, UHD Graphics 600 | 1.2 kg | 17 mm | 14.00" | 1920x1080 | |
| 76.9 % v7 (old) | 12/2020 | Chuwi LarkBook CWI509 Celeron N4120, UHD Graphics 600 | 1.1 kg | 12.3 mm | 13.30" | 1920x1080 | |
| 78.7 % v7 (old) | 08/2019 | Chuwi LapBook Pro Celeron N4100, UHD Graphics 600 | 1.4 kg | 13.4 mm | 14.00" | 1920x1080 | |
| 77.7 % v7 (old) | 06/2020 | Chuwi AeroBook Pro m3-8100Y, UHD Graphics 615 | 1.3 kg | 15.2 mm | 13.30" | 1920x1080 | |
| 72.5 % v7 (old) | 06/2019 | Acer Aspire 1 A114-32-P0K1 Pentium N5000, UHD Graphics 605 | 1.7 kg | 17.95 mm | 14.00" | 1920x1080 | |
| 85 % v7 (old) | 06/2020 | Acer Swift 3 SF314-42-R27B R3 4300U, Vega 5 | 1.2 kg | 16.55 mm | 14.00" | 1920x1080 | |
| 79.9 % v7 (old) | 08/2019 | Medion Akoya E4253-30025387 Pentium N5000, UHD Graphics 605 | 1.4 kg | 15 mm | 14.00" | 1920x1080 |
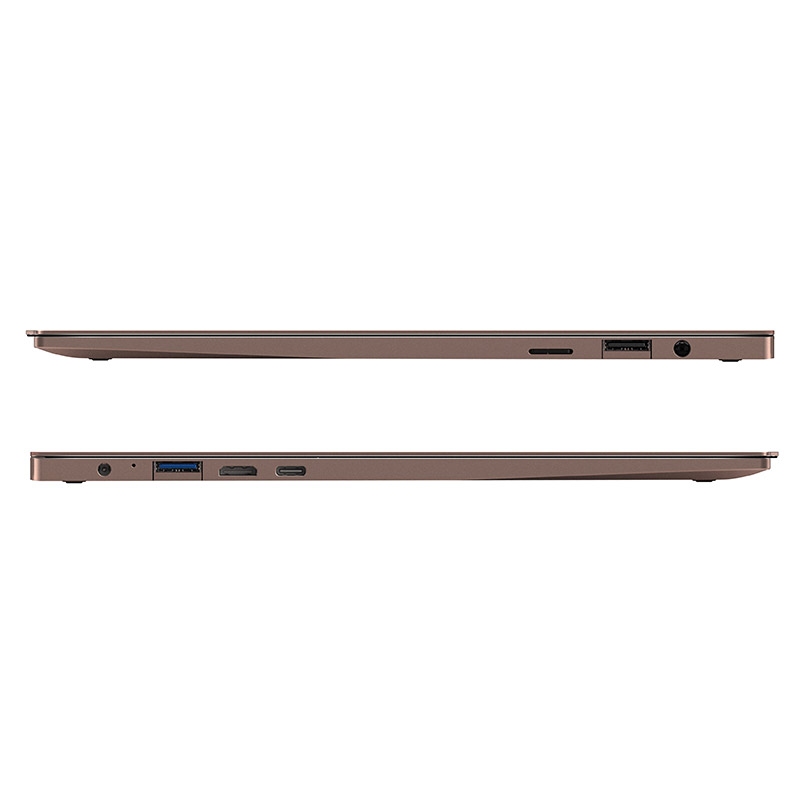
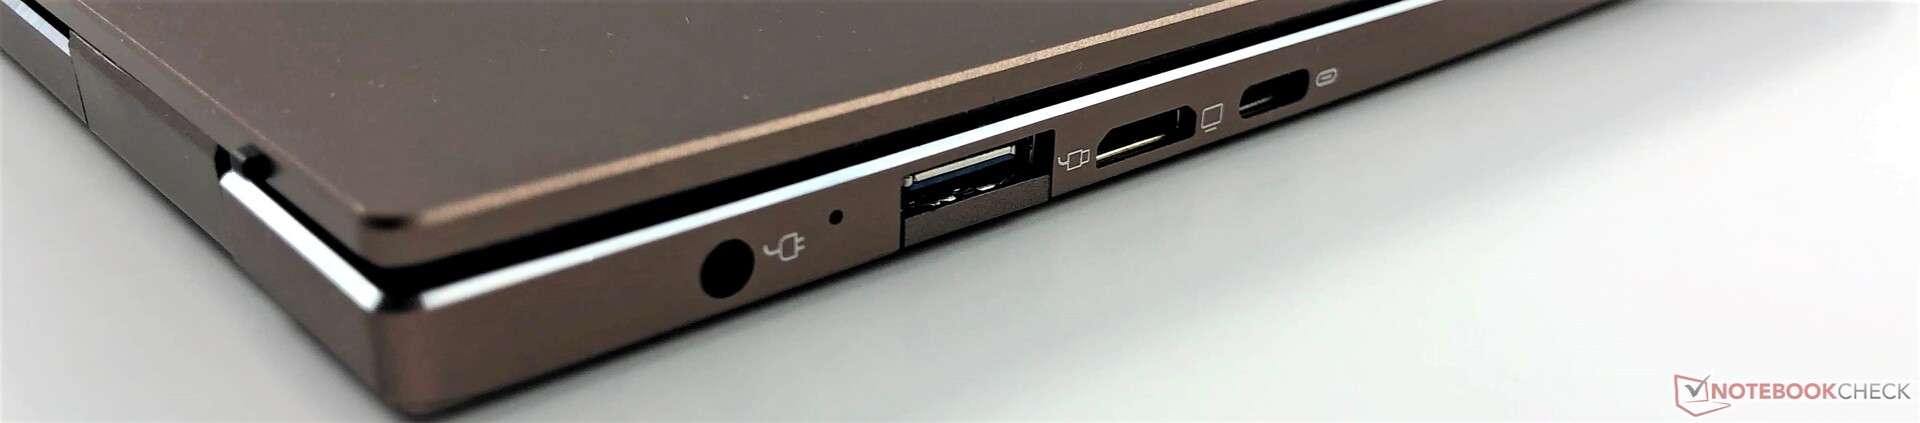
Connettività
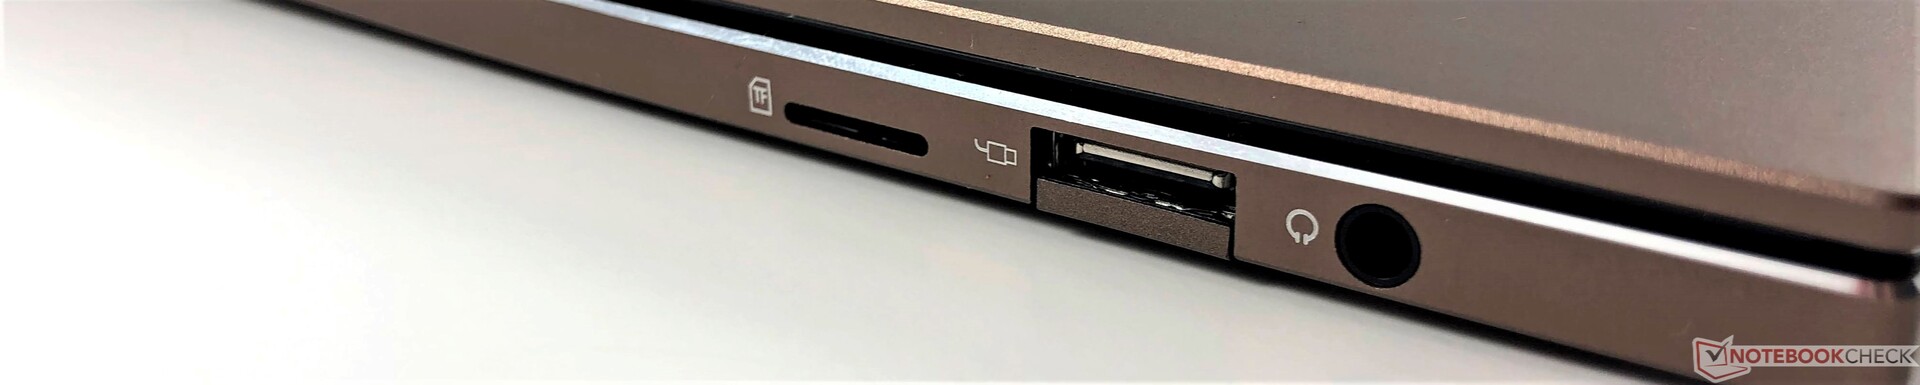
| SD Card Reader | |
| average JPG Copy Test (av. of 3 runs) | |
| Media della classe Subnotebook (23.7 - 188, n=9, ultimi 2 anni) | |
| Acer Aspire 1 A114-32-P0K1 (Toshiba Exceria Pro SDXC 64 GB UHS-II) | |
| Chuwi AeroBook Pro (Toshiba Exceria Pro M501 64 GB UHS-II) | |
| Teclast F7 Air (Toshiba Exceria Pro M501 UHS-II) | |
| Chuwi LarkBook CWI509 (Toshiba Exceria Pro M501 32 GB UHS-II) | |
| maximum AS SSD Seq Read Test (1GB) | |
| Media della classe Subnotebook (24.9 - 195, n=8, ultimi 2 anni) | |
| Acer Aspire 1 A114-32-P0K1 (Toshiba Exceria Pro SDXC 64 GB UHS-II) | |
| Medion Akoya E4253-30025387 (Toshiba Exceria Pro M501 microSDXC 64GB) | |
| Chuwi AeroBook Pro (Toshiba Exceria Pro M501 64 GB UHS-II) | |
| Teclast F7 Air (Toshiba Exceria Pro M501 UHS-II) | |
| Chuwi LarkBook CWI509 (Toshiba Exceria Pro M501 32 GB UHS-II) | |

| |||||||||||||||||||||||||
Distribuzione della luminosità: 78 %
Al centro con la batteria: 235.6 cd/m²
Contrasto: 512:1 (Nero: 0.46 cd/m²)
ΔE ColorChecker Calman: 9.43 | ∀{0.5-29.43 Ø4.71}
calibrated: 3.82
ΔE Greyscale Calman: 8.7 | ∀{0.09-98 Ø4.96}
69% sRGB (Argyll 1.6.3 3D)
44% AdobeRGB 1998 (Argyll 1.6.3 3D)
47.08% AdobeRGB 1998 (Argyll 3D)
68.7% sRGB (Argyll 3D)
45.57% Display P3 (Argyll 3D)
Gamma: 1.983
CCT: 8137 K
| Teclast F7 Air 1920x1080, 14" | Chuwi LarkBook CWI509 M133X56, , 1920x1080, 13.3" | Chuwi LapBook Pro BOE CQ HV140FHNM-N61, , 1920x1080, 14" | Chuwi AeroBook Pro BOE NV133FHM-N6A, , 1920x1080, 13.3" | Acer Aspire 1 A114-32-P0K1 Chi Mei N140HGE-EAA, , 1920x1080, 14" | Acer Swift 3 SF314-42-R27B AU Optronics B140HAN04.0, , 1920x1080, 14" | Medion Akoya E4253-30025387 Chi Mei N140HCA-EAB, , 1920x1080, 14" | |
|---|---|---|---|---|---|---|---|
| Display | 44% | 50% | 39% | -11% | -17% | -10% | |
| Display P3 Coverage (%) | 45.57 | 69.9 53% | 73 60% | 68.7 51% | 40.35 -11% | 37.78 -17% | 40.96 -10% |
| sRGB Coverage (%) | 68.7 | 92.7 35% | 96.1 40% | 88 28% | 60.3 -12% | 56.8 -17% | 61.1 -11% |
| AdobeRGB 1998 Coverage (%) | 47.08 | 67.8 44% | 70.3 49% | 64.4 37% | 41.71 -11% | 39.03 -17% | 42.37 -10% |
| Response Times | -10% | -16% | -5% | 11% | -15% | -15% | |
| Response Time Grey 50% / Grey 80% * (ms) | 32.4 ? | 32 ? 1% | 42 ? -30% | 31 ? 4% | 43 ? -33% | 42 ? -30% | 42 ? -30% |
| Response Time Black / White * (ms) | 28.4 ? | 34.4 ? -21% | 29 ? -2% | 32 ? -13% | 13 ? 54% | 28 ? 1% | 28 ? 1% |
| PWM Frequency (Hz) | 1000 ? | 1000 ? | 200 ? | 201.6 ? | 250 ? | 24500 ? | |
| Screen | 20% | 18% | 21% | -18% | 24% | 10% | |
| Brightness middle (cd/m²) | 235.6 | 235.3 0% | 297 26% | 242.3 3% | 208 -12% | 256 9% | 262 11% |
| Brightness (cd/m²) | 234 | 223 -5% | 268 15% | 233 0% | 192 -18% | 237 1% | 242 3% |
| Brightness Distribution (%) | 78 | 79 1% | 77 -1% | 88 13% | 85 9% | 81 4% | 87 12% |
| Black Level * (cd/m²) | 0.46 | 0.24 48% | 0.625 -36% | 0.31 33% | 0.41 11% | 0.17 63% | 0.505 -10% |
| Contrast (:1) | 512 | 980 91% | 475 -7% | 782 53% | 507 -1% | 1506 194% | 519 1% |
| Colorchecker dE 2000 * | 9.43 | 8.37 11% | 5.23 45% | 6.72 29% | 10.1 -7% | 5.43 42% | 5.49 42% |
| Colorchecker dE 2000 max. * | 13.5 | 15.79 -17% | 9.53 29% | 11.67 14% | 28.85 -114% | 19.73 -46% | 10.63 21% |
| Colorchecker dE 2000 calibrated * | 3.82 | 2.64 31% | 3.95 -3% | 4.38 -15% | 4.8 -26% | ||
| Greyscale dE 2000 * | 8.7 | 9.8 -13% | 6.72 23% | 6 31% | 10.96 -26% | 3.29 62% | 4.84 44% |
| Gamma | 1.983 111% | 2.16 102% | 2.38 92% | 2.18 101% | 2.24 98% | 2.52 87% | 2.3 96% |
| CCT | 8137 80% | 7557 86% | 7015 93% | 7159 91% | 11669 56% | 6840 95% | 6347 102% |
| Color Space (Percent of AdobeRGB 1998) (%) | 44 | 60.1 37% | 63 43% | 57.5 31% | 38 -14% | 36 -18% | 39 -11% |
| Color Space (Percent of sRGB) (%) | 69 | 92.4 34% | 96 39% | 87.7 27% | 59 -14% | 57 -17% | 61 -12% |
| Media totale (Programma / Settaggio) | 18% /
21% | 17% /
20% | 18% /
21% | -6% /
-13% | -3% /
12% | -5% /
3% |
* ... Meglio usare valori piccoli
Tempi di risposta del Display
| ↔ Tempi di risposta dal Nero al Bianco | ||
|---|---|---|
| 28.4 ms ... aumenta ↗ e diminuisce ↘ combinato | ↗ 16 ms Incremento | 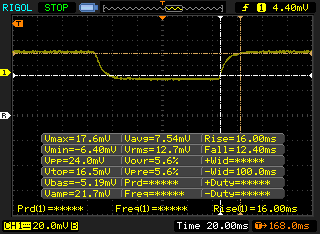 |
| ↘ 12.4 ms Calo | ||
| Lo schermo mostra tempi di risposta relativamente lenti nei nostri tests e potrebbe essere troppo lento per i gamers. In confronto, tutti i dispositivi di test variano da 0.1 (minimo) a 240 (massimo) ms. » 75 % di tutti i dispositivi è migliore. Questo significa che i tempi di risposta rilevati sono peggiori rispetto alla media di tutti i dispositivi testati (19.8 ms). | ||
| ↔ Tempo di risposta dal 50% Grigio all'80% Grigio | ||
| 32.4 ms ... aumenta ↗ e diminuisce ↘ combinato | ↗ 14.8 ms Incremento | 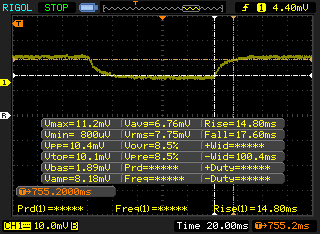 |
| ↘ 17.6 ms Calo | ||
| Lo schermo mostra tempi di risposta lenti nei nostri tests e sarà insoddisfacente per i gamers. In confronto, tutti i dispositivi di test variano da 0.165 (minimo) a 636 (massimo) ms. » 44 % di tutti i dispositivi è migliore. Questo significa che i tempi di risposta rilevati sono simili alla media di tutti i dispositivi testati (31 ms). | ||
Sfarfallio dello schermo / PWM (Pulse-Width Modulation)
| flickering dello schermo / PWM rilevato | 1000 Hz | ≤ 99 % settaggio luminosita' | 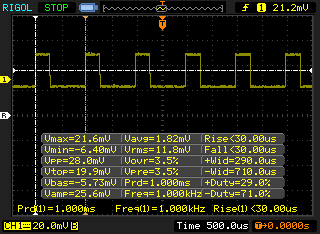 |
Il display sfarfalla a 1000 Hz (Probabilmente a causa dell'uso di PWM) Flickering rilevato ad una luminosita' di 99 % o inferiore. Non dovrebbe verificarsi flickering o PWM sopra questo valore di luminosita'. La frequenza di 1000 Hz è abbastanza alta, quindi la maggioranza degli utenti sensibili al PWM non dovrebbero notare alcun flickering. In confronto: 52 % di tutti i dispositivi testati non utilizza PWM per ridurre la luminosita' del display. Se è rilevato PWM, una media di 7757 (minimo: 5 - massimo: 343500) Hz è stata rilevata. | |||
Cinebench R15: CPU Single 64Bit | CPU Multi 64Bit
Blender: v2.79 BMW27 CPU
7-Zip 18.03: 7z b 4 -mmt1 | 7z b 4
Geekbench 5.5: Single-Core | Multi-Core
HWBOT x265 Benchmark v2.2: 4k Preset
LibreOffice : 20 Documents To PDF
R Benchmark 2.5: Overall mean
| Cinebench R20 / CPU (Single Core) | |
| Media della classe Subnotebook (128 - 832, n=57, ultimi 2 anni) | |
| Dell Inspiron 15 5000 5502 | |
| Acer Swift 3 SF314-42-R27B | |
| Dell Latitude 15 3510 NK2MC | |
| Asus Vivobook 15 F512DA-SH31 | |
| Chuwi AeroBook Pro | |
| Medion Akoya E4253-30025387 | |
| Acer Aspire 1 A114-32-P0K1 | |
| Teclast F7 Air | |
| Media Intel Celeron N4120 (159 - 166, n=3) | |
| Chuwi LapBook Pro | |
| Cinebench R20 / CPU (Multi Core) | |
| Media della classe Subnotebook (579 - 8541, n=57, ultimi 2 anni) | |
| Acer Swift 3 SF314-42-R27B | |
| Dell Inspiron 15 5000 5502 | |
| Dell Latitude 15 3510 NK2MC | |
| Asus Vivobook 15 F512DA-SH31 | |
| Chuwi LapBook Pro | |
| Teclast F7 Air | |
| Medion Akoya E4253-30025387 | |
| Media Intel Celeron N4120 (376 - 516, n=3) | |
| Acer Aspire 1 A114-32-P0K1 | |
| Chuwi AeroBook Pro | |
| Cinebench R15 / CPU Single 64Bit | |
| Media della classe Subnotebook (72.4 - 322, n=57, ultimi 2 anni) | |
| Dell Inspiron 15 5000 5502 | |
| Acer Swift 3 SF314-42-R27B | |
| Dell Latitude 15 3510 NK2MC | |
| Asus Vivobook 15 F512DA-SH31 | |
| Chuwi AeroBook Pro | |
| Acer Aspire 1 A114-32-P0K1 | |
| Medion Akoya E4253-30025387 | |
| Media Intel Celeron N4120 (73 - 74.5, n=3) | |
| Teclast F7 Air | |
| Chuwi LapBook Pro | |
| Cinebench R15 / CPU Multi 64Bit | |
| Media della classe Subnotebook (327 - 3345, n=57, ultimi 2 anni) | |
| Acer Swift 3 SF314-42-R27B | |
| Dell Inspiron 15 5000 5502 | |
| Asus Vivobook 15 F512DA-SH31 | |
| Dell Latitude 15 3510 NK2MC | |
| Chuwi LapBook Pro | |
| Medion Akoya E4253-30025387 | |
| Media Intel Celeron N4120 (223 - 234, n=3) | |
| Teclast F7 Air | |
| Acer Aspire 1 A114-32-P0K1 | |
| Chuwi AeroBook Pro | |
| Blender / v2.79 BMW27 CPU | |
| Media Intel Celeron N4120 (2558 - 2583, n=2) | |
| Teclast F7 Air | |
| Chuwi AeroBook Pro | |
| Chuwi LapBook Pro | |
| Asus Vivobook 15 F512DA-SH31 | |
| Dell Inspiron 15 5000 5502 | |
| Dell Latitude 15 3510 NK2MC | |
| Acer Swift 3 SF314-42-R27B | |
| Media della classe Subnotebook (159 - 2271, n=58, ultimi 2 anni) | |
| 7-Zip 18.03 / 7z b 4 -mmt1 | |
| Media della classe Subnotebook (2643 - 6699, n=59, ultimi 2 anni) | |
| Dell Inspiron 15 5000 5502 | |
| Dell Latitude 15 3510 NK2MC | |
| Acer Swift 3 SF314-42-R27B | |
| Asus Vivobook 15 F512DA-SH31 | |
| Chuwi AeroBook Pro | |
| Media Intel Celeron N4120 (2145 - 2412, n=3) | |
| Chuwi LapBook Pro | |
| Teclast F7 Air | |
| 7-Zip 18.03 / 7z b 4 | |
| Media della classe Subnotebook (11668 - 77867, n=57, ultimi 2 anni) | |
| Acer Swift 3 SF314-42-R27B | |
| Dell Inspiron 15 5000 5502 | |
| Dell Latitude 15 3510 NK2MC | |
| Asus Vivobook 15 F512DA-SH31 | |
| Chuwi LapBook Pro | |
| Media Intel Celeron N4120 (5832 - 7436, n=3) | |
| Teclast F7 Air | |
| Chuwi AeroBook Pro | |
| Geekbench 5.5 / Single-Core | |
| Media della classe Subnotebook (726 - 2224, n=48, ultimi 2 anni) | |
| Dell Inspiron 15 5000 5502 | |
| Acer Swift 3 SF314-42-R27B | |
| Dell Latitude 15 3510 NK2MC | |
| Asus Vivobook 15 F512DA-SH31 | |
| Chuwi AeroBook Pro | |
| Media Intel Celeron N4120 (438 - 449, n=3) | |
| Teclast F7 Air | |
| Geekbench 5.5 / Multi-Core | |
| Media della classe Subnotebook (2557 - 17218, n=48, ultimi 2 anni) | |
| Acer Swift 3 SF314-42-R27B | |
| Dell Inspiron 15 5000 5502 | |
| Dell Latitude 15 3510 NK2MC | |
| Asus Vivobook 15 F512DA-SH31 | |
| Media Intel Celeron N4120 (1505 - 1561, n=3) | |
| Teclast F7 Air | |
| Chuwi AeroBook Pro | |
| HWBOT x265 Benchmark v2.2 / 4k Preset | |
| Media della classe Subnotebook (0.97 - 25.1, n=57, ultimi 2 anni) | |
| Acer Swift 3 SF314-42-R27B | |
| Dell Inspiron 15 5000 5502 | |
| Dell Latitude 15 3510 NK2MC | |
| Asus Vivobook 15 F512DA-SH31 | |
| Chuwi LapBook Pro | |
| Chuwi AeroBook Pro | |
| Teclast F7 Air | |
| Media Intel Celeron N4120 (1.02 - 1.38, n=3) | |
| LibreOffice / 20 Documents To PDF | |
| Media Intel Celeron N4120 (131 - 157, n=3) | |
| Teclast F7 Air | |
| Chuwi AeroBook Pro | |
| Asus Vivobook 15 F512DA-SH31 | |
| Dell Inspiron 15 5000 5502 | |
| Acer Swift 3 SF314-42-R27B | |
| Media della classe Subnotebook (39.9 - 220, n=56, ultimi 2 anni) | |
| Dell Latitude 15 3510 NK2MC | |
| R Benchmark 2.5 / Overall mean | |
| Teclast F7 Air | |
| Media Intel Celeron N4120 (1.642 - 1.649, n=3) | |
| Chuwi AeroBook Pro | |
| Asus Vivobook 15 F512DA-SH31 | |
| Dell Latitude 15 3510 NK2MC | |
| Acer Swift 3 SF314-42-R27B | |
| Dell Inspiron 15 5000 5502 | |
| Media della classe Subnotebook (0.4024 - 1.456, n=58, ultimi 2 anni) | |
* ... Meglio usare valori piccoli
| PCMark 10 Score | 1801 punti | |
Aiuto | ||
| DPC Latencies / LatencyMon - interrupt to process latency (max), Web, Youtube, Prime95 | |
| Teclast F7 Air | |
* ... Meglio usare valori piccoli
| Teclast F7 Air faspeed K7N8-256G | Chuwi LarkBook CWI509 Kingston RBUSNS8180DS3256GJ | Chuwi AeroBook Pro Netac SSD 256GB | Acer Aspire 1 A114-32-P0K1 64 GB eMMC Flash | Acer Swift 3 SF314-42-R27B SK hynix BC511 HFM256GDJTNI-82A0 | |
|---|---|---|---|---|---|
| CrystalDiskMark 5.2 / 6 | 4% | 44% | -70% | 159% | |
| Write 4K (MB/s) | 75 | 63.9 -15% | 113.1 51% | 24.08 -68% | 96.3 28% |
| Read 4K (MB/s) | 27.31 | 34.38 26% | 30.21 11% | 11.48 -58% | 35.06 28% |
| Write Seq (MB/s) | 373.9 | 439.8 | 149.7 | 1001 | |
| Read Seq (MB/s) | 411.7 | 536 | 271.2 | 1072 | |
| Write 4K Q32T1 (MB/s) | 120.1 | 124.1 3% | 279.1 132% | 23.87 -80% | 423.9 253% |
| Read 4K Q32T1 (MB/s) | 135.2 | 139.5 3% | 227.3 68% | 30.76 -77% | 464.7 244% |
| Write Seq Q32T1 (MB/s) | 469.2 | 500 7% | 469.7 0% | 137.2 -71% | 967 106% |
| Read Seq Q32T1 (MB/s) | 555 | 537 -3% | 555 0% | 205.1 -63% | 2179 293% |
| Write 4K Q8T8 (MB/s) | 264.6 | ||||
| Read 4K Q8T8 (MB/s) | 135.6 | ||||
| AS SSD | 109% | 26% | 180% | ||
| Seq Read (MB/s) | 430.2 | 425.6 -1% | 445.4 4% | 1682 291% | |
| Seq Write (MB/s) | 412.3 | 417.1 1% | 418.9 2% | 931 126% | |
| 4K Read (MB/s) | 13.21 | 28.45 115% | 22.81 73% | 41.53 214% | |
| 4K Write (MB/s) | 50.1 | 48.14 -4% | 83.3 66% | 109.1 118% | |
| 4K-64 Read (MB/s) | 122.9 | 928 655% | 180.6 47% | 603 391% | |
| 4K-64 Write (MB/s) | 215.6 | 328.5 52% | 281.5 31% | 713 231% | |
| Access Time Read * (ms) | 0.151 | 0.175 -16% | 0.113 25% | ||
| Access Time Write * (ms) | 0.17 | 0.189 -11% | 0.161 5% | 0.035 79% | |
| Score Read (Points) | 179 | 999 458% | 248 39% | 813 354% | |
| Score Write (Points) | 307 | 418 36% | 408 33% | 915 198% | |
| Score Total (Points) | 581 | 1931 232% | 789 36% | 2118 265% | |
| Copy ISO MB/s (MB/s) | 440.8 | 473.6 7% | 410.8 -7% | 692 57% | |
| Copy Program MB/s (MB/s) | 193.4 | 198.6 3% | 204.4 6% | 226.5 17% | |
| Copy Game MB/s (MB/s) | 396.8 | 415.3 5% | 435.5 10% | 391.5 -1% | |
| Media totale (Programma / Settaggio) | 57% /
78% | 35% /
32% | -70% /
-70% | 170% /
173% |
* ... Meglio usare valori piccoli

| 3DMark Cloud Gate Standard Score | 3361 punti | |
| 3DMark Fire Strike Score | 434 punti | |
| 3DMark Time Spy Score | 133 punti | |
Aiuto | ||
| basso | medio | alto | ultra | |
|---|---|---|---|---|
| BioShock Infinite (2013) | 28 | |||
| Dota 2 Reborn (2015) | 38.5 | 17.2 | 8.2 | 7.4 |
| Final Fantasy XV Benchmark (2018) | 4.8 | |||
| X-Plane 11.11 (2018) | 8.57 | 5.64 | 4.91 |
(±) La temperatura massima sul lato superiore è di 41.2 °C / 106 F, rispetto alla media di 35.9 °C / 97 F, che varia da 21.4 a 59 °C per questa classe Subnotebook.
(±) Il lato inferiore si riscalda fino ad un massimo di 43.8 °C / 111 F, rispetto alla media di 39.2 °C / 103 F
(+) In idle, la temperatura media del lato superiore è di 29.7 °C / 85 F, rispetto alla media deld ispositivo di 30.8 °C / 87 F.
(+) I poggiapolsi e il touchpad sono piu' freddi della temperatura della pelle con un massimo di 30.6 °C / 87.1 F e sono quindi freddi al tatto.
(-) La temperatura media della zona del palmo della mano di dispositivi simili e'stata di 28.2 °C / 82.8 F (-2.4 °C / -4.3 F).
Teclast F7 Air analisi audio
(+) | gli altoparlanti sono relativamente potenti (88.4 dB)
Bassi 100 - 315 Hz
(-) | quasi nessun basso - in media 20.6% inferiori alla media
(+) | bassi in lineaa (6.6% delta rispetto alla precedente frequenza)
Medi 400 - 2000 Hz
(±) | medi elevati - circa 6.3% superiore alla media
(+) | medi lineari (6.4% delta rispetto alla precedente frequenza)
Alti 2 - 16 kHz
(+) | Alti bilanciati - appena 2.8% dalla media
(+) | alti lineari (4.4% delta rispetto alla precedente frequenza)
Nel complesso 100 - 16.000 Hz
(±) | la linearità complessiva del suono è media (15.5% di differenza rispetto alla media
Rispetto alla stessa classe
» 35% di tutti i dispositivi testati in questa classe è stato migliore, 6% simile, 59% peggiore
» Il migliore ha avuto un delta di 5%, medio di 18%, peggiore di 53%
Rispetto a tutti i dispositivi testati
» 23% di tutti i dispositivi testati in questa classe è stato migliore, 4% similare, 73% peggiore
» Il migliore ha avuto un delta di 4%, medio di 23%, peggiore di 134%
Chuwi AeroBook Pro analisi audio
(+) | gli altoparlanti sono relativamente potenti (82.8 dB)
Bassi 100 - 315 Hz
(-) | quasi nessun basso - in media 24.7% inferiori alla media
(+) | bassi in lineaa (4.8% delta rispetto alla precedente frequenza)
Medi 400 - 2000 Hz
(±) | medi ridotti - circa 7.2% inferiori alla media
(±) | linearità dei medi adeguata (10.8% delta rispetto alla precedente frequenza)
Alti 2 - 16 kHz
(±) | alti elevati - circa 9.4% superiori alla media
(±) | la linearità degli alti è media (12% delta rispetto alla precedente frequenza)
Nel complesso 100 - 16.000 Hz
(-) | suono nel complesso non lineare (37.3% di differenza rispetto alla media
Rispetto alla stessa classe
» 97% di tutti i dispositivi testati in questa classe è stato migliore, 1% simile, 1% peggiore
» Il migliore ha avuto un delta di 5%, medio di 18%, peggiore di 53%
Rispetto a tutti i dispositivi testati
» 94% di tutti i dispositivi testati in questa classe è stato migliore, 1% similare, 5% peggiore
» Il migliore ha avuto un delta di 4%, medio di 23%, peggiore di 134%
| Off / Standby | |
| Idle | |
| Sotto carico |
|
Leggenda:
min: | |
Pro
Contro
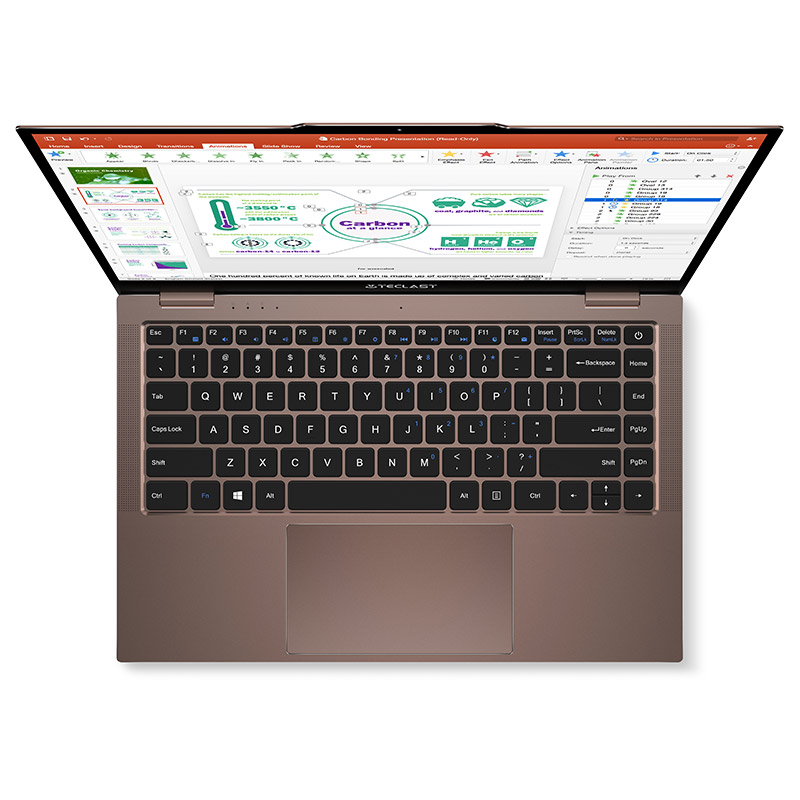
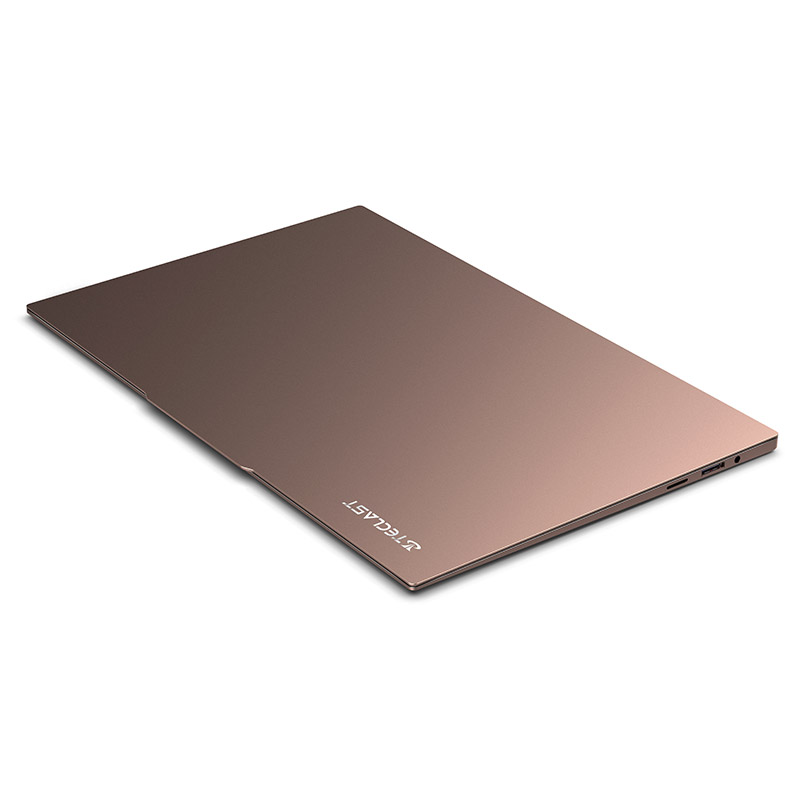
Il Teclast F7 Air è un ottimo esempio di forma che prevare sulla funzionalità. Il portatile è ben progettato e sembra stupefacente, specialmente considerando il suo prezzo (399,99 dollari). La maggior parte dei portatili in questa fascia di prezzo sembrano economici pezzi di plastica, ma l'F7 Air sembra più simile al MacBook da 12 pollici.
Tuttavia, la sua bellezza è solo in superficie. L'Intel Celeron N4120 a bassa potenza è troppo debole e troppo lento per qualcosa di diverso dal semplice lavoro d'ufficio, e-mail, e qualche leggera navigazione web. La macchina può gestire alcuni media streaming, compresi i video 4K, ma questo richiede pazienza ed è lontano dalla perfezione.
Aggiungete a questo una scarsa durata della batteria, una tastiera poco curata e un display poco brillante (prima della calibrazione), e i compromessi diventano lampanti. Ci sono alcune cose buone qui, principalmente l'estetica e la qualità costruttiva. Tuttavia, ci sono troppi altri difetti per noi per raccomandare il portatile.
In definitiva, il Teclast F7 Air subisce lo stesso destino di altri portatili economici a bassa potenza. Non è abbastanza potente per tutti i compiti tranne quelli più semplici. Se volete un bel portatile e non vi interessa o non avete bisogno di un hardware potente, il Teclast F7 Air può essere un buon valore per voi. Tuttavia, una macchina semplice e dal prezzo simile con una CPU Intel Core i3 o AMD Ryzen 3 farà sparire l'F7 Air dai vostri pensieri.
Teclast F7 Air
- 02/07/2021 v7 (old)
Sam Medley
Price comparison
