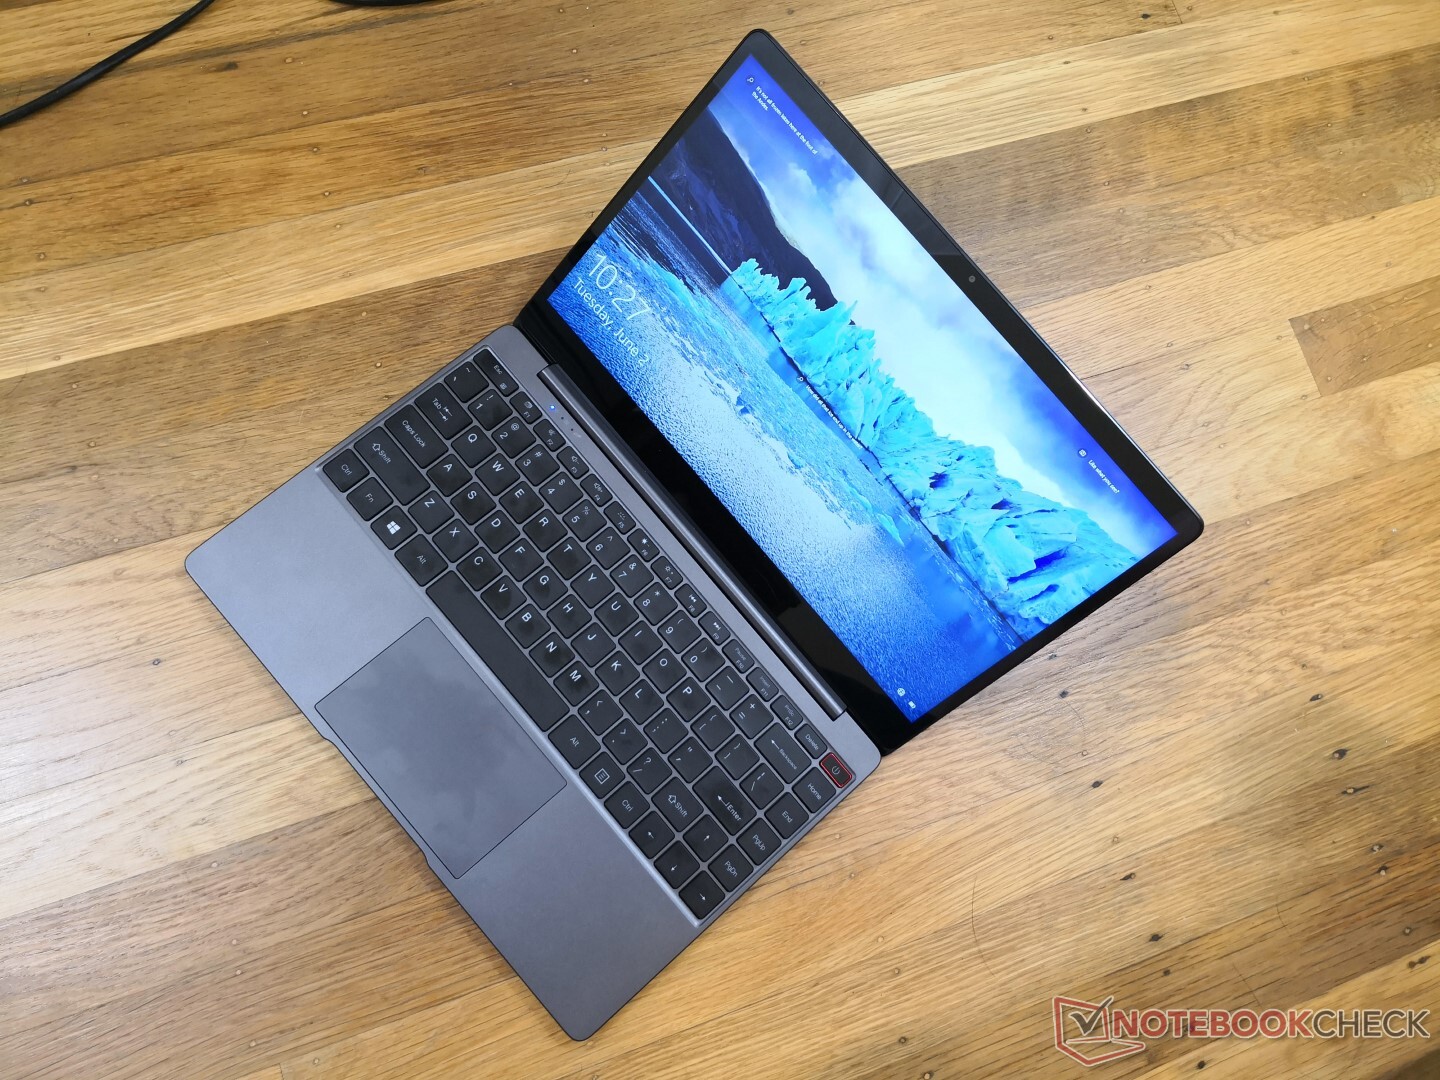
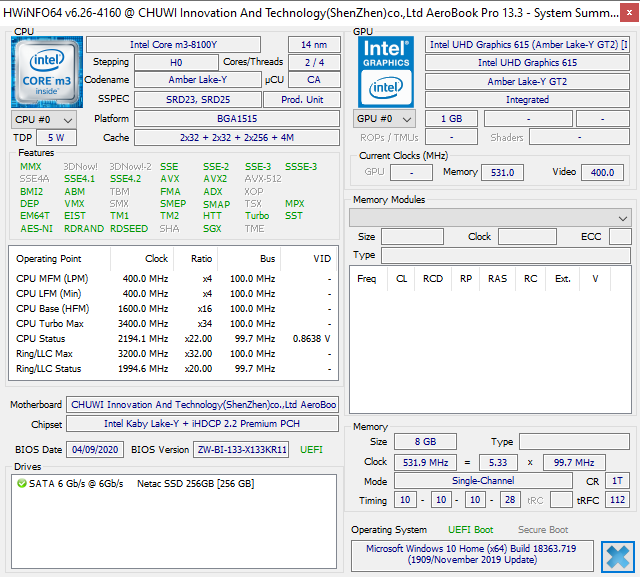
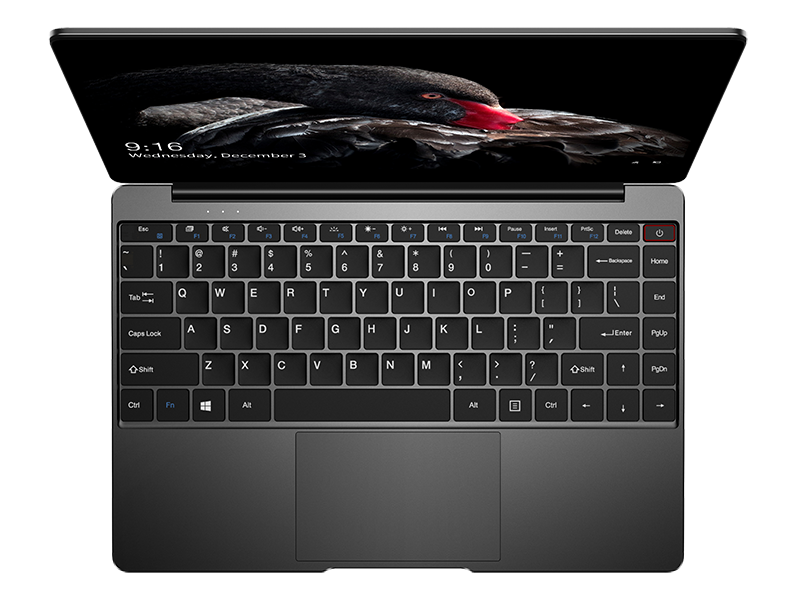
Recensione del Laptop Chuwi AeroBook Pro: il Core m3 mostra la sua età
Punteggio | Data | Modello | Peso | Altezza | Dimensione | Risoluzione | Prezzo |
|---|---|---|---|---|---|---|---|
| 77.7 % v7 (old) | 06/2020 | Chuwi AeroBook Pro m3-8100Y, UHD Graphics 615 | 1.3 kg | 15.2 mm | 13.30" | 1920x1080 | |
| 88 % v7 (old) | 04/2020 | Apple MacBook Air 2020 i5 i5-1030NG7, Iris Plus Graphics G7 (Ice Lake 64 EU) | 1.3 kg | 16.1 mm | 13.30" | 2560x1600 | |
| 88.8 % v7 (old) | 03/2020 | Dell XPS 13 9300 i5 FHD i5-1035G1, UHD Graphics G1 (Ice Lake 32 EU) | 1.2 kg | 14.8 mm | 13.40" | 1920x1200 | |
| 84.6 % v6 (old) | 01/2018 | Lenovo Yoga 720-12IKB i5-7200U, HD Graphics 620 | 1.2 kg | 15.8 mm | 12.50" | 1920x1080 | |
| 67.7 % v7 (old) | 04/2020 | Jumper EZbook X3 Celeron N3350, HD Graphics 500 | 1.3 kg | 18 mm | 13.30" | 1920x1080 | |
| 86.6 % v6 (old) | 03/2019 | Lenovo Ideapad S530-13IWL i5-8265U, UHD Graphics 620 | 1.2 kg | 14.8 mm | 13.30" | 1920x1080 |
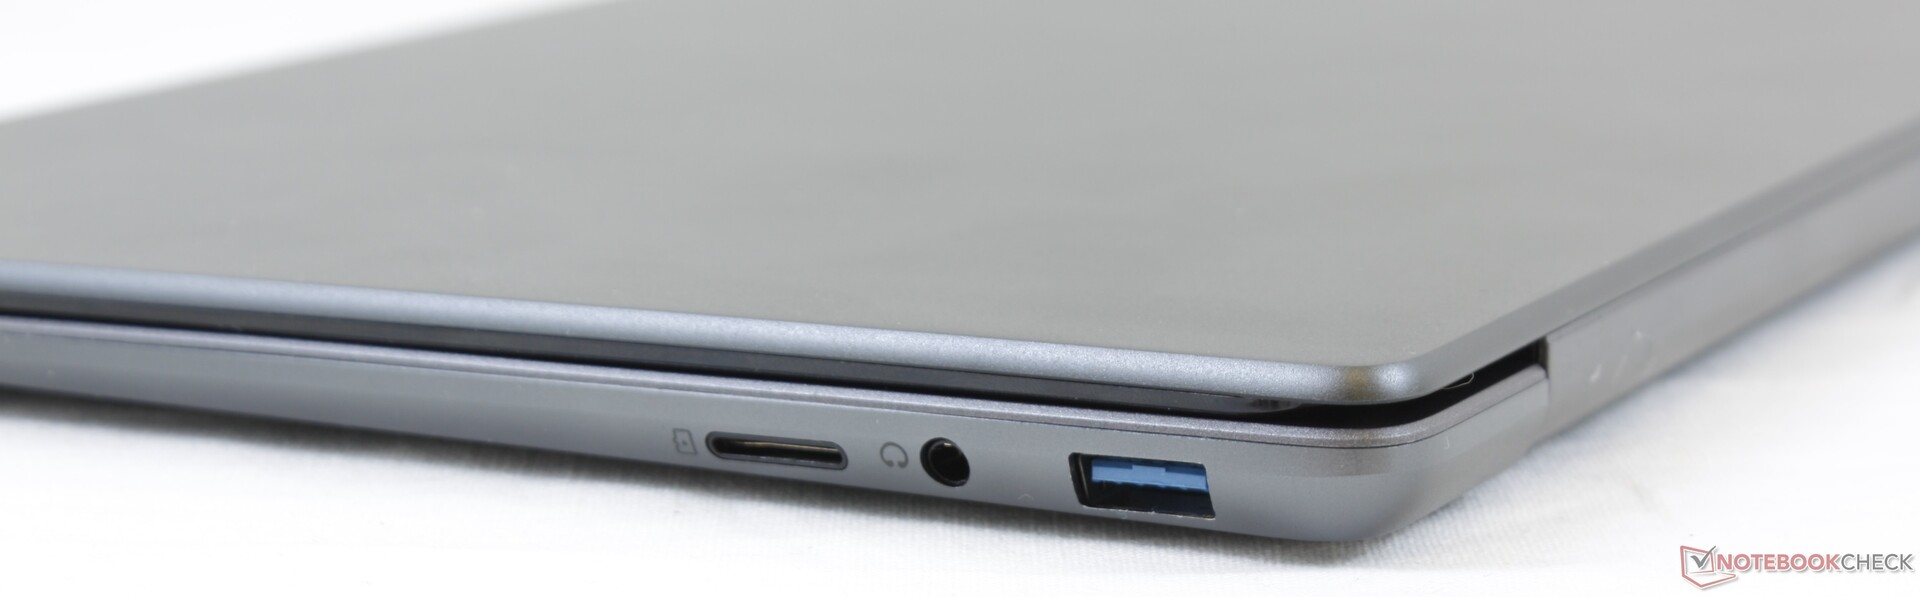
| SD Card Reader | |
| average JPG Copy Test (av. of 3 runs) | |
| Dell XPS 13 9300 i5 FHD (Toshiba Exceria Pro M501 64 GB UHS-II) | |
| Chuwi AeroBook Pro (Toshiba Exceria Pro M501 64 GB UHS-II) | |
| Jumper EZbook X3 | |
| maximum AS SSD Seq Read Test (1GB) | |
| Dell XPS 13 9300 i5 FHD (Toshiba Exceria Pro M501 64 GB UHS-II) | |
| Chuwi AeroBook Pro (Toshiba Exceria Pro M501 64 GB UHS-II) | |
| Jumper EZbook X3 | |
| Networking | |
| iperf3 transmit AX12 | |
| Dell XPS 13 9300 i5 FHD | |
| Apple MacBook Air 2020 i5 | |
| Jumper EZbook X3 | |
| Chuwi AeroBook Pro | |
| iperf3 receive AX12 | |
| Dell XPS 13 9300 i5 FHD | |
| Apple MacBook Air 2020 i5 | |
| Chuwi AeroBook Pro | |
| Jumper EZbook X3 | |


| |||||||||||||||||||||||||
Distribuzione della luminosità: 88 %
Al centro con la batteria: 242.3 cd/m²
Contrasto: 782:1 (Nero: 0.31 cd/m²)
ΔE ColorChecker Calman: 6.72 | ∀{0.5-29.43 Ø4.72}
calibrated: 3.95
ΔE Greyscale Calman: 6 | ∀{0.09-98 Ø4.97}
87.7% sRGB (Argyll 1.6.3 3D)
57.5% AdobeRGB 1998 (Argyll 1.6.3 3D)
64.4% AdobeRGB 1998 (Argyll 3D)
88% sRGB (Argyll 3D)
68.7% Display P3 (Argyll 3D)
Gamma: 2.18
CCT: 7159 K
| Chuwi AeroBook Pro BOE NV133FHM-N6A, IPS, 13.3", 1920x1080 | Apple MacBook Air 2020 i5 APPA042, IPS, 13.3", 2560x1600 | Dell XPS 13 9300 i5 FHD SHP14CB, IPS, 13.4", 1920x1200 | Jumper EZbook X3 PBTB133F006 A, IPS, 13.3", 1920x1080 | Lenovo Ideapad S530-13IWL BOE07D7, IPS, 13.3", 1920x1080 | |
|---|---|---|---|---|---|
| Display | 8% | 10% | -5% | 1% | |
| Display P3 Coverage (%) | 68.7 | 70.4 2% | 71.5 4% | 60.4 -12% | 68.6 0% |
| sRGB Coverage (%) | 88 | 97.7 11% | 99.4 13% | 88.7 1% | 89.7 2% |
| AdobeRGB 1998 Coverage (%) | 64.4 | 71.7 11% | 73.5 14% | 61.7 -4% | 65.6 2% |
| Response Times | -10% | -49% | -7% | -13% | |
| Response Time Grey 50% / Grey 80% * (ms) | 31 ? | 38.7 ? -25% | 60 ? -94% | 34 ? -10% | 41 ? -32% |
| Response Time Black / White * (ms) | 32 ? | 30.44 ? 5% | 33.2 ? -4% | 33 ? -3% | 30 ? 6% |
| PWM Frequency (Hz) | 201.6 ? | 117000 ? | 2500 ? | 192 ? | |
| Screen | 47% | 57% | -1% | 18% | |
| Brightness middle (cd/m²) | 242.3 | 430 77% | 619 155% | 209 -14% | 306 26% |
| Brightness (cd/m²) | 233 | 405 74% | 591 154% | 203 -13% | 287 23% |
| Brightness Distribution (%) | 88 | 89 1% | 91 3% | 95 8% | 78 -11% |
| Black Level * (cd/m²) | 0.31 | 0.32 -3% | 0.35 -13% | 0.2 35% | 0.21 32% |
| Contrast (:1) | 782 | 1344 72% | 1769 126% | 1045 34% | 1457 86% |
| Colorchecker dE 2000 * | 6.72 | 1.8 73% | 3 55% | 8.43 -25% | 5.96 11% |
| Colorchecker dE 2000 max. * | 11.67 | 4.6 61% | 8.2 30% | 14.77 -27% | 11.34 3% |
| Colorchecker dE 2000 calibrated * | 3.95 | 1.6 59% | 1 75% | 1.68 57% | 2.69 32% |
| Greyscale dE 2000 * | 6 | 1.1 82% | 5.2 13% | 9.81 -64% | 6.9 -15% |
| Gamma | 2.18 101% | 2.14 103% | 2.46 89% | 2.35 94% | |
| CCT | 7159 91% | 6644 98% | 6340 103% | 10135 64% | 7554 86% |
| Color Space (Percent of AdobeRGB 1998) (%) | 57.5 | 64.2 12% | 66.9 16% | 57 -1% | 59 3% |
| Color Space (Percent of sRGB) (%) | 87.7 | 97.6 11% | 99.3 13% | 89 1% | 90 3% |
| Media totale (Programma / Settaggio) | 15% /
33% | 6% /
35% | -4% /
-2% | 2% /
11% |
* ... Meglio usare valori piccoli
Tempi di risposta del Display
| ↔ Tempi di risposta dal Nero al Bianco | ||
|---|---|---|
| 32 ms ... aumenta ↗ e diminuisce ↘ combinato | ↗ 16 ms Incremento | 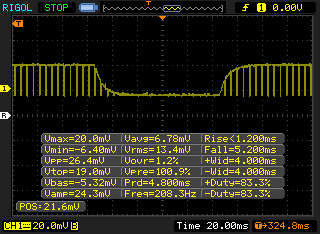 |
| ↘ 16 ms Calo | ||
| Lo schermo mostra tempi di risposta lenti nei nostri tests e sarà insoddisfacente per i gamers. In confronto, tutti i dispositivi di test variano da 0.1 (minimo) a 240 (massimo) ms. » 86 % di tutti i dispositivi è migliore. Questo significa che i tempi di risposta rilevati sono peggiori rispetto alla media di tutti i dispositivi testati (19.8 ms). | ||
| ↔ Tempo di risposta dal 50% Grigio all'80% Grigio | ||
| 31 ms ... aumenta ↗ e diminuisce ↘ combinato | ↗ 16 ms Incremento | 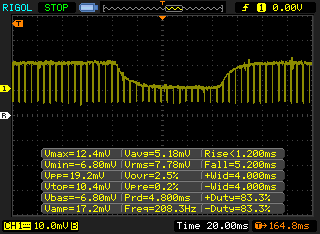 |
| ↘ 15 ms Calo | ||
| Lo schermo mostra tempi di risposta lenti nei nostri tests e sarà insoddisfacente per i gamers. In confronto, tutti i dispositivi di test variano da 0.165 (minimo) a 636 (massimo) ms. » 42 % di tutti i dispositivi è migliore. Questo significa che i tempi di risposta rilevati sono simili alla media di tutti i dispositivi testati (31 ms). | ||
Sfarfallio dello schermo / PWM (Pulse-Width Modulation)
| flickering dello schermo / PWM rilevato | 201.6 Hz | ≤ 100 % settaggio luminosita' | 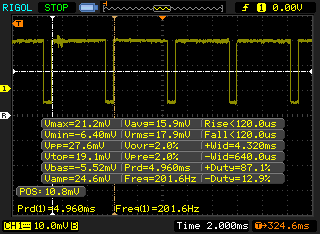 |
Il display sfarfalla a 201.6 Hz (Probabilmente a causa dell'uso di PWM) Flickering rilevato ad una luminosita' di 100 % o inferiore. Non dovrebbe verificarsi flickering o PWM sopra questo valore di luminosita'. La frequenza di 201.6 Hz è relativamente bassa, quindi gli utenti sensibili potrebbero notare il flickering ed accusare stanchezza agli occhi a questo livello di luminosità e a livelli inferiori. In confronto: 52 % di tutti i dispositivi testati non utilizza PWM per ridurre la luminosita' del display. Se è rilevato PWM, una media di 7750 (minimo: 5 - massimo: 343500) Hz è stata rilevata. | |||
Cinebench R20: CPU (Multi Core) | CPU (Single Core)
Blender: v2.79 BMW27 CPU
7-Zip 18.03: 7z b 4 -mmt1 | 7z b 4
Geekbench 5.5: Single-Core | Multi-Core
HWBOT x265 Benchmark v2.2: 4k Preset
LibreOffice : 20 Documents To PDF
R Benchmark 2.5: Overall mean
| Cinebench R15 / CPU Multi 64Bit | |
| Dynabook Portege X30L-G1331 | |
| Dell Latitude 3400 | |
| Apple MacBook Air 2020 i3 | |
| HP Pavilion x360 14-cd0002ng | |
| Lenovo Thinkpad 13-20J1001BUS | |
| HP EliteBook Folio G1 V1C37EA | |
| Eve-Tech Eve V m3 | |
| Medion Akoya P3401T 2in1 | |
| Chuwi AeroBook 13 inch 2019 | |
| Media Intel Core m3-8100Y (157 - 247, n=4) | |
| Chuwi UBook CWI509 | |
| Chuwi AeroBook Pro | |
| Jumper EZbook X3 | |
| Cinebench R15 / CPU Single 64Bit | |
| Dynabook Portege X30L-G1331 | |
| Dell Latitude 3400 | |
| Apple MacBook Air 2020 i3 | |
| HP Pavilion x360 14-cd0002ng | |
| HP EliteBook Folio G1 V1C37EA | |
| Eve-Tech Eve V m3 | |
| Medion Akoya P3401T 2in1 | |
| Media Intel Core m3-8100Y (91 - 121, n=4) | |
| Chuwi AeroBook Pro | |
| Lenovo Thinkpad 13-20J1001BUS | |
| Chuwi UBook CWI509 | |
| Chuwi AeroBook 13 inch 2019 | |
| Jumper EZbook X3 | |
| Cinebench R20 / CPU (Multi Core) | |
| Dynabook Portege X30L-G1331 | |
| Dell Latitude 3400 | |
| Apple MacBook Air 2020 i3 | |
| Media Intel Core m3-8100Y (382 - 527, n=3) | |
| Chuwi UBook CWI509 | |
| Chuwi AeroBook Pro | |
| Jumper EZbook X3 | |
| Cinebench R20 / CPU (Single Core) | |
| Dynabook Portege X30L-G1331 | |
| Apple MacBook Air 2020 i3 | |
| Dell Latitude 3400 | |
| Media Intel Core m3-8100Y (232 - 298, n=3) | |
| Chuwi AeroBook Pro | |
| Chuwi UBook CWI509 | |
| Jumper EZbook X3 | |
| Blender / v2.79 BMW27 CPU | |
| Jumper EZbook X3 | |
| Chuwi AeroBook Pro | |
| Media Intel Core m3-8100Y (1893 - 2519, n=2) | |
| Apple MacBook Air 2020 i3 | |
| Eve-Tech Eve V m3 | |
| Dynabook Portege X30L-G1331 | |
| 7-Zip 18.03 / 7z b 4 -mmt1 | |
| Dynabook Portege X30L-G1331 | |
| Apple MacBook Air 2020 i3 | |
| Media Intel Core m3-8100Y (2683 - 3282, n=2) | |
| Chuwi AeroBook Pro | |
| Jumper EZbook X3 | |
| 7-Zip 18.03 / 7z b 4 | |
| Dynabook Portege X30L-G1331 | |
| Apple MacBook Air 2020 i3 | |
| Media Intel Core m3-8100Y (4937 - 7554, n=2) | |
| Chuwi AeroBook Pro | |
| Jumper EZbook X3 | |
| Geekbench 5.5 / Single-Core | |
| Apple MacBook Air 2020 i3 | |
| Dynabook Portege X30L-G1331 | |
| Media Intel Core m3-8100Y (809 - 882, n=2) | |
| Chuwi AeroBook Pro | |
| Jumper EZbook X3 | |
| Geekbench 5.5 / Multi-Core | |
| Dynabook Portege X30L-G1331 | |
| Apple MacBook Air 2020 i3 | |
| Media Intel Core m3-8100Y (1178 - 1615, n=2) | |
| Chuwi AeroBook Pro | |
| Jumper EZbook X3 | |
| HWBOT x265 Benchmark v2.2 / 4k Preset | |
| Dynabook Portege X30L-G1331 | |
| Apple MacBook Air 2020 i3 | |
| Media Intel Core m3-8100Y (1.42 - 1.96, n=2) | |
| Chuwi AeroBook Pro | |
| Jumper EZbook X3 | |
| LibreOffice / 20 Documents To PDF | |
| Jumper EZbook X3 | |
| Chuwi AeroBook Pro | |
| Media Intel Core m3-8100Y (85.4 - 128, n=2) | |
| Apple MacBook Air 2020 i3 | |
| Dynabook Portege X30L-G1331 | |
| R Benchmark 2.5 / Overall mean | |
| Jumper EZbook X3 | |
| Chuwi AeroBook Pro | |
| Media Intel Core m3-8100Y (0.942 - 1.204, n=2) | |
| Apple MacBook Air 2020 i3 | |
| Dynabook Portege X30L-G1331 | |
Cinebench R20: CPU (Multi Core) | CPU (Single Core)
Blender: v2.79 BMW27 CPU
7-Zip 18.03: 7z b 4 -mmt1 | 7z b 4
Geekbench 5.5: Single-Core | Multi-Core
HWBOT x265 Benchmark v2.2: 4k Preset
LibreOffice : 20 Documents To PDF
R Benchmark 2.5: Overall mean
* ... Meglio usare valori piccoli
| PCMark 8 Home Score Accelerated v2 | 2280 punti | |
| PCMark 8 Work Score Accelerated v2 | 3805 punti | |
| PCMark 10 Score | 2447 punti | |
Aiuto | ||
| DPC Latencies / LatencyMon - interrupt to process latency (max), Web, Youtube, Prime95 | |
| Chuwi AeroBook Pro | |
| Apple MacBook Air 2020 i5 | |
| Dell XPS 13 9300 i5 FHD | |
* ... Meglio usare valori piccoli
| Chuwi AeroBook Pro Netac SSD 256GB | Apple MacBook Air 2020 i5 Apple SSD AP0512 | Dell XPS 13 9300 i5 FHD Toshiba XG6 KXG60ZNV512G | Lenovo Yoga 720-12IKB Liteonit CV3-8D128 | Jumper EZbook X3 64 GB eMMC Flash | Lenovo Ideapad S530-13IWL Lenovo UMIS AM610 RPFTJ256PDD2MWX | |
|---|---|---|---|---|---|---|
| AS SSD | 73% | 229% | -11% | -93% | 132% | |
| Seq Read (MB/s) | 445.4 | 1153 159% | 2328 423% | 361.6 -19% | 246.2 -45% | 1377 209% |
| Seq Write (MB/s) | 418.9 | 1367 226% | 1137 171% | 240.8 -43% | 155.8 -63% | 805 92% |
| 4K Read (MB/s) | 22.81 | 12.95 -43% | 48.07 111% | 23.81 4% | 18.41 -19% | 45.01 97% |
| 4K Write (MB/s) | 83.3 | 24.52 -71% | 120.6 45% | 61.8 -26% | 22 -74% | 88.9 7% |
| 4K-64 Read (MB/s) | 180.6 | 665 268% | 899 398% | 232.6 29% | 22.45 -88% | 767 325% |
| 4K-64 Write (MB/s) | 281.5 | 159.5 -43% | 1220 333% | 89.3 -68% | 22.73 -92% | 611 117% |
| Access Time Read * (ms) | 0.113 | 0.295 -161% | 0.085 25% | 0.109 4% | 0.246 -118% | 0.141 -25% |
| Access Time Write * (ms) | 0.161 | 0.163 -1% | 0.033 80% | 0.067 58% | 0.621 -286% | 0.043 73% |
| Score Read (Points) | 248 | 793 220% | 1180 376% | 296 19% | 65 -74% | 950 283% |
| Score Write (Points) | 408 | 321 -21% | 1455 257% | 175 -57% | 60 -85% | 781 91% |
| Score Total (Points) | 789 | 1528 94% | 3189 304% | 620 -21% | 163 -79% | 2200 179% |
| Copy ISO MB/s (MB/s) | 410.8 | 1433 249% | ||||
| Copy Program MB/s (MB/s) | 204.4 | 363 78% | ||||
| Copy Game MB/s (MB/s) | 435.5 | 725 66% | ||||
| CrystalDiskMark 5.2 / 6 | 207% | -77% | 55% | |||
| Write 4K (MB/s) | 113.1 | 121.9 8% | 19.21 -83% | 101.5 -10% | ||
| Read 4K (MB/s) | 30.21 | 50 66% | 7.435 -75% | 44.47 47% | ||
| Write Seq (MB/s) | 439.8 | 1497 240% | 138.8 -68% | 603 37% | ||
| Read Seq (MB/s) | 536 | 2111 294% | 219.8 -59% | 686 28% | ||
| Write 4K Q32T1 (MB/s) | 279.1 | 365.9 31% | 24.39 -91% | 298.1 7% | ||
| Read 4K Q32T1 (MB/s) | 227.3 | 384.6 69% | 22.2 -90% | 358.7 58% | ||
| Write Seq Q32T1 (MB/s) | 469.7 | 2748 485% | 122.3 -74% | 872 86% | ||
| Read Seq Q32T1 (MB/s) | 555 | 3119 462% | 147.6 -73% | 1611 190% | ||
| Media totale (Programma / Settaggio) | 73% /
73% | 218% /
220% | -11% /
-11% | -85% /
-86% | 94% /
100% |
* ... Meglio usare valori piccoli

Disk Throttling: DiskSpd Read Loop, Queue Depth 8
| 3DMark 11 Performance | 1021 punti | |
| 3DMark Cloud Gate Standard Score | 3689 punti | |
| 3DMark Fire Strike Score | 588 punti | |
| 3DMark Time Spy Score | 232 punti | |
Aiuto | ||
| basso | medio | alto | ultra | |
|---|---|---|---|---|
| Dota 2 Reborn (2015) | 40.8 | 17.7 | 8.5 | 7.6 |
| X-Plane 11.11 (2018) | 10 | 7.2 |
(±) La temperatura massima sul lato superiore è di 44.2 °C / 112 F, rispetto alla media di 35.9 °C / 97 F, che varia da 21.4 a 59 °C per questa classe Subnotebook.
(-) Il lato inferiore si riscalda fino ad un massimo di 49 °C / 120 F, rispetto alla media di 39.2 °C / 103 F
(+) In idle, la temperatura media del lato superiore è di 27.2 °C / 81 F, rispetto alla media deld ispositivo di 30.8 °C / 87 F.
(±) I poggiapolsi e il touchpad possono diventare molto caldi al tatto con un massimo di 37.4 °C / 99.3 F.
(-) La temperatura media della zona del palmo della mano di dispositivi simili e'stata di 28.2 °C / 82.8 F (-9.2 °C / -16.5 F).
Chuwi AeroBook Pro analisi audio
(+) | gli altoparlanti sono relativamente potenti (82.8 dB)
Bassi 100 - 315 Hz
(-) | quasi nessun basso - in media 24.7% inferiori alla media
(+) | bassi in lineaa (4.8% delta rispetto alla precedente frequenza)
Medi 400 - 2000 Hz
(±) | medi ridotti - circa 7.2% inferiori alla media
(±) | linearità dei medi adeguata (10.8% delta rispetto alla precedente frequenza)
Alti 2 - 16 kHz
(±) | alti elevati - circa 9.4% superiori alla media
(±) | la linearità degli alti è media (12% delta rispetto alla precedente frequenza)
Nel complesso 100 - 16.000 Hz
(-) | suono nel complesso non lineare (37.3% di differenza rispetto alla media
Rispetto alla stessa classe
» 97% di tutti i dispositivi testati in questa classe è stato migliore, 1% simile, 1% peggiore
» Il migliore ha avuto un delta di 5%, medio di 18%, peggiore di 53%
Rispetto a tutti i dispositivi testati
» 94% di tutti i dispositivi testati in questa classe è stato migliore, 1% similare, 5% peggiore
» Il migliore ha avuto un delta di 4%, medio di 23%, peggiore di 134%
Apple MacBook 12 (Early 2016) 1.1 GHz analisi audio
(+) | gli altoparlanti sono relativamente potenti (83.6 dB)
Bassi 100 - 315 Hz
(±) | bassi ridotti - in media 11.3% inferiori alla media
(±) | la linearità dei bassi è media (14.2% delta rispetto alla precedente frequenza)
Medi 400 - 2000 Hz
(+) | medi bilanciati - solo only 2.4% rispetto alla media
(+) | medi lineari (5.5% delta rispetto alla precedente frequenza)
Alti 2 - 16 kHz
(+) | Alti bilanciati - appena 2% dalla media
(+) | alti lineari (4.5% delta rispetto alla precedente frequenza)
Nel complesso 100 - 16.000 Hz
(+) | suono nel complesso lineare (10.2% differenza dalla media)
Rispetto alla stessa classe
» 7% di tutti i dispositivi testati in questa classe è stato migliore, 2% simile, 91% peggiore
» Il migliore ha avuto un delta di 5%, medio di 18%, peggiore di 53%
Rispetto a tutti i dispositivi testati
» 5% di tutti i dispositivi testati in questa classe è stato migliore, 1% similare, 94% peggiore
» Il migliore ha avuto un delta di 4%, medio di 23%, peggiore di 134%
| Off / Standby | |
| Idle | |
| Sotto carico |
|
Leggenda:
min: | |
| Chuwi AeroBook Pro m3-8100Y, UHD Graphics 615, Netac SSD 256GB, IPS, 1920x1080, 13.3" | Apple MacBook Air 2020 i5 i5-1030NG7, Iris Plus Graphics G7 (Ice Lake 64 EU), Apple SSD AP0512, IPS, 2560x1600, 13.3" | Dell XPS 13 9300 i5 FHD i5-1035G1, UHD Graphics G1 (Ice Lake 32 EU), Toshiba XG6 KXG60ZNV512G, IPS, 1920x1200, 13.4" | Lenovo Yoga 720-12IKB i5-7200U, HD Graphics 620, Liteonit CV3-8D128, IPS, 1920x1080, 12.5" | Jumper EZbook X3 Celeron N3350, HD Graphics 500, 64 GB eMMC Flash, IPS, 1920x1080, 13.3" | Lenovo Ideapad S530-13IWL i5-8265U, UHD Graphics 620, Lenovo UMIS AM610 RPFTJ256PDD2MWX, IPS, 1920x1080, 13.3" | |
|---|---|---|---|---|---|---|
| Power Consumption | 0% | -27% | 3% | 32% | -27% | |
| Idle Minimum * (Watt) | 5.7 | 2.4 58% | 3.4 40% | 3.7 35% | 3.3 42% | 2.8 51% |
| Idle Average * (Watt) | 8.2 | 6.8 17% | 6 27% | 5.7 30% | 6.4 22% | 5.6 32% |
| Idle Maximum * (Watt) | 9.2 | 10.5 -14% | 10.2 -11% | 6.9 25% | 7 24% | 7.4 20% |
| Load Average * (Watt) | 17.5 | 25.7 -47% | 36.6 -109% | 29.6 -69% | 13.4 23% | 41.6 -138% |
| Load Maximum * (Watt) | 27.2 | 30.4 -12% | 49.3 -81% | 29.4 -8% | 14 49% | 55 -102% |
| Witcher 3 ultra * (Watt) | 24.5 |
* ... Meglio usare valori piccoli
| Chuwi AeroBook Pro m3-8100Y, UHD Graphics 615, 38 Wh | Apple MacBook Air 2020 i5 i5-1030NG7, Iris Plus Graphics G7 (Ice Lake 64 EU), 49.9 Wh | Dell XPS 13 9300 i5 FHD i5-1035G1, UHD Graphics G1 (Ice Lake 32 EU), 52 Wh | Lenovo Yoga 720-12IKB i5-7200U, HD Graphics 620, 36 Wh | Jumper EZbook X3 Celeron N3350, HD Graphics 500, 34.9 Wh | Lenovo Ideapad S530-13IWL i5-8265U, UHD Graphics 620, 45 Wh | |
|---|---|---|---|---|---|---|
| Autonomia della batteria | 106% | 134% | 20% | 58% | 32% | |
| WiFi v1.3 (h) | 5 | 10.3 106% | 11.7 134% | 6 20% | 7.9 58% | 6.6 32% |
| Load (h) | 2.9 | 3.4 | 1.5 | 1.3 | ||
| Reader / Idle (h) | 11.5 | 13.5 |
Pro
Contro
Passare dall'AeroBook all'AeroBook Pro dovrebbe significare aggiornamenti su tutta la linea. Sfortunatamente, l'AeroBook Pro è essenzialmente lo stesso nonostante lo swap del processore e i cambiamenti del display sono in realtà un downgrade. Le prestazioni del sistema rimangono incredibilmente lente al punto che anche il leggero multi-tasking sembrerà un rallentamento.
Se siete alla ricerca di un Ultrabook economico per tirare avanti, allora investite in un portatile di vecchia generazione della serie Core U come il Dell XPS 13, HP Spectre 13, o Asus ZenBook 13. Anche una configurazione dell'era Core i3 2016-era durerà più a lungo e supererà le prestazioni dell'AeroBook Pro, senza costare molto di più.
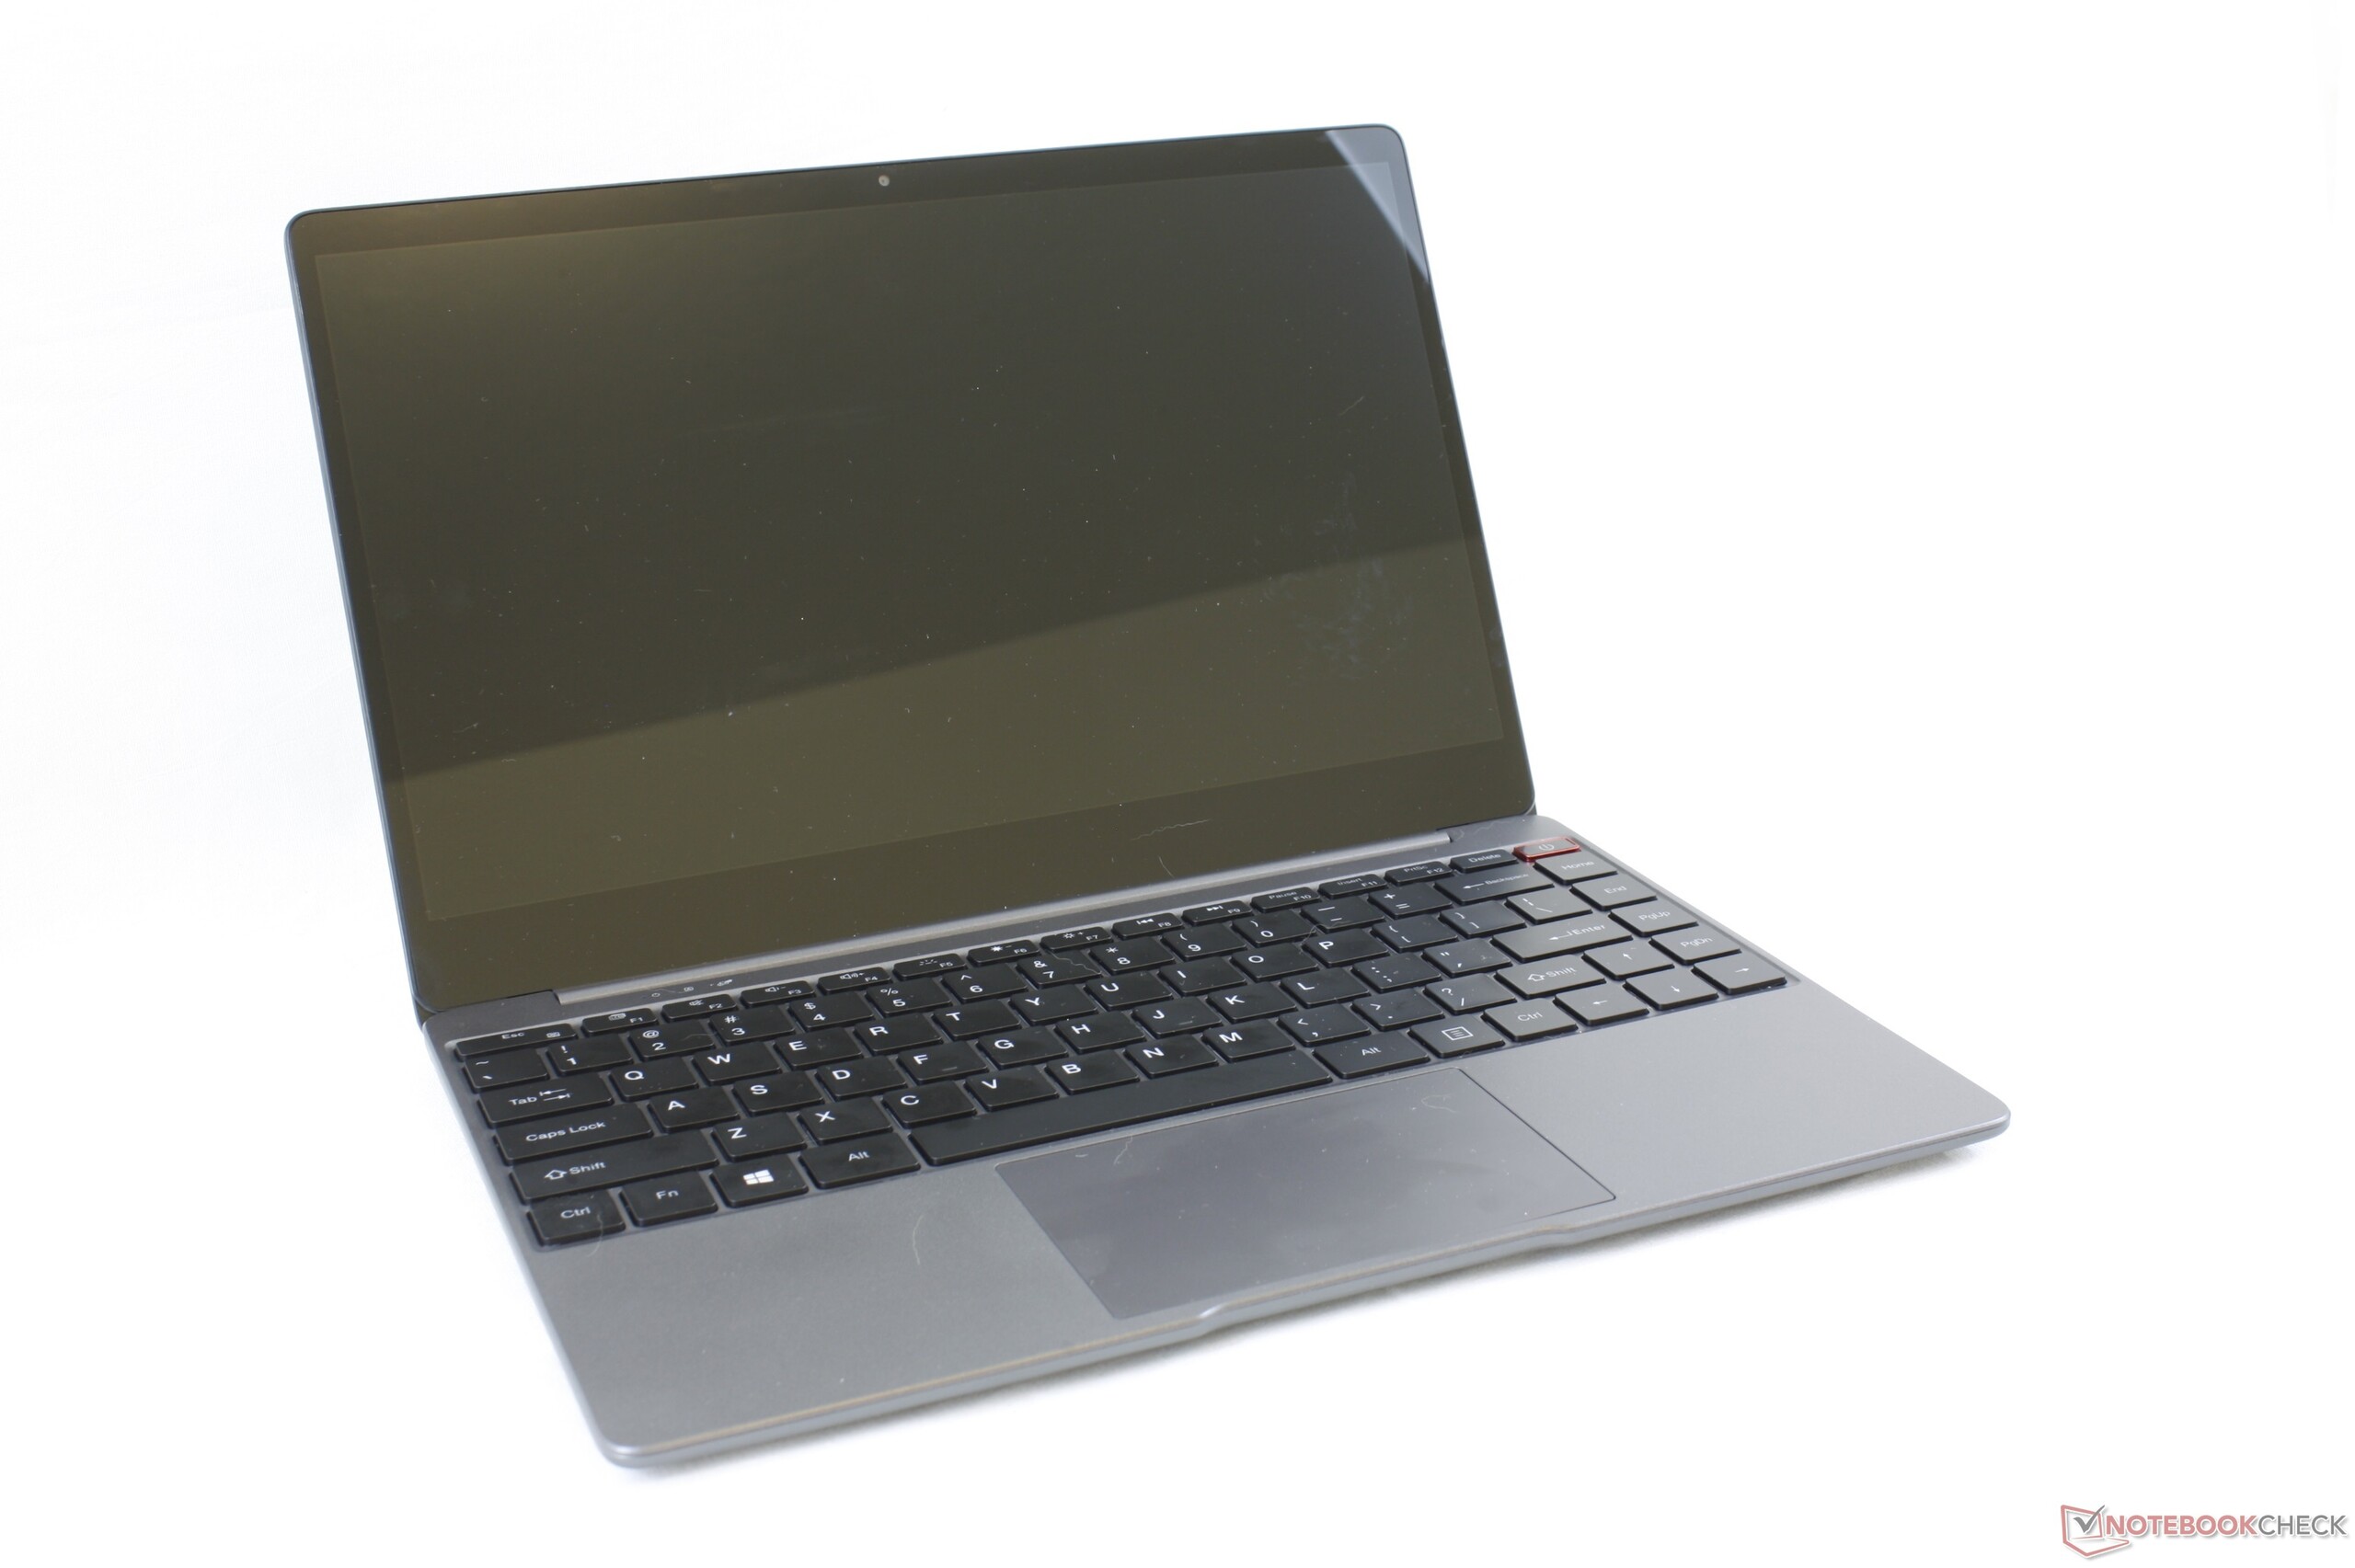
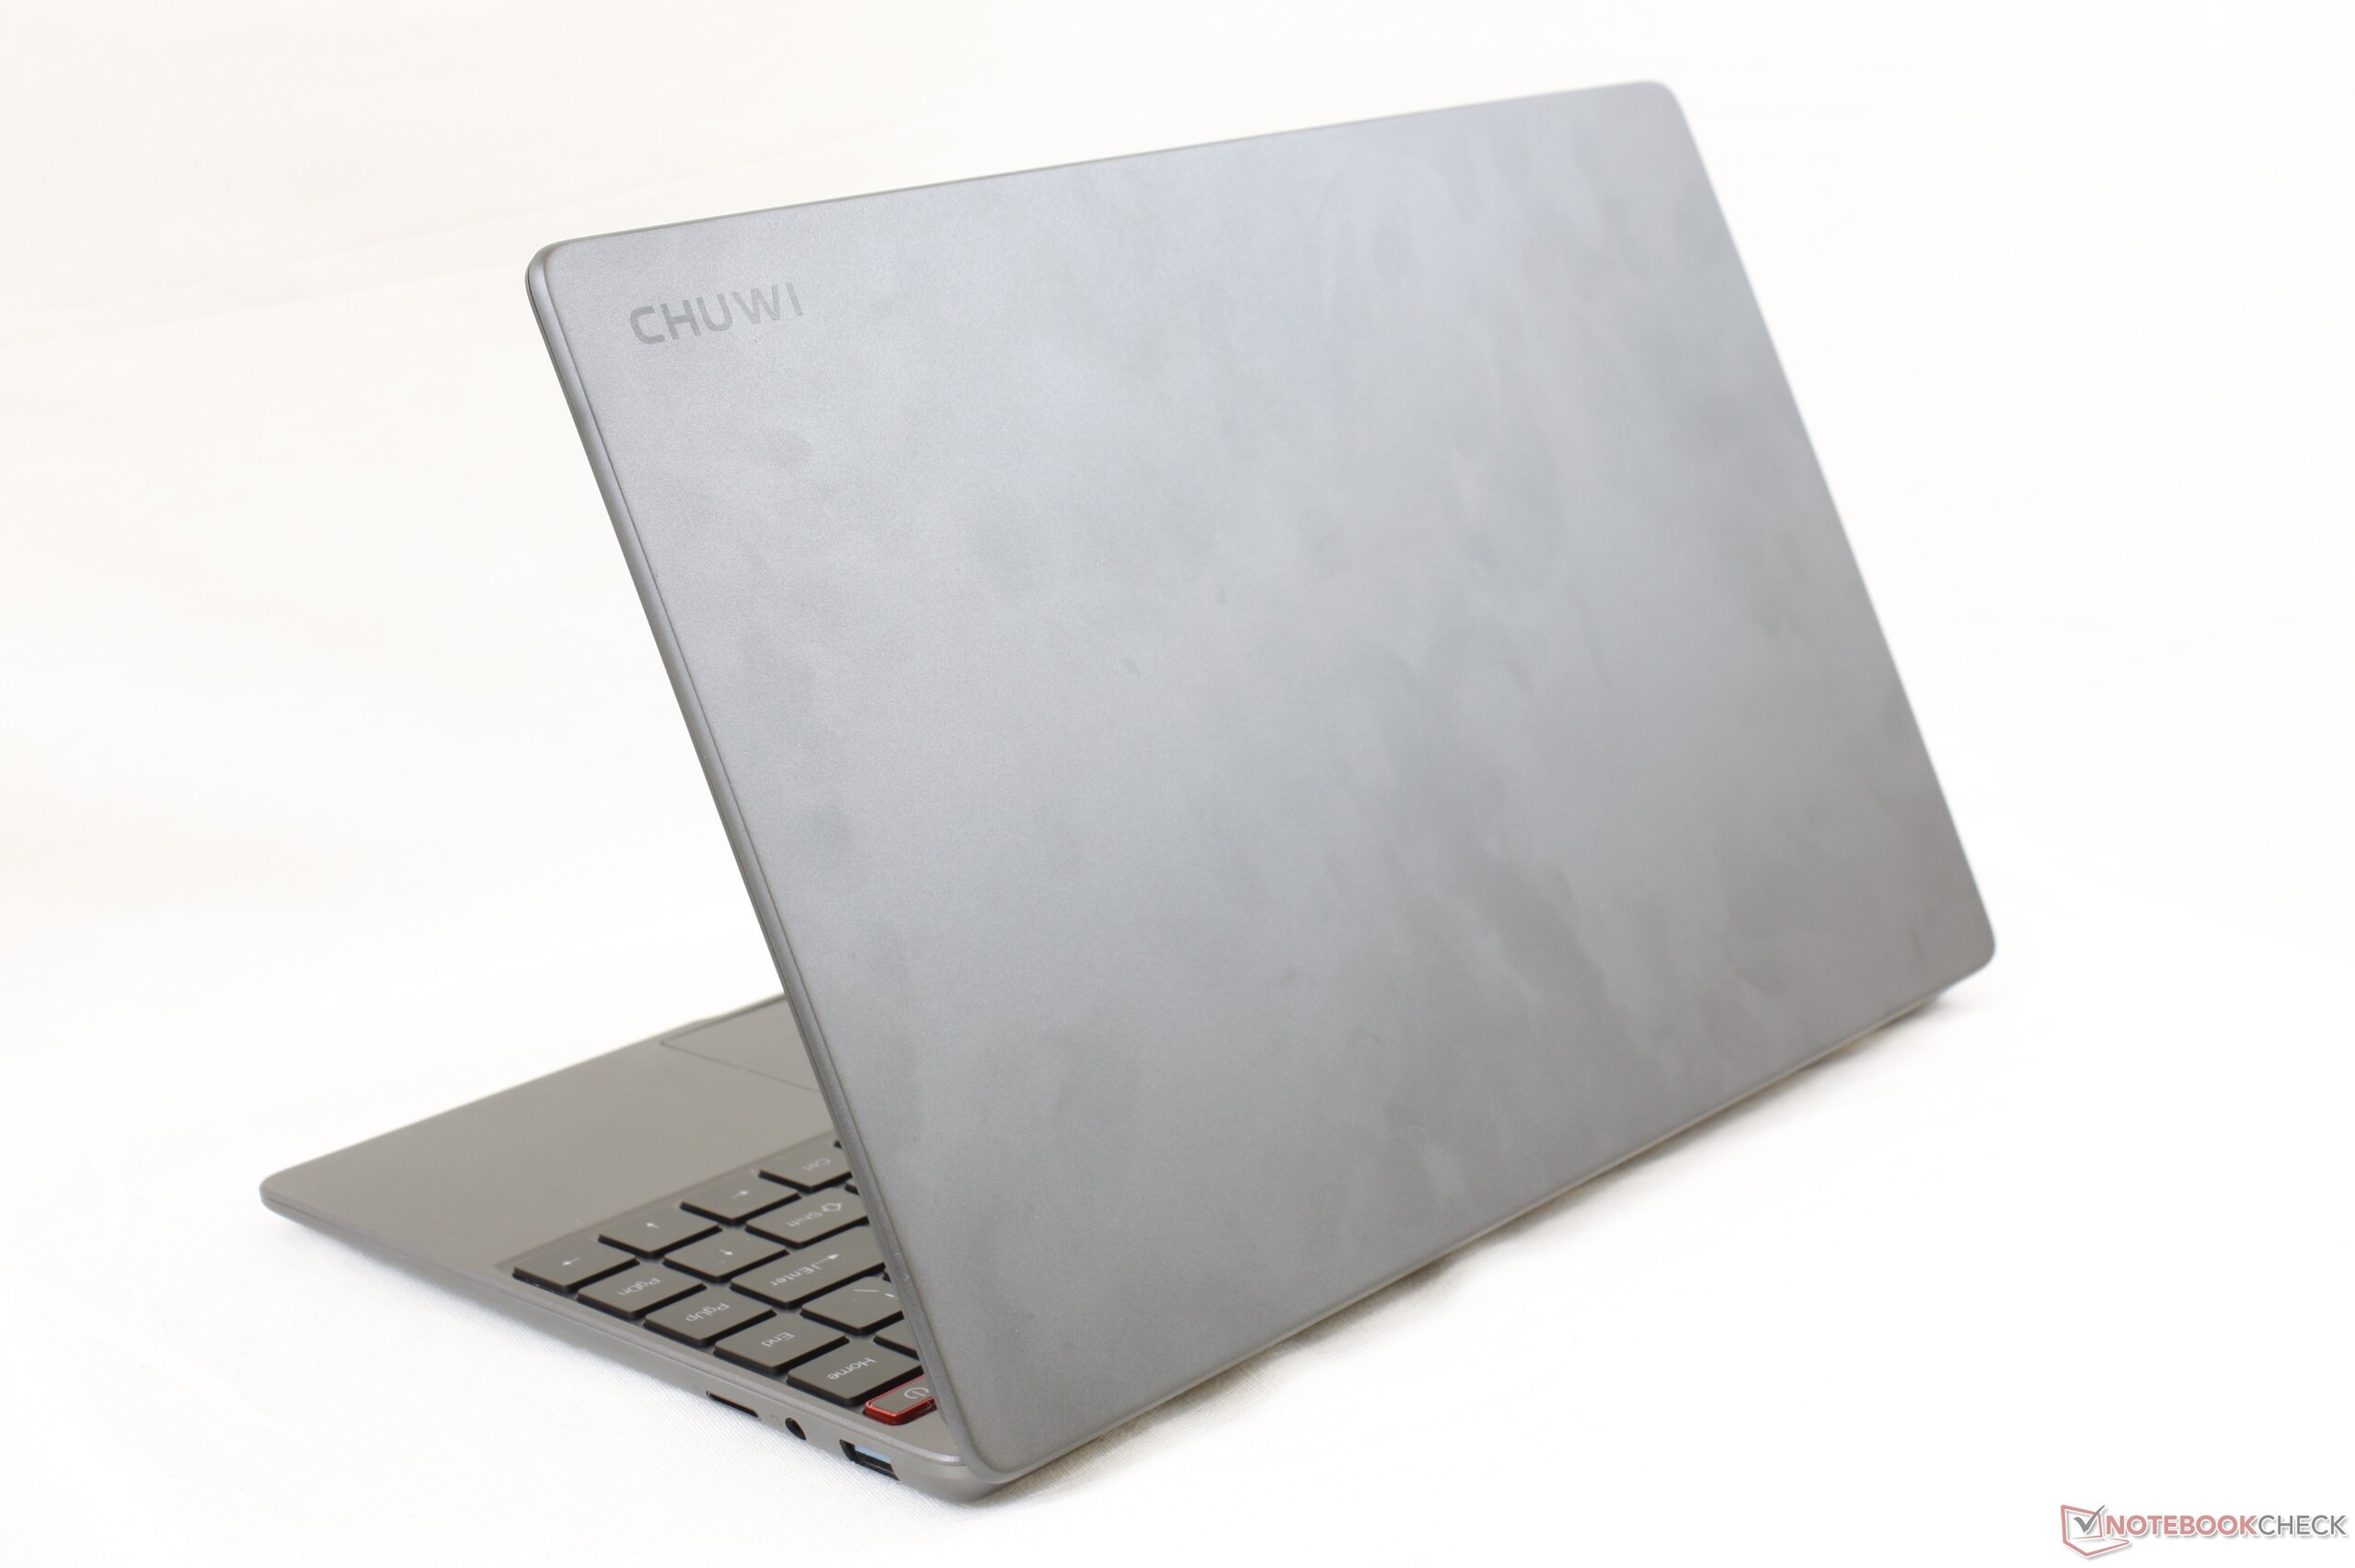
L'AeroBook Pro ha un ottimo display, un design eccellente del telaio e una buona tastiera soprattutto considerando il prezzo. Il processore Core m3 molto lento trascina giù quello che altrimenti avrebbe potuto essere un buon affare.
Chuwi AeroBook Pro
- 06/04/2020 v7 (old)
Allen Ngo
Price comparison
