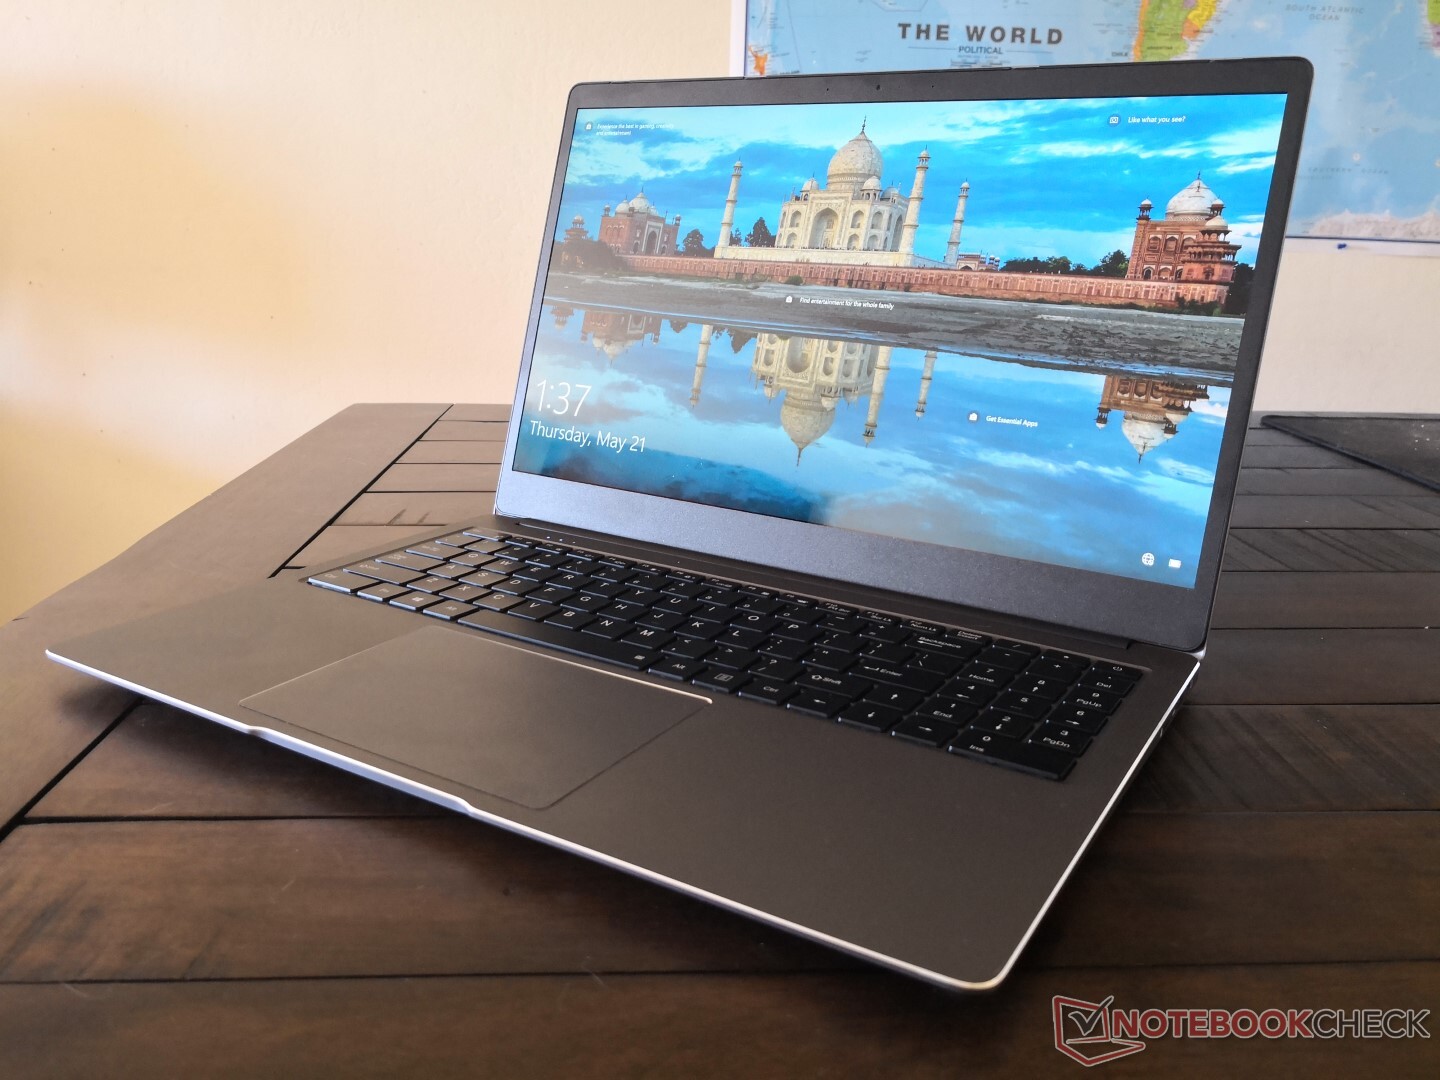
Recensione del Laptop Chuwi AeroBook Plus 4K Intel Skylake-U 6a Gen...nel 2020
Punteggio | Data | Modello | Peso | Altezza | Dimensione | Risoluzione | Prezzo |
|---|---|---|---|---|---|---|---|
| 73.2 % v7 (old) | 05/2020 | Chuwi AeroBook Plus 6287U, Iris Graphics 550 | 1.7 kg | 15.9 mm | 15.60" | 3840x2160 | |
| 87.9 % v7 (old) | 07/2018 | Apple MacBook Pro 15 2018 (2.6 GHz, 560X) i7-8850H, Radeon Pro 560X | 1.8 kg | 15.5 mm | 15.40" | 2880x1800 | |
| 81.4 % v7 (old) | 01/2020 | Lenovo Ideapad S540-15IML i5-10210U, GeForce MX250 | 1.9 kg | 17 mm | 15.60" | 1920x1080 | |
| 80.1 % v6 (old) | 03/2018 | HP Envy x360 15-bq102ng R5 2500U, Vega 8 | 2.1 kg | 19.6 mm | 15.60" | 1920x1080 | |
| 73.1 % v7 (old) | 04/2020 | Asus Vivobook 15 F512DA-SH31 R3 3200U, Vega 3 | 1.8 kg | 19.9 mm | 15.60" | 1920x1080 |
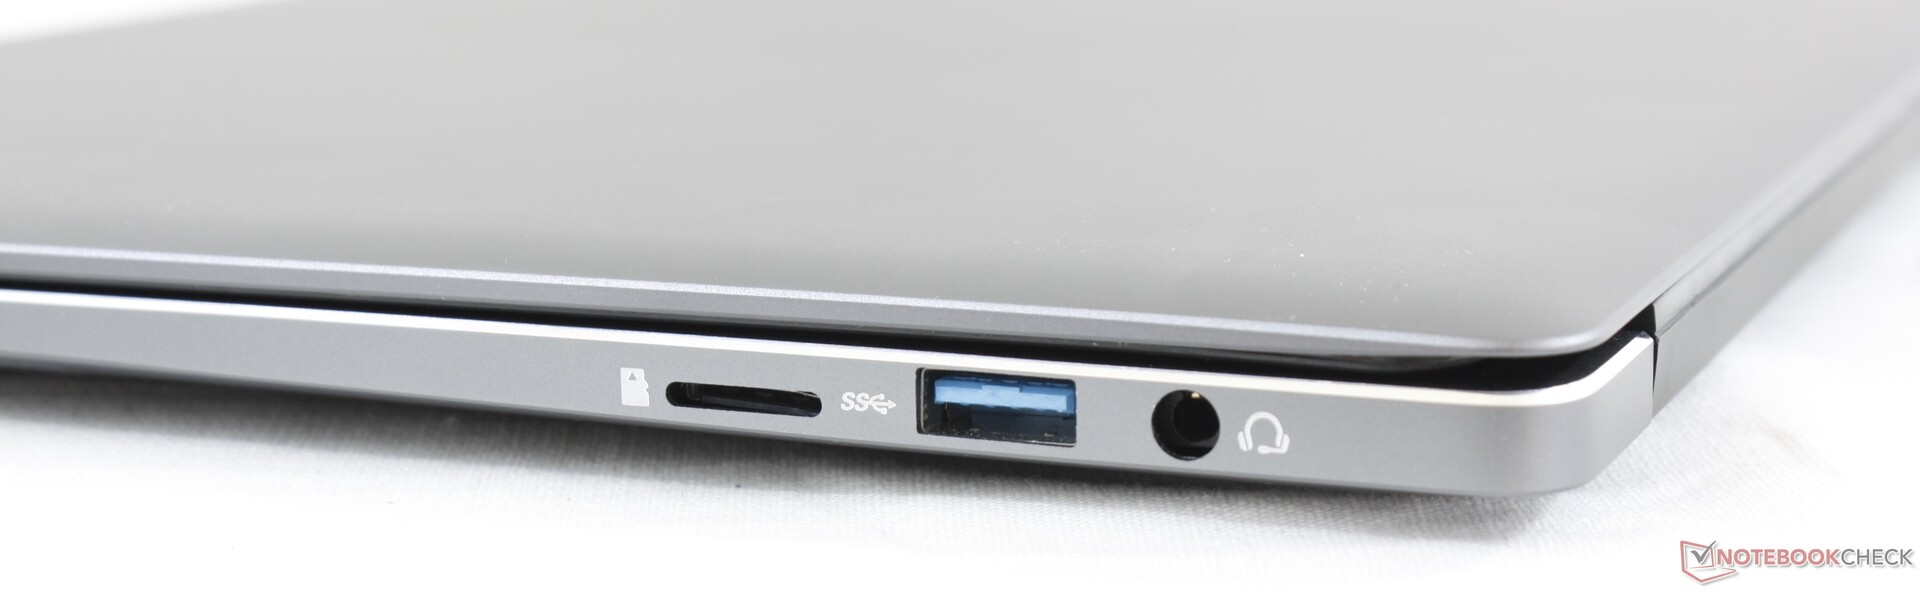
| SD Card Reader | |
| average JPG Copy Test (av. of 3 runs) | |
| Dell XPS 15 7590 i5 iGPU FHD (Toshiba Exceria Pro SDXC 64 GB UHS-II) | |
| HP Envy x360 15-bq102ng (Toshiba Exceria Pro SDXC 64 GB UHS-II) | |
| Asus Vivobook 15 F512DA-SH31 (Toshiba Exceria Pro M501 64 GB UHS-II) | |
| Chuwi AeroBook Plus (Toshiba Exceria Pro M501 64 GB UHS-II) | |
| maximum AS SSD Seq Read Test (1GB) | |
| Dell XPS 15 7590 i5 iGPU FHD (Toshiba Exceria Pro SDXC 64 GB UHS-II) | |
| HP Envy x360 15-bq102ng (Toshiba Exceria Pro SDXC 64 GB UHS-II) | |
| Asus Vivobook 15 F512DA-SH31 (Toshiba Exceria Pro M501 64 GB UHS-II) | |
| Chuwi AeroBook Plus (Toshiba Exceria Pro M501 64 GB UHS-II) | |
| Networking | |
| iperf3 transmit AX12 | |
| Dynabook Portégé X30L-G | |
| Microsoft Surface Laptop 3 13 Core i5-1035G7 | |
| LG Gram 14Z90N | |
| Chuwi AeroBook Plus | |
| iperf3 receive AX12 | |
| LG Gram 14Z90N | |
| Dynabook Portégé X30L-G | |
| Microsoft Surface Laptop 3 13 Core i5-1035G7 | |
| Chuwi AeroBook Plus | |


| |||||||||||||||||||||||||
Distribuzione della luminosità: 86 %
Al centro con la batteria: 336.9 cd/m²
Contrasto: 1047:1 (Nero: 0.33 cd/m²)
ΔE ColorChecker Calman: 4.25 | ∀{0.5-29.43 Ø4.72}
calibrated: 3.49
ΔE Greyscale Calman: 5.8 | ∀{0.09-98 Ø4.97}
88% sRGB (Argyll 1.6.3 3D)
57.2% AdobeRGB 1998 (Argyll 1.6.3 3D)
64.7% AdobeRGB 1998 (Argyll 3D)
88.4% sRGB (Argyll 3D)
66.7% Display P3 (Argyll 3D)
Gamma: 2.13
CCT: 7771 K
| Chuwi AeroBook Plus BOE06C3, IPS, 15.6", 3840x2160 | Apple MacBook Pro 15 2018 (2.6 GHz, 560X) APPA040, IPS, 15.4", 2880x1800 | Dell XPS 15 7590 i5 iGPU FHD LQ156M1, IPS, 15.6", 1920x1080 | Lenovo Yoga C740-15IML B156HAN02.5, IPS LED, 15.6", 1920x1080 | HP Envy x360 15-bq102ng Chi Mei CM15E9, IPS, 15.6", 1920x1080 | Asus Vivobook 15 F512DA-SH31 AU Optronics B156HAN02.1, IPS, 15.6", 1920x1080 | |
|---|---|---|---|---|---|---|
| Display | 32% | 6% | -38% | -34% | -38% | |
| Display P3 Coverage (%) | 66.7 | 98.7 48% | 66.5 0% | 39.04 -41% | 41.36 -38% | 38.71 -42% |
| sRGB Coverage (%) | 88.4 | 99.9 13% | 98 11% | 57.9 -35% | 62.2 -30% | 58.2 -34% |
| AdobeRGB 1998 Coverage (%) | 64.7 | 86.6 34% | 68.4 6% | 40.33 -38% | 42.74 -34% | 40 -38% |
| Response Times | -11% | -25% | -23% | 3% | 1% | |
| Response Time Grey 50% / Grey 80% * (ms) | 39.6 ? | 43.2 ? -9% | 52.8 ? -33% | 50.8 ? -28% | 40 ? -1% | 36 ? 9% |
| Response Time Black / White * (ms) | 27.6 ? | 31.2 ? -13% | 32 ? -16% | 32.4 ? -17% | 26 ? 6% | 29.6 ? -7% |
| PWM Frequency (Hz) | 943 ? | 117000 ? | 1020 ? | 25000 ? | ||
| Screen | 43% | 33% | -27% | 7% | -39% | |
| Brightness middle (cd/m²) | 345.4 | 520 51% | 588 70% | 286 -17% | 221 -36% | 252.8 -27% |
| Brightness (cd/m²) | 318 | 492 55% | 555 75% | 268 -16% | 207 -35% | 237 -25% |
| Brightness Distribution (%) | 86 | 88 2% | 89 3% | 83 -3% | 87 1% | 89 3% |
| Black Level * (cd/m²) | 0.33 | 0.39 -18% | 0.4 -21% | 0.2 39% | 0.15 55% | 0.86 -161% |
| Contrast (:1) | 1047 | 1333 27% | 1470 40% | 1430 37% | 1473 41% | 294 -72% |
| Colorchecker dE 2000 * | 4.25 | 1.2 72% | 2.5 41% | 7.3 -72% | 4.35 -2% | 4.83 -14% |
| Colorchecker dE 2000 max. * | 9.34 | 2.3 75% | 6.3 33% | 21.7 -132% | 8.98 4% | 16.38 -75% |
| Colorchecker dE 2000 calibrated * | 3.49 | 0.6 83% | 5.1 -46% | 3.78 -8% | ||
| Greyscale dE 2000 * | 5.8 | 1.3 78% | 4.5 22% | 7 -21% | 3.09 47% | 4.6 21% |
| Gamma | 2.13 103% | 2.18 101% | 2.2 100% | 2.35 94% | 2.23 99% | 2.34 94% |
| CCT | 7771 84% | 6738 96% | 6836 95% | 5847 111% | 6068 107% | 6841 95% |
| Color Space (Percent of AdobeRGB 1998) (%) | 57.2 | 63.2 10% | 36.9 -35% | 56 -2% | 36.9 -35% | |
| Color Space (Percent of sRGB) (%) | 88 | 98 11% | 57.5 -35% | 86 -2% | 58.1 -34% | |
| Media totale (Programma / Settaggio) | 21% /
32% | 5% /
21% | -29% /
-29% | -8% /
-2% | -25% /
-34% |
* ... Meglio usare valori piccoli
Tempi di risposta del Display
| ↔ Tempi di risposta dal Nero al Bianco | ||
|---|---|---|
| 27.6 ms ... aumenta ↗ e diminuisce ↘ combinato | ↗ 13.6 ms Incremento | 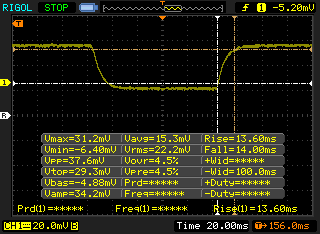 |
| ↘ 14 ms Calo | ||
| Lo schermo mostra tempi di risposta relativamente lenti nei nostri tests e potrebbe essere troppo lento per i gamers. In confronto, tutti i dispositivi di test variano da 0.1 (minimo) a 240 (massimo) ms. » 70 % di tutti i dispositivi è migliore. Questo significa che i tempi di risposta rilevati sono peggiori rispetto alla media di tutti i dispositivi testati (19.8 ms). | ||
| ↔ Tempo di risposta dal 50% Grigio all'80% Grigio | ||
| 39.6 ms ... aumenta ↗ e diminuisce ↘ combinato | ↗ 20.4 ms Incremento | 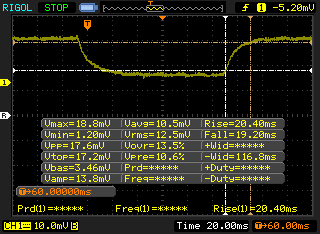 |
| ↘ 19.2 ms Calo | ||
| Lo schermo mostra tempi di risposta lenti nei nostri tests e sarà insoddisfacente per i gamers. In confronto, tutti i dispositivi di test variano da 0.165 (minimo) a 636 (massimo) ms. » 61 % di tutti i dispositivi è migliore. Questo significa che i tempi di risposta rilevati sono peggiori rispetto alla media di tutti i dispositivi testati (31 ms). | ||
Sfarfallio dello schermo / PWM (Pulse-Width Modulation)
| flickering dello schermo / PWM rilevato | 943 Hz | ≤ 99 % settaggio luminosita' | 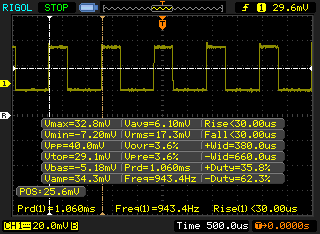 |
Il display sfarfalla a 943 Hz (Probabilmente a causa dell'uso di PWM) Flickering rilevato ad una luminosita' di 99 % o inferiore. Non dovrebbe verificarsi flickering o PWM sopra questo valore di luminosita'. La frequenza di 943 Hz è abbastanza alta, quindi la maggioranza degli utenti sensibili al PWM non dovrebbero notare alcun flickering. In confronto: 52 % di tutti i dispositivi testati non utilizza PWM per ridurre la luminosita' del display. Se è rilevato PWM, una media di 7763 (minimo: 5 - massimo: 343500) Hz è stata rilevata. | |||
Cinebench R20: CPU (Multi Core) | CPU (Single Core)
Blender: v2.79 BMW27 CPU
7-Zip 18.03: 7z b 4 -mmt1 | 7z b 4
Geekbench 5.5: Single-Core | Multi-Core
HWBOT x265 Benchmark v2.2: 4k Preset
LibreOffice : 20 Documents To PDF
R Benchmark 2.5: Overall mean
| Geekbench 5.5 / Single-Core | |
| Apple MacBook Pro 13 2020 2GHz i5 10th-Gen | |
| Asus ZenBook 15 UX534FTC-A8190T | |
| Apple MacBook Air 2020 i3 | |
| Acer Aspire 5 A515-54G | |
| Wacom MobileStudio Pro 13 i7 256GB | |
| Chuwi AeroBook Plus | |
| Media Intel Core i5-6287U (825 - 939, n=2) | |
| Geekbench 5.5 / Multi-Core | |
| Apple MacBook Pro 13 2020 2GHz i5 10th-Gen | |
| Asus ZenBook 15 UX534FTC-A8190T | |
| Acer Aspire 5 A515-54G | |
| Wacom MobileStudio Pro 13 i7 256GB | |
| Chuwi AeroBook Plus | |
| Apple MacBook Air 2020 i3 | |
| Media Intel Core i5-6287U (1935 - 2042, n=2) | |
| HWBOT x265 Benchmark v2.2 / 4k Preset | |
| Apple MacBook Pro 13 2020 2GHz i5 10th-Gen | |
| Lenovo IdeaPad S540-15IWL 81SW0015GE | |
| Microsoft Surface Laptop 3 13 Core i5-1035G7 | |
| Acer Aspire 5 A515-54G | |
| Dell Latitude 13 3390 | |
| Wacom MobileStudio Pro 13 i7 256GB | |
| Chuwi AeroBook Plus | |
| Media Intel Core i5-6287U (n=1) | |
| Apple MacBook Air 2020 i3 | |
| LibreOffice / 20 Documents To PDF | |
| Apple MacBook Air 2020 i3 | |
| Apple MacBook Pro 13 2020 2GHz i5 10th-Gen | |
| Chuwi AeroBook Plus | |
| Media Intel Core i5-6287U (n=1) | |
| Acer Aspire 5 A515-54G | |
| R Benchmark 2.5 / Overall mean | |
| Apple MacBook Air 2020 i3 | |
| Chuwi AeroBook Plus | |
| Media Intel Core i5-6287U (n=1) | |
| Acer Aspire 5 A515-54G | |
| Apple MacBook Pro 13 2020 2GHz i5 10th-Gen | |
Cinebench R20: CPU (Multi Core) | CPU (Single Core)
Blender: v2.79 BMW27 CPU
7-Zip 18.03: 7z b 4 -mmt1 | 7z b 4
Geekbench 5.5: Single-Core | Multi-Core
HWBOT x265 Benchmark v2.2: 4k Preset
LibreOffice : 20 Documents To PDF
R Benchmark 2.5: Overall mean
* ... Meglio usare valori piccoli
| PCMark 8 | |
| Home Score Accelerated v2 | |
| Lenovo Yoga C740-15IML | |
| Dell Latitude 15 3590 | |
| HP Envy x360 15-bq102ng | |
| Chuwi AeroBook Plus | |
| Asus Vivobook 15 F512DA-SH31 | |
| Work Score Accelerated v2 | |
| Lenovo Yoga C740-15IML | |
| Dell Latitude 15 3590 | |
| Asus Vivobook 15 F512DA-SH31 | |
| HP Envy x360 15-bq102ng | |
| Chuwi AeroBook Plus | |
| PCMark 8 Home Score Accelerated v2 | 2764 punti | |
| PCMark 8 Work Score Accelerated v2 | 3609 punti | |
| PCMark 10 Score | 3528 punti | |
Aiuto | ||
| DPC Latencies / LatencyMon - interrupt to process latency (max), Web, Youtube, Prime95 | |
| Chuwi AeroBook Plus | |
* ... Meglio usare valori piccoli
| Chuwi AeroBook Plus HIKVision HS-SSD-C100N M.2 SATA III SSD 256 GB | HP Envy x360 15-bq102ng Samsung PM961 MZVLW256HEHP | Dell XPS 15 7590 i5 iGPU FHD Toshiba XG6 KXG60ZNV512G | Lenovo Yoga C740-15IML Samsung SSD PM981 MZVLB512HAJQ | Asus Vivobook 15 F512DA-SH31 SanDisk X600 SD9SN8W-128G | |
|---|---|---|---|---|---|
| AS SSD | 268% | 640% | 678% | -12% | |
| Seq Read (MB/s) | 469 | 2465 426% | 2357 403% | 2732 483% | 341.4 -27% |
| Seq Write (MB/s) | 418.3 | 1318 215% | 1235 195% | 1477 253% | 134.2 -68% |
| 4K Read (MB/s) | 21.17 | 42.97 103% | 43.29 104% | 57.7 173% | 27.83 31% |
| 4K Write (MB/s) | 48.31 | 81.9 70% | 99.7 106% | 136.3 182% | 54.9 14% |
| 4K-64 Read (MB/s) | 155.4 | 1025 560% | 1020 556% | 1021 557% | 217.1 40% |
| 4K-64 Write (MB/s) | 56.6 | 338.6 498% | 1502 2554% | 1651 2817% | 68.1 20% |
| Access Time Read * (ms) | 0.11 | 0.077 30% | 0.07 36% | 0.062 44% | 0.153 -39% |
| Access Time Write * (ms) | 0.726 | 0.046 94% | 0.039 95% | 0.028 96% | 1.075 -48% |
| Score Read (Points) | 223 | 1314 489% | 1299 483% | 1352 506% | 279 25% |
| Score Write (Points) | 147 | 552 276% | 1726 1074% | 1935 1216% | 136 -7% |
| Score Total (Points) | 490 | 2488 408% | 3640 643% | 3929 702% | 559 14% |
| Copy ISO MB/s (MB/s) | 407 | 700 72% | 2145 427% | 1972 385% | 115.9 -72% |
| Copy Program MB/s (MB/s) | 80.6 | 167.2 107% | 565 601% | 642 697% | 44.51 -45% |
| Copy Game MB/s (MB/s) | 73.9 | 370.4 401% | 1320 1686% | 1090 1375% | 74.3 1% |
| CrystalDiskMark 5.2 / 6 | 152% | 218% | 275% | -22% | |
| Write 4K (MB/s) | 115.3 | 116 1% | 93.6 -19% | 142.3 23% | 65.2 -43% |
| Read 4K (MB/s) | 28.98 | 42.73 47% | 41.87 44% | 47.56 64% | 31.22 8% |
| Write Seq (MB/s) | 352.8 | 1222 246% | 1698 381% | 2185 519% | 284.8 -19% |
| Read Seq (MB/s) | 506 | 1608 218% | 1978 291% | 2235 342% | 497.5 -2% |
| Write 4K Q32T1 (MB/s) | 275.9 | 280.1 2% | 383.1 39% | 515 87% | 164 -41% |
| Read 4K Q32T1 (MB/s) | 219.9 | 333.6 52% | 326.9 49% | 413.4 88% | 230.2 5% |
| Write Seq Q32T1 (MB/s) | 466.2 | 1291 177% | 2778 496% | 2981 539% | 221.7 -52% |
| Read Seq Q32T1 (MB/s) | 558 | 3183 470% | 3119 459% | 3565 539% | 389.7 -30% |
| Media totale (Programma / Settaggio) | 210% /
226% | 429% /
487% | 477% /
531% | -17% /
-15% |
* ... Meglio usare valori piccoli

Disk Throttling: DiskSpd Read Loop, Queue Depth 8
| 3DMark 11 Performance | 2695 punti | |
| 3DMark Cloud Gate Standard Score | 8532 punti | |
| 3DMark Fire Strike Score | 1552 punti | |
| 3DMark Time Spy Score | 599 punti | |
Aiuto | ||
| basso | medio | alto | ultra | |
|---|---|---|---|---|
| Dota 2 Reborn (2015) | 82.5 | 43.5 | 26.9 | 23.6 |
| X-Plane 11.11 (2018) | 22.7 | 15.9 | 14.1 |
| Chuwi AeroBook Plus Iris Graphics 550, 6287U, HIKVision HS-SSD-C100N M.2 SATA III SSD 256 GB | Apple MacBook Pro 15 2018 (2.6 GHz, 560X) Radeon Pro 560X, i7-8850H, Apple SSD AP0512 | Dell XPS 15 7590 i5 iGPU FHD UHD Graphics 630, i5-9300H, Toshiba XG6 KXG60ZNV512G | Lenovo Yoga C740-15IML UHD Graphics 620, i7-10510U, Samsung SSD PM981 MZVLB512HAJQ | HP Envy x360 15-bq102ng Vega 8, R5 2500U, Samsung PM961 MZVLW256HEHP | Asus Vivobook 15 F512DA-SH31 Vega 3, R3 3200U, SanDisk X600 SD9SN8W-128G | |
|---|---|---|---|---|---|---|
| Noise | -7% | 5% | 7% | -0% | 8% | |
| off /ambiente * (dB) | 28.5 | 29.6 -4% | 29.3 -3% | 29.3 -3% | 30.13 -6% | 29.2 -2% |
| Idle Minimum * (dB) | 28.5 | 30.1 -6% | 29.3 -3% | 29.3 -3% | 30.13 -6% | 29.2 -2% |
| Idle Average * (dB) | 31.1 | 30.1 3% | 29.3 6% | 29.3 6% | 30.13 3% | 29.2 6% |
| Idle Maximum * (dB) | 33 | 30.1 9% | 29.8 10% | 29.6 10% | 30.13 9% | 29.2 12% |
| Load Average * (dB) | 36.4 | 46.8 -29% | 32.4 11% | 32.4 11% | 38.8 -7% | 30.5 16% |
| Load Maximum * (dB) | 41.2 | 46.8 -14% | 37.2 10% | 33.3 19% | 38.8 6% | 34 17% |
| Witcher 3 ultra * (dB) | 36 |
* ... Meglio usare valori piccoli
Rumorosità
| Idle |
| 28.5 / 31.1 / 33 dB(A) |
| Sotto carico |
| 36.4 / 41.2 dB(A) |
 | ||
30 dB silenzioso 40 dB(A) udibile 50 dB(A) rumoroso |
||
min: | ||
(±) La temperatura massima sul lato superiore è di 44.8 °C / 113 F, rispetto alla media di 36.8 °C / 98 F, che varia da 21 a 71 °C per questa classe Multimedia.
(-) Il lato inferiore si riscalda fino ad un massimo di 49.2 °C / 121 F, rispetto alla media di 39.1 °C / 102 F
(+) In idle, la temperatura media del lato superiore è di 30.3 °C / 87 F, rispetto alla media deld ispositivo di 31.3 °C / 88 F.
(+) I poggiapolsi e il touchpad sono piu' freddi della temperatura della pelle con un massimo di 31 °C / 87.8 F e sono quindi freddi al tatto.
(-) La temperatura media della zona del palmo della mano di dispositivi simili e'stata di 28.7 °C / 83.7 F (-2.3 °C / -4.1 F).
Chuwi AeroBook Plus analisi audio
(±) | potenza degli altiparlanti media ma buona (79.4 dB)
Bassi 100 - 315 Hz
(-) | quasi nessun basso - in media 17.5% inferiori alla media
(±) | la linearità dei bassi è media (10.3% delta rispetto alla precedente frequenza)
Medi 400 - 2000 Hz
(±) | medi elevati - circa 6.1% superiore alla media
(±) | linearità dei medi adeguata (8.8% delta rispetto alla precedente frequenza)
Alti 2 - 16 kHz
(+) | Alti bilanciati - appena 4.8% dalla media
(±) | la linearità degli alti è media (10.8% delta rispetto alla precedente frequenza)
Nel complesso 100 - 16.000 Hz
(±) | la linearità complessiva del suono è media (24.3% di differenza rispetto alla media
Rispetto alla stessa classe
» 86% di tutti i dispositivi testati in questa classe è stato migliore, 5% simile, 9% peggiore
» Il migliore ha avuto un delta di 5%, medio di 17%, peggiore di 45%
Rispetto a tutti i dispositivi testati
» 74% di tutti i dispositivi testati in questa classe è stato migliore, 6% similare, 21% peggiore
» Il migliore ha avuto un delta di 4%, medio di 23%, peggiore di 134%
Apple MacBook 12 (Early 2016) 1.1 GHz analisi audio
(+) | gli altoparlanti sono relativamente potenti (83.6 dB)
Bassi 100 - 315 Hz
(±) | bassi ridotti - in media 11.3% inferiori alla media
(±) | la linearità dei bassi è media (14.2% delta rispetto alla precedente frequenza)
Medi 400 - 2000 Hz
(+) | medi bilanciati - solo only 2.4% rispetto alla media
(+) | medi lineari (5.5% delta rispetto alla precedente frequenza)
Alti 2 - 16 kHz
(+) | Alti bilanciati - appena 2% dalla media
(+) | alti lineari (4.5% delta rispetto alla precedente frequenza)
Nel complesso 100 - 16.000 Hz
(+) | suono nel complesso lineare (10.2% differenza dalla media)
Rispetto alla stessa classe
» 7% di tutti i dispositivi testati in questa classe è stato migliore, 2% simile, 91% peggiore
» Il migliore ha avuto un delta di 5%, medio di 18%, peggiore di 53%
Rispetto a tutti i dispositivi testati
» 5% di tutti i dispositivi testati in questa classe è stato migliore, 1% similare, 94% peggiore
» Il migliore ha avuto un delta di 4%, medio di 23%, peggiore di 134%
| Off / Standby | |
| Idle | |
| Sotto carico |
|
Leggenda:
min: | |
| Chuwi AeroBook Plus 6287U, Iris Graphics 550, HIKVision HS-SSD-C100N M.2 SATA III SSD 256 GB, IPS, 3840x2160, 15.6" | Apple MacBook Pro 15 2018 (2.6 GHz, 560X) i7-8850H, Radeon Pro 560X, Apple SSD AP0512, IPS, 2880x1800, 15.4" | Dell XPS 15 7590 i5 iGPU FHD i5-9300H, UHD Graphics 630, Toshiba XG6 KXG60ZNV512G, IPS, 1920x1080, 15.6" | Lenovo Yoga C740-15IML i7-10510U, UHD Graphics 620, Samsung SSD PM981 MZVLB512HAJQ, IPS LED, 1920x1080, 15.6" | HP Envy x360 15-bq102ng R5 2500U, Vega 8, Samsung PM961 MZVLW256HEHP, IPS, 1920x1080, 15.6" | Dell Latitude 15 3590 i5-8250U, UHD Graphics 620, Samsung SSD PM871b MZ7LN256HAJQ, TN LED, 1920x1080, 15.6" | |
|---|---|---|---|---|---|---|
| Power Consumption | -2% | 11% | 35% | 39% | 47% | |
| Idle Minimum * (Watt) | 11.8 | 3.4 71% | 3.79 68% | 2.97 75% | 4.8 59% | 4.3 64% |
| Idle Average * (Watt) | 13.3 | 11 17% | 6.9 48% | 7.2 46% | 7 47% | 7.2 46% |
| Idle Maximum * (Watt) | 16.4 | 14.9 9% | 9.2 44% | 9.9 40% | 9.5 42% | 9.8 40% |
| Load Average * (Watt) | 52.2 | 78.9 -51% | 62 -19% | 40.8 22% | 40.8 22% | 38 27% |
| Load Maximum * (Watt) | 58.6 | 91.2 -56% | 108 -84% | 64.7 -10% | 44.3 24% | 24 59% |
* ... Meglio usare valori piccoli
| Chuwi AeroBook Plus 6287U, Iris Graphics 550, 55 Wh | Apple MacBook Pro 15 2018 (2.6 GHz, 560X) i7-8850H, Radeon Pro 560X, 83 Wh | Dell XPS 15 7590 i5 iGPU FHD i5-9300H, UHD Graphics 630, 97 Wh | Lenovo Yoga C740-15IML i7-10510U, UHD Graphics 620, 60.3 Wh | HP Envy x360 15-bq102ng R5 2500U, Vega 8, 55.8 Wh | Asus Vivobook 15 F512DA-SH31 R3 3200U, Vega 3, 37 Wh | |
|---|---|---|---|---|---|---|
| Autonomia della batteria | 149% | 244% | 154% | 73% | 46% | |
| WiFi v1.3 (h) | 4.1 | 10.2 149% | 14.1 244% | 10.4 154% | 7.1 73% | 6 46% |
| Witcher 3 ultra (h) | 1.5 | |||||
| Load (h) | 1.7 | 2 |
Pro
Contro
Il Chuwi AeroBook Plus risparmia su molte cose per offrire un bellissimo display 4K a questo prezzo. Alcune di esse sono ragionevoli come la WLAN 1x1, la RAM saldata, l'SSD SATA III e la mancanza del supporto Thunderbolt 3. Altri, invece, non sono accettabili. La tastiera inaffidabile e il clickpad rendono il portatile più difficile da usare di quanto dovrebbe essere e la longevità delle cerniere è discutibile. Il controllo di qualità dei prodotti Chuwi potrebbe certamente essere migliore sulla base della nostra esperienza con diversi dei loro laptops finora. Tuttavia, riconosciamo che la nostra particolare unità può essere un prototipo pre-produzione in quanto l'AeroBook Plus è ancora in fase di crowdfunding.
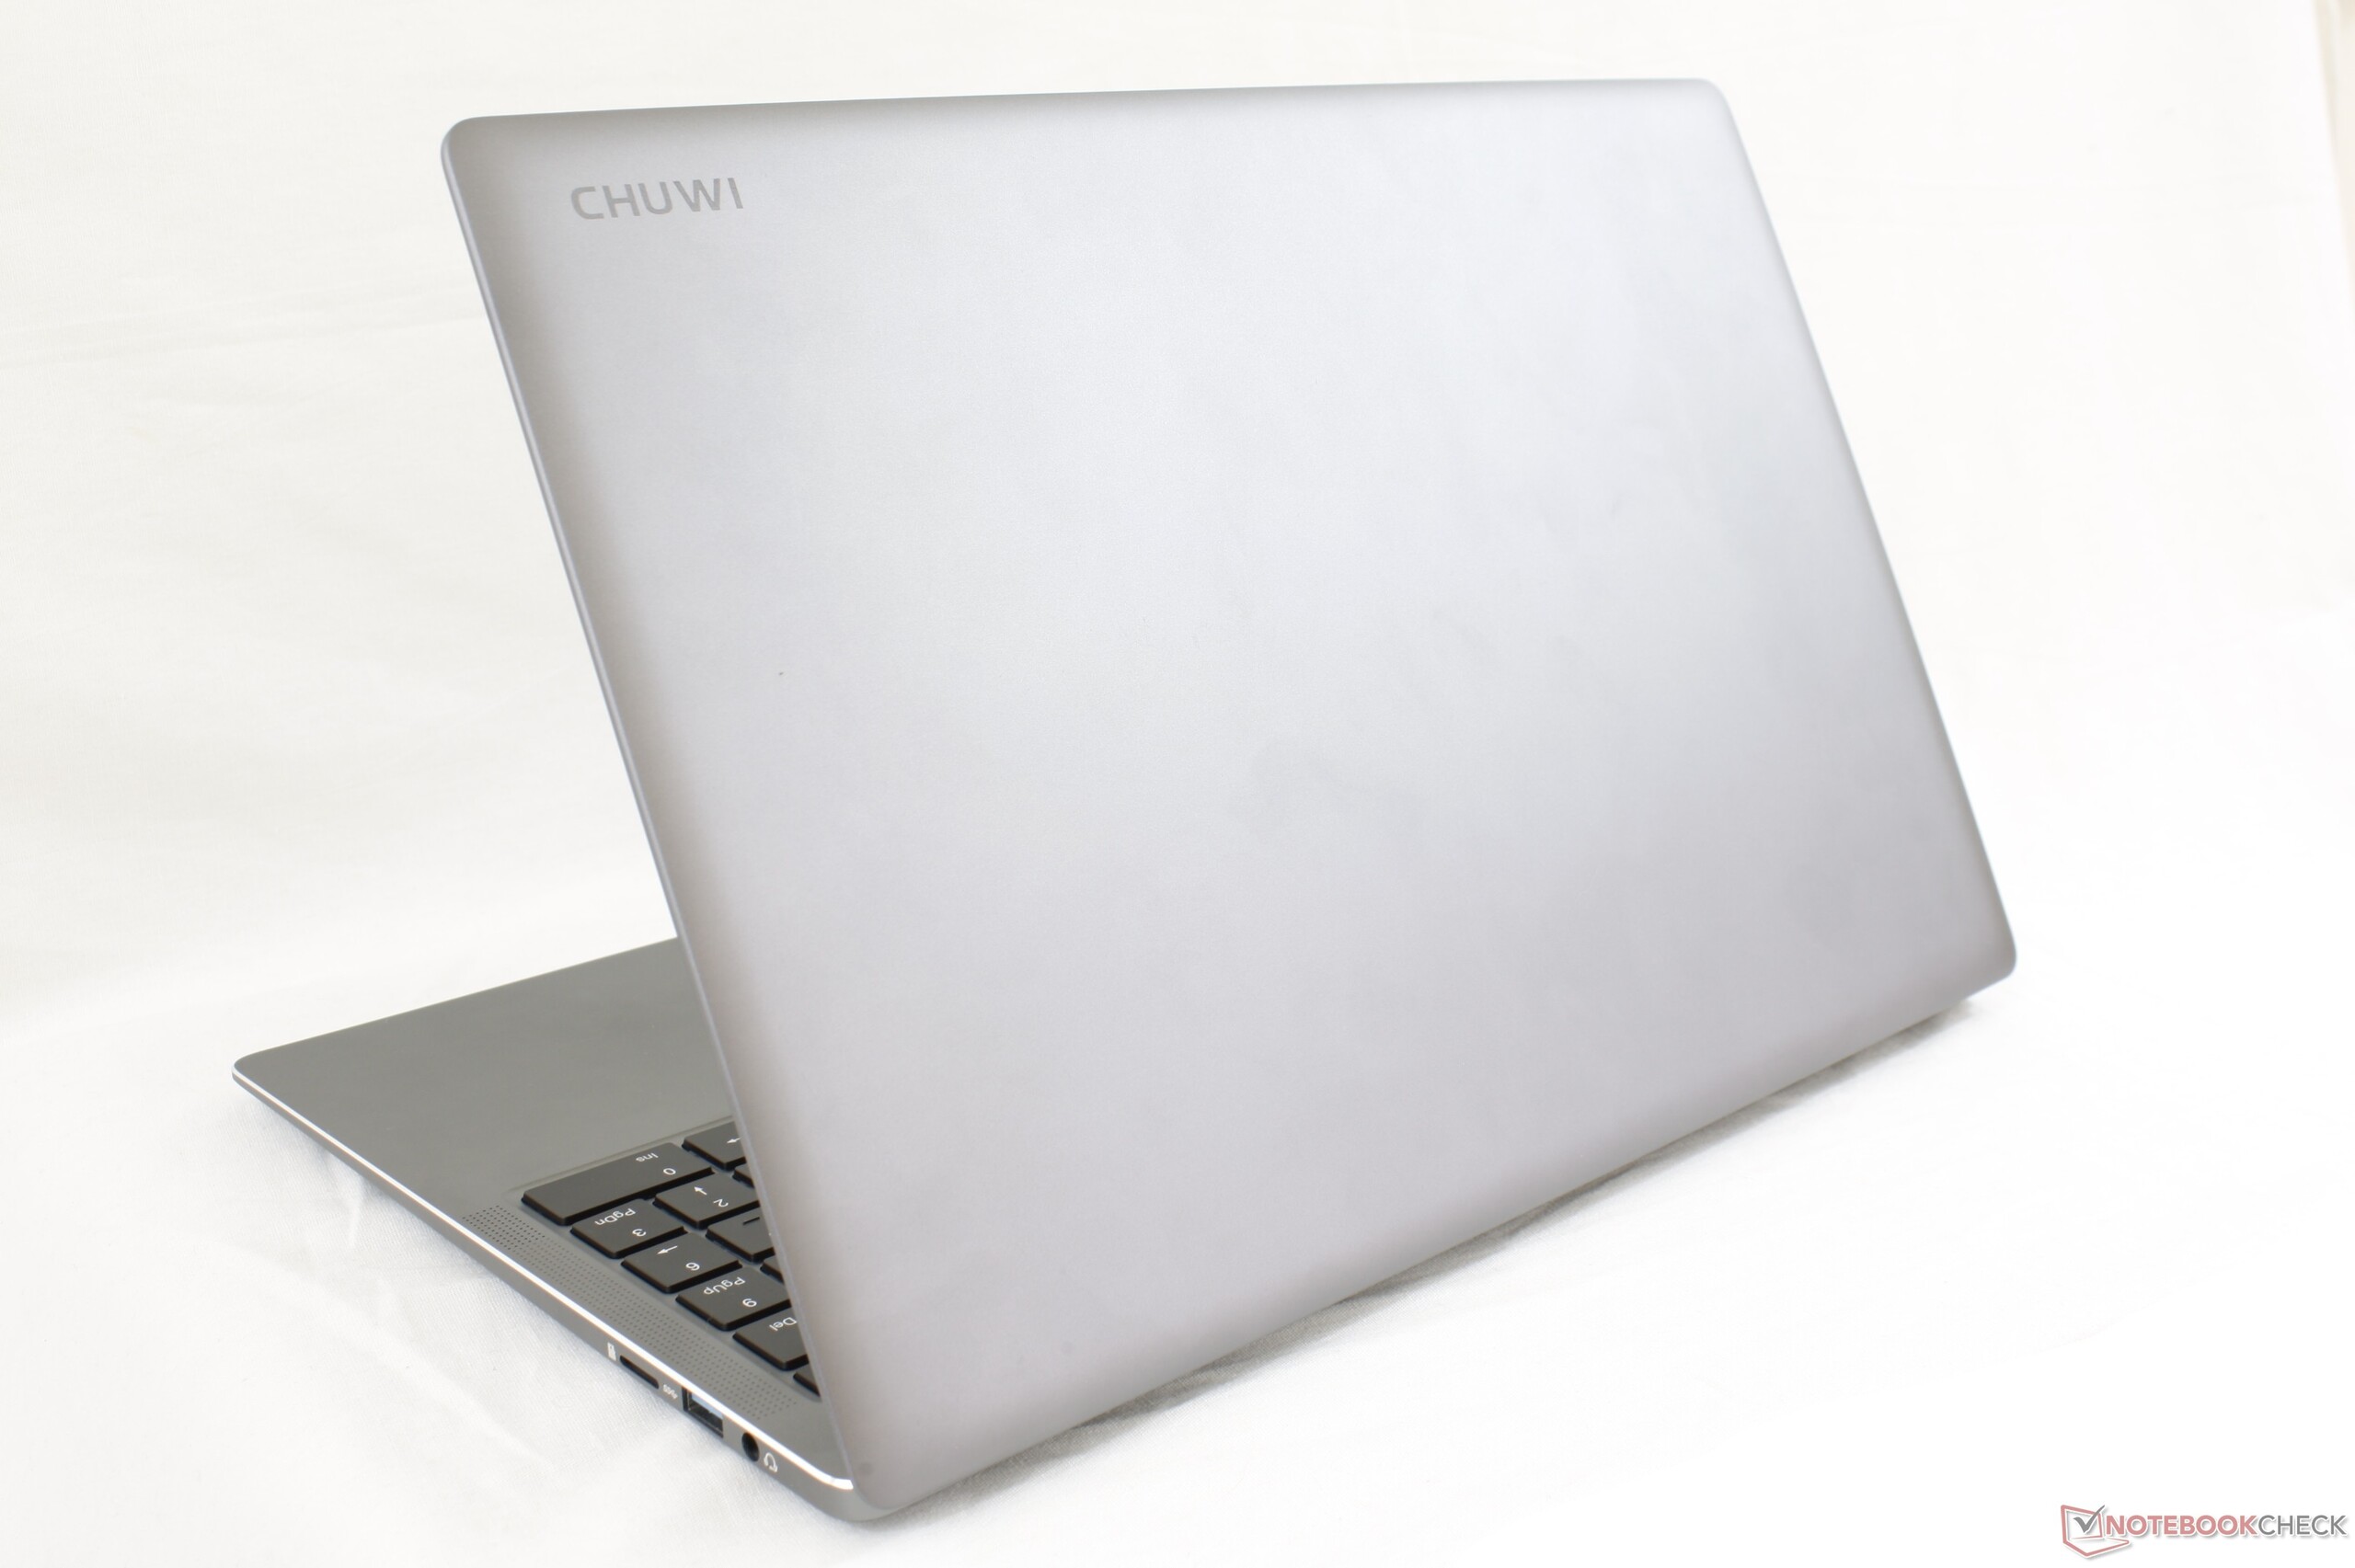
Ci sono alcuni aspetti del sistema che meritano un elogio. Il clickpad molto grande, il viaggio profondo dei tasti, le ampie opzioni di porta e l'attraente aspetto estetico aiutano l'AeroBook Plus a distinguersi dalla folla. Altri portatili della sua fascia di prezzo, come l'Asus VivoBook, Dell Inspiron o l'HP Pavilion, sono per lo più in plastica e più spessi al confronto.
Se volete davvero un Ultrabook con un display 4K senza spendere troppo, allora vi consigliamo i vecchi portatili Kaby Lake o Kaby Lake-R di Dell, HP o Lenovo, in quanto offrono opzioni di garanzia migliori e un migliore controllo della qualità.
Ottimo aspetto con un grande display 4K. Quasi tutto il resto è semplicemente nella media o ha bisogno di essere riparato, come il clickpad instabile, le cerniere deboli o i tasti della tastiera che non rispondono.
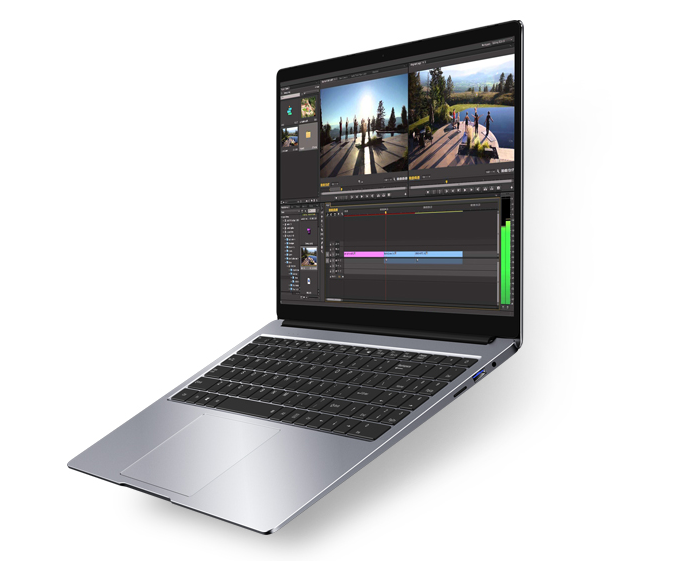
Chuwi AeroBook Plus
- 05/22/2020 v7 (old)
Allen Ngo
Price comparison
