Recensione del Tablet Wacom MobileStudio Pro 13 (Core i7-6567U, 8 GB RAM, 256 GB SSD)
| SD Card Reader - average JPG Copy Test (av. of 3 runs) | |
| HP Spectre x360 13-ae048ng (Toshiba Exceria Pro M501 microSDXC 64GB) | |
| Microsoft Surface Pro 6, Core i5, 128 GB (Toshiba Exceria Pro M501 microSDXC 64GB) | |
| Wacom MobileStudio Pro 13 i7 256GB (oshiba Exceria Pro M501 microSDXC 64GB) | |
| Media della classe Tablet (10.2 - 79.2, n=44, ultimi 2 anni) | |
| |||||||||||||||||||||||||
Distribuzione della luminosità: 86 %
Al centro con la batteria: 211 cd/m²
Contrasto: 177:1 (Nero: 1.19 cd/m²)
ΔE ColorChecker Calman: 5.1 | ∀{0.5-29.43 Ø4.73}
ΔE Greyscale Calman: 3.1 | ∀{0.09-98 Ø4.97}
Gamma: 2.26
CCT: 6606 K
| Wacom MobileStudio Pro 13 i7 256GB 2560x1440, 13.3" | Apple iPad Pro 12.9 2018 2732x2048, 12.9" | Microsoft Surface Pro 6, Core i7, 512 GB LGPhilips LP123WQ112604, , 2736x1824, 12.3" | Lenovo ThinkPad X1 Tablet G3-20KJ001NGE LP130QP1-SPA1, , 3000x2000, 13" | HP Spectre x360 13-ae048ng Chi Mei (CMN1376), , 1920x1080, 13.3" | |
|---|---|---|---|---|---|
| Display | |||||
| Display P3 Coverage (%) | 67.1 | 68.1 67.8 | 68.1 | ||
| sRGB Coverage (%) | 95.5 | 99.4 99.1 | 99.5 | ||
| AdobeRGB 1998 Coverage (%) | 67.9 | 69.9 69.3 | 70.2 | ||
| Response Times | -7% | -2% | -38% | 5% | |
| Response Time Grey 50% / Grey 80% * (ms) | 38.1 ? | 49.6 ? -30% | 43 ? -13% | 47.2 ? -24% | 36 ? 6% |
| Response Time Black / White * (ms) | 27.9 ? | 23.2 ? 17% | 25 ? 10% | 42.4 ? -52% | 27 ? 3% |
| PWM Frequency (Hz) | 22000 ? | 25000 ? | |||
| Screen | 213% | 139% | 133% | 117% | |
| Brightness middle (cd/m²) | 211 | 632 200% | 484 129% | 474 125% | 311 47% |
| Brightness (cd/m²) | 202 | 605 200% | 473 134% | 418 107% | 278 38% |
| Brightness Distribution (%) | 86 | 91 6% | 91 6% | 76 -12% | 82 -5% |
| Black Level * (cd/m²) | 1.19 | 0.32 73% | 0.33 72% | 0.33 72% | 0.2 83% |
| Contrast (:1) | 177 | 1975 1016% | 1467 729% | 1436 711% | 1555 779% |
| Colorchecker dE 2000 * | 5.1 | 1.1 78% | 4.29 16% | 3.2 37% | 3.98 22% |
| Colorchecker dE 2000 max. * | 19 | 2.4 87% | 6.46 66% | 6.1 68% | 8.48 55% |
| Greyscale dE 2000 * | 3.1 | 1.7 45% | 4.3 -39% | 4.5 -45% | 5.57 -80% |
| Gamma | 2.26 97% | 2.21 100% | 2.51 88% | 2.07 106% | 2.51 88% |
| CCT | 6606 98% | 6794 96% | 7315 89% | 5881 111% | 7810 83% |
| Colorchecker dE 2000 calibrated * | 1.34 | 0.9 | |||
| Color Space (Percent of AdobeRGB 1998) (%) | 62 | 64 | 64 | ||
| Color Space (Percent of sRGB) (%) | 95 | 99.4 | 99 | ||
| Media totale (Programma / Settaggio) | 103% /
169% | 69% /
111% | 48% /
99% | 61% /
95% |
* ... Meglio usare valori piccoli
Tempi di risposta del Display
| ↔ Tempi di risposta dal Nero al Bianco | ||
|---|---|---|
| 27.9 ms ... aumenta ↗ e diminuisce ↘ combinato | ↗ 14.7 ms Incremento | 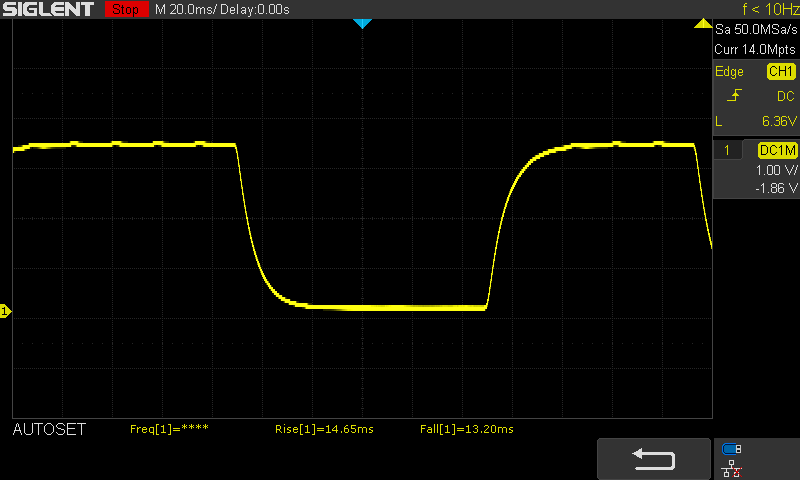 |
| ↘ 13.2 ms Calo | ||
| Lo schermo mostra tempi di risposta relativamente lenti nei nostri tests e potrebbe essere troppo lento per i gamers. In confronto, tutti i dispositivi di test variano da 0.1 (minimo) a 240 (massimo) ms. » 71 % di tutti i dispositivi è migliore. Questo significa che i tempi di risposta rilevati sono peggiori rispetto alla media di tutti i dispositivi testati (19.9 ms). | ||
| ↔ Tempo di risposta dal 50% Grigio all'80% Grigio | ||
| 38.1 ms ... aumenta ↗ e diminuisce ↘ combinato | ↗ 20.2 ms Incremento | 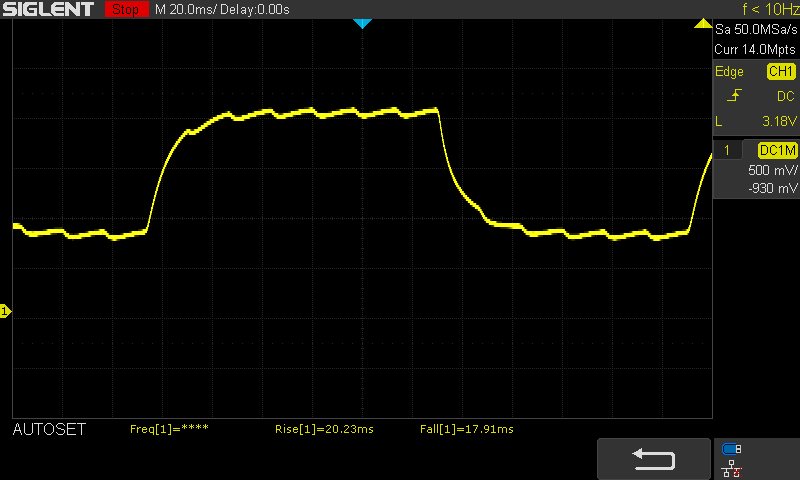 |
| ↘ 17.9 ms Calo | ||
| Lo schermo mostra tempi di risposta lenti nei nostri tests e sarà insoddisfacente per i gamers. In confronto, tutti i dispositivi di test variano da 0.165 (minimo) a 636 (massimo) ms. » 57 % di tutti i dispositivi è migliore. Questo significa che i tempi di risposta rilevati sono peggiori rispetto alla media di tutti i dispositivi testati (31.1 ms). | ||
Sfarfallio dello schermo / PWM (Pulse-Width Modulation)
| flickering dello schermo / PWM non rilevato | 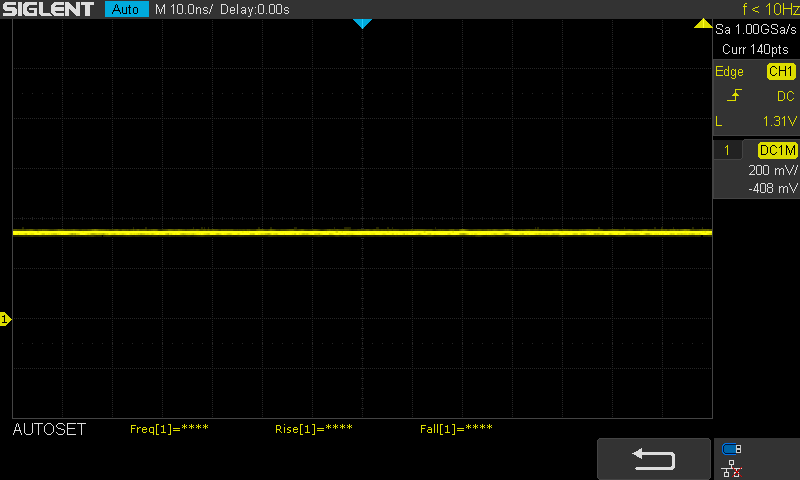 | ||
In confronto: 52 % di tutti i dispositivi testati non utilizza PWM per ridurre la luminosita' del display. Se è rilevato PWM, una media di 7798 (minimo: 5 - massimo: 343500) Hz è stata rilevata. | |||
| PCMark 8 Home Score Accelerated v2 | 4096 punti | |
| PCMark 8 Creative Score Accelerated v2 | 5177 punti | |
| PCMark 8 Work Score Accelerated v2 | 4468 punti | |
Aiuto | ||
| Wacom MobileStudio Pro 13 i7 256GB Phison SM280256GPMC15B-S10C4 | Microsoft Surface Pro 6, Core i7, 512 GB Toshiba KBG30ZPZ512G | HP Spectre x360 13-ae048ng Toshiba NVMe THNSN51T02DUK | HP ProBook x360 440 G1 Toshiba KBG30ZMV256G | Lenovo ThinkPad X1 Tablet G3-20KJ001NGE Samsung PM961 MZVLW256HEHP | Schenker Slim 14 M18 Samsung SSD 970 Pro 1TB | Media della classe Tablet | |
|---|---|---|---|---|---|---|---|
| AS SSD | -50% | -580% | 11% | 131% | 272% | 160% | |
| Seq Read (MB/s) | 519 | 1154 122% | 1574 203% | 1255 142% | 2243 332% | 2374 357% | 3327 ? 541% |
| Seq Write (MB/s) | 361 | 393.6 9% | 377.1 4% | 625 73% | 847 135% | 2243 521% | 1825 ? 406% |
| 4K Read (MB/s) | 40.12 | 34.42 -14% | 31.73 -21% | 42.09 5% | 42.48 6% | 52.5 31% | 38.7 ? -4% |
| 4K Write (MB/s) | 86.8 | 68.9 -21% | 1.73 -98% | 96.1 11% | 112.2 29% | 138.6 60% | 94.3 ? 9% |
| 4K-64 Read (MB/s) | 381.5 | 494.1 30% | 115.6 -70% | 624 64% | 741 94% | 1121 194% | 817 ? 114% |
| 4K-64 Write (MB/s) | 142.8 | 171.3 20% | 2.09 -99% | 298.3 109% | 597 318% | 1227 759% | 662 ? 364% |
| Access Time Read * (ms) | 0.123 | 0.213 -73% | 0.044 64% | 0.122 1% | 0.041 67% | 0.035 72% | 0.0745 ? 39% |
| Access Time Write * (ms) | 0.038 | 0.3 -689% | 2.391 -6192% | 0.224 -489% | 0.032 16% | 0.027 29% | 0.144 ? -279% |
| Score Read (Points) | 474 | 644 36% | 305 -36% | 791 67% | 1008 113% | 1411 198% | 1188 ? 151% |
| Score Write (Points) | 266 | 280 5% | 42 -84% | 457 72% | 794 198% | 1590 498% | 938 ? 253% |
| Score Total (Points) | 988 | 1225 24% | 455 -54% | 1634 65% | 2257 128% | 3726 277% | 2665 ? 170% |
* ... Meglio usare valori piccoli

| 3DMark 06 Standard Score | 15910 punti | |
| 3DMark Cloud Gate Standard Score | 9099 punti | |
| 3DMark Fire Strike Score | 1665 punti | |
| 3DMark Time Spy Score | 646 punti | |
Aiuto | ||
| The Witcher 3 | |
| 1024x768 The Witcher 3 low | |
| Media Intel Iris Graphics 550 (19.6 - 21.6, n=2) | |
| 1366x768 The Witcher 3 medium | |
| Media Intel Iris Graphics 550 (13.3 - 14.9, n=2) | |
| 1920x1080 The Witcher 3 high | |
| Media Intel Iris Graphics 550 (n=1) | |
| 1920x1080 The Witcher 3 ultra | |
| basso | medio | alto | ultra | QHD | 4K | |
|---|---|---|---|---|---|---|
| Counter-Strike: GO (2012) | 75.4 | 44.4 | 28.4 | |||
| X-Plane 10.25 (2013) | 30.3 | 22.7 | 19.1 | |||
| Dota 2 Reborn (2015) | 81.3 | 46.8 | 28.2 | 24.7 | ||
| World of Tanks enCore (2018) | 228 | 36.9 | 13.5 | |||
| Dirt Rally 2.0 (2019) | 47.1 | 23.7 | 17 | |||
| League of Legends (2019) | 137 | 113 | 104 | 96 | 49.5 | |
| F1 2019 (2019) | 41.7 | 18.5 |
Rumorosità
| Idle |
| 29.6 / 32.9 / 32.9 dB(A) |
| Sotto carico |
| 39.4 / 40.9 dB(A) |
 | ||
30 dB silenzioso 40 dB(A) udibile 50 dB(A) rumoroso |
||
min: | ||
(±) La temperatura massima sul lato superiore è di 40 °C / 104 F, rispetto alla media di 33.6 °C / 92 F, che varia da 20.7 a 53.2 °C per questa classe Tablet.
(±) Il lato inferiore si riscalda fino ad un massimo di 40 °C / 104 F, rispetto alla media di 33.2 °C / 92 F
(±) Riproducendo The Witcher 3, la temperatura media per il lato superiore e' di 32.2 °C / 90 F, rispetto alla media del dispositivo di 30 °C / 86 F.
Wacom MobileStudio Pro 13 i7 256GB analisi audio
(±) | potenza degli altiparlanti media ma buona (76.5 dB)
Bassi 100 - 315 Hz
(-) | quasi nessun basso - in media 20.5% inferiori alla media
(±) | la linearità dei bassi è media (12.9% delta rispetto alla precedente frequenza)
Medi 400 - 2000 Hz
(±) | medi elevati - circa 9.3% superiore alla media
(±) | linearità dei medi adeguata (14.7% delta rispetto alla precedente frequenza)
Alti 2 - 16 kHz
(±) | alti elevati - circa 6% superiori alla media
(±) | la linearità degli alti è media (10.8% delta rispetto alla precedente frequenza)
Nel complesso 100 - 16.000 Hz
(-) | suono nel complesso non lineare (36.9% di differenza rispetto alla media
Rispetto alla stessa classe
» 96% di tutti i dispositivi testati in questa classe è stato migliore, 1% simile, 2% peggiore
» Il migliore ha avuto un delta di 7%, medio di 20%, peggiore di 129%
Rispetto a tutti i dispositivi testati
» 94% di tutti i dispositivi testati in questa classe è stato migliore, 1% similare, 5% peggiore
» Il migliore ha avuto un delta di 4%, medio di 24%, peggiore di 134%
Apple MacBook 12 (Early 2016) 1.1 GHz analisi audio
(+) | gli altoparlanti sono relativamente potenti (83.6 dB)
Bassi 100 - 315 Hz
(±) | bassi ridotti - in media 11.3% inferiori alla media
(±) | la linearità dei bassi è media (14.2% delta rispetto alla precedente frequenza)
Medi 400 - 2000 Hz
(+) | medi bilanciati - solo only 2.4% rispetto alla media
(+) | medi lineari (5.5% delta rispetto alla precedente frequenza)
Alti 2 - 16 kHz
(+) | Alti bilanciati - appena 2% dalla media
(+) | alti lineari (4.5% delta rispetto alla precedente frequenza)
Nel complesso 100 - 16.000 Hz
(+) | suono nel complesso lineare (10.2% differenza dalla media)
Rispetto alla stessa classe
» 7% di tutti i dispositivi testati in questa classe è stato migliore, 2% simile, 91% peggiore
» Il migliore ha avuto un delta di 5%, medio di 18%, peggiore di 53%
Rispetto a tutti i dispositivi testati
» 5% di tutti i dispositivi testati in questa classe è stato migliore, 1% similare, 94% peggiore
» Il migliore ha avuto un delta di 4%, medio di 24%, peggiore di 134%
| Off / Standby | |
| Idle | |
| Sotto carico |
|
Leggenda:
min: | |
| Wacom MobileStudio Pro 13 i7 256GB 6567U, Iris Graphics 550, Phison SM280256GPMC15B-S10C4, IPS, 2560x1440, 13.3" | Microsoft Surface Pro 6, Core i7, 512 GB i7-8650U, UHD Graphics 620, Toshiba KBG30ZPZ512G, IPS, 2736x1824, 12.3" | Apple iPad Pro 12.9 2018 A12X Bionic, A12X Bionic GPU, 256 GB NVMe, IPS, 2732x2048, 12.9" | HP Spectre x360 13-ae048ng i5-8550U, UHD Graphics 620, Toshiba NVMe THNSN51T02DUK, IPS, 1920x1080, 13.3" | Microsoft Surface Book 2 i7-8650U, GeForce GTX 1050 Mobile, Samsung PM961 MZVLW256HEHP, IPS, 3000x2000, 13.5" | Media Intel Iris Graphics 550 | Media della classe Tablet | |
|---|---|---|---|---|---|---|---|
| Power Consumption | 43% | 61% | 50% | -4% | 24% | 76% | |
| Idle Minimum * (Watt) | 10.3 | 3.2 69% | 1.42 86% | 3.2 69% | 4.7 54% | 6.72 ? 35% | 2.15 ? 79% |
| Idle Average * (Watt) | 13 | 8.7 33% | 9.35 28% | 6 54% | 10.6 18% | 9.79 ? 25% | 4 ? 69% |
| Idle Maximum * (Watt) | 15.1 | 10.4 31% | 9.38 38% | 9.2 39% | 12.3 19% | 11.1 ? 26% | 4.39 ? 71% |
| Load Average * (Watt) | 54 | 29.2 46% | 12.75 76% | 29.5 45% | 81 -50% | 46.8 ? 13% | 8.53 ? 84% |
| Load Maximum * (Watt) | 63 | 40.8 35% | 14.96 76% | 35.6 43% | 100.3 -59% | 50 ? 21% | 13.4 ? 79% |
| Witcher 3 ultra * (Watt) | 97 |
* ... Meglio usare valori piccoli
| Wacom MobileStudio Pro 13 i7 256GB 6567U, Iris Graphics 550, 52 Wh | Microsoft Surface Pro 6, Core i7, 512 GB i7-8650U, UHD Graphics 620, 45 Wh | HP Spectre x360 13-ae048ng i5-8550U, UHD Graphics 620, 60 Wh | Apple iPad Pro 12.9 2018 A12X Bionic, A12X Bionic GPU, 36.71 Wh | Media della classe Tablet | |
|---|---|---|---|---|---|
| Autonomia della batteria | 174% | 184% | 329% | 410% | |
| WiFi v1.3 (h) | 3.1 | 8.5 174% | 8.8 184% | 13.3 329% | 15.8 ? 410% |
| Reader / Idle (h) | 18.1 | 31.5 | 31 ? | ||
| Load (h) | 2.2 | 2.8 | 3.1 | 4.15 ? | |
| H.264 (h) | 17.8 | 15 | 16.9 ? |
Pro
Contro
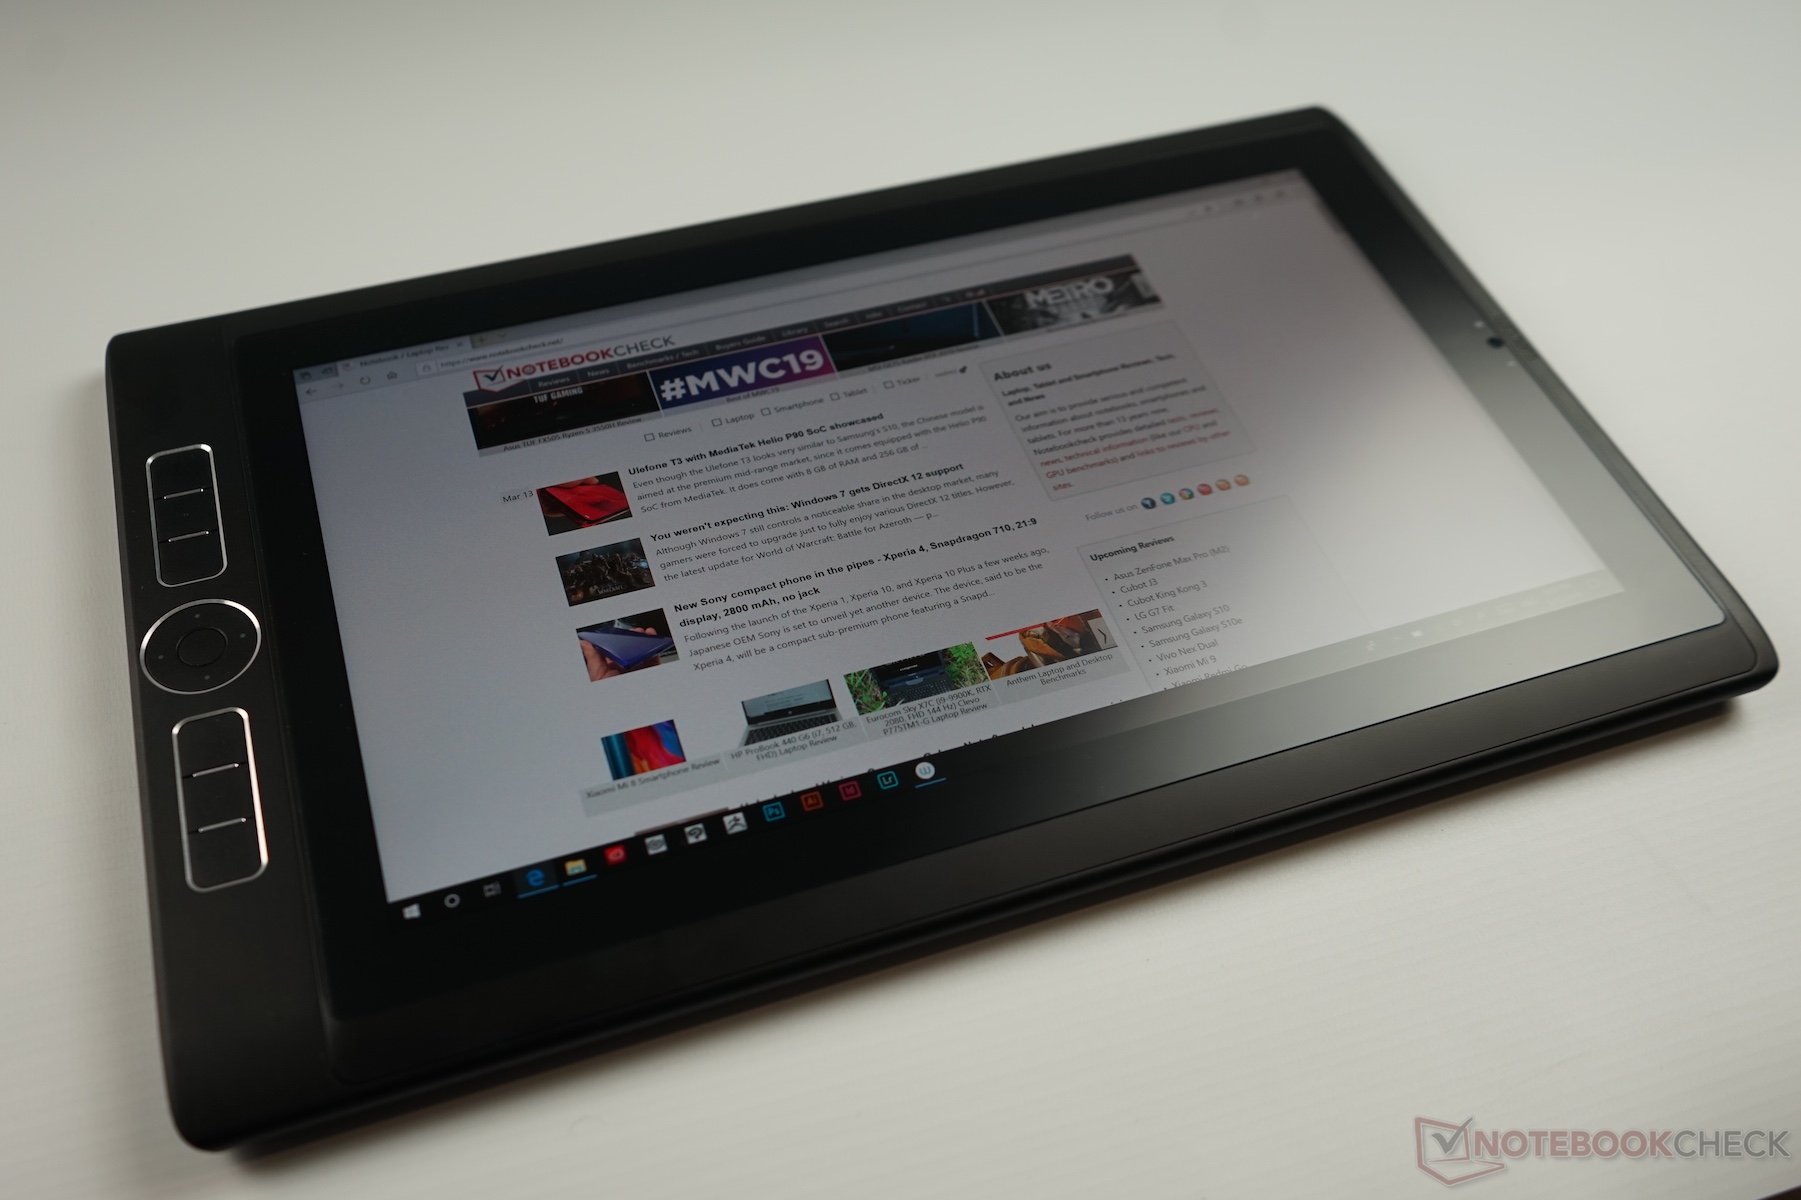
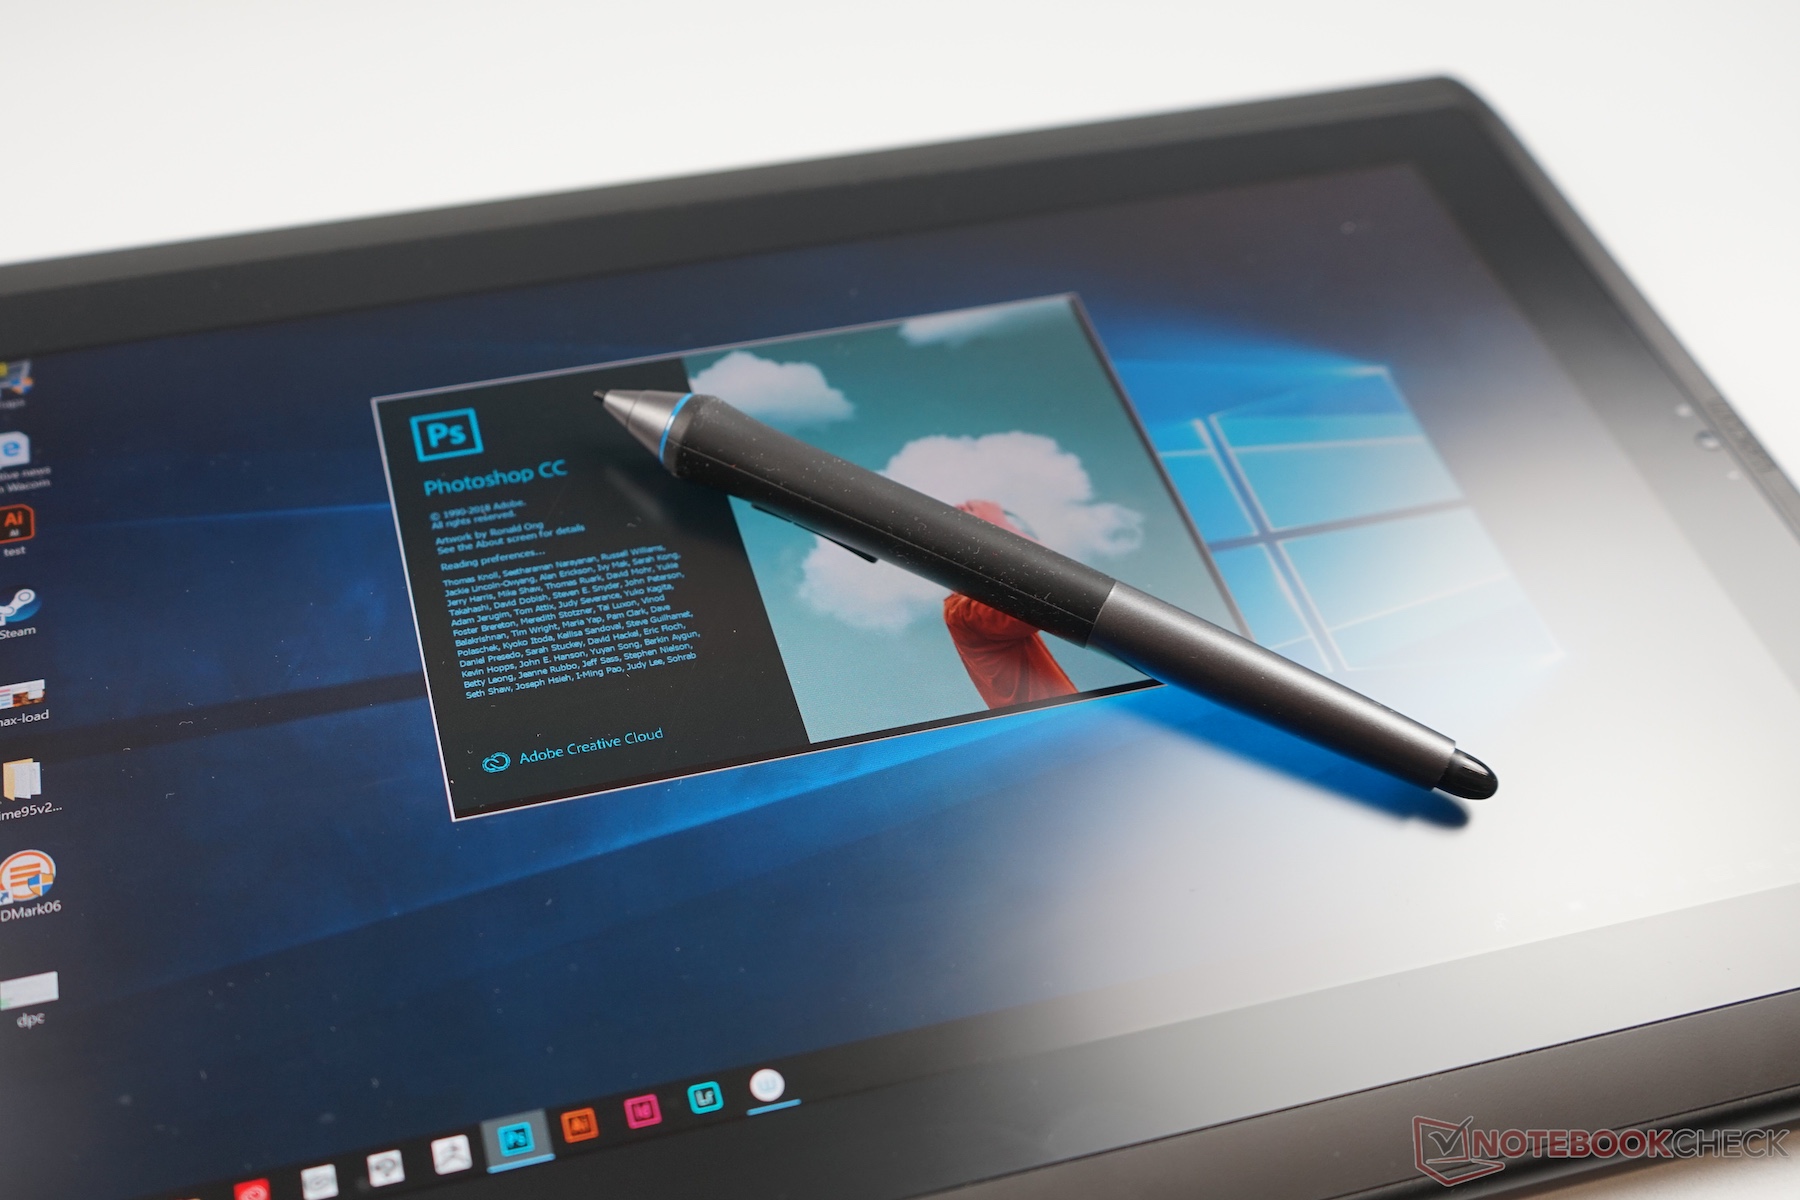
Per quanto il Wacom MobileStudio Pro 13 ci abbia impressionato nei nostri test con lapenna digitale, delude sotto quasi tutti gli altri aspetti. La ventola funziona costantemente, mentre la durata della batteria è a dir poco orribile. Inoltre, lo schermo è scuro e la precisione del colore è deludente per un dispositivo professionale.
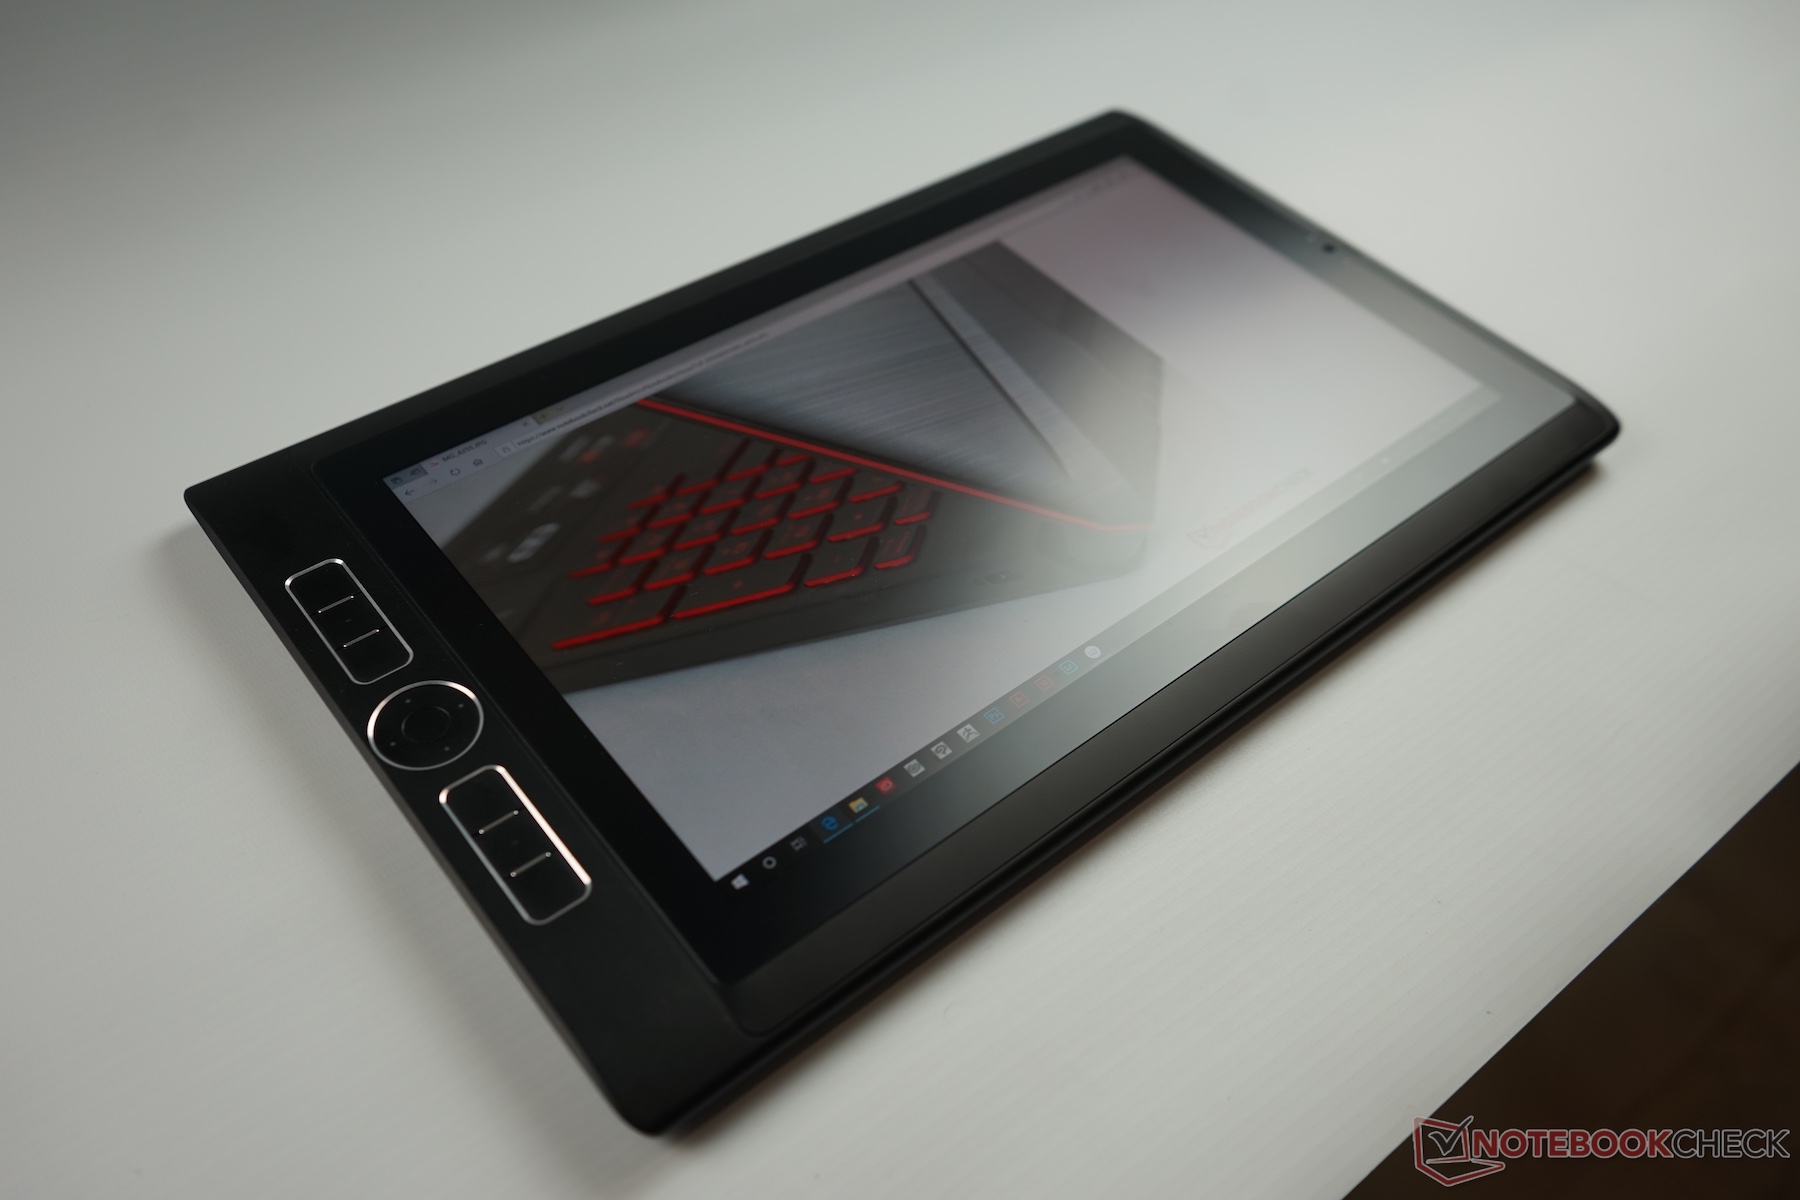
Il Wacom MobileStudio Pro 13 ha un eccellente supporto per la penna e la sua flessibilità come monitor esterno o dispositivo di disegno dedicato è ottima, ma è ben al di sotto di altri dispositivi in tutti gli altri settori.
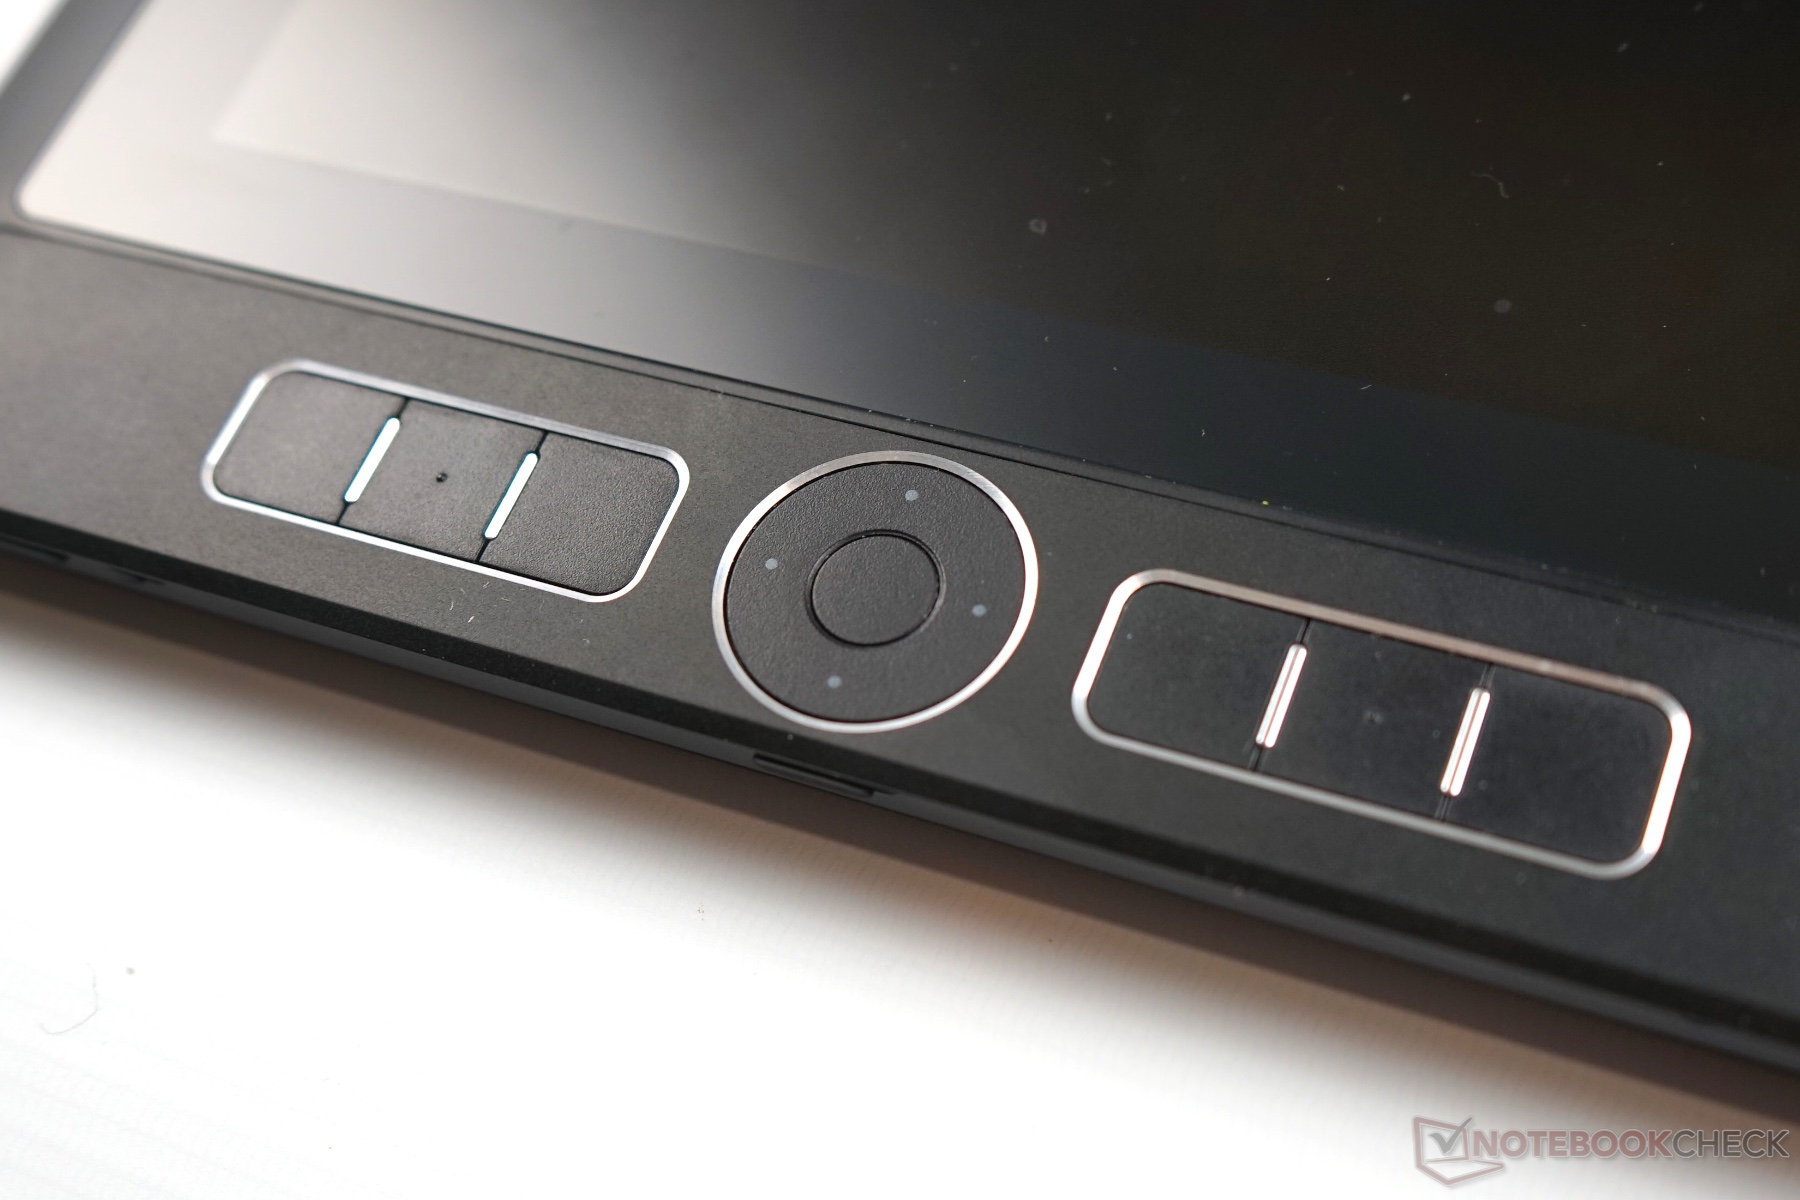
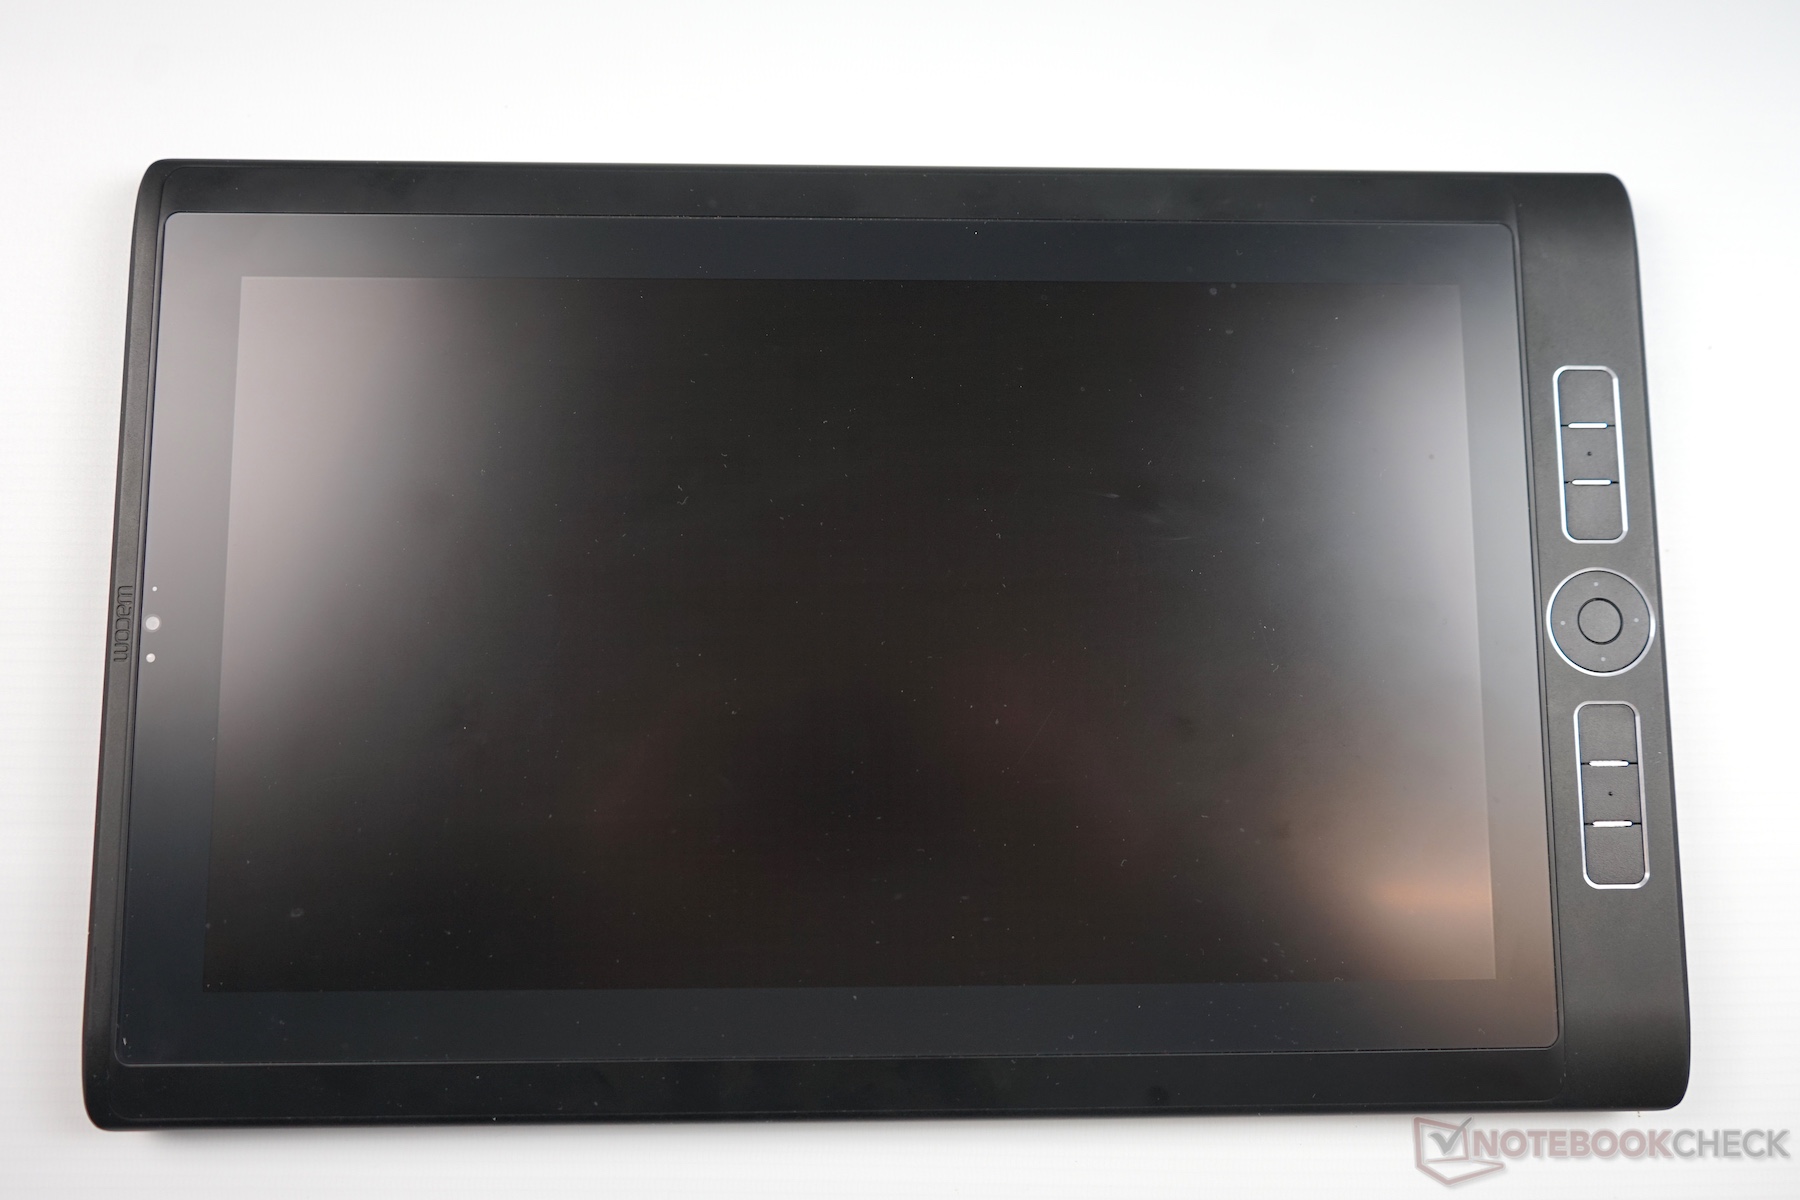
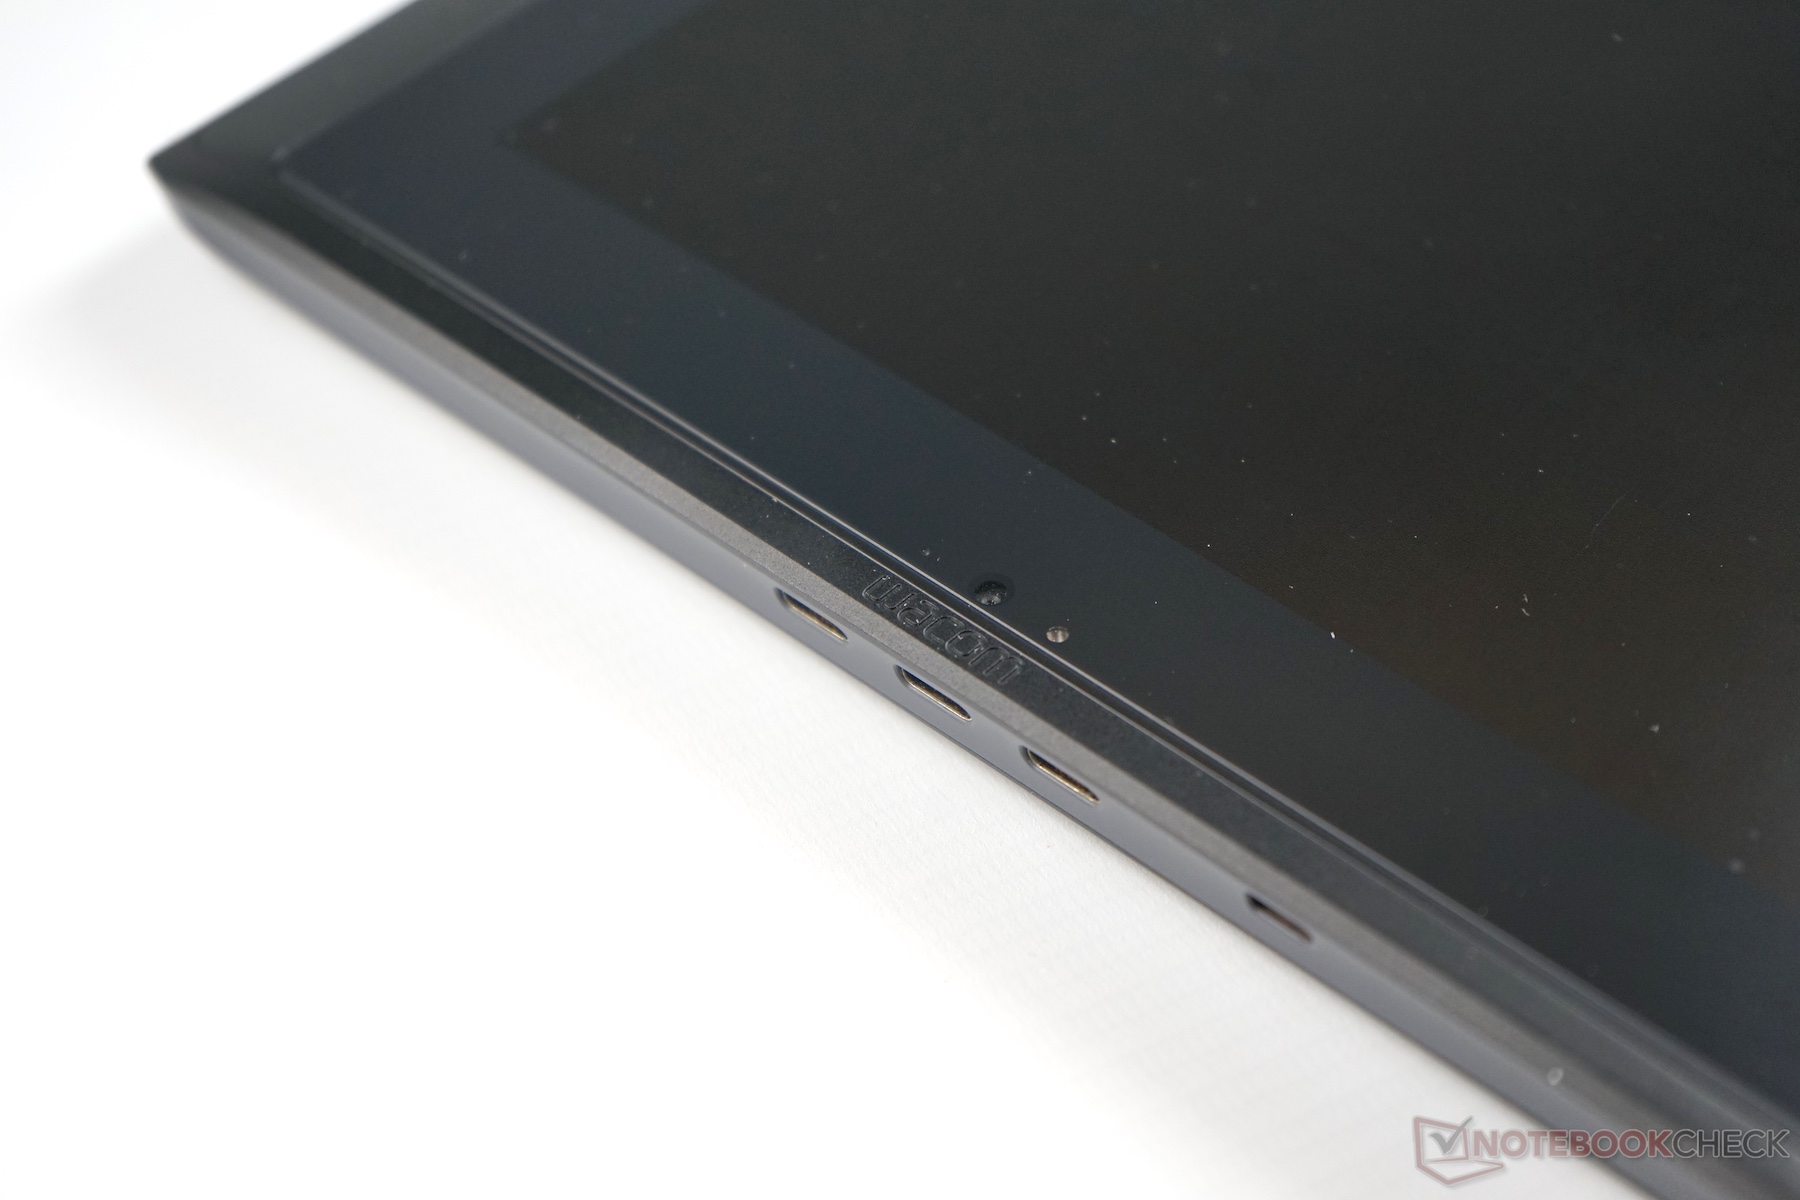
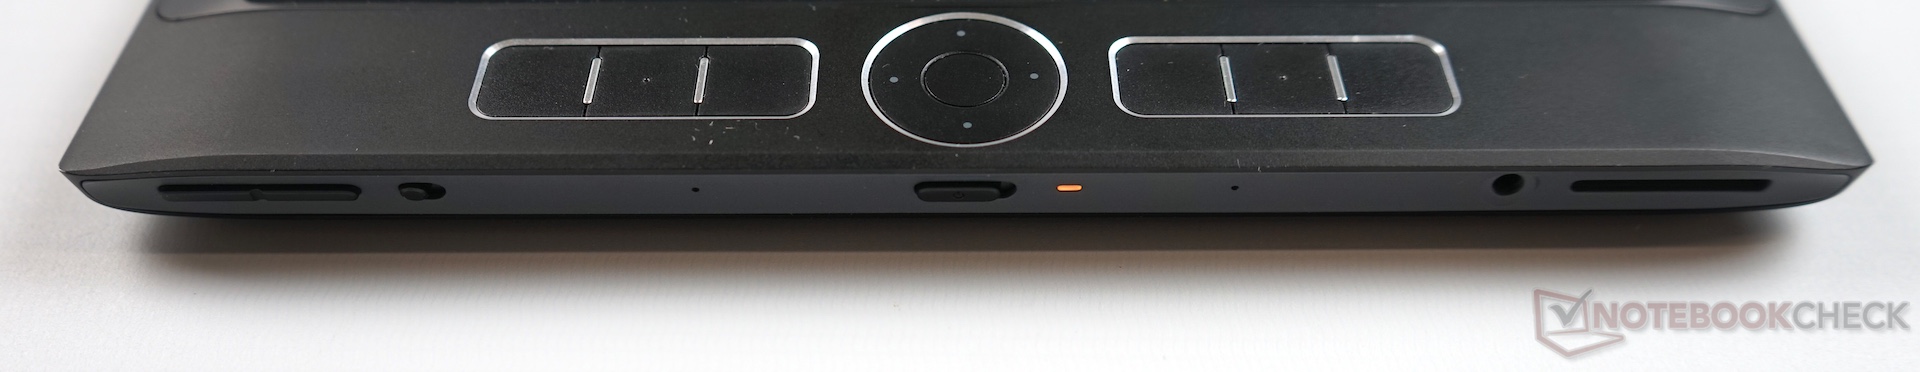
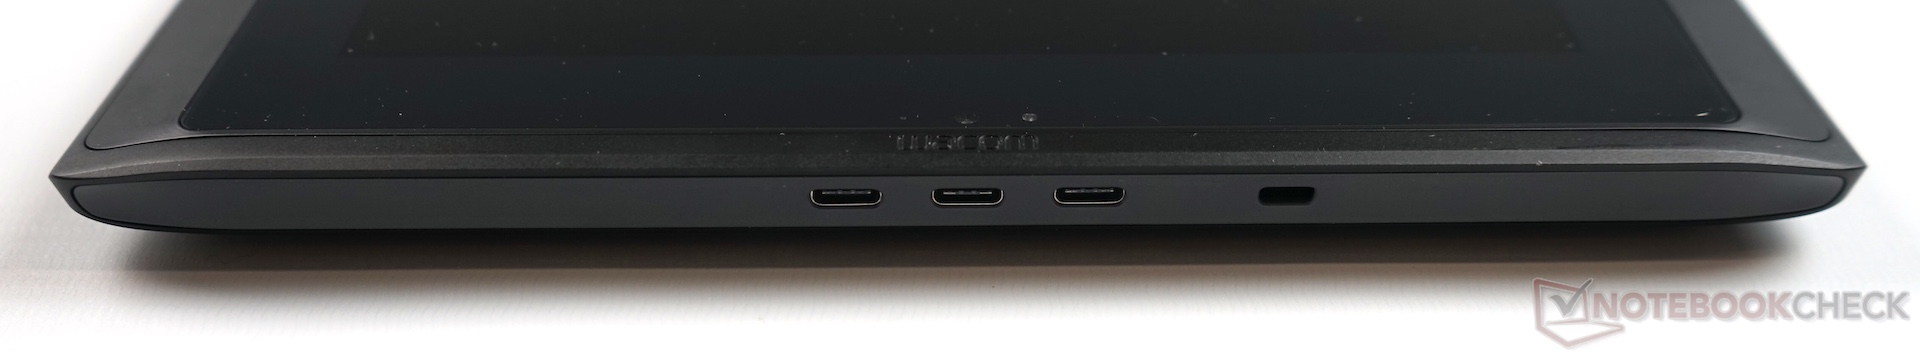
Wacom continua a dotare il tablet anche di hardware obsoleto. Anche se in genere funziona bene, è inaccettabile che l'azienda continui a chiedere un prezzo così alto per quello che oggi è un tablet sottoalimentato rispetto ai suoi colleghi. Detto questo, ci piace che ci sono tre porte USB Type-C e i pulsanti fisici sono utili. In breve, il MobileStudio Pro 13 può essere un tablet dedicato ai un graphic designers, ma ha davvero bisogno di un aggiornamento.
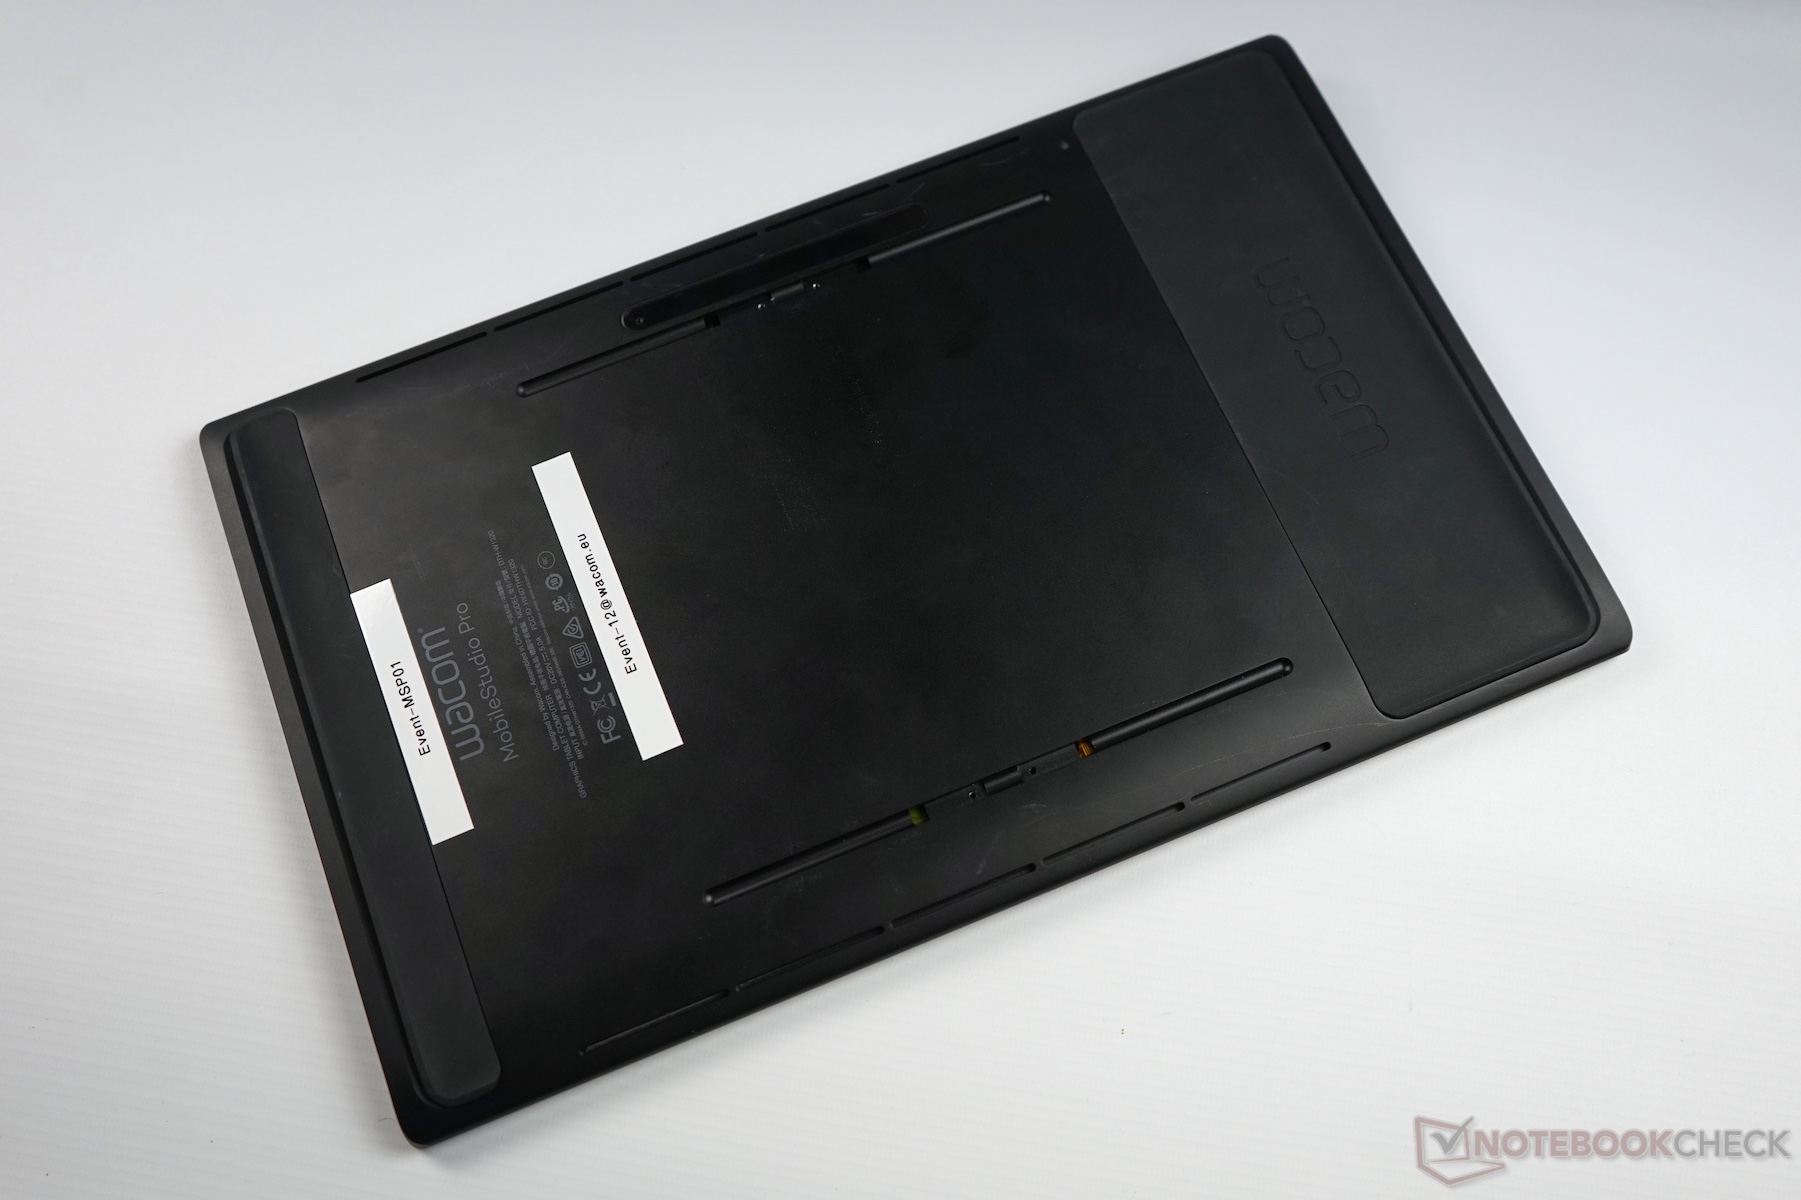
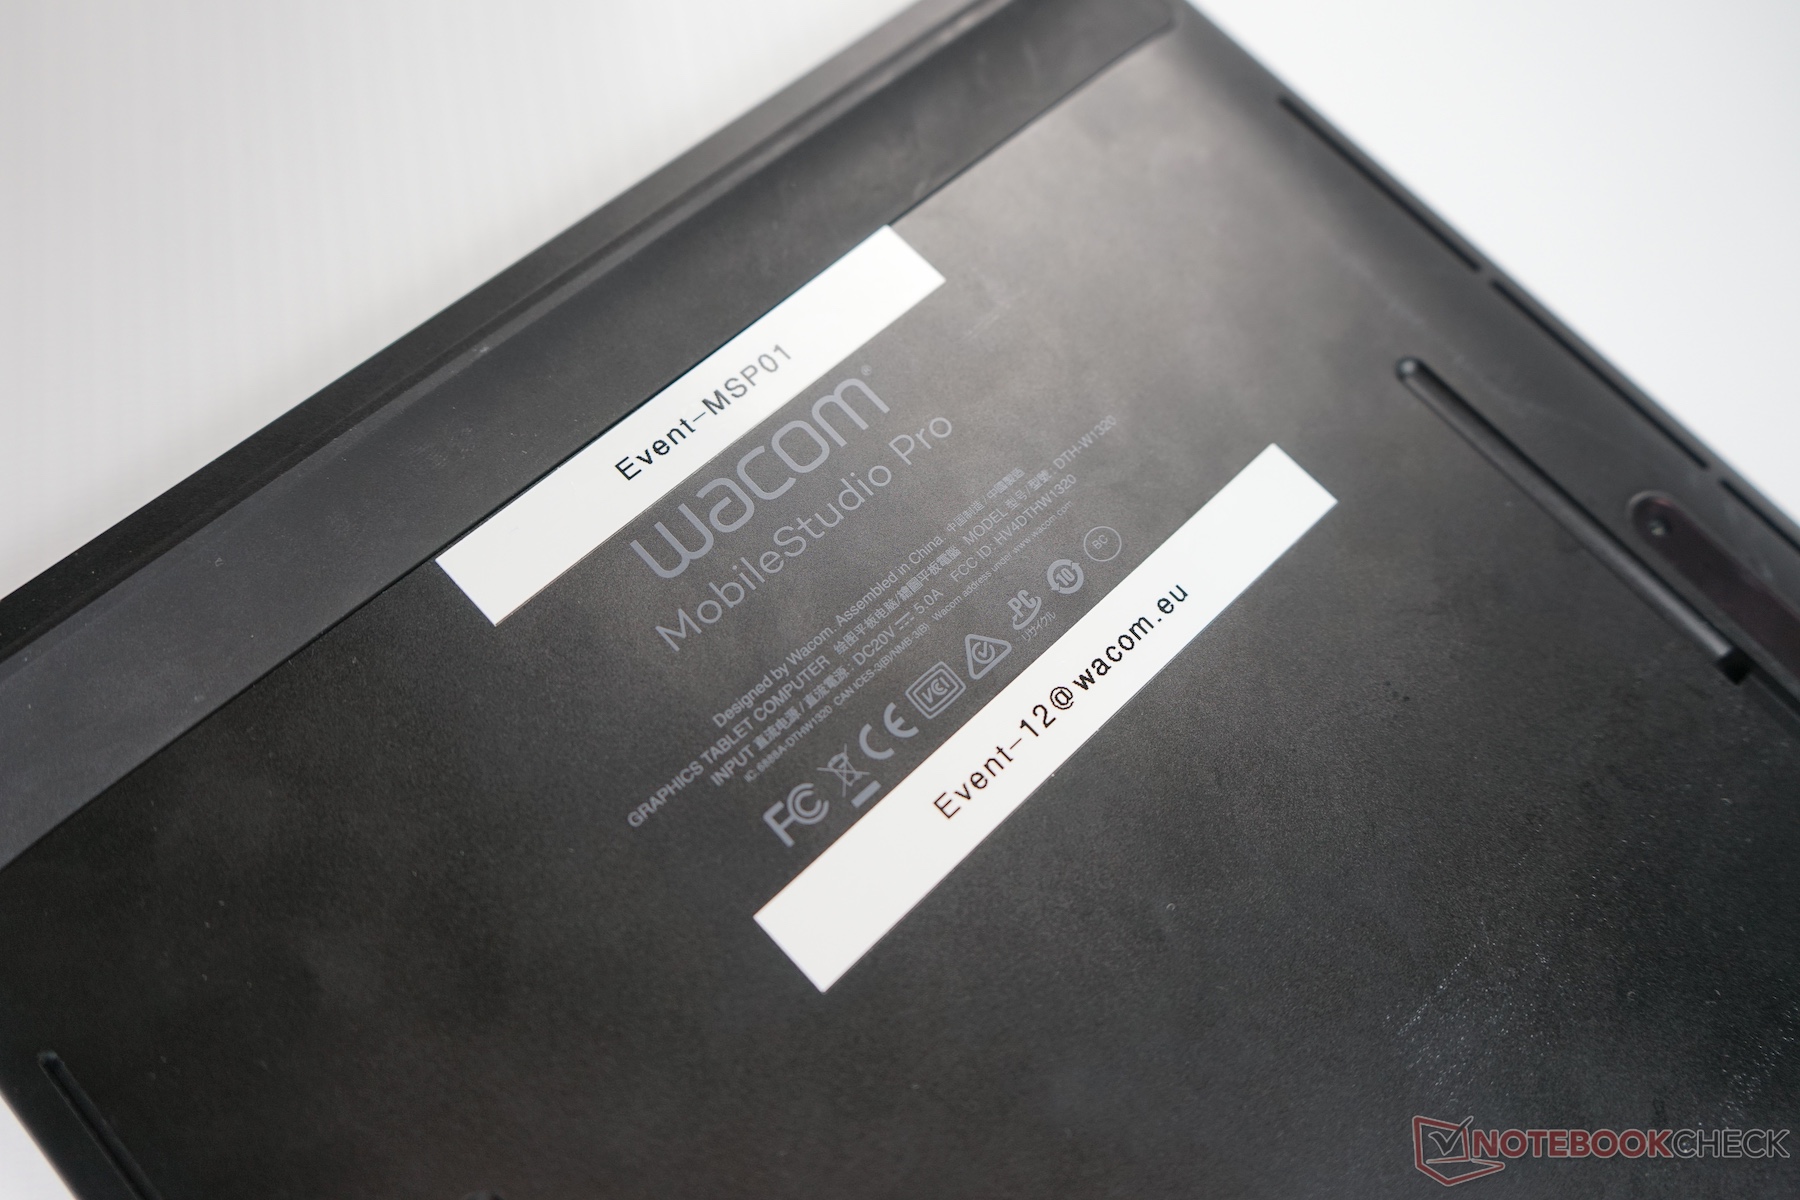
Wacom MobileStudio Pro 13 i7 256GB
- 03/14/2019 v6 (old)
Klaus Hinum
Price comparison
