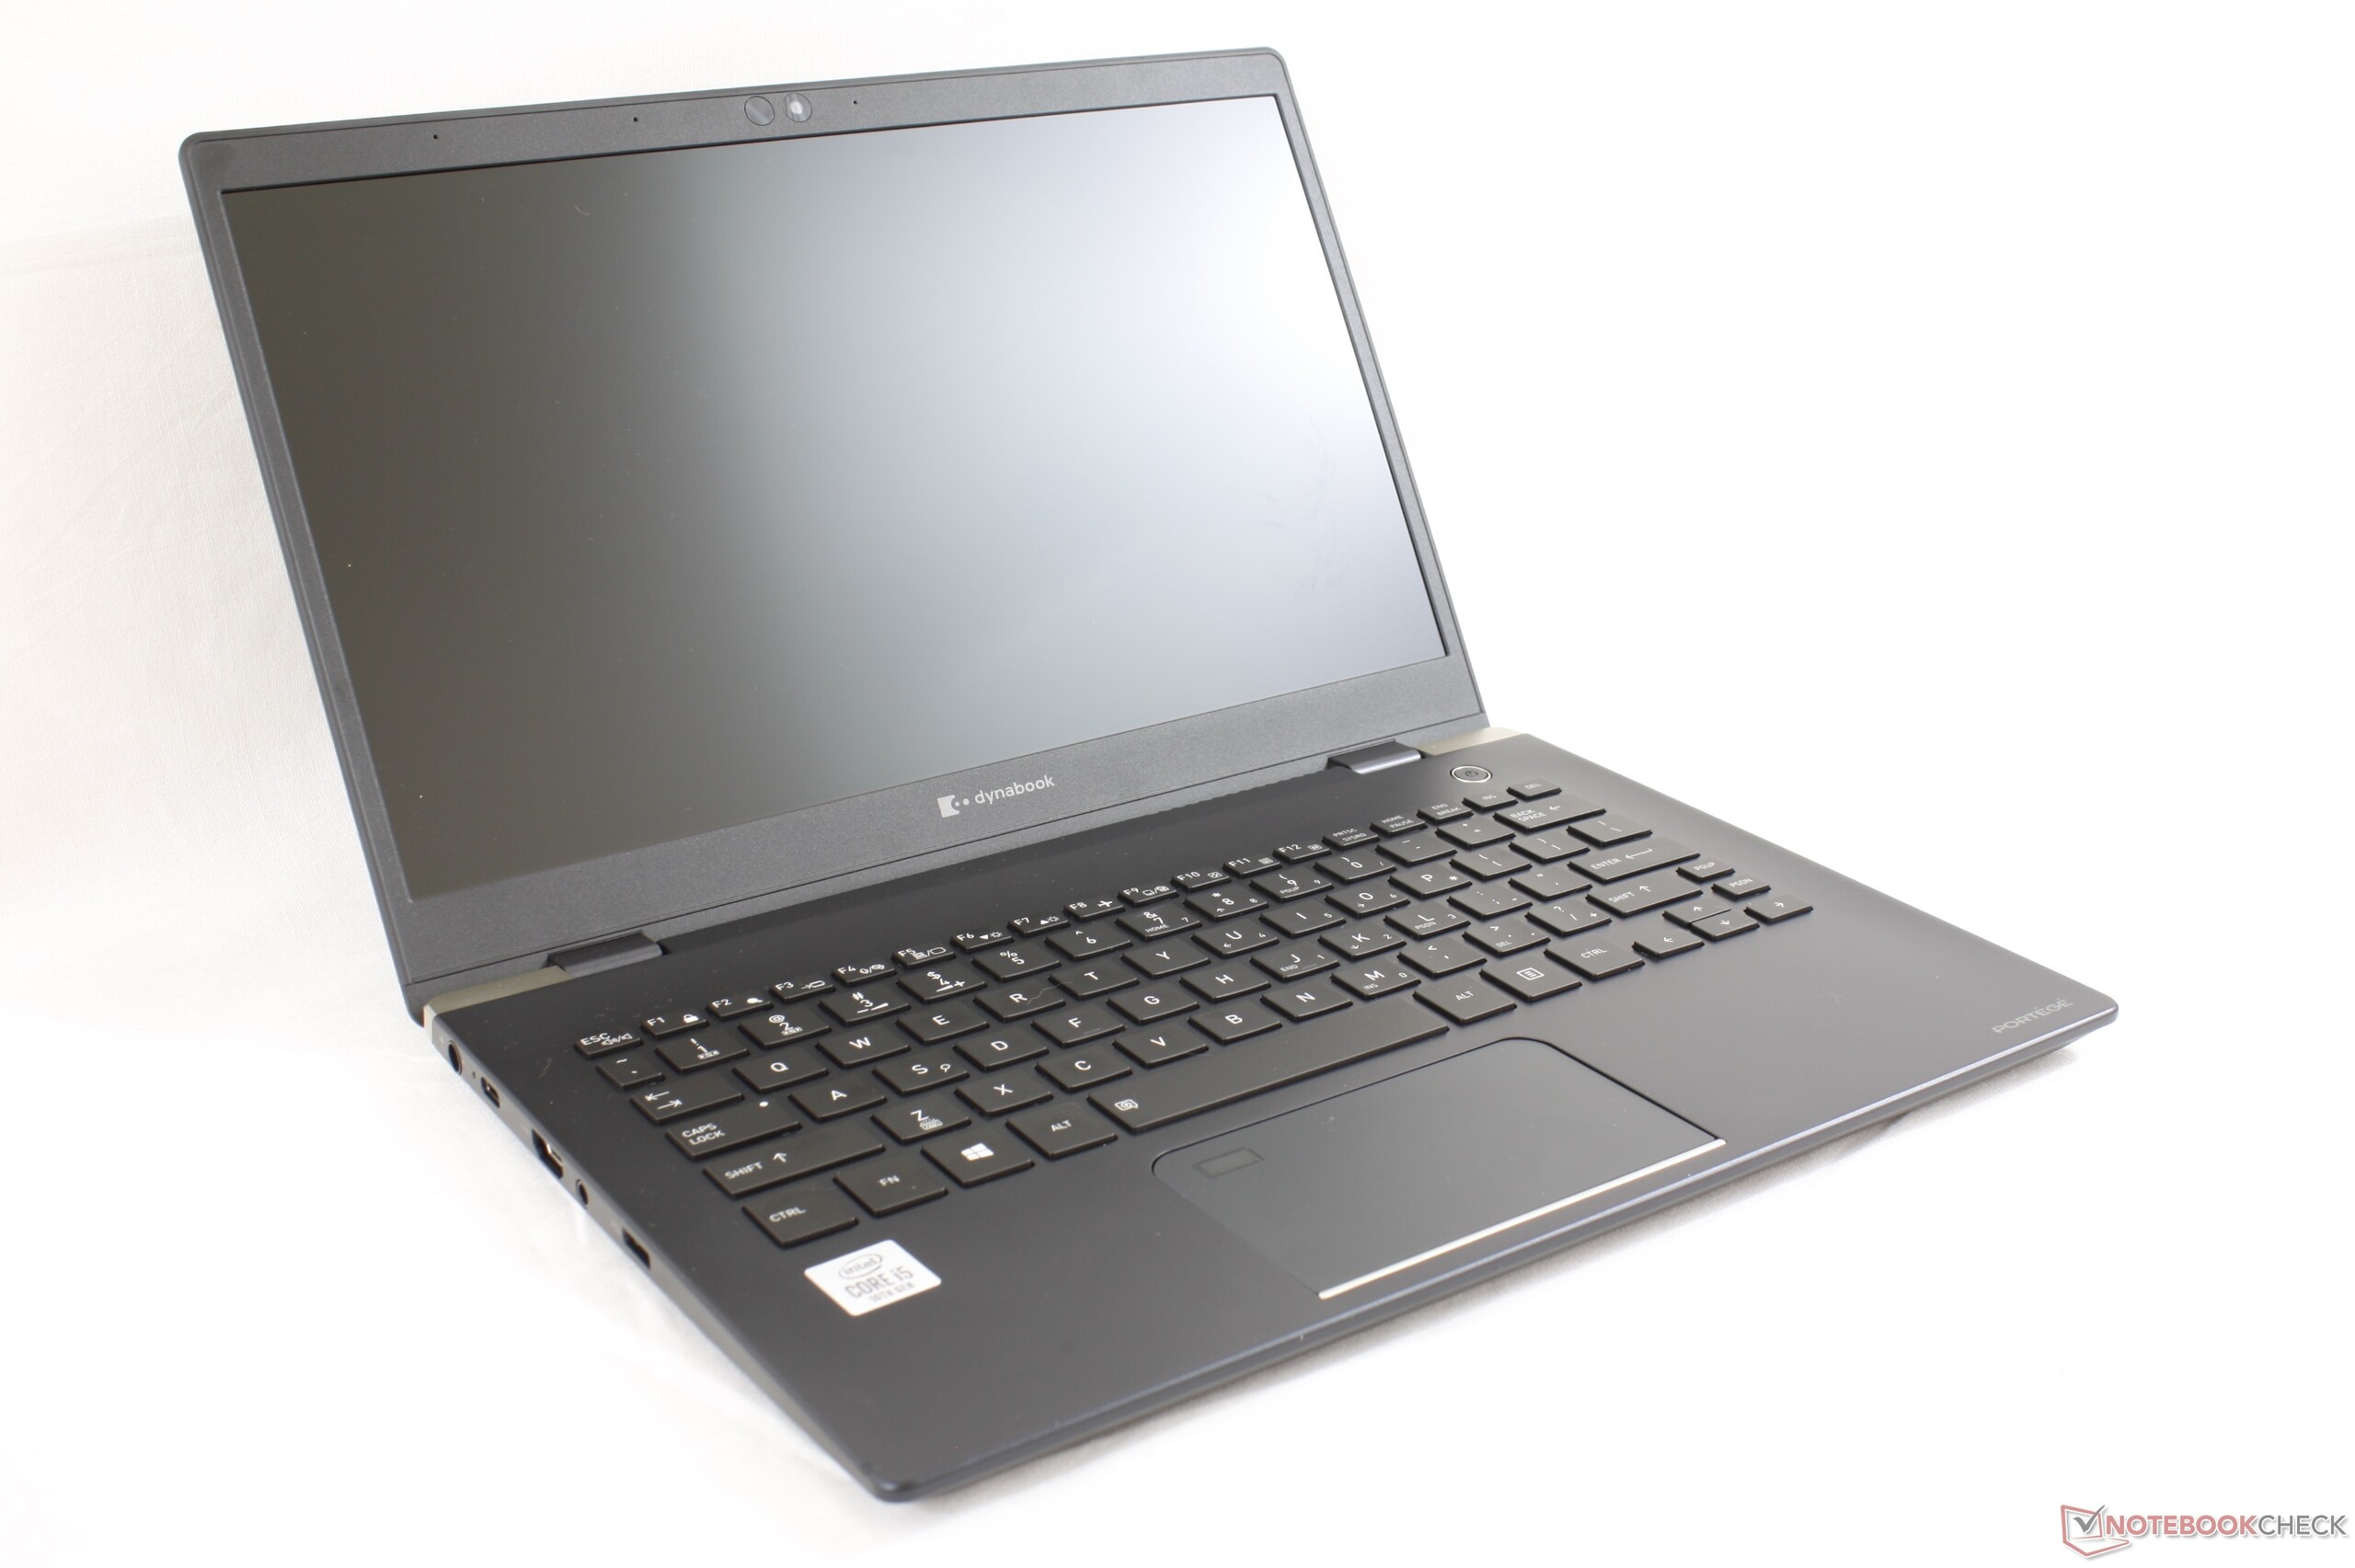
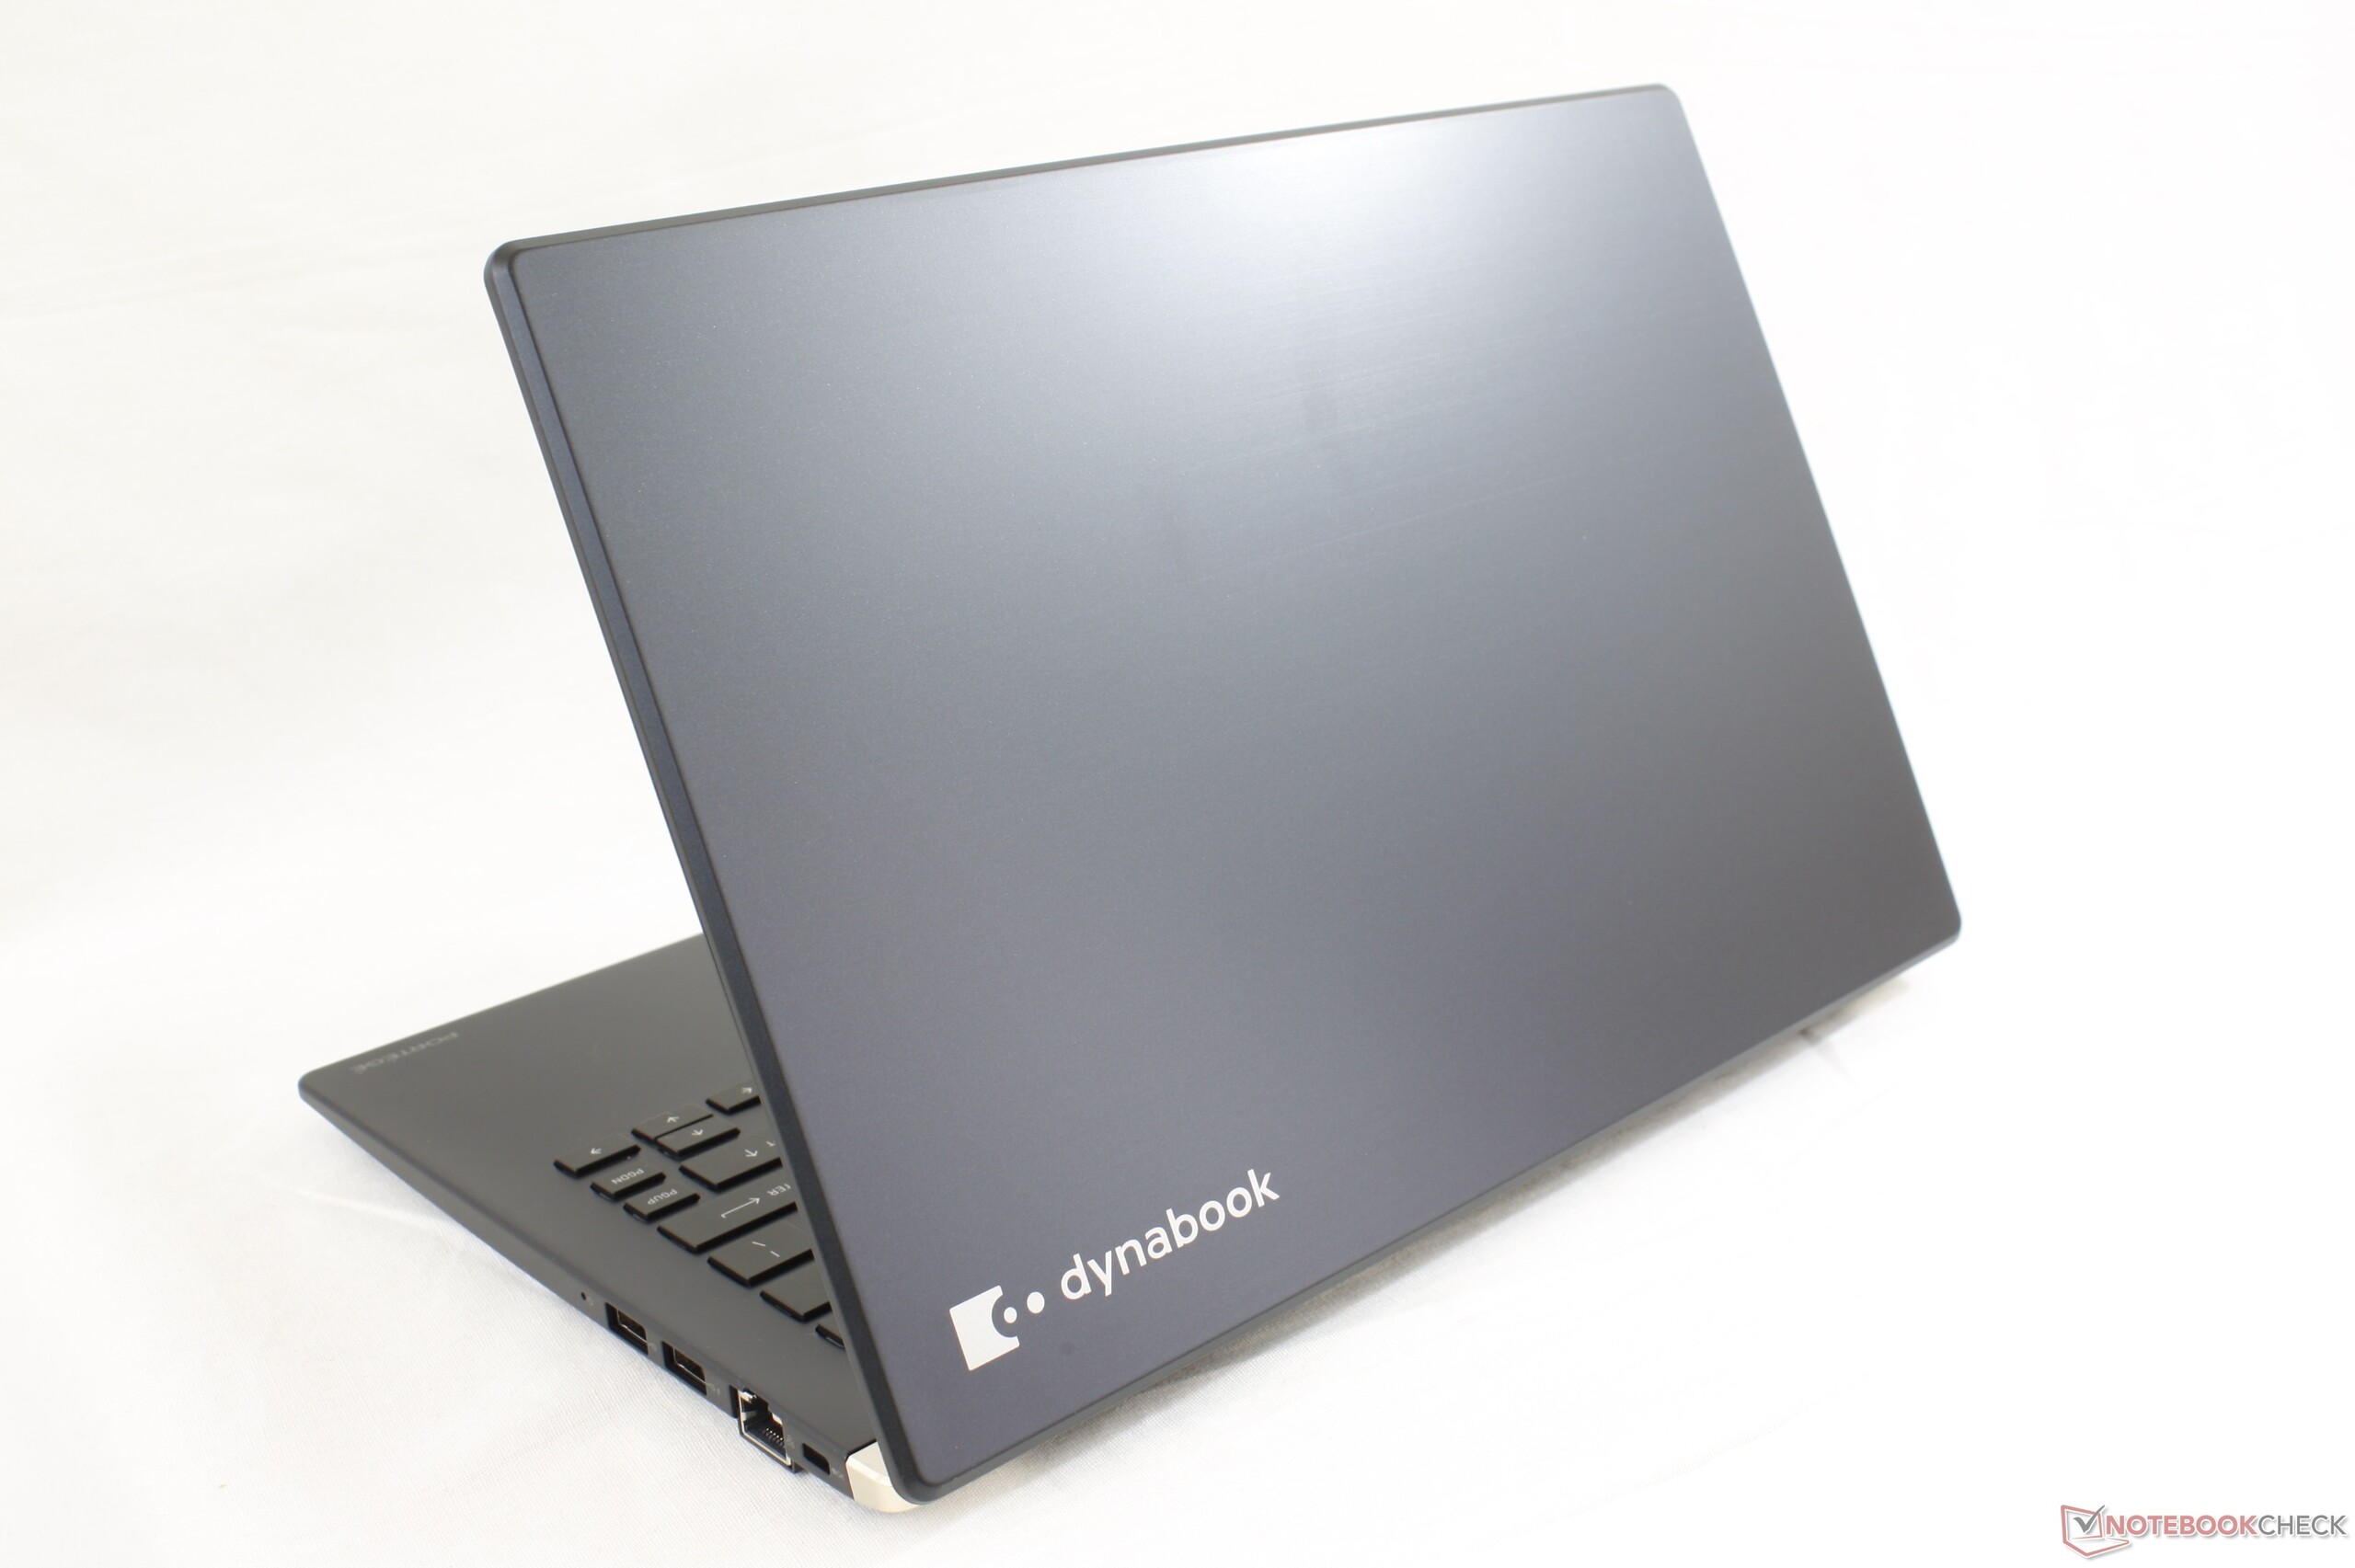
Recensione del Laptop Dynabook Portege X30L-G: un nuovo e leggero punto di riferimento
Punteggio | Data | Modello | Peso | Altezza | Dimensione | Risoluzione | Prezzo |
|---|---|---|---|---|---|---|---|
| 85.1 % v7 (old) | 05/2020 | Dynabook Portege X30L-G1331 i5-10210U, UHD Graphics 620 | 859 gr | 17.9 mm | 13.30" | 1920x1080 | |
| 88.9 % v7 (old) | 03/2020 | Dell XPS 13 9300 Core i7-1065G7 i7-1065G7, Iris Plus Graphics G7 (Ice Lake 64 EU) | 1.2 kg | 14.8 mm | 13.40" | 1920x1200 | |
| 81.9 % v6 (old) | 04/2018 | LG Gram 13Z980-A i5-8250U, UHD Graphics 620 | 965 gr | 15 mm | 13.30" | 1920x1080 | |
| 86 % v7 (old) | 08/2019 | Lenovo ThinkBook 13s-20R90071GE i5-8265U, UHD Graphics 620 | 1.3 kg | 15.9 mm | 13.30" | 1920x1080 | |
| 88.2 % v6 (old) | 05/2018 | HP EliteBook 830 G5-3JX74EA i5-8550U, UHD Graphics 620 | 1.3 kg | 17.7 mm | 13.30" | 1920x1080 |
| SD Card Reader | |
| average JPG Copy Test (av. of 3 runs) | |
| HP EliteBook 1050 G1-4QY20EA (Toshiba Exceria Pro SDXC 64 GB UHS-II) | |
| Dell XPS 13 9300 Core i7-1065G7 (Toshiba Exceria Pro M501 64 GB UHS-II) | |
| Dynabook Portege X30L-G1331 (Toshiba Exceria Pro M501 64 GB UHS-II) | |
| LG Gram 13Z980-A (Toshiba Exceria Pro M501 UHS-II) | |
| maximum AS SSD Seq Read Test (1GB) | |
| HP EliteBook 1050 G1-4QY20EA (Toshiba Exceria Pro SDXC 64 GB UHS-II) | |
| Dell XPS 13 9300 Core i7-1065G7 (Toshiba Exceria Pro M501 64 GB UHS-II) | |
| LG Gram 13Z980-A (Toshiba Exceria Pro M501 UHS-II) | |
| Dynabook Portege X30L-G1331 (Toshiba Exceria Pro M501 64 GB UHS-II) | |


| |||||||||||||||||||||||||
Distribuzione della luminosità: 91 %
Al centro con la batteria: 482 cd/m²
Contrasto: 1205:1 (Nero: 0.4 cd/m²)
ΔE ColorChecker Calman: 1.85 | ∀{0.5-29.43 Ø4.73}
calibrated: 1.2
ΔE Greyscale Calman: 2 | ∀{0.09-98 Ø4.97}
97.7% sRGB (Argyll 1.6.3 3D)
62.5% AdobeRGB 1998 (Argyll 1.6.3 3D)
67.8% AdobeRGB 1998 (Argyll 3D)
97.6% sRGB (Argyll 3D)
66.9% Display P3 (Argyll 3D)
Gamma: 2.1
CCT: 6822 K
| Dynabook Portege X30L-G1331 Toshiba TOS508F, IPS, 13.3", 1920x1080 | Dell XPS 13 9300 Core i7-1065G7 Sharp LQ134N1, IPS, 13.4", 1920x1200 | LG Gram 13Z980-A LG LP133WF6-SPC1, IPS, 13.3", 1920x1080 | Apple MacBook Pro 13 2019 2TB3 APPA03D, IPS, 13.3", 2560x1600 | Lenovo ThinkBook 13s-20R90071GE N133HCE-EN2, a-Si IPS LED, 13.3", 1920x1080 | HP EliteBook 830 G5-3JX74EA IVO M133NVF3-R0, IPS LED, 13.3", 1920x1080 | |
|---|---|---|---|---|---|---|
| Display | 0% | 0% | 24% | 1% | -6% | |
| Display P3 Coverage (%) | 66.9 | 66.3 -1% | 66.9 0% | 96.1 44% | 67 0% | 64.2 -4% |
| sRGB Coverage (%) | 97.6 | 97.3 0% | 97.3 0% | 99.4 2% | 99.1 2% | 89.2 -9% |
| AdobeRGB 1998 Coverage (%) | 67.8 | 68.5 1% | 67.9 0% | 85.6 26% | 69.2 2% | 65.2 -4% |
| Response Times | 8% | 27% | 5% | 23% | 32% | |
| Response Time Grey 50% / Grey 80% * (ms) | 54.8 ? | 50 ? 9% | 37.6 ? 31% | 50.4 ? 8% | 40.4 ? 26% | 36 ? 34% |
| Response Time Black / White * (ms) | 35.6 ? | 33.2 ? 7% | 27.6 ? 22% | 35.2 ? 1% | 28.8 ? 19% | 24.8 ? 30% |
| PWM Frequency (Hz) | 23810 ? | 2500 ? | 116300 ? | 25000 ? | 1020 ? | |
| Screen | -30% | -37% | 16% | -19% | -66% | |
| Brightness middle (cd/m²) | 482 | 607.6 26% | 347.8 -28% | 603 25% | 319 -34% | 316 -34% |
| Brightness (cd/m²) | 452 | 595 32% | 331 -27% | 577 28% | 309 -32% | 326 -28% |
| Brightness Distribution (%) | 91 | 96 5% | 89 -2% | 92 1% | 92 1% | 85 -7% |
| Black Level * (cd/m²) | 0.4 | 0.4 -0% | 0.36 10% | 0.35 13% | 0.28 30% | 0.19 52% |
| Contrast (:1) | 1205 | 1519 26% | 966 -20% | 1723 43% | 1139 -5% | 1663 38% |
| Colorchecker dE 2000 * | 1.85 | 3.23 -75% | 2.37 -28% | 1.7 8% | 2.4 -30% | 4.5 -143% |
| Colorchecker dE 2000 max. * | 3.08 | 8.67 -181% | 4.21 -37% | 3.1 -1% | 6.3 -105% | 12.1 -293% |
| Colorchecker dE 2000 calibrated * | 1.2 | 1.01 16% | 4.21 -251% | 0.7 42% | 0.6 50% | 2.9 -142% |
| Greyscale dE 2000 * | 2 | 5.5 -175% | 2.5 -25% | 2.1 -5% | 3.8 -90% | 5 -150% |
| Gamma | 2.1 105% | 2.12 104% | 2.15 102% | 2.18 101% | 2.16 102% | 2.22 99% |
| CCT | 6822 95% | 6413 101% | 6384 102% | 6843 95% | 7335 89% | 6018 108% |
| Color Space (Percent of AdobeRGB 1998) (%) | 62.5 | 63 1% | 62.5 0% | 76.7 23% | 63.5 2% | 57.9 -7% |
| Color Space (Percent of sRGB) (%) | 97.7 | 97.5 0% | 97 -1% | 99.4 2% | 99.1 1% | 87.3 -11% |
| Media totale (Programma / Settaggio) | -7% /
-19% | -3% /
-22% | 15% /
16% | 2% /
-10% | -13% /
-42% |
* ... Meglio usare valori piccoli
Tempi di risposta del Display
| ↔ Tempi di risposta dal Nero al Bianco | ||
|---|---|---|
| 35.6 ms ... aumenta ↗ e diminuisce ↘ combinato | ↗ 19.2 ms Incremento | 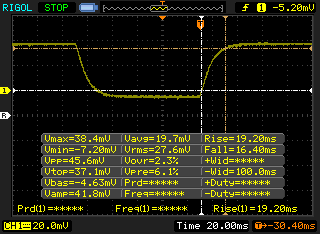 |
| ↘ 16.4 ms Calo | ||
| Lo schermo mostra tempi di risposta lenti nei nostri tests e sarà insoddisfacente per i gamers. In confronto, tutti i dispositivi di test variano da 0.1 (minimo) a 240 (massimo) ms. » 93 % di tutti i dispositivi è migliore. Questo significa che i tempi di risposta rilevati sono peggiori rispetto alla media di tutti i dispositivi testati (19.9 ms). | ||
| ↔ Tempo di risposta dal 50% Grigio all'80% Grigio | ||
| 54.8 ms ... aumenta ↗ e diminuisce ↘ combinato | ↗ 26 ms Incremento | 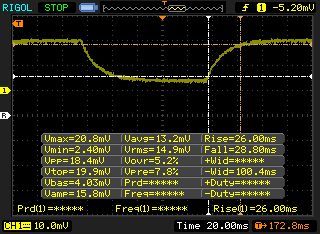 |
| ↘ 28.8 ms Calo | ||
| Lo schermo mostra tempi di risposta lenti nei nostri tests e sarà insoddisfacente per i gamers. In confronto, tutti i dispositivi di test variano da 0.165 (minimo) a 636 (massimo) ms. » 91 % di tutti i dispositivi è migliore. Questo significa che i tempi di risposta rilevati sono peggiori rispetto alla media di tutti i dispositivi testati (31.1 ms). | ||
Sfarfallio dello schermo / PWM (Pulse-Width Modulation)
| flickering dello schermo / PWM rilevato | 23810 Hz | ≤ 24 % settaggio luminosita' | 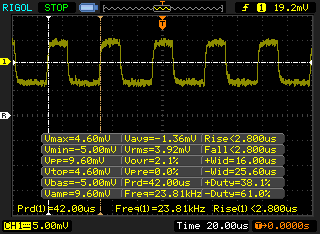 |
Il display sfarfalla a 23810 Hz (Probabilmente a causa dell'uso di PWM) Flickering rilevato ad una luminosita' di 24 % o inferiore. Non dovrebbe verificarsi flickering o PWM sopra questo valore di luminosita'. La frequenza di 23810 Hz è abbastanza alta, quindi la maggioranza degli utenti sensibili al PWM non dovrebbero notare alcun flickering. In confronto: 52 % di tutti i dispositivi testati non utilizza PWM per ridurre la luminosita' del display. Se è rilevato PWM, una media di 7784 (minimo: 5 - massimo: 343500) Hz è stata rilevata. | |||
Cinebench R15: CPU Multi 64Bit | CPU Single 64Bit
Blender: v2.79 BMW27 CPU
7-Zip 18.03: 7z b 4 -mmt1 | 7z b 4
Geekbench 5.5: Single-Core | Multi-Core
HWBOT x265 Benchmark v2.2: 4k Preset
LibreOffice : 20 Documents To PDF
R Benchmark 2.5: Overall mean
| Blender / v2.79 BMW27 CPU | |
| Dell Latitude 13 3390 | |
| Dynabook Portege X30L-G1331 | |
| Media Intel Core i5-10210U (585 - 1339, n=24) | |
| Dell XPS 13 9300 i5 FHD | |
| Honor Magicbook 14 | |
| Dell XPS 13 9300 4K UHD | |
| Dell XPS 13 7390 Core i7-10710U | |
| 7-Zip 18.03 / 7z b 4 -mmt1 | |
| Dell XPS 13 9300 4K UHD | |
| Dell XPS 13 7390 Core i7-10710U | |
| Dynabook Portege X30L-G1331 | |
| Media Intel Core i5-10210U (3504 - 4467, n=24) | |
| Dell XPS 13 9300 i5 FHD | |
| Dell Latitude 13 3390 | |
| Honor Magicbook 14 | |
| 7-Zip 18.03 / 7z b 4 | |
| Dell XPS 13 7390 Core i7-10710U | |
| Dell XPS 13 9300 4K UHD | |
| Dell XPS 13 9300 i5 FHD | |
| Honor Magicbook 14 | |
| Media Intel Core i5-10210U (10920 - 21679, n=24) | |
| Dynabook Portege X30L-G1331 | |
| Dell Latitude 13 3390 | |
| Geekbench 5.5 / Single-Core | |
| Dell XPS 13 9300 4K UHD | |
| Dell XPS 13 9300 i5 FHD | |
| Dynabook Portege X30L-G1331 | |
| Media Intel Core i5-10210U (949 - 1133, n=27) | |
| Honor Magicbook 14 | |
| Geekbench 5.5 / Multi-Core | |
| Dell XPS 13 9300 4K UHD | |
| Dell XPS 13 9300 i5 FHD | |
| Dynabook Portege X30L-G1331 | |
| Media Intel Core i5-10210U (2079 - 4256, n=27) | |
| Honor Magicbook 14 | |
| HWBOT x265 Benchmark v2.2 / 4k Preset | |
| Dell XPS 13 9300 4K UHD | |
| Dell XPS 13 7390 Core i7-10710U | |
| Media Intel Core i5-10210U (2.36 - 6.28, n=24) | |
| Dell XPS 13 9300 i5 FHD | |
| Dynabook Portege X30L-G1331 | |
| Honor Magicbook 14 | |
| Dell Latitude 13 3390 | |
| LibreOffice / 20 Documents To PDF | |
| Dell XPS 13 9300 4K UHD | |
| Media Intel Core i5-10210U (49.6 - 80.3, n=18) | |
| Dynabook Portege X30L-G1331 | |
| R Benchmark 2.5 / Overall mean | |
| Honor Magicbook 14 | |
| Media Intel Core i5-10210U (0.658 - 0.901, n=24) | |
| Dell XPS 13 9300 i5 FHD | |
| Dynabook Portege X30L-G1331 | |
| Dell XPS 13 9300 4K UHD | |
* ... Meglio usare valori piccoli
| PCMark 8 Home Score Accelerated v2 | 3641 punti | |
| PCMark 8 Work Score Accelerated v2 | 5039 punti | |
| PCMark 10 Score | 4217 punti | |
Aiuto | ||
| DPC Latencies / LatencyMon - interrupt to process latency (max), Web, Youtube, Prime95 | |
| Dynabook Portege X30L-G1331 | |
* ... Meglio usare valori piccoli
| Dynabook Portege X30L-G1331 Samsung SSD PM981a MZVLB512HBJQ | Dell XPS 13 9300 Core i7-1065G7 Intel SSDPEMKF512G8 NVMe SSD | LG Gram 13Z980-A SK Hynix HFS256G39TND-N210A | Apple MacBook Pro 13 2019 2TB3 Apple SSD AP0256 | Lenovo ThinkBook 13s-20R90071GE SK hynix BC501 HFM512GDHTNG-8310A | |
|---|---|---|---|---|---|
| AS SSD | -36% | -83% | -105% | -38% | |
| Seq Read (MB/s) | 2067 | 1956 -5% | 496.4 -76% | 974 -53% | 1264 -39% |
| Seq Write (MB/s) | 2444 | 1227 -50% | 241.7 -90% | 1340 -45% | 518 -79% |
| 4K Read (MB/s) | 55.8 | 63 13% | 27.16 -51% | 11.35 -80% | 40.31 -28% |
| 4K Write (MB/s) | 124.6 | 156.6 26% | 61 -51% | 15.95 -87% | 119.1 -4% |
| 4K-64 Read (MB/s) | 1601 | 475.6 -70% | 376.7 -76% | 643 -60% | 772 -52% |
| 4K-64 Write (MB/s) | 1696 | 539 -68% | 231.3 -86% | 163 -90% | 672 -60% |
| Access Time Read * (ms) | 0.048 | 0.042 12% | 0.084 -75% | 0.316 -558% | 0.046 4% |
| Access Time Write * (ms) | 0.091 | 0.105 -15% | 0.235 -158% | 0.258 -184% | 0.031 66% |
| Score Read (Points) | 1864 | 734 -61% | 453 -76% | 752 -60% | 939 -50% |
| Score Write (Points) | 2065 | 818 -60% | 316 -85% | 313 -85% | 843 -59% |
| Score Total (Points) | 4908 | 1915 -61% | 997 -80% | 1465 -70% | 2234 -54% |
| Copy ISO MB/s (MB/s) | 2051 | 1022 -50% | 204.5 -90% | 1404 -32% | 943 -54% |
| Copy Program MB/s (MB/s) | 572 | 302.8 -47% | 127.6 -78% | 406.9 -29% | 292.2 -49% |
| Copy Game MB/s (MB/s) | 1447 | 491.4 -66% | 191.7 -87% | 850 -41% | 374.1 -74% |
| CrystalDiskMark 5.2 / 6 | 3% | -68% | -41% | ||
| Write 4K (MB/s) | 164.1 | 186.8 14% | 73.9 -55% | 89.3 -46% | |
| Read 4K (MB/s) | 49.34 | 71.4 45% | 25.67 -48% | 37.4 -24% | |
| Write Seq (MB/s) | 1777 | 1203 -32% | 255.2 -86% | 608 -66% | |
| Read Seq (MB/s) | 1752 | 2600 48% | 480.7 -73% | 1019 -42% | |
| Write 4K Q32T1 (MB/s) | 401.1 | 514 28% | 197.2 -51% | 487.9 22% | |
| Read 4K Q32T1 (MB/s) | 498.7 | 570 14% | 214.4 -57% | 284.8 -43% | |
| Write Seq Q32T1 (MB/s) | 2988 | 786 -74% | 254.9 -91% | 872 -71% | |
| Read Seq Q32T1 (MB/s) | 3544 | 2947 -17% | 554 -84% | 1635 -54% | |
| Write 4K Q8T8 (MB/s) | 387.3 | ||||
| Read 4K Q8T8 (MB/s) | 757 | ||||
| Media totale (Programma / Settaggio) | -17% /
-22% | -76% /
-77% | -105% /
-105% | -40% /
-39% |
* ... Meglio usare valori piccoli

Disk Throttling: DiskSpd Read Loop, Queue Depth 8
| 3DMark 11 Performance | 2008 punti | |
| 3DMark Fire Strike Score | 1173 punti | |
| 3DMark Time Spy Score | 460 punti | |
Aiuto | ||
| basso | medio | alto | ultra | |
|---|---|---|---|---|
| Dota 2 Reborn (2015) | 71.5 | 45.3 | 21.1 | 18.8 |
| X-Plane 11.11 (2018) | 21.9 | 14.9 | 13.2 |
| Dynabook Portege X30L-G1331 UHD Graphics 620, i5-10210U, Samsung SSD PM981a MZVLB512HBJQ | Dell XPS 13 9300 Core i7-1065G7 Iris Plus Graphics G7 (Ice Lake 64 EU), i7-1065G7, Intel SSDPEMKF512G8 NVMe SSD | LG Gram 13Z980-A UHD Graphics 620, i5-8250U, SK Hynix HFS256G39TND-N210A | Apple MacBook Pro 13 2019 2TB3 Iris Plus Graphics 645, i5-8257U, Apple SSD AP0256 | Lenovo ThinkBook 13s-20R90071GE UHD Graphics 620, i5-8265U, SK hynix BC501 HFM512GDHTNG-8310A | HP EliteBook 830 G5-3JX74EA UHD Graphics 620, i5-8550U, Samsung SSD PM961 1TB M.2 PCIe 3.0 x4 NVMe (MZVLW1T0) | |
|---|---|---|---|---|---|---|
| Noise | -0% | 1% | -3% | -1% | -2% | |
| off /ambiente * (dB) | 28.5 | 28.3 1% | 28.1 1% | 29.5 -4% | 28.8 -1% | 29.3 -3% |
| Idle Minimum * (dB) | 28.5 | 28.3 1% | 28.1 1% | 29.5 -4% | 28.8 -1% | 29.3 -3% |
| Idle Average * (dB) | 28.5 | 28.3 1% | 28.1 1% | 29.5 -4% | 28.8 -1% | 29.3 -3% |
| Idle Maximum * (dB) | 28.5 | 28.3 1% | 28.1 1% | 29.5 -4% | 29.7 -4% | 29.3 -3% |
| Load Average * (dB) | 32 | 32.5 -2% | 34.3 -7% | 31.1 3% | 30.7 4% | 33.2 -4% |
| Load Maximum * (dB) | 38 | 39.3 -3% | 34.3 10% | 39.3 -3% | 38.3 -1% | 36.1 5% |
| Witcher 3 ultra * (dB) | 39.3 |
* ... Meglio usare valori piccoli
Rumorosità
| Idle |
| 28.5 / 28.5 / 28.5 dB(A) |
| Sotto carico |
| 32 / 38 dB(A) |
 | ||
30 dB silenzioso 40 dB(A) udibile 50 dB(A) rumoroso |
||
min: | ||
(±) La temperatura massima sul lato superiore è di 41.2 °C / 106 F, rispetto alla media di 34.3 °C / 94 F, che varia da 21.2 a 62.5 °C per questa classe Office.
(±) Il lato inferiore si riscalda fino ad un massimo di 44 °C / 111 F, rispetto alla media di 36.8 °C / 98 F
(+) In idle, la temperatura media del lato superiore è di 28.5 °C / 83 F, rispetto alla media deld ispositivo di 29.5 °C / 85 F.
(+) I poggiapolsi e il touchpad sono piu' freddi della temperatura della pelle con un massimo di 26 °C / 78.8 F e sono quindi freddi al tatto.
(±) La temperatura media della zona del palmo della mano di dispositivi simili e'stata di 27.5 °C / 81.5 F (+1.5 °C / 2.7 F).
Dynabook Portege X30L-G1331 analisi audio
(+) | gli altoparlanti sono relativamente potenti (83.1 dB)
Bassi 100 - 315 Hz
(-) | quasi nessun basso - in media 29.8% inferiori alla media
(±) | la linearità dei bassi è media (8.6% delta rispetto alla precedente frequenza)
Medi 400 - 2000 Hz
(±) | medi ridotti - circa 6.8% inferiori alla media
(±) | linearità dei medi adeguata (8.5% delta rispetto alla precedente frequenza)
Alti 2 - 16 kHz
(+) | Alti bilanciati - appena 3.2% dalla media
(+) | alti lineari (5.4% delta rispetto alla precedente frequenza)
Nel complesso 100 - 16.000 Hz
(±) | la linearità complessiva del suono è media (26% di differenza rispetto alla media
Rispetto alla stessa classe
» 79% di tutti i dispositivi testati in questa classe è stato migliore, 7% simile, 14% peggiore
» Il migliore ha avuto un delta di 7%, medio di 21%, peggiore di 53%
Rispetto a tutti i dispositivi testati
» 80% di tutti i dispositivi testati in questa classe è stato migliore, 4% similare, 16% peggiore
» Il migliore ha avuto un delta di 4%, medio di 24%, peggiore di 134%
Apple MacBook 12 (Early 2016) 1.1 GHz analisi audio
(+) | gli altoparlanti sono relativamente potenti (83.6 dB)
Bassi 100 - 315 Hz
(±) | bassi ridotti - in media 11.3% inferiori alla media
(±) | la linearità dei bassi è media (14.2% delta rispetto alla precedente frequenza)
Medi 400 - 2000 Hz
(+) | medi bilanciati - solo only 2.4% rispetto alla media
(+) | medi lineari (5.5% delta rispetto alla precedente frequenza)
Alti 2 - 16 kHz
(+) | Alti bilanciati - appena 2% dalla media
(+) | alti lineari (4.5% delta rispetto alla precedente frequenza)
Nel complesso 100 - 16.000 Hz
(+) | suono nel complesso lineare (10.2% differenza dalla media)
Rispetto alla stessa classe
» 7% di tutti i dispositivi testati in questa classe è stato migliore, 2% simile, 91% peggiore
» Il migliore ha avuto un delta di 5%, medio di 18%, peggiore di 53%
Rispetto a tutti i dispositivi testati
» 5% di tutti i dispositivi testati in questa classe è stato migliore, 1% similare, 94% peggiore
» Il migliore ha avuto un delta di 4%, medio di 24%, peggiore di 134%
| Off / Standby | |
| Idle | |
| Sotto carico |
|
Leggenda:
min: | |
| Dynabook Portege X30L-G1331 i5-10210U, UHD Graphics 620, Samsung SSD PM981a MZVLB512HBJQ, IPS, 1920x1080, 13.3" | Dell XPS 13 9300 Core i7-1065G7 i7-1065G7, Iris Plus Graphics G7 (Ice Lake 64 EU), Intel SSDPEMKF512G8 NVMe SSD, IPS, 1920x1200, 13.4" | LG Gram 13Z980-A i5-8250U, UHD Graphics 620, SK Hynix HFS256G39TND-N210A, IPS, 1920x1080, 13.3" | Apple MacBook Pro 13 2019 2TB3 i5-8257U, Iris Plus Graphics 645, Apple SSD AP0256, IPS, 2560x1600, 13.3" | Lenovo ThinkBook 13s-20R90071GE i5-8265U, UHD Graphics 620, SK hynix BC501 HFM512GDHTNG-8310A, a-Si IPS LED, 1920x1080, 13.3" | HP EliteBook 830 G5-3JX74EA i5-8550U, UHD Graphics 620, Samsung SSD PM961 1TB M.2 PCIe 3.0 x4 NVMe (MZVLW1T0), IPS LED, 1920x1080, 13.3" | |
|---|---|---|---|---|---|---|
| Power Consumption | -16% | -12% | -14% | -2% | -28% | |
| Idle Minimum * (Watt) | 2.8 | 4.2 -50% | 3.9 -39% | 2.1 25% | 3.1 -11% | 4.5 -61% |
| Idle Average * (Watt) | 4.9 | 6.9 -41% | 7.3 -49% | 6.9 -41% | 5.87 -20% | 6.4 -31% |
| Idle Maximum * (Watt) | 9 | 7.5 17% | 7.4 18% | 7.8 13% | 6.6 27% | 9.2 -2% |
| Load Average * (Watt) | 31.2 | 33.3 -7% | 36.1 -16% | 42 -35% | 35.3 -13% | 35.7 -14% |
| Load Maximum * (Watt) | 49.4 | 48.4 2% | 35.8 28% | 64.5 -31% | 46.5 6% | 65.4 -32% |
| Witcher 3 ultra * (Watt) | 37.1 |
* ... Meglio usare valori piccoli
| Dynabook Portege X30L-G1331 i5-10210U, UHD Graphics 620, 42 Wh | Dell XPS 13 9300 Core i7-1065G7 i7-1065G7, Iris Plus Graphics G7 (Ice Lake 64 EU), 52 Wh | LG Gram 13Z980-A i5-8250U, UHD Graphics 620, 72 Wh | Apple MacBook Pro 13 2019 2TB3 i5-8257U, Iris Plus Graphics 645, 58.2 Wh | Lenovo ThinkBook 13s-20R90071GE i5-8265U, UHD Graphics 620, 45 Wh | HP EliteBook 830 G5-3JX74EA i5-8550U, UHD Graphics 620, 49 Wh | |
|---|---|---|---|---|---|---|
| Autonomia della batteria | 53% | 46% | 57% | 10% | -14% | |
| WiFi v1.3 (h) | 8.3 | 12.7 53% | 12.1 46% | 13 57% | 9.1 10% | 7.1 -14% |
| Load (h) | 1.4 | 2.3 | ||||
| Reader / Idle (h) | 12.8 |
Pro
Contro
La ragione principale per possedere un Dynabook Portege X30L rispetto ad alternative come l'HP EliteBook, Dell Latitude, o Lenovo ThinkPad serie X è il suo peso molto basso. Non possiamo immaginare quanta differenza possano fare alcune centinaia di grammi, soprattutto se ti piace portare il tuo laptop ovunque. Anche il LG Gram 13 non è leggero come il nostro Portege ed è commercializzato come uno dei subnotebooks più leggeri che si possano acquistare.
Se il peso non è la vostra principale preoccupazione, allora gli altri portatili tendono ad offrire prestazioni più veloci di CPU e GPU, tasti della tastiera più solidi, opzioni di connettività aggiuntive come Thunderbolt e WAN, chassis più rigido, maggiore durata della batteria e un accesso più facile all'SSD interno. L'HP EliteBook x360 1030, ad esempio, è più luminoso, più sottile e più versatile quando è in viaggio, anche se al costo di un certo peso extra.
Il Dynabook Portege X30L funziona meglio quando siete sempre in movimento e volete un compagno leggero che non rispamia sul nummero di porte o sulla qualità. Se però si passa la maggior parte della giornata a lavorare in un unico posto, allora ci sono opzioni migliori in quanto non si sfrutta il principale punto di forza di questo computer portatile.
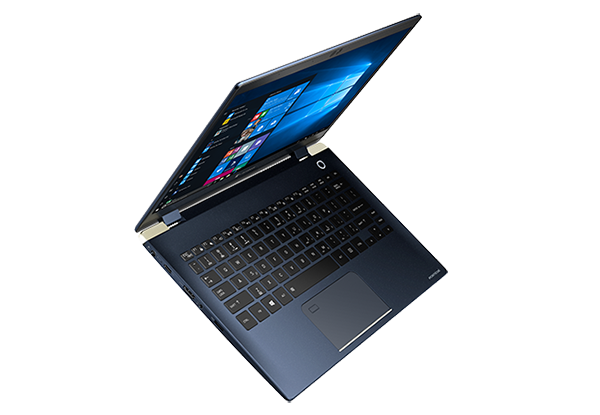
Dynabook Portege X30L-G1331
- 05/18/2020 v7 (old)
Allen Ngo
Price comparison
