Recensione del Laptop Lenovo ThinkPad X1 Carbon G7 2020: stesso Look, Processore nuovo
")
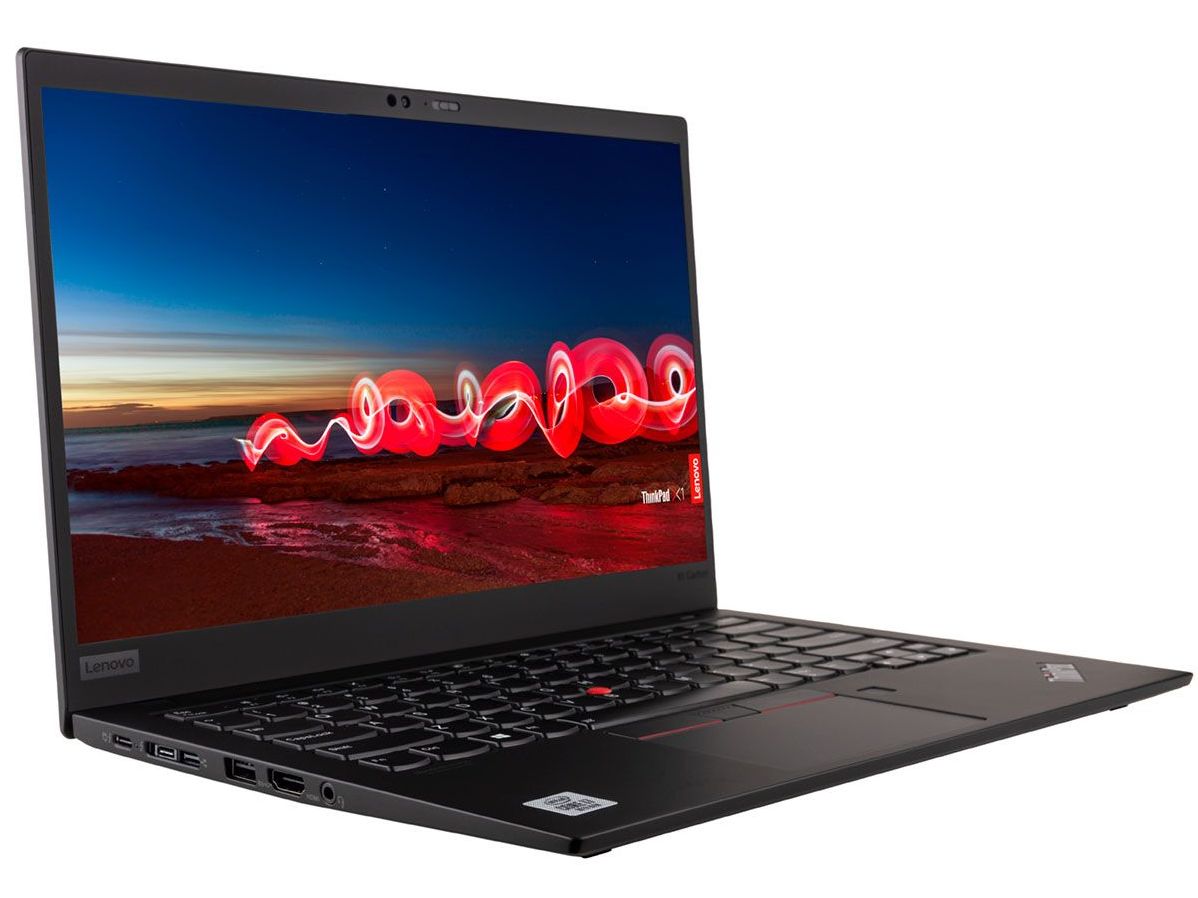
Giunta alla settima generazione, la serie Lenovo ThinkPad X1 Carbon ha avuto successo nell'attrarre gli utenti che desiderano un portatile ThinkPad serie T senza le dimensioni e il peso normalmente associati ad esso. E' quanto di più simile a un ThinkPad Ultrabook che si possa ottenere senza sacrificare molte delle caratteristiche che sono venute a definire un ThinkPad.
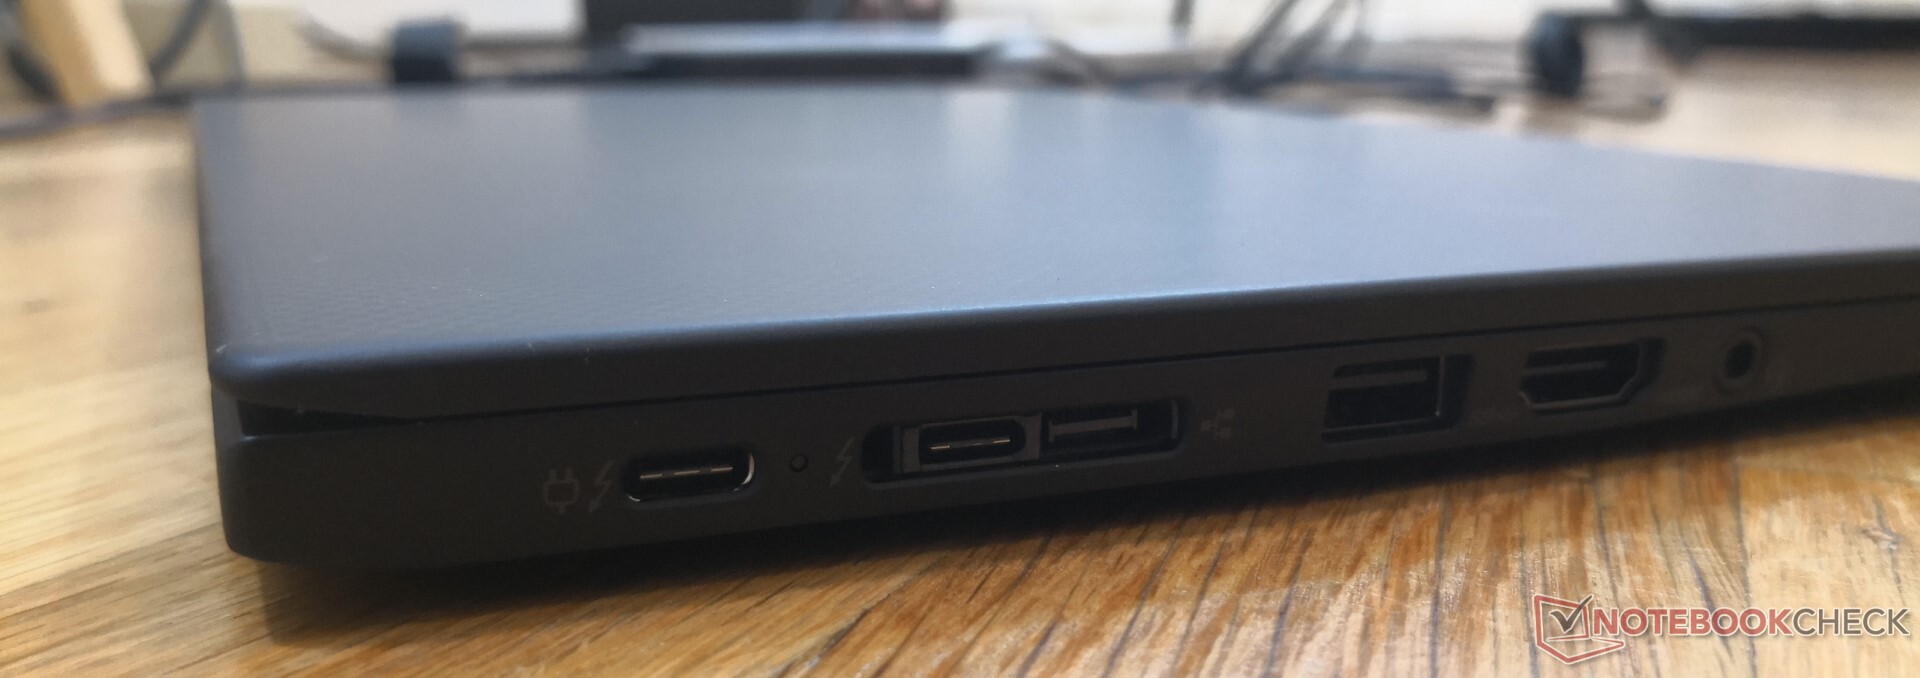
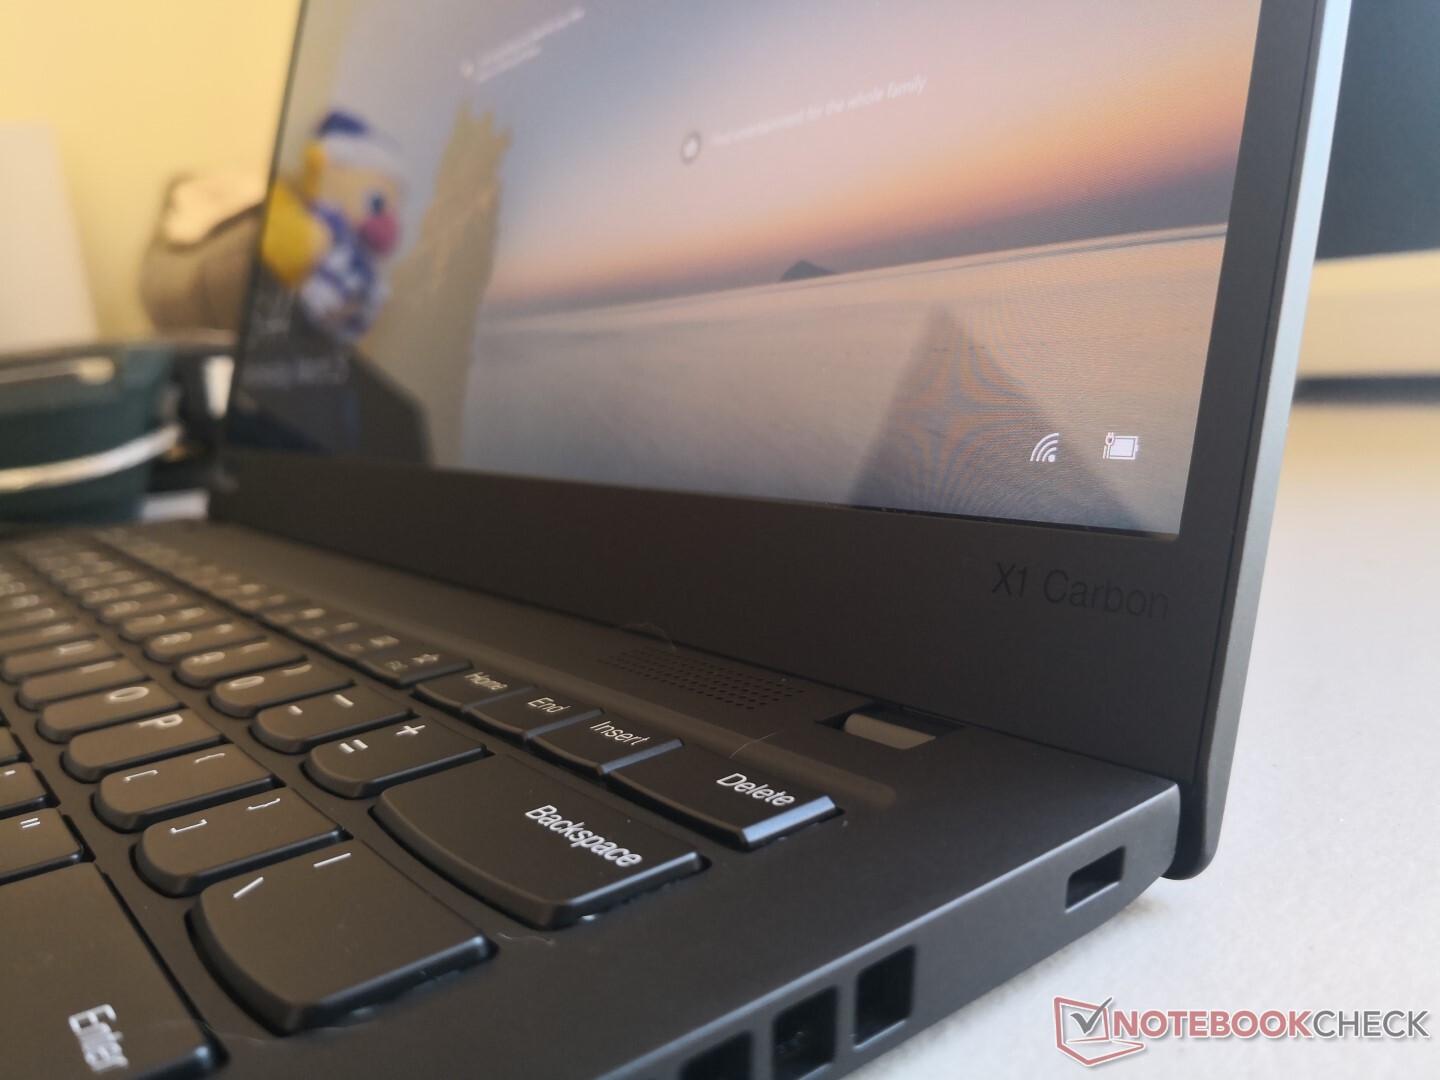
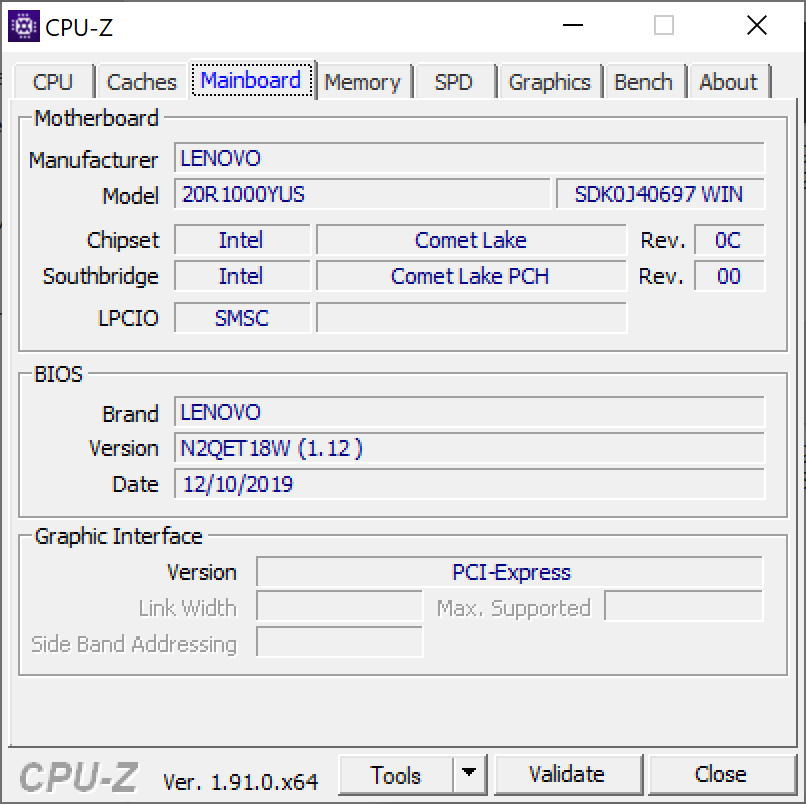
L'unità che vedremo qui viene fornito con l'ultima CPU Intel Comet Lake-U Core i7-10510U e un display lucido 4K UHD per sostituire le configurazioni Whiskey Lake-U dello scorso anno 2019. Il suo chassis è per il resto identico ai modelli 2019 e 2018 e quindi i nostri commenti su porte, tastiera, altoparlanti e altre caratteristiche fisiche si possono trovare sulle nostre recensioni qui sotto.
Computer Upgrade King ha esattamente questa SKU per $2300 USD. Competitors diretti del ThinkPad X1 Carbon includono altri business sottili e leggeri cme HP EliteBook 1040 series, Dell Latitude 7000/9000 series, Microsoft Surface Laptop series, e Toshiba Portege series.
Altre recensioni Lenovo ThinkPad:
Punteggio | Data | Modello | Peso | Altezza | Dimensione | Risoluzione | Prezzo |
|---|---|---|---|---|---|---|---|
| 88.5 % v7 (old) | 03/2020 | Lenovo ThinkPad X1 Carbon G7 20R1-000YUS i7-10510U, UHD Graphics 620 | 1.2 kg | 15.4 mm | 14.00" | 3840x2160 | |
| 89.6 % v7 (old) | 08/2019 | Lenovo ThinkPad X1 Yoga 2019-20QGS00A00 i7-8565U, UHD Graphics 620 | 1.3 kg | 15.5 mm | 14.00" | 1920x1080 | |
| 87.4 % v7 (old) | 05/2019 | Lenovo ThinkPad T490-20N3S02L00 i7-8565U, GeForce MX250 | 1.5 kg | 17.9 mm | 14.00" | 1920x1080 | |
| 90.1 % v7 (old) | 08/2019 | Lenovo ThinkPad X1 Carbon 2019-20QE000VGE i7-8665U, UHD Graphics 620 | 1.1 kg | 14.9 mm | 14.00" | 2560x1440 | |
| 83.9 % v7 (old) | 12/2019 | Microsoft Surface Laptop 3 15 i7-1065G7 i7-1065G7, Iris Plus Graphics G7 (Ice Lake 64 EU) | 1.5 kg | 14.7 mm | 15.00" | 2496x1664 |
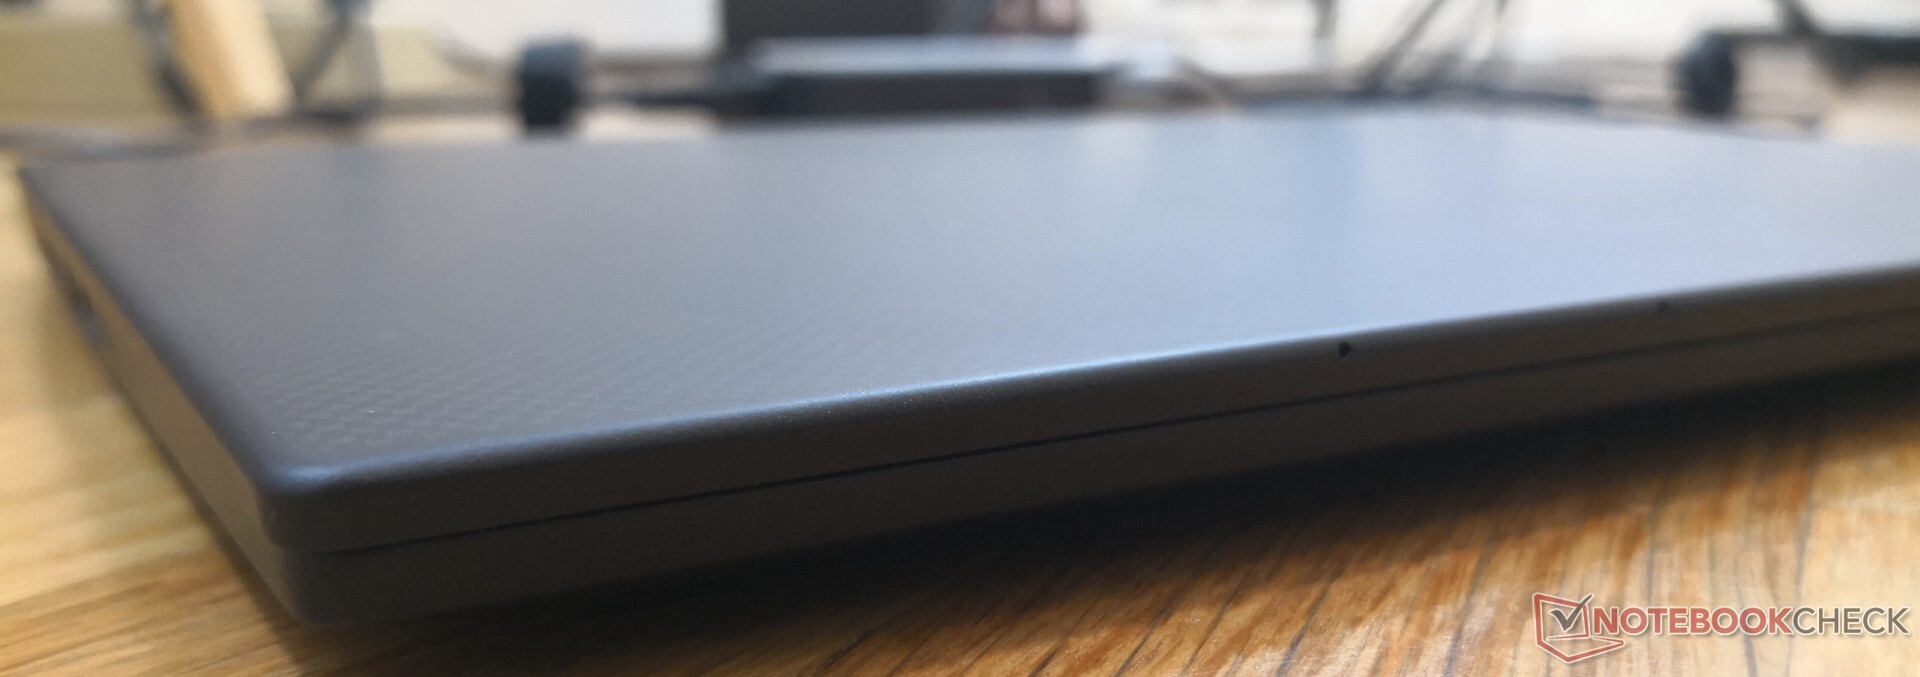
Case
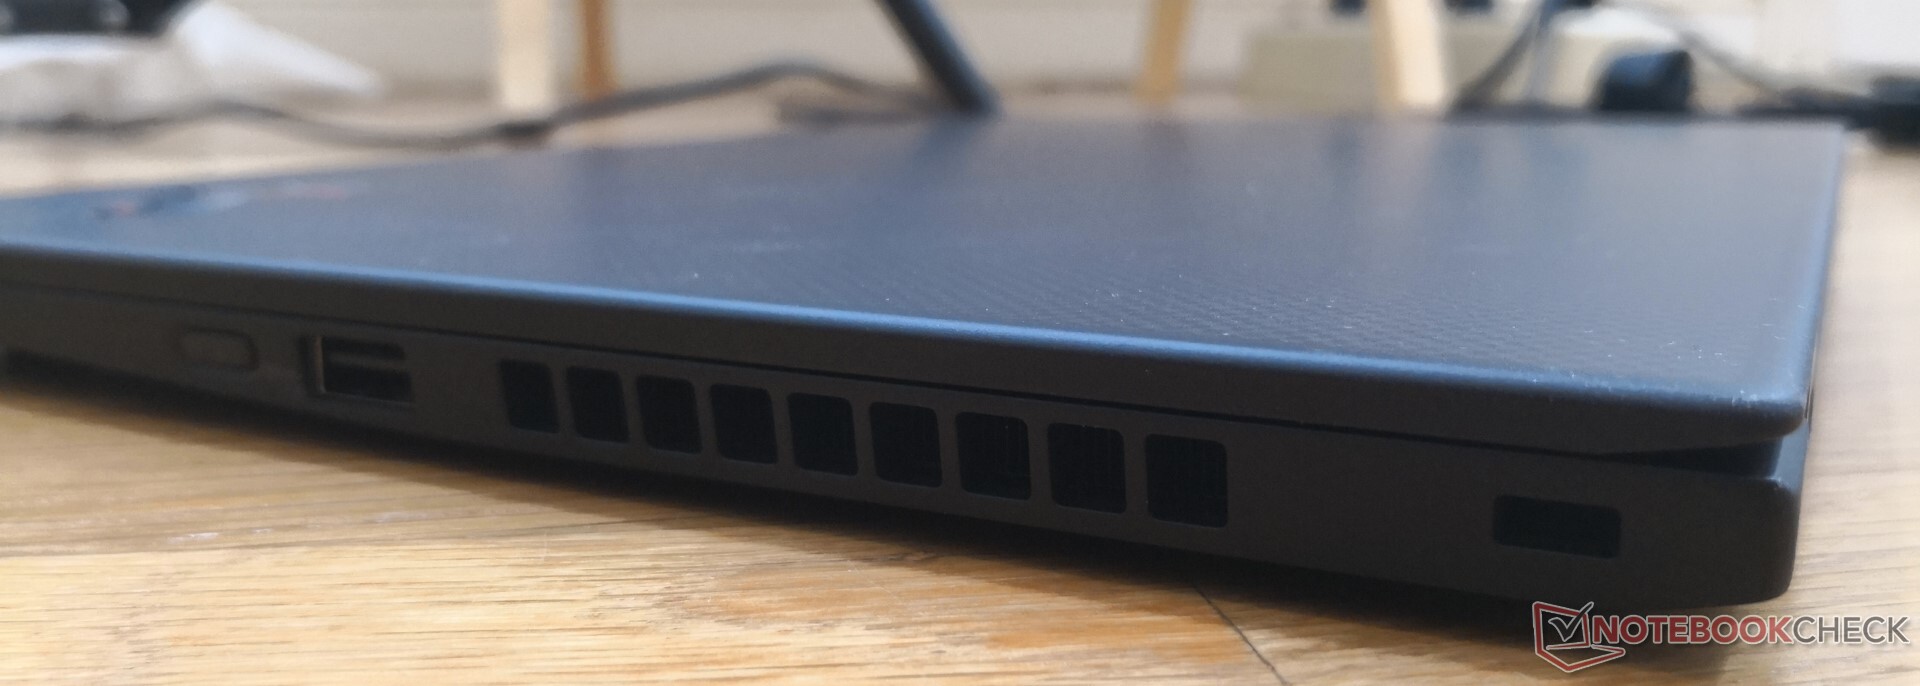
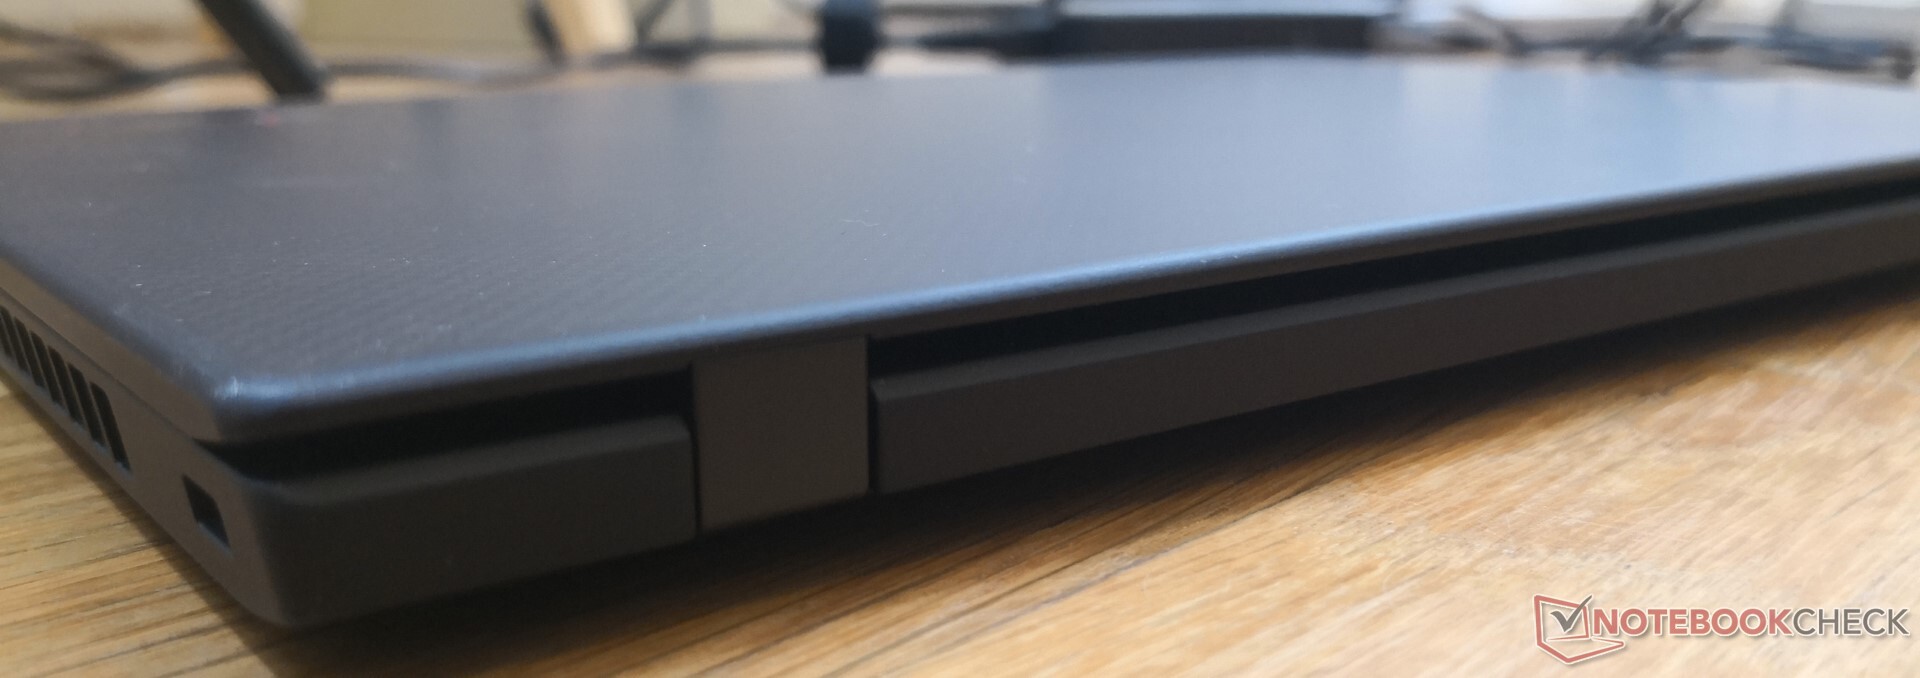
Connettività
Comunicazioni
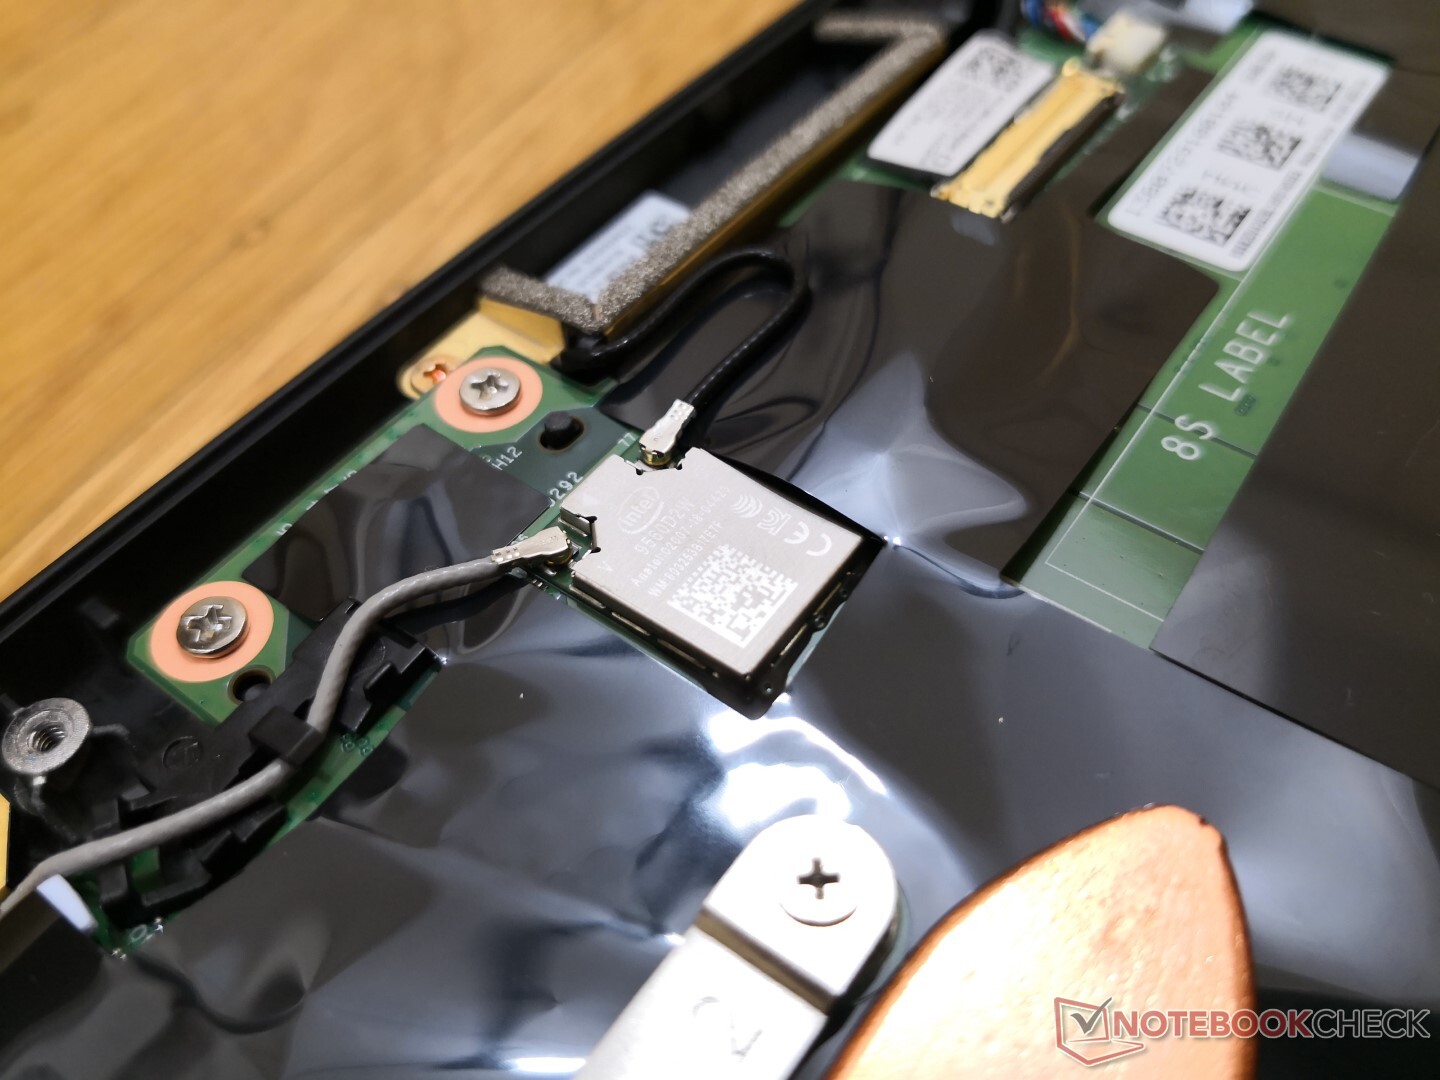
L'Intel 9560 è fornito di serie per la connettività 802.11ac o Wi-Fi 5. Purtroppo, Lenovo non offre opzioni AX200/AX201 per la connettività Wi-Fi 6, ma almeno gli utenti possono configurarla con WWAN 4G LTE CAT9 opzionale o con l'aggiornamento a Intel 9560 vPro. Siamo in grado di registrare velocità di trasferimento medie da 1100 a 1200 Mbps quando ci si trova a un metro di distanza dal nostro router abilitato per la connettività Wi-Fi 6 di Netgear RAX200.
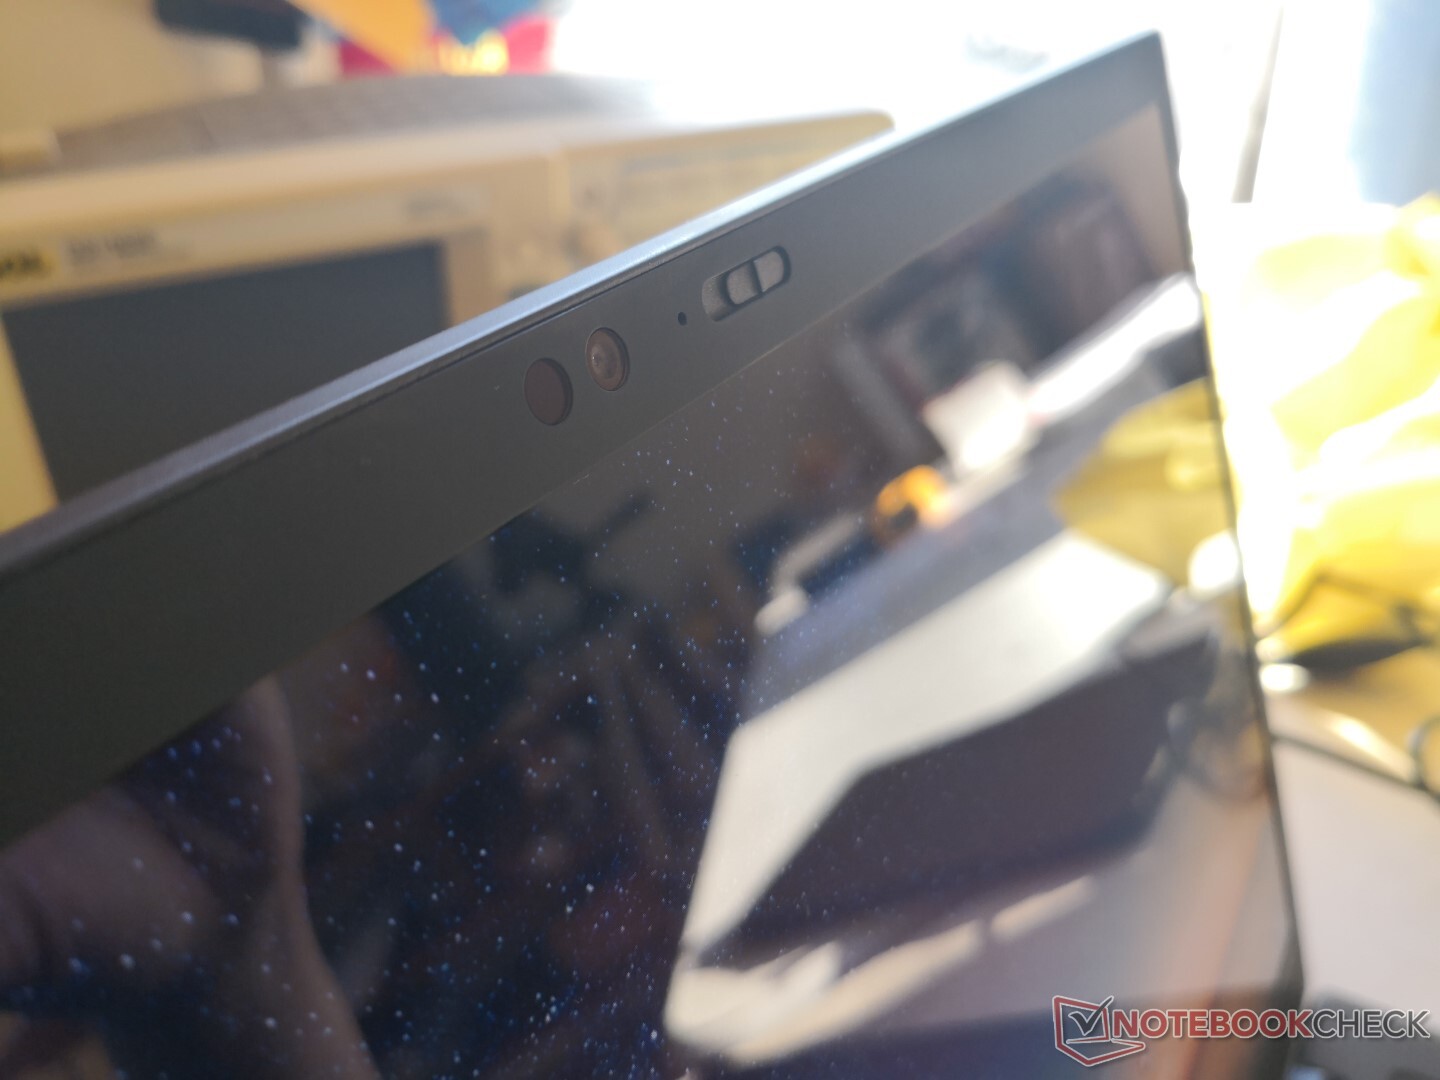
Webcam

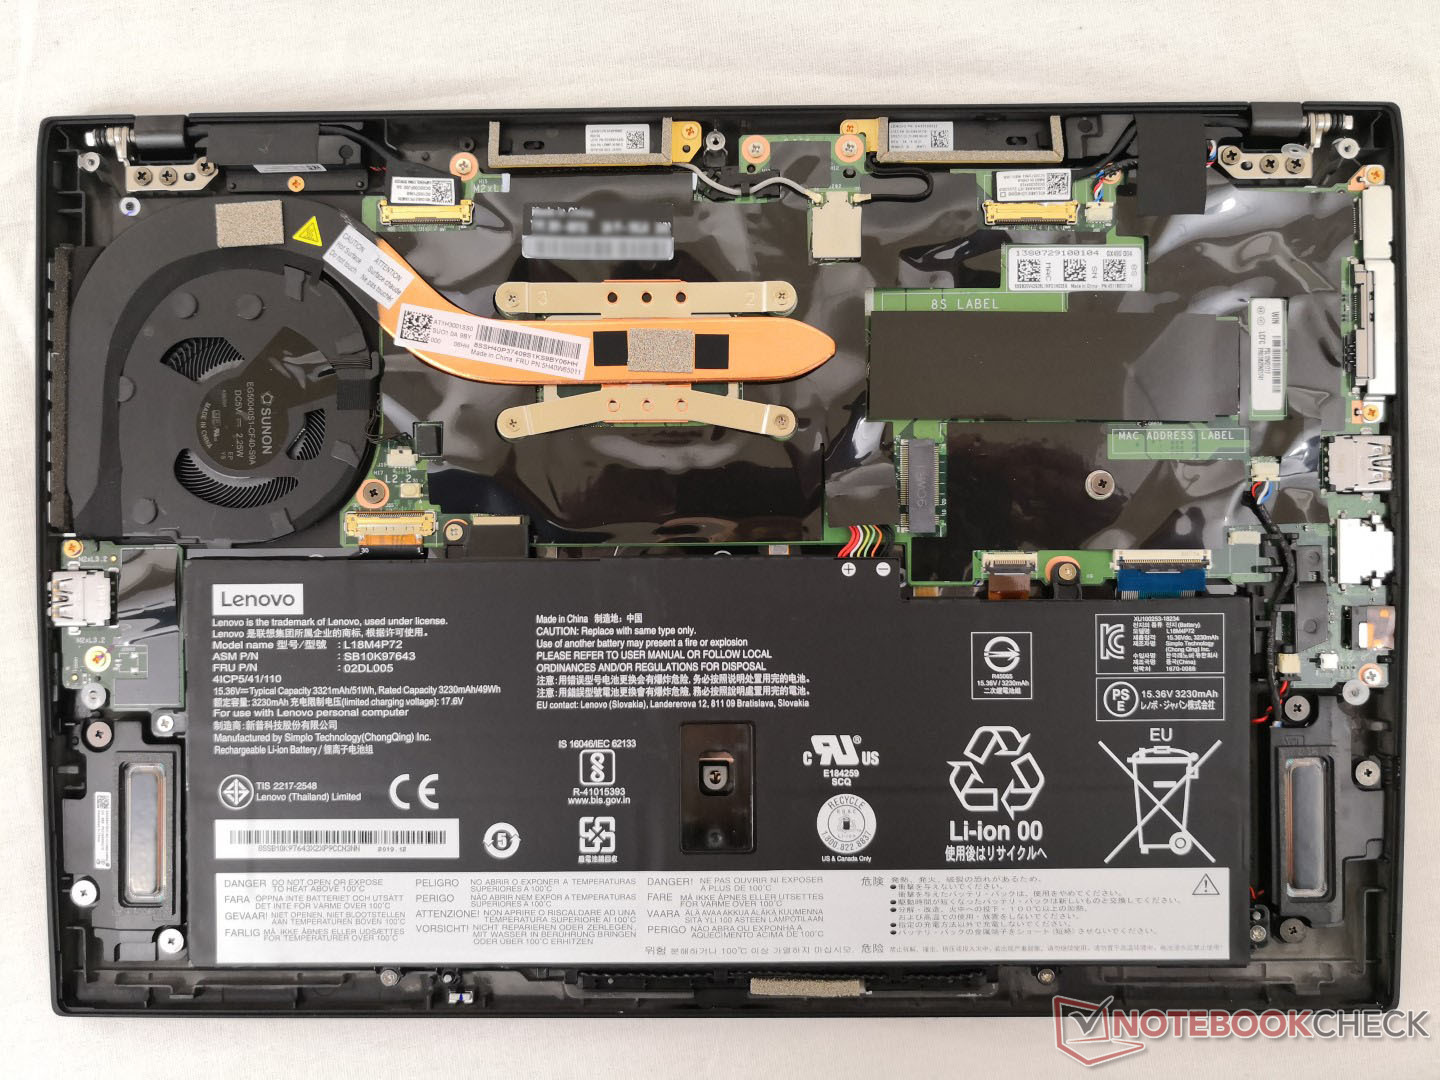
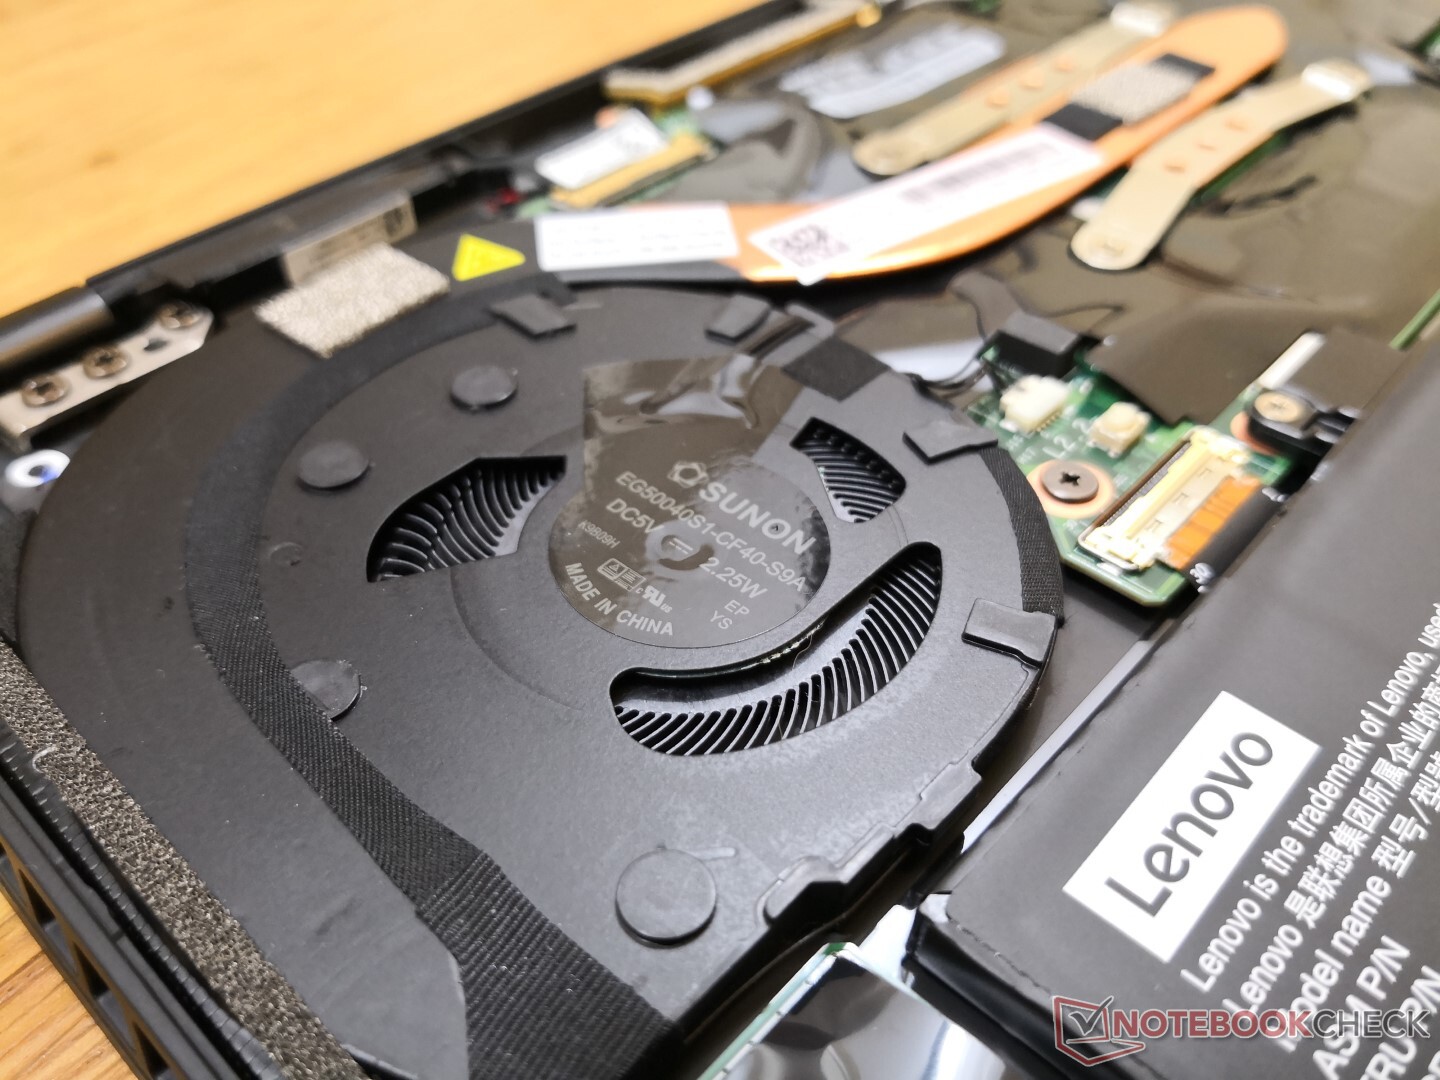
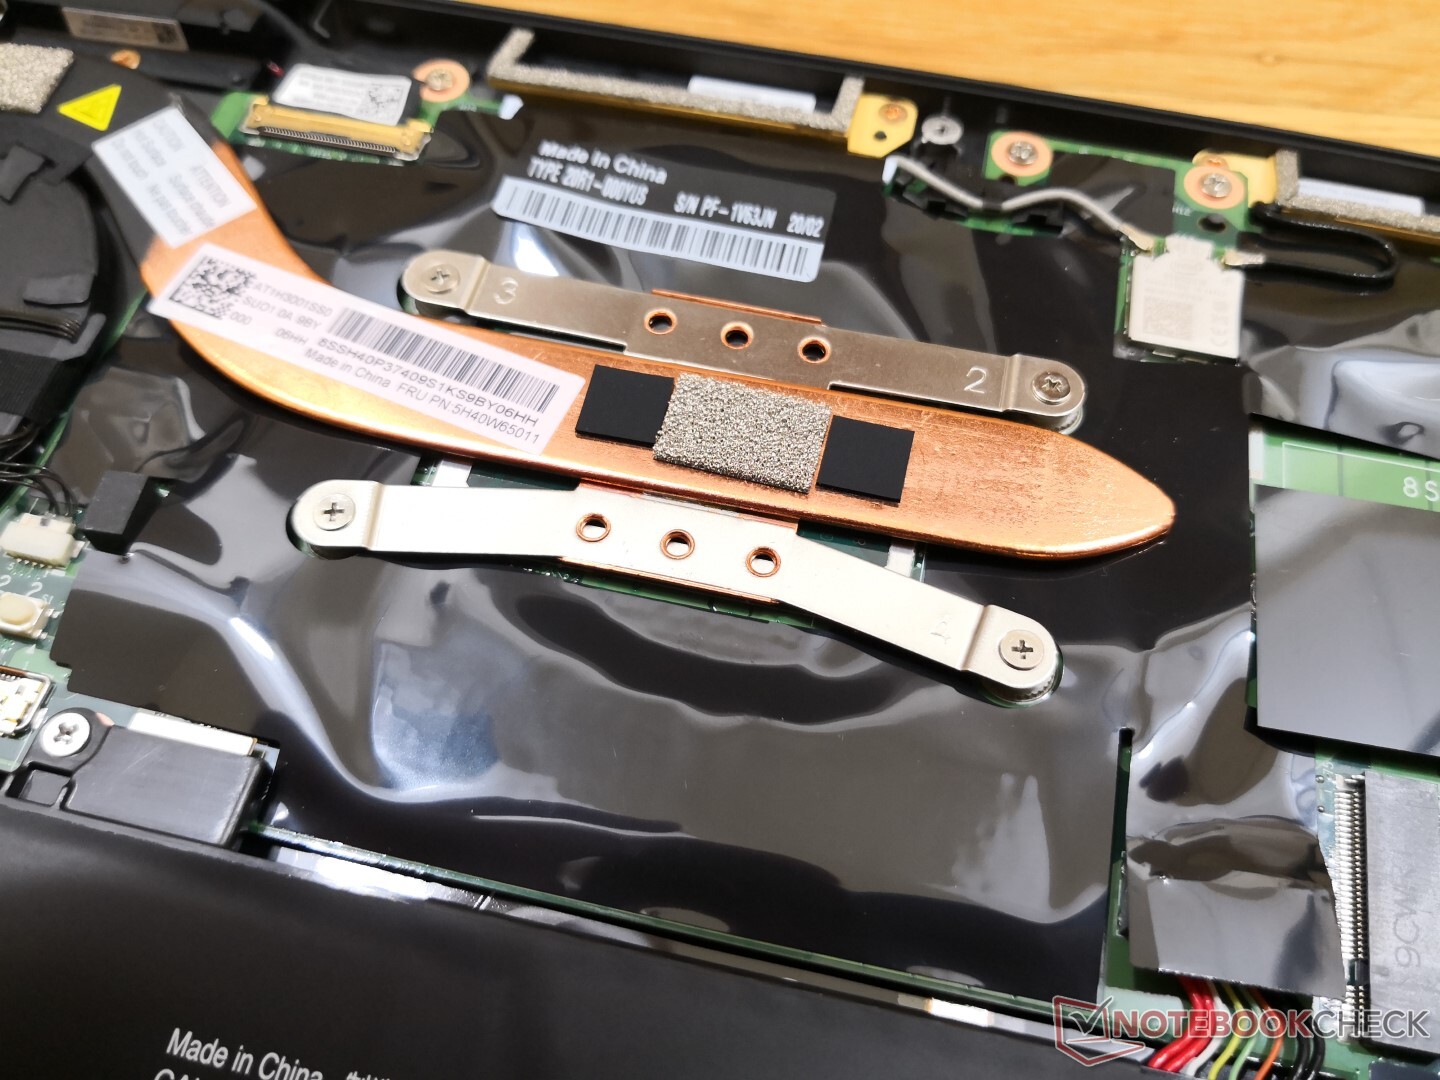
Manutenzione
Display
Questo è il primo ThinkPad X1 Carbon che abbiamo testato con un display UHD 4K poiché tutte le unità precedenti avevano invece pannelli FHD o WQHD. Il suo esatto pannello BOE NV140QUM-N53 IPS non si trova su nessun altro portatile nel nostro database, ma l'ultimo Yoga C940 utilizza un BOE NV140QUM-N54 molto simile.
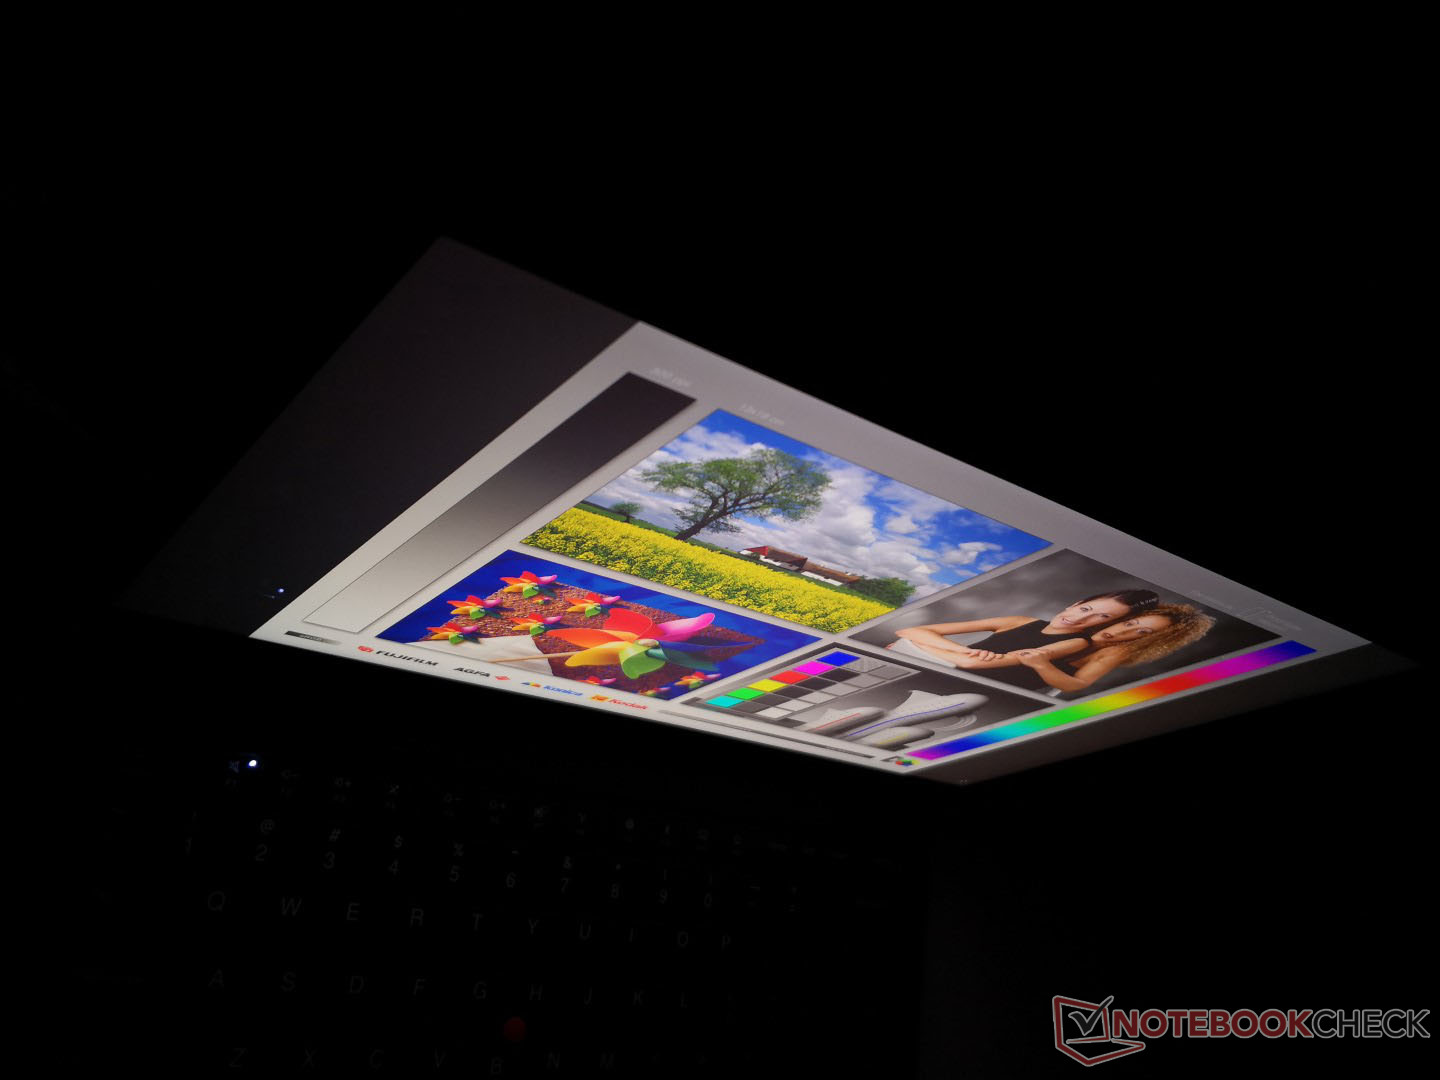
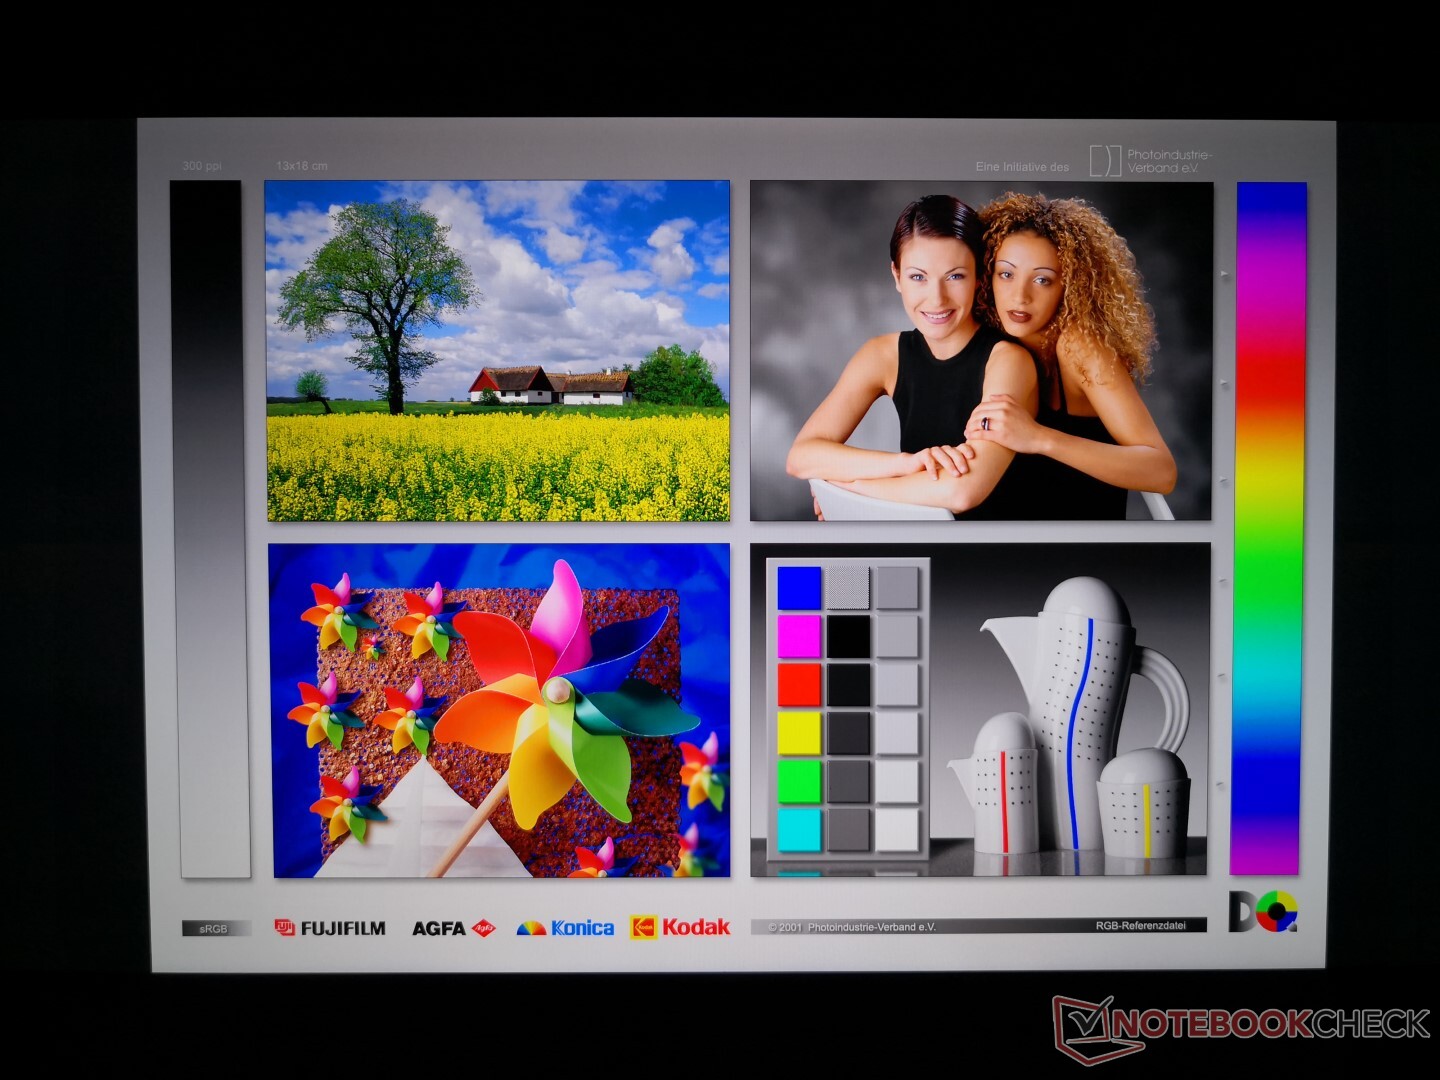
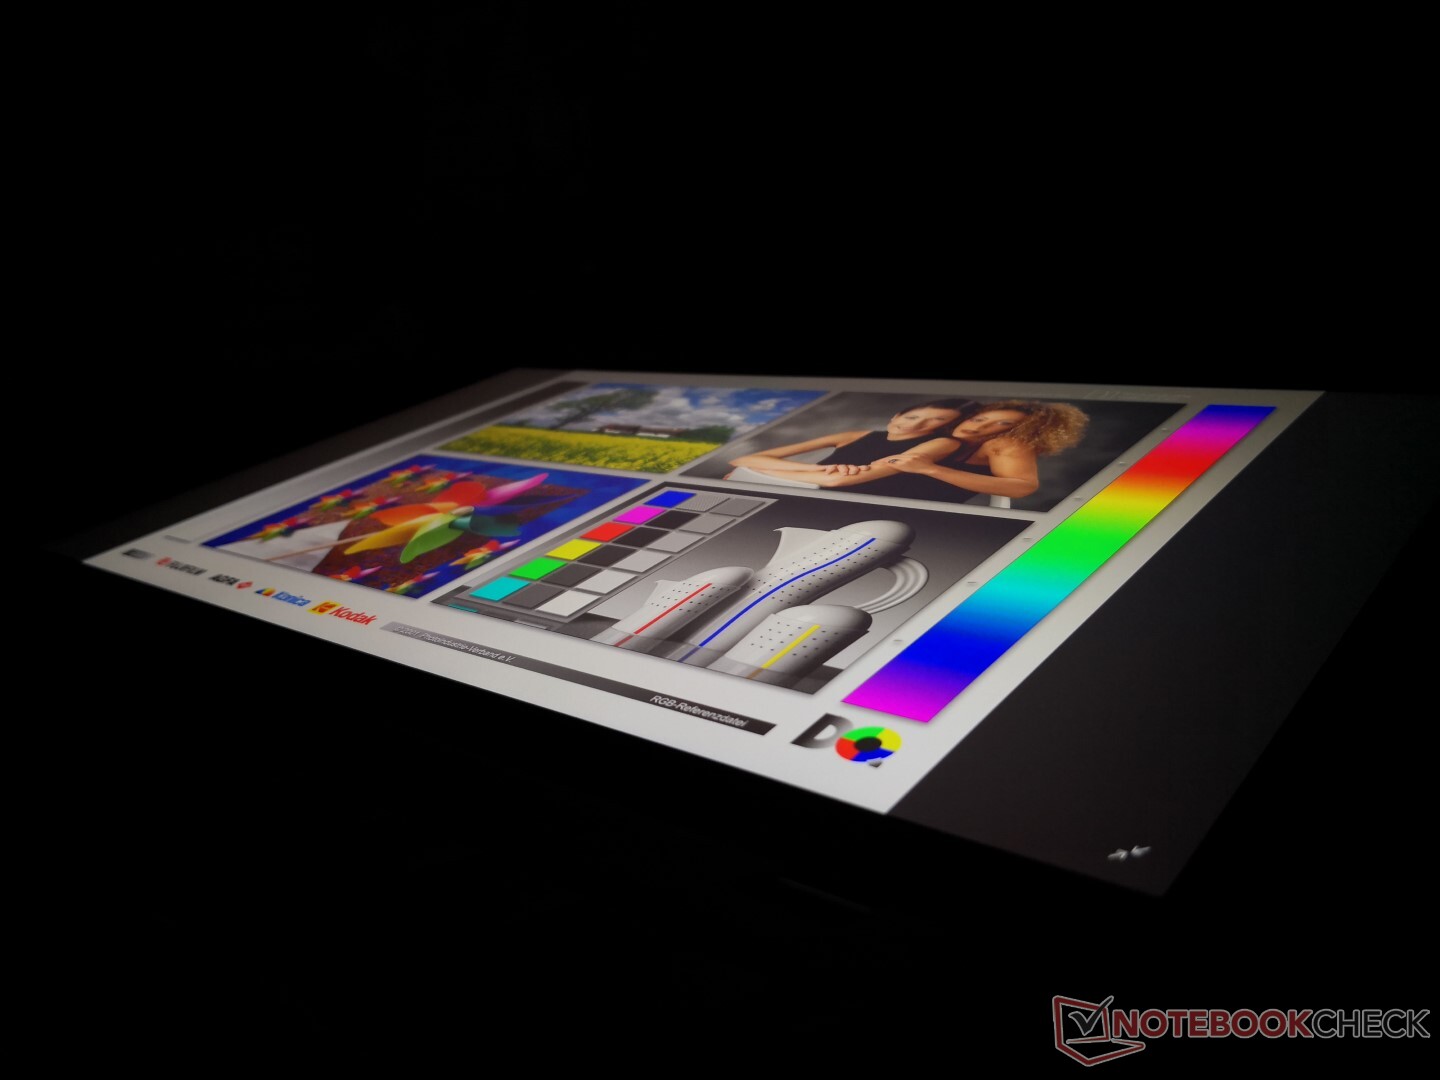
La qualità visiva è eccellente in quanto il display lucido è più nitido e luminoso e con una gamma di colori leggermente più ampia rispetto ai vecchi modelli. Lo svantaggio più grande è il tempo di risposta più lento per un ghosting più evidente, ma questo è un comune compromesso tra i display FHD e 4K UHD. Sfortunatamente, la modulazione di larghezza d'impulso è ora presente su tutti i livelli di luminosità, tranne il massimo che può avere un impatto sugli utenti sensibili allo sfarfallio dello schermo.


| |||||||||||||||||||||||||
Distribuzione della luminosità: 90 %
Al centro con la batteria: 532 cd/m²
Contrasto: 1298:1 (Nero: 0.41 cd/m²)
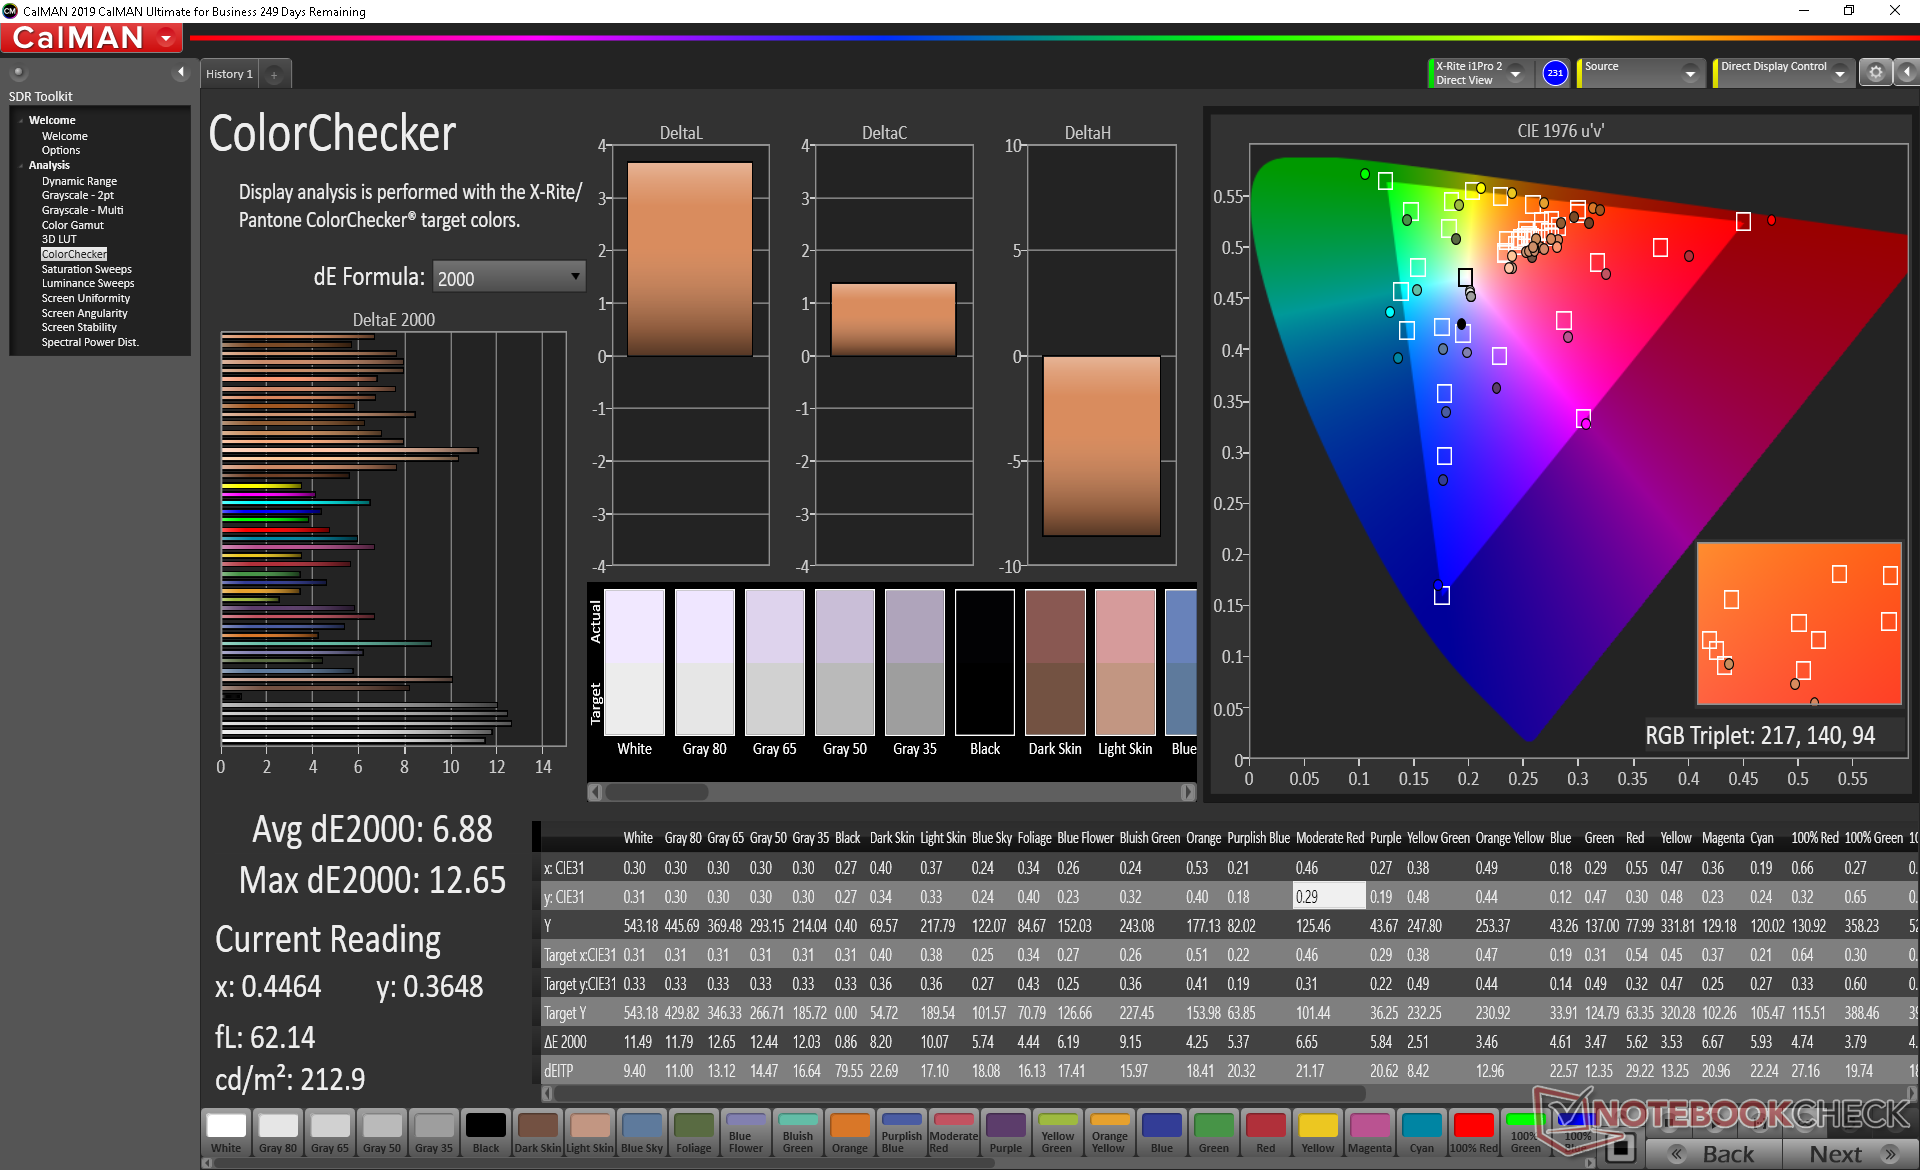
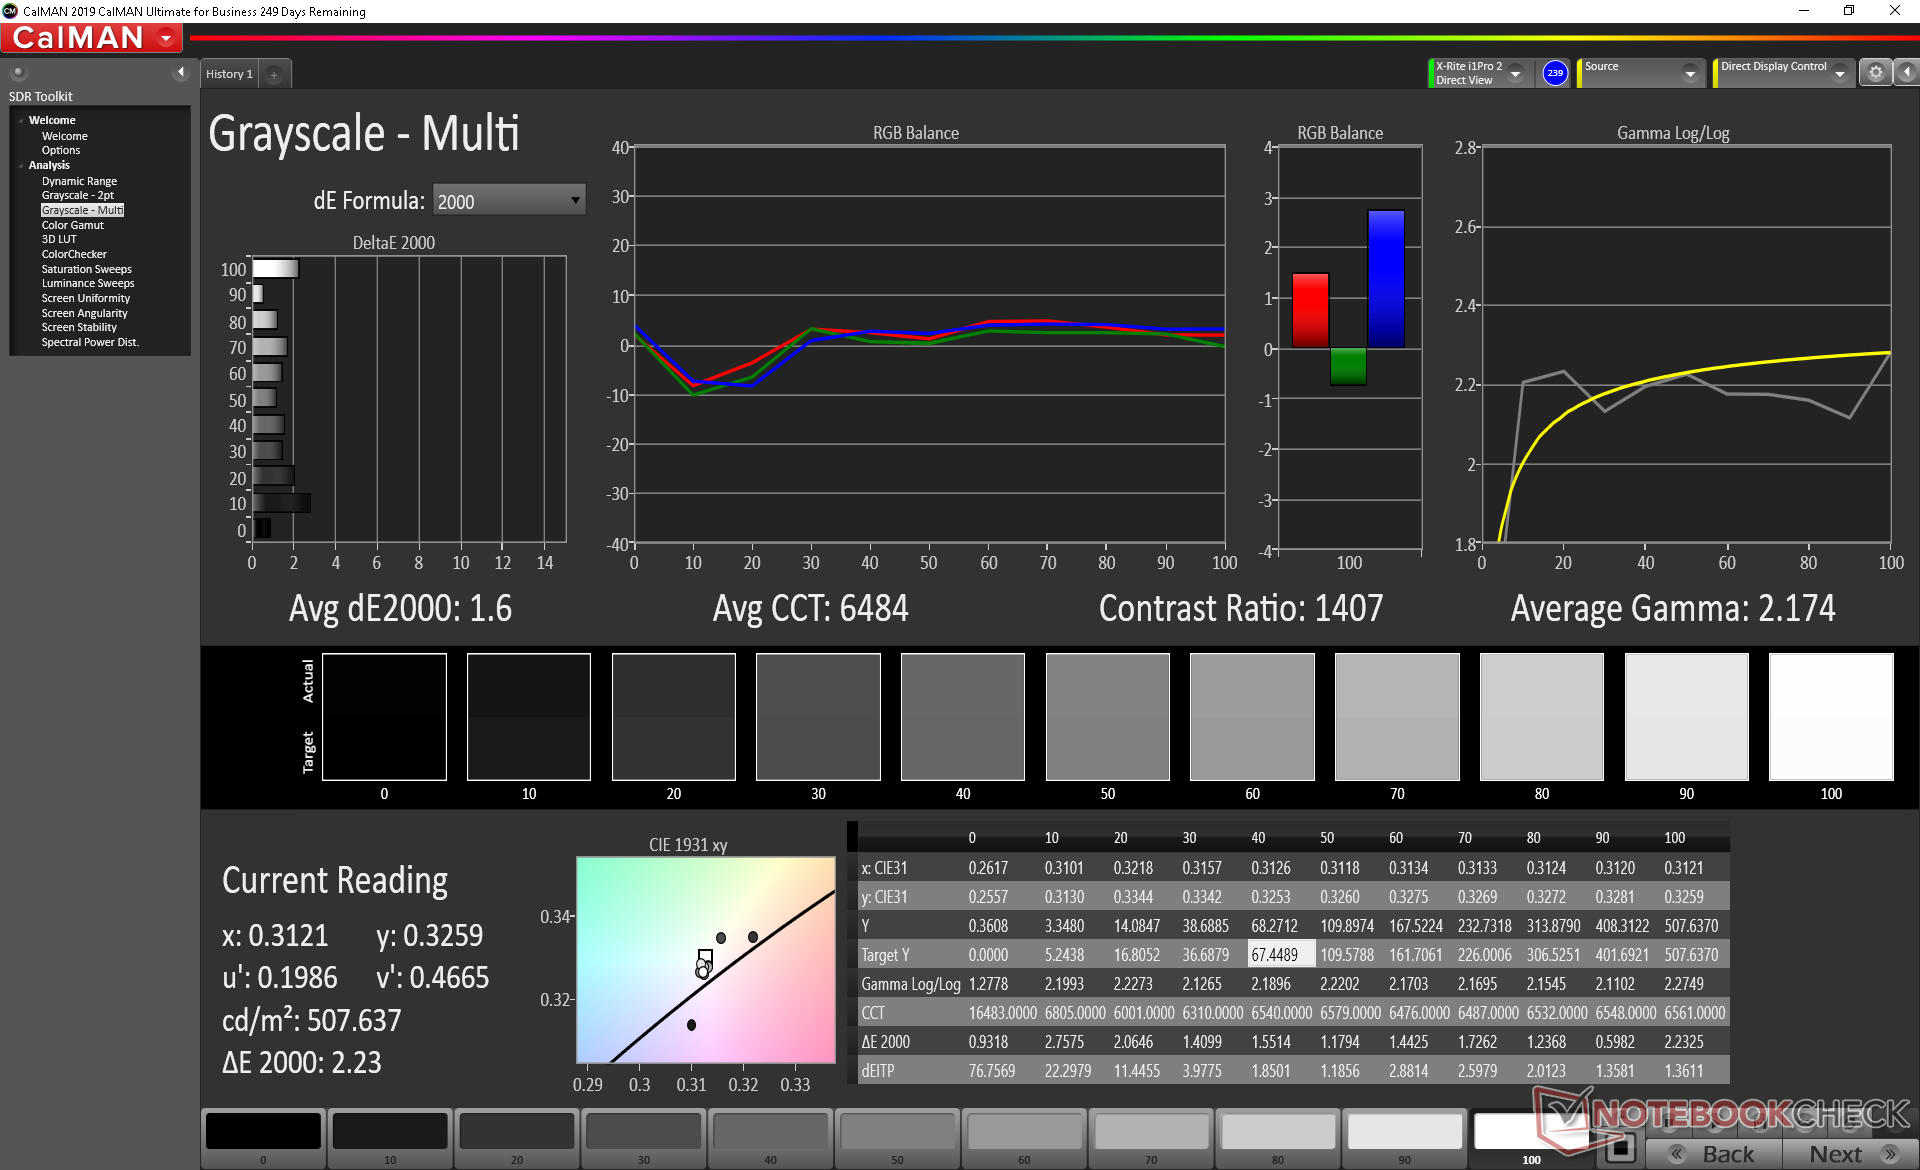
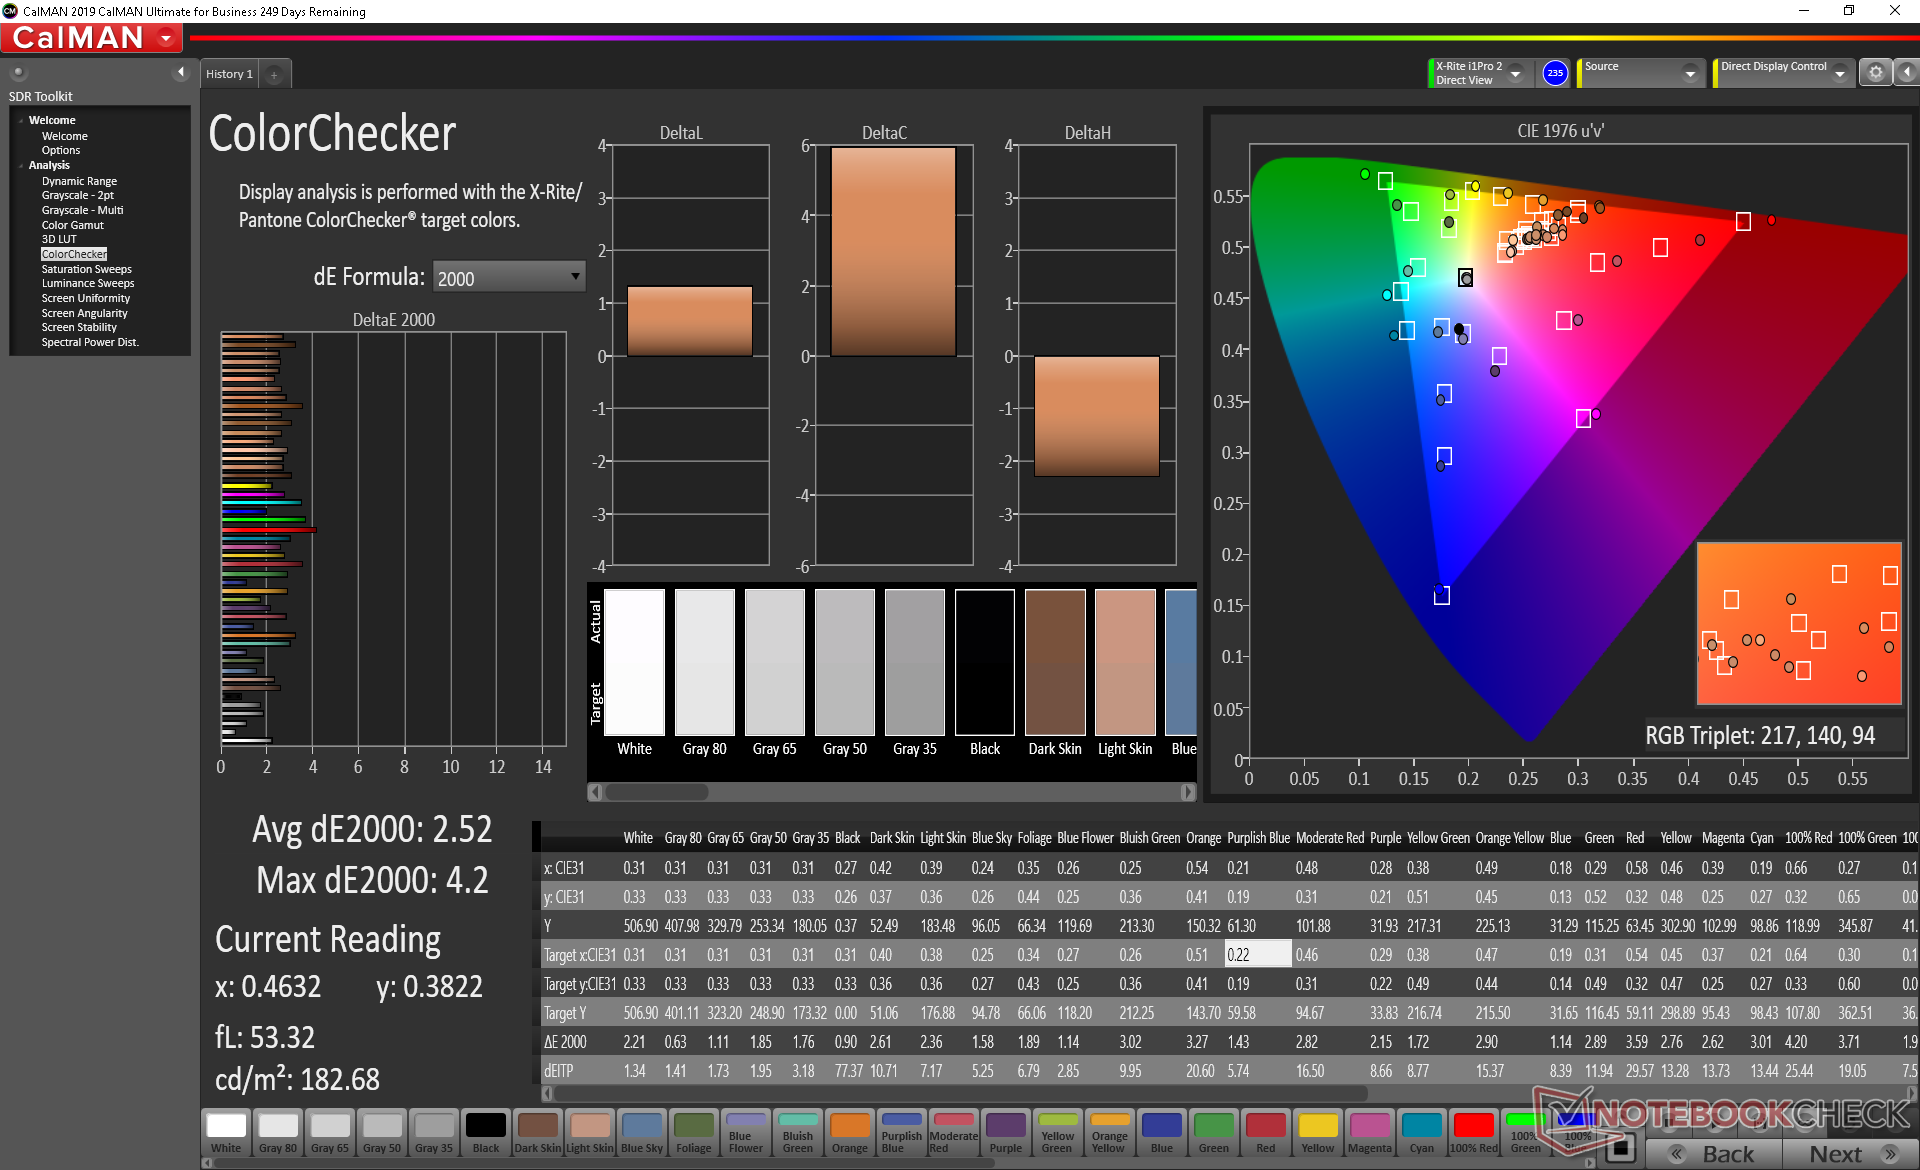
ΔE ColorChecker Calman: 6.88 | ∀{0.5-29.43 Ø4.73}
calibrated: 2.52
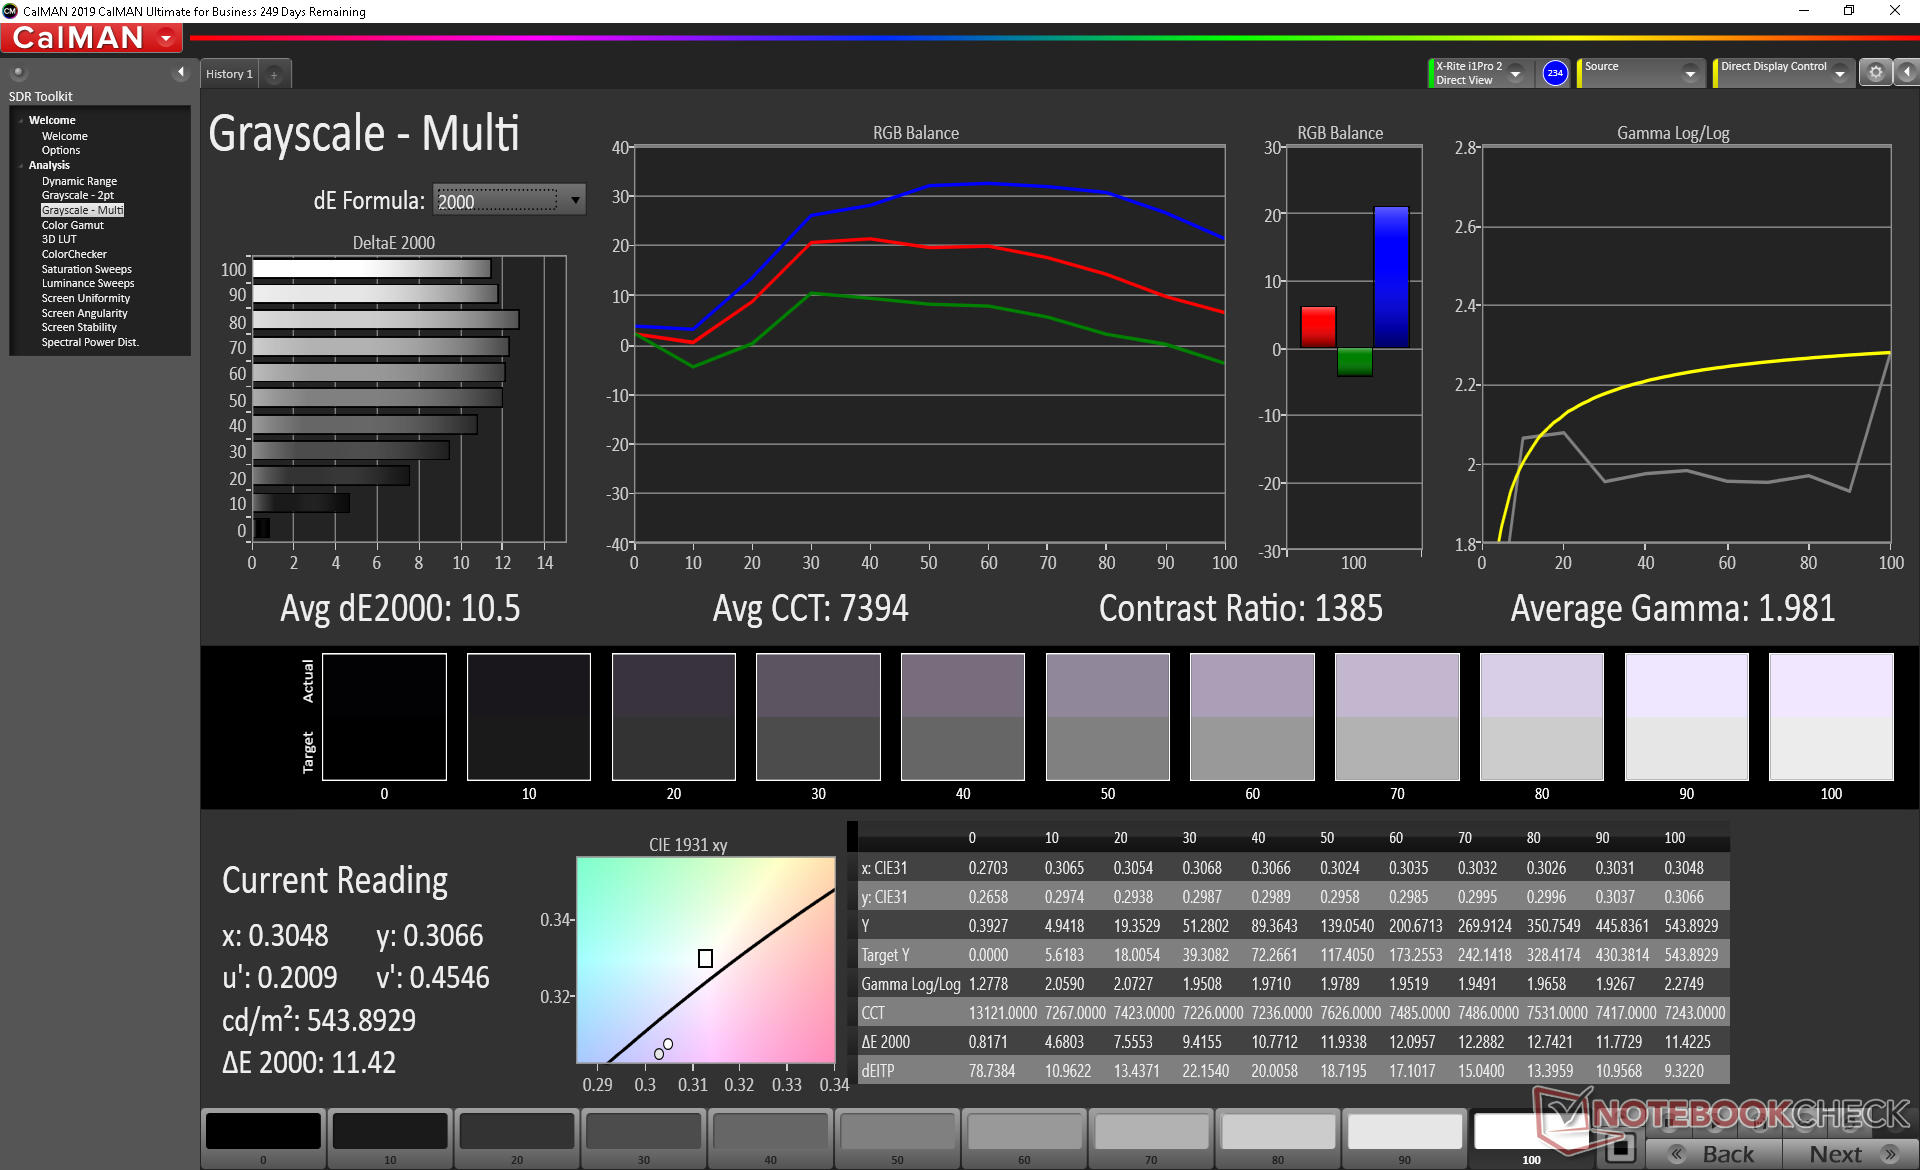
ΔE Greyscale Calman: 10.5 | ∀{0.09-98 Ø4.97}
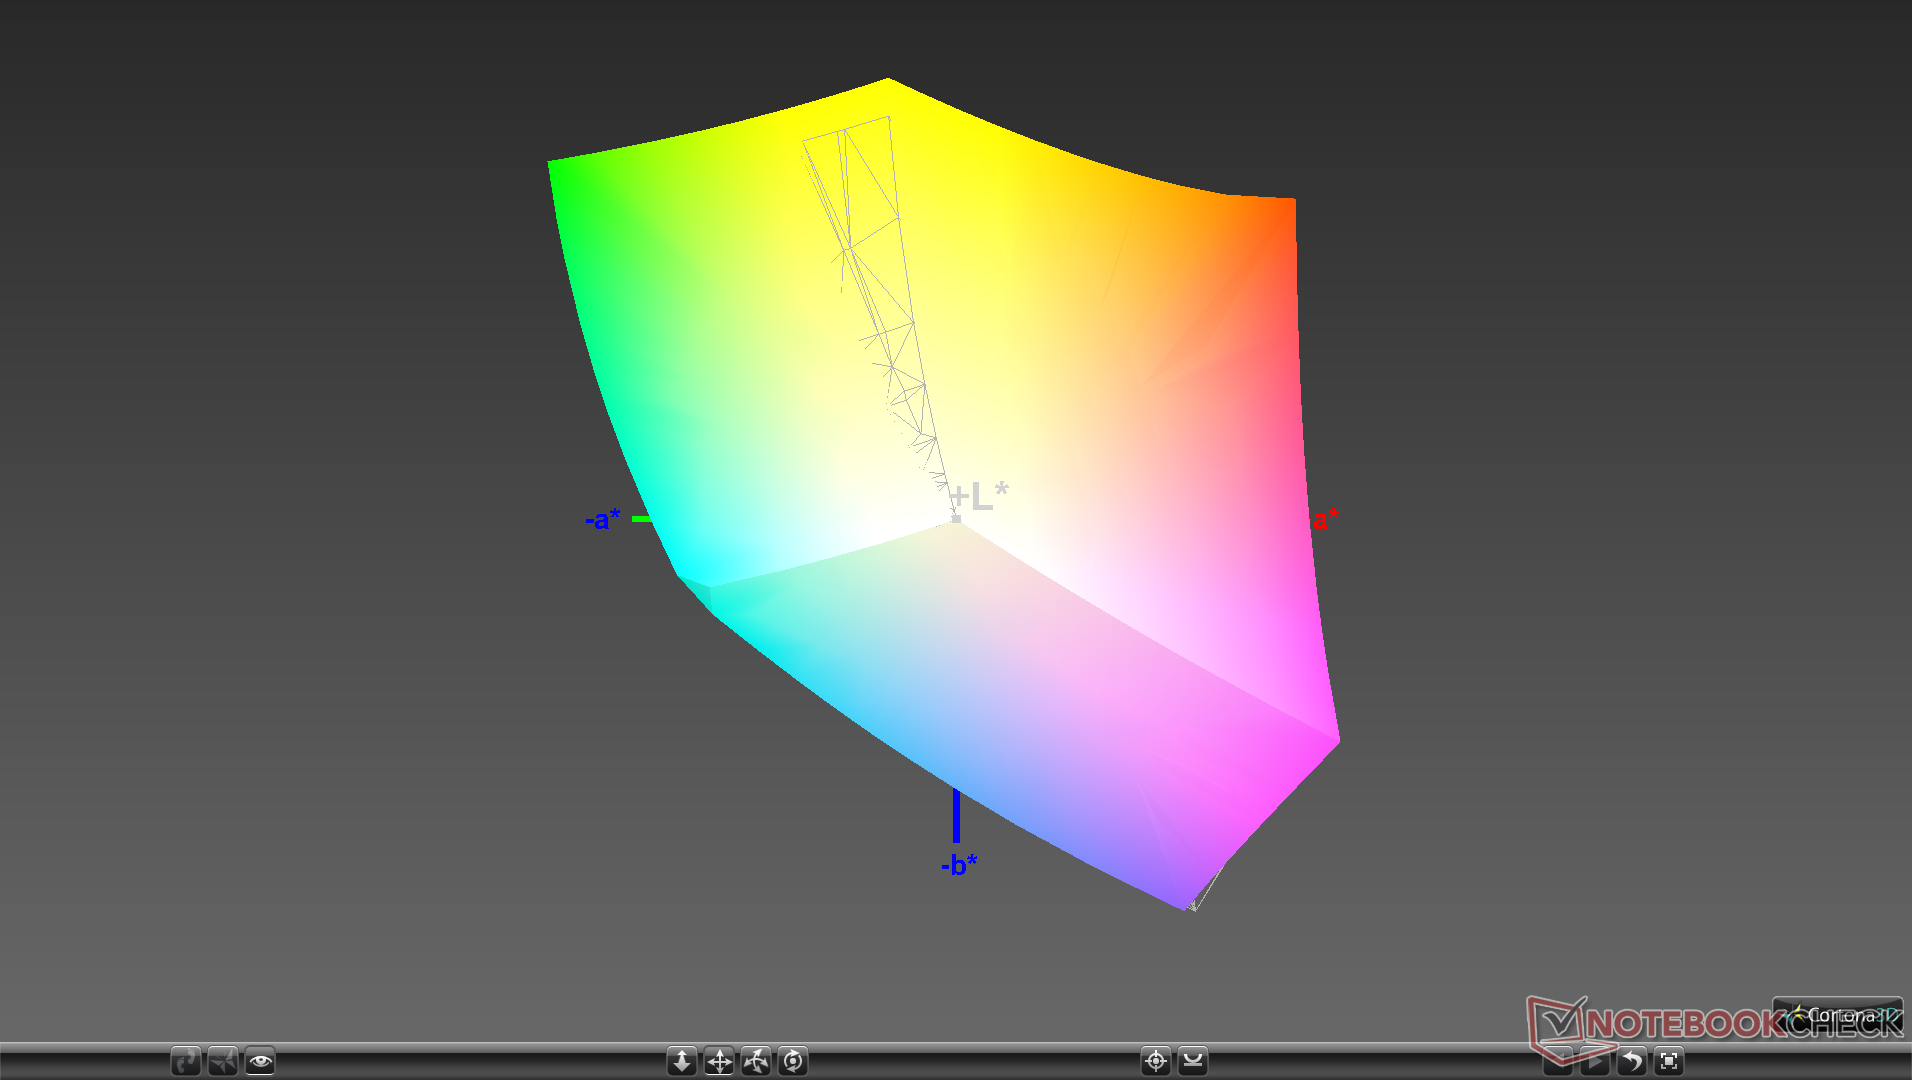
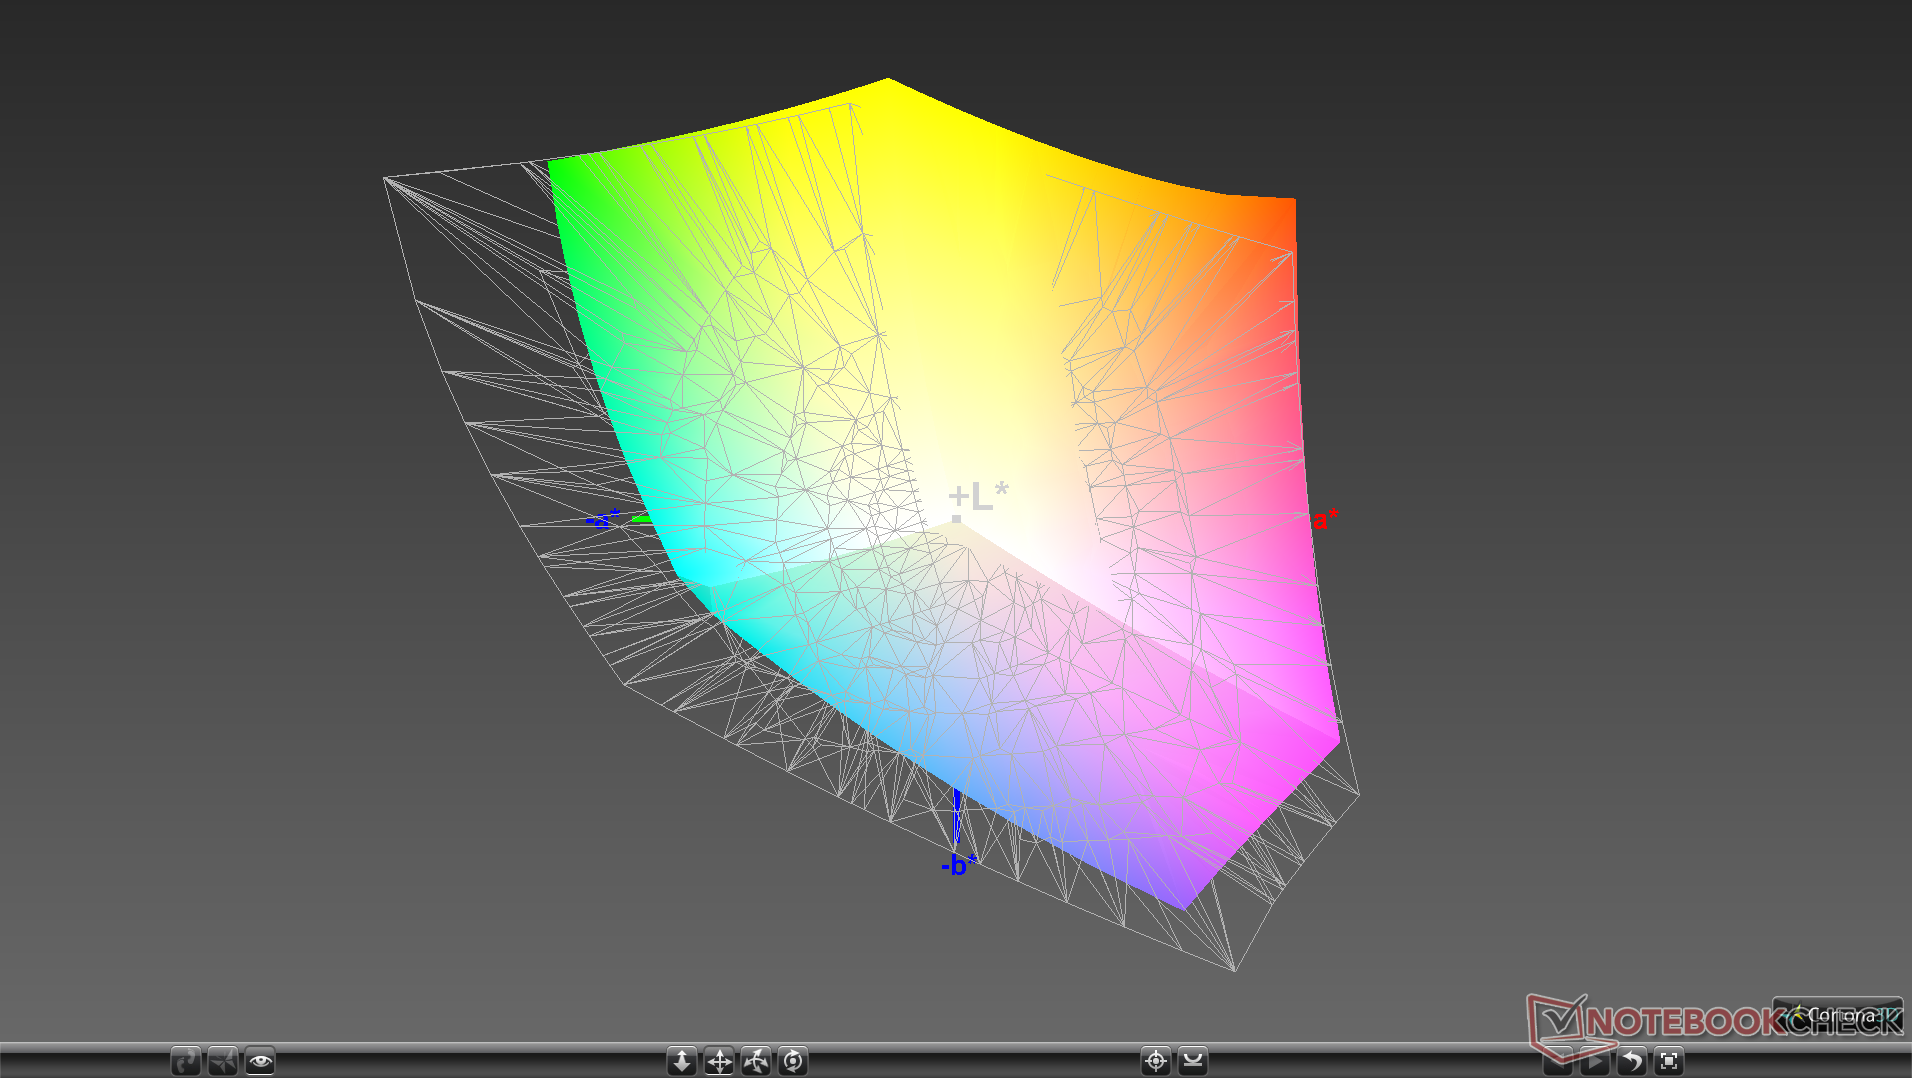
99.7% sRGB (Argyll 1.6.3 3D)
74.1% AdobeRGB 1998 (Argyll 1.6.3 3D)
83.1% AdobeRGB 1998 (Argyll 3D)
99.7% sRGB (Argyll 3D)
83% Display P3 (Argyll 3D)
Gamma: 1.98
CCT: 7394 K
| Lenovo ThinkPad X1 Carbon G7 20R1-000YUS BOE NV140QUM-N53, IPS, 14", 3840x2160 | Lenovo ThinkPad X1 Carbon 2019-20QD00M7GE N140HCR-GA2, IPS, 14", 1920x1080 | Lenovo ThinkPad X1 Carbon 2018-20KGS5DU00 LP140QH2-SPB1, IPS, 14", 2560x1440 | Lenovo ThinkPad X1 Carbon G6-20KG0025UK Lenovo LEN40A9 / AUO B140HAK02.3, IPS, 14", 1920x1080 | Lenovo ThinkPad X1 Carbon 2017-20HR0021GE B140HAN03_1, IPS, 14", 1920x1080 | Lenovo ThinkPad X1 Carbon Touch 20A7-002DGE LG Philips LP140GH1-SPA2, IPS-Panel, 14", 2560x1440 | |
|---|---|---|---|---|---|---|
| Display | -11% | -8% | -13% | -21% | -30% | |
| Display P3 Coverage (%) | 83 | 68.3 -18% | 72.7 -12% | 68.3 -18% | 61.6 -26% | 54.1 -35% |
| sRGB Coverage (%) | 99.7 | 98.6 -1% | 97.9 -2% | 94.9 -5% | 87.6 -12% | 77.5 -22% |
| AdobeRGB 1998 Coverage (%) | 83.1 | 70.3 -15% | 74.6 -10% | 69.3 -17% | 62.6 -25% | 55.2 -34% |
| Response Times | 17% | 21% | 21% | 4% | ||
| Response Time Grey 50% / Grey 80% * (ms) | 49.2 ? | 40.8 ? 17% | 38 ? 23% | 40 ? 19% | 48 ? 2% | |
| Response Time Black / White * (ms) | 32.2 ? | 27.2 ? 16% | 26 ? 19% | 25 ? 22% | 30.4 ? 6% | |
| PWM Frequency (Hz) | 201.6 ? | 25000 ? | ||||
| Screen | 20% | 1% | 19% | 11% | -11% | |
| Brightness middle (cd/m²) | 532 | 406 -24% | 316 -41% | 298 -44% | 278 -48% | 228 -57% |
| Brightness (cd/m²) | 513 | 372 -27% | 311 -39% | 287 -44% | 271 -47% | 226 -56% |
| Brightness Distribution (%) | 90 | 88 -2% | 84 -7% | 91 1% | 91 1% | 89 -1% |
| Black Level * (cd/m²) | 0.41 | 0.25 39% | 0.35 15% | 0.2 51% | 0.16 61% | 0.23 44% |
| Contrast (:1) | 1298 | 1624 25% | 903 -30% | 1490 15% | 1738 34% | 991 -24% |
| Colorchecker dE 2000 * | 6.88 | 2.9 58% | 4.5 35% | 2.19 68% | 4.5 35% | 6.29 9% |
| Colorchecker dE 2000 max. * | 12.65 | 6.1 52% | 10.3 19% | 4.39 65% | 8.4 34% | |
| Colorchecker dE 2000 calibrated * | 2.52 | 1.1 56% | 1.6 37% | 1.67 34% | ||
| Greyscale dE 2000 * | 10.5 | 4.4 58% | 7.7 27% | 1.97 81% | 3.2 70% | 7.79 26% |
| Gamma | 1.98 111% | 2.24 98% | 2.2 100% | 2.43 91% | 2.02 109% | 2.36 93% |
| CCT | 7394 88% | 5967 109% | 6639 98% | 6571 99% | 7042 92% | 5531 118% |
| Color Space (Percent of AdobeRGB 1998) (%) | 74.1 | 63.4 -14% | 68.6 -7% | 62 -16% | 57 -23% | 51.7 -30% |
| Color Space (Percent of sRGB) (%) | 99.7 | 98.6 -1% | 97.9 -2% | 95 -5% | 87.5 -12% | |
| Media totale (Programma / Settaggio) | 9% /
14% | 5% /
2% | 9% /
13% | -2% /
3% | -21% /
-16% |
* ... Meglio usare valori piccoli
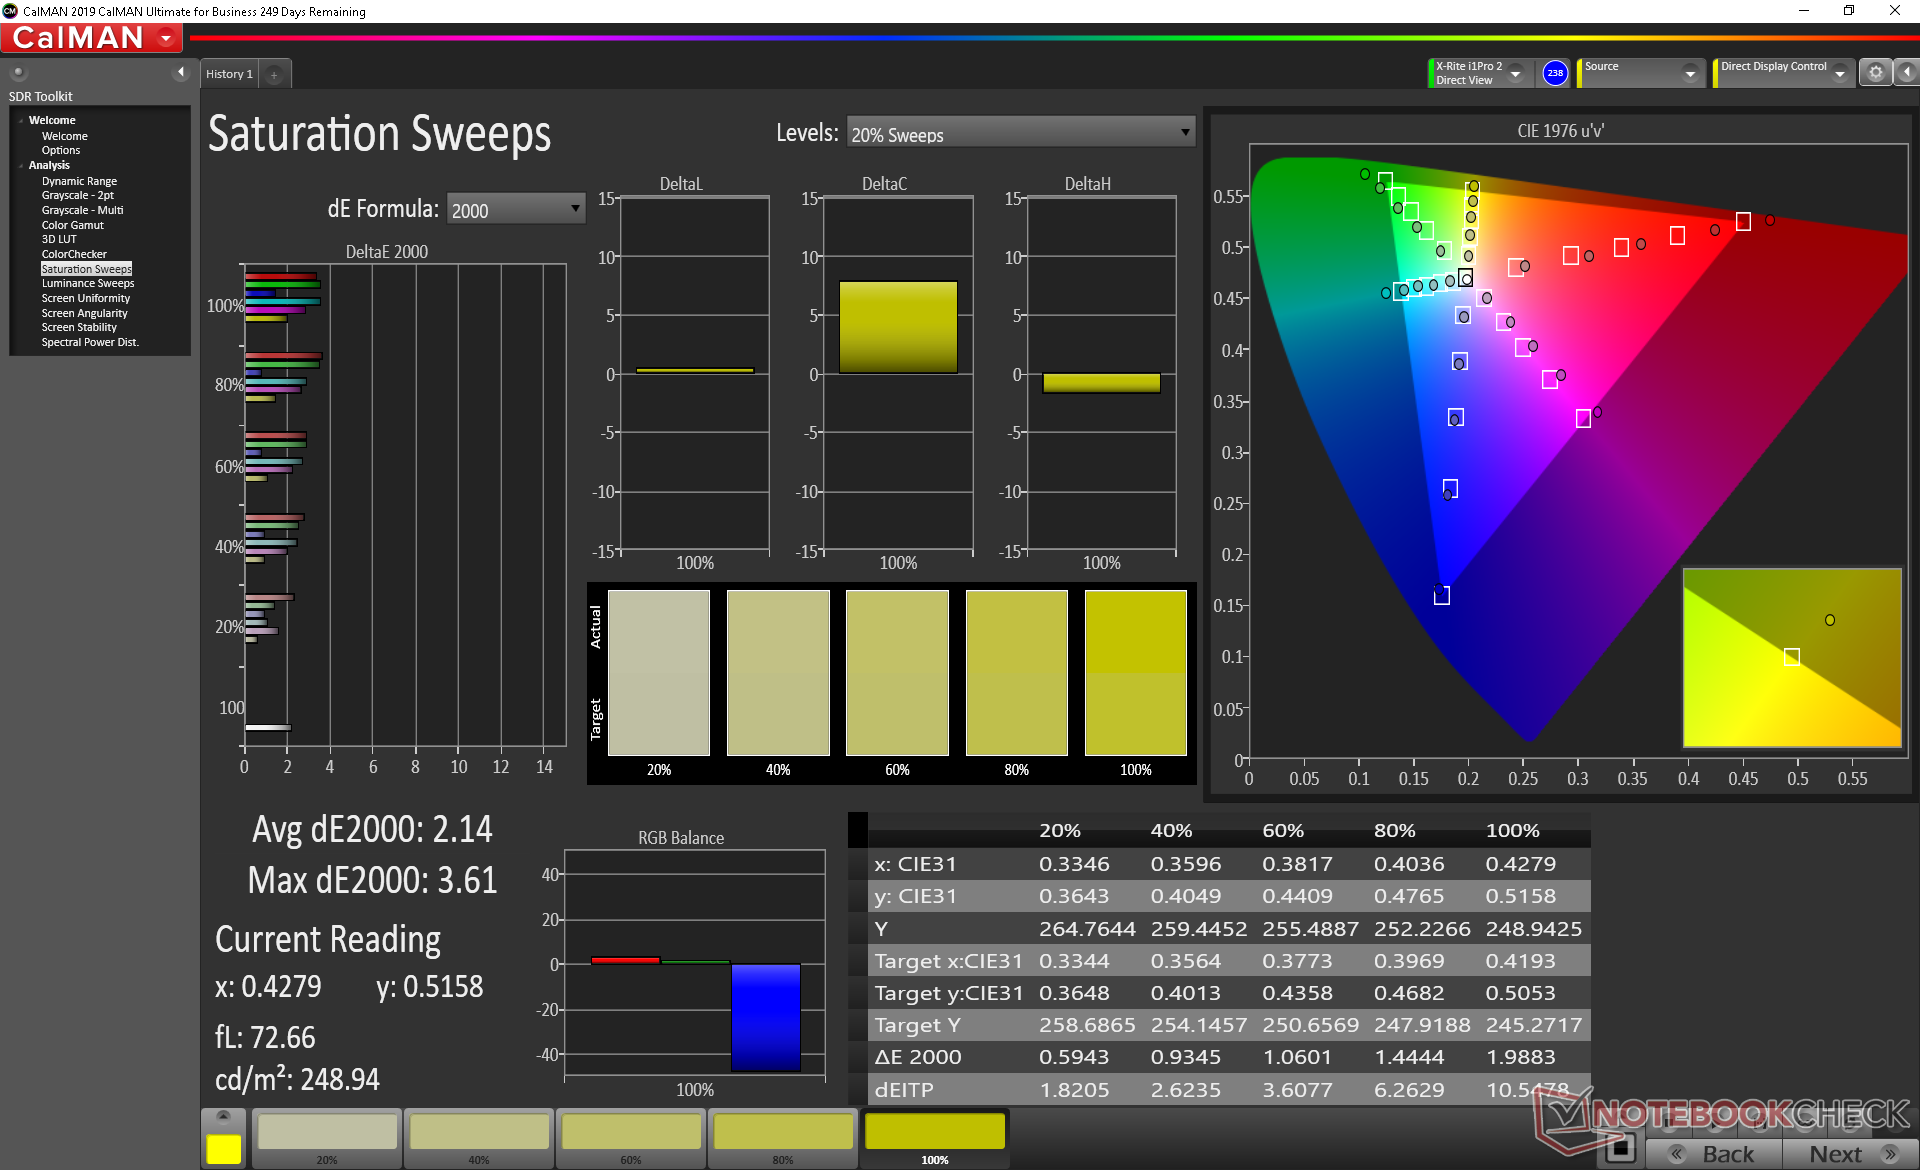
Lo spazio colore copre tutto il sRGB e il 74% di AdobeRGB risultando essere leggermente più grande rispetto alla maggior parte degli altri subnotebook di punta. Le soluzioni UHD da 15,6 pollici e 4K UHD più grandi come la serie XPS 15, Razer Blade 15 o ZenBook Pro hanno gamme ancora più ampie dell'88% di AdobeRGB o superiori per colori potenzialmente più precisi.
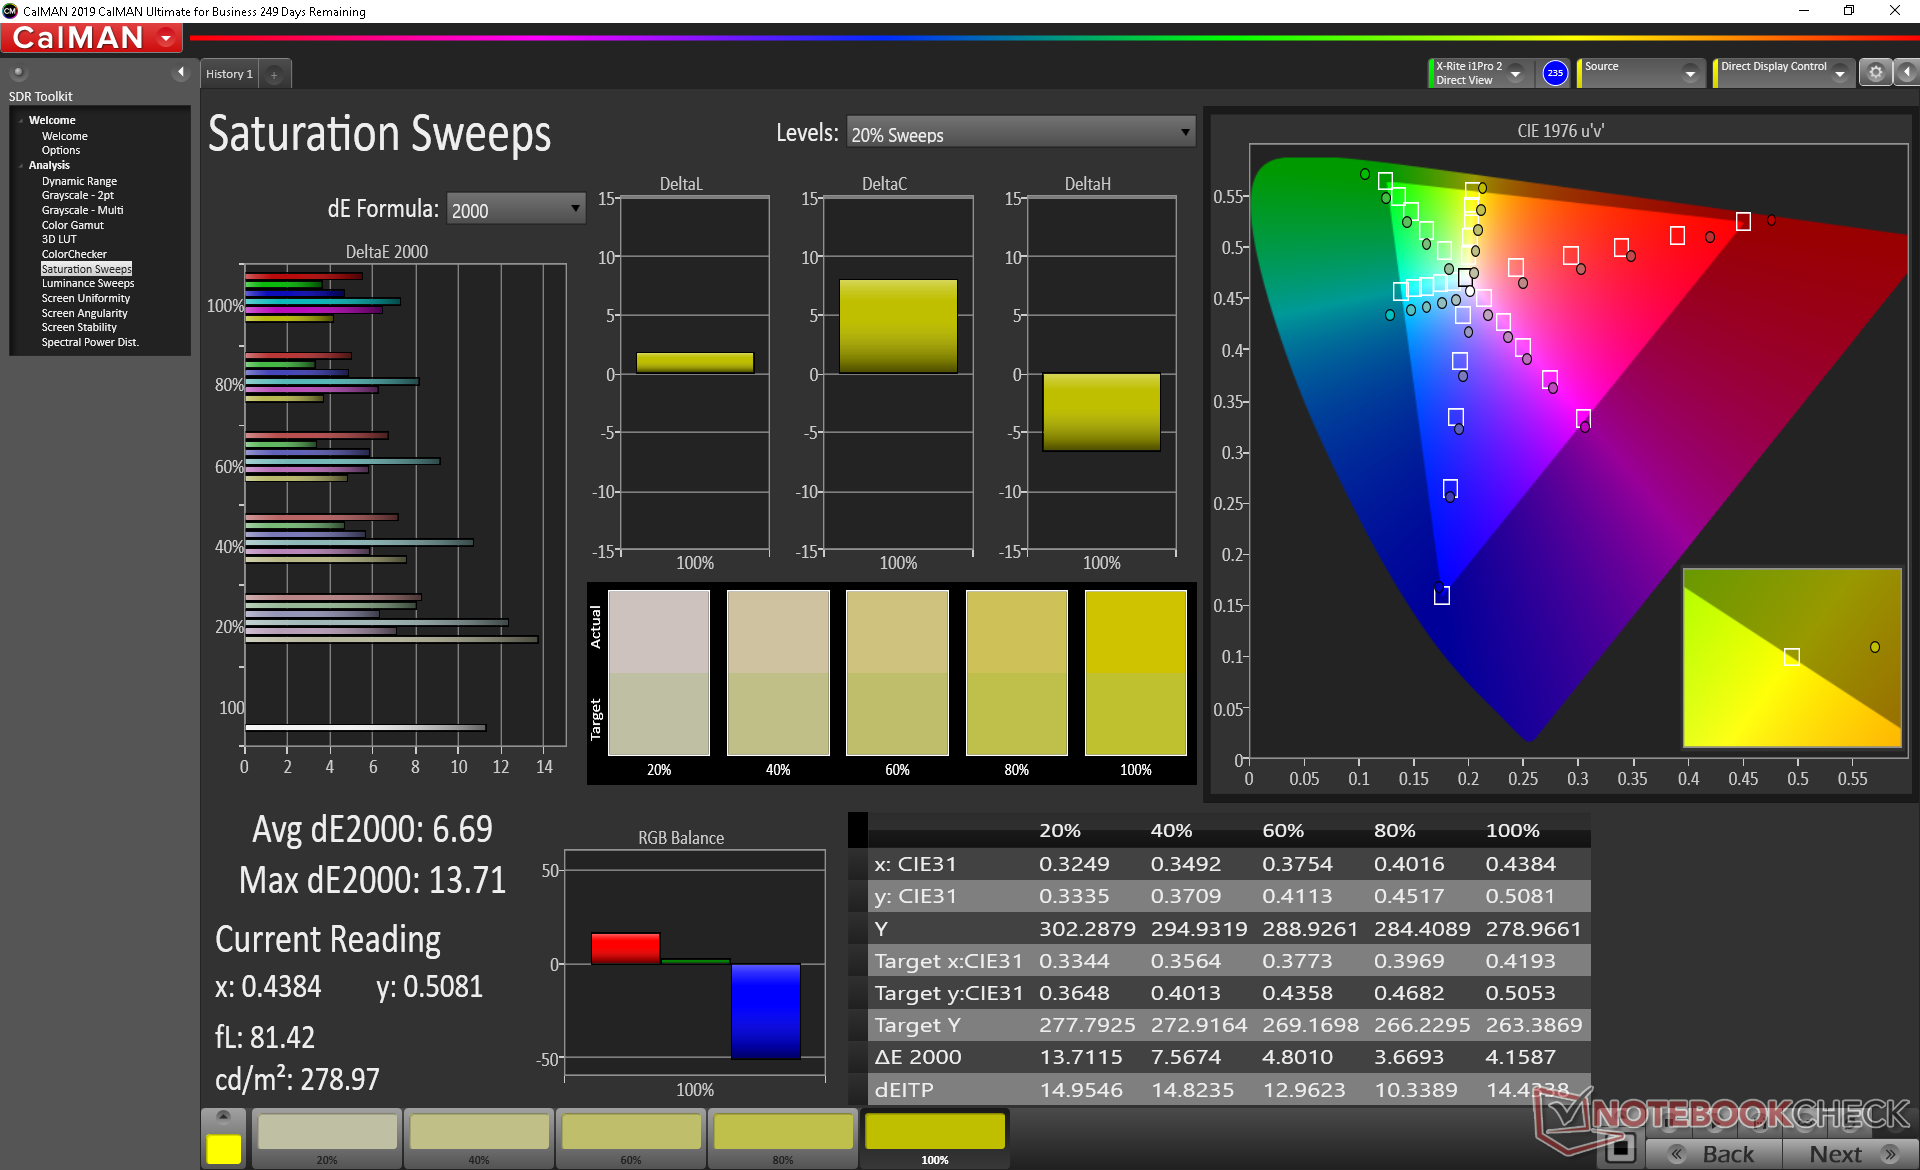
Ulteriori misurazioni con un colorimetro X-Rite rivelano che il display avrebbe potuto essere calibrato meglio. La temperatura del colore, per esempio, è sul lato freddo e il bilanciamento RGB è molto lontano. Il nostro tentativo di calibrazione migliora significativamente i colori e la scala dei grigi riducendo i valori medi DeltaE a soli 1 a 3. Si consiglia di giocare con il software Lenovo Display Optimizer o di applicare il nostro profilo ICM calibrato sopra per ottenere il massimo dal display.
Tempi di risposta del Display
| ↔ Tempi di risposta dal Nero al Bianco | ||
|---|---|---|
| 32.2 ms ... aumenta ↗ e diminuisce ↘ combinato | ↗ 19.2 ms Incremento | 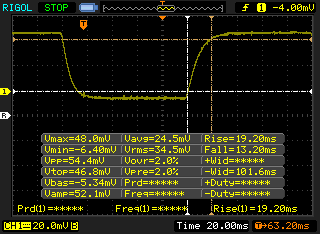 |
| ↘ 13.2 ms Calo | ||
| Lo schermo mostra tempi di risposta lenti nei nostri tests e sarà insoddisfacente per i gamers. In confronto, tutti i dispositivi di test variano da 0.1 (minimo) a 240 (massimo) ms. » 88 % di tutti i dispositivi è migliore. Questo significa che i tempi di risposta rilevati sono peggiori rispetto alla media di tutti i dispositivi testati (19.9 ms). | ||
| ↔ Tempo di risposta dal 50% Grigio all'80% Grigio | ||
| 49.2 ms ... aumenta ↗ e diminuisce ↘ combinato | ↗ 22 ms Incremento | 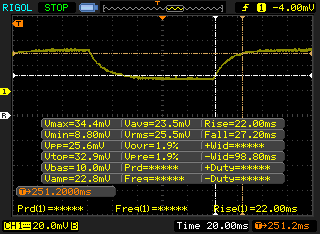 |
| ↘ 27.2 ms Calo | ||
| Lo schermo mostra tempi di risposta lenti nei nostri tests e sarà insoddisfacente per i gamers. In confronto, tutti i dispositivi di test variano da 0.165 (minimo) a 636 (massimo) ms. » 85 % di tutti i dispositivi è migliore. Questo significa che i tempi di risposta rilevati sono peggiori rispetto alla media di tutti i dispositivi testati (31.1 ms). | ||
Sfarfallio dello schermo / PWM (Pulse-Width Modulation)
| flickering dello schermo / PWM rilevato | 201.6 Hz | ≤ 99 % settaggio luminosita' | 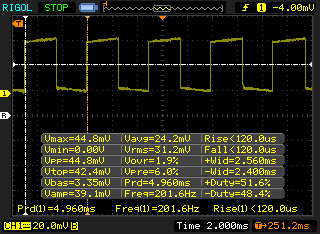 |
Il display sfarfalla a 201.6 Hz (Probabilmente a causa dell'uso di PWM) Flickering rilevato ad una luminosita' di 99 % o inferiore. Non dovrebbe verificarsi flickering o PWM sopra questo valore di luminosita'. La frequenza di 201.6 Hz è relativamente bassa, quindi gli utenti sensibili potrebbero notare il flickering ed accusare stanchezza agli occhi a questo livello di luminosità e a livelli inferiori. In confronto: 52 % di tutti i dispositivi testati non utilizza PWM per ridurre la luminosita' del display. Se è rilevato PWM, una media di 7801 (minimo: 5 - massimo: 343500) Hz è stata rilevata. | |||
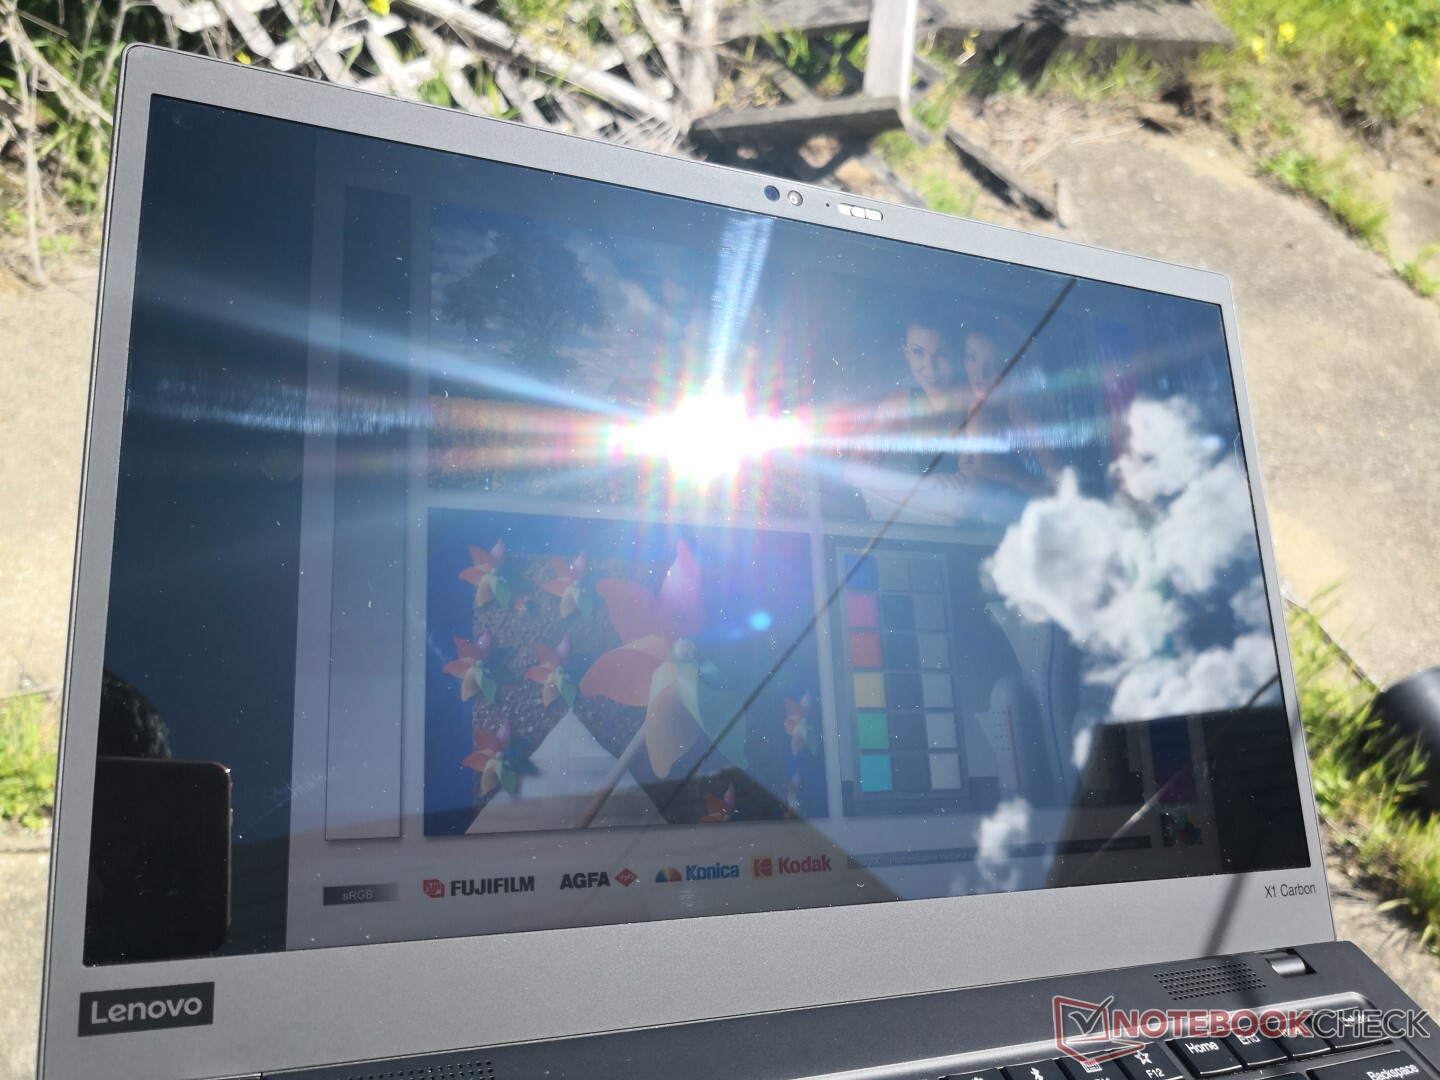
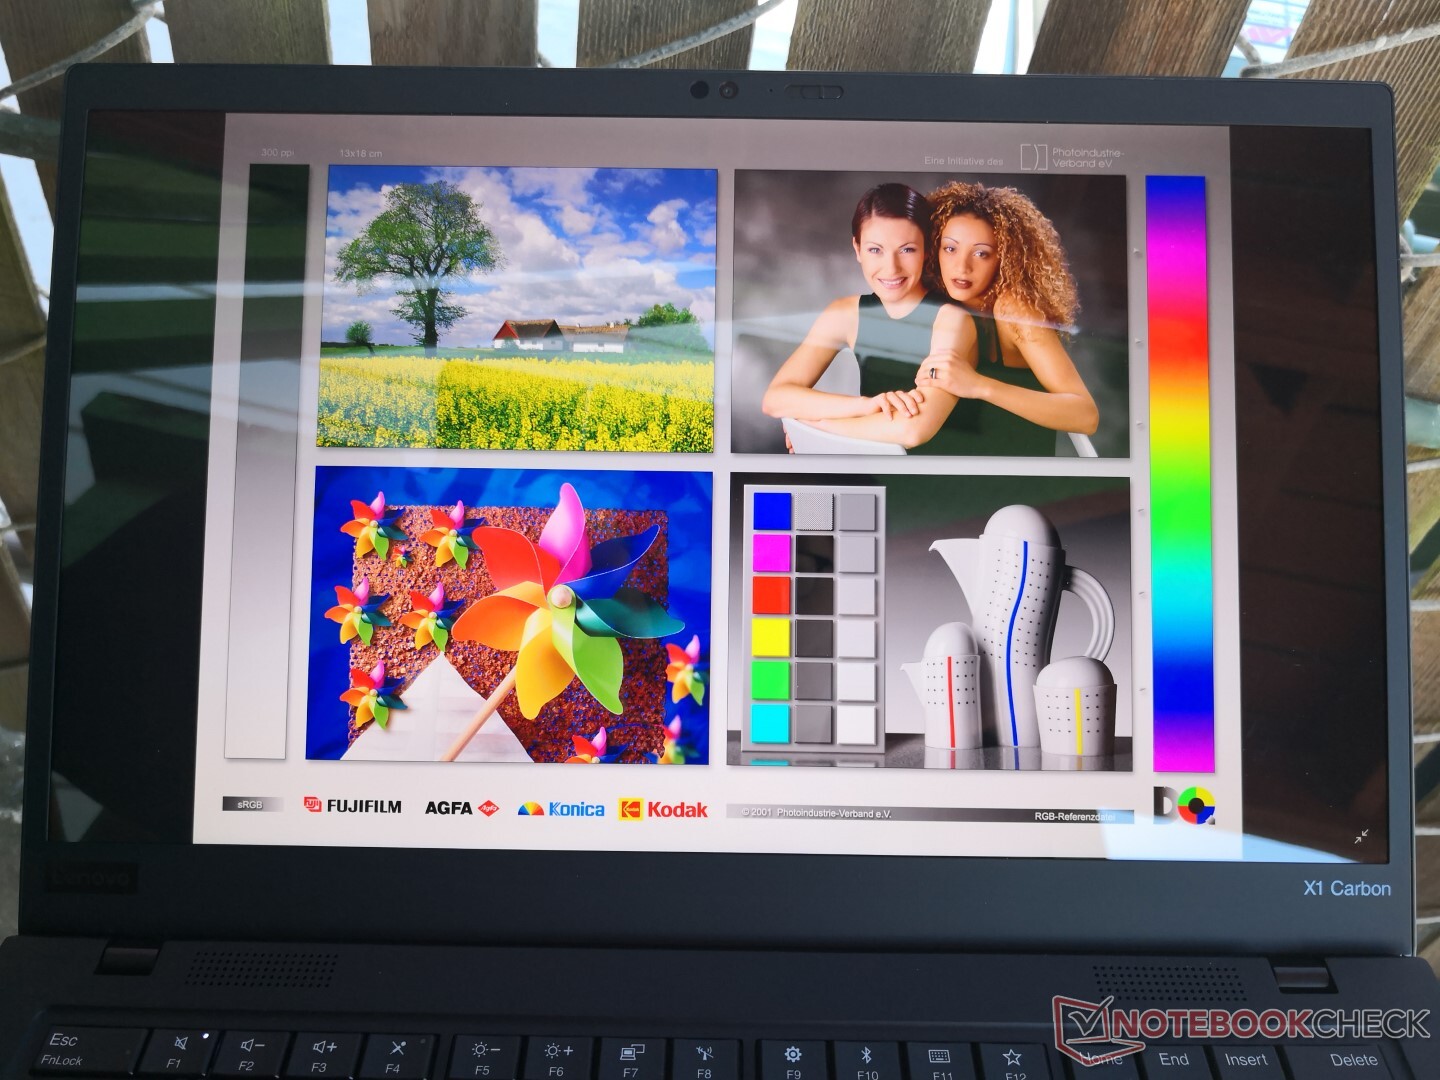
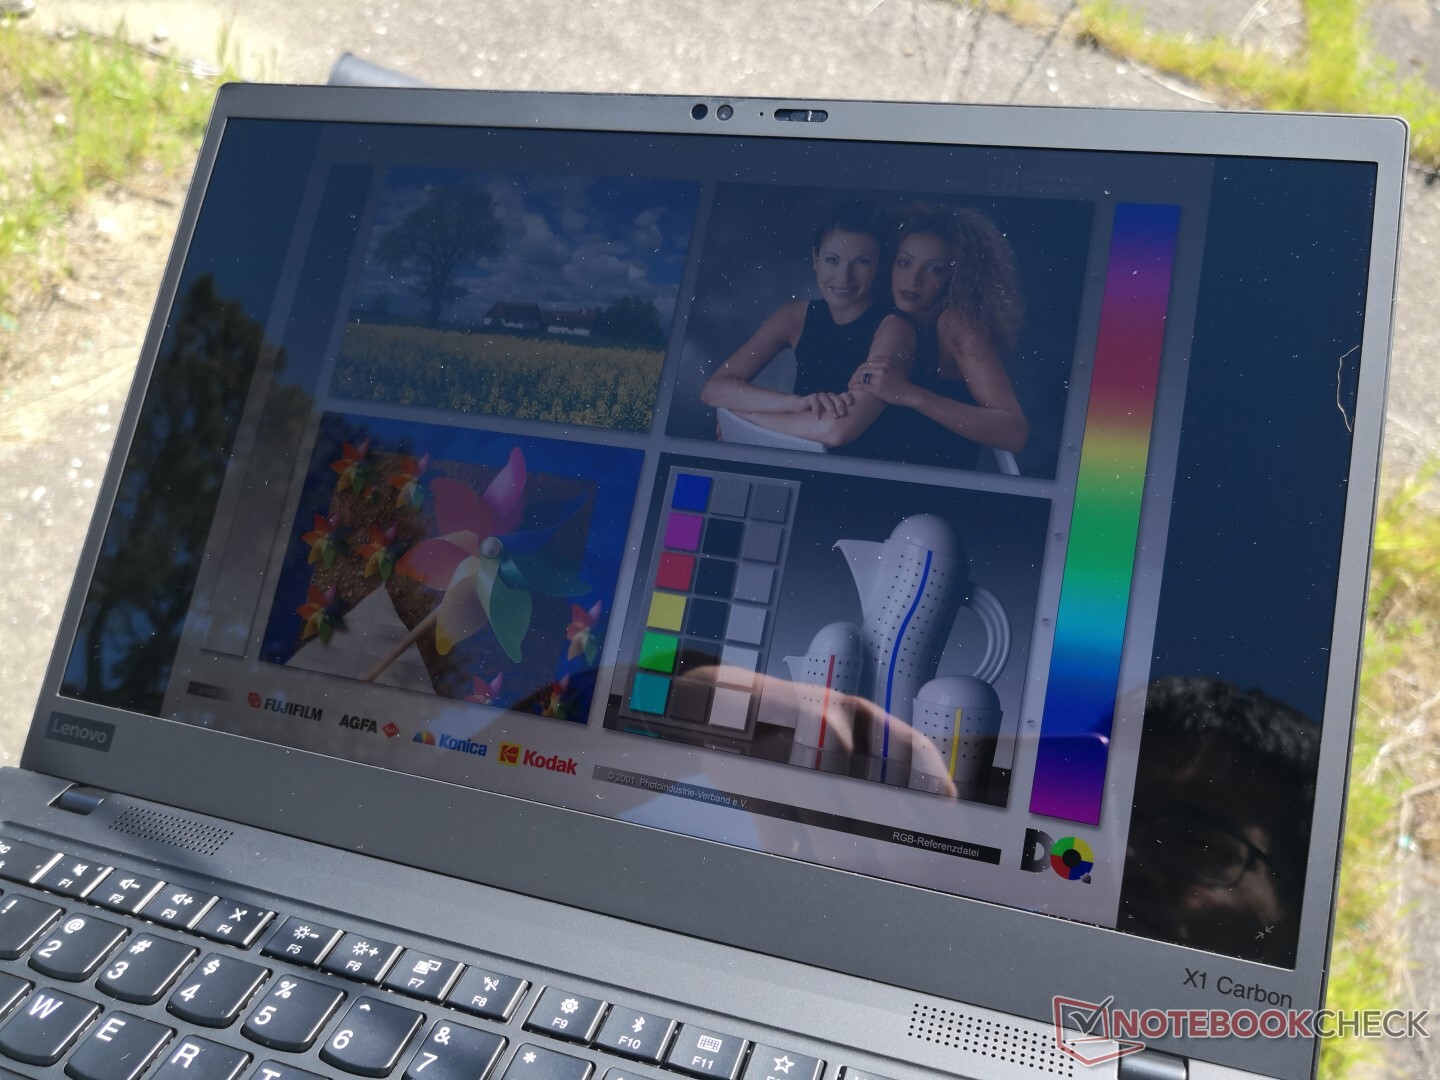
Il riflesso è inevitabile sul display lucido e la retroilluminazione non è neanche lontanamente sufficientemente luminosa per un uso confortevole quando si lavora sotto la luce del sole. Ciononostante, la visibilità all'aperto è comunque migliore rispetto ai modelli X1 Carbon 2018 o 2017, dove i display erano molto più luminosi. Gli ampi angoli di visualizzazione e le cerniere a 180 gradi aiutano a ridurre al minimo l'abbagliamento.
Prestazioni
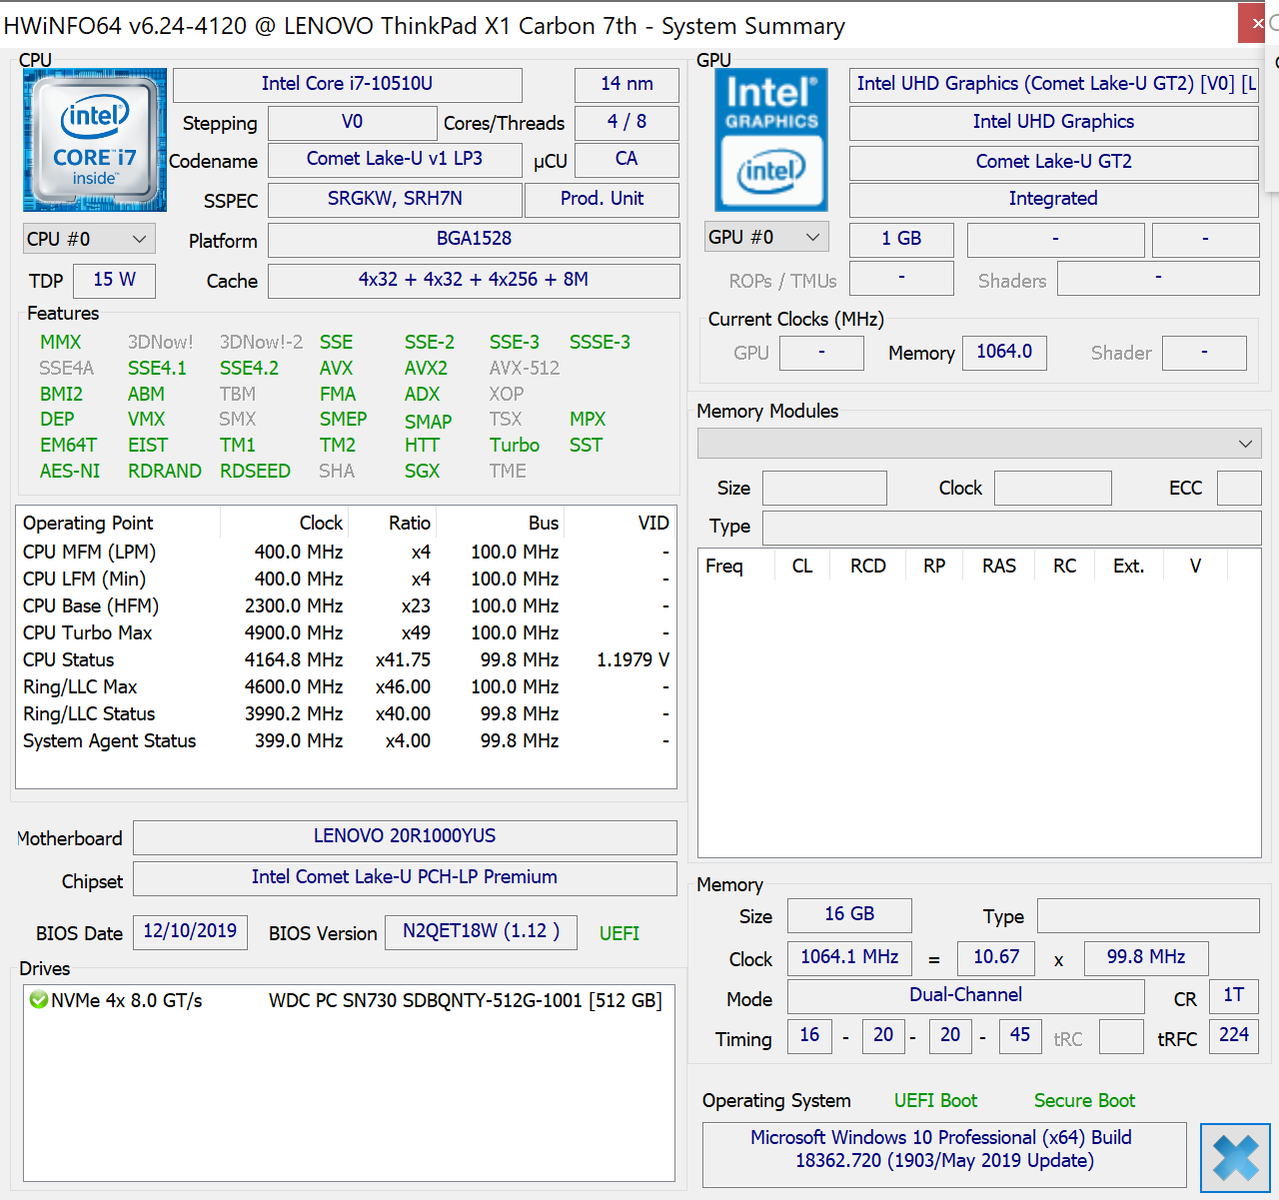
Come la maggior parte dei sistemi ThinkPad, Lenovo offre un'ampia gamma di opzioni di CPU e di display dall'8° gen quad-core Core i5-8265U fino al 10° gen hexa-core Core i7-10710U. Non ci sono GPU dedicate o opzioni Iris Plus, tuttavia, per cui non è necessario applicare editor fotografici pesanti o giocatori leggeri. Sarebbe stato bello vedere alcune opzioni AMD Ryzen, dato che la serie RX Vega è significativamente più veloce dell'UHD Graphics 620 senza bisogno della pausa da 15 W a 25 W TDP.
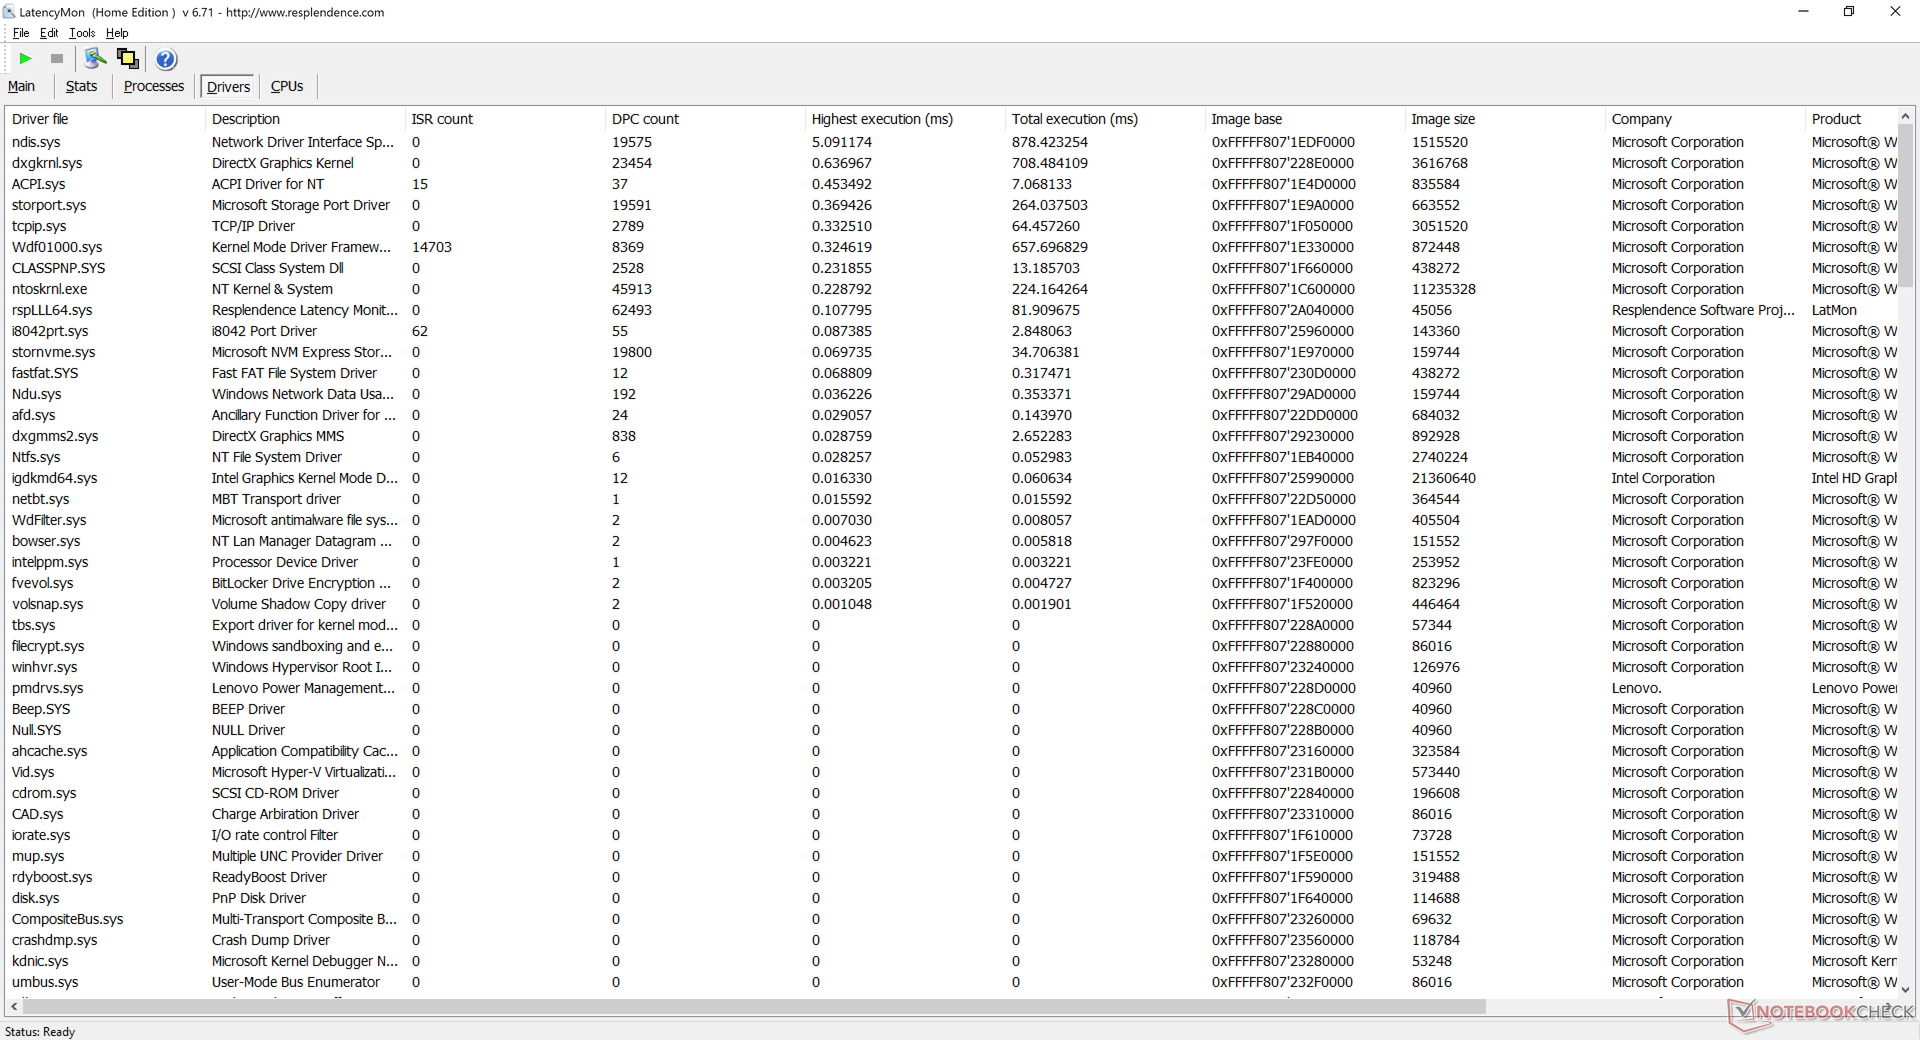
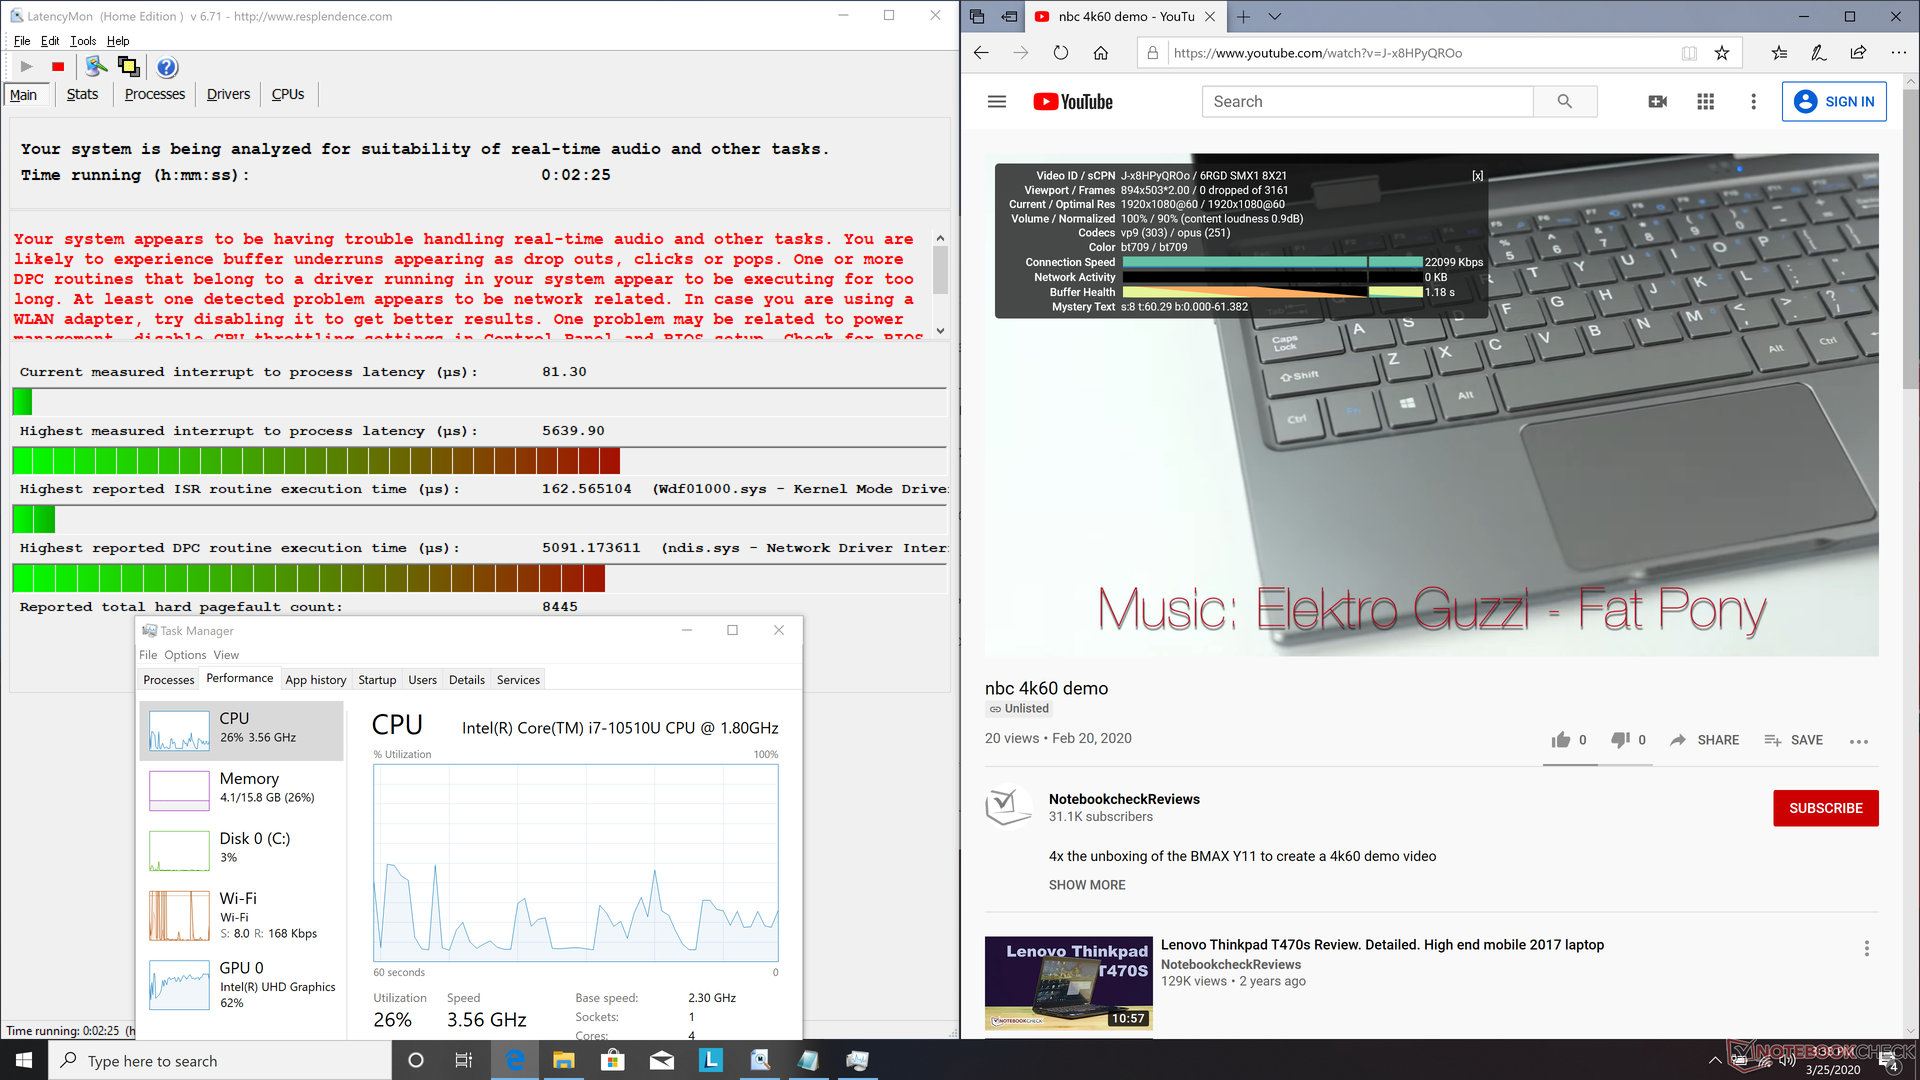
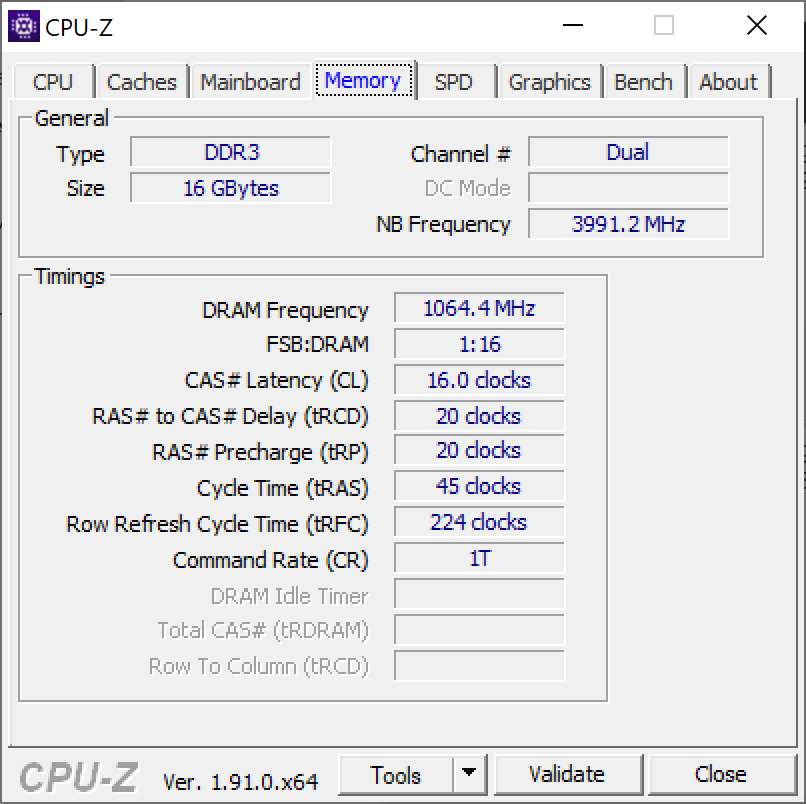
La RAM è saldata fino a 16 GB di LPDDR3-2133. Il sistema presenta problemi di latenza DPC durante la navigazione sul web, la riproduzione di video 4K su YouTube e l'esecuzione di Prime95 in sequenza.
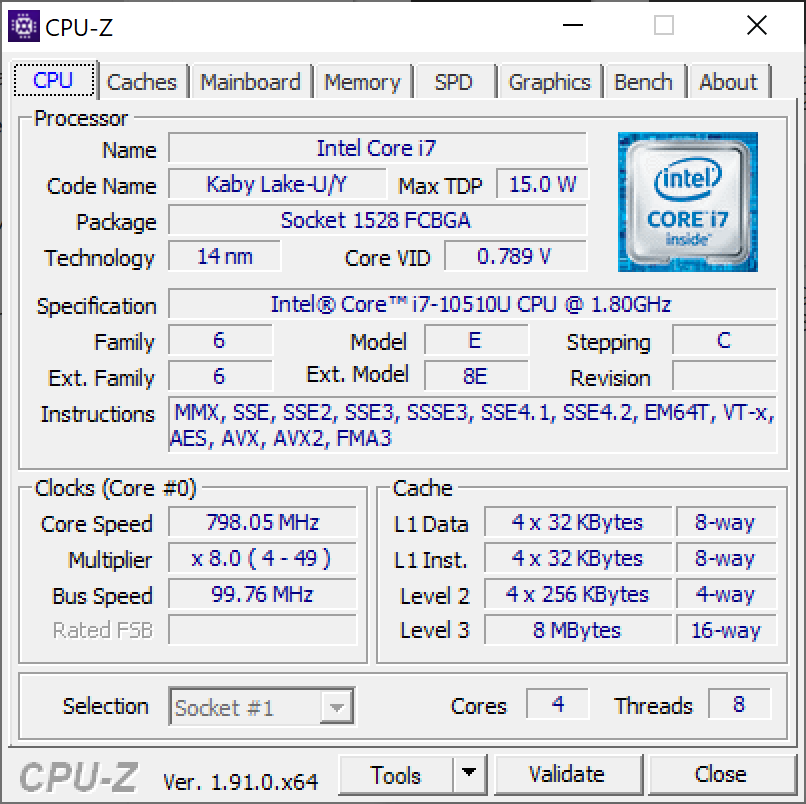
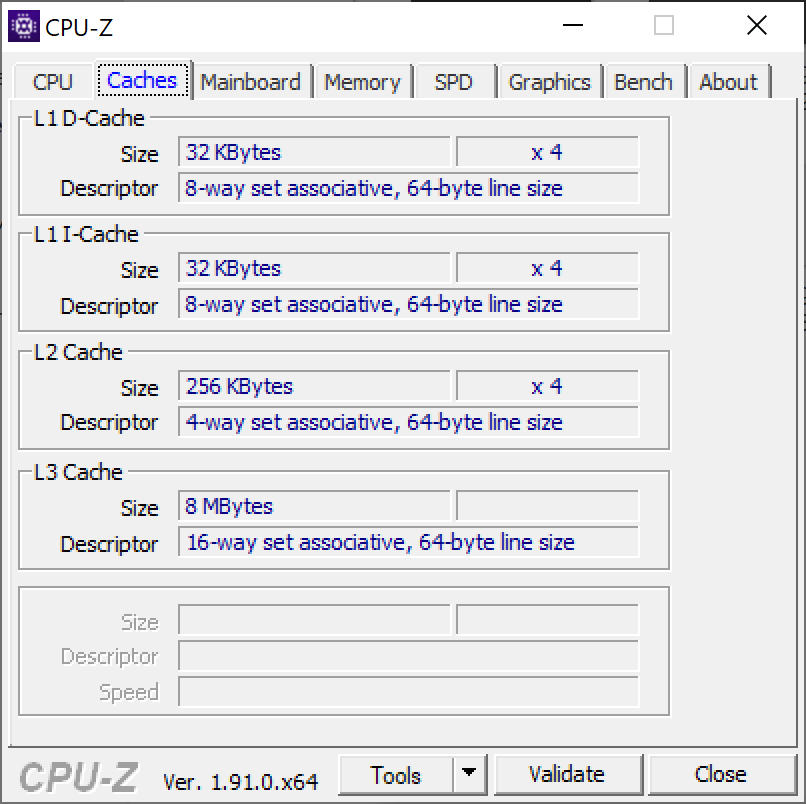
Processore
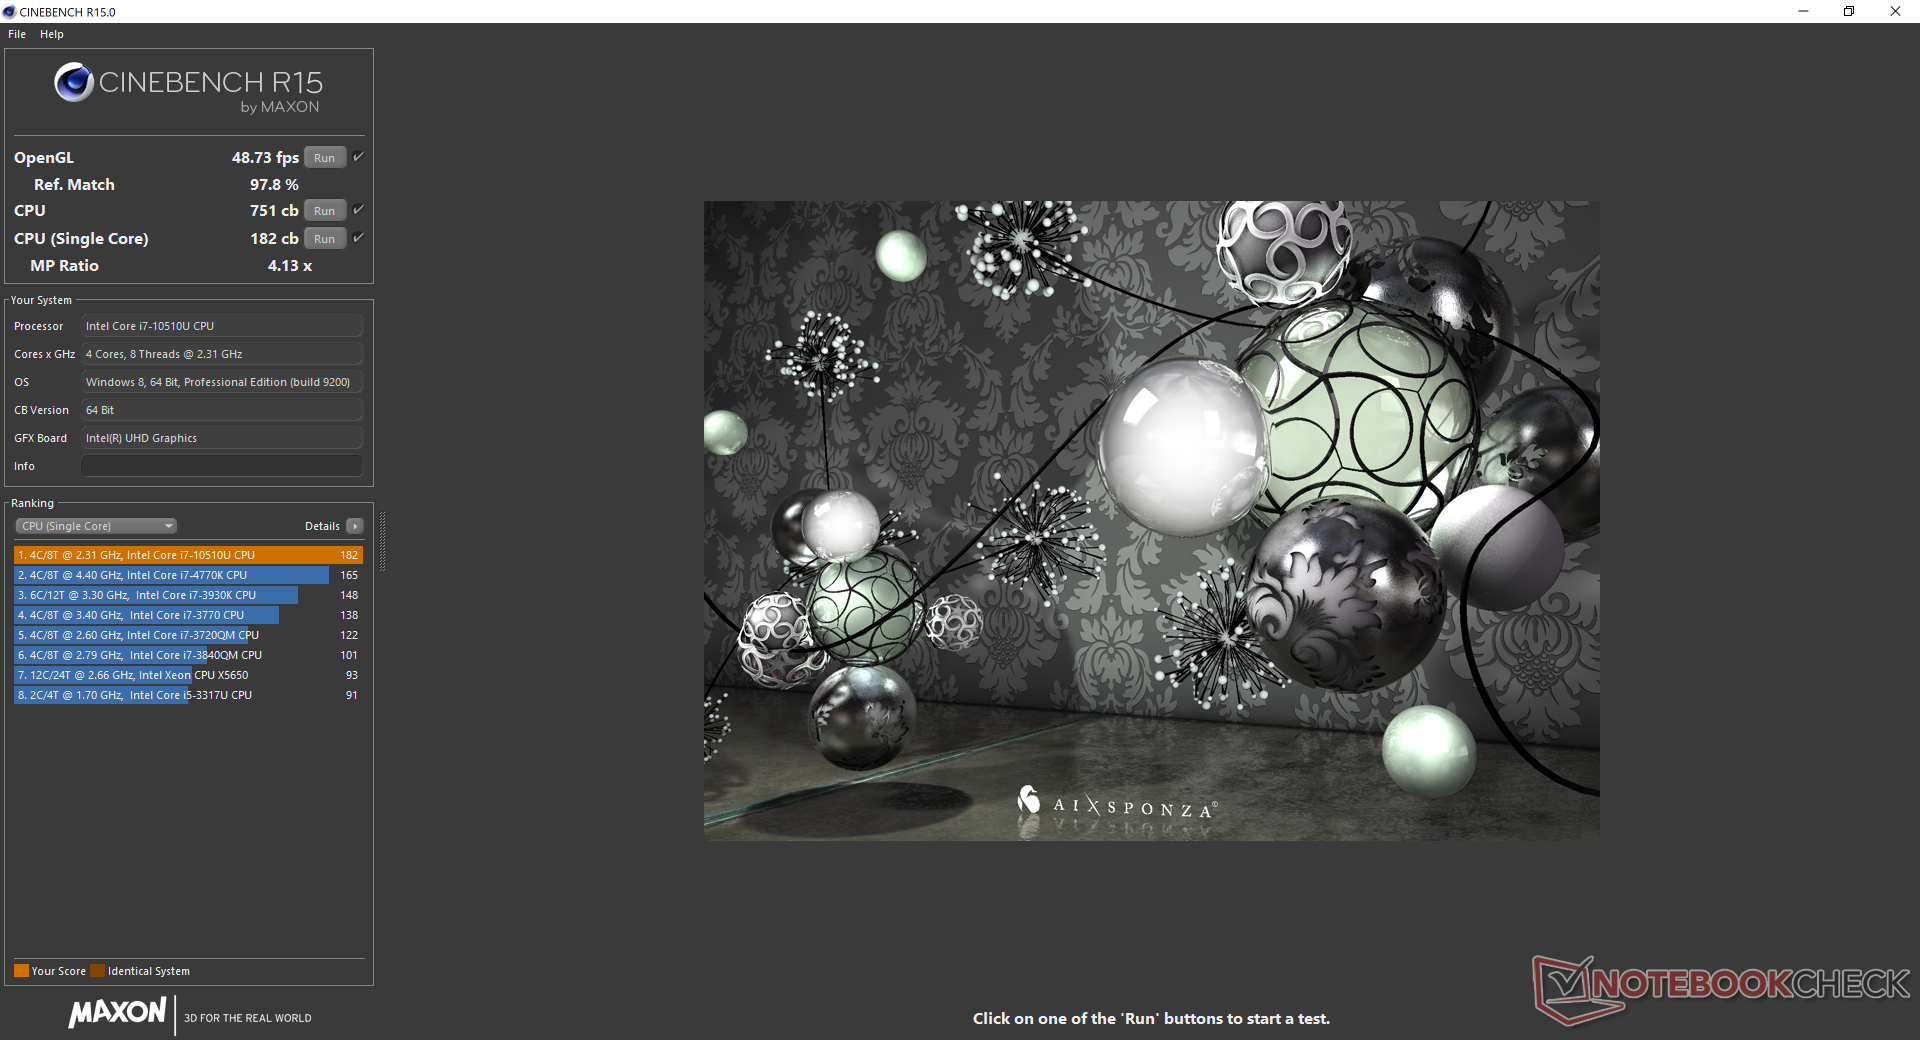
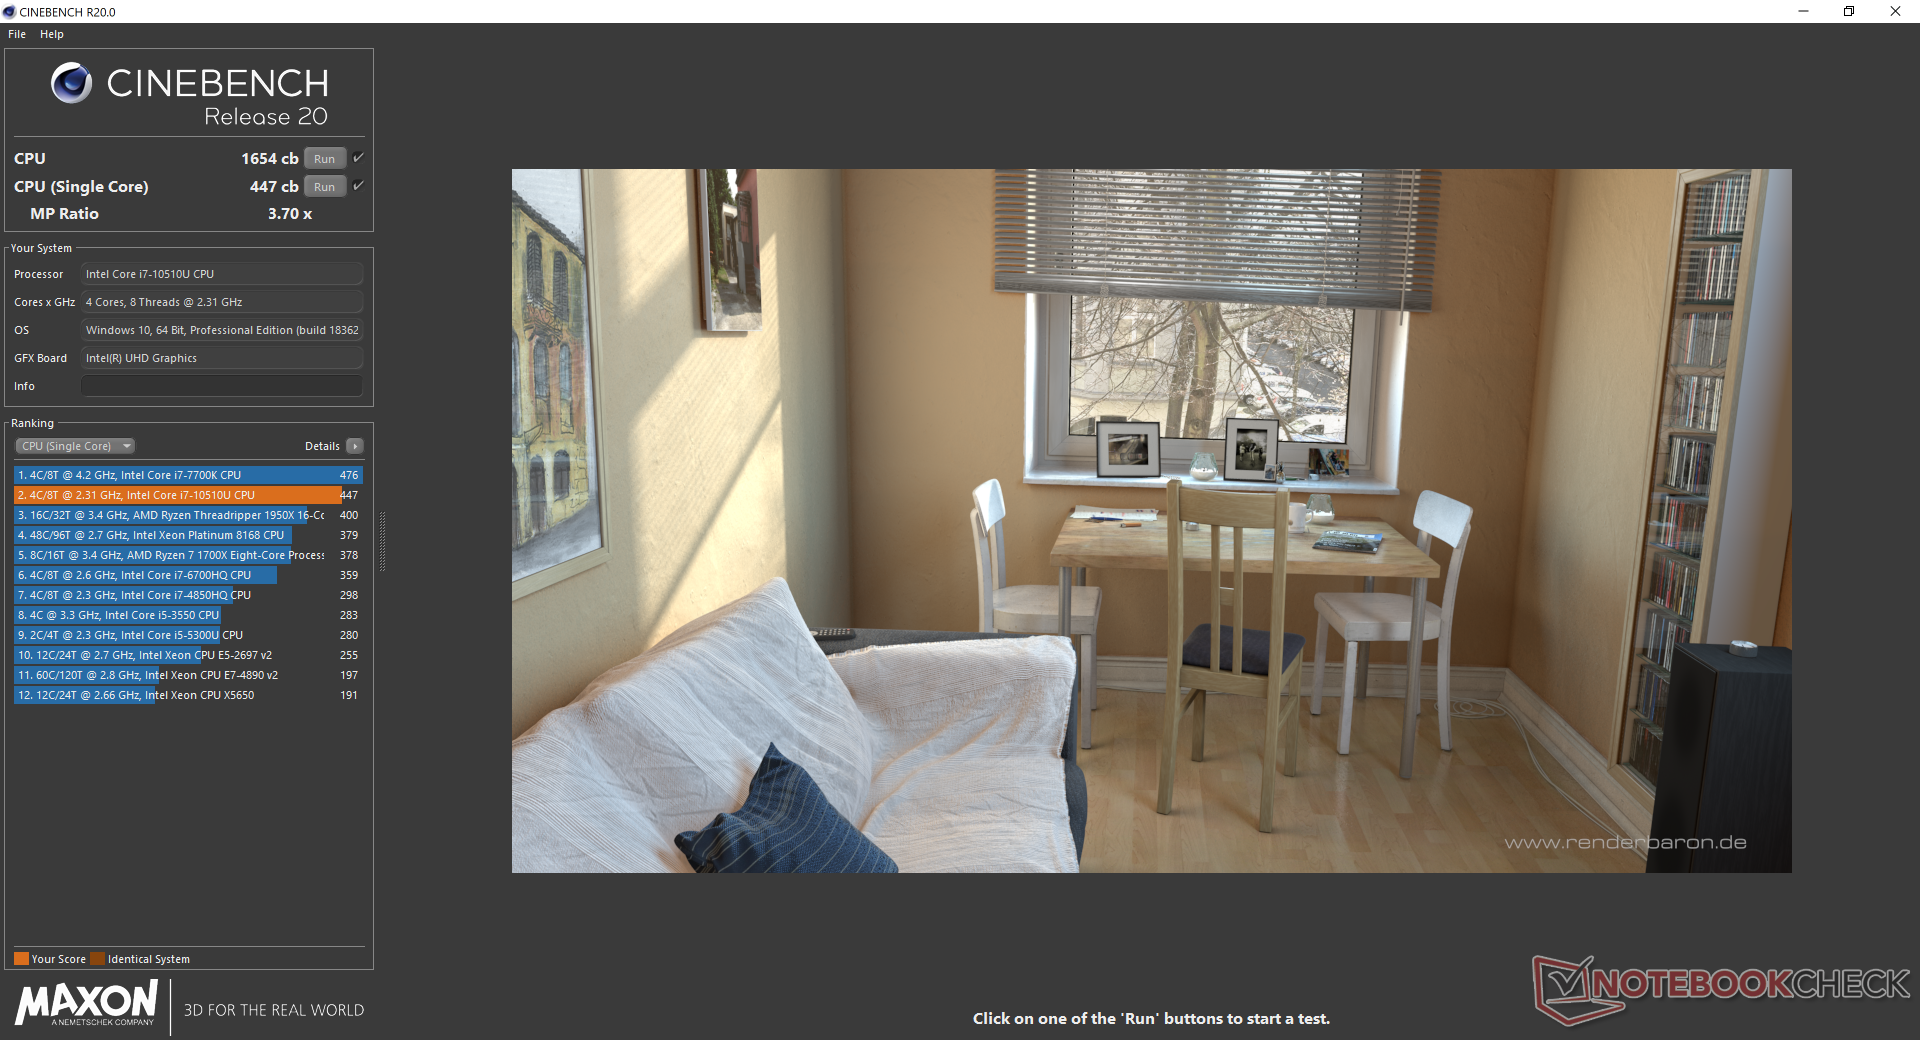
Analogamente a quanto abbiamo scoperto l'anno scorso con il ThinkPad X1 Carbon e il ThinkPad T590 con il Core i7-8565U, questa più recente SKU Core i7-10510U presenta lo stesso comportamento di clock rate ciclico quando viene sottoposto a lunghi periodi di stress di elaborazione, come dimostrato dal nostro test Multi-Thread loop CineBench R15 Multi-Thread test qui sotto. Le prestazioni della CPU inizierebbero ad essere elevate prima di scendere lentamente in un ripido modello variabile. L'esecuzione dei benchmark della CPU solo una o due volte non è quindi una rappresentazione accurata delle prestazioni del ThinkPad X1 Carbon. Altri portatili, come il Microsoft Surface Laptop 3 15, non soffrono di questo problema e sono in grado di mantenere livelli di prestazioni più costanti nel tempo.
Optando per la più costosa SKU hexa-core Core i7-10710U invece del Core i5-10510U si migliorano le prestazioni della CPU del 40-50%. Tuttavia, sospettiamo che anche la configurazione Core i7 soffrirà delle stesse velocità di clock ciclico, il che significa che i suoi vantaggi rispetto alla nostra SKU Core i5 probabilmente diminuiranno quando si eseguono carichi elevati per lunghi periodi.
Consultate la nostra pagina dedicata al Core i7-10510U per ulteriori informazioni tecniche e benchmark di confronto.
| Cinebench R11.5 | |
| CPU Single 64Bit | |
| Dell XPS 13 7390 Core i7-10710U | |
| Media Intel Core i7-10510U (n=1) | |
| Lenovo ThinkPad L13 Yoga 20R6S00800 | |
| CPU Multi 64Bit | |
| Dell XPS 13 7390 Core i7-10710U | |
| Media Intel Core i7-10510U (n=1) | |
| Lenovo ThinkPad L13 Yoga 20R6S00800 | |
| Cinebench R10 | |
| Rendering Multiple CPUs 32Bit | |
| Dell XPS 13 7390 Core i7-10710U | |
| Media Intel Core i7-10510U (6763 - 26265, n=3) | |
| Rendering Single 32Bit | |
| Dell XPS 13 7390 Core i7-10710U | |
| Media Intel Core i7-10510U (5740 - 7748, n=3) | |
| wPrime 2.10 - 1024m | |
| Dell XPS 13 7390 Core i7-10710U | |
* ... Meglio usare valori piccoli
Prestazioni di sistema
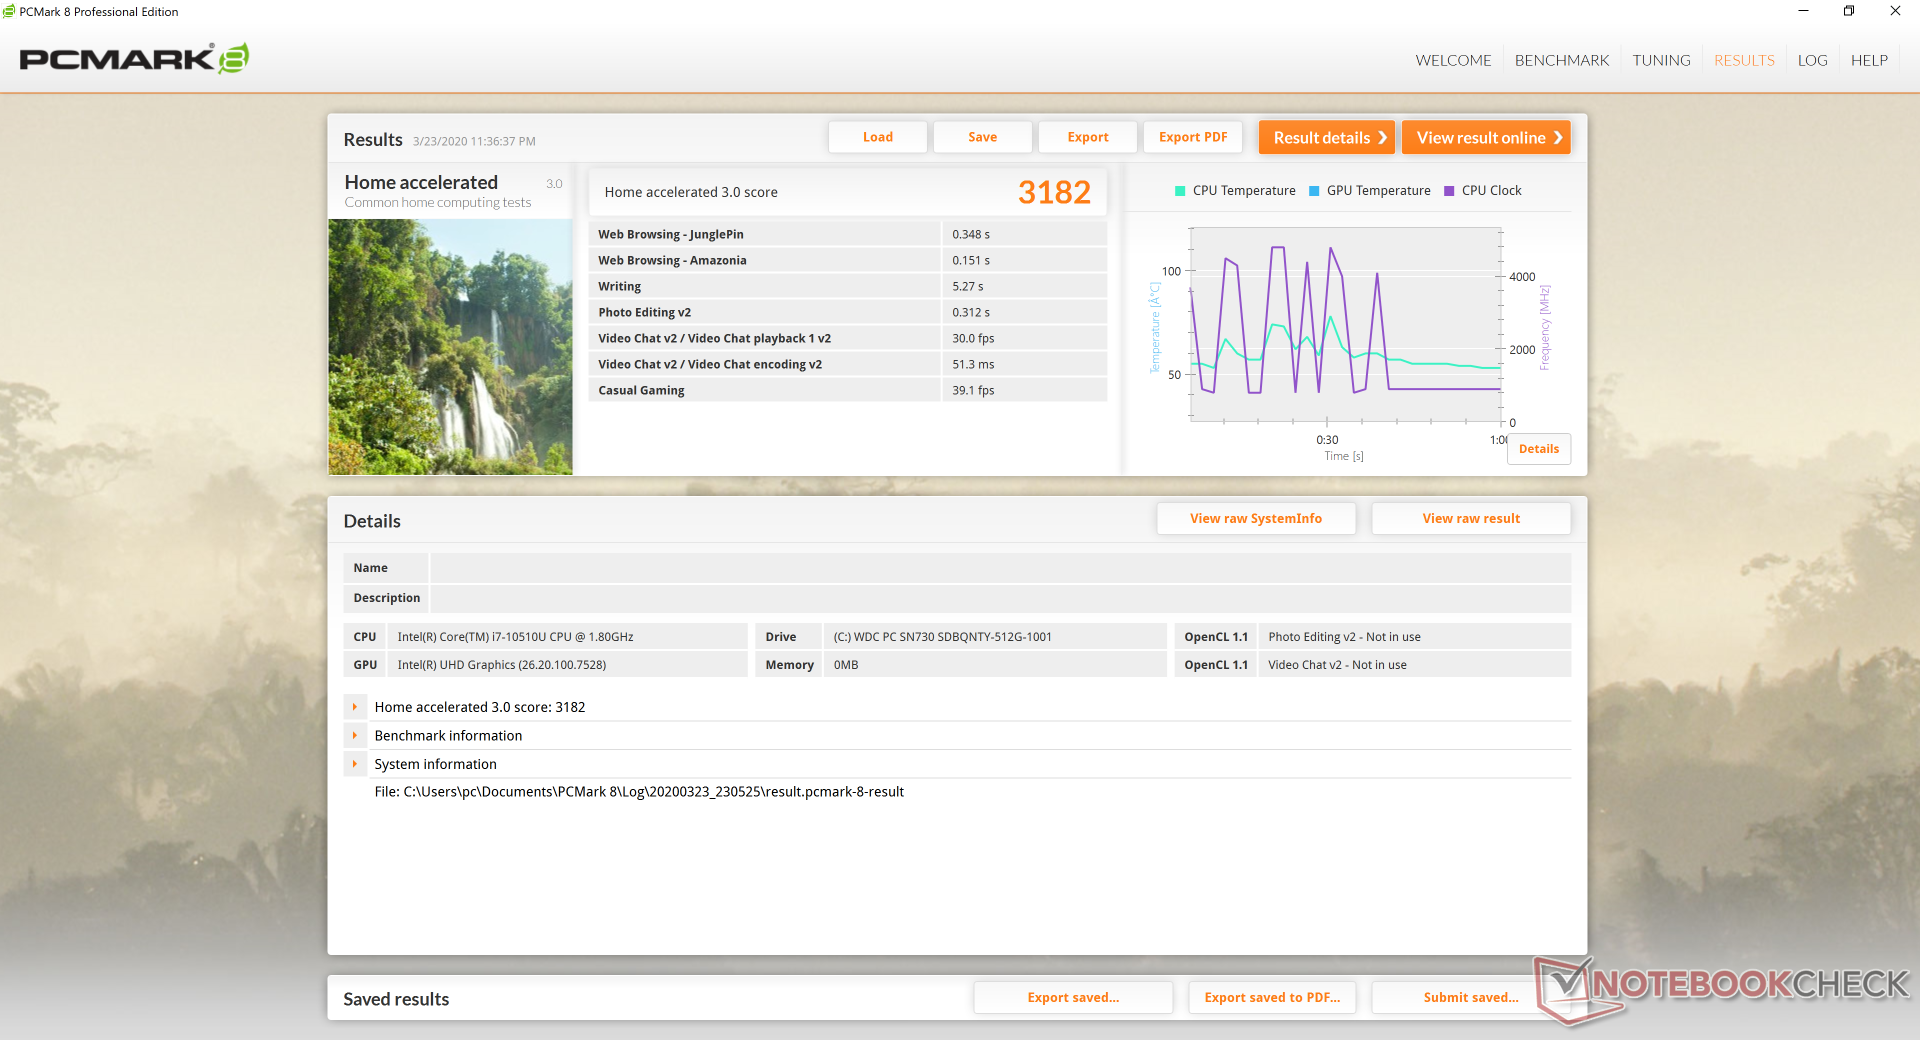
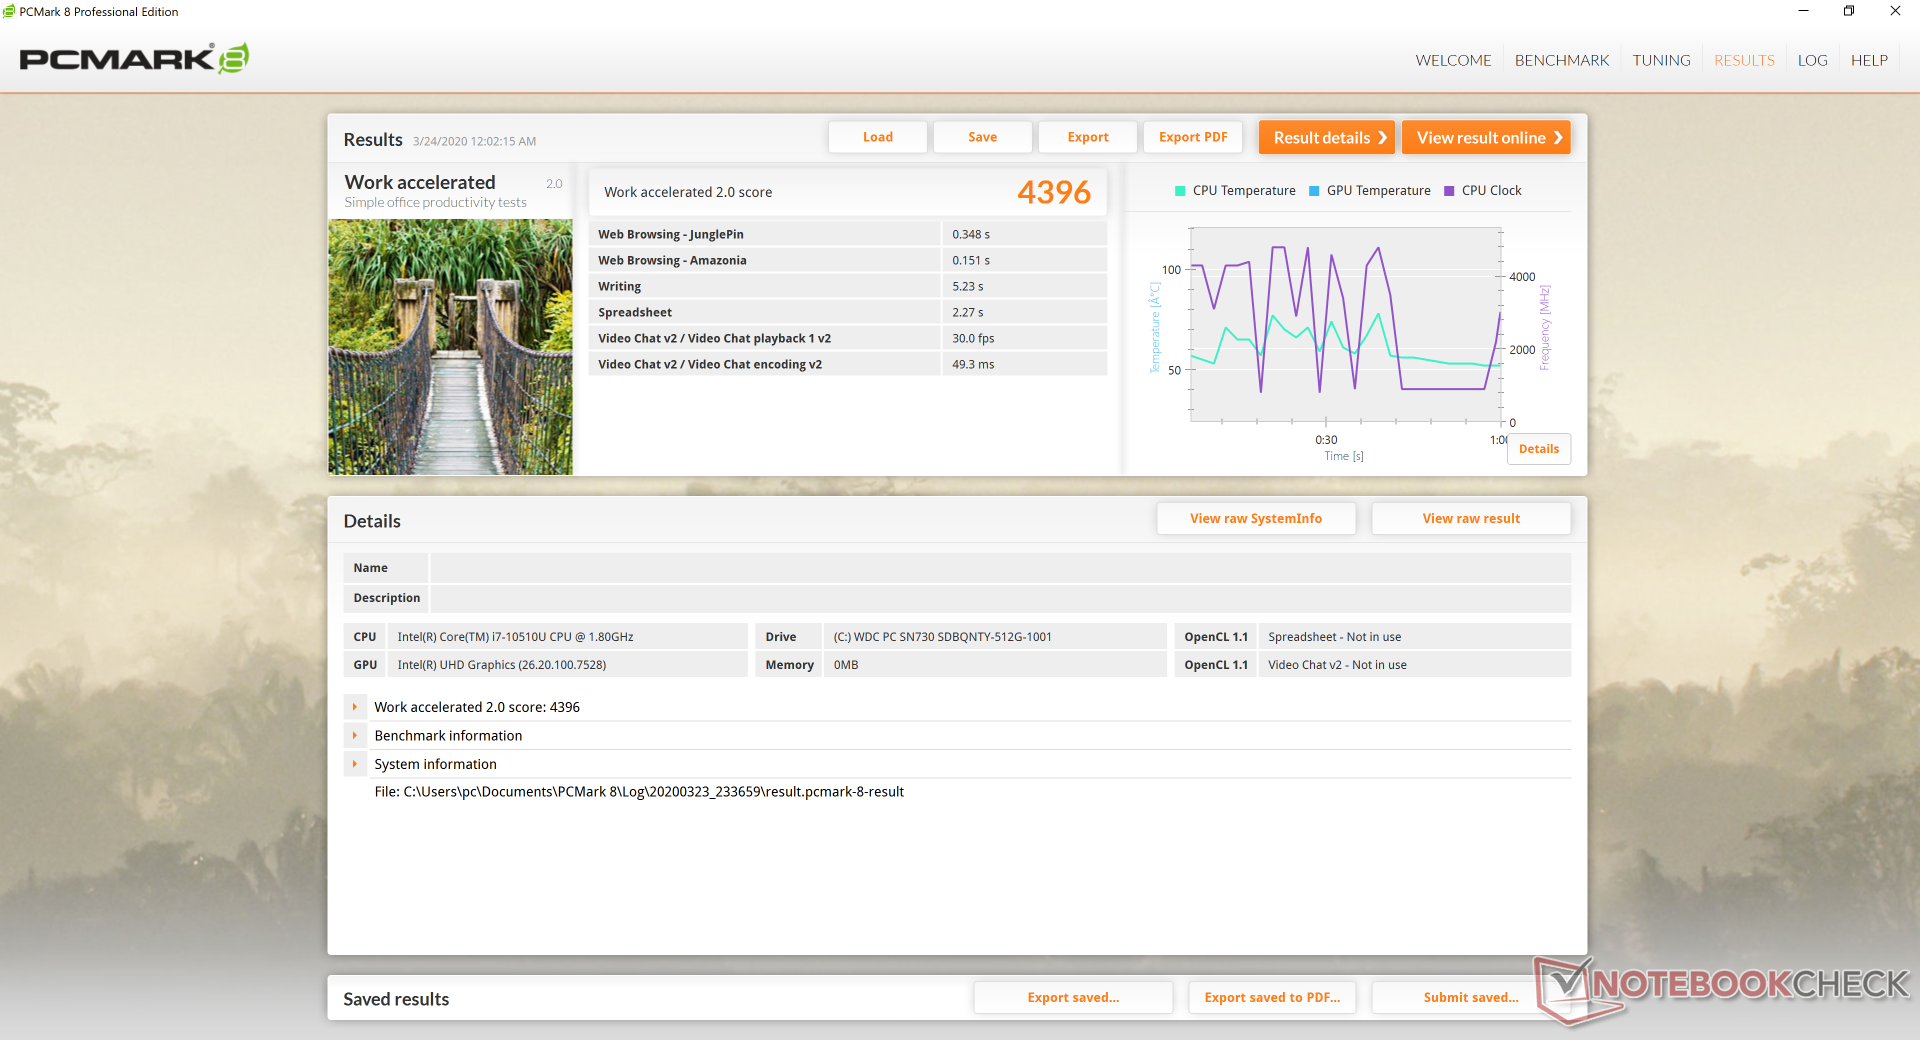
| PCMark 8 Home Score Accelerated v2 | 3182 punti | |
| PCMark 8 Work Score Accelerated v2 | 4396 punti | |
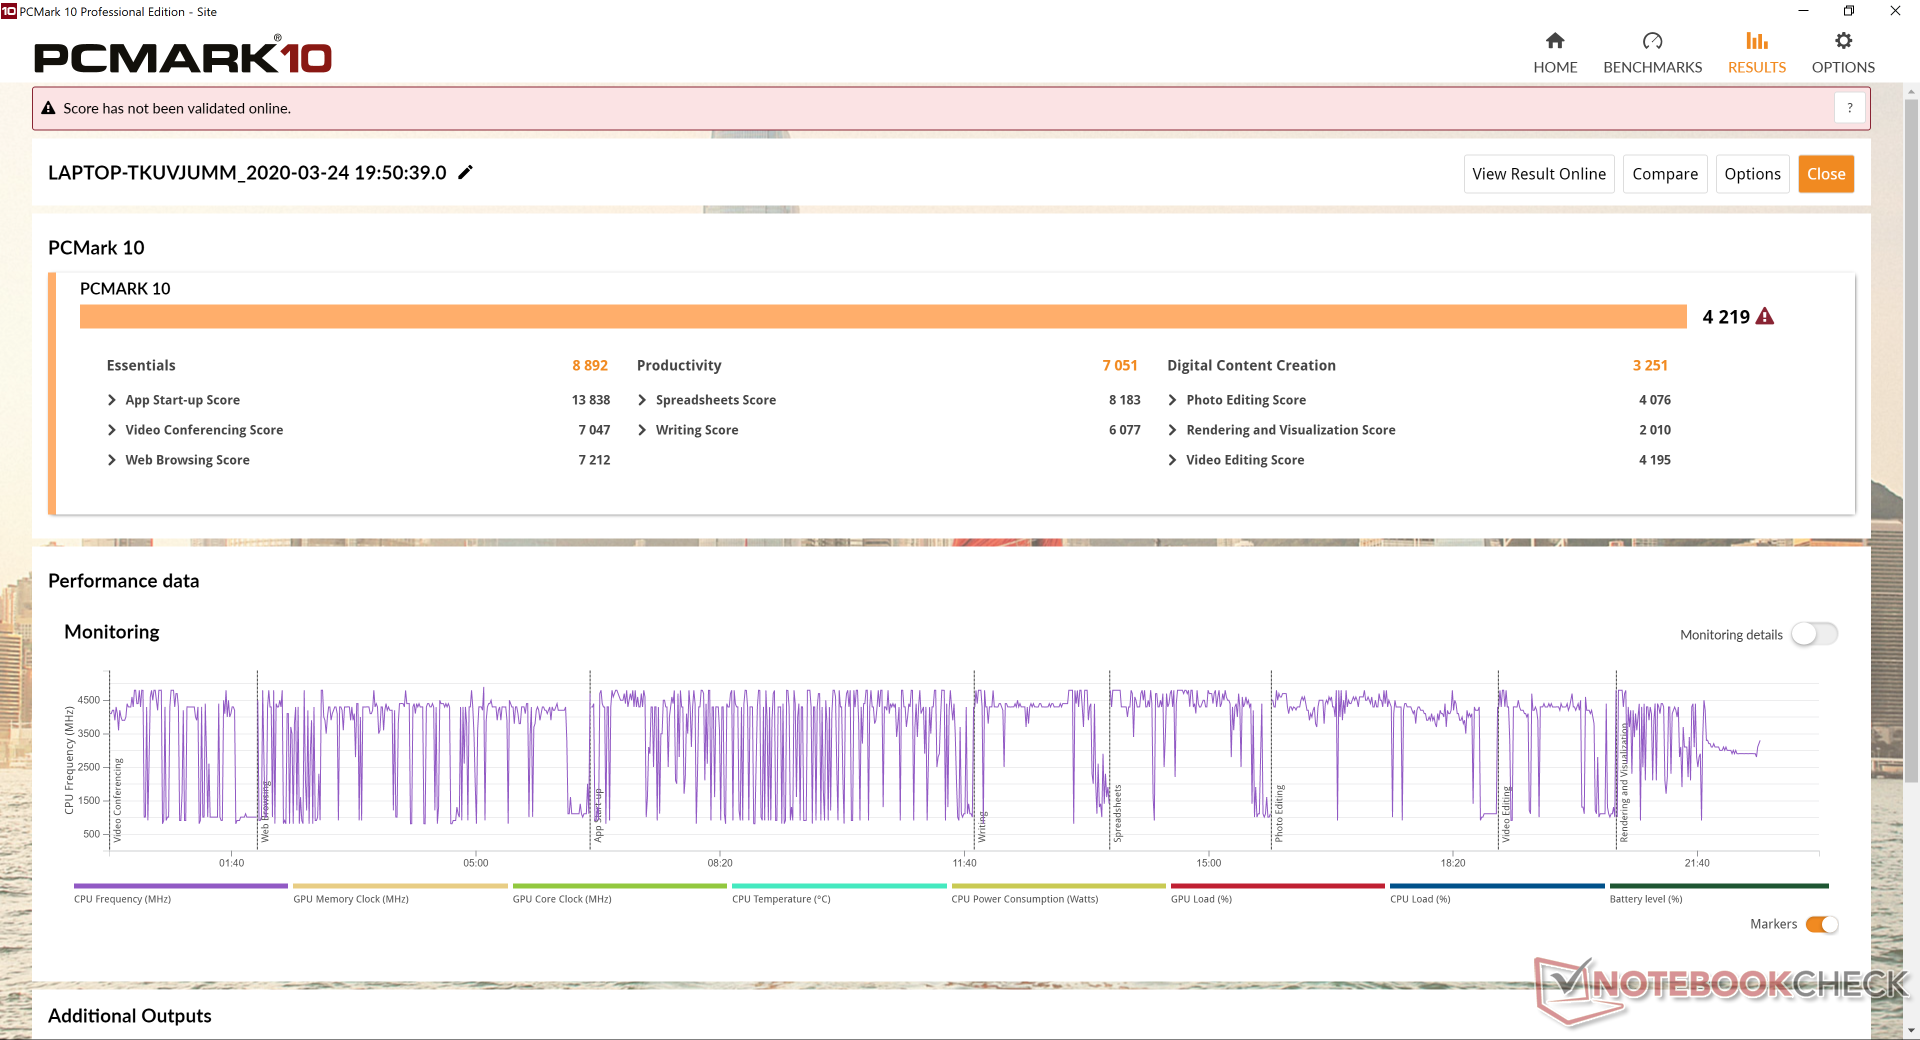
| PCMark 10 Score | 4219 punti | |
Aiuto | ||
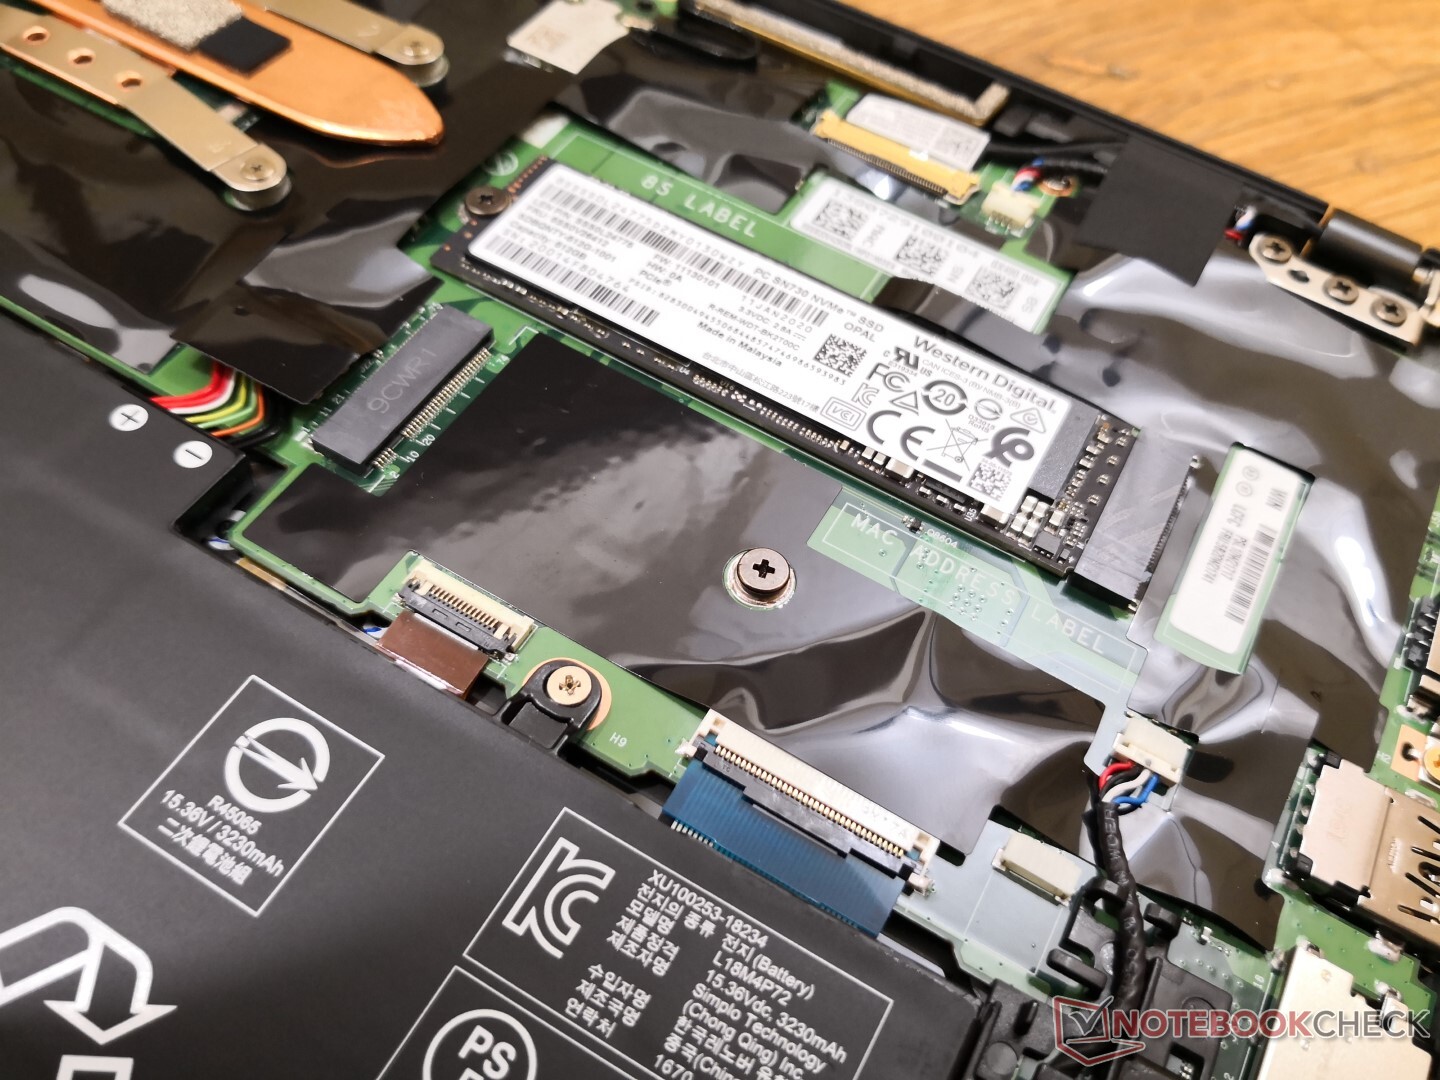
Dispositivi di archiviazione
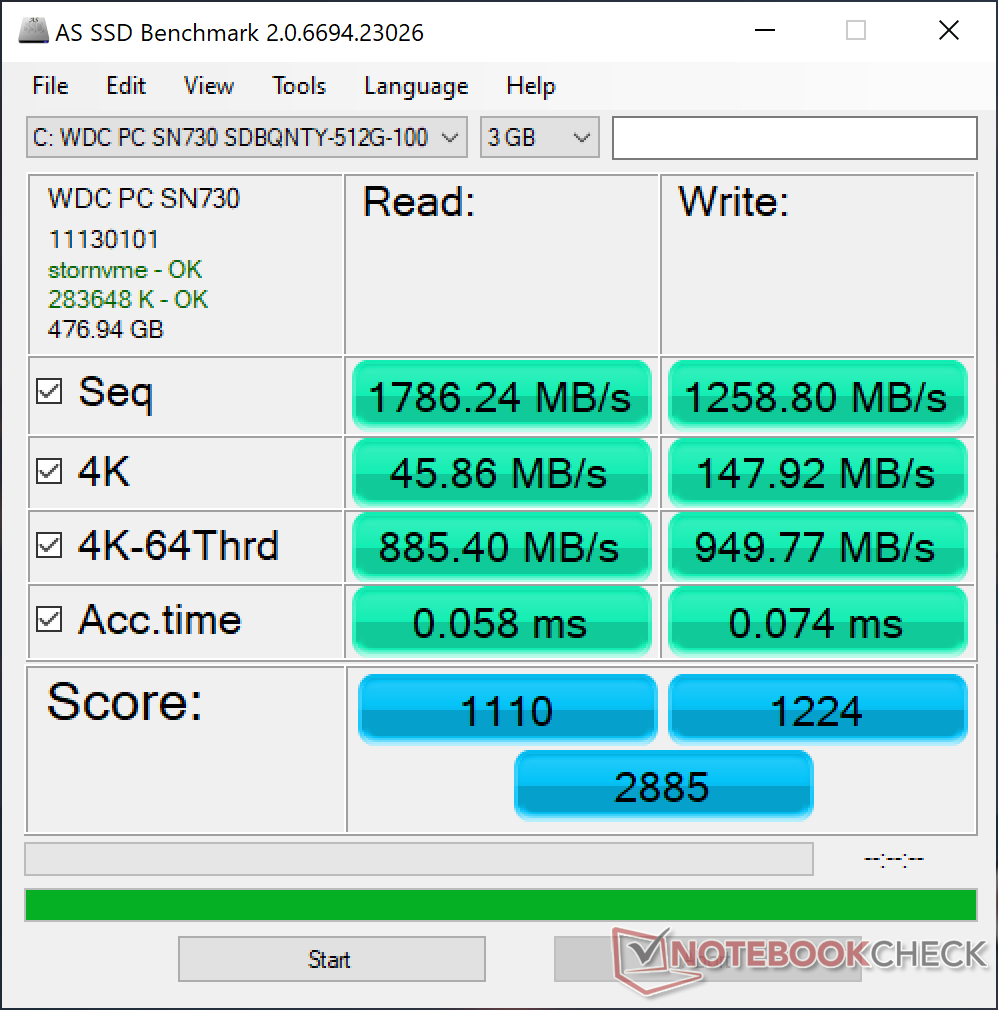
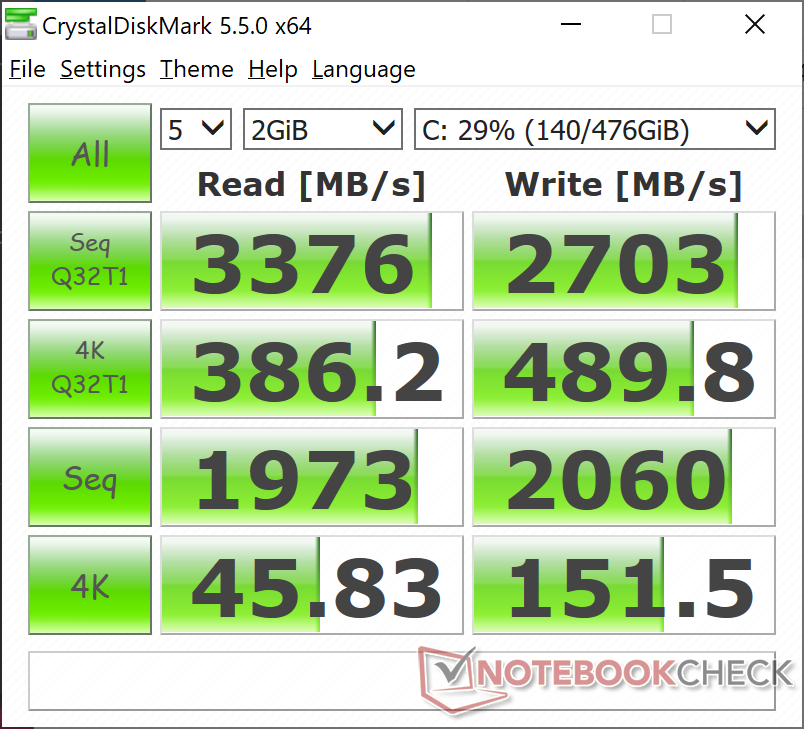
C'è spazio solo per un'unità di memorizzazione interna, poiché il secondo slot M.2 più piccolo può essere occupato da un modulo WWAN. La nostra unità di prova 2020 è dotata di un SSD NVMe PC WDC SN730 da 512 GB, mentre la nostra unità 2019 è dotata di un PC WDC SN720 da 512 GB. Western Digital dichiara valori massimi di lettura e scrittura sequenziale di 3400 MB/s e 2700 MB/s, rispettivamente, che siamo in grado di confermare durante l'esecuzione del test CrystalDiskMark 5 Q32T1. In pratica, gli utenti non noteranno gli aggiornamenti di velocità minori rispetto alla serie SN720.
Consultate la nostra tabella di HDD ed SSD per ulteriori confronti di benchmarks.
| Lenovo ThinkPad X1 Carbon G7 20R1-000YUS WDC PC SN730 SDBPNTY-512G | Lenovo ThinkPad X1 Carbon 2019-20QE000VGE WDC PC SN720 SDAQNTW-512G | Lenovo ThinkPad X1 Extreme 2019 20QV000WGE Samsung SSD PM981 MZVLB512HAJQ | Lenovo ThinkPad X1 Yoga 2019-20QGS00A00 WDC PC SN720 SDAPNTW-512G | Lenovo ThinkPad X1 Carbon 2018-20KGS5DU00 Samsung SSD PM981 MZVLB512HAJQ | |
|---|---|---|---|---|---|
| AS SSD | 40% | 47% | 31% | 3% | |
| Seq Read (MB/s) | 1786 | 2978 67% | 2352 32% | 2888 62% | 2399 34% |
| Seq Write (MB/s) | 1259 | 2287 82% | 2106 67% | 2381 89% | 1343 7% |
| 4K Read (MB/s) | 45.86 | 47.39 3% | 55 20% | 45.66 0% | 46.21 1% |
| 4K Write (MB/s) | 147.9 | 175.6 19% | 138.1 -7% | 162.4 10% | 109.4 -26% |
| 4K-64 Read (MB/s) | 885 | 1209 37% | 1265 43% | 1276 44% | 664 -25% |
| 4K-64 Write (MB/s) | 950 | 1148 21% | 1952 105% | 1432 51% | 1020 7% |
| Access Time Read * (ms) | 0.058 | 0.053 9% | 0.088 -52% | 0.056 3% | |
| Access Time Write * (ms) | 0.074 | 0.023 69% | 0.027 64% | 0.023 69% | 0.033 55% |
| Score Read (Points) | 1110 | 1554 40% | 1556 40% | 1610 45% | 950 -14% |
| Score Write (Points) | 1224 | 1553 27% | 2301 88% | 1832 50% | 1264 3% |
| Score Total (Points) | 2885 | 3874 34% | 4650 61% | 4245 47% | 2659 -8% |
| Copy ISO MB/s (MB/s) | 1384 | 1810 31% | |||
| Copy Program MB/s (MB/s) | 525 | 498.3 -5% | |||
| Copy Game MB/s (MB/s) | 1008 | 921 -9% | |||
| CrystalDiskMark 5.2 / 6 | 9% | 1% | 10% | -24% | |
| Write 4K (MB/s) | 151.5 | 196.9 30% | 148.1 -2% | 194.3 28% | 98.6 -35% |
| Read 4K (MB/s) | 45.83 | 51.3 12% | 47.31 3% | 51.2 12% | 39.75 -13% |
| Write Seq (MB/s) | 2060 | 1715 -17% | 1414 -31% | 1773 -14% | 1757 -15% |
| Read Seq (MB/s) | 1973 | 2464 25% | 1320 -33% | 2512 27% | 1169 -41% |
| Write 4K Q32T1 (MB/s) | 489.8 | 429.1 -12% | 493.6 1% | 431.7 -12% | 333.8 -32% |
| Read 4K Q32T1 (MB/s) | 386.2 | 542 40% | 594 54% | 539 40% | 268 -31% |
| Write Seq Q32T1 (MB/s) | 2703 | 2521 -7% | 2970 10% | 2538 -6% | 2069 -23% |
| Read Seq Q32T1 (MB/s) | 3376 | 3481 3% | 3472 3% | 3489 3% | 3426 1% |
| Write 4K Q8T8 (MB/s) | 867 | ||||
| Read 4K Q8T8 (MB/s) | 1315 | ||||
| Media totale (Programma / Settaggio) | 25% /
26% | 24% /
28% | 21% /
23% | -11% /
-8% |
* ... Meglio usare valori piccoli

Prestazioni GPU
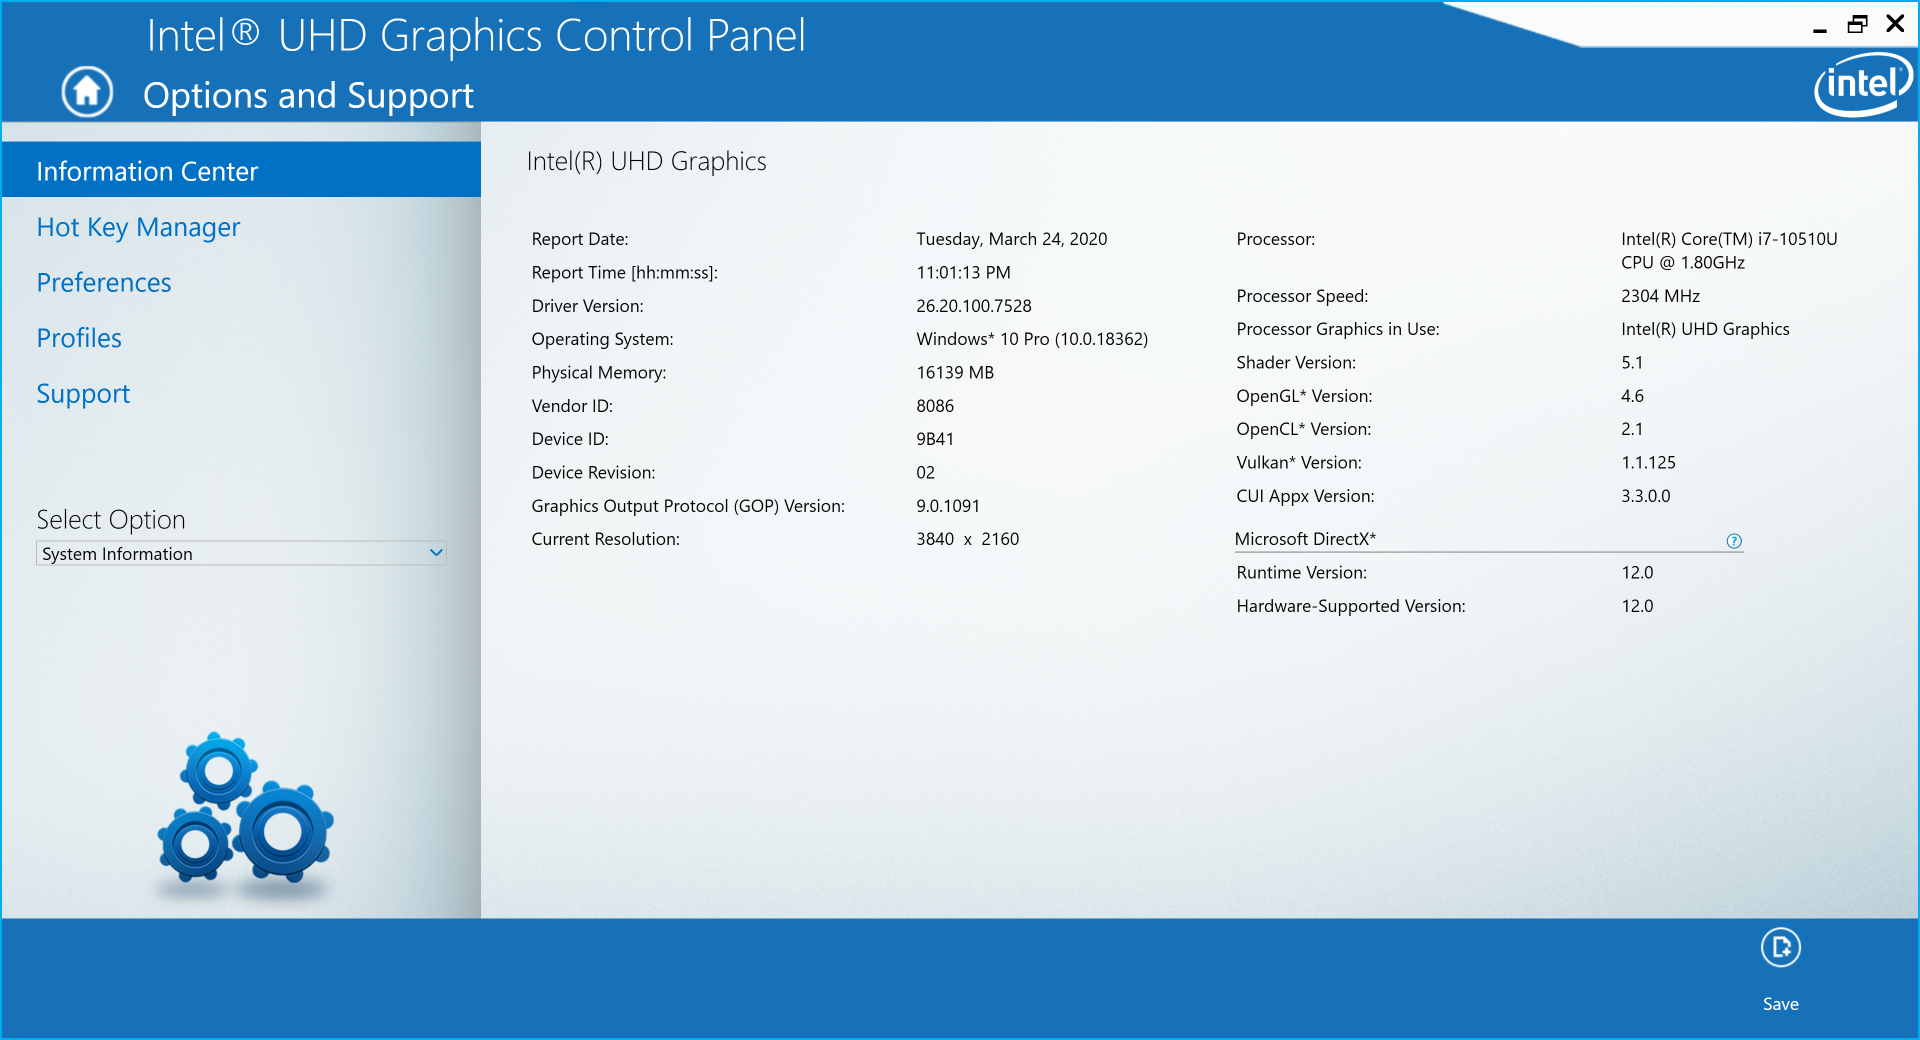
La famiglia Comet Lake-U utilizza la stessa GPU UHD Graphics 620 della famiglia Kaby Lake, molto più vecchia. È sufficiente per lo streaming video 4K e l'uscita del monitor, ma la GPU è diventata obsoleta per qualsiasi tipo di gioco o di editing secondo gli standard odierni. Per prestazioni grafiche significativamente più veloci, si considerino i laptop con CPU Ice Lake o la serie AMD Ryzen.
Consultate la nostra pagina dedicata alla UHD Graphics 620 per ulteriori benchmarks.
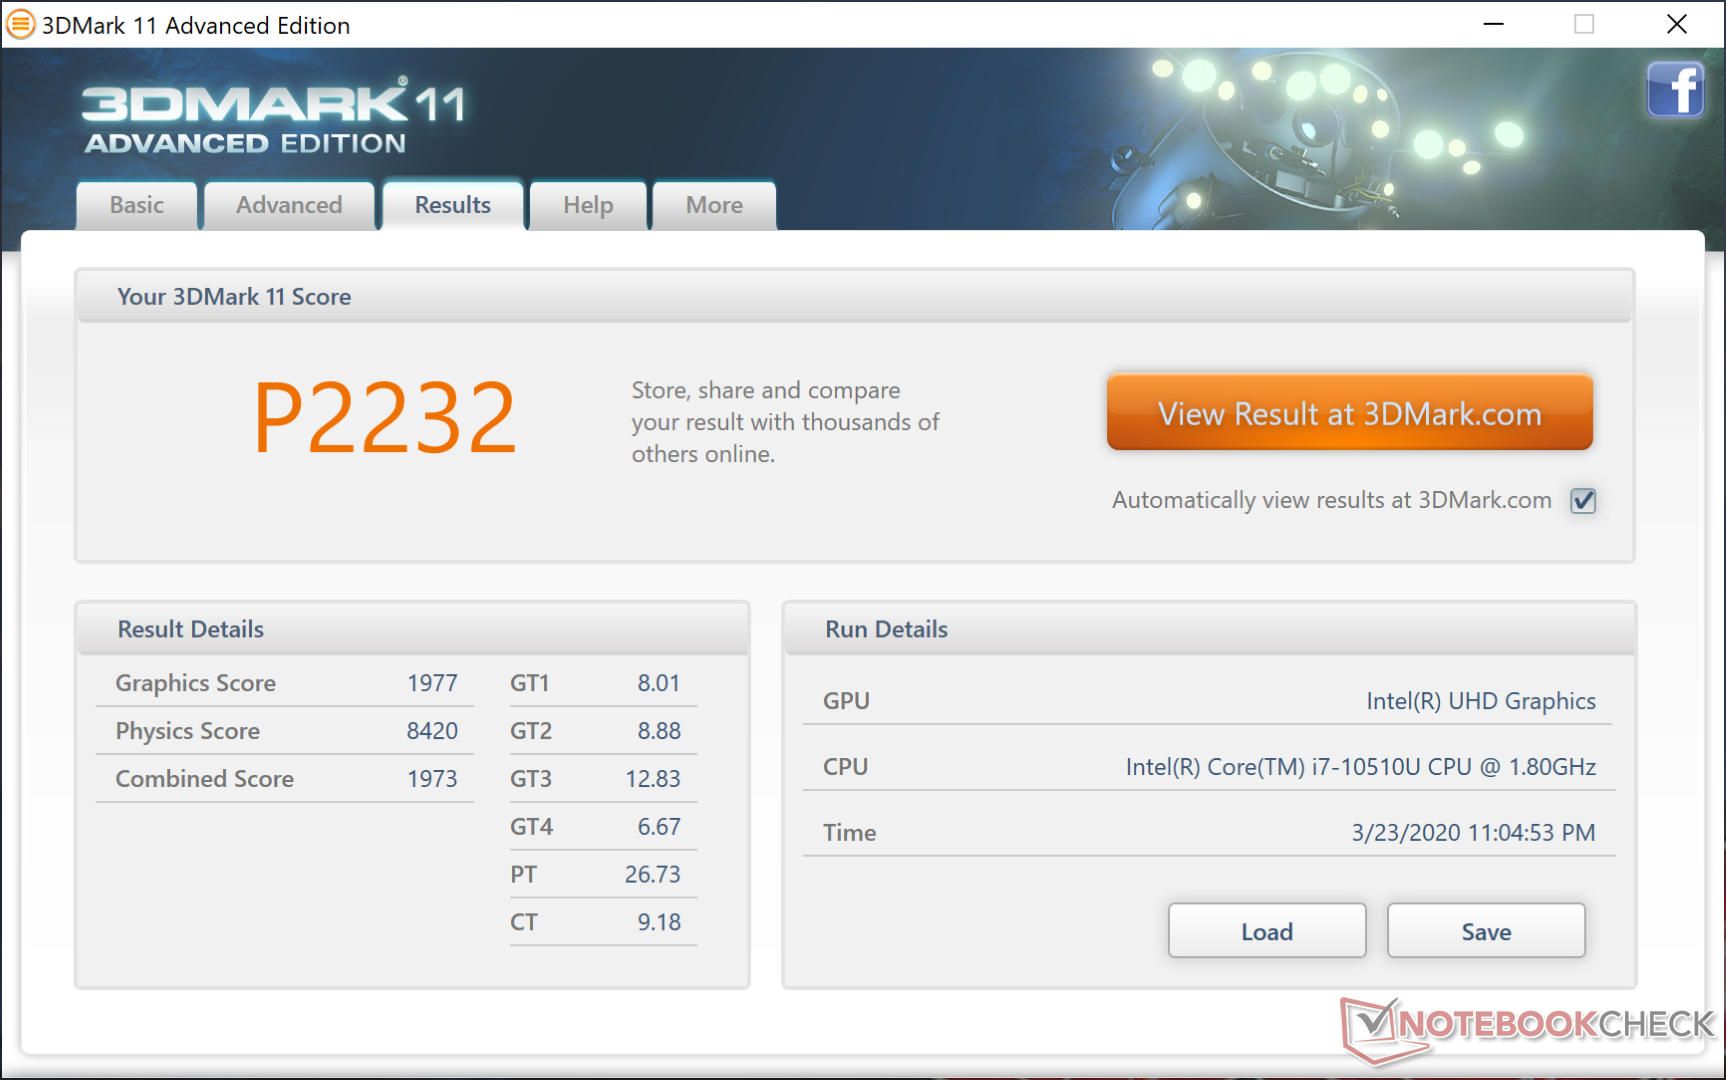
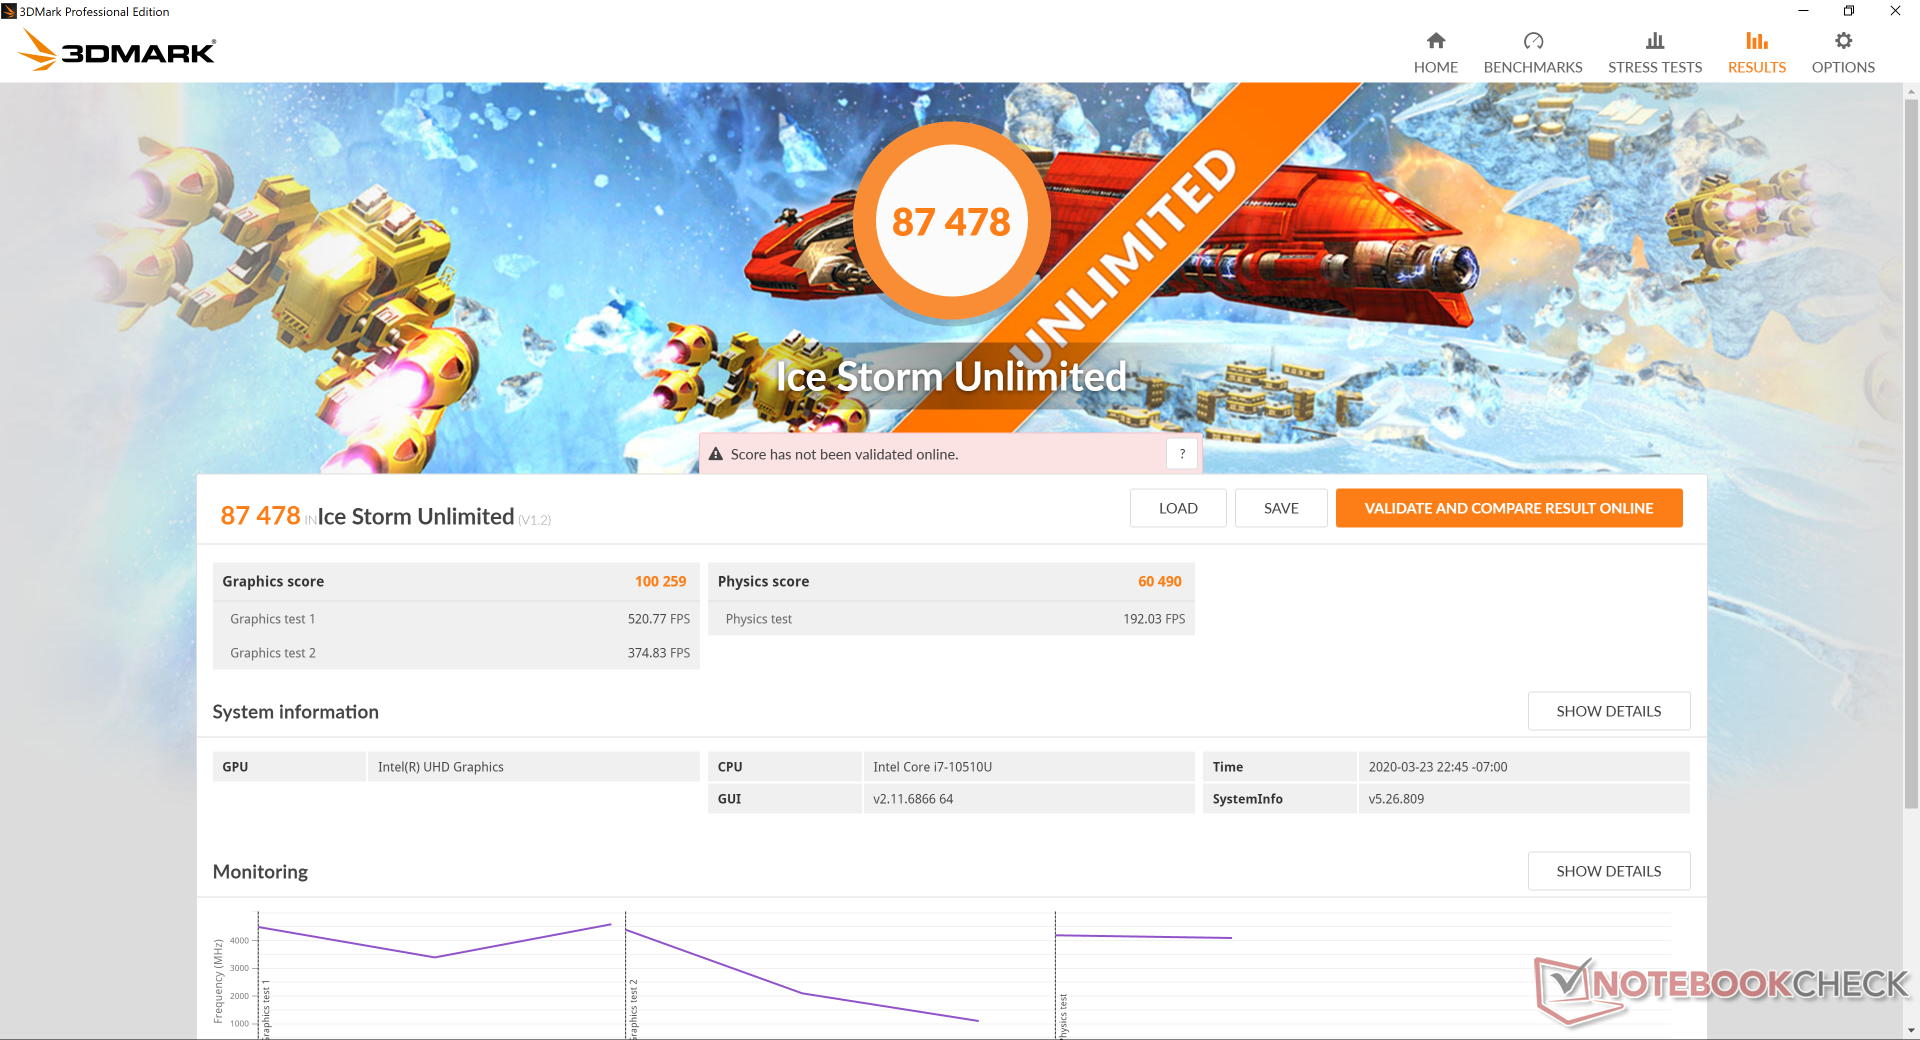
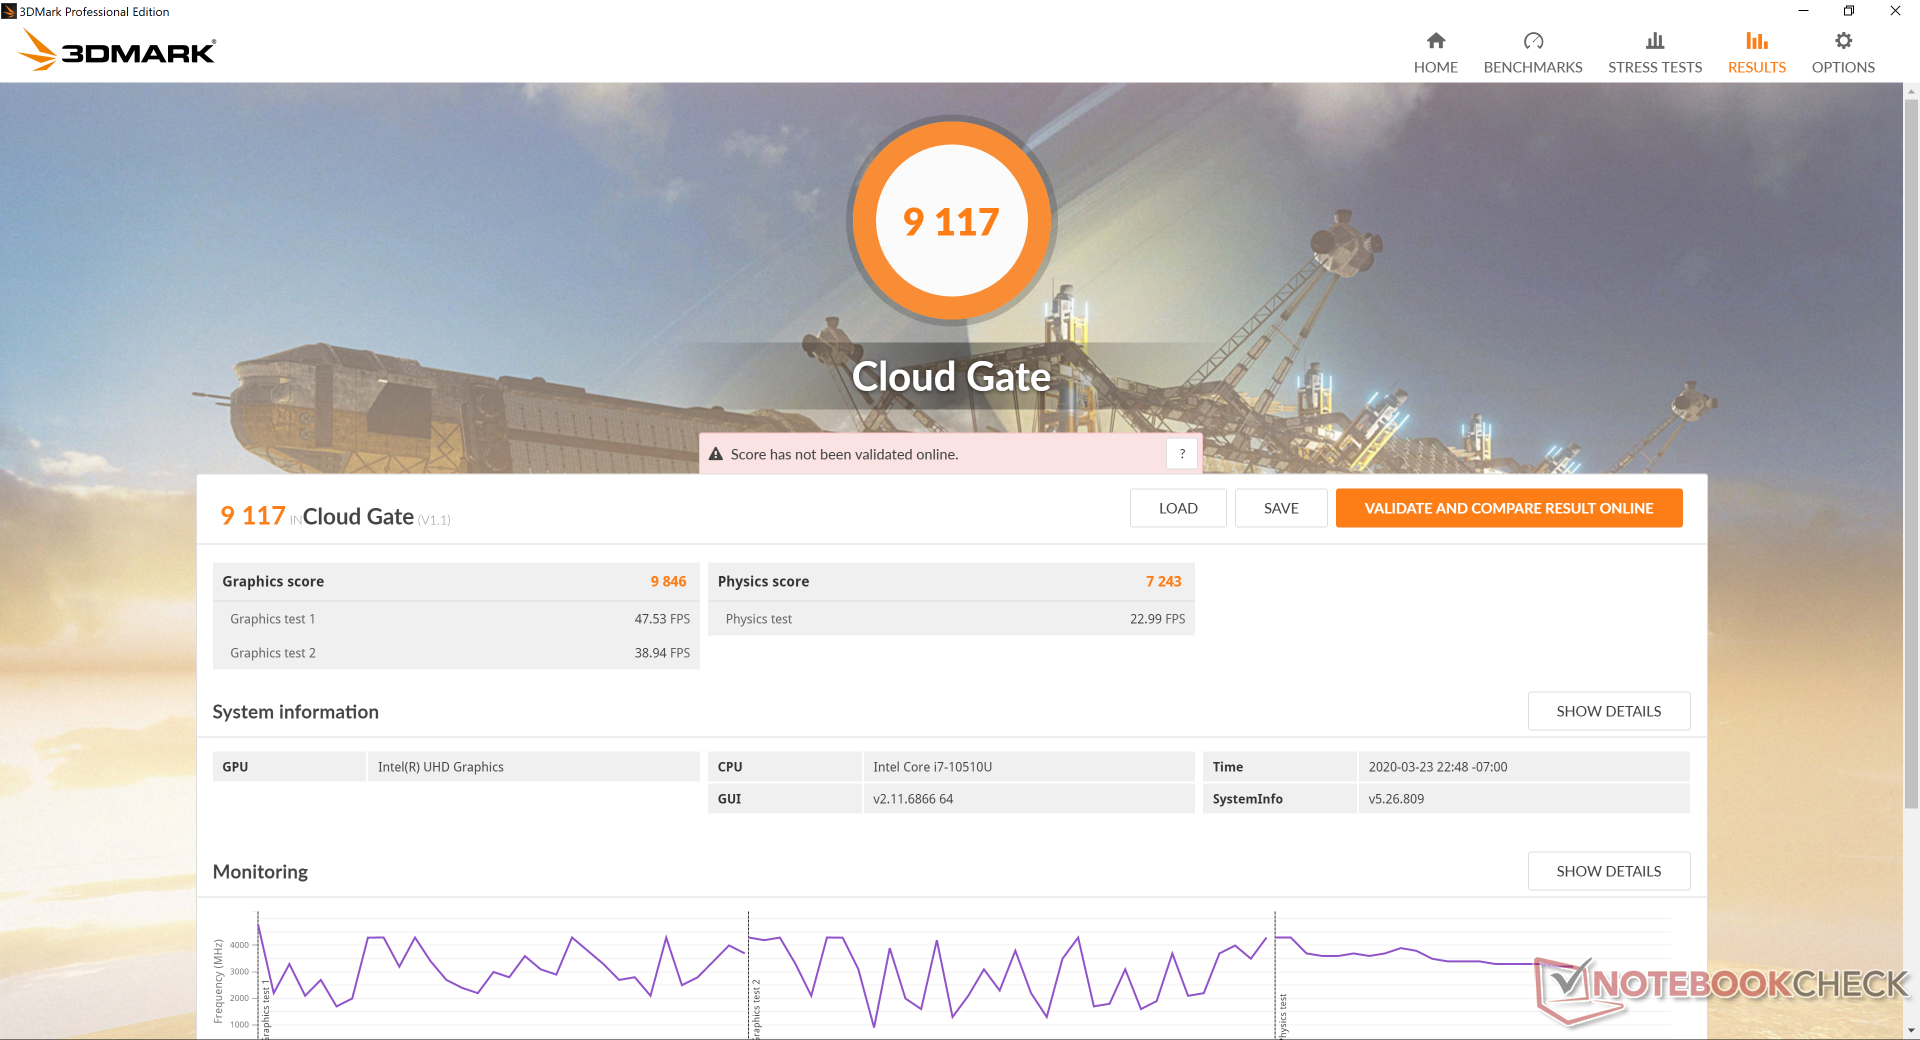
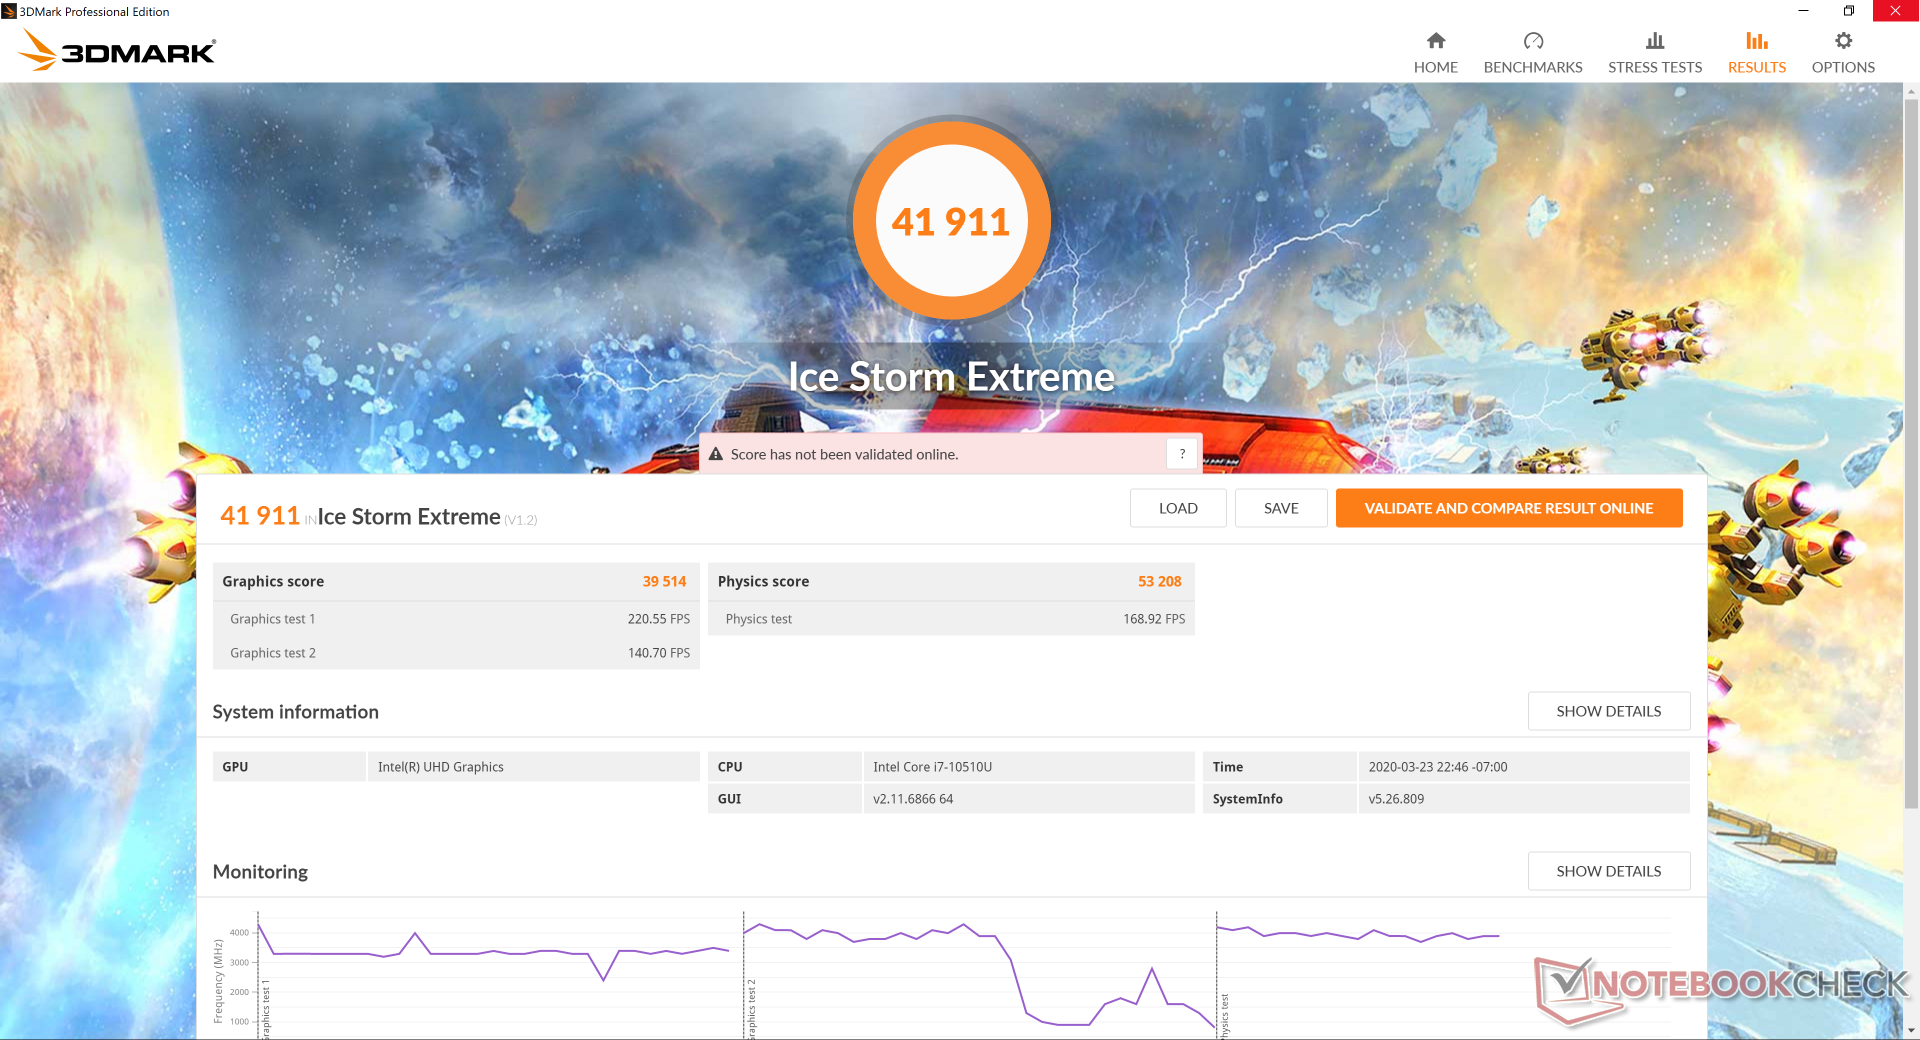
| 3DMark 11 Performance | 2232 punti | |
| 3DMark Ice Storm Standard Score | 61083 punti | |
| 3DMark Cloud Gate Standard Score | 9117 punti | |
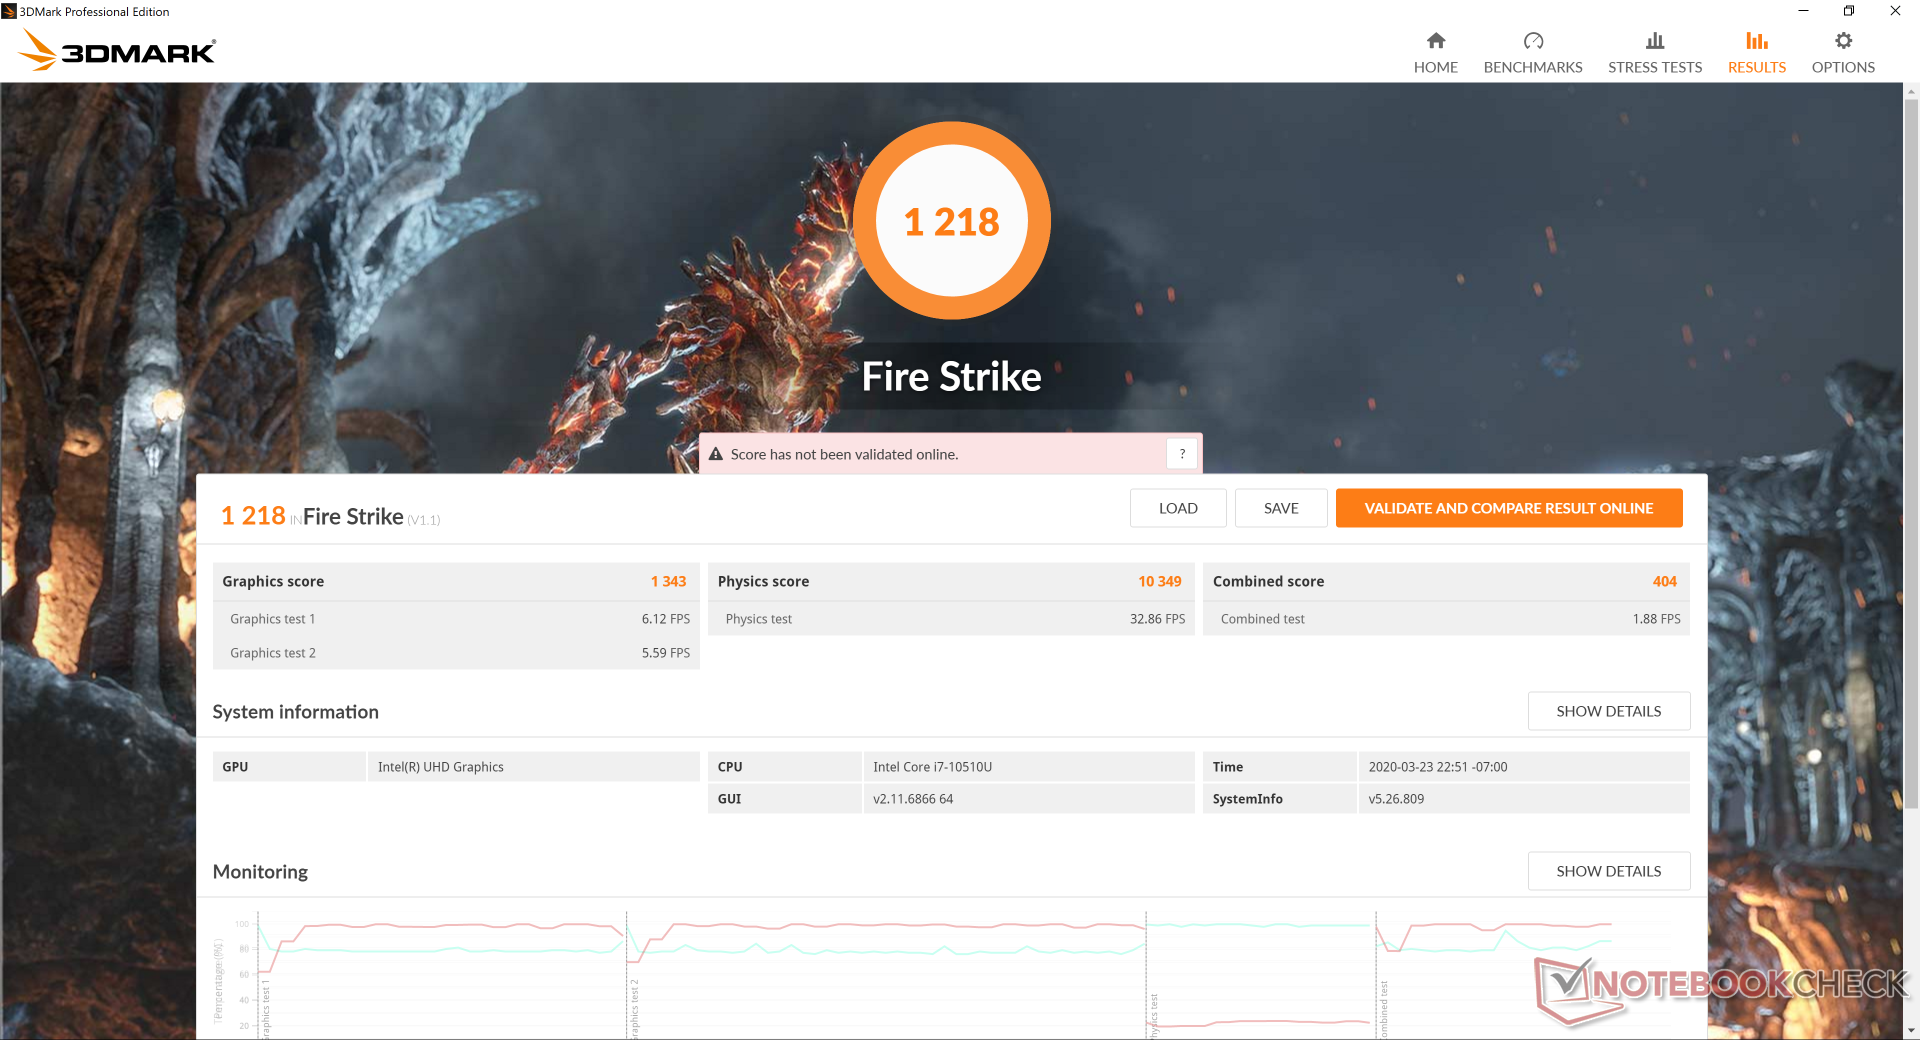
| 3DMark Fire Strike Score | 1218 punti | |
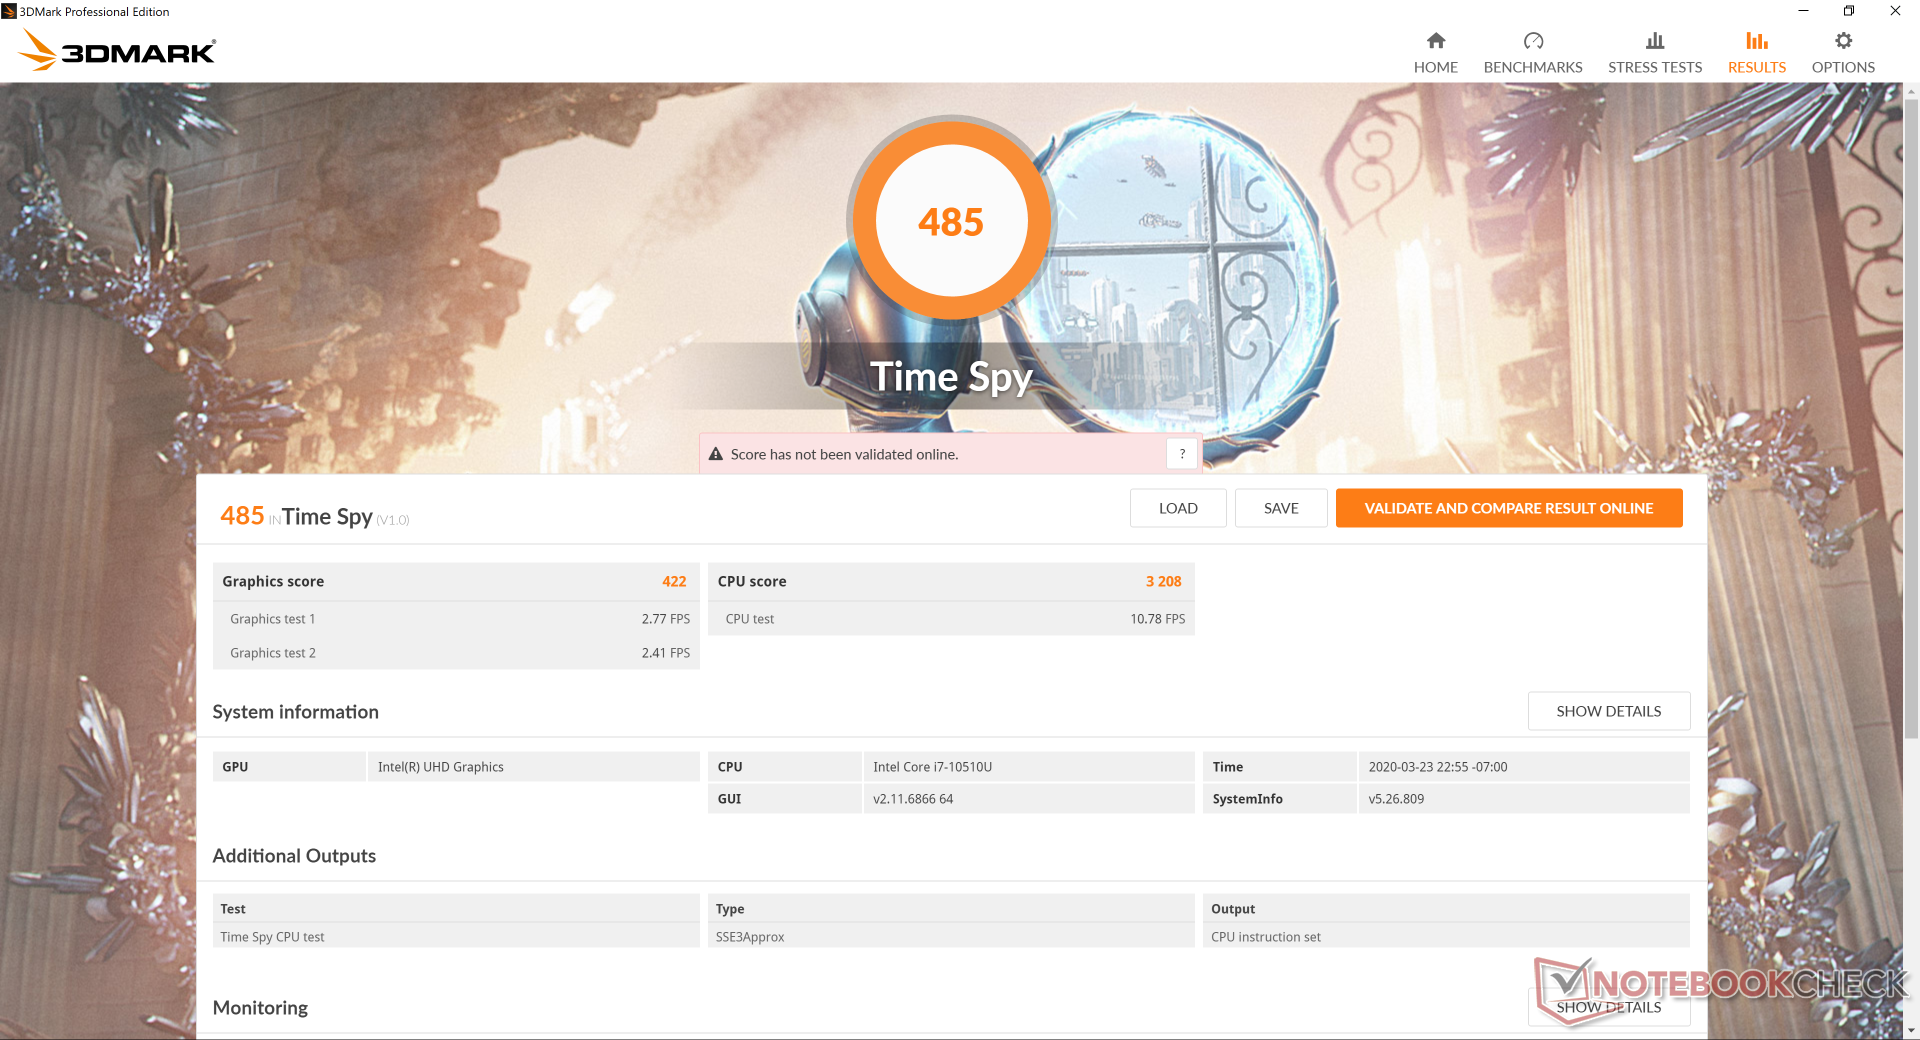
| 3DMark Time Spy Score | 485 punti | |
Aiuto | ||
| basso | medio | alto | ultra | |
|---|---|---|---|---|
| BioShock Infinite (2013) | 81.2 | 39.7 | 34.3 | 11 |
| The Witcher 3 (2015) | 20.7 | 11 | ||
| Rocket League (2017) | 44 | 27.7 | 20.6 | |
| Shadow of the Tomb Raider (2018) | 14 |
Emissioni
Rumorosità di sistema
Se il cursore Power di Windows è impostato su Balanced o Power Saver, allora il sistema sarà silenzioso durante i bassi carichi come la navigazione o l'elaborazione di testi. Se impostato su High Performance, la ventola automaticamente sale fino a 29,4 dB(A) su uno sfondo di 28,2 dB(A) che è ancora appena udibile. Eseguendo la prima scena di riferimento di 3DMark 06 si sente un rumore della ventola di 31,5 dB(A) più silenzioso di molti Ultrabooks.
L'esecuzione di Prime95 induce un rumore della ventola di 38 dB(A) fino a stabilizzarsi a 41.2 dB(A) dopo pochi minuti. La maggior parte degli utenti non sperimenterà probabilmente la ventola alla massima velocità durante gli scenari del mondo reale, poiché la CPU deve essere spinta al 100% di carico perché questo accada.
Non possiamo notare alcun rumore elettronico dalla nostra unità di prova.
| Lenovo ThinkPad X1 Carbon G7 20R1-000YUS UHD Graphics 620, i7-10510U, WDC PC SN730 SDBPNTY-512G | Lenovo ThinkPad X1 Extreme 2019 20QV000WGE GeForce GTX 1650 Mobile, i7-9750H, Samsung SSD PM981 MZVLB512HAJQ | Lenovo ThinkPad X1 Yoga 2019-20QGS00A00 UHD Graphics 620, i7-8565U, WDC PC SN720 SDAPNTW-512G | Lenovo ThinkPad X1 Carbon 2017-20HR0021GE HD Graphics 620, i5-7200U, Toshiba THNSF5256GPUK | Lenovo ThinkPad X1 Carbon G6-20KG0025UK UHD Graphics 620, i5-8350U, Lenovo LENSE20256GMSP34MEAT2TA | Lenovo ThinkPad X1 Carbon Touch 20A7-002DGE HD Graphics 5000, 4550U, Samsung MZNTD512HAGL | |
|---|---|---|---|---|---|---|
| Noise | -1% | -0% | -4% | 0% | 2% | |
| off /ambiente * (dB) | 28.2 | 28.5 -1% | 29.3 -4% | 29.6 -5% | 30.25 -7% | |
| Idle Minimum * (dB) | 28.2 | 28.5 -1% | 29.3 -4% | 29.6 -5% | 30.25 -7% | 28.8 -2% |
| Idle Average * (dB) | 28.2 | 28.5 -1% | 29.3 -4% | 29.6 -5% | 30.25 -7% | 28.8 -2% |
| Idle Maximum * (dB) | 29.4 | 28.5 3% | 31.1 -6% | 32.2 -10% | 30.25 -3% | 28.8 2% |
| Load Average * (dB) | 31.5 | 36.3 -15% | 32.7 -4% | 34.2 -9% | 31.3 1% | 33.7 -7% |
| Load Maximum * (dB) | 41.2 | 36.3 12% | 32.7 21% | 36.1 12% | 31.3 24% | 34 17% |
| Witcher 3 ultra * (dB) | 36.3 |
* ... Meglio usare valori piccoli
Rumorosità
| Idle |
| 28.2 / 28.2 / 29.4 dB(A) |
| Sotto carico |
| 31.5 / 41.2 dB(A) |
 | ||
30 dB silenzioso 40 dB(A) udibile 50 dB(A) rumoroso |
||
min: | ||
Temperature
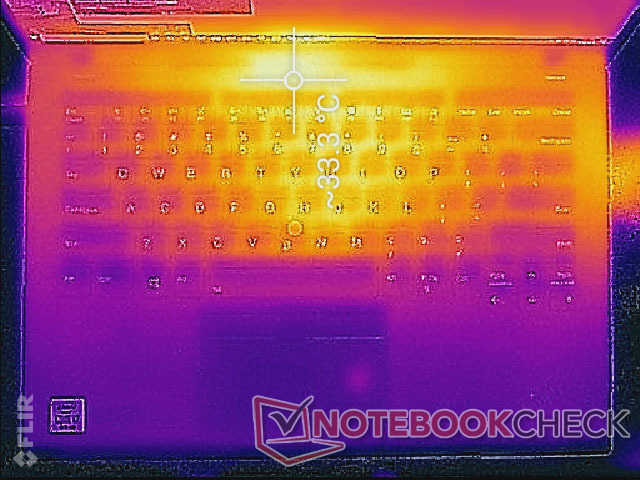
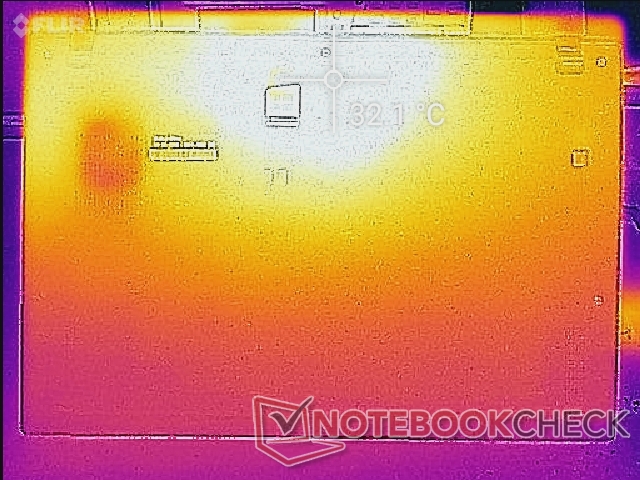
Le temperature di superficie sono più fredde del previsto quando si utilizzano contemporaneamente Prime95 e FurMark. I punti caldi, per esempio, risultano essere solo 32 °C - 33 °C rispetto ai 46 °C - 48 °C del ThinkPad X1 Carbon dell'anno scorso. Il più pesante strozzamento della CPU durante l'esecuzione simultanea dei due programmi di riferimento è il probabile colpevole, come descritto nella sezione seguente. Aspettatevi temperature di superficie molto più alte e più vicine al modello del 2019 se si esegue solo Prime95 o FurMark.
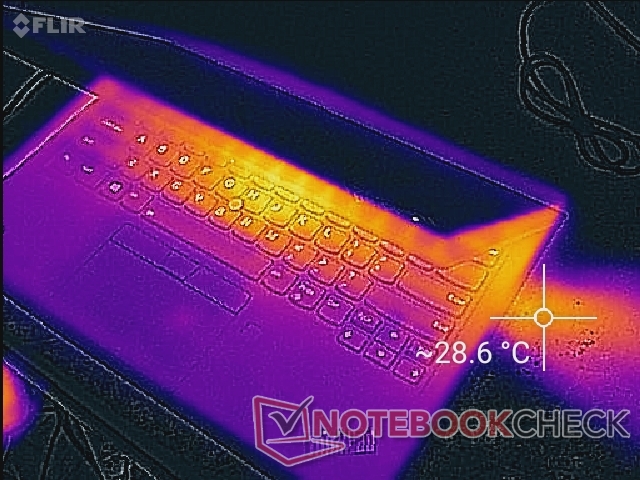
(+) La temperatura massima sul lato superiore è di 33.6 °C / 92 F, rispetto alla media di 34.3 °C / 94 F, che varia da 21.2 a 62.5 °C per questa classe Office.
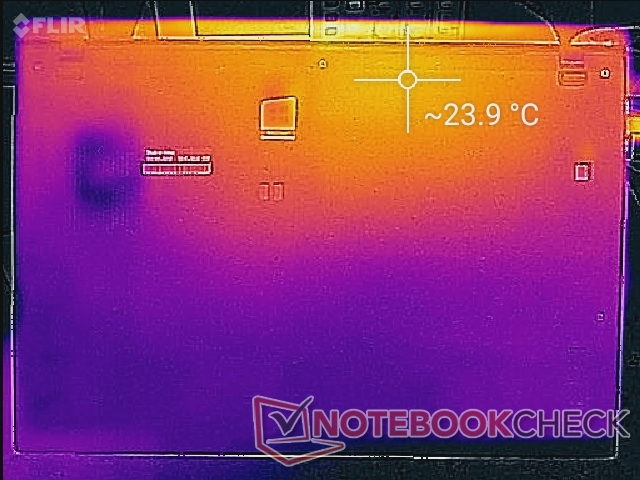
(+) Il lato inferiore si riscalda fino ad un massimo di 32.2 °C / 90 F, rispetto alla media di 36.8 °C / 98 F
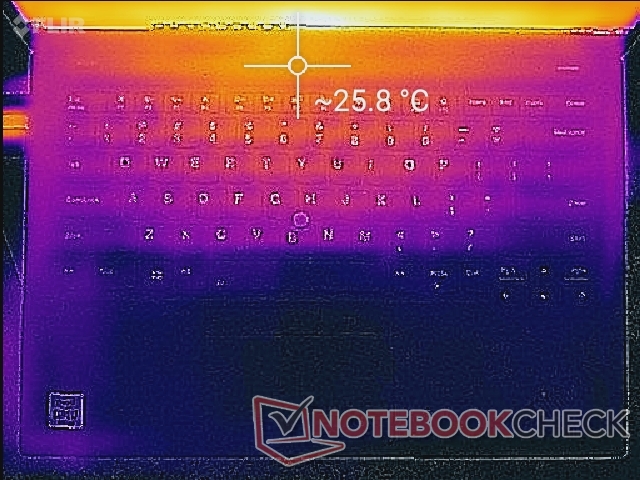
(+) In idle, la temperatura media del lato superiore è di 22.6 °C / 73 F, rispetto alla media deld ispositivo di 29.5 °C / 85 F.
(+) I poggiapolsi e il touchpad sono piu' freddi della temperatura della pelle con un massimo di 22.6 °C / 72.7 F e sono quindi freddi al tatto.
(+) La temperatura media della zona del palmo della mano di dispositivi simili e'stata di 27.5 °C / 81.5 F (+4.9 °C / 8.8 F).
Stress Test
Stressiamo il sistema con carichi sintetici per identificare eventuali problemi di strozzamento. Quando si esegue Prime95, la CPU aumenta a 4,1 GHz per pochi secondi prima che la temperatura del core raggiunga i 98 °C. Successivamente, le frequenze di clock si stabilizzano a 3,2 - 3,3 GHz ad una temperatura di 97 °C per alcuni minuti. Le frequenze di clock e la temperatura si stabilizzeranno poi tra 2,0 e 3,2 GHz e 73 C a 97 C, rispettivamente, per corroborare con le nostre osservazioni del loop CineBench R15 dall'alto.
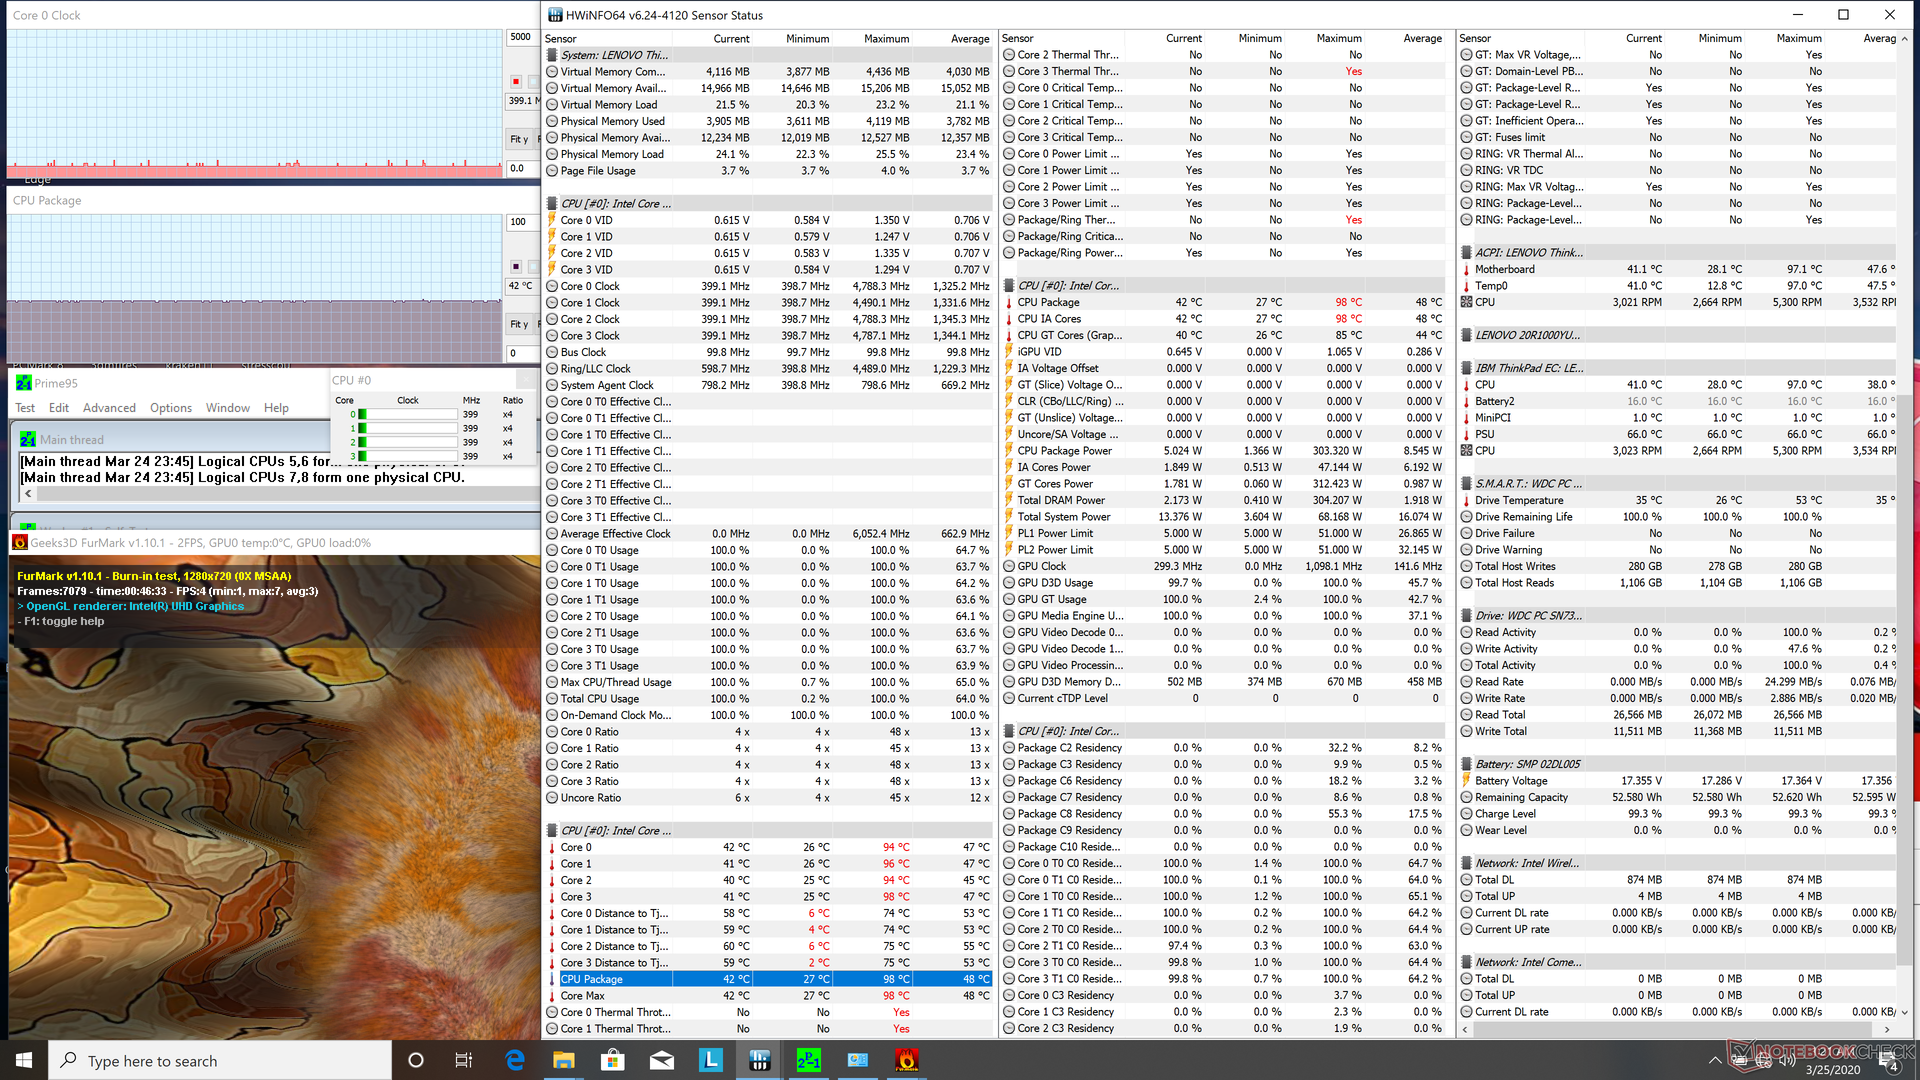
Un pesante strozzamento della CPU si verifica quando si eseguono contemporaneamente sia Prime95 che FurMark. La CPU gira a soli 400 MHz per una temperatura del core di 42 °C. Le temperature di superficie sono quindi molto più calde se si eseguono giochi o altri carichi reali impegnativi in cui la CPU e la GPU non sono al 100% di utilizzo.
L'utilizzo della batteria non avrà alcun impatto sulle prestazioni. Un test 3DMark 11 sulle batterie non comporta quasi nessuna modifica dei punteggi finali di Physics and Graphics.
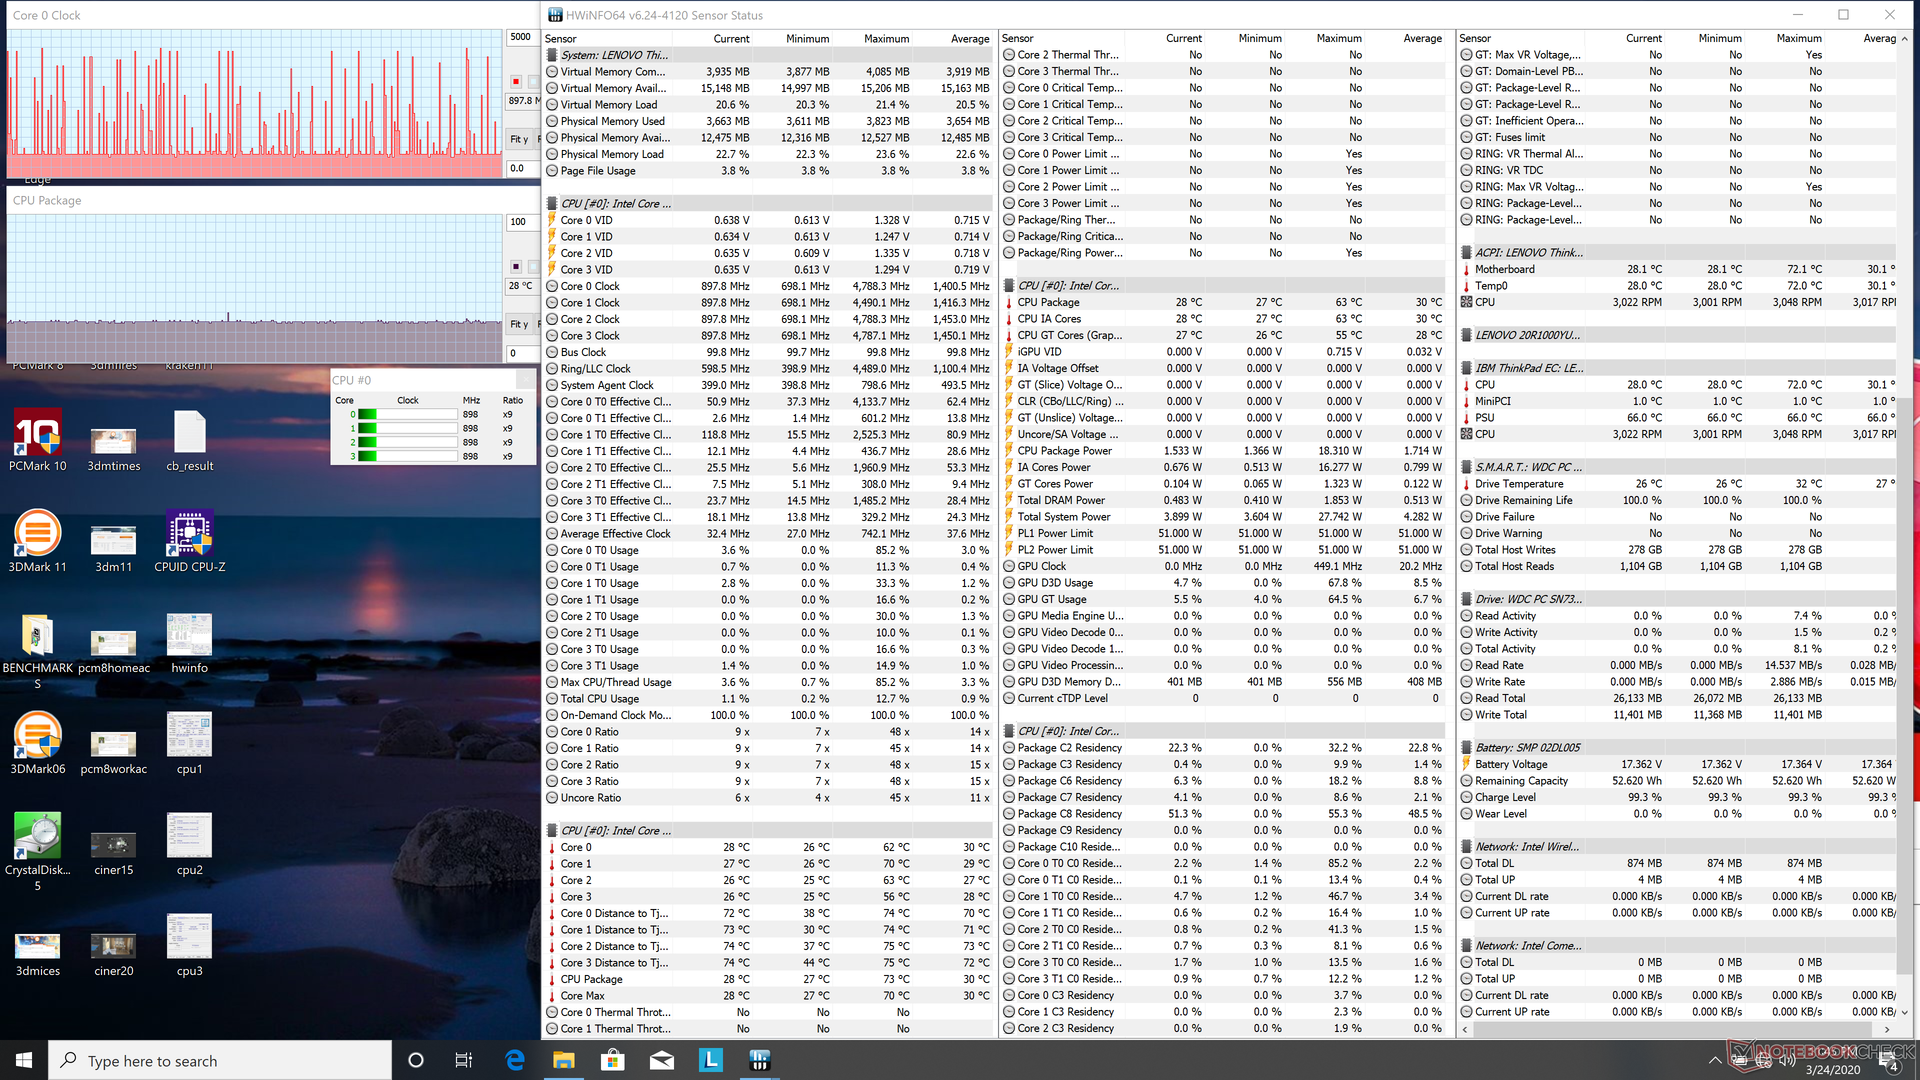
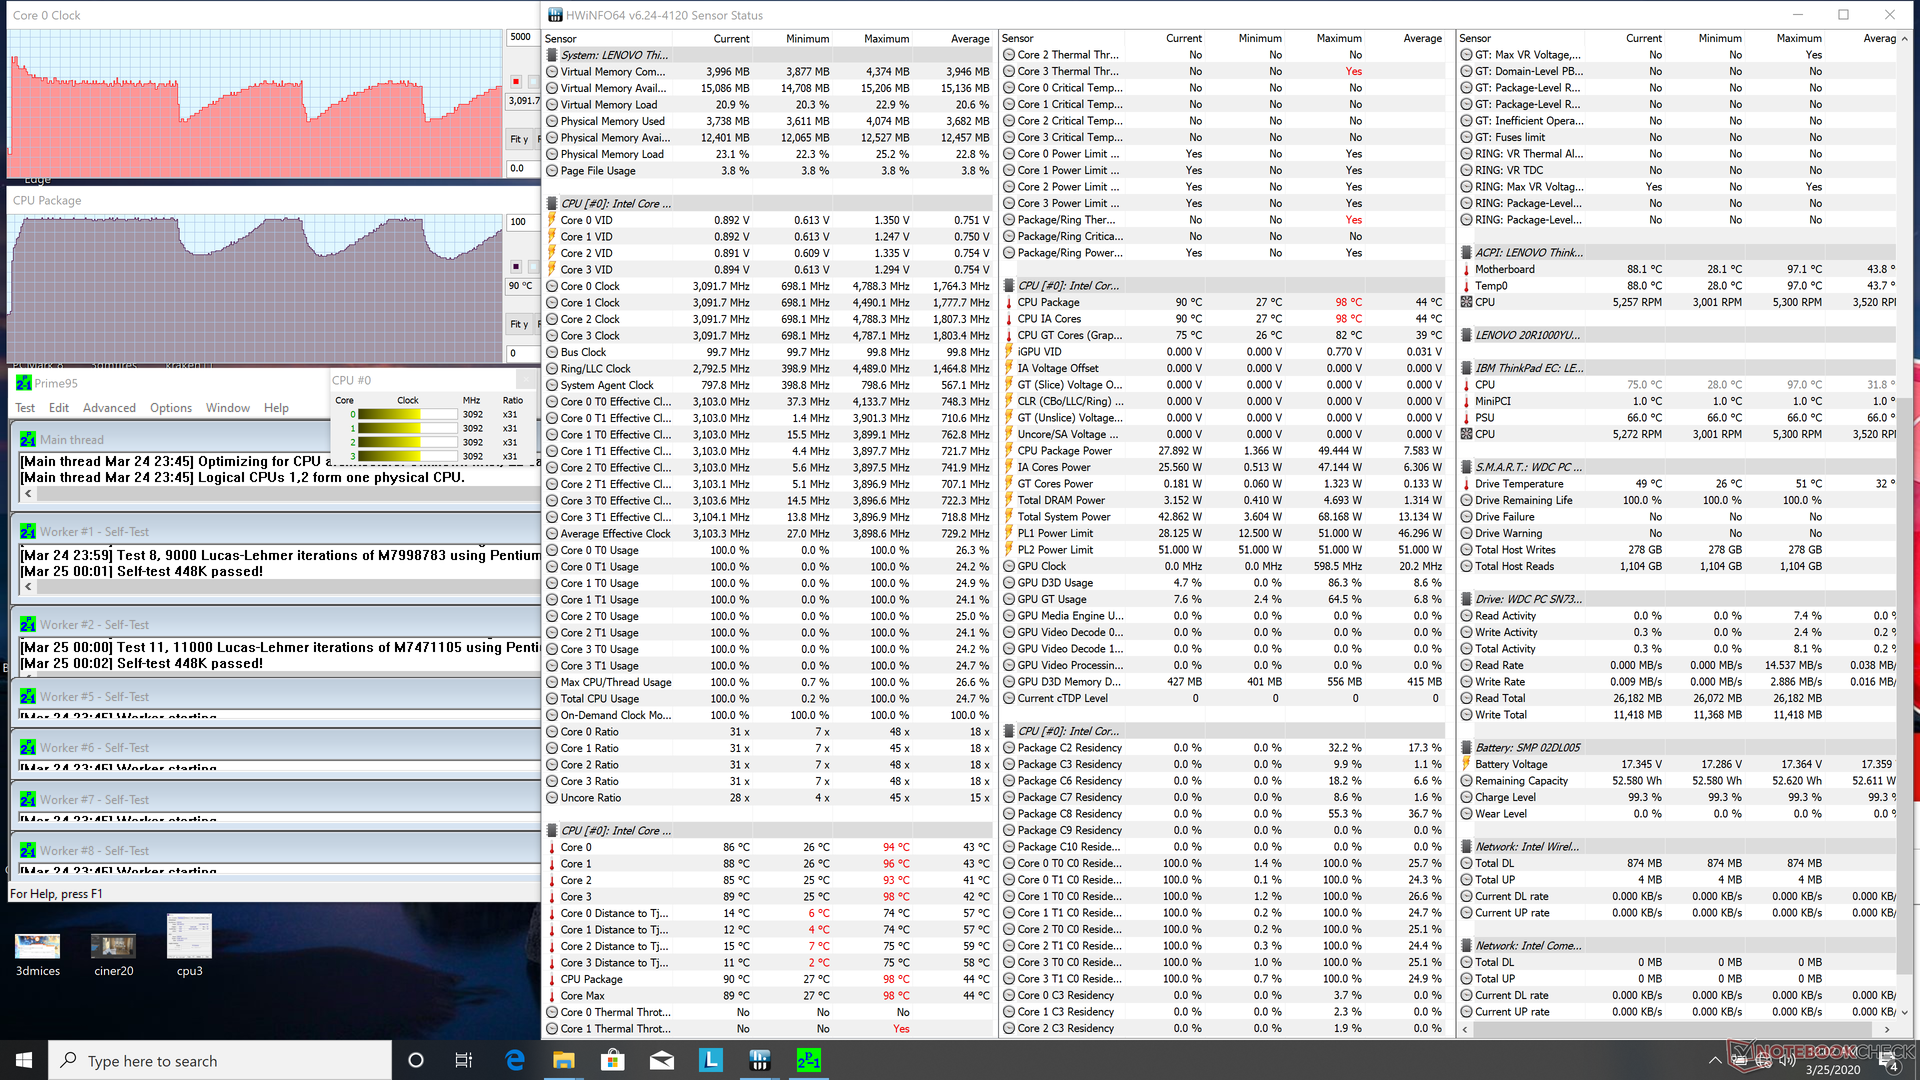
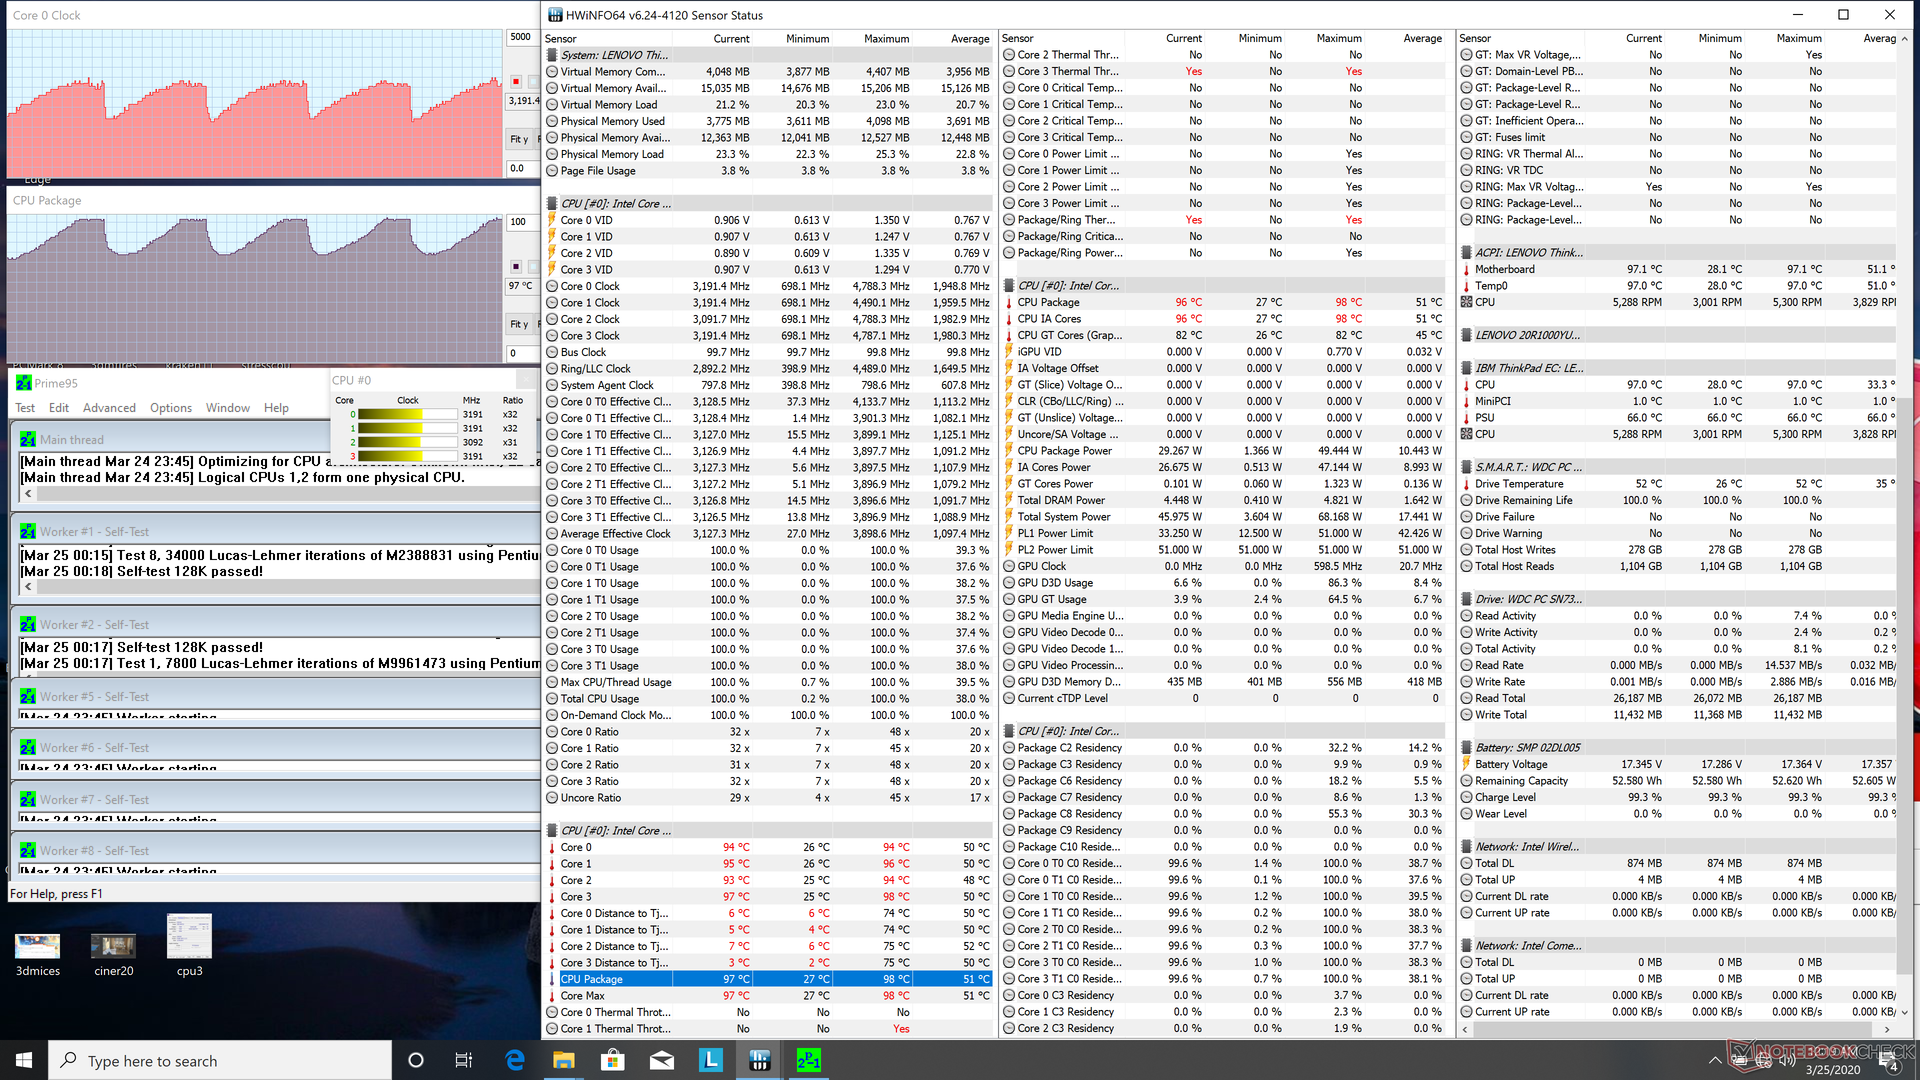
| CPU Clock (GHz) | GPU Clock (MHz) | Average CPU Temperature (°C) | |
| System Idle | -- | -- | 28 |
| Prime95 Stress | 2.0 - 3.2 | -- | 73 - 97 |
| Prime95 + FurMark Stress | 0.4 | -- | 42 |
Altoparlanti


Gestione Energetica
Consumo Energetico
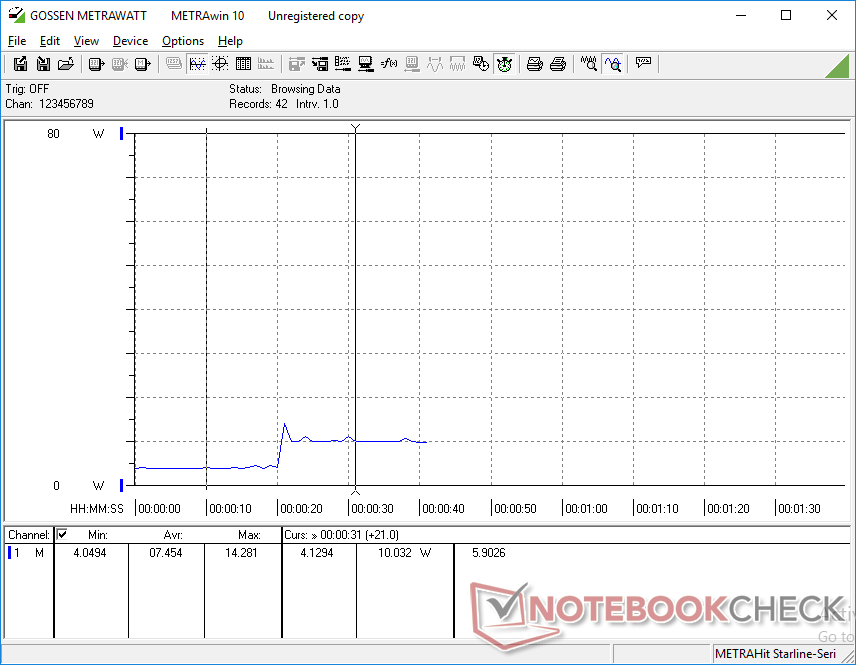
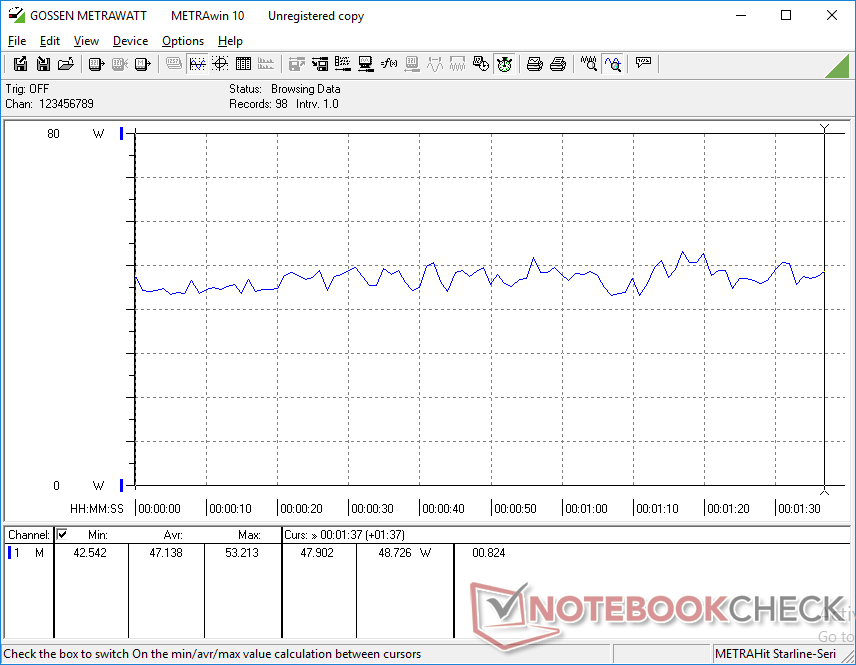
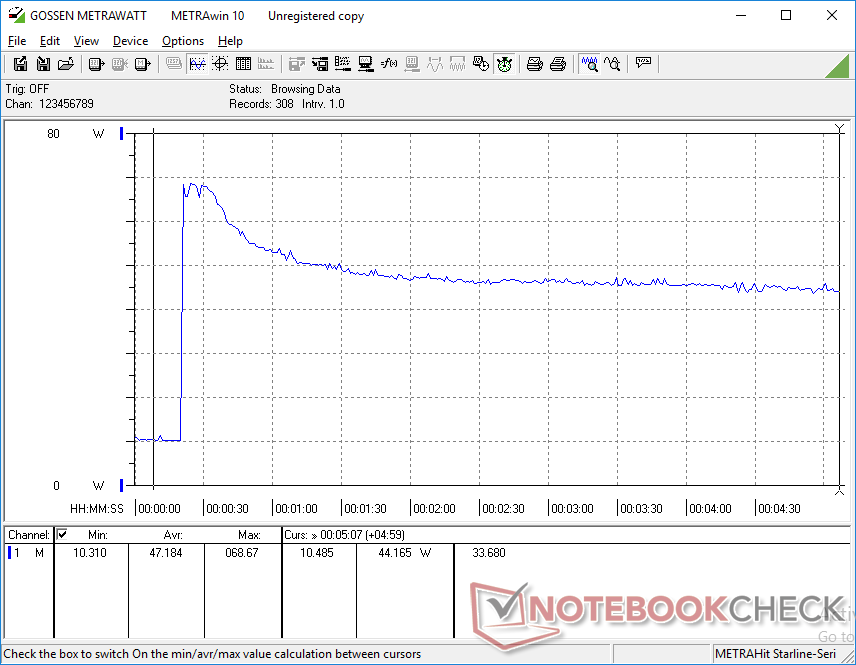
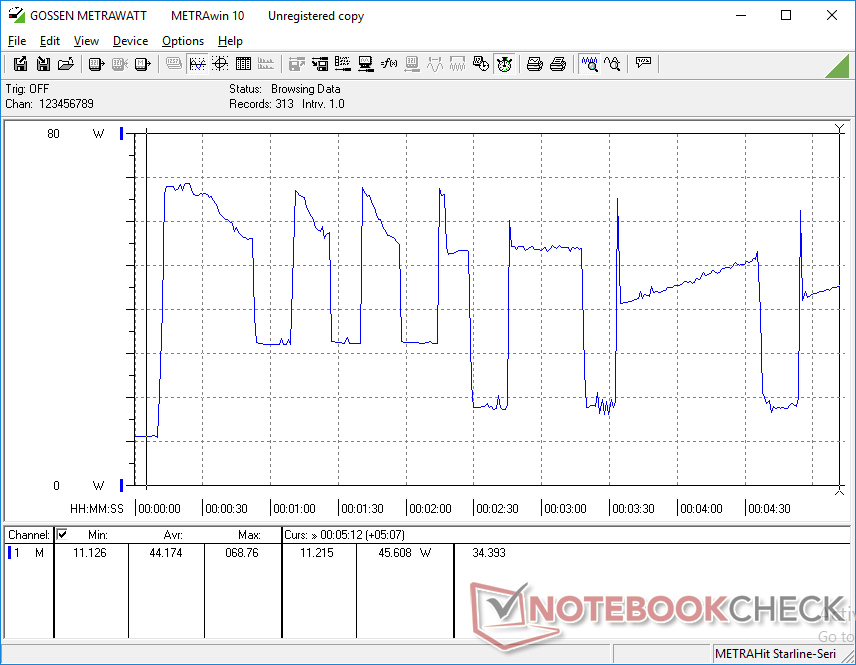
Se lo lasciamo al minimo sulla scrivania, la potenza richiesta sarà compresa tra i 3 W e i 13 W, a seconda del profilo di potenza e del livello di luminosità. In effetti, il salto da 0% di luminosità al 100% di luminosità incorrerà in circa 6 W. Il consumo complessivo di energia rimane molto simile a quello del Whiskey Lake-U ThinkPad X1 Carbon dello scorso anno, anche se ancora qualche Watt in più in media a causa del nostro più esigente display UHD 4K UHD.
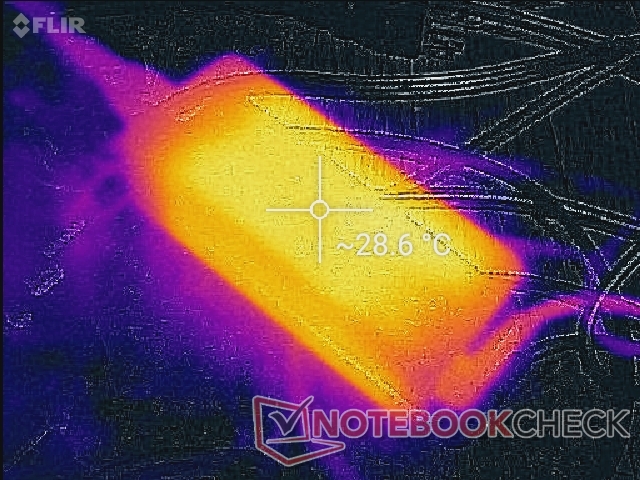
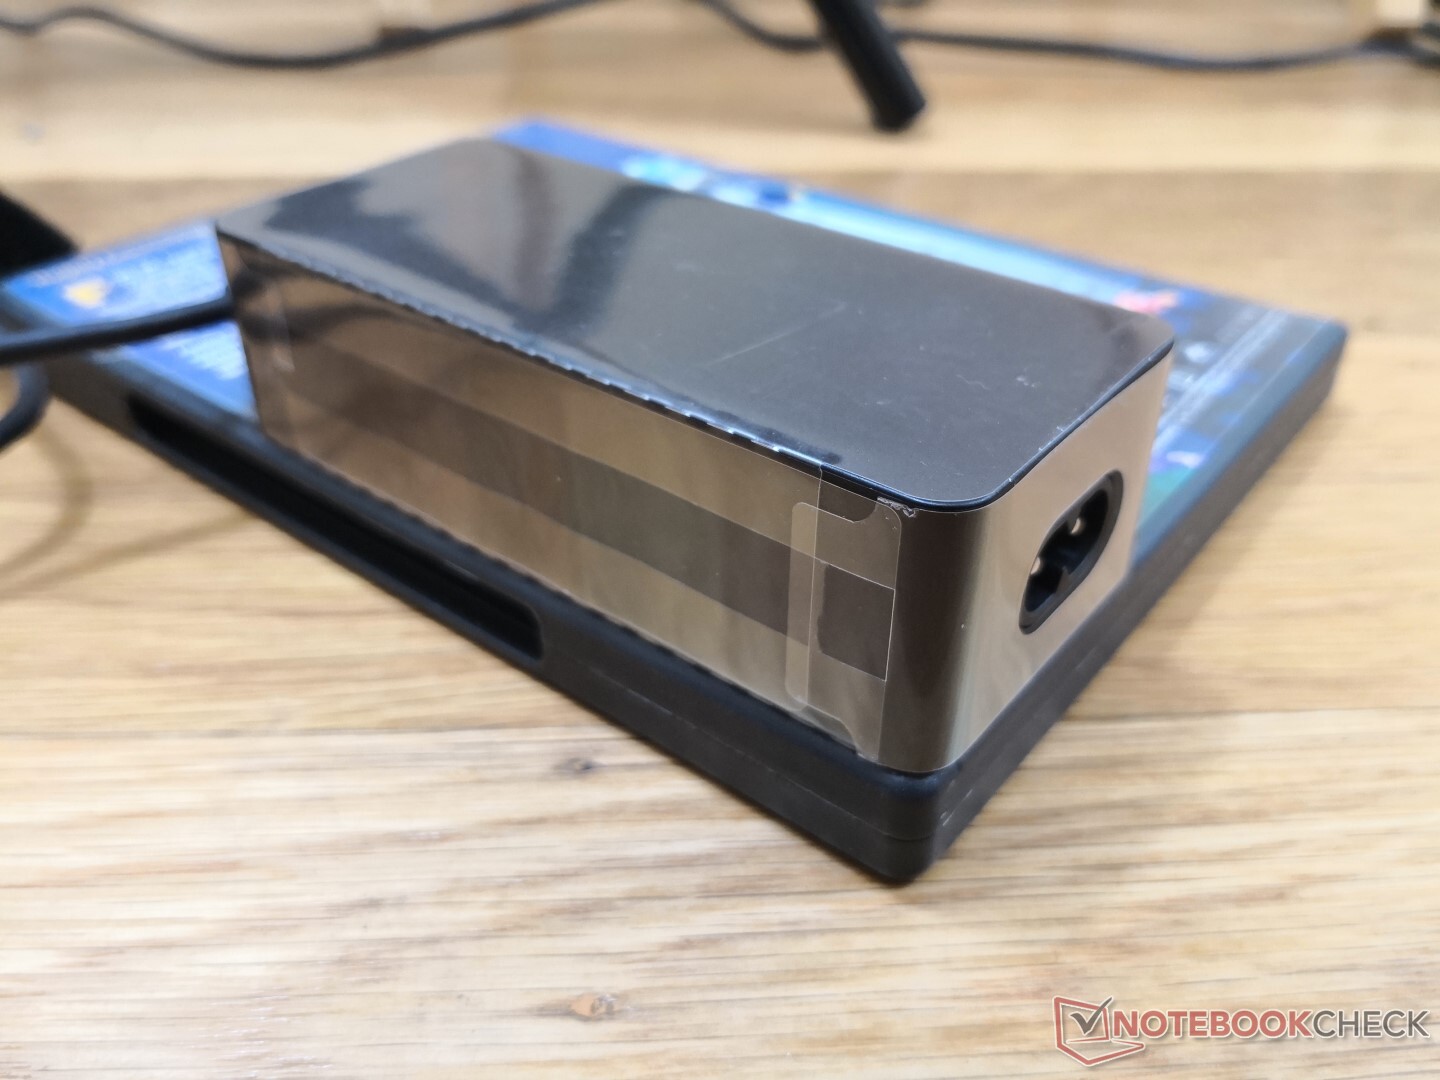
Siamo in grado di registrare un consumo massimo di 69 W dal piccolo (~10,8 x 4,8 x 3 cm) adattatore da 65 W quando si utilizzano contemporaneamente Prime95 e FurMark. Tuttavia, questo elevato consumo è solo temporaneo a causa del comportamento ciclico estremo quando si eseguono entrambi i programmi di riferimento, come mostrato dai nostri grafici qui sotto.
| Off / Standby | |
| Idle | |
| Sotto carico |
|
Leggenda:
min: | |
| Lenovo ThinkPad X1 Carbon G7 20R1-000YUS i7-10510U, UHD Graphics 620, WDC PC SN730 SDBPNTY-512G, IPS, 3840x2160, 14" | Lenovo ThinkPad X1 Extreme 2019 20QV000WGE i7-9750H, GeForce GTX 1650 Mobile, Samsung SSD PM981 MZVLB512HAJQ, IPS, 3840x2160, 15.6" | Lenovo ThinkPad X1 Carbon 2019-20QE000VGE i7-8665U, UHD Graphics 620, WDC PC SN720 SDAQNTW-512G, IPS, 2560x1440, 14" | Lenovo ThinkPad X1 Carbon G6-20KG0025UK i5-8350U, UHD Graphics 620, Lenovo LENSE20256GMSP34MEAT2TA, IPS, 1920x1080, 14" | Lenovo ThinkPad X1 Carbon 2017-20HR0021GE i5-7200U, HD Graphics 620, Toshiba THNSF5256GPUK, IPS, 1920x1080, 14" | Lenovo ThinkPad X1 Carbon Touch 20A7-002DGE 4550U, HD Graphics 5000, Samsung MZNTD512HAGL, IPS-Panel, 2560x1440, 14" | |
|---|---|---|---|---|---|---|
| Power Consumption | -83% | 20% | 25% | 25% | 25% | |
| Idle Minimum * (Watt) | 3.5 | 8.5 -143% | 3 14% | 4.7 -34% | 3.8 -9% | 4.1 -17% |
| Idle Average * (Watt) | 10.8 | 14.7 -36% | 6.3 42% | 7.3 32% | 7.1 34% | 8.7 19% |
| Idle Maximum * (Watt) | 12.5 | 19.4 -55% | 8.9 29% | 9.4 25% | 8.3 34% | 10.2 18% |
| Load Average * (Watt) | 47.2 | 89.6 -90% | 40.8 14% | 28 41% | 34.2 28% | 26.3 44% |
| Load Maximum * (Watt) | 68.8 | 129.8 -89% | 67.5 2% | 28.2 59% | 43.3 37% | 26.7 61% |
| Witcher 3 ultra * (Watt) | 96.1 |
* ... Meglio usare valori piccoli
Autonomia della batteria
I tempi di autonomia sono circa una o due ore più lunghi rispetto a quelli registrati l'anno scorso sull'X1 Carbon con il display WQHD, anche se la capacità della batteria rimane invariata. Quasi tutti i caricabatterie USB Type-C possono essere utilizzati per ricaricare il sistema, ma la velocità di ricarica varia a seconda del caricabatterie.
La ricarica completa richiede circa 90 minuti con l'adattatore AC incluso dopo l'aggiornamento al sistema al BIOS più recente. Prima dell'aggiornamento, la velocità di ricarica sarà di 5-6 ore.
| Lenovo ThinkPad X1 Carbon G7 20R1-000YUS i7-10510U, UHD Graphics 620, 51 Wh | Lenovo ThinkPad X1 Carbon 2019-20QD00M7GE i5-8265U, UHD Graphics 620, 51 Wh | Lenovo ThinkPad X1 Carbon 2018-20KGS5DU00 i5-8550U, UHD Graphics 620, 57 Wh | Lenovo ThinkPad X1 Carbon G6-20KG0025UK i5-8350U, UHD Graphics 620, 57 Wh | Lenovo ThinkPad X1 Carbon 2017-20HR0021GE i5-7200U, HD Graphics 620, 57 Wh | Lenovo ThinkPad X1 Carbon Touch 20A7-002DGE 4550U, HD Graphics 5000, 45 Wh | |
|---|---|---|---|---|---|---|
| Autonomia della batteria | -24% | -10% | 4% | -9% | ||
| WiFi v1.3 (h) | 10 | 7.6 -24% | 9 -10% | 10.4 4% | 9.1 -9% | |
| Reader / Idle (h) | 24.5 | 13.7 | 12.1 | |||
| Load (h) | 1.9 | 2 | 1.8 | |||
| WiFi (h) | 6.5 |
Pro
Contro
Giudizio Complessivo

Se siete sul mercato alla ricerca di un nuovo Lenovo ThinkPad X1 Carbon, la scelta della configurazione migliore è importante soprattutto perché il modello non è economico. Si consiglia di evitare il Core i7-10510U in quanto le prestazioni sono all'incirca le stesse del più economico Core i5-8265U o Core i7-8565U. Solo l'opzione Core i7-10710U con core hexa-core fornirà un notevole incremento delle prestazioni della CPU rispetto alle opzioni dell'ultima generazione. Investire in RAM, 4G LTE, o il display più luminoso sarebbe più utile della più recente CPU di decima generazione per l'uso quotidiano.
I principali inconvenienti del sistema richiederanno una completa riprogettazione per essere affrontati. La mancanza di Wi-Fi 6, lettore SD, e migliori opzioni grafiche smorzano il potenziale lavoro da ufficio dell'X1 Carbon. Anche la presenza della modulazione di larghezza di impulso su questa opzione di display più luminoso è una seccatura, in quanto i modelli della generazione precedente non presentavano lo stesso fenomeno. Il clock ciclico della CPU in condizioni di stress molto elevato impedisce agli utenti di sfruttare le elevate velocità di clock Turbo Boost della CPU Intel per lunghi periodi. Rende meno appetibile l'investimento nei processori più recenti quando non è possibile utilizzarli al meglio.
Combinate un portatile sottile Yoga con un portatile ThinkPad serie T e avrete il ThinkPad X1 Carbon. È sicuramente una delle macchine ThinkPad più portatili e attraenti disponibili, ma bisogna essere preparati ad alcune caratteristiche mancanti. Scegliere il modello dell'anno scorso vi darà quasi le stesse prestazioni ad un prezzo più economico.
Lenovo ThinkPad X1 Carbon G7 20R1-000YUS
- 06/22/2020 v7 (old)
Allen Ngo
Price comparison
