Recensione breve del Portatile HP Elitebook Folio 1040 G4 (FHD, 7820HQ)
| |||||||||||||||||||||||||
Distribuzione della luminosità: 87 %
Al centro con la batteria: 295.9 cd/m²
Contrasto: 1287:1 (Nero: 0.23 cd/m²)
ΔE ColorChecker Calman: 2.83 | ∀{0.5-29.43 Ø4.73}
ΔE Greyscale Calman: 5.2 | ∀{0.09-98 Ø4.97}
97% sRGB (Argyll 1.6.3 3D)
63% AdobeRGB 1998 (Argyll 1.6.3 3D)
69% AdobeRGB 1998 (Argyll 3D)
97.1% sRGB (Argyll 3D)
66.8% Display P3 (Argyll 3D)
Gamma: 2.28
CCT: 7056 K
| HP Elitebook 1040 G4-2XU40UT Chi Mei CMN14D7, IPS, 14", 1920x1080 | Lenovo ThinkPad X1 Carbon 2017-20HQS03P00 B140HAN03_1, IPS, 14", 1920x1080 | Lenovo ThinkPad T470s-20HGS00V00 B140QAN01.5, IPS, 14", 2560x1440 | HP EliteBook Folio 1040 G3 AUO1136, IPS, 14", 2560x1440 | Toshiba Tecra X40-D Toshiba TOS508F, IPS, 14", 1920x1080 | Dell XPS 15 9560 (i7-7700HQ, UHD) IGZO IPS, 15.6", 3840x2160 | |
|---|---|---|---|---|---|---|
| Display | -10% | 1% | 1% | -38% | 27% | |
| Display P3 Coverage (%) | 66.8 | 61.4 -8% | 69 3% | 67.9 2% | 40.55 -39% | 89.7 34% |
| sRGB Coverage (%) | 97.1 | 85.9 -12% | 95.1 -2% | 96.8 0% | 61 -37% | 100 3% |
| AdobeRGB 1998 Coverage (%) | 69 | 62.4 -10% | 69.6 1% | 70 1% | 41.89 -39% | 100 45% |
| Response Times | -13% | -16% | -12% | 1% | -49% | |
| Response Time Grey 50% / Grey 80% * (ms) | 34.4 ? | 41.6 ? -21% | 46.4 ? -35% | 46.4 ? -35% | 38 ? -10% | 57.2 ? -66% |
| Response Time Black / White * (ms) | 30 ? | 31.6 ? -5% | 28.8 ? 4% | 26.4 ? 12% | 26.8 ? 11% | 39.2 ? -31% |
| PWM Frequency (Hz) | 26040 ? | 20410 ? | 962 | |||
| Screen | -16% | -24% | -10% | -42% | -10% | |
| Brightness middle (cd/m²) | 295.9 | 311 5% | 327 11% | 327 11% | 283.9 -4% | 370.1 25% |
| Brightness (cd/m²) | 287 | 288 0% | 311 8% | 316 10% | 261 -9% | 356 24% |
| Brightness Distribution (%) | 87 | 85 -2% | 88 1% | 87 0% | 85 -2% | 87 0% |
| Black Level * (cd/m²) | 0.23 | 0.24 -4% | 0.25 -9% | 0.35 -52% | 0.25 -9% | 0.37 -61% |
| Contrast (:1) | 1287 | 1296 1% | 1308 2% | 934 -27% | 1136 -12% | 1000 -22% |
| Colorchecker dE 2000 * | 2.83 | 5.5 -94% | 6.1 -116% | 4.39 -55% | 6.4 -126% | 5.3 -87% |
| Colorchecker dE 2000 max. * | 7.34 | 9 -23% | 12.2 -66% | 7.27 1% | 18.7 -155% | 9.9 -35% |
| Greyscale dE 2000 * | 5.2 | 6.2 -19% | 8.8 -69% | 4.69 10% | 6.3 -21% | 4.6 12% |
| Gamma | 2.28 96% | 2.02 109% | 2.18 101% | 2.15 102% | 2.39 92% | 2.31 95% |
| CCT | 7056 92% | 5950 109% | 6172 105% | 7101 92% | 6511 100% | 6284 103% |
| Color Space (Percent of AdobeRGB 1998) (%) | 63 | 55.96 -11% | 61.56 -2% | 62.52 -1% | 38 -40% | 88.3 40% |
| Color Space (Percent of sRGB) (%) | 97 | 85.77 -12% | 94.88 -2% | 96.71 0% | 60 -38% | 100 3% |
| Media totale (Programma / Settaggio) | -13% /
-14% | -13% /
-18% | -7% /
-8% | -26% /
-35% | -11% /
-8% |
* ... Meglio usare valori piccoli
Tempi di risposta del Display
| ↔ Tempi di risposta dal Nero al Bianco | ||
|---|---|---|
| 30 ms ... aumenta ↗ e diminuisce ↘ combinato | ↗ 11.2 ms Incremento | 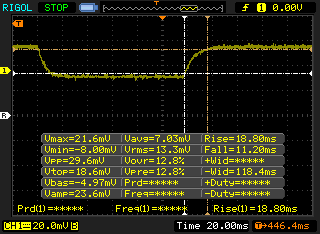 |
| ↘ 18.8 ms Calo | ||
| Lo schermo mostra tempi di risposta lenti nei nostri tests e sarà insoddisfacente per i gamers. In confronto, tutti i dispositivi di test variano da 0.1 (minimo) a 240 (massimo) ms. » 80 % di tutti i dispositivi è migliore. Questo significa che i tempi di risposta rilevati sono peggiori rispetto alla media di tutti i dispositivi testati (19.9 ms). | ||
| ↔ Tempo di risposta dal 50% Grigio all'80% Grigio | ||
| 34.4 ms ... aumenta ↗ e diminuisce ↘ combinato | ↗ 16.4 ms Incremento | 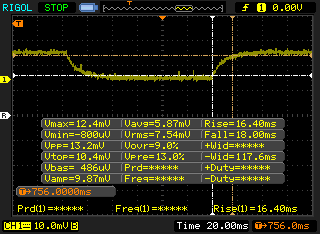 |
| ↘ 18 ms Calo | ||
| Lo schermo mostra tempi di risposta lenti nei nostri tests e sarà insoddisfacente per i gamers. In confronto, tutti i dispositivi di test variano da 0.165 (minimo) a 636 (massimo) ms. » 48 % di tutti i dispositivi è migliore. Questo significa che i tempi di risposta rilevati sono peggiori rispetto alla media di tutti i dispositivi testati (31.1 ms). | ||
Sfarfallio dello schermo / PWM (Pulse-Width Modulation)
| flickering dello schermo / PWM rilevato | 26040 Hz | ≤ 59 % settaggio luminosita' | 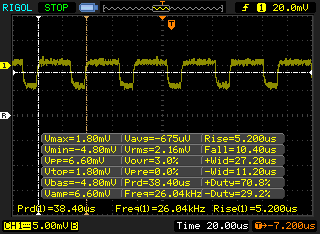 |
Il display sfarfalla a 26040 Hz (Probabilmente a causa dell'uso di PWM) Flickering rilevato ad una luminosita' di 59 % o inferiore. Non dovrebbe verificarsi flickering o PWM sopra questo valore di luminosita'. La frequenza di 26040 Hz è abbastanza alta, quindi la maggioranza degli utenti sensibili al PWM non dovrebbero notare alcun flickering. In confronto: 52 % di tutti i dispositivi testati non utilizza PWM per ridurre la luminosita' del display. Se è rilevato PWM, una media di 7798 (minimo: 5 - massimo: 343500) Hz è stata rilevata. | |||
| wPrime 2.10 - 1024m | |
| Toshiba Tecra X40-D | |
| Lenovo ThinkPad T470s-20HGS00V00 | |
| HP Spectre x360 15t-bl100 | |
| HP Elitebook 1040 G4-2XU40UT | |
| Lenovo ThinkPad T470p PL | |
| Dell XPS 15 9560 (i7-7700HQ, UHD) | |
* ... Meglio usare valori piccoli
| PCMark 8 Home Score Accelerated v2 | 4186 punti | |
| PCMark 8 Creative Score Accelerated v2 | 5275 punti | |
| PCMark 8 Work Score Accelerated v2 | 5161 punti | |
| PCMark 10 Score | 4043 punti | |
Aiuto | ||
| HP Elitebook 1040 G4-2XU40UT Toshiba XG4 NVMe (THNSN5512GPUK) | Lenovo ThinkPad X1 Carbon 2017-20HQS03P00 Samsung PM961 NVMe MZVLW512HMJP | Lenovo ThinkPad T470p PL Toshiba NVMe THNSF5512GPUK | HP EliteBook Folio 1040 G3 Samsung SM951 MZVPV256HDGL m.2 PCI-e | Toshiba Tecra X40-D Samsung PM961 MZVLW256HEHP | Dell XPS 15 9560 (i7-7700HQ, UHD) Lite-On CX2-8B512-Q11 | Lenovo Yoga 720-13IKB Toshiba XG4 NVMe (THNSN5512GPUK) | HP Spectre x360 15t-bl100 Samsung PM961 NVMe MZVLW512HMJP | |
|---|---|---|---|---|---|---|---|---|
| AS SSD | 84% | -7% | 56% | 39% | 47% | 9% | 99% | |
| Copy Game MB/s (MB/s) | 394.2 | 1145 190% | 617 57% | 540 37% | 413.9 5% | 1134 188% | ||
| Copy Program MB/s (MB/s) | 133.7 | 467.9 250% | 348.7 161% | 411.5 208% | 106.2 -21% | 534 299% | ||
| Copy ISO MB/s (MB/s) | 534 | 1725 223% | 1313 146% | 1272 138% | 755 41% | 1936 263% | ||
| Score Total (Points) | 2299 | 3171 38% | 1855 -19% | 3721 62% | 3576 56% | 2810 22% | 2427 6% | 3781 64% |
| Score Write (Points) | 848 | 1207 42% | 737 -13% | 590 -30% | 675 -20% | 1022 21% | 879 4% | 1556 83% |
| Score Read (Points) | 979 | 1322 35% | 745 -24% | 2095 114% | 1963 101% | 1206 23% | 1049 7% | 1493 53% |
| Access Time Write * (ms) | 0.038 | 0.027 29% | 0.036 5% | 0.03 21% | 0.028 26% | 0.034 11% | 0.034 11% | 0.026 32% |
| Access Time Read * (ms) | 0.105 | 0.028 73% | 0.083 21% | 0.047 55% | 0.061 42% | 0.034 68% | 0.054 49% | 0.04 62% |
| 4K-64 Write (MB/s) | 662 | 905 37% | 542 -18% | 344.3 -48% | 438.4 -34% | 789 19% | 687 4% | 1262 91% |
| 4K-64 Read (MB/s) | 782 | 1022 31% | 568 -27% | 1858 138% | 1663 113% | 962 23% | 828 6% | 1206 54% |
| 4K Write (MB/s) | 100.1 | 151.1 51% | 101.5 1% | 126.6 26% | 124.8 25% | 112.2 12% | 93.8 -6% | 141.1 41% |
| 4K Read (MB/s) | 38.49 | 56.8 48% | 41 7% | 47.72 24% | 51.6 34% | 41.34 7% | 35.88 -7% | 51.9 35% |
| Seq Write (MB/s) | 863 | 1506 75% | 940 9% | 1190 38% | 1117 29% | 1207 40% | 977 13% | 1530 77% |
| Seq Read (MB/s) | 1585 | 2434 54% | 1360 -14% | 1839 16% | 2479 56% | 2026 28% | 1852 17% | 2342 48% |
* ... Meglio usare valori piccoli

| 3DMark | |
| 1280x720 Cloud Gate Standard Graphics | |
| Dell XPS 15 9560 (i7-7700HQ, UHD) | |
| Microsoft Surface Book 2 | |
| Apple MacBook Pro 15 2017 (2.9 GHz, 560) | |
| HP Spectre x360 15t-bl100 | |
| Lenovo ThinkPad T470p PL | |
| HP Elitebook 1040 G4-2XU40UT | |
| Lenovo ThinkPad T470s-20HGS00V00 | |
| Lenovo Yoga 720-13IKB | |
| Lenovo ThinkPad X1 Carbon 2017-20HQS03P00 | |
| Toshiba Tecra X40-D | |
| Lenovo ThinkPad T470-20HD002HGE | |
| HP EliteBook Folio 1040 G3 | |
| 1920x1080 Fire Strike Graphics | |
| Dell XPS 15 9560 (i7-7700HQ, UHD) | |
| Microsoft Surface Book 2 | |
| Apple MacBook Pro 15 2017 (2.9 GHz, 560) | |
| HP Spectre x360 15t-bl100 | |
| Lenovo ThinkPad T470p PL | |
| HP Elitebook 1040 G4-2XU40UT | |
| Lenovo ThinkPad T470s-20HGS00V00 | |
| Lenovo Yoga 720-13IKB | |
| Lenovo ThinkPad X1 Carbon 2017-20HQS03P00 | |
| Toshiba Tecra X40-D | |
| HP EliteBook Folio 1040 G3 | |
| Lenovo ThinkPad T470-20HD002HGE | |
| 1920x1080 Ice Storm Extreme Graphics | |
| Dell XPS 15 9560 (i7-7700HQ, UHD) | |
| Lenovo ThinkPad T470p PL | |
| HP Spectre x360 15t-bl100 | |
| Microsoft Surface Book 2 | |
| 3DMark 06 Standard Score | 12419 punti | |
| 3DMark 11 Performance | 1980 punti | |
| 3DMark Cloud Gate Standard Score | 9244 punti | |
| 3DMark Fire Strike Score | 1102 punti | |
Aiuto | ||
| BioShock Infinite - 1280x720 Very Low Preset | |
| Microsoft Surface Book 2 | |
| HP Spectre x360 15t-bl100 | |
| Lenovo ThinkPad T470p PL | |
| HP Elitebook 1040 G4-2XU40UT | |
| Lenovo Yoga 720-13IKB | |
| Lenovo ThinkPad X1 Carbon 2017-20HQS03P00 | |
| HP EliteBook Folio 1040 G3 | |
| Lenovo ThinkPad T470s-20HGS00V00 | |
| Lenovo ThinkPad T470-20HD002HGE | |
| Ashes of the Singularity - 1280x768 low | |
| HP Elitebook 1040 G4-2XU40UT | |
| Civilization 6 | |
| 1024x768 Minimum Preset | |
| HP Elitebook 1040 G4-2XU40UT | |
| 1366x768 Medium Preset | |
| HP Elitebook 1040 G4-2XU40UT | |
| basso | medio | alto | ultra | |
|---|---|---|---|---|
| BioShock Infinite (2013) | 79 | 35 | 30 | |
| Ashes of the Singularity (2016) | 10 | |||
| Civilization 6 (2016) | 42 | 16 |
Rumorosità
| Idle |
| 28.2 / 28.2 / 28.2 dB(A) |
| Sotto carico |
| 33.3 / 35.3 dB(A) |
 | ||
30 dB silenzioso 40 dB(A) udibile 50 dB(A) rumoroso |
||
min: | ||
| HP Elitebook 1040 G4-2XU40UT HD Graphics 630, i7-7820HQ, Toshiba XG4 NVMe (THNSN5512GPUK) | Lenovo ThinkPad X1 Carbon 2017-20HQS03P00 HD Graphics 620, i7-7500U, Samsung PM961 NVMe MZVLW512HMJP | Lenovo ThinkPad T470p PL GeForce 940MX, i7-7700HQ, Toshiba NVMe THNSF5512GPUK | Lenovo ThinkPad T470s-20HGS00V00 HD Graphics 620, i7-7600U, Samsung SSD PM961 1TB M.2 PCIe 3.0 x4 NVMe (MZVLW1T0) | Lenovo ThinkPad T470-20HD002HGE HD Graphics 620, i5-7200U, Samsung PM961 NVMe MZVLW512HMJP | HP EliteBook Folio 1040 G3 HD Graphics 520, 6300U, Samsung SM951 MZVPV256HDGL m.2 PCI-e | Toshiba Tecra X40-D HD Graphics 620, i7-7600U, Samsung PM961 MZVLW256HEHP | Dell XPS 15 9560 (i7-7700HQ, UHD) GeForce GTX 1050 Mobile, i7-7700HQ, Lite-On CX2-8B512-Q11 | Lenovo Yoga 720-13IKB UHD Graphics 620, i5-8550U, Toshiba XG4 NVMe (THNSN5512GPUK) | HP Spectre x360 15t-bl100 GeForce MX150, i5-8550U, Samsung PM961 NVMe MZVLW512HMJP | Microsoft Surface Book 2 GeForce GTX 1050 Mobile, i7-8650U, Samsung PM961 MZVLW256HEHP | Apple MacBook Pro 15 2017 (2.9 GHz, 560) Radeon Pro 560, i7-7820HQ | |
|---|---|---|---|---|---|---|---|---|---|---|---|---|
| Noise | -7% | -10% | -7% | 1% | -3% | -2% | -16% | -5% | -8% | -8% | -9% | |
| off /ambiente * (dB) | 28.2 | 29.3 -4% | 28.9 -2% | 28 1% | 29.1 -3% | 28 1% | 28.4 -1% | 30.5 -8% | 28.4 -1% | 29.4 -4% | 30.8 -9% | |
| Idle Minimum * (dB) | 28.2 | 29.3 -4% | 30 -6% | 28.9 -2% | 28 1% | 29.1 -3% | 28 1% | 29 -3% | 30.5 -8% | 28.4 -1% | 29.4 -4% | 31 -10% |
| Idle Average * (dB) | 28.2 | 29.3 -4% | 31.4 -11% | 28.9 -2% | 28 1% | 29.1 -3% | 28 1% | 29 -3% | 30.5 -8% | 28.4 -1% | 29.4 -4% | 31 -10% |
| Idle Maximum * (dB) | 28.2 | 32.2 -14% | 32.7 -16% | 30.1 -7% | 29.4 -4% | 29.1 -3% | 28.2 -0% | 32.2 -14% | 30.5 -8% | 28.4 -1% | 29.4 -4% | 31 -10% |
| Load Average * (dB) | 33.3 | 34.3 -3% | 34.4 -3% | 39.2 -18% | 31.4 6% | 32.6 2% | 33.2 -0% | 47.1 -41% | 32.8 2% | 41.6 -25% | 31.4 6% | 31.3 6% |
| Load Maximum * (dB) | 35.3 | 39.3 -11% | 39.5 -12% | 39.2 -11% | 34.6 2% | 37.8 -7% | 39.9 -13% | 47.1 -33% | 34.7 2% | 41.6 -18% | 49 -39% | 41.8 -18% |
| Witcher 3 ultra * (dB) | 52 | 36.1 | 49 |
* ... Meglio usare valori piccoli
(±) La temperatura massima sul lato superiore è di 41.6 °C / 107 F, rispetto alla media di 34.3 °C / 94 F, che varia da 21.2 a 62.5 °C per questa classe Office.
(-) Il lato inferiore si riscalda fino ad un massimo di 48.4 °C / 119 F, rispetto alla media di 36.8 °C / 98 F
(+) In idle, la temperatura media del lato superiore è di 22.8 °C / 73 F, rispetto alla media deld ispositivo di 29.5 °C / 85 F.
(+) I poggiapolsi e il touchpad sono piu' freddi della temperatura della pelle con un massimo di 27.8 °C / 82 F e sono quindi freddi al tatto.
(±) La temperatura media della zona del palmo della mano di dispositivi simili e'stata di 27.5 °C / 81.5 F (-0.3 °C / -0.5 F).
HP Elitebook 1040 G4-2XU40UT analisi audio
(±) | potenza degli altiparlanti media ma buona (75.4 dB)
Bassi 100 - 315 Hz
(±) | bassi ridotti - in media 12.4% inferiori alla media
(±) | la linearità dei bassi è media (13.8% delta rispetto alla precedente frequenza)
Medi 400 - 2000 Hz
(+) | medi bilanciati - solo only 2.2% rispetto alla media
(+) | medi lineari (6.2% delta rispetto alla precedente frequenza)
Alti 2 - 16 kHz
(+) | Alti bilanciati - appena 3.3% dalla media
(+) | alti lineari (4.6% delta rispetto alla precedente frequenza)
Nel complesso 100 - 16.000 Hz
(+) | suono nel complesso lineare (11.6% differenza dalla media)
Rispetto alla stessa classe
» 3% di tutti i dispositivi testati in questa classe è stato migliore, 2% simile, 95% peggiore
» Il migliore ha avuto un delta di 7%, medio di 21%, peggiore di 53%
Rispetto a tutti i dispositivi testati
» 8% di tutti i dispositivi testati in questa classe è stato migliore, 2% similare, 90% peggiore
» Il migliore ha avuto un delta di 4%, medio di 24%, peggiore di 134%
Lenovo ThinkPad X1 Carbon 2017-20HQS03P00 analisi audio
(±) | potenza degli altiparlanti media ma buona (78.2 dB)
Bassi 100 - 315 Hz
(-) | quasi nessun basso - in media 16.5% inferiori alla media
(±) | la linearità dei bassi è media (8.7% delta rispetto alla precedente frequenza)
Medi 400 - 2000 Hz
(+) | medi bilanciati - solo only 2.9% rispetto alla media
(+) | medi lineari (5% delta rispetto alla precedente frequenza)
Alti 2 - 16 kHz
(+) | Alti bilanciati - appena 3.8% dalla media
(+) | alti lineari (6% delta rispetto alla precedente frequenza)
Nel complesso 100 - 16.000 Hz
(±) | la linearità complessiva del suono è media (16.3% di differenza rispetto alla media
Rispetto alla stessa classe
» 19% di tutti i dispositivi testati in questa classe è stato migliore, 7% simile, 75% peggiore
» Il migliore ha avuto un delta di 7%, medio di 21%, peggiore di 53%
Rispetto a tutti i dispositivi testati
» 27% di tutti i dispositivi testati in questa classe è stato migliore, 6% similare, 68% peggiore
» Il migliore ha avuto un delta di 4%, medio di 24%, peggiore di 134%
Toshiba Tecra X40-D analisi audio
(±) | potenza degli altiparlanti media ma buona (77.3 dB)
Bassi 100 - 315 Hz
(-) | quasi nessun basso - in media 15.2% inferiori alla media
(±) | la linearità dei bassi è media (7.2% delta rispetto alla precedente frequenza)
Medi 400 - 2000 Hz
(+) | medi bilanciati - solo only 3.6% rispetto alla media
(+) | medi lineari (5.7% delta rispetto alla precedente frequenza)
Alti 2 - 16 kHz
(±) | alti elevati - circa 5.6% superiori alla media
(+) | alti lineari (5.2% delta rispetto alla precedente frequenza)
Nel complesso 100 - 16.000 Hz
(±) | la linearità complessiva del suono è media (22% di differenza rispetto alla media
Rispetto alla stessa classe
» 57% di tutti i dispositivi testati in questa classe è stato migliore, 8% simile, 35% peggiore
» Il migliore ha avuto un delta di 7%, medio di 21%, peggiore di 53%
Rispetto a tutti i dispositivi testati
» 63% di tutti i dispositivi testati in questa classe è stato migliore, 6% similare, 30% peggiore
» Il migliore ha avuto un delta di 4%, medio di 24%, peggiore di 134%
| Off / Standby | |
| Idle | |
| Sotto carico |
|
Leggenda:
min: | |
| HP Elitebook 1040 G4-2XU40UT i7-7820HQ, HD Graphics 630, Toshiba XG4 NVMe (THNSN5512GPUK), IPS, 1920x1080, 14" | Lenovo ThinkPad X1 Carbon 2017-20HQS03P00 i7-7500U, HD Graphics 620, Samsung PM961 NVMe MZVLW512HMJP, IPS, 1920x1080, 14" | Lenovo ThinkPad T470p PL i7-7700HQ, GeForce 940MX, Toshiba NVMe THNSF5512GPUK, , 2560x1440, 14" | Lenovo ThinkPad T470s-20HGS00V00 i7-7600U, HD Graphics 620, Samsung SSD PM961 1TB M.2 PCIe 3.0 x4 NVMe (MZVLW1T0), IPS, 2560x1440, 14" | Lenovo ThinkPad T470-20HD002HGE i5-7200U, HD Graphics 620, Samsung PM961 NVMe MZVLW512HMJP, IPS, 1920x1080, 14" | HP EliteBook Folio 1040 G3 6300U, HD Graphics 520, Samsung SM951 MZVPV256HDGL m.2 PCI-e, IPS, 2560x1440, 14" | Toshiba Tecra X40-D i7-7600U, HD Graphics 620, Samsung PM961 MZVLW256HEHP, IPS, 1920x1080, 14" | Dell XPS 15 9560 (i7-7700HQ, UHD) i7-7700HQ, GeForce GTX 1050 Mobile, Lite-On CX2-8B512-Q11, IGZO IPS, 3840x2160, 15.6" | Lenovo Yoga 720-13IKB i5-8550U, UHD Graphics 620, Toshiba XG4 NVMe (THNSN5512GPUK), IPS, 1920x1080, 13.3" | HP Spectre x360 15t-bl100 i5-8550U, GeForce MX150, Samsung PM961 NVMe MZVLW512HMJP, IPS, 3840x2160, 15.6" | Microsoft Surface Book 2 i7-8650U, GeForce GTX 1050 Mobile, Samsung PM961 MZVLW256HEHP, IPS, 3000x2000, 13.5" | Apple MacBook Pro 15 2017 (2.9 GHz, 560) i7-7820HQ, Radeon Pro 560, , , 2880x1800, 15.4" | |
|---|---|---|---|---|---|---|---|---|---|---|---|---|
| Power Consumption | 15% | -31% | 4% | 32% | -2% | 25% | -114% | 14% | -69% | -44% | -51% | |
| Idle Minimum * (Watt) | 5.1 | 3.84 25% | 3.9 24% | 4.64 9% | 3.21 37% | 6.3 -24% | 5.2 -2% | 11.9 -133% | 3.8 25% | 11.6 -127% | 4.7 8% | 3.7 27% |
| Idle Average * (Watt) | 7 | 6.3 10% | 9.4 -34% | 8.93 -28% | 6.15 12% | 9.4 -34% | 6.9 1% | 17.1 -144% | 8.4 -20% | 13.8 -97% | 10.6 -51% | 16.2 -131% |
| Idle Maximum * (Watt) | 11.7 | 8.6 26% | 12.2 -4% | 9.12 22% | 6.82 42% | 10.1 14% | 7 40% | 17.3 -48% | 9.7 17% | 14.2 -21% | 12.3 -5% | 18 -54% |
| Load Average * (Watt) | 41.2 | 41.9 -2% | 73.3 -78% | 42.2 -2% | 28.5 31% | 33.3 19% | 24.6 40% | 94.7 -130% | 36 13% | 67.9 -65% | 81 -97% | 58.4 -42% |
| Load Maximum * (Watt) | 56.9 | 48.7 14% | 93.4 -64% | 47.3 17% | 34.5 39% | 49.5 13% | 30.1 47% | 122 -114% | 36 37% | 76.9 -35% | 100.3 -76% | 89.6 -57% |
| Witcher 3 ultra * (Watt) | 104.8 | 59 | 97 |
* ... Meglio usare valori piccoli
| HP Elitebook 1040 G4-2XU40UT i7-7820HQ, HD Graphics 630, 67 Wh | Lenovo ThinkPad X1 Carbon 2017-20HQS03P00 i7-7500U, HD Graphics 620, 57 Wh | Lenovo ThinkPad T470p PL i7-7700HQ, GeForce 940MX, 48 Wh | Lenovo ThinkPad T470s-20HGS00V00 i7-7600U, HD Graphics 620, 51 Wh | Lenovo ThinkPad T470-20HD002HGE i5-7200U, HD Graphics 620, 48 Wh | HP EliteBook Folio 1040 G3 6300U, HD Graphics 520, 45.6 Wh | Toshiba Tecra X40-D i7-7600U, HD Graphics 620, 48 Wh | Dell XPS 15 9560 (i7-7700HQ, UHD) i7-7700HQ, GeForce GTX 1050 Mobile, 97 Wh | Lenovo Yoga 720-13IKB i5-8550U, UHD Graphics 620, 48 Wh | HP Spectre x360 15t-bl100 i5-8550U, GeForce MX150, 79.2 Wh | Microsoft Surface Book 2 i7-8650U, GeForce GTX 1050 Mobile, 75 Wh | Apple MacBook Pro 15 2017 (2.9 GHz, 560) i7-7820HQ, Radeon Pro 560, Wh | |
|---|---|---|---|---|---|---|---|---|---|---|---|---|
| Autonomia della batteria | -6% | -45% | -26% | -11% | -25% | -17% | -22% | -30% | -3% | 36% | -15% | |
| Reader / Idle (h) | 22.5 | 20.9 -7% | 12.3 -45% | 13.1 -42% | 8.8 -61% | 14.6 -35% | 13.9 -38% | 15.6 -31% | 24.5 9% | |||
| WiFi v1.3 (h) | 11.1 | 8.3 -25% | 7 -37% | 7.3 -34% | 5.2 -53% | 6 -46% | 7.2 -35% | 7.8 -30% | 8.5 -23% | 11.1 0% | 11.3 2% | |
| Load (h) | 1.6 | 1.8 13% | 1.6 0% | 1.8 13% | 2.2 38% | 2.1 31% | 1.7 6% | 2.3 44% | 3.2 100% | 1.1 -31% | ||
| WiFi (h) | 5.1 | |||||||||||
| Witcher 3 ultra (h) | 3.8 | 1.3 |
Pro
Contro

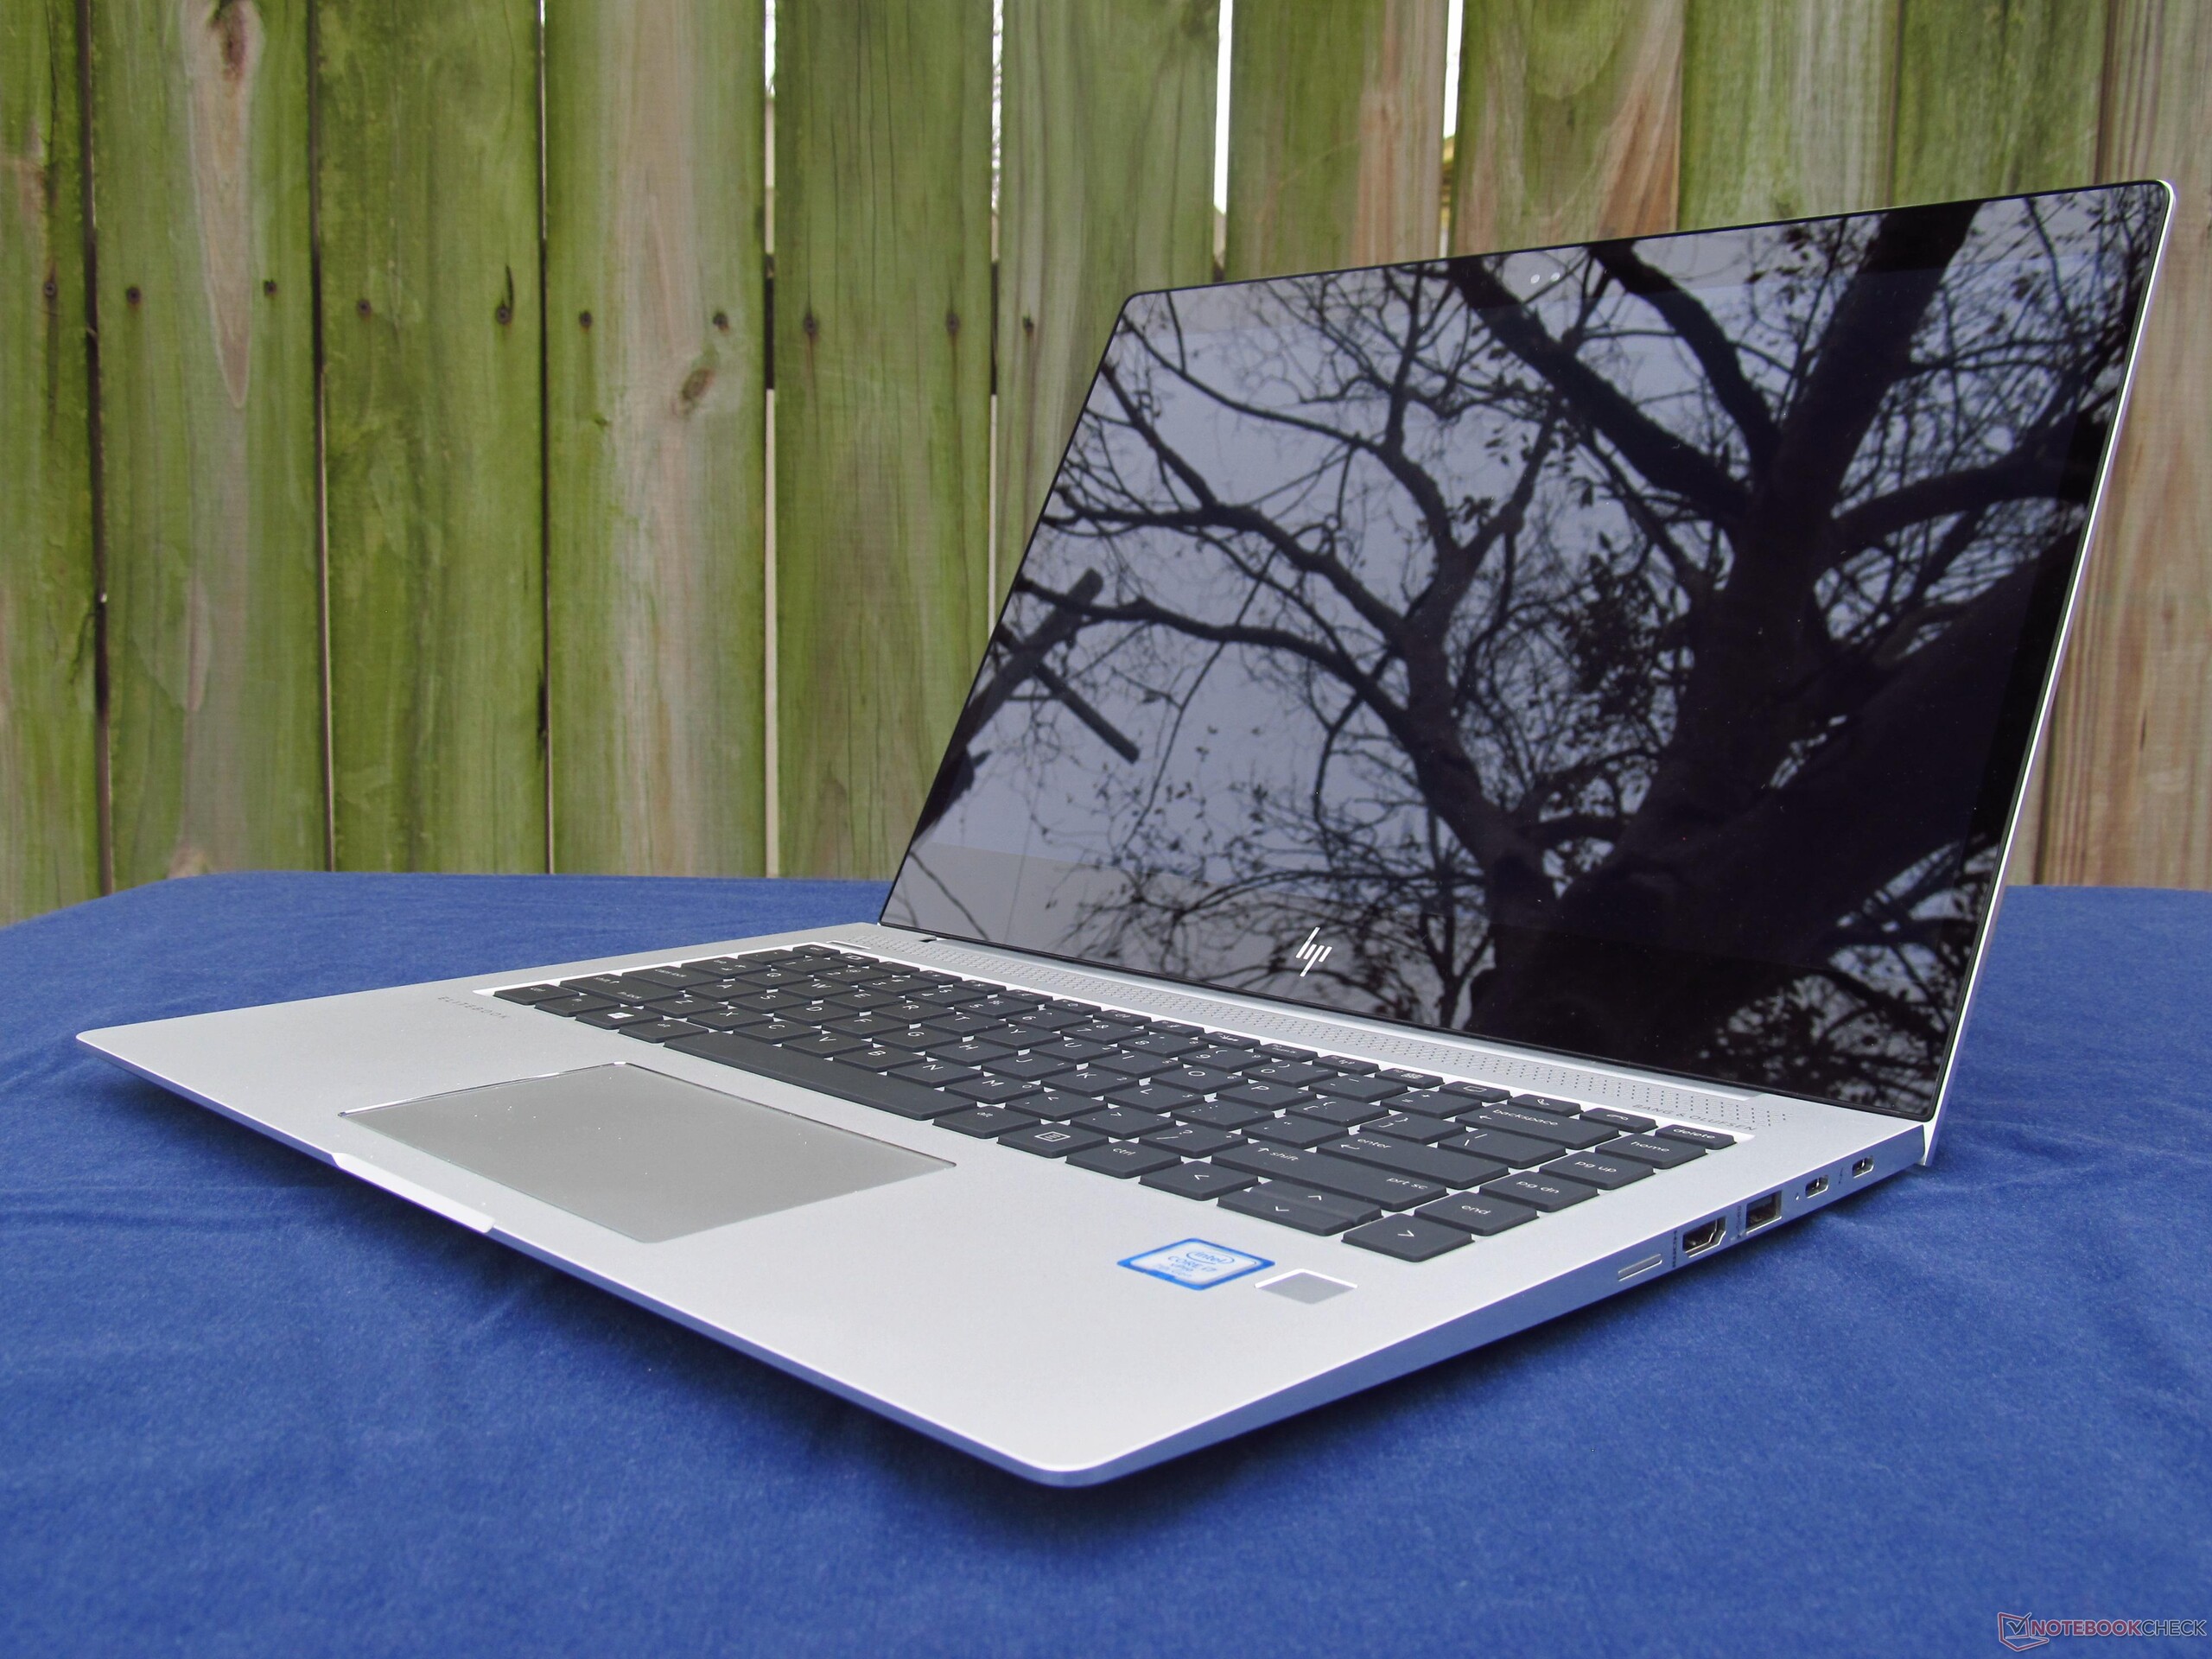
L'HP EliteBook 1040 G4 mette componenti potenti in uno chassis molto bello. L'opzione per una CPU quad-core da 45 W può essere interessante per i professionisti che richiedono più potenza rispetto a quanto offrono i chips da 15 W dual-core tipicamente usati nei portatili business. Le casse sono fantastiche e perfettamente settate per le teleconferenze e la batteria riesce a durare un giorno intero, inoltre la ricarica è molto veloce. HP riesce a realizzare un perfetto "guerriero da strada".
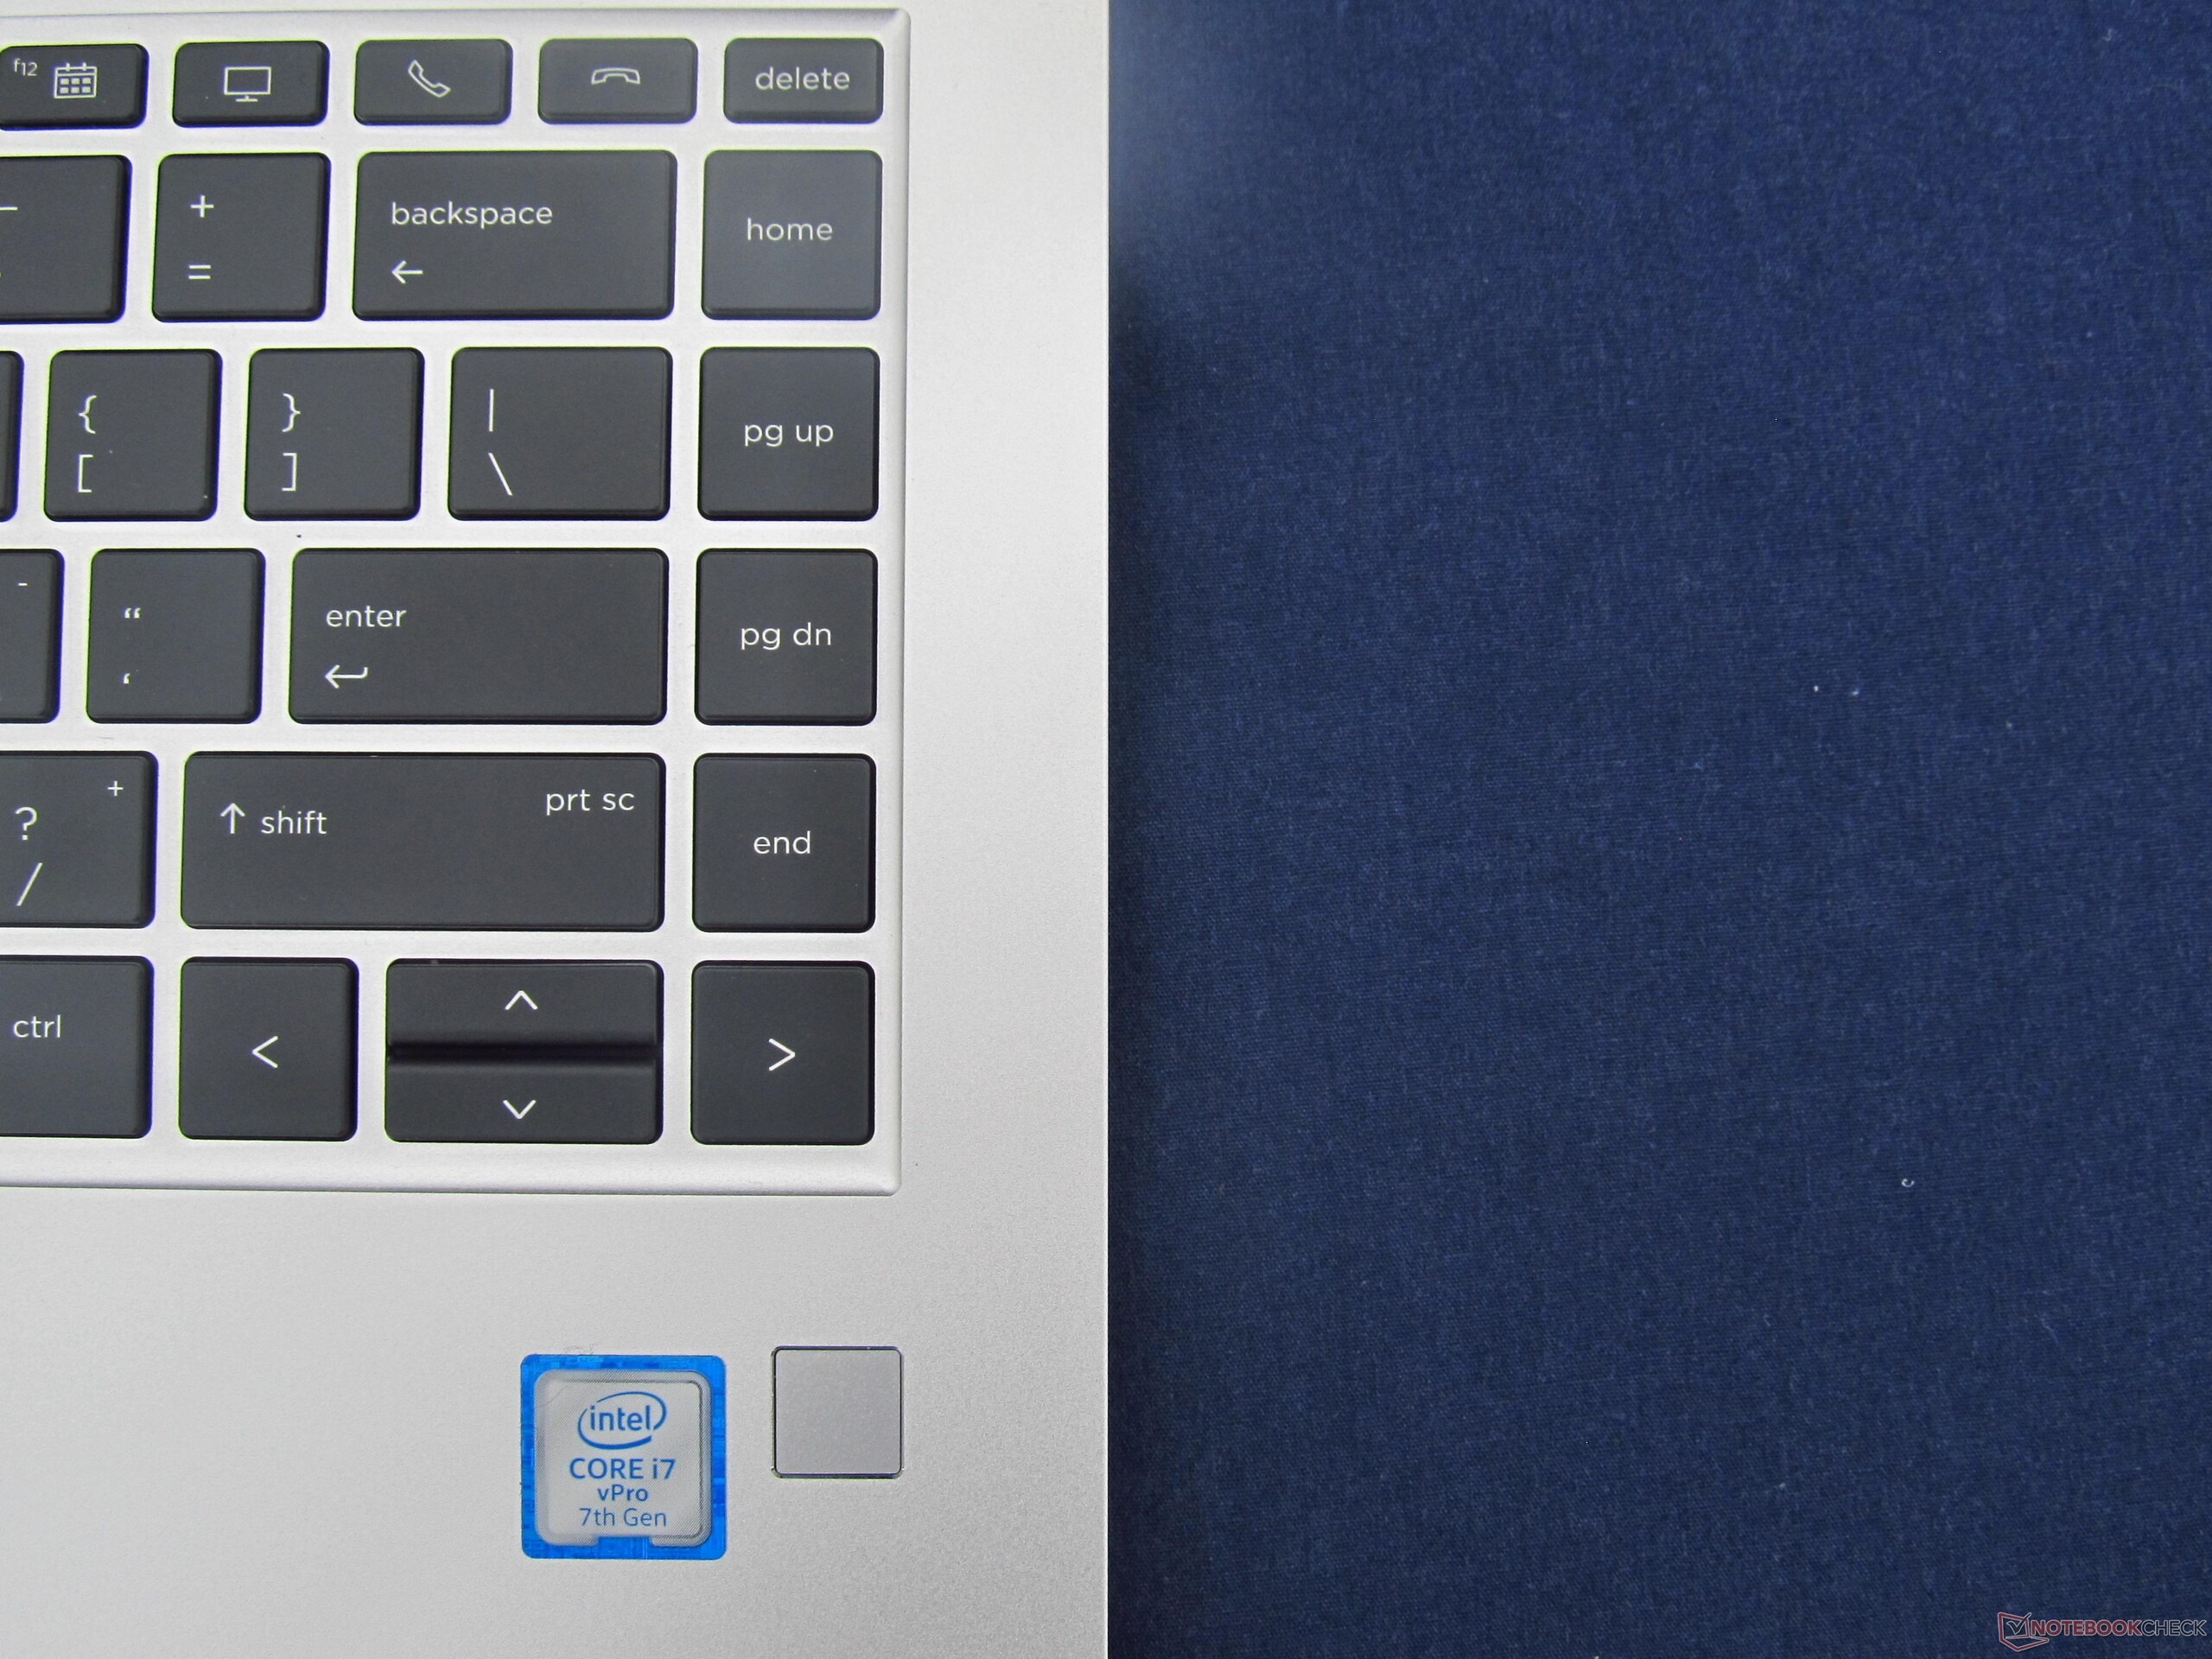
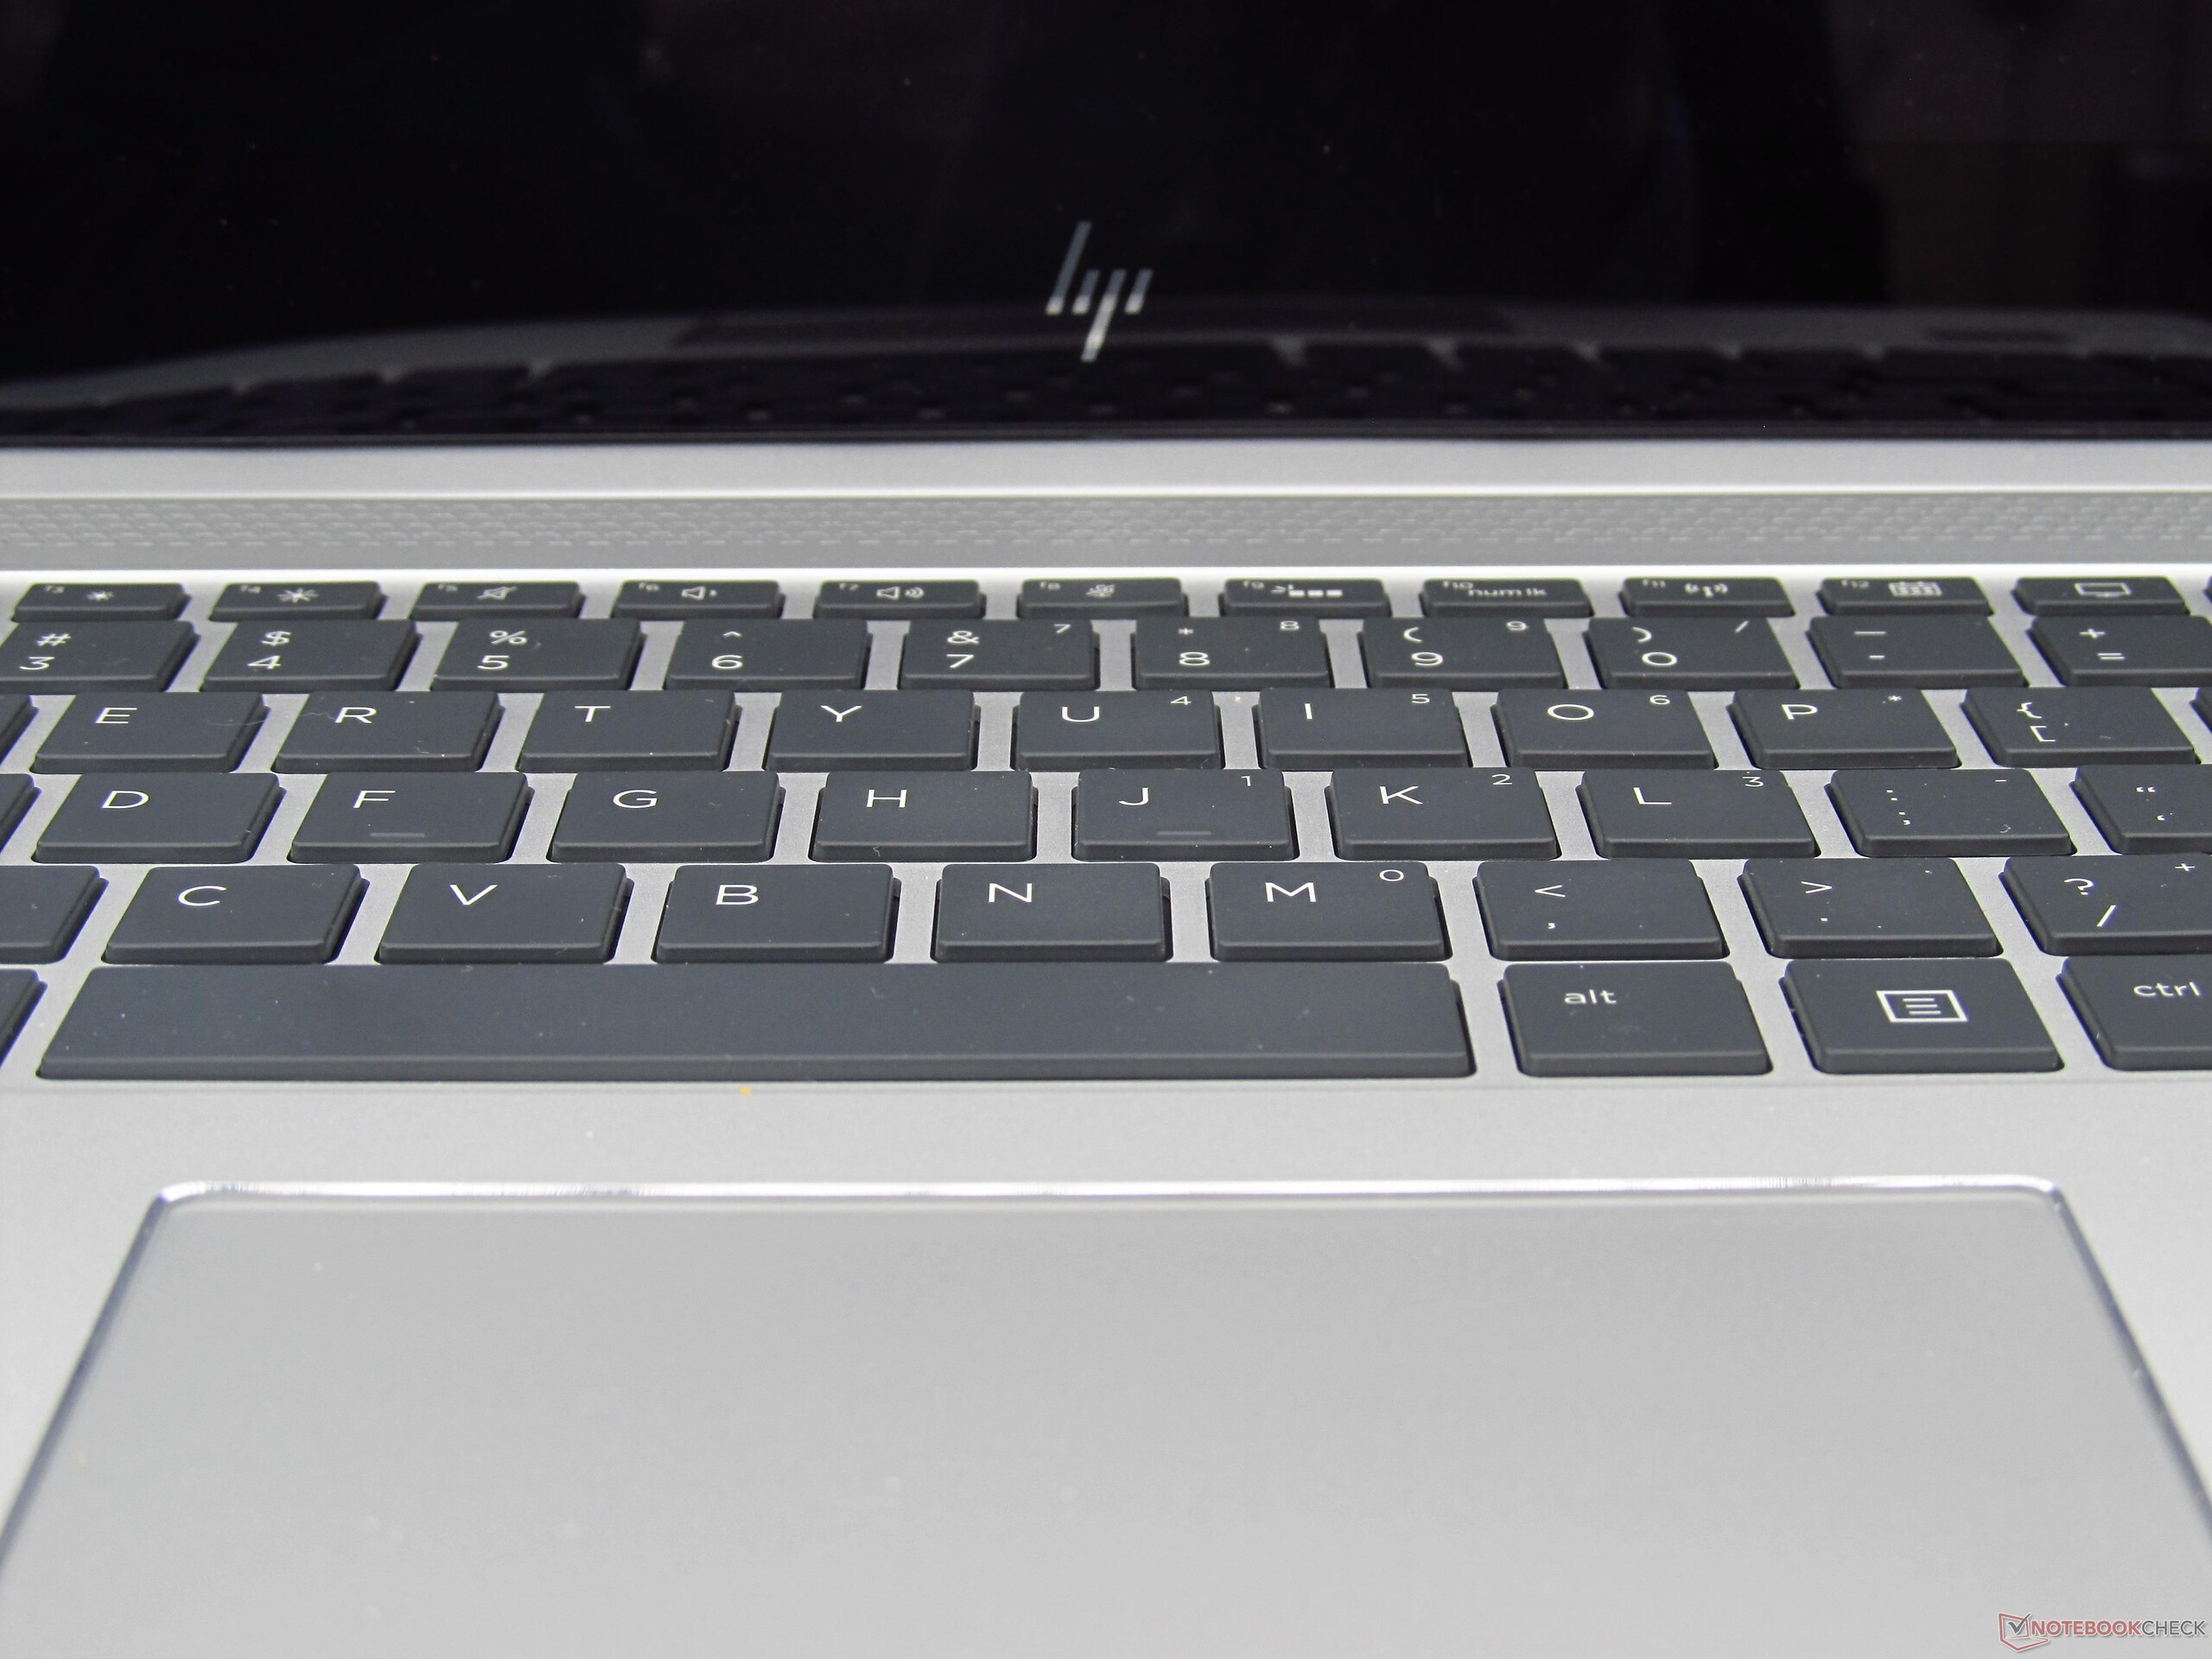
Lascia perplessi il fatto che un dispositivo votato alle chiamate Skype e videoconferenze abbia una webcam così scarsa. Inoltre la retroilluminazione del display non è omogenea con luminosità al massimo; gli angoli inferiori sono più scuri rispetto a quelli superiori, il che può dare fastidio agli occhi. La tastiera è appena nella media con una corsa breve ed è inferiore rispetto alla concorrenza. Infine, l'assenza di una GPU dedicata, anche una low-power, è una occasione persa. Il Core i7-7820HQ sembra sprecato senza un adeguato supporto.
L'unico nel è la Kaby Lake-R. L'ottava generazione di chips prende quattro cores dalla linea di CPU da 15 W, offrendo potenza simile in un design molto più efficiente dal punto di vista energetico. L'architettura è ancora troppo recente per fare un confronto definitivo, ma la Kaby Lake-R sarà in grado di fornire prestazioni analoghe con un surriscaldamento minore e consumi più bassi.
Quindi, come si comporta l'Elitebook Folio 1040 G4 rispetto ad altri portatili business da 14" come l'X1 Carbon ed i Latitude? Non ci sono dubbio sul fatto che HP si fa notare in questo mercato. Il quad-core i7-7820HQ è nettamente avanti alla concorrenza. Tuttavia, le cose cambieranno quando Dell e Lenovo rilasceranno versioni aggiornate dei loro dispositivi con chips di ottava generazione quad-core Intel. Il 1040 G4 sicuramente sarà ancora più potente, ma questa potenza andrà a discapito dell'autonomia.
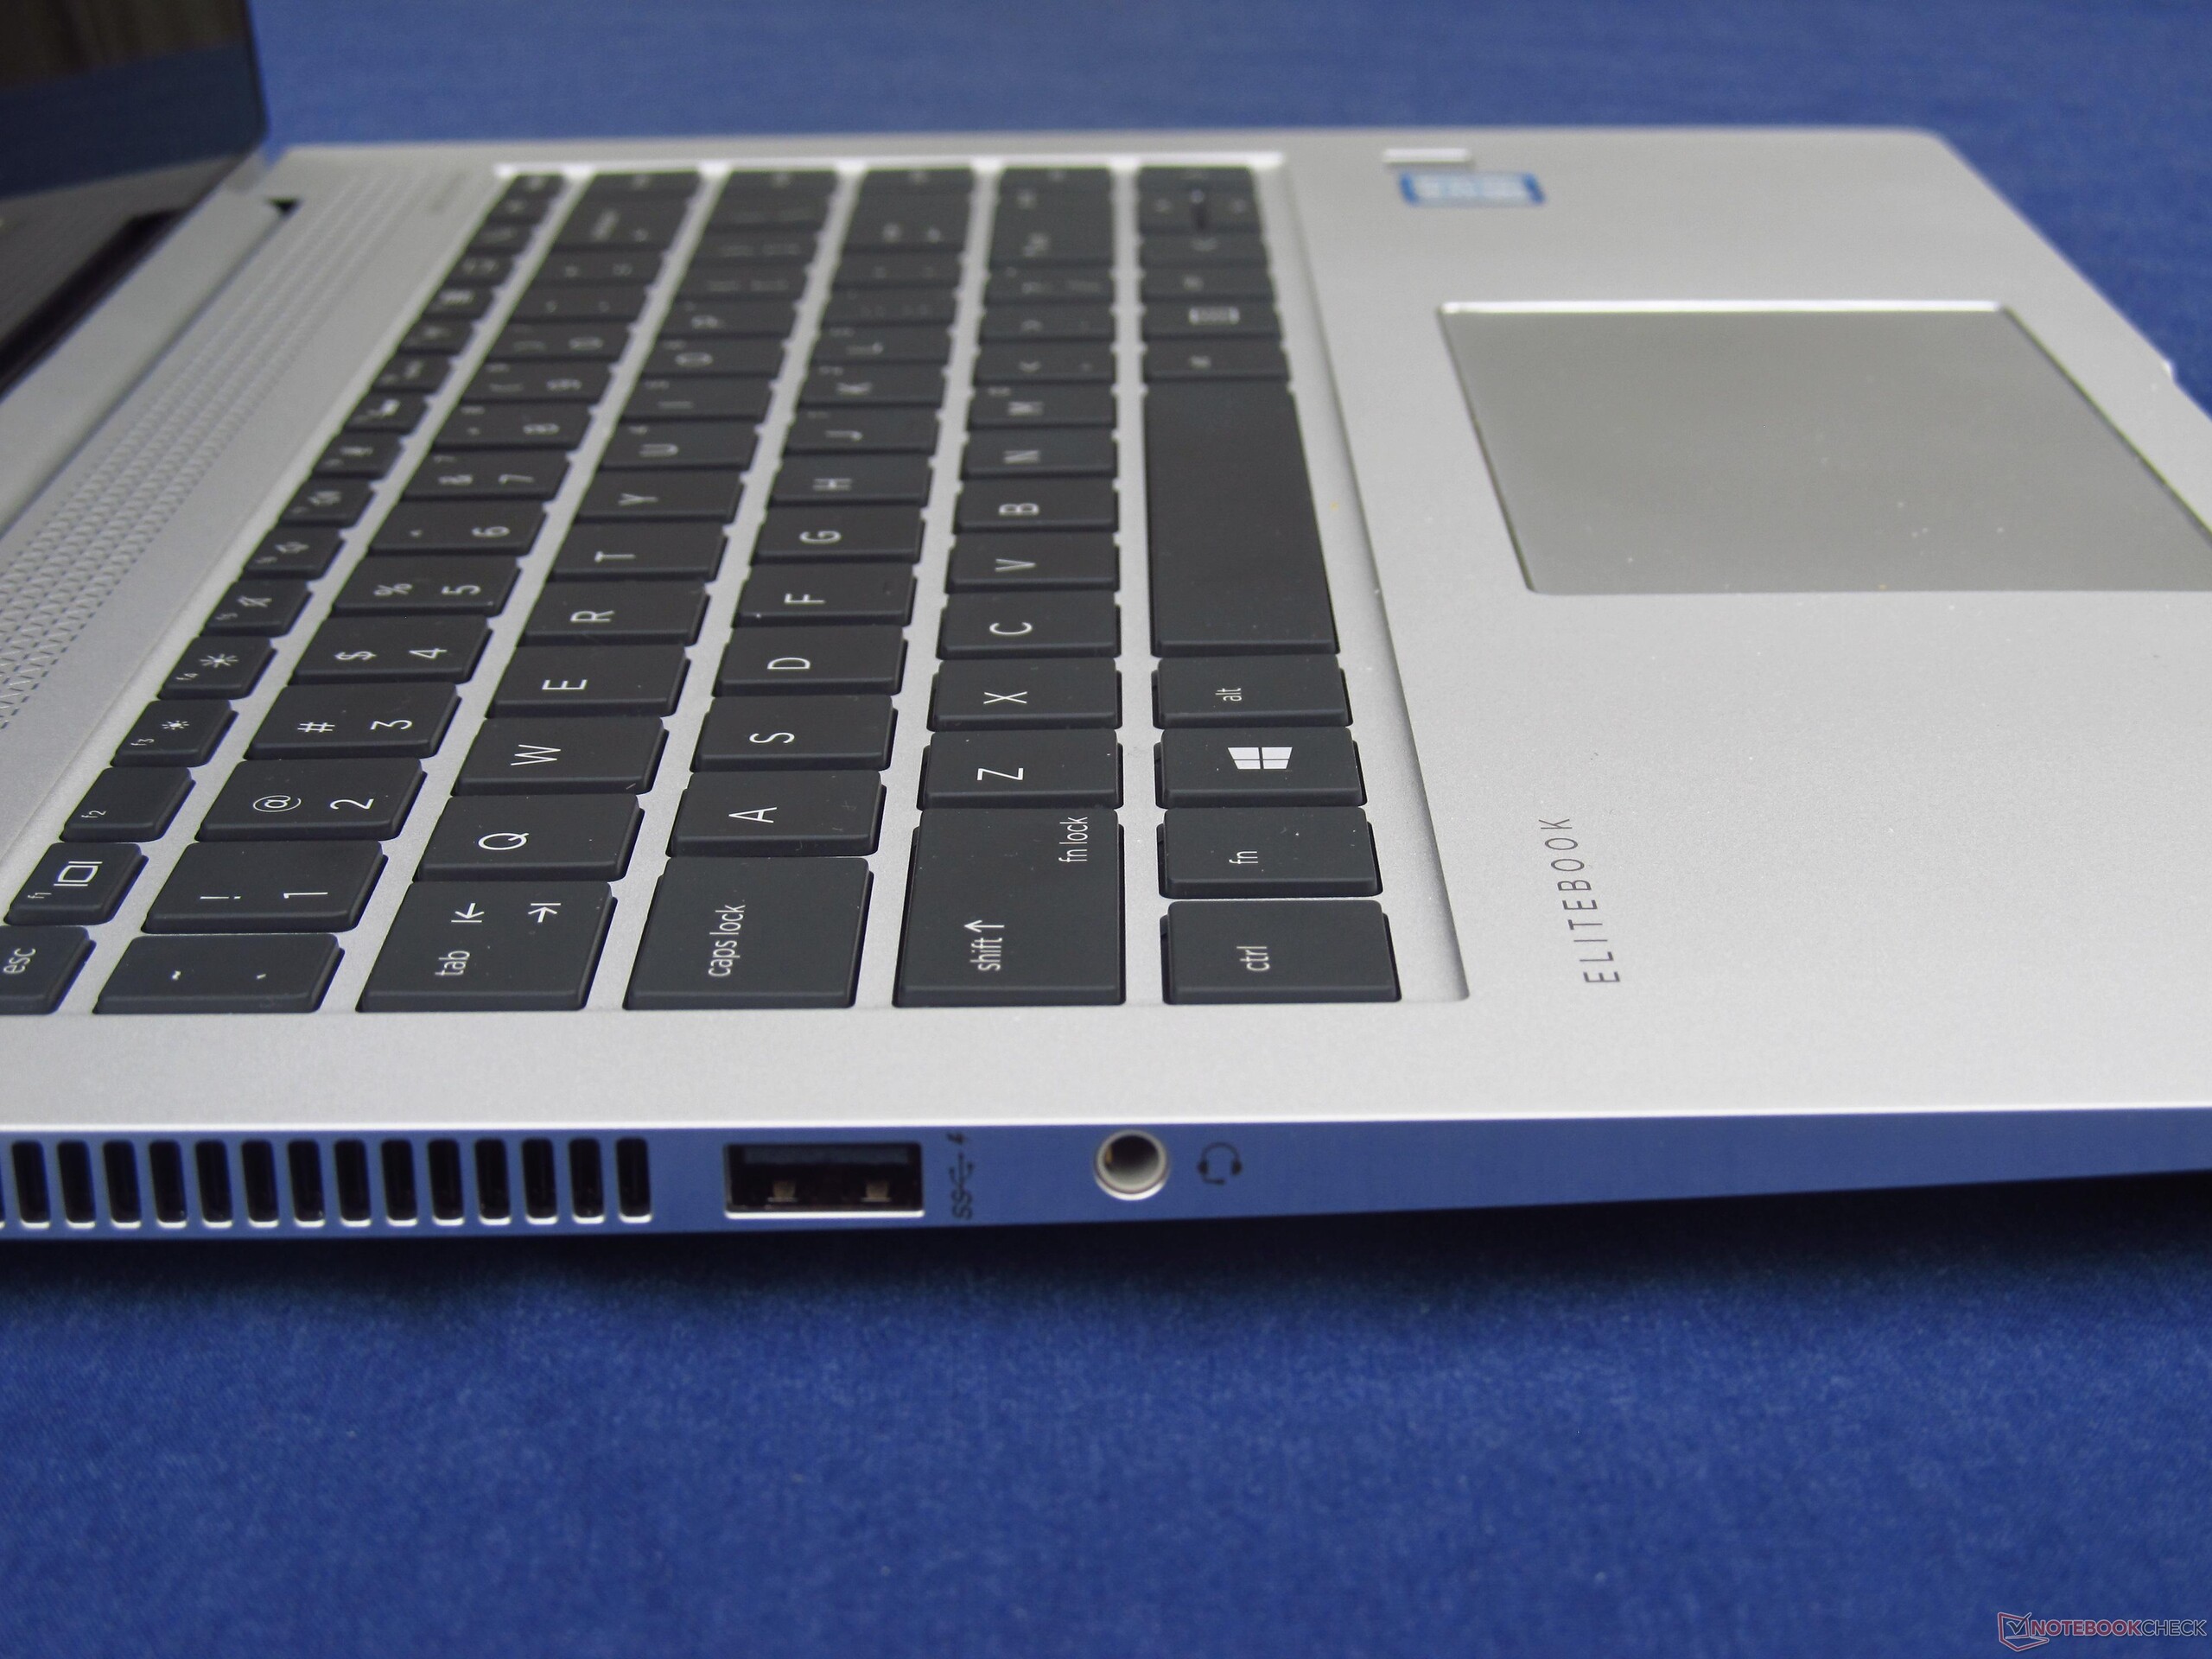
In aggiunta, il concorrenti Lenovo e Dell offrono migliori possibilità di manutenzione e tastiere migliori. Queste sono due aree in cui il 1040 G4 accetta compromessi. I potenziali clienti dovranno considerare di quanta potenza hanno davvero bisogno e determinare se valga la pena accettare i citati punti deboli. Detto questo, il 1040 G4 non è per nulla male; resta appena dietro la concorrenza.
Se viaggiate molto o partecipate spesso a videoconferenze ed avete bisogno di molta potenza, l'HP Elitebook 1040 G4 è una buona scelta. Dovrete solo investire qualcosa per comprare una webcam dedicata.
Nota: si tratta di una recensione breve, con alcune sezioni non tradotte, per la versione integrale in inglese guardate qui.
HP Elitebook 1040 G4-2XU40UT
- 12/26/2017 v6 (old)
Sam Medley
Price comparison
