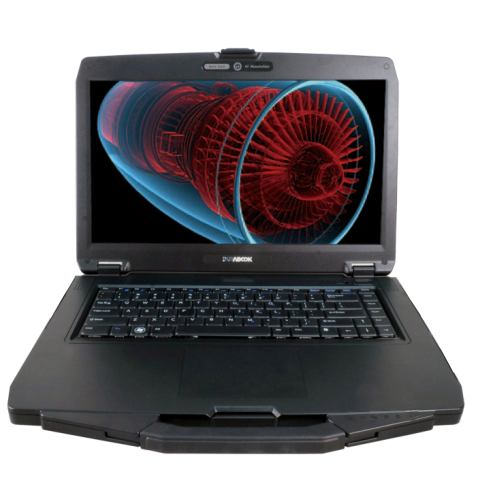
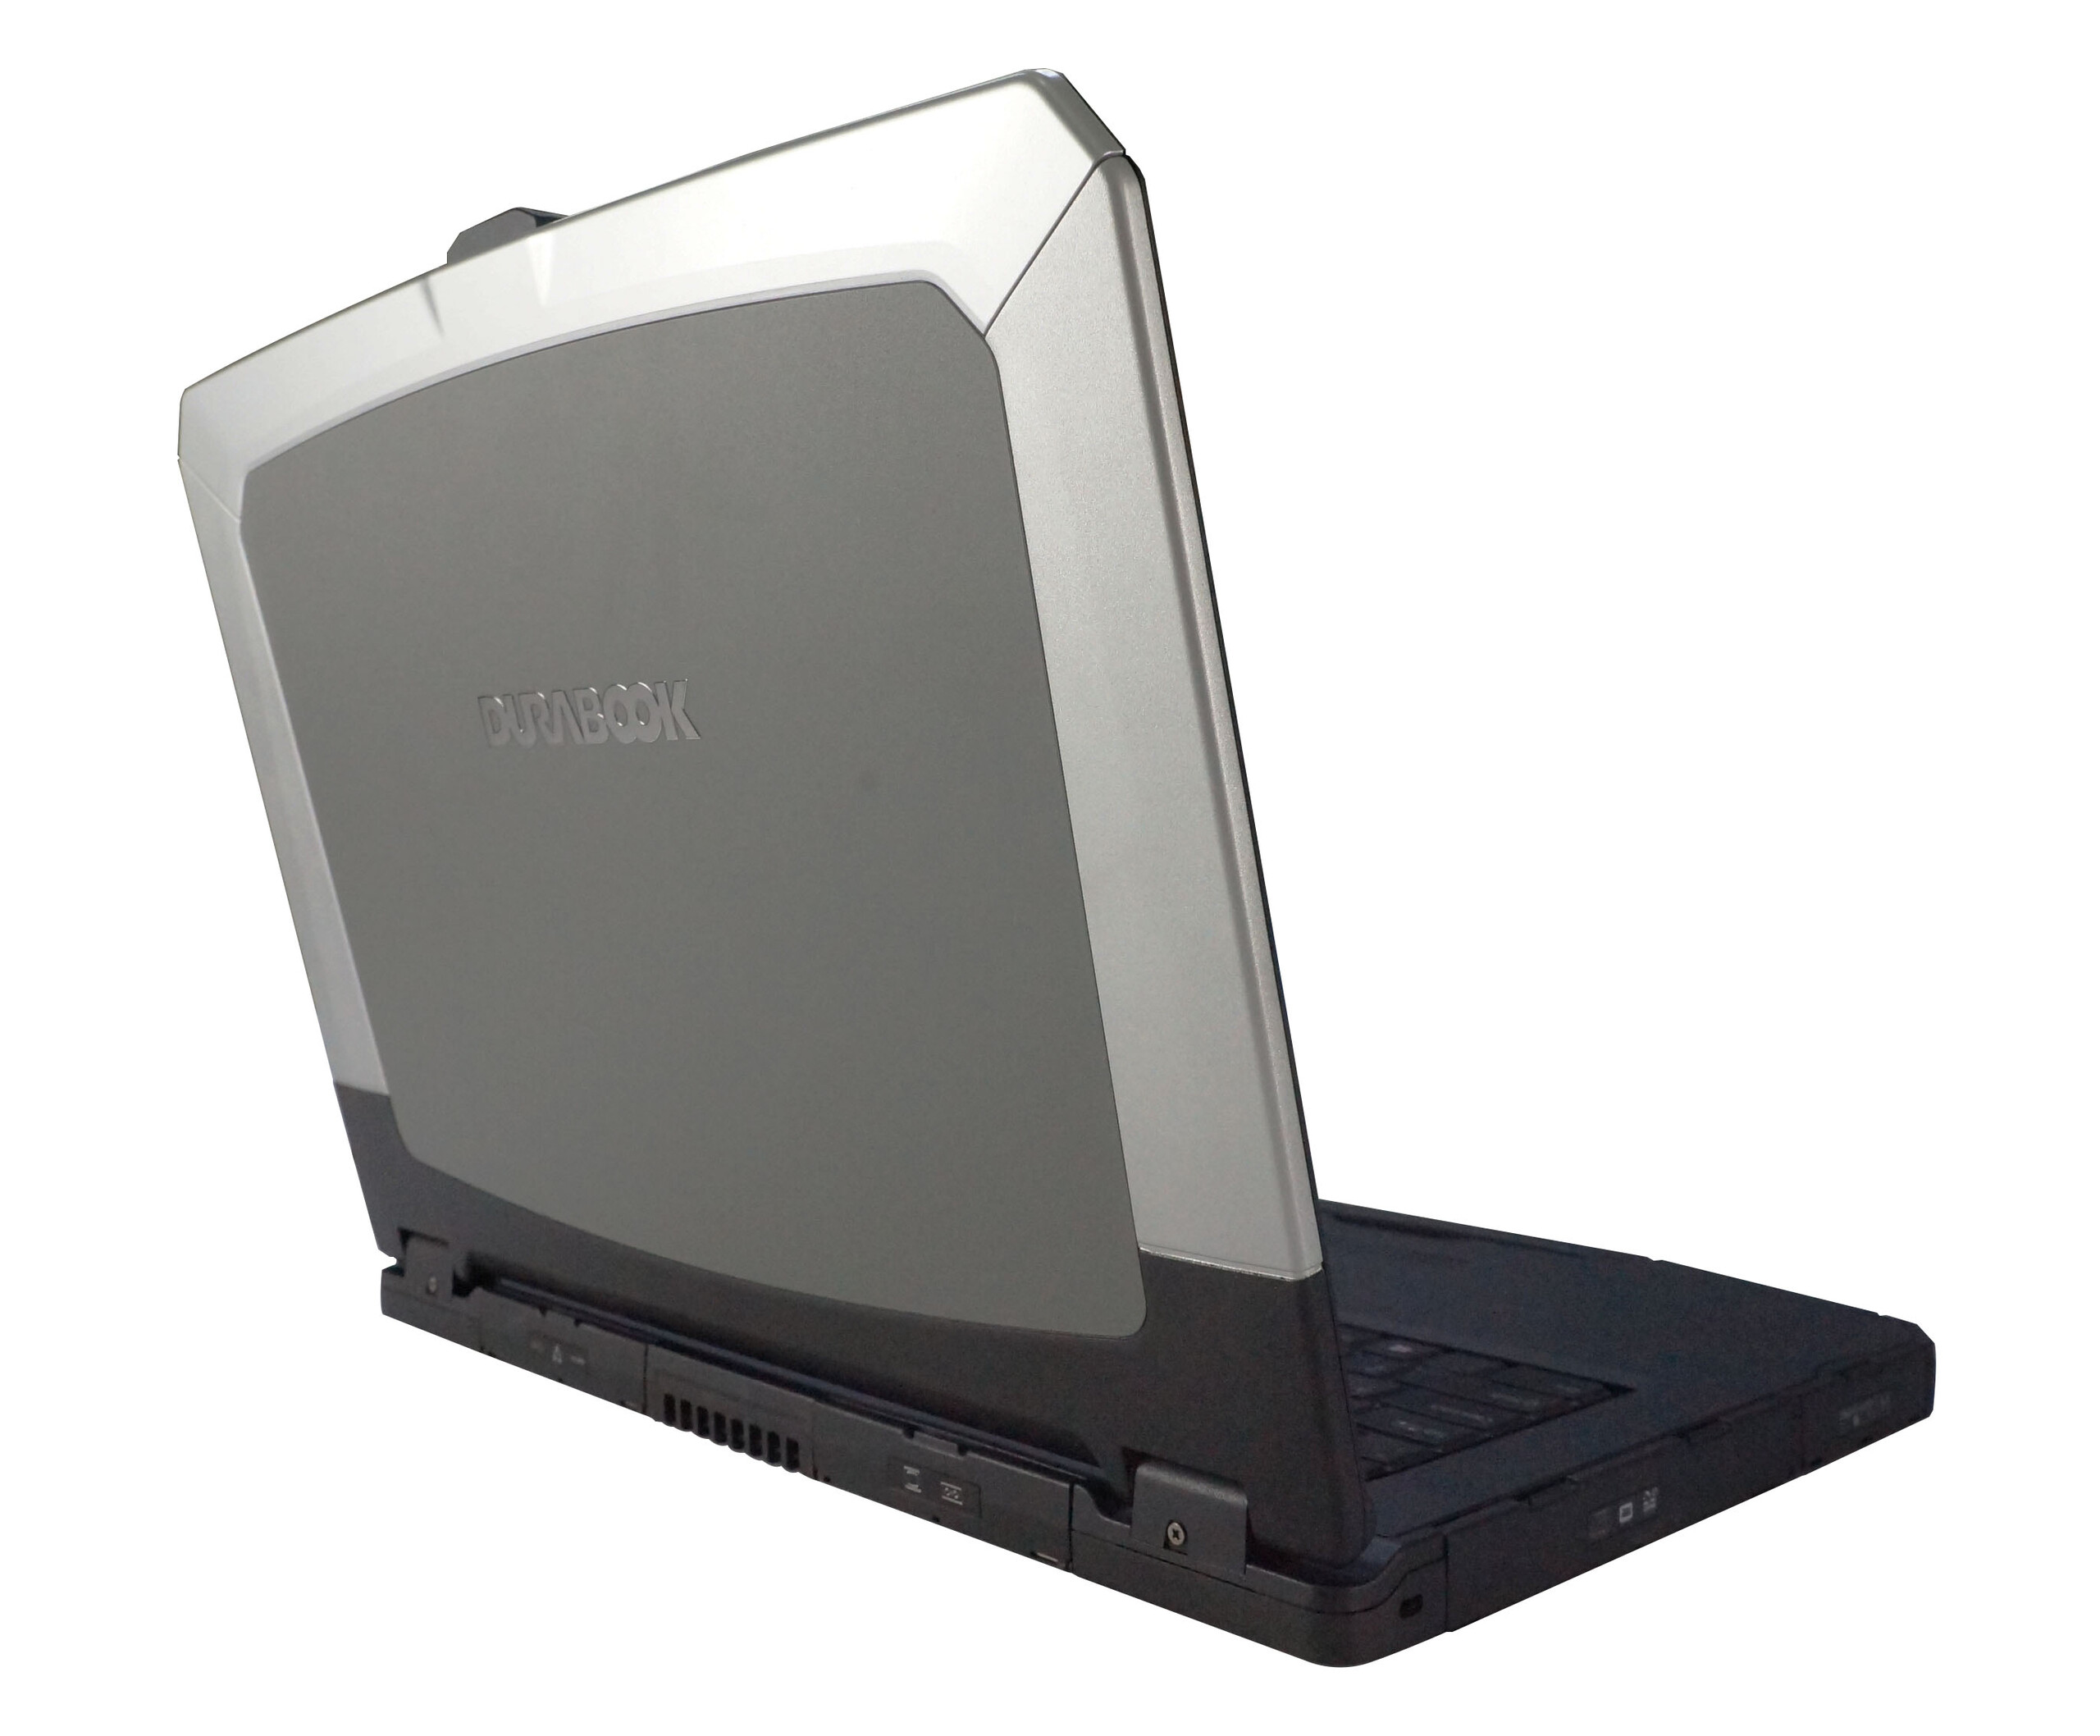
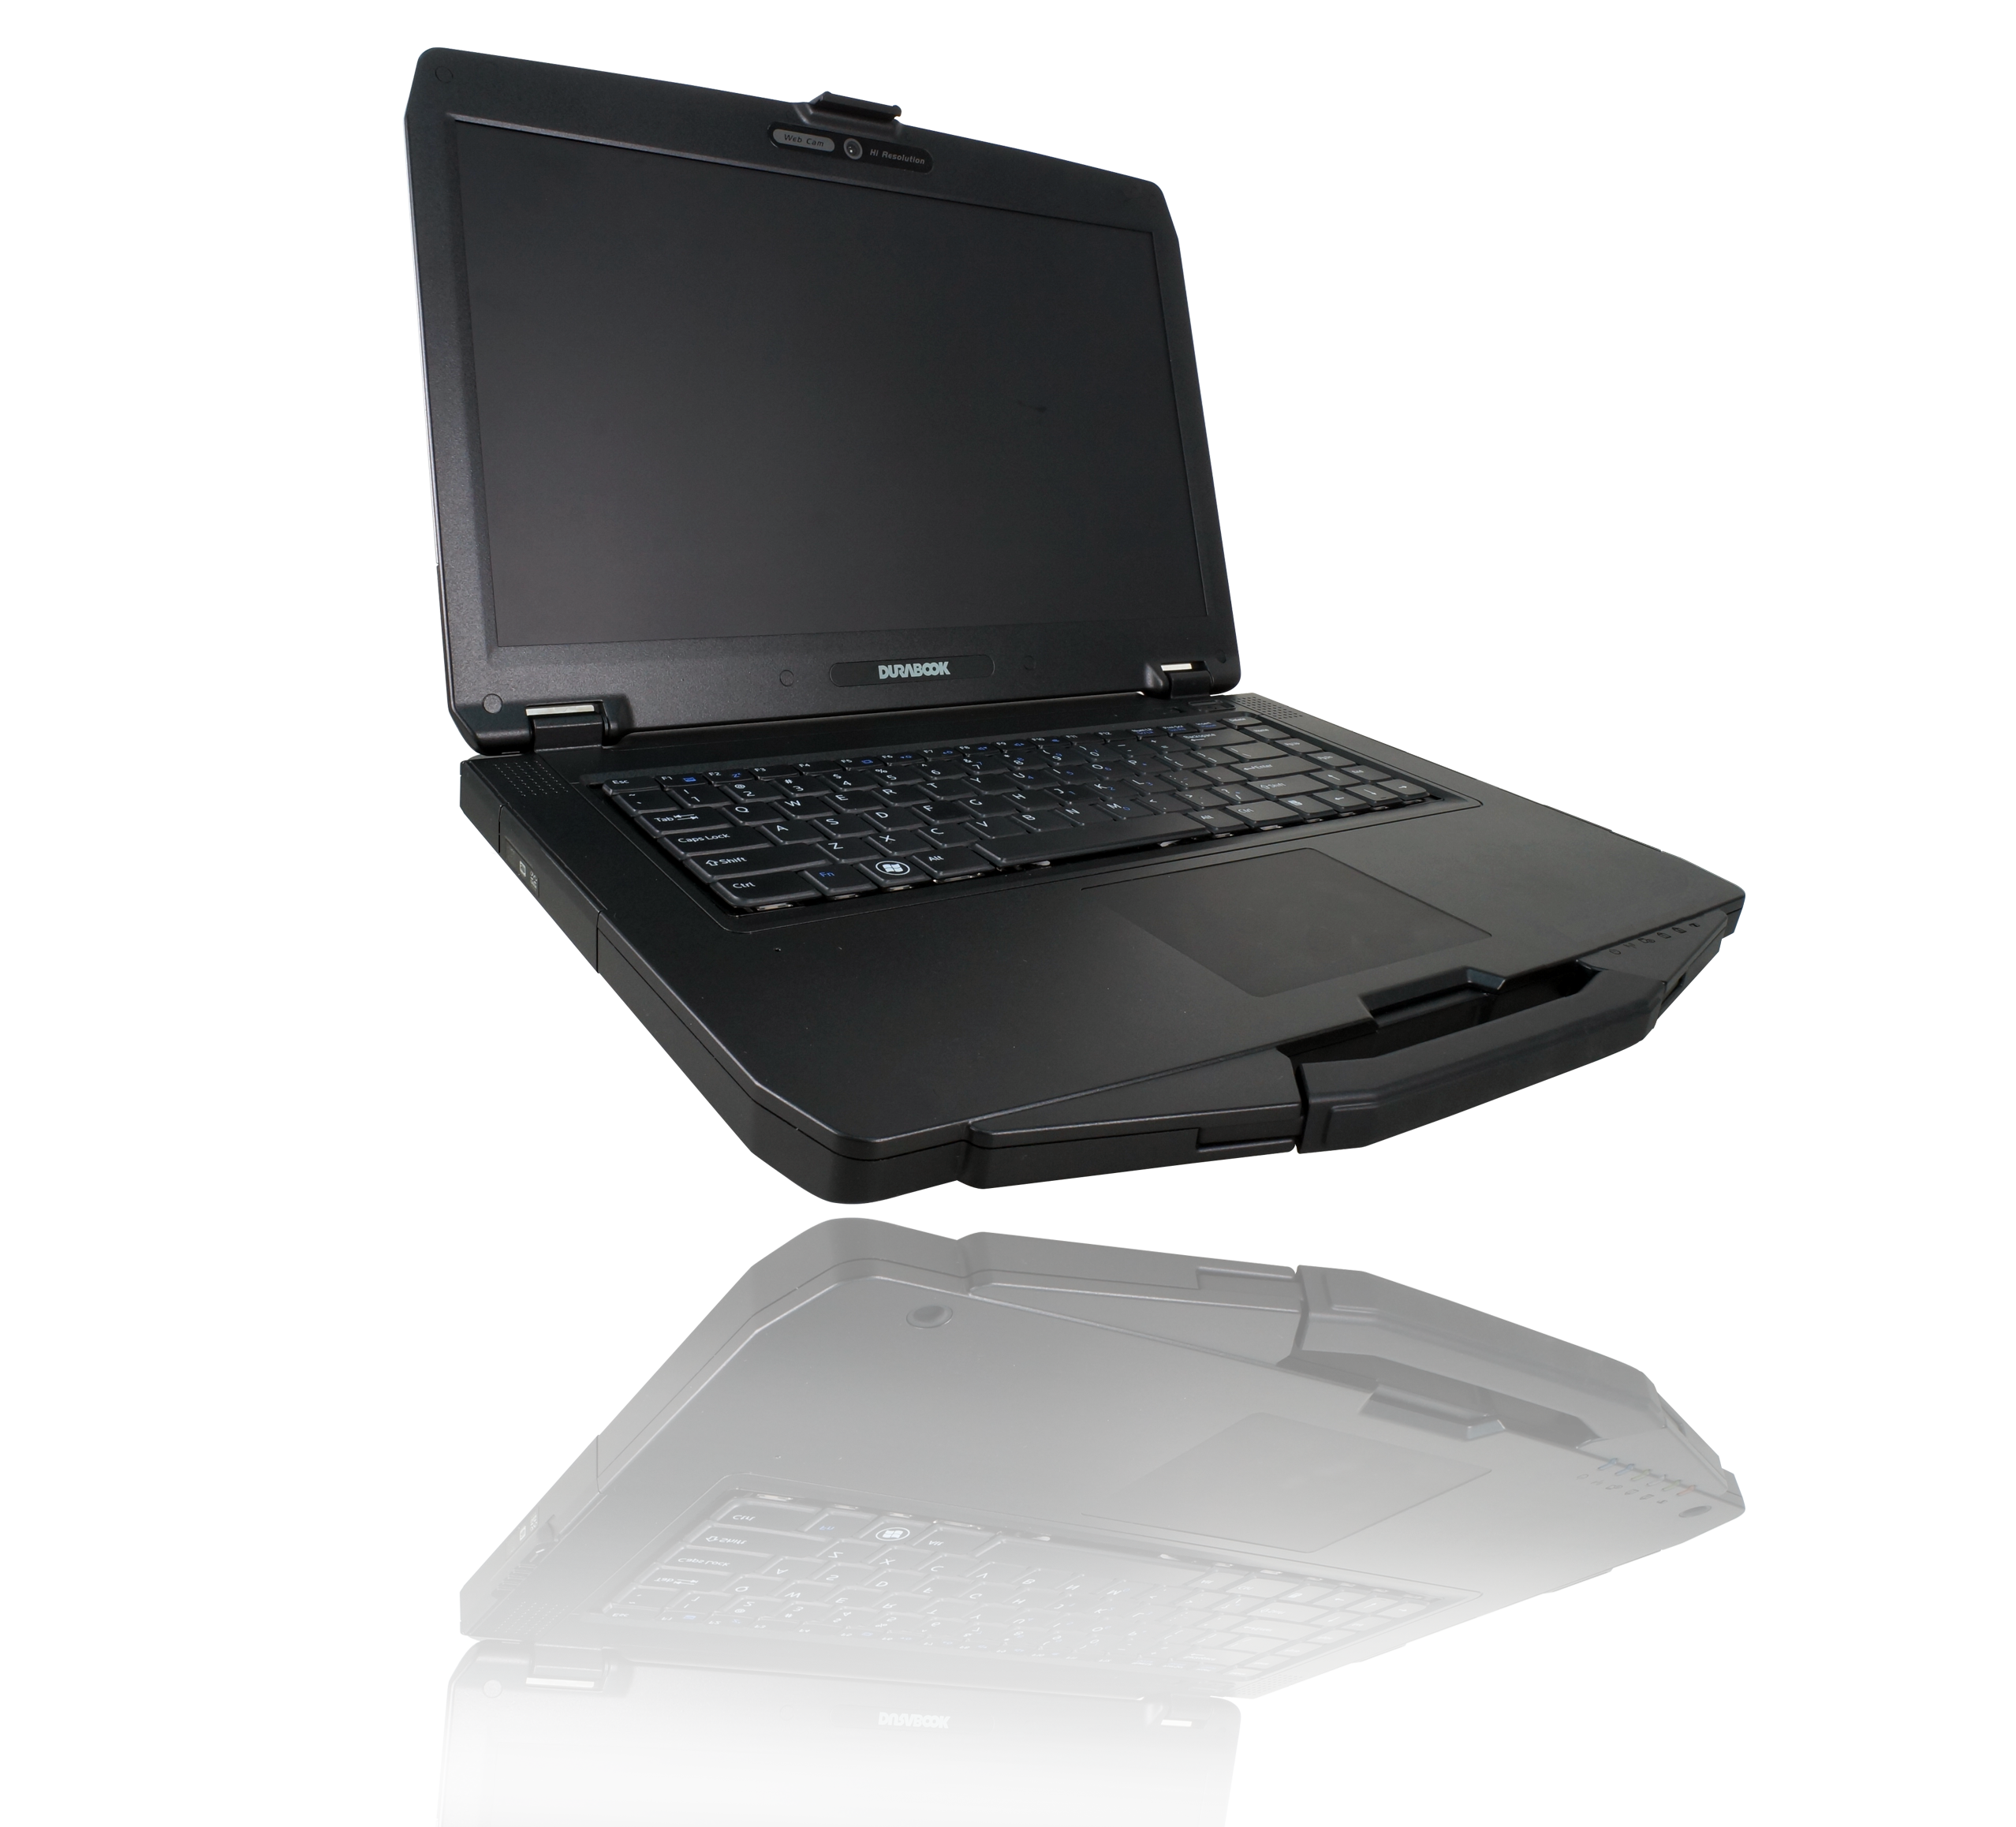
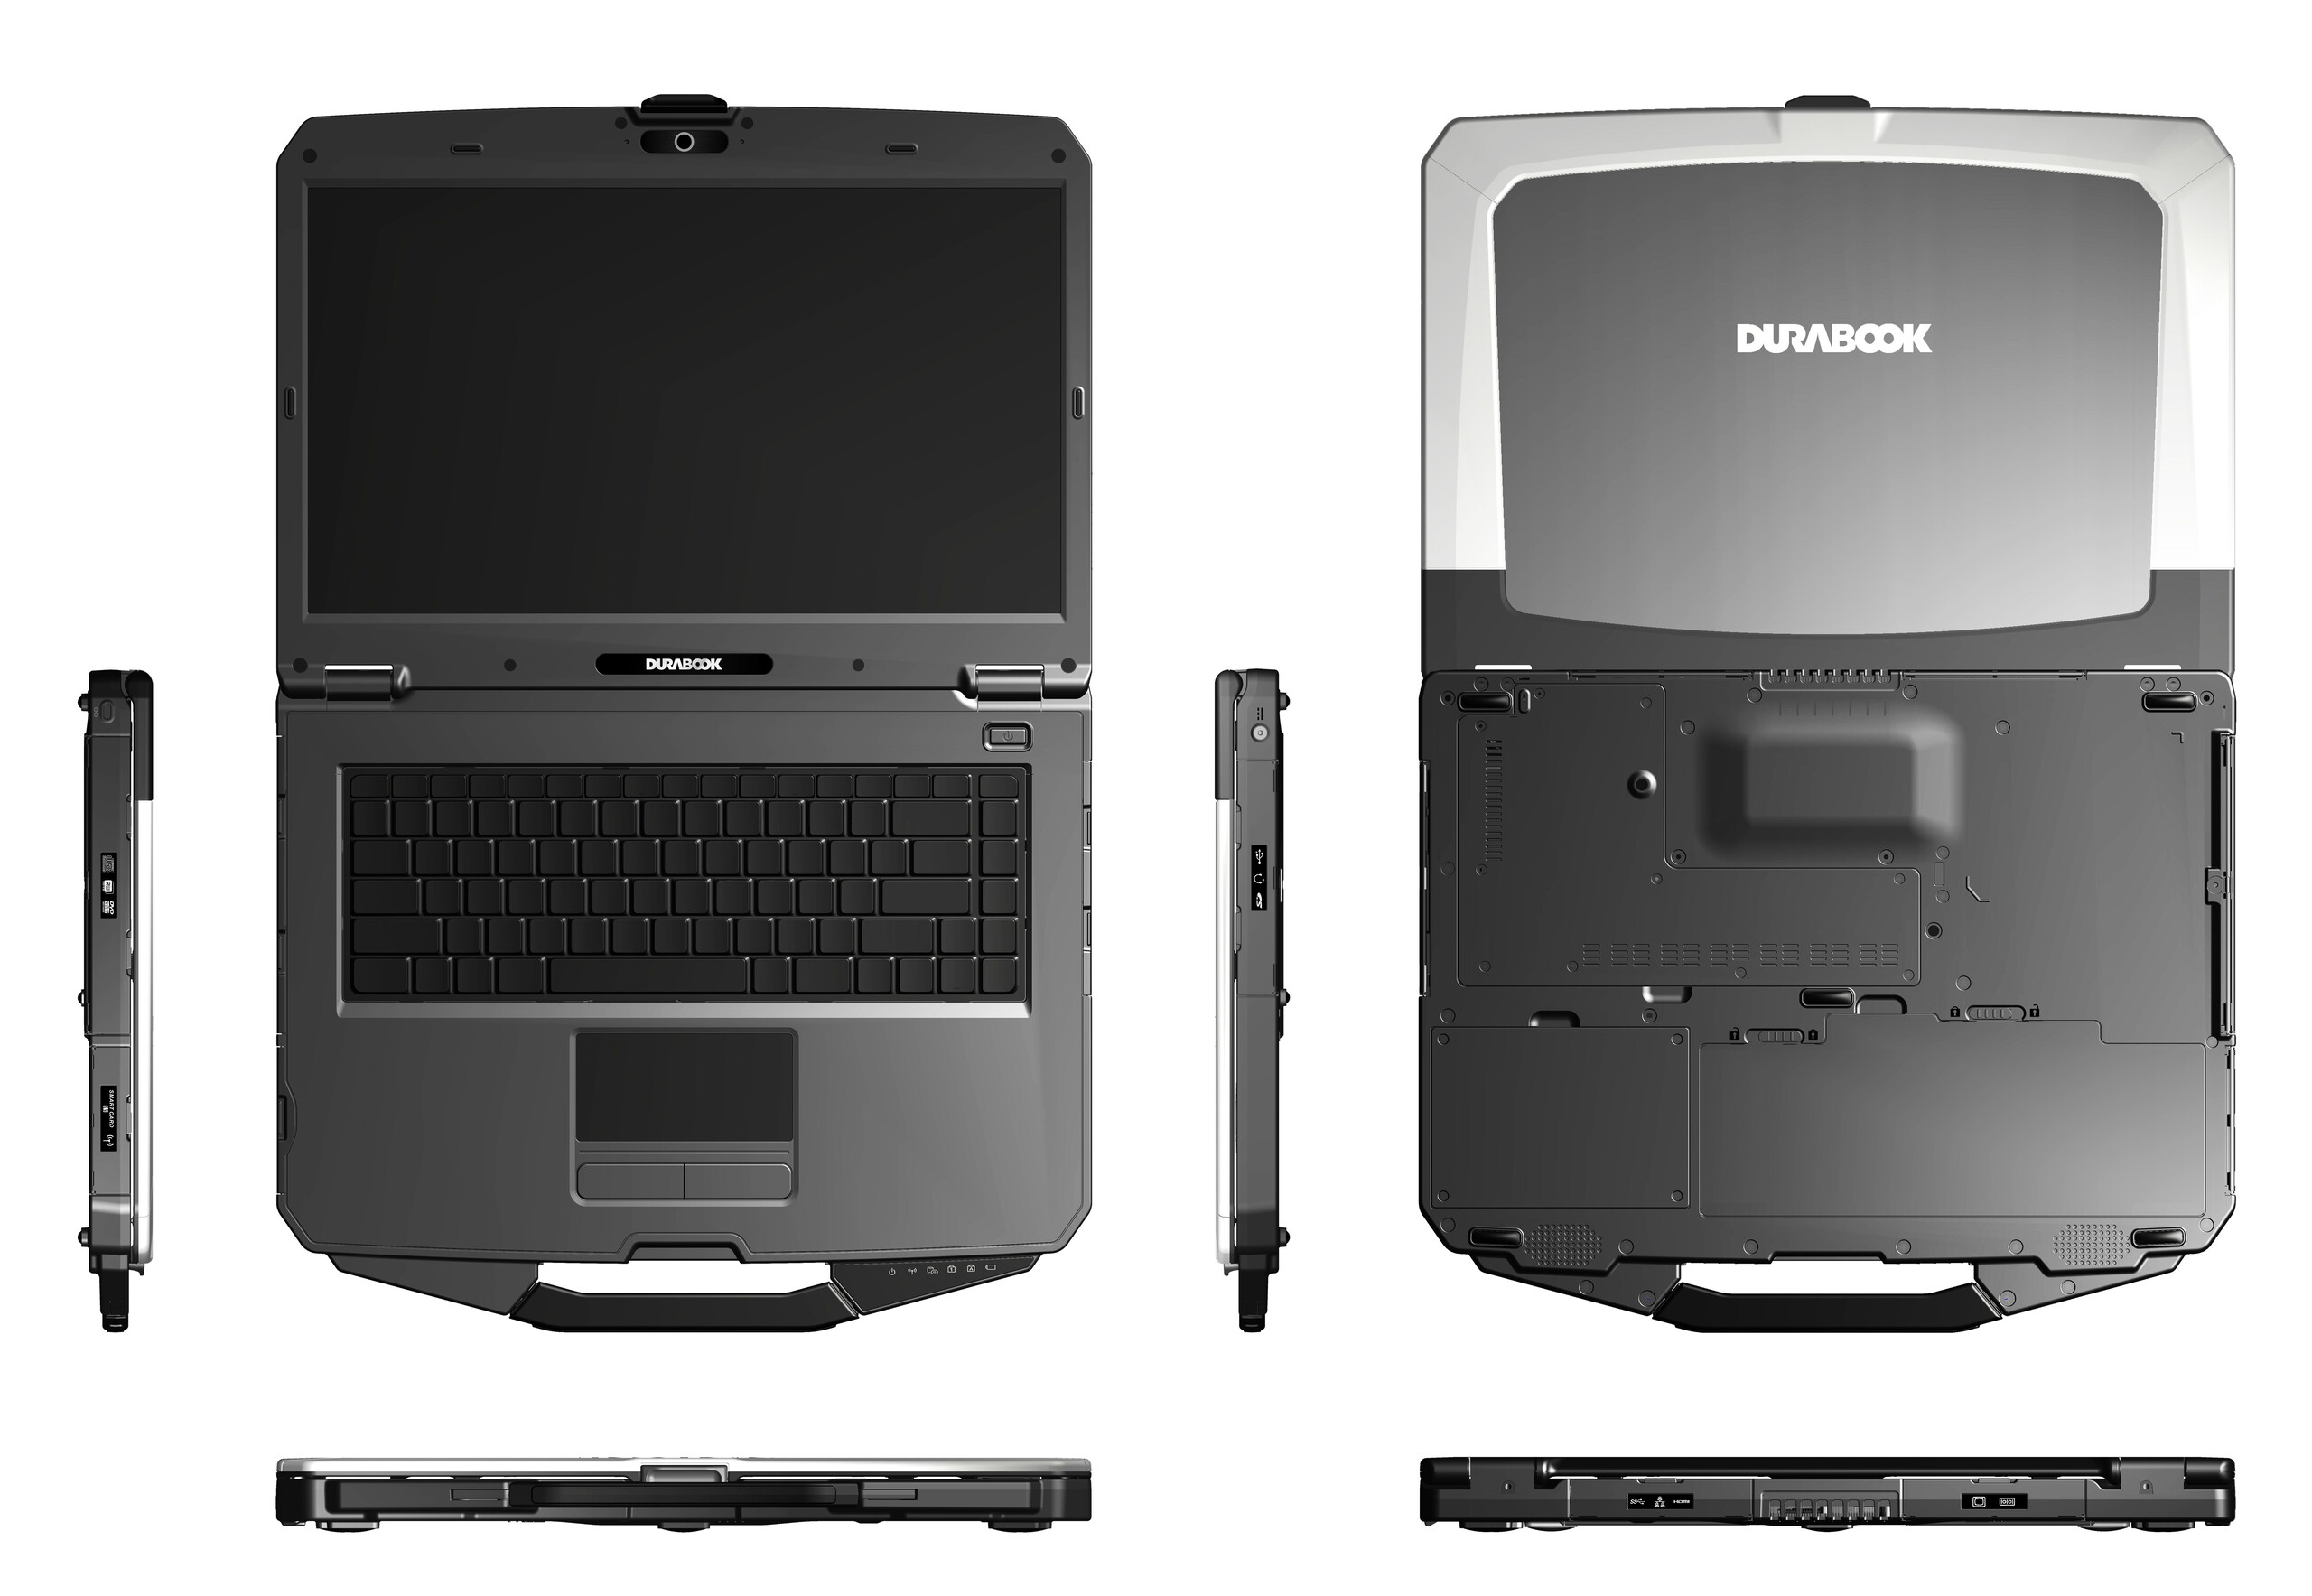
Recensione del Laptop rinfornzato Durabook S15ABG2
Punteggio | Data | Modello | Peso | Altezza | Dimensione | Risoluzione | Prezzo |
|---|---|---|---|---|---|---|---|
| 78.3 % v7 (old) | 04/2020 | Durabook S15ABG2 i5-8265U, UHD Graphics 620 | 2.6 kg | 30 mm | 15.60" | 1920x1080 | |
| 84.3 % v6 (old) | 04/2019 | Dell Latitude 7424 Rugged Extreme i7-8650U, Radeon RX 540 | 3.5 kg | 59.3 mm | 14.00" | 1920x1080 | |
| 80.9 % v7 (old) | 09/2019 | Panasonic Toughbook FZ-55 i5-8365U, UHD Graphics 620 | 2.2 kg | 33 mm | 14.00" | 1920x1080 | |
| 83.9 % v6 (old) | 10/2018 | Fujitsu Lifebook A357-A3570MPH06DE i5-7200U, HD Graphics 620 | 2.2 kg | 30.9 mm | 15.60" | 1920x1080 | |
| 81.9 % v6 (old) | 10/2018 | Getac S410 i5-8550U, UHD Graphics 620 | 3.2 kg | 34.9 mm | 14.00" | 1366x768 |

| SD Card Reader | |
| average JPG Copy Test (av. of 3 runs) | |
| Dell Latitude 5420 Rugged-P85G (Toshiba Exceria Pro SDXC 64 GB UHS-II) | |
| Dell Latitude 7424 Rugged Extreme (Toshiba Exceria Pro SDXC 64 GB UHS-II) | |
| Fujitsu Celsius H780 (Toshiba Exceria Pro SDXC 64 GB UHS-II) | |
| Fujitsu Lifebook A357-A3570MPH06DE (Toshiba Exceria Pro SDXC 64 GB UHS-II) | |
| Panasonic Toughbook FZ-55 (Toshiba Exceria Pro M501 64 GB UHS-II) | |
| Durabook S15ABG2 (Toshiba Exceria Pro SDXC 64 GB UHS-II) | |
| maximum AS SSD Seq Read Test (1GB) | |
| Dell Latitude 5420 Rugged-P85G (Toshiba Exceria Pro SDXC 64 GB UHS-II) | |
| Dell Latitude 7424 Rugged Extreme (Toshiba Exceria Pro SDXC 64 GB UHS-II) | |
| Fujitsu Celsius H780 (Toshiba Exceria Pro SDXC 64 GB UHS-II) | |
| Fujitsu Lifebook A357-A3570MPH06DE (Toshiba Exceria Pro SDXC 64 GB UHS-II) | |
| Panasonic Toughbook FZ-55 (Toshiba Exceria Pro M501 64 GB UHS-II) | |
| Durabook S15ABG2 (Toshiba Exceria Pro SDXC 64 GB UHS-II) | |
| Networking | |
| iperf3 transmit AX12 | |
| Asus Zephyrus G14 GA401IV | |
| Lenovo ThinkPad X1 Yoga 20SA000GUS | |
| Durabook S15ABG2 | |
| MSI GF75 Thin 10SCXR | |
| iperf3 receive AX12 | |
| MSI GF75 Thin 10SCXR | |
| Asus Zephyrus G14 GA401IV | |
| Lenovo ThinkPad X1 Yoga 20SA000GUS | |
| Durabook S15ABG2 | |


| |||||||||||||||||||||||||
Distribuzione della luminosità: 86 %
Al centro con la batteria: 284.8 cd/m²
Contrasto: 407:1 (Nero: 0.7 cd/m²)
ΔE ColorChecker Calman: 11.48 | ∀{0.5-29.43 Ø4.71}
calibrated: 3.06
ΔE Greyscale Calman: 13.2 | ∀{0.09-98 Ø4.96}
76.8% sRGB (Argyll 1.6.3 3D)
48.8% AdobeRGB 1998 (Argyll 1.6.3 3D)
52.9% AdobeRGB 1998 (Argyll 3D)
77.1% sRGB (Argyll 3D)
51.4% Display P3 (Argyll 3D)
Gamma: 2.09
CCT: 14566 K
| Durabook S15ABG2 Chi Mei N156HGE-EA2, TN LED, 15.6", 1920x1080 | Dell Latitude 7424 Rugged Extreme AU Optronics AUO523D, IPS, 14", 1920x1080 | Dell Latitude 5420 Rugged-P85G AU Optronics AUO523D, IPS, 14", 1920x1080 | Panasonic Toughbook FZ-55 InfoVision M140NWF5 R3, IPS, 14", 1920x1080 | Fujitsu Celsius H780 LP156WF6-SPP1, IPS LED, 15.6", 1920x1080 | Fujitsu Lifebook A357-A3570MPH06DE LG Philips LP156WFB-SPB1, IPS, 15.6", 1920x1080 | |
|---|---|---|---|---|---|---|
| Display | 27% | 21% | -26% | 20% | -31% | |
| Display P3 Coverage (%) | 51.4 | 65.3 27% | 62.5 22% | 38.09 -26% | 66.3 29% | 35.37 -31% |
| sRGB Coverage (%) | 77.1 | 96.9 26% | 92.4 20% | 57 -26% | 85.9 11% | 53.2 -31% |
| AdobeRGB 1998 Coverage (%) | 52.9 | 67.3 27% | 64.2 21% | 39.38 -26% | 62.8 19% | 36.54 -31% |
| Response Times | -131% | -125% | -62% | -47% | -47% | |
| Response Time Grey 50% / Grey 80% * (ms) | 24.4 ? | 62.8 ? -157% | 68 ? -179% | 42 ? -72% | 38 ? -56% | 38 ? -56% |
| Response Time Black / White * (ms) | 19.6 ? | 40 ? -104% | 33.6 ? -71% | 29.6 ? -51% | 26.8 ? -37% | 27 ? -38% |
| PWM Frequency (Hz) | 301.2 ? | 763 | 735 ? | 694 ? | 20830 ? | |
| Screen | 87% | 93% | 77% | 37% | 16% | |
| Brightness middle (cd/m²) | 284.8 | 844 196% | 1111.7 290% | 1037 264% | 271 -5% | 260 -9% |
| Brightness (cd/m²) | 267 | 793 197% | 1026 284% | 1015 280% | 260 -3% | 241 -10% |
| Brightness Distribution (%) | 86 | 88 2% | 80 -7% | 76 -12% | 86 0% | 87 1% |
| Black Level * (cd/m²) | 0.7 | 0.54 23% | 0.81 -16% | 0.6 14% | 0.29 59% | 0.39 44% |
| Contrast (:1) | 407 | 1563 284% | 1372 237% | 1728 325% | 934 129% | 667 64% |
| Colorchecker dE 2000 * | 11.48 | 4.8 58% | 3.83 67% | 5.71 50% | 3.9 66% | 5.23 54% |
| Colorchecker dE 2000 max. * | 19.71 | 11.88 40% | 7.85 60% | 26.27 -33% | 10.2 48% | 7.73 61% |
| Colorchecker dE 2000 calibrated * | 3.06 | 1.15 62% | 2.98 3% | 4.52 -48% | 2.9 5% | 4.2 -37% |
| Greyscale dE 2000 * | 13.2 | 7.6 42% | 5.6 58% | 5.5 58% | 2.6 80% | 4.22 68% |
| Gamma | 2.09 105% | 2.334 94% | 2.306 95% | 2.04 108% | 2.29 96% | 2.62 84% |
| CCT | 14566 45% | 6546 99% | 7676 85% | 5783 112% | 6517 100% | 6104 106% |
| Color Space (Percent of AdobeRGB 1998) (%) | 48.8 | 62 27% | 59 21% | 36.4 -25% | 56.1 15% | 34 -30% |
| Color Space (Percent of sRGB) (%) | 76.8 | 97 26% | 93 21% | 57 -26% | 85.8 12% | 53 -31% |
| Media totale (Programma / Settaggio) | -6% /
49% | -4% /
52% | -4% /
40% | 3% /
23% | -21% /
-1% |
* ... Meglio usare valori piccoli
Tempi di risposta del Display
| ↔ Tempi di risposta dal Nero al Bianco | ||
|---|---|---|
| 19.6 ms ... aumenta ↗ e diminuisce ↘ combinato | ↗ 14.4 ms Incremento | 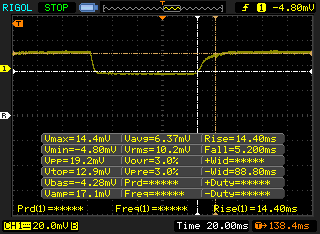 |
| ↘ 5.2 ms Calo | ||
| Lo schermo mostra buoni tempi di risposta durante i nostri tests, ma potrebbe essere troppo lento per i gamers competitivi. In confronto, tutti i dispositivi di test variano da 0.1 (minimo) a 240 (massimo) ms. » 43 % di tutti i dispositivi è migliore. Questo significa che i tempi di risposta rilevati sono simili alla media di tutti i dispositivi testati (19.8 ms). | ||
| ↔ Tempo di risposta dal 50% Grigio all'80% Grigio | ||
| 24.4 ms ... aumenta ↗ e diminuisce ↘ combinato | ↗ 12.8 ms Incremento | 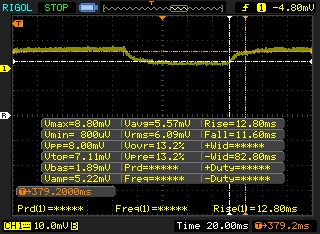 |
| ↘ 11.6 ms Calo | ||
| Lo schermo mostra buoni tempi di risposta durante i nostri tests, ma potrebbe essere troppo lento per i gamers competitivi. In confronto, tutti i dispositivi di test variano da 0.165 (minimo) a 636 (massimo) ms. » 35 % di tutti i dispositivi è migliore. Questo significa che i tempi di risposta rilevati sono migliori rispettto alla media di tutti i dispositivi testati (31 ms). | ||
Sfarfallio dello schermo / PWM (Pulse-Width Modulation)
| flickering dello schermo / PWM rilevato | 301.2 Hz | ≤ 99 % settaggio luminosita' | 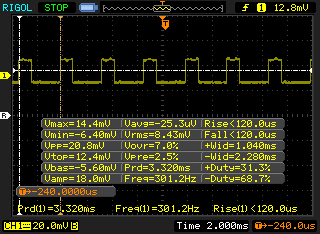 |
Il display sfarfalla a 301.2 Hz (Probabilmente a causa dell'uso di PWM) Flickering rilevato ad una luminosita' di 99 % o inferiore. Non dovrebbe verificarsi flickering o PWM sopra questo valore di luminosita'. La frequenza di 301.2 Hz è relativamente elevata, quindi la maggioranza degli utenti sensibili al PWM non dovrebbe notare alcun flickering. Tuttavia, è stato segnalato che alcuni utenti sono sensibili al PWM a 500 Hz ed oltre, quindi prestate attenzione. In confronto: 52 % di tutti i dispositivi testati non utilizza PWM per ridurre la luminosita' del display. Se è rilevato PWM, una media di 7754 (minimo: 5 - massimo: 343500) Hz è stata rilevata. | |||
Cinebench R20: CPU (Multi Core) | CPU (Single Core)
Blender: v2.79 BMW27 CPU
7-Zip 18.03: 7z b 4 -mmt1 | 7z b 4
Geekbench 5.5: Single-Core | Multi-Core
HWBOT x265 Benchmark v2.2: 4k Preset
LibreOffice : 20 Documents To PDF
R Benchmark 2.5: Overall mean
| Cinebench R20 / CPU (Multi Core) | |
| Lenovo ThinkPad T590-20N4002VGE | |
| Huawei MateBook D 15-53010TUY | |
| Dell Inspiron 15 5000 5585 | |
| Media Intel Core i5-8265U (972 - 1564, n=16) | |
| Dynabook Portégé X30-F-10N | |
| HP Elite Dragonfly-8MK79EA | |
| Durabook S15ABG2 | |
| Cinebench R20 / CPU (Single Core) | |
| Lenovo ThinkPad T590-20N4002VGE | |
| Durabook S15ABG2 | |
| Media Intel Core i5-8265U (325 - 403, n=16) | |
| Dynabook Portégé X30-F-10N | |
| HP Elite Dragonfly-8MK79EA | |
| Huawei MateBook D 15-53010TUY | |
| Dell Inspiron 15 5000 5585 | |
| Blender / v2.79 BMW27 CPU | |
| Durabook S15ABG2 | |
| HP Elite Dragonfly-8MK79EA | |
| Media Intel Core i5-8265U (769 - 1098, n=15) | |
| Lenovo ThinkPad T590-20N4002VGE | |
| Huawei MateBook D 15-53010TUY | |
| Fujitsu Celsius H780 | |
| 7-Zip 18.03 / 7z b 4 -mmt1 | |
| Lenovo ThinkPad T590-20N4002VGE | |
| Fujitsu Celsius H780 | |
| Durabook S15ABG2 | |
| Media Intel Core i5-8265U (3780 - 4195, n=15) | |
| HP Elite Dragonfly-8MK79EA | |
| Huawei MateBook D 15-53010TUY | |
| 7-Zip 18.03 / 7z b 4 | |
| Fujitsu Celsius H780 | |
| Lenovo ThinkPad T590-20N4002VGE | |
| Huawei MateBook D 15-53010TUY | |
| Media Intel Core i5-8265U (13731 - 18802, n=15) | |
| HP Elite Dragonfly-8MK79EA | |
| Durabook S15ABG2 | |
| Geekbench 5.5 / Single-Core | |
| Durabook S15ABG2 | |
| Media Intel Core i5-8265U (1024 - 1047, n=4) | |
| Huawei MateBook D 15-53010TUY | |
| Geekbench 5.5 / Multi-Core | |
| Media Intel Core i5-8265U (3442 - 3986, n=4) | |
| Durabook S15ABG2 | |
| Huawei MateBook D 15-53010TUY | |
| HWBOT x265 Benchmark v2.2 / 4k Preset | |
| Fujitsu Celsius H780 | |
| Lenovo ThinkPad T590-20N4002VGE | |
| Media Intel Core i5-8265U (3.38 - 4.8, n=15) | |
| Huawei MateBook D 15-53010TUY | |
| HP Elite Dragonfly-8MK79EA | |
| Durabook S15ABG2 | |
| LibreOffice / 20 Documents To PDF | |
| Durabook S15ABG2 | |
| Media Intel Core i5-8265U (59.4 - 67.8, n=4) | |
| R Benchmark 2.5 / Overall mean | |
| Huawei MateBook D 15-53010TUY | |
| Media Intel Core i5-8265U (0.72 - 0.754, n=4) | |
| Durabook S15ABG2 | |
* ... Meglio usare valori piccoli
| PCMark 8 Home Score Accelerated v2 | 3285 punti | |
| PCMark 8 Work Score Accelerated v2 | 4605 punti | |
| PCMark 10 Score | 3699 punti | |
Aiuto | ||
| DPC Latencies / LatencyMon - interrupt to process latency (max), Web, Youtube, Prime95 | |
| Durabook S15ABG2 | |
* ... Meglio usare valori piccoli
| Durabook S15ABG2 UDinfo HF3-25UB HF325UB256GBA2P | Dell Latitude 7424 Rugged Extreme SK Hynix PC401 512GB M.2 (HFS512GD9TNG) | Dell Latitude 5420 Rugged-P85G SK hynix PC401 NVMe 500 GB | Panasonic Toughbook FZ-55 Samsung SSD PM871b MZNLN256HAJQ | Fujitsu Celsius H780 Samsung SSD PM981 MZVLB512HAJQ | Fujitsu Lifebook A357-A3570MPH06DE Micron SSD 1100 SED 256GB MTFDDAK256TBN | |
|---|---|---|---|---|---|---|
| AS SSD | 138% | 188% | 36% | 306% | 10% | |
| Seq Read (MB/s) | 424.7 | 2096 394% | 2054 384% | 437.7 3% | 1049 147% | 494.3 16% |
| Seq Write (MB/s) | 290.4 | 1016 250% | 653 125% | 387.3 33% | 1882 548% | 341.5 18% |
| 4K Read (MB/s) | 35.07 | 39.91 14% | 39.34 12% | 26.18 -25% | 48.35 38% | 23.9 -32% |
| 4K Write (MB/s) | 46.69 | 97.9 110% | 96.4 106% | 60.3 29% | 102.5 120% | 65.9 41% |
| 4K-64 Read (MB/s) | 291.8 | 636 118% | 677 132% | 369.8 27% | 1395 378% | 236.1 -19% |
| 4K-64 Write (MB/s) | 297.8 | 604 103% | 982 230% | 313.7 5% | 1789 501% | 258.3 -13% |
| Access Time Read * (ms) | 0.192 | 0.044 77% | 0.044 77% | 0.089 54% | 0.066 66% | 0.115 40% |
| Access Time Write * (ms) | 0.189 | 0.051 73% | 0.051 73% | 0.058 69% | 0.037 80% | 0.057 70% |
| Score Read (Points) | 369 | 886 140% | 921 150% | 440 19% | 1549 320% | 309 -16% |
| Score Write (Points) | 374 | 804 115% | 1143 206% | 413 10% | 2080 456% | 358 -4% |
| Score Total (Points) | 938 | 2099 124% | 2475 164% | 1083 15% | 4469 376% | 827 -12% |
| Copy ISO MB/s (MB/s) | 371.3 | 1622 337% | 553 49% | 1547 317% | 311.7 -16% | |
| Copy Program MB/s (MB/s) | 151.3 | 378.1 150% | 204.7 35% | 405.9 168% | 149.6 -1% | |
| Copy Game MB/s (MB/s) | 134.7 | 793 489% | 385.9 186% | 1170 769% | 229.6 70% | |
| CrystalDiskMark 5.2 / 6 | 220% | 152% | 20% | 237% | 11% | |
| Write 4K (MB/s) | 63.5 | 114.4 80% | 98.8 56% | 55.4 -13% | 98.3 55% | 72.1 14% |
| Read 4K (MB/s) | 26.67 | 43.86 64% | 38.51 44% | 31.11 17% | 40.18 51% | 25 -6% |
| Write Seq (MB/s) | 258.8 | 1281 395% | 843 226% | 460.9 78% | 1777 587% | 413.2 60% |
| Read Seq (MB/s) | 392.4 | 1918 389% | 1282 227% | 481.9 23% | 1247 218% | 488.9 25% |
| Write 4K Q32T1 (MB/s) | 249.4 | 422.5 69% | 355.5 43% | 234.6 -6% | 344.7 38% | 161.5 -35% |
| Read 4K Q32T1 (MB/s) | 259.2 | 260.6 1% | 241.4 -7% | 181.7 -30% | 383.1 48% | 184.8 -29% |
| Write Seq Q32T1 (MB/s) | 311.9 | 1282 311% | 893 186% | 528 69% | 2019 547% | 432.3 39% |
| Read Seq Q32T1 (MB/s) | 459 | 2515 448% | 2478 440% | 548 19% | 2076 352% | 531 16% |
| Write 4K Q8T8 (MB/s) | 1751 | |||||
| Read 4K Q8T8 (MB/s) | 1568 | |||||
| Media totale (Programma / Settaggio) | 179% /
172% | 170% /
175% | 28% /
30% | 272% /
281% | 11% /
10% |
* ... Meglio usare valori piccoli

| 3DMark 11 Performance | 1926 punti | |
| 3DMark Cloud Gate Standard Score | 7910 punti | |
| 3DMark Fire Strike Score | 1020 punti | |
| 3DMark Time Spy Score | 416 punti | |
Aiuto | ||
| basso | medio | alto | ultra | |
|---|---|---|---|---|
| Dota 2 Reborn (2015) | 71.3 | 42.3 | 19.1 | 16.7 |
| X-Plane 11.11 (2018) | 20.9 | 14.2 | 12.8 |
| Durabook S15ABG2 UHD Graphics 620, i5-8265U, UDinfo HF3-25UB HF325UB256GBA2P | Dell Latitude 7424 Rugged Extreme Radeon RX 540, i7-8650U, SK Hynix PC401 512GB M.2 (HFS512GD9TNG) | Panasonic Toughbook FZ-55 UHD Graphics 620, i5-8365U, Samsung SSD PM871b MZNLN256HAJQ | Fujitsu Lifebook A357-A3570MPH06DE HD Graphics 620, i5-7200U, Micron SSD 1100 SED 256GB MTFDDAK256TBN | Dell Latitude 5420 Rugged-P85G Radeon RX 540, i7-8650U, SK hynix PC401 NVMe 500 GB | |
|---|---|---|---|---|---|
| Noise | 2% | 2% | -2% | 5% | |
| off /ambiente * (dB) | 29.3 | 28.6 2% | 29 1% | 30.3 -3% | 28.3 3% |
| Idle Minimum * (dB) | 29.3 | 28.6 2% | 29 1% | 30.3 -3% | 28.3 3% |
| Idle Average * (dB) | 29.3 | 28.6 2% | 29.6 -1% | 30.3 -3% | 28.3 3% |
| Idle Maximum * (dB) | 29.3 | 28.6 2% | 30.5 -4% | 30.3 -3% | 28.3 3% |
| Load Average * (dB) | 35.5 | 32.9 7% | 30.3 15% | 37 -4% | 29.9 16% |
| Load Maximum * (dB) | 38 | 39 -3% | 39 -3% | 36.9 3% | 38 -0% |
* ... Meglio usare valori piccoli
Rumorosità
| Idle |
| 29.3 / 29.3 / 29.3 dB(A) |
| Sotto carico |
| 35.5 / 38 dB(A) |
 | ||
30 dB silenzioso 40 dB(A) udibile 50 dB(A) rumoroso |
||
min: | ||
(±) La temperatura massima sul lato superiore è di 44 °C / 111 F, rispetto alla media di 34.3 °C / 94 F, che varia da 21.2 a 62.5 °C per questa classe Office.
(±) Il lato inferiore si riscalda fino ad un massimo di 42 °C / 108 F, rispetto alla media di 36.8 °C / 98 F
(+) In idle, la temperatura media del lato superiore è di 26.4 °C / 80 F, rispetto alla media deld ispositivo di 29.5 °C / 85 F.
(+) I poggiapolsi e il touchpad sono piu' freddi della temperatura della pelle con un massimo di 30.6 °C / 87.1 F e sono quindi freddi al tatto.
(-) La temperatura media della zona del palmo della mano di dispositivi simili e'stata di 27.5 °C / 81.5 F (-3.1 °C / -5.6 F).
Durabook S15ABG2 analisi audio
(+) | gli altoparlanti sono relativamente potenti (84.2 dB)
Bassi 100 - 315 Hz
(-) | quasi nessun basso - in media 29% inferiori alla media
(+) | bassi in lineaa (4.9% delta rispetto alla precedente frequenza)
Medi 400 - 2000 Hz
(±) | medi elevati - circa 8.4% superiore alla media
(±) | linearità dei medi adeguata (12.6% delta rispetto alla precedente frequenza)
Alti 2 - 16 kHz
(+) | Alti bilanciati - appena 4% dalla media
(±) | la linearità degli alti è media (11.8% delta rispetto alla precedente frequenza)
Nel complesso 100 - 16.000 Hz
(-) | suono nel complesso non lineare (32.5% di differenza rispetto alla media
Rispetto alla stessa classe
» 95% di tutti i dispositivi testati in questa classe è stato migliore, 2% simile, 4% peggiore
» Il migliore ha avuto un delta di 7%, medio di 21%, peggiore di 53%
Rispetto a tutti i dispositivi testati
» 92% di tutti i dispositivi testati in questa classe è stato migliore, 2% similare, 7% peggiore
» Il migliore ha avuto un delta di 4%, medio di 23%, peggiore di 134%
Apple MacBook 12 (Early 2016) 1.1 GHz analisi audio
(+) | gli altoparlanti sono relativamente potenti (83.6 dB)
Bassi 100 - 315 Hz
(±) | bassi ridotti - in media 11.3% inferiori alla media
(±) | la linearità dei bassi è media (14.2% delta rispetto alla precedente frequenza)
Medi 400 - 2000 Hz
(+) | medi bilanciati - solo only 2.4% rispetto alla media
(+) | medi lineari (5.5% delta rispetto alla precedente frequenza)
Alti 2 - 16 kHz
(+) | Alti bilanciati - appena 2% dalla media
(+) | alti lineari (4.5% delta rispetto alla precedente frequenza)
Nel complesso 100 - 16.000 Hz
(+) | suono nel complesso lineare (10.2% differenza dalla media)
Rispetto alla stessa classe
» 7% di tutti i dispositivi testati in questa classe è stato migliore, 2% simile, 90% peggiore
» Il migliore ha avuto un delta di 5%, medio di 18%, peggiore di 53%
Rispetto a tutti i dispositivi testati
» 5% di tutti i dispositivi testati in questa classe è stato migliore, 1% similare, 94% peggiore
» Il migliore ha avuto un delta di 4%, medio di 23%, peggiore di 134%
| Off / Standby | |
| Idle | |
| Sotto carico |
|
Leggenda:
min: | |
| Durabook S15ABG2 i5-8265U, UHD Graphics 620, UDinfo HF3-25UB HF325UB256GBA2P, TN LED, 1920x1080, 15.6" | Dell Latitude 7424 Rugged Extreme i7-8650U, Radeon RX 540, SK Hynix PC401 512GB M.2 (HFS512GD9TNG), IPS, 1920x1080, 14" | Dell Latitude 5420 Rugged-P85G i7-8650U, Radeon RX 540, SK hynix PC401 NVMe 500 GB, IPS, 1920x1080, 14" | Panasonic Toughbook FZ-55 i5-8365U, UHD Graphics 620, Samsung SSD PM871b MZNLN256HAJQ, IPS, 1920x1080, 14" | Fujitsu Celsius H780 i7-8850H, Quadro P2000, Samsung SSD PM981 MZVLB512HAJQ, IPS LED, 1920x1080, 15.6" | Fujitsu Lifebook A357-A3570MPH06DE i5-7200U, HD Graphics 620, Micron SSD 1100 SED 256GB MTFDDAK256TBN, IPS, 1920x1080, 15.6" | |
|---|---|---|---|---|---|---|
| Power Consumption | -78% | -58% | -13% | -114% | 21% | |
| Idle Minimum * (Watt) | 3.5 | 6.5 -86% | 4.8 -37% | 3.7 -6% | 9.1 -160% | 3.65 -4% |
| Idle Average * (Watt) | 7.9 | 15.1 -91% | 13.6 -72% | 9.6 -22% | 13.2 -67% | 6.8 14% |
| Idle Maximum * (Watt) | 9 | 16.1 -79% | 13.8 -53% | 10.4 -16% | 14.04 -56% | 6.9 23% |
| Load Average * (Watt) | 39.8 | 70.5 -77% | 67.8 -70% | 40 -1% | 78.8 -98% | 29.1 27% |
| Load Maximum * (Watt) | 59.8 | 95.2 -59% | 93.5 -56% | 71.9 -20% | 172.5 -188% | 34 43% |
| Witcher 3 ultra * (Watt) | 68.1 | 69.1 |
* ... Meglio usare valori piccoli
| Durabook S15ABG2 i5-8265U, UHD Graphics 620, 56 Wh | Dell Latitude 7424 Rugged Extreme i7-8650U, Radeon RX 540, 102 Wh | Dell Latitude 5420 Rugged-P85G i7-8650U, Radeon RX 540, 102 Wh | Panasonic Toughbook FZ-55 i5-8365U, UHD Graphics 620, 71 Wh | Fujitsu Lifebook A357-A3570MPH06DE i5-7200U, HD Graphics 620, 49 Wh | Dell Latitude 14 7414 Rugged Extreme 6300U, HD Graphics 520, 97 Wh | |
|---|---|---|---|---|---|---|
| Autonomia della batteria | 70% | 135% | 167% | 14% | 52% | |
| WiFi v1.3 (h) | 6.9 | 11.7 70% | 16.2 135% | 18.4 167% | 7.9 14% | 10.5 52% |
| Load (h) | 2.7 | 3.2 | ||||
| Reader / Idle (h) | 31.4 |
Pro
Contro
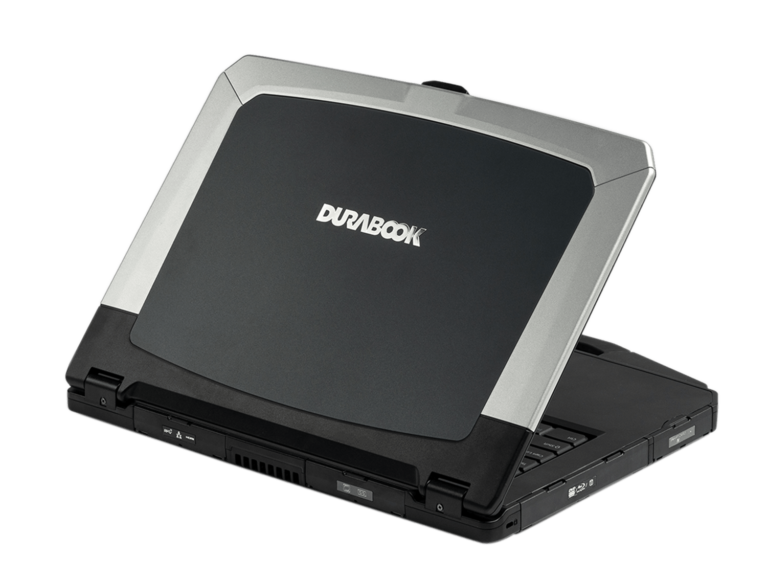
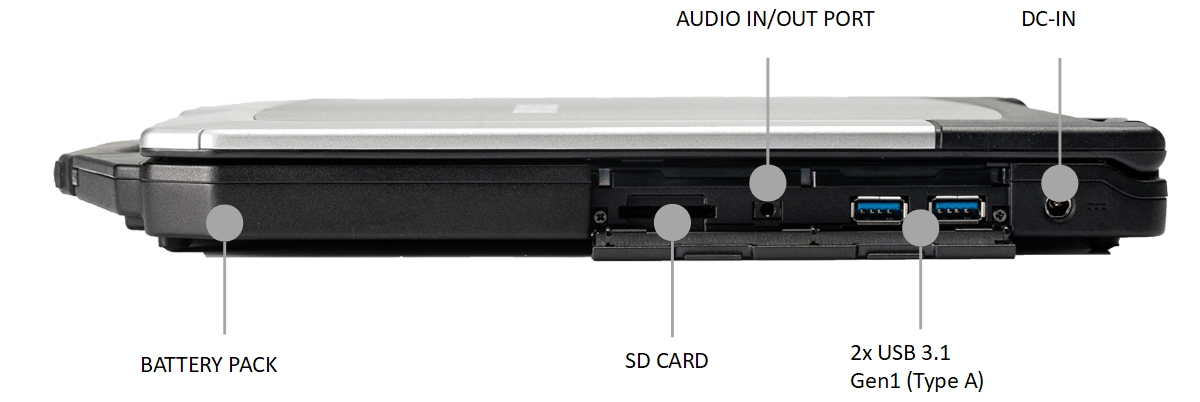
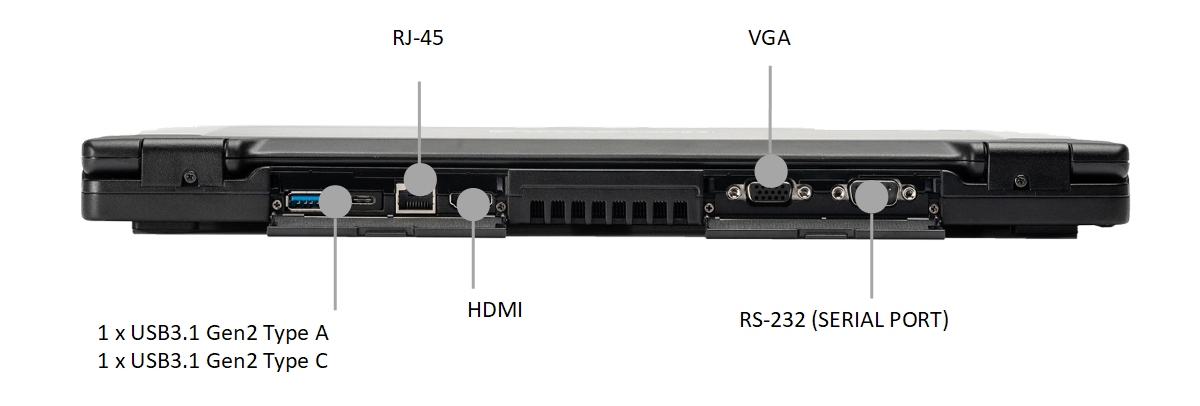
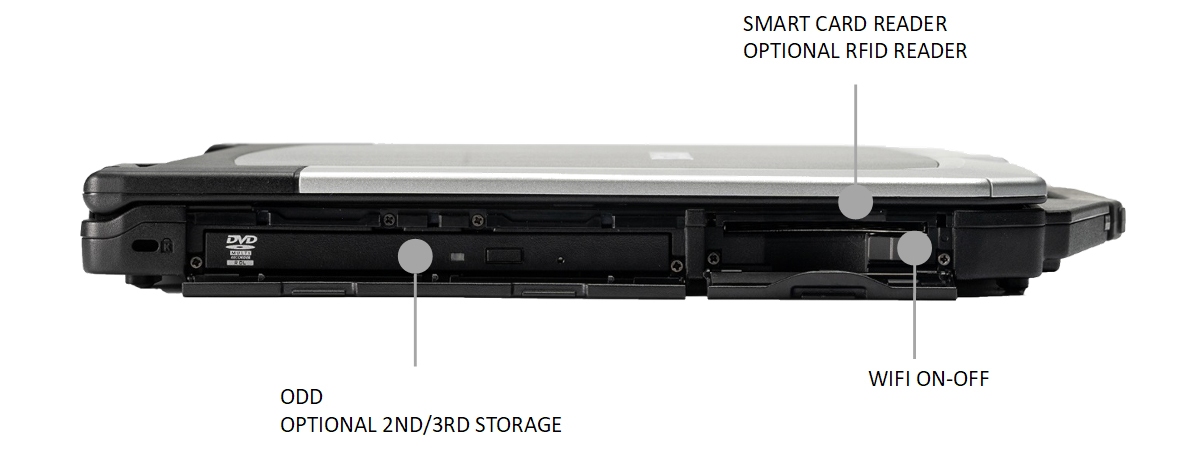
Il nostro aspetto preferito del Durabook S15ABG2 è il feedback nitido dei tasti della tastiera durante la digitazione e il facile accesso alle porte e agli aggiornamenti interni. Le alette di protezione che coprono le porte del Panasonic Toughbook FZ-55 e del Getac S410, ad esempio, sono relativamente più difficili da aprire e scomode da accedere.
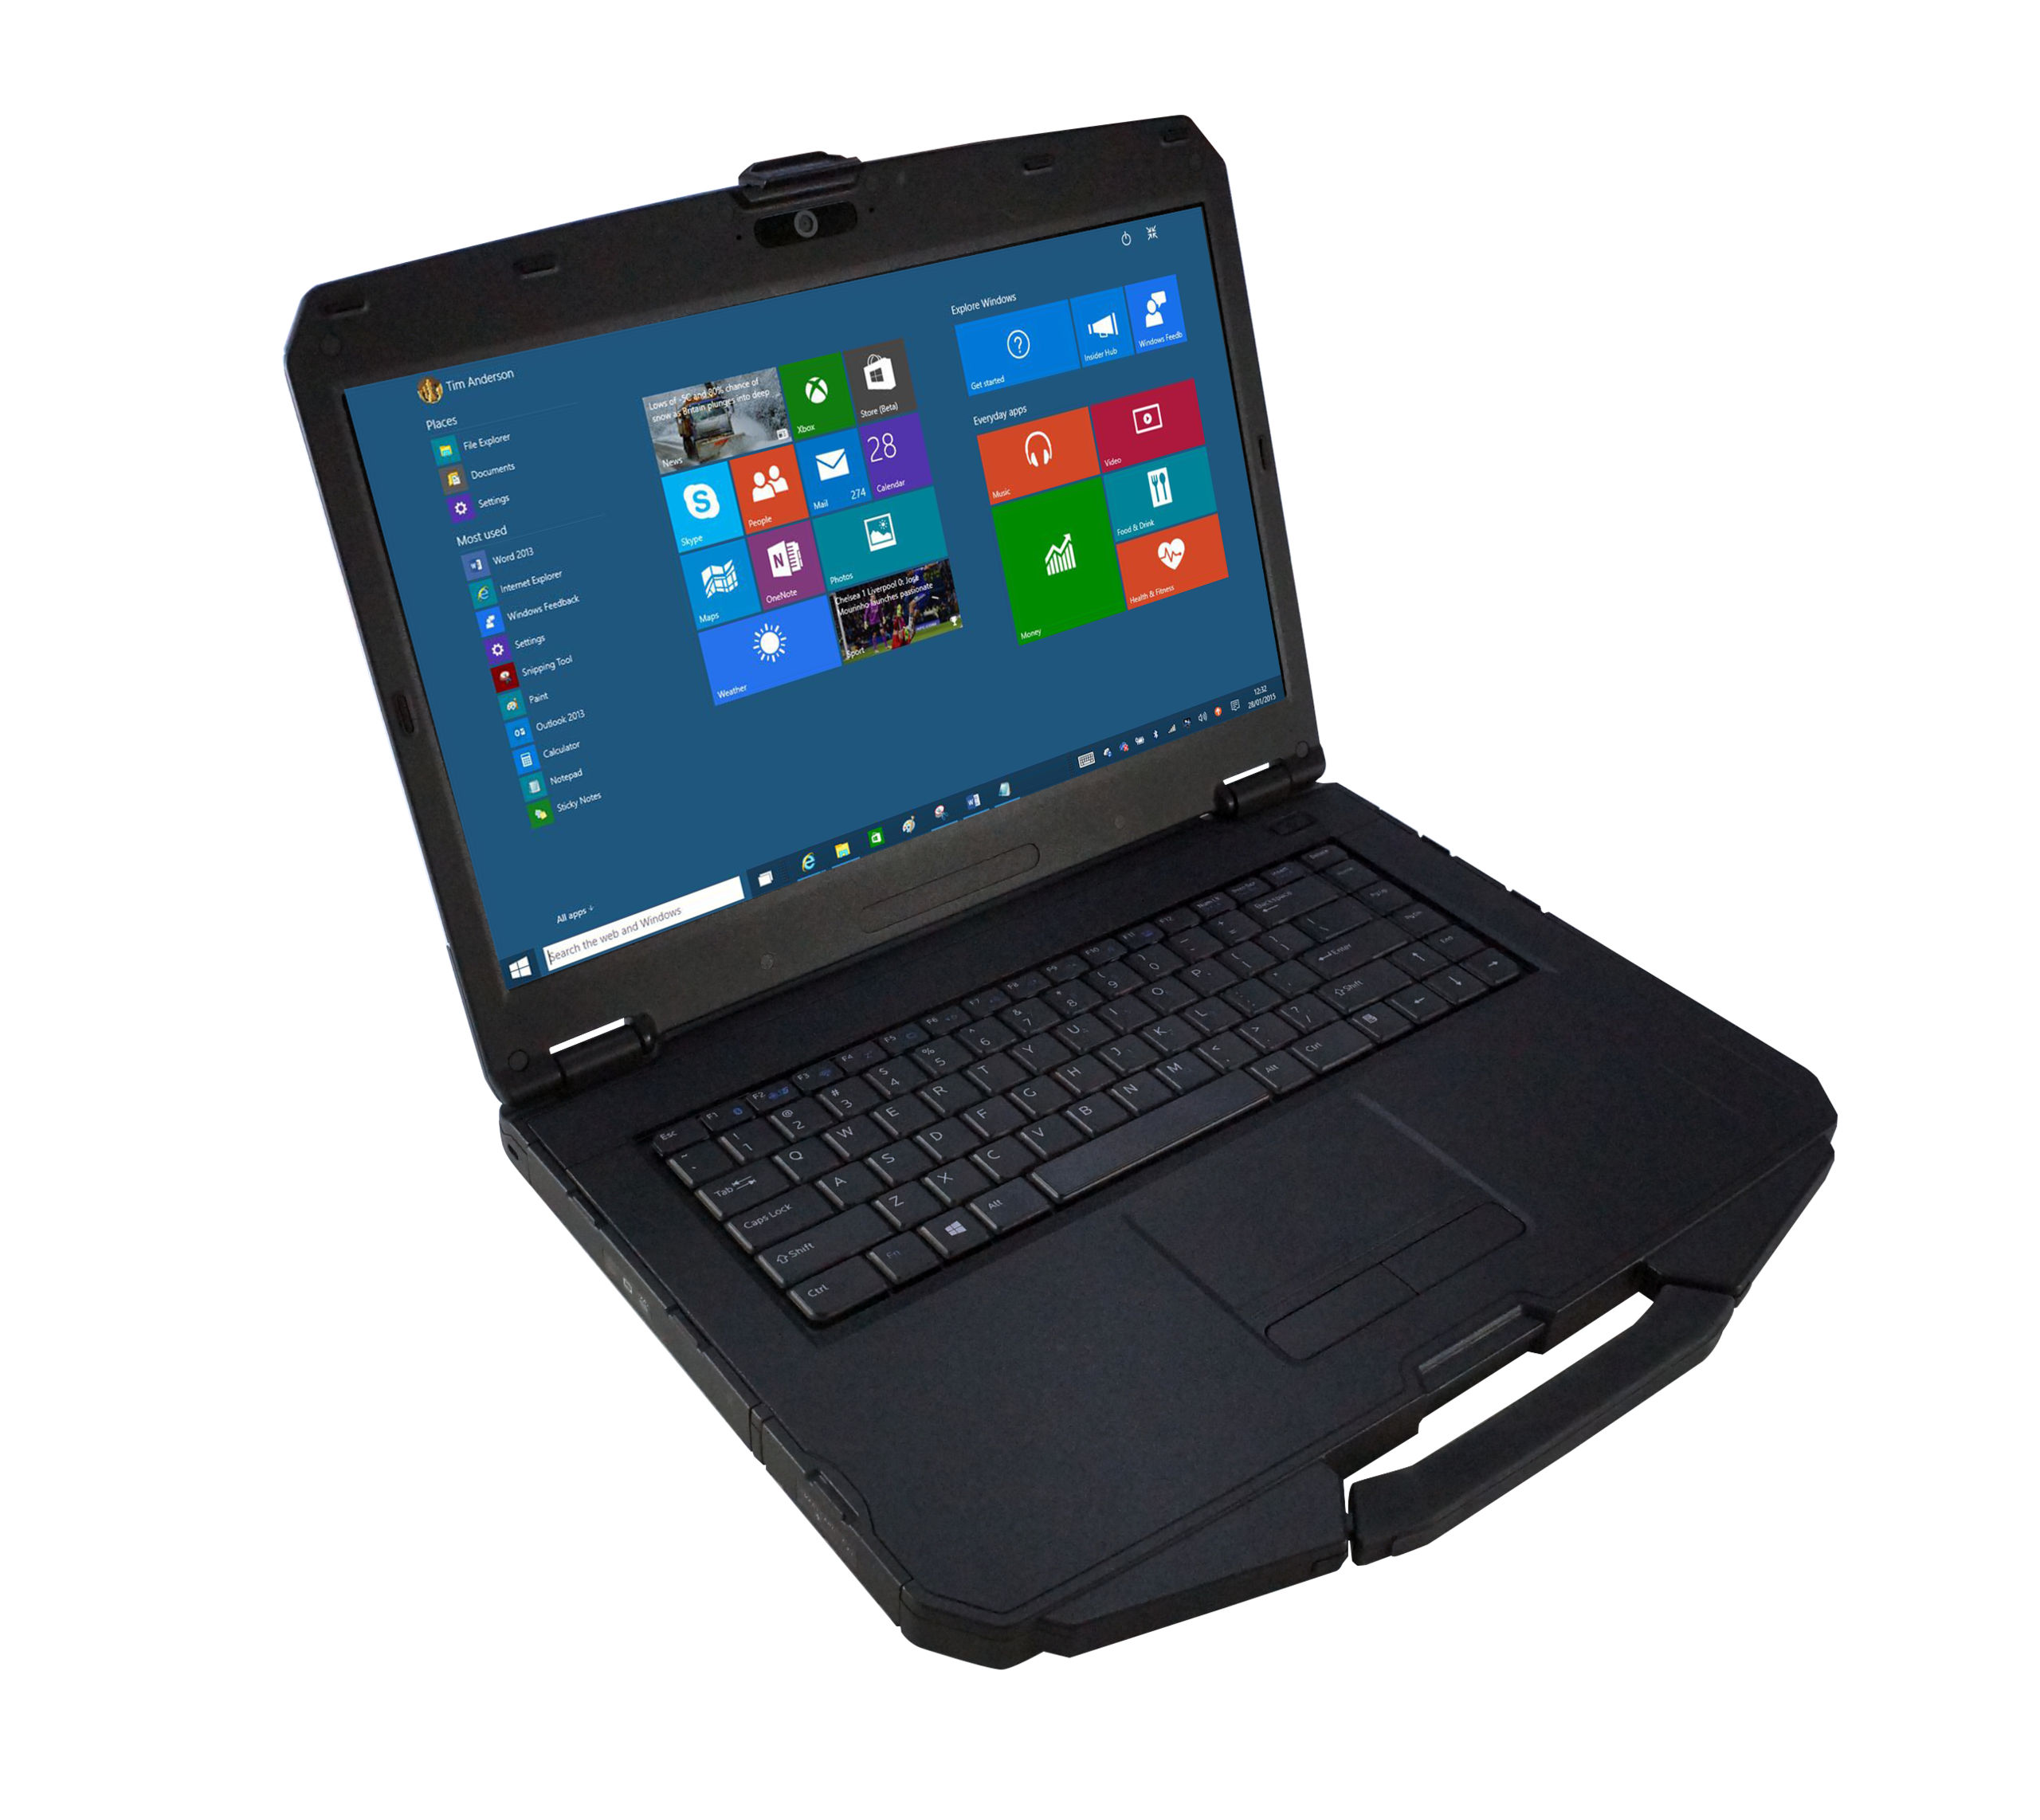
L'unico aspetto che potrebbe essere migliorato maggiormente sarebbe il display TN e il volubile controllo del touchpad. Si tratta di un vecchio display che non regge molto bene secondo gli odierni standard IPS e non è abbastanza luminoso per essere utilizzato all'aperto senza dover strizzare gli occhi. La presenza della modulazione di larghezza d'impulso potrebbe avere un impatto anche sull'uso notturno, dove sono auspicabili impostazioni di luminosità più basse.
Gli utenti possono personalizzare e ottenere un preventivo sul Durabook S15ABG2 attraverso la pagina del prodotto qui.
Durabook S15ABG2
- 04/27/2020 v7 (old)
Allen Ngo
Price comparison
