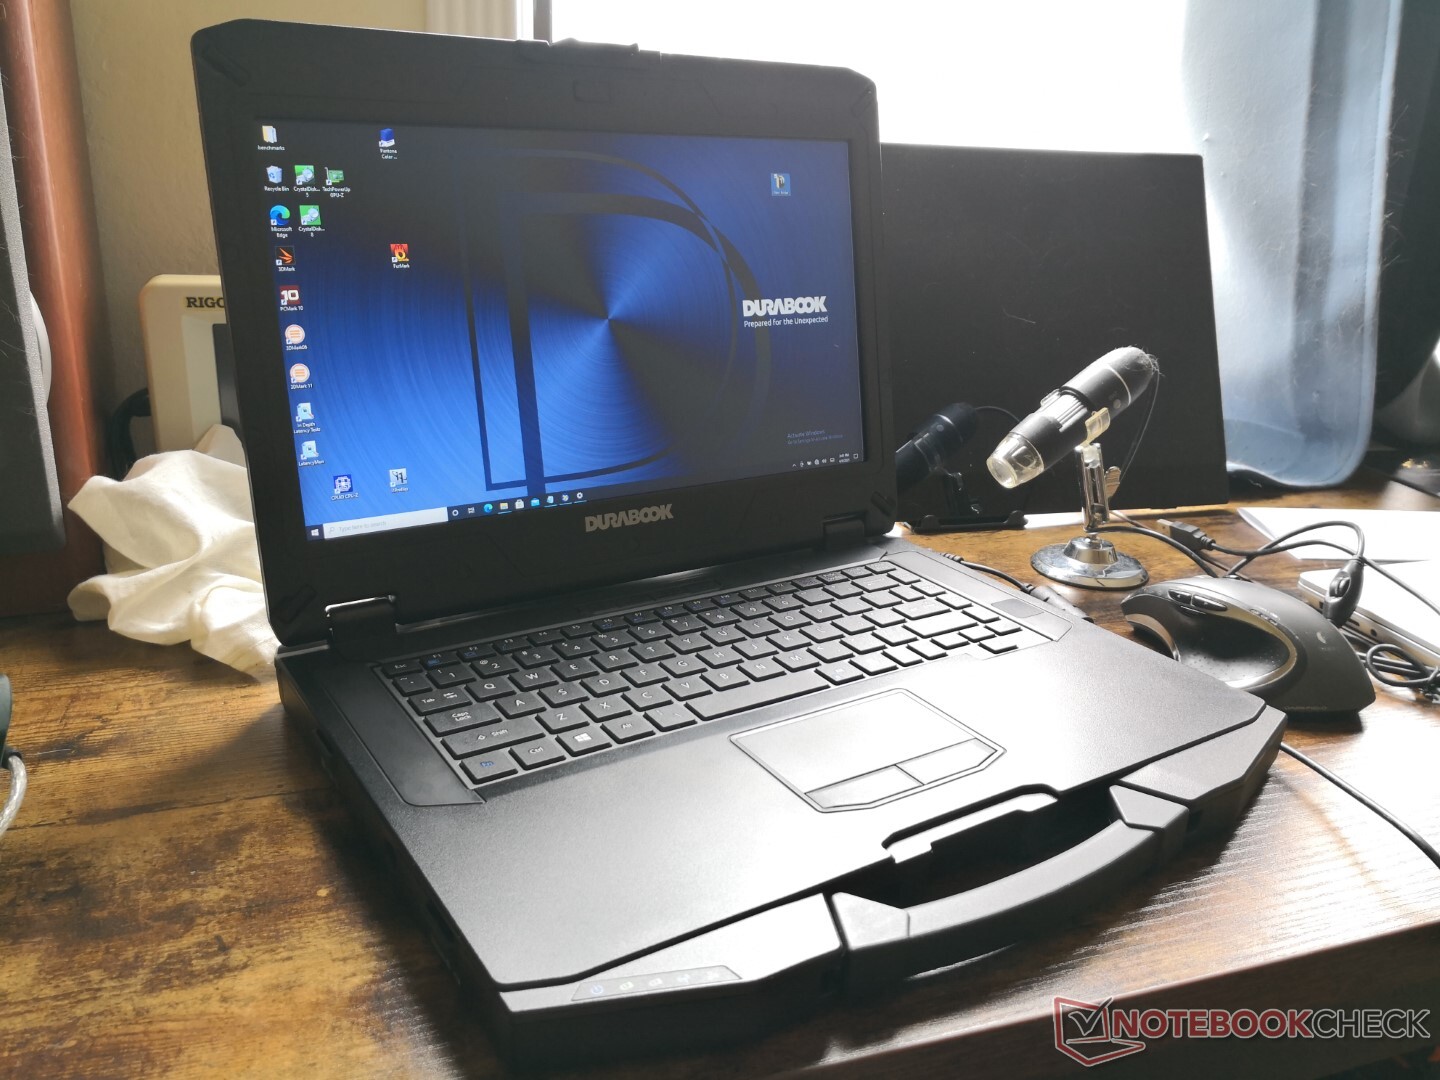
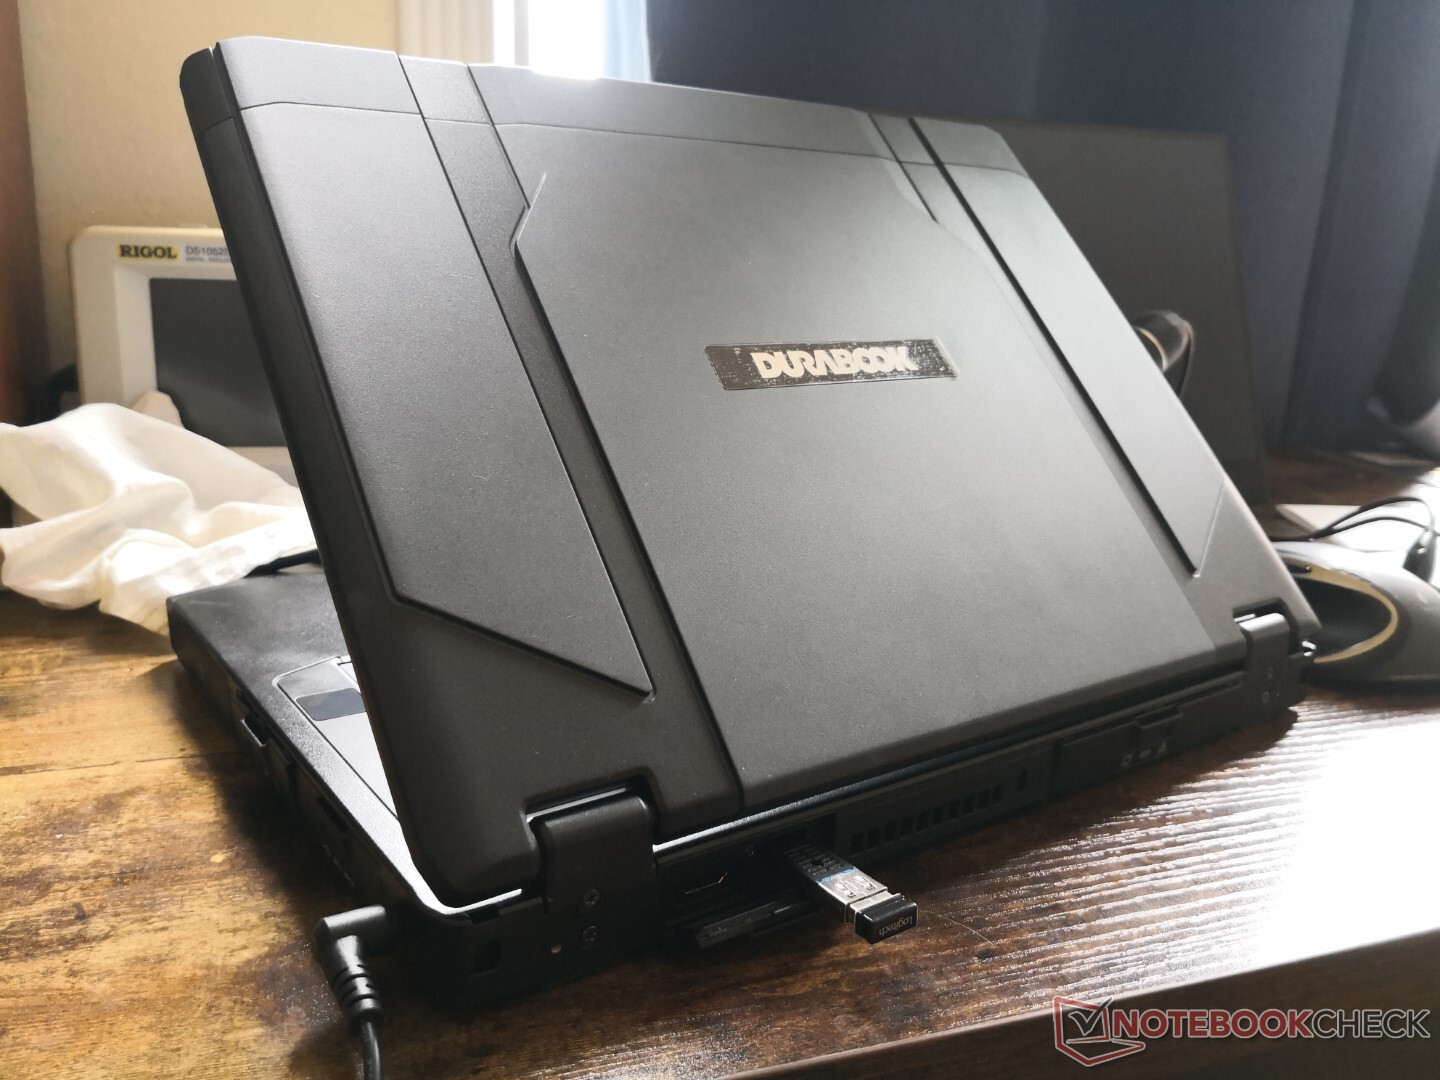
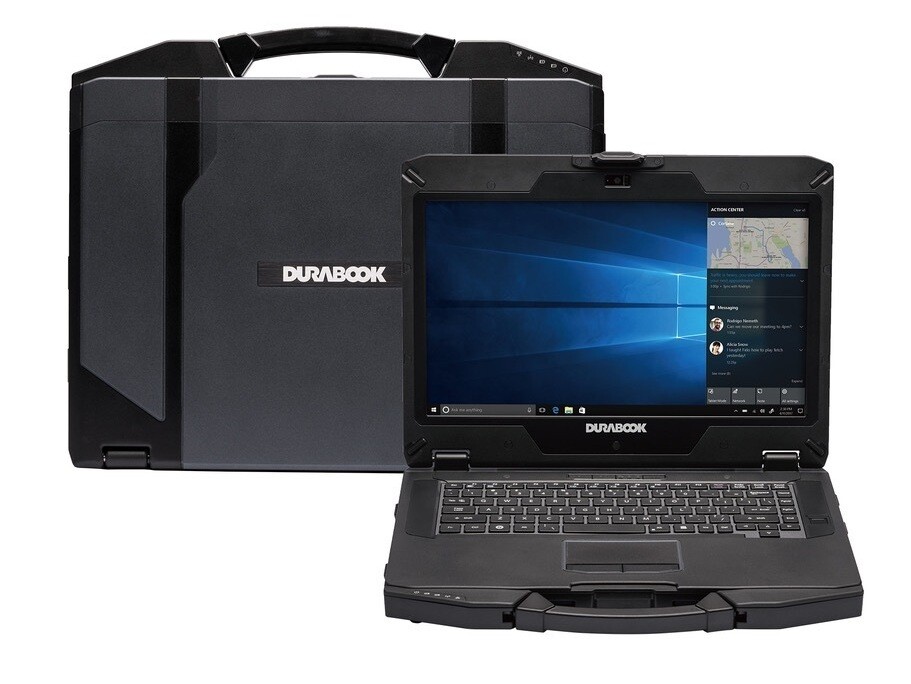
Recensione del portatile rinforzato Durabook S14I: Durevole dispositivo con Tiger Lake 11a generazione
Confronto con i potenziali concorrenti
Punteggio | Data | Modello | Peso | Altezza | Dimensione | Risoluzione | Prezzo |
|---|---|---|---|---|---|---|---|
v (old) | 04/2021 | Durabook S14I i7-1165G7, Iris Xe G7 96EUs | 3 kg | 38.1 mm | 14.00" | 1920x1080 | |
| 78.3 % v7 (old) | 04/2020 | Durabook S15ABG2 i5-8265U, UHD Graphics 620 | 2.6 kg | 30 mm | 15.60" | 1920x1080 | |
| 80.9 % v7 (old) | 09/2019 | Panasonic Toughbook FZ-55 i5-8365U, UHD Graphics 620 | 2.2 kg | 33 mm | 14.00" | 1920x1080 | |
| 84.3 % v6 (old) | 04/2019 | Dell Latitude 7424 Rugged Extreme i7-8650U, Radeon RX 540 | 3.5 kg | 59.3 mm | 14.00" | 1920x1080 | |
| 81.9 % v6 (old) | 10/2018 | Getac S410 i5-8550U, UHD Graphics 620 | 3.2 kg | 34.9 mm | 14.00" | 1366x768 | |
| 80.4 % v6 (old) | 10/2018 | Panasonic Toughbook CF-54G2999VM i5-7300U, HD Graphics 620 | 1.9 kg | 30.5 mm | 14.00" | 1366x768 |
| SD Card Reader | |
| average JPG Copy Test (av. of 3 runs) | |
| Dell Latitude 7424 Rugged Extreme (Toshiba Exceria Pro SDXC 64 GB UHS-II) | |
| Panasonic Toughbook CF-54G2999VM (Toshiba Exceria Pro SDXC 64 GB UHS-II) | |
| Getac S410 (Toshiba Exceria Pro SDXC 64 GB UHS-II) | |
| Panasonic Toughbook FZ-55 (Toshiba Exceria Pro M501 64 GB UHS-II) | |
| Durabook S15ABG2 (Toshiba Exceria Pro SDXC 64 GB UHS-II) | |
| Durabook S14I (Angelbird 128GB AV Pro UHS-II) | |
| maximum AS SSD Seq Read Test (1GB) | |
| Dell Latitude 7424 Rugged Extreme (Toshiba Exceria Pro SDXC 64 GB UHS-II) | |
| Panasonic Toughbook CF-54G2999VM (Toshiba Exceria Pro SDXC 64 GB UHS-II) | |
| Getac S410 (Toshiba Exceria Pro SDXC 64 GB UHS-II) | |
| Panasonic Toughbook FZ-55 (Toshiba Exceria Pro M501 64 GB UHS-II) | |
| Durabook S15ABG2 (Toshiba Exceria Pro SDXC 64 GB UHS-II) | |
| Durabook S14I (Angelbird 128GB AV Pro UHS-II) | |


| |||||||||||||||||||||||||
Distribuzione della luminosità: 89 %
Al centro con la batteria: 1180.7 cd/m²
Contrasto: 618:1 (Nero: 1.91 cd/m²)
ΔE ColorChecker Calman: 13.45 | ∀{0.5-29.43 Ø4.72}
calibrated: 3.19
ΔE Greyscale Calman: 15.4 | ∀{0.09-98 Ø4.97}
65.5% sRGB (Argyll 1.6.3 3D)
41.6% AdobeRGB 1998 (Argyll 1.6.3 3D)
45% AdobeRGB 1998 (Argyll 3D)
65.4% sRGB (Argyll 3D)
43.55% Display P3 (Argyll 3D)
Gamma: 1.97
CCT: 21134 K
| Durabook S14I KD140N0730A01, TN, 14", 1920x1080 | Durabook S15ABG2 Chi Mei N156HGE-EA2, TN LED, 15.6", 1920x1080 | Panasonic Toughbook FZ-55 InfoVision M140NWF5 R3, IPS, 14", 1920x1080 | Dell Latitude 7424 Rugged Extreme AU Optronics AUO523D, IPS, 14", 1920x1080 | Getac S410 CMN N140BGE-E33, TN PED, 14", 1366x768 | Panasonic Toughbook CF-54G2999VM B140XTN, AUO2E3C, TN LED, 14", 1366x768 | |
|---|---|---|---|---|---|---|
| Display | 18% | -13% | 49% | -7% | -14% | |
| Display P3 Coverage (%) | 43.55 | 51.4 18% | 38.09 -13% | 65.3 50% | 40.46 -7% | 37.36 -14% |
| sRGB Coverage (%) | 65.4 | 77.1 18% | 57 -13% | 96.9 48% | 60.9 -7% | 56.1 -14% |
| AdobeRGB 1998 Coverage (%) | 45 | 52.9 18% | 39.38 -12% | 67.3 50% | 41.8 -7% | 38.62 -14% |
| Response Times | -23% | -95% | -173% | -28% | -44% | |
| Response Time Grey 50% / Grey 80% * (ms) | 30.4 ? | 24.4 ? 20% | 42 ? -38% | 62.8 ? -107% | 41.2 ? -36% | 43.2 ? -42% |
| Response Time Black / White * (ms) | 11.8 ? | 19.6 ? -66% | 29.6 ? -151% | 40 ? -239% | 14 ? -19% | 17.2 ? -46% |
| PWM Frequency (Hz) | 304.9 ? | 301.2 ? | 694 ? | 763 | 877 ? | |
| Screen | -4% | 23% | 45% | -16% | -22% | |
| Brightness middle (cd/m²) | 1180.7 | 284.8 -76% | 1037 -12% | 844 -29% | 265.1 -78% | 174.5 -85% |
| Brightness (cd/m²) | 1102 | 267 -76% | 1015 -8% | 793 -28% | 246 -78% | 164 -85% |
| Brightness Distribution (%) | 89 | 86 -3% | 76 -15% | 88 -1% | 81 -9% | 71 -20% |
| Black Level * (cd/m²) | 1.91 | 0.7 63% | 0.6 69% | 0.54 72% | 0.58 70% | 0.6 69% |
| Contrast (:1) | 618 | 407 -34% | 1728 180% | 1563 153% | 457 -26% | 291 -53% |
| Colorchecker dE 2000 * | 13.45 | 11.48 15% | 5.71 58% | 4.8 64% | 14.24 -6% | 12.05 10% |
| Colorchecker dE 2000 max. * | 22.52 | 19.71 12% | 26.27 -17% | 11.88 47% | 26.66 -18% | 27.5 -22% |
| Colorchecker dE 2000 calibrated * | 3.19 | 3.06 4% | 4.52 -42% | 1.15 64% | 3.94 -24% | 4.34 -36% |
| Greyscale dE 2000 * | 15.4 | 13.2 14% | 5.5 64% | 7.6 51% | 14.2 8% | 14.8 4% |
| Gamma | 1.97 112% | 2.09 105% | 2.04 108% | 2.334 94% | 2.03 108% | 1.4 157% |
| CCT | 21134 31% | 14566 45% | 5783 112% | 6546 99% | 17152 38% | 14529 45% |
| Color Space (Percent of AdobeRGB 1998) (%) | 41.6 | 48.8 17% | 36.4 -13% | 62 49% | 38.7 -7% | 35.7 -14% |
| Color Space (Percent of sRGB) (%) | 65.5 | 76.8 17% | 57 -13% | 97 48% | 61 -7% | 56.2 -14% |
| Media totale (Programma / Settaggio) | -3% /
-2% | -28% /
2% | -26% /
18% | -17% /
-16% | -27% /
-24% |
* ... Meglio usare valori piccoli
Tempi di risposta del Display
| ↔ Tempi di risposta dal Nero al Bianco | ||
|---|---|---|
| 11.8 ms ... aumenta ↗ e diminuisce ↘ combinato | ↗ 8.2 ms Incremento | 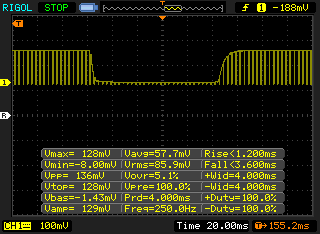 |
| ↘ 3.6 ms Calo | ||
| Lo schermo mostra buoni tempi di risposta durante i nostri tests, ma potrebbe essere troppo lento per i gamers competitivi. In confronto, tutti i dispositivi di test variano da 0.1 (minimo) a 240 (massimo) ms. » 32 % di tutti i dispositivi è migliore. Questo significa che i tempi di risposta rilevati sono migliori rispettto alla media di tutti i dispositivi testati (19.8 ms). | ||
| ↔ Tempo di risposta dal 50% Grigio all'80% Grigio | ||
| 30.4 ms ... aumenta ↗ e diminuisce ↘ combinato | ↗ 16.8 ms Incremento | 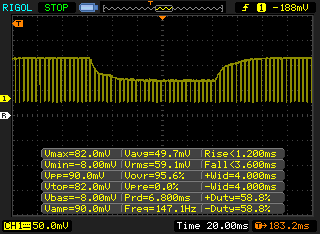 |
| ↘ 13.6 ms Calo | ||
| Lo schermo mostra tempi di risposta lenti nei nostri tests e sarà insoddisfacente per i gamers. In confronto, tutti i dispositivi di test variano da 0.165 (minimo) a 636 (massimo) ms. » 41 % di tutti i dispositivi è migliore. Questo significa che i tempi di risposta rilevati sono simili alla media di tutti i dispositivi testati (31 ms). | ||
Sfarfallio dello schermo / PWM (Pulse-Width Modulation)
| flickering dello schermo / PWM rilevato | 304.9 Hz | ≤ 100 % settaggio luminosita' | 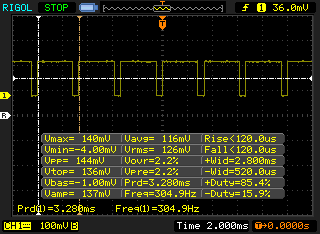 |
Il display sfarfalla a 304.9 Hz (Probabilmente a causa dell'uso di PWM) Flickering rilevato ad una luminosita' di 100 % o inferiore. Non dovrebbe verificarsi flickering o PWM sopra questo valore di luminosita'. La frequenza di 304.9 Hz è relativamente elevata, quindi la maggioranza degli utenti sensibili al PWM non dovrebbe notare alcun flickering. Tuttavia, è stato segnalato che alcuni utenti sono sensibili al PWM a 500 Hz ed oltre, quindi prestate attenzione. In confronto: 52 % di tutti i dispositivi testati non utilizza PWM per ridurre la luminosita' del display. Se è rilevato PWM, una media di 7763 (minimo: 5 - massimo: 343500) Hz è stata rilevata. | |||
Cinebench R15: CPU Multi 64Bit | CPU Single 64Bit
Blender: v2.79 BMW27 CPU
7-Zip 18.03: 7z b 4 -mmt1 | 7z b 4
Geekbench 5.5: Single-Core | Multi-Core
HWBOT x265 Benchmark v2.2: 4k Preset
LibreOffice : 20 Documents To PDF
R Benchmark 2.5: Overall mean
| Geekbench 5.5 / Single-Core | |
| Media Intel Core i7-1165G7 (1302 - 1595, n=77) | |
| Lenovo Yoga 9 14 ITL 4K | |
| Durabook S14I | |
| Lenovo ThinkBook 14 G2 ITL 20VD008WGE | |
| Acer Spin 3 SP314-54N-56S5 | |
| Lenovo Yoga Slim 7 14ARE05 82A20008GE | |
| Lenovo ThinkPad L14-20U50003GE | |
| Acer Swift 3 SF314-42-R27B | |
| Geekbench 5.5 / Multi-Core | |
| Lenovo Yoga Slim 7 14ARE05 82A20008GE | |
| Lenovo Yoga 9 14 ITL 4K | |
| Media Intel Core i7-1165G7 (3078 - 5926, n=77) | |
| Lenovo ThinkBook 14 G2 ITL 20VD008WGE | |
| Lenovo ThinkPad L14-20U50003GE | |
| Durabook S14I | |
| Acer Spin 3 SP314-54N-56S5 | |
| Acer Swift 3 SF314-42-R27B | |
| LibreOffice / 20 Documents To PDF | |
| Lenovo Yoga Slim 7 14ARE05 82A20008GE | |
| Acer Swift 3 SF314-42-R27B | |
| Lenovo ThinkPad L14-20U50003GE | |
| Acer Spin 3 SP314-54N-56S5 | |
| Lenovo ThinkBook 14 G2 ITL 20VD008WGE | |
| Lenovo Yoga 9 14 ITL 4K | |
| Media Intel Core i7-1165G7 (21.5 - 88.1, n=78) | |
| Durabook S14I | |
| R Benchmark 2.5 / Overall mean | |
| Acer Spin 3 SP314-54N-56S5 | |
| Acer Swift 3 SF314-42-R27B | |
| Lenovo ThinkPad L14-20U50003GE | |
| Lenovo ThinkBook 14 G2 ITL 20VD008WGE | |
| Lenovo Yoga Slim 7 14ARE05 82A20008GE | |
| Durabook S14I | |
| Media Intel Core i7-1165G7 (0.552 - 1.002, n=80) | |
| Lenovo Yoga 9 14 ITL 4K | |
* ... Meglio usare valori piccoli
| PCMark 10 Score | 4826 punti | |
Aiuto | ||
| DPC Latencies / LatencyMon - interrupt to process latency (max), Web, Youtube, Prime95 | |
| Durabook S14I | |
| Durabook S15ABG2 | |
* ... Meglio usare valori piccoli
| Durabook S14I UDinfo M2P M2P80DE512GBAEP | Durabook S15ABG2 UDinfo HF3-25UB HF325UB256GBA2P | Panasonic Toughbook FZ-55 Samsung SSD PM871b MZNLN256HAJQ | Dell Latitude 7424 Rugged Extreme SK Hynix PC401 512GB M.2 (HFS512GD9TNG) | Getac S410 CUKUSA 1 TB SATA SSD Q0526A | |
|---|---|---|---|---|---|
| AS SSD | -79% | -49% | -2% | -22% | |
| Seq Read (MB/s) | 2184 | 424.7 -81% | 437.7 -80% | 2096 -4% | 484.2 -78% |
| Seq Write (MB/s) | 1441 | 290.4 -80% | 387.3 -73% | 1016 -29% | 396.1 -73% |
| 4K Read (MB/s) | 35.98 | 35.07 -3% | 26.18 -27% | 39.91 11% | 34.9 -3% |
| 4K Write (MB/s) | 260.1 | 46.69 -82% | 60.3 -77% | 97.9 -62% | 74.1 -72% |
| 4K-64 Read (MB/s) | 396.5 | 291.8 -26% | 369.8 -7% | 636 60% | 382.3 -4% |
| 4K-64 Write (MB/s) | 1057 | 297.8 -72% | 313.7 -70% | 604 -43% | 329 -69% |
| Access Time Read * (ms) | 0.051 | 0.192 -276% | 0.089 -75% | 0.044 14% | 0.058 -14% |
| Access Time Write * (ms) | 0.106 | 0.189 -78% | 0.058 45% | 0.051 52% | 0.045 58% |
| Score Read (Points) | 651 | 369 -43% | 440 -32% | 886 36% | 466 -28% |
| Score Write (Points) | 1461 | 374 -74% | 413 -72% | 804 -45% | 443 -70% |
| Score Total (Points) | 2418 | 938 -61% | 1083 -55% | 2099 -13% | 1154 -52% |
| Copy ISO MB/s (MB/s) | 1538 | 371.3 -76% | 553 -64% | 2151 40% | |
| Copy Program MB/s (MB/s) | 570 | 151.3 -73% | 204.7 -64% | 422.8 -26% | |
| Copy Game MB/s (MB/s) | 566 | 134.7 -76% | 385.9 -32% | 1045 85% | |
| CrystalDiskMark 5.2 / 6 | -71% | -68% | -24% | -67% | |
| Write 4K (MB/s) | 260.4 | 63.5 -76% | 55.4 -79% | 114.4 -56% | 74 -72% |
| Read 4K (MB/s) | 53 | 26.67 -50% | 31.11 -41% | 43.86 -17% | 31.85 -40% |
| Write Seq (MB/s) | 1665 | 258.8 -84% | 460.9 -72% | 1281 -23% | 460.6 -72% |
| Read Seq (MB/s) | 1541 | 392.4 -75% | 481.9 -69% | 1918 24% | 514 -67% |
| Write 4K Q32T1 (MB/s) | 638 | 249.4 -61% | 234.6 -63% | 422.5 -34% | 211.4 -67% |
| Read 4K Q32T1 (MB/s) | 683 | 259.2 -62% | 181.7 -73% | 260.6 -62% | 203.5 -70% |
| Write Seq Q32T1 (MB/s) | 1656 | 311.9 -81% | 528 -68% | 1282 -23% | 523 -68% |
| Read Seq Q32T1 (MB/s) | 2490 | 459 -82% | 548 -78% | 2515 1% | 554 -78% |
| Media totale (Programma / Settaggio) | -75% /
-76% | -59% /
-56% | -13% /
-11% | -45% /
-38% |
* ... Meglio usare valori piccoli

Disk Throttling: DiskSpd Read Loop, Queue Depth 8
| 3DMark 11 Performance | 5041 punti | |
| 3DMark Cloud Gate Standard Score | 13221 punti | |
| 3DMark Fire Strike Score | 2823 punti | |
| 3DMark Time Spy Score | 1137 punti | |
Aiuto | ||
| basso | medio | alto | ultra | |
|---|---|---|---|---|
| Dota 2 Reborn (2015) | 75.4 | 60 | 36.8 | 32.8 |
| Final Fantasy XV Benchmark (2018) | 23.8 | 13.4 | 9.86 | |
| X-Plane 11.11 (2018) | 37.4 | 28.8 | 26.2 |
| Durabook S14I Iris Xe G7 96EUs, i7-1165G7, UDinfo M2P M2P80DE512GBAEP | Durabook S15ABG2 UHD Graphics 620, i5-8265U, UDinfo HF3-25UB HF325UB256GBA2P | Panasonic Toughbook FZ-55 UHD Graphics 620, i5-8365U, Samsung SSD PM871b MZNLN256HAJQ | Dell Latitude 7424 Rugged Extreme Radeon RX 540, i7-8650U, SK Hynix PC401 512GB M.2 (HFS512GD9TNG) | Getac S410 UHD Graphics 620, i5-8550U, CUKUSA 1 TB SATA SSD Q0526A | Panasonic Toughbook CF-54G2999VM HD Graphics 620, i5-7300U, Seagate BarraCuda Compute 1TB ST1000LM048 | |
|---|---|---|---|---|---|---|
| Noise | -7% | -5% | -4% | -0% | -4% | |
| off /ambiente * (dB) | 25.2 | 29.3 -16% | 29 -15% | 28.6 -13% | 28.4 -13% | 28.3 -12% |
| Idle Minimum * (dB) | 25.2 | 29.3 -16% | 29 -15% | 28.6 -13% | 28.4 -13% | 28.8 -14% |
| Idle Average * (dB) | 25.2 | 29.3 -16% | 29.6 -17% | 28.6 -13% | 28.4 -13% | 28.8 -14% |
| Idle Maximum * (dB) | 34.5 | 29.3 15% | 30.5 12% | 28.6 17% | 28.4 18% | 29.1 16% |
| Load Average * (dB) | 34.5 | 35.5 -3% | 30.3 12% | 32.9 5% | 30.3 12% | 31.3 9% |
| Load Maximum * (dB) | 36.2 | 38 -5% | 39 -8% | 39 -8% | 33.3 8% | 40 -10% |
* ... Meglio usare valori piccoli
Rumorosità
| Idle |
| 25.2 / 25.2 / 34.5 dB(A) |
| Sotto carico |
| 34.5 / 36.2 dB(A) |
 | ||
30 dB silenzioso 40 dB(A) udibile 50 dB(A) rumoroso |
||
min: | ||
(+) La temperatura massima sul lato superiore è di 36.4 °C / 98 F, rispetto alla media di 34.3 °C / 94 F, che varia da 21.2 a 62.5 °C per questa classe Office.
(+) Il lato inferiore si riscalda fino ad un massimo di 38.6 °C / 101 F, rispetto alla media di 36.8 °C / 98 F
(+) In idle, la temperatura media del lato superiore è di 30.1 °C / 86 F, rispetto alla media deld ispositivo di 29.5 °C / 85 F.
(+) I poggiapolsi e il touchpad sono piu' freddi della temperatura della pelle con un massimo di 29.6 °C / 85.3 F e sono quindi freddi al tatto.
(-) La temperatura media della zona del palmo della mano di dispositivi simili e'stata di 27.5 °C / 81.5 F (-2.1 °C / -3.8 F).
Durabook S14I analisi audio
(+) | gli altoparlanti sono relativamente potenti (82.9 dB)
Bassi 100 - 315 Hz
(-) | quasi nessun basso - in media 37.9% inferiori alla media
(±) | la linearità dei bassi è media (12% delta rispetto alla precedente frequenza)
Medi 400 - 2000 Hz
(±) | medi ridotti - circa 11.4% inferiori alla media
(±) | linearità dei medi adeguata (11.8% delta rispetto alla precedente frequenza)
Alti 2 - 16 kHz
(±) | alti elevati - circa 6.2% superiori alla media
(+) | alti lineari (6.2% delta rispetto alla precedente frequenza)
Nel complesso 100 - 16.000 Hz
(-) | suono nel complesso non lineare (31.3% di differenza rispetto alla media
Rispetto alla stessa classe
» 93% di tutti i dispositivi testati in questa classe è stato migliore, 2% simile, 5% peggiore
» Il migliore ha avuto un delta di 7%, medio di 21%, peggiore di 53%
Rispetto a tutti i dispositivi testati
» 90% di tutti i dispositivi testati in questa classe è stato migliore, 2% similare, 8% peggiore
» Il migliore ha avuto un delta di 4%, medio di 24%, peggiore di 134%
Apple MacBook 12 (Early 2016) 1.1 GHz analisi audio
(+) | gli altoparlanti sono relativamente potenti (83.6 dB)
Bassi 100 - 315 Hz
(±) | bassi ridotti - in media 11.3% inferiori alla media
(±) | la linearità dei bassi è media (14.2% delta rispetto alla precedente frequenza)
Medi 400 - 2000 Hz
(+) | medi bilanciati - solo only 2.4% rispetto alla media
(+) | medi lineari (5.5% delta rispetto alla precedente frequenza)
Alti 2 - 16 kHz
(+) | Alti bilanciati - appena 2% dalla media
(+) | alti lineari (4.5% delta rispetto alla precedente frequenza)
Nel complesso 100 - 16.000 Hz
(+) | suono nel complesso lineare (10.2% differenza dalla media)
Rispetto alla stessa classe
» 7% di tutti i dispositivi testati in questa classe è stato migliore, 2% simile, 91% peggiore
» Il migliore ha avuto un delta di 5%, medio di 18%, peggiore di 53%
Rispetto a tutti i dispositivi testati
» 5% di tutti i dispositivi testati in questa classe è stato migliore, 1% similare, 94% peggiore
» Il migliore ha avuto un delta di 4%, medio di 24%, peggiore di 134%
| Off / Standby | |
| Idle | |
| Sotto carico |
|
Leggenda:
min: | |
| Durabook S14I i7-1165G7, Iris Xe G7 96EUs, UDinfo M2P M2P80DE512GBAEP, TN, 1920x1080, 14" | Durabook S15ABG2 i5-8265U, UHD Graphics 620, UDinfo HF3-25UB HF325UB256GBA2P, TN LED, 1920x1080, 15.6" | Panasonic Toughbook FZ-55 i5-8365U, UHD Graphics 620, Samsung SSD PM871b MZNLN256HAJQ, IPS, 1920x1080, 14" | Dell Latitude 7424 Rugged Extreme i7-8650U, Radeon RX 540, SK Hynix PC401 512GB M.2 (HFS512GD9TNG), IPS, 1920x1080, 14" | Getac S410 i5-8550U, UHD Graphics 620, CUKUSA 1 TB SATA SSD Q0526A, TN PED, 1366x768, 14" | Panasonic Toughbook CF-54G2999VM i5-7300U, HD Graphics 620, Seagate BarraCuda Compute 1TB ST1000LM048, TN LED, 1366x768, 14" | |
|---|---|---|---|---|---|---|
| Power Consumption | 33% | 25% | -19% | 38% | 43% | |
| Idle Minimum * (Watt) | 6.8 | 3.5 49% | 3.7 46% | 6.5 4% | 5.6 18% | 4.4 35% |
| Idle Average * (Watt) | 16.4 | 7.9 52% | 9.6 41% | 15.1 8% | 7.9 52% | 6.3 62% |
| Idle Maximum * (Watt) | 16.9 | 9 47% | 10.4 38% | 16.1 5% | 8.4 50% | 6.5 62% |
| Load Average * (Watt) | 39.2 | 39.8 -2% | 40 -2% | 70.5 -80% | 32.8 16% | 36.3 7% |
| Load Maximum * (Watt) | 73.1 | 59.8 18% | 71.9 2% | 95.2 -30% | 34.3 53% | 38.3 48% |
| Witcher 3 ultra * (Watt) | 68.1 |
* ... Meglio usare valori piccoli
| Durabook S14I i7-1165G7, Iris Xe G7 96EUs, 50 Wh | Durabook S15ABG2 i5-8265U, UHD Graphics 620, 56 Wh | Panasonic Toughbook FZ-55 i5-8365U, UHD Graphics 620, 71 Wh | Dell Latitude 7424 Rugged Extreme i7-8650U, Radeon RX 540, 102 Wh | Getac S410 i5-8550U, UHD Graphics 620, 46.6 Wh | Panasonic Toughbook CF-54G2999VM i5-7300U, HD Graphics 620, 33 Wh | |
|---|---|---|---|---|---|---|
| Autonomia della batteria | 25% | 235% | 113% | -5% | 7% | |
| WiFi v1.3 (h) | 5.5 | 6.9 25% | 18.4 235% | 11.7 113% | 5.2 -5% | 5.9 7% |
| Load (h) | 2.7 |
Pro
Contro
I portatili rugged sono di solito dietro gli ultimi Ultrabook in termini di prestazioni e caratteristiche, ma il Durabook S14I punta sulla velocità con lussi come Wi-Fi 6, USB-C, NVMe, e le elevate prestazioni per watt dell'Intel Tiger Lake. Se sapete di poter sfruttare queste caratteristiche, allora l'S14I dovrebbe essere un buon acquisto rispetto ad altri modelli rugged da 14".
Un PC ricco di funzionalità che non ha paura di essere più pesante pur di essere robusto e resistente.
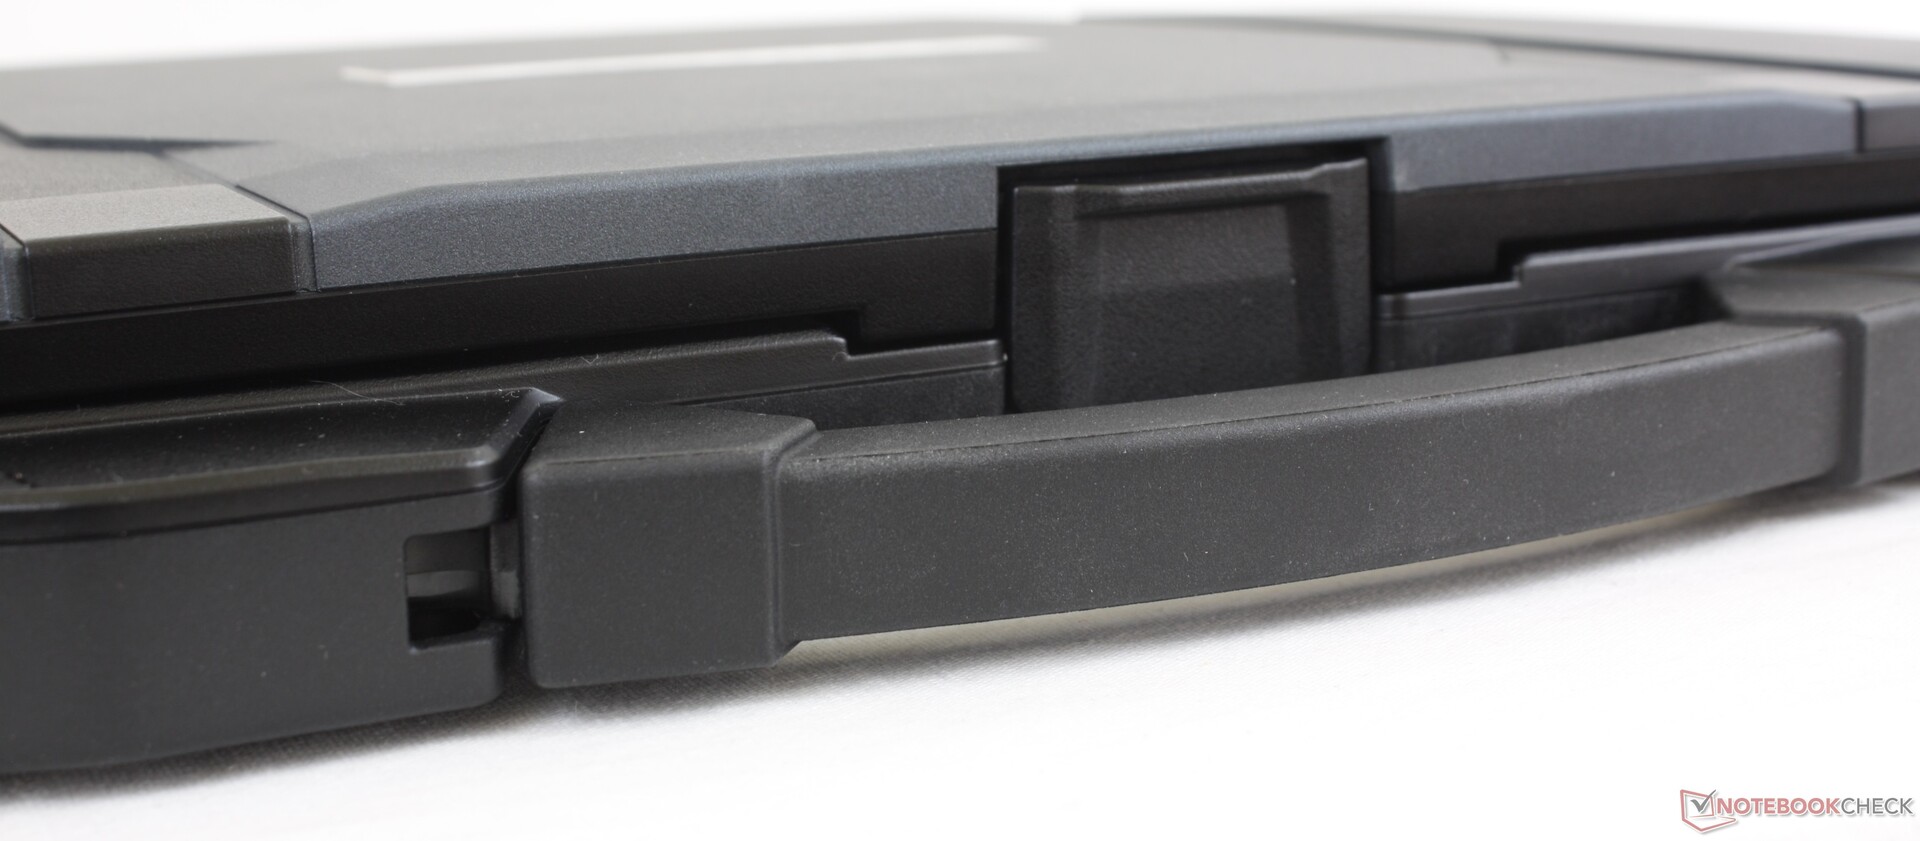
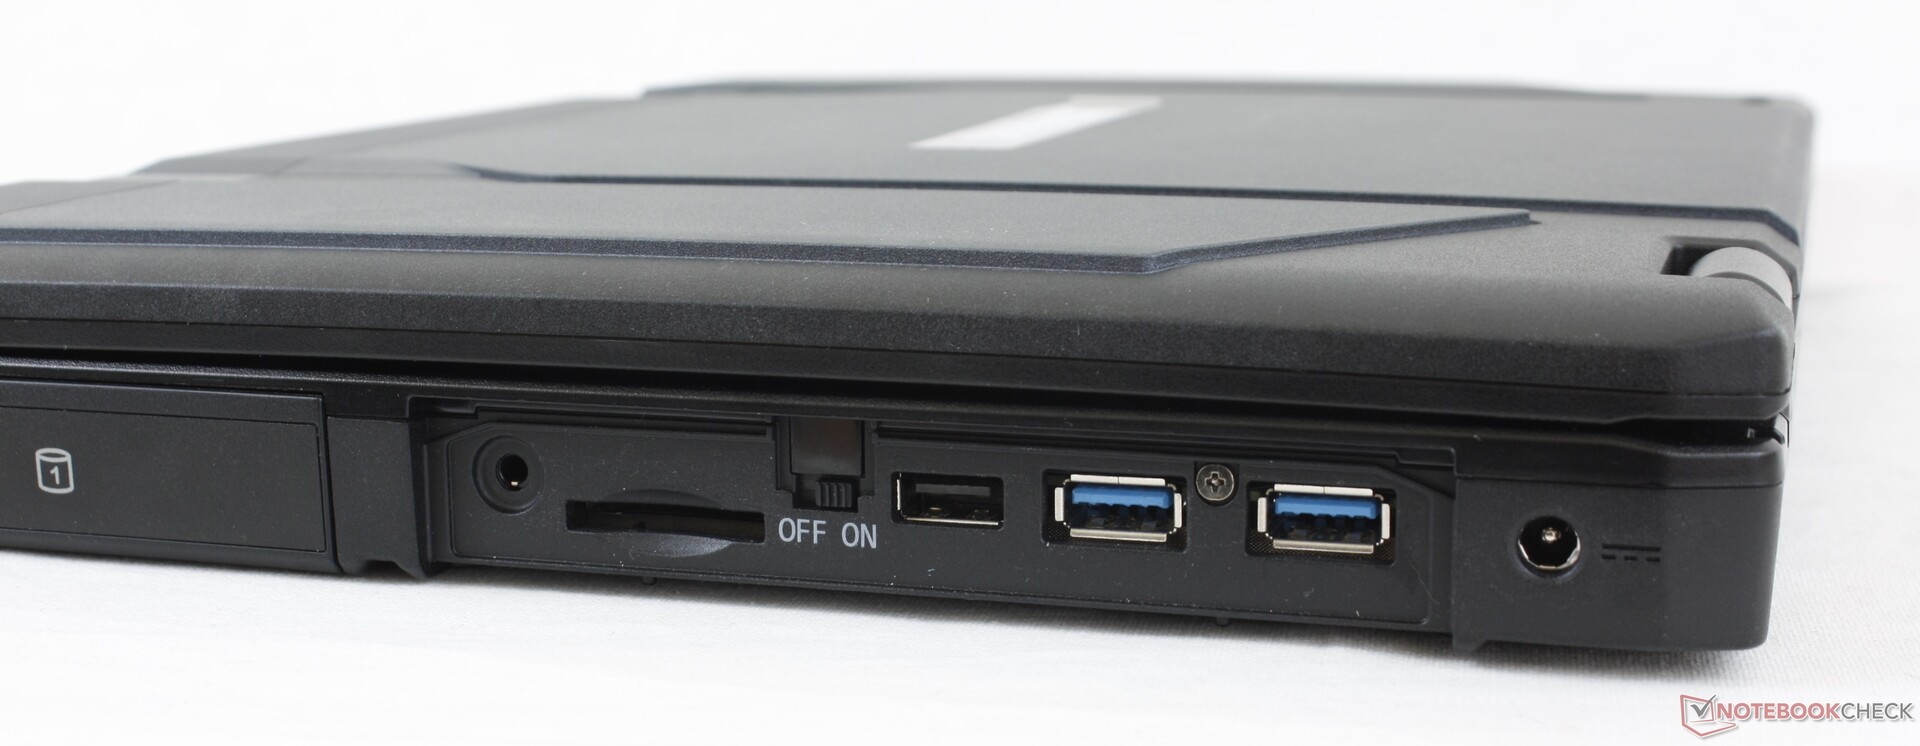
Ci sono alcuni cambiamenti che ci piacerebbe vedere nelle future versioni. Per esempio, il PWM dovrebbe essere eliminato per ridurre il fastidio agli occhi di coloro che possono essere sensibili al flickering. Il touchpad è troppo piccolo e macchinoso e le coperture delle porte non si aprono molto facilmente. Il lettore di schede SD è lento e un display IPS farebbe molto per migliorare la qualità dell'immagine e aumentare il contrasto all'aperto.
Price comparison
