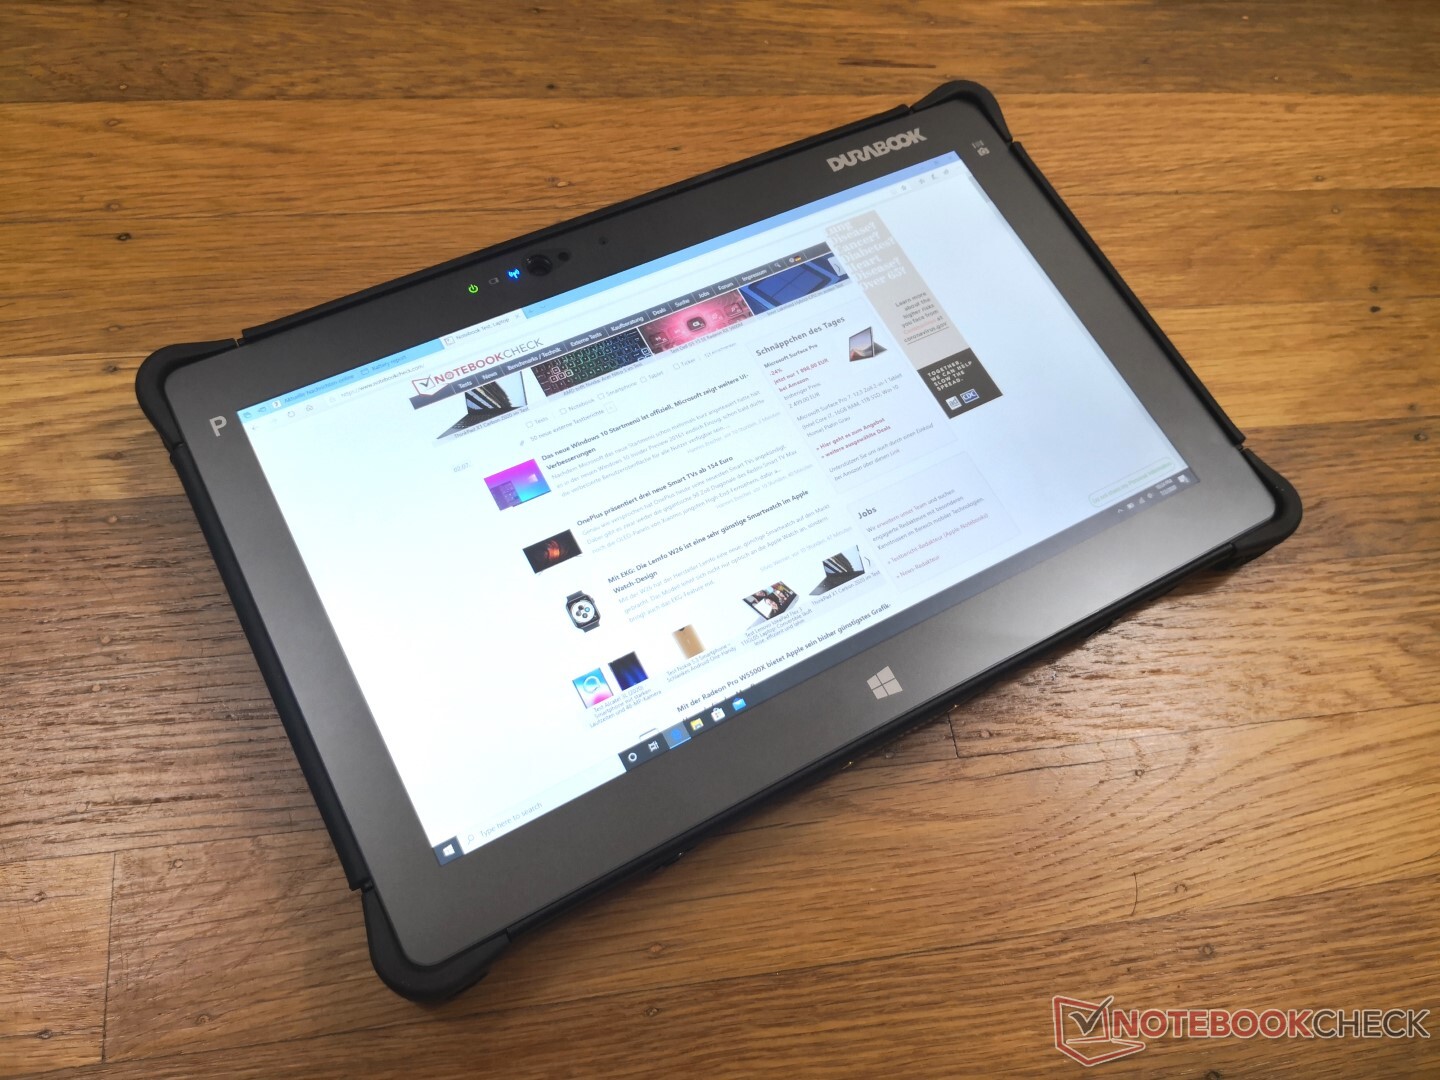
Recensione del Tabet Rinforzato Durabook R11: un tipo tosto
Punteggio | Data | Modello | Peso | Altezza | Dimensione | Risoluzione | Prezzo |
|---|---|---|---|---|---|---|---|
v (old) | 07/2020 | Durabook R11 i5-8250U, UHD Graphics 620 | 1.2 kg | 20 mm | 11.60" | 1920x1080 | |
| 84.3 % v6 (old) | 04/2019 | Dell Latitude 7424 Rugged Extreme i7-8650U, Radeon RX 540 | 3.5 kg | 59.3 mm | 14.00" | 1920x1080 | |
| 89.2 % v6 (old) | 03/2019 | Dell Latitude 5420 Rugged-P85G i7-8650U, Radeon RX 540 | 2.8 kg | 32.9 mm | 14.00" | 1920x1080 | |
| 77.3 % v6 (old) | 08/2018 | Fujitsu Stylistic Q738 i5-8350U, UHD Graphics 620 | 1.4 kg | 18 mm | 13.30" | 1920x1080 | |
| 89.1 % v7 (old) | 10/2019 | Dell Latitude 7200 i5-8365U, UHD Graphics 620 | 1.2 kg | 9.35 mm | 12.30" | 1920x1280 |
| SD Card Reader | |
| average JPG Copy Test (av. of 3 runs) | |
| Dell Latitude 5420 Rugged-P85G (Toshiba Exceria Pro SDXC 64 GB UHS-II) | |
| Dell Latitude 7200 (Toshiba Exceria Pro M501 64 GB UHS-II) | |
| Dell Latitude 7424 Rugged Extreme (Toshiba Exceria Pro SDXC 64 GB UHS-II) | |
| Fujitsu Stylistic Q738 (Toshiba Exceria Pro M501 microSDXC 64GB) | |
| Durabook R11 (Toshiba Exceria Pro M501 microSDXC 64GB) | |
| maximum AS SSD Seq Read Test (1GB) | |
| Dell Latitude 5420 Rugged-P85G (Toshiba Exceria Pro SDXC 64 GB UHS-II) | |
| Dell Latitude 7424 Rugged Extreme (Toshiba Exceria Pro SDXC 64 GB UHS-II) | |
| Dell Latitude 7200 (Toshiba Exceria Pro M501 64 GB UHS-II) | |
| Fujitsu Stylistic Q738 (Toshiba Exceria Pro M501 microSDXC 64GB) | |
| Durabook R11 (Toshiba Exceria Pro M501 microSDXC 64GB) | |
| Networking | |
| iperf3 transmit AX12 | |
| HP Envy x360 13-ay0010nr | |
| Microsoft Surface Book 3 15 | |
| Acer Swift 3 SF314-42-R27B | |
| Durabook R11 | |
| iperf3 receive AX12 | |
| HP Envy x360 13-ay0010nr | |
| Acer Swift 3 SF314-42-R27B | |
| Microsoft Surface Book 3 15 | |
| Durabook R11 | |


| |||||||||||||||||||||||||
Distribuzione della luminosità: 79 %
Al centro con la batteria: 584.2 cd/m²
Contrasto: 1123:1 (Nero: 0.52 cd/m²)
ΔE ColorChecker Calman: 9.29 | ∀{0.5-29.43 Ø4.72}
calibrated: 4.72
ΔE Greyscale Calman: 10.6 | ∀{0.09-98 Ø4.97}
82.2% sRGB (Argyll 1.6.3 3D)
53.4% AdobeRGB 1998 (Argyll 1.6.3 3D)
60% AdobeRGB 1998 (Argyll 3D)
82.9% sRGB (Argyll 3D)
59.3% Display P3 (Argyll 3D)
Gamma: 2.41
CCT: 6230 K
| Durabook R11 BOE5F9, IPS, 11.6", 1920x1080 | Dell Latitude 7424 Rugged Extreme AU Optronics AUO523D, IPS, 14", 1920x1080 | Dell Latitude 5420 Rugged-P85G AU Optronics AUO523D, IPS, 14", 1920x1080 | Fujitsu Stylistic Q738 Sharp SHP149B, IPS, 13.3", 1920x1080 | Dell Latitude 7200 SHP14A3 LQ123N1, IPS LED, 12.3", 1920x1280 | |
|---|---|---|---|---|---|
| Display | 13% | 8% | 16% | 21% | |
| Display P3 Coverage (%) | 59.3 | 65.3 10% | 62.5 5% | 67.8 14% | 71.6 21% |
| sRGB Coverage (%) | 82.9 | 96.9 17% | 92.4 11% | 96.6 17% | 99.5 20% |
| AdobeRGB 1998 Coverage (%) | 60 | 67.3 12% | 64.2 7% | 69.4 16% | 72.6 21% |
| Response Times | -130% | -123% | -28% | -95% | |
| Response Time Grey 50% / Grey 80% * (ms) | 26 ? | 62.8 ? -142% | 68 ? -162% | 35 ? -35% | 52 ? -100% |
| Response Time Black / White * (ms) | 18.4 ? | 40 ? -117% | 33.6 ? -83% | 22 ? -20% | 34.8 ? -89% |
| PWM Frequency (Hz) | 198.4 ? | 763 | 735 ? | 208 ? | 1645 ? |
| Screen | 31% | 32% | 14% | 35% | |
| Brightness middle (cd/m²) | 584.2 | 844 44% | 1111.7 90% | 292 -50% | 401 -31% |
| Brightness (cd/m²) | 560 | 793 42% | 1026 83% | 277 -51% | 385 -31% |
| Brightness Distribution (%) | 79 | 88 11% | 80 1% | 90 14% | 88 11% |
| Black Level * (cd/m²) | 0.52 | 0.54 -4% | 0.81 -56% | 0.32 38% | 0.28 46% |
| Contrast (:1) | 1123 | 1563 39% | 1372 22% | 913 -19% | 1432 28% |
| Colorchecker dE 2000 * | 9.29 | 4.8 48% | 3.83 59% | 3.69 60% | 1.8 81% |
| Colorchecker dE 2000 max. * | 14.43 | 11.88 18% | 7.85 46% | 6.9 52% | 3.4 76% |
| Colorchecker dE 2000 calibrated * | 4.72 | 1.15 76% | 2.98 37% | 1.1 77% | |
| Greyscale dE 2000 * | 10.6 | 7.6 28% | 5.6 47% | 4.11 61% | 1.6 85% |
| Gamma | 2.41 91% | 2.334 94% | 2.306 95% | 2.3 96% | 2.14 103% |
| CCT | 6230 104% | 6546 99% | 7676 85% | 7140 91% | 6702 97% |
| Color Space (Percent of AdobeRGB 1998) (%) | 53.4 | 62 16% | 59 10% | 63 18% | 66.6 25% |
| Color Space (Percent of sRGB) (%) | 82.2 | 97 18% | 93 13% | 97 18% | 99.4 21% |
| Media totale (Programma / Settaggio) | -29% /
7% | -28% /
8% | 1% /
9% | -13% /
16% |
* ... Meglio usare valori piccoli
Tempi di risposta del Display
| ↔ Tempi di risposta dal Nero al Bianco | ||
|---|---|---|
| 18.4 ms ... aumenta ↗ e diminuisce ↘ combinato | ↗ 10 ms Incremento | 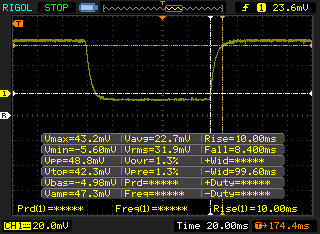 |
| ↘ 8.4 ms Calo | ||
| Lo schermo mostra buoni tempi di risposta durante i nostri tests, ma potrebbe essere troppo lento per i gamers competitivi. In confronto, tutti i dispositivi di test variano da 0.1 (minimo) a 240 (massimo) ms. » 41 % di tutti i dispositivi è migliore. Questo significa che i tempi di risposta rilevati sono simili alla media di tutti i dispositivi testati (19.8 ms). | ||
| ↔ Tempo di risposta dal 50% Grigio all'80% Grigio | ||
| 26 ms ... aumenta ↗ e diminuisce ↘ combinato | ↗ 14 ms Incremento | 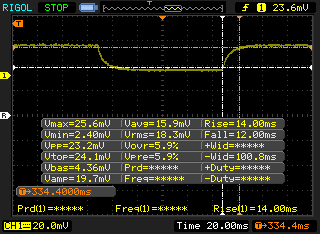 |
| ↘ 12 ms Calo | ||
| Lo schermo mostra tempi di risposta relativamente lenti nei nostri tests e potrebbe essere troppo lento per i gamers. In confronto, tutti i dispositivi di test variano da 0.165 (minimo) a 636 (massimo) ms. » 36 % di tutti i dispositivi è migliore. Questo significa che i tempi di risposta rilevati sono migliori rispettto alla media di tutti i dispositivi testati (31 ms). | ||
Sfarfallio dello schermo / PWM (Pulse-Width Modulation)
| flickering dello schermo / PWM rilevato | 198.4 Hz | ≤ 99 % settaggio luminosita' | 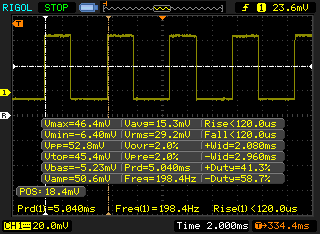 |
Il display sfarfalla a 198.4 Hz (Probabilmente a causa dell'uso di PWM) Flickering rilevato ad una luminosita' di 99 % o inferiore. Non dovrebbe verificarsi flickering o PWM sopra questo valore di luminosita'. La frequenza di 198.4 Hz è relativamente bassa, quindi gli utenti sensibili potrebbero notare il flickering ed accusare stanchezza agli occhi a questo livello di luminosità e a livelli inferiori. In confronto: 52 % di tutti i dispositivi testati non utilizza PWM per ridurre la luminosita' del display. Se è rilevato PWM, una media di 7772 (minimo: 5 - massimo: 343500) Hz è stata rilevata. | |||

Cinebench R15: CPU Multi 64Bit | CPU Single 64Bit
Blender: v2.79 BMW27 CPU
7-Zip 18.03: 7z b 4 -mmt1 | 7z b 4
Geekbench 5.5: Single-Core | Multi-Core
HWBOT x265 Benchmark v2.2: 4k Preset
LibreOffice : 20 Documents To PDF
R Benchmark 2.5: Overall mean
| Cinebench R20 / CPU (Multi Core) | |
| Dell XPS 13 9300 i5 FHD | |
| Lenovo ThinkPad X1 Carbon 2020-20UAS04T00 | |
| Huawei MateBook 13 2020 AMD | |
| Media Intel Core i5-8250U (846 - 1325, n=5) | |
| Dynabook Portege A30-E-174 | |
| Dynabook Portege X30L-G1331 | |
| Lenovo ThinkPad P43s-20RH001FGE | |
| Durabook S15ABG2 | |
| HP Pavilion 15-cw1212ng | |
| Durabook R11 | |
| Apple MacBook Air 2020 i3 | |
| Lenovo IdeaPad Flex 3 11IGL05 | |
| Teclast Tbook 16 Power | |
| Cinebench R20 / CPU (Single Core) | |
| Lenovo ThinkPad X1 Carbon 2020-20UAS04T00 | |
| Dell XPS 13 9300 i5 FHD | |
| Dynabook Portege X30L-G1331 | |
| Durabook S15ABG2 | |
| Dynabook Portege A30-E-174 | |
| Lenovo ThinkPad P43s-20RH001FGE | |
| Huawei MateBook 13 2020 AMD | |
| Media Intel Core i5-8250U (332 - 355, n=5) | |
| Apple MacBook Air 2020 i3 | |
| HP Pavilion 15-cw1212ng | |
| Durabook R11 | |
| Lenovo IdeaPad Flex 3 11IGL05 | |
| Teclast Tbook 16 Power | |
| Blender / v2.79 BMW27 CPU | |
| Teclast Tbook 16 Power | |
| Lenovo IdeaPad Flex 3 11IGL05 | |
| Apple MacBook Air 2020 i3 | |
| HP Pavilion 15-cw1212ng | |
| Durabook R11 | |
| Durabook S15ABG2 | |
| Media Intel Core i5-8250U (813 - 1209, n=8) | |
| Dynabook Portege X30L-G1331 | |
| Huawei MateBook 13 2020 AMD | |
| Lenovo ThinkPad X1 Carbon 2020-20UAS04T00 | |
| Dell XPS 13 9300 i5 FHD | |
| Lenovo ThinkPad P43s-20RH001FGE | |
| 7-Zip 18.03 / 7z b 4 -mmt1 | |
| Lenovo ThinkPad P43s-20RH001FGE | |
| Lenovo ThinkPad X1 Carbon 2020-20UAS04T00 | |
| Dynabook Portege X30L-G1331 | |
| Durabook S15ABG2 | |
| Dell XPS 13 9300 i5 FHD | |
| Media Intel Core i5-8250U (3641 - 3925, n=6) | |
| Durabook R11 | |
| Huawei MateBook 13 2020 AMD | |
| Apple MacBook Air 2020 i3 | |
| HP Pavilion 15-cw1212ng | |
| Lenovo IdeaPad Flex 3 11IGL05 | |
| 7-Zip 18.03 / 7z b 4 | |
| Lenovo ThinkPad P43s-20RH001FGE | |
| Dell XPS 13 9300 i5 FHD | |
| Lenovo ThinkPad X1 Carbon 2020-20UAS04T00 | |
| Huawei MateBook 13 2020 AMD | |
| Dynabook Portege X30L-G1331 | |
| Media Intel Core i5-8250U (11546 - 17405, n=6) | |
| Durabook S15ABG2 | |
| HP Pavilion 15-cw1212ng | |
| Durabook R11 | |
| Apple MacBook Air 2020 i3 | |
| Lenovo IdeaPad Flex 3 11IGL05 | |
| HWBOT x265 Benchmark v2.2 / 4k Preset | |
| Lenovo ThinkPad P43s-20RH001FGE | |
| Lenovo ThinkPad X1 Carbon 2020-20UAS04T00 | |
| Dell XPS 13 9300 i5 FHD | |
| Media Intel Core i5-8250U (3.02 - 4.78, n=8) | |
| Dynabook Portege X30L-G1331 | |
| Durabook S15ABG2 | |
| Huawei MateBook 13 2020 AMD | |
| Durabook R11 | |
| HP Pavilion 15-cw1212ng | |
| Apple MacBook Air 2020 i3 | |
| Lenovo IdeaPad Flex 3 11IGL05 | |
| Teclast Tbook 16 Power | |
| LibreOffice / 20 Documents To PDF | |
| Teclast Tbook 16 Power | |
| Lenovo IdeaPad Flex 3 11IGL05 | |
| Apple MacBook Air 2020 i3 | |
| Huawei MateBook 13 2020 AMD | |
| HP Pavilion 15-cw1212ng | |
| Durabook R11 | |
| Media Intel Core i5-8250U (63.8 - 78.9, n=4) | |
| Durabook S15ABG2 | |
| Dynabook Portege X30L-G1331 | |
| Lenovo ThinkPad X1 Carbon 2020-20UAS04T00 | |
| R Benchmark 2.5 / Overall mean | |
| Teclast Tbook 16 Power | |
| Lenovo IdeaPad Flex 3 11IGL05 | |
| Apple MacBook Air 2020 i3 | |
| Durabook R11 | |
| Media Intel Core i5-8250U (0.818 - 0.843, n=4) | |
| Huawei MateBook 13 2020 AMD | |
| HP Pavilion 15-cw1212ng | |
| Dell XPS 13 9300 i5 FHD | |
| Durabook S15ABG2 | |
| Dynabook Portege X30L-G1331 | |
| Lenovo ThinkPad X1 Carbon 2020-20UAS04T00 | |
Cinebench R15: CPU Multi 64Bit | CPU Single 64Bit
Blender: v2.79 BMW27 CPU
7-Zip 18.03: 7z b 4 -mmt1 | 7z b 4
Geekbench 5.5: Single-Core | Multi-Core
HWBOT x265 Benchmark v2.2: 4k Preset
LibreOffice : 20 Documents To PDF
R Benchmark 2.5: Overall mean
* ... Meglio usare valori piccoli
| PCMark 8 Home Score Accelerated v2 | 3054 punti | |
| PCMark 8 Work Score Accelerated v2 | 4474 punti | |
| PCMark 10 Score | 3489 punti | |
Aiuto | ||
| DPC Latencies / LatencyMon - interrupt to process latency (max), Web, Youtube, Prime95 | |
| Durabook R11 | |
| Dell XPS 13 9300 i5 FHD | |
| HP Envy x360 13-ay0010nr | |
| Durabook S15ABG2 | |
| Acer Swift 3 SF314-42-R27B | |
* ... Meglio usare valori piccoli
| Durabook R11 Kingston RBUSNS4180S3128GJ | Dell Latitude 7424 Rugged Extreme SK Hynix PC401 512GB M.2 (HFS512GD9TNG) | Dell Latitude 5420 Rugged-P85G SK hynix PC401 NVMe 500 GB | Fujitsu Stylistic Q738 Samsung SSD PM871b MZNLN256HAJQ | Dell Latitude 7200 WDC PC SN520 SDAPNUW-512G | |
|---|---|---|---|---|---|
| AS SSD | 82% | 126% | -10% | 151% | |
| Seq Read (MB/s) | 461.7 | 2096 354% | 2054 345% | 432.9 -6% | 1294 180% |
| Seq Write (MB/s) | 409.3 | 1016 148% | 653 60% | 253.6 -38% | 856 109% |
| 4K Read (MB/s) | 45.52 | 39.91 -12% | 39.34 -14% | 22.47 -51% | 42.52 -7% |
| 4K Write (MB/s) | 76 | 97.9 29% | 96.4 27% | 76.7 1% | 141 86% |
| 4K-64 Read (MB/s) | 359.8 | 636 77% | 677 88% | 377.8 5% | 983 173% |
| 4K-64 Write (MB/s) | 623 | 604 -3% | 982 58% | 282.1 -55% | 1183 90% |
| Access Time Read * (ms) | 0.203 | 0.044 78% | 0.044 78% | 0.148 27% | 0.057 72% |
| Access Time Write * (ms) | 0.226 | 0.051 77% | 0.051 77% | 0.046 80% | 0.026 88% |
| Score Read (Points) | 451 | 886 96% | 921 104% | 444 -2% | 1155 156% |
| Score Write (Points) | 740 | 804 9% | 1143 54% | 384 -48% | 1410 91% |
| Score Total (Points) | 1438 | 2099 46% | 2475 72% | 1052 -27% | 3142 118% |
| Copy ISO MB/s (MB/s) | 454.8 | 1622 257% | 1387 205% | ||
| Copy Program MB/s (MB/s) | 114.7 | 378.1 230% | 449.5 292% | ||
| Copy Game MB/s (MB/s) | 188.1 | 793 322% | 1059 463% | ||
| CrystalDiskMark 5.2 / 6 | 176% | 118% | -1% | 139% | |
| Write 4K (MB/s) | 102.6 | 114.4 12% | 98.8 -4% | 79.5 -23% | 131.9 29% |
| Read 4K (MB/s) | 38.82 | 43.86 13% | 38.51 -1% | 19.71 -49% | 45.47 17% |
| Write Seq (MB/s) | 408.8 | 1281 213% | 843 106% | 385.2 -6% | 1021 150% |
| Read Seq (MB/s) | 427 | 1918 349% | 1282 200% | 435.9 2% | 1085 154% |
| Write 4K Q32T1 (MB/s) | 259.1 | 422.5 63% | 355.5 37% | 222.4 -14% | 444.9 72% |
| Read 4K Q32T1 (MB/s) | 232.1 | 260.6 12% | 241.4 4% | 212.8 -8% | 366.6 58% |
| Write Seq Q32T1 (MB/s) | 286.9 | 1282 347% | 893 211% | 534 86% | 1458 408% |
| Read Seq Q32T1 (MB/s) | 503 | 2515 400% | 2478 393% | 544 8% | 1640 226% |
| Write 4K Q8T8 (MB/s) | 437.2 | ||||
| Read 4K Q8T8 (MB/s) | 988 | ||||
| Media totale (Programma / Settaggio) | 129% /
121% | 122% /
123% | -6% /
-6% | 145% /
147% |
* ... Meglio usare valori piccoli

Throttling Disk: DiskSpd Read Loop, Queue Depth 8
| 3DMark 11 Performance | 1870 punti | |
| 3DMark Cloud Gate Standard Score | 6890 punti | |
| 3DMark Fire Strike Score | 985 punti | |
| 3DMark Time Spy Score | 413 punti | |
Aiuto | ||
| basso | medio | alto | ultra | |
|---|---|---|---|---|
| Dota 2 Reborn (2015) | 59.8 | 33.7 | 17.8 | 14.9 |
| X-Plane 11.11 (2018) | 19.1 | 13.2 | 11.9 |
| Durabook R11 UHD Graphics 620, i5-8250U, Kingston RBUSNS4180S3128GJ | Dell Latitude 7424 Rugged Extreme Radeon RX 540, i7-8650U, SK Hynix PC401 512GB M.2 (HFS512GD9TNG) | Dell Latitude 5420 Rugged-P85G Radeon RX 540, i7-8650U, SK hynix PC401 NVMe 500 GB | Fujitsu Stylistic Q738 UHD Graphics 620, i5-8350U, Samsung SSD PM871b MZNLN256HAJQ | Dell Latitude 7200 UHD Graphics 620, i5-8365U, WDC PC SN520 SDAPNUW-512G | |
|---|---|---|---|---|---|
| Noise | 2% | 4% | -1% | 6% | |
| off /ambiente * (dB) | 28 | 28.6 -2% | 28.3 -1% | 30.5 -9% | 28.8 -3% |
| Idle Minimum * (dB) | 28 | 28.6 -2% | 28.3 -1% | 30.5 -9% | 28.8 -3% |
| Idle Average * (dB) | 28 | 28.6 -2% | 28.3 -1% | 30.5 -9% | 28.8 -3% |
| Idle Maximum * (dB) | 28 | 28.6 -2% | 28.3 -1% | 30.5 -9% | 28.8 -3% |
| Load Average * (dB) | 39.3 | 32.9 16% | 29.9 24% | 33.3 15% | 30.1 23% |
| Load Maximum * (dB) | 39.3 | 39 1% | 38 3% | 33.6 15% | 30.1 23% |
* ... Meglio usare valori piccoli
Rumorosità
| Idle |
| 28 / 28 / 28 dB(A) |
| Sotto carico |
| 39.3 / 39.3 dB(A) |
 | ||
30 dB silenzioso 40 dB(A) udibile 50 dB(A) rumoroso |
||
min: | ||
(-) La temperatura massima sul lato superiore è di 53.2 °C / 128 F, rispetto alla media di 33.6 °C / 92 F, che varia da 20.7 a 53.2 °C per questa classe Tablet.
(-) Il lato inferiore si riscalda fino ad un massimo di 55.2 °C / 131 F, rispetto alla media di 33.2 °C / 92 F
(+) In idle, la temperatura media del lato superiore è di 30.7 °C / 87 F, rispetto alla media deld ispositivo di 30 °C / 86 F.
Durabook R11 analisi audio
(±) | potenza degli altiparlanti media ma buona (76.8 dB)
Bassi 100 - 315 Hz
(-) | quasi nessun basso - in media 38.7% inferiori alla media
(±) | la linearità dei bassi è media (7.8% delta rispetto alla precedente frequenza)
Medi 400 - 2000 Hz
(±) | medi ridotti - circa 12.1% inferiori alla media
(±) | linearità dei medi adeguata (9.5% delta rispetto alla precedente frequenza)
Alti 2 - 16 kHz
(+) | Alti bilanciati - appena 3.2% dalla media
(+) | alti lineari (6.8% delta rispetto alla precedente frequenza)
Nel complesso 100 - 16.000 Hz
(-) | suono nel complesso non lineare (33.8% di differenza rispetto alla media
Rispetto alla stessa classe
» 93% di tutti i dispositivi testati in questa classe è stato migliore, 3% simile, 4% peggiore
» Il migliore ha avuto un delta di 7%, medio di 20%, peggiore di 129%
Rispetto a tutti i dispositivi testati
» 93% di tutti i dispositivi testati in questa classe è stato migliore, 1% similare, 6% peggiore
» Il migliore ha avuto un delta di 4%, medio di 24%, peggiore di 134%
Apple MacBook 12 (Early 2016) 1.1 GHz analisi audio
(+) | gli altoparlanti sono relativamente potenti (83.6 dB)
Bassi 100 - 315 Hz
(±) | bassi ridotti - in media 11.3% inferiori alla media
(±) | la linearità dei bassi è media (14.2% delta rispetto alla precedente frequenza)
Medi 400 - 2000 Hz
(+) | medi bilanciati - solo only 2.4% rispetto alla media
(+) | medi lineari (5.5% delta rispetto alla precedente frequenza)
Alti 2 - 16 kHz
(+) | Alti bilanciati - appena 2% dalla media
(+) | alti lineari (4.5% delta rispetto alla precedente frequenza)
Nel complesso 100 - 16.000 Hz
(+) | suono nel complesso lineare (10.2% differenza dalla media)
Rispetto alla stessa classe
» 7% di tutti i dispositivi testati in questa classe è stato migliore, 2% simile, 91% peggiore
» Il migliore ha avuto un delta di 5%, medio di 18%, peggiore di 53%
Rispetto a tutti i dispositivi testati
» 5% di tutti i dispositivi testati in questa classe è stato migliore, 1% similare, 94% peggiore
» Il migliore ha avuto un delta di 4%, medio di 24%, peggiore di 134%
| Off / Standby | |
| Idle | |
| Sotto carico |
|
Leggenda:
min: | |
| Durabook R11 i5-8250U, UHD Graphics 620, Kingston RBUSNS4180S3128GJ, IPS, 1920x1080, 11.6" | Dell Latitude 7424 Rugged Extreme i7-8650U, Radeon RX 540, SK Hynix PC401 512GB M.2 (HFS512GD9TNG), IPS, 1920x1080, 14" | Dell Latitude 5420 Rugged-P85G i7-8650U, Radeon RX 540, SK hynix PC401 NVMe 500 GB, IPS, 1920x1080, 14" | Fujitsu Stylistic Q738 i5-8350U, UHD Graphics 620, Samsung SSD PM871b MZNLN256HAJQ, IPS, 1920x1080, 13.3" | Dell Latitude 7200 i5-8365U, UHD Graphics 620, WDC PC SN520 SDAPNUW-512G, IPS LED, 1920x1280, 12.3" | |
|---|---|---|---|---|---|
| Power Consumption | -49% | -35% | 42% | 28% | |
| Idle Minimum * (Watt) | 6.1 | 6.5 -7% | 4.8 21% | 4.2 31% | 3.3 46% |
| Idle Average * (Watt) | 11.7 | 15.1 -29% | 13.6 -16% | 7 40% | 5.8 50% |
| Idle Maximum * (Watt) | 11.9 | 16.1 -35% | 13.8 -16% | 7.9 34% | 6.5 45% |
| Load Average * (Watt) | 37.7 | 70.5 -87% | 67.8 -80% | 19.8 47% | 37 2% |
| Load Maximum * (Watt) | 50.5 | 95.2 -89% | 93.5 -85% | 22 56% | 51.3 -2% |
| Witcher 3 ultra * (Watt) | 68.1 | 69.1 |
* ... Meglio usare valori piccoli
| Durabook R11 i5-8250U, UHD Graphics 620, 43 Wh | Dell Latitude 7424 Rugged Extreme i7-8650U, Radeon RX 540, 102 Wh | Dell Latitude 5420 Rugged-P85G i7-8650U, Radeon RX 540, 102 Wh | Fujitsu Stylistic Q738 i5-8350U, UHD Graphics 620, Wh | Dell Latitude 7200 i5-8365U, UHD Graphics 620, 38 Wh | |
|---|---|---|---|---|---|
| Autonomia della batteria | 105% | 184% | 12% | 23% | |
| WiFi v1.3 (h) | 5.7 | 11.7 105% | 16.2 184% | 6.4 12% | 7 23% |
| Load (h) | 2.7 | 3.2 | 1.8 | ||
| Reader / Idle (h) | 31.4 |
Pro
Contro
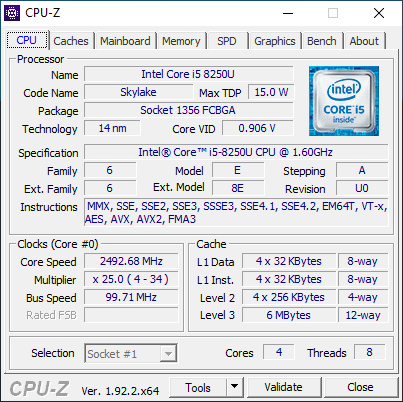
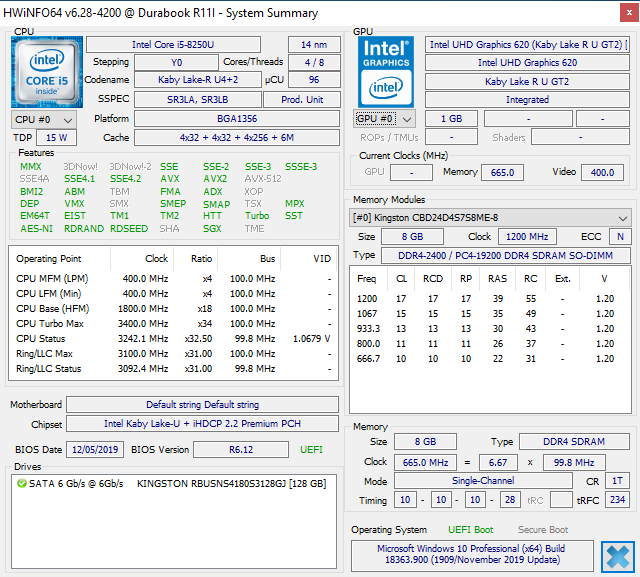
Avere una moderna CPU Core serie U al posto di una più debole variante Celeron o Atom aiuta enormemente la reattività del sistema. Nonostante sia venduto come un tablet rinforzato più economico, il Durabook R11 non sacrifica di molto la qualità del display o le opzioni del processore.
C'è un margine di miglioramento. Un'opzione con un pannello più luminoso da 1000 nits avrebbe aiutato molto gli utenti che lavorano all'aperto, dato che 500 nits di solito non sono sufficienti. Inoltre, i punti caldi del tablet possono raggiungere temperature elevate nonostante il profilo spesso e la ventola attiva. In terzo luogo, i pulsanti touch e i LEDs luminosi lungo i bordi dello schermo sono più fastidiosi che utili, soprattutto perché i pulsanti sono facili da colpire per errore. Questi pulsanti possono fortunatamente essere disattivati, ma è un'occasione mancata per altre funzioni potenzialmente più utili.
Forse l'inconveniente più notevole è l'uso della modulazione di larghezza d'impulso per il controllo della luminosità a quasi tutti i livelli di luminosità. Se i vostri occhi sono sensibili allo sfarfallio, allora evitate di usare questo tablet al buio troppo spesso.
Un tablet robusto con un display impressionante per la sua categoria. Tuttavia, i suoi pulsanti touch e il display PWM dovrebbero essere sicuramente modificati nelle future versioni di questo tablet.
Price comparison
