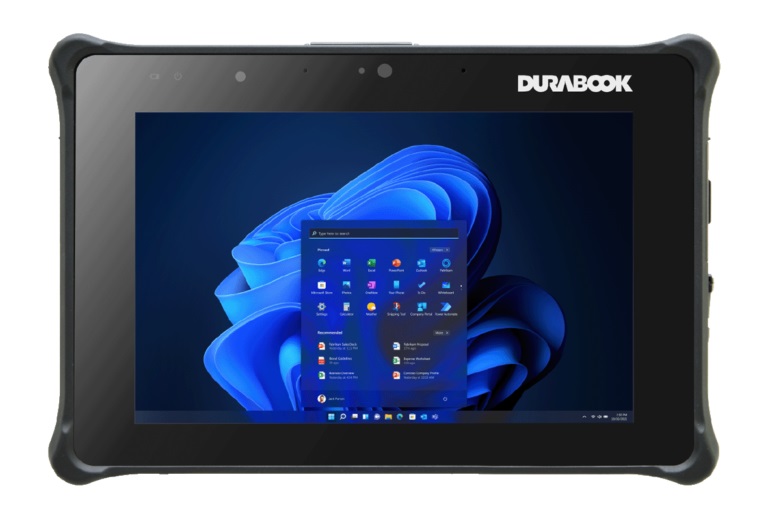
Recensione del Durabook R8: Il primo tablet rugged al mondo senza ventole con Intel 12a generazione

Durabook è specializzata in PC portatili e tablet rugged progettati per ambienti impegnativi come l'industria manifatturiera, le forze dell'ordine, la ricerca sul campo, le agenzie governative e altri settori al di fuori degli uffici tradizionali. L'ultimo modello è il Durabook R8, completamente rugged, uno dei primi nella sua categoria di dimensioni a montare CPU Alder Lake-U di 12a generazione in un design senza ventole.
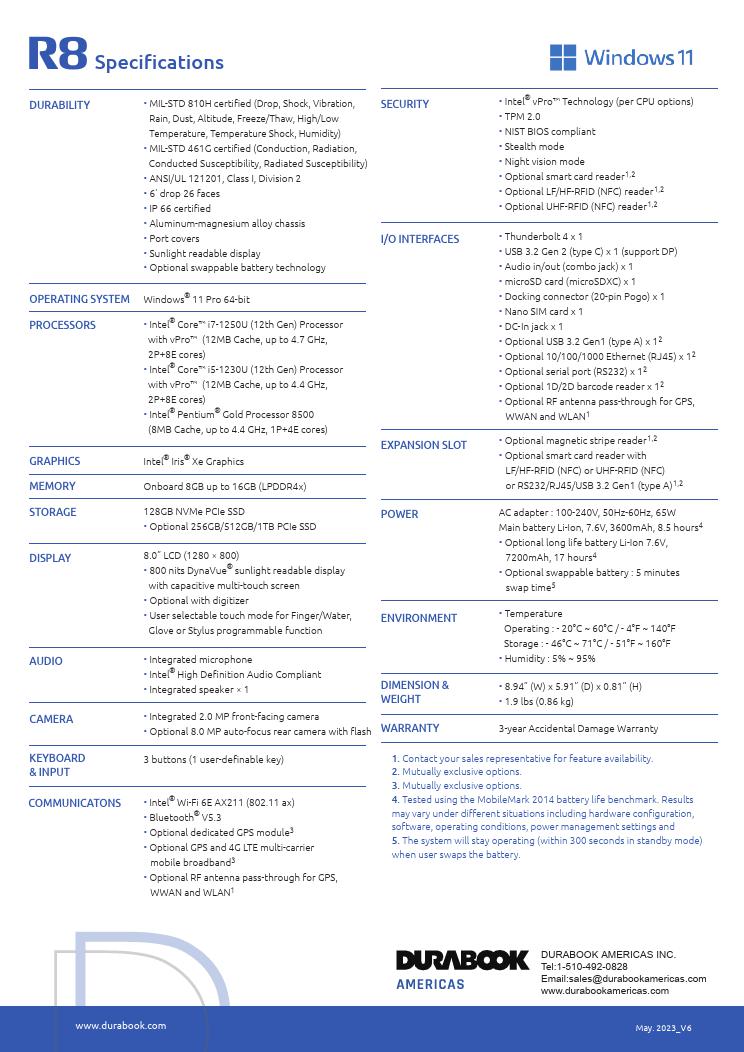
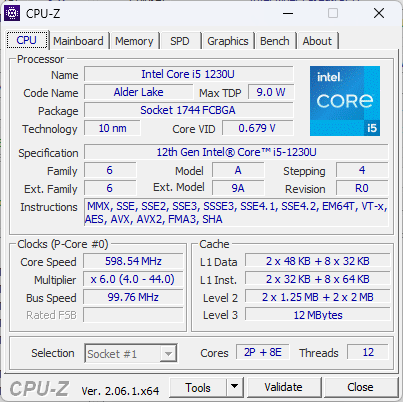
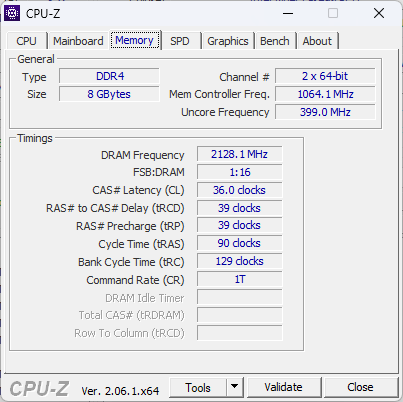
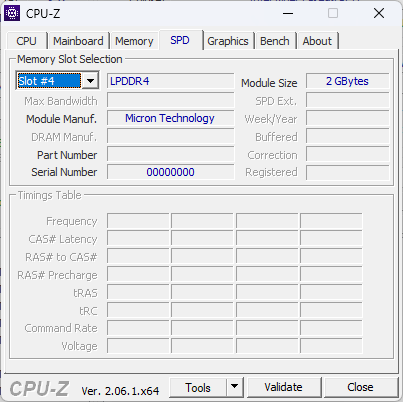
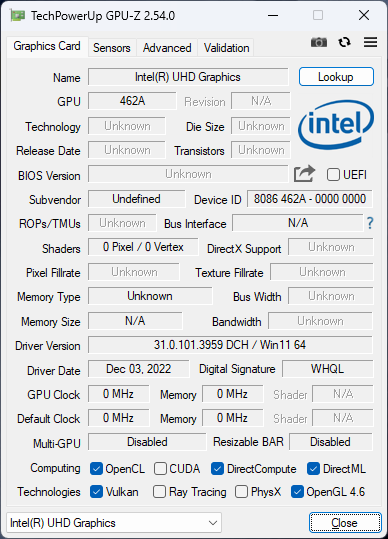
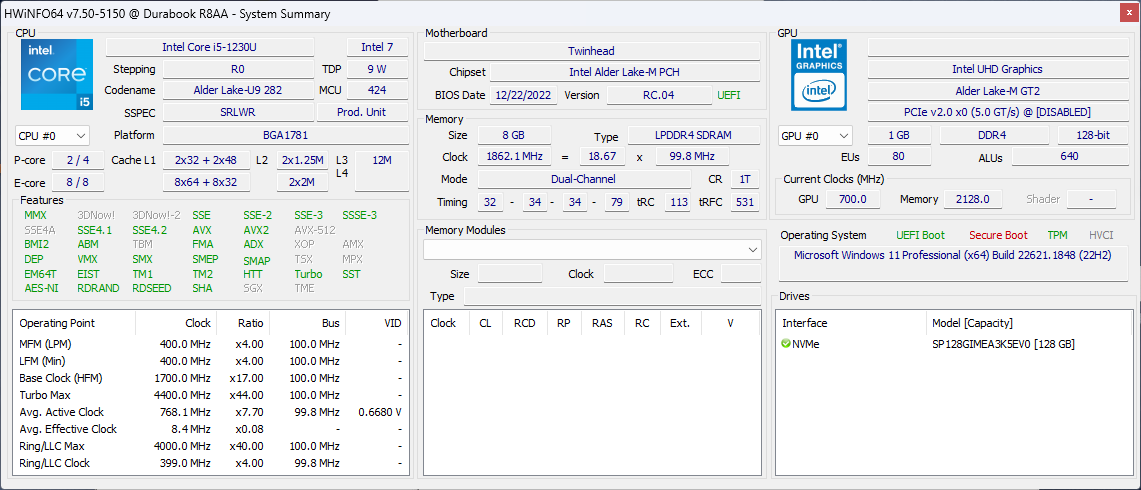
La nostra unità di prova monta un Core i5-1230U, 8 GB di RAM LPDDR4x-2133 saldata e un'unità SSD da 128 GB. Altre SKU sono disponibili con Pentium 8500, Core i7-1250U, 16 GB di RAM o SSD da 1 TB, ma tutte le opzioni vengono fornite con lo stesso schermo touchscreen da 8 pollici con risoluzione 1280 x 800.
Tra le alternative al Durabook R8 ci sono altri tablet rugged come l'Acer Enduro T1,Dell Latitude 7230 Rugged Extremeo ilPanasonic Toughbook FZ-G2.
Altre recensioni di Durabook:
Potenziali concorrenti a confronto
Punteggio | Data | Modello | Peso | Altezza | Dimensione | Risoluzione | Prezzo |
|---|---|---|---|---|---|---|---|
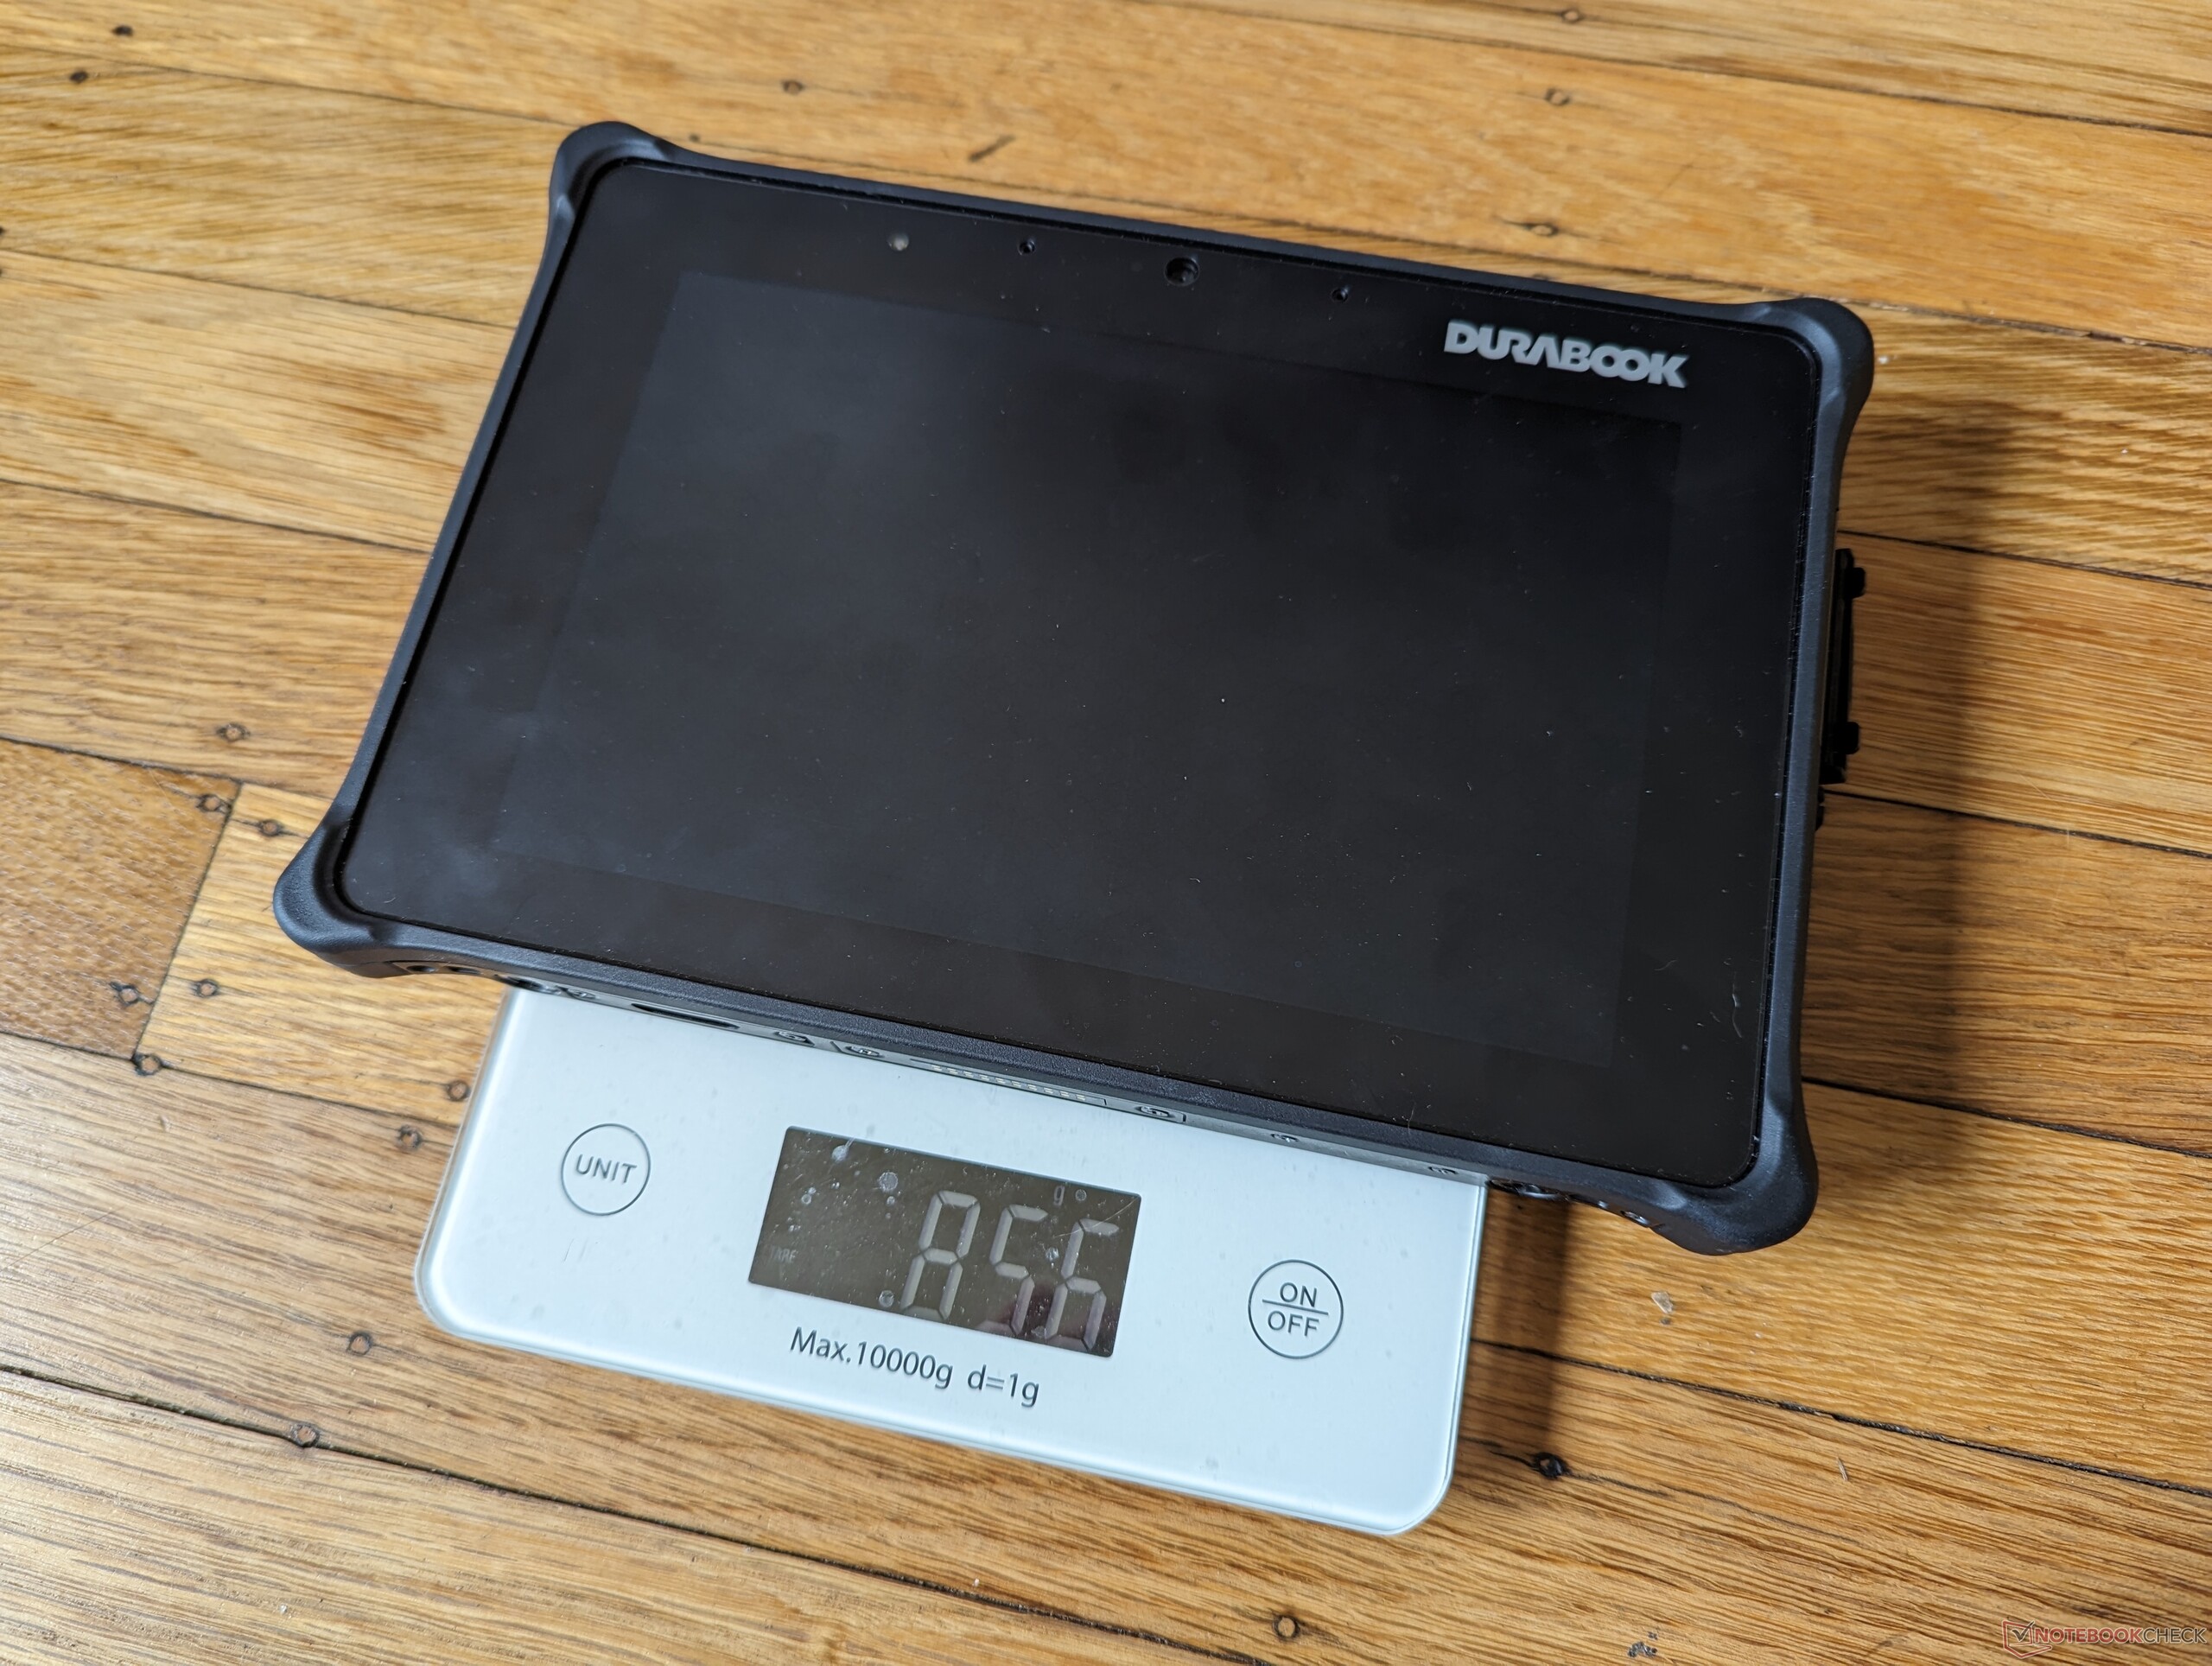
| 79.6 % v7 (old) | 07/2023 | Durabook R8 Tablet i5-1230U, Iris Xe G7 80EUs | 856 gr | 20.6 mm | 8.00" | 1280x800 | |
v (old) | 09/2020 | Acer Enduro T1 ET108-11A A9001 | 499 gr | 10.9 mm | 8.00" | 1280x800 | |
| 79.5 % v7 (old) | 05/2023 | Lenovo Tab M8 (Gen 4) Helio A22 MT6761, PowerVR GE8300 | 320 gr | 9 mm | 8.00" | 1280x800 | |
| 83.9 % v7 (old) | 04/2023 | Dell Latitude 7230 Rugged Extreme i5-1240U, Iris Xe G7 80EUs | 1.6 kg | 23.9 mm | 12.00" | 1920x1200 | |
v (old) | 08/2021 | Panasonic Toughbook FZ-G2 i5-10310U, UHD Graphics 620 | 1.5 kg | 28 mm | 10.10" | 1920x1200 |
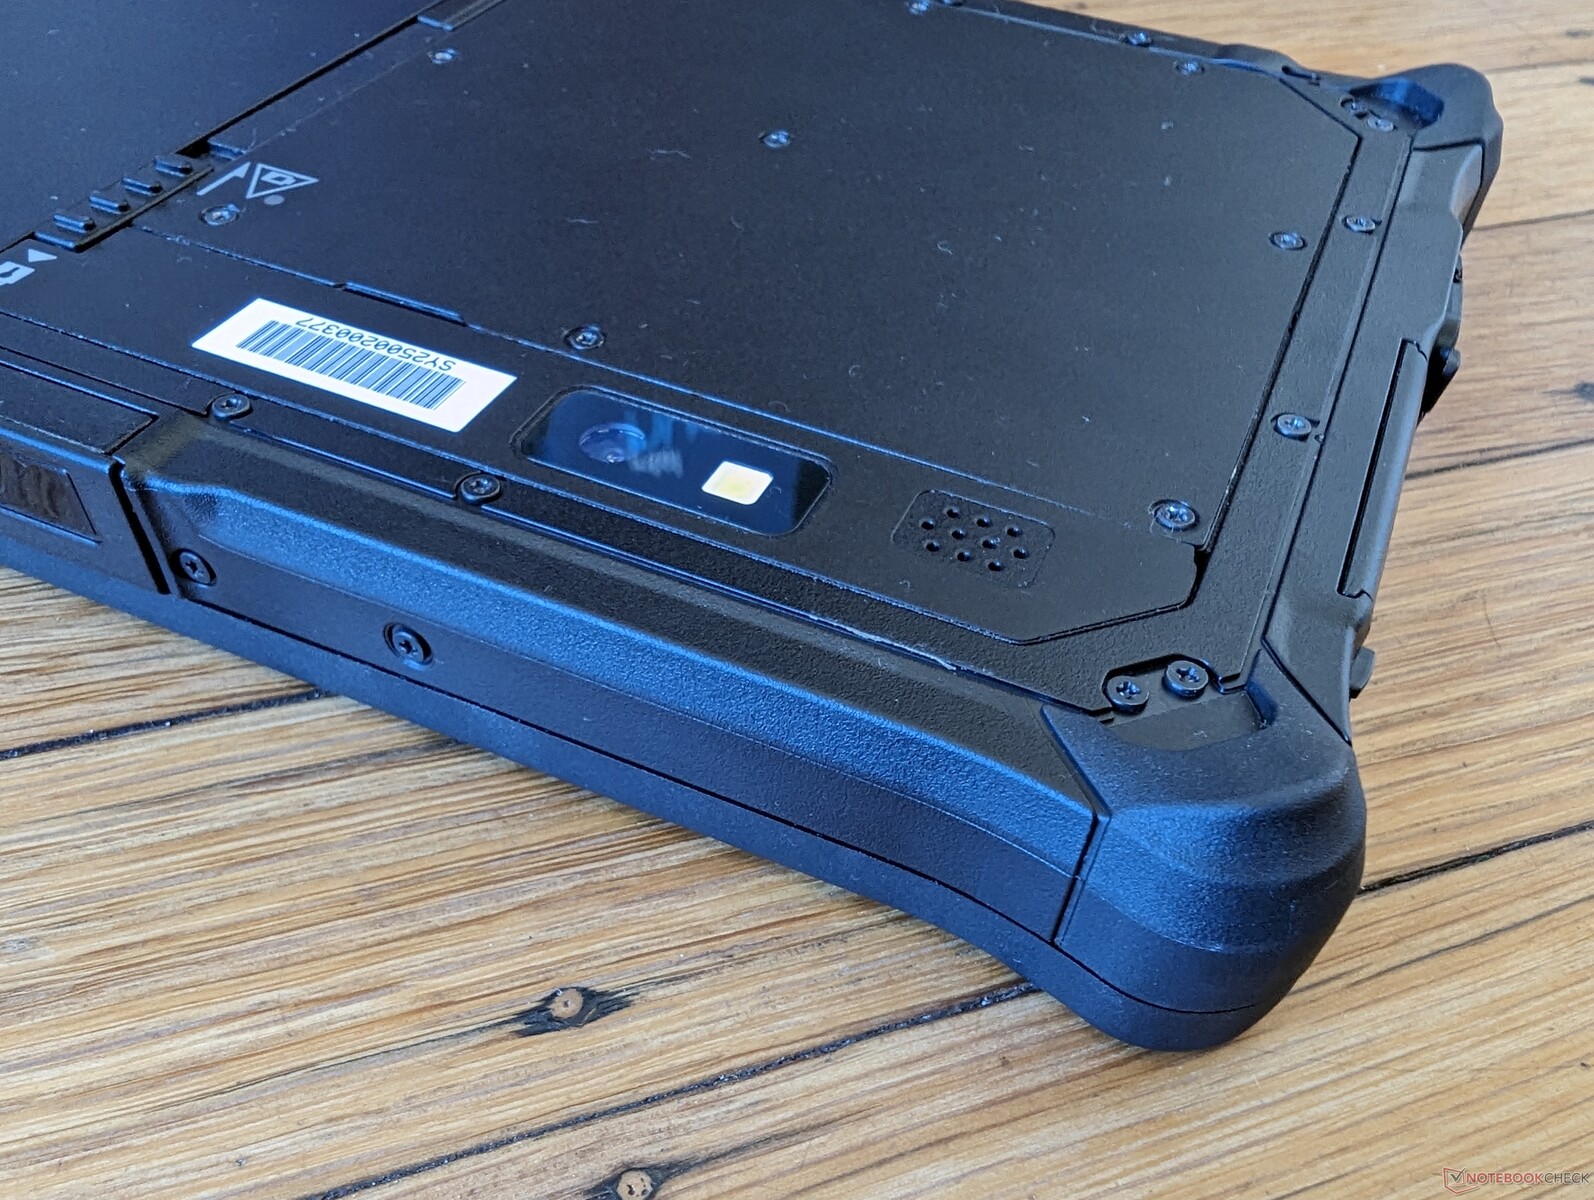
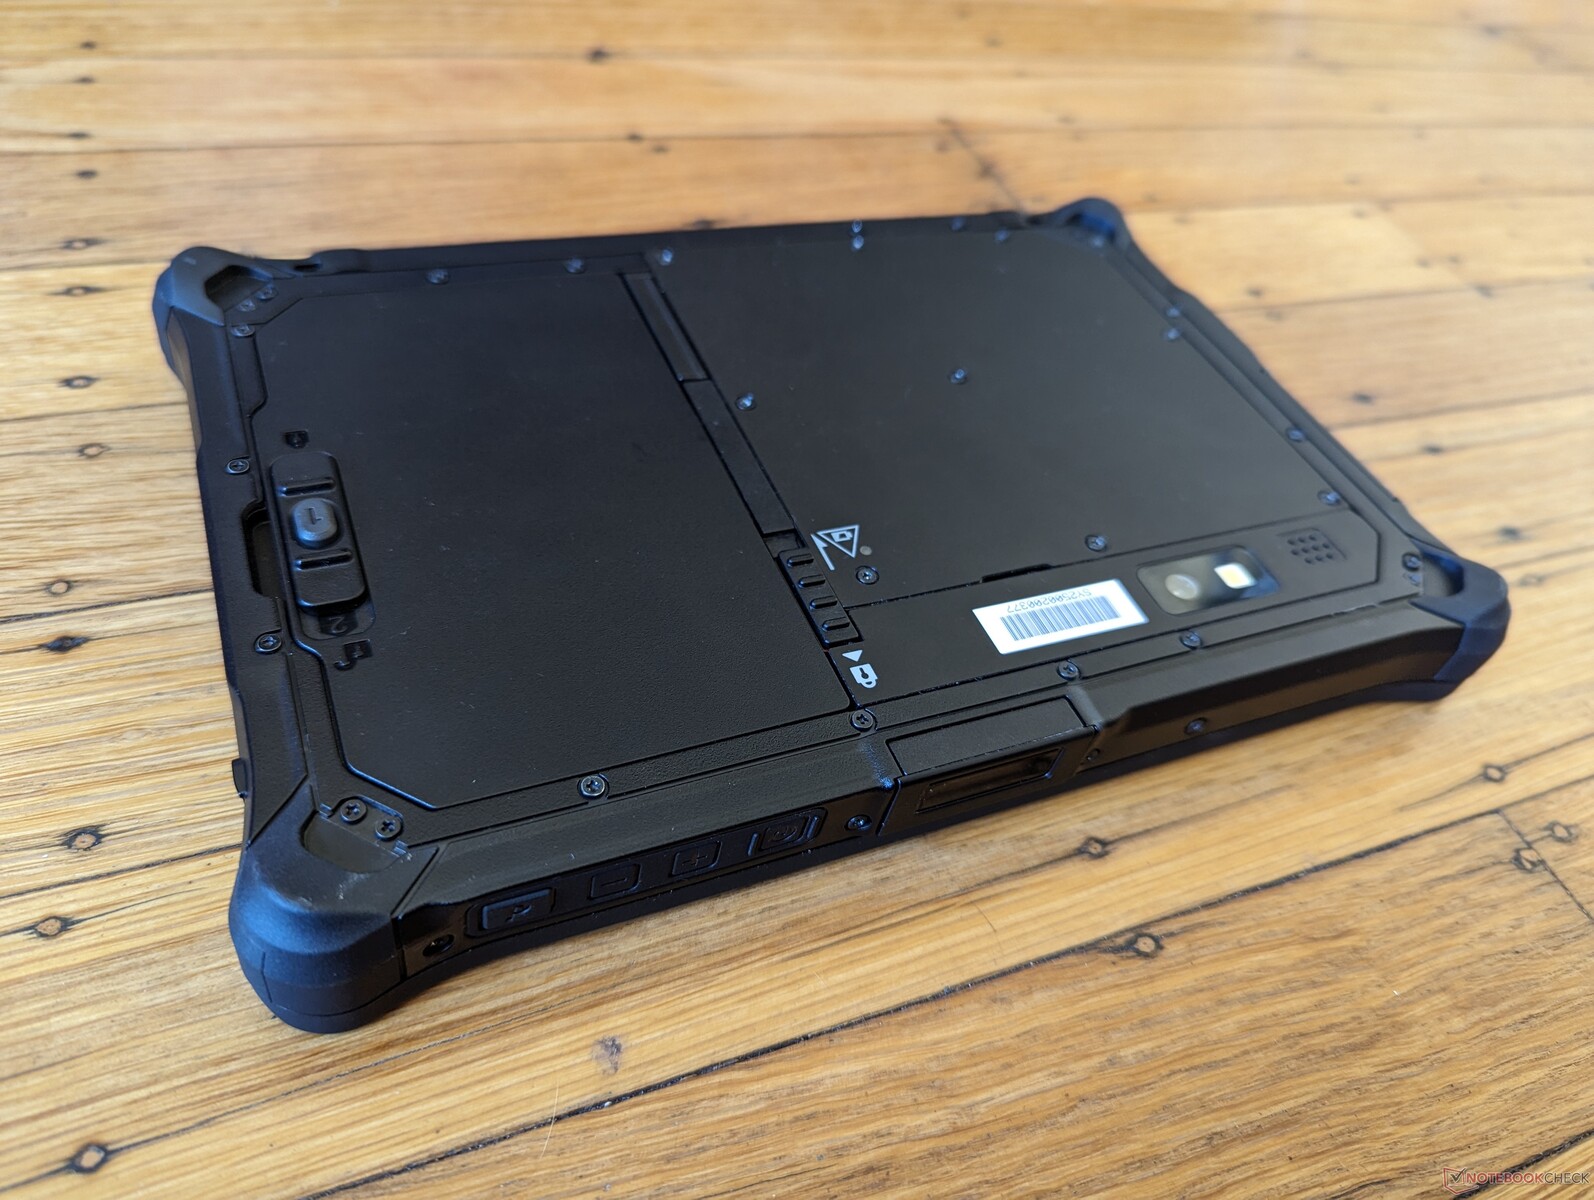
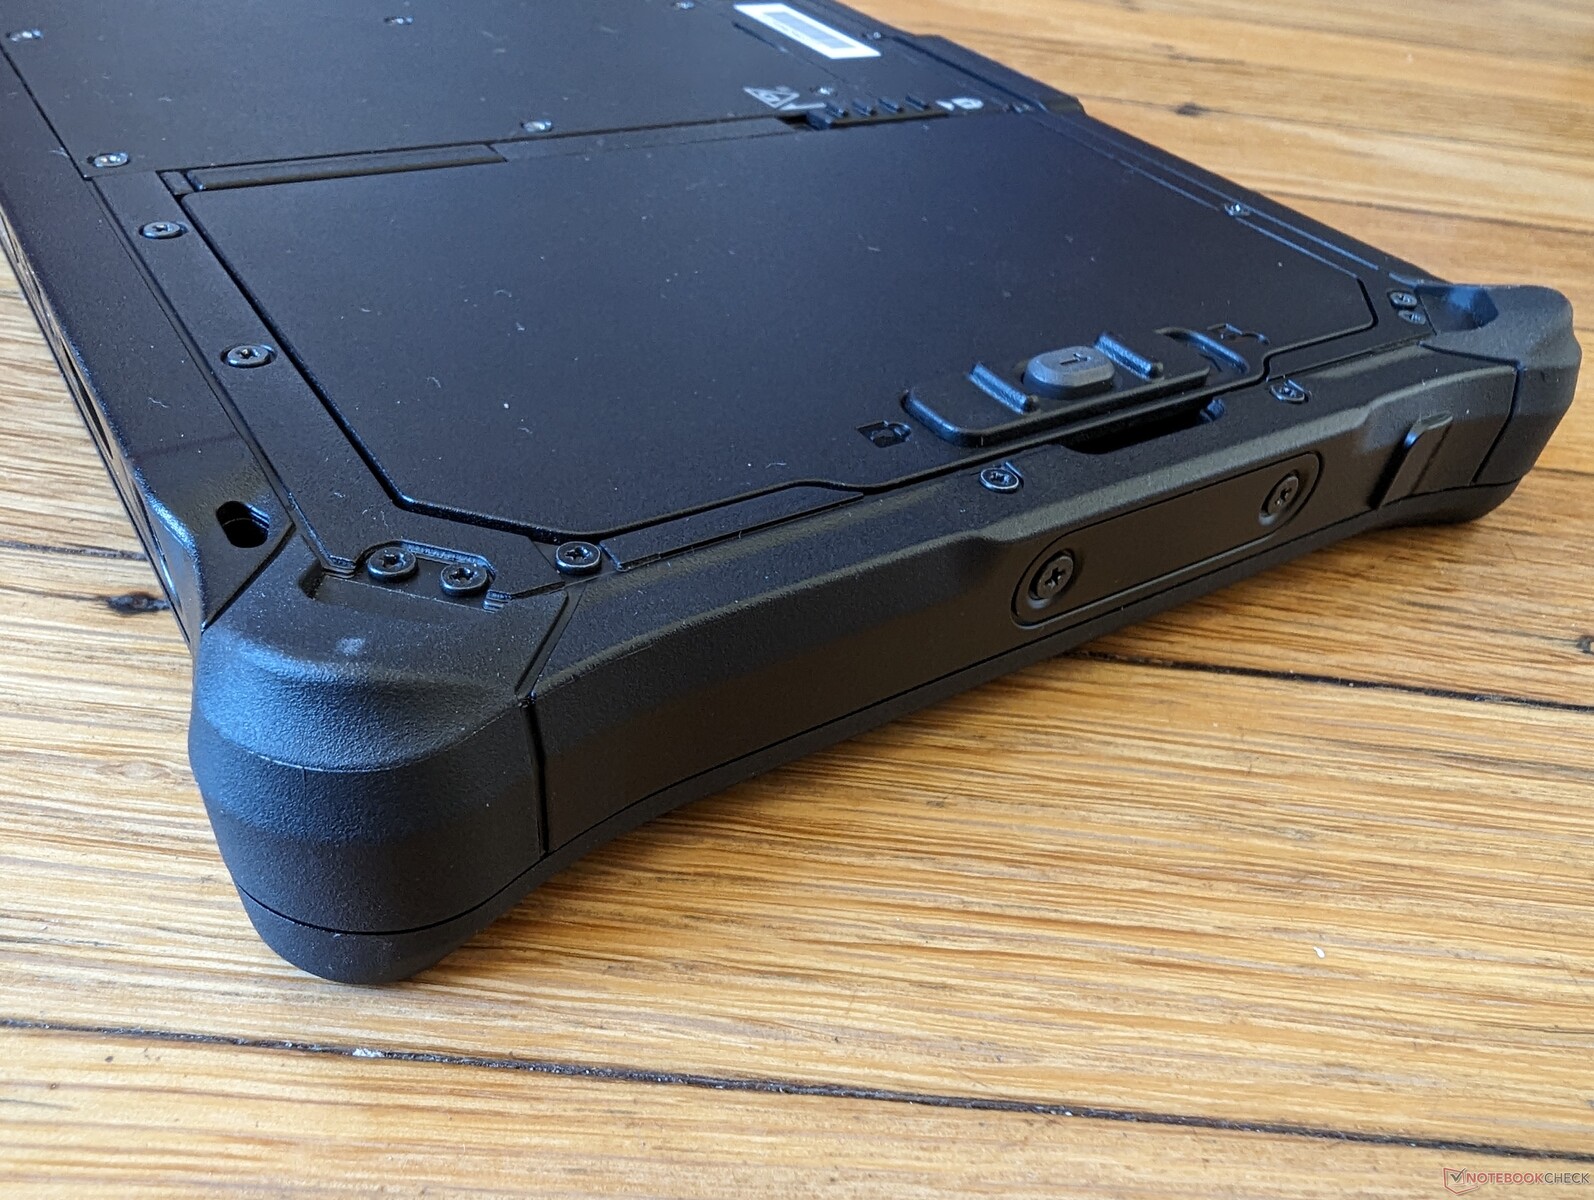
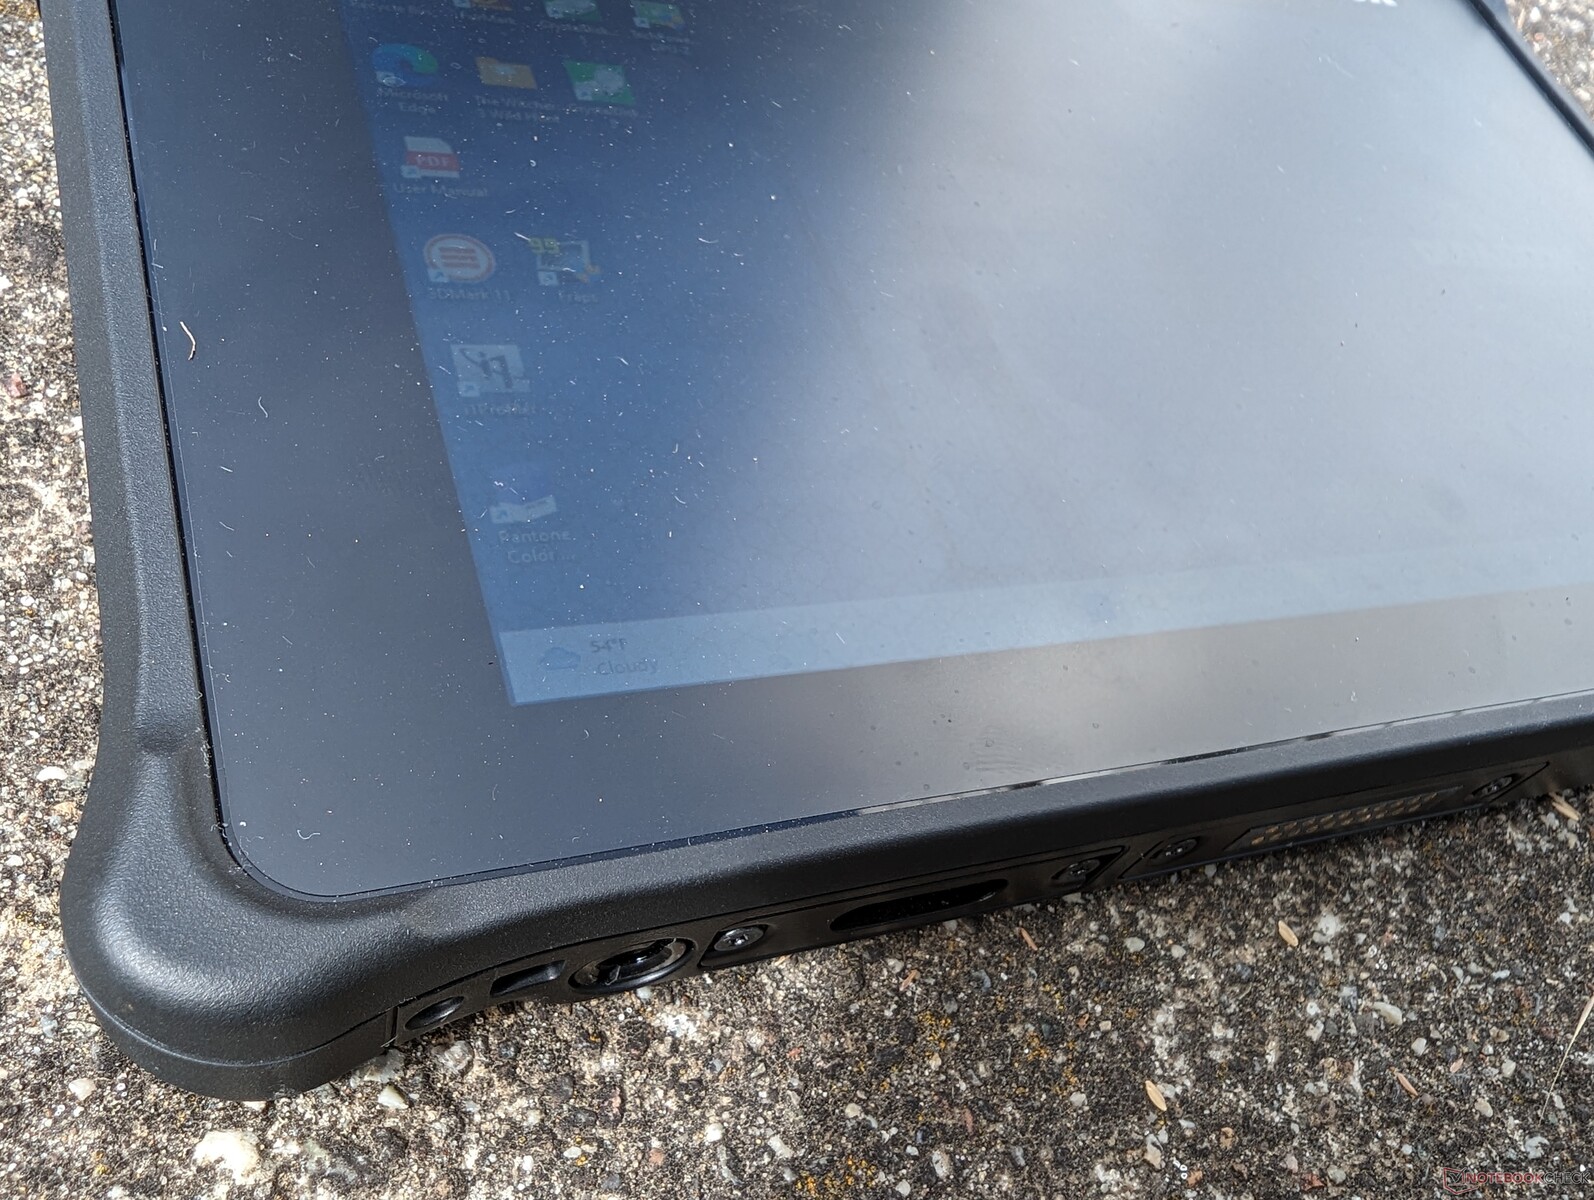
Custodia - Durabook durevole
Lo chassis è certificato MIL-STD 810H, MIL-STD 461G e IP66 contro un'ampia gamma di elementi ambientali. Se si tenta di ruotare il tablet dagli angoli o di premere il centro dello schermo, non si notano scricchiolii o deformazioni, per una prima impressione di solidità.
Le specifiche completamente rugged aggiungono indubbiamente peso e spessore al design. Rispetto al concorrente Acer Enduro T1, ad esempio, il nostro Durabook è quasi due volte più spesso e pesante, anche se entrambi hanno uno schermo touchscreen da 8 pollici.
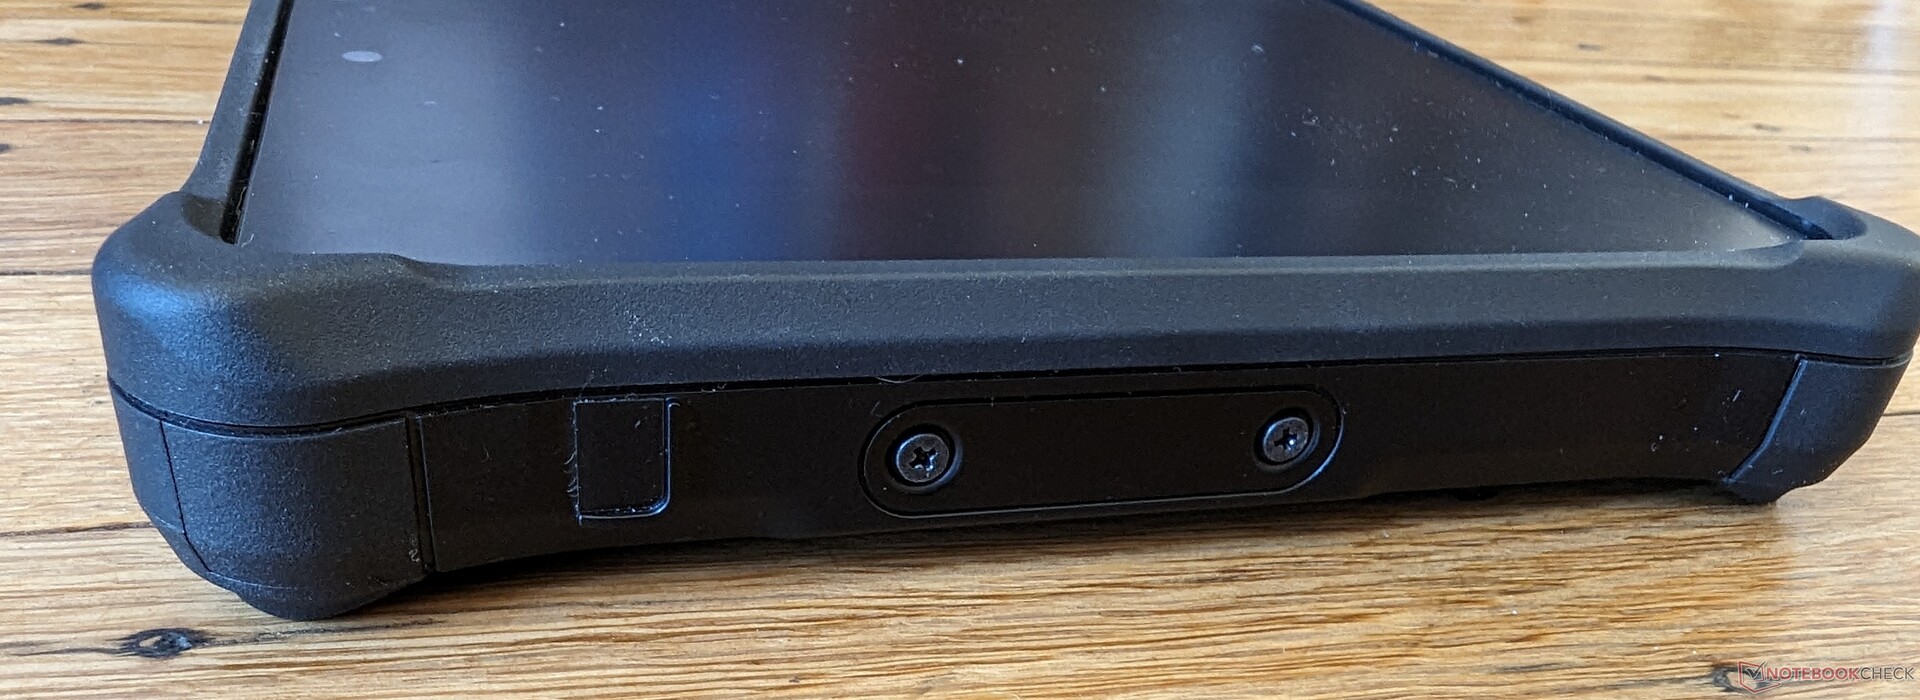
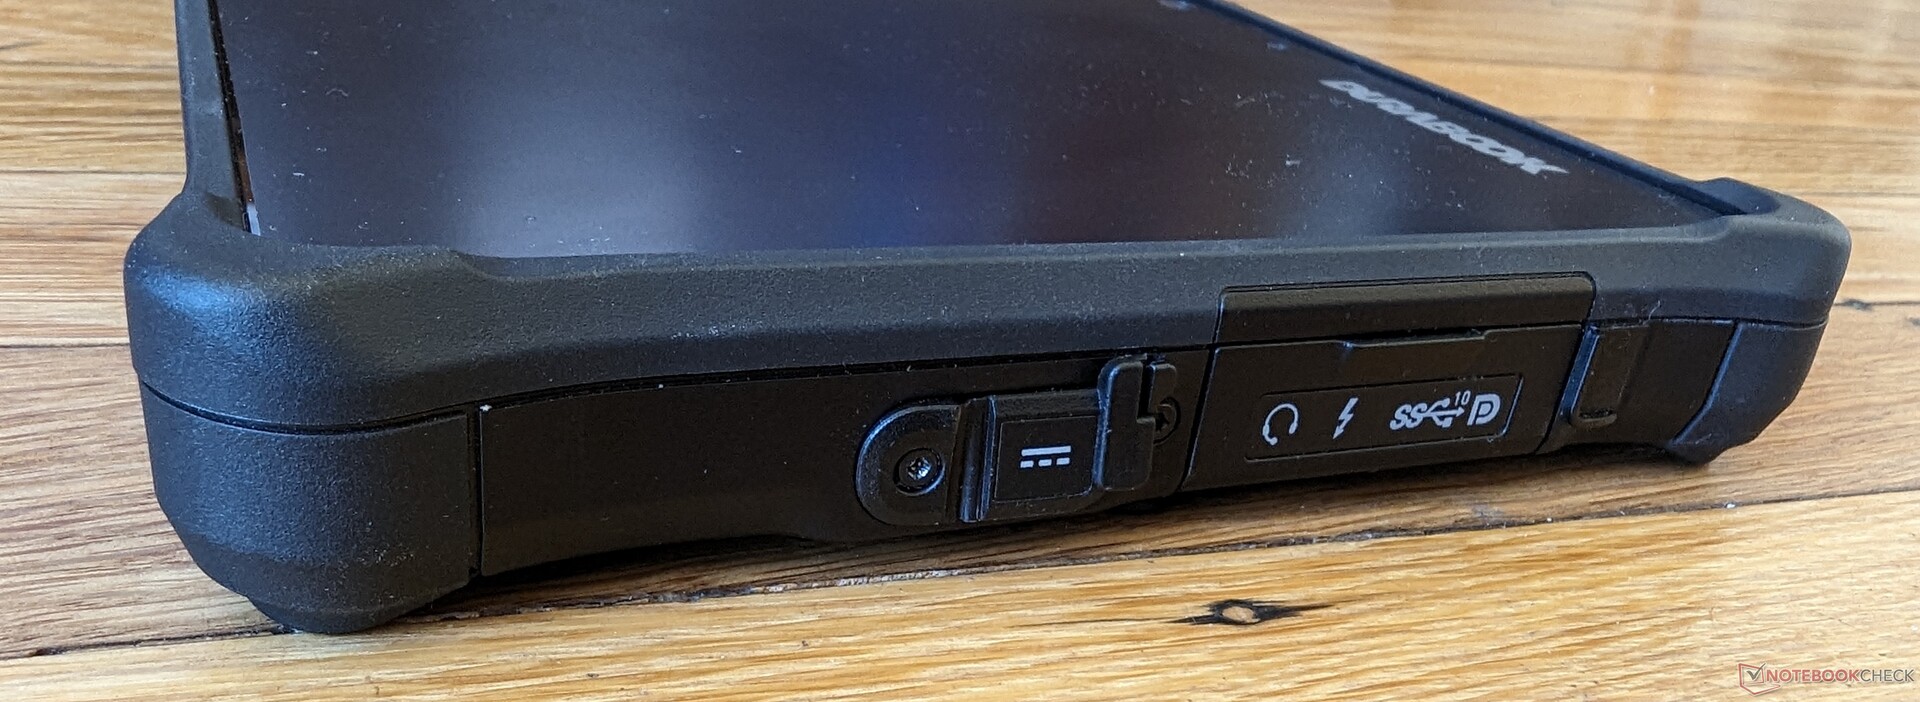
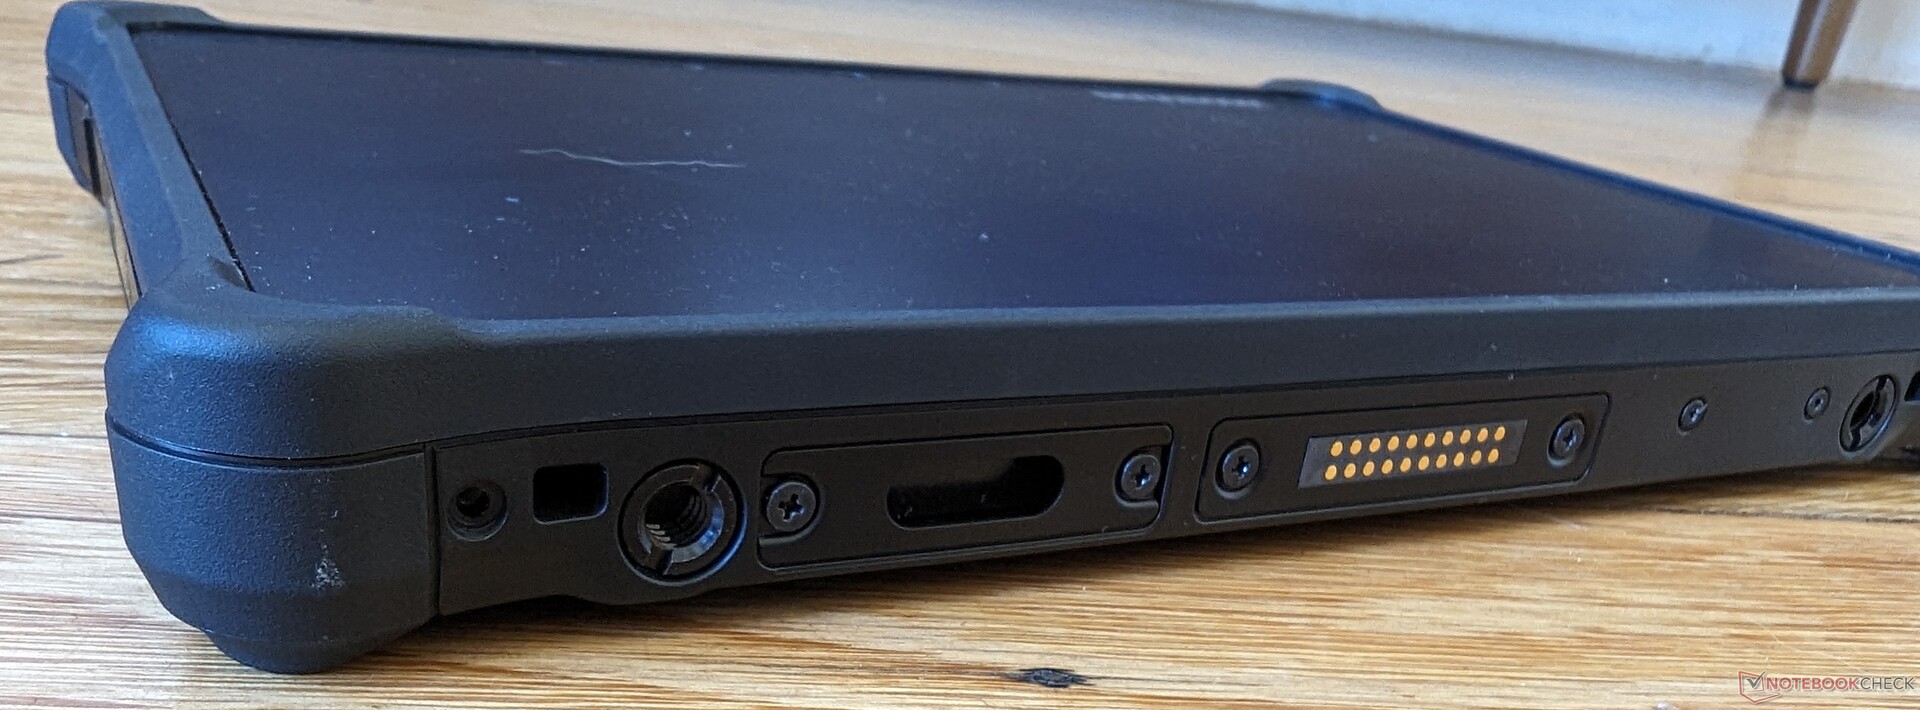
Connettività - Supporto Thunderbolt 4
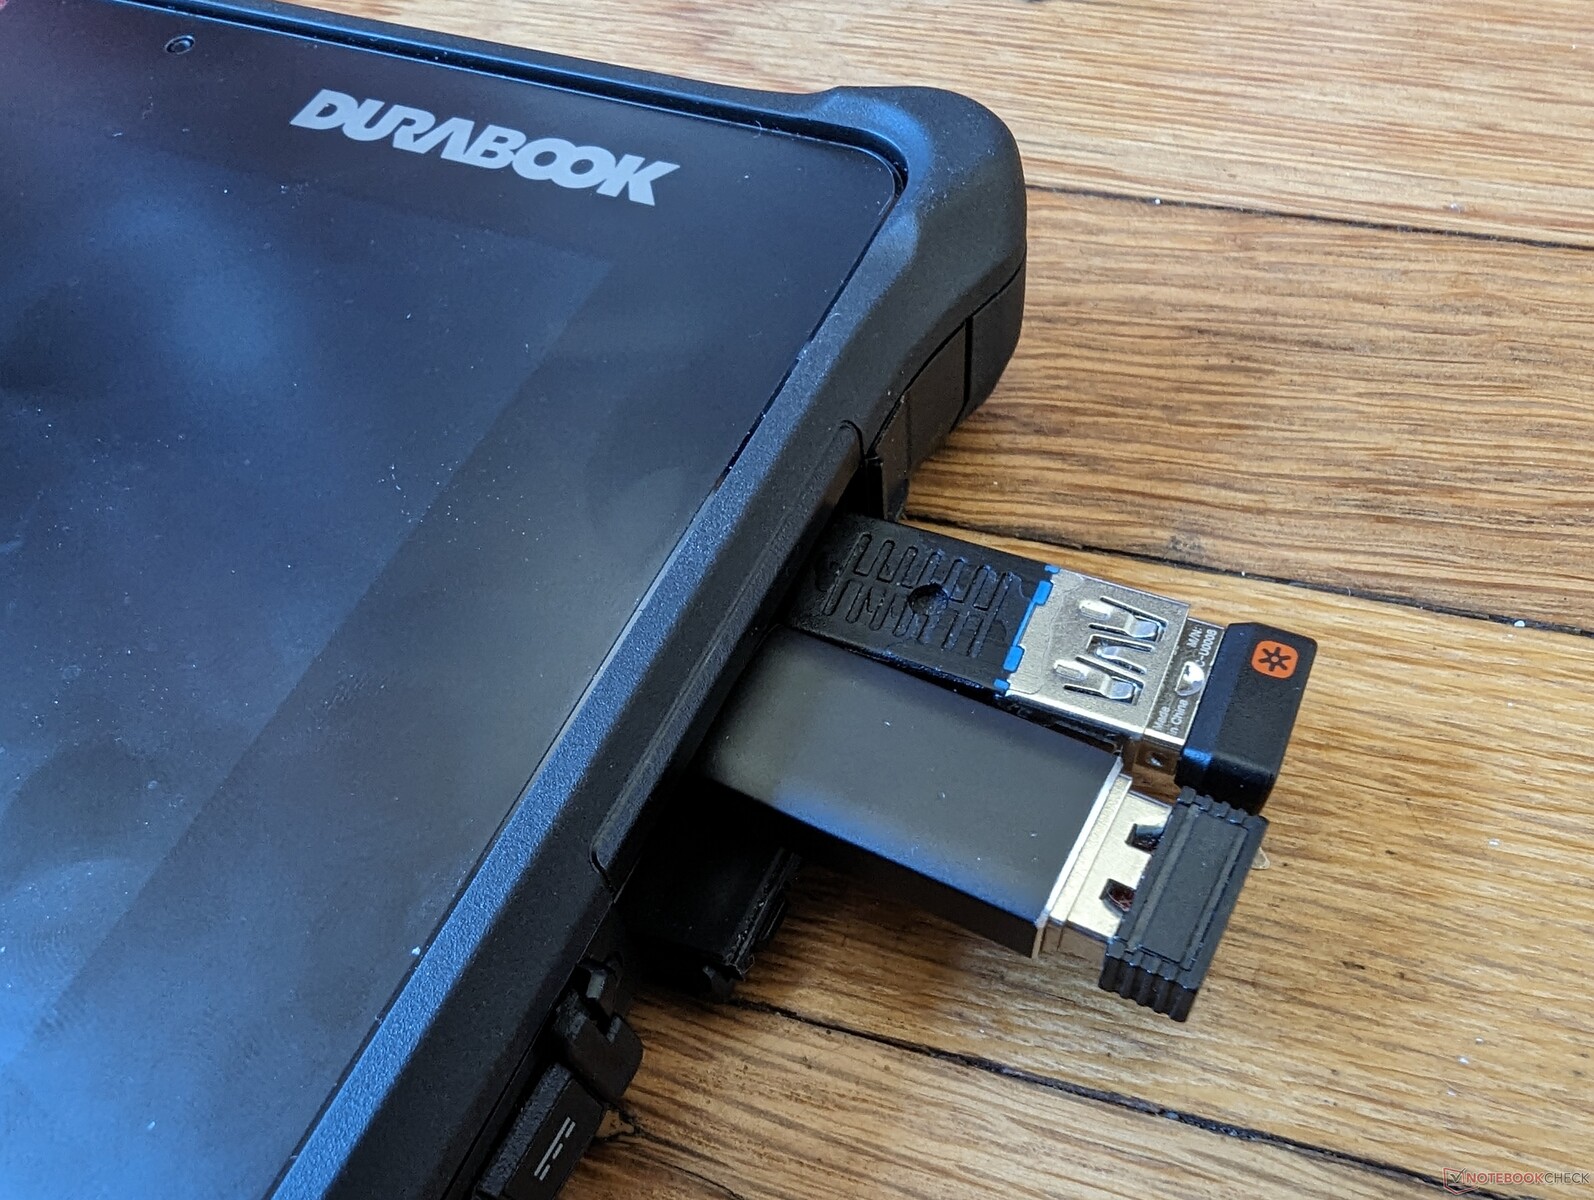
Alcune porte sono standard su tutte le SKU, mentre altre possono essere aggiunte a un costo aggiuntivo, tra cui USB-A, Gigabit RJ-45, RS232 o un lettore di codici a barre.
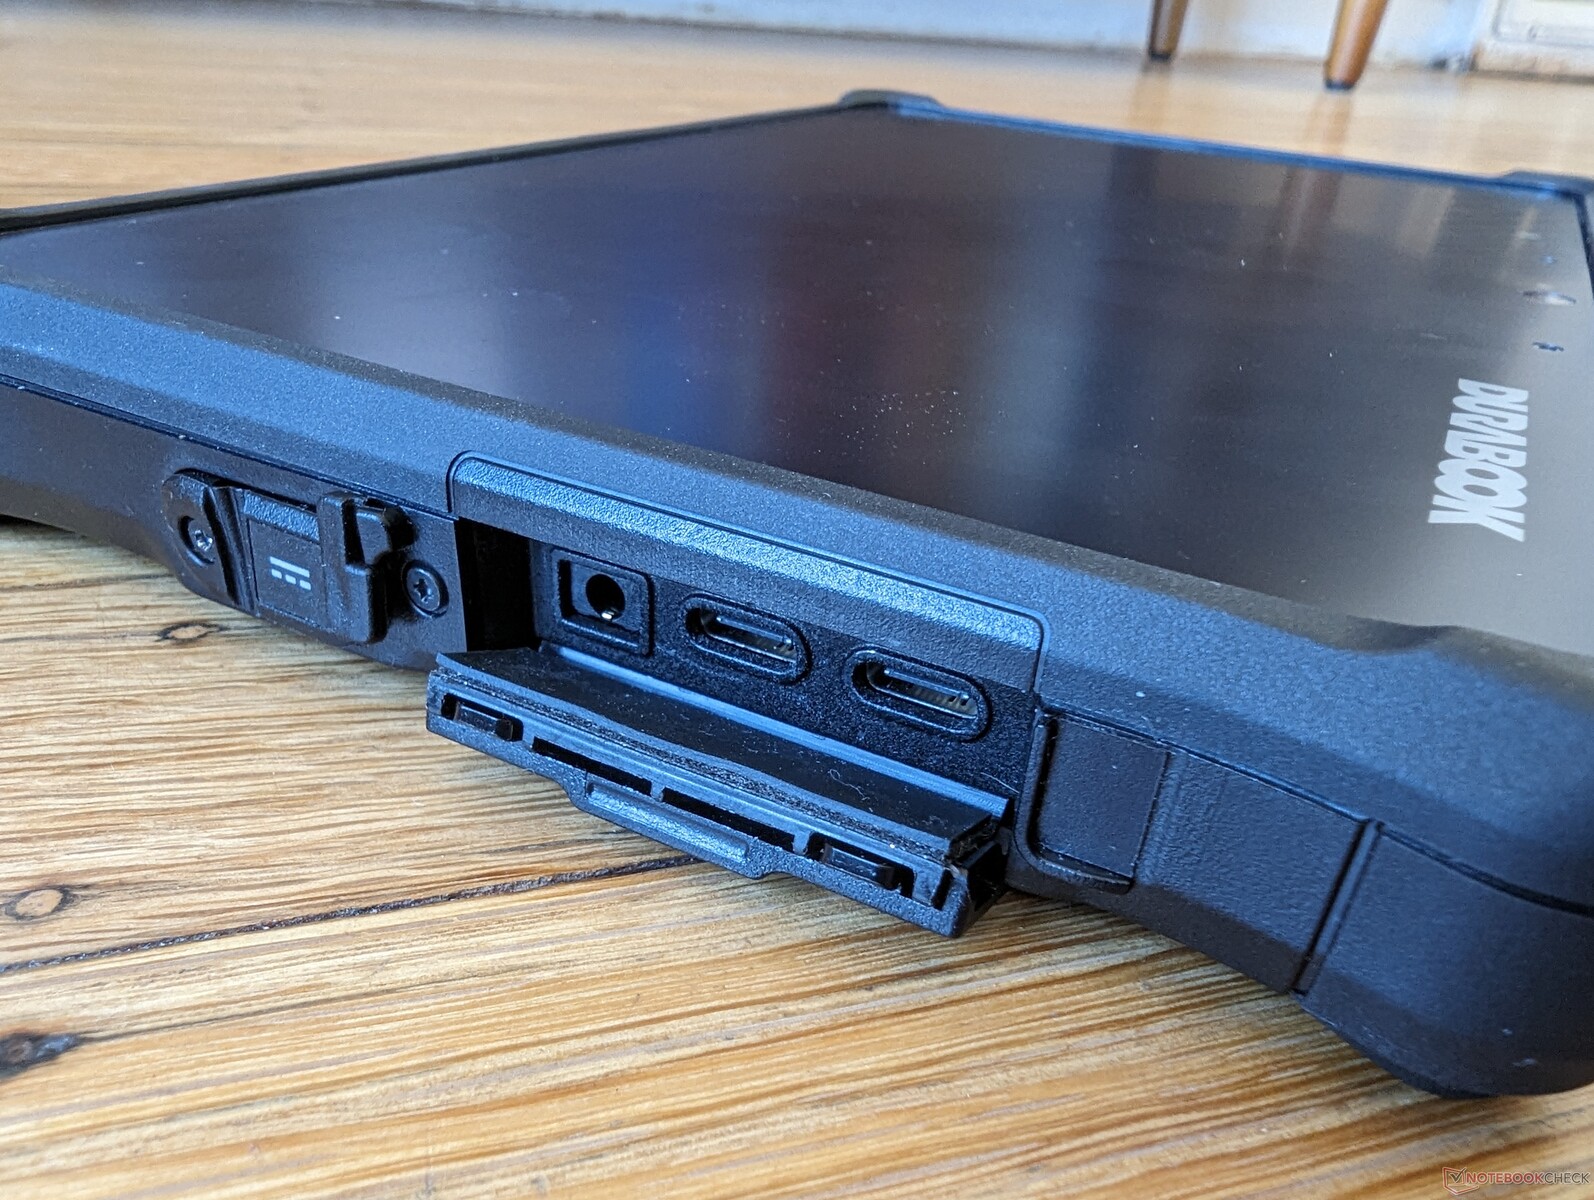
Una delle due porte USB-C supporta Thunderbolt 4 per un'ampia gamma di dispositivi esterni compatibili. Tuttavia, solo una delle porte supporta Power Delivery. Le porte sono troppo strette tra loro e quindi alcuni cavi o adattatori USB-C più spessi possono bloccare parzialmente l'accesso alle altre porte, come mostra l'immagine a destra.
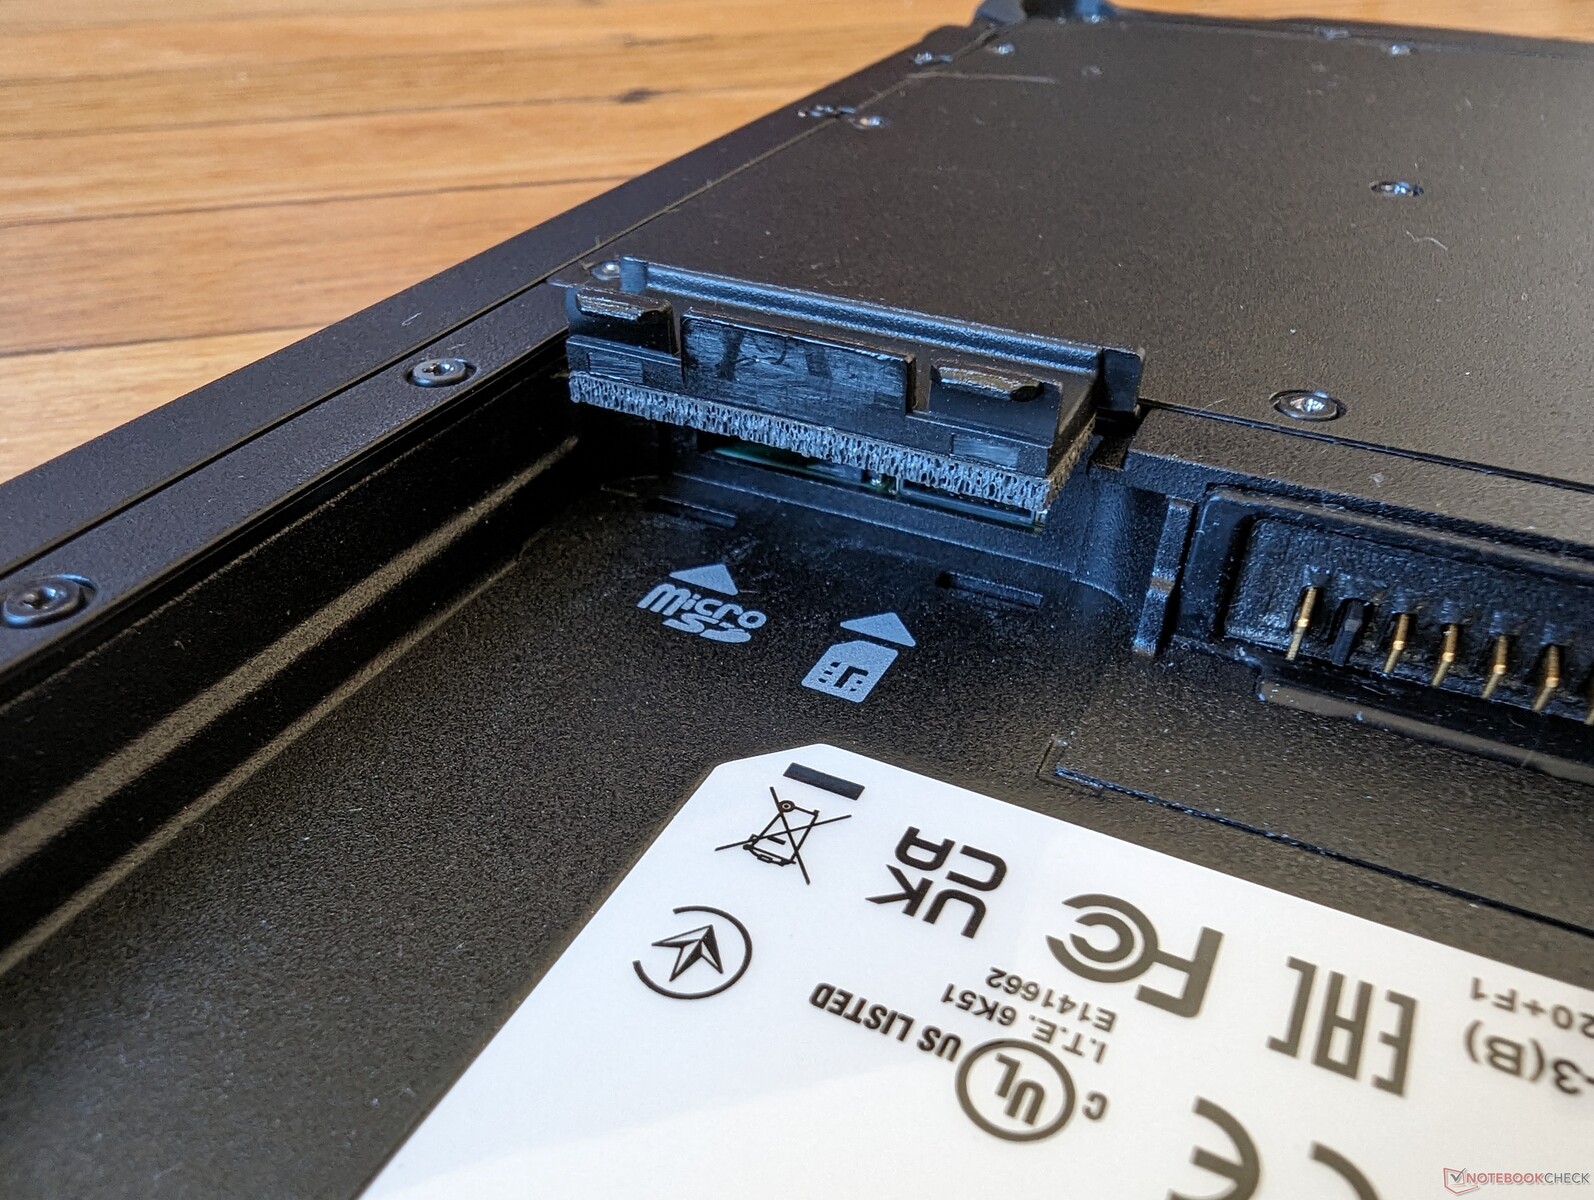
Lettore di schede SD: la scheda MicroSD si blocca
Il rilascio a molla del lettore di schede SD integrato è molto debole rispetto ai lettori di schede della maggior parte dei laptop e tablet. La nostra scheda MicroSD di prova si incastrava e richiedeva una pinzetta per essere rimossa con attenzione.
| SD Card Reader | |
| average JPG Copy Test (av. of 3 runs) | |
| Dell Latitude 7230 Rugged Extreme (AV Pro V60) | |
| Durabook R8 Tablet (AV Pro V60) | |
| Lenovo Tab M8 (Gen 4) (Angelbird V60) | |
| maximum AS SSD Seq Read Test (1GB) | |
| Dell Latitude 7230 Rugged Extreme (AV Pro V60) | |
| Durabook R8 Tablet (AV Pro V60) | |
Comunicazione
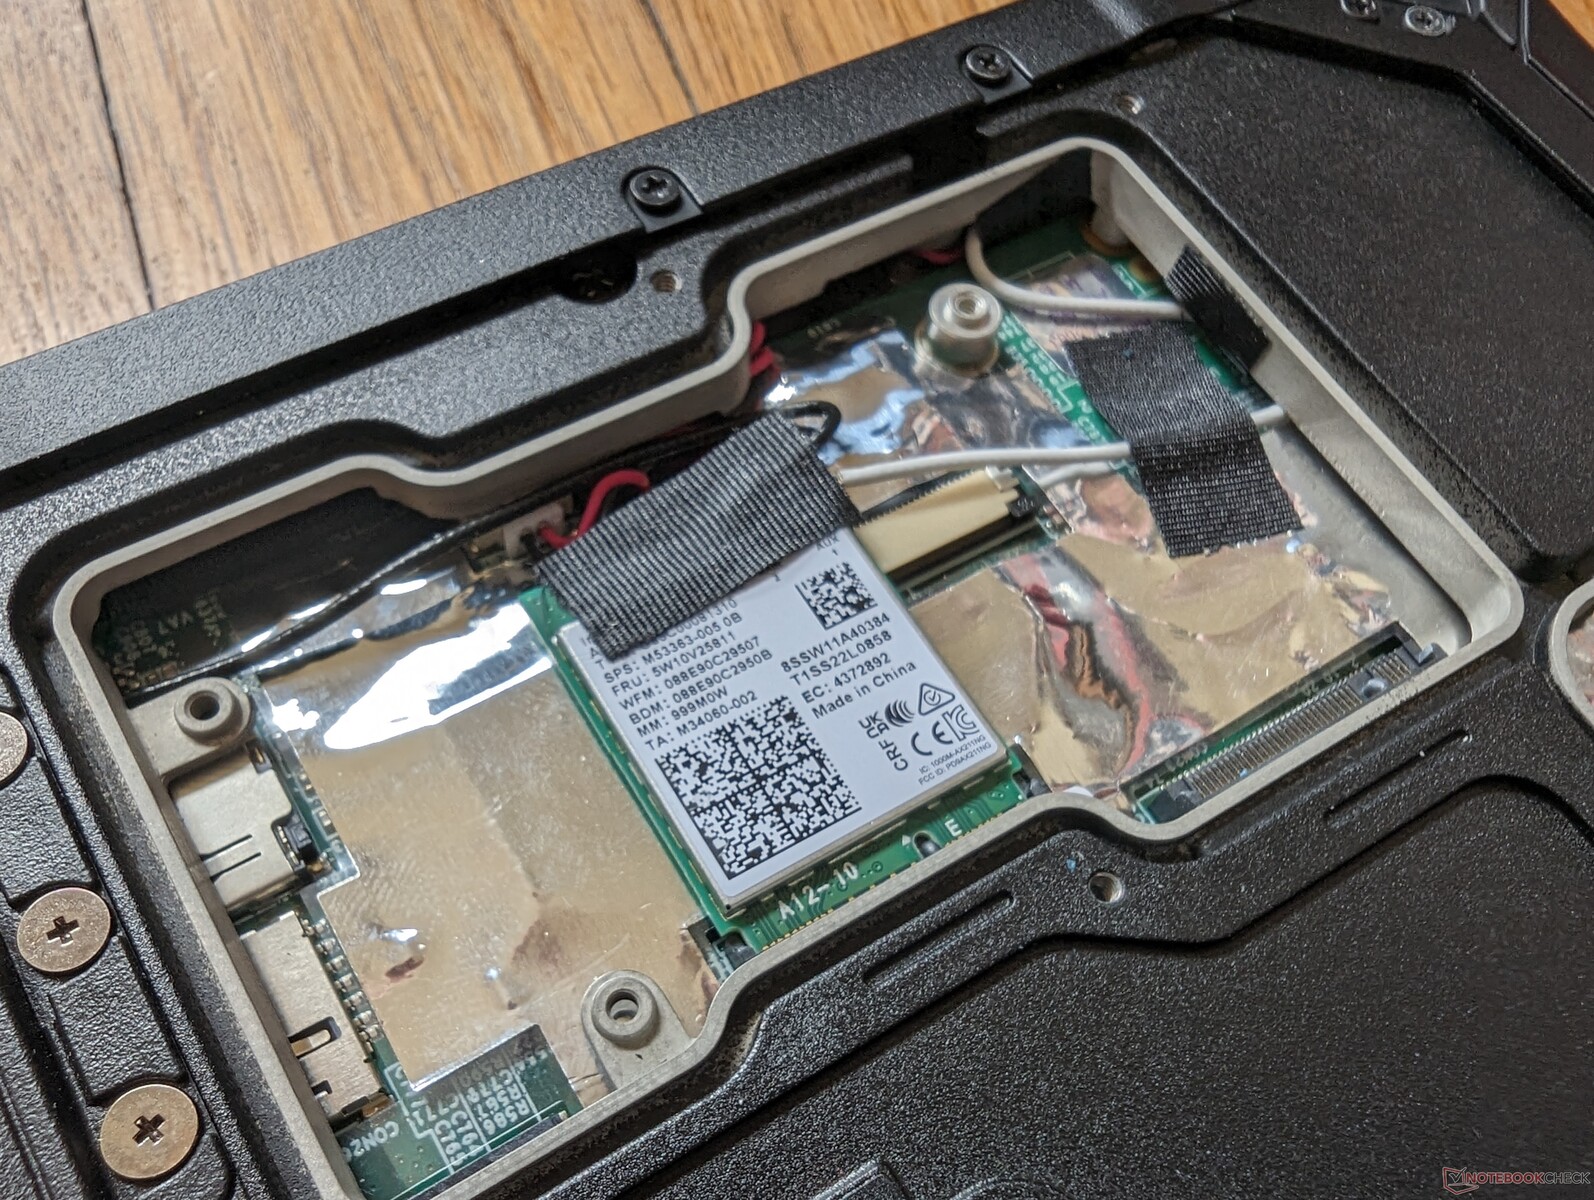
La connettività Wi-Fi 6E e Bluetooth 5.3 è garantita da un Intel AX211. Le velocità di trasferimento sono costanti e senza problemi.
| Networking | |
| iperf3 transmit AX12 | |
| Panasonic Toughbook FZ-G2 | |
| Acer Enduro T1 ET108-11A A9001 | |
| iperf3 receive AX12 | |
| Panasonic Toughbook FZ-G2 | |
| Acer Enduro T1 ET108-11A A9001 | |
| iperf3 transmit AXE11000 | |
| Durabook R8 Tablet | |
| Dell Latitude 7230 Rugged Extreme | |
| Lenovo Tab M8 (Gen 4) | |
| iperf3 receive AXE11000 | |
| Durabook R8 Tablet | |
| Dell Latitude 7230 Rugged Extreme | |
| Lenovo Tab M8 (Gen 4) | |
| iperf3 transmit AXE11000 6GHz | |
| Dell Latitude 7230 Rugged Extreme | |
| Durabook R8 Tablet | |
| iperf3 receive AXE11000 6GHz | |
| Durabook R8 Tablet | |
| Dell Latitude 7230 Rugged Extreme | |
Webcam
La fotocamera frontale da 2 MP è di serie, mentre quella posteriore da 8 MP con flash è un aggiornamento opzionale. La qualità dell'immagine è più nitida rispetto alle webcam dei computer portatili, ma la qualità video è limitata a 1080p e 30 FPS nonostante il sensore a risoluzione più elevata.


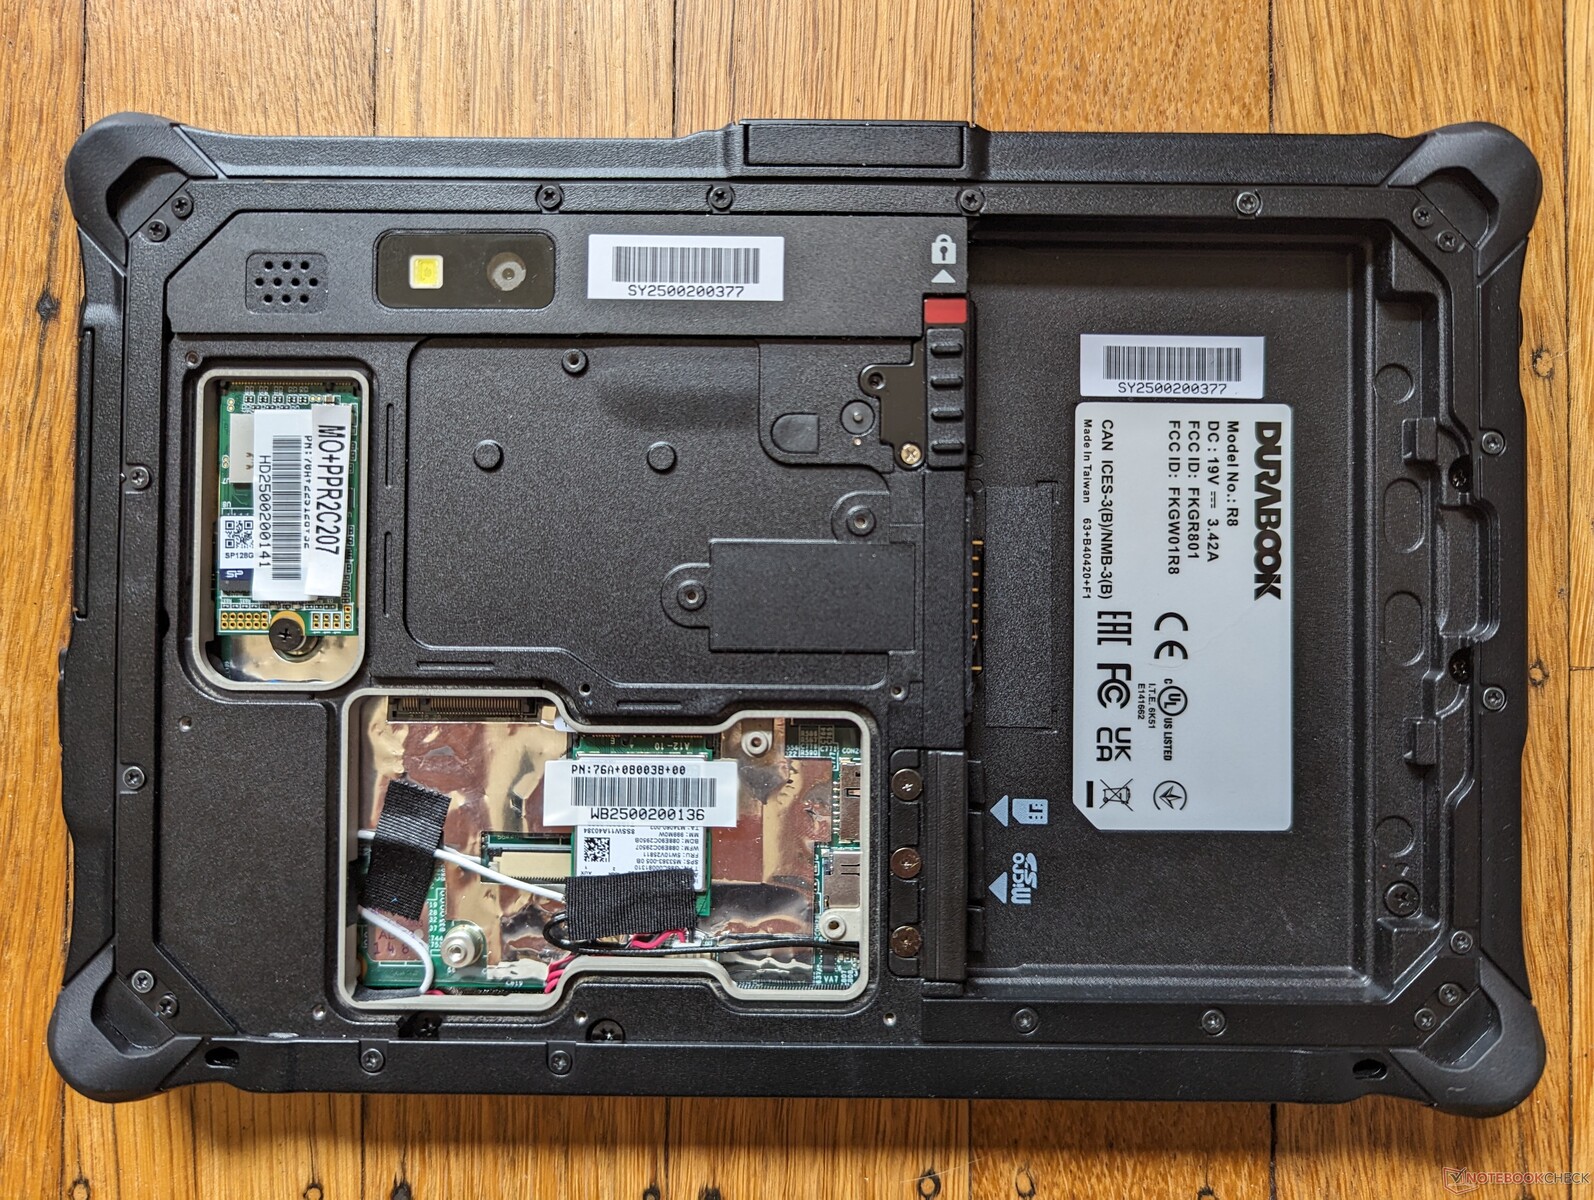
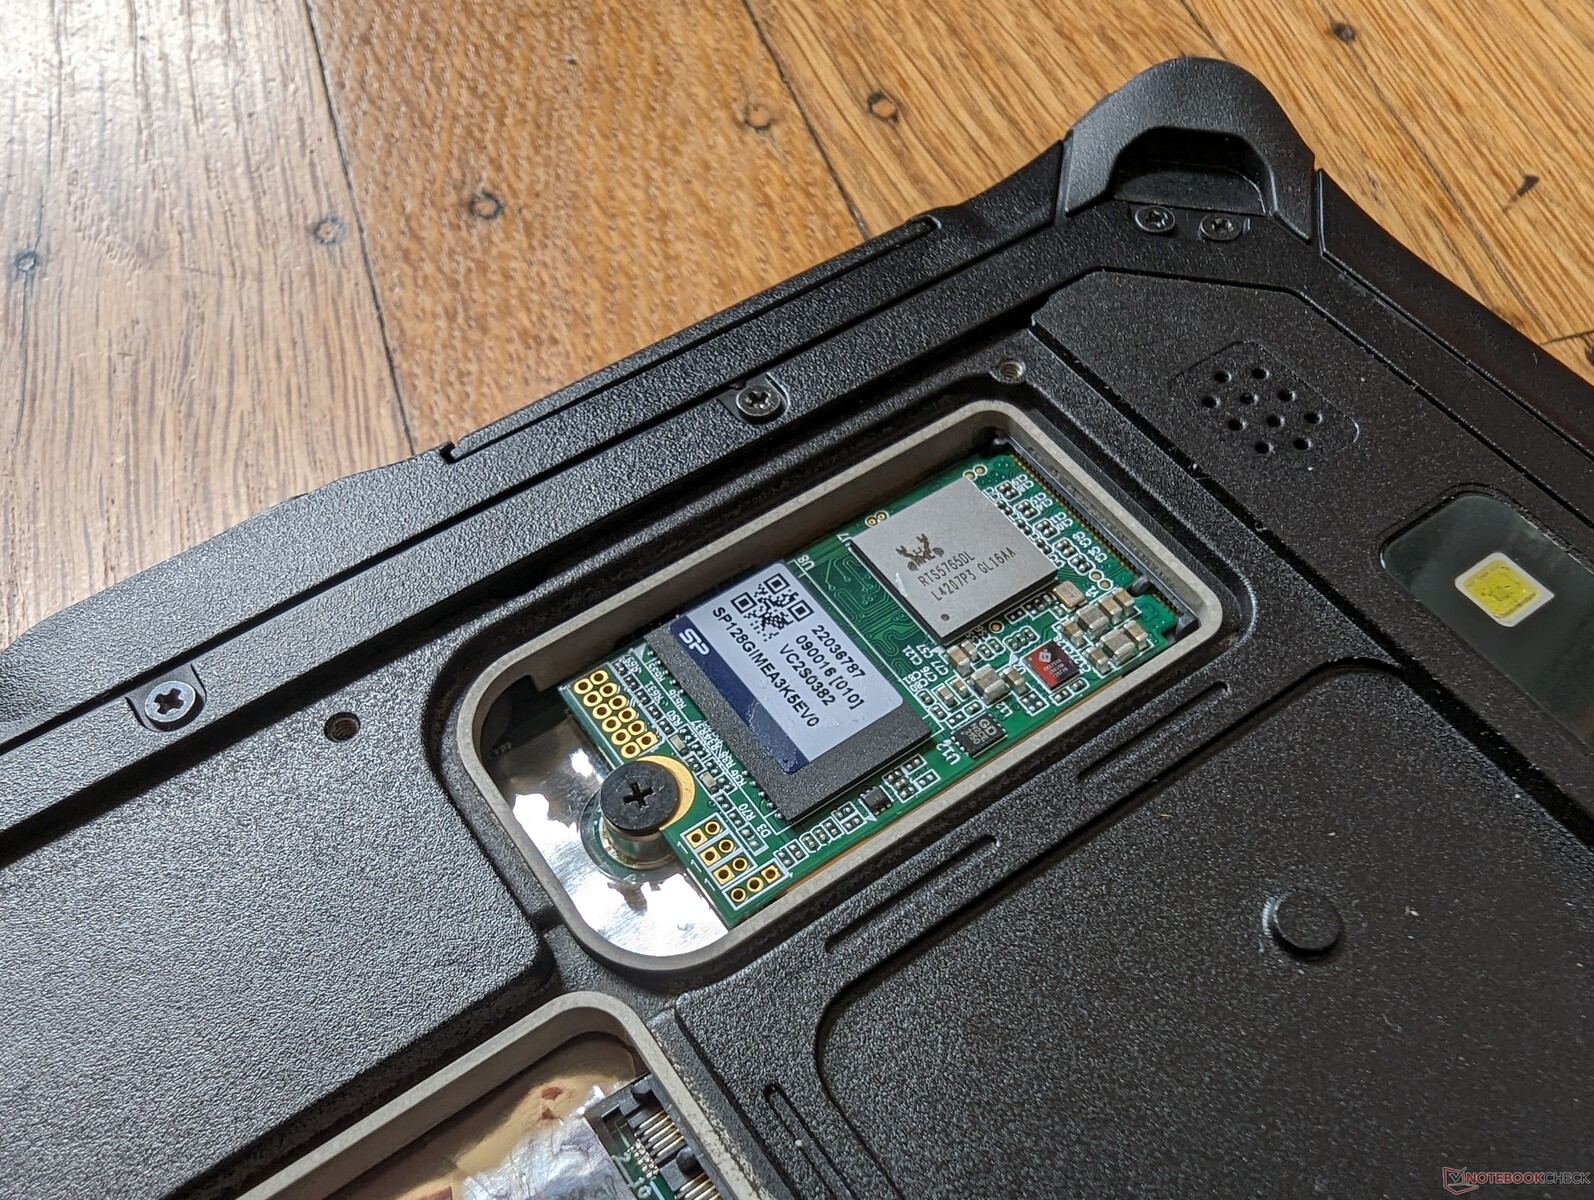
Manutenzione
Accessori e garanzia
La confezione include uno stilo passivo e un cordino da polso. Gli accessori opzionali sono numerosi, come un supporto specializzato per la docking station con porte aggiuntive, una batteria di riserva di maggiore capacità, alloggiamenti per la ricarica della batteria, lettori di smart card, diversi tipi di adattatori CA e molto altro ancora, come illustrato in dettaglio su https://media.durabook.com/wp-content/uploads/2023/06/13125656/Solutions-Guide-R8-US-06-2023.pdf.
La garanzia di tre anni per danni accidentali è di serie.
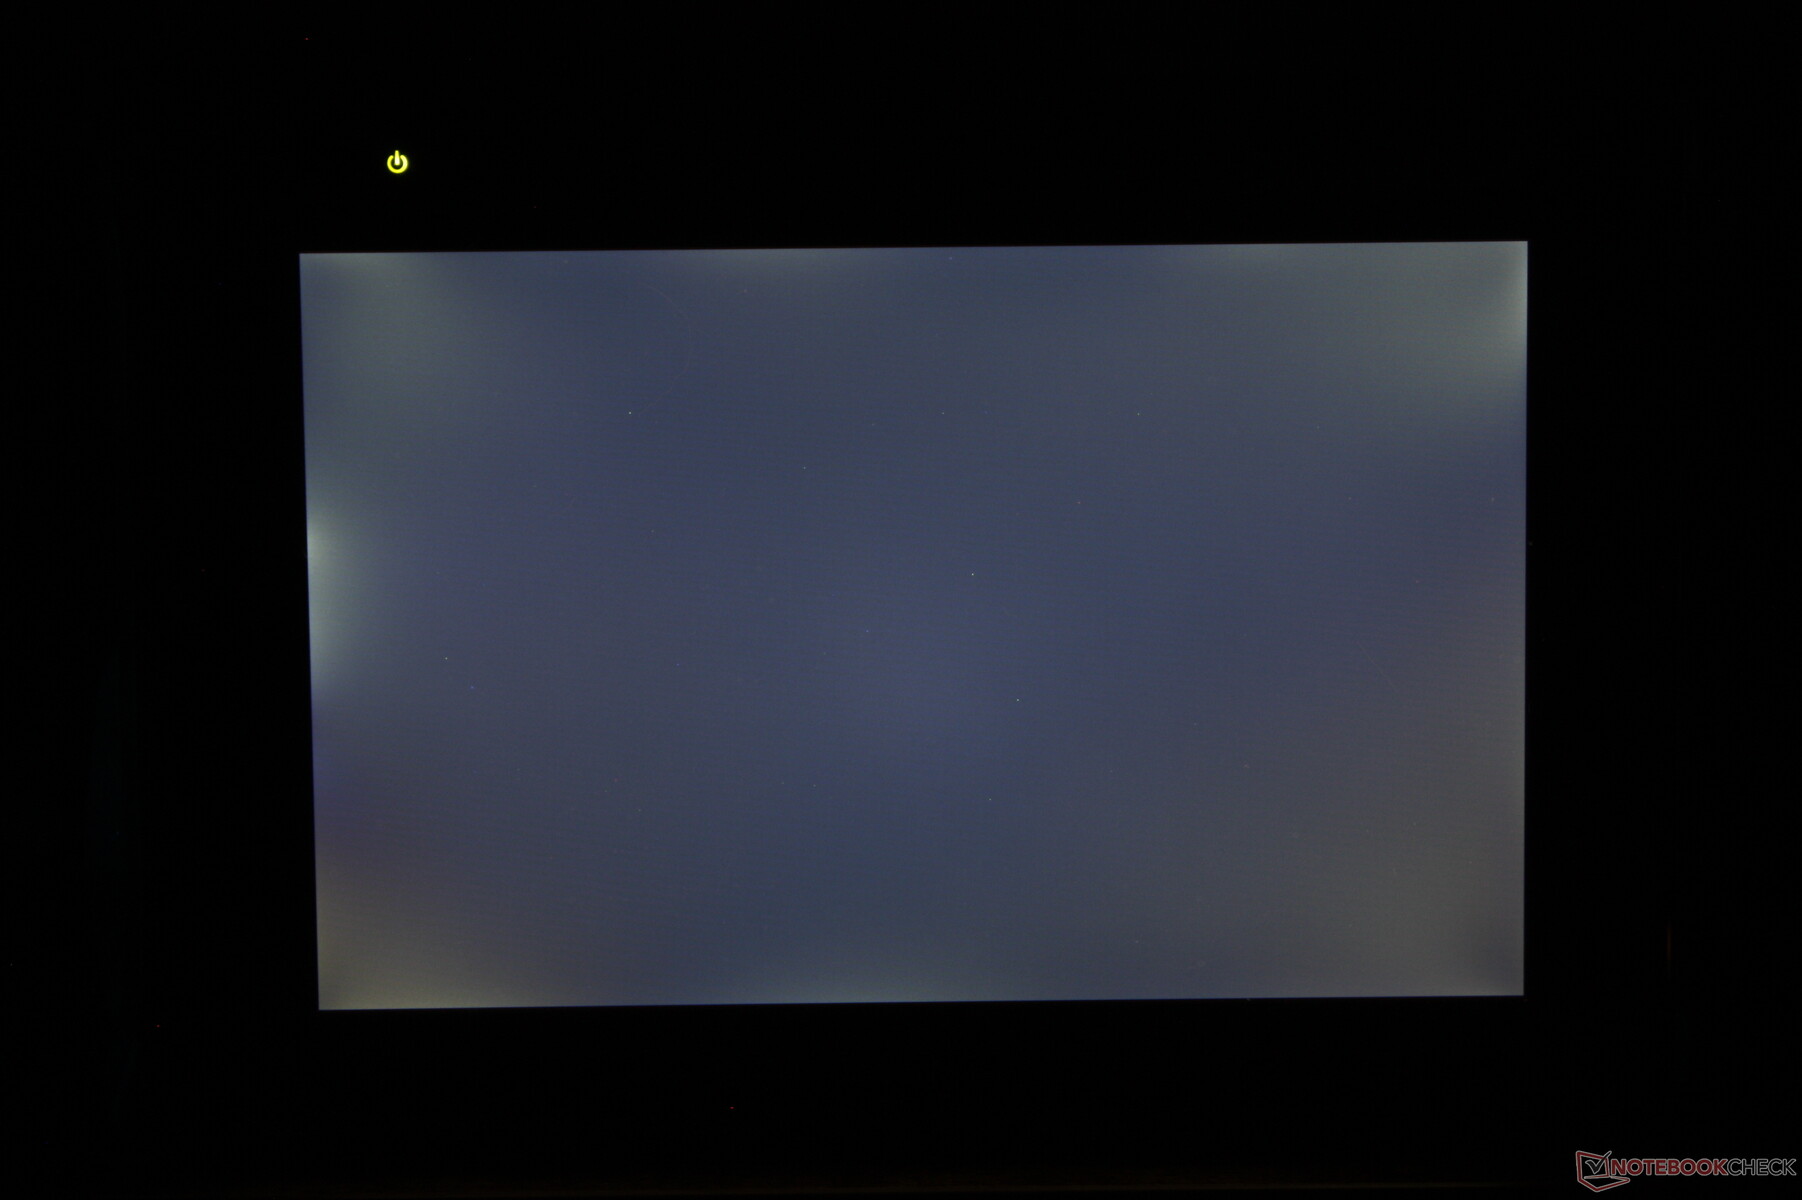
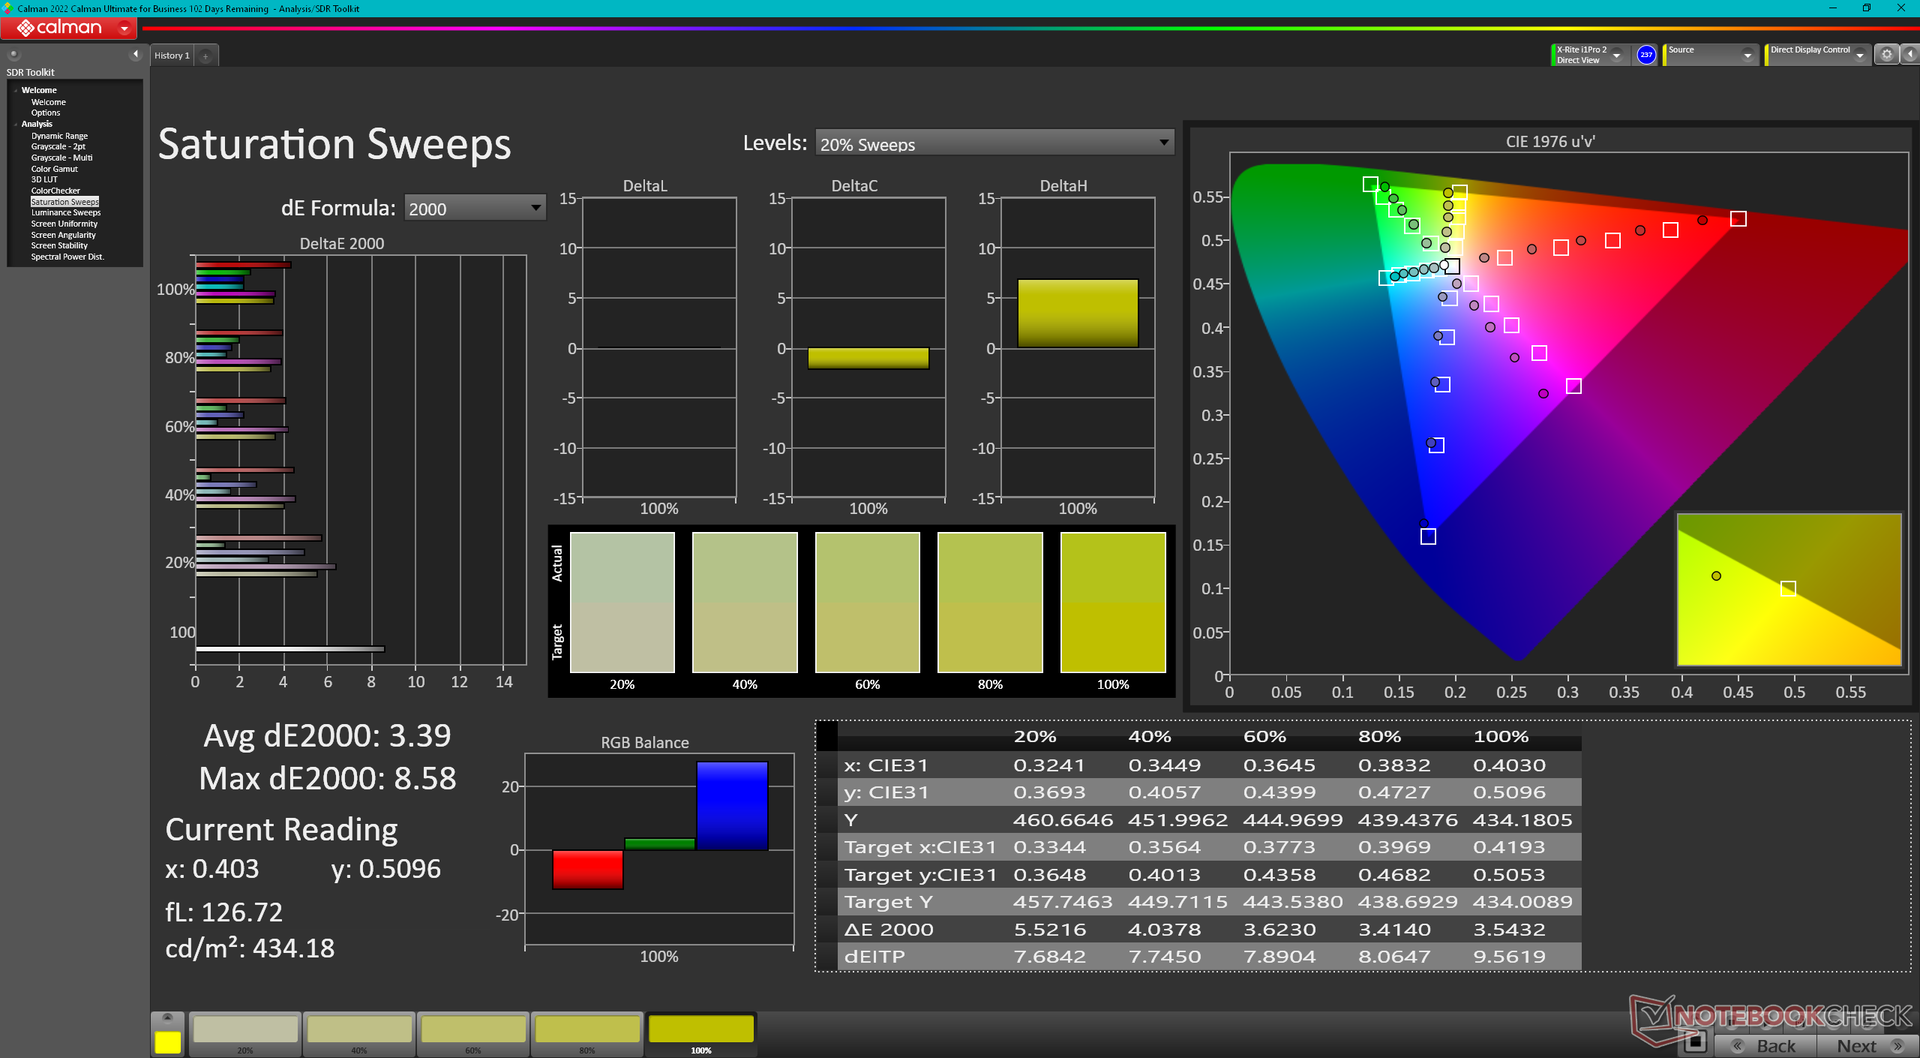
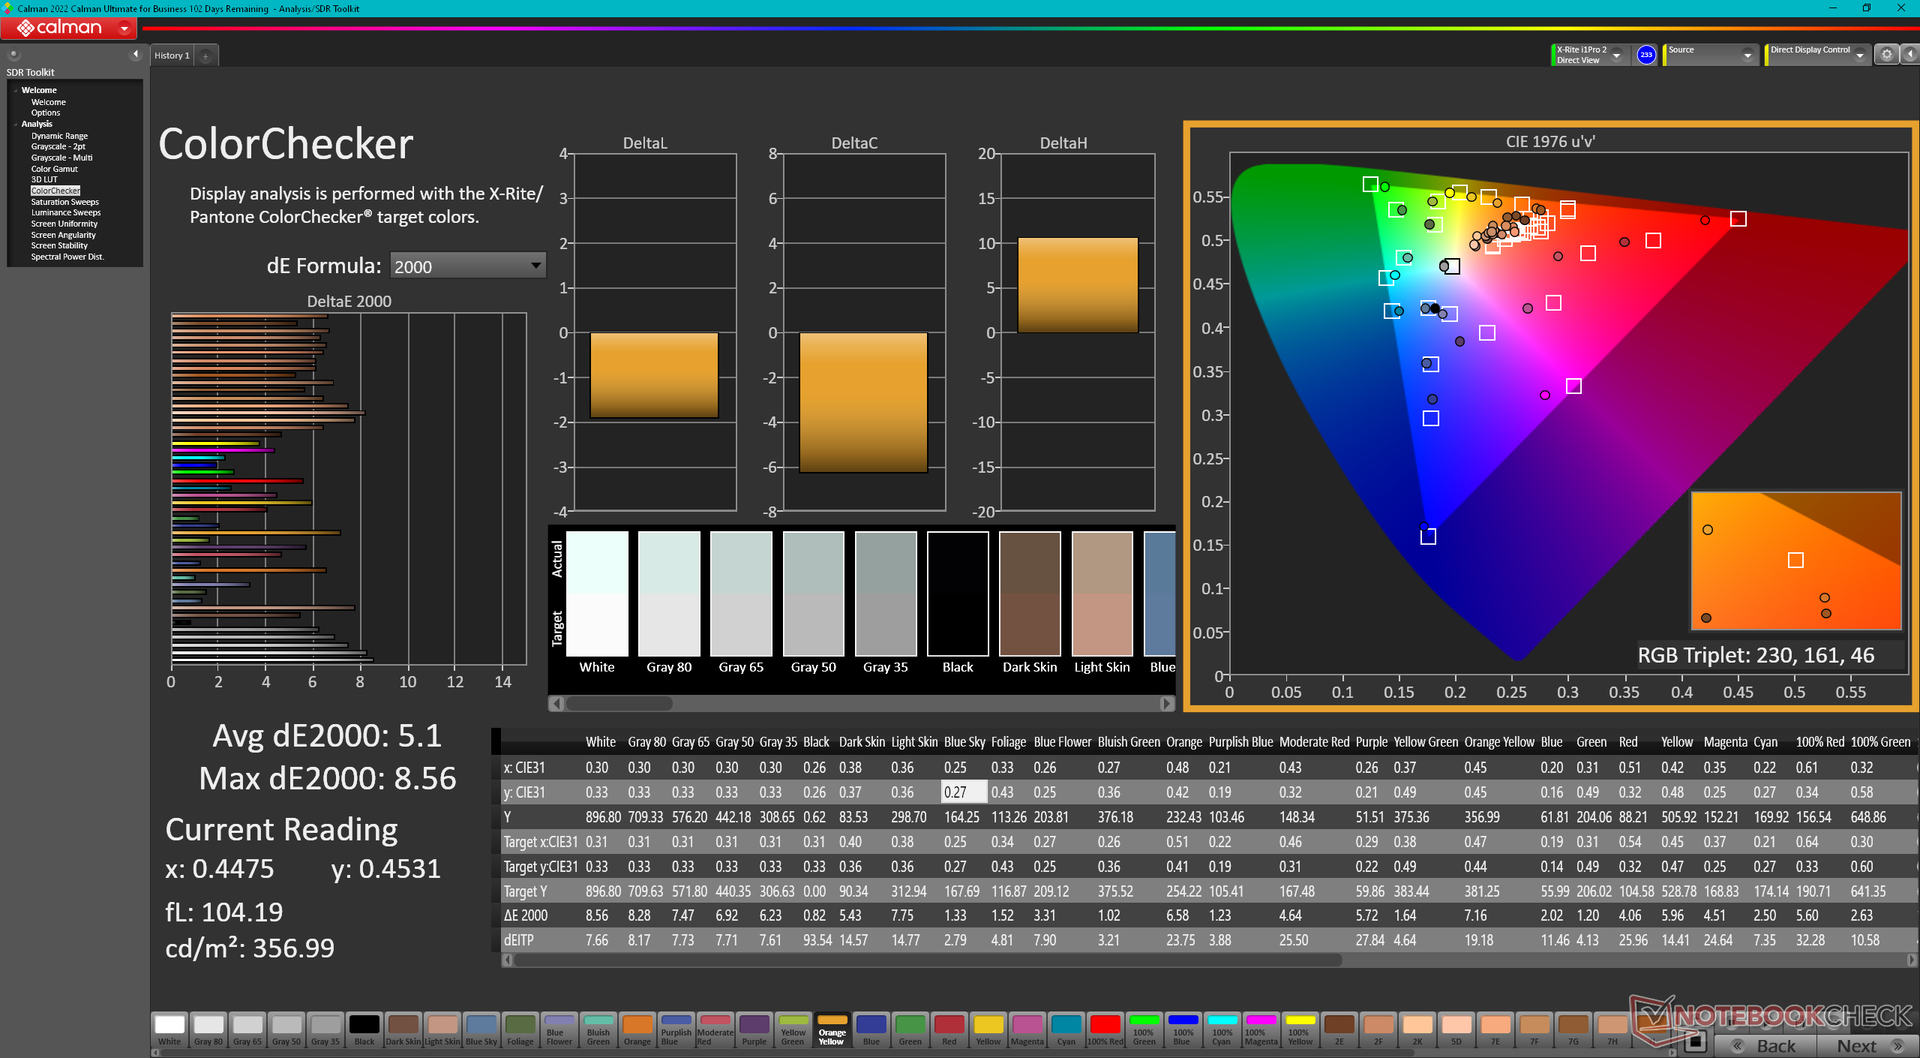
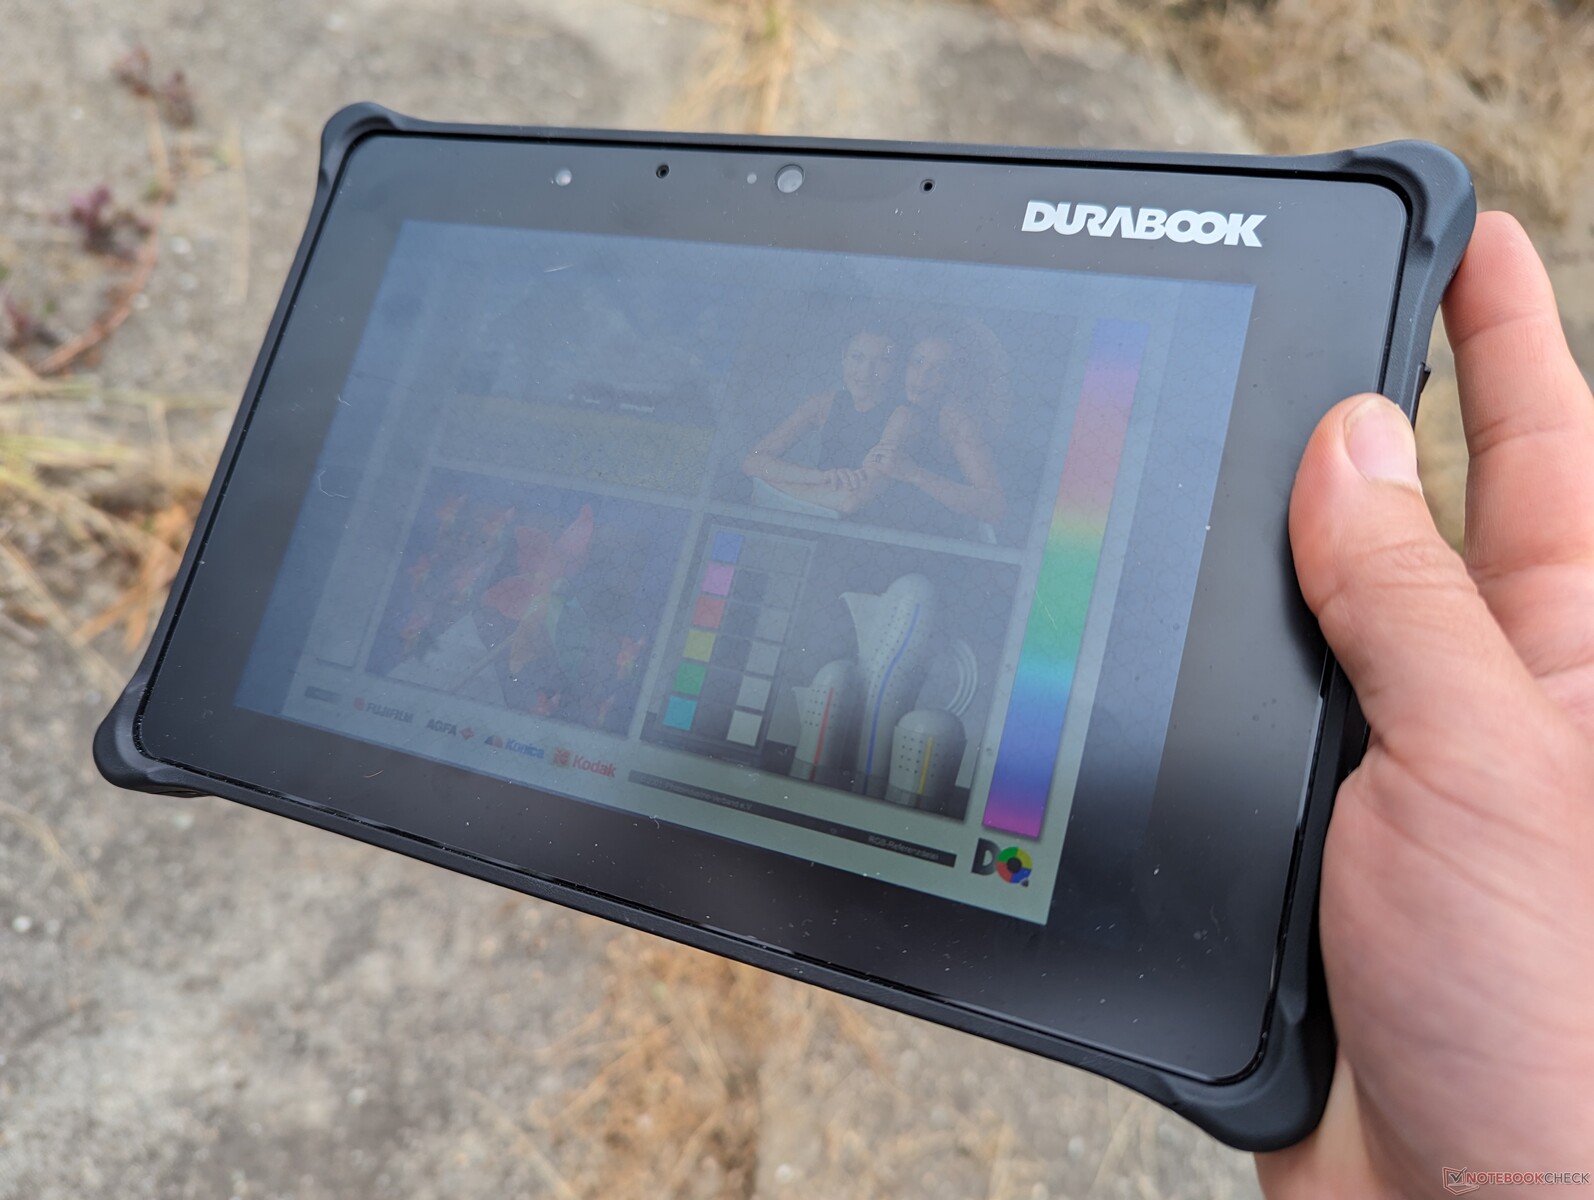
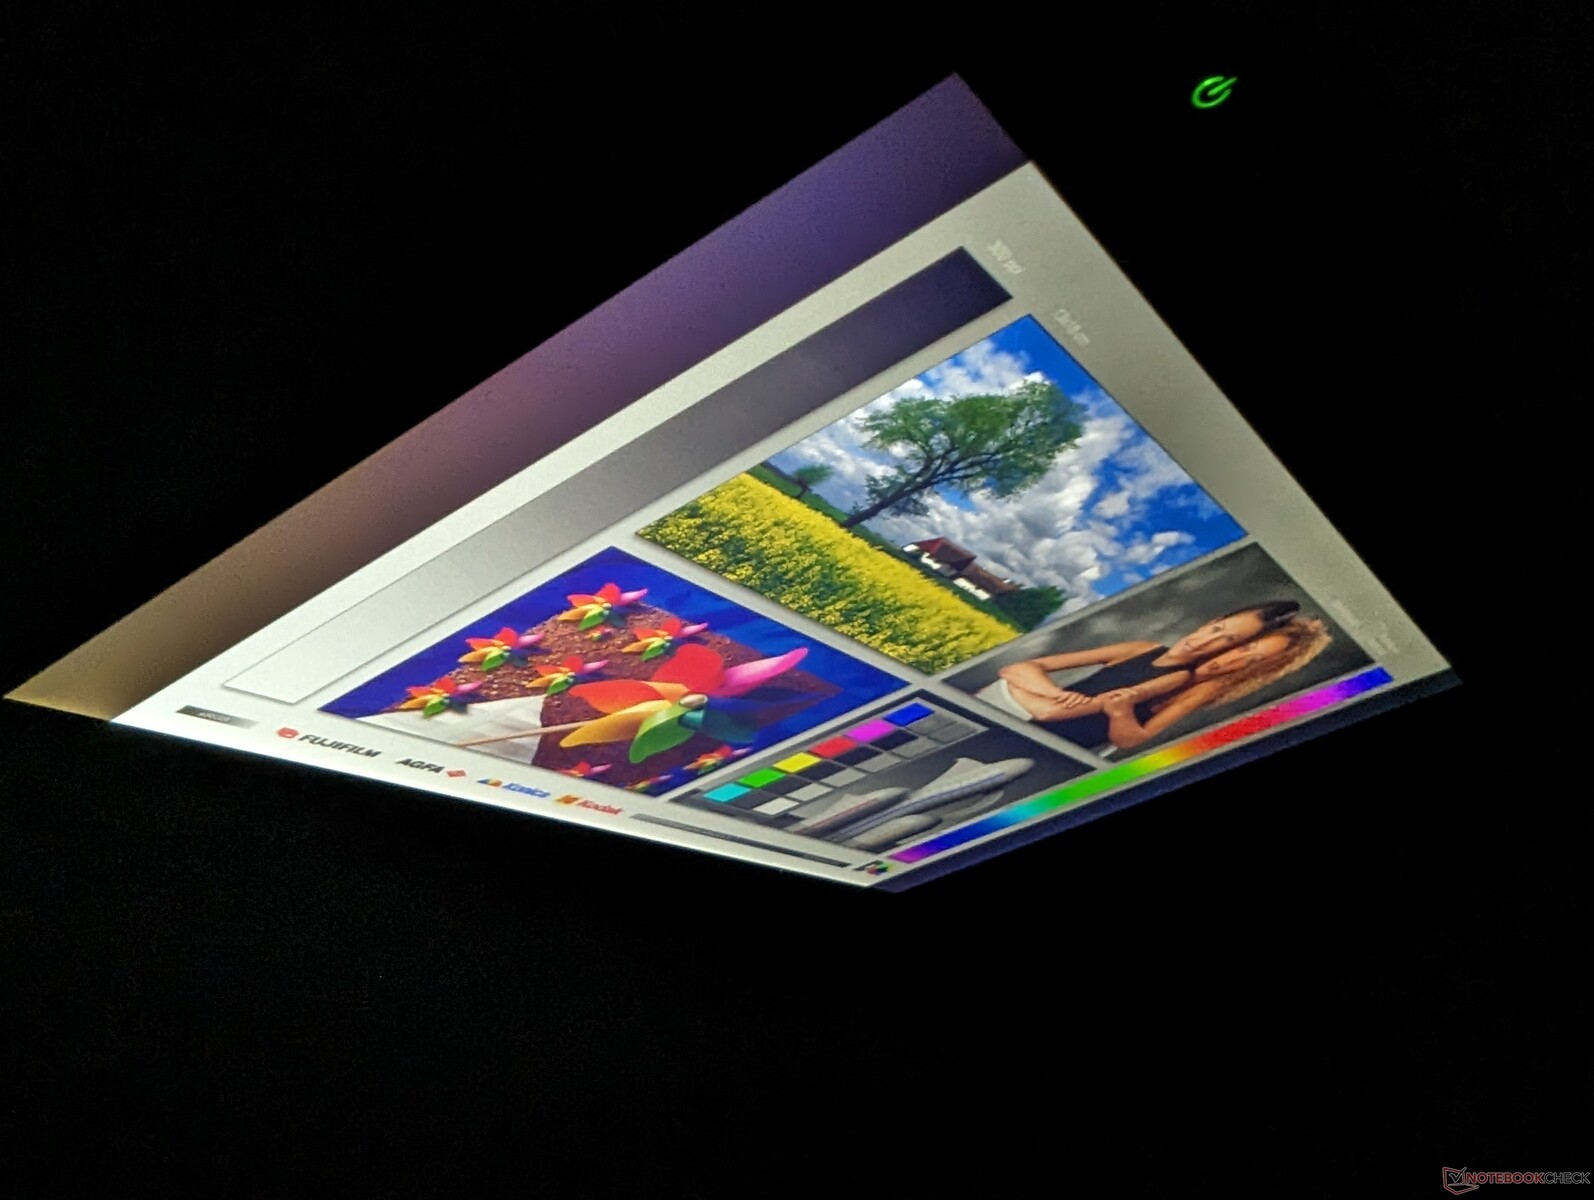
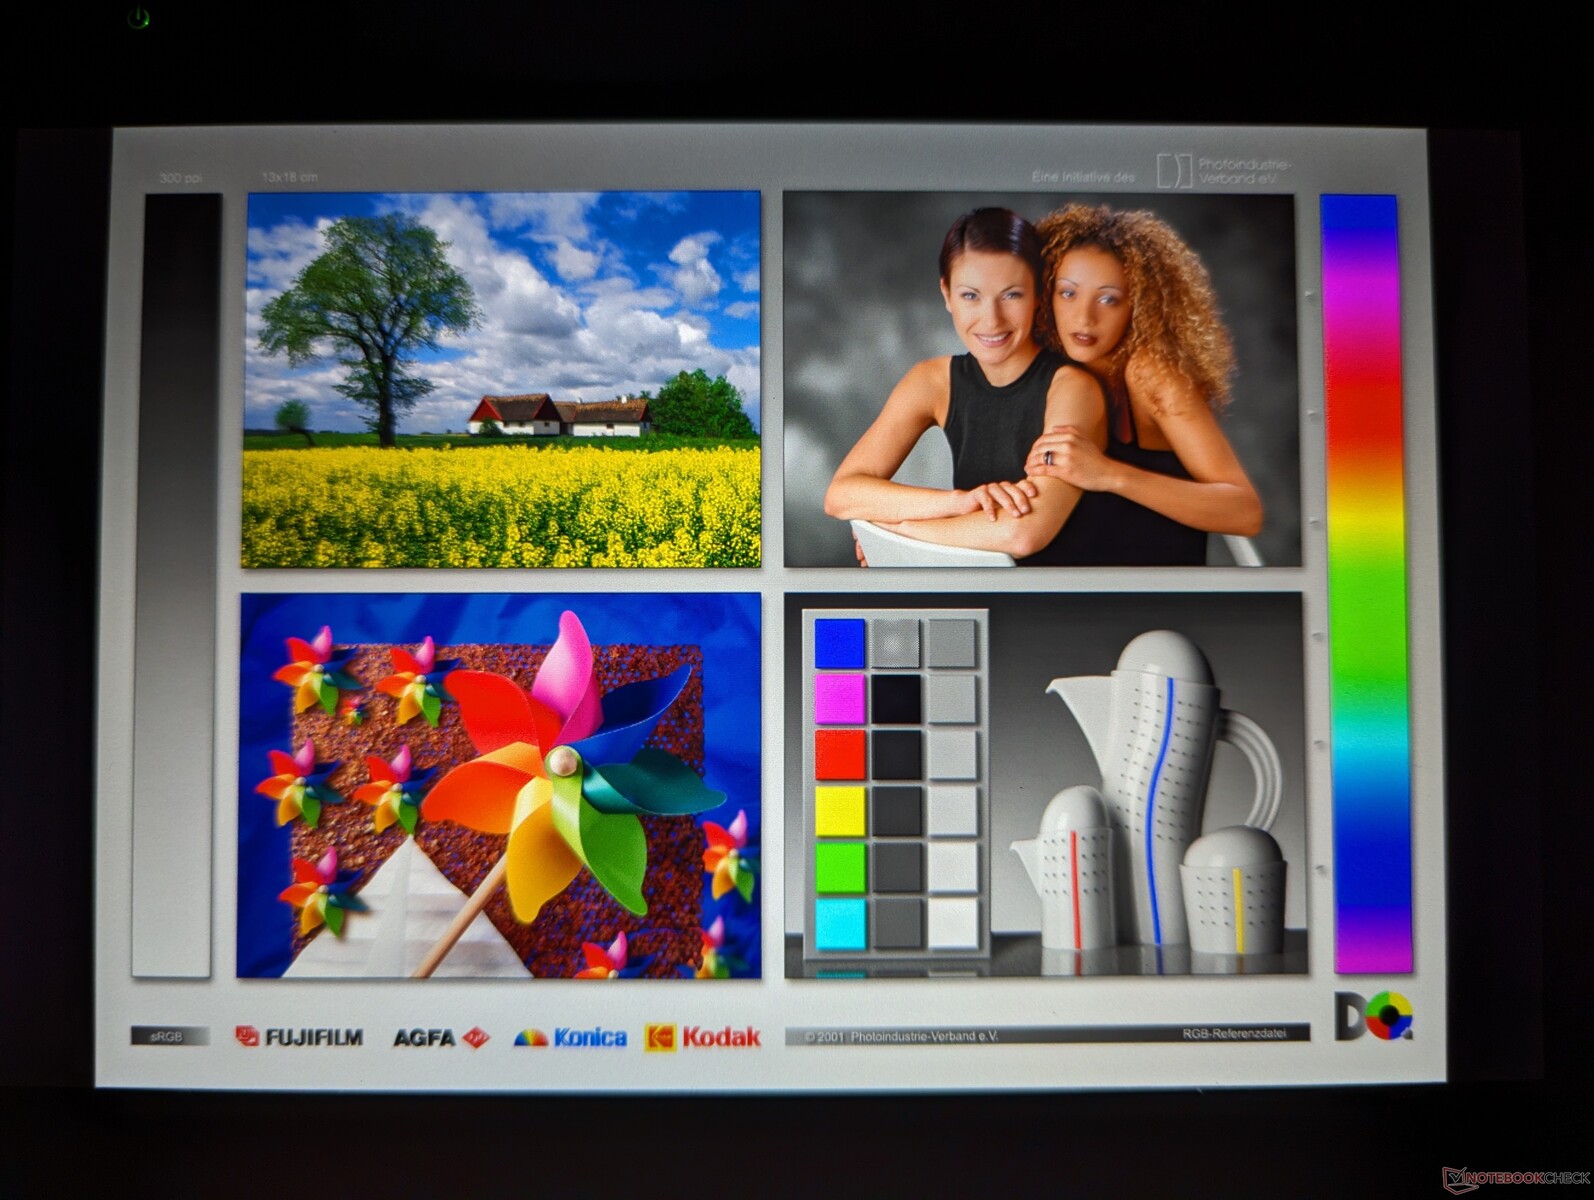
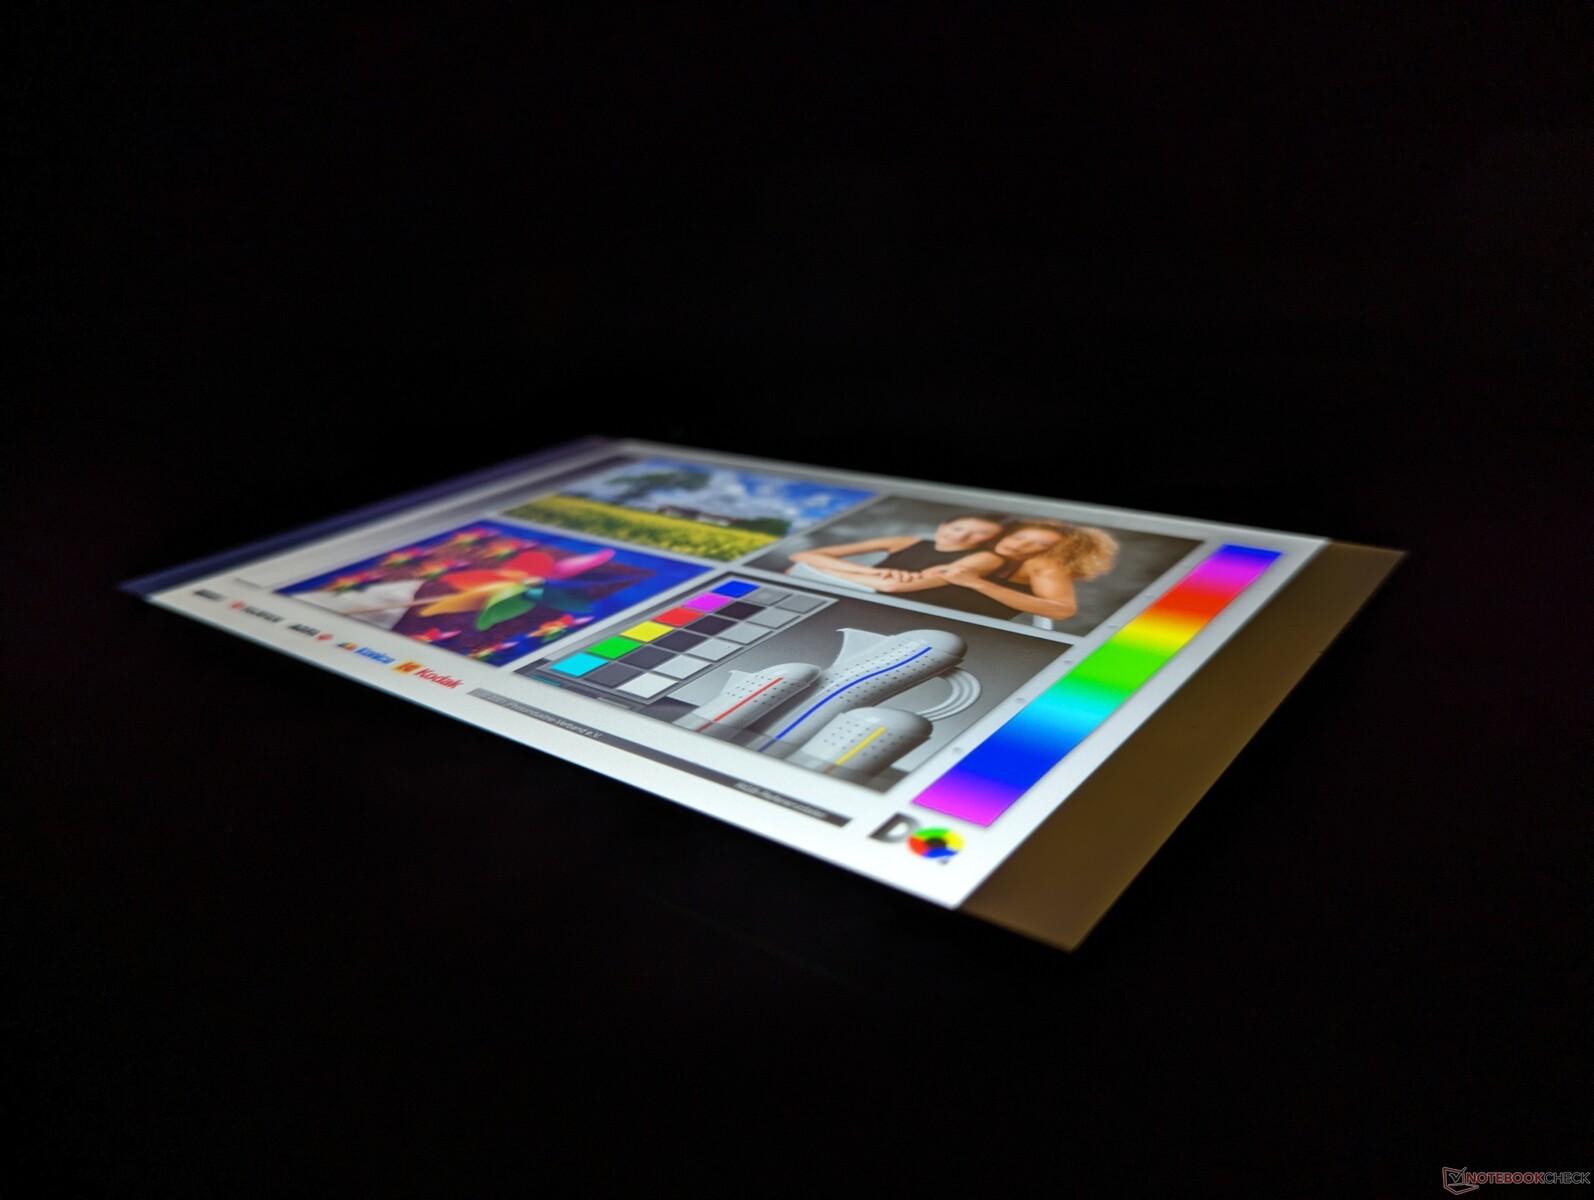
Display - Touchscreen luminoso a 800 nit
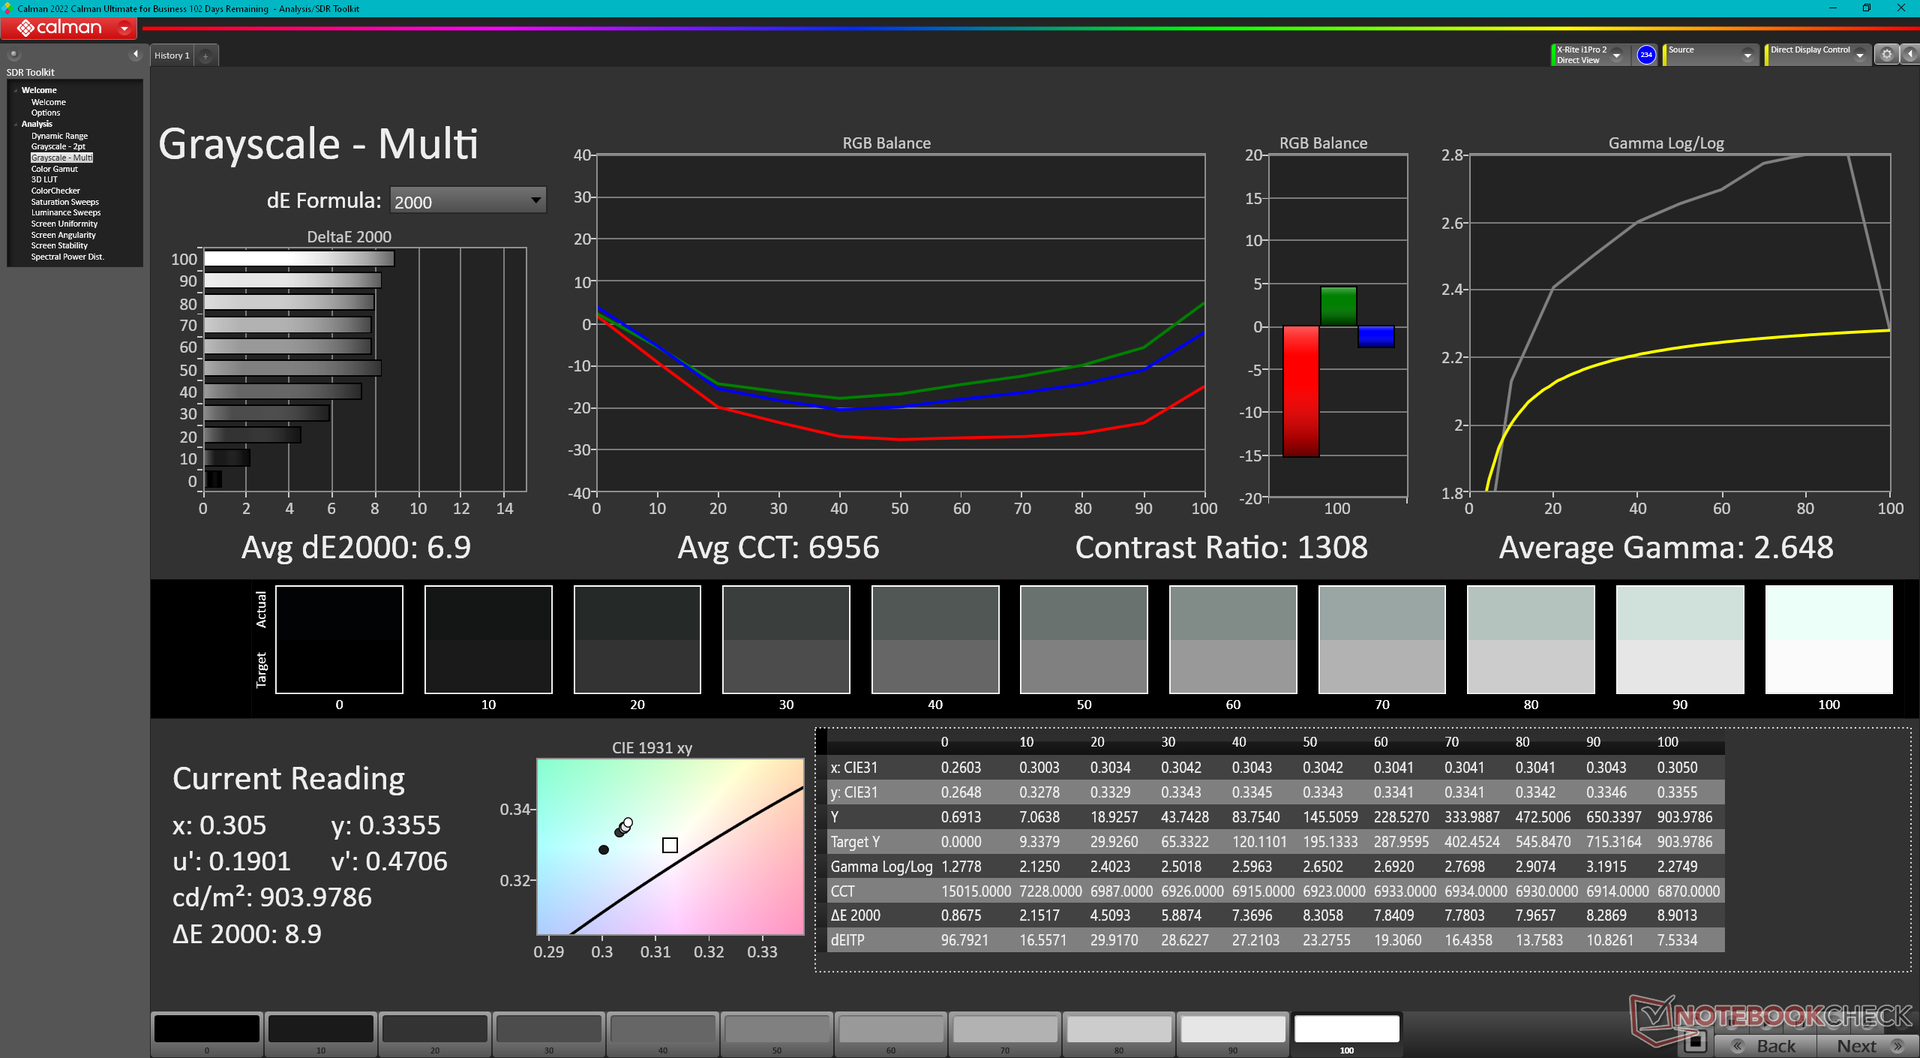
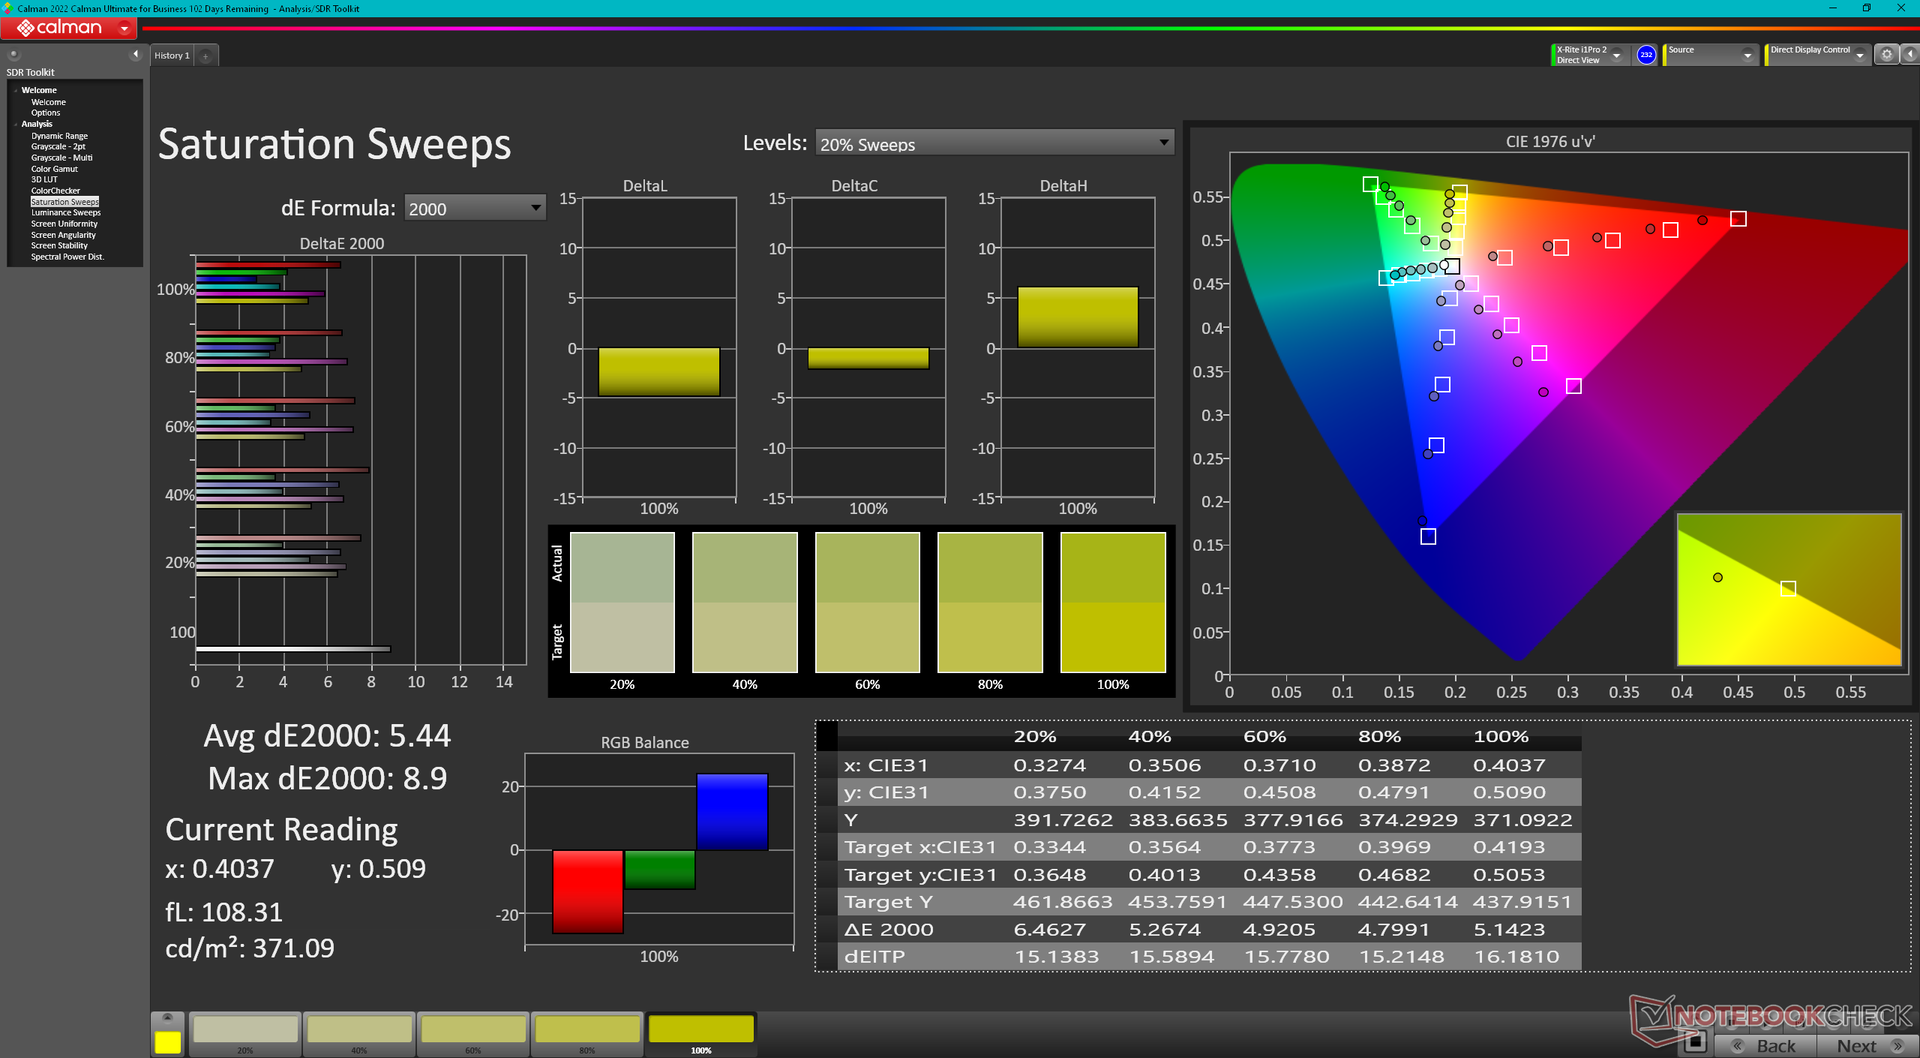
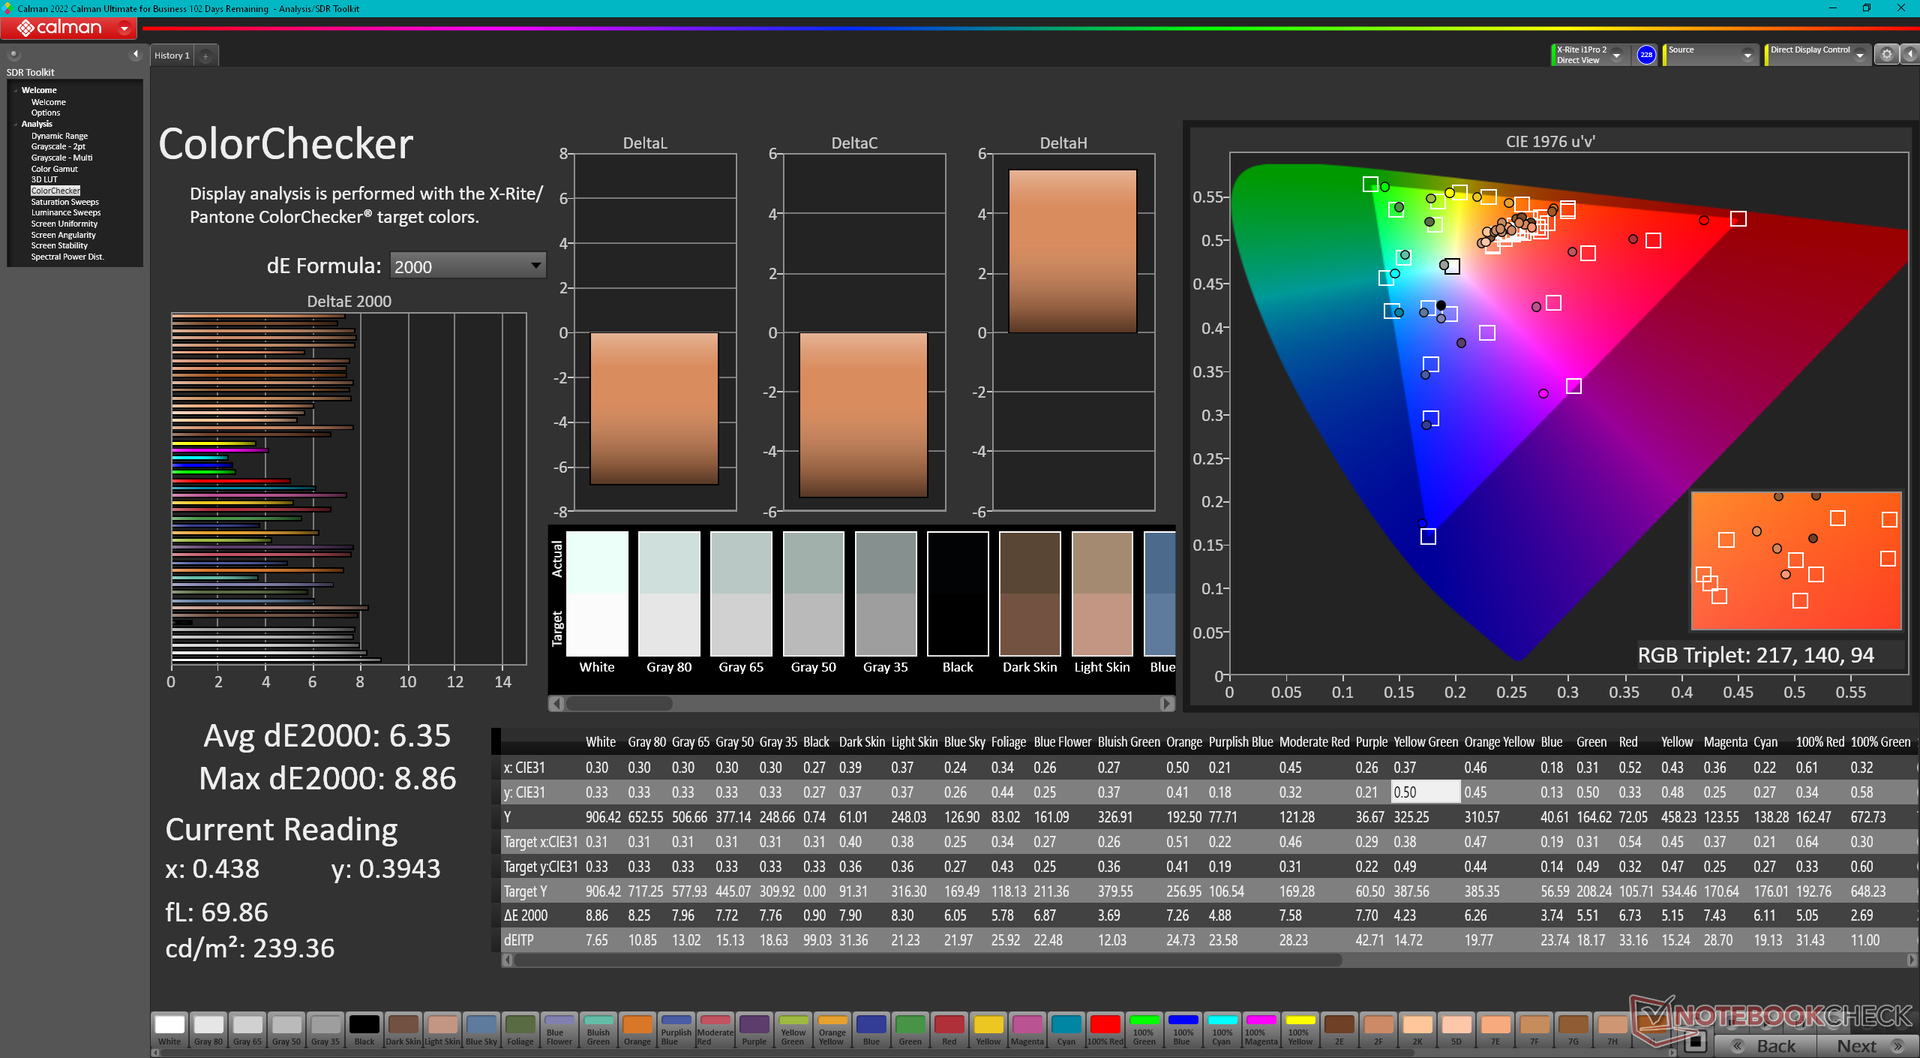
Il produttore dichiara una luminosità massima di 800 nits, che possiamo confermare con le nostre misurazioni indipendenti. Anche il rapporto di contrasto è rispettabile, appena superiore a 1000:1, simile a quello dei display della maggior parte dei portatili consumer. Sfortunatamente, altri aspetti del display sono mediocri, come la copertura limitata dei colori, i tempi di risposta medi e i pixel un po' sgranati. Se i vostri carichi di lavoro richiedono che le immagini e i testi di piccole dimensioni siano il più nitidi possibile, il Durabook R8 potrebbe non fare al caso vostro.
Il touchscreen multi-touch può essere commutato tra la modalità capacitiva per gli input con le dita e la modalità resistiva per gli input con guanti o stilo.

| |||||||||||||||||||||||||
Distribuzione della luminosità: 85 %
Al centro con la batteria: 943.7 cd/m²
Contrasto: 1110:1 (Nero: 0.85 cd/m²)
ΔE ColorChecker Calman: 6.35 | ∀{0.5-29.43 Ø4.71}
calibrated: 5.1
ΔE Greyscale Calman: 6.9 | ∀{0.09-98 Ø4.96}
53.1% AdobeRGB 1998 (Argyll 3D)
77.4% sRGB (Argyll 3D)
51.5% Display P3 (Argyll 3D)
Gamma: 2.65
CCT: 6956 K
| Durabook R8 Tablet Digital Flat Panel, IPS, 1280x800, 8" | Acer Enduro T1 ET108-11A A9001 IPS, 1280x800, 8" | Lenovo Tab M8 (Gen 4) IPS, 1280x800, 8" | Dell Latitude 7230 Rugged Extreme Sharp LQ120N1, IPS, 1920x1200, 12" | Panasonic Toughbook FZ-G2 InfoVision M133NWFD R1, IPS, 1920x1200, 10.1" | |
|---|---|---|---|---|---|
| Display | 27% | 1% | |||
| Display P3 Coverage (%) | 51.5 | 66.2 29% | 52.1 1% | ||
| sRGB Coverage (%) | 77.4 | 96.1 24% | 78.5 1% | ||
| AdobeRGB 1998 Coverage (%) | 53.1 | 68.4 29% | 53.8 1% | ||
| Response Times | -20% | -34% | 12% | -63% | |
| Response Time Grey 50% / Grey 80% * (ms) | 32.4 ? | 33.6 ? -4% | 29.2 ? 10% | 28.4 ? 12% | 54.4 ? -68% |
| Response Time Black / White * (ms) | 21.9 ? | 29.6 ? -35% | 39 ? -78% | 19.4 ? 11% | 34.4 ? -57% |
| PWM Frequency (Hz) | 300 ? | 211.9 ? | |||
| Screen | 2% | 17% | 47% | 38% | |
| Brightness middle (cd/m²) | 943.7 | 350 -63% | 410 -57% | 1326.7 41% | 1078.6 14% |
| Brightness (cd/m²) | 870 | 353 -59% | 380 -56% | 1193 37% | 1056 21% |
| Brightness Distribution (%) | 85 | 92 8% | 86 1% | 82 -4% | 90 6% |
| Black Level * (cd/m²) | 0.85 | 0.21 75% | 0.16 81% | 0.85 -0% | 0.48 44% |
| Contrast (:1) | 1110 | 1667 50% | 2563 131% | 1561 41% | 2247 102% |
| Colorchecker dE 2000 * | 6.35 | 5.68 11% | 4.6 28% | 1.06 83% | 4.18 34% |
| Colorchecker dE 2000 max. * | 8.86 | 10.51 -19% | 9.03 -2% | 3.78 57% | 6.2 30% |
| Colorchecker dE 2000 calibrated * | 5.1 | 0.71 86% | 1.95 62% | ||
| Greyscale dE 2000 * | 6.9 | 6.3 9% | 6.3 9% | 1.5 78% | 4.8 30% |
| Gamma | 2.65 83% | 2.12 104% | 2.519 87% | 2.19 100% | 2.05 107% |
| CCT | 6956 93% | 7390 88% | 7707 84% | 6804 96% | 7565 86% |
| Media totale (Programma / Settaggio) | -9% /
-3% | -9% /
7% | 29% /
37% | -8% /
16% |
* ... Meglio usare valori piccoli
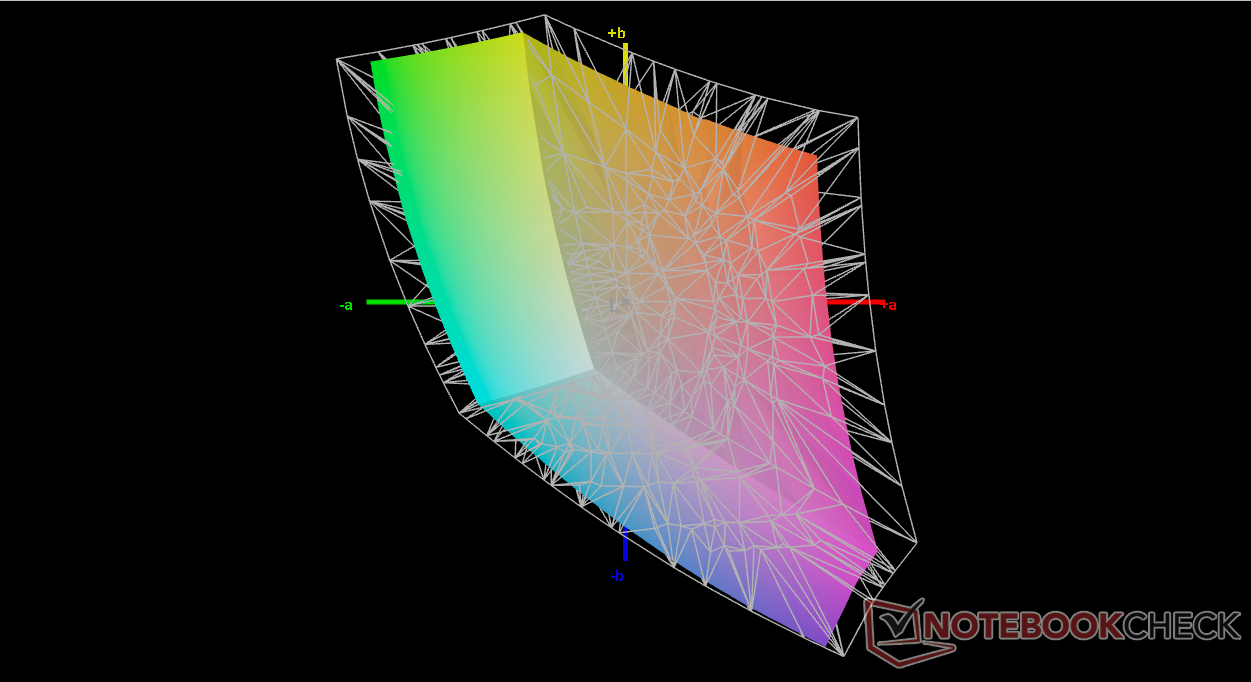
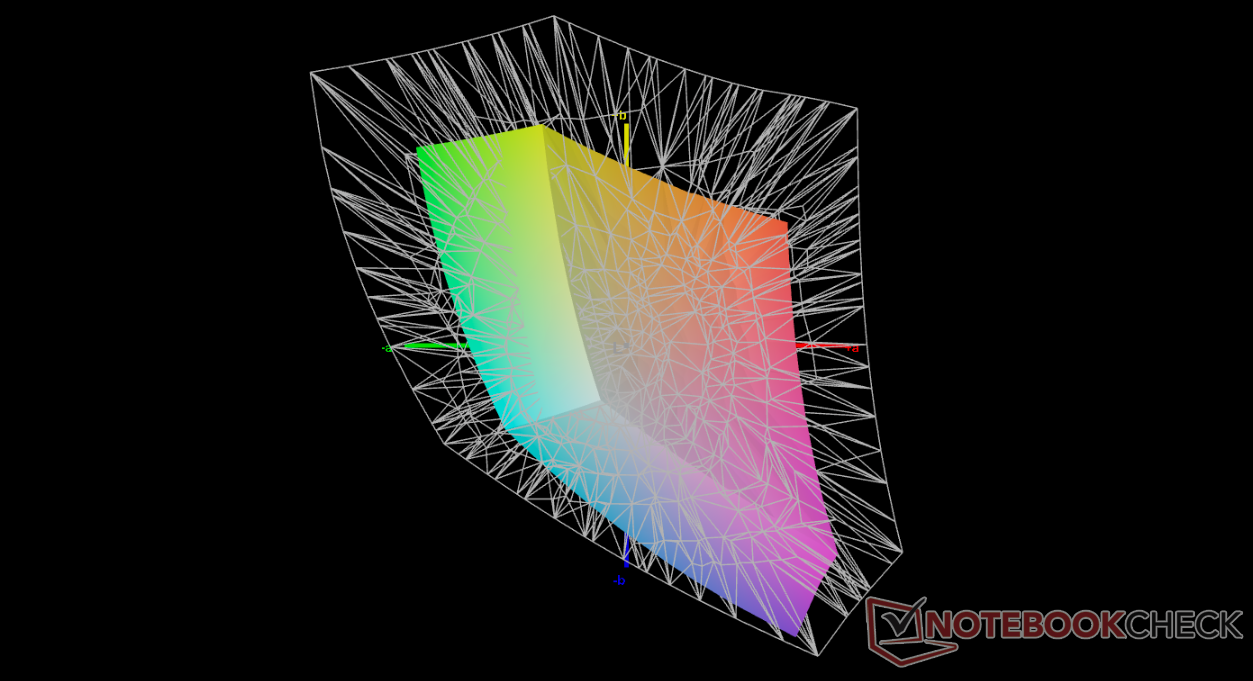
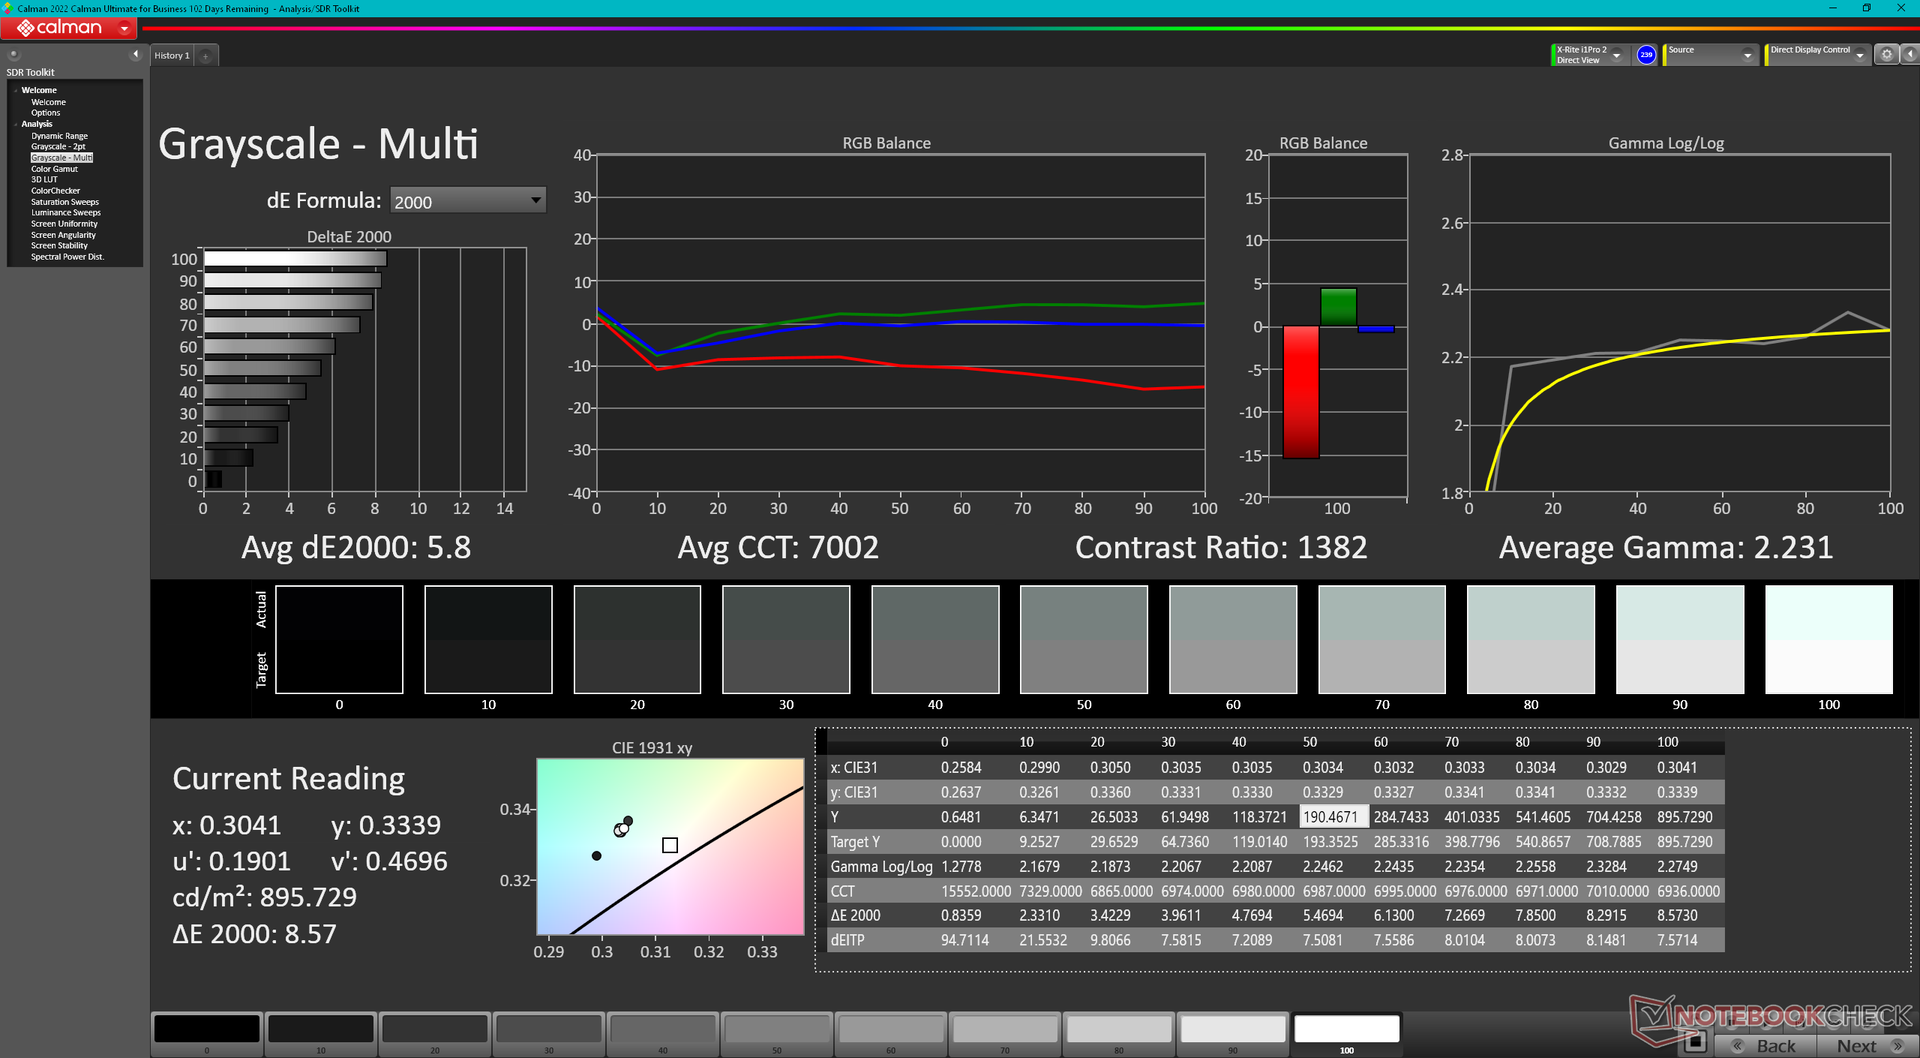
La temperatura del colore è sul lato freddo per impostazione predefinita. La calibrazione del display con il nostro colorimetro X-Rite non produrrebbe miglioramenti significativi a causa della gamma limitata del pannello di cui sopra.
Tempi di risposta del Display
| ↔ Tempi di risposta dal Nero al Bianco | ||
|---|---|---|
| 21.9 ms ... aumenta ↗ e diminuisce ↘ combinato | ↗ 14.2 ms Incremento | 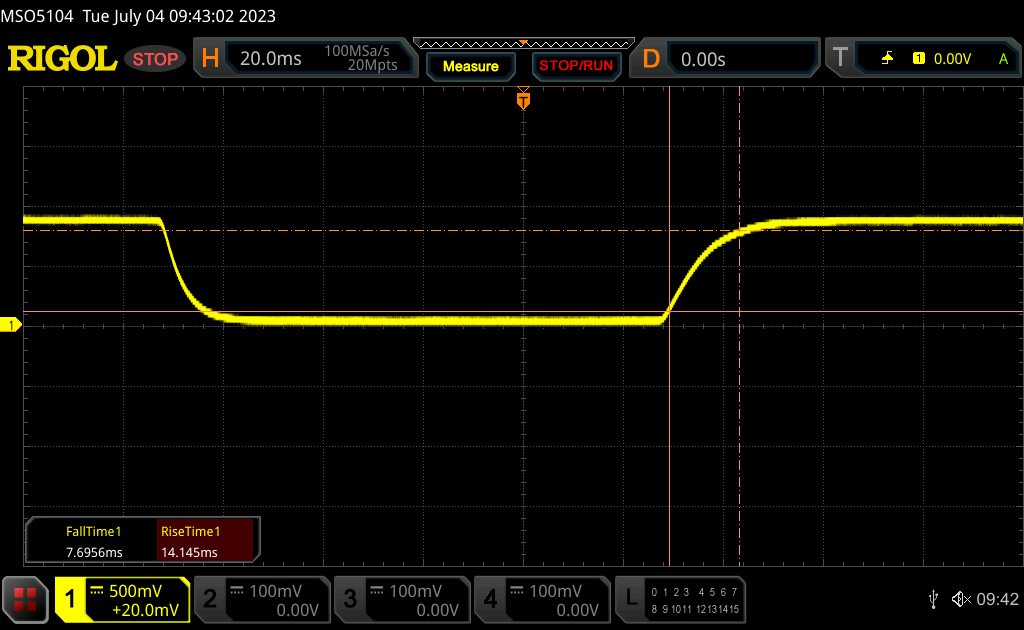 |
| ↘ 7.7 ms Calo | ||
| Lo schermo mostra buoni tempi di risposta durante i nostri tests, ma potrebbe essere troppo lento per i gamers competitivi. In confronto, tutti i dispositivi di test variano da 0.1 (minimo) a 240 (massimo) ms. » 49 % di tutti i dispositivi è migliore. Questo significa che i tempi di risposta rilevati sono peggiori rispetto alla media di tutti i dispositivi testati (19.8 ms). | ||
| ↔ Tempo di risposta dal 50% Grigio all'80% Grigio | ||
| 32.4 ms ... aumenta ↗ e diminuisce ↘ combinato | ↗ 16.4 ms Incremento | 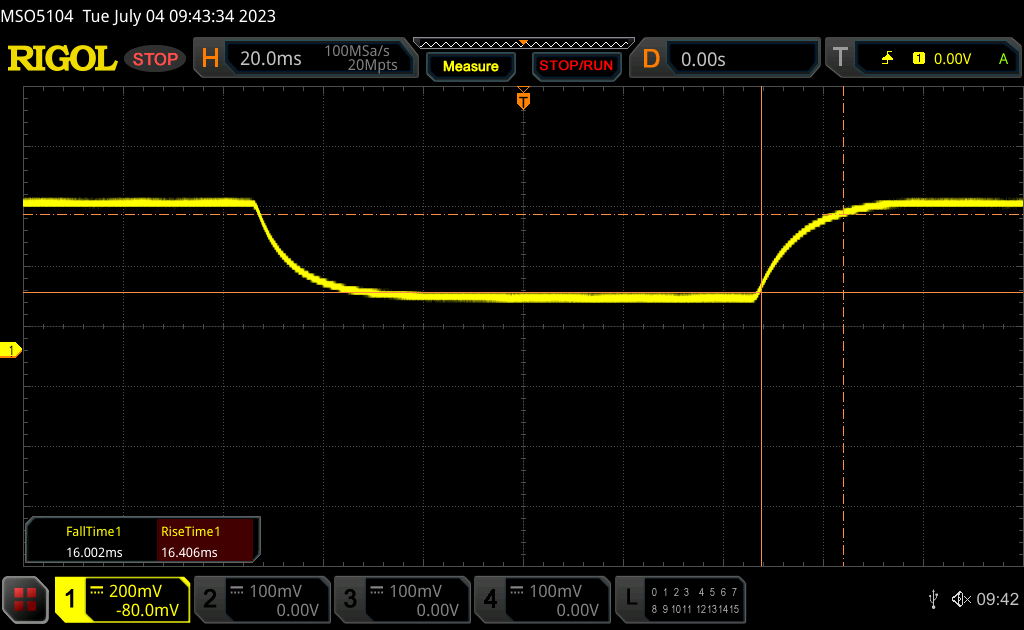 |
| ↘ 16 ms Calo | ||
| Lo schermo mostra tempi di risposta lenti nei nostri tests e sarà insoddisfacente per i gamers. In confronto, tutti i dispositivi di test variano da 0.165 (minimo) a 636 (massimo) ms. » 44 % di tutti i dispositivi è migliore. Questo significa che i tempi di risposta rilevati sono simili alla media di tutti i dispositivi testati (31 ms). | ||
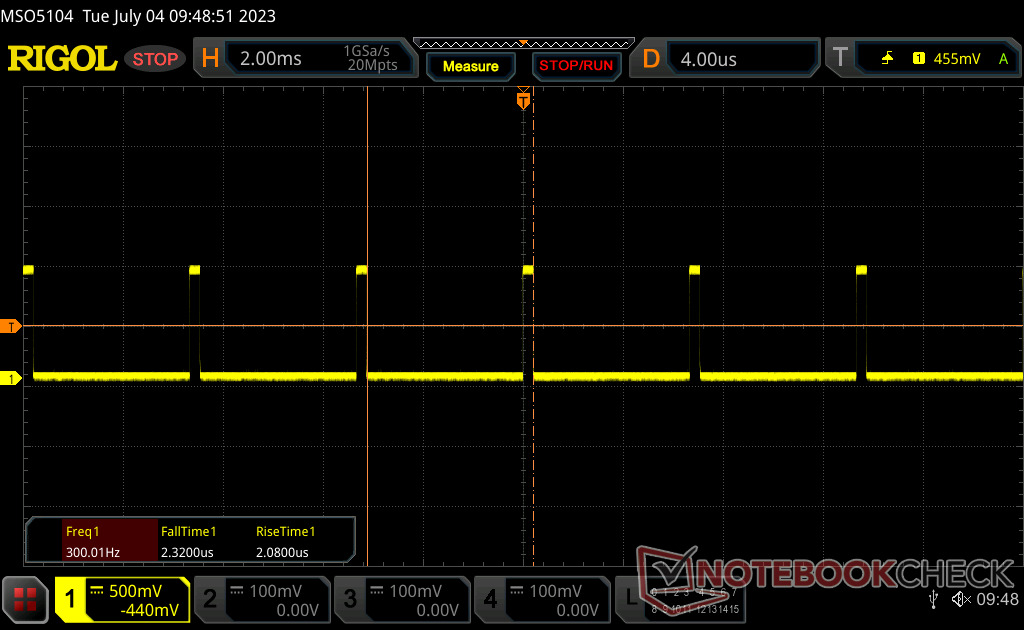
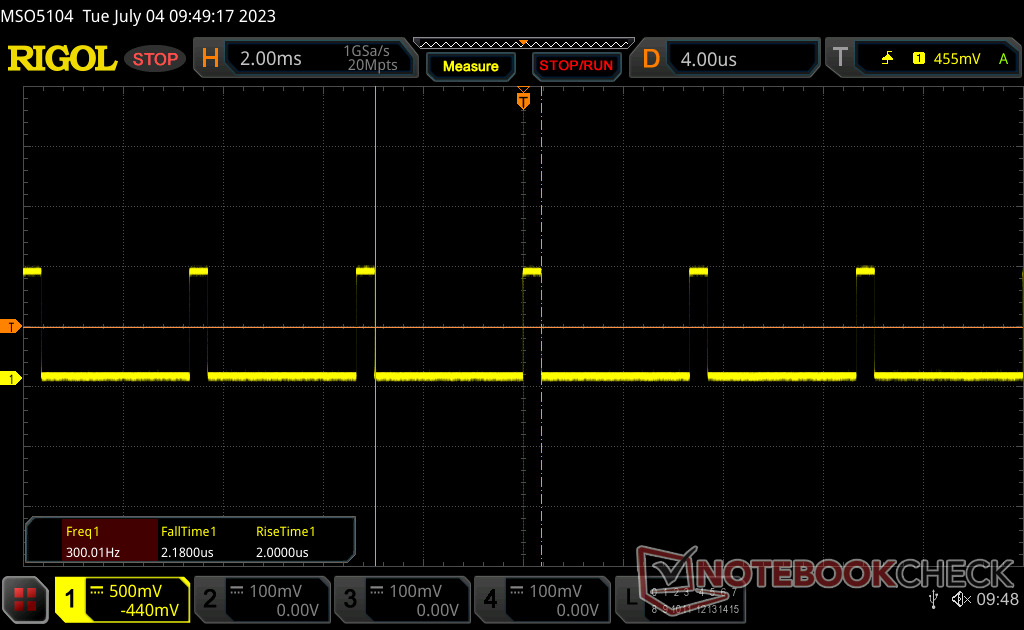
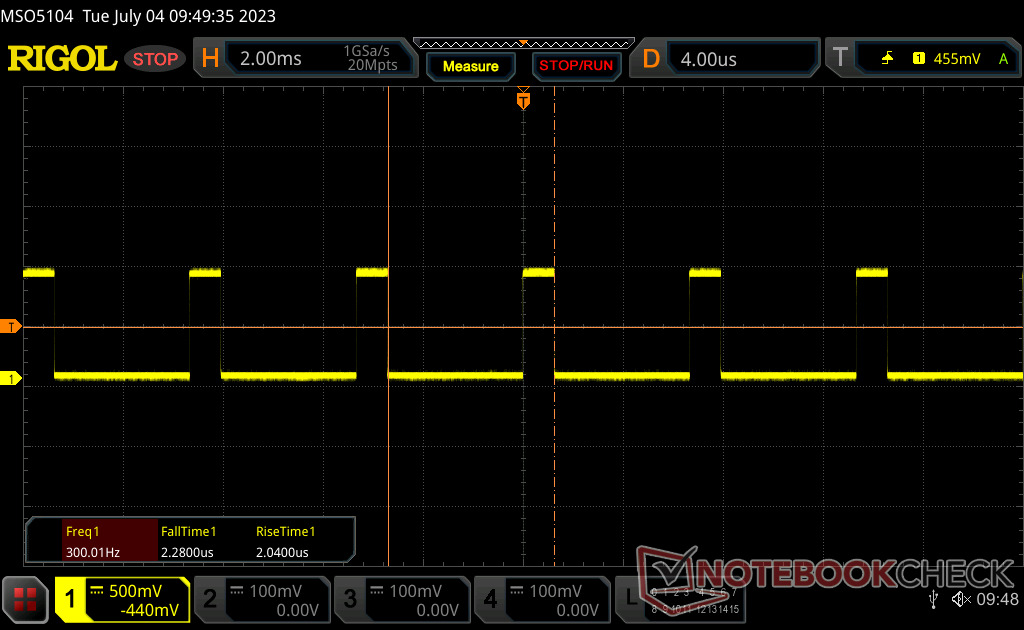
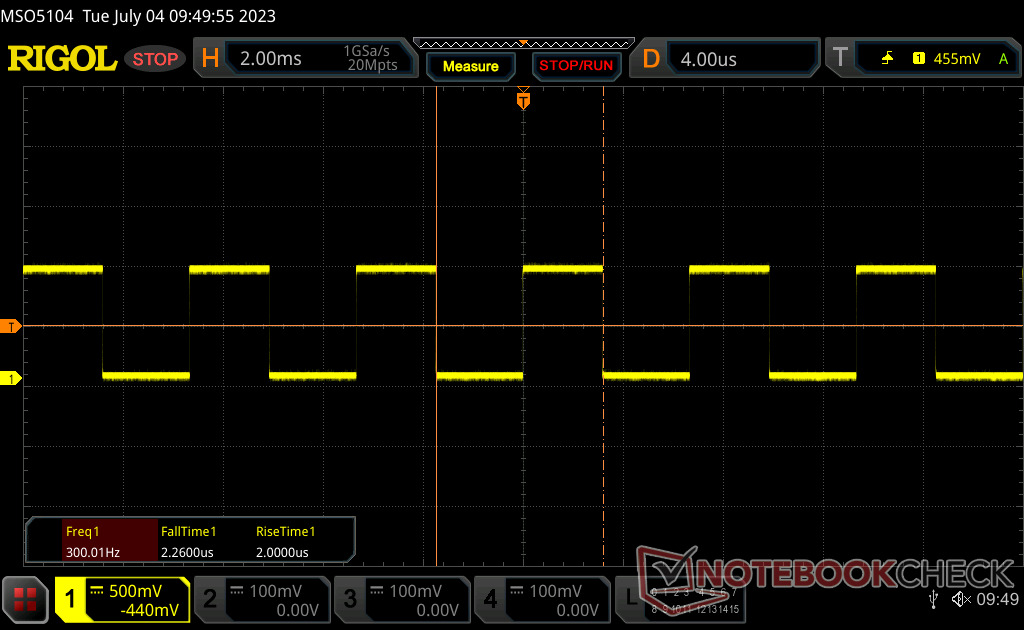
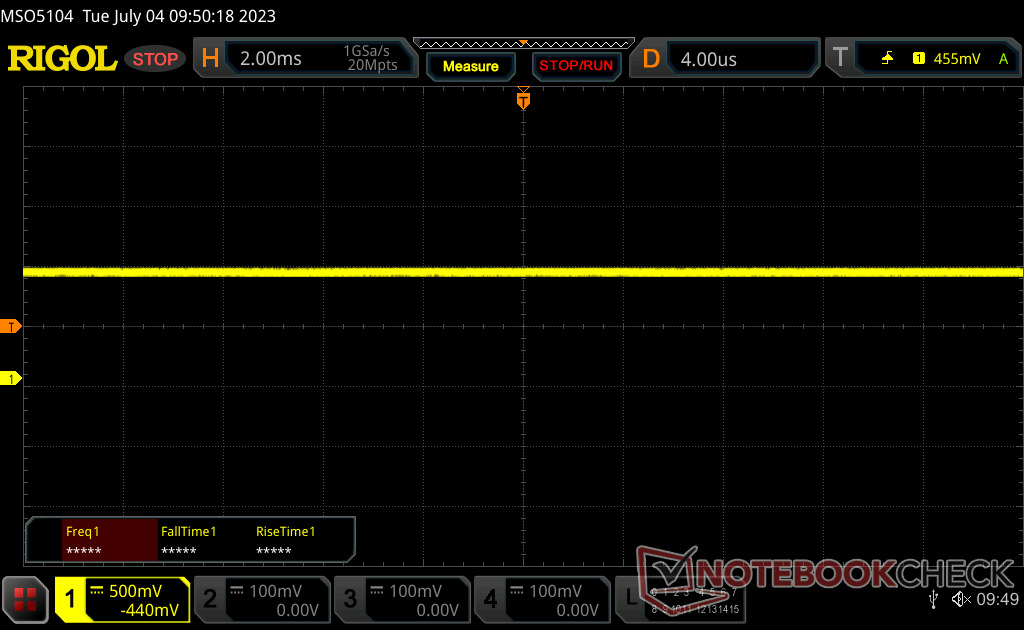
Sfarfallio dello schermo / PWM (Pulse-Width Modulation)
| flickering dello schermo / PWM rilevato | 300 Hz | ≤ 99 % settaggio luminosita' | 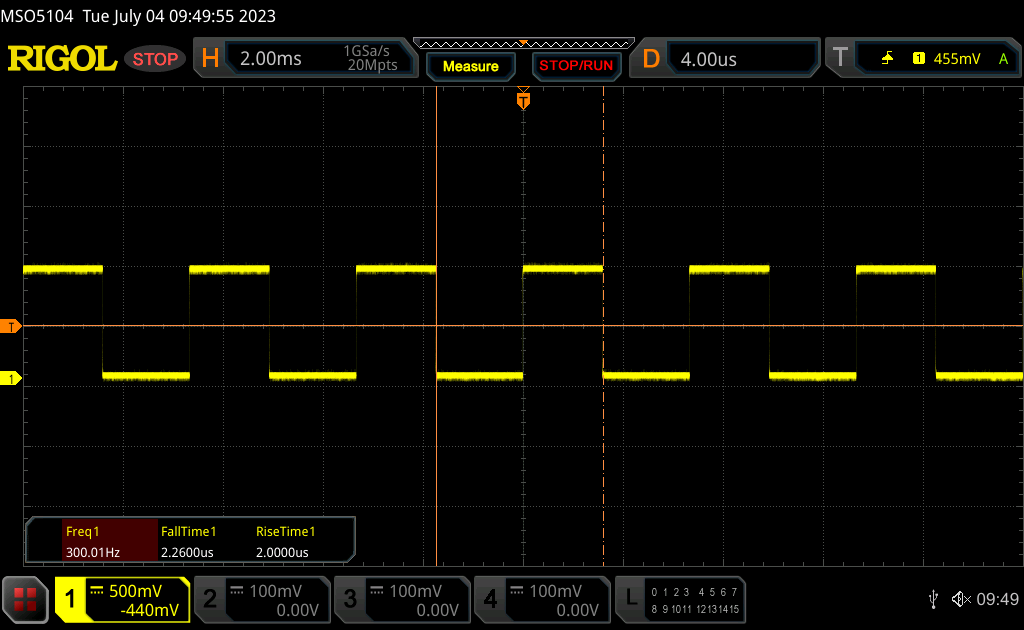 |
Il display sfarfalla a 300 Hz (Probabilmente a causa dell'uso di PWM) Flickering rilevato ad una luminosita' di 99 % o inferiore. Non dovrebbe verificarsi flickering o PWM sopra questo valore di luminosita'. La frequenza di 300 Hz è relativamente elevata, quindi la maggioranza degli utenti sensibili al PWM non dovrebbe notare alcun flickering. Tuttavia, è stato segnalato che alcuni utenti sono sensibili al PWM a 500 Hz ed oltre, quindi prestate attenzione. In confronto: 52 % di tutti i dispositivi testati non utilizza PWM per ridurre la luminosita' del display. Se è rilevato PWM, una media di 7754 (minimo: 5 - massimo: 343500) Hz è stata rilevata. | |||
La modulazione a larghezza di impulso o sfarfallio di 300 Hz è presente su tutti i livelli di luminosità fino al 99%.
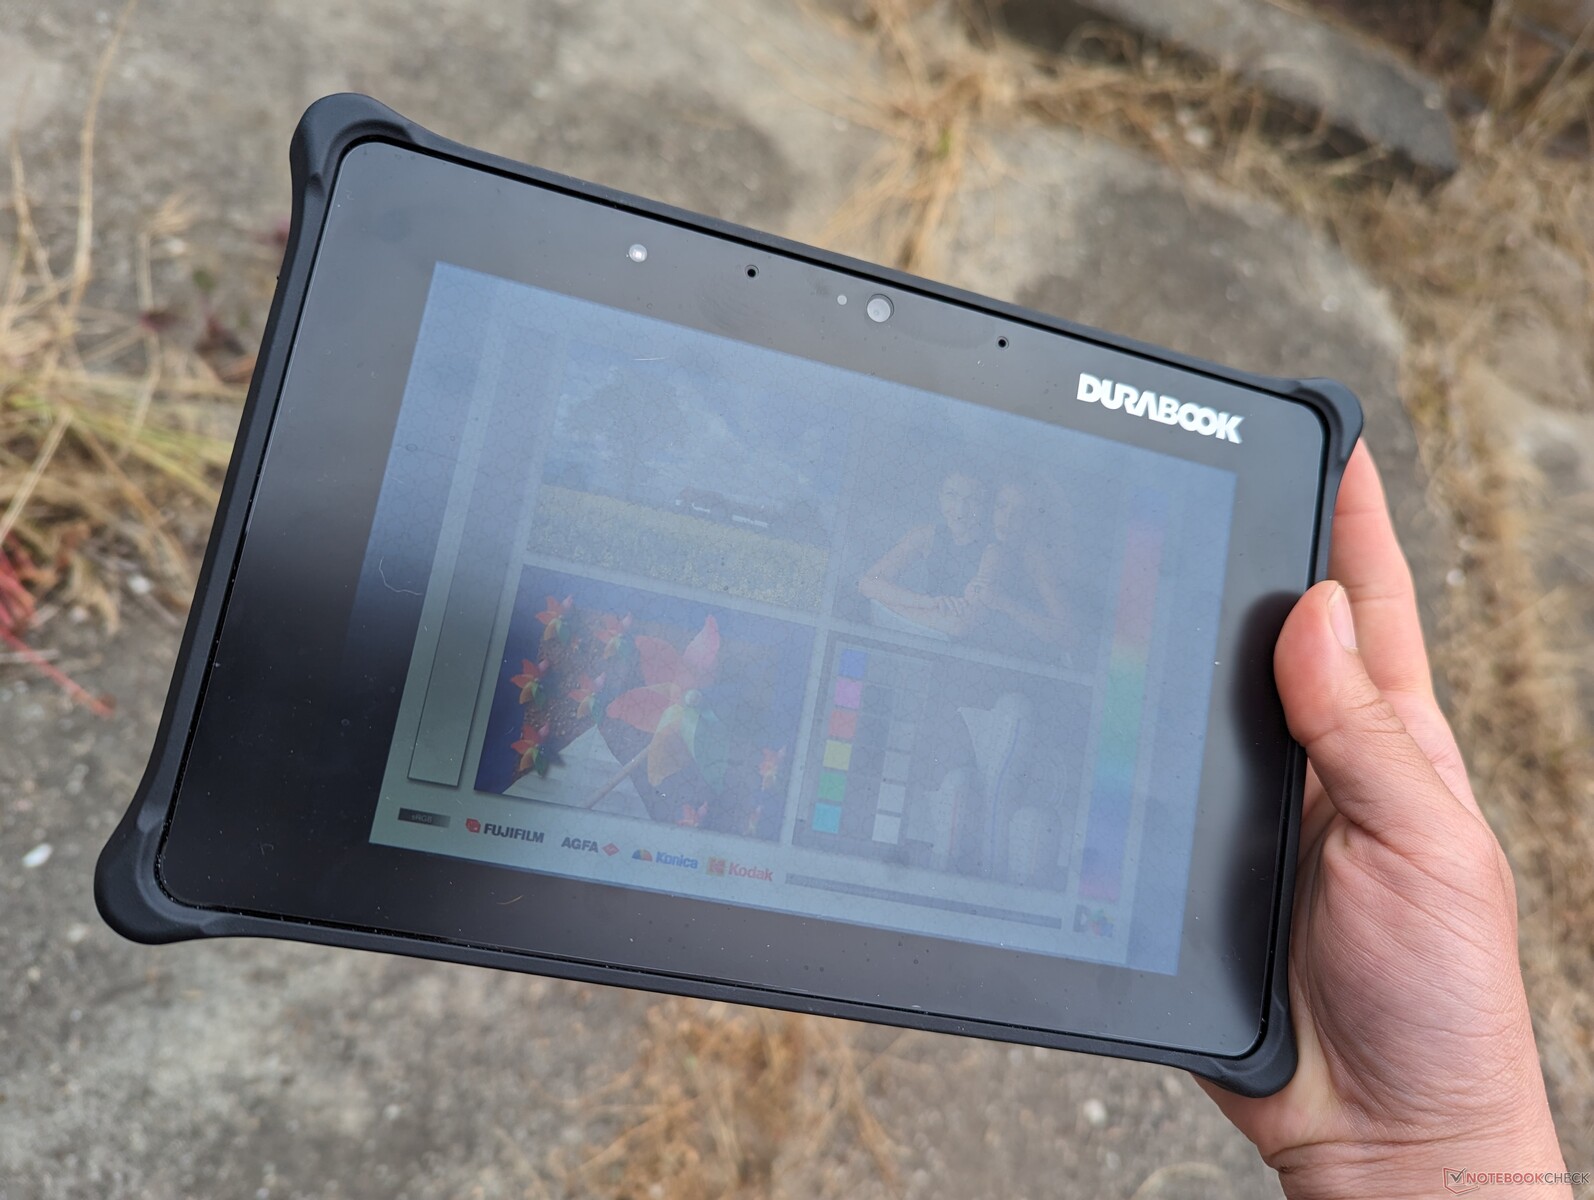
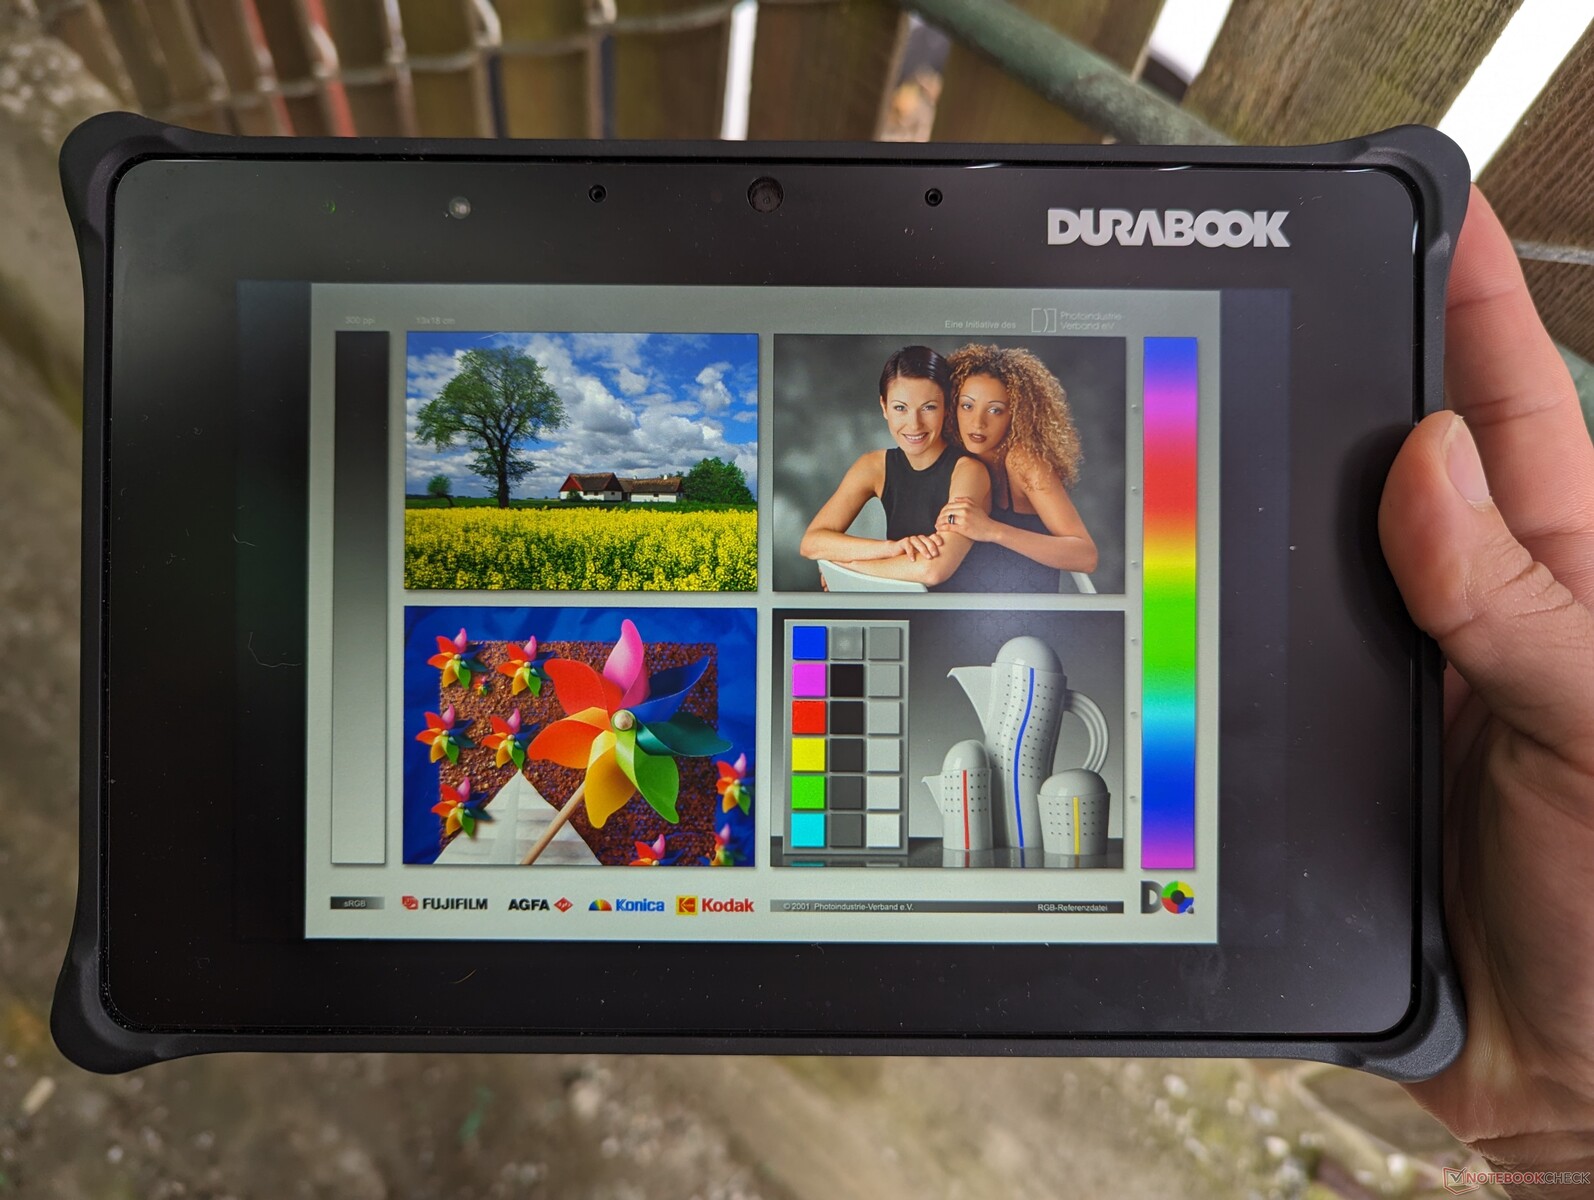
La visibilità all'aperto è eccellente quando si è all'ombra, grazie al display extra-luminoso. L'abbagliamento può comunque offuscare i colori e costituire un problema in condizioni di maggiore luminosità.
Prestazioni - Intel 12a generazione sottocloccato
Condizioni di test
Abbiamo impostato Windows in modalità Prestazioni prima di eseguire i benchmark qui sotto.
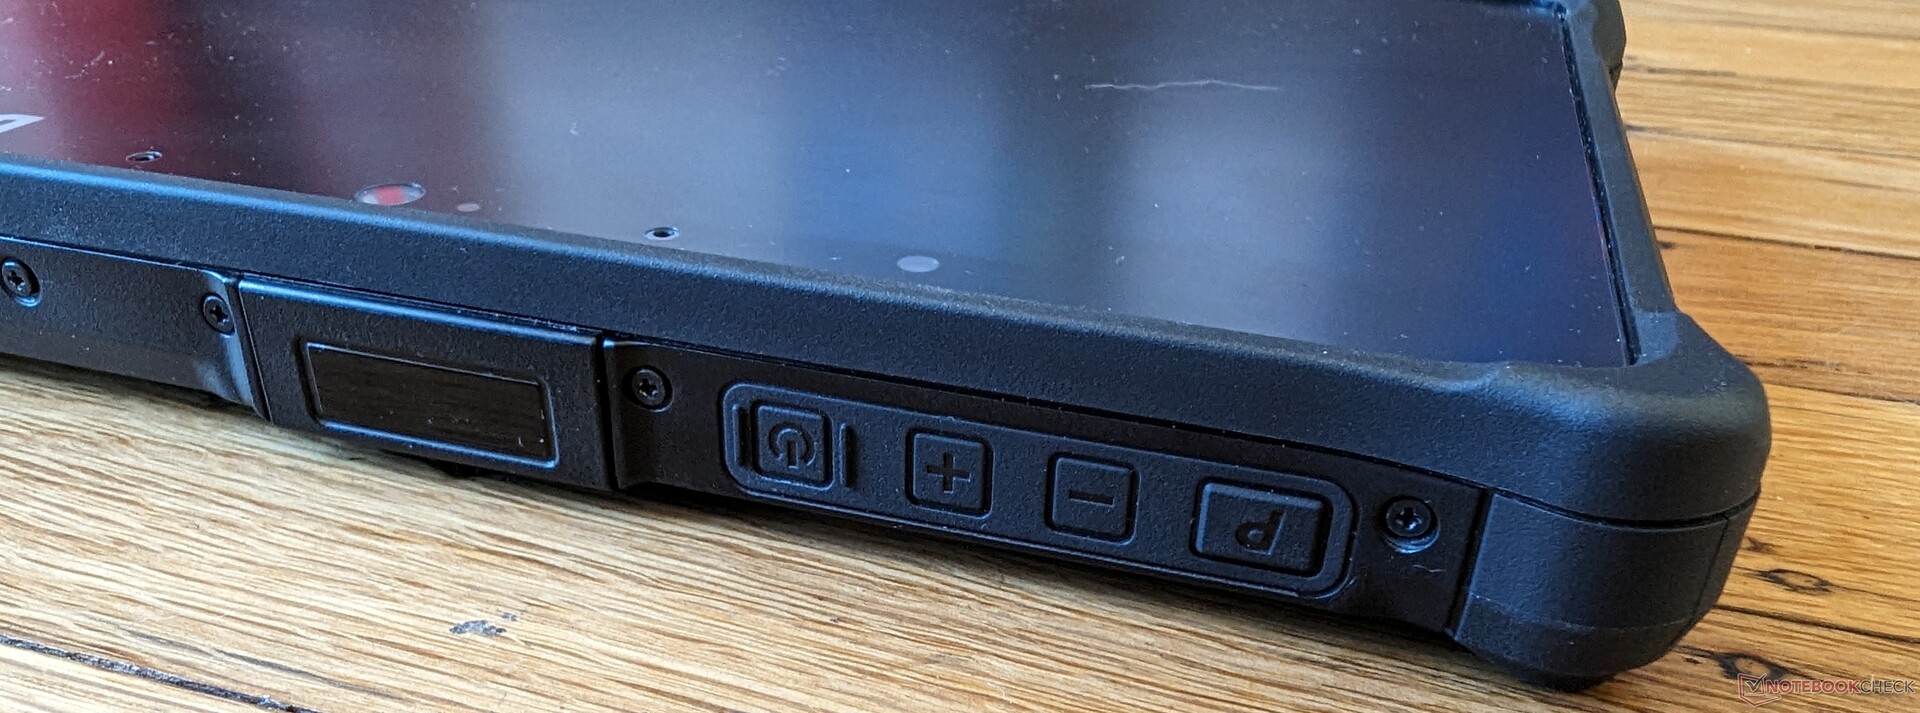
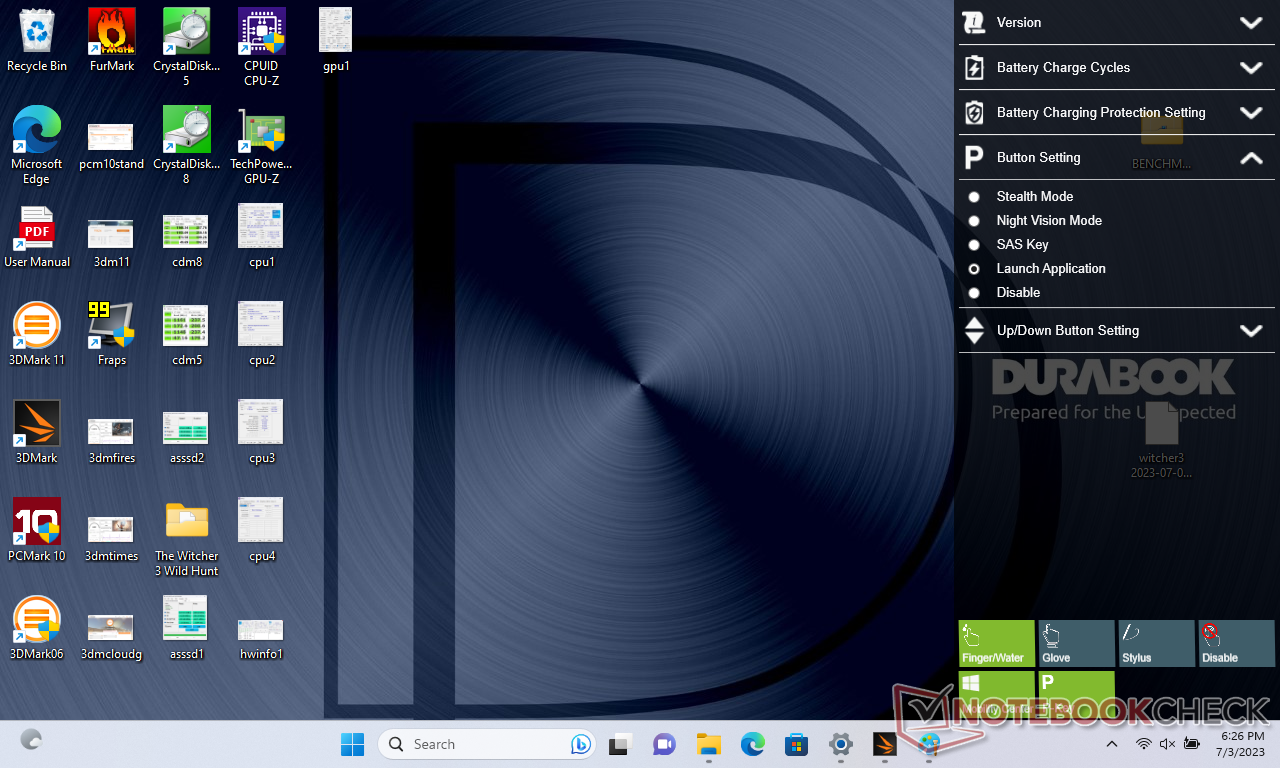
Premendo il pulsante "P" in alto si avvia il menu del centro di controllo per regolare diversi aspetti della tavoletta, come il comportamento di ricarica della batteria, le azioni dei pulsanti e le modalità touchscreen con guanti e dita.
Processore
La nostra unità di prova utilizza lo stesso Core i5-1230U che si trova nel modello Dell XPS 13 9315 e XPS 9315 2-in-1. Le prestazioni, purtroppo, sono state notevolmente ridotte per massimizzare la stabilità. Le prestazioni single-thread e multi-thread sono più lente rispettivamente del 25% e del 60% rispetto allo stesso processore nel sistema Dell sopra citato. Le prestazioni complessive sono quindi più vicine a quelle del Core i5-10310U di 10a generazione, vecchio di tre anni Core i5-10310U.
È difficile dire quanto gli utenti possano aspettarsi un aumento delle prestazioni se passano al Core i7-1250U.Core i7-1250U dato che la nostra unità Core i5-1230U è più lenta del previsto. Tuttavia, è probabile che anche la SKU Core i7 sia sottocloccata.
Cinebench R15 Multi Loop
Cinebench R23: Multi Core | Single Core
Cinebench R20: CPU (Multi Core) | CPU (Single Core)
Cinebench R15: CPU Multi 64Bit | CPU Single 64Bit
Blender: v2.79 BMW27 CPU
7-Zip 18.03: 7z b 4 | 7z b 4 -mmt1
Geekbench 5.5: Multi-Core | Single-Core
HWBOT x265 Benchmark v2.2: 4k Preset
LibreOffice : 20 Documents To PDF
R Benchmark 2.5: Overall mean
| CPU Performance rating | |
| Lenovo Yoga 7-14ARB G7 | |
| Samsung Galaxy Book3 Pro 14 | |
| Lenovo ThinkPad T14s G3 21BR00CDGE | |
| HP Envy x360 13-bf0013dx | |
| Dell Latitude 7230 Rugged Extreme | |
| Dell XPS 13 9315 2-in-1 Core i5-1230U | |
| Dell Latitude 7330 Rugged Extreme | |
| Dynabook Satellite Pro C50D-B-115 | |
| Asus ZenBook 14X OLED UX5400EA-L7154W | |
| Media Intel Core i5-1230U | |
| Durabook R8 Tablet | |
| Panasonic Toughbook FZ-G2 -2! | |
| Acer Enduro T1 ET108-11A A9001 -12! | |
| Chuwi LapBook Plus -6! | |
| Lenovo Tab M8 (Gen 4) -12! | |
| Cinebench R23 / Multi Core | |
| Lenovo Yoga 7-14ARB G7 | |
| Lenovo ThinkPad T14s G3 21BR00CDGE | |
| Samsung Galaxy Book3 Pro 14 | |
| Dell Latitude 7230 Rugged Extreme | |
| HP Envy x360 13-bf0013dx | |
| Dell XPS 13 9315 2-in-1 Core i5-1230U | |
| Dynabook Satellite Pro C50D-B-115 | |
| Asus ZenBook 14X OLED UX5400EA-L7154W | |
| Dell Latitude 7330 Rugged Extreme | |
| Media Intel Core i5-1230U (3066 - 7264, n=3) | |
| Panasonic Toughbook FZ-G2 | |
| Durabook R8 Tablet | |
| Cinebench R23 / Single Core | |
| Lenovo ThinkPad T14s G3 21BR00CDGE | |
| Samsung Galaxy Book3 Pro 14 | |
| HP Envy x360 13-bf0013dx | |
| Dell Latitude 7230 Rugged Extreme | |
| Dell Latitude 7330 Rugged Extreme | |
| Lenovo Yoga 7-14ARB G7 | |
| Dell XPS 13 9315 2-in-1 Core i5-1230U | |
| Asus ZenBook 14X OLED UX5400EA-L7154W | |
| Dynabook Satellite Pro C50D-B-115 | |
| Media Intel Core i5-1230U (1135 - 1512, n=3) | |
| Durabook R8 Tablet | |
| Panasonic Toughbook FZ-G2 | |
| Cinebench R20 / CPU (Multi Core) | |
| Lenovo Yoga 7-14ARB G7 | |
| Lenovo ThinkPad T14s G3 21BR00CDGE | |
| Samsung Galaxy Book3 Pro 14 | |
| Dell Latitude 7230 Rugged Extreme | |
| HP Envy x360 13-bf0013dx | |
| Dell XPS 13 9315 2-in-1 Core i5-1230U | |
| Asus ZenBook 14X OLED UX5400EA-L7154W | |
| Dynabook Satellite Pro C50D-B-115 | |
| Dell Latitude 7330 Rugged Extreme | |
| Media Intel Core i5-1230U (1175 - 2802, n=3) | |
| Panasonic Toughbook FZ-G2 | |
| Durabook R8 Tablet | |
| Chuwi LapBook Plus | |
| Cinebench R20 / CPU (Single Core) | |
| Lenovo ThinkPad T14s G3 21BR00CDGE | |
| Samsung Galaxy Book3 Pro 14 | |
| HP Envy x360 13-bf0013dx | |
| Lenovo Yoga 7-14ARB G7 | |
| Dell Latitude 7230 Rugged Extreme | |
| Dell Latitude 7330 Rugged Extreme | |
| Dell XPS 13 9315 2-in-1 Core i5-1230U | |
| Asus ZenBook 14X OLED UX5400EA-L7154W | |
| Dynabook Satellite Pro C50D-B-115 | |
| Media Intel Core i5-1230U (441 - 580, n=3) | |
| Durabook R8 Tablet | |
| Panasonic Toughbook FZ-G2 | |
| Chuwi LapBook Plus | |
| Cinebench R15 / CPU Multi 64Bit | |
| Lenovo Yoga 7-14ARB G7 | |
| Samsung Galaxy Book3 Pro 14 | |
| Lenovo ThinkPad T14s G3 21BR00CDGE | |
| HP Envy x360 13-bf0013dx | |
| Dynabook Satellite Pro C50D-B-115 | |
| Dell XPS 13 9315 2-in-1 Core i5-1230U | |
| Dell Latitude 7230 Rugged Extreme | |
| Asus ZenBook 14X OLED UX5400EA-L7154W | |
| Dell Latitude 7330 Rugged Extreme | |
| Media Intel Core i5-1230U (433 - 1254, n=3) | |
| Panasonic Toughbook FZ-G2 | |
| Durabook R8 Tablet | |
| Chuwi LapBook Plus | |
| Cinebench R15 / CPU Single 64Bit | |
| Lenovo Yoga 7-14ARB G7 | |
| Lenovo ThinkPad T14s G3 21BR00CDGE | |
| Samsung Galaxy Book3 Pro 14 | |
| Dell Latitude 7330 Rugged Extreme | |
| HP Envy x360 13-bf0013dx | |
| Dell Latitude 7230 Rugged Extreme | |
| Dell XPS 13 9315 2-in-1 Core i5-1230U | |
| Dynabook Satellite Pro C50D-B-115 | |
| Asus ZenBook 14X OLED UX5400EA-L7154W | |
| Media Intel Core i5-1230U (120.1 - 221, n=3) | |
| Panasonic Toughbook FZ-G2 | |
| Durabook R8 Tablet | |
| Chuwi LapBook Plus | |
| Blender / v2.79 BMW27 CPU | |
| Chuwi LapBook Plus | |
| Durabook R8 Tablet | |
| Panasonic Toughbook FZ-G2 | |
| Media Intel Core i5-1230U (503 - 1005, n=2) | |
| Dell Latitude 7330 Rugged Extreme | |
| Asus ZenBook 14X OLED UX5400EA-L7154W | |
| Dell XPS 13 9315 2-in-1 Core i5-1230U | |
| Dynabook Satellite Pro C50D-B-115 | |
| HP Envy x360 13-bf0013dx | |
| Dell Latitude 7230 Rugged Extreme | |
| Lenovo ThinkPad T14s G3 21BR00CDGE | |
| Samsung Galaxy Book3 Pro 14 | |
| Lenovo Yoga 7-14ARB G7 | |
| 7-Zip 18.03 / 7z b 4 | |
| Lenovo Yoga 7-14ARB G7 | |
| Lenovo ThinkPad T14s G3 21BR00CDGE | |
| Samsung Galaxy Book3 Pro 14 | |
| Dell XPS 13 9315 2-in-1 Core i5-1230U | |
| Dynabook Satellite Pro C50D-B-115 | |
| HP Envy x360 13-bf0013dx | |
| Dell Latitude 7230 Rugged Extreme | |
| Asus ZenBook 14X OLED UX5400EA-L7154W | |
| Dell Latitude 7330 Rugged Extreme | |
| Media Intel Core i5-1230U (12470 - 34505, n=3) | |
| Panasonic Toughbook FZ-G2 | |
| Durabook R8 Tablet | |
| Chuwi LapBook Plus | |
| 7-Zip 18.03 / 7z b 4 -mmt1 | |
| Samsung Galaxy Book3 Pro 14 | |
| Lenovo Yoga 7-14ARB G7 | |
| Dell Latitude 7330 Rugged Extreme | |
| Lenovo ThinkPad T14s G3 21BR00CDGE | |
| Dynabook Satellite Pro C50D-B-115 | |
| Asus ZenBook 14X OLED UX5400EA-L7154W | |
| Dell XPS 13 9315 2-in-1 Core i5-1230U | |
| HP Envy x360 13-bf0013dx | |
| Dell Latitude 7230 Rugged Extreme | |
| Media Intel Core i5-1230U (3873 - 4870, n=3) | |
| Panasonic Toughbook FZ-G2 | |
| Durabook R8 Tablet | |
| Chuwi LapBook Plus | |
| HWBOT x265 Benchmark v2.2 / 4k Preset | |
| Lenovo Yoga 7-14ARB G7 | |
| Samsung Galaxy Book3 Pro 14 | |
| Lenovo ThinkPad T14s G3 21BR00CDGE | |
| Dell Latitude 7230 Rugged Extreme | |
| HP Envy x360 13-bf0013dx | |
| Dell XPS 13 9315 2-in-1 Core i5-1230U | |
| Asus ZenBook 14X OLED UX5400EA-L7154W | |
| Dynabook Satellite Pro C50D-B-115 | |
| Dell Latitude 7330 Rugged Extreme | |
| Media Intel Core i5-1230U (3.59 - 8.33, n=2) | |
| Panasonic Toughbook FZ-G2 | |
| Durabook R8 Tablet | |
| Chuwi LapBook Plus | |
| LibreOffice / 20 Documents To PDF | |
| Asus ZenBook 14X OLED UX5400EA-L7154W | |
| Panasonic Toughbook FZ-G2 | |
| Durabook R8 Tablet | |
| Media Intel Core i5-1230U (51.2 - 62.5, n=2) | |
| Lenovo Yoga 7-14ARB G7 | |
| Dynabook Satellite Pro C50D-B-115 | |
| HP Envy x360 13-bf0013dx | |
| Dell Latitude 7230 Rugged Extreme | |
| Dell XPS 13 9315 2-in-1 Core i5-1230U | |
| Dell Latitude 7330 Rugged Extreme | |
| Samsung Galaxy Book3 Pro 14 | |
| Lenovo ThinkPad T14s G3 21BR00CDGE | |
| R Benchmark 2.5 / Overall mean | |
| Panasonic Toughbook FZ-G2 | |
| Durabook R8 Tablet | |
| Asus ZenBook 14X OLED UX5400EA-L7154W | |
| Media Intel Core i5-1230U (0.527 - 0.676, n=2) | |
| Dynabook Satellite Pro C50D-B-115 | |
| Dell Latitude 7330 Rugged Extreme | |
| HP Envy x360 13-bf0013dx | |
| Dell Latitude 7230 Rugged Extreme | |
| Dell XPS 13 9315 2-in-1 Core i5-1230U | |
| Lenovo Yoga 7-14ARB G7 | |
| Lenovo ThinkPad T14s G3 21BR00CDGE | |
| Samsung Galaxy Book3 Pro 14 | |
Cinebench R23: Multi Core | Single Core
Cinebench R20: CPU (Multi Core) | CPU (Single Core)
Cinebench R15: CPU Multi 64Bit | CPU Single 64Bit
Blender: v2.79 BMW27 CPU
7-Zip 18.03: 7z b 4 | 7z b 4 -mmt1
Geekbench 5.5: Multi-Core | Single-Core
HWBOT x265 Benchmark v2.2: 4k Preset
LibreOffice : 20 Documents To PDF
R Benchmark 2.5: Overall mean
* ... Meglio usare valori piccoli
* ... Meglio usare valori piccoli
AIDA64: FP32 Ray-Trace | FPU Julia | CPU SHA3 | CPU Queen | FPU SinJulia | FPU Mandel | CPU AES | CPU ZLib | FP64 Ray-Trace | CPU PhotoWorxx
| Performance rating | |
| Dell Latitude 7230 Rugged Extreme | |
| Media Intel Core i5-1230U | |
| Panasonic Toughbook FZ-G2 | |
| Durabook R8 Tablet | |
| AIDA64 / FP32 Ray-Trace | |
| Dell Latitude 7230 Rugged Extreme | |
| Media Intel Core i5-1230U (2344 - 6360, n=3) | |
| Panasonic Toughbook FZ-G2 | |
| Durabook R8 Tablet | |
| AIDA64 / FPU Julia | |
| Dell Latitude 7230 Rugged Extreme | |
| Media Intel Core i5-1230U (11867 - 31714, n=3) | |
| Panasonic Toughbook FZ-G2 | |
| Durabook R8 Tablet | |
| AIDA64 / CPU SHA3 | |
| Dell Latitude 7230 Rugged Extreme | |
| Media Intel Core i5-1230U (772 - 1711, n=3) | |
| Panasonic Toughbook FZ-G2 | |
| Durabook R8 Tablet | |
| AIDA64 / CPU Queen | |
| Dell Latitude 7230 Rugged Extreme | |
| Media Intel Core i5-1230U (30824 - 52533, n=3) | |
| Panasonic Toughbook FZ-G2 | |
| Durabook R8 Tablet | |
| AIDA64 / FPU SinJulia | |
| Dell Latitude 7230 Rugged Extreme | |
| Panasonic Toughbook FZ-G2 | |
| Media Intel Core i5-1230U (2269 - 3947, n=3) | |
| Durabook R8 Tablet | |
| AIDA64 / FPU Mandel | |
| Dell Latitude 7230 Rugged Extreme | |
| Media Intel Core i5-1230U (6379 - 15896, n=3) | |
| Panasonic Toughbook FZ-G2 | |
| Durabook R8 Tablet | |
| AIDA64 / CPU AES | |
| Dell Latitude 7230 Rugged Extreme | |
| Durabook R8 Tablet | |
| Media Intel Core i5-1230U (18011 - 31941, n=3) | |
| Panasonic Toughbook FZ-G2 | |
| AIDA64 / CPU ZLib | |
| Dell Latitude 7230 Rugged Extreme | |
| Media Intel Core i5-1230U (229 - 495, n=3) | |
| Durabook R8 Tablet | |
| Panasonic Toughbook FZ-G2 | |
| AIDA64 / FP64 Ray-Trace | |
| Dell Latitude 7230 Rugged Extreme | |
| Media Intel Core i5-1230U (1328 - 3305, n=3) | |
| Panasonic Toughbook FZ-G2 | |
| Durabook R8 Tablet | |
| AIDA64 / CPU PhotoWorxx | |
| Dell Latitude 7230 Rugged Extreme | |
| Media Intel Core i5-1230U (17516 - 37042, n=3) | |
| Panasonic Toughbook FZ-G2 | |
| Durabook R8 Tablet | |
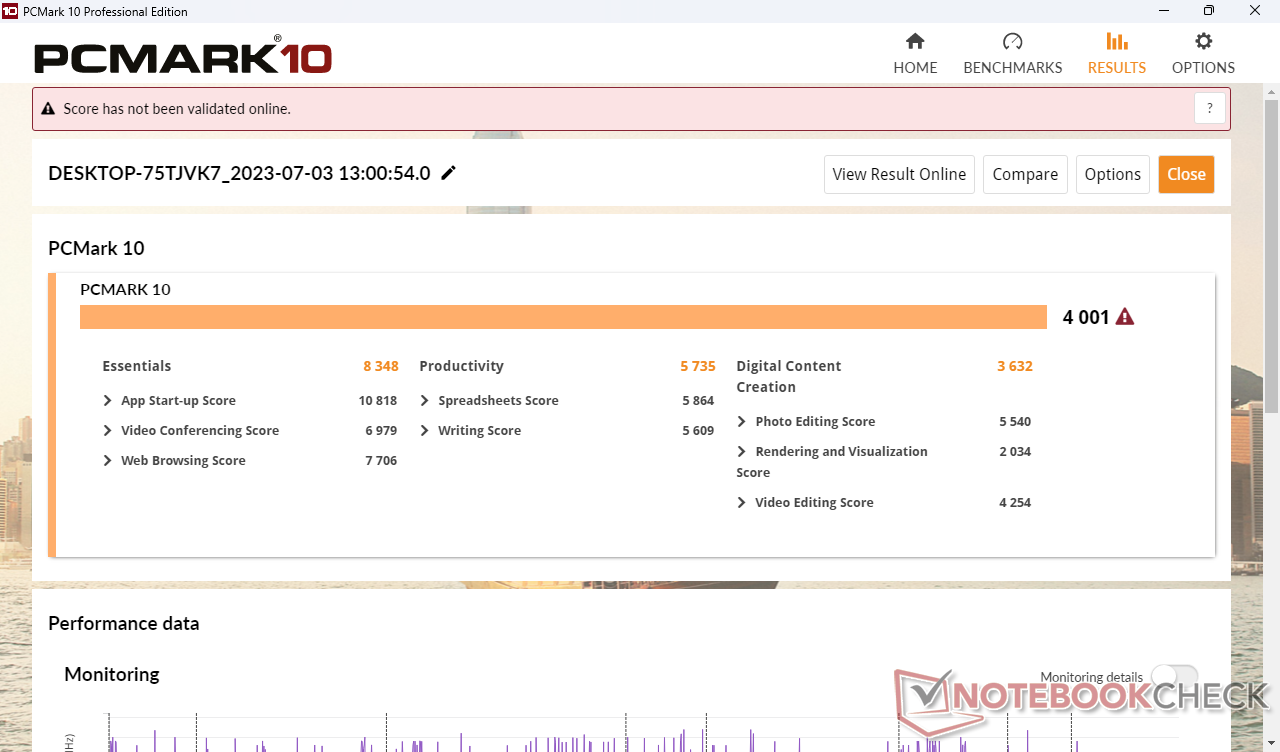
Prestazioni del sistema
I risultati di PCMark sono paragonabili a quelli del vecchio Panasonic Toughbook FZ-G2 poiché il processore della nostra unità è stato downclockato per funzionare in modo più simile al Toughbook.
CrossMark: Overall | Productivity | Creativity | Responsiveness
| PCMark 10 / Score | |
| Dell Latitude 7230 Rugged Extreme | |
| Media Intel Core i5-1230U, Intel Iris Xe Graphics G7 80EUs (4001 - 4943, n=3) | |
| Durabook R8 Tablet | |
| Panasonic Toughbook FZ-G2 | |
| PCMark 10 / Essentials | |
| Dell Latitude 7230 Rugged Extreme | |
| Media Intel Core i5-1230U, Intel Iris Xe Graphics G7 80EUs (8348 - 10139, n=3) | |
| Panasonic Toughbook FZ-G2 | |
| Durabook R8 Tablet | |
| PCMark 10 / Productivity | |
| Dell Latitude 7230 Rugged Extreme | |
| Media Intel Core i5-1230U, Intel Iris Xe Graphics G7 80EUs (5735 - 6692, n=3) | |
| Panasonic Toughbook FZ-G2 | |
| Durabook R8 Tablet | |
| PCMark 10 / Digital Content Creation | |
| Dell Latitude 7230 Rugged Extreme | |
| Media Intel Core i5-1230U, Intel Iris Xe Graphics G7 80EUs (3632 - 4833, n=3) | |
| Durabook R8 Tablet | |
| Panasonic Toughbook FZ-G2 | |
| CrossMark / Overall | |
| Dell Latitude 7230 Rugged Extreme | |
| Media Intel Core i5-1230U, Intel Iris Xe Graphics G7 80EUs (1117 - 1383, n=3) | |
| Durabook R8 Tablet | |
| Lenovo Tab M8 (Gen 4) | |
| CrossMark / Productivity | |
| Dell Latitude 7230 Rugged Extreme | |
| Media Intel Core i5-1230U, Intel Iris Xe Graphics G7 80EUs (1187 - 1356, n=3) | |
| Durabook R8 Tablet | |
| Lenovo Tab M8 (Gen 4) | |
| CrossMark / Creativity | |
| Dell Latitude 7230 Rugged Extreme | |
| Media Intel Core i5-1230U, Intel Iris Xe Graphics G7 80EUs (1095 - 1469, n=3) | |
| Durabook R8 Tablet | |
| Lenovo Tab M8 (Gen 4) | |
| CrossMark / Responsiveness | |
| Dell Latitude 7230 Rugged Extreme | |
| Media Intel Core i5-1230U, Intel Iris Xe Graphics G7 80EUs (990 - 1224, n=3) | |
| Durabook R8 Tablet | |
| Lenovo Tab M8 (Gen 4) | |
| PCMark 10 Score | 4001 punti | |
Aiuto | ||
| AIDA64 / Memory Copy | |
| Media della classe Tablet (60613 - 110050, n=3, ultimi 2 anni) | |
| Media Intel Core i5-1230U (32539 - 60944, n=3) | |
| Durabook R8 Tablet | |
| AIDA64 / Memory Read | |
| Media della classe Tablet (85395 - 122306, n=3, ultimi 2 anni) | |
| Media Intel Core i5-1230U (31342 - 60435, n=3) | |
| Durabook R8 Tablet | |
| AIDA64 / Memory Write | |
| Media della classe Tablet (43045 - 117859, n=3, ultimi 2 anni) | |
| Media Intel Core i5-1230U (33224 - 65665, n=3) | |
| Durabook R8 Tablet | |
| AIDA64 / Memory Latency | |
| Durabook R8 Tablet | |
| Media della classe Tablet (94.4 - 101.7, n=2, ultimi 2 anni) | |
| Media Intel Core i5-1230U (104.3 - 105.3, n=3) | |
* ... Meglio usare valori piccoli
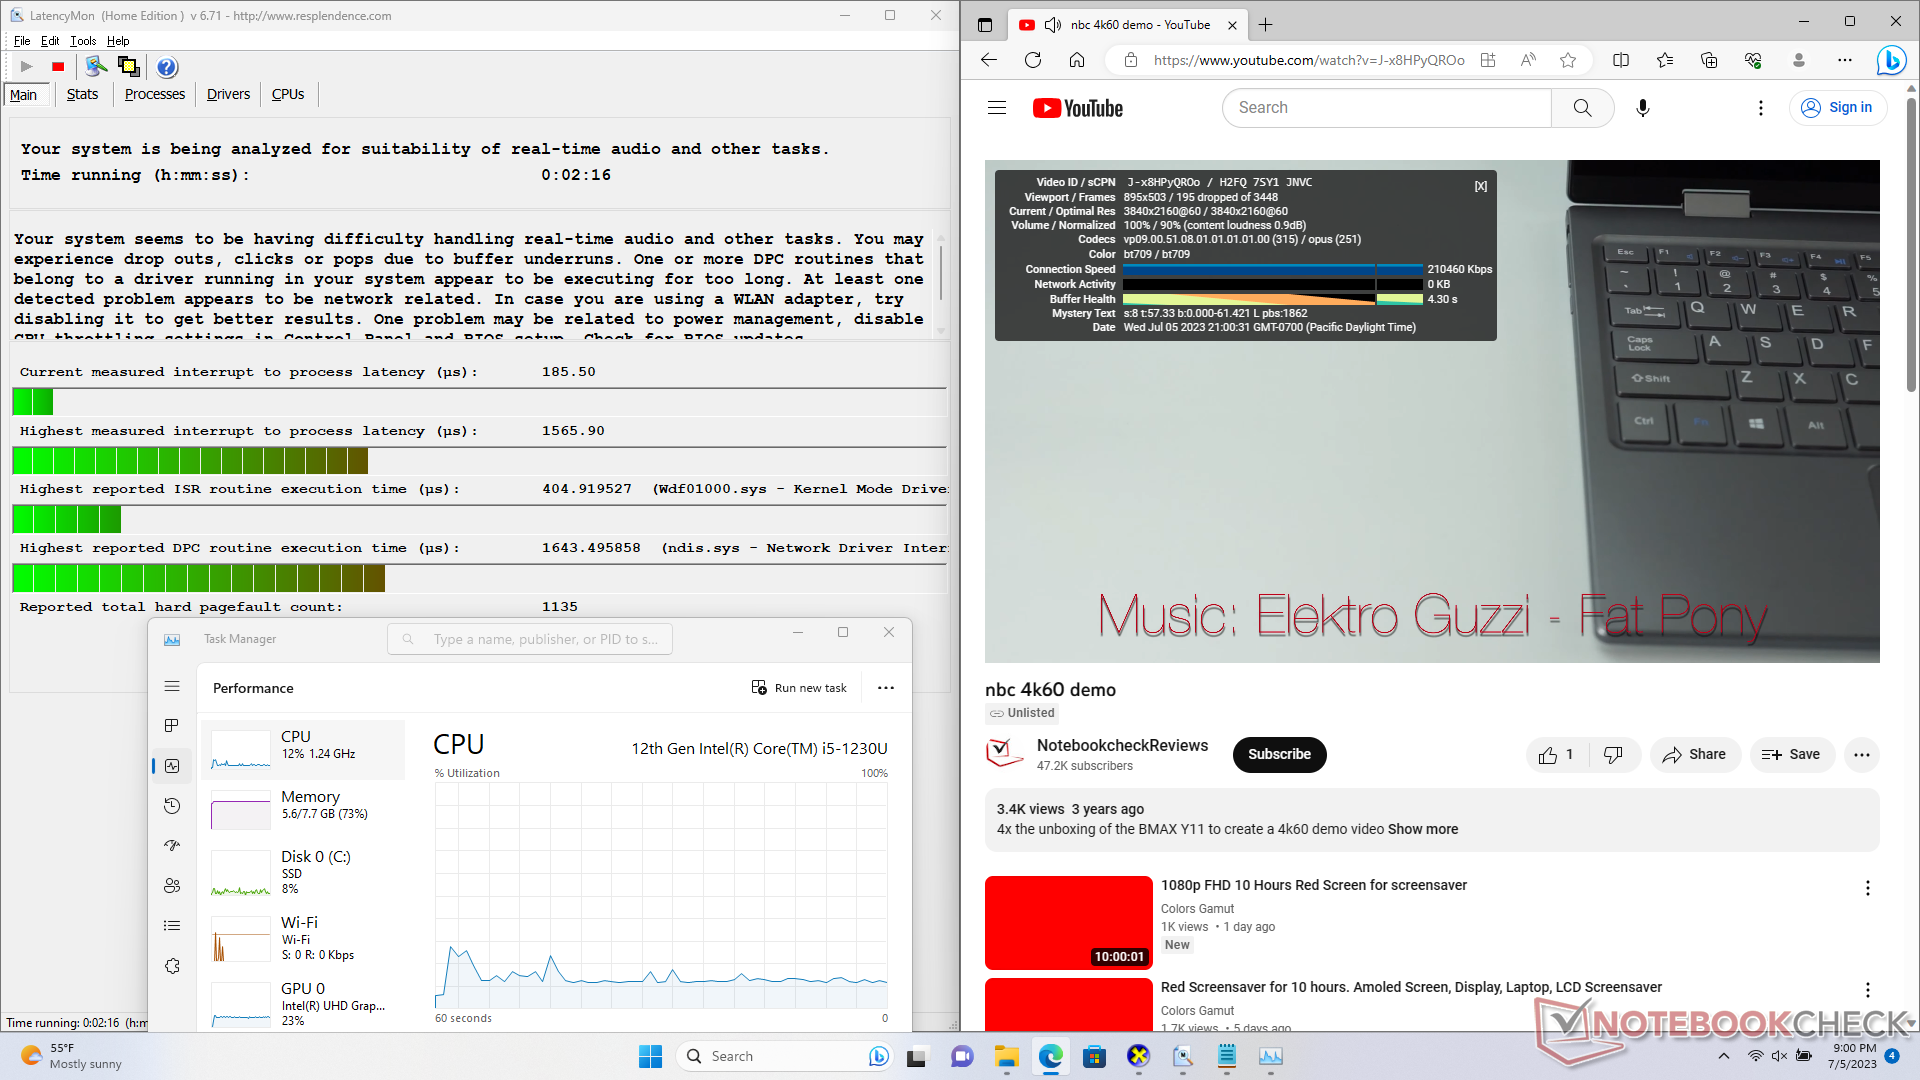
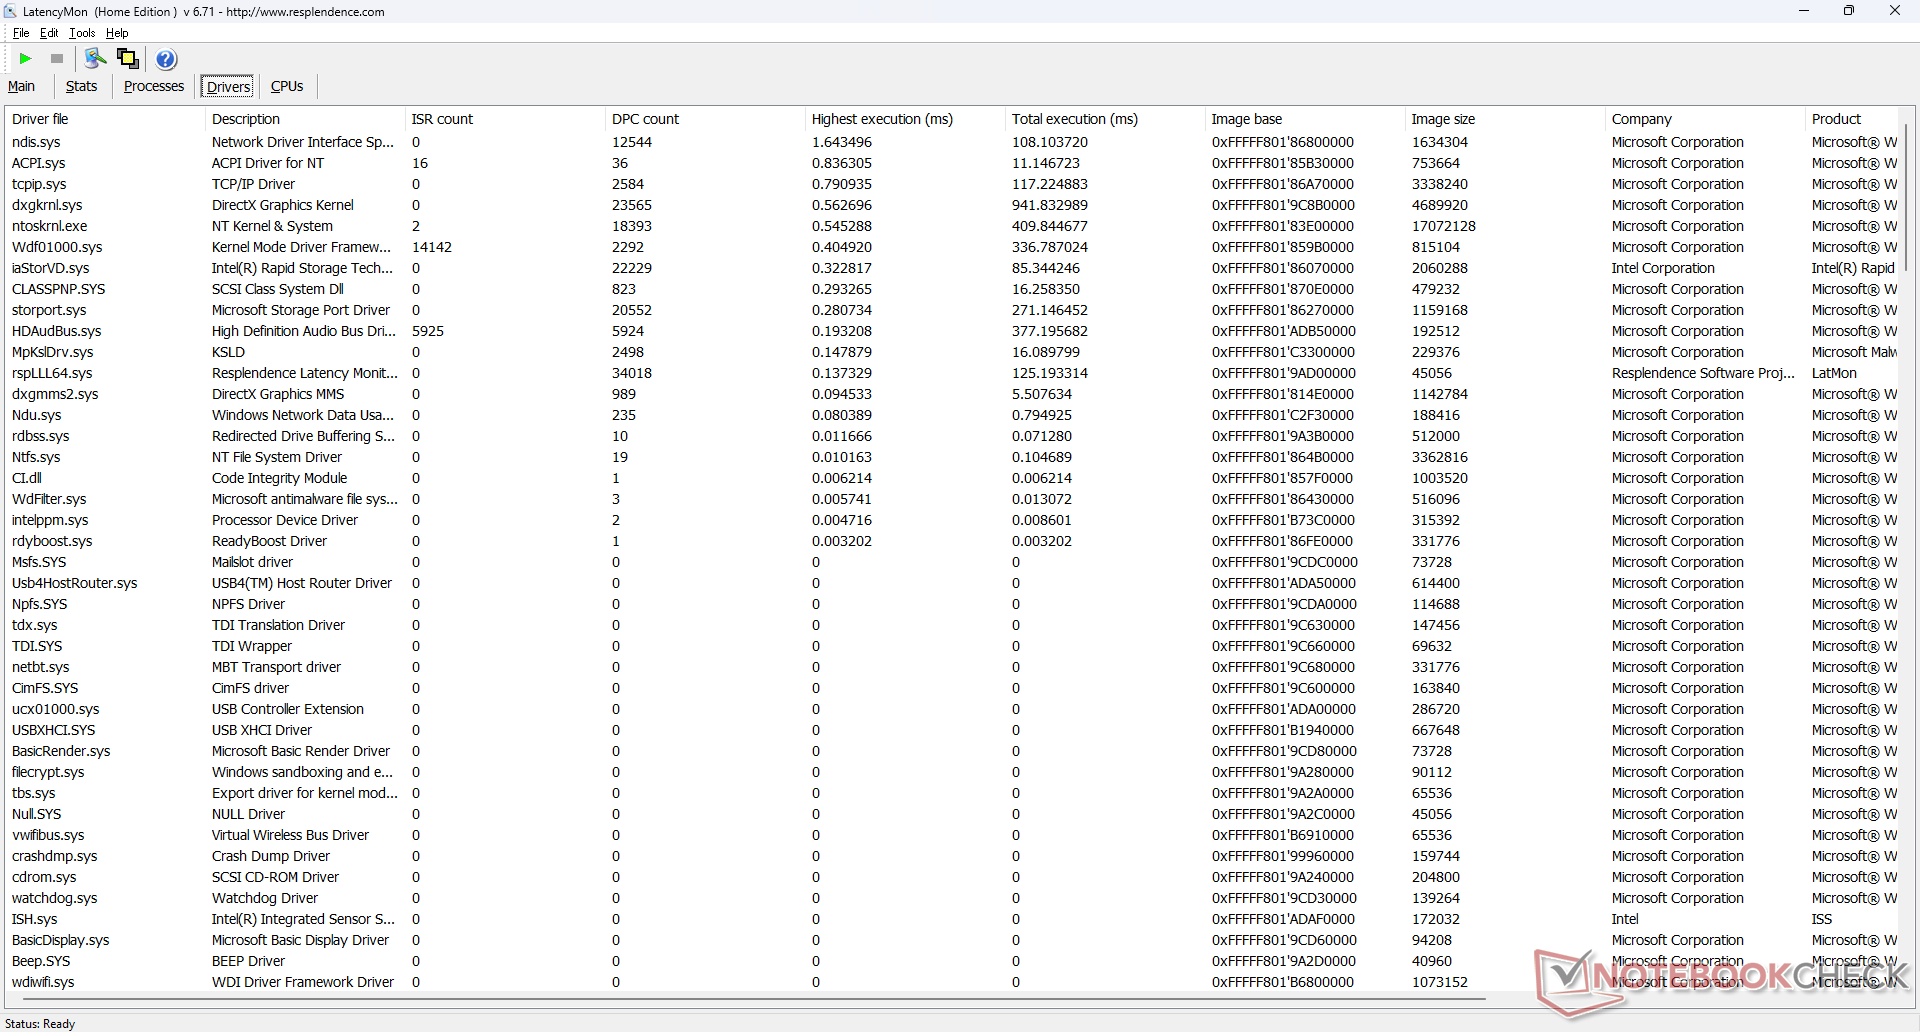
Latenza DPC
LatencyMon rivela problemi di DPC quando si aprono più schede del browser della nostra homepage. Inoltre, anche la riproduzione di video 4K a 60 FPS presenta dei problemi, in quanto si registrano 195 fotogrammi interrotti durante il nostro video di prova della durata di un minuto.
| DPC Latencies / LatencyMon - interrupt to process latency (max), Web, Youtube, Prime95 | |
| Dell Latitude 7230 Rugged Extreme | |
| Panasonic Toughbook FZ-G2 | |
| Durabook R8 Tablet | |
* ... Meglio usare valori piccoli
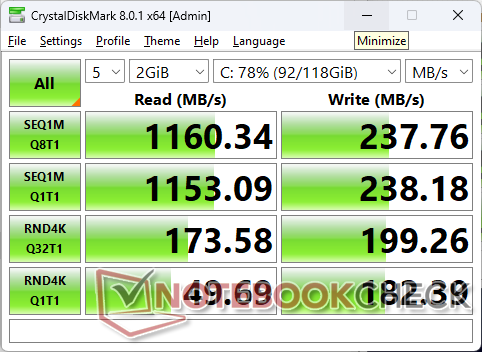
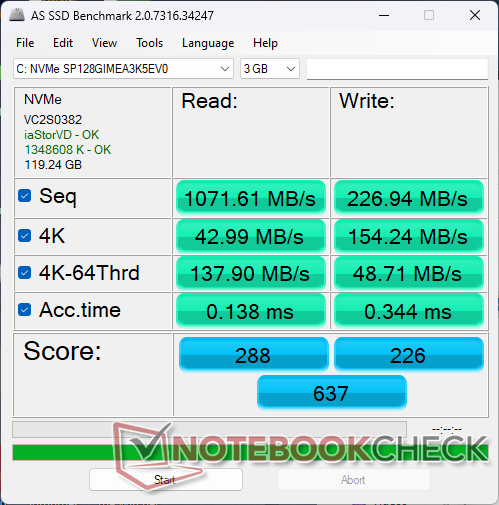
Dispositivi di archiviazione
L'unità rimovibile sSD NVMe da 128 GB può sostenere velocità di lettura e scrittura fino a 1100 MB/s e 240 MB/s, rispettivamente, per periodi prolungati. Le velocità di scrittura sono significativamente più basse, il che non dovrebbe essere un problema per il pubblico di destinazione. Le opzioni di maggiore capacità da 256 GB, 512 GB o 1 TB dovrebbero garantire prestazioni più elevate.

| Drive Performance rating - Percent | |
| Dell Latitude 7230 Rugged Extreme | |
| Panasonic Toughbook FZ-G2 | |
| Durabook R8 Tablet | |
* ... Meglio usare valori piccoli
Disk Throttling: DiskSpd Read Loop, Queue Depth 8
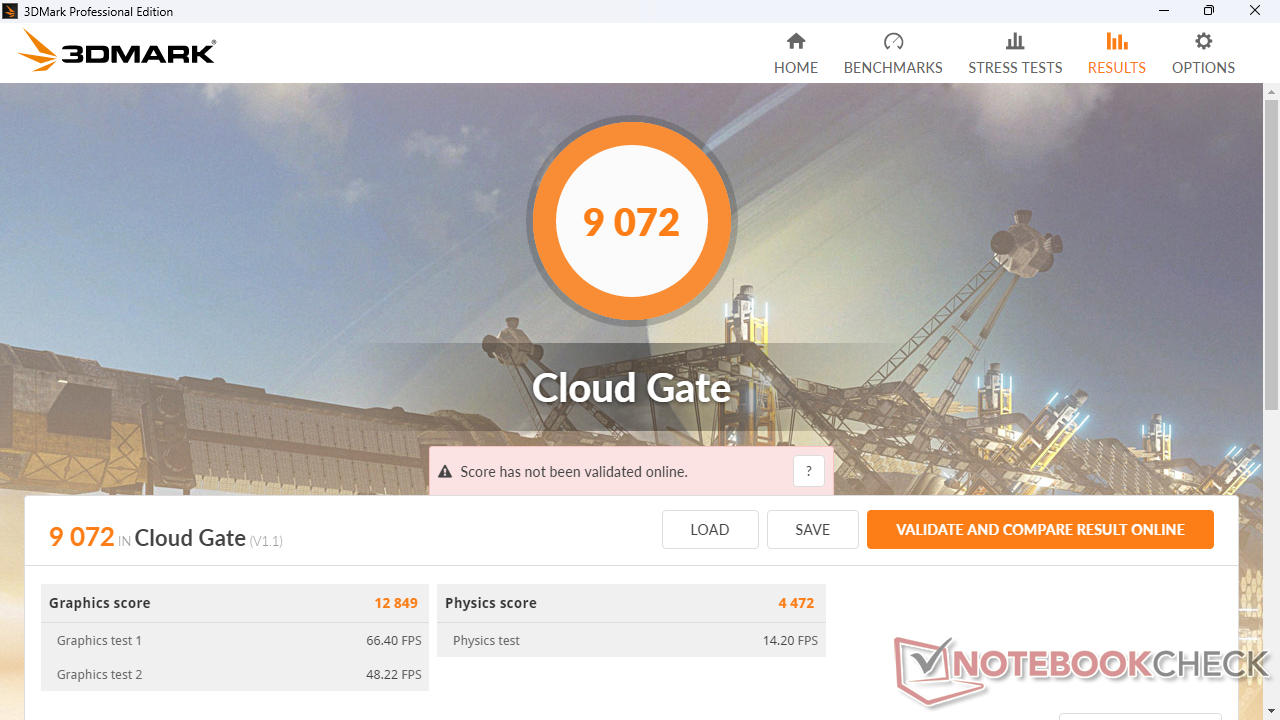
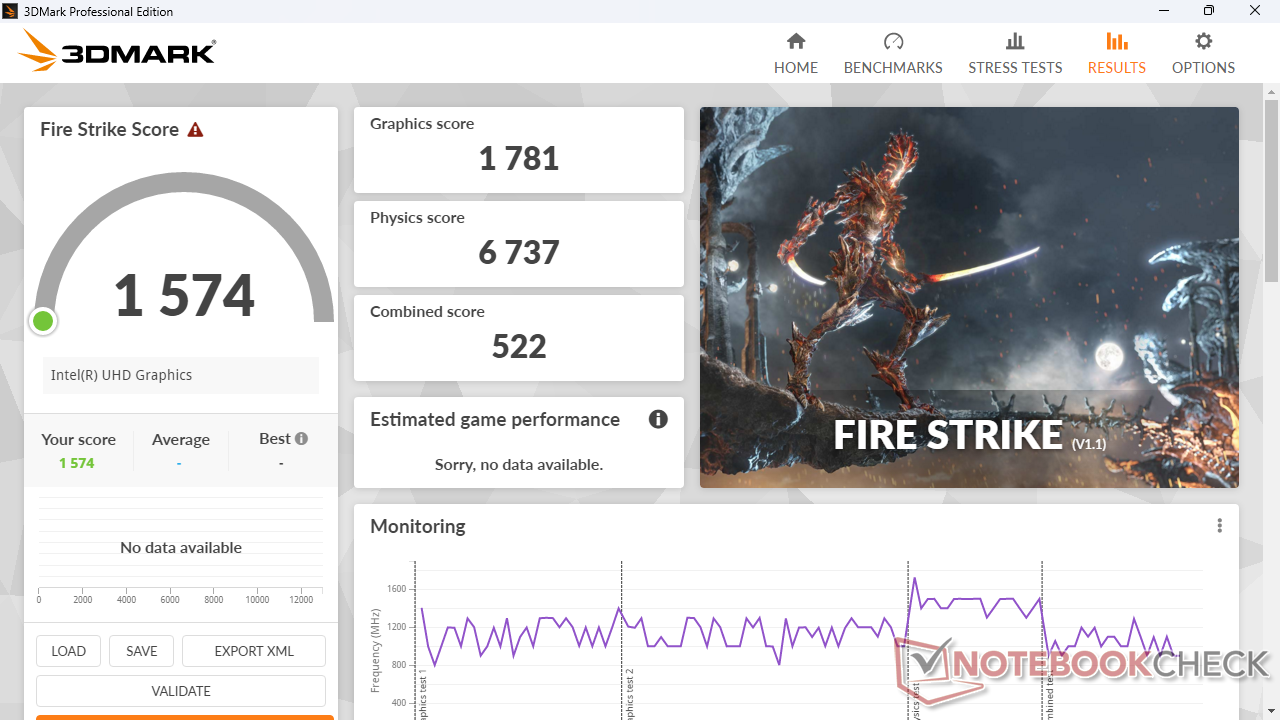
Prestazioni della GPU
Le prestazioni grafiche sono inferiori di circa il 30-40% rispetto alle stesse unità Iris Xe 80 EUs Dell'XPS 13 9315, in parte a causa della CPU sottocloccata e della RAM a canale singolo più lenta. Ciononostante, le prestazioni complessive sono ancora superiori a quelle del modello molto più datato UHD Graphics 620 di circa il 40-50%.
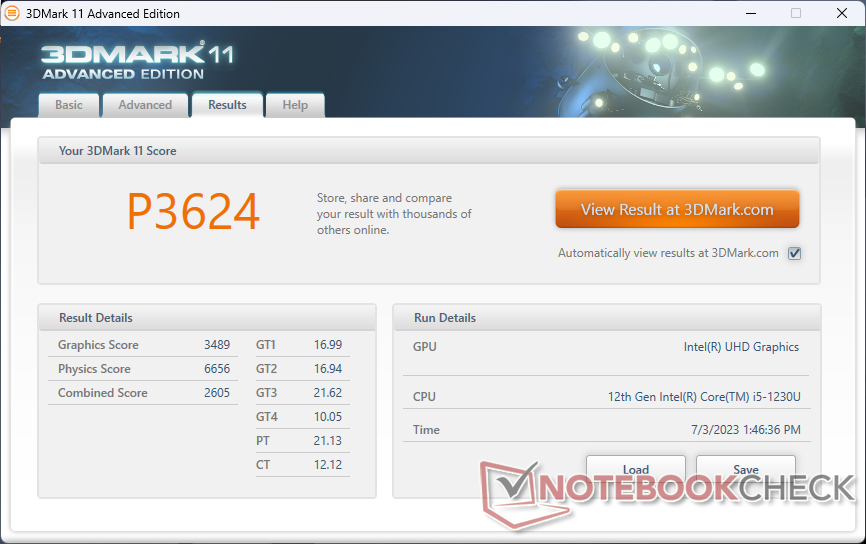
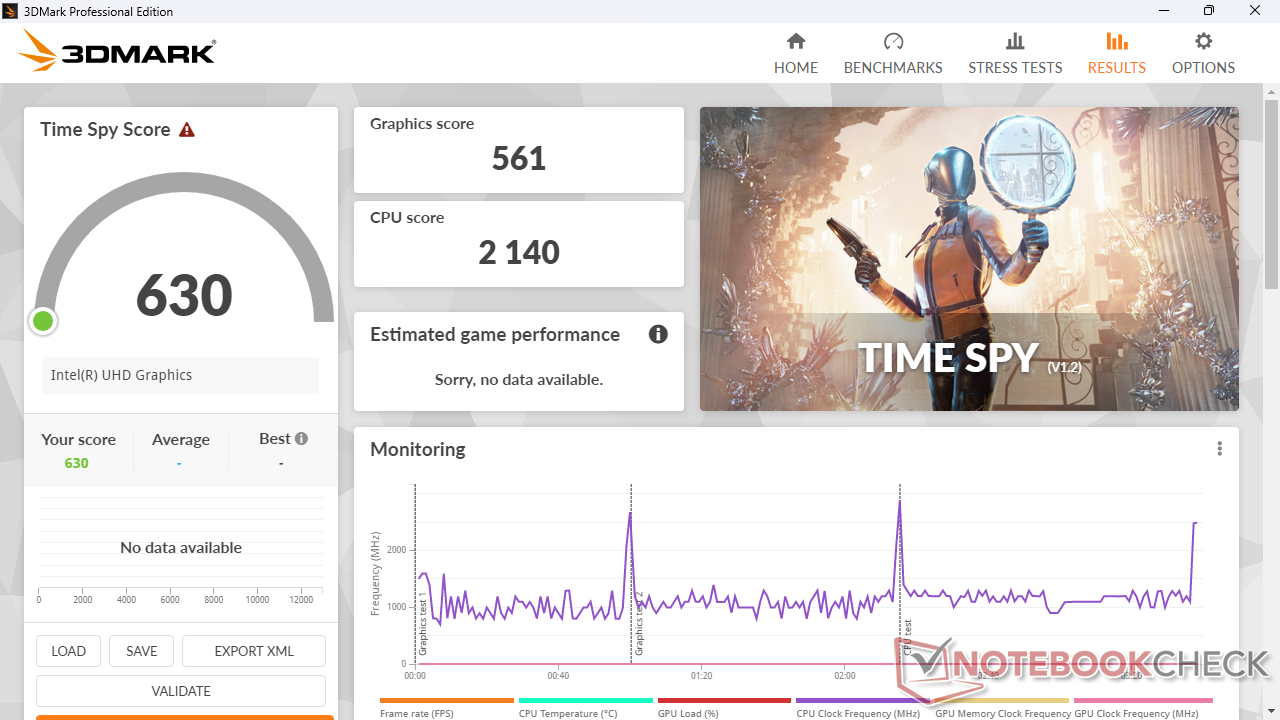
| 3DMark 11 Performance | 3624 punti | |
| 3DMark Cloud Gate Standard Score | 9072 punti | |
| 3DMark Fire Strike Score | 1574 punti | |
| 3DMark Time Spy Score | 630 punti | |
Aiuto | ||
| Final Fantasy XV Benchmark - 1280x720 Lite Quality | |
| Asus ZenBook 14X OLED UX5400EA-L7154W | |
| Lenovo Yoga 7-14ARB G7 | |
| Dell Latitude 7330 Rugged Extreme | |
| Lenovo ThinkPad T14s G3 21BR00CDGE | |
| Samsung Galaxy Book3 Pro 14 | |
| Media Intel Iris Xe Graphics G7 80EUs (8.32 - 45.6, n=107) | |
| Dell Latitude 7230 Rugged Extreme | |
| Dell XPS 13 9315 2-in-1 Core i5-1230U | |
| Dynabook Satellite Pro C50D-B-115 | |
| Panasonic Toughbook FZ-G2 | |
| Durabook R8 Tablet | |
Witcher 3 FPS Chart
| basso | medio | alto | ultra | |
|---|---|---|---|---|
| The Witcher 3 (2015) | 30.2 | |||
| Dota 2 Reborn (2015) | 62.9 | 41.7 | 19.6 | 13.2 |
| Final Fantasy XV Benchmark (2018) | 12.1 | |||
| X-Plane 11.11 (2018) | 26.2 | 21.8 | 20.1 |
Emissioni - Design senza ventola
Temperatura
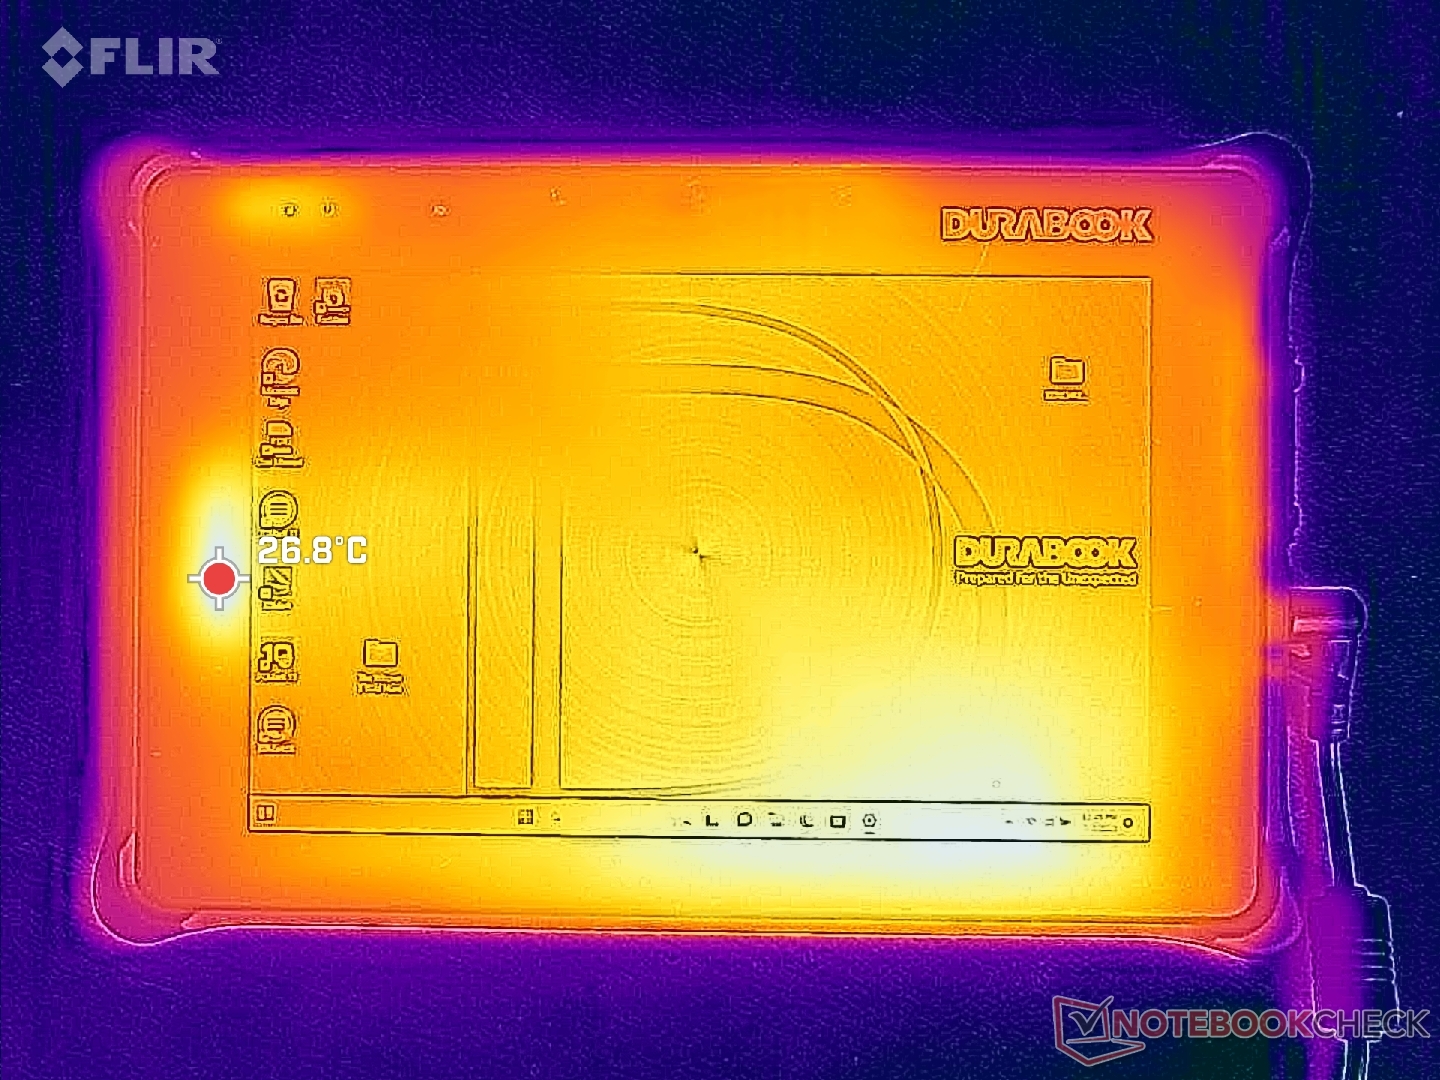
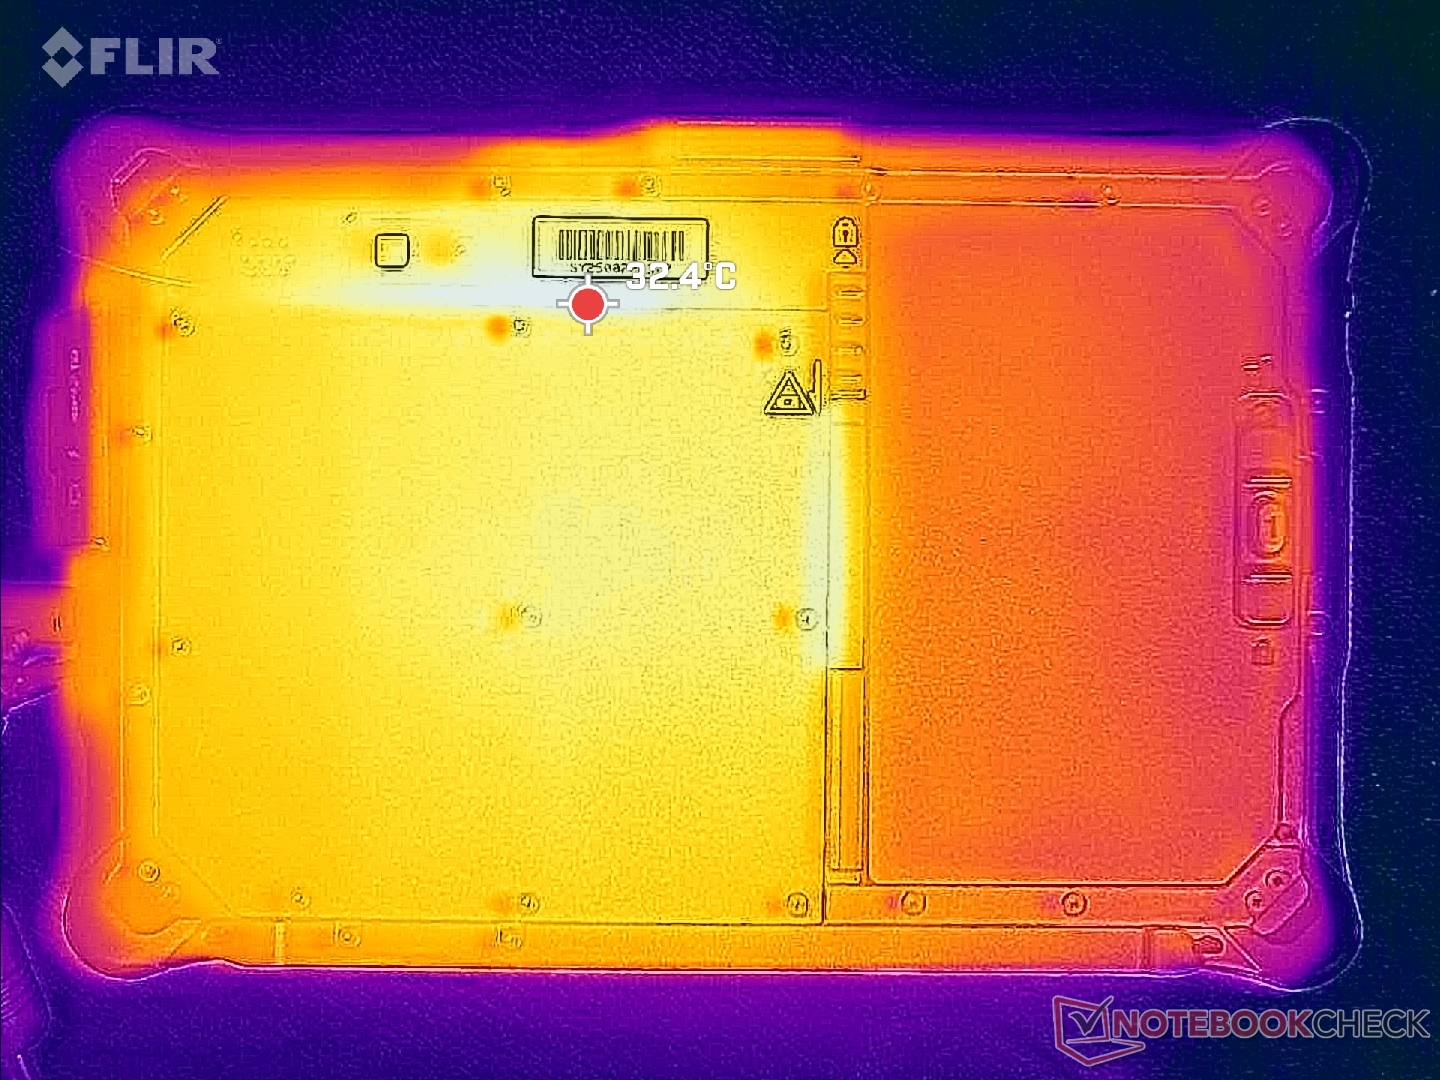
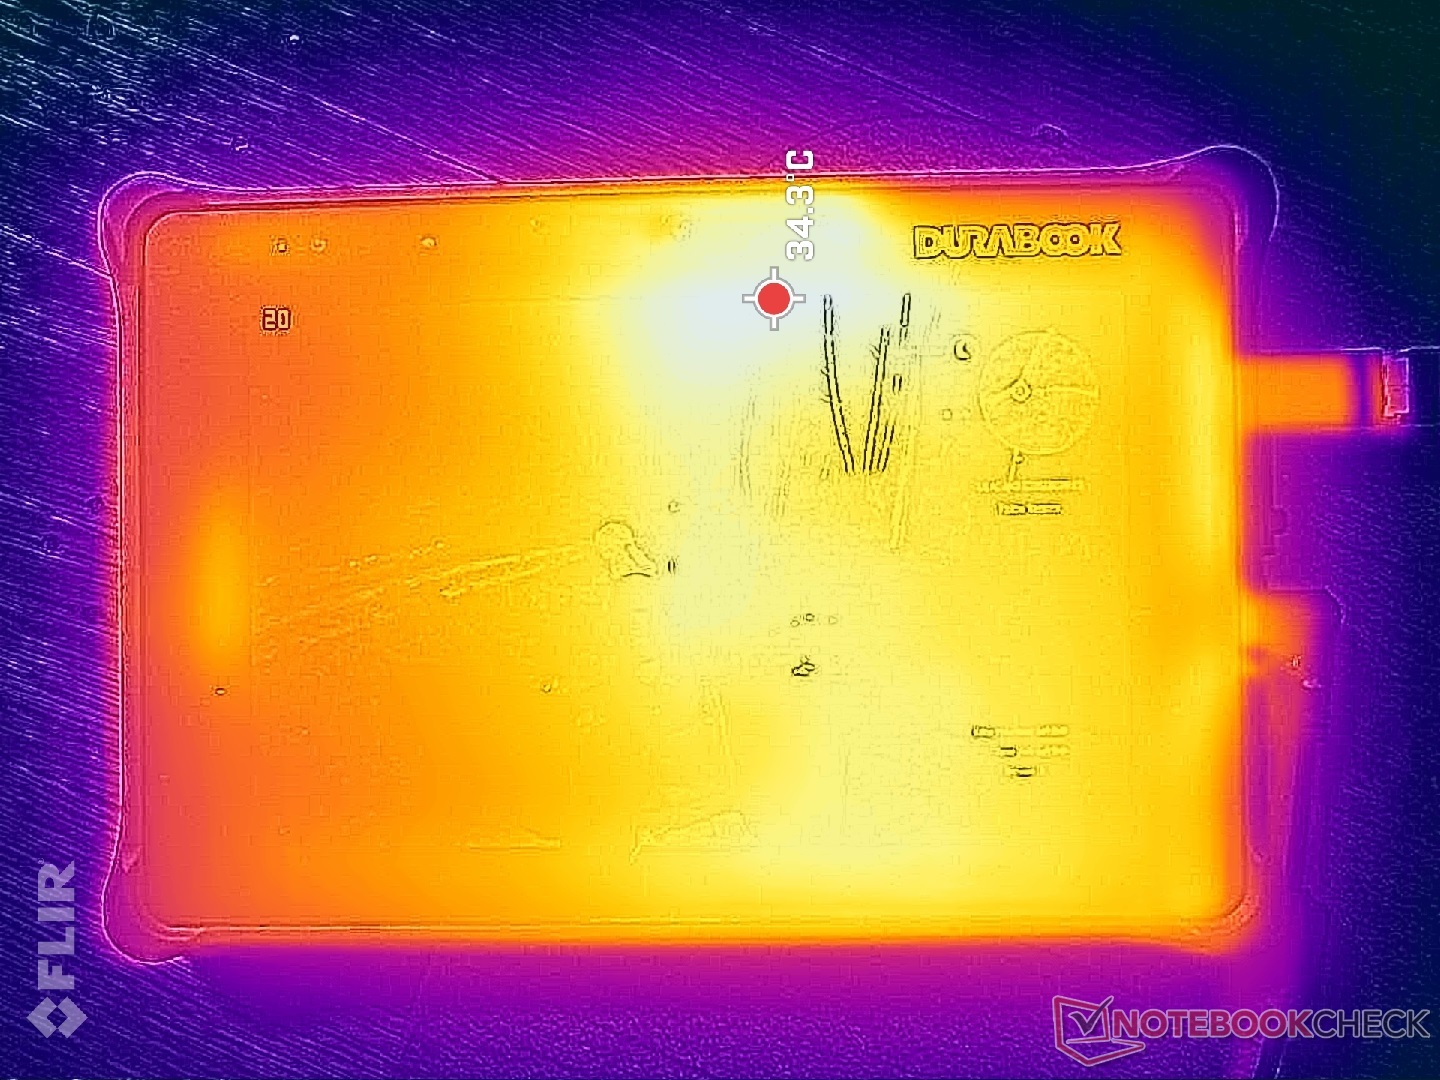
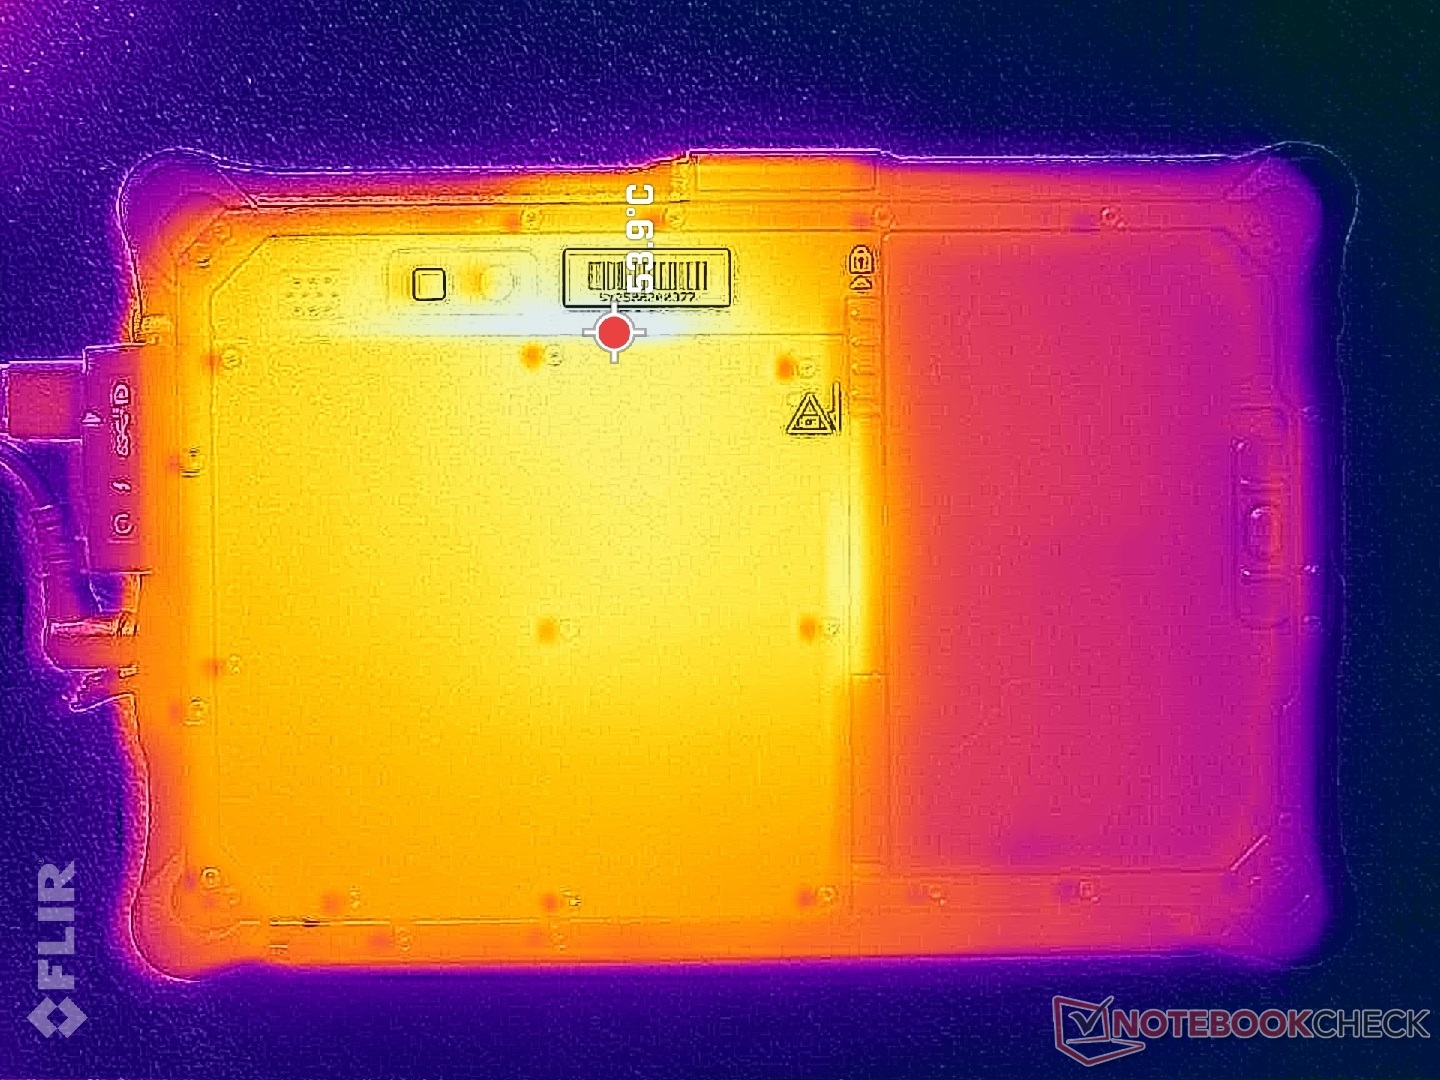
Le temperature della superficie sono più calde sulla metà destra del tablet rispetto a quella sinistra, a causa del posizionamento della scheda madre e della batteria. Il lato posteriore può essere molto caldo, fino a 54 C quando si eseguono carichi impegnativi, rispetto ai soli 40 C del tablet basato su AndroidAcer Enduro T1.
(+) La temperatura massima sul lato superiore è di 38.2 °C / 101 F, rispetto alla media di 33.7 °C / 93 F, che varia da 20.7 a 53.2 °C per questa classe Tablet.
(-) Il lato inferiore si riscalda fino ad un massimo di 49.6 °C / 121 F, rispetto alla media di 33.2 °C / 92 F
(+) In idle, la temperatura media del lato superiore è di 30.8 °C / 87 F, rispetto alla media deld ispositivo di 30 °C / 86 F.
| Durabook R8 Tablet Intel Core i5-1230U, Intel Iris Xe Graphics G7 80EUs | Acer Enduro T1 ET108-11A A9001 | Lenovo Tab M8 (Gen 4) Mediatek Helio A22 MT6761, PowerVR GE8300 | Dell Latitude 7230 Rugged Extreme Intel Core i5-1240U, Intel Iris Xe Graphics G7 80EUs | Panasonic Toughbook FZ-G2 Intel Core i5-10310U, Intel UHD Graphics 620 | |
|---|---|---|---|---|---|
| Heat | 7% | 29% | 9% | 19% | |
| Maximum Upper Side * (°C) | 38.2 | 37.8 1% | 28.6 25% | 32.6 15% | 37.4 2% |
| Maximum Bottom * (°C) | 49.6 | 39.4 21% | 30.1 39% | 40.2 19% | 36.6 26% |
| Idle Upper Side * (°C) | 32.2 | 32.8 -2% | 23.1 28% | 30.6 5% | 25.6 20% |
| Idle Bottom * (°C) | 33.4 | 31.2 7% | 25.1 25% | 35 -5% | 24 28% |
* ... Meglio usare valori piccoli
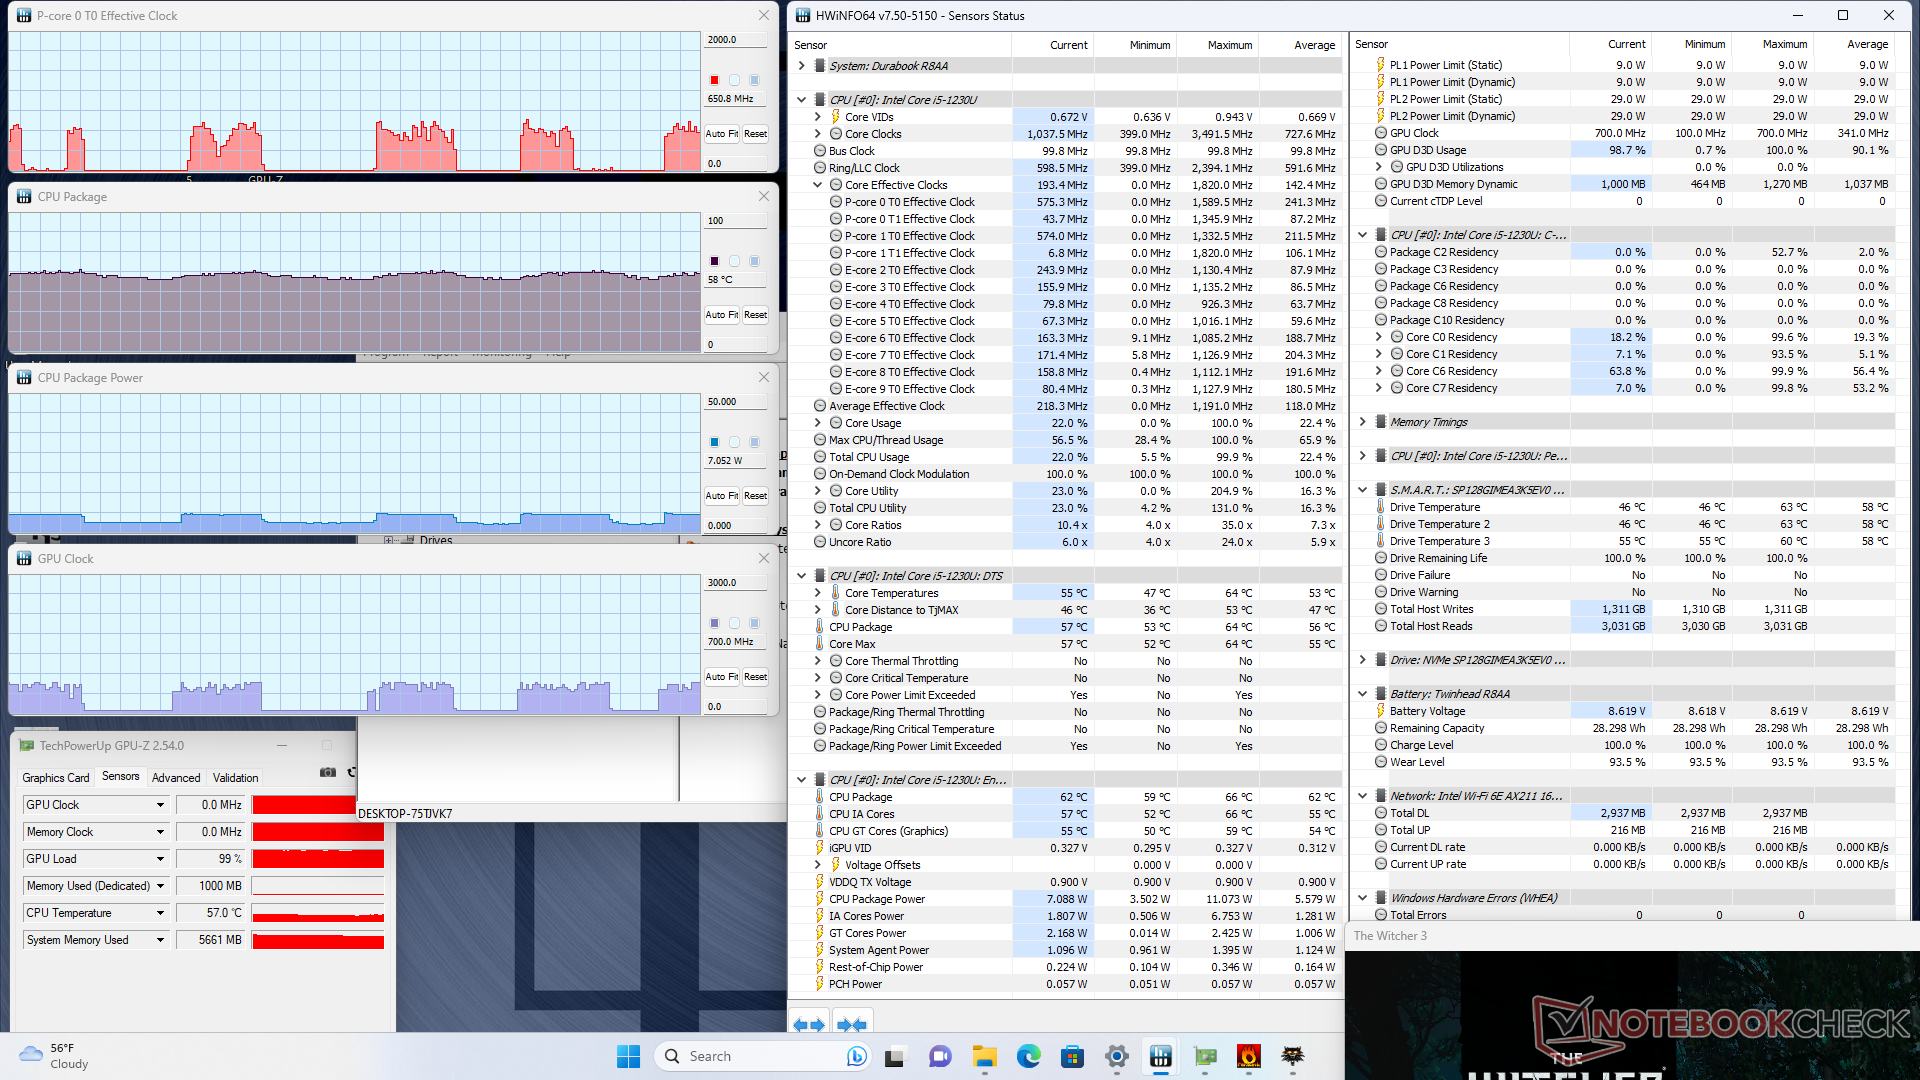
Stress test
La CPU ha raggiunto 1,8 GHz, 67 C e 15 W per i primi secondi dopo l'avvio dello stress Prime95, prima di scendere e stabilizzarsi a soli 400 MHz, 59 C e 7 W. Questi risultati sono significativamente inferiori rispetto a quelli ottenuti dal Dell XPS 13 9315 che monta la stessa CPU e spiegano i risultati dei benchmark inferiori alle aspettative nella sezione Prestazioni della CPU.
Le prestazioni a batteria rimarrebbero identiche.
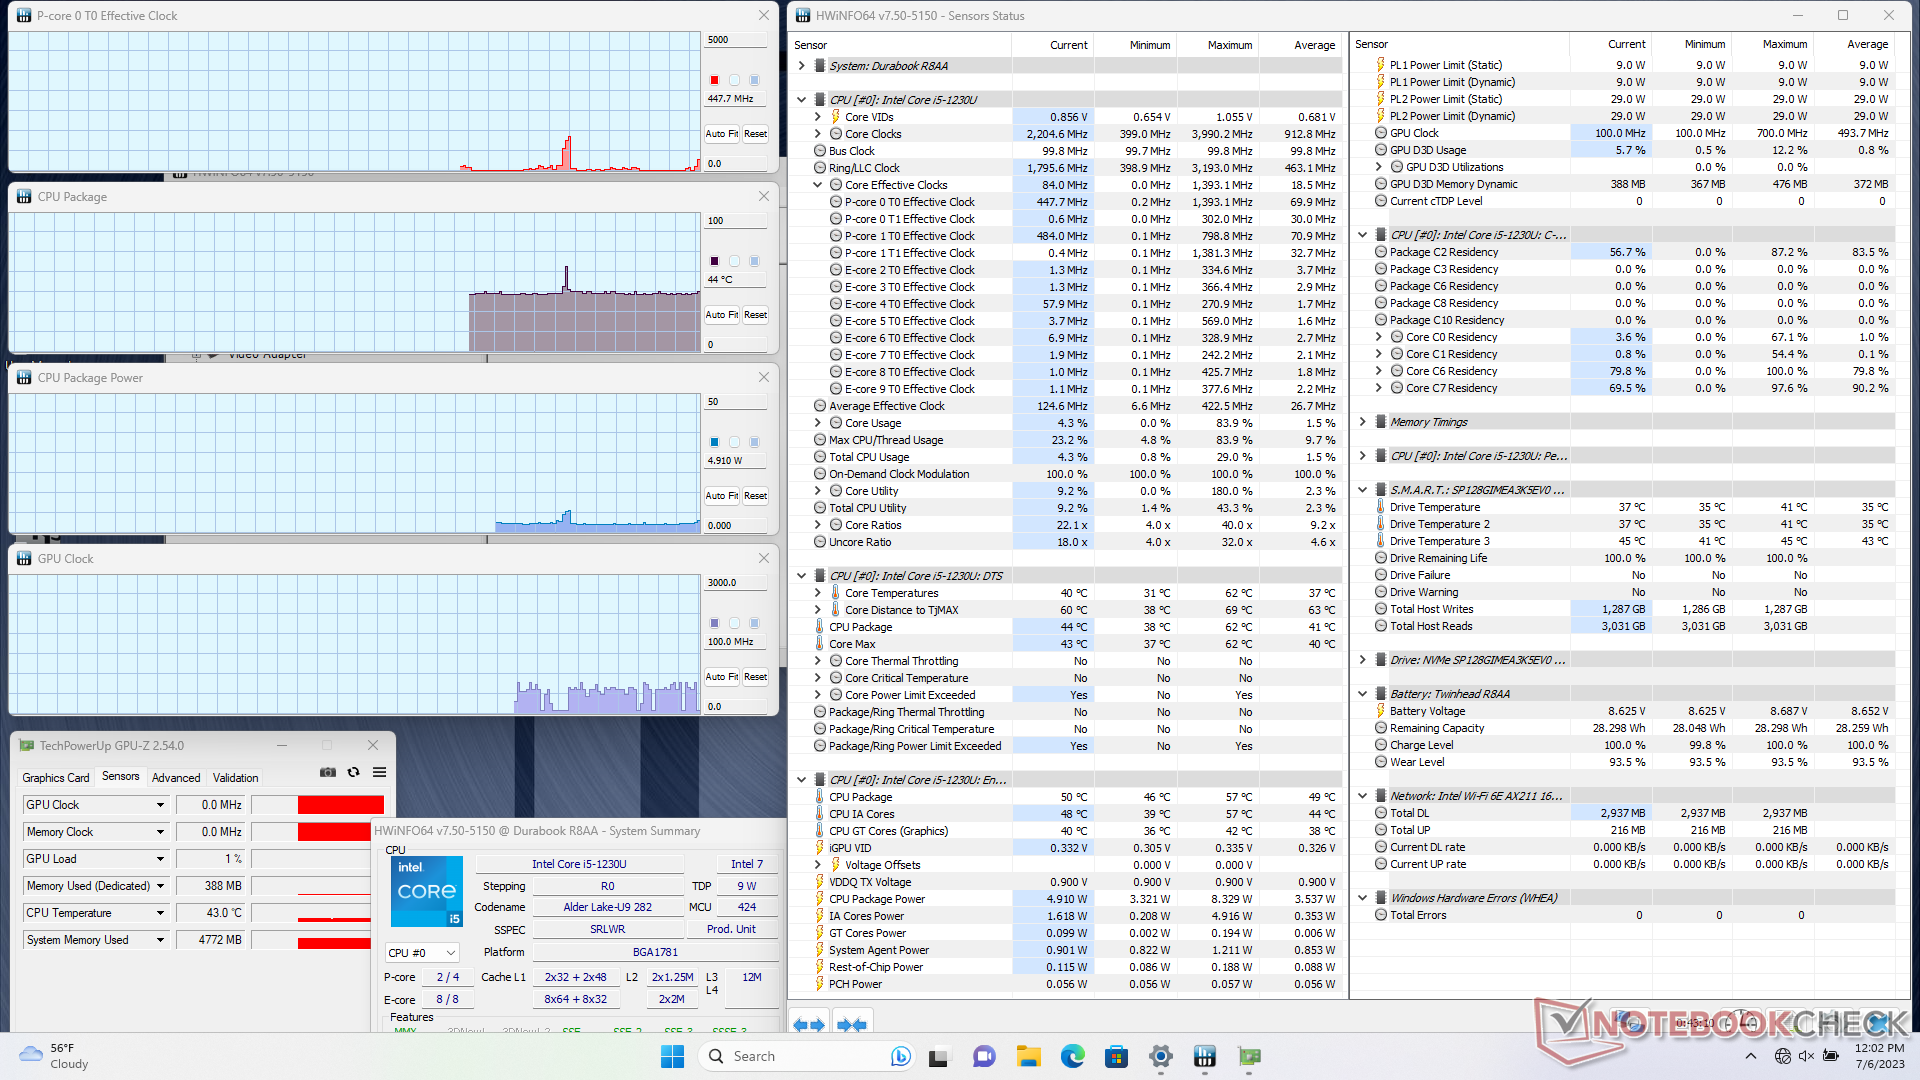
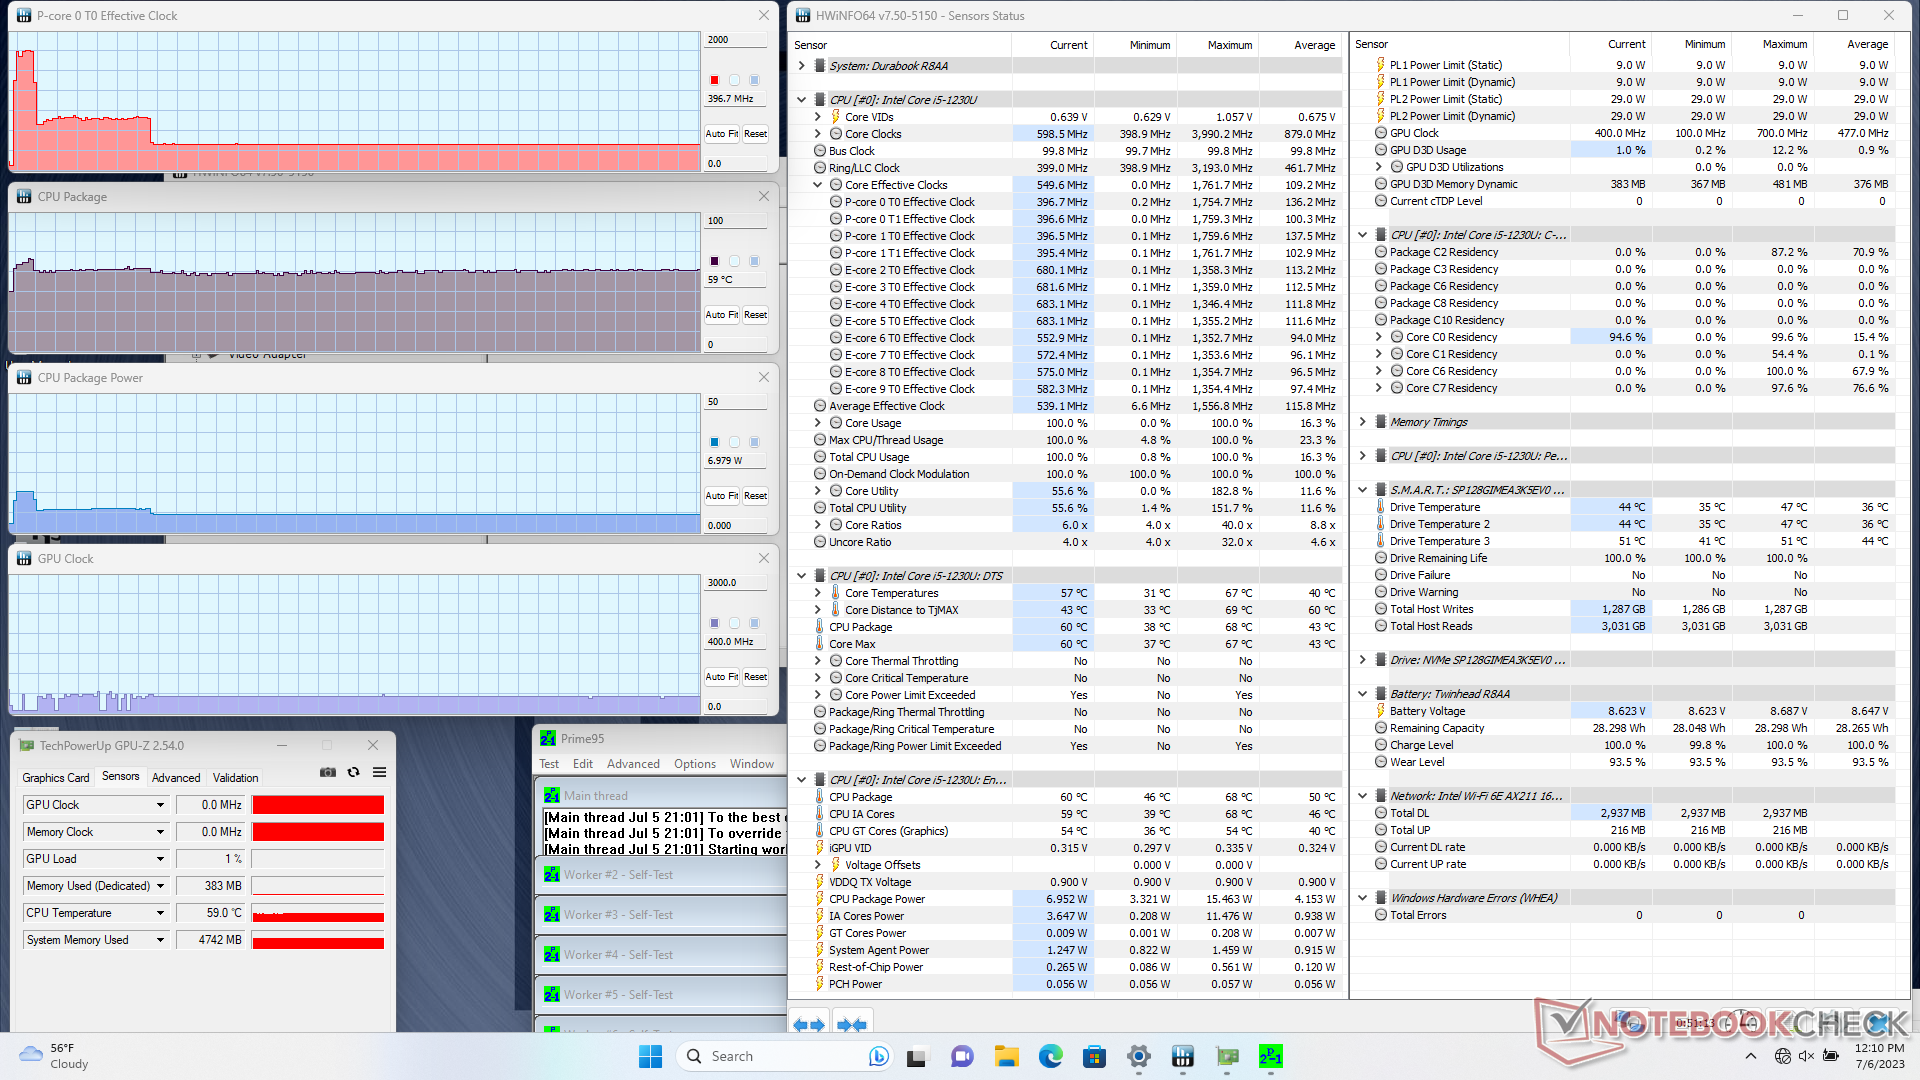
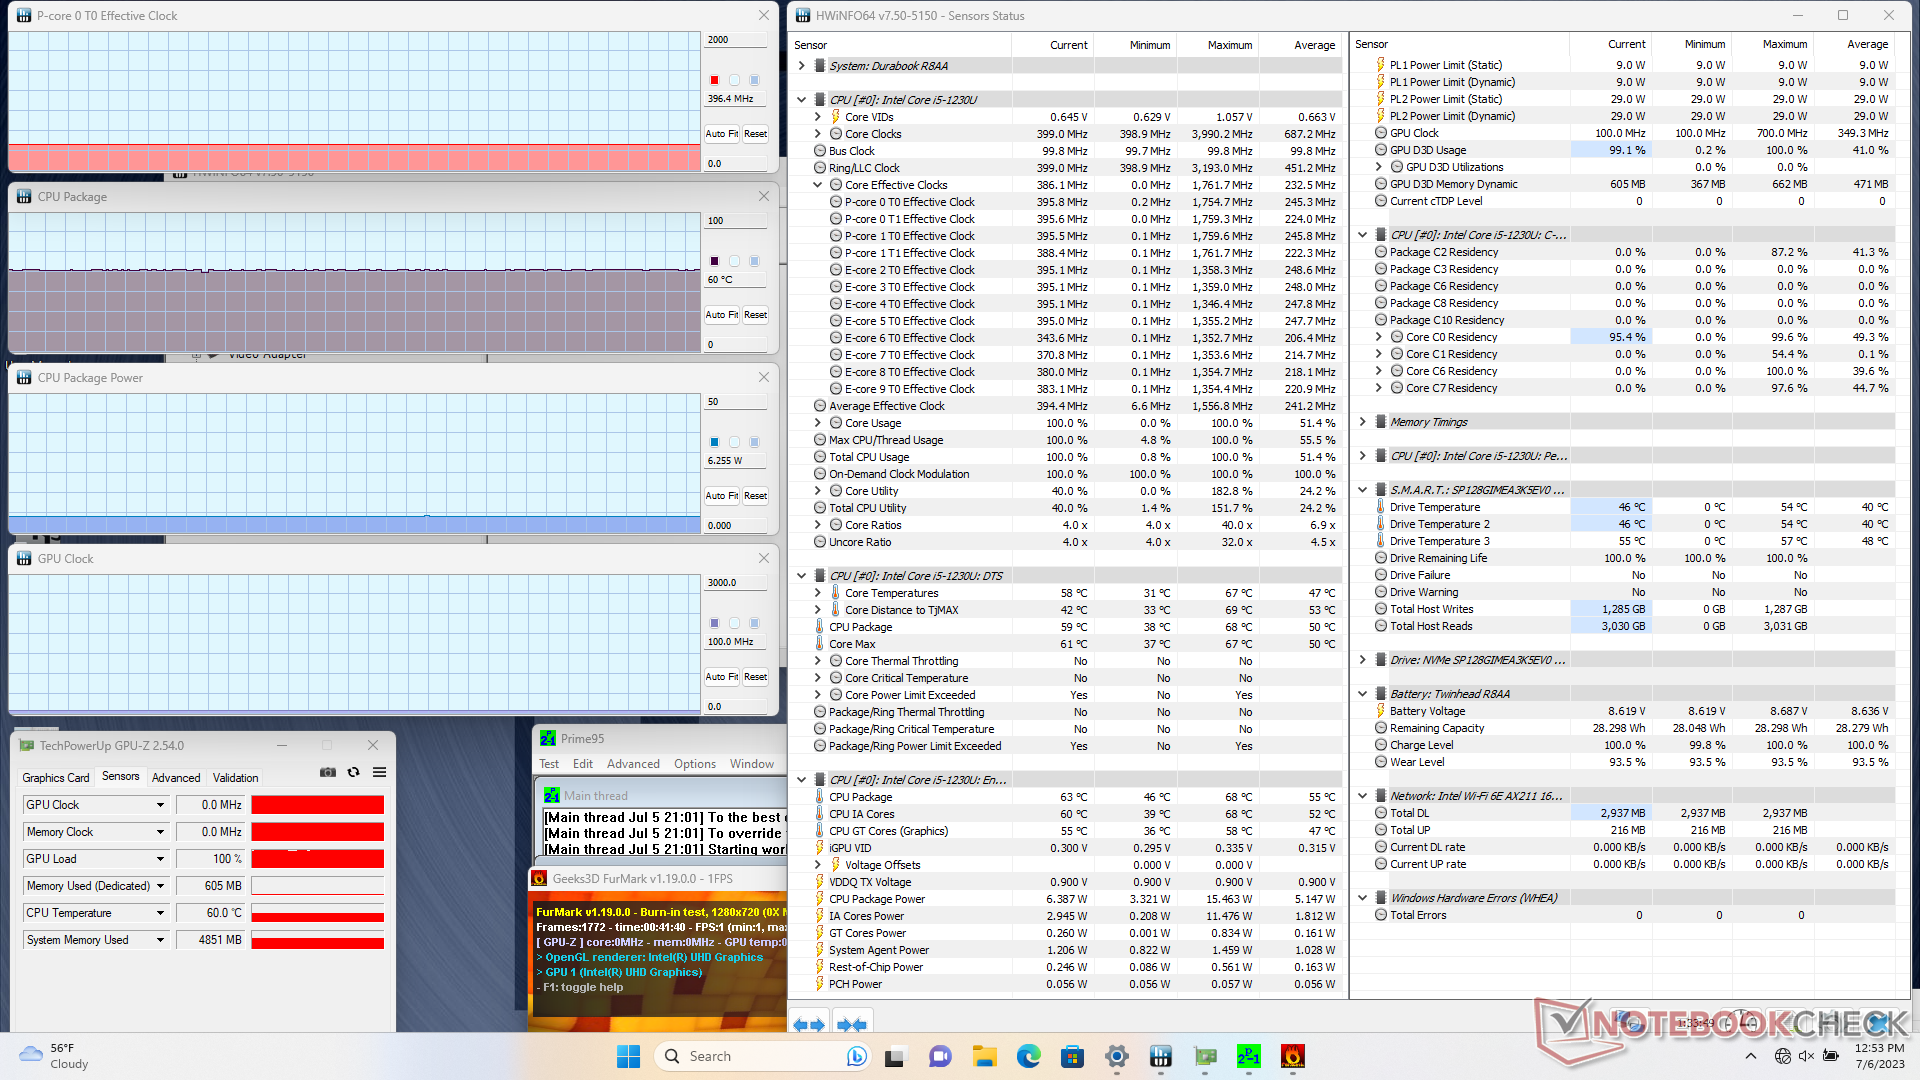
| Clock della CPU (GHz) | Clock della GPU (MHz) | Temperatura media della CPU (°C) | |
| Sistema inattivo | -- | -- | 44 |
| Stress Prime95 | 0,4 | -- | 59 |
| Prime95 + FurMark Stress | 0,4 | 100 | 60 |
| Witcher 3 Stress | ~0,6 | ~700 | 58 |
Altoparlanti
I bassi sono deboli, come prevedibile, ma il volume massimo avrebbe potuto essere più alto con soli 75 dB(A) rispetto agli 88 dB(A) dell'Acerduro T1 Acer Enduro T1. L'altoparlante del Durabook R8 è rivolto verso la parte posteriore, il che non è ottimale per l'utente.
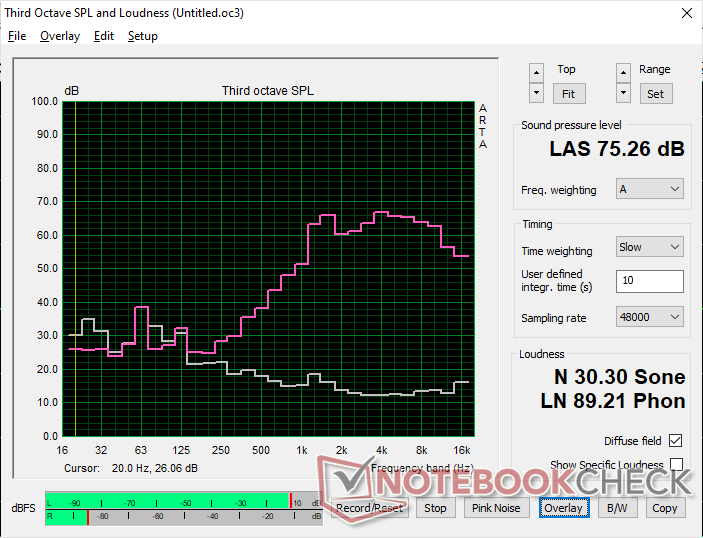
Durabook R8 Tablet analisi audio
(±) | potenza degli altiparlanti media ma buona (75.3 dB)
Bassi 100 - 315 Hz
(-) | quasi nessun basso - in media 25.7% inferiori alla media
(±) | la linearità dei bassi è media (8.4% delta rispetto alla precedente frequenza)
Medi 400 - 2000 Hz
(±) | medi ridotti - circa 10% inferiori alla media
(±) | linearità dei medi adeguata (13.9% delta rispetto alla precedente frequenza)
Alti 2 - 16 kHz
(±) | alti elevati - circa 10.6% superiori alla media
(+) | alti lineari (4.1% delta rispetto alla precedente frequenza)
Nel complesso 100 - 16.000 Hz
(-) | suono nel complesso non lineare (38% di differenza rispetto alla media
Rispetto alla stessa classe
» 97% di tutti i dispositivi testati in questa classe è stato migliore, 1% simile, 2% peggiore
» Il migliore ha avuto un delta di 7%, medio di 20%, peggiore di 129%
Rispetto a tutti i dispositivi testati
» 95% di tutti i dispositivi testati in questa classe è stato migliore, 1% similare, 5% peggiore
» Il migliore ha avuto un delta di 4%, medio di 23%, peggiore di 134%
Apple MacBook Pro 16 2021 M1 Pro analisi audio
(+) | gli altoparlanti sono relativamente potenti (84.7 dB)
Bassi 100 - 315 Hz
(+) | bassi buoni - solo 3.8% dalla media
(+) | bassi in lineaa (5.2% delta rispetto alla precedente frequenza)
Medi 400 - 2000 Hz
(+) | medi bilanciati - solo only 1.3% rispetto alla media
(+) | medi lineari (2.1% delta rispetto alla precedente frequenza)
Alti 2 - 16 kHz
(+) | Alti bilanciati - appena 1.9% dalla media
(+) | alti lineari (2.7% delta rispetto alla precedente frequenza)
Nel complesso 100 - 16.000 Hz
(+) | suono nel complesso lineare (4.6% differenza dalla media)
Rispetto alla stessa classe
» 0% di tutti i dispositivi testati in questa classe è stato migliore, 0% simile, 100% peggiore
» Il migliore ha avuto un delta di 5%, medio di 17%, peggiore di 45%
Rispetto a tutti i dispositivi testati
» 0% di tutti i dispositivi testati in questa classe è stato migliore, 0% similare, 100% peggiore
» Il migliore ha avuto un delta di 4%, medio di 23%, peggiore di 134%
Gestione dell'energia - Elevate prestazioni per watt
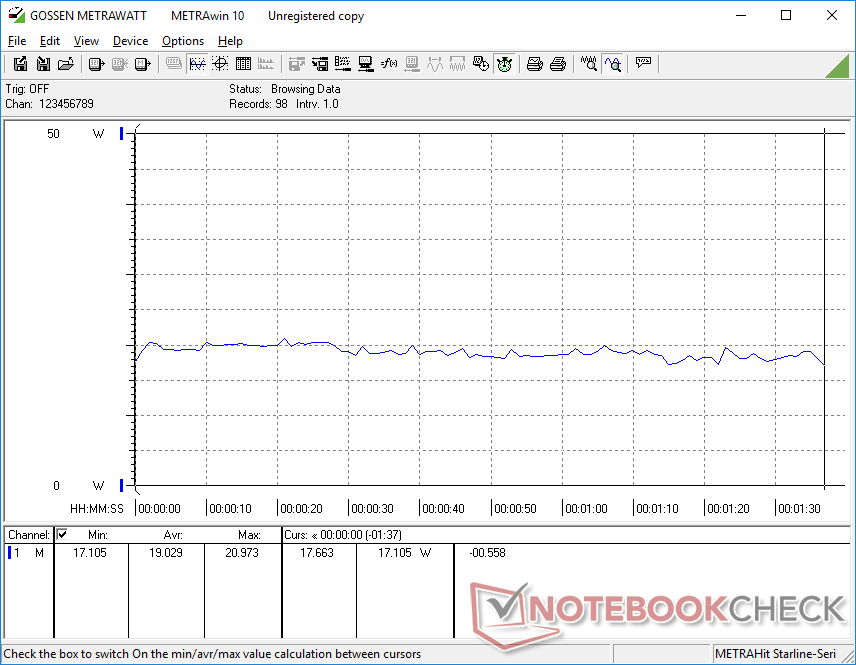
Consumo di energia
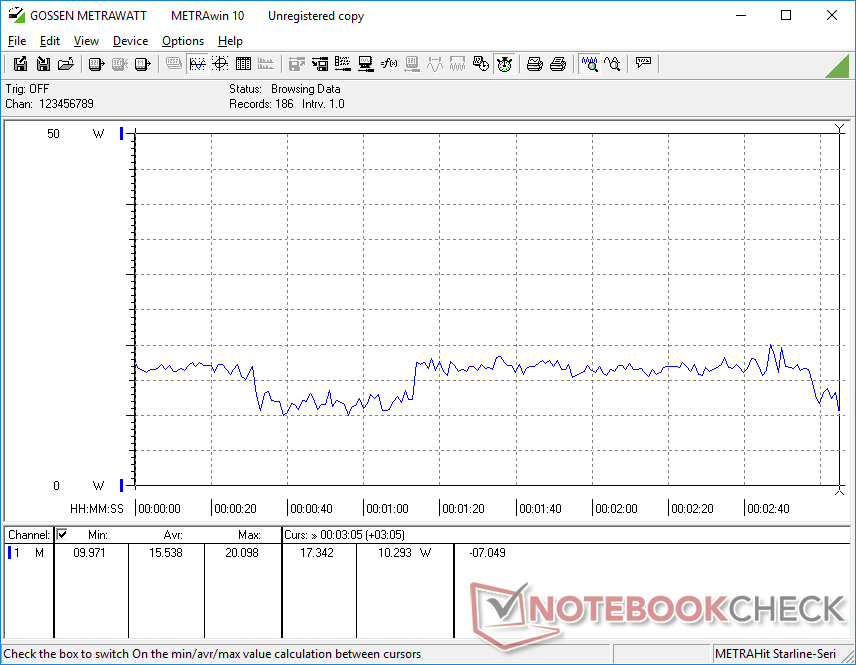
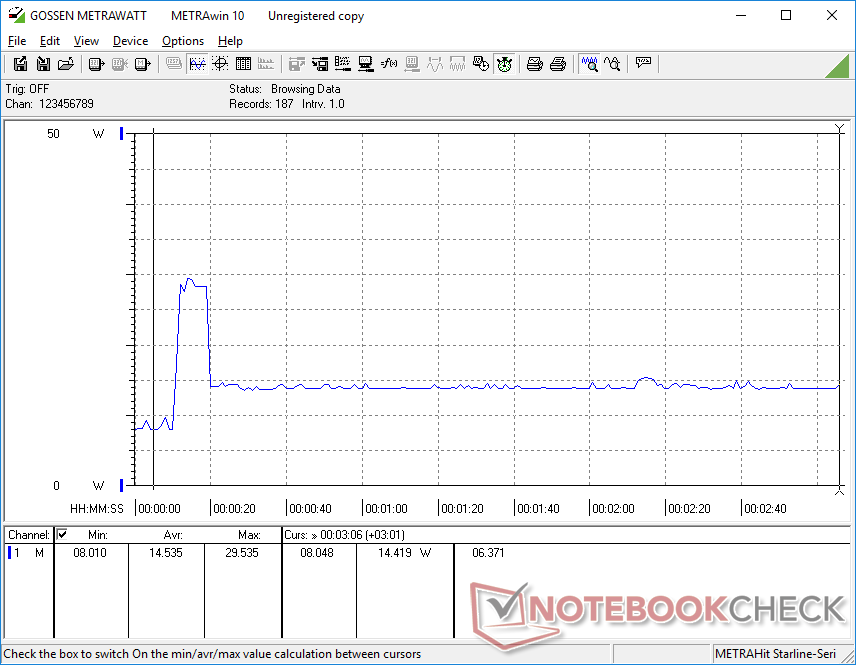
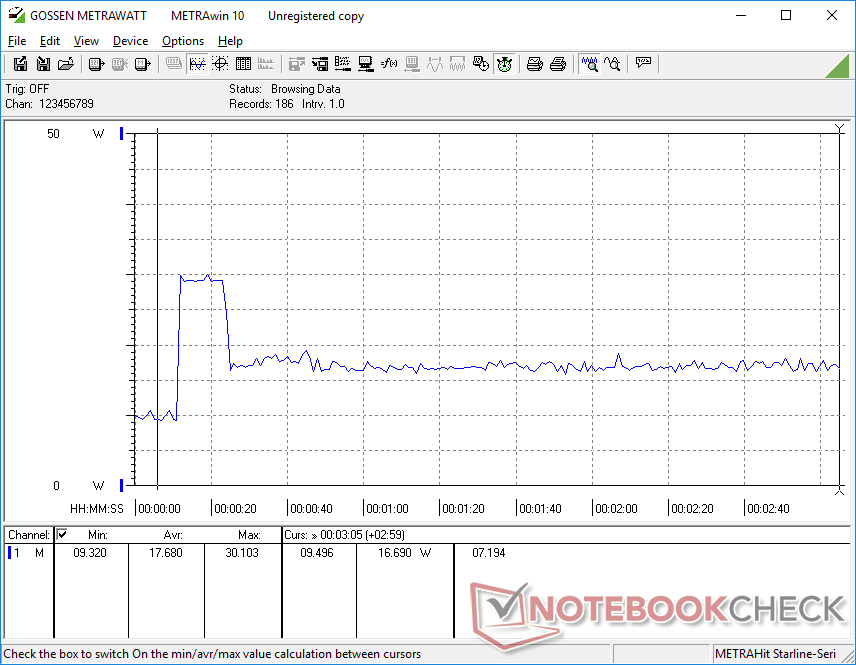
Il consumo di energia può arrivare a 3 W quando il computer è al minimo con l'impostazione di luminosità più bassa o a quasi 7 W se la luminosità è al massimo.
Il consumo complessivo in caso di carichi pesanti è circa la metà di quello del vecchio Panasonic Toughbook FZ-G2, anche se le prestazioni del processore sono quasi le stesse. Pertanto, gli utenti possono ancora beneficiare delle maggiori prestazioni per watt del più recente Core i5-1230U.
Siamo riusciti a misurare un consumo massimo di 30 W dal piccolo adattatore CA da 65 W (~10,5 x 4,5 x 3 cm).
| Off / Standby | |
| Idle | |
| Sotto carico |
|
Leggenda:
min: | |
| Durabook R8 Tablet i5-1230U, Iris Xe G7 80EUs, Silicon Power SP128GIMEA3K5EV0, IPS, 1280x800, 8" | Acer Enduro T1 ET108-11A A9001 64 GB eMMC Flash, IPS, 1280x800, 8" | Lenovo Tab M8 (Gen 4) Helio A22 MT6761, PowerVR GE8300, 32 GB eMMC Flash, IPS, 1280x800, 8" | Dell Latitude 7230 Rugged Extreme i5-1240U, Iris Xe G7 80EUs, WD PC SN740 512GB SDDPMQD-512G-1101, IPS, 1920x1200, 12" | Panasonic Toughbook FZ-G2 i5-10310U, UHD Graphics 620, Toshiba KIOXIA KBG4AZNV512G M.2 2280 OPAL, IPS, 1920x1200, 10.1" | |
|---|---|---|---|---|---|
| Power Consumption | 73% | 71% | -102% | -65% | |
| Idle Minimum * (Watt) | 2.8 | 1.1 61% | 1.7 39% | 6.5 -132% | 3.5 -25% |
| Idle Average * (Watt) | 6.3 | 2.2 65% | 1.9 70% | 8.9 -41% | 8.1 -29% |
| Idle Maximum * (Watt) | 10.3 | 2.2 79% | 2.4 77% | 14.3 -39% | 8.2 20% |
| Load Average * (Watt) | 19 | 3.6 81% | 3 84% | 44.9 -136% | 34.7 -83% |
| Witcher 3 ultra * (Watt) | 15.5 | 43.2 -179% | 31.8 -105% | ||
| Load Maximum * (Watt) | 30.1 | 6.7 78% | 3.9 87% | 54.8 -82% | 79.7 -165% |
* ... Meglio usare valori piccoli
Power Consumption Witcher 3 / Stresstest
Power Consumption external Monitor
Durata della batteria
L'autonomia WLAN nel mondo reale è di appena 5,5 ore con la batteria rimovibile da 27 Wh. Gli utenti possono passare a batterie più grandi e pesanti o portarne più di una alla volta per scambiarle, ma la durata della batteria è comunque deludente.
La ricarica della batteria da 27 Wh da vuota a piena è relativamente lenta, circa 2 ore.
| Durabook R8 Tablet i5-1230U, Iris Xe G7 80EUs, 27.4 Wh | Acer Enduro T1 ET108-11A A9001 Wh | Lenovo Tab M8 (Gen 4) Helio A22 MT6761, PowerVR GE8300, Wh | Dell Latitude 7230 Rugged Extreme i5-1240U, Iris Xe G7 80EUs, 72 Wh | Panasonic Toughbook FZ-G2 i5-10310U, UHD Graphics 620, 68 Wh | |
|---|---|---|---|---|---|
| Autonomia della batteria | 194% | 192% | 145% | 111% | |
| WiFi v1.3 (h) | 5.3 | 15.6 194% | 15.5 192% | 13 145% | 11.2 111% |
| Reader / Idle (h) | 37.1 | ||||
| H.264 (h) | 16.6 | ||||
| Load (h) | 3.8 | 3.6 |
Pro
Contro
Verdetto - Un design solido con alcuni inconvenienti
I maggiori punti di forza del Durabook R8 sono il design senza ventole, le versatili opzioni di configurazione e il supporto Thunderbolt 4. Si tratta di una combinazione non comune di caratteristiche che possono interessare una certa categoria di professionisti. Si tratta di una combinazione di caratteristiche non comune che può interessare una certa categoria di professionisti. Ci piace soprattutto la facilità di accesso ai moduli SSD, WLAN e WAN dal retro.
L'approccio senza ventole è tuttavia accompagnato dalla solita serie di avvertenze. Le prestazioni della CPU sono state ridotte di molto e le temperature superficiali possono diventare molto calde, soprattutto sul retro. Questo non significa che il tablet sia lento, ma non aspettatevi prestazioni pari a quelle di un laptop con lo stesso processore.
Il Durabook R8 è consigliato soprattutto per il design senza ventole, la facilità d'uso e l'ampio supporto per le periferiche. Altri aspetti, come la durata della batteria e i colori, potrebbero essere migliori.
Ci sono diversi aspetti minori che potrebbero essere migliorati nelle future revisioni. Il meccanismo di espulsione del lettore MicroSD, ad esempio, deve essere più robusto e affidabile. L'altoparlante potrebbe essere rivolto verso la parte anteriore anziché posteriore per essere più utile. Le strette porte USB-C potrebbero essere allargate per ridurre l'affollamento. La porta proprietaria AC potrebbe essere eliminata a favore della ricarica universale USB-C. Infine, la durata della batteria predefinita potrebbe essere maggiore e il PWM dovrebbe essere ridotto o eliminato.
Prezzo e disponibilità
Gli utenti possono richiedere un preventivo per il tablet Durabook R8 direttamente al produttore https://www.durabook.com/us/products/r8-tablet/.
Durabook R8 Tablet
- 07/12/2023 v7 (old)
Allen Ngo
Transparency
La selezione dei dispositivi da recensire viene effettuata dalla nostra redazione. Il campione di prova è stato fornito all'autore come prestito dal produttore o dal rivenditore ai fini di questa recensione. L'istituto di credito non ha avuto alcuna influenza su questa recensione, né il produttore ne ha ricevuto una copia prima della pubblicazione. Non vi era alcun obbligo di pubblicare questa recensione. In quanto società mediatica indipendente, Notebookcheck non è soggetta all'autorità di produttori, rivenditori o editori.
Ecco come Notebookcheck esegue i test
Ogni anno, Notebookcheck esamina in modo indipendente centinaia di laptop e smartphone utilizzando procedure standardizzate per garantire che tutti i risultati siano comparabili. Da circa 20 anni sviluppiamo continuamente i nostri metodi di prova e nel frattempo stabiliamo gli standard di settore. Nei nostri laboratori di prova, tecnici ed editori esperti utilizzano apparecchiature di misurazione di alta qualità. Questi test comportano un processo di validazione in più fasi. Il nostro complesso sistema di valutazione si basa su centinaia di misurazioni e parametri di riferimento ben fondati, che mantengono l'obiettività.Price comparison

