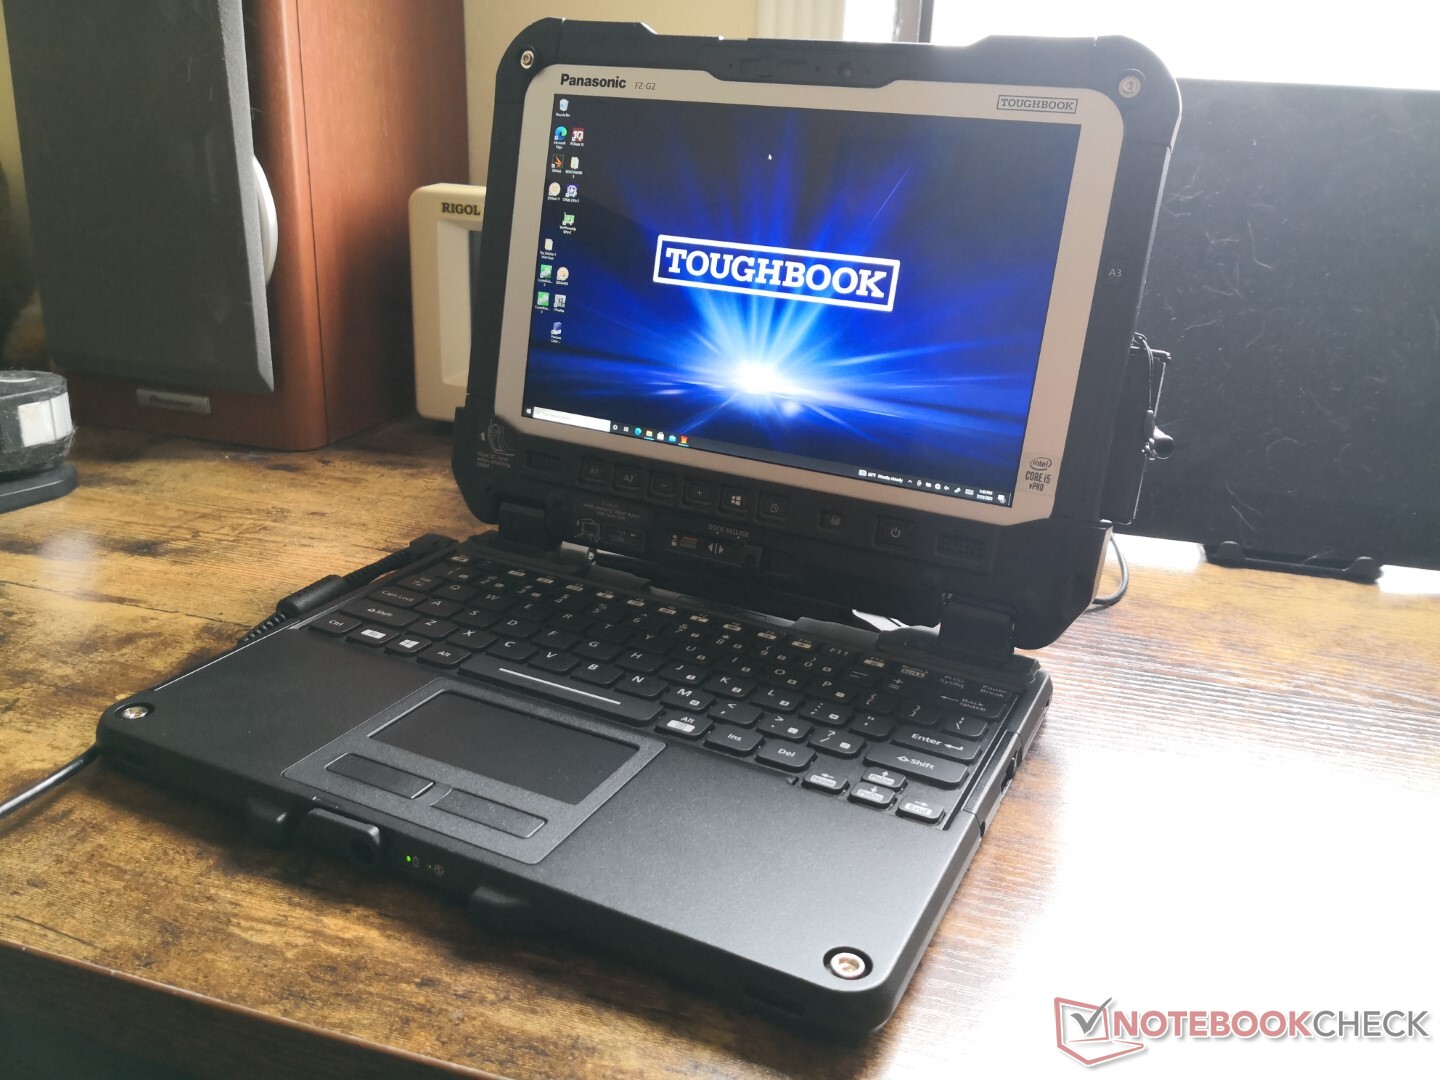
Recensione del convertibile rugged Panasonic Toughbook FZ-G2: Tablet con archiviazione PCIe M.2 rimovibile
Confronto con i potenziali concorrenti
Punteggio | Data | Modello | Peso | Altezza | Dimensione | Risoluzione | Prezzo |
|---|---|---|---|---|---|---|---|
v (old) | 08/2021 | Panasonic Toughbook FZ-G2 i5-10310U, UHD Graphics 620 | 1.5 kg | 28 mm | 10.10" | 1920x1200 | |
v (old) | 07/2021 | Panasonic Toughbook FZ-S1 SD 660, Adreno 512 | 503 gr | 19.1 mm | 7.00" | 1280x800 | |
v (old) | 04/2021 | Durabook S14I i7-1165G7, Iris Xe G7 96EUs | 3 kg | 38.1 mm | 14.00" | 1920x1080 | |
| 78.1 % v7 (old) | 07/2020 | Panasonic Toughbook FZ-A3 SD 660, Adreno 512 | 930 gr | 16.4 mm | 10.10" | 1920x1200 | |
v (old) | 07/2020 | Durabook R11 i5-8250U, UHD Graphics 620 | 1.2 kg | 20 mm | 11.60" | 1920x1080 | |
v (old) | 09/2020 | Acer Enduro T1 ET108-11A A9001 | 499 gr | 10.9 mm | 8.00" | 1280x800 |


| |||||||||||||||||||||||||
Distribuzione della luminosità: 90 %
Al centro con la batteria: 1078.6 cd/m²
Contrasto: 2247:1 (Nero: 0.48 cd/m²)
ΔE ColorChecker Calman: 4.18 | ∀{0.5-29.43 Ø4.71}
calibrated: 1.95
ΔE Greyscale Calman: 4.8 | ∀{0.09-98 Ø4.96}
53.8% AdobeRGB 1998 (Argyll 3D)
78.5% sRGB (Argyll 3D)
52.1% Display P3 (Argyll 3D)
Gamma: 2.05
CCT: 7565 K
| Panasonic Toughbook FZ-G2 InfoVision M133NWFD R1, IPS, 10.1", 1920x1200 | Panasonic Toughbook FZ-S1 IPS, 7", 1280x800 | Durabook S14I KD140N0730A01, TN, 14", 1920x1080 | Panasonic Toughbook FZ-A3 IPS, 10.1", 1920x1200 | Durabook R11 BOE5F9, IPS, 11.6", 1920x1080 | Acer Enduro T1 ET108-11A A9001 IPS, 8", 1280x800 | |
|---|---|---|---|---|---|---|
| Display | -16% | 11% | ||||
| Display P3 Coverage (%) | 52.1 | 43.55 -16% | 59.3 14% | |||
| sRGB Coverage (%) | 78.5 | 65.4 -17% | 82.9 6% | |||
| AdobeRGB 1998 Coverage (%) | 53.8 | 45 -16% | 60 12% | |||
| Response Times | 27% | 55% | 1% | 50% | 26% | |
| Response Time Grey 50% / Grey 80% * (ms) | 54.4 ? | 33.2 ? 39% | 30.4 ? 44% | 54 ? 1% | 26 ? 52% | 33.6 ? 38% |
| Response Time Black / White * (ms) | 34.4 ? | 29.2 ? 15% | 11.8 ? 66% | 34 ? 1% | 18.4 ? 47% | 29.6 ? 14% |
| PWM Frequency (Hz) | 211.9 ? | 304.9 ? | 193.8 ? | 198.4 ? | ||
| Screen | -43% | -125% | -35% | -76% | -30% | |
| Brightness middle (cd/m²) | 1078.6 | 697.3 -35% | 1180.7 9% | 1078 0% | 584.2 -46% | 350 -68% |
| Brightness (cd/m²) | 1056 | 637 -40% | 1102 4% | 1060 0% | 560 -47% | 353 -67% |
| Brightness Distribution (%) | 90 | 85 -6% | 89 -1% | 77 -14% | 79 -12% | 92 2% |
| Black Level * (cd/m²) | 0.48 | 0.92 -92% | 1.91 -298% | 0.68 -42% | 0.52 -8% | 0.21 56% |
| Contrast (:1) | 2247 | 758 -66% | 618 -72% | 1585 -29% | 1123 -50% | 1667 -26% |
| Colorchecker dE 2000 * | 4.18 | 5.79 -39% | 13.45 -222% | 5.94 -42% | 9.29 -122% | 5.68 -36% |
| Colorchecker dE 2000 max. * | 6.2 | 9.29 -50% | 22.52 -263% | 12.54 -102% | 14.43 -133% | 10.51 -70% |
| Colorchecker dE 2000 calibrated * | 1.95 | 3.19 -64% | 4.72 -142% | |||
| Greyscale dE 2000 * | 4.8 | 5.4 -13% | 15.4 -221% | 7.2 -50% | 10.6 -121% | 6.3 -31% |
| Gamma | 2.05 107% | 2.18 101% | 1.97 112% | 2.17 101% | 2.41 91% | 2.12 104% |
| CCT | 7565 86% | 5736 113% | 21134 31% | 6530 100% | 6230 104% | 7390 88% |
| Color Space (Percent of AdobeRGB 1998) (%) | 41.6 | 53.4 | ||||
| Color Space (Percent of sRGB) (%) | 65.5 | 82.2 | ||||
| Media totale (Programma / Settaggio) | -8% /
-29% | -29% /
-76% | -17% /
-28% | -5% /
-39% | -2% /
-19% |
* ... Meglio usare valori piccoli
Tempi di risposta del Display
| ↔ Tempi di risposta dal Nero al Bianco | ||
|---|---|---|
| 34.4 ms ... aumenta ↗ e diminuisce ↘ combinato | ↗ 20 ms Incremento | 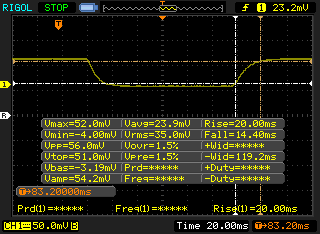 |
| ↘ 14.4 ms Calo | ||
| Lo schermo mostra tempi di risposta lenti nei nostri tests e sarà insoddisfacente per i gamers. In confronto, tutti i dispositivi di test variano da 0.1 (minimo) a 240 (massimo) ms. » 92 % di tutti i dispositivi è migliore. Questo significa che i tempi di risposta rilevati sono peggiori rispetto alla media di tutti i dispositivi testati (19.8 ms). | ||
| ↔ Tempo di risposta dal 50% Grigio all'80% Grigio | ||
| 54.4 ms ... aumenta ↗ e diminuisce ↘ combinato | ↗ 26.8 ms Incremento | 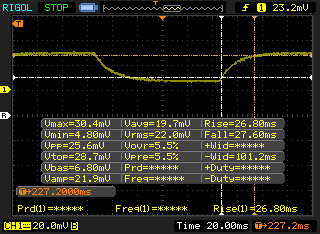 |
| ↘ 27.6 ms Calo | ||
| Lo schermo mostra tempi di risposta lenti nei nostri tests e sarà insoddisfacente per i gamers. In confronto, tutti i dispositivi di test variano da 0.165 (minimo) a 636 (massimo) ms. » 91 % di tutti i dispositivi è migliore. Questo significa che i tempi di risposta rilevati sono peggiori rispetto alla media di tutti i dispositivi testati (31 ms). | ||
Sfarfallio dello schermo / PWM (Pulse-Width Modulation)
| flickering dello schermo / PWM rilevato | 211.9 Hz | ≤ 7 % settaggio luminosita' | 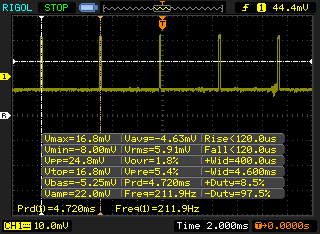 |
Il display sfarfalla a 211.9 Hz (Probabilmente a causa dell'uso di PWM) Flickering rilevato ad una luminosita' di 7 % o inferiore. Non dovrebbe verificarsi flickering o PWM sopra questo valore di luminosita'. La frequenza di 211.9 Hz è relativamente bassa, quindi gli utenti sensibili potrebbero notare il flickering ed accusare stanchezza agli occhi a questo livello di luminosità e a livelli inferiori. In confronto: 52 % di tutti i dispositivi testati non utilizza PWM per ridurre la luminosita' del display. Se è rilevato PWM, una media di 7757 (minimo: 5 - massimo: 343500) Hz è stata rilevata. | |||
Cinebench R15 Multi Loop
Cinebench R23: Multi Core | Single Core
Cinebench R15: CPU Multi 64Bit | CPU Single 64Bit
Blender: v2.79 BMW27 CPU
7-Zip 18.03: 7z b 4 -mmt1 | 7z b 4
Geekbench 5.5: Single-Core | Multi-Core
HWBOT x265 Benchmark v2.2: 4k Preset
LibreOffice : 20 Documents To PDF
R Benchmark 2.5: Overall mean
| Cinebench R23 / Multi Core | |
| ADATA XPG Xenia 14 | |
| Dell Latitude 9420 2-in-1 | |
| HP EliteBook x360 1040 G7, i7-10810U | |
| Microsoft Surface Pro 7 Plus | |
| Durabook S14I | |
| Panasonic Toughbook FZ-G2 | |
| Media Intel Core i5-10310U (n=1) | |
| Cinebench R23 / Single Core | |
| ADATA XPG Xenia 14 | |
| Dell Latitude 9420 2-in-1 | |
| Durabook S14I | |
| Microsoft Surface Pro 7 Plus | |
| HP EliteBook x360 1040 G7, i7-10810U | |
| Panasonic Toughbook FZ-G2 | |
| Media Intel Core i5-10310U (n=1) | |
| Geekbench 5.5 / Single-Core | |
| Durabook S14I | |
| Microsoft Surface Pro 7 Plus | |
| HP EliteBook x360 1040 G7, i7-10810U | |
| Lenovo ThinkPad E14-20RA001LGE | |
| Media Intel Core i5-10310U (1040 - 1128, n=6) | |
| Fujitsu LifeBook U9310X | |
| Durabook R11 | |
| Panasonic Toughbook FZ-A3 | |
| Panasonic Toughbook FZ-S1 | |
| Geekbench 5.5 / Multi-Core | |
| HP EliteBook x360 1040 G7, i7-10810U | |
| Microsoft Surface Pro 7 Plus | |
| Durabook S14I | |
| Fujitsu LifeBook U9310X | |
| Media Intel Core i5-10310U (2821 - 3854, n=6) | |
| Lenovo ThinkPad E14-20RA001LGE | |
| Durabook R11 | |
| Panasonic Toughbook FZ-S1 | |
| Panasonic Toughbook FZ-A3 | |
| HWBOT x265 Benchmark v2.2 / 4k Preset | |
| ADATA XPG Xenia 14 | |
| Dell Latitude 9420 2-in-1 | |
| HP EliteBook x360 1040 G7, i7-10810U | |
| Microsoft Surface Pro 7 Plus | |
| Durabook S14I | |
| Lenovo ThinkPad E14-20RA001LGE | |
| Media Intel Core i5-10310U (3.88 - 5.35, n=5) | |
| Fujitsu LifeBook U9310X | |
| Panasonic Toughbook FZ-G2 | |
| HP ZBook 14u G6 6TP71EA | |
| Durabook R11 | |
| LibreOffice / 20 Documents To PDF | |
| Durabook R11 | |
| Panasonic Toughbook FZ-G2 | |
| Media Intel Core i5-10310U (60 - 71.4, n=5) | |
| HP EliteBook x360 1040 G7, i7-10810U | |
| Microsoft Surface Pro 7 Plus | |
| Fujitsu LifeBook U9310X | |
| Lenovo ThinkPad E14-20RA001LGE | |
| Dell Latitude 9420 2-in-1 | |
| ADATA XPG Xenia 14 | |
| Durabook S14I | |
| R Benchmark 2.5 / Overall mean | |
| Durabook R11 | |
| Media Intel Core i5-10310U (0.703 - 0.806, n=5) | |
| Panasonic Toughbook FZ-G2 | |
| Fujitsu LifeBook U9310X | |
| Lenovo ThinkPad E14-20RA001LGE | |
| Microsoft Surface Pro 7 Plus | |
| HP EliteBook x360 1040 G7, i7-10810U | |
| Durabook S14I | |
| Dell Latitude 9420 2-in-1 | |
| ADATA XPG Xenia 14 | |
Cinebench R23: Multi Core | Single Core
Cinebench R15: CPU Multi 64Bit | CPU Single 64Bit
Blender: v2.79 BMW27 CPU
7-Zip 18.03: 7z b 4 -mmt1 | 7z b 4
Geekbench 5.5: Single-Core | Multi-Core
HWBOT x265 Benchmark v2.2: 4k Preset
LibreOffice : 20 Documents To PDF
R Benchmark 2.5: Overall mean
* ... Meglio usare valori piccoli
| PCMark 10 / Score | |
| Durabook S14I | |
| Media Intel Core i5-10310U, Intel UHD Graphics 620 (3888 - 4155, n=5) | |
| Panasonic Toughbook FZ-G2 | |
| Durabook R11 | |
| PCMark 10 / Essentials | |
| Durabook S14I | |
| Panasonic Toughbook FZ-G2 | |
| Media Intel Core i5-10310U, Intel UHD Graphics 620 (8289 - 8659, n=5) | |
| Durabook R11 | |
| PCMark 10 / Productivity | |
| Durabook S14I | |
| Media Intel Core i5-10310U, Intel UHD Graphics 620 (6151 - 6886, n=5) | |
| Panasonic Toughbook FZ-G2 | |
| Durabook R11 | |
| PCMark 10 / Digital Content Creation | |
| Durabook S14I | |
| Media Intel Core i5-10310U, Intel UHD Graphics 620 (3021 - 3265, n=5) | |
| Panasonic Toughbook FZ-G2 | |
| Durabook R11 | |
| PCMark 10 Score | 3888 punti | |
Aiuto | ||
| DPC Latencies / LatencyMon - interrupt to process latency (max), Web, Youtube, Prime95 | |
| Durabook R11 | |
| Durabook S14I | |
| Panasonic Toughbook FZ-G2 | |
* ... Meglio usare valori piccoli
| Panasonic Toughbook FZ-G2 Toshiba KIOXIA KBG4AZNV512G M.2 2280 OPAL | Durabook S14I UDinfo M2P M2P80DE512GBAEP | Durabook R11 Kingston RBUSNS4180S3128GJ | Dell Latitude 5420 Rugged-P85G SK hynix PC401 NVMe 500 GB | |
|---|---|---|---|---|
| AS SSD | 60% | -28% | 40% | |
| Seq Read (MB/s) | 1876 | 2184 16% | 461.7 -75% | 2054 9% |
| Seq Write (MB/s) | 731 | 1441 97% | 409.3 -44% | 653 -11% |
| 4K Read (MB/s) | 43.55 | 35.98 -17% | 45.52 5% | 39.34 -10% |
| 4K Write (MB/s) | 88.4 | 260.1 194% | 76 -14% | 96.4 9% |
| 4K-64 Read (MB/s) | 507 | 396.5 -22% | 359.8 -29% | 677 34% |
| 4K-64 Write (MB/s) | 339.8 | 1057 211% | 623 83% | 982 189% |
| Access Time Read * (ms) | 0.077 | 0.051 34% | 0.203 -164% | 0.044 43% |
| Access Time Write * (ms) | 0.566 | 0.106 81% | 0.226 60% | 0.051 91% |
| Score Read (Points) | 738 | 651 -12% | 451 -39% | 921 25% |
| Score Write (Points) | 501 | 1461 192% | 740 48% | 1143 128% |
| Score Total (Points) | 1574 | 2418 54% | 1438 -9% | 2475 57% |
| Copy ISO MB/s (MB/s) | 1080 | 1538 42% | 454.8 -58% | 1622 50% |
| Copy Program MB/s (MB/s) | 525 | 570 9% | 114.7 -78% | 378.1 -28% |
| Copy Game MB/s (MB/s) | 1033 | 566 -45% | 188.1 -82% | 793 -23% |
| CrystalDiskMark 5.2 / 6 | 67% | -40% | -9% | |
| Write 4K (MB/s) | 96.4 | 260.4 170% | 102.6 6% | 98.8 2% |
| Read 4K (MB/s) | 47.38 | 53 12% | 38.82 -18% | 38.51 -19% |
| Write Seq (MB/s) | 1213 | 1665 37% | 408.8 -66% | 843 -31% |
| Read Seq (MB/s) | 1622 | 1541 -5% | 427 -74% | 1282 -21% |
| Write 4K Q32T1 (MB/s) | 251.8 | 638 153% | 259.1 3% | 355.5 41% |
| Read 4K Q32T1 (MB/s) | 264.8 | 683 158% | 232.1 -12% | 241.4 -9% |
| Write Seq Q32T1 (MB/s) | 1533 | 1656 8% | 286.9 -81% | 893 -42% |
| Read Seq Q32T1 (MB/s) | 2342 | 2490 6% | 503 -79% | 2478 6% |
| Media totale (Programma / Settaggio) | 64% /
62% | -34% /
-33% | 16% /
22% |
* ... Meglio usare valori piccoli

Throttling disco: DiskSpd Read Loop, Queue Depth 8
| 3DMark 11 Performance | 2030 punti | |
| 3DMark Cloud Gate Standard Score | 8466 punti | |
| 3DMark Fire Strike Score | 1207 punti | |
| 3DMark Time Spy Score | 476 punti | |
Aiuto | ||
| basso | medio | alto | ultra | |
|---|---|---|---|---|
| Dota 2 Reborn (2015) | 78 | 46.1 | 21 | 19 |
| Final Fantasy XV Benchmark (2018) | 13.7 | 6.6 | 4.73 | |
| X-Plane 11.11 (2018) | 13.4 | 8.9 | 8.41 |
| Panasonic Toughbook FZ-G2 UHD Graphics 620, i5-10310U, Toshiba KIOXIA KBG4AZNV512G M.2 2280 OPAL | Durabook S14I Iris Xe G7 96EUs, i7-1165G7, UDinfo M2P M2P80DE512GBAEP | Durabook R11 UHD Graphics 620, i5-8250U, Kingston RBUSNS4180S3128GJ | Dell Latitude 5420 Rugged-P85G Radeon RX 540, i7-8650U, SK hynix PC401 NVMe 500 GB | |
|---|---|---|---|---|
| Noise | -9% | -15% | -10% | |
| off /ambiente * (dB) | 24 | 25.2 -5% | 28 -17% | 28.3 -18% |
| Idle Minimum * (dB) | 24.4 | 25.2 -3% | 28 -15% | 28.3 -16% |
| Idle Average * (dB) | 24.4 | 25.2 -3% | 28 -15% | 28.3 -16% |
| Idle Maximum * (dB) | 24.4 | 34.5 -41% | 28 -15% | 28.3 -16% |
| Load Average * (dB) | 33.5 | 34.5 -3% | 39.3 -17% | 29.9 11% |
| Load Maximum * (dB) | 36 | 36.2 -1% | 39.3 -9% | 38 -6% |
* ... Meglio usare valori piccoli
Rumorosità
| Idle |
| 24.4 / 24.4 / 24.4 dB(A) |
| Sotto carico |
| 33.5 / 36 dB(A) |
 | ||
30 dB silenzioso 40 dB(A) udibile 50 dB(A) rumoroso |
||
min: | ||
(+) La temperatura massima sul lato superiore è di 37.4 °C / 99 F, rispetto alla media di 34.3 °C / 94 F, che varia da 21.2 a 62.5 °C per questa classe Office.
(+) Il lato inferiore si riscalda fino ad un massimo di 36.6 °C / 98 F, rispetto alla media di 36.8 °C / 98 F
(+) In idle, la temperatura media del lato superiore è di 24 °C / 75 F, rispetto alla media deld ispositivo di 29.5 °C / 85 F.
(±) I poggiapolsi e il touchpad possono diventare molto caldi al tatto con un massimo di 37.4 °C / 99.3 F.
(-) La temperatura media della zona del palmo della mano di dispositivi simili e'stata di 27.5 °C / 81.5 F (-9.9 °C / -17.8 F).
Panasonic Toughbook FZ-G2 analisi audio
(+) | gli altoparlanti sono relativamente potenti (85.4 dB)
Bassi 100 - 315 Hz
(-) | quasi nessun basso - in media 31.8% inferiori alla media
(±) | la linearità dei bassi è media (9.5% delta rispetto alla precedente frequenza)
Medi 400 - 2000 Hz
(±) | medi elevati - circa 7.5% superiore alla media
(±) | linearità dei medi adeguata (7% delta rispetto alla precedente frequenza)
Alti 2 - 16 kHz
(±) | alti elevati - circa 7.6% superiori alla media
(+) | alti lineari (6.6% delta rispetto alla precedente frequenza)
Nel complesso 100 - 16.000 Hz
(±) | la linearità complessiva del suono è media (26.3% di differenza rispetto alla media
Rispetto alla stessa classe
» 81% di tutti i dispositivi testati in questa classe è stato migliore, 7% simile, 13% peggiore
» Il migliore ha avuto un delta di 7%, medio di 21%, peggiore di 53%
Rispetto a tutti i dispositivi testati
» 81% di tutti i dispositivi testati in questa classe è stato migliore, 4% similare, 15% peggiore
» Il migliore ha avuto un delta di 4%, medio di 23%, peggiore di 134%
Apple MacBook 12 (Early 2016) 1.1 GHz analisi audio
(+) | gli altoparlanti sono relativamente potenti (83.6 dB)
Bassi 100 - 315 Hz
(±) | bassi ridotti - in media 11.3% inferiori alla media
(±) | la linearità dei bassi è media (14.2% delta rispetto alla precedente frequenza)
Medi 400 - 2000 Hz
(+) | medi bilanciati - solo only 2.4% rispetto alla media
(+) | medi lineari (5.5% delta rispetto alla precedente frequenza)
Alti 2 - 16 kHz
(+) | Alti bilanciati - appena 2% dalla media
(+) | alti lineari (4.5% delta rispetto alla precedente frequenza)
Nel complesso 100 - 16.000 Hz
(+) | suono nel complesso lineare (10.2% differenza dalla media)
Rispetto alla stessa classe
» 7% di tutti i dispositivi testati in questa classe è stato migliore, 2% simile, 90% peggiore
» Il migliore ha avuto un delta di 5%, medio di 18%, peggiore di 53%
Rispetto a tutti i dispositivi testati
» 5% di tutti i dispositivi testati in questa classe è stato migliore, 1% similare, 94% peggiore
» Il migliore ha avuto un delta di 4%, medio di 23%, peggiore di 134%
| Off / Standby | |
| Idle | |
| Sotto carico |
|
Leggenda:
min: | |
| Panasonic Toughbook FZ-G2 i5-10310U, UHD Graphics 620, Toshiba KIOXIA KBG4AZNV512G M.2 2280 OPAL, IPS, 1920x1200, 10.1" | Durabook S14I i7-1165G7, Iris Xe G7 96EUs, UDinfo M2P M2P80DE512GBAEP, TN, 1920x1080, 14" | Durabook R11 i5-8250U, UHD Graphics 620, Kingston RBUSNS4180S3128GJ, IPS, 1920x1080, 11.6" | Dell Latitude 5420 Rugged-P85G i7-8650U, Radeon RX 540, SK hynix PC401 NVMe 500 GB, IPS, 1920x1080, 14" | |
|---|---|---|---|---|
| Power Consumption | -61% | -27% | -67% | |
| Idle Minimum * (Watt) | 3.5 | 6.8 -94% | 6.1 -74% | 4.8 -37% |
| Idle Average * (Watt) | 8.1 | 16.4 -102% | 11.7 -44% | 13.6 -68% |
| Idle Maximum * (Watt) | 8.2 | 16.9 -106% | 11.9 -45% | 13.8 -68% |
| Load Average * (Watt) | 34.7 | 39.2 -13% | 37.7 -9% | 67.8 -95% |
| Witcher 3 ultra * (Watt) | 31.8 | 69.1 -117% | ||
| Load Maximum * (Watt) | 79.7 | 73.1 8% | 50.5 37% | 93.5 -17% |
* ... Meglio usare valori piccoli
Consumo energetico The Witcher 3 / Stresstest
| Panasonic Toughbook FZ-G2 i5-10310U, UHD Graphics 620, 68 Wh | Durabook S14I i7-1165G7, Iris Xe G7 96EUs, 50 Wh | Durabook R11 i5-8250U, UHD Graphics 620, 43 Wh | Dell Latitude 5420 Rugged-P85G i7-8650U, Radeon RX 540, 102 Wh | |
|---|---|---|---|---|
| Autonomia della batteria | -51% | -49% | 45% | |
| WiFi v1.3 (h) | 11.2 | 5.5 -51% | 5.7 -49% | 16.2 45% |
| Reader / Idle (h) | 31.4 | |||
| Load (h) | 3.2 |
Pro
Contro
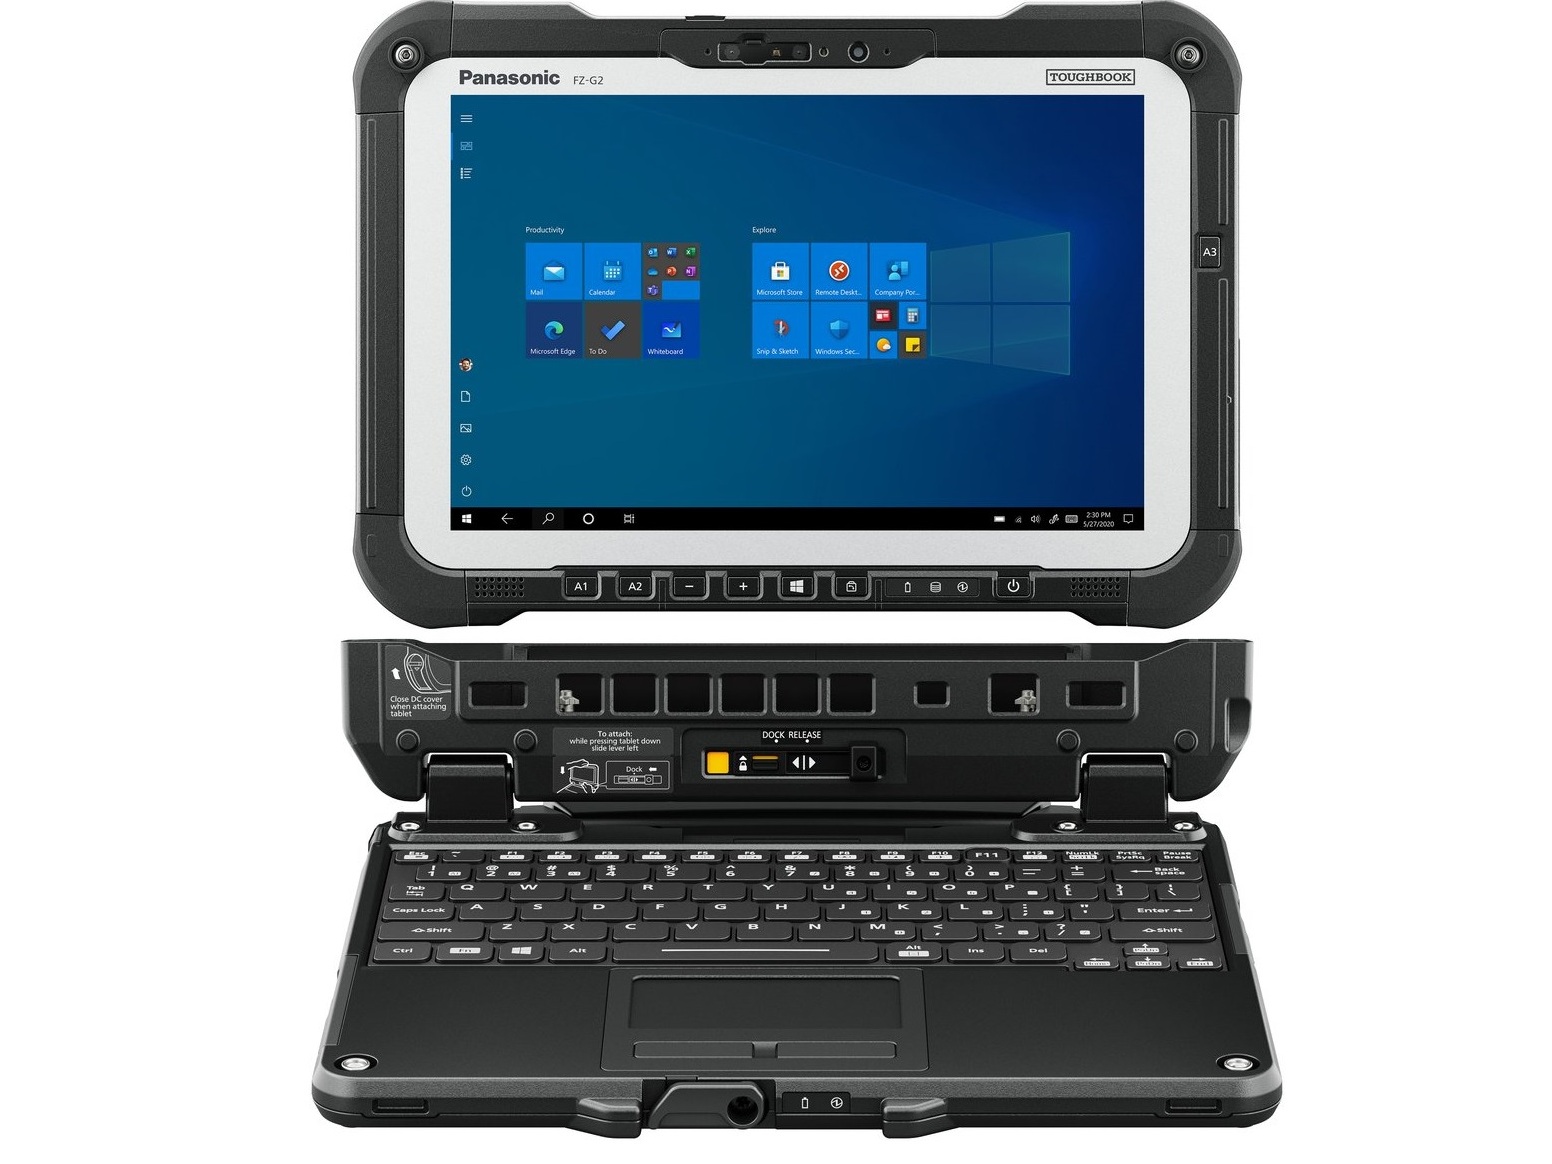
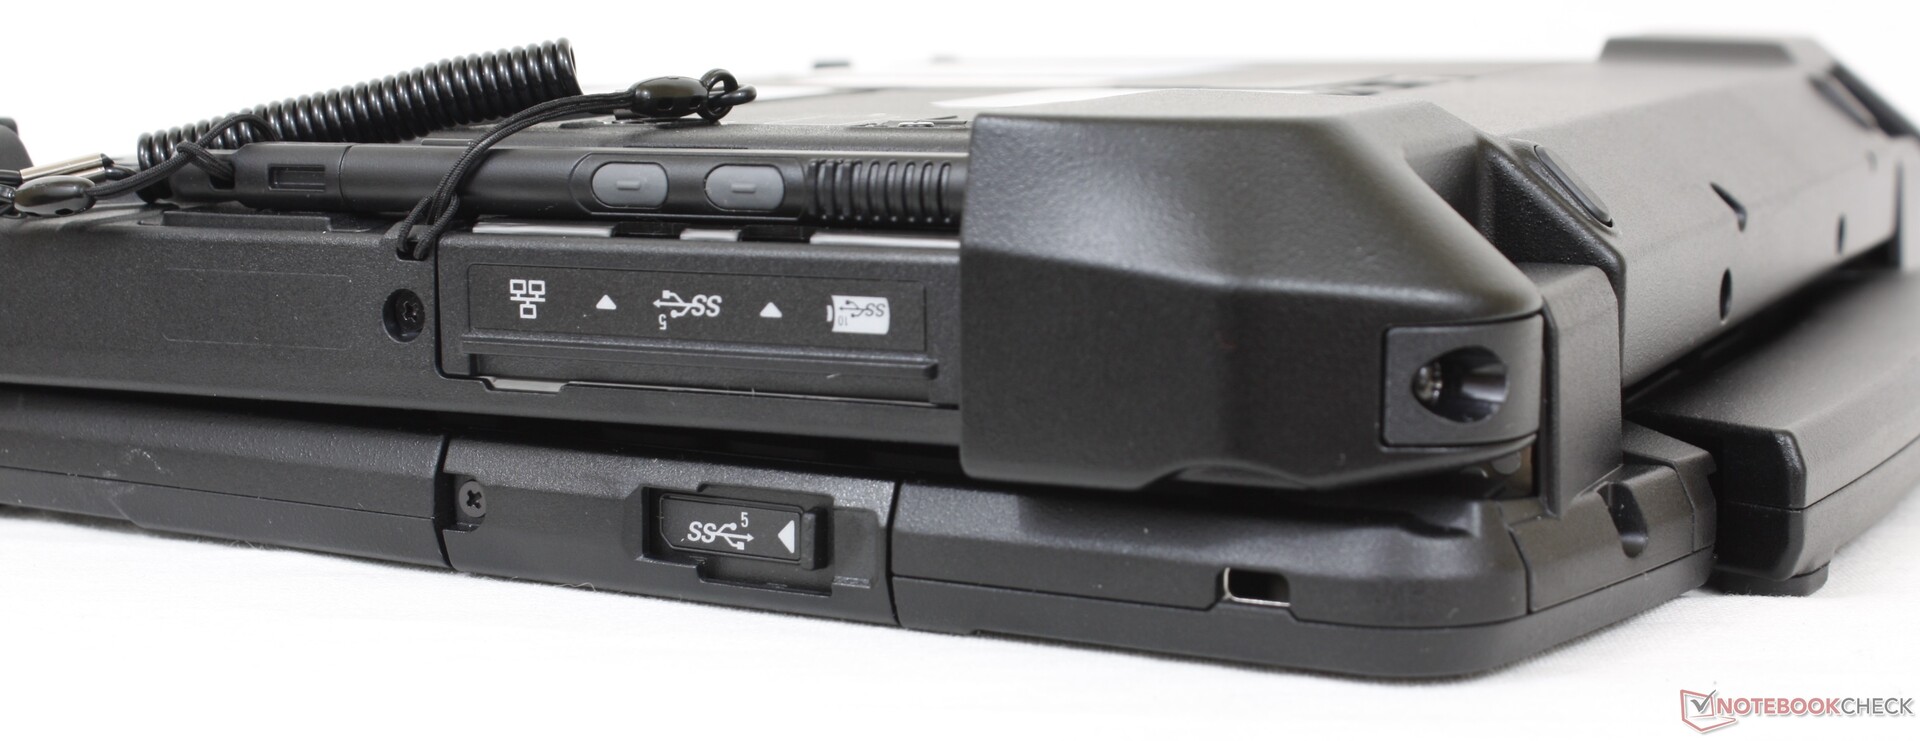
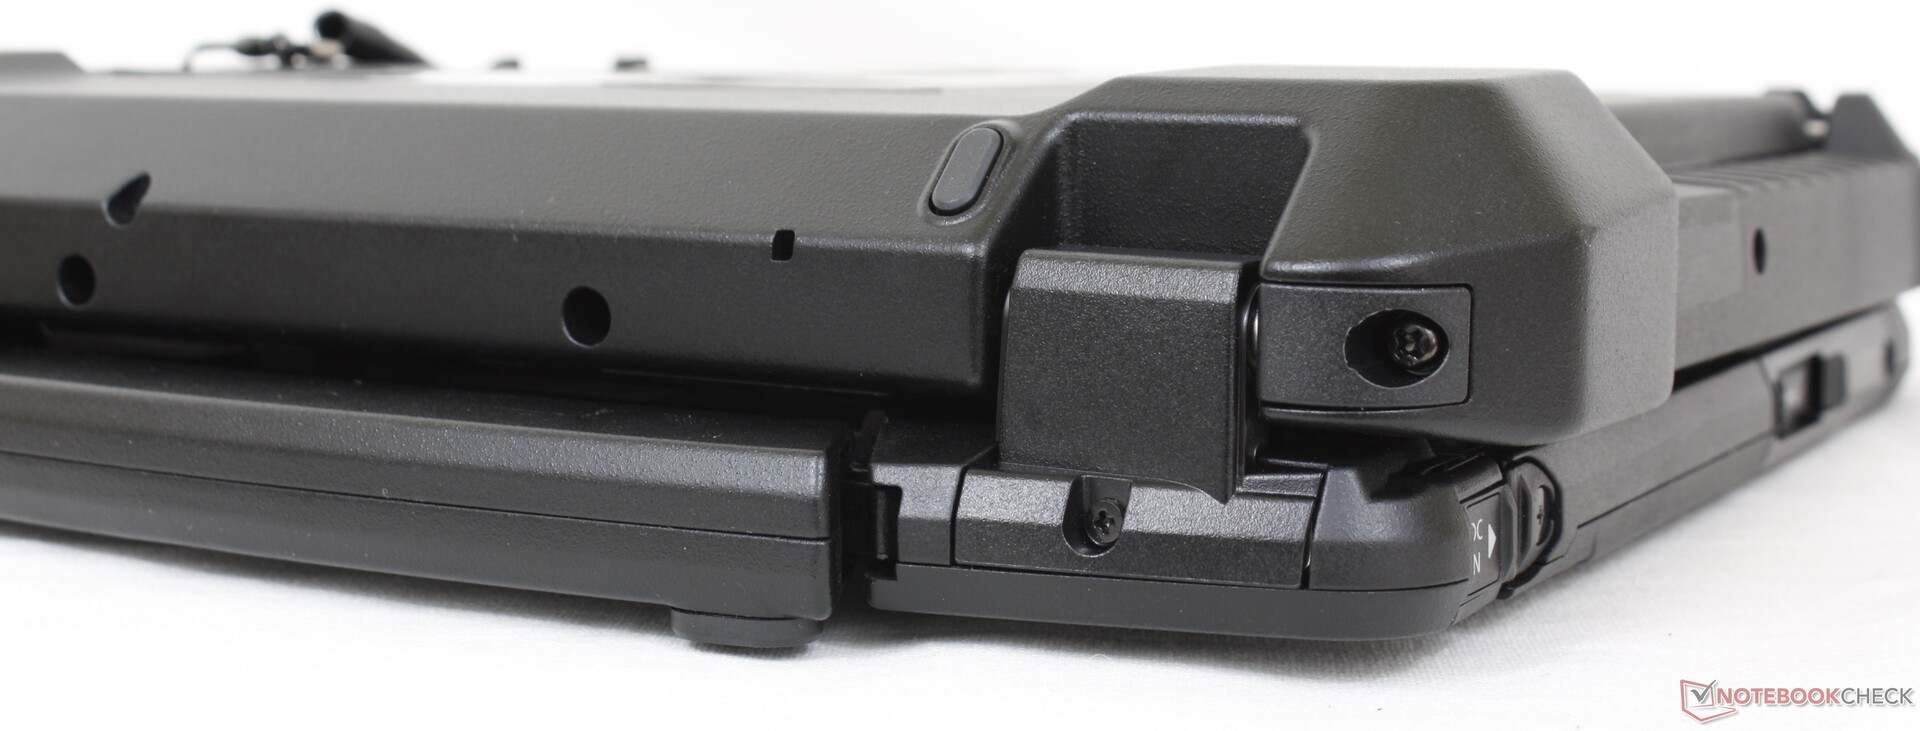
Il Toughbook G2 è una ottima opzione per coloro che hanno bisogno di un tablet Windows versatile e non solo uno sottile con poche caratteristiche di connettività. Gli accessori modulari e l'eccellente qualità del display in particolare sono i punti di forza del G2, poiché gli utenti possono adattarlo più facilmente a qualsiasi ambiente o funzione.
Forse il più grande svantaggio del G2 è il suo peso elevato, anche dopo aver tenuto conto della sua classificazione rugged. Il Durabook R11 offre sia un display più grande che componenti aggiornabili pur pesando diverse centinaia di grammi in meno rispetto al Panasonic. Per rendere maggiormente utile il più goffo Toughbook G2, dovrete sfruttare i suoi versatili moduli.
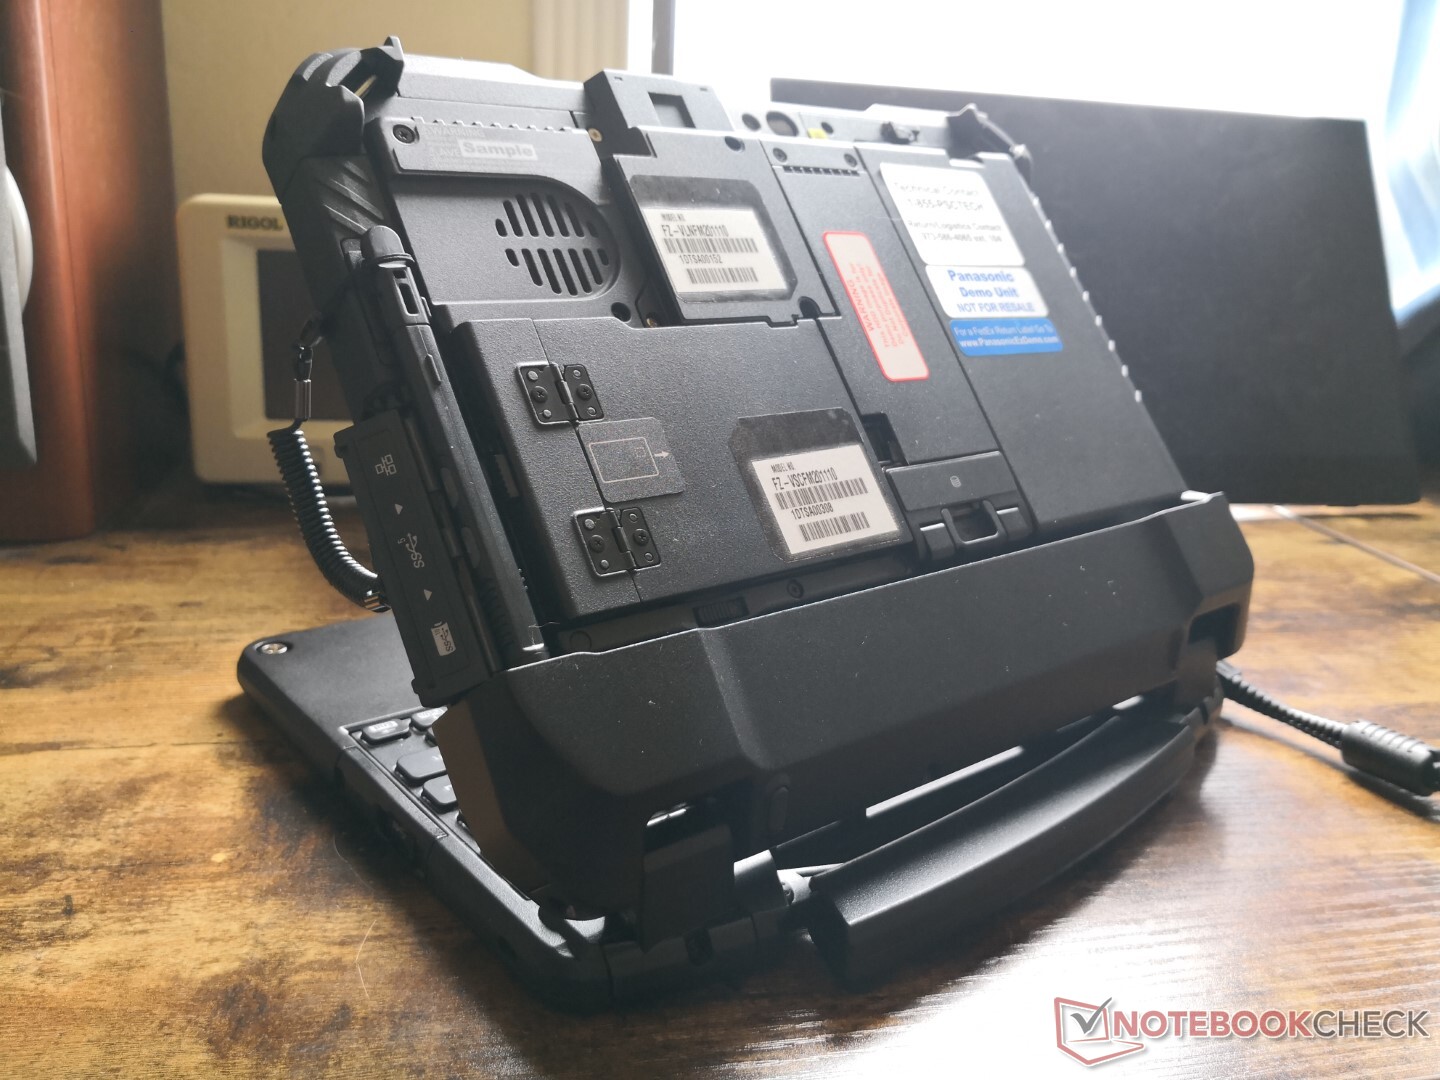
Il Toughbook G2 è uno dei tablet rugged più modulari e personalizzabili in circolazione. Dovrete però fare i conti con la sua maggiore circonferenza e il suo peso più pesante.
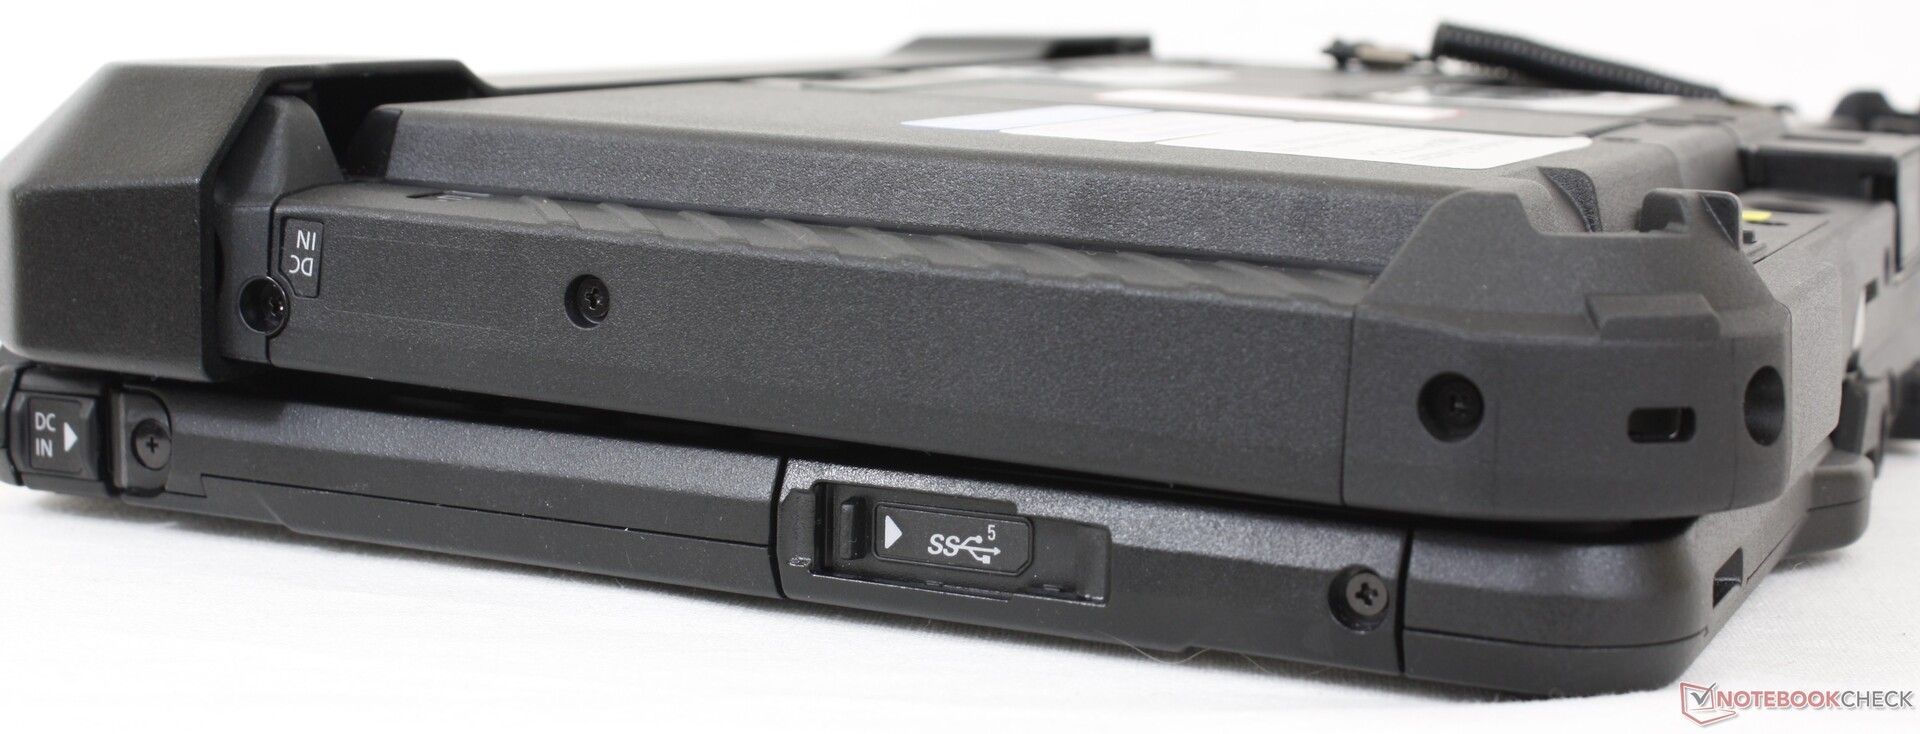
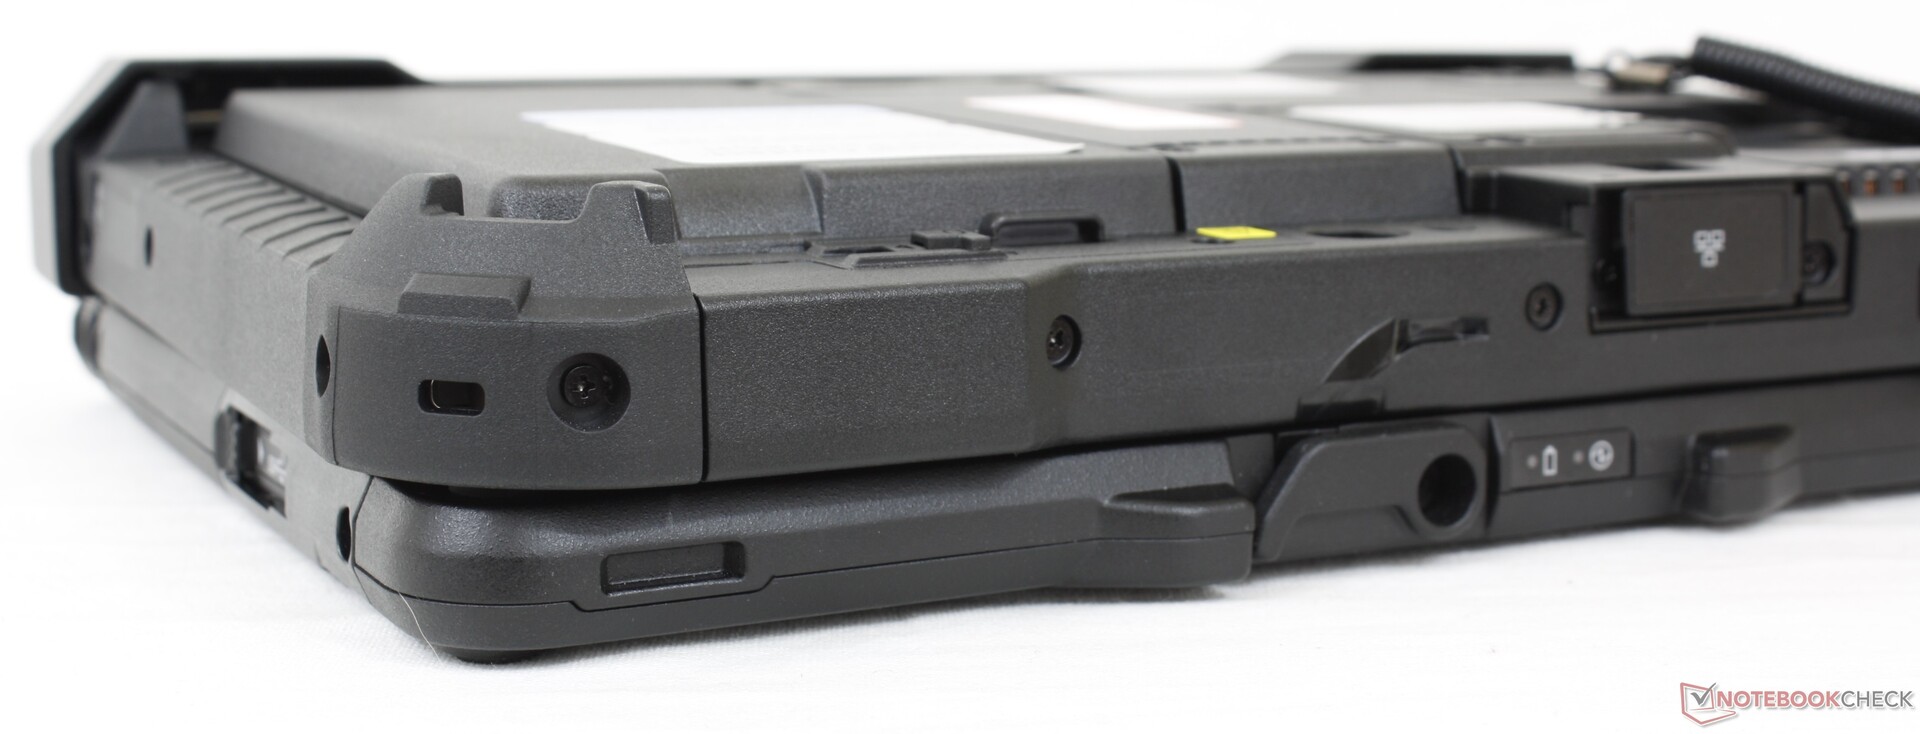
Per le future versioni, ci piacerebbe vedere chiusure più grandi e l'eliminazione della modulazione di larghezza d'impulso per il controllo della luminosità. Le piccole chiusure che fissano le porte e i moduli sono difficili da afferrare, mentre gli utenti sensibili al tremolio dello schermo potrebbero voler evitare di usare il G2 a livelli di luminosità molto bassi. Un aggiornamento interno a Intel Tiger Lake fornirebbe una spinta significativa alle prestazioni grafiche.
Price comparison
