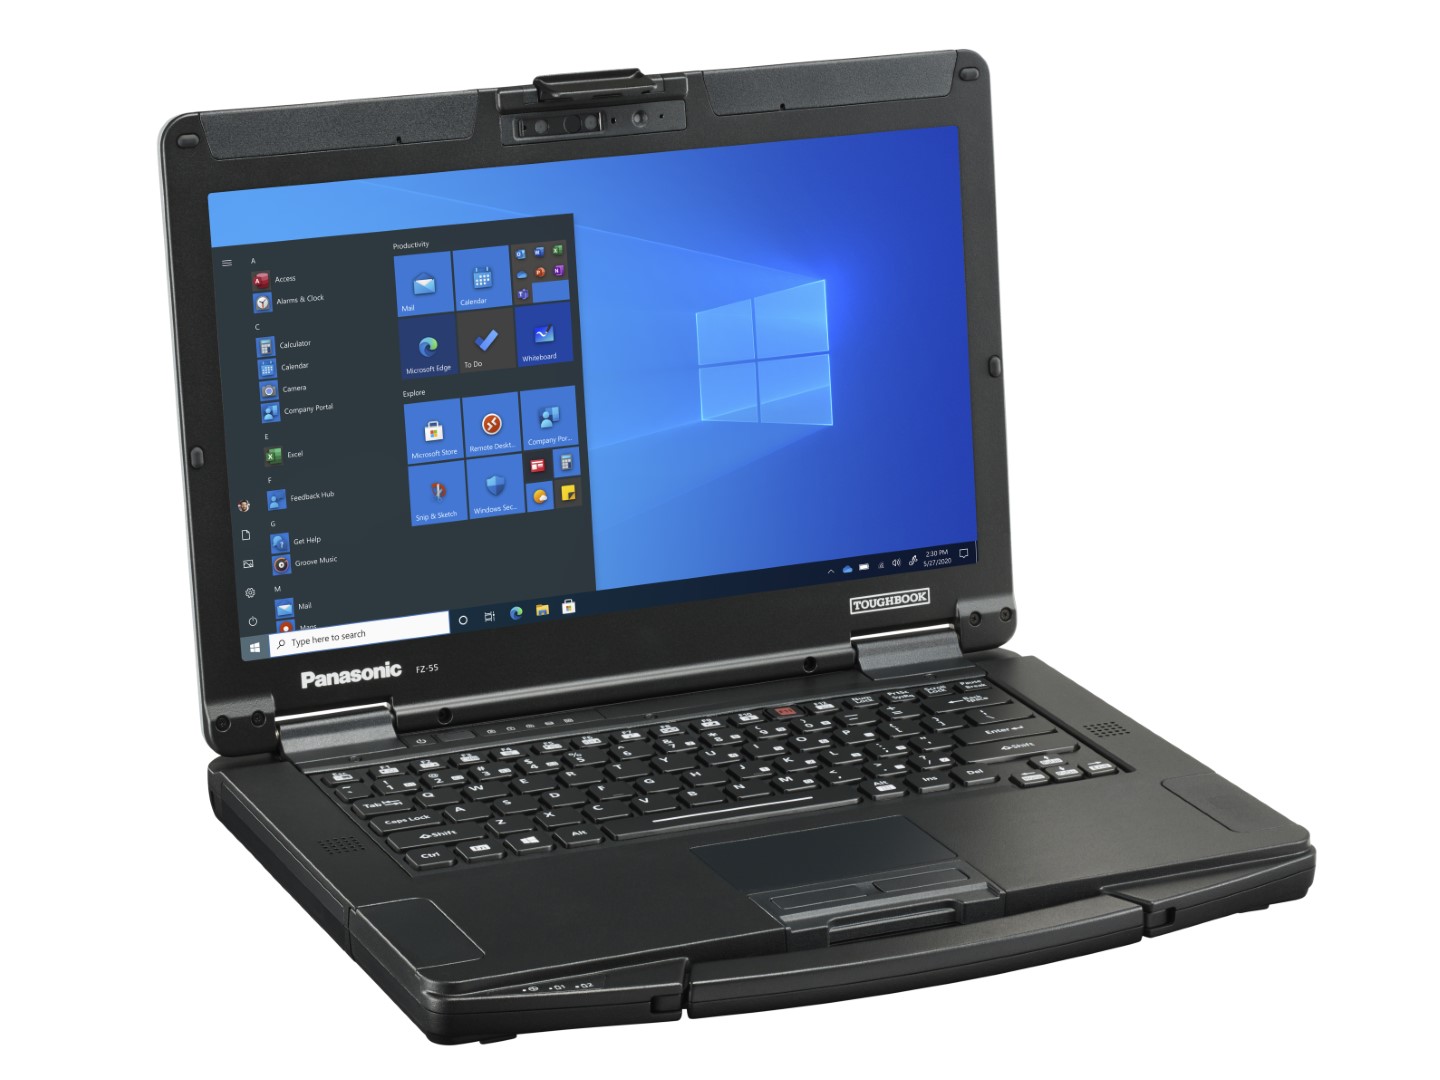
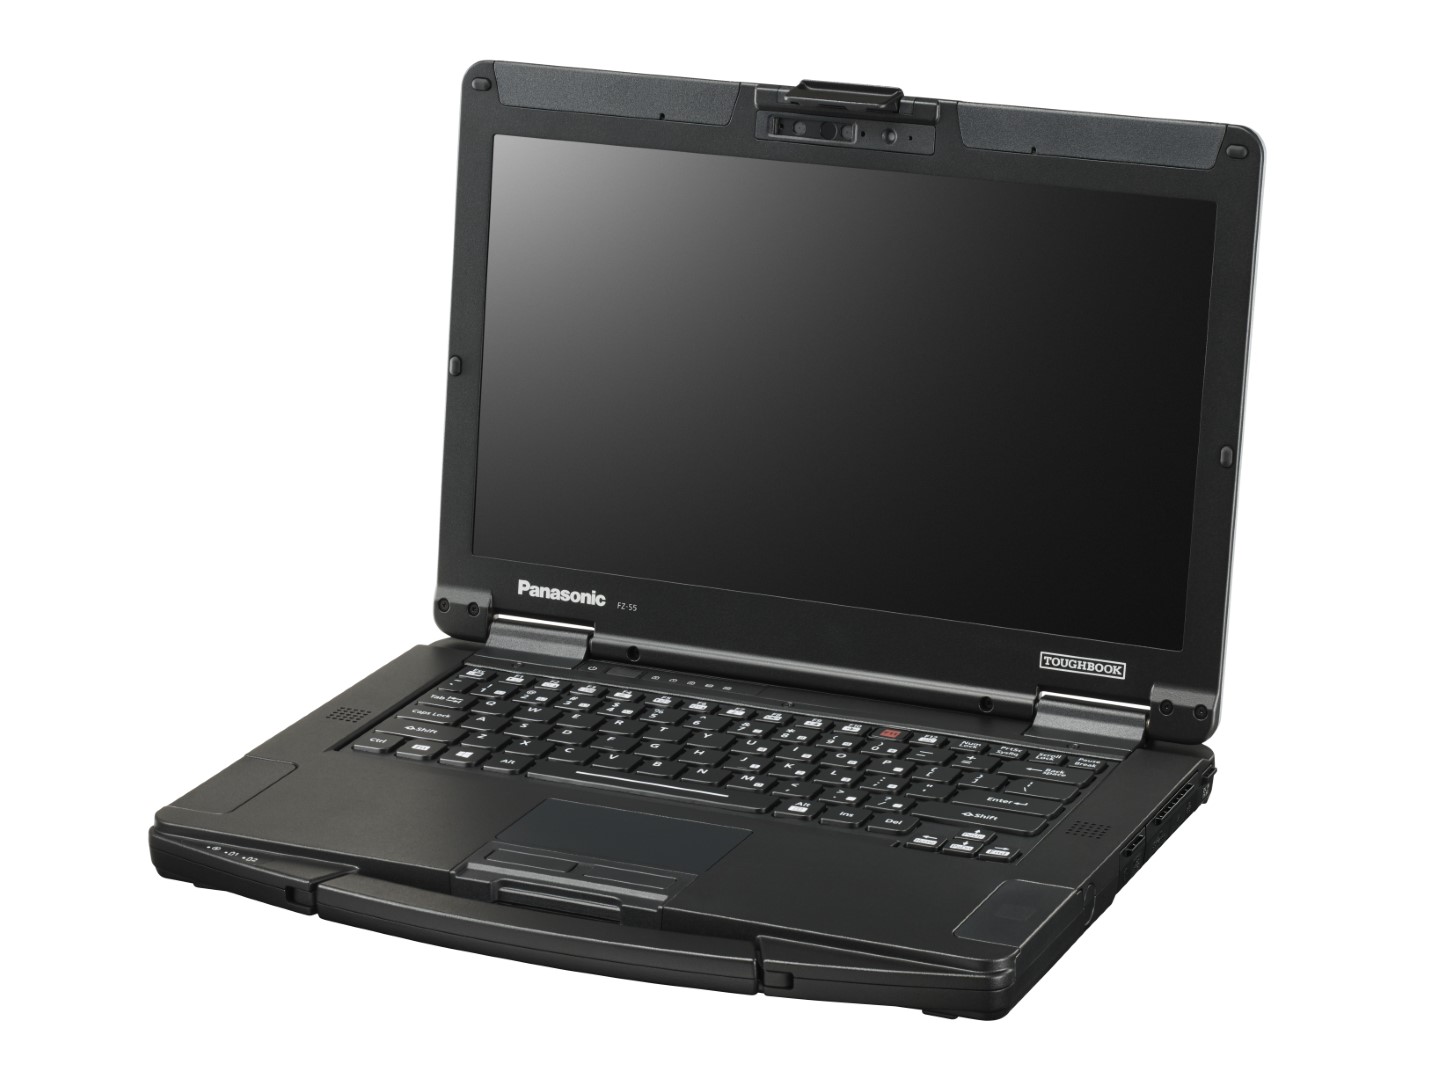
Recensione del portatile rinforzato Panasonic Toughbook FZ-55 MK2: la Iris Xe fa la differenza
Confronto con i potenziali concorrenti
Punteggio | Data | Modello | Peso | Altezza | Dimensione | Risoluzione | Prezzo |
|---|---|---|---|---|---|---|---|
| 83.9 % v7 (old) | 09/2021 | Panasonic Toughbook FZ-55 MK2 i7-1185G7, Iris Xe G7 96EUs | 2.3 kg | 33 mm | 14.00" | 1920x1080 | |
| 80.9 % v7 (old) | 09/2019 | Panasonic Toughbook FZ-55 i5-8365U, UHD Graphics 620 | 2.2 kg | 33 mm | 14.00" | 1920x1080 | |
| 89.2 % v6 (old) | 03/2019 | Dell Latitude 5420 Rugged-P85G i7-8650U, Radeon RX 540 | 2.8 kg | 32.9 mm | 14.00" | 1920x1080 | |
v (old) | 04/2021 | Durabook S14I i7-1165G7, Iris Xe G7 96EUs | 3 kg | 38.1 mm | 14.00" | 1920x1080 | |
| 81.9 % v6 (old) | 10/2018 | Getac S410 i5-8550U, UHD Graphics 620 | 3.2 kg | 34.9 mm | 14.00" | 1366x768 |
| SD Card Reader | |
| average JPG Copy Test (av. of 3 runs) | |
| Dell Latitude 5420 Rugged-P85G (Toshiba Exceria Pro SDXC 64 GB UHS-II) | |
| Getac S410 (Toshiba Exceria Pro SDXC 64 GB UHS-II) | |
| Panasonic Toughbook FZ-55 MK2 (AV Pro V60) | |
| Panasonic Toughbook FZ-55 (Toshiba Exceria Pro M501 64 GB UHS-II) | |
| Durabook S14I (Angelbird 128GB AV Pro UHS-II) | |
| maximum AS SSD Seq Read Test (1GB) | |
| Dell Latitude 5420 Rugged-P85G (Toshiba Exceria Pro SDXC 64 GB UHS-II) | |
| Panasonic Toughbook FZ-55 MK2 (AV Pro V60) | |
| Getac S410 (Toshiba Exceria Pro SDXC 64 GB UHS-II) | |
| Panasonic Toughbook FZ-55 (Toshiba Exceria Pro M501 64 GB UHS-II) | |
| Durabook S14I (Angelbird 128GB AV Pro UHS-II) | |
| Networking | |
| iperf3 transmit AX12 | |
| Panasonic Toughbook FZ-55 MK2 | |
| Durabook S14I | |
| Dell Latitude 5420 Rugged-P85G | |
| Getac S410 | |
| iperf3 receive AX12 | |
| Durabook S14I | |
| Panasonic Toughbook FZ-55 MK2 | |
| Dell Latitude 5420 Rugged-P85G | |
| Getac S410 | |


| |||||||||||||||||||||||||
Distribuzione della luminosità: 76 %
Al centro con la batteria: 1061.1 cd/m²
Contrasto: 1516:1 (Nero: 0.7 cd/m²)
ΔE ColorChecker Calman: 4.64 | ∀{0.5-29.43 Ø4.71}
calibrated: 2.52
ΔE Greyscale Calman: 2.8 | ∀{0.09-98 Ø4.96}
36% AdobeRGB 1998 (Argyll 3D)
52.2% sRGB (Argyll 3D)
34.8% Display P3 (Argyll 3D)
Gamma: 2.08
CCT: 6364 K
| Panasonic Toughbook FZ-55 MK2 InfoVision M140NWF5 R3, IPS, 14", 1920x1080 | Panasonic Toughbook FZ-55 InfoVision M140NWF5 R3, IPS, 14", 1920x1080 | Dell Latitude 5420 Rugged-P85G AU Optronics AUO523D, IPS, 14", 1920x1080 | Durabook S14I KD140N0730A01, TN, 14", 1920x1080 | Getac S410 CMN N140BGE-E33, TN PED, 14", 1366x768 | |
|---|---|---|---|---|---|
| Display | 9% | 78% | 25% | 16% | |
| Display P3 Coverage (%) | 34.8 | 38.09 9% | 62.5 80% | 43.55 25% | 40.46 16% |
| sRGB Coverage (%) | 52.2 | 57 9% | 92.4 77% | 65.4 25% | 60.9 17% |
| AdobeRGB 1998 Coverage (%) | 36 | 39.38 9% | 64.2 78% | 45 25% | 41.8 16% |
| Response Times | -24% | -76% | 27% | 4% | |
| Response Time Grey 50% / Grey 80% * (ms) | 28.4 ? | 42 ? -48% | 68 ? -139% | 30.4 ? -7% | 41.2 ? -45% |
| Response Time Black / White * (ms) | 30 ? | 29.6 ? 1% | 33.6 ? -12% | 11.8 ? 61% | 14 ? 53% |
| PWM Frequency (Hz) | 685 ? | 694 ? | 735 ? | 304.9 ? | 877 ? |
| Screen | -22% | -6% | -96% | -99% | |
| Brightness middle (cd/m²) | 1061.1 | 1037 -2% | 1111.7 5% | 1180.7 11% | 265.1 -75% |
| Brightness (cd/m²) | 997 | 1015 2% | 1026 3% | 1102 11% | 246 -75% |
| Brightness Distribution (%) | 76 | 76 0% | 80 5% | 89 17% | 81 7% |
| Black Level * (cd/m²) | 0.7 | 0.6 14% | 0.81 -16% | 1.91 -173% | 0.58 17% |
| Contrast (:1) | 1516 | 1728 14% | 1372 -9% | 618 -59% | 457 -70% |
| Colorchecker dE 2000 * | 4.64 | 5.71 -23% | 3.83 17% | 13.45 -190% | 14.24 -207% |
| Colorchecker dE 2000 max. * | 20.92 | 26.27 -26% | 7.85 62% | 22.52 -8% | 26.66 -27% |
| Colorchecker dE 2000 calibrated * | 2.52 | 4.52 -79% | 2.98 -18% | 3.19 -27% | 3.94 -56% |
| Greyscale dE 2000 * | 2.8 | 5.5 -96% | 5.6 -100% | 15.4 -450% | 14.2 -407% |
| Gamma | 2.08 106% | 2.04 108% | 2.306 95% | 1.97 112% | 2.03 108% |
| CCT | 6364 102% | 5783 112% | 7676 85% | 21134 31% | 17152 38% |
| Color Space (Percent of AdobeRGB 1998) (%) | 36.4 | 59 | 41.6 | 38.7 | |
| Color Space (Percent of sRGB) (%) | 57 | 93 | 65.5 | 61 | |
| Media totale (Programma / Settaggio) | -12% /
-15% | -1% /
2% | -15% /
-53% | -26% /
-60% |
* ... Meglio usare valori piccoli
Tempi di risposta del Display
| ↔ Tempi di risposta dal Nero al Bianco | ||
|---|---|---|
| 30 ms ... aumenta ↗ e diminuisce ↘ combinato | ↗ 16 ms Incremento | 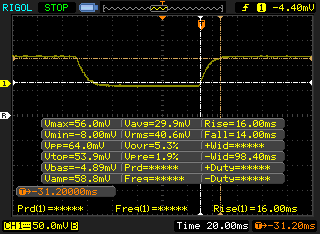 |
| ↘ 14 ms Calo | ||
| Lo schermo mostra tempi di risposta lenti nei nostri tests e sarà insoddisfacente per i gamers. In confronto, tutti i dispositivi di test variano da 0.1 (minimo) a 240 (massimo) ms. » 80 % di tutti i dispositivi è migliore. Questo significa che i tempi di risposta rilevati sono peggiori rispetto alla media di tutti i dispositivi testati (19.8 ms). | ||
| ↔ Tempo di risposta dal 50% Grigio all'80% Grigio | ||
| 28.4 ms ... aumenta ↗ e diminuisce ↘ combinato | ↗ 14 ms Incremento | 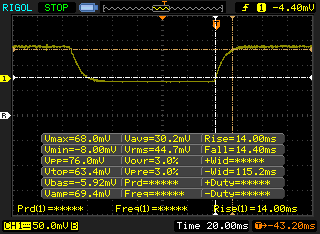 |
| ↘ 14.4 ms Calo | ||
| Lo schermo mostra tempi di risposta relativamente lenti nei nostri tests e potrebbe essere troppo lento per i gamers. In confronto, tutti i dispositivi di test variano da 0.165 (minimo) a 636 (massimo) ms. » 38 % di tutti i dispositivi è migliore. Questo significa che i tempi di risposta rilevati sono simili alla media di tutti i dispositivi testati (31 ms). | ||
Sfarfallio dello schermo / PWM (Pulse-Width Modulation)
| flickering dello schermo / PWM rilevato | 685 Hz | ≤ 99 % settaggio luminosita' | 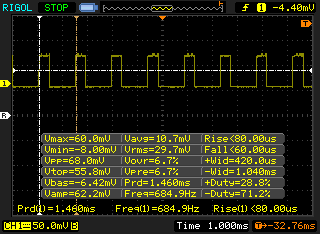 |
Il display sfarfalla a 685 Hz (Probabilmente a causa dell'uso di PWM) Flickering rilevato ad una luminosita' di 99 % o inferiore. Non dovrebbe verificarsi flickering o PWM sopra questo valore di luminosita'. La frequenza di 685 Hz è abbastanza alta, quindi la maggioranza degli utenti sensibili al PWM non dovrebbero notare alcun flickering. In confronto: 52 % di tutti i dispositivi testati non utilizza PWM per ridurre la luminosita' del display. Se è rilevato PWM, una media di 7757 (minimo: 5 - massimo: 343500) Hz è stata rilevata. | |||
Cinebench R15 Multi Loop
Cinebench R23: Multi Core | Single Core
Cinebench R15: CPU Multi 64Bit | CPU Single 64Bit
Blender: v2.79 BMW27 CPU
7-Zip 18.03: 7z b 4 -mmt1 | 7z b 4
Geekbench 5.5: Single-Core | Multi-Core
HWBOT x265 Benchmark v2.2: 4k Preset
LibreOffice : 20 Documents To PDF
R Benchmark 2.5: Overall mean
| Cinebench R20 / CPU (Single Core) | |
| ADATA XPG Xenia 14 | |
| Media Intel Core i7-1185G7 (489 - 593, n=28) | |
| Lenovo ThinkPad L14 G2 AMD | |
| Panasonic Toughbook FZ-55 MK2 | |
| Schenker VIA 14 Late 2020 | |
| Lenovo ThinkPad P14s Gen1-20Y10002GE | |
| Infinix INBook X1 Pro | |
| Asus ZenBook 14 UX434FL-DB77 | |
| Acer Spin 3 SP314-54N-56S5 | |
| Asus VivoBook 14 X403FA | |
| Cinebench R23 / Multi Core | |
| Lenovo ThinkPad P14s Gen1-20Y10002GE | |
| Lenovo ThinkPad L14 G2 AMD | |
| ADATA XPG Xenia 14 | |
| Media Intel Core i7-1185G7 (3610 - 6383, n=24) | |
| Panasonic Toughbook FZ-55 MK2 | |
| Schenker VIA 14 Late 2020 | |
| Infinix INBook X1 Pro | |
| Acer Spin 3 SP314-54N-56S5 | |
| Cinebench R23 / Single Core | |
| ADATA XPG Xenia 14 | |
| Media Intel Core i7-1185G7 (1251 - 1532, n=24) | |
| Panasonic Toughbook FZ-55 MK2 | |
| Lenovo ThinkPad L14 G2 AMD | |
| Schenker VIA 14 Late 2020 | |
| Infinix INBook X1 Pro | |
| Lenovo ThinkPad P14s Gen1-20Y10002GE | |
| Acer Spin 3 SP314-54N-56S5 | |
| Geekbench 5.5 / Single-Core | |
| Media Intel Core i7-1185G7 (1398 - 1626, n=21) | |
| Schenker VIA 14 Late 2020 | |
| Lenovo ThinkPad L14 G2 AMD | |
| Acer Spin 3 SP314-54N-56S5 | |
| Asus ZenBook 14 UX434FL-DB77 | |
| Lenovo ThinkPad P14s Gen1-20Y10002GE | |
| Geekbench 5.5 / Multi-Core | |
| Lenovo ThinkPad P14s Gen1-20Y10002GE | |
| Media Intel Core i7-1185G7 (4620 - 5944, n=21) | |
| Lenovo ThinkPad L14 G2 AMD | |
| Schenker VIA 14 Late 2020 | |
| Acer Spin 3 SP314-54N-56S5 | |
| Asus ZenBook 14 UX434FL-DB77 | |
| HWBOT x265 Benchmark v2.2 / 4k Preset | |
| Lenovo ThinkPad L14 G2 AMD | |
| Lenovo ThinkPad P14s Gen1-20Y10002GE | |
| ADATA XPG Xenia 14 | |
| Panasonic Toughbook FZ-55 MK2 | |
| Media Intel Core i7-1185G7 (5.02 - 8.13, n=27) | |
| Infinix INBook X1 Pro | |
| Schenker VIA 14 Late 2020 | |
| Asus ZenBook 14 UX434FL-DB77 | |
| Asus VivoBook 14 X403FA | |
| Acer Spin 3 SP314-54N-56S5 | |
| LibreOffice / 20 Documents To PDF | |
| Asus ZenBook 14 UX434FL-DB77 | |
| Lenovo ThinkPad P14s Gen1-20Y10002GE | |
| Acer Spin 3 SP314-54N-56S5 | |
| Infinix INBook X1 Pro | |
| Lenovo ThinkPad L14 G2 AMD | |
| Media Intel Core i7-1185G7 (41.3 - 61.7, n=26) | |
| Schenker VIA 14 Late 2020 | |
| Panasonic Toughbook FZ-55 MK2 | |
| ADATA XPG Xenia 14 | |
| R Benchmark 2.5 / Overall mean | |
| Asus ZenBook 14 UX434FL-DB77 | |
| Acer Spin 3 SP314-54N-56S5 | |
| Infinix INBook X1 Pro | |
| Schenker VIA 14 Late 2020 | |
| Lenovo ThinkPad P14s Gen1-20Y10002GE | |
| Media Intel Core i7-1185G7 (0.55 - 0.615, n=27) | |
| Panasonic Toughbook FZ-55 MK2 | |
| ADATA XPG Xenia 14 | |
| Lenovo ThinkPad L14 G2 AMD | |
* ... Meglio usare valori piccoli
| PCMark 10 / Score | |
| Panasonic Toughbook FZ-55 MK2 | |
| Media Intel Core i7-1185G7, Intel Iris Xe Graphics G7 96EUs (4746 - 5561, n=20) | |
| Durabook S14I | |
| Dell Latitude 5420 Rugged-P85G | |
| Getac S410 | |
| Panasonic Toughbook FZ-55 | |
| PCMark 10 / Essentials | |
| Panasonic Toughbook FZ-55 MK2 | |
| Durabook S14I | |
| Media Intel Core i7-1185G7, Intel Iris Xe Graphics G7 96EUs (8279 - 10664, n=20) | |
| Dell Latitude 5420 Rugged-P85G | |
| Getac S410 | |
| Panasonic Toughbook FZ-55 | |
| PCMark 10 / Productivity | |
| Dell Latitude 5420 Rugged-P85G | |
| Durabook S14I | |
| Getac S410 | |
| Media Intel Core i7-1185G7, Intel Iris Xe Graphics G7 96EUs (5799 - 8770, n=20) | |
| Panasonic Toughbook FZ-55 MK2 | |
| Panasonic Toughbook FZ-55 | |
| PCMark 10 / Digital Content Creation | |
| Panasonic Toughbook FZ-55 MK2 | |
| Media Intel Core i7-1185G7, Intel Iris Xe Graphics G7 96EUs (4424 - 5684, n=20) | |
| Durabook S14I | |
| Dell Latitude 5420 Rugged-P85G | |
| Panasonic Toughbook FZ-55 | |
| Getac S410 | |
| PCMark 10 Score | 5078 punti | |
Aiuto | ||
| DPC Latencies / LatencyMon - interrupt to process latency (max), Web, Youtube, Prime95 | |
| HP EliteBook 840 Aero G8 3E4Q6AA | |
| MSI Prestige 14 Evo A11MO-026US | |
| Panasonic Toughbook FZ-55 MK2 | |
| Dell Latitude 9420 2-in-1 | |
| ADATA XPG Xenia 14 | |
* ... Meglio usare valori piccoli
| Panasonic Toughbook FZ-55 MK2 Toshiba KIOXIA KBG4AZNV512G M.2 2280 OPAL | Panasonic Toughbook FZ-55 Samsung SSD PM871b MZNLN256HAJQ | Dell Latitude 5420 Rugged-P85G SK hynix PC401 NVMe 500 GB | Durabook S14I UDinfo M2P M2P80DE512GBAEP | Getac S410 CUKUSA 1 TB SATA SSD Q0526A | |
|---|---|---|---|---|---|
| AS SSD | -41% | 22% | 37% | -16% | |
| Seq Read (MB/s) | 2007 | 437.7 -78% | 2054 2% | 2184 9% | 484.2 -76% |
| Seq Write (MB/s) | 806 | 387.3 -52% | 653 -19% | 1441 79% | 396.1 -51% |
| 4K Read (MB/s) | 51.2 | 26.18 -49% | 39.34 -23% | 35.98 -30% | 34.9 -32% |
| 4K Write (MB/s) | 123.3 | 60.3 -51% | 96.4 -22% | 260.1 111% | 74.1 -40% |
| 4K-64 Read (MB/s) | 805 | 369.8 -54% | 677 -16% | 396.5 -51% | 382.3 -53% |
| 4K-64 Write (MB/s) | 352.1 | 313.7 -11% | 982 179% | 1057 200% | 329 -7% |
| Access Time Read * (ms) | 0.064 | 0.089 -39% | 0.044 31% | 0.051 20% | 0.058 9% |
| Access Time Write * (ms) | 0.544 | 0.058 89% | 0.051 91% | 0.106 81% | 0.045 92% |
| Score Read (Points) | 1057 | 440 -58% | 921 -13% | 651 -38% | 466 -56% |
| Score Write (Points) | 556 | 413 -26% | 1143 106% | 1461 163% | 443 -20% |
| Score Total (Points) | 2106 | 1083 -49% | 2475 18% | 2418 15% | 1154 -45% |
| Copy ISO MB/s (MB/s) | 1045 | 553 -47% | 1622 55% | 1538 47% | 2151 106% |
| Copy Program MB/s (MB/s) | 854 | 204.7 -76% | 378.1 -56% | 570 -33% | 422.8 -50% |
| Copy Game MB/s (MB/s) | 1127 | 385.9 -66% | 793 -30% | 566 -50% | 1045 -7% |
| CrystalDiskMark 5.2 / 6 | -54% | -18% | 48% | -52% | |
| Write 4K (MB/s) | 117.1 | 55.4 -53% | 98.8 -16% | 260.4 122% | 74 -37% |
| Read 4K (MB/s) | 51.3 | 31.11 -39% | 38.51 -25% | 53 3% | 31.85 -38% |
| Write Seq (MB/s) | 1384 | 460.9 -67% | 843 -39% | 1665 20% | 460.6 -67% |
| Read Seq (MB/s) | 1716 | 481.9 -72% | 1282 -25% | 1541 -10% | 514 -70% |
| Write 4K Q32T1 (MB/s) | 282.6 | 234.6 -17% | 355.5 26% | 638 126% | 211.4 -25% |
| Read 4K Q32T1 (MB/s) | 332 | 181.7 -45% | 241.4 -27% | 683 106% | 203.5 -39% |
| Write Seq Q32T1 (MB/s) | 1519 | 528 -65% | 893 -41% | 1656 9% | 523 -66% |
| Read Seq Q32T1 (MB/s) | 2347 | 548 -77% | 2478 6% | 2490 6% | 554 -76% |
| Media totale (Programma / Settaggio) | -48% /
-46% | 2% /
7% | 43% /
41% | -34% /
-29% |
* ... Meglio usare valori piccoli

Throttling disco: DiskSpd Read Loop, Queue Depth 8
| 3DMark 11 Performance | 6981 punti | |
| 3DMark Cloud Gate Standard Score | 18445 punti | |
| 3DMark Fire Strike Score | 4240 punti | |
| 3DMark Time Spy Score | 1623 punti | |
Aiuto | ||
Grafico FPS The Witcher 3
| basso | medio | alto | ultra | |
|---|---|---|---|---|
| The Witcher 3 (2015) | 94.5 | 56.7 | 30.5 | 15.4 |
| Dota 2 Reborn (2015) | 84.2 | 86.7 | 53.9 | 48.6 |
| Final Fantasy XV Benchmark (2018) | 41.7 | 22 | 15.7 | |
| X-Plane 11.11 (2018) | 27 | 24.8 | 22.3 |
| Panasonic Toughbook FZ-55 MK2 Iris Xe G7 96EUs, i7-1185G7, Toshiba KIOXIA KBG4AZNV512G M.2 2280 OPAL | Panasonic Toughbook FZ-55 UHD Graphics 620, i5-8365U, Samsung SSD PM871b MZNLN256HAJQ | Dell Latitude 5420 Rugged-P85G Radeon RX 540, i7-8650U, SK hynix PC401 NVMe 500 GB | Durabook S14I Iris Xe G7 96EUs, i7-1165G7, UDinfo M2P M2P80DE512GBAEP | Getac S410 UHD Graphics 620, i5-8550U, CUKUSA 1 TB SATA SSD Q0526A | |
|---|---|---|---|---|---|
| Noise | -17% | -13% | -13% | -11% | |
| off /ambiente * (dB) | 23.8 | 29 -22% | 28.3 -19% | 25.2 -6% | 28.4 -19% |
| Idle Minimum * (dB) | 24 | 29 -21% | 28.3 -18% | 25.2 -5% | 28.4 -18% |
| Idle Average * (dB) | 24 | 29.6 -23% | 28.3 -18% | 25.2 -5% | 28.4 -18% |
| Idle Maximum * (dB) | 24 | 30.5 -27% | 28.3 -18% | 34.5 -44% | 28.4 -18% |
| Load Average * (dB) | 26.7 | 30.3 -13% | 29.9 -12% | 34.5 -29% | 30.3 -13% |
| Load Maximum * (dB) | 41.7 | 39 6% | 38 9% | 36.2 13% | 33.3 20% |
* ... Meglio usare valori piccoli
Rumorosità
| Idle |
| 24 / 24 / 24 dB(A) |
| Sotto carico |
| 26.7 / 41.7 dB(A) |
 | ||
30 dB silenzioso 40 dB(A) udibile 50 dB(A) rumoroso |
||
min: | ||
(+) La temperatura massima sul lato superiore è di 36.2 °C / 97 F, rispetto alla media di 34.3 °C / 94 F, che varia da 21.2 a 62.5 °C per questa classe Office.
(±) Il lato inferiore si riscalda fino ad un massimo di 42.2 °C / 108 F, rispetto alla media di 36.8 °C / 98 F
(+) In idle, la temperatura media del lato superiore è di 29.2 °C / 85 F, rispetto alla media deld ispositivo di 29.5 °C / 85 F.
(+) I poggiapolsi e il touchpad sono piu' freddi della temperatura della pelle con un massimo di 29.2 °C / 84.6 F e sono quindi freddi al tatto.
(±) La temperatura media della zona del palmo della mano di dispositivi simili e'stata di 27.5 °C / 81.5 F (-1.7 °C / -3.1 F).
Panasonic Toughbook FZ-55 MK2 analisi audio
(+) | gli altoparlanti sono relativamente potenti (86.2 dB)
Bassi 100 - 315 Hz
(-) | quasi nessun basso - in media 41.6% inferiori alla media
(+) | bassi in lineaa (6.8% delta rispetto alla precedente frequenza)
Medi 400 - 2000 Hz
(±) | medi ridotti - circa 9.5% inferiori alla media
(±) | linearità dei medi adeguata (8.9% delta rispetto alla precedente frequenza)
Alti 2 - 16 kHz
(+) | Alti bilanciati - appena 2.7% dalla media
(+) | alti lineari (3% delta rispetto alla precedente frequenza)
Nel complesso 100 - 16.000 Hz
(±) | la linearità complessiva del suono è media (25.4% di differenza rispetto alla media
Rispetto alla stessa classe
» 78% di tutti i dispositivi testati in questa classe è stato migliore, 6% simile, 17% peggiore
» Il migliore ha avuto un delta di 7%, medio di 21%, peggiore di 53%
Rispetto a tutti i dispositivi testati
» 78% di tutti i dispositivi testati in questa classe è stato migliore, 5% similare, 17% peggiore
» Il migliore ha avuto un delta di 4%, medio di 23%, peggiore di 134%
Apple MacBook 12 (Early 2016) 1.1 GHz analisi audio
(+) | gli altoparlanti sono relativamente potenti (83.6 dB)
Bassi 100 - 315 Hz
(±) | bassi ridotti - in media 11.3% inferiori alla media
(±) | la linearità dei bassi è media (14.2% delta rispetto alla precedente frequenza)
Medi 400 - 2000 Hz
(+) | medi bilanciati - solo only 2.4% rispetto alla media
(+) | medi lineari (5.5% delta rispetto alla precedente frequenza)
Alti 2 - 16 kHz
(+) | Alti bilanciati - appena 2% dalla media
(+) | alti lineari (4.5% delta rispetto alla precedente frequenza)
Nel complesso 100 - 16.000 Hz
(+) | suono nel complesso lineare (10.2% differenza dalla media)
Rispetto alla stessa classe
» 7% di tutti i dispositivi testati in questa classe è stato migliore, 2% simile, 90% peggiore
» Il migliore ha avuto un delta di 5%, medio di 18%, peggiore di 53%
Rispetto a tutti i dispositivi testati
» 5% di tutti i dispositivi testati in questa classe è stato migliore, 1% similare, 94% peggiore
» Il migliore ha avuto un delta di 4%, medio di 23%, peggiore di 134%
| Off / Standby | |
| Idle | |
| Sotto carico |
|
Leggenda:
min: | |
| Panasonic Toughbook FZ-55 MK2 i7-1185G7, Iris Xe G7 96EUs, Toshiba KIOXIA KBG4AZNV512G M.2 2280 OPAL, IPS, 1920x1080, 14" | Panasonic Toughbook FZ-55 i5-8365U, UHD Graphics 620, Samsung SSD PM871b MZNLN256HAJQ, IPS, 1920x1080, 14" | Dell Latitude 5420 Rugged-P85G i7-8650U, Radeon RX 540, SK hynix PC401 NVMe 500 GB, IPS, 1920x1080, 14" | Durabook S14I i7-1165G7, Iris Xe G7 96EUs, UDinfo M2P M2P80DE512GBAEP, TN, 1920x1080, 14" | Getac S410 i5-8550U, UHD Graphics 620, CUKUSA 1 TB SATA SSD Q0526A, TN PED, 1366x768, 14" | |
|---|---|---|---|---|---|
| Power Consumption | 9% | -34% | -35% | 15% | |
| Idle Minimum * (Watt) | 3.5 | 3.7 -6% | 4.8 -37% | 6.8 -94% | 5.6 -60% |
| Idle Average * (Watt) | 10.4 | 9.6 8% | 13.6 -31% | 16.4 -58% | 7.9 24% |
| Idle Maximum * (Watt) | 10.5 | 10.4 1% | 13.8 -31% | 16.9 -61% | 8.4 20% |
| Load Average * (Watt) | 45.4 | 40 12% | 67.8 -49% | 39.2 14% | 32.8 28% |
| Witcher 3 ultra * (Watt) | 43 | 69.1 -61% | |||
| Load Maximum * (Watt) | 99.3 | 71.9 28% | 93.5 6% | 73.1 26% | 34.3 65% |
* ... Meglio usare valori piccoli
Consumo energetico The Witcher 3 / Stresstest
| Panasonic Toughbook FZ-55 MK2 i7-1185G7, Iris Xe G7 96EUs, 71 Wh | Panasonic Toughbook FZ-55 i5-8365U, UHD Graphics 620, 71 Wh | Dell Latitude 5420 Rugged-P85G i7-8650U, Radeon RX 540, 102 Wh | Durabook S14I i7-1165G7, Iris Xe G7 96EUs, 50 Wh | Getac S410 i5-8550U, UHD Graphics 620, 46.6 Wh | |
|---|---|---|---|---|---|
| Autonomia della batteria | 35% | 19% | -60% | -62% | |
| WiFi v1.3 (h) | 13.6 | 18.4 35% | 16.2 19% | 5.5 -60% | 5.2 -62% |
| Reader / Idle (h) | 31.4 | ||||
| Load (h) | 3.2 |
Pro
Contro
La serie di CPU Intel 11th gen è facilmente uno dei più grandi aggiornamenti per i portatili rugged. Anche se gli esterni rimangono gli stessi, le prestazioni della CPU e della GPU sono aumentate rispettivamente del 40% e del 350%, il tutto sotto lo stesso pacchetto di alimentazione ULV del modello di ultima generazione. Anche le prestazioni di archiviazione sono aumentate in modo significativo. I portatili consumer stanno godendo di questi aggiornamenti dalla fine dello scorso anno e quindi è ora che i portatili rugged e da campo possano avere gli stessi benefici.
L'originale FZ-55 MK1 è obsoleto? Non necessariamente. Se non fai molto di più che elaborare testi o fogli di calcolo, allora il modello originale sarà più che sufficiente, soprattutto perché condivide le stesse opzioni di visualizzazione dell'FZ-55 MK2. Se le vostre applicazioni coinvolgono un po' di rendering grafico, allora vale la pena investire nell'FZ-55 MK2 e nei suoi notevoli aggiornamenti di prestazioni.
Price comparison
