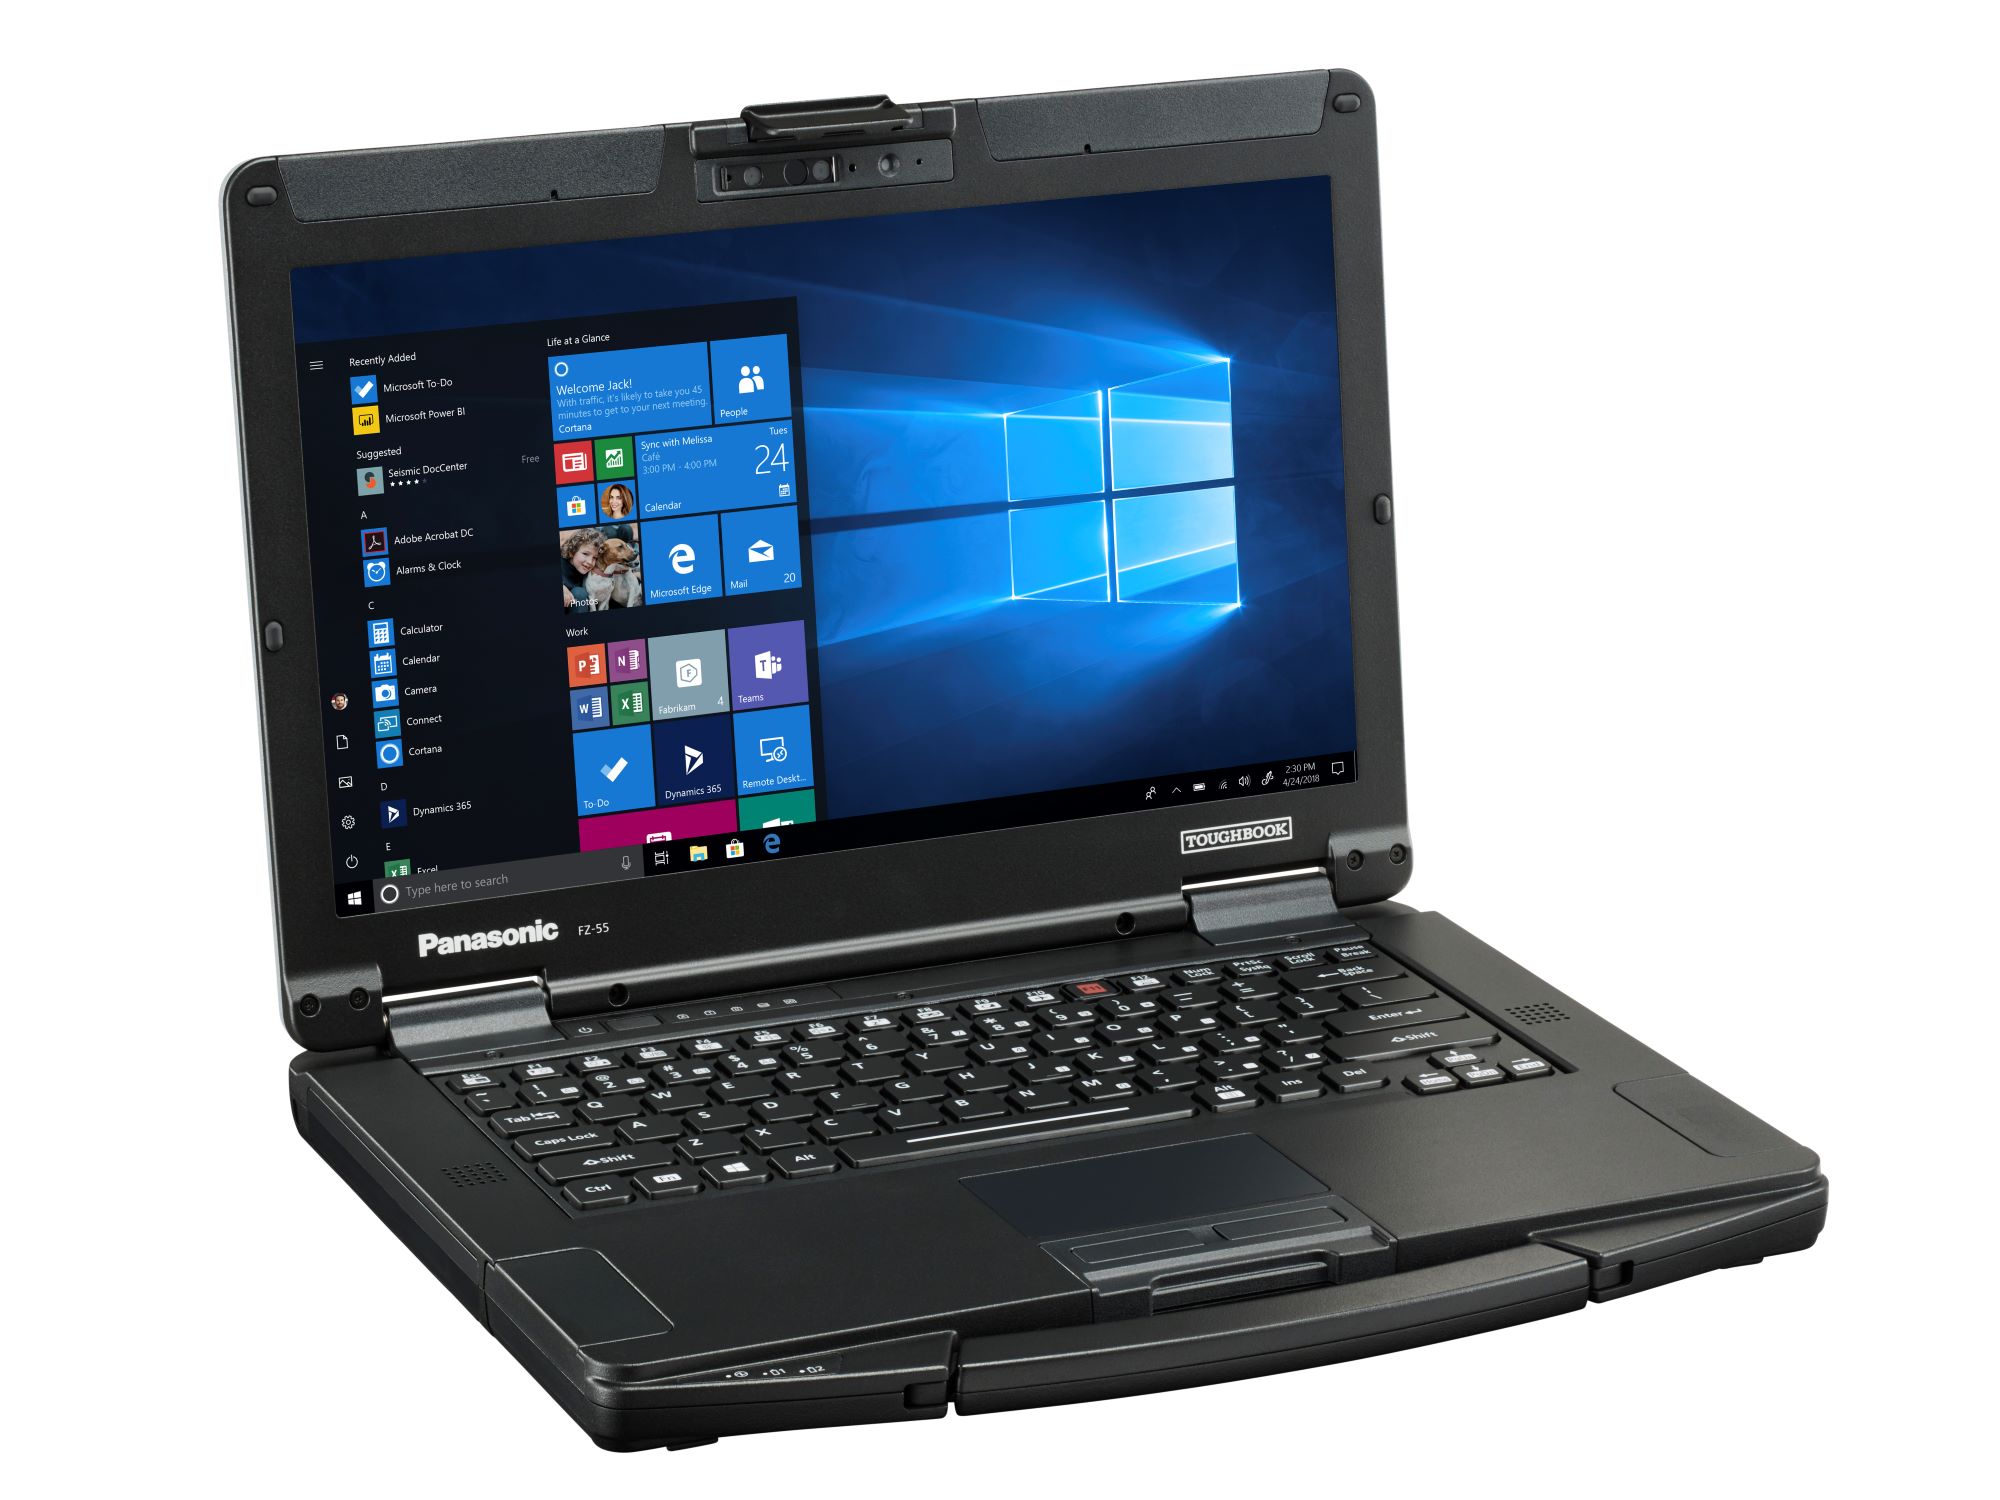
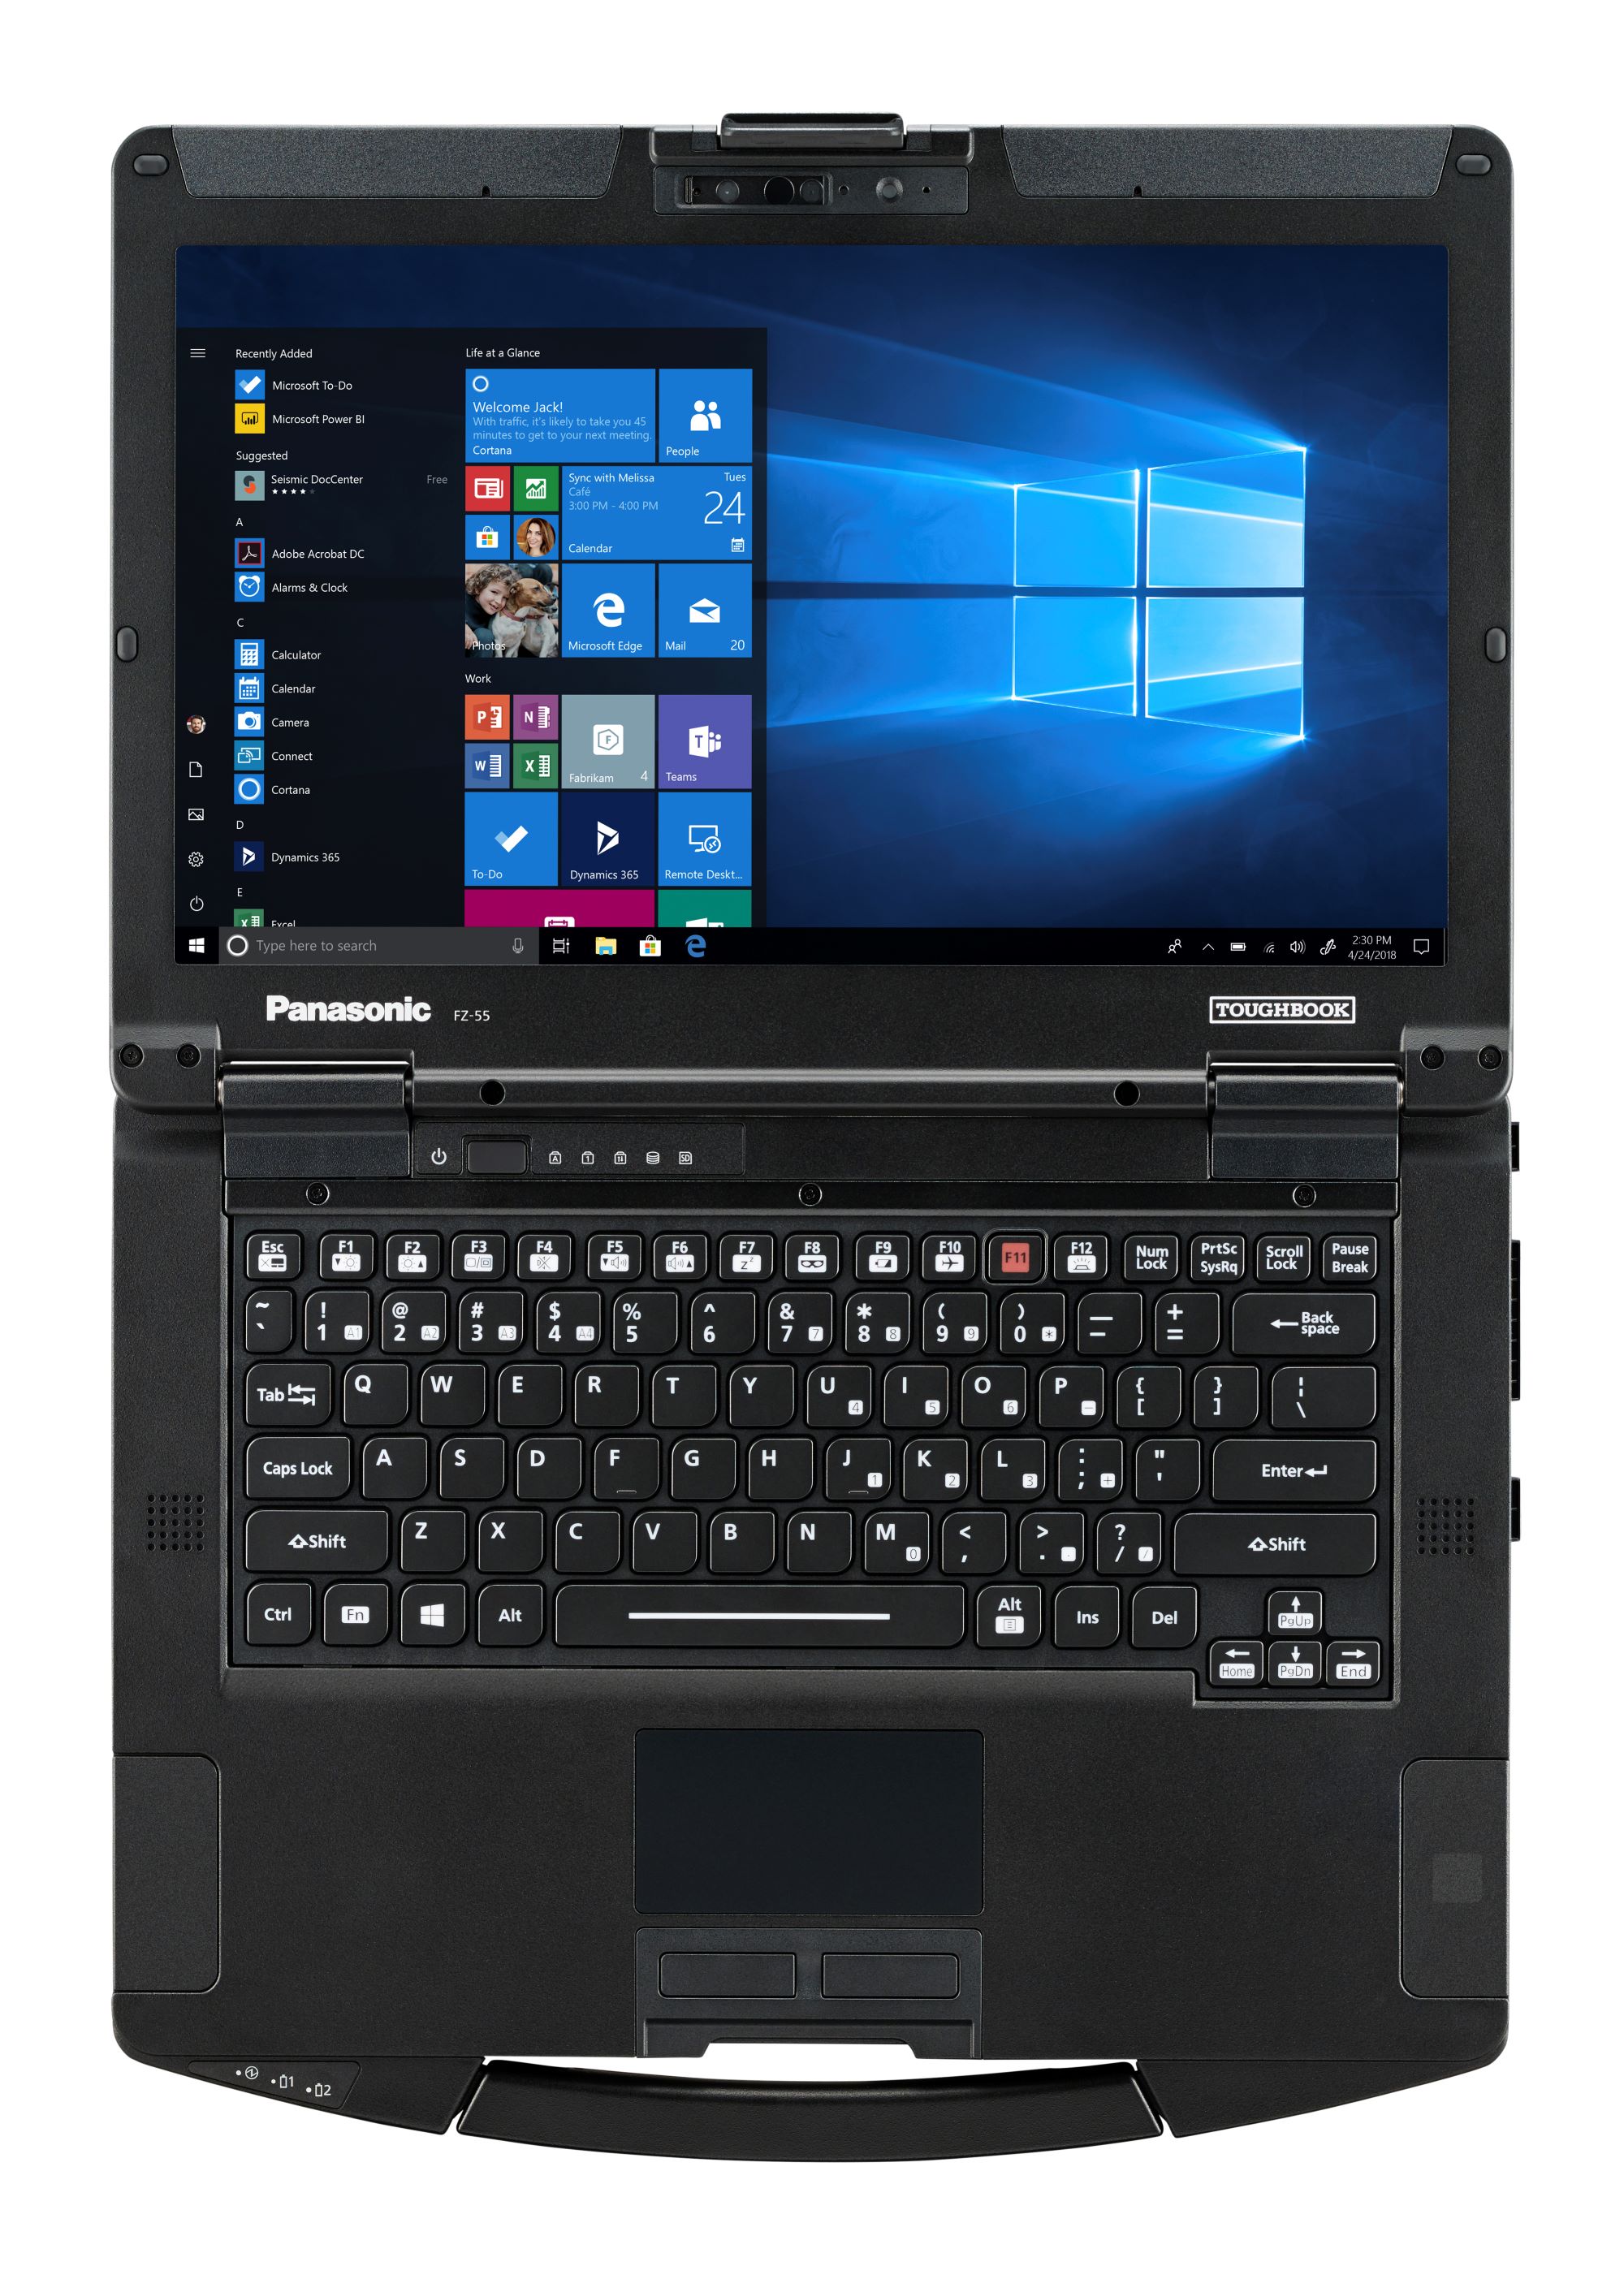
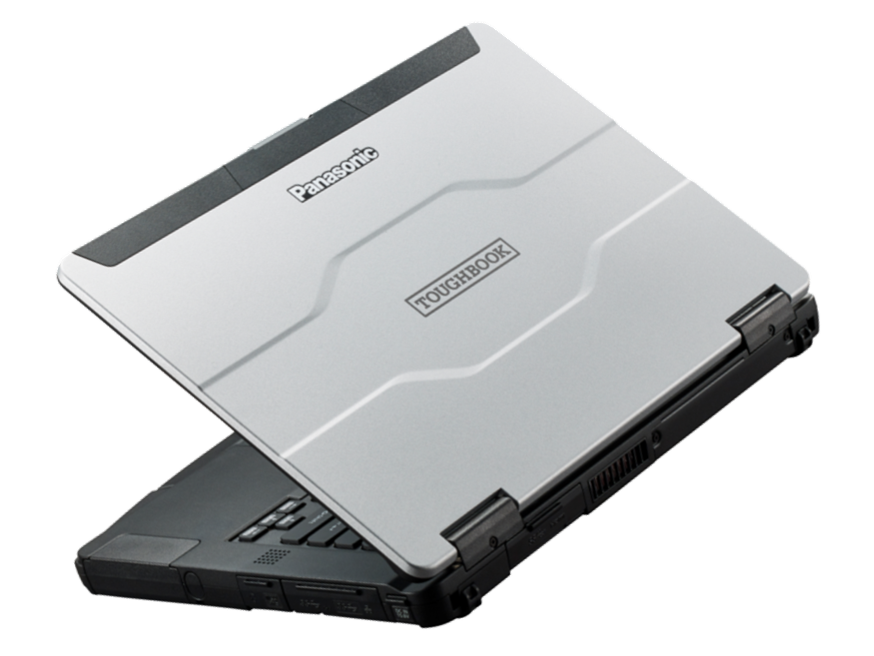
Recensione del Laptop Panasonic Toughbook FZ-55 MK1
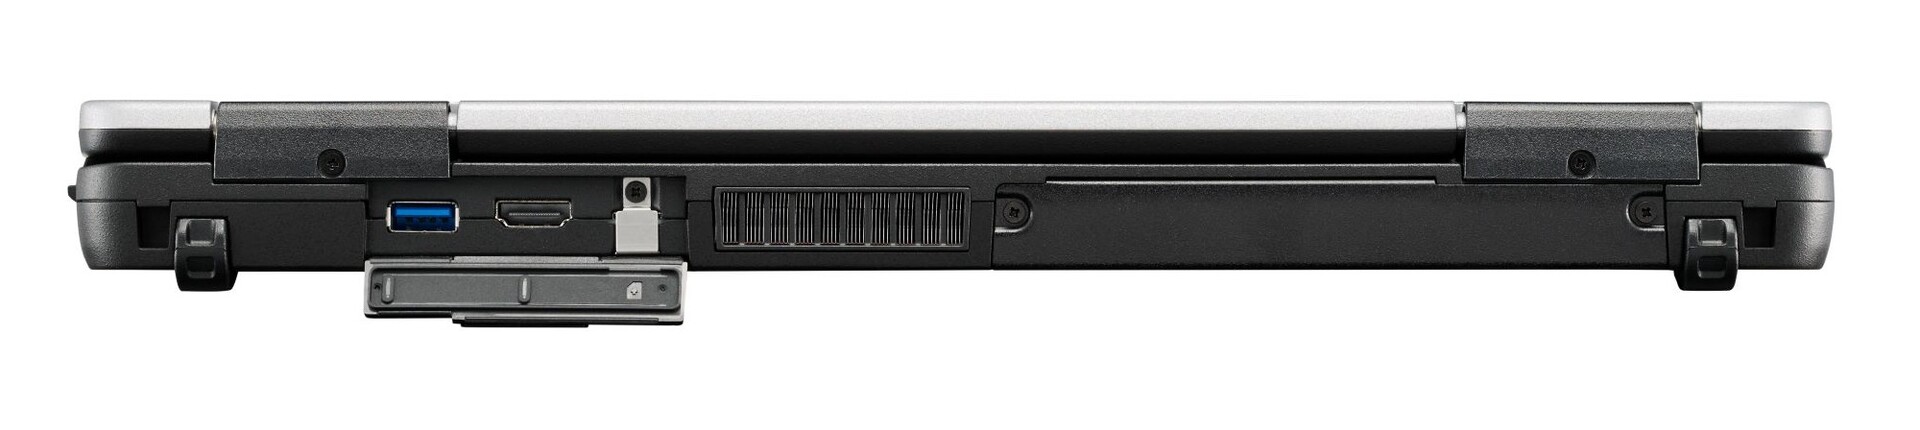
| SD Card Reader | |
| average JPG Copy Test (av. of 3 runs) | |
| Dell Latitude 5420 Rugged-P85G (Toshiba Exceria Pro SDXC 64 GB UHS-II) | |
| Dell Latitude 7424 Rugged Extreme (Toshiba Exceria Pro SDXC 64 GB UHS-II) | |
| Panasonic Toughbook CF-54G2999VM (Toshiba Exceria Pro SDXC 64 GB UHS-II) | |
| Getac S410 (Toshiba Exceria Pro SDXC 64 GB UHS-II) | |
| Panasonic Toughbook FZ-55 (Toshiba Exceria Pro M501 64 GB UHS-II) | |
| maximum AS SSD Seq Read Test (1GB) | |
| Dell Latitude 5420 Rugged-P85G (Toshiba Exceria Pro SDXC 64 GB UHS-II) | |
| Dell Latitude 7424 Rugged Extreme (Toshiba Exceria Pro SDXC 64 GB UHS-II) | |
| Panasonic Toughbook CF-54G2999VM (Toshiba Exceria Pro SDXC 64 GB UHS-II) | |
| Getac S410 (Toshiba Exceria Pro SDXC 64 GB UHS-II) | |
| Panasonic Toughbook FZ-55 (Toshiba Exceria Pro M501 64 GB UHS-II) | |
| |||||||||||||||||||||||||
Distribuzione della luminosità: 76 %
Al centro con la batteria: 1037 cd/m²
Contrasto: 1728:1 (Nero: 0.6 cd/m²)
ΔE ColorChecker Calman: 5.71 | ∀{0.5-29.43 Ø4.71}
calibrated: 4.52
ΔE Greyscale Calman: 5.5 | ∀{0.09-98 Ø4.96}
57% sRGB (Argyll 1.6.3 3D)
36.4% AdobeRGB 1998 (Argyll 1.6.3 3D)
39.38% AdobeRGB 1998 (Argyll 3D)
57% sRGB (Argyll 3D)
38.09% Display P3 (Argyll 3D)
Gamma: 2.04
CCT: 5783 K
| Panasonic Toughbook FZ-55 InfoVision M140NWF5 R3, IPS, 14", 1920x1080 | Panasonic Toughbook CF-54G2999VM B140XTN, AUO2E3C, TN LED, 14", 1366x768 | Getac S410 CMN N140BGE-E33, TN PED, 14", 1366x768 | Dell Latitude 5420 Rugged-P85G AU Optronics AUO523D, IPS, 14", 1920x1080 | Dell Latitude 7424 Rugged Extreme AU Optronics AUO523D, IPS, 14", 1920x1080 | Lenovo ThinkPad X1 Carbon 2019-20QE000VGE LP140QH2-SPD1, IPS, 14", 2560x1440 | |
|---|---|---|---|---|---|---|
| Display | -2% | 6% | 63% | 71% | 83% | |
| Display P3 Coverage (%) | 38.09 | 37.36 -2% | 40.46 6% | 62.5 64% | 65.3 71% | 72.5 90% |
| sRGB Coverage (%) | 57 | 56.1 -2% | 60.9 7% | 92.4 62% | 96.9 70% | 97.8 72% |
| AdobeRGB 1998 Coverage (%) | 39.38 | 38.62 -2% | 41.8 6% | 64.2 63% | 67.3 71% | 73.8 87% |
| Response Times | 20% | 28% | -38% | -43% | 20% | |
| Response Time Grey 50% / Grey 80% * (ms) | 42 ? | 43.2 ? -3% | 41.2 ? 2% | 68 ? -62% | 62.8 ? -50% | 33.6 ? 20% |
| Response Time Black / White * (ms) | 29.6 ? | 17.2 ? 42% | 14 ? 53% | 33.6 ? -14% | 40 ? -35% | 24 ? 19% |
| PWM Frequency (Hz) | 694 ? | 877 ? | 735 ? | 763 | ||
| Screen | -49% | -45% | 20% | 20% | 15% | |
| Brightness middle (cd/m²) | 1037 | 174.5 -83% | 265.1 -74% | 1111.7 7% | 844 -19% | 338 -67% |
| Brightness (cd/m²) | 1015 | 164 -84% | 246 -76% | 1026 1% | 793 -22% | 315 -69% |
| Brightness Distribution (%) | 76 | 71 -7% | 81 7% | 80 5% | 88 16% | 88 16% |
| Black Level * (cd/m²) | 0.6 | 0.6 -0% | 0.58 3% | 0.81 -35% | 0.54 10% | 0.43 28% |
| Contrast (:1) | 1728 | 291 -83% | 457 -74% | 1372 -21% | 1563 -10% | 786 -55% |
| Colorchecker dE 2000 * | 5.71 | 12.05 -111% | 14.24 -149% | 3.83 33% | 4.8 16% | 4 30% |
| Colorchecker dE 2000 max. * | 26.27 | 27.5 -5% | 26.66 -1% | 7.85 70% | 11.88 55% | 7.9 70% |
| Colorchecker dE 2000 calibrated * | 4.52 | 4.34 4% | 3.94 13% | 2.98 34% | 1.15 75% | 1.7 62% |
| Greyscale dE 2000 * | 5.5 | 14.8 -169% | 14.2 -158% | 5.6 -2% | 7.6 -38% | 6.2 -13% |
| Gamma | 2.04 108% | 1.4 157% | 2.03 108% | 2.306 95% | 2.334 94% | 2.13 103% |
| CCT | 5783 112% | 14529 45% | 17152 38% | 7676 85% | 6546 99% | 6787 96% |
| Color Space (Percent of AdobeRGB 1998) (%) | 36.4 | 35.7 -2% | 38.7 6% | 59 62% | 62 70% | 68.1 87% |
| Color Space (Percent of sRGB) (%) | 57 | 56.2 -1% | 61 7% | 93 63% | 97 70% | 97.8 72% |
| Media totale (Programma / Settaggio) | -10% /
-32% | -4% /
-26% | 15% /
21% | 16% /
22% | 39% /
28% |
* ... Meglio usare valori piccoli
Tempi di risposta del Display
| ↔ Tempi di risposta dal Nero al Bianco | ||
|---|---|---|
| 29.6 ms ... aumenta ↗ e diminuisce ↘ combinato | ↗ 13.2 ms Incremento | 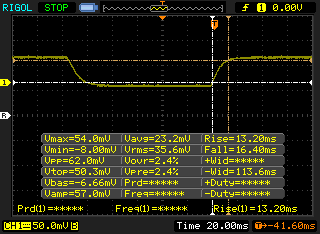 |
| ↘ 16.4 ms Calo | ||
| Lo schermo mostra tempi di risposta relativamente lenti nei nostri tests e potrebbe essere troppo lento per i gamers. In confronto, tutti i dispositivi di test variano da 0.1 (minimo) a 240 (massimo) ms. » 79 % di tutti i dispositivi è migliore. Questo significa che i tempi di risposta rilevati sono peggiori rispetto alla media di tutti i dispositivi testati (19.8 ms). | ||
| ↔ Tempo di risposta dal 50% Grigio all'80% Grigio | ||
| 42 ms ... aumenta ↗ e diminuisce ↘ combinato | ↗ 20.8 ms Incremento | 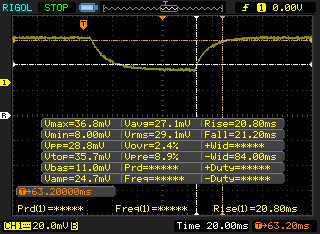 |
| ↘ 21.2 ms Calo | ||
| Lo schermo mostra tempi di risposta lenti nei nostri tests e sarà insoddisfacente per i gamers. In confronto, tutti i dispositivi di test variano da 0.165 (minimo) a 636 (massimo) ms. » 67 % di tutti i dispositivi è migliore. Questo significa che i tempi di risposta rilevati sono peggiori rispetto alla media di tutti i dispositivi testati (31 ms). | ||
Sfarfallio dello schermo / PWM (Pulse-Width Modulation)
| flickering dello schermo / PWM rilevato | 694 Hz | ≤ 99 % settaggio luminosita' | 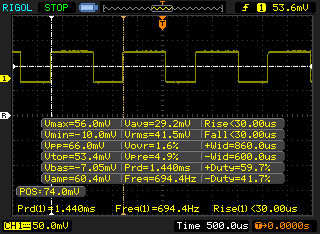 |
Il display sfarfalla a 694 Hz (Probabilmente a causa dell'uso di PWM) Flickering rilevato ad una luminosita' di 99 % o inferiore. Non dovrebbe verificarsi flickering o PWM sopra questo valore di luminosita'. La frequenza di 694 Hz è abbastanza alta, quindi la maggioranza degli utenti sensibili al PWM non dovrebbero notare alcun flickering. In confronto: 52 % di tutti i dispositivi testati non utilizza PWM per ridurre la luminosita' del display. Se è rilevato PWM, una media di 7757 (minimo: 5 - massimo: 343500) Hz è stata rilevata. | |||
| Cinebench R11.5 | |
| CPU Single 64Bit | |
| Media Intel Core i5-8365U (n=1) | |
| Lenovo ThinkPad L490 20Q6S08600 | |
| Dell Latitude 13 3390 | |
| CPU Multi 64Bit | |
| Media Intel Core i5-8365U (n=1) | |
| Lenovo ThinkPad L490 20Q6S08600 | |
| Dell Latitude 13 3390 | |
| Cinebench R10 | |
| Rendering Multiple CPUs 32Bit | |
| Lenovo Legion Y540-17IRH | |
| Media Intel Core i5-8365U (n=1) | |
| HP ProBook 445 G6 | |
| Rendering Single 32Bit | |
| Media Intel Core i5-8365U (n=1) | |
| Lenovo Legion Y540-17IRH | |
| HP ProBook 445 G6 | |
| wPrime 2.10 - 1024m | |
| Lenovo ThinkPad 13 20J1005TPB | |
| Media Intel Core i5-8365U (n=1) | |
* ... Meglio usare valori piccoli
| PCMark 8 Home Score Accelerated v2 | 3146 punti | |
| PCMark 8 Work Score Accelerated v2 | 4381 punti | |
| PCMark 10 Score | 3751 punti | |
Aiuto | ||
| Panasonic Toughbook FZ-55 Samsung SSD PM871b MZNLN256HAJQ | Getac S410 CUKUSA 1 TB SATA SSD Q0526A | Dell Latitude 5420 Rugged-P85G SK hynix PC401 NVMe 500 GB | Dell Latitude 7424 Rugged Extreme SK Hynix PC401 512GB M.2 (HFS512GD9TNG) | Lenovo ThinkPad X1 Carbon 2019-20QE000VGE WDC PC SN720 SDAQNTW-512G | |
|---|---|---|---|---|---|
| AS SSD | 52% | 122% | 107% | 268% | |
| Seq Read (MB/s) | 437.7 | 484.2 11% | 2054 369% | 2096 379% | 2978 580% |
| Seq Write (MB/s) | 387.3 | 396.1 2% | 653 69% | 1016 162% | 2287 490% |
| 4K Read (MB/s) | 26.18 | 34.9 33% | 39.34 50% | 39.91 52% | 47.39 81% |
| 4K Write (MB/s) | 60.3 | 74.1 23% | 96.4 60% | 97.9 62% | 175.6 191% |
| 4K-64 Read (MB/s) | 369.8 | 382.3 3% | 677 83% | 636 72% | 1209 227% |
| 4K-64 Write (MB/s) | 313.7 | 329 5% | 982 213% | 604 93% | 1148 266% |
| Access Time Read * (ms) | 0.089 | 0.058 35% | 0.044 51% | 0.044 51% | |
| Access Time Write * (ms) | 0.058 | 0.045 22% | 0.051 12% | 0.051 12% | 0.023 60% |
| Score Read (Points) | 440 | 466 6% | 921 109% | 886 101% | 1554 253% |
| Score Write (Points) | 413 | 443 7% | 1143 177% | 804 95% | 1553 276% |
| Score Total (Points) | 1083 | 1154 7% | 2475 129% | 2099 94% | 3874 258% |
| Copy ISO MB/s (MB/s) | 553 | 2151 289% | 1622 193% | ||
| Copy Program MB/s (MB/s) | 204.7 | 422.8 107% | 378.1 85% | ||
| Copy Game MB/s (MB/s) | 385.9 | 1045 171% | 793 105% |
* ... Meglio usare valori piccoli

| 3DMark 11 | |
| 1280x720 Performance GPU | |
| Asus FX550IU-WSFX | |
| Razer Blade Stealth i7-8565U | |
| HP ProBook 445 G6 | |
| Intel NUC8i7BE | |
| Lenovo ThinkPad X1 Yoga 2019-20QGS00A00 | |
| Media Intel UHD Graphics 620 (1144 - 3432, n=244) | |
| Panasonic Toughbook FZ-55 | |
| Dell Latitude 13 3390 | |
| Lenovo ThinkPad 13 20J1005TPB | |
| Chuwi LapBook Plus | |
| 1280x720 Performance Combined | |
| Razer Blade Stealth i7-8565U | |
| Asus FX550IU-WSFX | |
| Intel NUC8i7BE | |
| HP ProBook 445 G6 | |
| Lenovo ThinkPad X1 Yoga 2019-20QGS00A00 | |
| Media Intel UHD Graphics 620 (927 - 2505, n=244) | |
| Dell Latitude 13 3390 | |
| Panasonic Toughbook FZ-55 | |
| Lenovo ThinkPad 13 20J1005TPB | |
| Chuwi LapBook Plus | |
| 3DMark | |
| 1280x720 Cloud Gate Standard Graphics | |
| Asus FX550IU-WSFX | |
| Razer Blade Stealth i7-8565U | |
| Intel NUC8i7BE | |
| HP ProBook 445 G6 | |
| Lenovo ThinkPad X1 Yoga 2019-20QGS00A00 | |
| Lenovo ThinkPad X1 Yoga 2019-20QGS00A00 | |
| Media Intel UHD Graphics 620 (6205 - 16400, n=225) | |
| Dell Latitude 13 3390 | |
| Panasonic Toughbook FZ-55 | |
| Lenovo ThinkPad 13 20J1005TPB | |
| Chuwi LapBook Plus | |
| 1920x1080 Fire Strike Graphics | |
| Asus FX550IU-WSFX | |
| Razer Blade Stealth i7-8565U | |
| Intel NUC8i7BE | |
| HP ProBook 445 G6 | |
| Lenovo ThinkPad X1 Yoga 2019-20QGS00A00 | |
| Media Intel UHD Graphics 620 (557 - 2608, n=213) | |
| Dell Latitude 13 3390 | |
| Panasonic Toughbook FZ-55 | |
| Lenovo ThinkPad 13 20J1005TPB | |
| 1920x1080 Ice Storm Extreme Graphics | |
| Asus FX550IU-WSFX | |
| HP ProBook 445 G6 | |
| Dell Latitude 13 3390 | |
| Media Intel UHD Graphics 620 (26409 - 59483, n=71) | |
| Panasonic Toughbook FZ-55 | |
| Lenovo ThinkPad 13 20J1005TPB | |
| Chuwi LapBook Plus | |
| 3DMark 11 Performance | 1875 punti | |
| 3DMark Ice Storm Standard Score | 57207 punti | |
| 3DMark Cloud Gate Standard Score | 7800 punti | |
| 3DMark Fire Strike Score | 967 punti | |
| 3DMark Time Spy Score | 407 punti | |
Aiuto | ||
| The Witcher 3 | |
| 1024x768 The Witcher 3 low | |
| Media della classe Office (32.2 - 135, n=3, ultimi 2 anni) | |
| Media Intel UHD Graphics 620 (8.8 - 50.9, n=64) | |
| 1366x768 The Witcher 3 medium | |
| Media della classe Office (44.7 - 90.4, n=3, ultimi 2 anni) | |
| Media Intel UHD Graphics 620 (8 - 27.9, n=29) | |
| 1920x1080 The Witcher 3 high | |
| Media della classe Office (23.7 - 53.4, n=3, ultimi 2 anni) | |
| Media Intel UHD Graphics 620 (4.2 - 13.5, n=17) | |
| 1920x1080 The Witcher 3 ultra | |
| Media della classe Office (14.8 - 28.1, n=3, ultimi 2 anni) | |
| Media Intel UHD Graphics 620 (2.97 - 5.2, n=7) | |
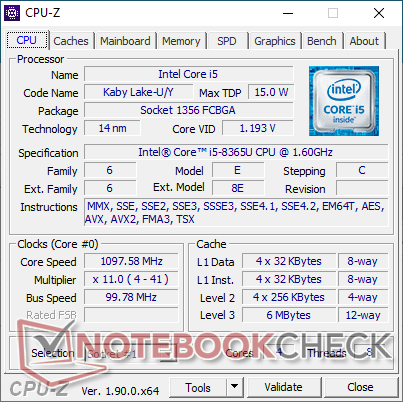
| Panasonic Toughbook FZ-55 UHD Graphics 620, i5-8365U, Samsung SSD PM871b MZNLN256HAJQ | Panasonic Toughbook CF-54G2999VM HD Graphics 620, i5-7300U, Seagate BarraCuda Compute 1TB ST1000LM048 | Getac S410 UHD Graphics 620, i5-8550U, CUKUSA 1 TB SATA SSD Q0526A | Dell Latitude 5420 Rugged-P85G Radeon RX 540, i7-8650U, SK hynix PC401 NVMe 500 GB | Dell Latitude 7424 Rugged Extreme Radeon RX 540, i7-8650U, SK Hynix PC401 512GB M.2 (HFS512GD9TNG) | Lenovo ThinkPad X1 Carbon 2019-20QE000VGE UHD Graphics 620, i7-8665U, WDC PC SN720 SDAQNTW-512G | |
|---|---|---|---|---|---|---|
| Noise | 1% | 5% | 3% | 0% | 4% | |
| off /ambiente * (dB) | 29 | 28.3 2% | 28.4 2% | 28.3 2% | 28.6 1% | 28.4 2% |
| Idle Minimum * (dB) | 29 | 28.8 1% | 28.4 2% | 28.3 2% | 28.6 1% | 28.4 2% |
| Idle Average * (dB) | 29.6 | 28.8 3% | 28.4 4% | 28.3 4% | 28.6 3% | 28.4 4% |
| Idle Maximum * (dB) | 30.5 | 29.1 5% | 28.4 7% | 28.3 7% | 28.6 6% | 28.6 6% |
| Load Average * (dB) | 30.3 | 31.3 -3% | 30.3 -0% | 29.9 1% | 32.9 -9% | 31.5 -4% |
| Load Maximum * (dB) | 39 | 40 -3% | 33.3 15% | 38 3% | 39 -0% | 33.1 15% |
* ... Meglio usare valori piccoli
Rumorosità
| Idle |
| 29 / 29.6 / 30.5 dB(A) |
| Sotto carico |
| 30.3 / 39 dB(A) |
 | ||
30 dB silenzioso 40 dB(A) udibile 50 dB(A) rumoroso |
||
min: | ||
(+) La temperatura massima sul lato superiore è di 36 °C / 97 F, rispetto alla media di 34.3 °C / 94 F, che varia da 21.2 a 62.5 °C per questa classe Office.
(+) Il lato inferiore si riscalda fino ad un massimo di 37.8 °C / 100 F, rispetto alla media di 36.8 °C / 98 F
(+) In idle, la temperatura media del lato superiore è di 22.7 °C / 73 F, rispetto alla media deld ispositivo di 29.5 °C / 85 F.
(+) I poggiapolsi e il touchpad sono piu' freddi della temperatura della pelle con un massimo di 28.6 °C / 83.5 F e sono quindi freddi al tatto.
(±) La temperatura media della zona del palmo della mano di dispositivi simili e'stata di 27.5 °C / 81.5 F (-1.1 °C / -2 F).
Panasonic Toughbook FZ-55 analisi audio
(+) | gli altoparlanti sono relativamente potenti (84.3 dB)
Bassi 100 - 315 Hz
(-) | quasi nessun basso - in media 30% inferiori alla media
(+) | bassi in lineaa (6.2% delta rispetto alla precedente frequenza)
Medi 400 - 2000 Hz
(±) | medi elevati - circa 6.9% superiore alla media
(±) | linearità dei medi adeguata (9.7% delta rispetto alla precedente frequenza)
Alti 2 - 16 kHz
(+) | Alti bilanciati - appena 0.9% dalla media
(+) | alti lineari (3.8% delta rispetto alla precedente frequenza)
Nel complesso 100 - 16.000 Hz
(±) | la linearità complessiva del suono è media (28% di differenza rispetto alla media
Rispetto alla stessa classe
» 88% di tutti i dispositivi testati in questa classe è stato migliore, 3% simile, 9% peggiore
» Il migliore ha avuto un delta di 7%, medio di 21%, peggiore di 53%
Rispetto a tutti i dispositivi testati
» 85% di tutti i dispositivi testati in questa classe è stato migliore, 3% similare, 12% peggiore
» Il migliore ha avuto un delta di 4%, medio di 23%, peggiore di 134%
Apple MacBook 12 (Early 2016) 1.1 GHz analisi audio
(+) | gli altoparlanti sono relativamente potenti (83.6 dB)
Bassi 100 - 315 Hz
(±) | bassi ridotti - in media 11.3% inferiori alla media
(±) | la linearità dei bassi è media (14.2% delta rispetto alla precedente frequenza)
Medi 400 - 2000 Hz
(+) | medi bilanciati - solo only 2.4% rispetto alla media
(+) | medi lineari (5.5% delta rispetto alla precedente frequenza)
Alti 2 - 16 kHz
(+) | Alti bilanciati - appena 2% dalla media
(+) | alti lineari (4.5% delta rispetto alla precedente frequenza)
Nel complesso 100 - 16.000 Hz
(+) | suono nel complesso lineare (10.2% differenza dalla media)
Rispetto alla stessa classe
» 7% di tutti i dispositivi testati in questa classe è stato migliore, 2% simile, 90% peggiore
» Il migliore ha avuto un delta di 5%, medio di 18%, peggiore di 53%
Rispetto a tutti i dispositivi testati
» 5% di tutti i dispositivi testati in questa classe è stato migliore, 1% similare, 94% peggiore
» Il migliore ha avuto un delta di 4%, medio di 23%, peggiore di 134%
| Off / Standby | |
| Idle | |
| Sotto carico |
|
Leggenda:
min: | |
| Panasonic Toughbook FZ-55 i5-8365U, UHD Graphics 620, Samsung SSD PM871b MZNLN256HAJQ, IPS, 1920x1080, 14" | Panasonic Toughbook CF-54G2999VM i5-7300U, HD Graphics 620, Seagate BarraCuda Compute 1TB ST1000LM048, TN LED, 1366x768, 14" | Getac S410 i5-8550U, UHD Graphics 620, CUKUSA 1 TB SATA SSD Q0526A, TN PED, 1366x768, 14" | Dell Latitude 5420 Rugged-P85G i7-8650U, Radeon RX 540, SK hynix PC401 NVMe 500 GB, IPS, 1920x1080, 14" | Dell Latitude 7424 Rugged Extreme i7-8650U, Radeon RX 540, SK Hynix PC401 512GB M.2 (HFS512GD9TNG), IPS, 1920x1080, 14" | Lenovo ThinkPad X1 Carbon 2019-20QE000VGE i7-8665U, UHD Graphics 620, WDC PC SN720 SDAQNTW-512G, IPS, 2560x1440, 14" | |
|---|---|---|---|---|---|---|
| Power Consumption | 22% | 11% | -41% | -59% | 14% | |
| Idle Minimum * (Watt) | 3.7 | 4.4 -19% | 5.6 -51% | 4.8 -30% | 6.5 -76% | 3 19% |
| Idle Average * (Watt) | 9.6 | 6.3 34% | 7.9 18% | 13.6 -42% | 15.1 -57% | 6.3 34% |
| Idle Maximum * (Watt) | 10.4 | 6.5 37% | 8.4 19% | 13.8 -33% | 16.1 -55% | 8.9 14% |
| Load Average * (Watt) | 40 | 36.3 9% | 32.8 18% | 67.8 -69% | 70.5 -76% | 40.8 -2% |
| Load Maximum * (Watt) | 71.9 | 38.3 47% | 34.3 52% | 93.5 -30% | 95.2 -32% | 67.5 6% |
| Witcher 3 ultra * (Watt) | 69.1 | 68.1 |
* ... Meglio usare valori piccoli
| Panasonic Toughbook FZ-55 i5-8365U, UHD Graphics 620, 71 Wh | Panasonic Toughbook CF-54G2999VM i5-7300U, HD Graphics 620, 33 Wh | Getac S410 i5-8550U, UHD Graphics 620, 46.6 Wh | Dell Latitude 5420 Rugged-P85G i7-8650U, Radeon RX 540, 102 Wh | Dell Latitude 7424 Rugged Extreme i7-8650U, Radeon RX 540, 102 Wh | Lenovo ThinkPad X1 Carbon 2019-20QE000VGE i7-8665U, UHD Graphics 620, 51 Wh | |
|---|---|---|---|---|---|---|
| Autonomia della batteria | -68% | -72% | -12% | -36% | -55% | |
| WiFi v1.3 (h) | 18.4 | 5.9 -68% | 5.2 -72% | 16.2 -12% | 11.7 -36% | 8.2 -55% |
| Reader / Idle (h) | 31.4 | |||||
| Load (h) | 3.2 | 2.7 | 1.4 |
Pro
Contro
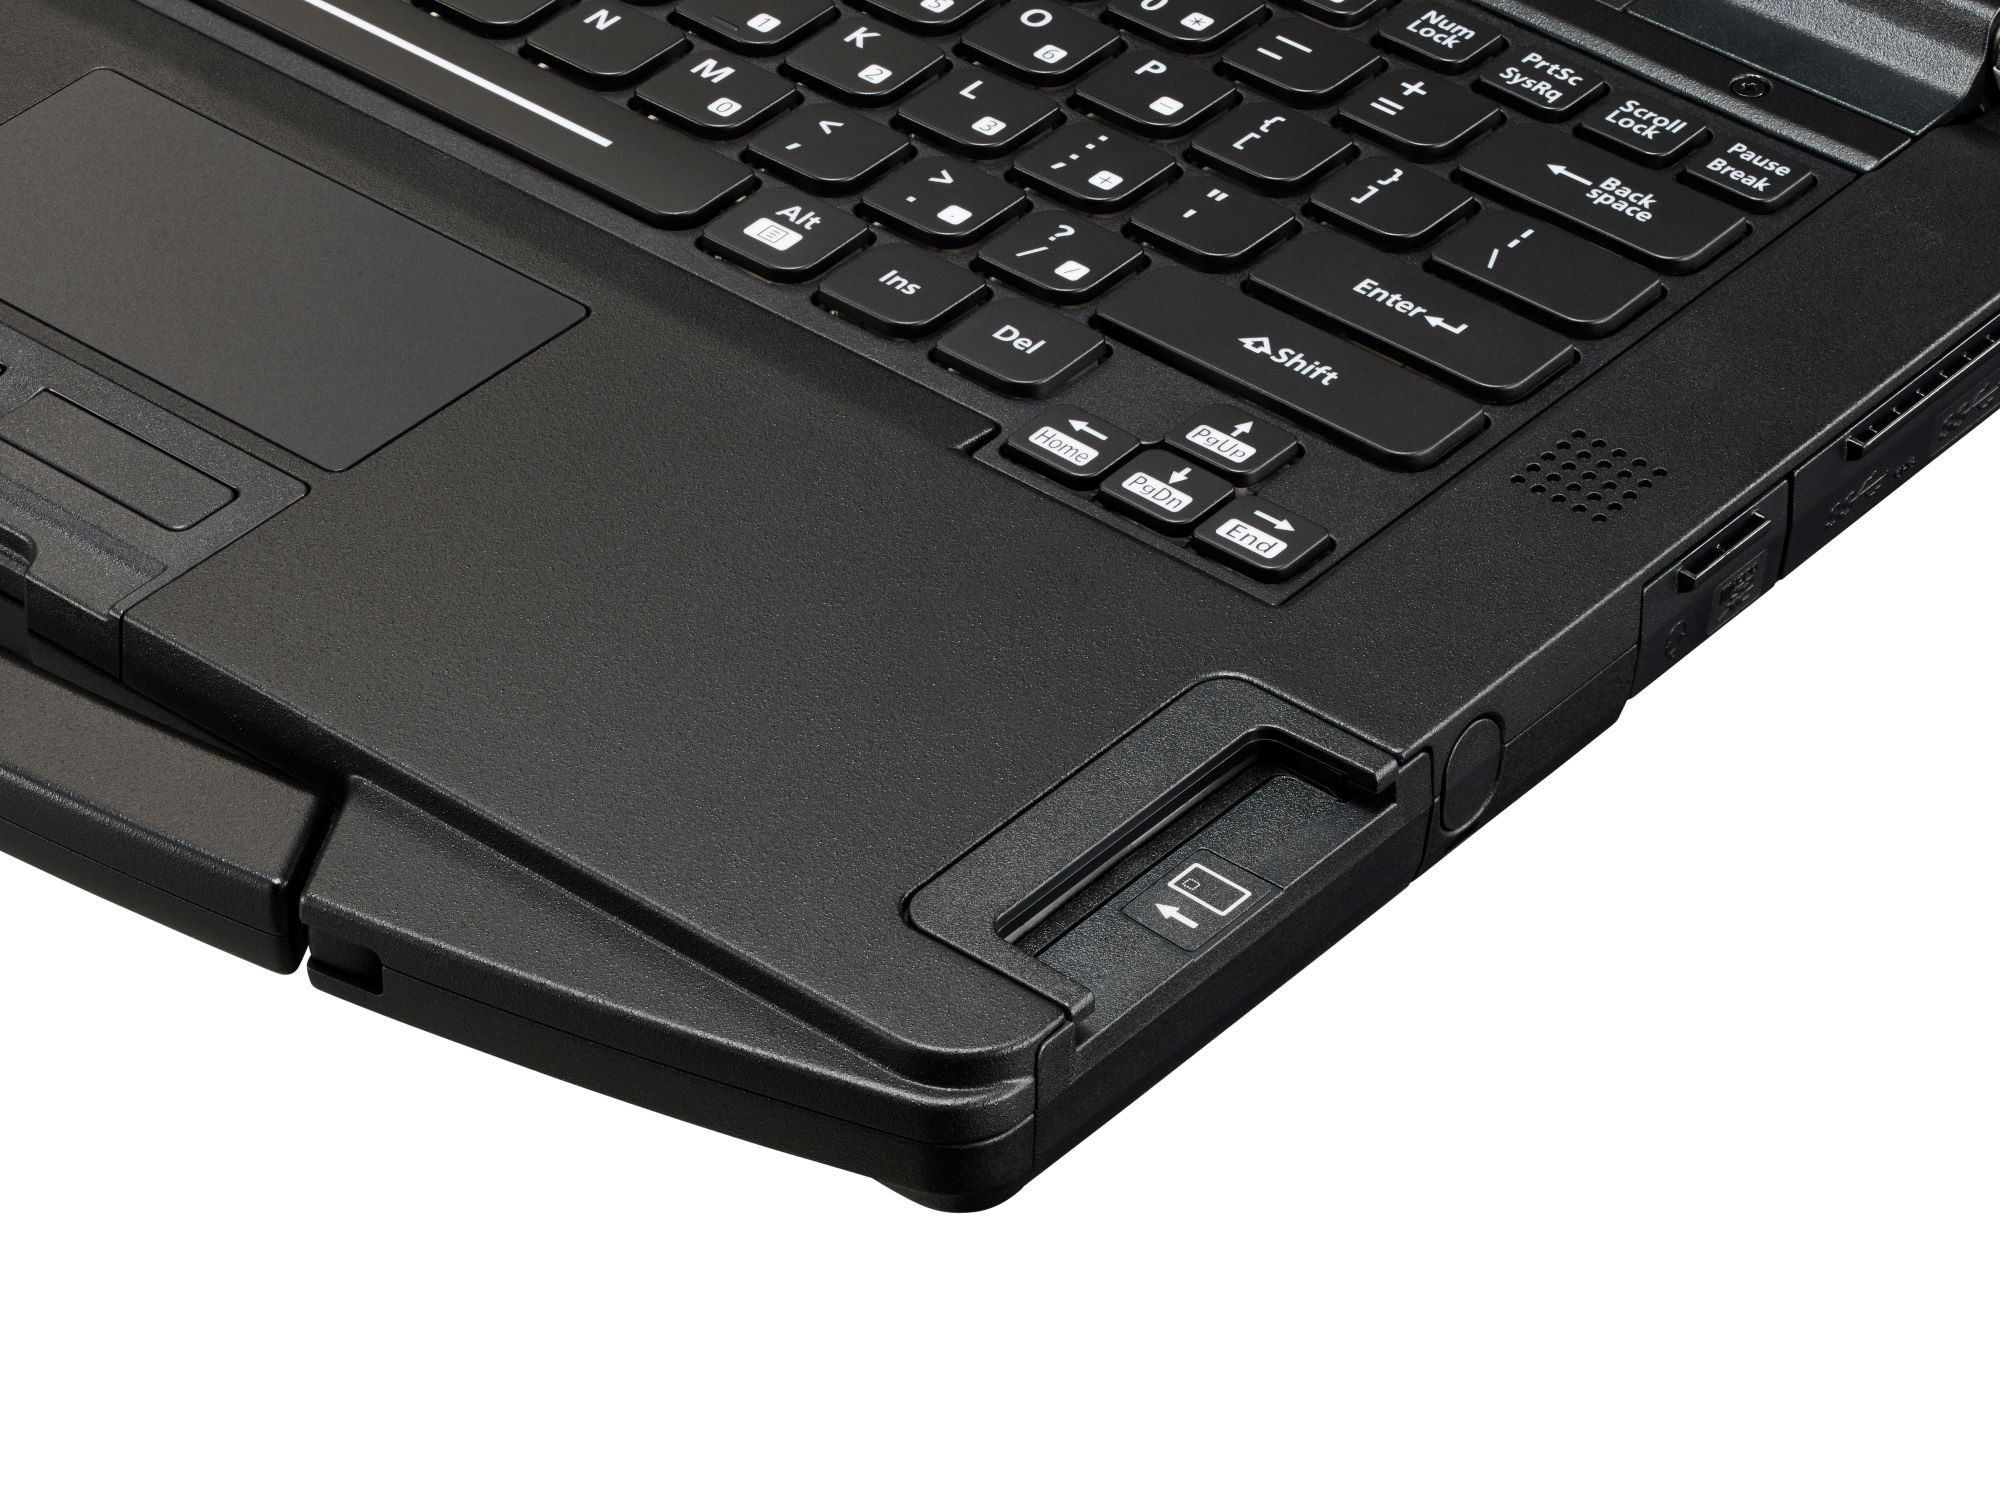
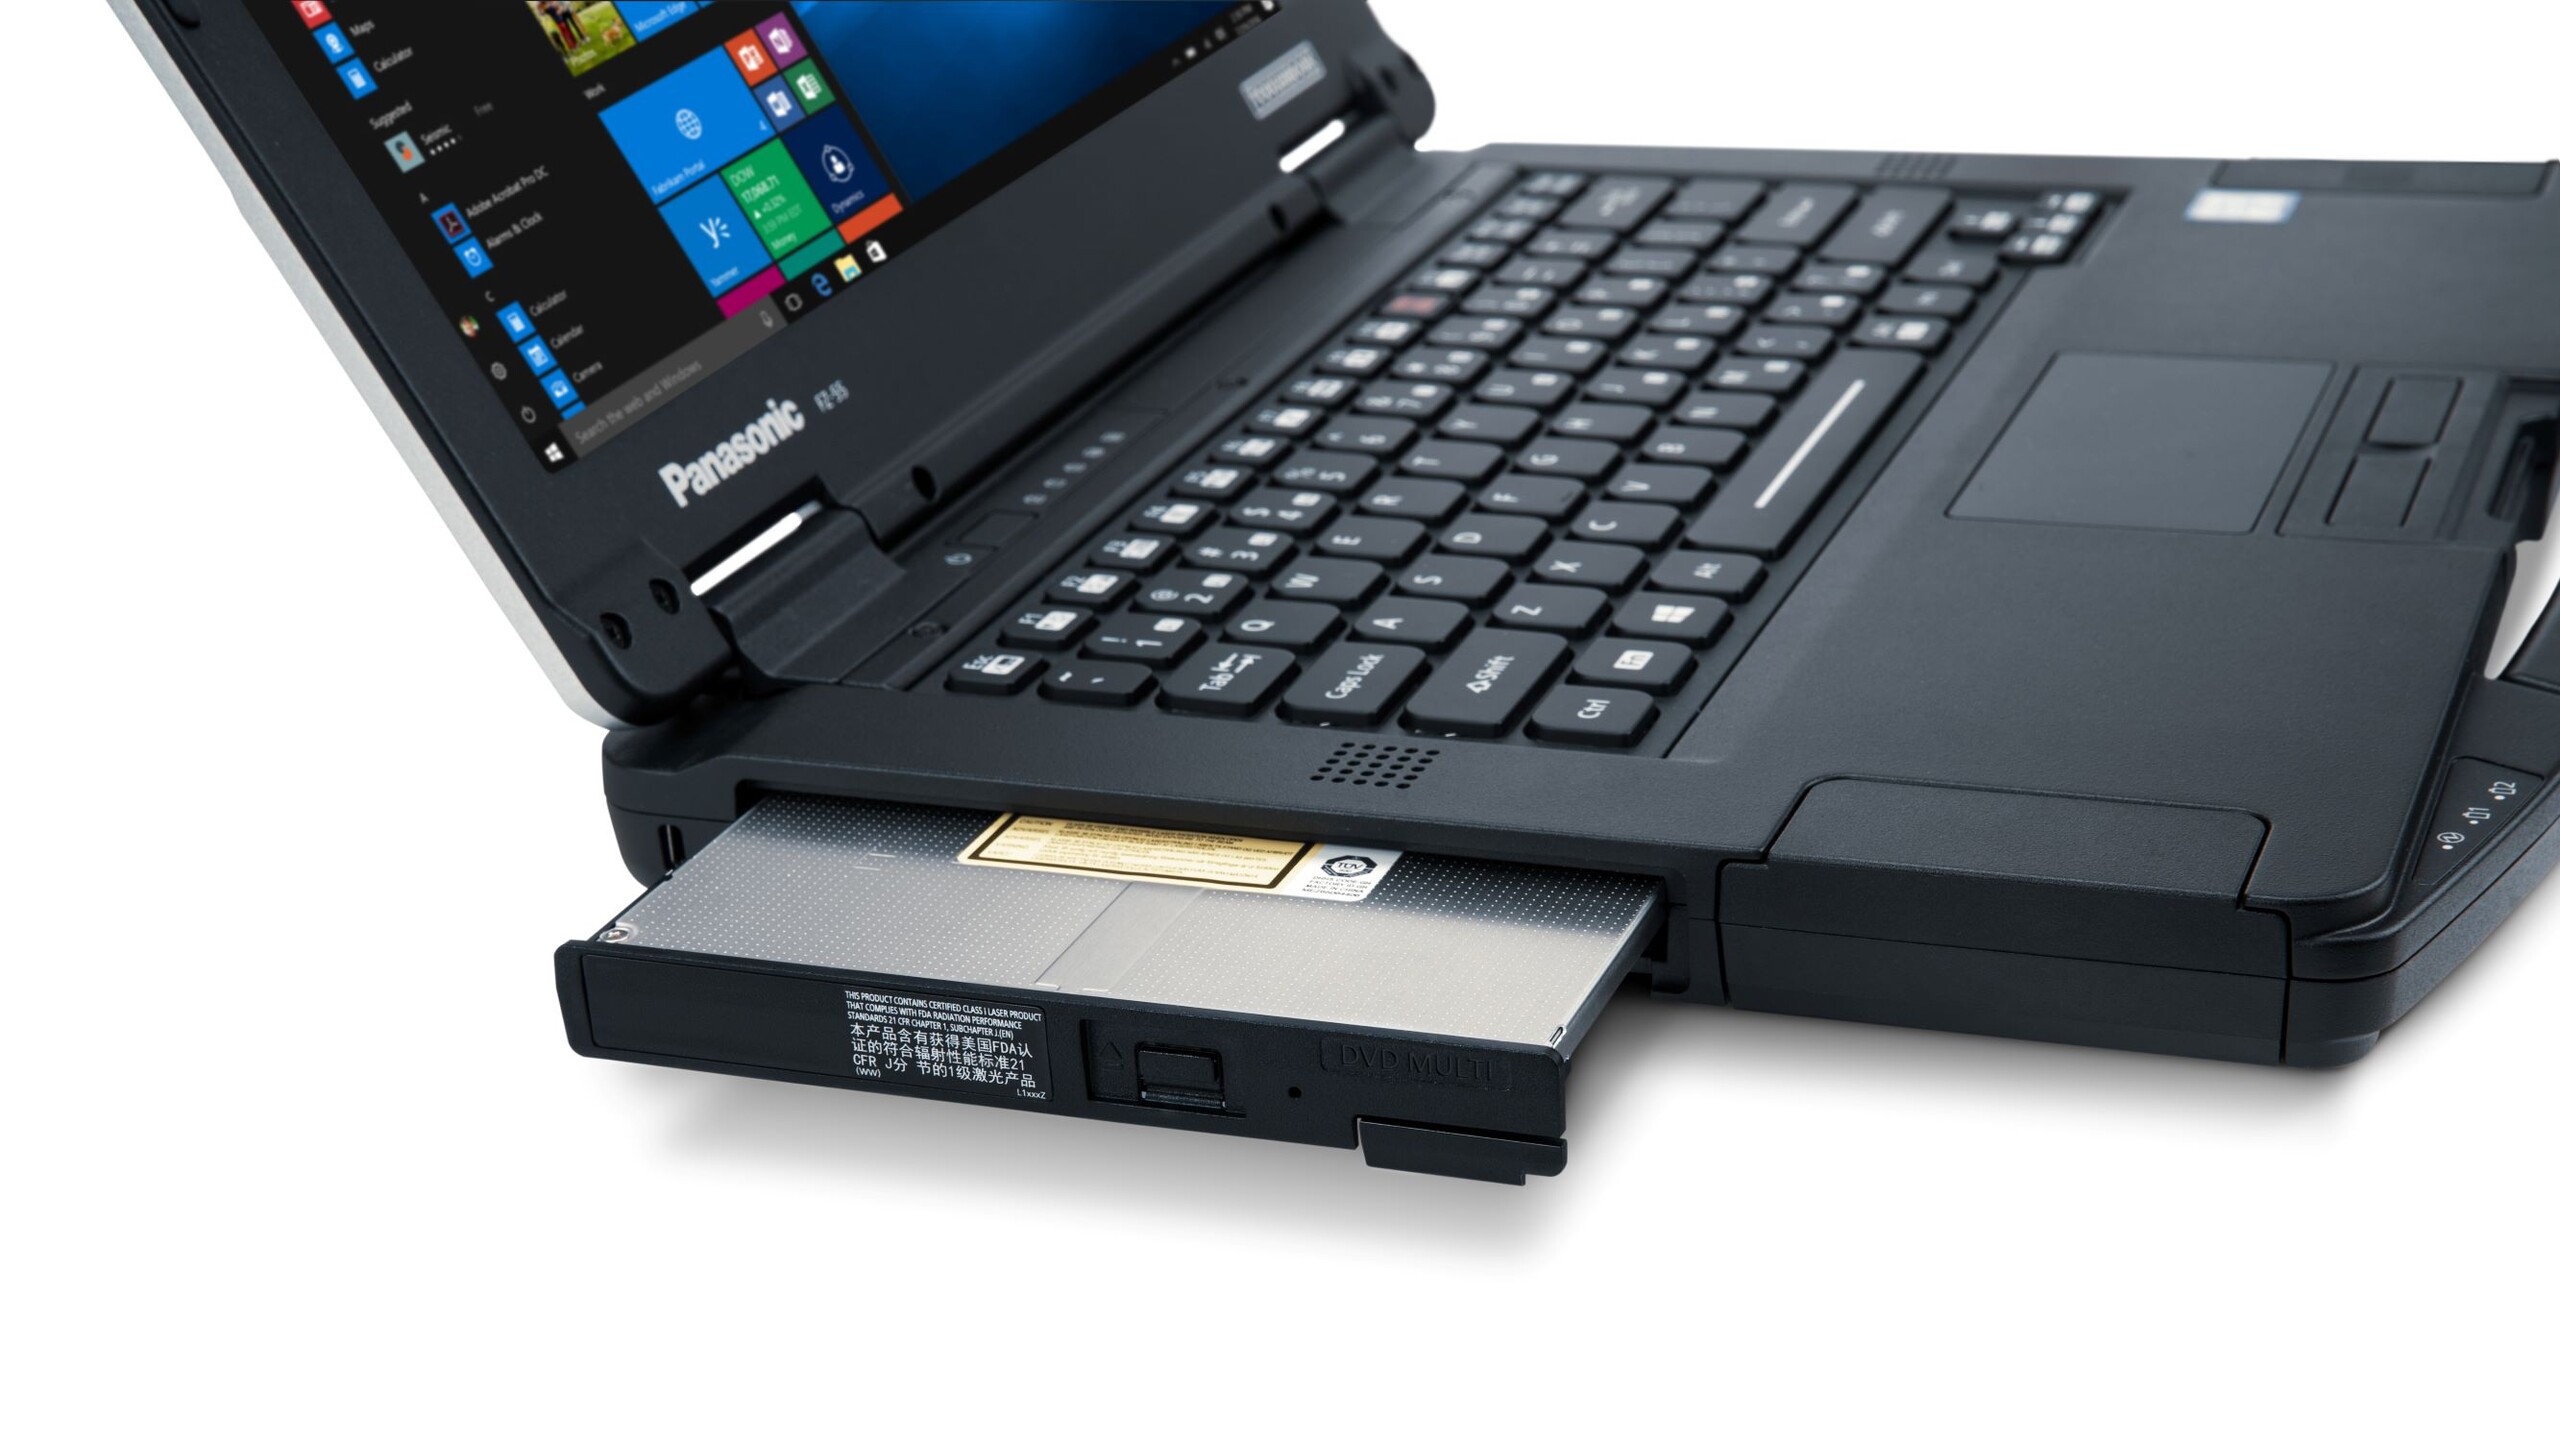
Il Toughbook 55 offre prestazioni della CPU più veloci del 70% rispetto al Toughbook 54, pur essendo compatibile con tutti i suoi accessori. La durata della batteria è inoltre straordinariamente lunga a 18 ore di uso costante WLAN e le batterie, le unità M.2, WAN e l'espansione SATA lo rendono una macchina versatile.
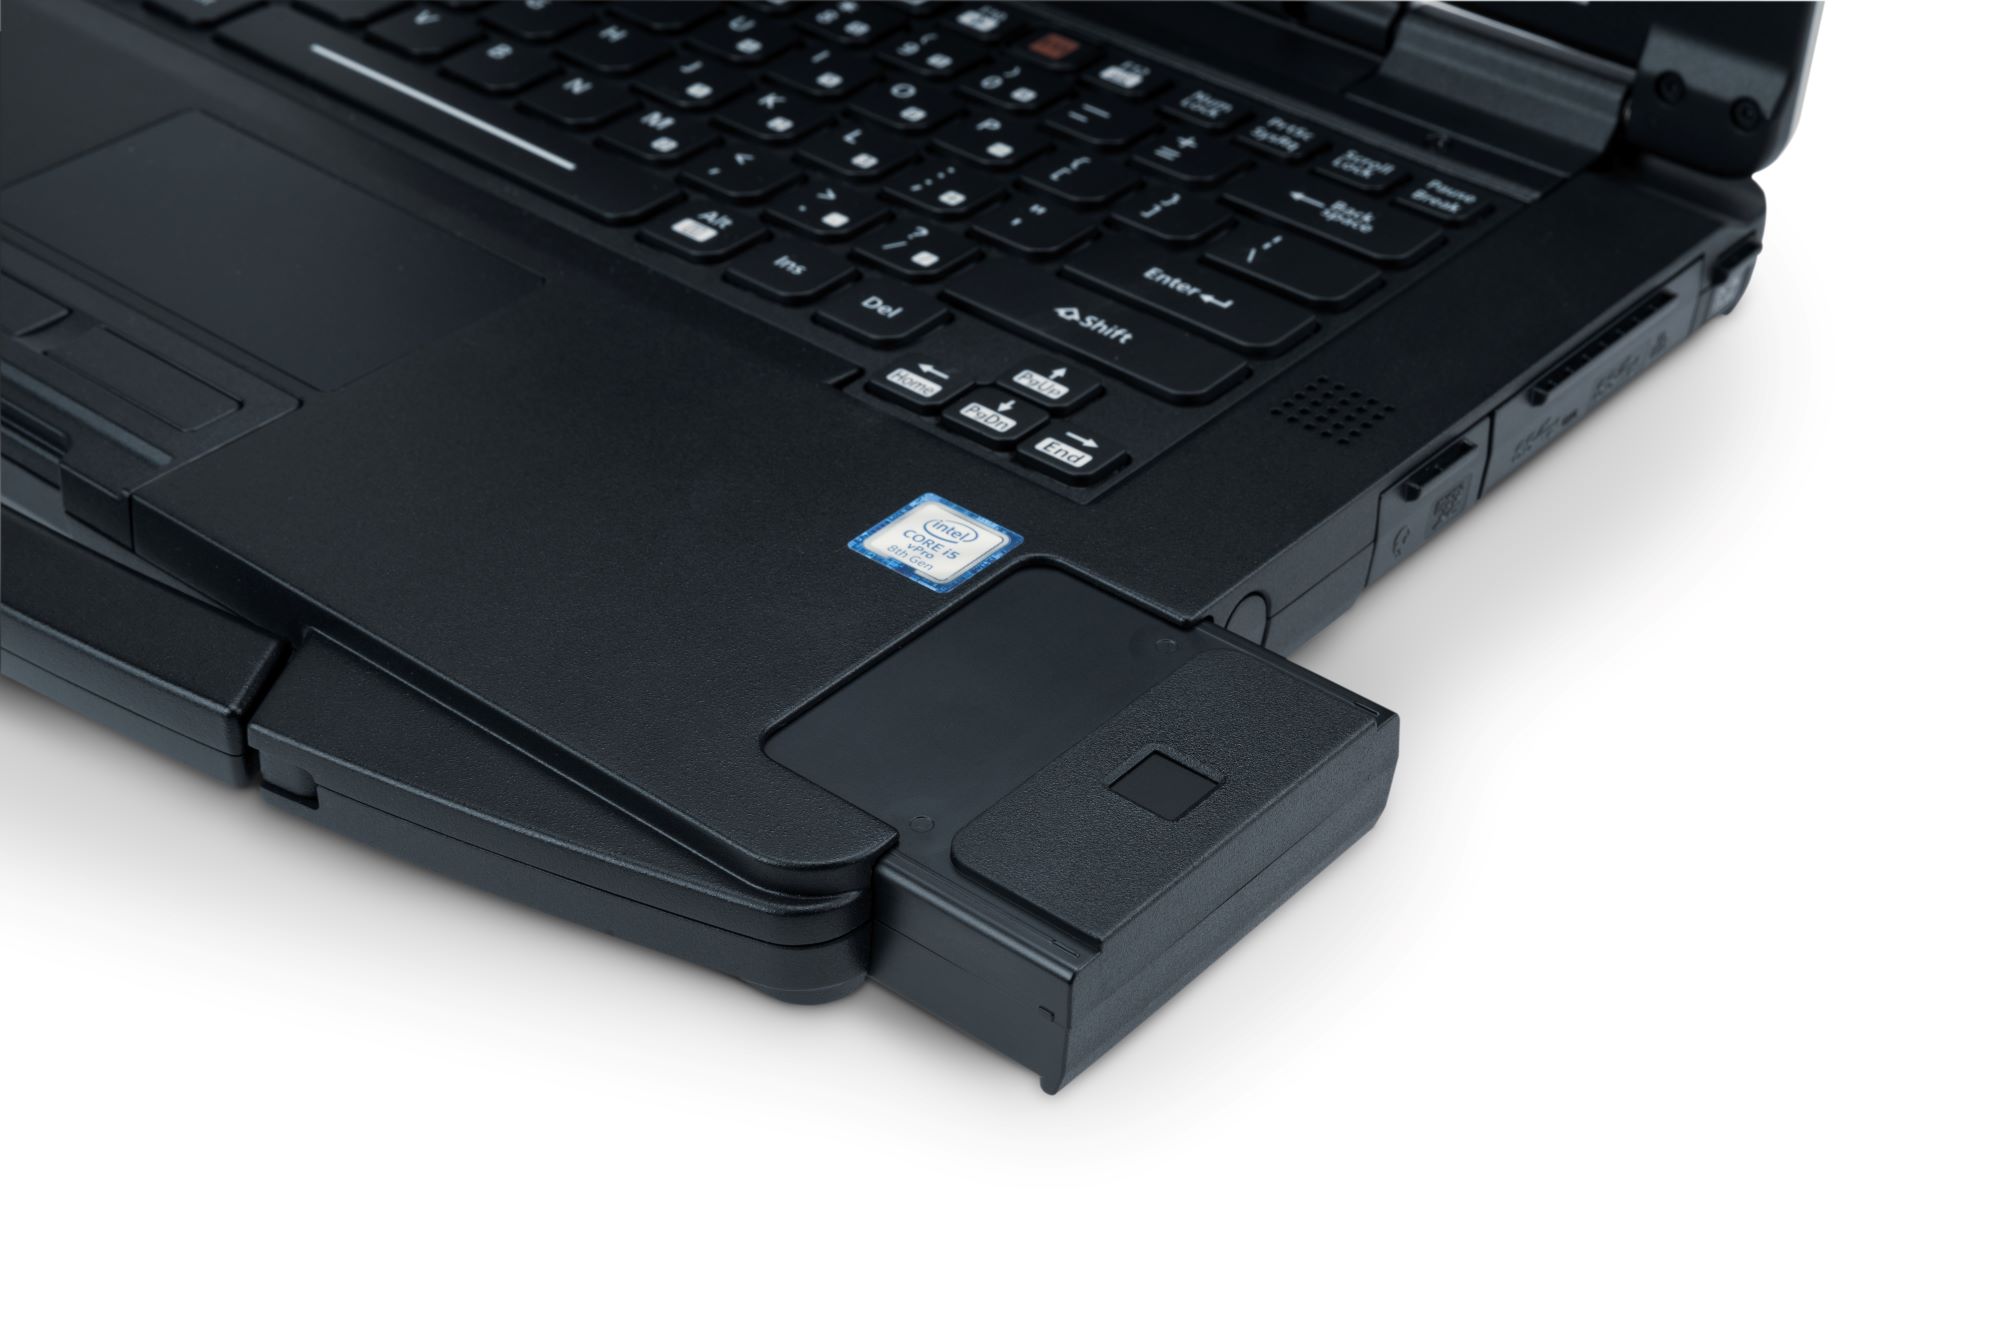
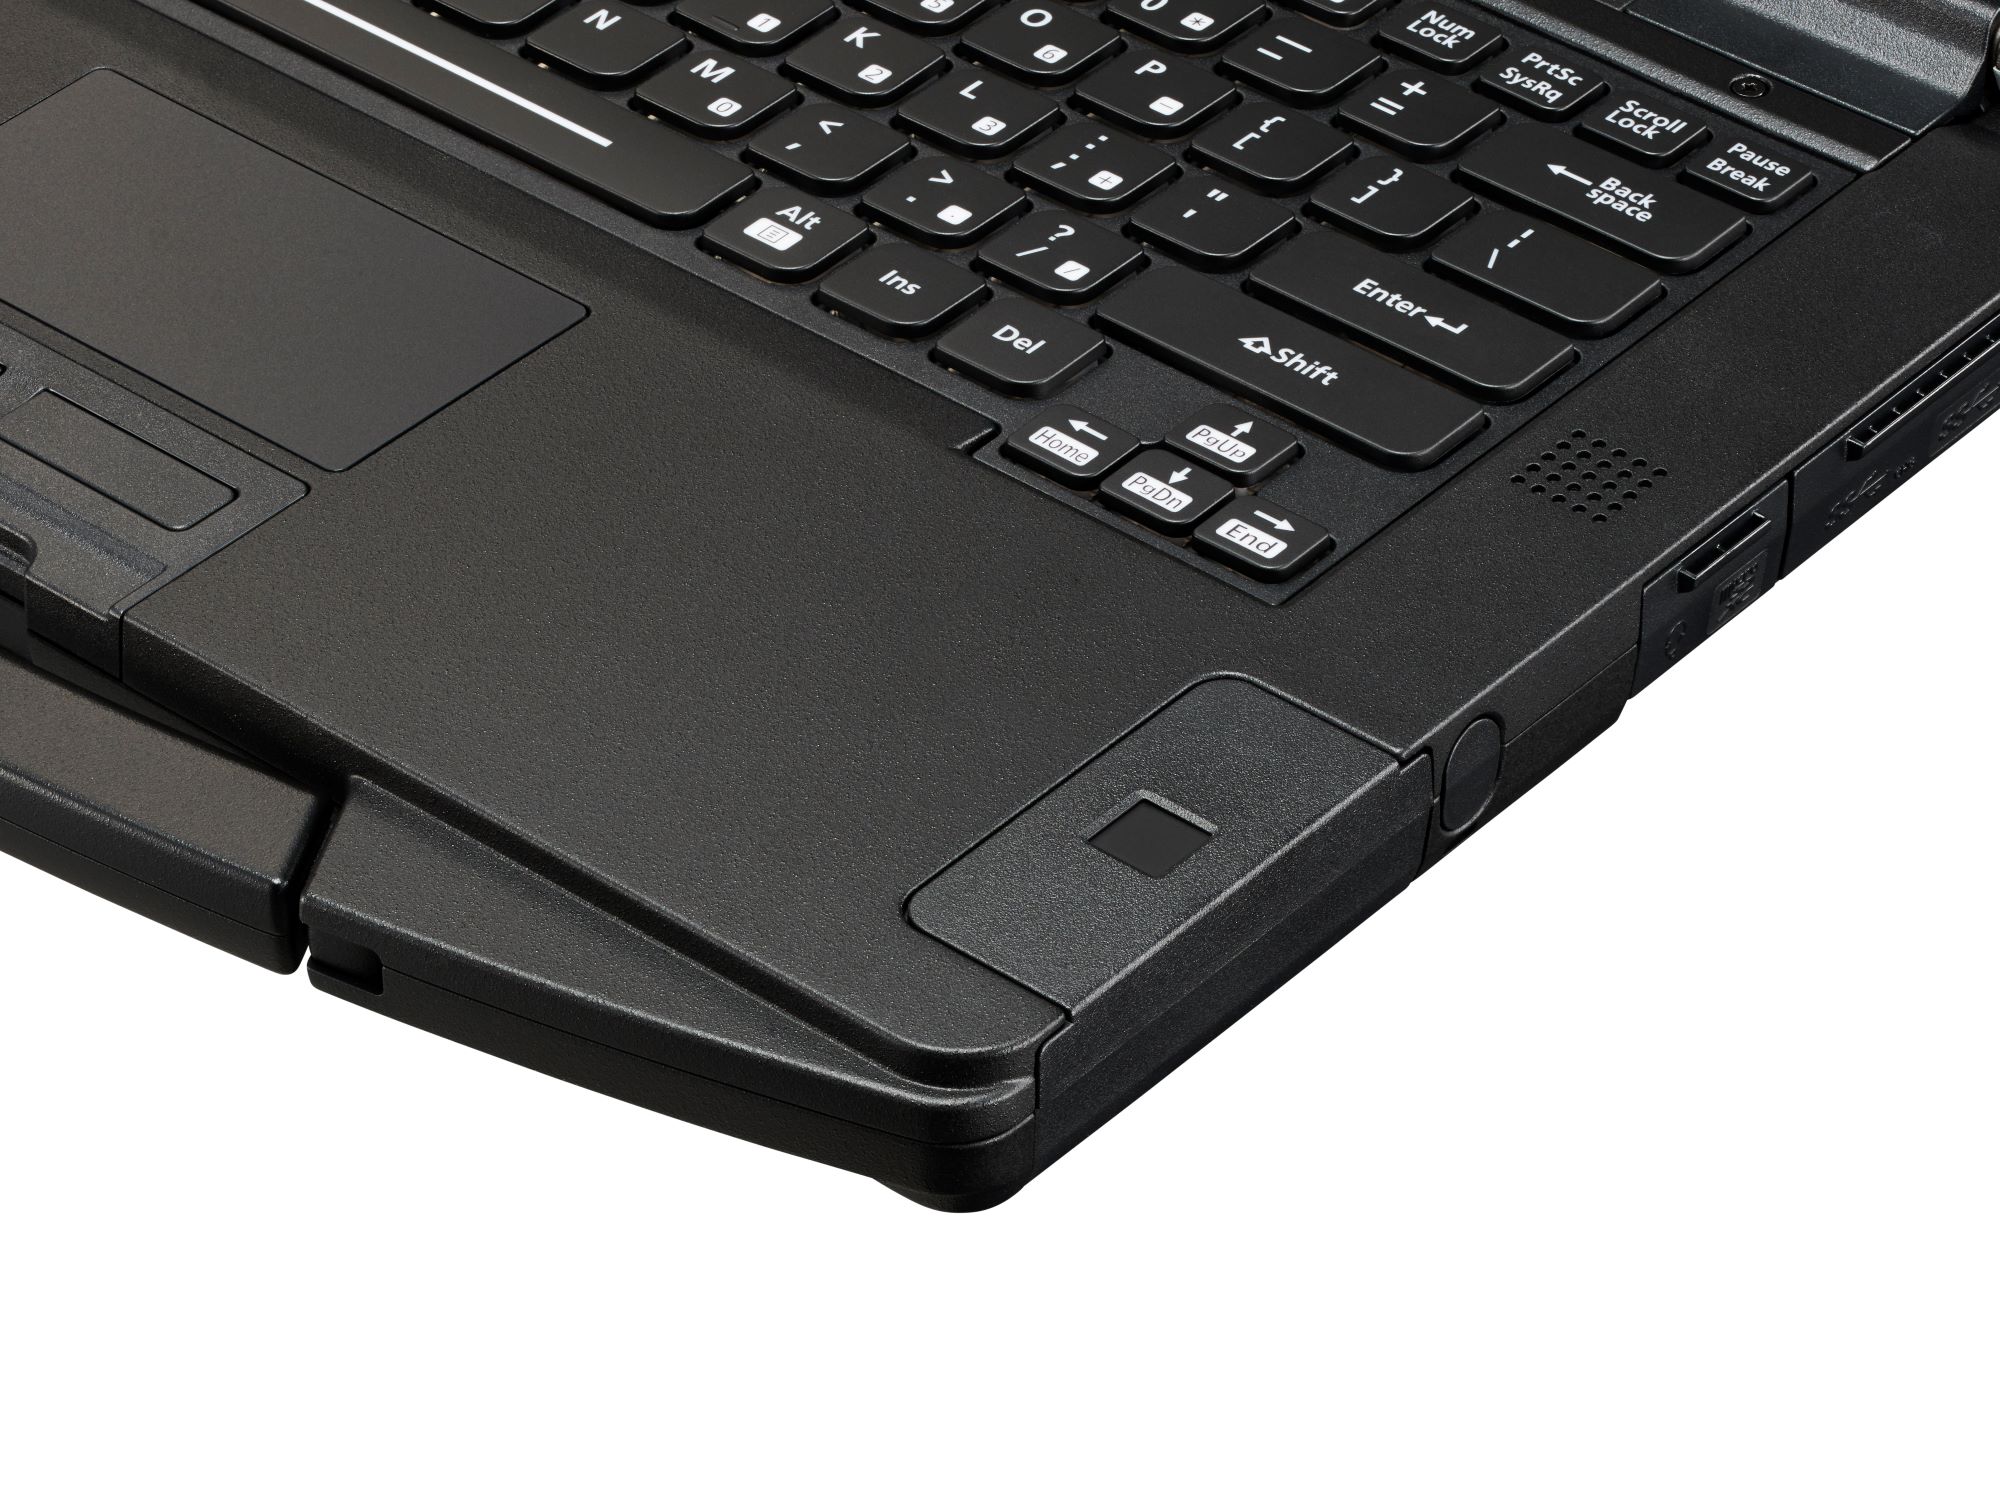
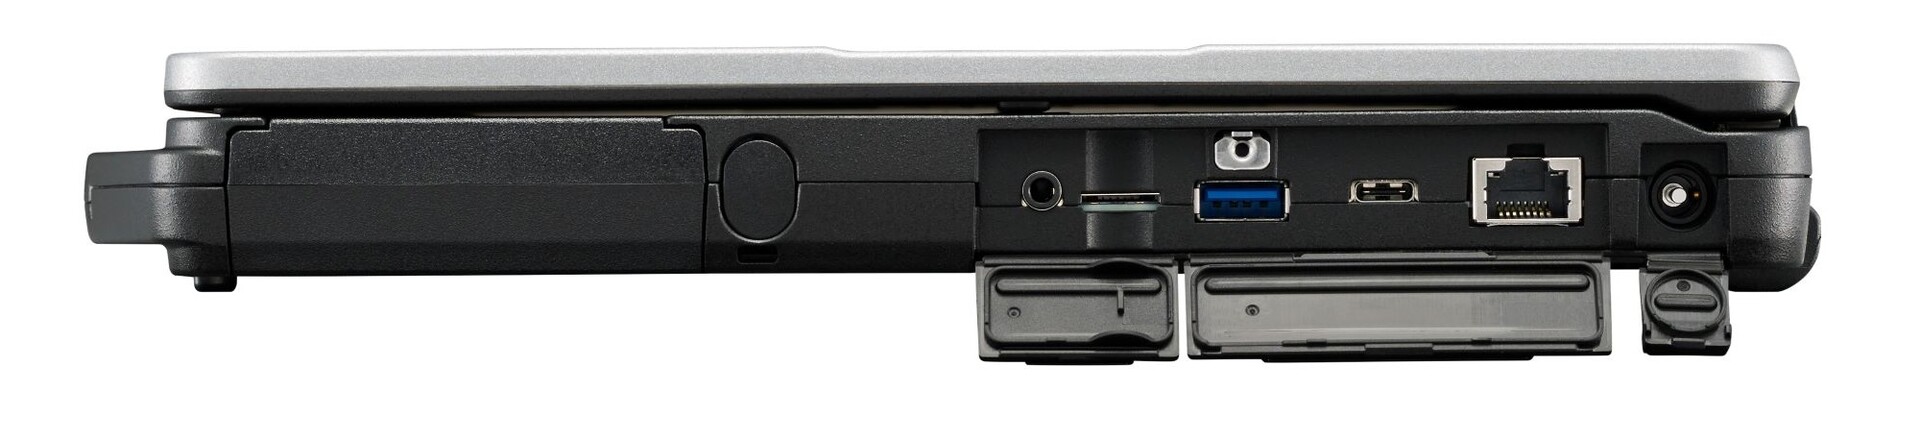
Ci sono aspetti che pensiamo potrebbero essere migliori. Il lettore MicroSD più lento è un downgrade rispetto al modello di ultima generazione e i piccoli tasti freccia sono troppo stretti. Alcune caratteristiche che sono di serie sulla maggior parte degli Ultrabooks sono opzionali sul Toughbook, tra cui USB Type-C PD e un lettore di impronte digitali. Altre caratteristiche sono completamente mancanti come Thunderbolt 3, 4K UHD e NFC. Inoltre, il display luminoso potrebbe essere meno sgranato con colori più profondi, senza PWM, e leggero effetto bleeding irregolare della retroilluminazione per una migliore esperienza visiva.
Il Toughbook 55 è ideale per la sua autonomia, il display luminoso, la vasta gamma di accessori e la facilità di manutenzione. Basta non aspettarsi i migliori colori o prestazioni elevate, poiché le opzioni del processore sono limitate alla famiglia di processori Intel di classe U con una GPU Radeon opzionale di tre anni fa.
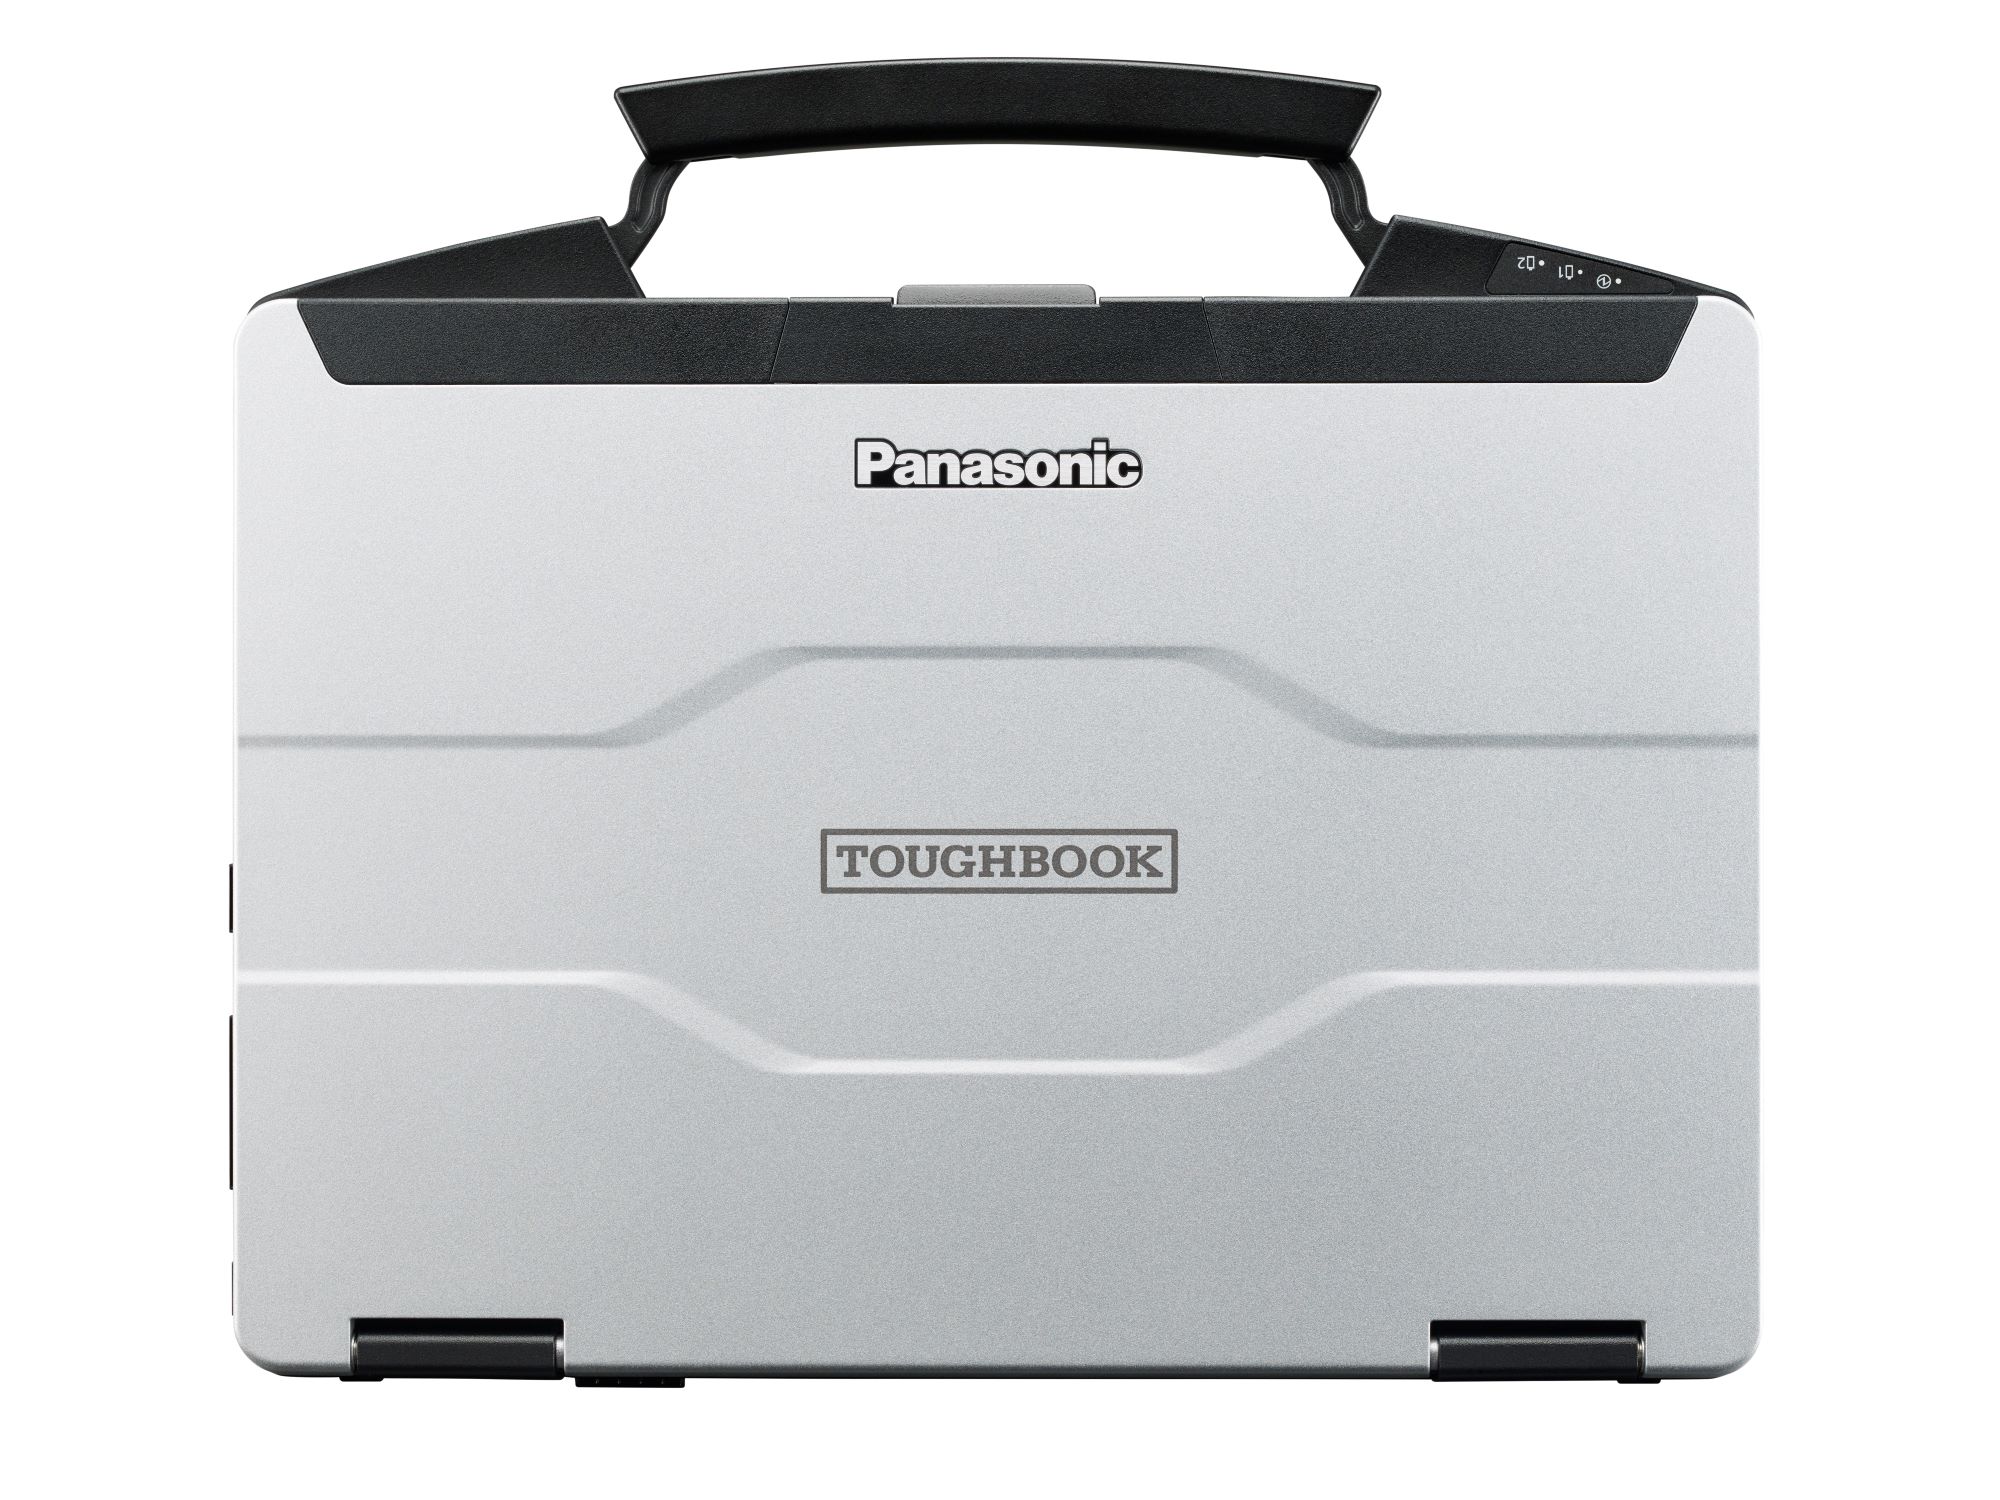
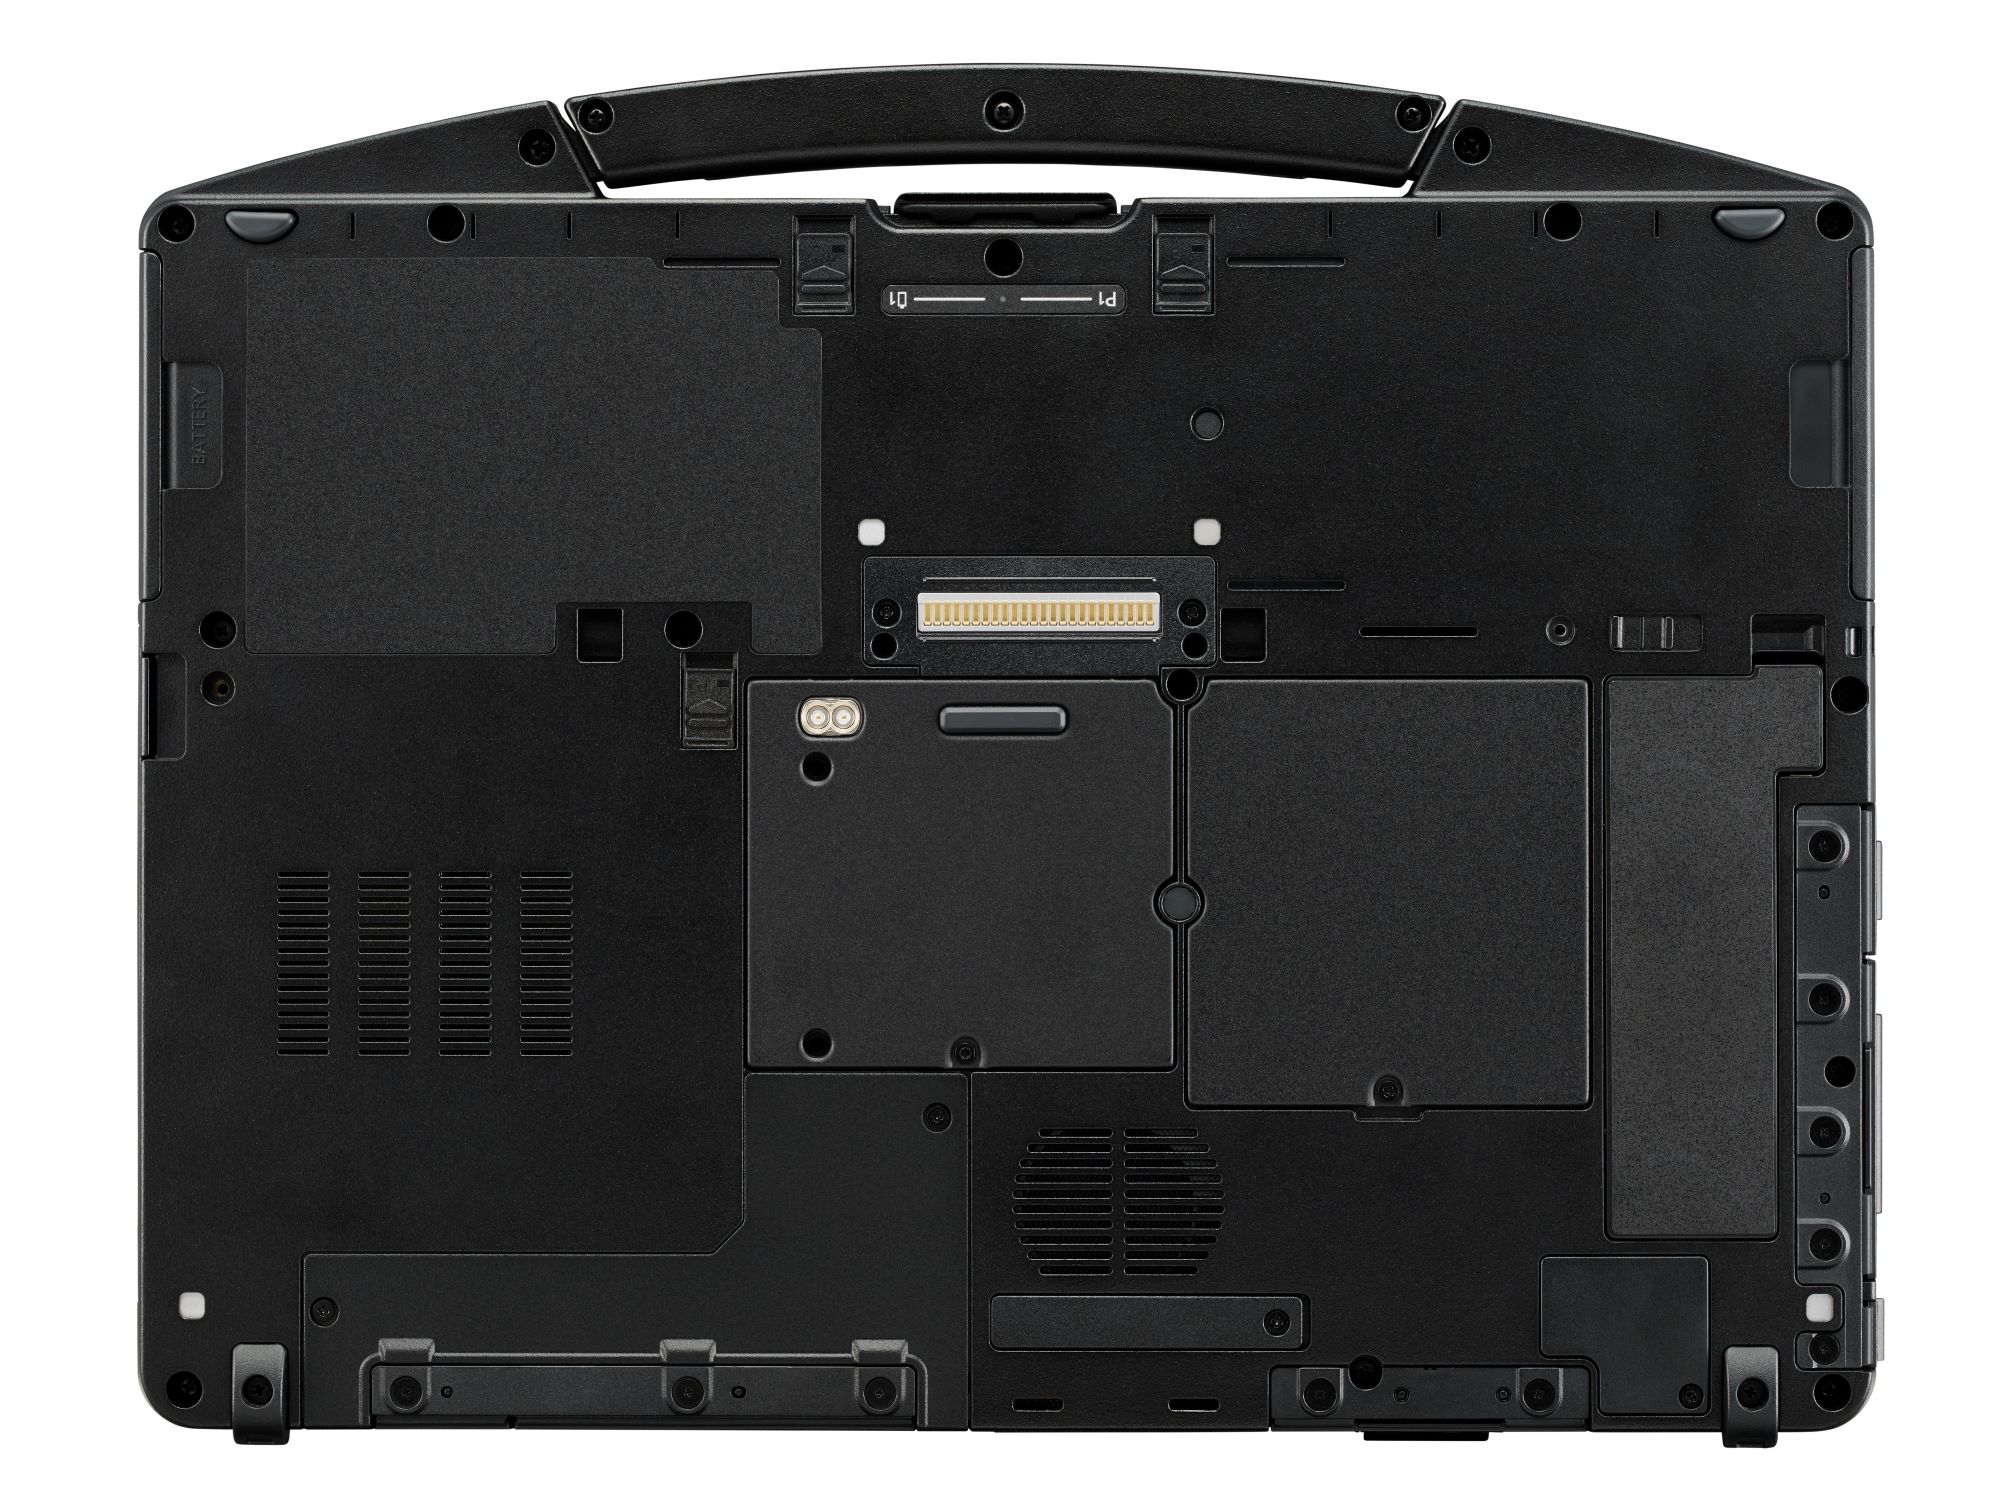
Panasonic Toughbook FZ-55
- 05/14/2020 v7 (old)
Allen Ngo
