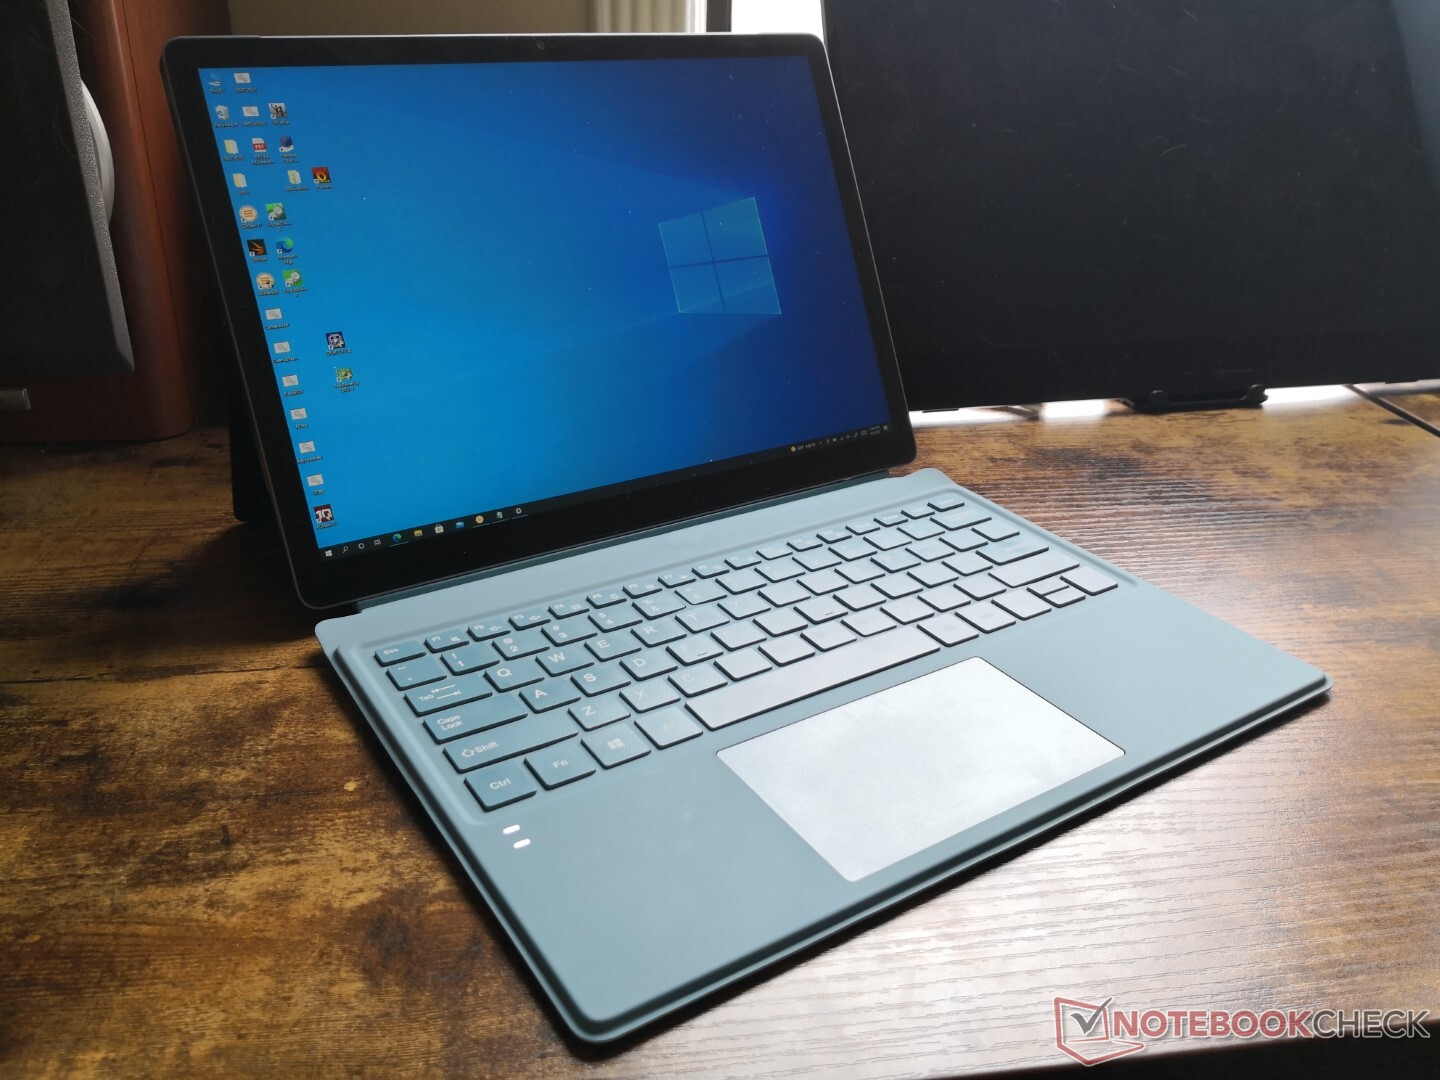
Recensione del KUU LeBook 12.6 convertibile 2-in-1: Un'alternativa più economica al Microsoft Surface Pro
Confronto con i potenziali concorrenti
Punteggio | Data | Modello | Peso | Altezza | Dimensione | Risoluzione | Prezzo |
|---|---|---|---|---|---|---|---|
| 75.3 % v7 (old) | 09/2021 | Kuu LeBook 12.6 Core i7-8550U i5-8550U, UHD Graphics 620 | 859 gr | 9.5 mm | 12.60" | 2160x1440 | |
| 88.5 % v7 (old) | 04/2021 | Lenovo ThinkPad X12 20UVS03G00 i7-1160G7, Iris Xe G7 96EUs | 1.1 kg | 14.5 mm | 12.30" | 1920x1280 | |
| 88.5 % v7 (old) | 03/2021 | Microsoft Surface Pro 7 Plus i5-1135G7, Iris Xe G7 80EUs | 796 gr | 8.5 mm | 12.30" | 2736x1824 | |
| 89.5 % v7 (old) | 03/2021 | Dell Latitude 12 7210 2-in-1 i7-10610U, UHD Graphics 620 | 850 gr | 9.35 mm | 12.30" | 1920x1280 | |
| 84.6 % v7 (old) | 10/2020 | Microsoft Surface Laptop Go Core i5 i5-1035G1, UHD Graphics G1 (Ice Lake 32 EU) | 1.1 kg | 15.69 mm | 12.40" | 1536x1024 | |
| 77.1 % v6 (old) | 01/2019 | NuVision Encite Book 12 Plus Celeron N3350, HD Graphics 500 | 1 kg | 15 mm | 12.50" | 2560x1440 |


| |||||||||||||||||||||||||
Distribuzione della luminosità: 87 %
Al centro con la batteria: 269.7 cd/m²
Contrasto: 586:1 (Nero: 0.46 cd/m²)
ΔE ColorChecker Calman: 3.72 | ∀{0.5-29.43 Ø4.71}
calibrated: 1.27
ΔE Greyscale Calman: 2.3 | ∀{0.09-98 Ø4.96}
65.3% AdobeRGB 1998 (Argyll 3D)
89.1% sRGB (Argyll 3D)
68.8% Display P3 (Argyll 3D)
Gamma: 2.23
CCT: 6910 K
| Kuu LeBook 12.6 Core i7-8550U BOE TV126WTM-NU0, IPS, 12.6", 2160x1440 | Lenovo ThinkPad X12 20UVS03G00 N123NCA-GS1, a-Si IPS LED, 12.3", 1920x1280 | Microsoft Surface Pro 7 Plus LG Philips LP123WQ332684, IPS, 12.3", 2736x1824 | Dell Latitude 12 7210 2-in-1 Sharp LQ123N1, IPS, 12.3", 1920x1280 | Microsoft Surface Laptop Go Core i5 LG Philips LP125WX112403, IPS, 12.4", 1536x1024 | NuVision Encite Book 12 Plus Sharp SHP142C, IPS, 12.5", 2560x1440 | |
|---|---|---|---|---|---|---|
| Display | 4% | 4% | 4% | 0% | 12% | |
| Display P3 Coverage (%) | 68.8 | 67 -3% | 66.9 -3% | 67.9 -1% | 64.4 -6% | 74.8 9% |
| sRGB Coverage (%) | 89.1 | 99.2 11% | 96.7 9% | 96.8 9% | 94.6 6% | 98.9 11% |
| AdobeRGB 1998 Coverage (%) | 65.3 | 68.8 5% | 69.1 6% | 68.8 5% | 65.7 1% | 75.6 16% |
| Response Times | -29% | -11% | 42% | 15% | 8% | |
| Response Time Grey 50% / Grey 80% * (ms) | 42 ? | 63.2 ? -50% | 50.8 ? -21% | 29 ? 31% | 34.8 ? 17% | 37.6 ? 10% |
| Response Time Black / White * (ms) | 33.2 ? | 36 ? -8% | 33.6 ? -1% | 16 ? 52% | 29.2 ? 12% | 31.6 ? 5% |
| PWM Frequency (Hz) | 199.2 ? | 1250 ? | 21930 ? | 198.4 ? | ||
| Screen | 70% | 45% | 38% | 44% | 4% | |
| Brightness middle (cd/m²) | 269.7 | 419 55% | 408 51% | 380 41% | 354.3 31% | 431.5 60% |
| Brightness (cd/m²) | 256 | 406 59% | 425 66% | 378 48% | 353 38% | 406 59% |
| Brightness Distribution (%) | 87 | 94 8% | 85 -2% | 86 -1% | 95 9% | 80 -8% |
| Black Level * (cd/m²) | 0.46 | 0.23 50% | 0.34 26% | 0.31 33% | 0.29 37% | 0.43 7% |
| Contrast (:1) | 586 | 1822 211% | 1200 105% | 1226 109% | 1222 109% | 1003 71% |
| Colorchecker dE 2000 * | 3.72 | 1.1 70% | 1.5 60% | 2.28 39% | 1.41 62% | 3.56 4% |
| Colorchecker dE 2000 max. * | 10.49 | 2.2 79% | 2.5 76% | 3.93 63% | 2.96 72% | 7 33% |
| Colorchecker dE 2000 calibrated * | 1.27 | 0.5 61% | 1.4 -10% | 0.97 24% | 1.44 -13% | 3.34 -163% |
| Greyscale dE 2000 * | 2.3 | 1.5 35% | 1.6 30% | 2.56 -11% | 1.2 48% | 2.9 -26% |
| Gamma | 2.23 99% | 2.06 107% | 2.05 107% | 2.32 95% | 2.26 97% | 2.2 100% |
| CCT | 6910 94% | 6524 100% | 6432 101% | 6130 106% | 6600 98% | 6572 99% |
| Color Space (Percent of AdobeRGB 1998) (%) | 62.8 | 63.7 | 63 | 60.2 | 66.7 | |
| Color Space (Percent of sRGB) (%) | 99.2 | 96.8 | 97 | 94.4 | 98.9 | |
| Media totale (Programma / Settaggio) | 15% /
42% | 13% /
28% | 28% /
32% | 20% /
30% | 8% /
6% |
* ... Meglio usare valori piccoli
Tempi di risposta del Display
| ↔ Tempi di risposta dal Nero al Bianco | ||
|---|---|---|
| 33.2 ms ... aumenta ↗ e diminuisce ↘ combinato | ↗ 19.2 ms Incremento | 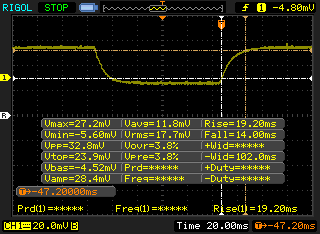 |
| ↘ 14 ms Calo | ||
| Lo schermo mostra tempi di risposta lenti nei nostri tests e sarà insoddisfacente per i gamers. In confronto, tutti i dispositivi di test variano da 0.1 (minimo) a 240 (massimo) ms. » 90 % di tutti i dispositivi è migliore. Questo significa che i tempi di risposta rilevati sono peggiori rispetto alla media di tutti i dispositivi testati (19.8 ms). | ||
| ↔ Tempo di risposta dal 50% Grigio all'80% Grigio | ||
| 42 ms ... aumenta ↗ e diminuisce ↘ combinato | ↗ 22.4 ms Incremento | 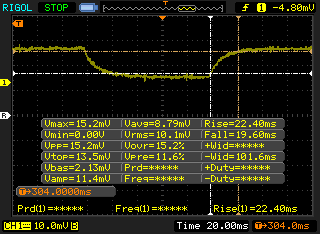 |
| ↘ 19.6 ms Calo | ||
| Lo schermo mostra tempi di risposta lenti nei nostri tests e sarà insoddisfacente per i gamers. In confronto, tutti i dispositivi di test variano da 0.165 (minimo) a 636 (massimo) ms. » 67 % di tutti i dispositivi è migliore. Questo significa che i tempi di risposta rilevati sono peggiori rispetto alla media di tutti i dispositivi testati (31 ms). | ||
Sfarfallio dello schermo / PWM (Pulse-Width Modulation)
| flickering dello schermo / PWM non rilevato | 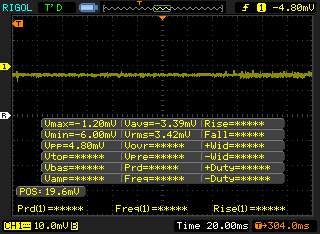 | ||
In confronto: 52 % di tutti i dispositivi testati non utilizza PWM per ridurre la luminosita' del display. Se è rilevato PWM, una media di 7757 (minimo: 5 - massimo: 343500) Hz è stata rilevata. | |||
Cinebench R15 Multi Loop
Cinebench R23: Multi Core | Single Core
Cinebench R15: CPU Multi 64Bit | CPU Single 64Bit
Blender: v2.79 BMW27 CPU
7-Zip 18.03: 7z b 4 -mmt1 | 7z b 4
Geekbench 5.5: Single-Core | Multi-Core
HWBOT x265 Benchmark v2.2: 4k Preset
LibreOffice : 20 Documents To PDF
R Benchmark 2.5: Overall mean
| Cinebench R23 / Multi Core | |
| Framework Laptop 13.5 | |
| Microsoft Surface Pro 7 Plus | |
| Dell Latitude 12 7210 2-in-1 | |
| Lenovo ThinkPad X12 20UVS03G00 | |
| Kuu LeBook 12.6 Core i7-8550U | |
| Media Intel Core i7-8550U (n=1) | |
| Teclast F7 Air | |
| Cinebench R23 / Single Core | |
| Framework Laptop 13.5 | |
| Microsoft Surface Pro 7 Plus | |
| Dell Latitude 12 7210 2-in-1 | |
| Lenovo ThinkPad X12 20UVS03G00 | |
| Kuu LeBook 12.6 Core i7-8550U | |
| Media Intel Core i7-8550U (n=1) | |
| Teclast F7 Air | |
Cinebench R23: Multi Core | Single Core
Cinebench R15: CPU Multi 64Bit | CPU Single 64Bit
Blender: v2.79 BMW27 CPU
7-Zip 18.03: 7z b 4 -mmt1 | 7z b 4
Geekbench 5.5: Single-Core | Multi-Core
HWBOT x265 Benchmark v2.2: 4k Preset
LibreOffice : 20 Documents To PDF
R Benchmark 2.5: Overall mean
* ... Meglio usare valori piccoli
| PCMark 10 / Score | |
| Lenovo ThinkPad X12 20UVS03G00 | |
| Dell Latitude 12 7210 2-in-1 | |
| Microsoft Surface Pro 7 Plus | |
| Kuu LeBook 12.6 Core i7-8550U | |
| Media Intel Core i7-8550U, Intel UHD Graphics 620 (2629 - 4072, n=31) | |
| Microsoft Surface Laptop Go Core i5 | |
| NuVision Encite Book 12 Plus | |
| PCMark 10 / Essentials | |
| Lenovo ThinkPad X12 20UVS03G00 | |
| Dell Latitude 12 7210 2-in-1 | |
| Microsoft Surface Pro 7 Plus | |
| Microsoft Surface Laptop Go Core i5 | |
| Media Intel Core i7-8550U, Intel UHD Graphics 620 (6628 - 9291, n=29) | |
| Kuu LeBook 12.6 Core i7-8550U | |
| NuVision Encite Book 12 Plus | |
| PCMark 10 / Productivity | |
| Dell Latitude 12 7210 2-in-1 | |
| Kuu LeBook 12.6 Core i7-8550U | |
| Media Intel Core i7-8550U, Intel UHD Graphics 620 (4889 - 7006, n=29) | |
| Lenovo ThinkPad X12 20UVS03G00 | |
| Microsoft Surface Pro 7 Plus | |
| Microsoft Surface Laptop Go Core i5 | |
| NuVision Encite Book 12 Plus | |
| PCMark 10 / Digital Content Creation | |
| Lenovo ThinkPad X12 20UVS03G00 | |
| Microsoft Surface Pro 7 Plus | |
| Dell Latitude 12 7210 2-in-1 | |
| Microsoft Surface Laptop Go Core i5 | |
| Media Intel Core i7-8550U, Intel UHD Graphics 620 (1506 - 3160, n=29) | |
| Kuu LeBook 12.6 Core i7-8550U | |
| NuVision Encite Book 12 Plus | |
| PCMark 10 Score | 3645 punti | |
Aiuto | ||
| DPC Latencies / LatencyMon - interrupt to process latency (max), Web, Youtube, Prime95 | |
| Dell Latitude 12 7210 2-in-1 | |
| Kuu LeBook 12.6 Core i7-8550U | |
| Microsoft Surface Laptop Go Core i5 | |
| Lenovo ThinkPad X12 20UVS03G00 | |
| Microsoft Surface Pro 7 Plus | |
* ... Meglio usare valori piccoli
| Kuu LeBook 12.6 Core i7-8550U KUU-512GB | Lenovo ThinkPad X12 20UVS03G00 Toshiba BG4 KBG40ZNT512G | Microsoft Surface Pro 7 Plus Samsung PM991 MZ9LQ256HBJQ | Dell Latitude 12 7210 2-in-1 WDC PC SN530 SDBPTPZ-512G | Microsoft Surface Laptop Go Core i5 SK hynix BC501 HFM256GDGTNG | NuVision Encite Book 12 Plus SanDisk DF4064 | |
|---|---|---|---|---|---|---|
| AS SSD | 121% | 171% | 268% | 85% | -127% | |
| Seq Read (MB/s) | 503 | 1760 250% | 1725 243% | 2185 334% | 1347 168% | 154 -69% |
| Seq Write (MB/s) | 421.1 | 761 81% | 931 121% | 1731 311% | 491 17% | 102.4 -76% |
| 4K Read (MB/s) | 19.23 | 47.68 148% | 50.1 161% | 46.28 141% | 38.08 98% | 5.07 -74% |
| 4K Write (MB/s) | 78.1 | 176 125% | 136.9 75% | 161.6 107% | 98.2 26% | 8.42 -89% |
| 4K-64 Read (MB/s) | 133.6 | 581 335% | 870 551% | 1021 664% | 483.1 262% | 27.74 -79% |
| 4K-64 Write (MB/s) | 222.3 | 118.5 -47% | 762 243% | 1125 406% | 350.9 58% | 12.15 -95% |
| Access Time Read * (ms) | 0.091 | 0.155 -70% | 0.279 -207% | 0.069 24% | 0.057 37% | 0.747 -721% |
| Access Time Write * (ms) | 0.558 | 0.188 66% | 0.028 95% | 0.046 92% | 0.105 81% | 1.136 -104% |
| Score Read (Points) | 203 | 805 297% | 1093 438% | 1286 533% | 656 223% | 48 -76% |
| Score Write (Points) | 342 | 371 8% | 992 190% | 1460 327% | 498 46% | 31 -91% |
| Score Total (Points) | 653 | 1551 138% | 2616 301% | 3389 419% | 1458 123% | 103 -84% |
| Copy ISO MB/s (MB/s) | 433.4 | 1174 171% | 1555 259% | 765 77% | 119.7 -72% | |
| Copy Program MB/s (MB/s) | 365.8 | 262.8 -28% | 468.5 28% | 299.6 -18% | 72.8 -80% | |
| Copy Game MB/s (MB/s) | 409.2 | 562 37% | 841 106% | 371.5 -9% | 116.5 -72% | |
| CrystalDiskMark 5.2 / 6 | 98% | 156% | 211% | 93% | -77% | |
| Write 4K (MB/s) | 85.8 | 72.8 -15% | 165.3 93% | 182.7 113% | 87.6 2% | 7.837 -91% |
| Read 4K (MB/s) | 19.22 | 26.35 37% | 42.95 123% | 51.4 167% | 40.41 110% | 7.689 -60% |
| Write Seq (MB/s) | 412.7 | 823 99% | 955 131% | 1303 216% | 601 46% | 104.9 -75% |
| Read Seq (MB/s) | 518 | 1169 126% | 867 67% | 1450 180% | 1033 99% | 167.8 -68% |
| Write 4K Q32T1 (MB/s) | 201 | 112.6 -44% | 423.5 111% | 342.9 71% | 269.1 34% | 13.64 -93% |
| Read 4K Q32T1 (MB/s) | 125.6 | 327.2 161% | 479.2 282% | 523 316% | 261.4 108% | 32.95 -74% |
| Write Seq Q32T1 (MB/s) | 451.1 | 1039 130% | 1060 135% | 1776 294% | 818 81% | 99.5 -78% |
| Read Seq Q32T1 (MB/s) | 556 | 2176 291% | 2251 305% | 2378 328% | 2025 264% | 128.8 -77% |
| Media totale (Programma / Settaggio) | 110% /
111% | 164% /
165% | 240% /
247% | 89% /
88% | -102% /
-109% |
* ... Meglio usare valori piccoli

Throttling disco: DiskSpd Read Loop, Queue Depth 8
| 3DMark 11 Performance | 1913 punti | |
| 3DMark Cloud Gate Standard Score | 8139 punti | |
| 3DMark Fire Strike Score | 1046 punti | |
| 3DMark Time Spy Score | 427 punti | |
Aiuto | ||
| basso | medio | alto | ultra | |
|---|---|---|---|---|
| Dota 2 Reborn (2015) | 75.3 | 40.9 | 17.9 | 16 |
| Final Fantasy XV Benchmark (2018) | 11.7 | 5.39 | 5.39 | |
| X-Plane 11.11 (2018) | 11.3 | 9.73 | 9.11 |
| Kuu LeBook 12.6 Core i7-8550U UHD Graphics 620, i5-8550U, KUU-512GB | Lenovo ThinkPad X12 20UVS03G00 Iris Xe G7 96EUs, i7-1160G7, Toshiba BG4 KBG40ZNT512G | Microsoft Surface Pro 7 Plus Iris Xe G7 80EUs, i5-1135G7, Samsung PM991 MZ9LQ256HBJQ | Dell Latitude 12 7210 2-in-1 UHD Graphics 620, i7-10610U, WDC PC SN530 SDBPTPZ-512G | Microsoft Surface Laptop Go Core i5 UHD Graphics G1 (Ice Lake 32 EU), i5-1035G1, SK hynix BC501 HFM256GDGTNG | |
|---|---|---|---|---|---|
| Noise | 10% | 14% | 4% | ||
| off /ambiente * (dB) | 23.8 | 25.1 -5% | 25 -5% | 26.4 -11% | |
| Idle Minimum * (dB) | 23.8 | 25.1 -5% | 25 -5% | 26.4 -11% | |
| Idle Average * (dB) | 23.8 | 25.1 -5% | 25 -5% | 26.4 -11% | |
| Idle Maximum * (dB) | 41.1 | 26 37% | 25 39% | 26.4 36% | |
| Load Average * (dB) | 44.5 | 34.6 22% | 28.7 36% | 36.9 17% | |
| Load Maximum * (dB) | 45 | 37 18% | 34.5 23% | 44.2 2% | |
| Witcher 3 ultra * (dB) | 34.6 |
* ... Meglio usare valori piccoli
Rumorosità
| Idle |
| 23.8 / 23.8 / 41.1 dB(A) |
| Sotto carico |
| 44.5 / 45 dB(A) |
 | ||
30 dB silenzioso 40 dB(A) udibile 50 dB(A) rumoroso |
||
min: | ||
(+) La temperatura massima sul lato superiore è di 36.8 °C / 98 F, rispetto alla media di 35.4 °C / 96 F, che varia da 19.6 a 60 °C per questa classe Convertible.
(+) Il lato inferiore si riscalda fino ad un massimo di 39.8 °C / 104 F, rispetto alla media di 36.9 °C / 98 F
(±) In idle, la temperatura media del lato superiore è di 34.5 °C / 94 F, rispetto alla media deld ispositivo di 30.3 °C / 87 F.
(+) I poggiapolsi e il touchpad raggiungono la temperatura massima della pelle (32.6 °C / 90.7 F) e quindi non sono caldi.
(-) La temperatura media della zona del palmo della mano di dispositivi simili e'stata di 28 °C / 82.4 F (-4.6 °C / -8.3 F).
Kuu LeBook 12.6 Core i7-8550U analisi audio
(±) | potenza degli altiparlanti media ma buona (72.2 dB)
Bassi 100 - 315 Hz
(-) | quasi nessun basso - in media 28.8% inferiori alla media
(±) | la linearità dei bassi è media (7.9% delta rispetto alla precedente frequenza)
Medi 400 - 2000 Hz
(±) | medi elevati - circa 5.4% superiore alla media
(±) | linearità dei medi adeguata (9.7% delta rispetto alla precedente frequenza)
Alti 2 - 16 kHz
(±) | alti elevati - circa 5.5% superiori alla media
(±) | la linearità degli alti è media (9% delta rispetto alla precedente frequenza)
Nel complesso 100 - 16.000 Hz
(±) | la linearità complessiva del suono è media (29.5% di differenza rispetto alla media
Rispetto alla stessa classe
» 87% di tutti i dispositivi testati in questa classe è stato migliore, 3% simile, 10% peggiore
» Il migliore ha avuto un delta di 6%, medio di 20%, peggiore di 57%
Rispetto a tutti i dispositivi testati
» 87% di tutti i dispositivi testati in questa classe è stato migliore, 3% similare, 10% peggiore
» Il migliore ha avuto un delta di 4%, medio di 23%, peggiore di 134%
Apple MacBook 12 (Early 2016) 1.1 GHz analisi audio
(+) | gli altoparlanti sono relativamente potenti (83.6 dB)
Bassi 100 - 315 Hz
(±) | bassi ridotti - in media 11.3% inferiori alla media
(±) | la linearità dei bassi è media (14.2% delta rispetto alla precedente frequenza)
Medi 400 - 2000 Hz
(+) | medi bilanciati - solo only 2.4% rispetto alla media
(+) | medi lineari (5.5% delta rispetto alla precedente frequenza)
Alti 2 - 16 kHz
(+) | Alti bilanciati - appena 2% dalla media
(+) | alti lineari (4.5% delta rispetto alla precedente frequenza)
Nel complesso 100 - 16.000 Hz
(+) | suono nel complesso lineare (10.2% differenza dalla media)
Rispetto alla stessa classe
» 7% di tutti i dispositivi testati in questa classe è stato migliore, 2% simile, 90% peggiore
» Il migliore ha avuto un delta di 5%, medio di 18%, peggiore di 53%
Rispetto a tutti i dispositivi testati
» 5% di tutti i dispositivi testati in questa classe è stato migliore, 1% similare, 94% peggiore
» Il migliore ha avuto un delta di 4%, medio di 23%, peggiore di 134%
| Off / Standby | |
| Idle | |
| Sotto carico |
|
Leggenda:
min: | |
| Kuu LeBook 12.6 Core i7-8550U i5-8550U, UHD Graphics 620, KUU-512GB, IPS, 2160x1440, 12.6" | Lenovo ThinkPad X12 20UVS03G00 i7-1160G7, Iris Xe G7 96EUs, Toshiba BG4 KBG40ZNT512G, a-Si IPS LED, 1920x1280, 12.3" | Microsoft Surface Pro 7 Plus i5-1135G7, Iris Xe G7 80EUs, Samsung PM991 MZ9LQ256HBJQ, IPS, 2736x1824, 12.3" | Dell Latitude 12 7210 2-in-1 i7-10610U, UHD Graphics 620, WDC PC SN530 SDBPTPZ-512G, IPS, 1920x1280, 12.3" | Microsoft Surface Laptop Go Core i5 i5-1035G1, UHD Graphics G1 (Ice Lake 32 EU), SK hynix BC501 HFM256GDGTNG, IPS, 1536x1024, 12.4" | NuVision Encite Book 12 Plus Celeron N3350, HD Graphics 500, SanDisk DF4064, IPS, 2560x1440, 12.5" | |
|---|---|---|---|---|---|---|
| Power Consumption | 7% | -18% | 19% | 9% | 29% | |
| Idle Minimum * (Watt) | 6.4 | 4 37% | 5.5 14% | 3.2 50% | 2.8 56% | 4.7 27% |
| Idle Average * (Watt) | 8.8 | 5.9 33% | 9.1 -3% | 5.3 40% | 6.8 23% | 7 20% |
| Idle Maximum * (Watt) | 8.9 | 8.3 7% | 10.8 -21% | 8.4 6% | 8 10% | 8 10% |
| Load Average * (Watt) | 33.6 | 30.1 10% | 39.2 -17% | 27 20% | 37.2 -11% | 14.1 58% |
| Load Maximum * (Watt) | 38.9 | 59 -52% | 62.5 -61% | 46.9 -21% | 51.6 -33% | 27.1 30% |
| Witcher 3 ultra * (Watt) | 30.8 |
* ... Meglio usare valori piccoli
Consumo energetico Test Prime95 Stress
| Kuu LeBook 12.6 Core i7-8550U i5-8550U, UHD Graphics 620, 42 Wh | Lenovo ThinkPad X12 20UVS03G00 i7-1160G7, Iris Xe G7 96EUs, 42 Wh | Microsoft Surface Pro 7 Plus i5-1135G7, Iris Xe G7 80EUs, 48.9 Wh | Dell Latitude 12 7210 2-in-1 i7-10610U, UHD Graphics 620, 38 Wh | Microsoft Surface Laptop Go Core i5 i5-1035G1, UHD Graphics G1 (Ice Lake 32 EU), 39 Wh | NuVision Encite Book 12 Plus Celeron N3350, HD Graphics 500, 31.9 Wh | |
|---|---|---|---|---|---|---|
| Autonomia della batteria | 28% | 27% | 28% | 25% | 6% | |
| WiFi v1.3 (h) | 6.4 | 8.2 28% | 8.1 27% | 8.2 28% | 8 25% | 6.8 6% |
| Load (h) | 2 | 3.9 | 1.9 | 2 | 3.6 | |
| Reader / Idle (h) | 13.6 | 22.8 | 35 | 11.3 |
Pro
Contro
Valutazione complessiva del KUU LeBook - Uno dei migliori tablet Windows economici
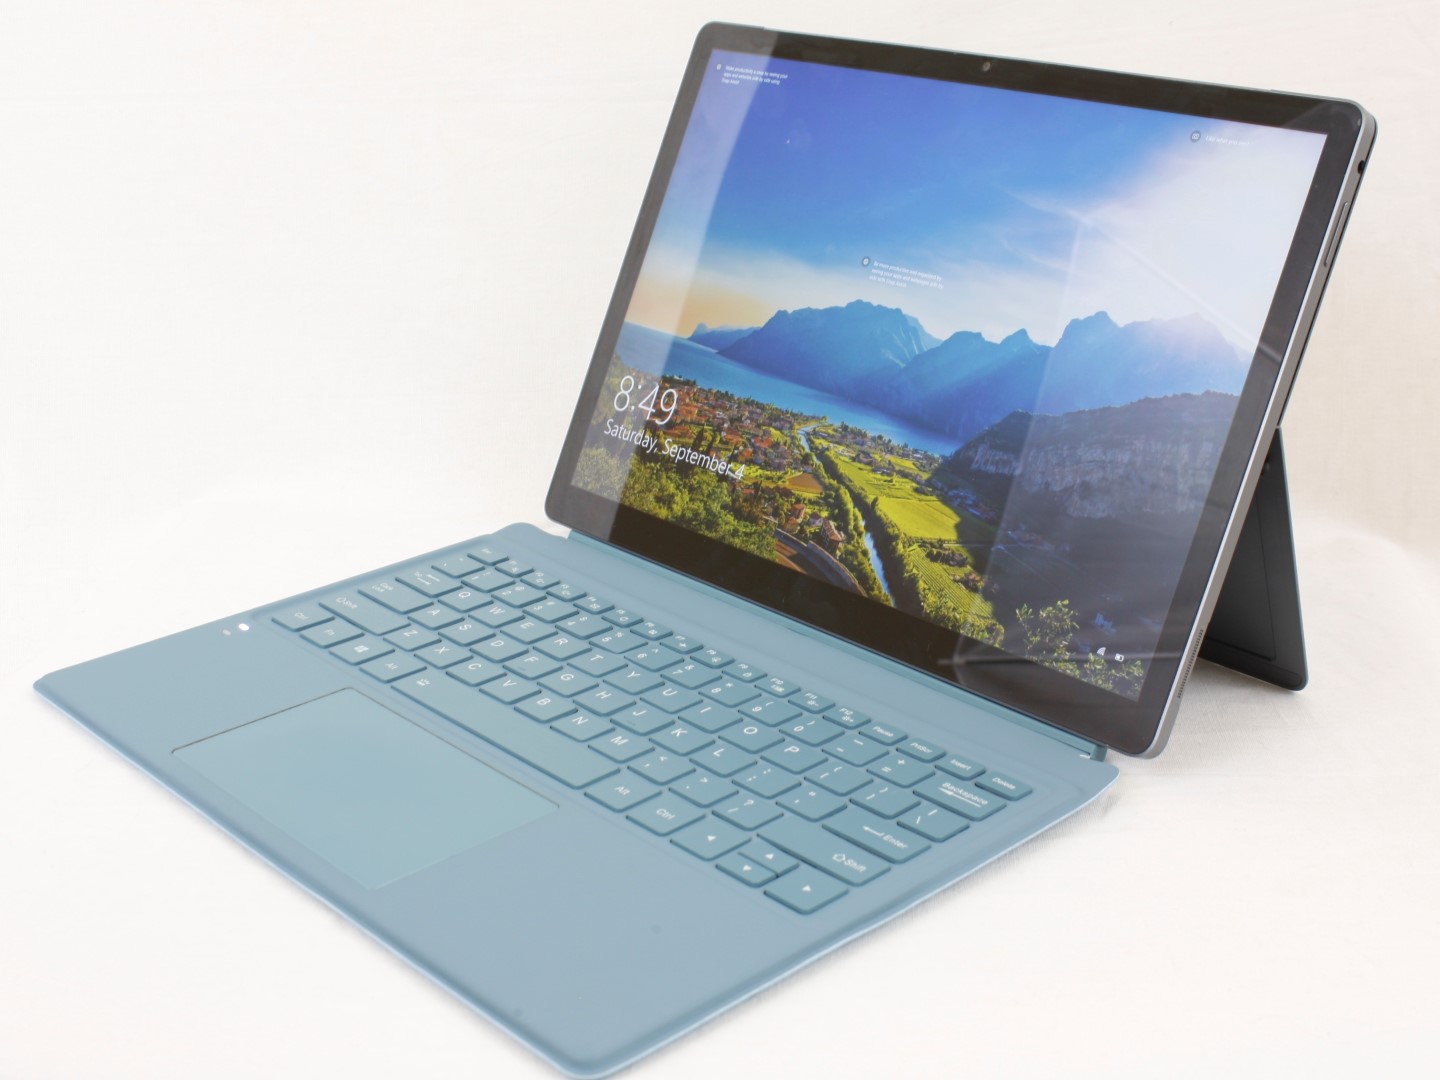
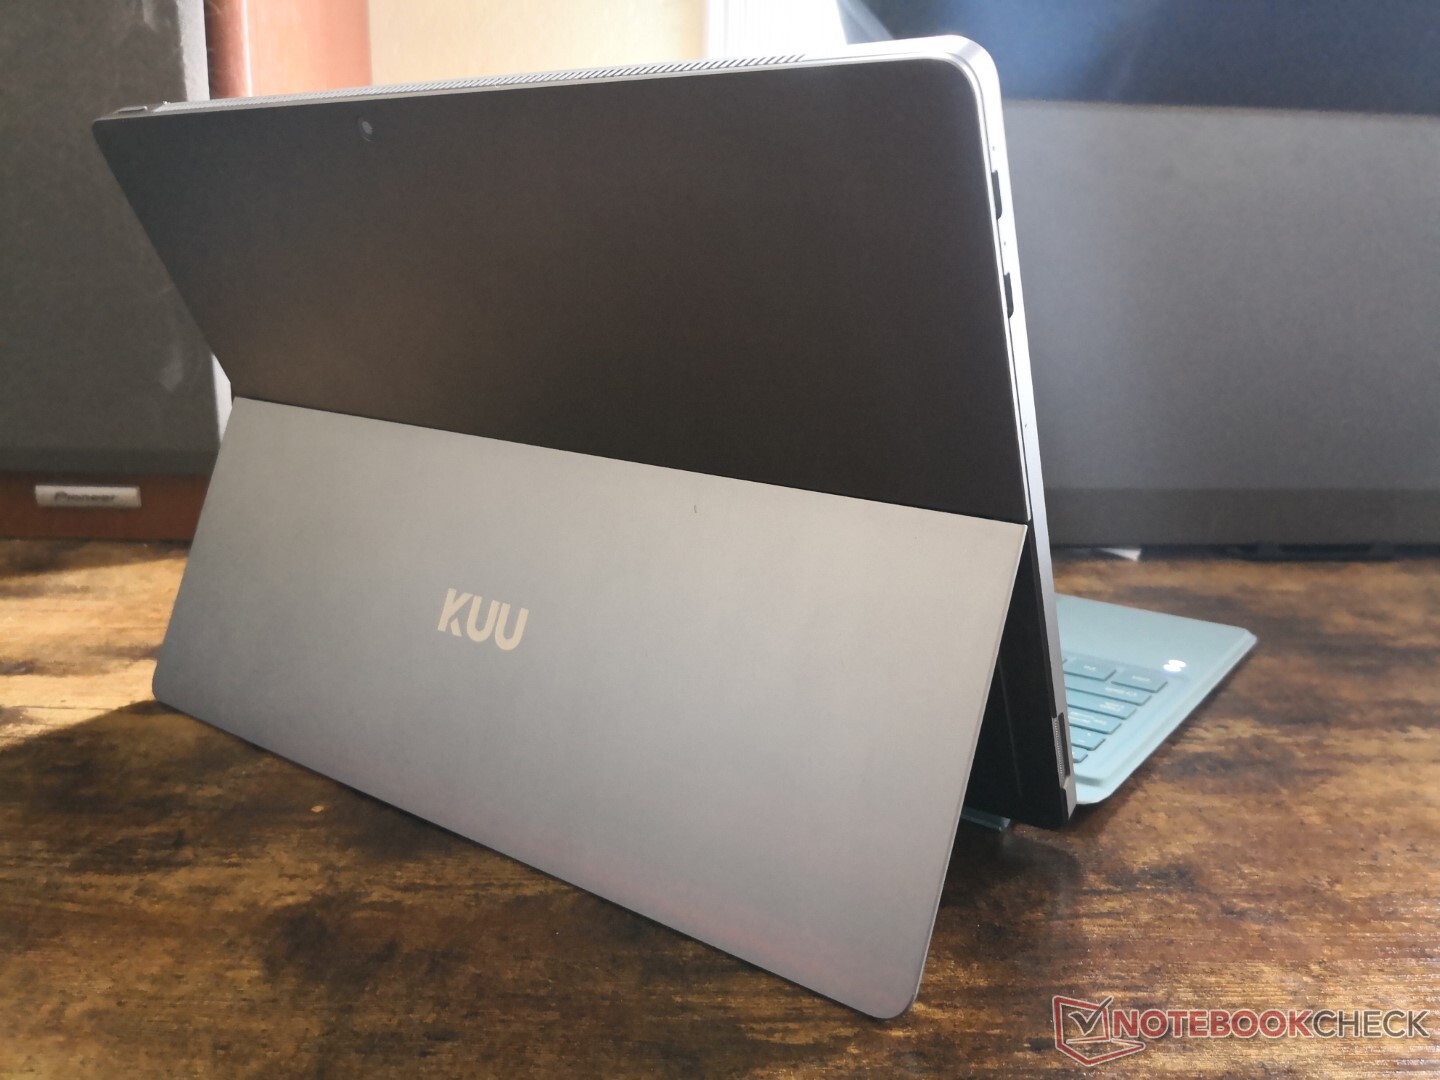
I punti di forza del KUU LeBook sono estetici e tangibili. È un tablet solidamente costruito che potrebbe passare come un modello di punta più costoso come il Surface Pro o HP ElitePad. Dobbiamo anche applaudire il produttore per aver scelto una CPU Core serie U invece di una molto più debole Atom, Celeron o Pentium, come il Surface Go o molti altri tablet Windows più economici nella fascia economica. L'ampio touchscreen da 12,6 pollici e le cornici relativamente strette contribuiscono a rendere il LeBook ancora più attraente.
Sembra e si sente come un tablet di alta qualità con prestazioni rispettabili dalla sua CPU Core serie U. Tuttavia, la base rimbalzante della tastiera e il rumore acuto della ventola sono difficili da ignorare.
I benefici del KUU sono per lo più a fior di pelle, dato che la ventola acuta che pulsa, il display più debole, la batteria più corta e i tasti della tastiera spugnosi ostacolano l'esperienza dell'utente, nonostante quanto sia elegante e liscio lo chassis. Anche se il LeBook non può essere paragonato al Surface Pro in queste aree specifiche, è ancora generalmente migliore di altri tablet Windows economici tra cui l'Asus Transformer Book o Surface Go soprattutto in termini di dimensioni del display e prestazioni.
Kuu LeBook 12.6 Core i7-8550U
- 09/04/2021 v7 (old)
Allen Ngo
Price comparison
