Recensione del portatile Acer Enduro Urban N3 EUN314: In parte rugged, in parte Ultrabook
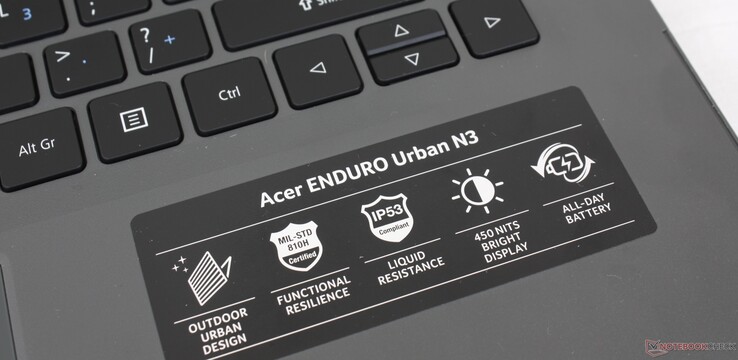
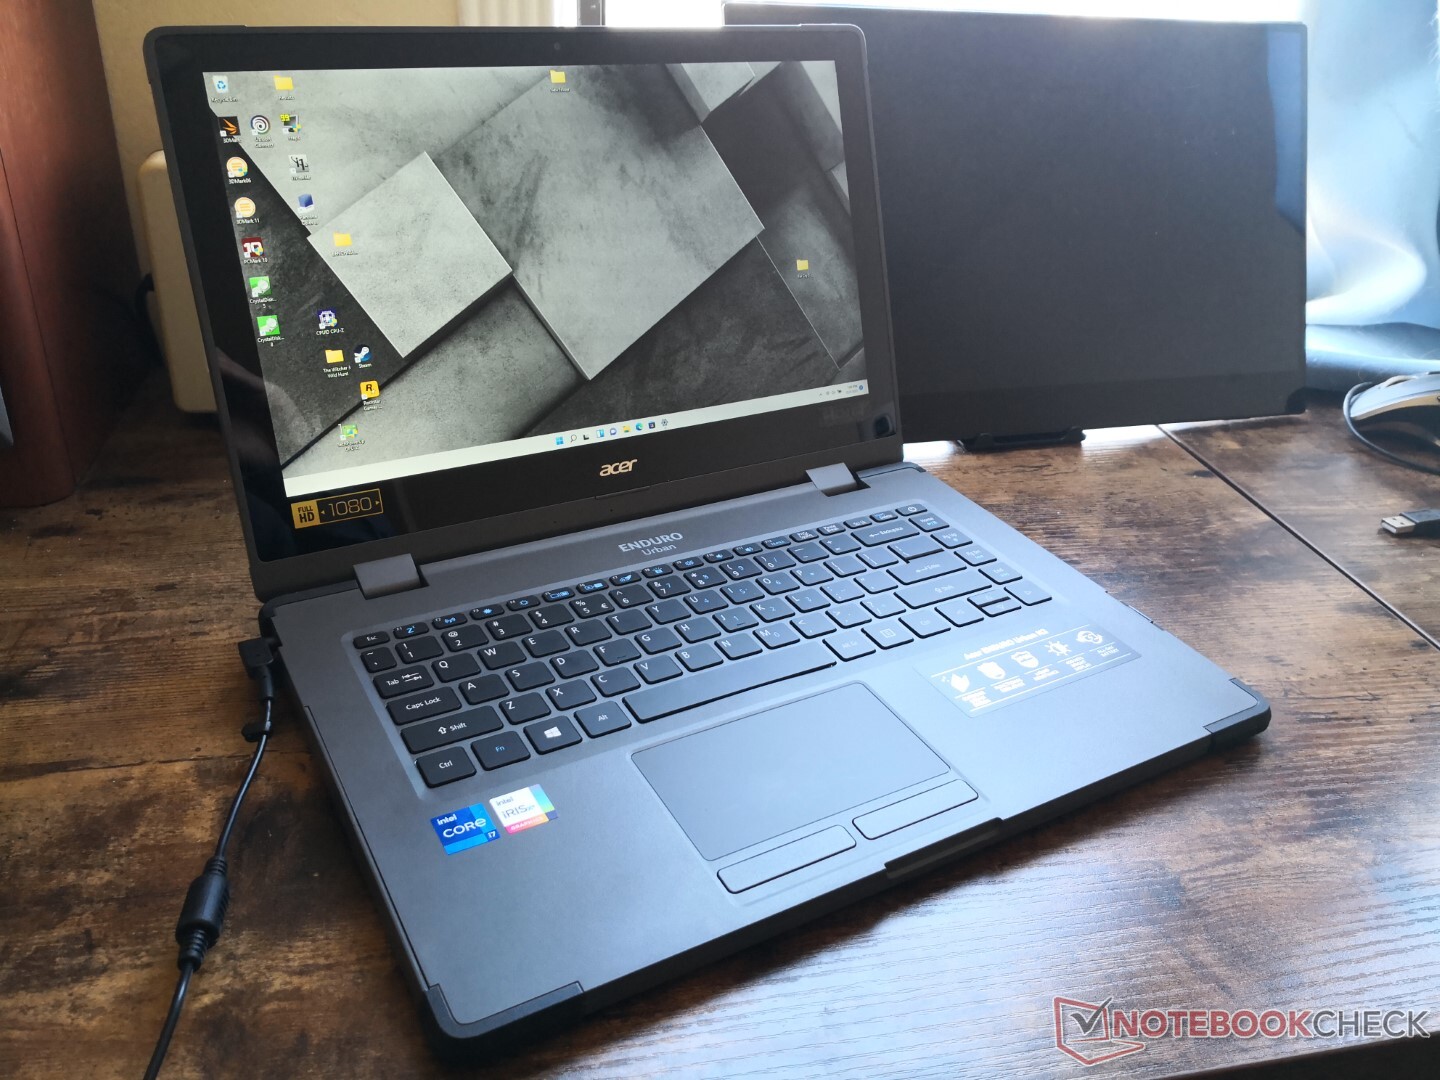
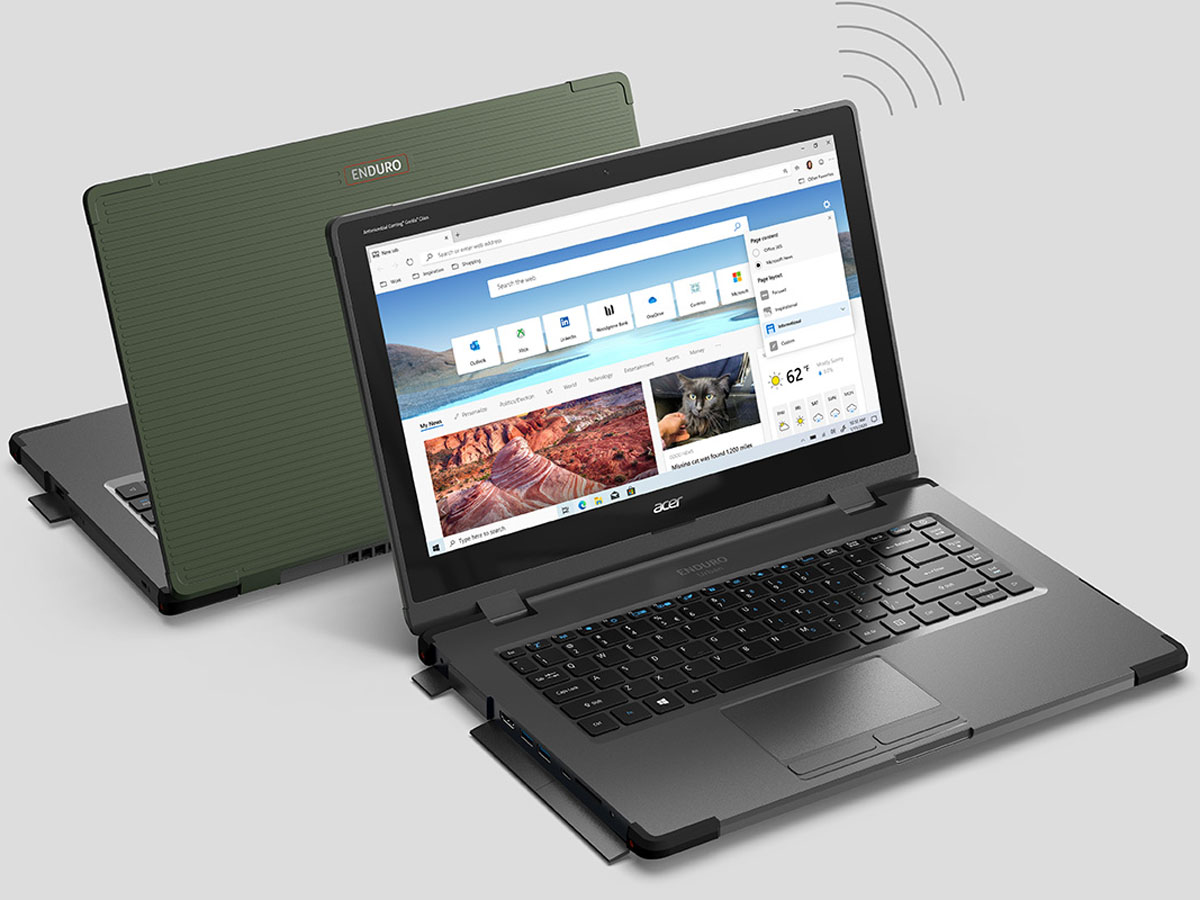
Se un portatile rugged o semi-rugged e un Ultrabook avessero un figlio, allora probabilmente assomiglierebbe molto all'Acer Enduro Urban N3. Questo portatile da 14 pollici integra alcune caratteristiche comuni dei portatili rugged, tra cui paraurti ammortizzanti e porte I/O resistenti all'acqua, pur mantenendo la portabilità di un Ultrabook tradizionale
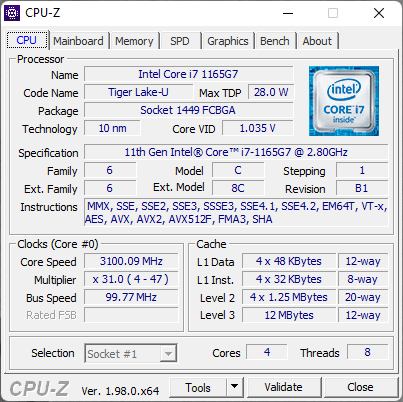
La nostra configurazione in esame include la CPU Core i7-1165G7 di 11a generazione, 16 GB di RAM e 1 TB NVMe SSD per circa 999 dollari USA, che è molto più economico di molti sistemi rugged o semi-rugged. Altre SKU sono disponibili con la vecchia CPU Core i5-10210U di decima generazione o la grafica discreta GeForce MX230, ma tutte le opzioni includono lo stesso display 1080p
Altre recensioni di Acer:
Potential Competitors in Comparison
Punteggio | Data | Modello | Peso | Altezza | Dimensione | Risoluzione | Prezzo |
|---|---|---|---|---|---|---|---|
| 82.4 % v7 (old) | 12/2021 | Acer Enduro Urban N3 EUN314 i7-1165G7, Iris Xe G7 96EUs | 1.8 kg | 21.95 mm | 14.00" | 1920x1080 | |
| 89.2 % v6 (old) | 03/2019 | Dell Latitude 5420 Rugged-P85G i7-8650U, Radeon RX 540 | 2.8 kg | 32.9 mm | 14.00" | 1920x1080 | |
| 83.9 % v7 (old) | 09/2021 | Panasonic Toughbook FZ-55 MK2 i7-1185G7, Iris Xe G7 96EUs | 2.3 kg | 33 mm | 14.00" | 1920x1080 | |
v (old) | 04/2021 | Durabook S14I i7-1165G7, Iris Xe G7 96EUs | 3 kg | 38.1 mm | 14.00" | 1920x1080 | |
| 81.9 % v6 (old) | 10/2018 | Getac S410 i5-8550U, UHD Graphics 620 | 3.2 kg | 34.9 mm | 14.00" | 1366x768 |
Caso
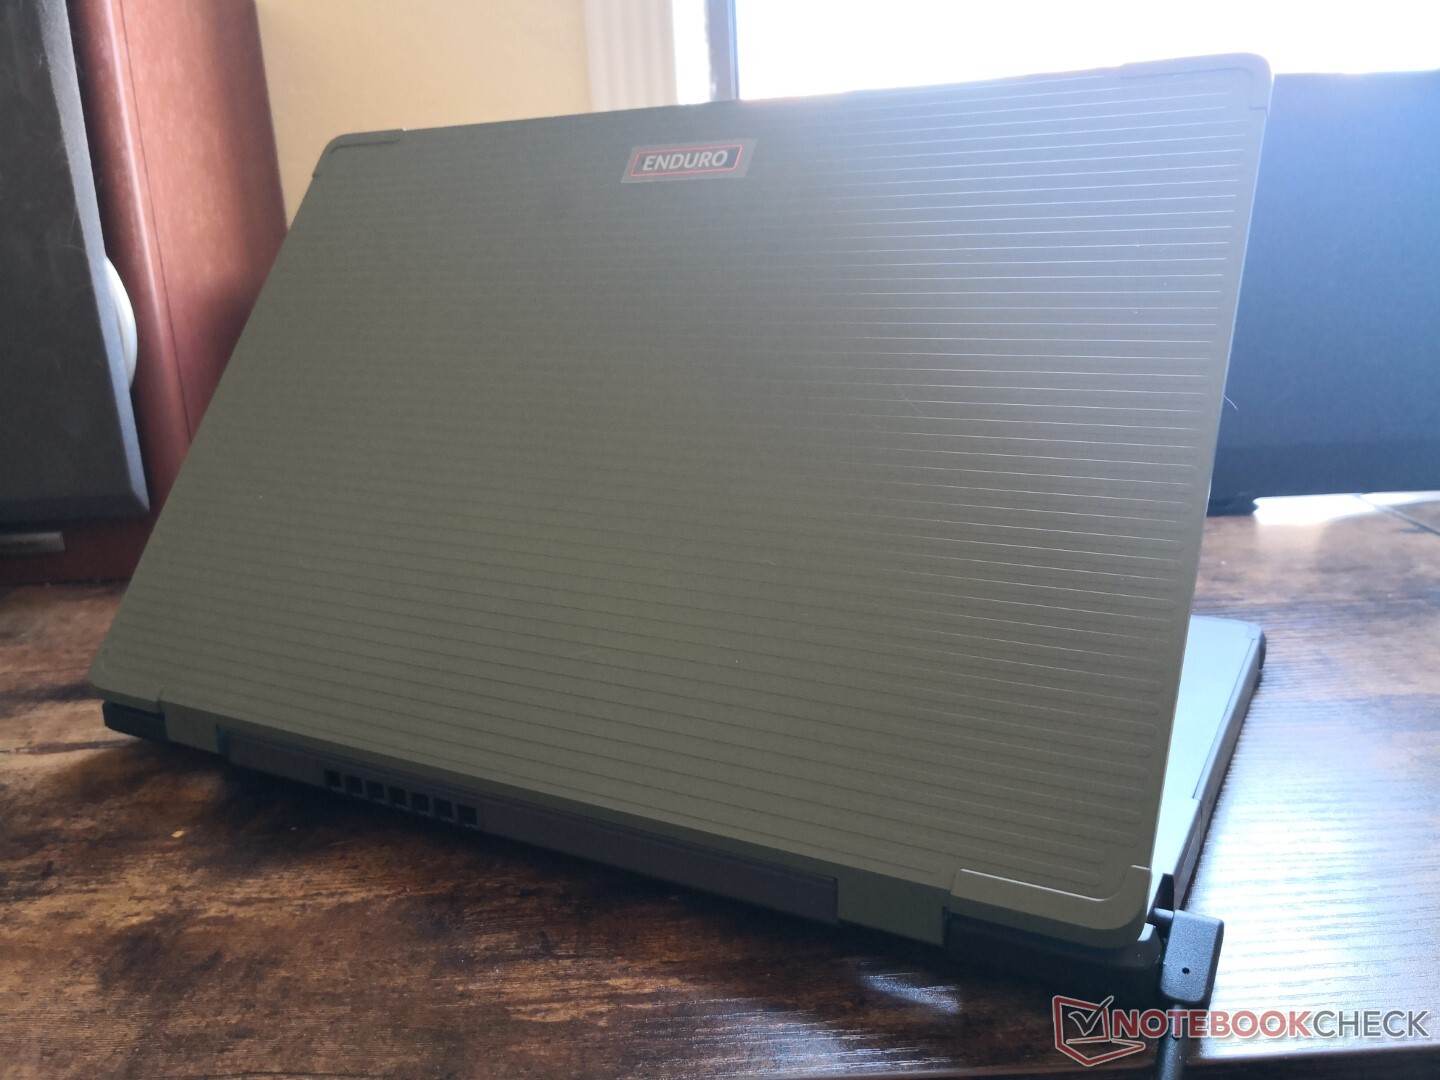
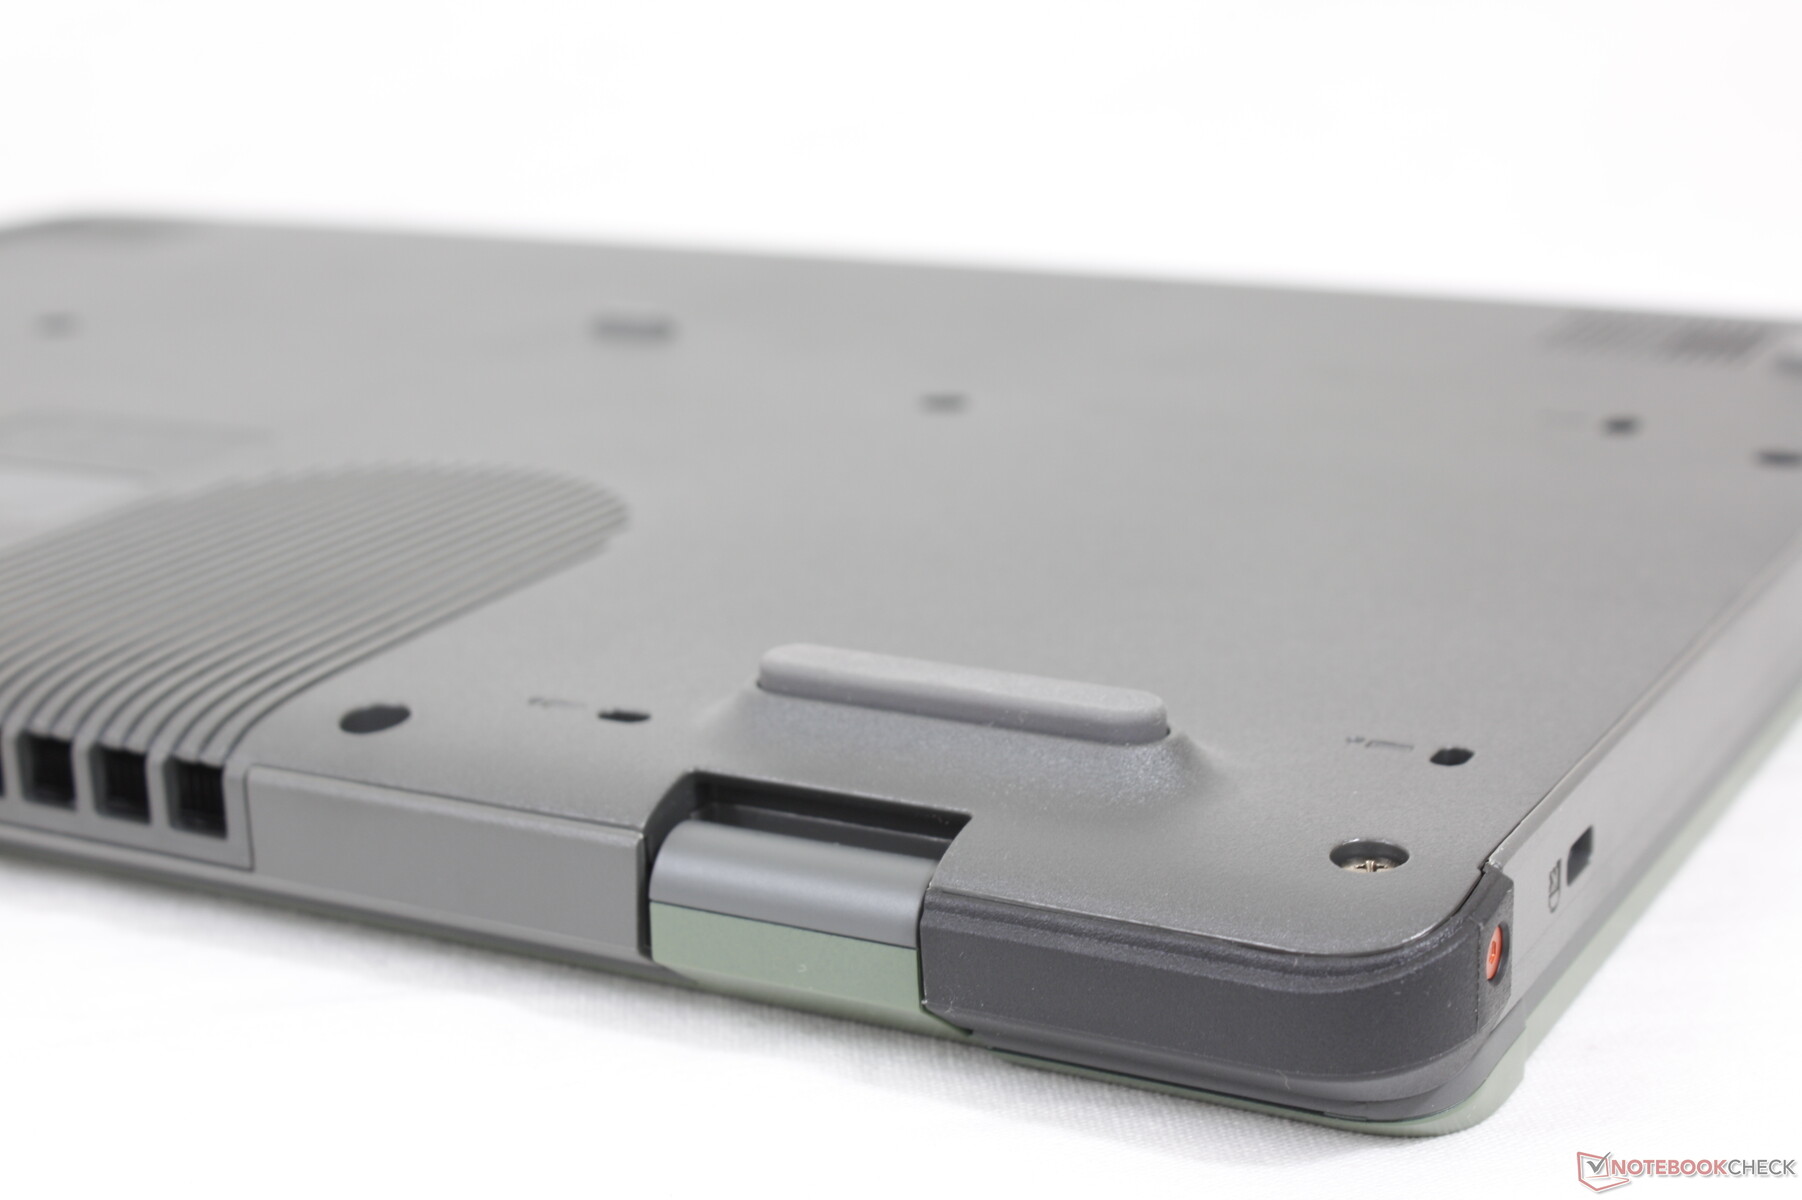
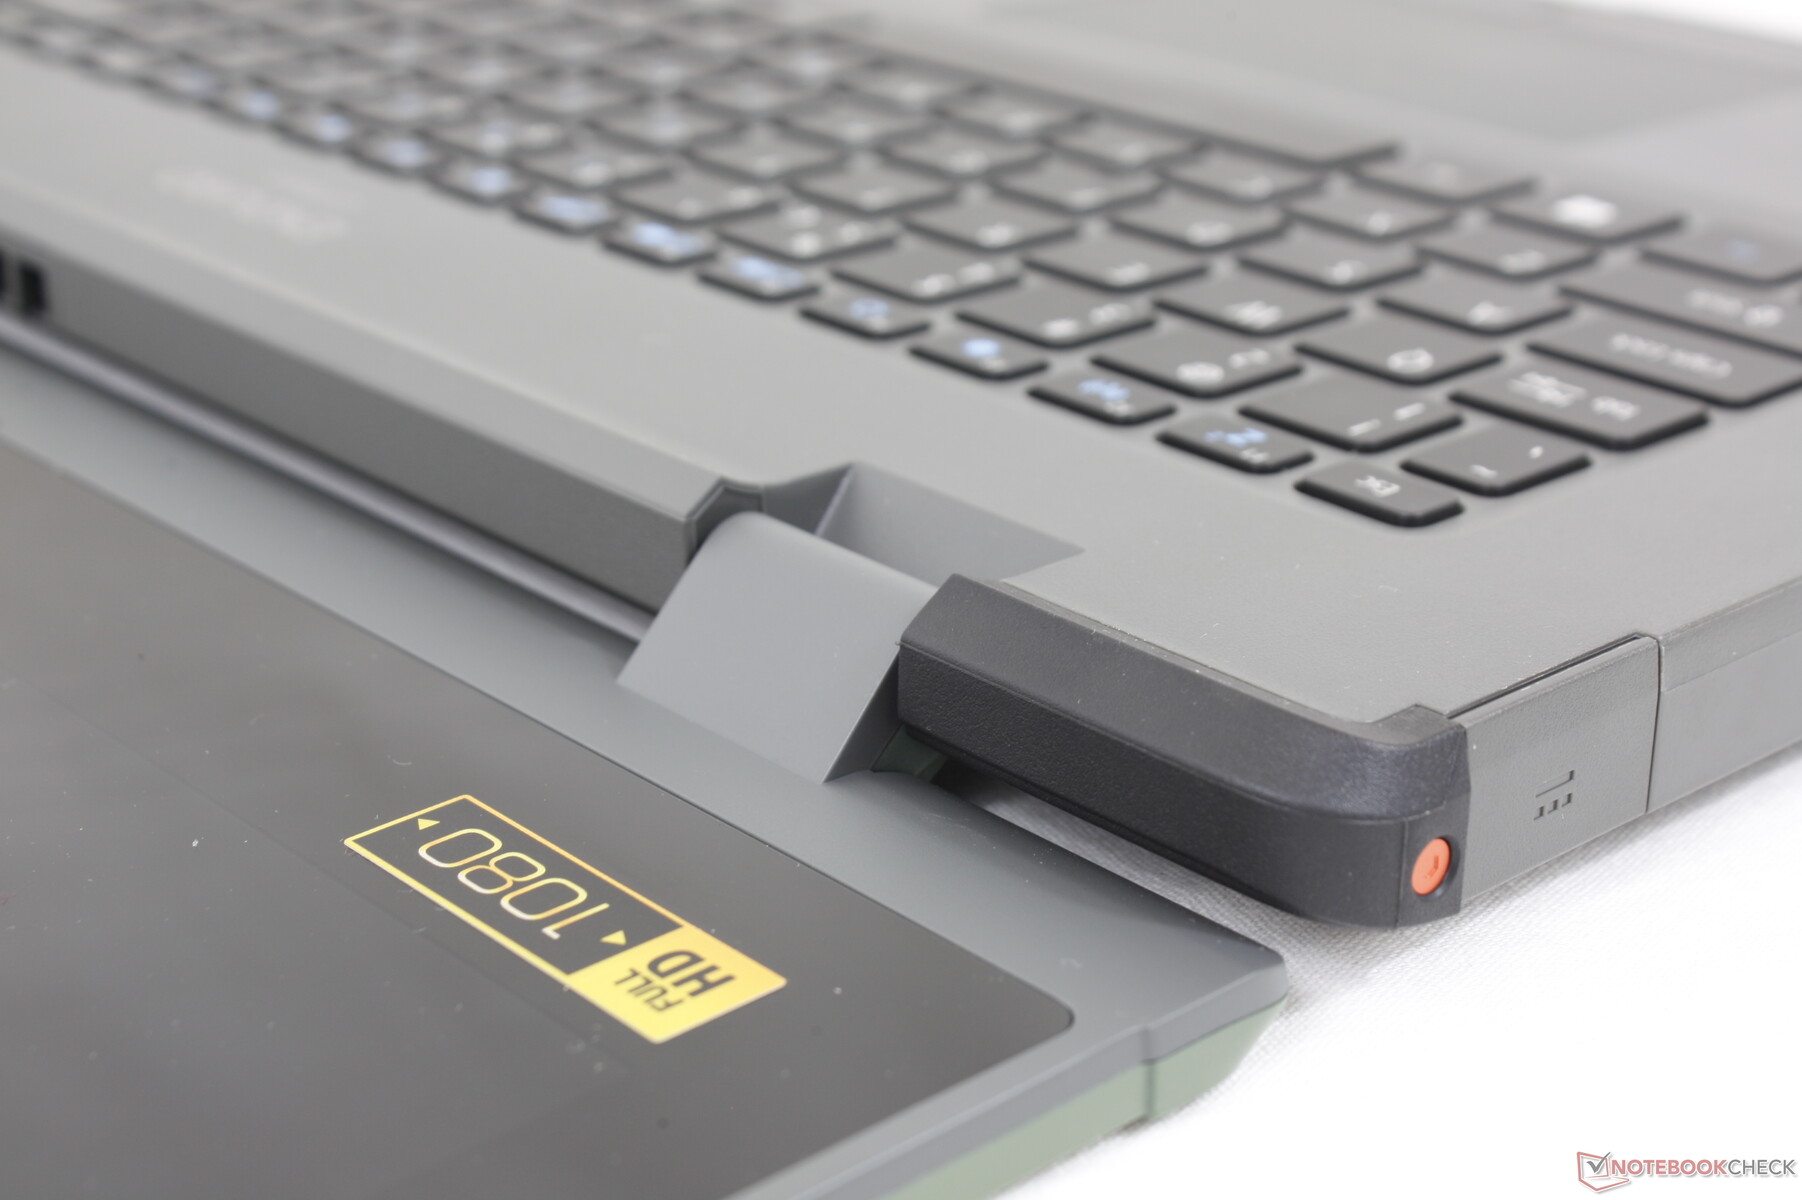
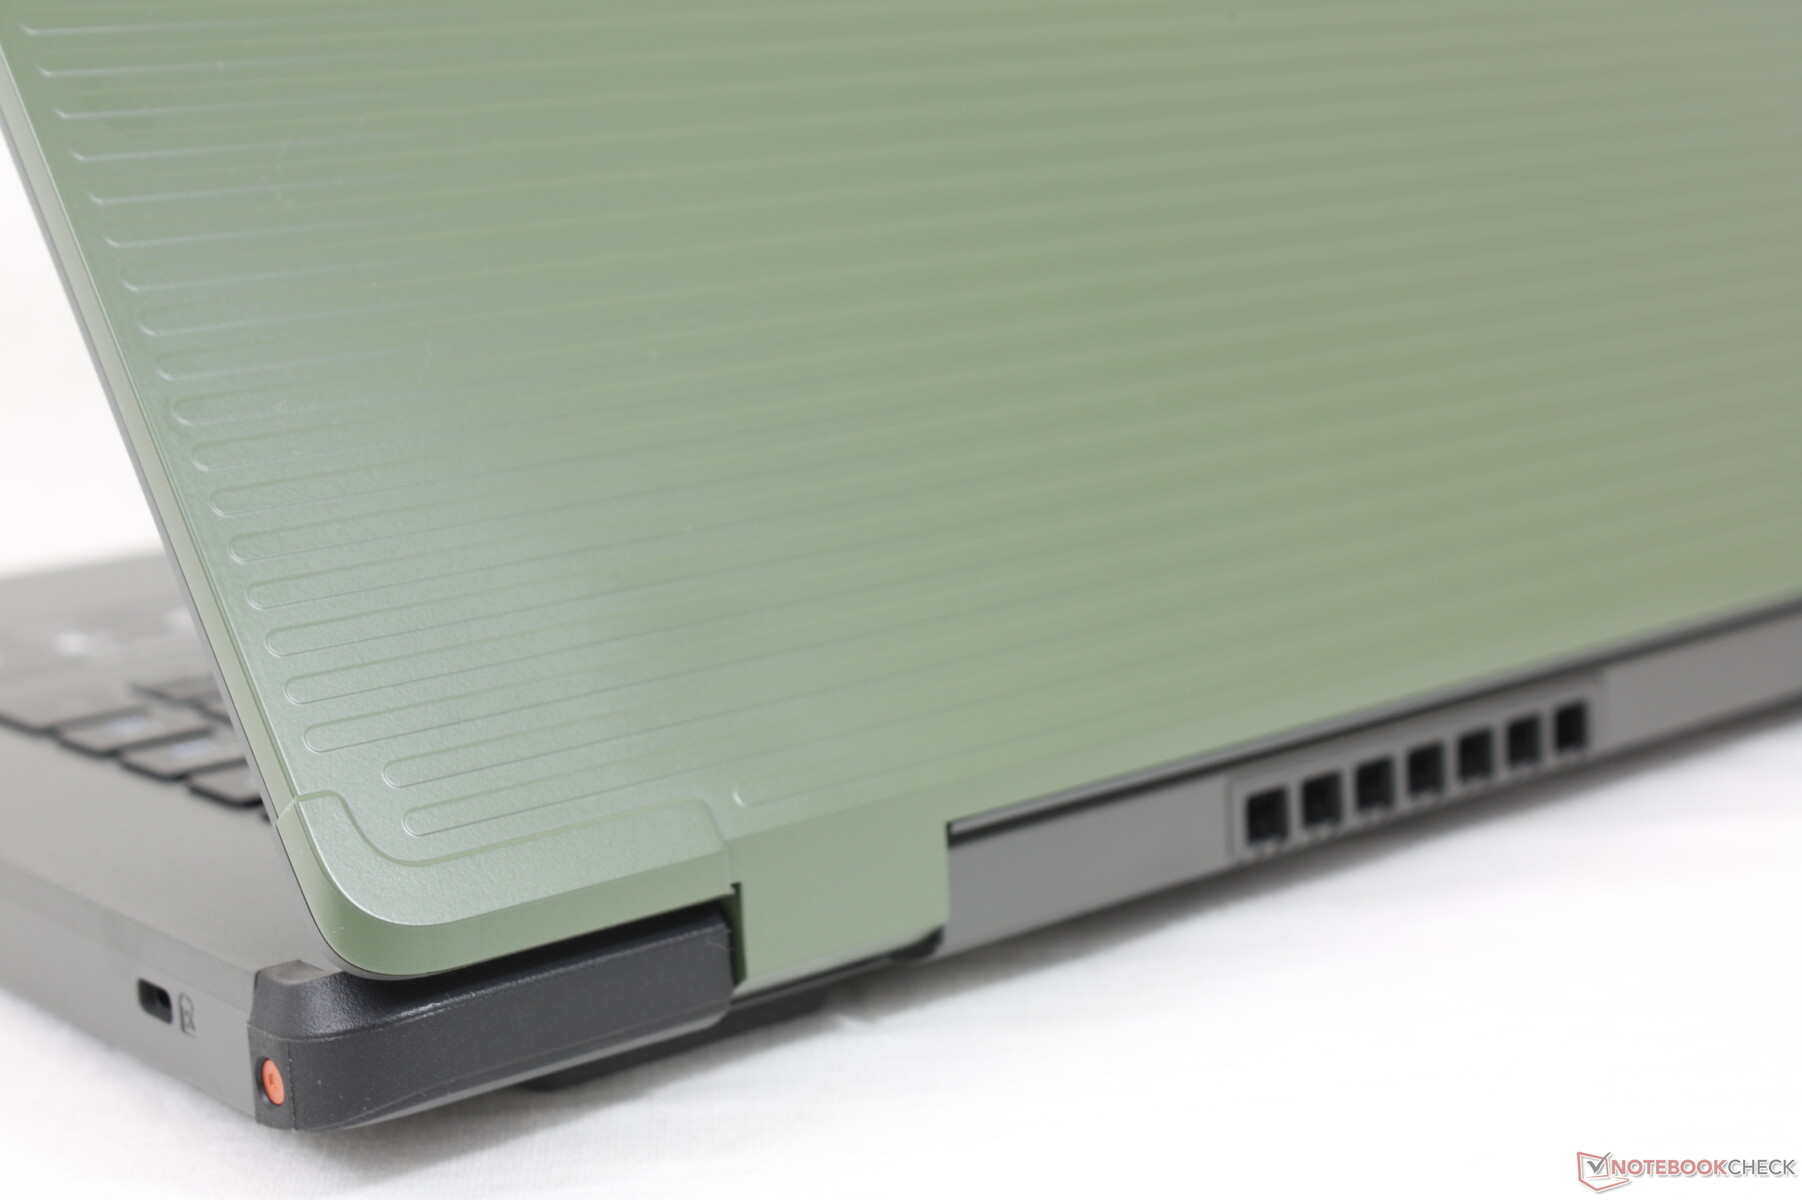
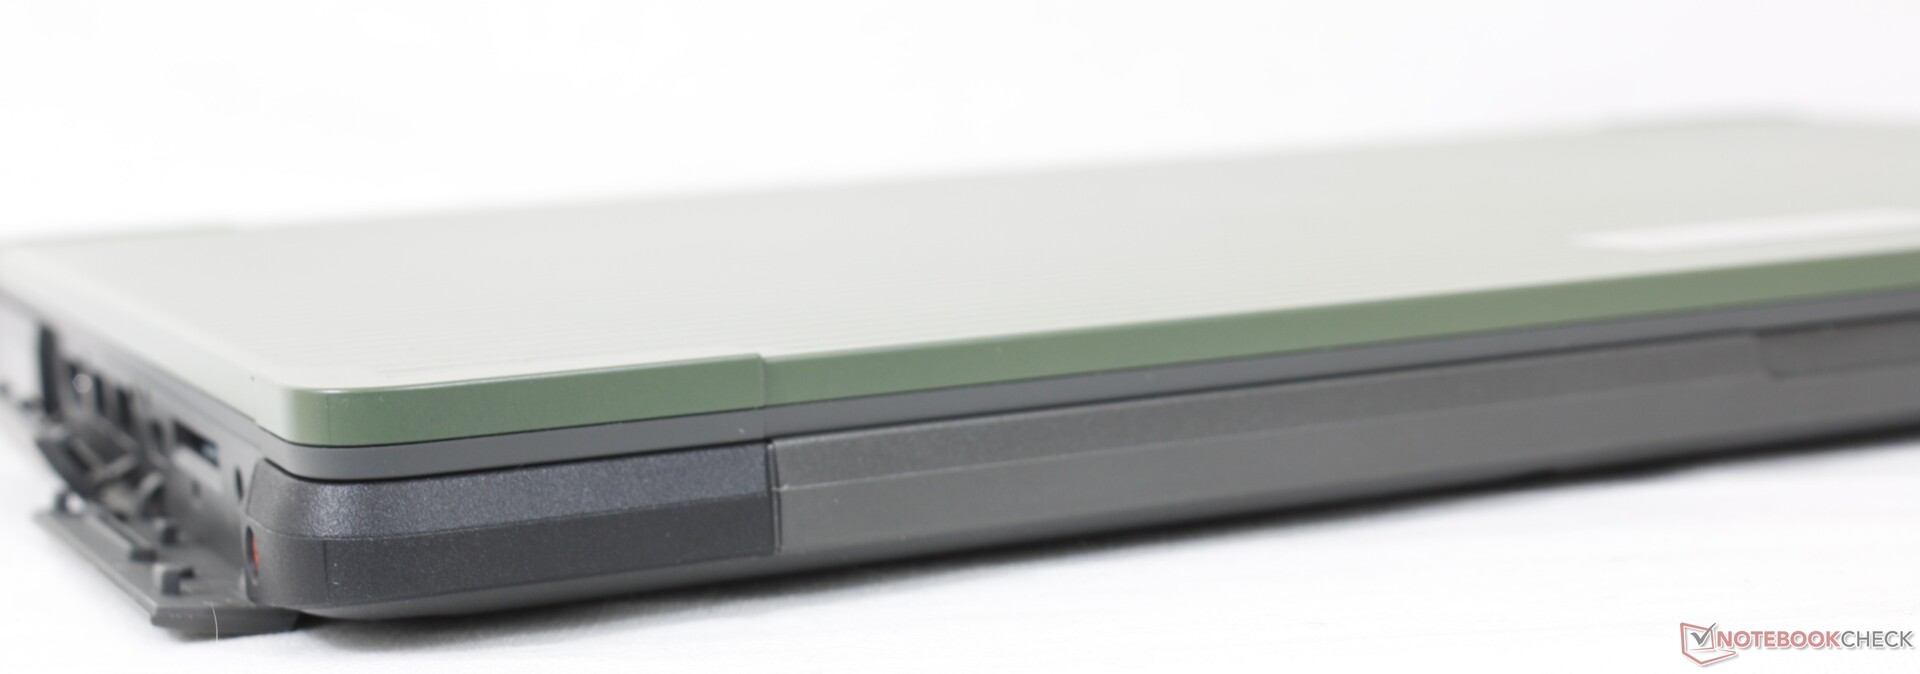
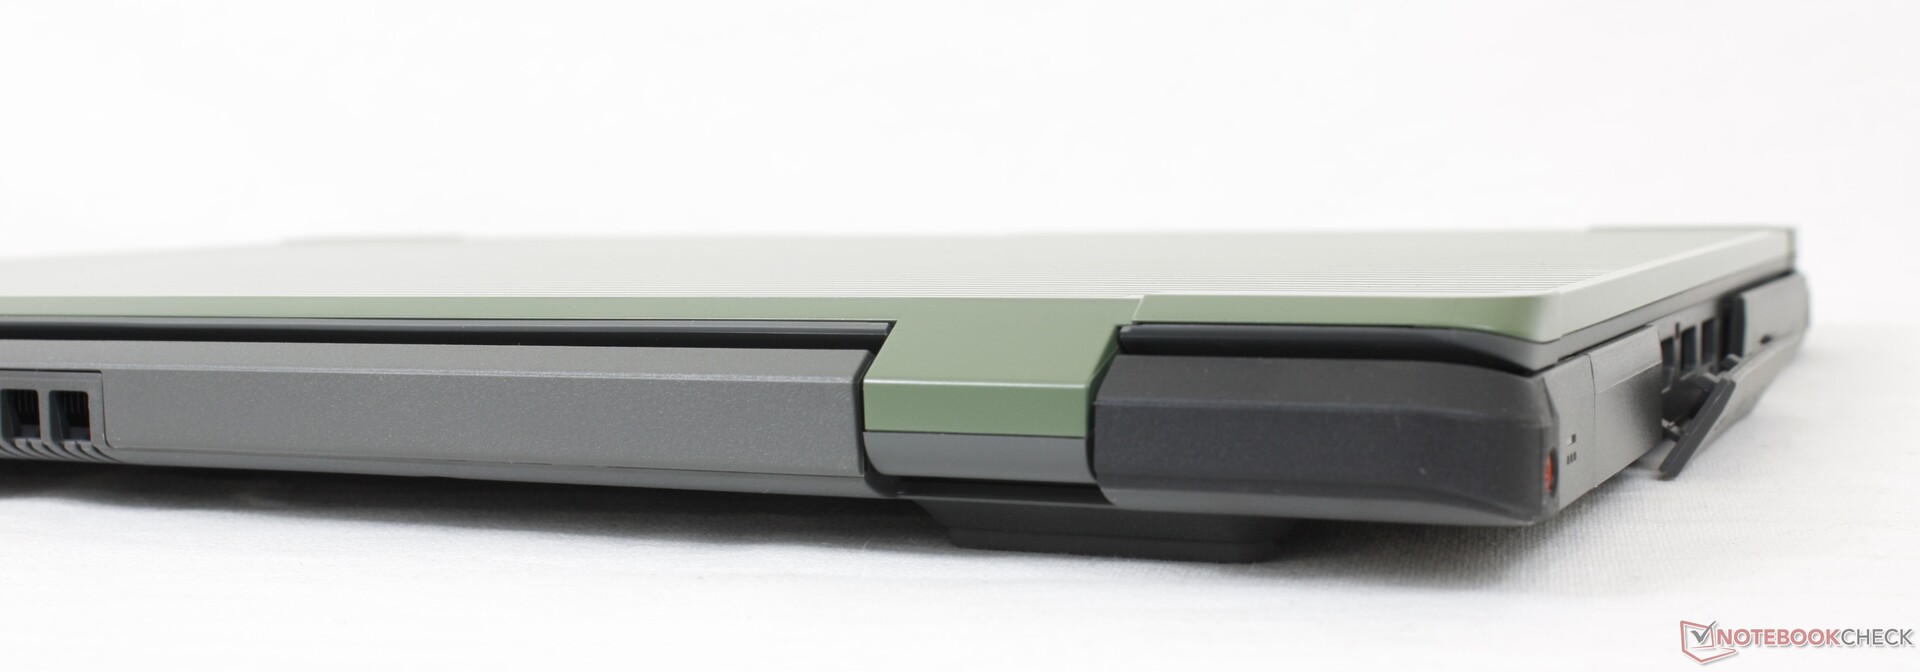
Le caratteristiche più notevoli dell'Urban N3 sono la sua portabilità e le piccole dimensioni rispetto ad altri dispositivi rugged da 14 pollici. A soli 1,8 kg, il sistema Acer è diverse centinaia di grammi più leggero del Getac S410 oPanasonic Toughbook FZ-55 MK2 per essere molto più vicino alle dimensioni di un tipico portatile consumer da 15,6 pollici. Le sue spesse cornici possono essere antiestetiche, ma le famiglie rugged come l'Enduro hanno sempre avuto a che fare con la funzione piuttosto che con la forma.
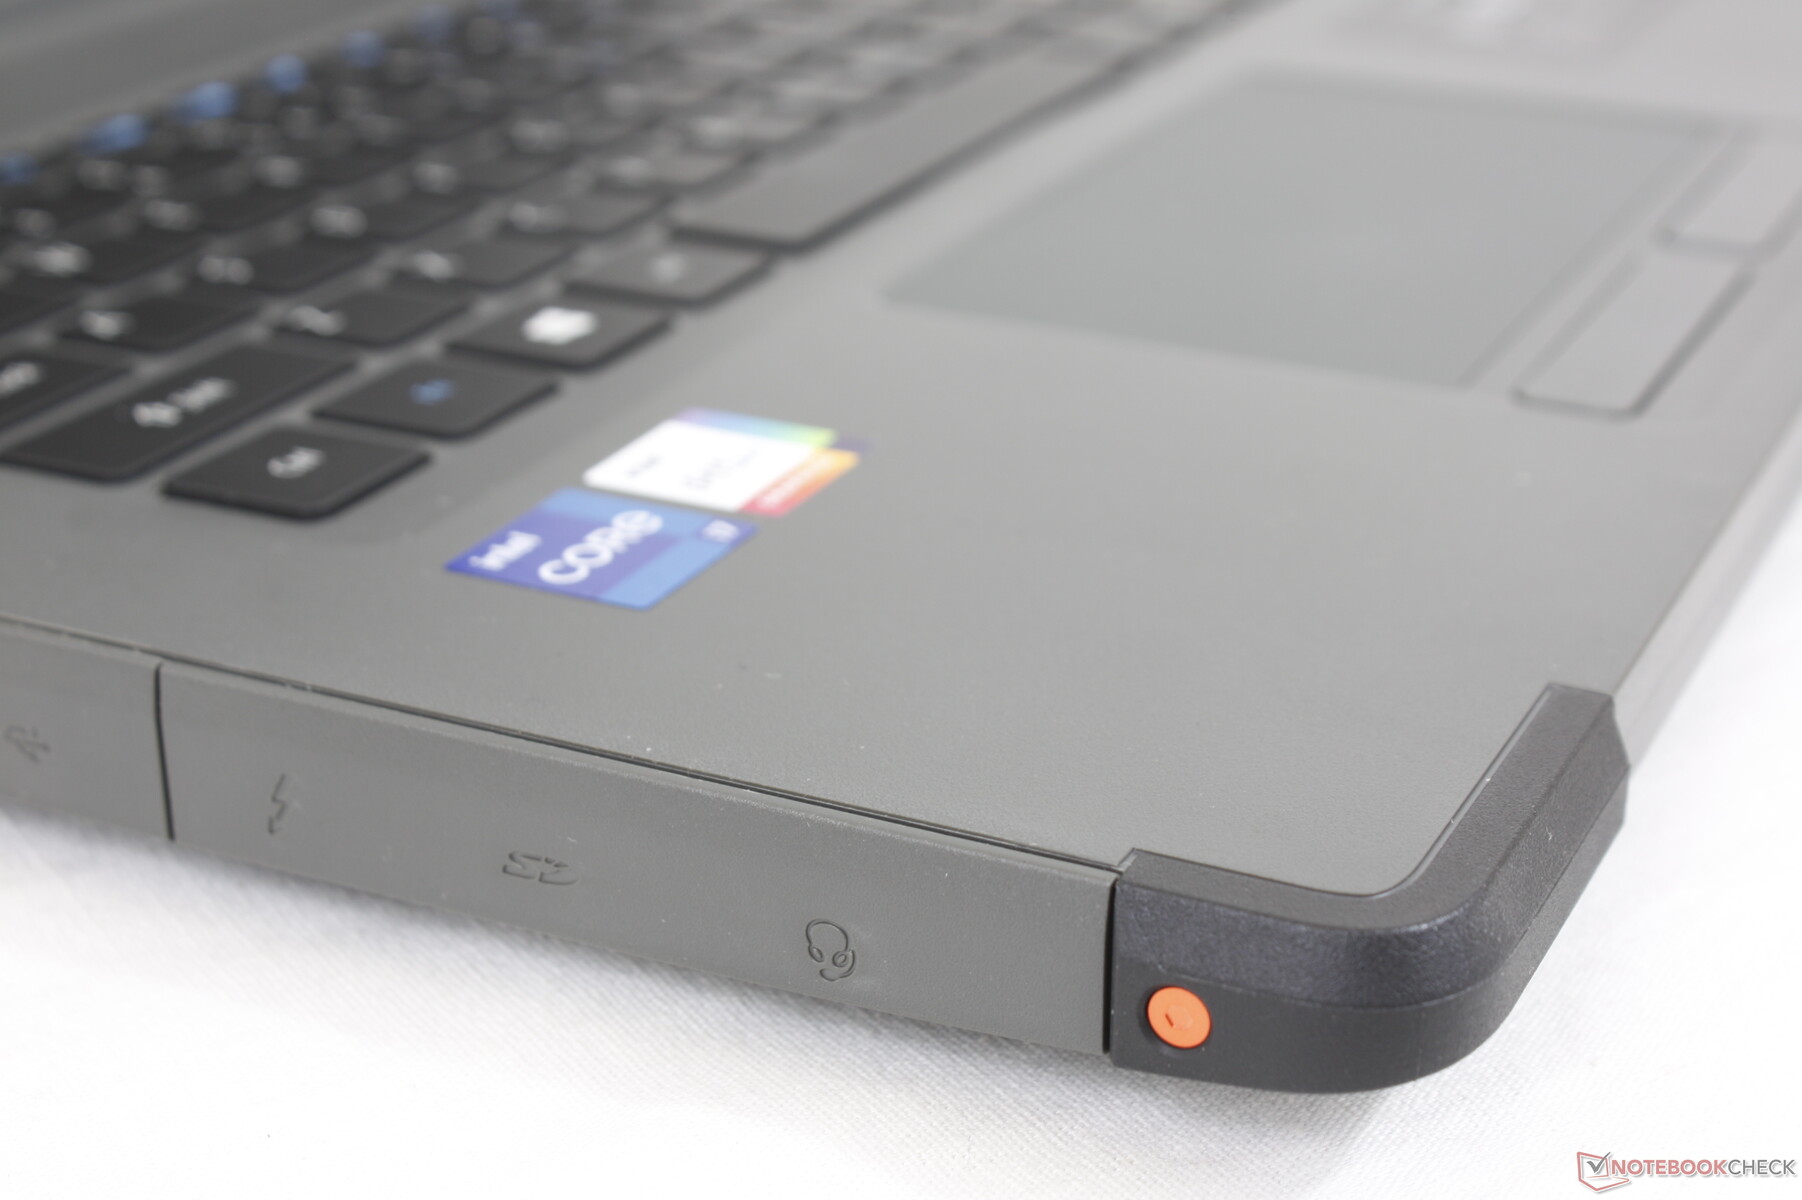
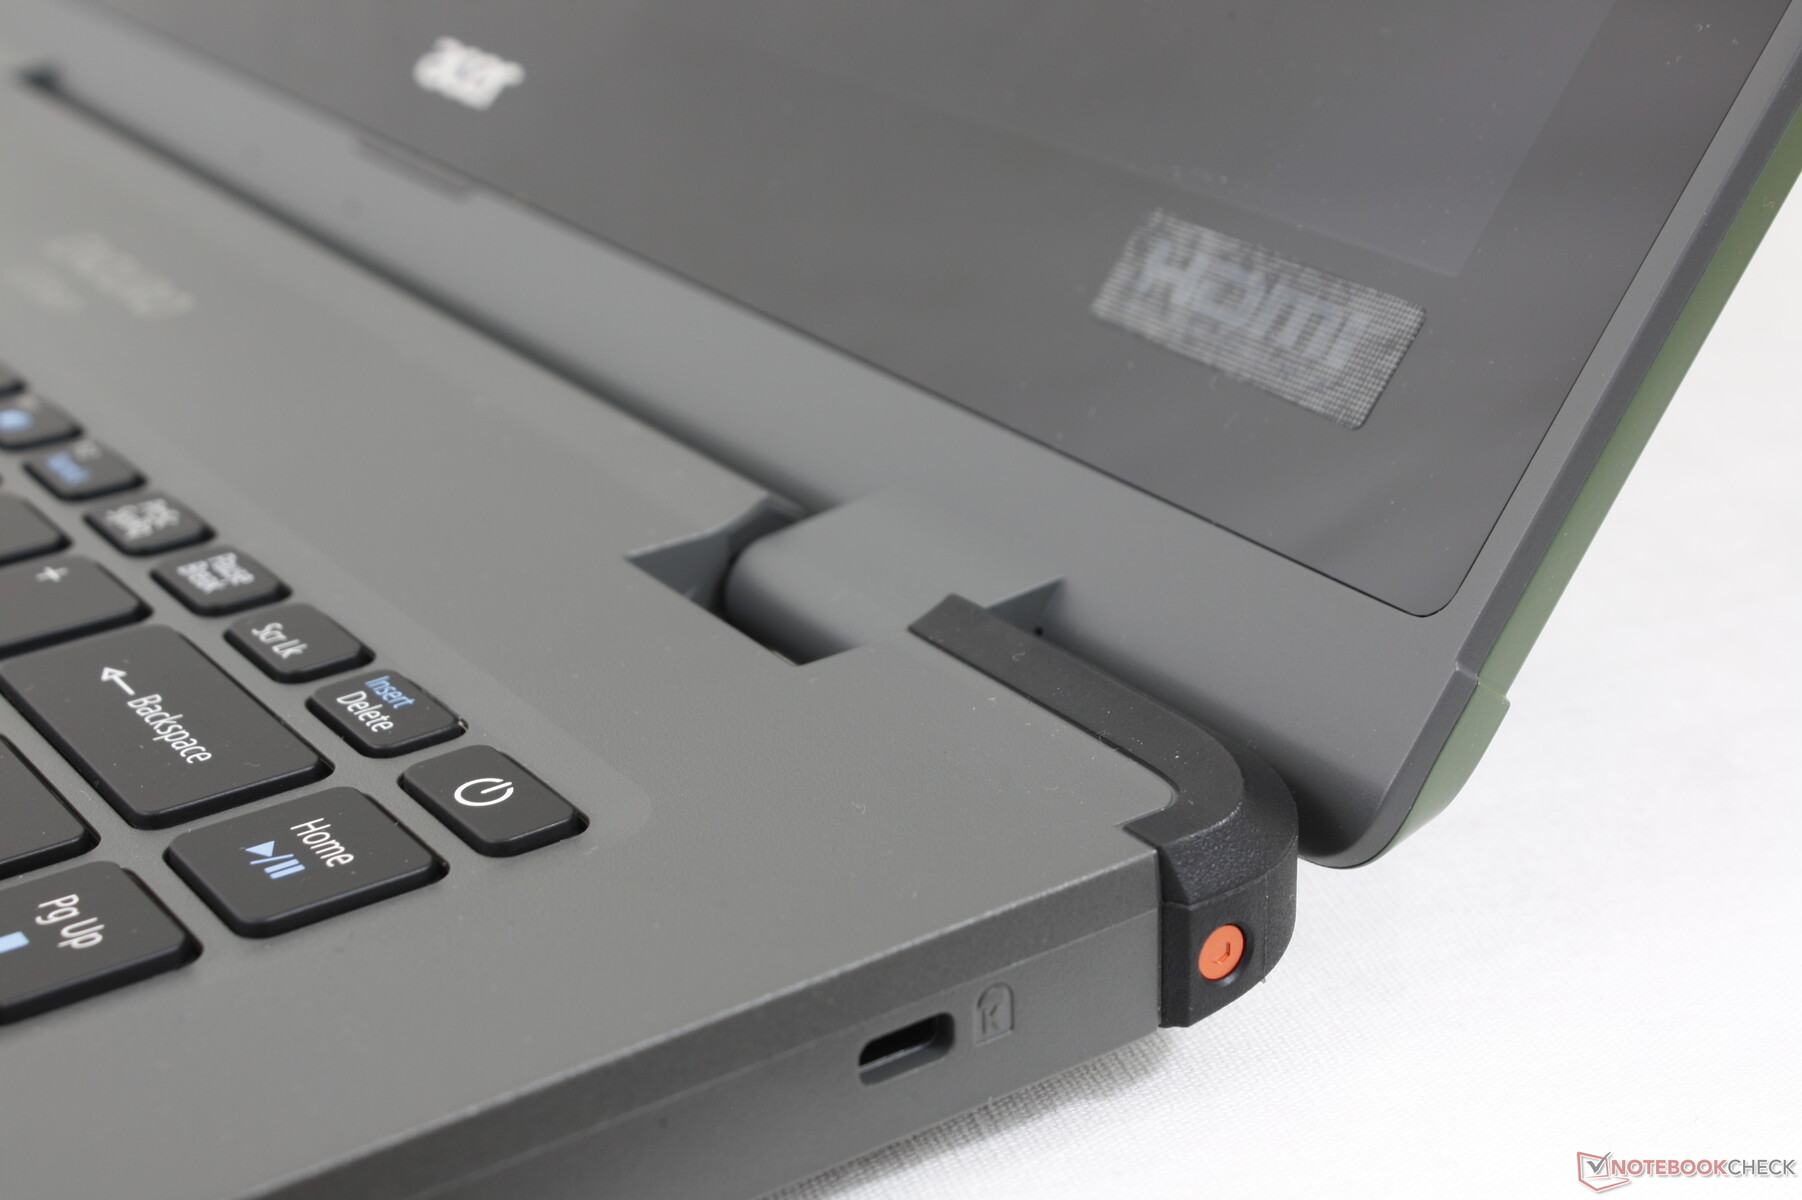
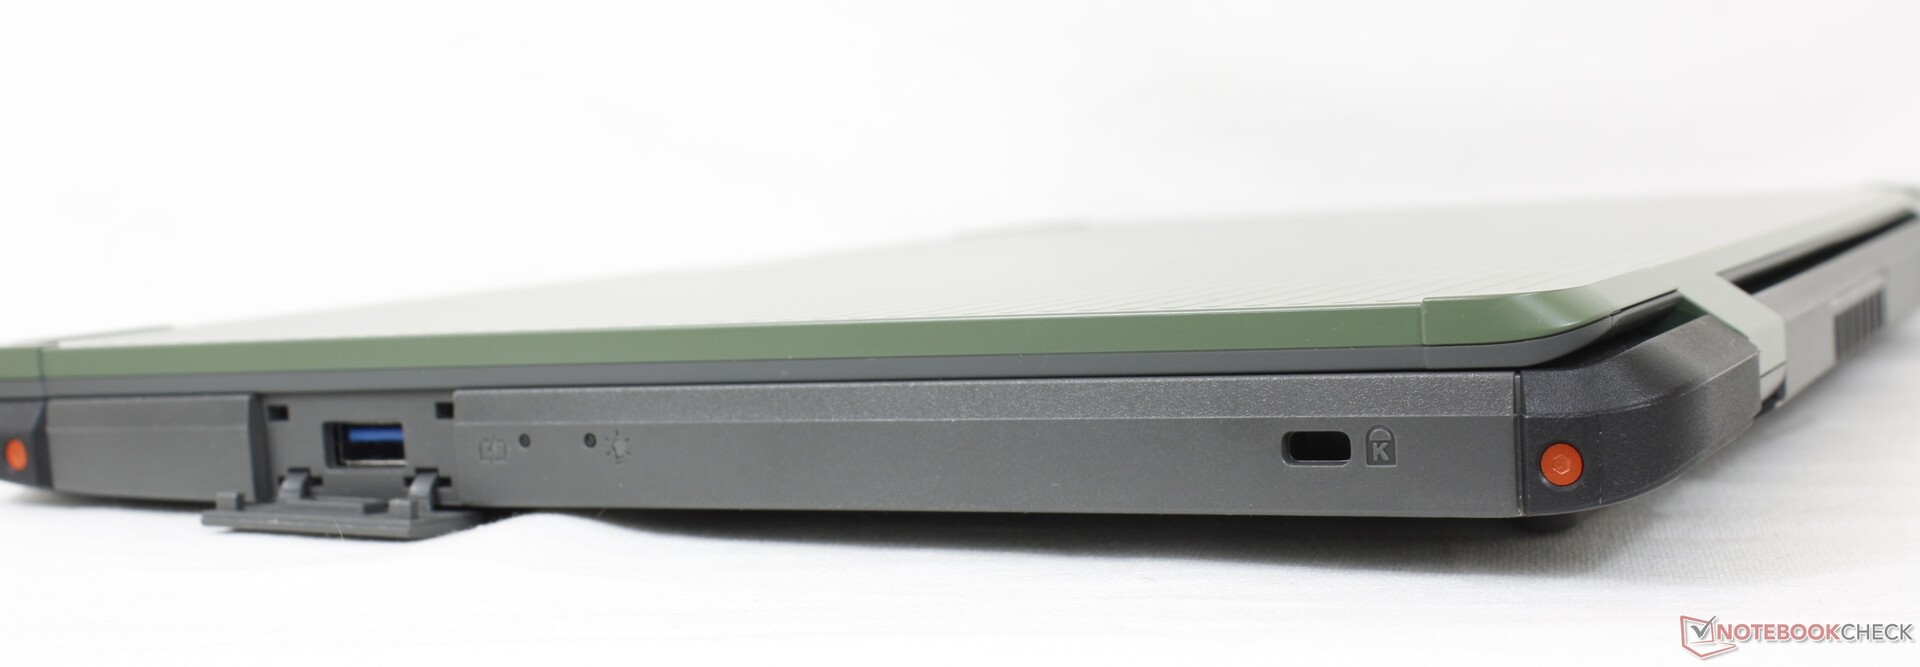
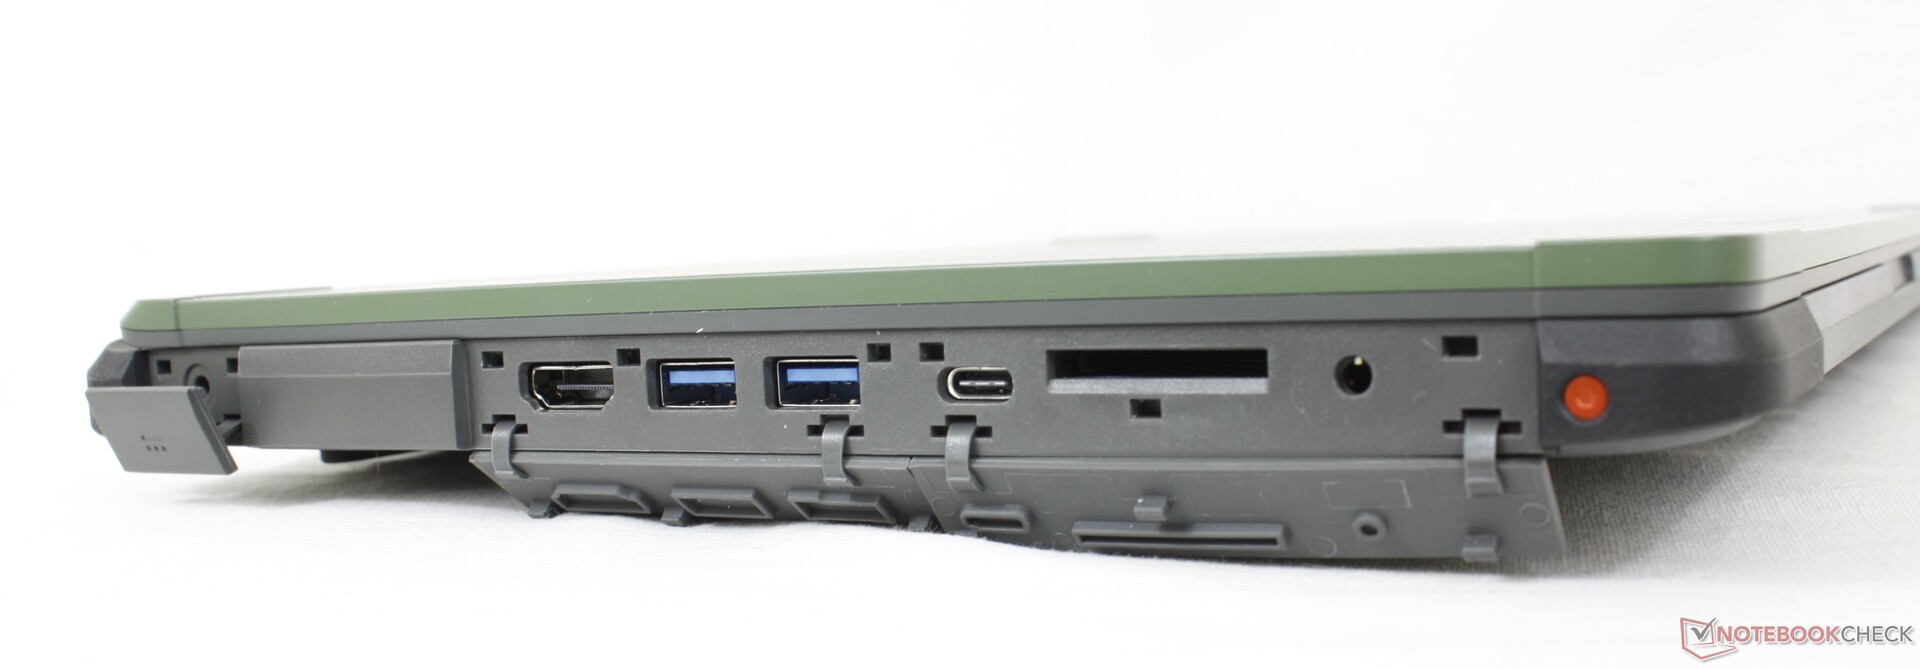
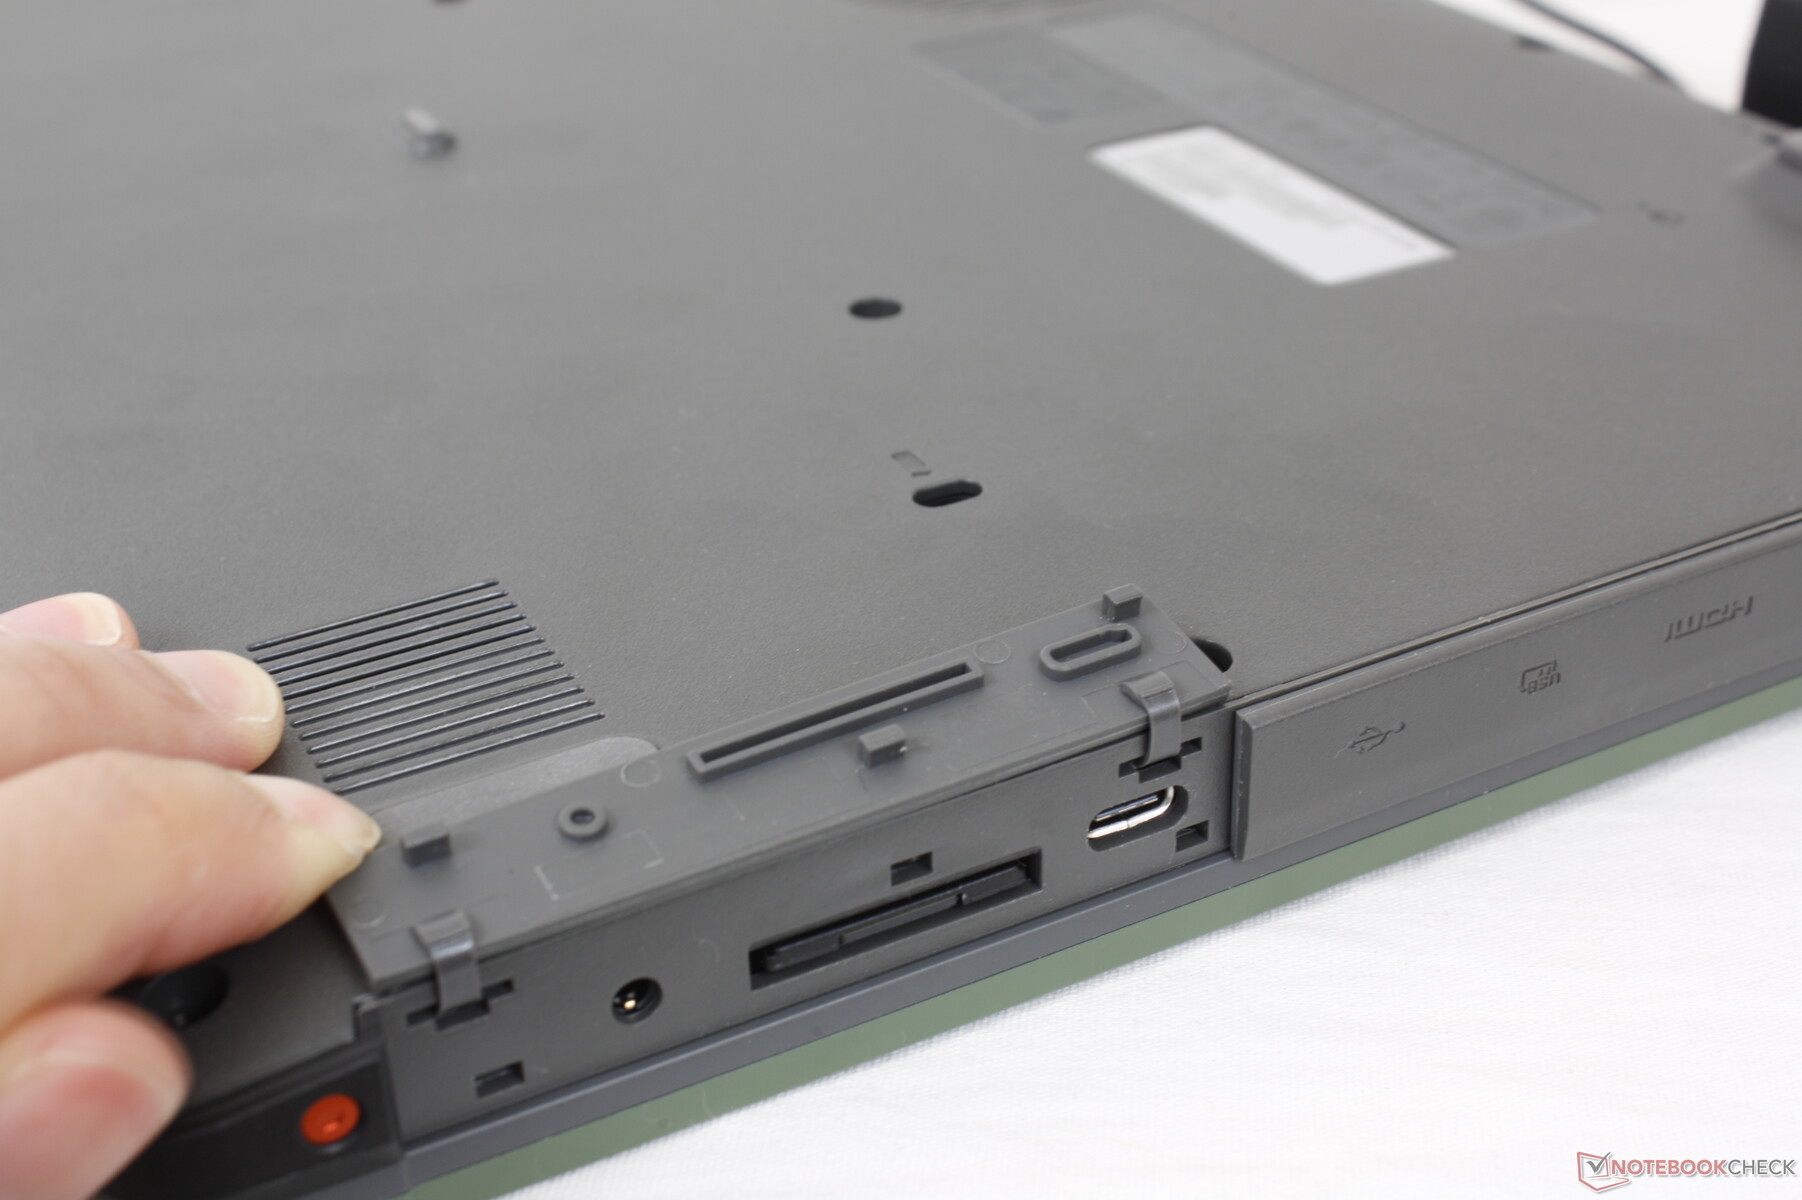
Connettività
Le opzioni delle porte sono simili a quelle di molti Ultrabook, inclusa la importantissima porta Thunderbolt 4. I normali portatili rugged come Serial RS232, VGA, e RJ-45 sono omessi.
Lettore di schede SD
Il lettore di schede SD integrato è lento. Spostare 1 GB di immagini dalla nostra scheda di test UHS-II al desktop richiede circa 45 secondi rispetto ai 12 secondi del Getac S410.
| SD Card Reader | |
| average JPG Copy Test (av. of 3 runs) | |
| Dell Latitude 5420 Rugged-P85G (Toshiba Exceria Pro SDXC 64 GB UHS-II) | |
| Getac S410 (Toshiba Exceria Pro SDXC 64 GB UHS-II) | |
| Panasonic Toughbook FZ-55 MK2 (AV Pro V60) | |
| Acer Enduro Urban N3 EUN314 (AV Pro V60) | |
| Durabook S14I (Angelbird 128GB AV Pro UHS-II) | |
| maximum AS SSD Seq Read Test (1GB) | |
| Dell Latitude 5420 Rugged-P85G (Toshiba Exceria Pro SDXC 64 GB UHS-II) | |
| Panasonic Toughbook FZ-55 MK2 (AV Pro V60) | |
| Getac S410 (Toshiba Exceria Pro SDXC 64 GB UHS-II) | |
| Durabook S14I (Angelbird 128GB AV Pro UHS-II) | |
| Acer Enduro Urban N3 EUN314 (AV Pro V60) | |
Comunicazione
Webcam
La webcam 720p è di scarsa qualità, senza otturatore per la privacy o fotocamera IR.


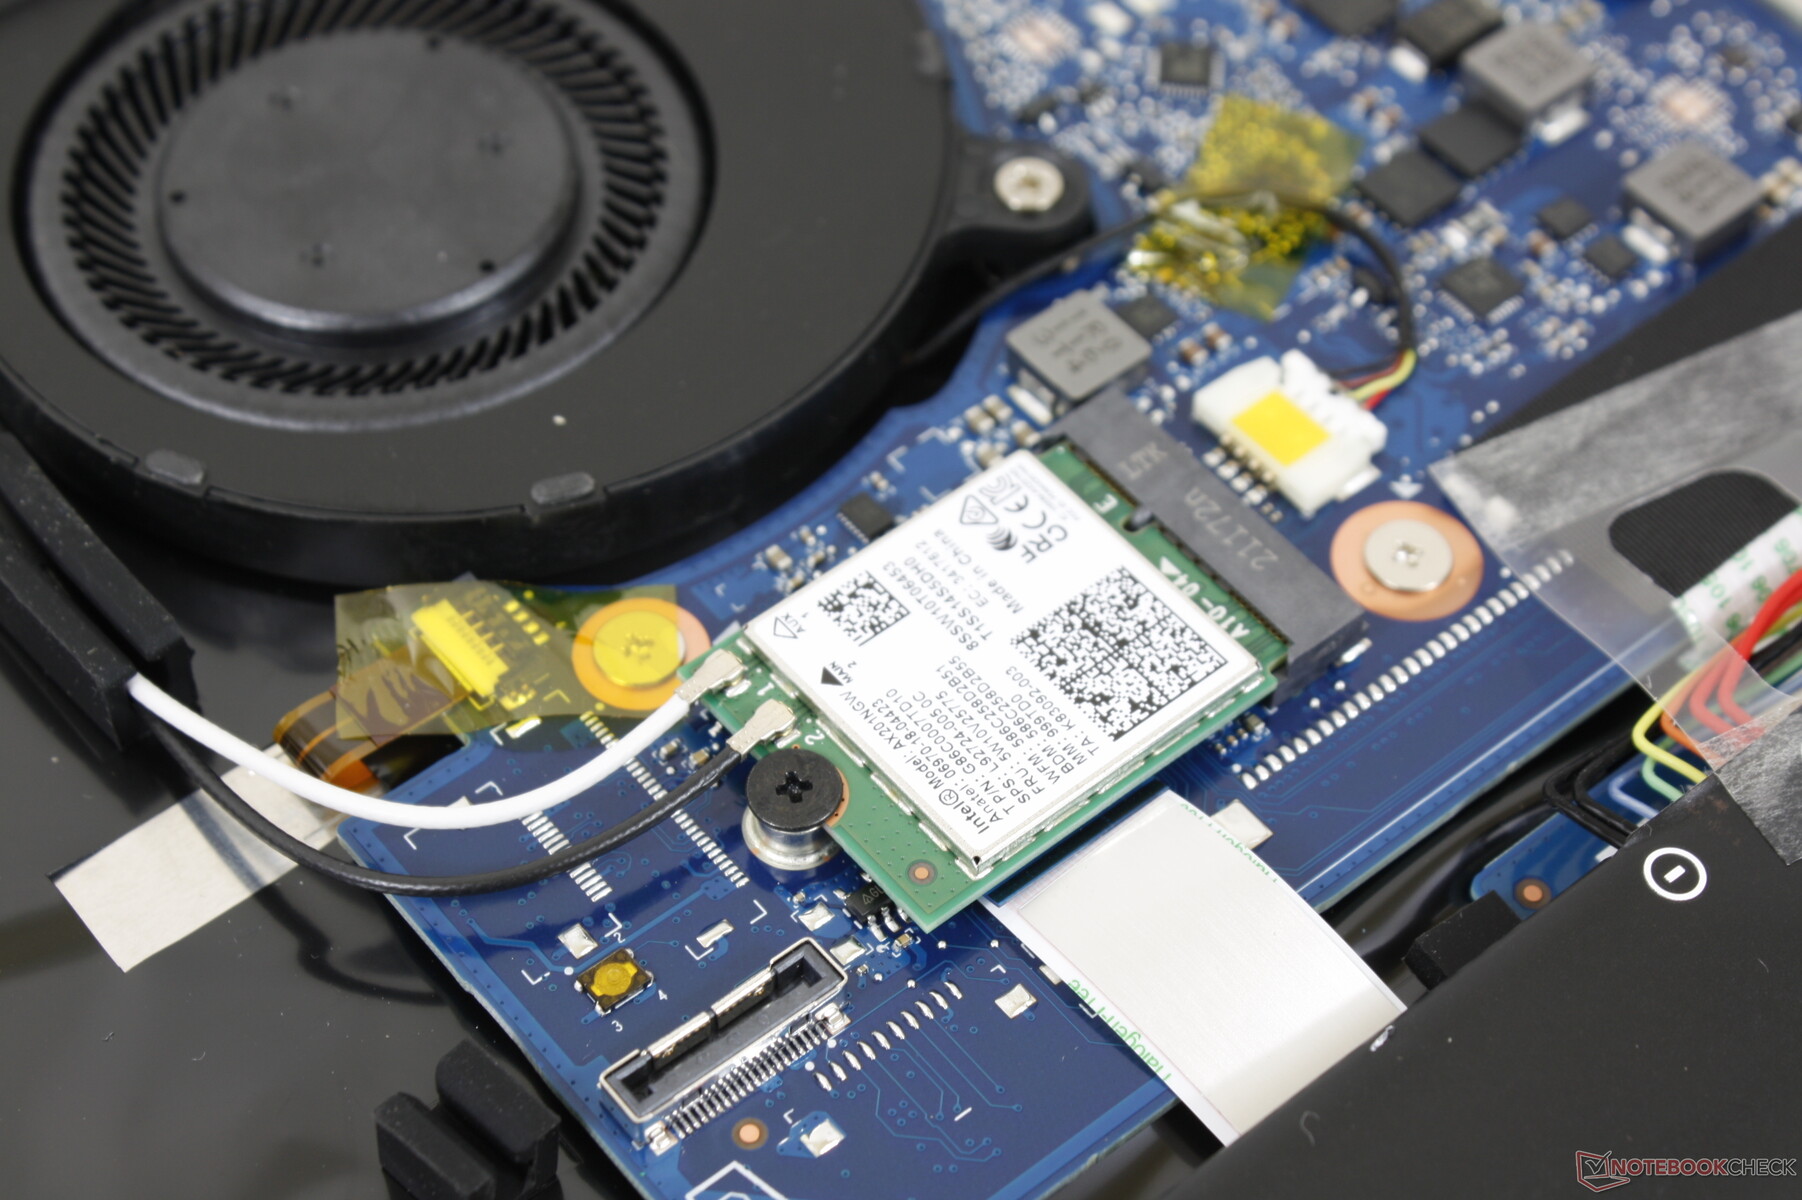
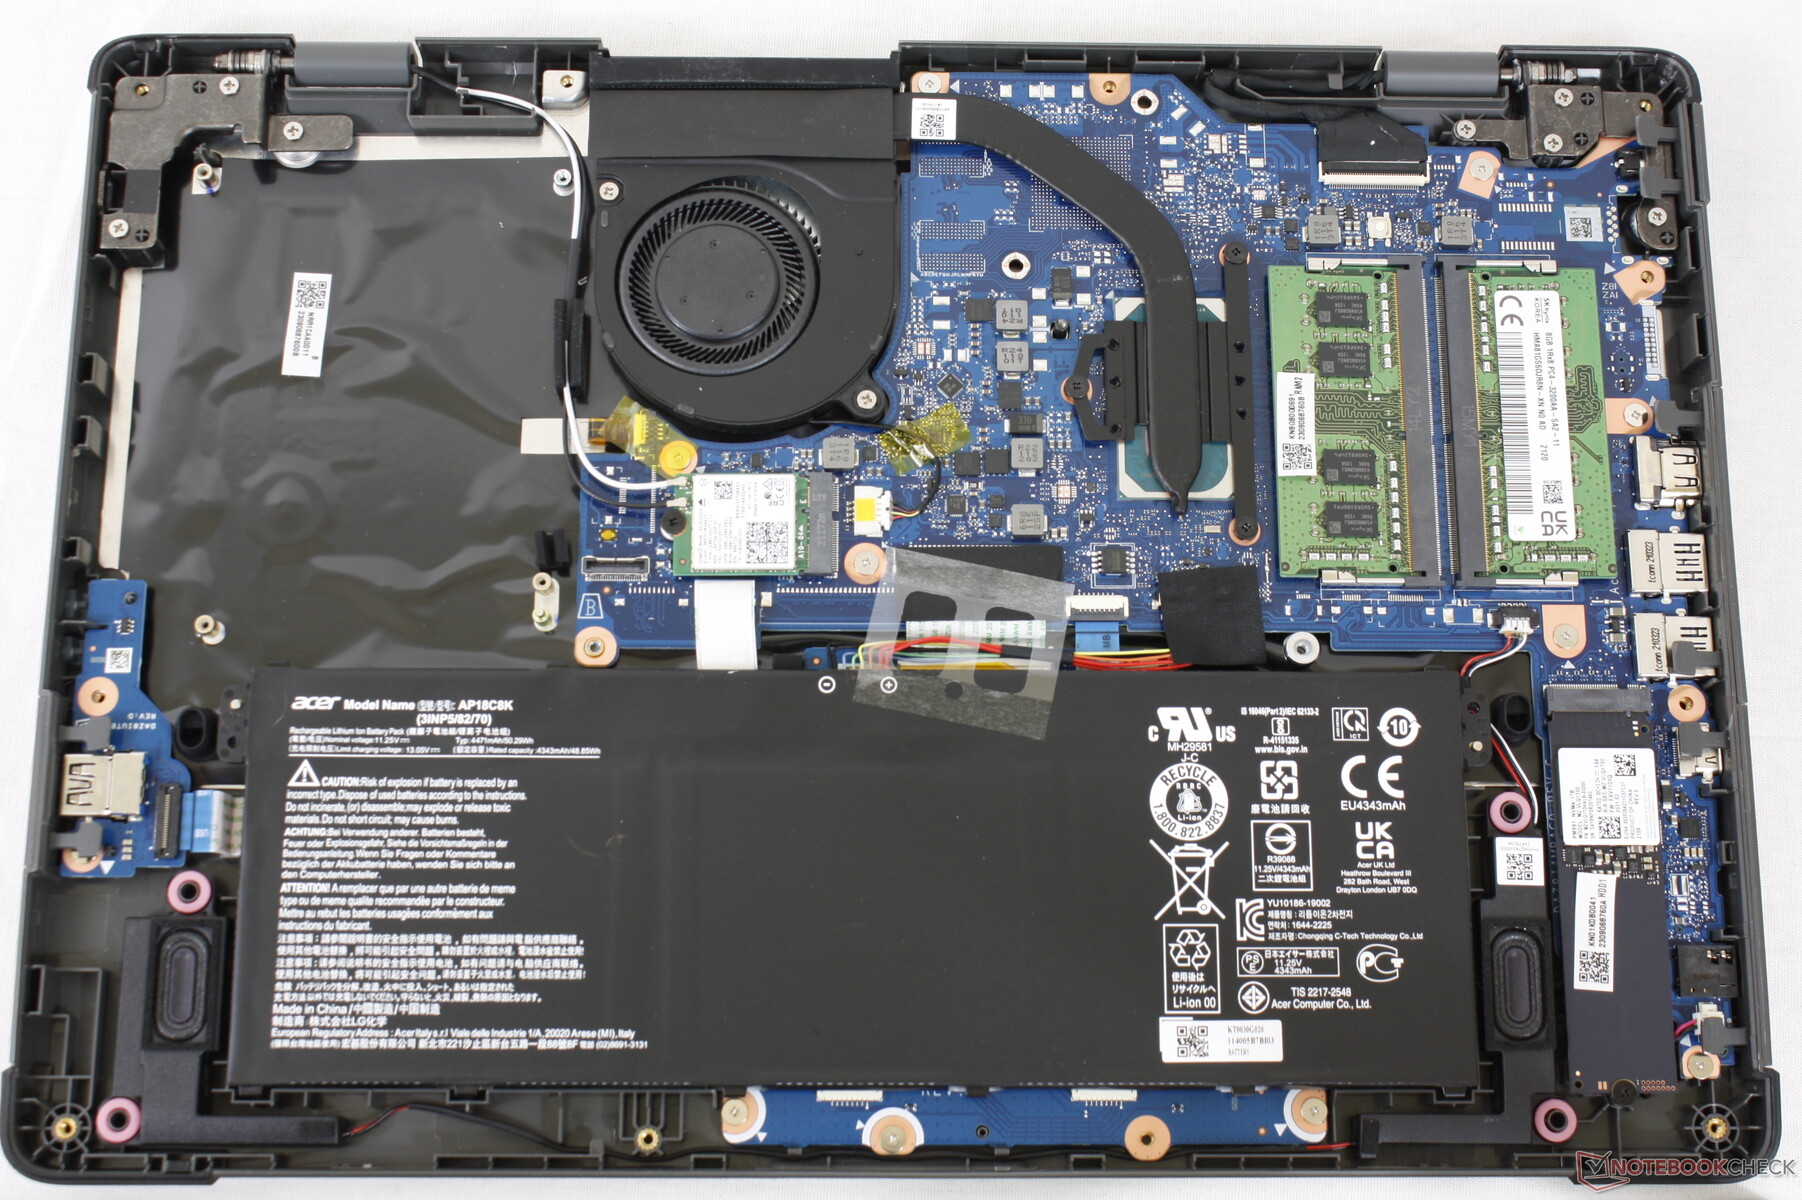
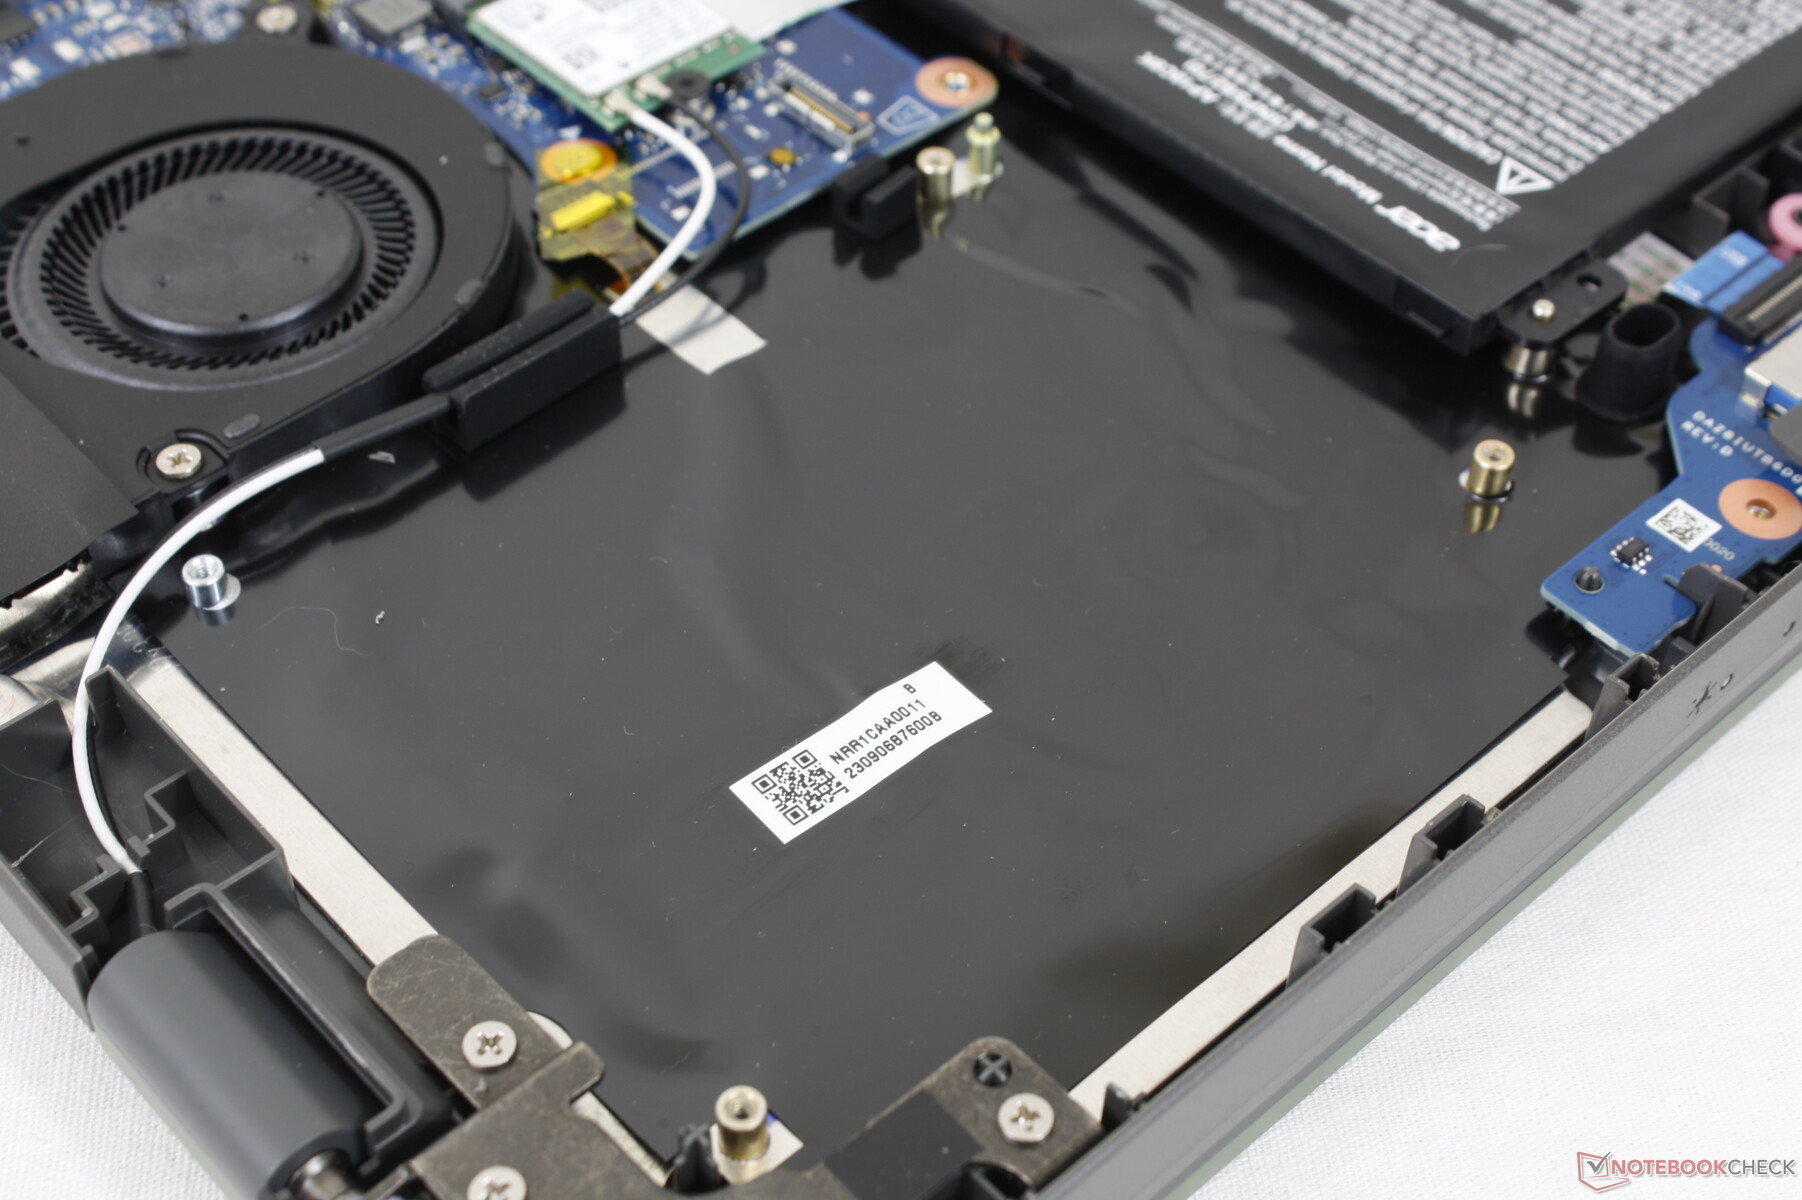
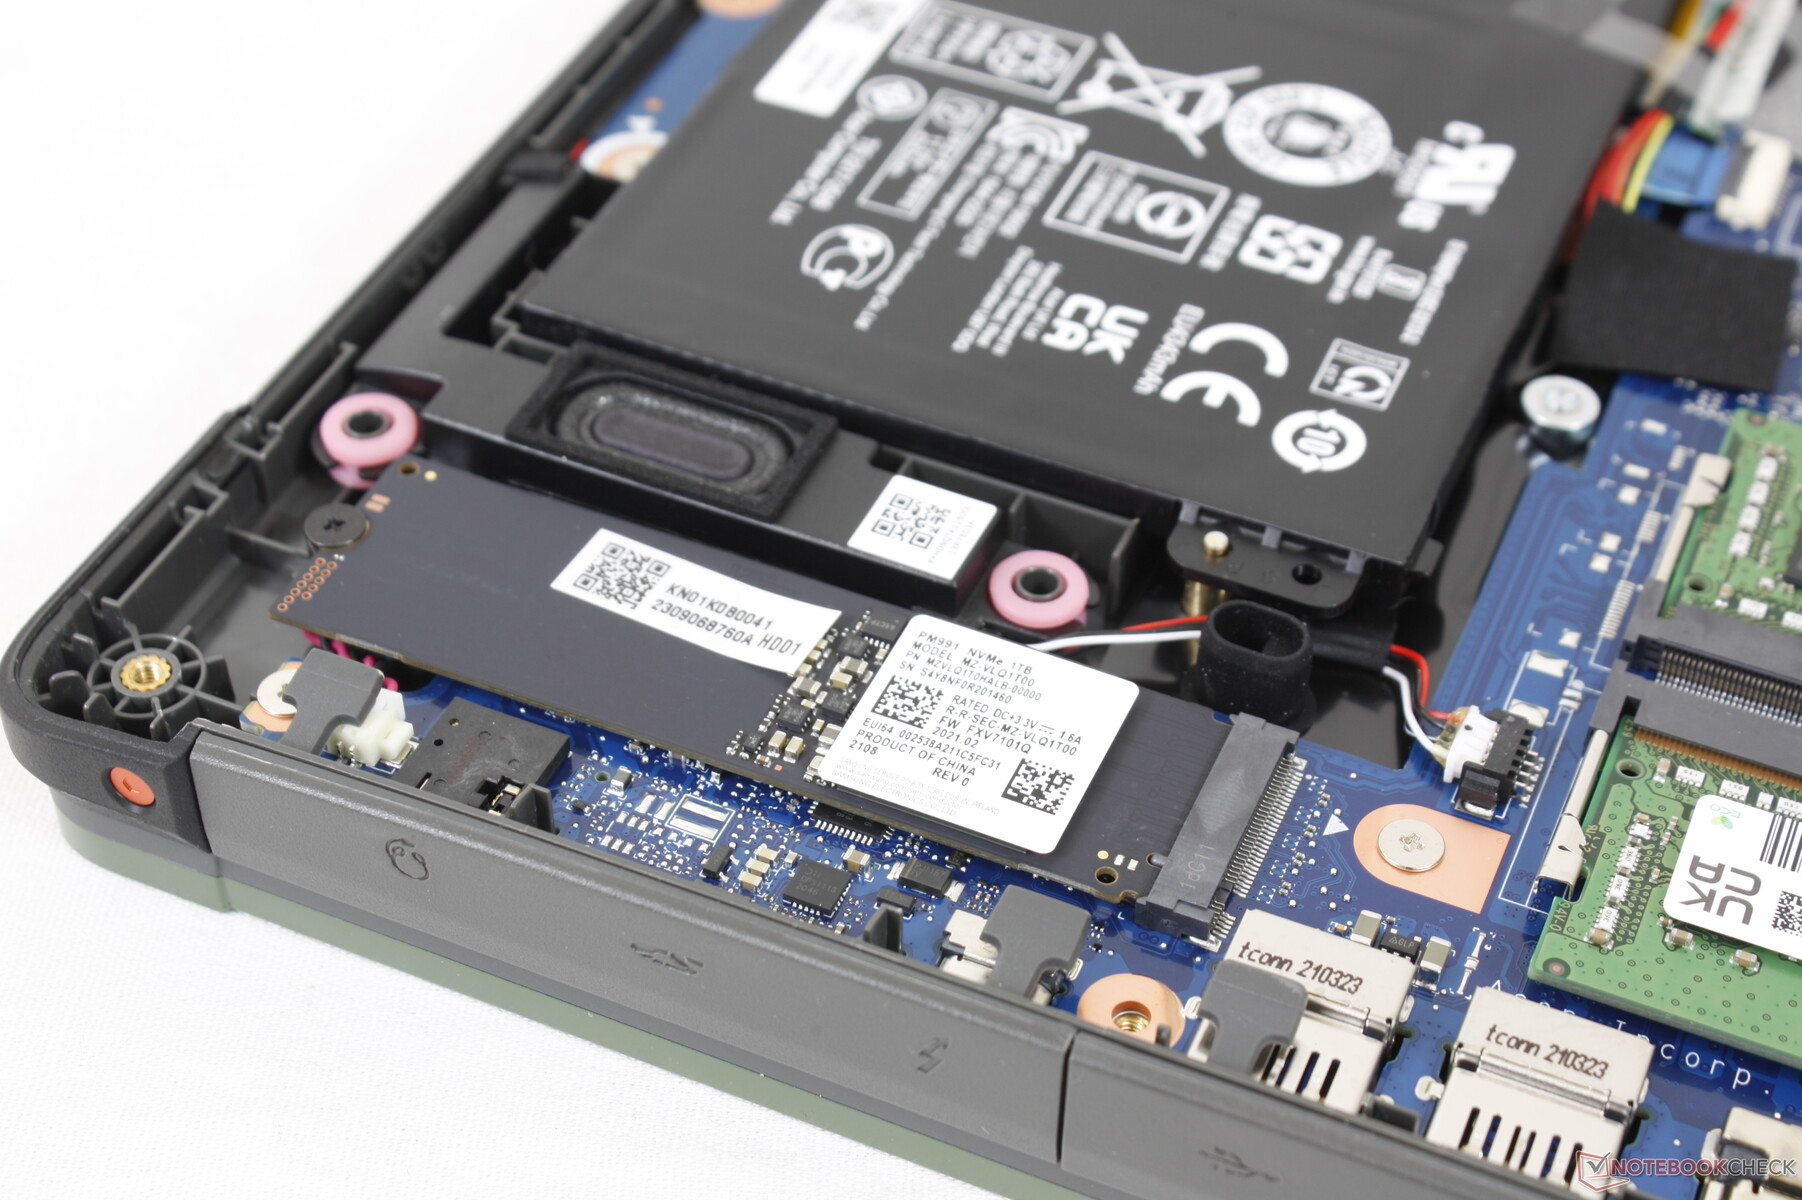
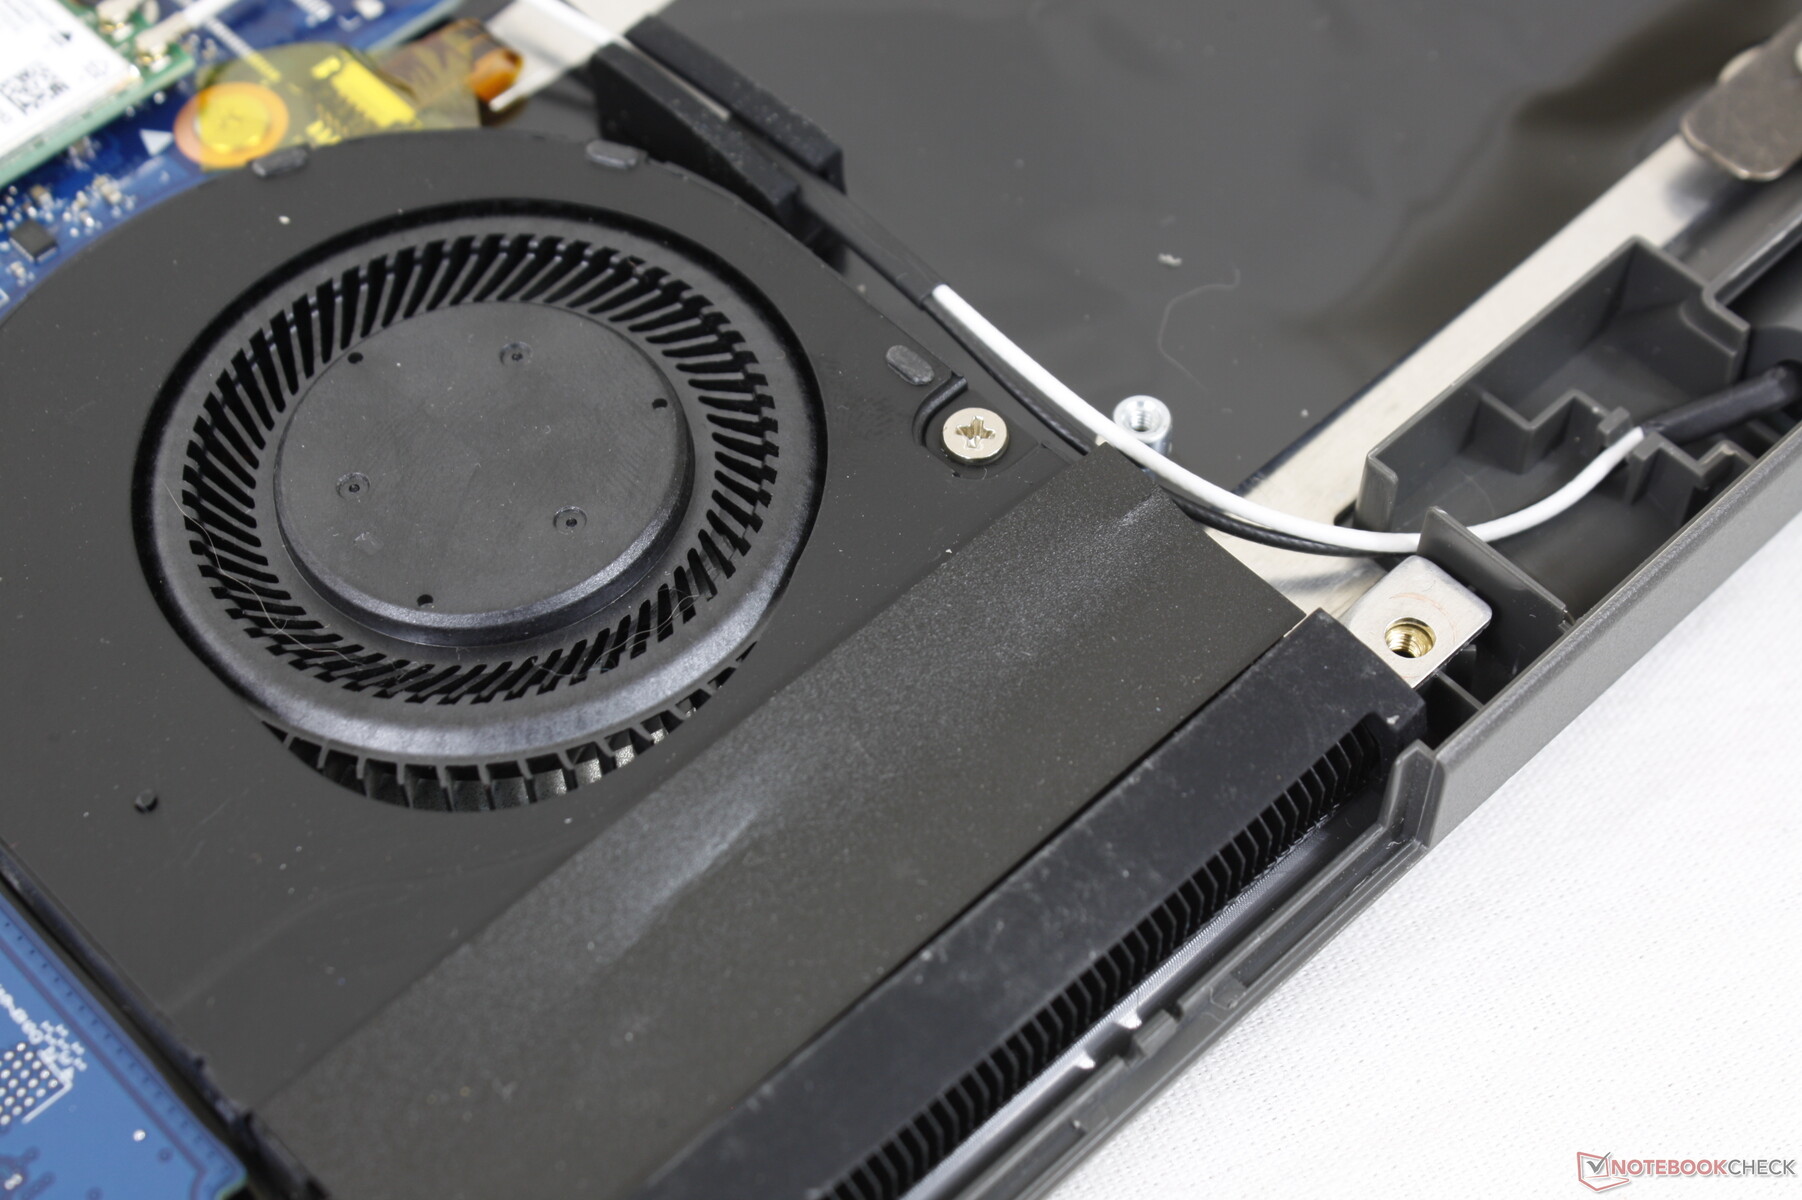
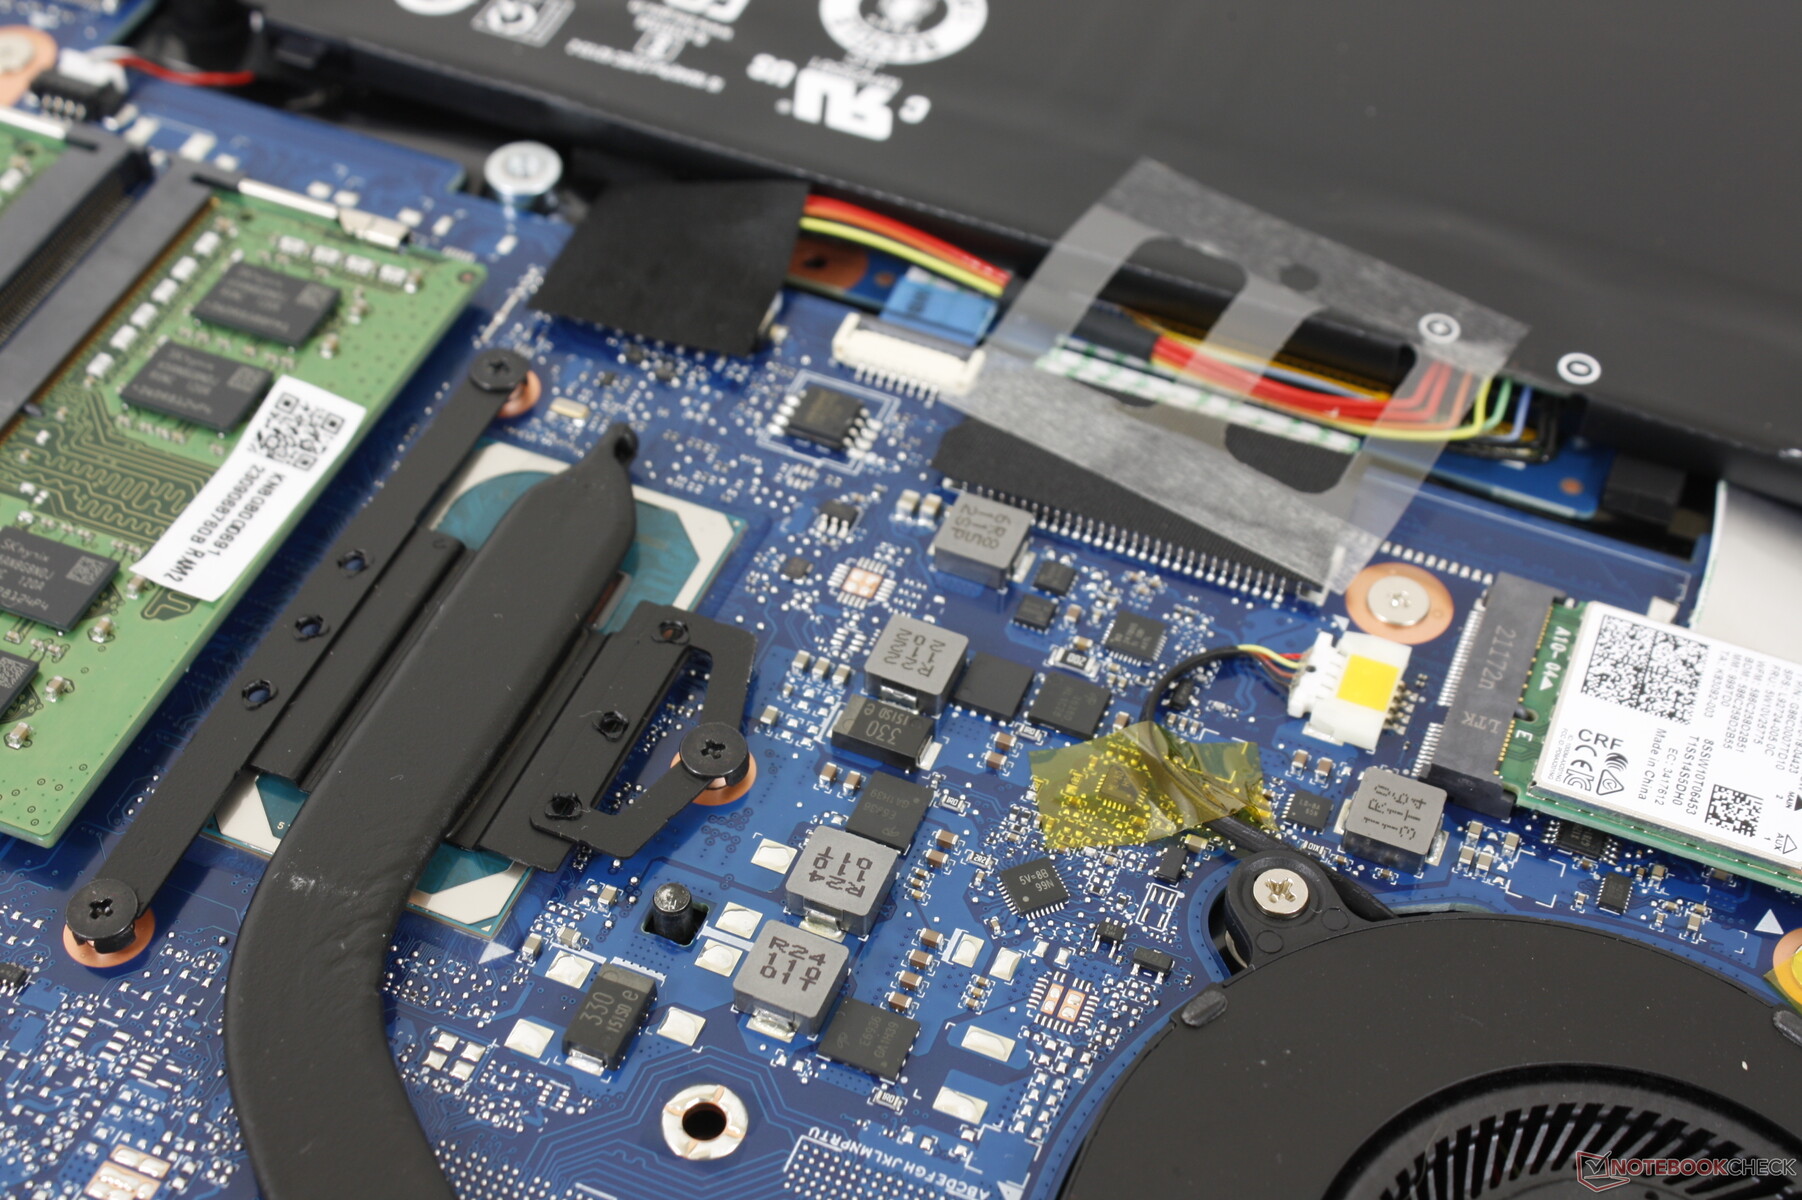
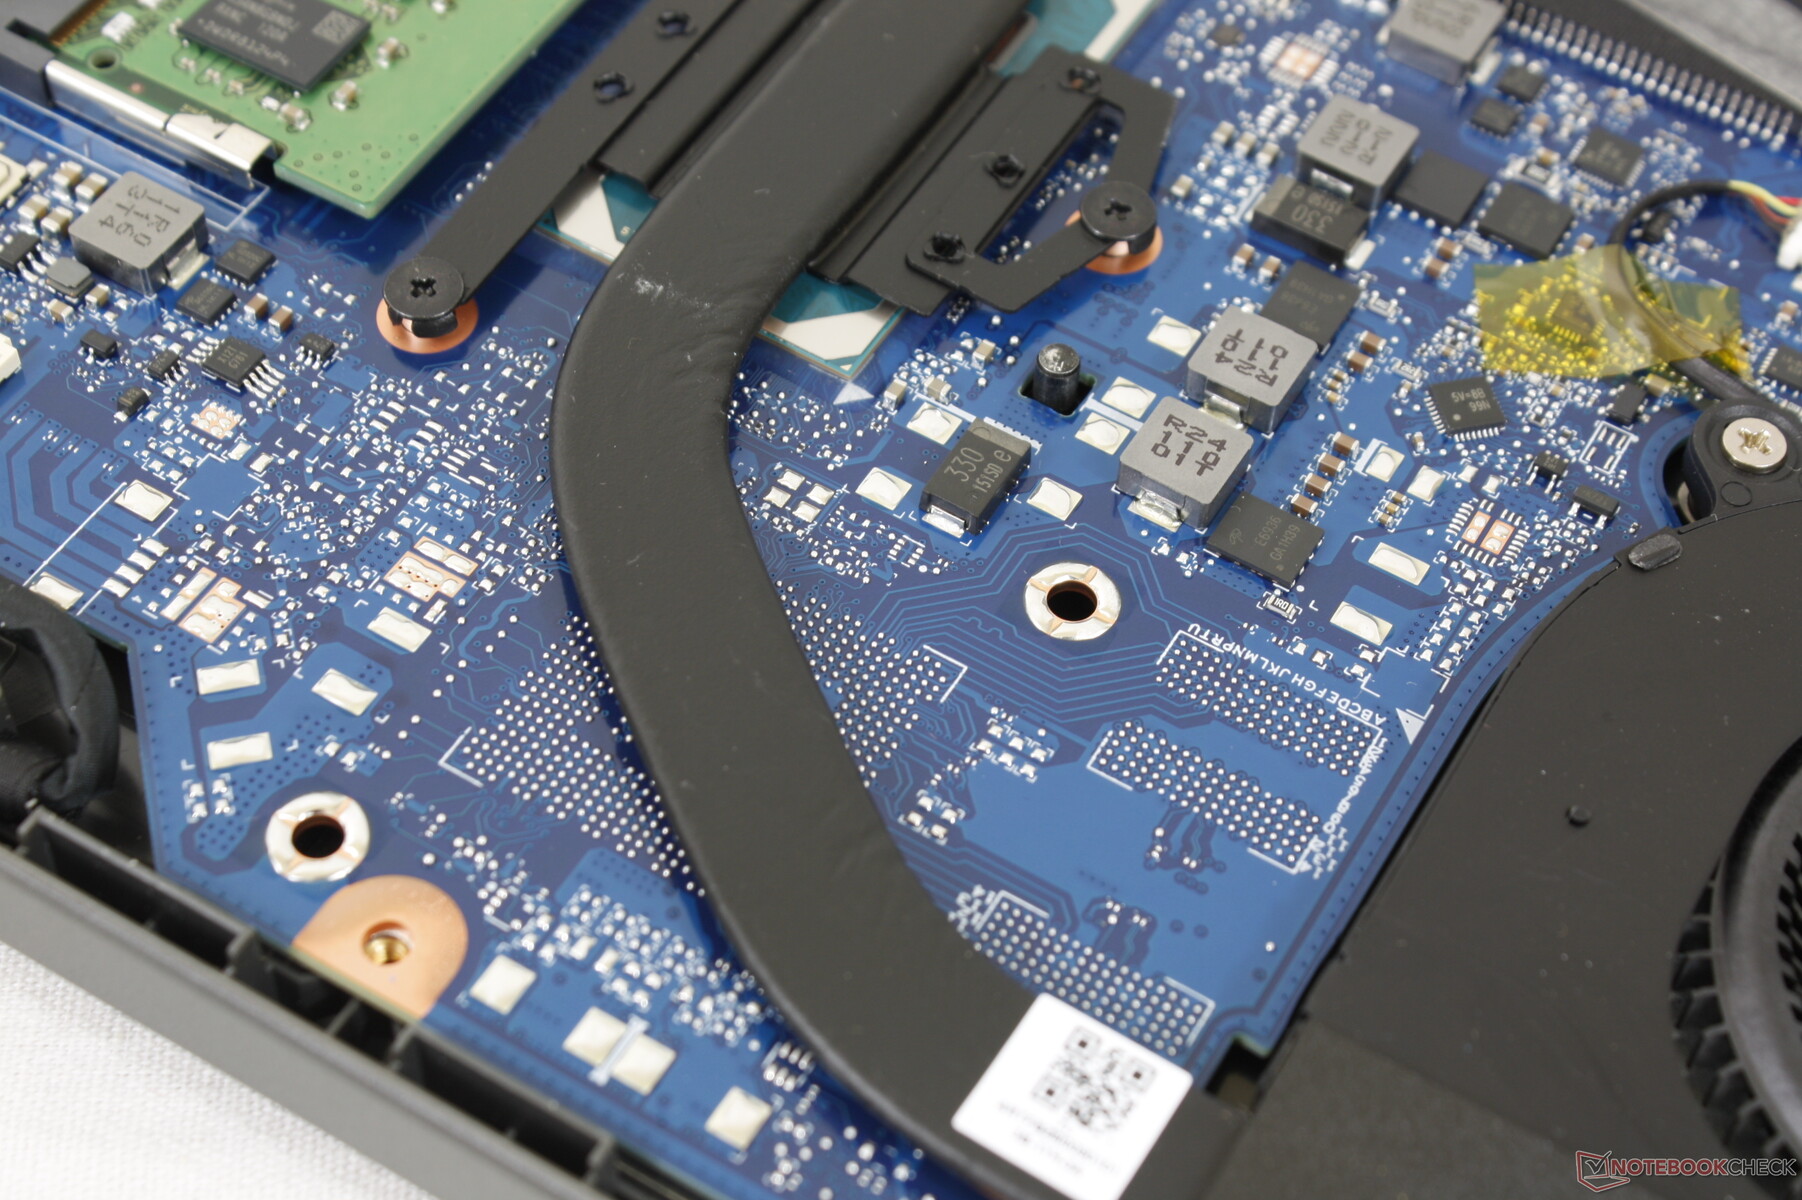
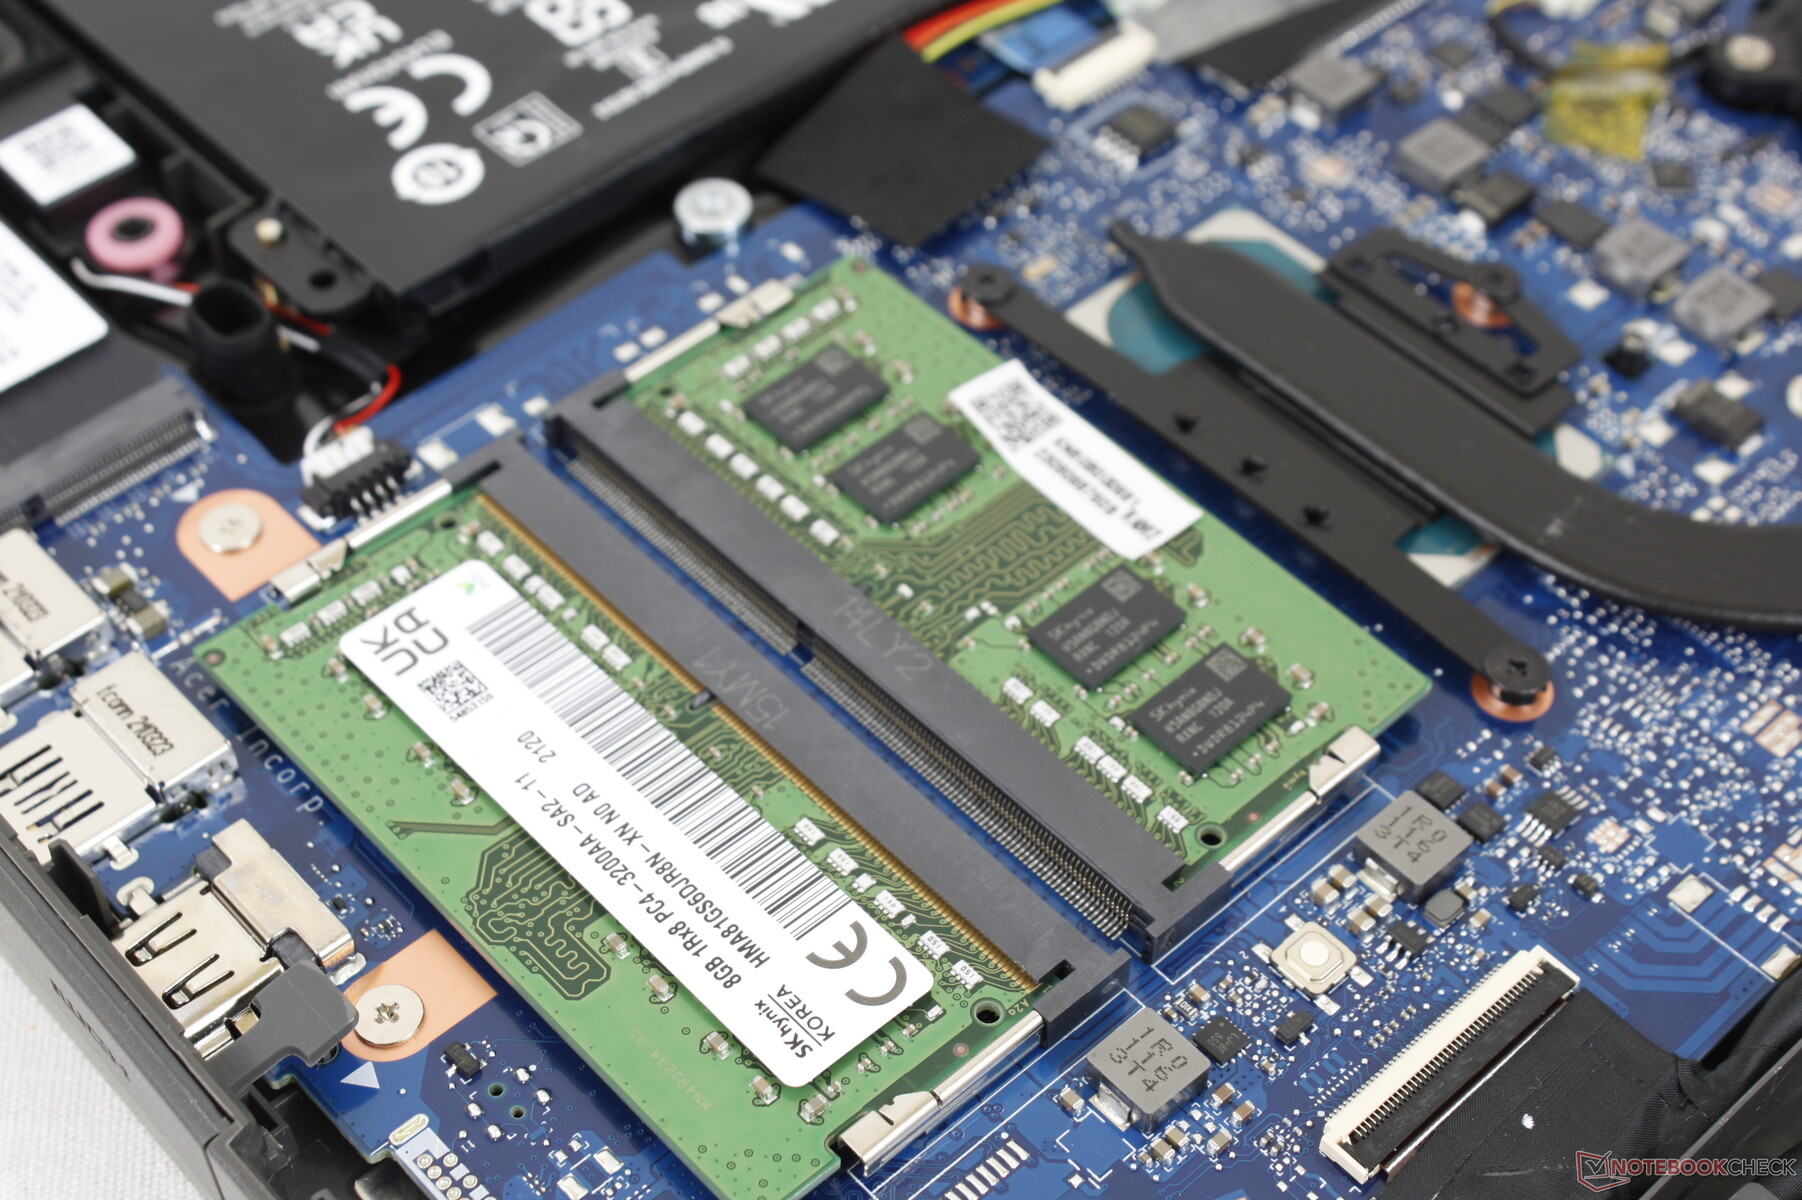
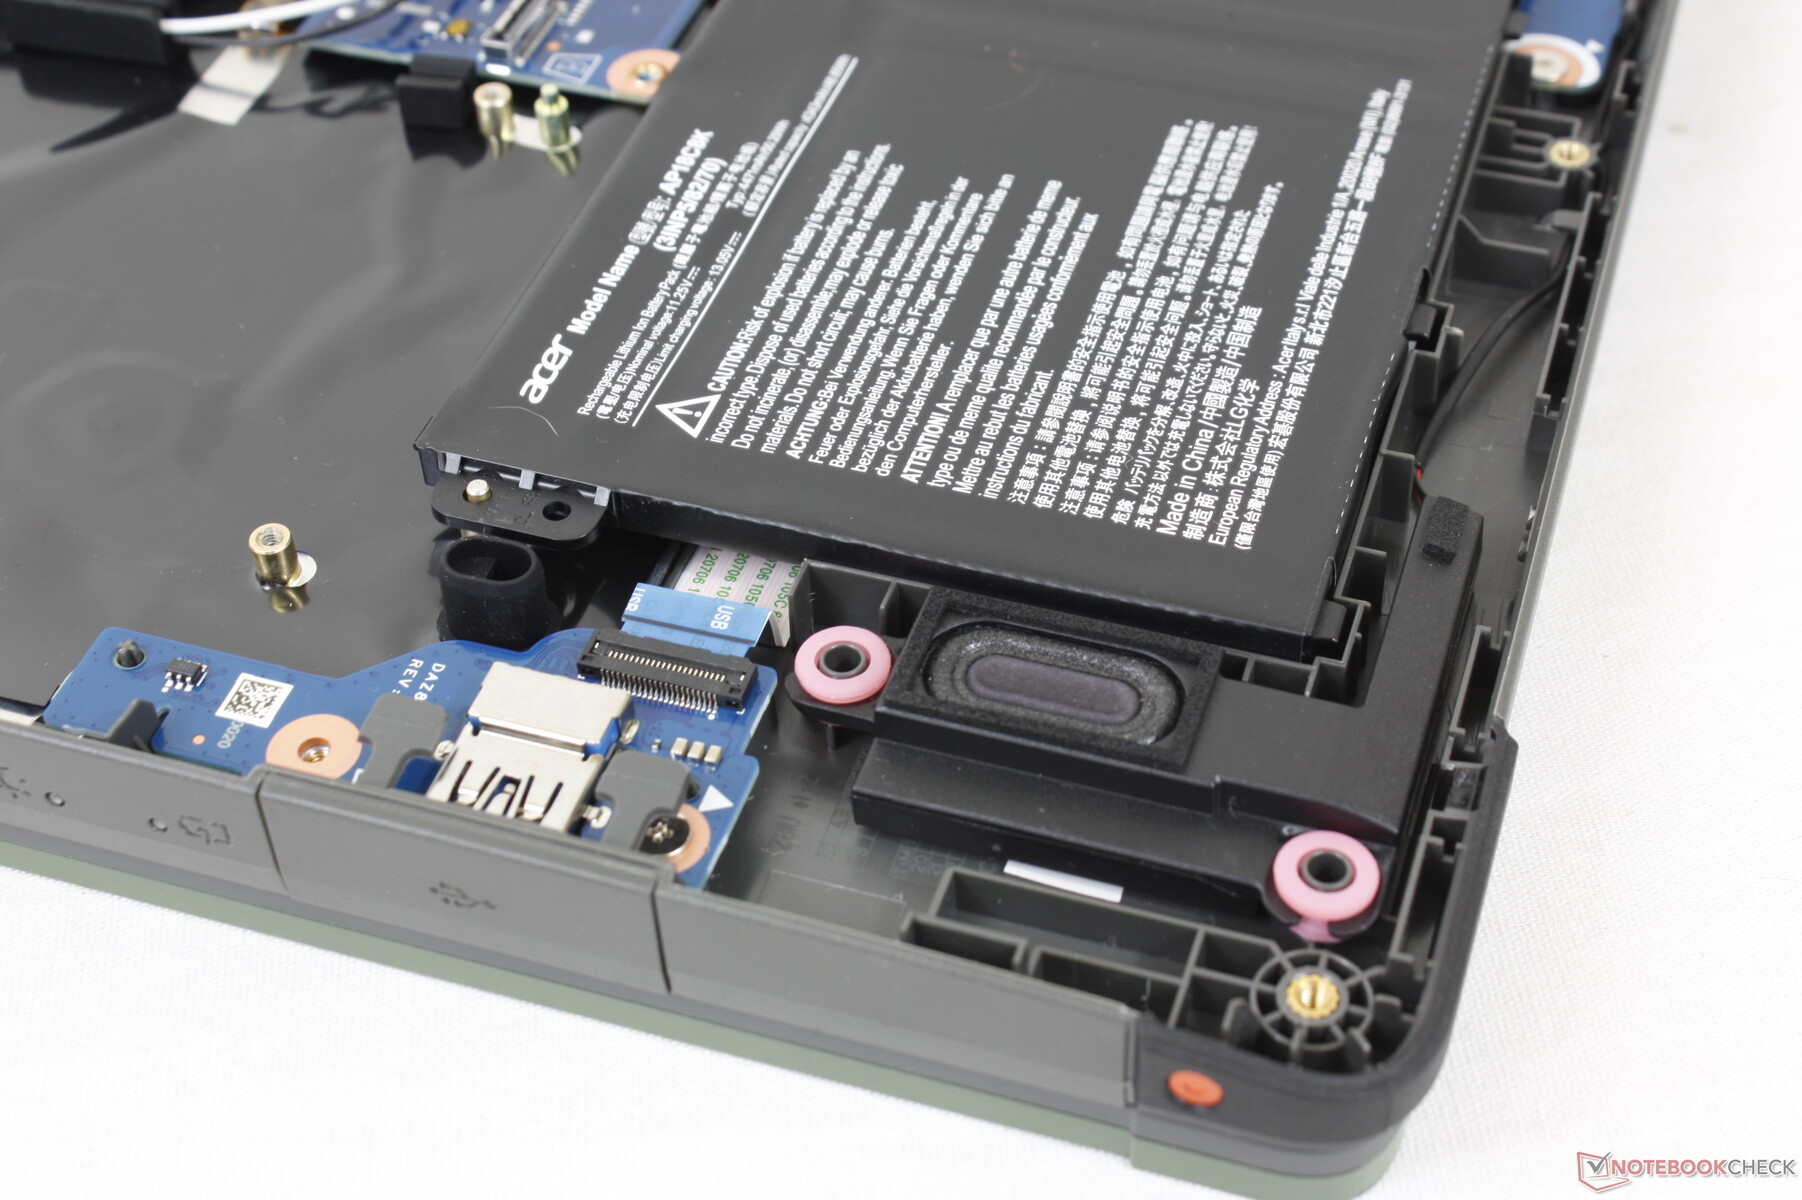
Manutenzione
Il pannello di plastica inferiore si stacca abbastanza facilmente dopo aver rimosso le sue 13 viti Philips. Gli utenti hanno accesso diretto alla batteria, a entrambi gli slot SODIMM, al modulo WLAN e allo slot M.2 PCIe3 x4 2280.
Accessori e garanzia
Non ci sono extra nella scatola di vendita al dettaglio oltre all'adattatore AC e alla documentazione. Si applica una garanzia limitata di un anno, mentre molti computer portatili professionali sono in genere dotati di garanzie di due o tre anni
Dispositivi di input
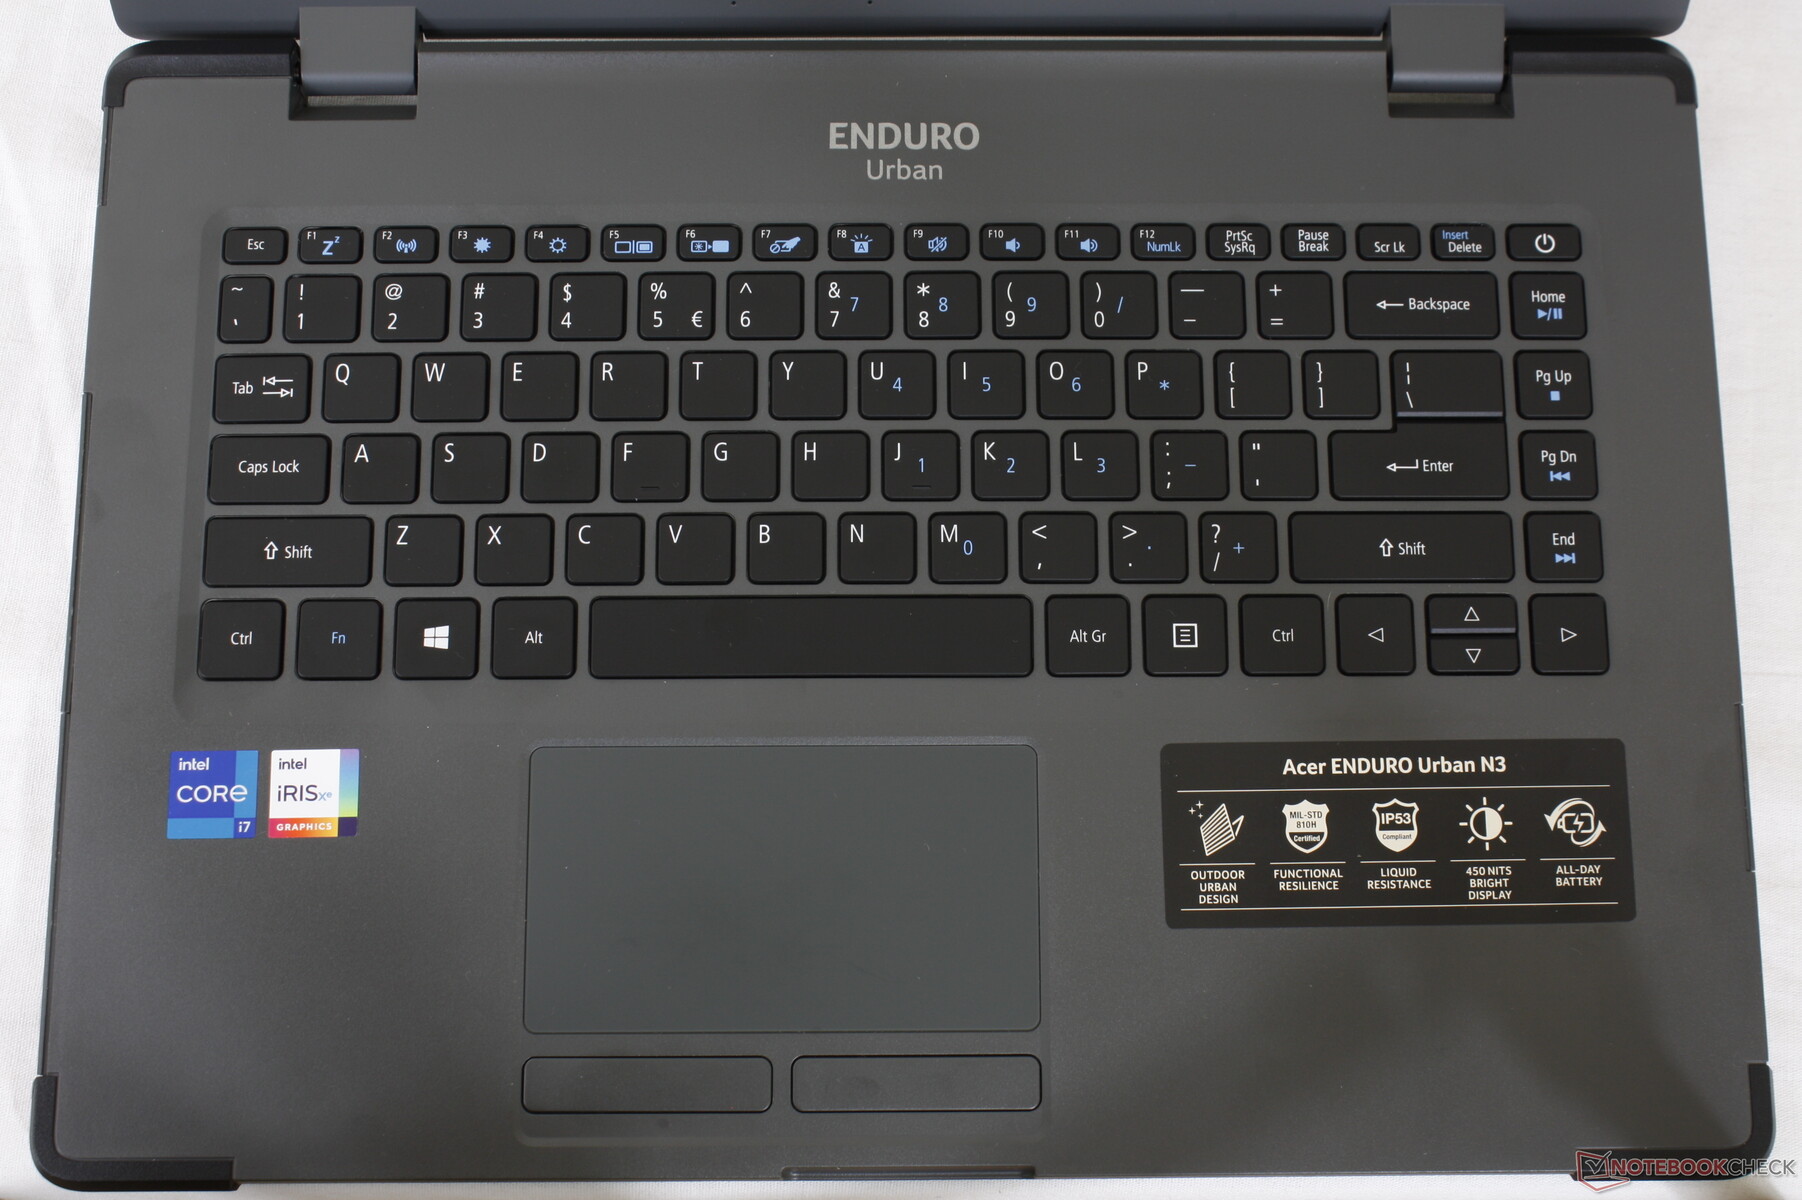
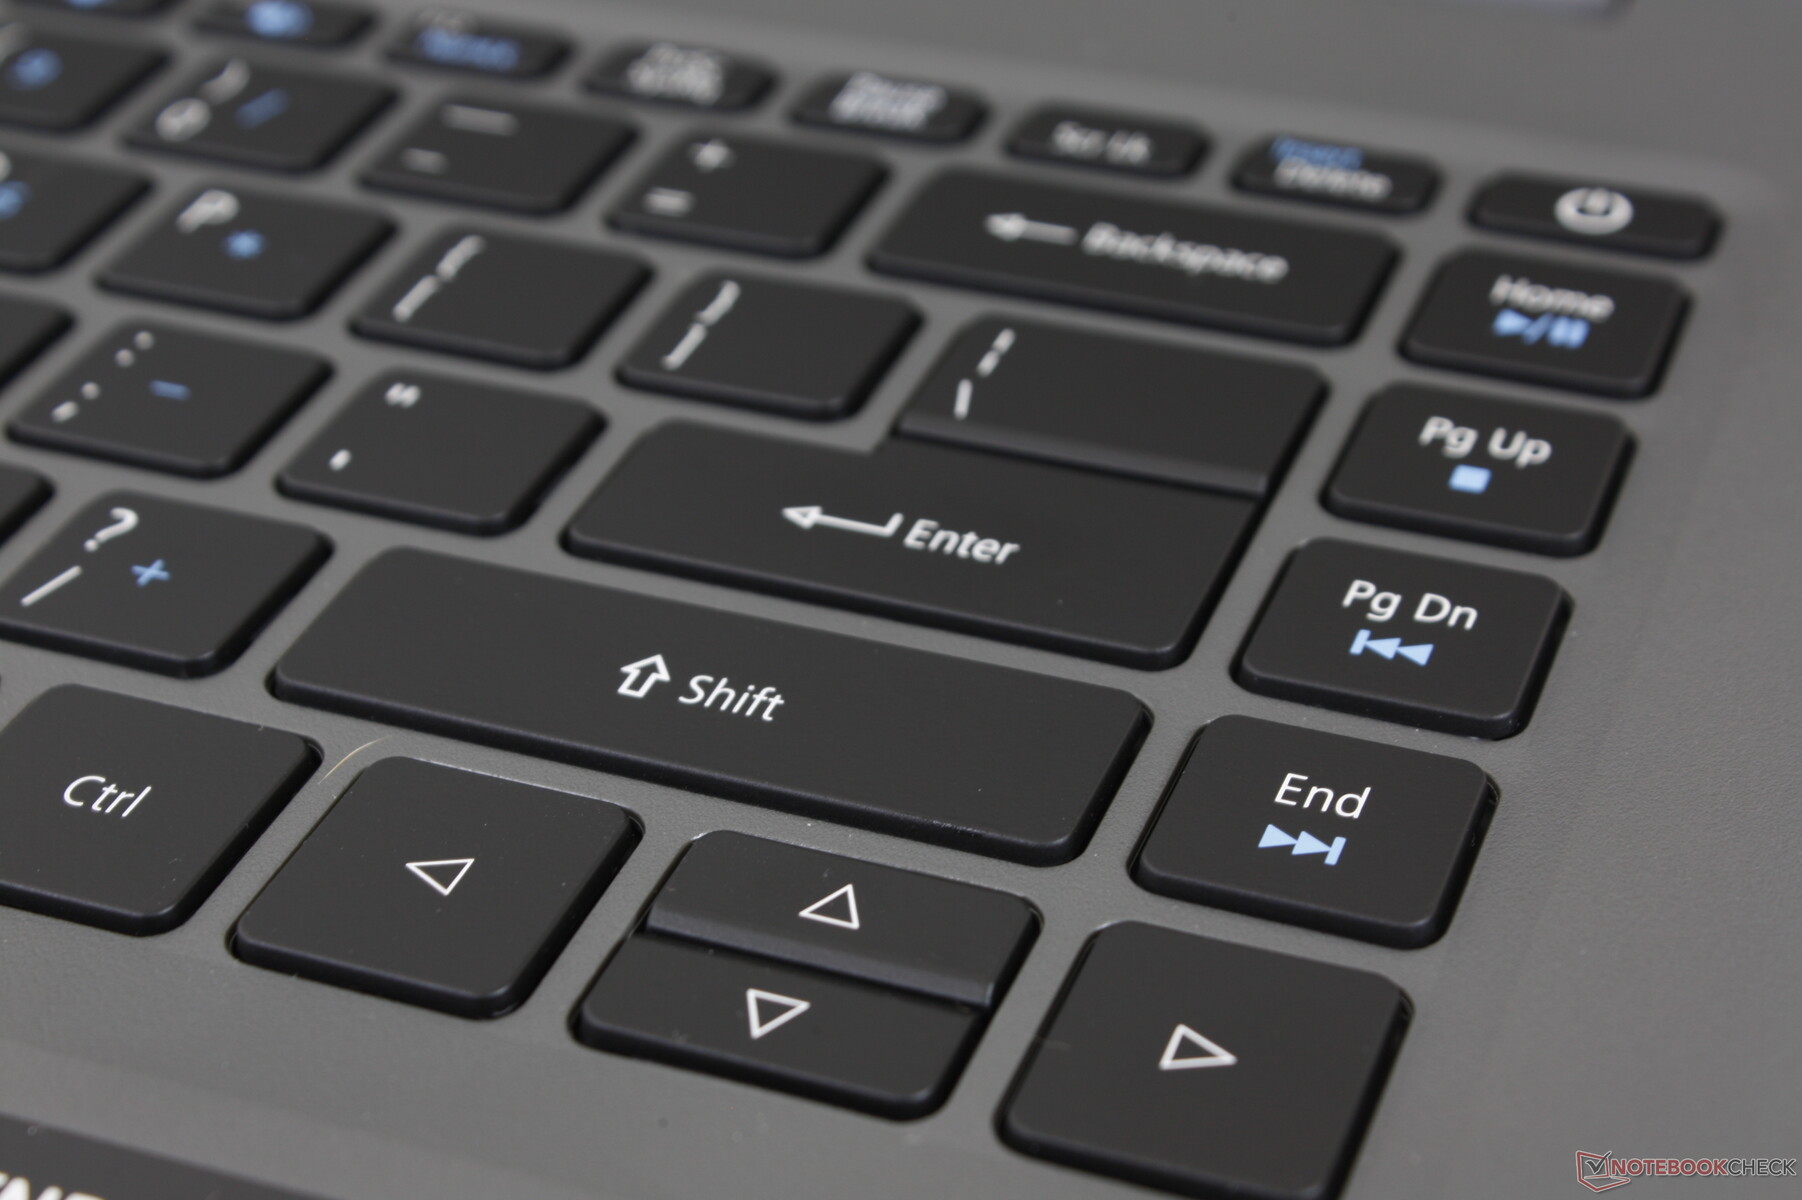
Tastiera
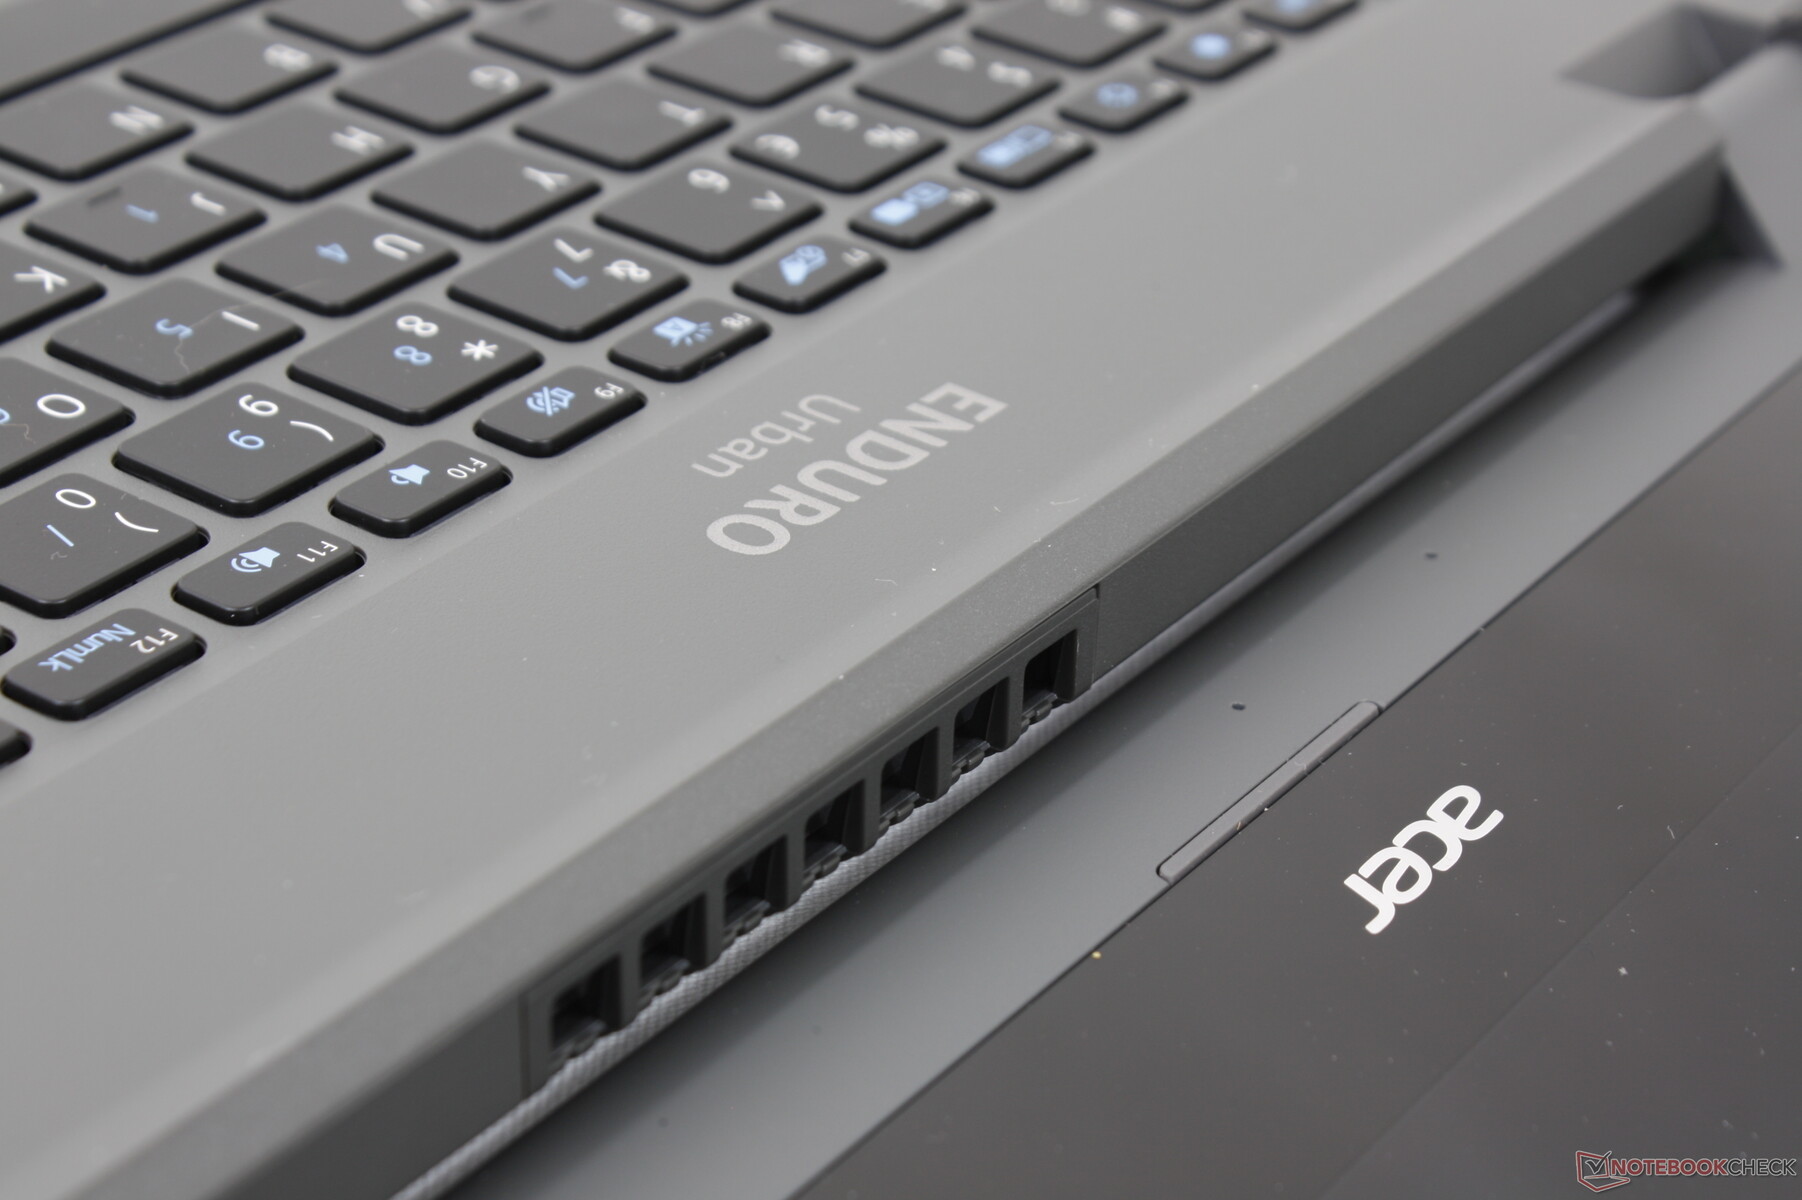
L'esperienza di digitazione è più simile a quella di un Ultrabook standard come l'Asus VivoBook o Dell Inspiron piuttosto che a quella di portatili più professionali come il Durabook S14I o Lenovo ThinkPad che tendono ad avere tasti più solidi e profondi. Se siete abituati a digitare su computer portatili di fascia consumer, allora la tastiera dell'Urban N3 non vi sembrerà così diversa, nel bene e nel male. Il rumore dei tasti è sul lato tranquillo con un feedback morbido ma uniforme su tutti i tasti.
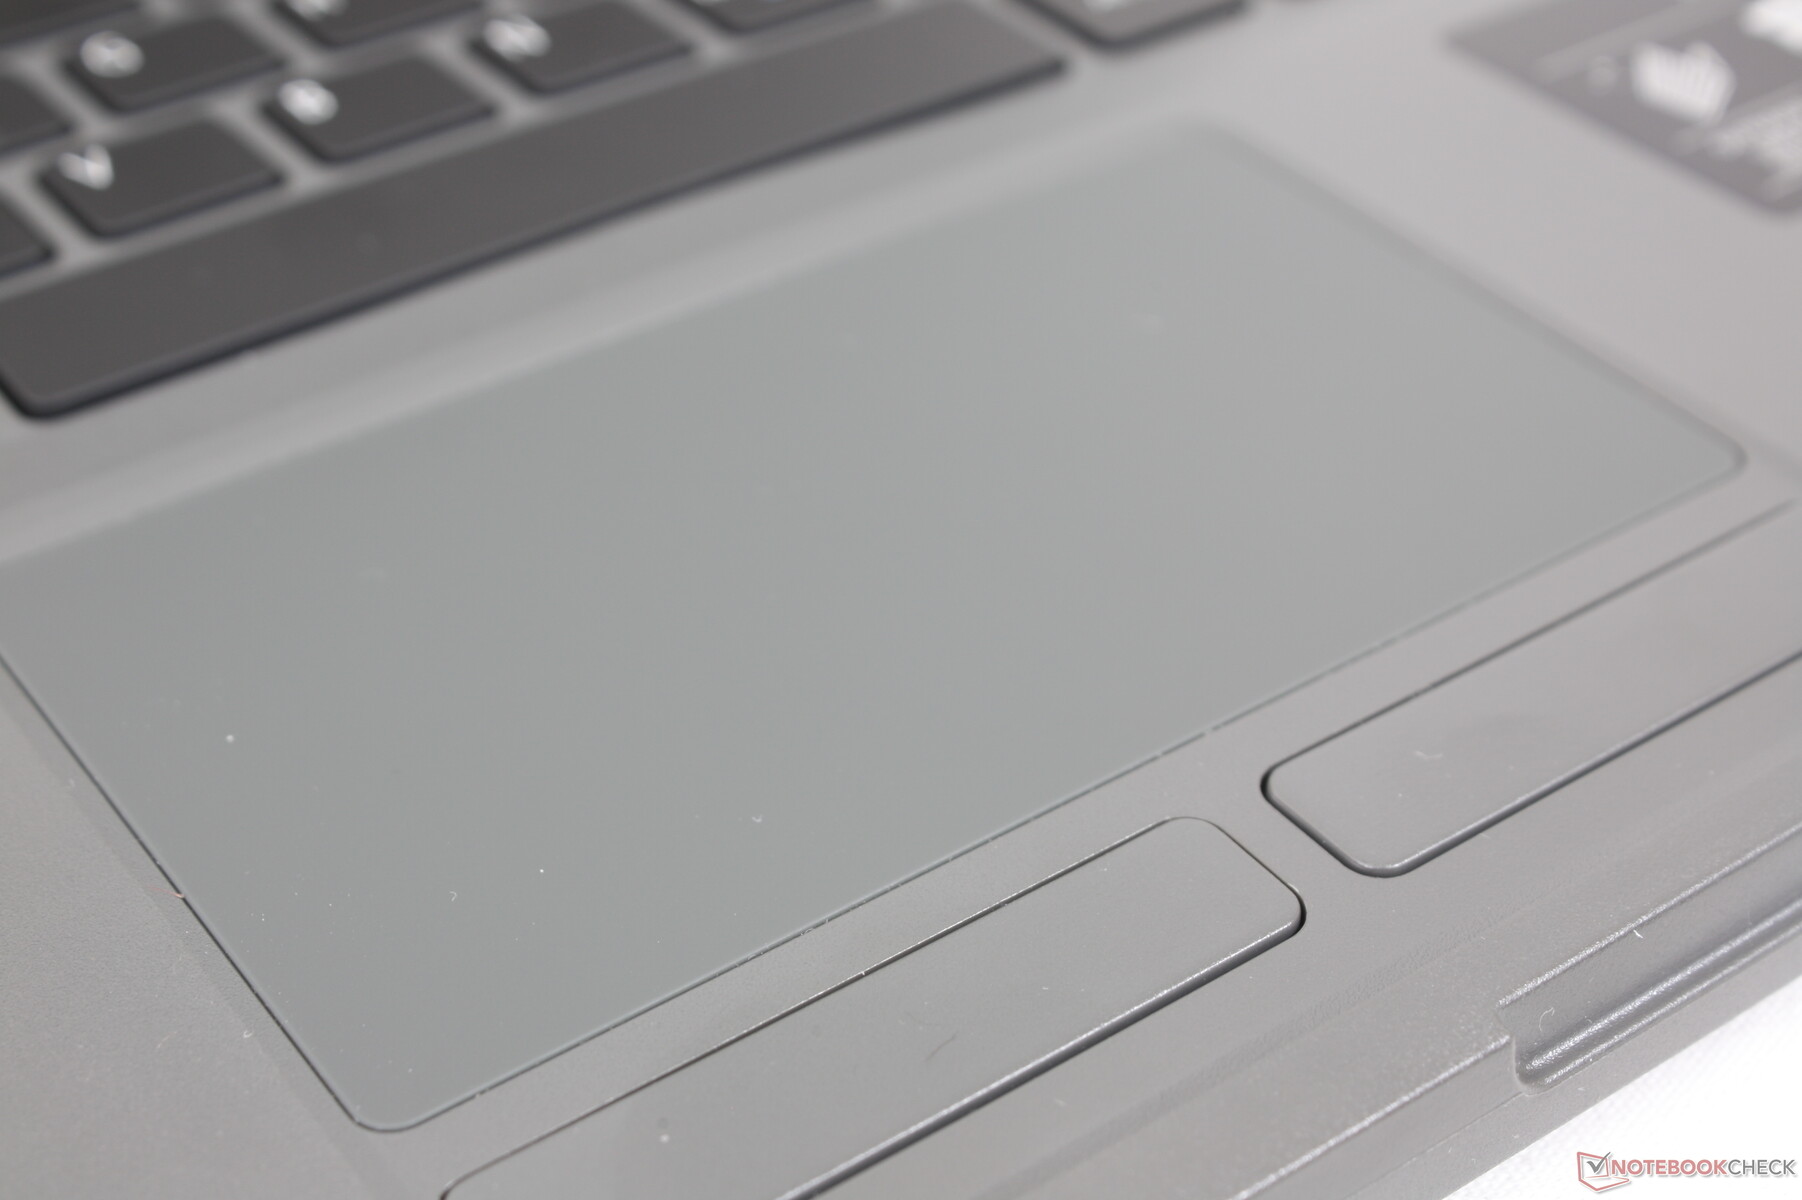
Touchpad
Il touchpad è di dimensioni decenti a 10,5 x 5,9 cm. Lo scorrimento a velocità medio-alte è fluido, mentre le velocità più lente tendono ad attaccarsi per un maggiore trascinamento.

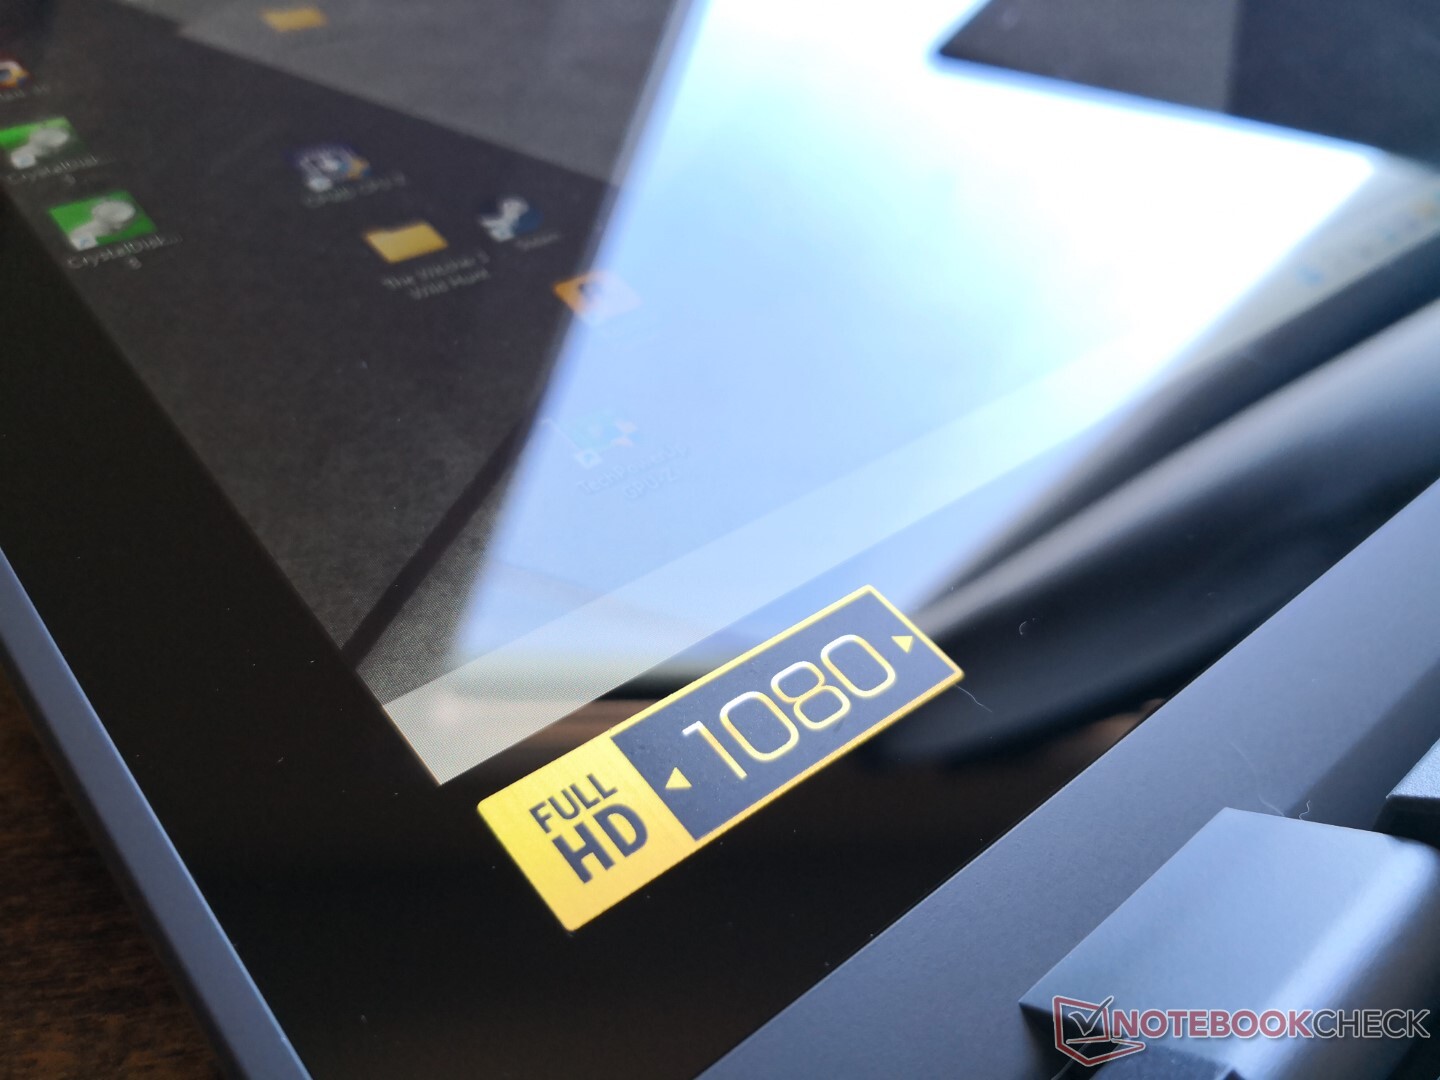
Visualizza
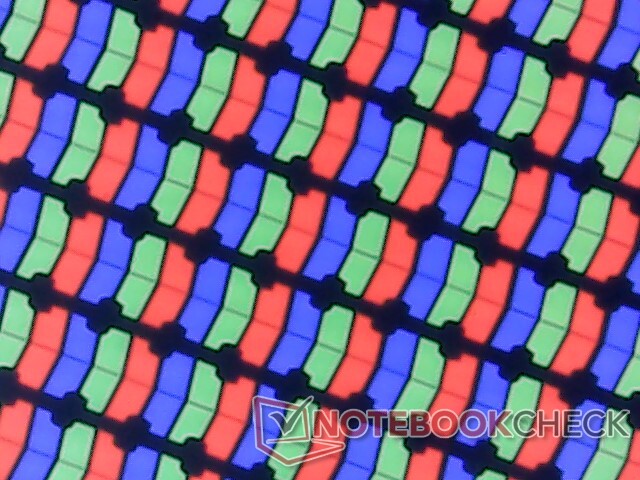
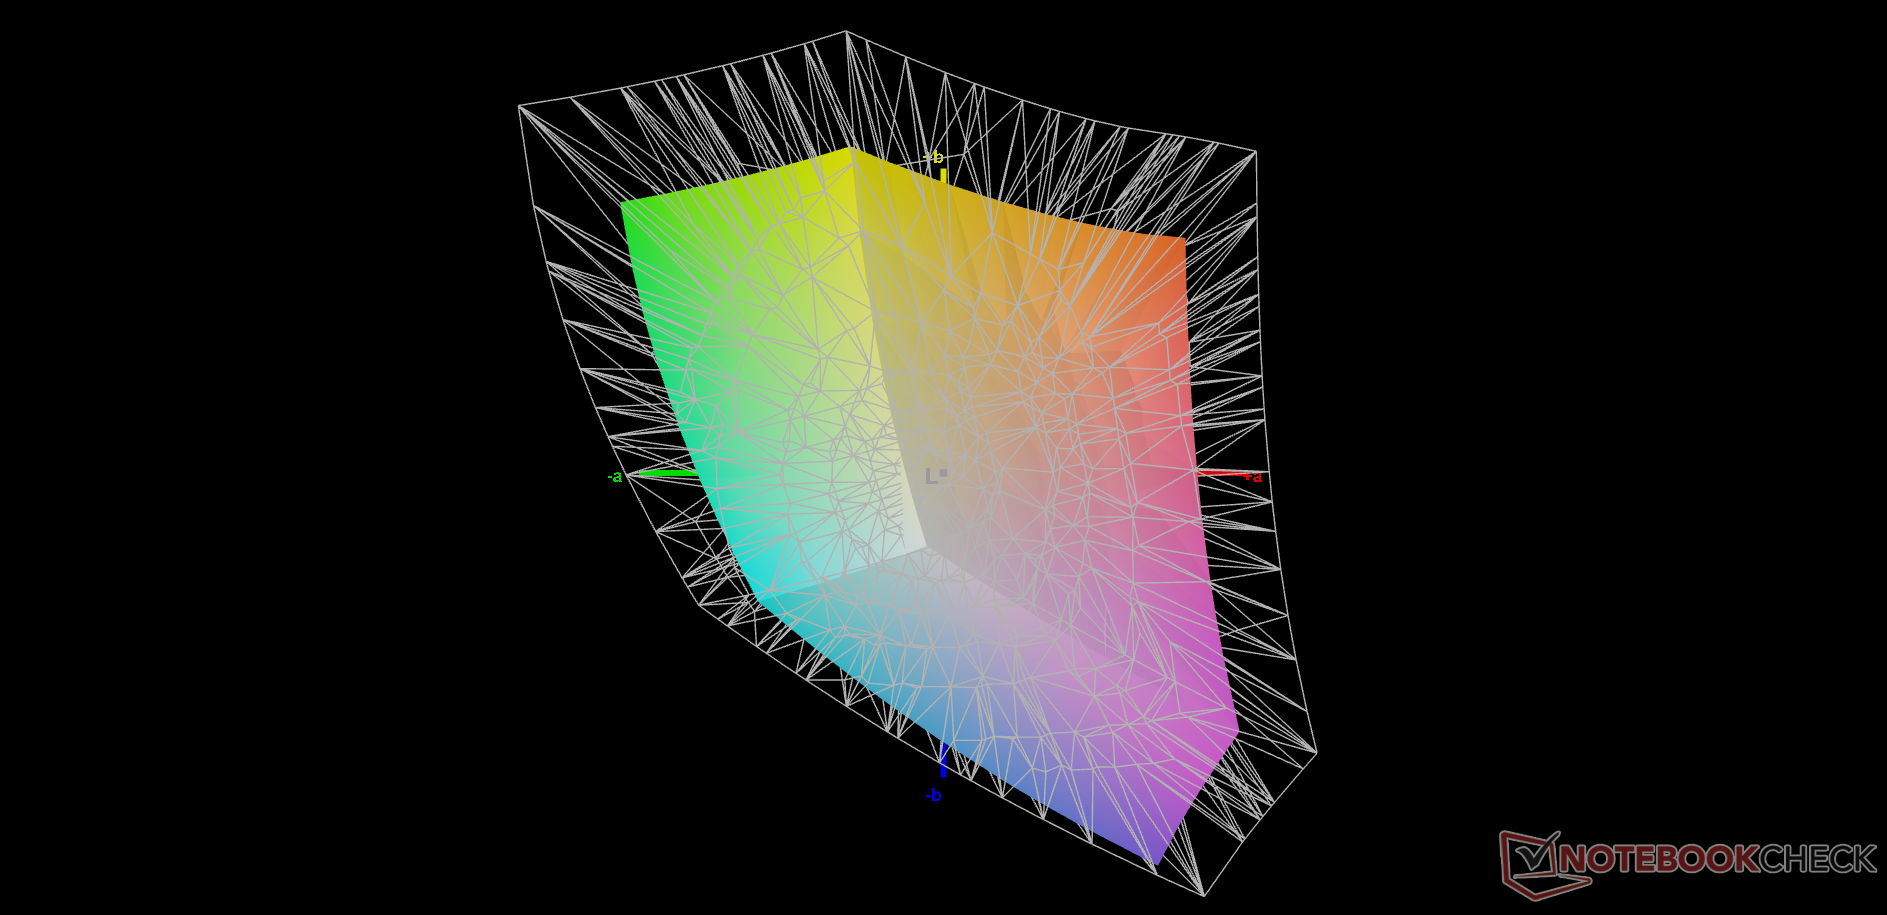
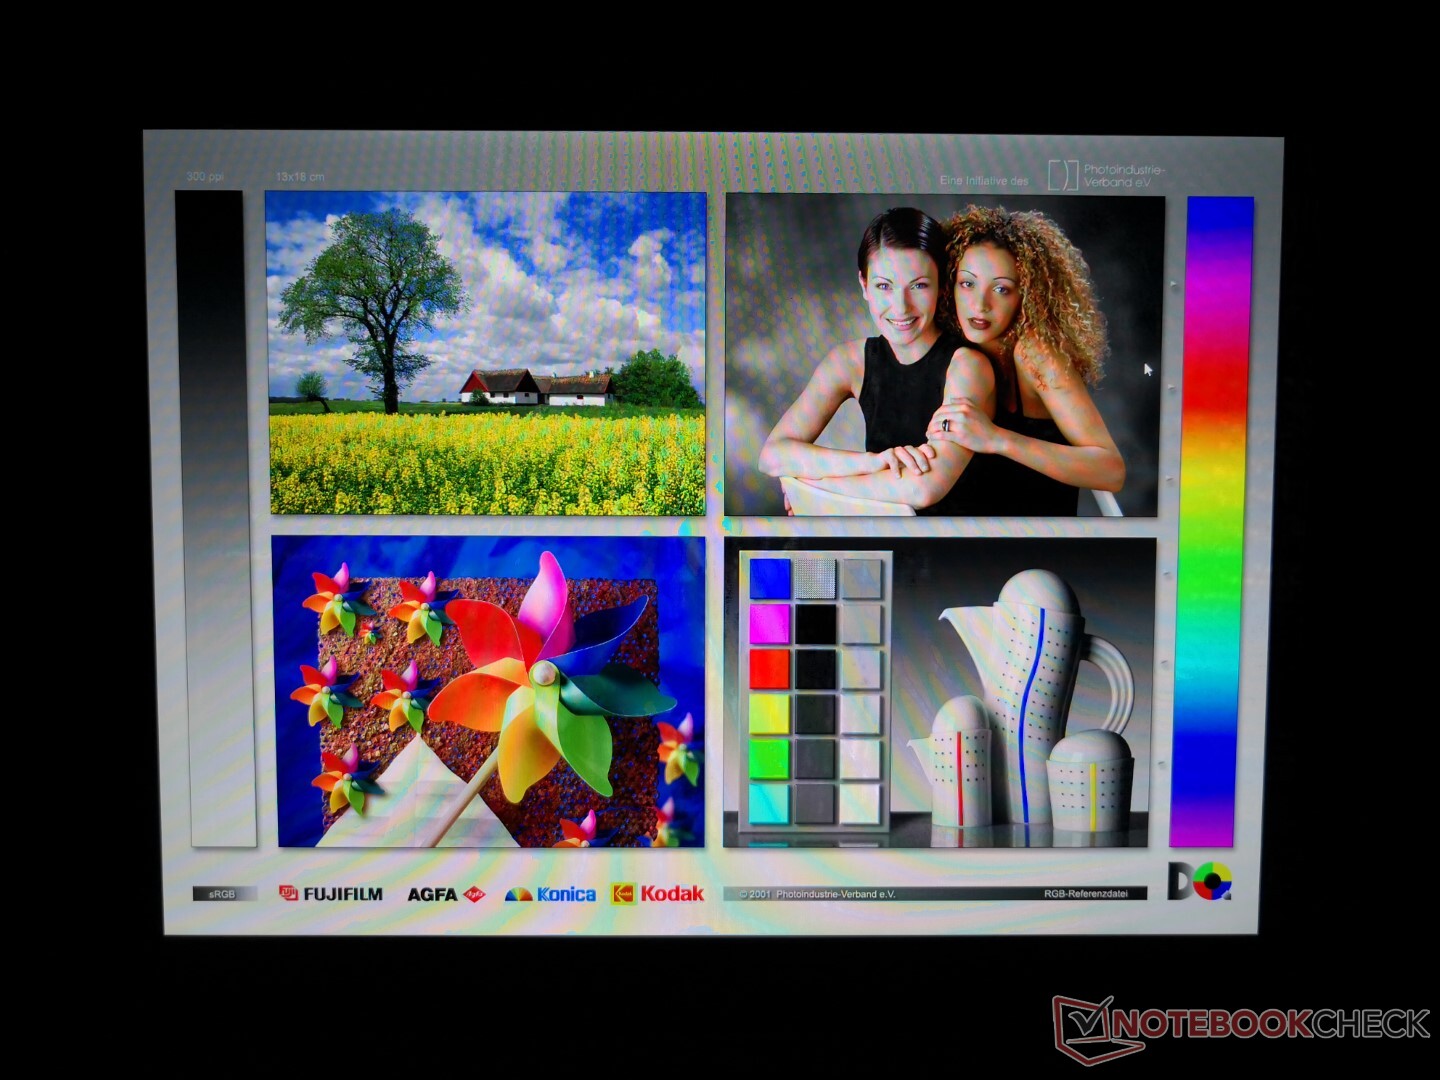
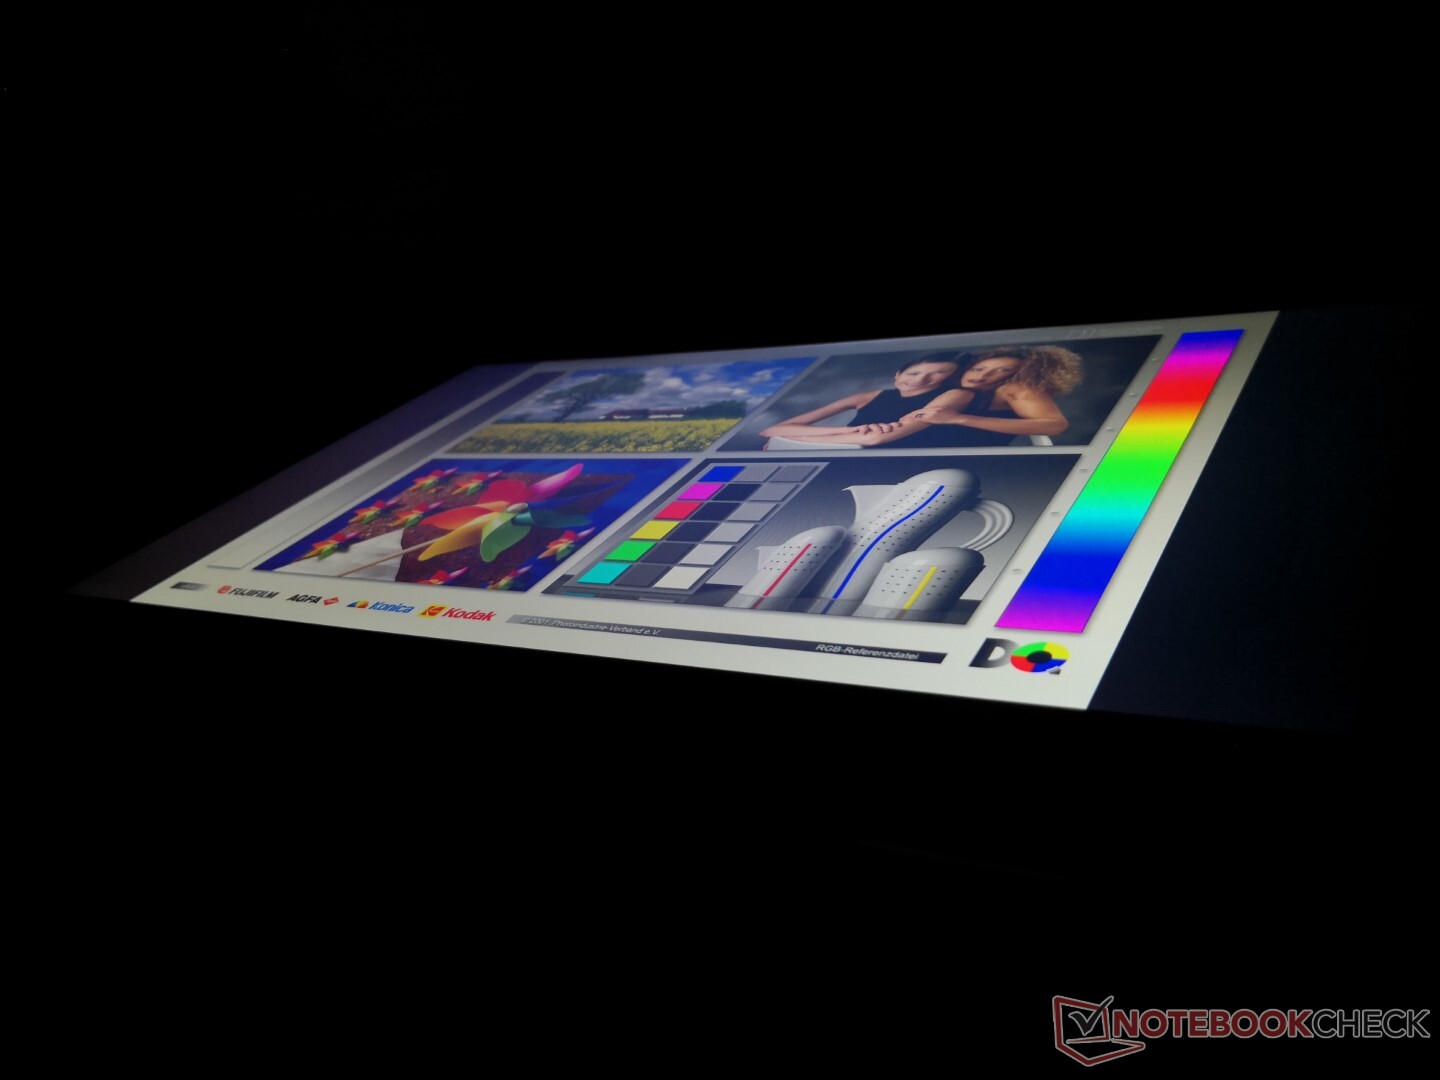
Il pannello XR140EA6T non si trova su nessun altro portatile nel nostro database. Fortunatamente, i suoi attributi principali sono eccellenti, specialmente per un portatile rugged. La sua retroilluminazione è luminosa a quasi 500 nits con un contrasto elevato (>1000:1) e una copertura del colore rispettabile
Gli svantaggi includono i lenti tempi di risposta bianco-nero per un ghosting evidente e la presenza di PWM a tutti i livelli di luminosità fino al 99%. Potreste voler evitare questo portatile se i vostri occhi sono sensibili allo sfarfallio sullo schermo. Altri portatili rugged come il Durabook S14I possono offrire display ancora più luminosi di oltre 1000 nits.
| |||||||||||||||||||||||||
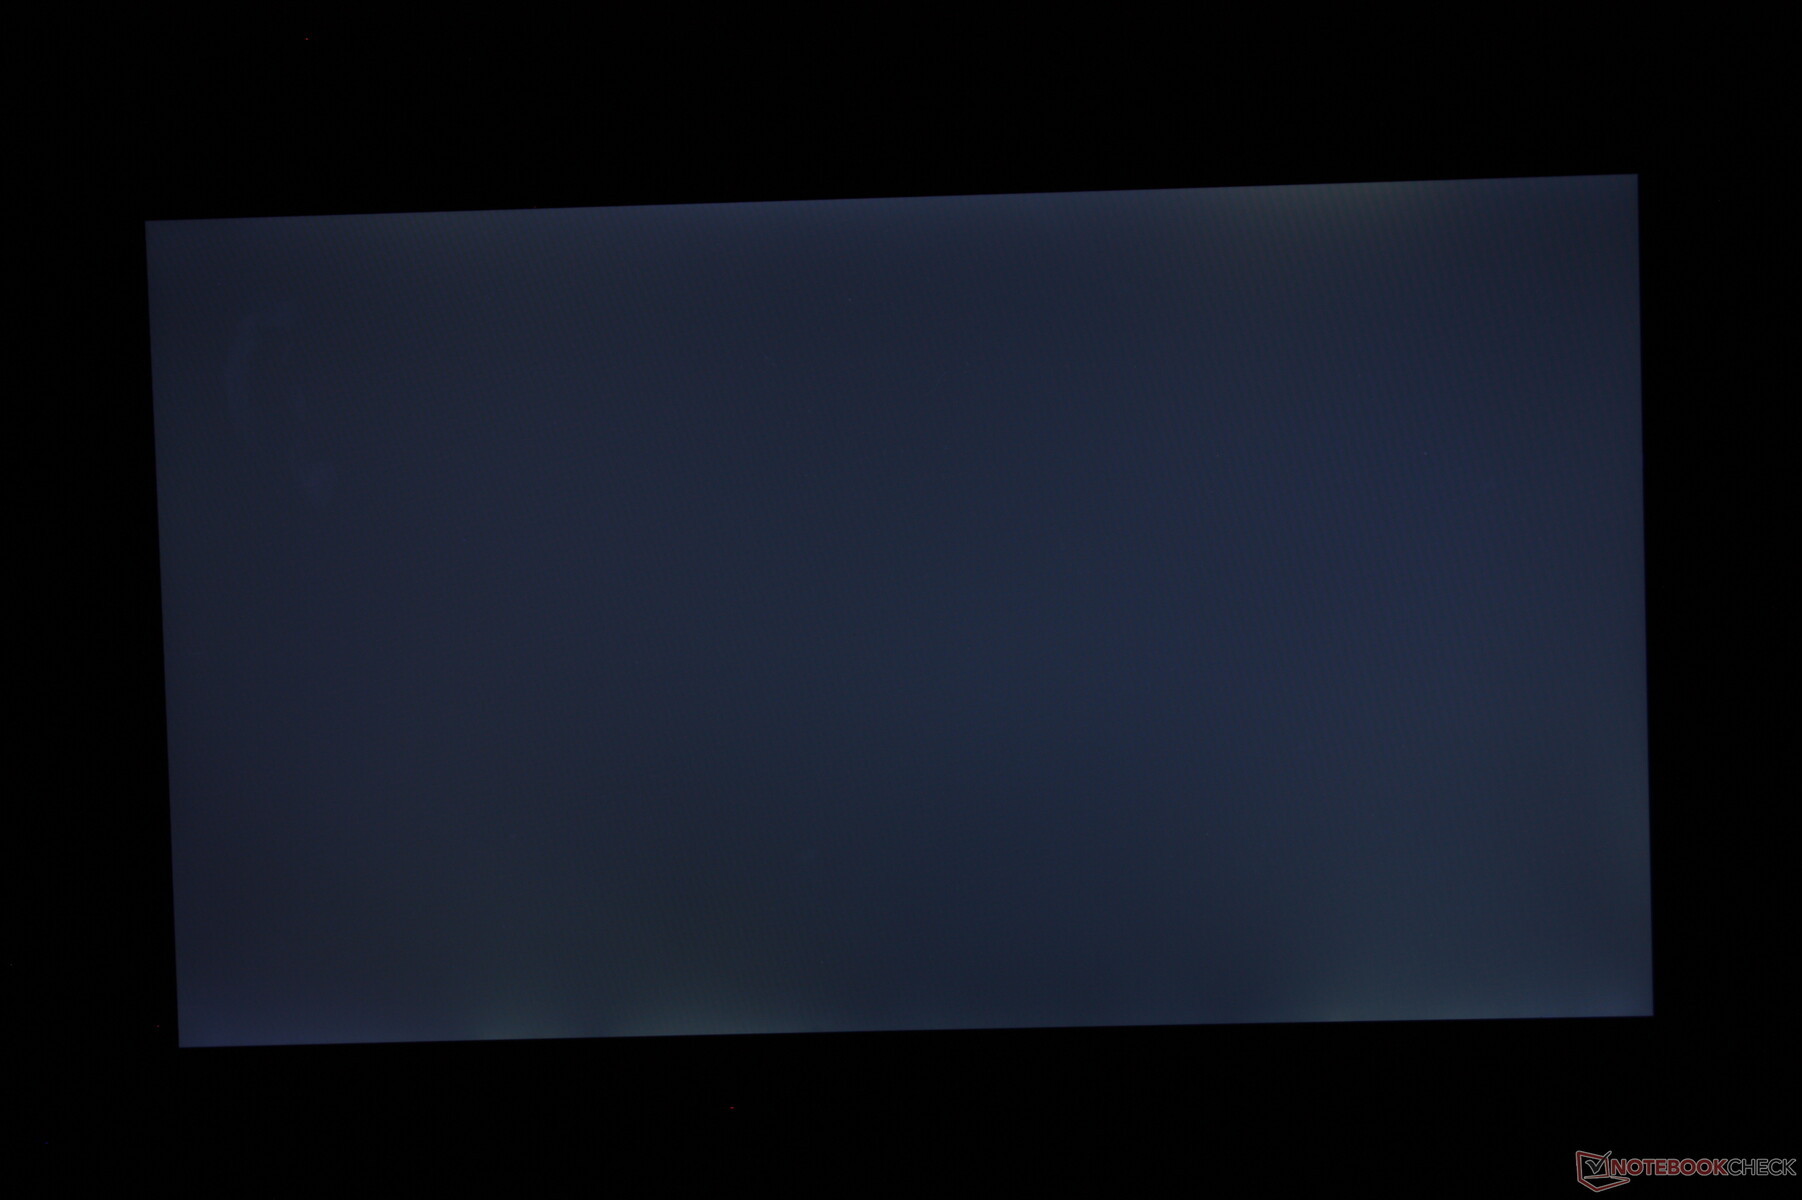
Distribuzione della luminosità: 89 %
Al centro con la batteria: 487.8 cd/m²
Contrasto: 1016:1 (Nero: 0.48 cd/m²)
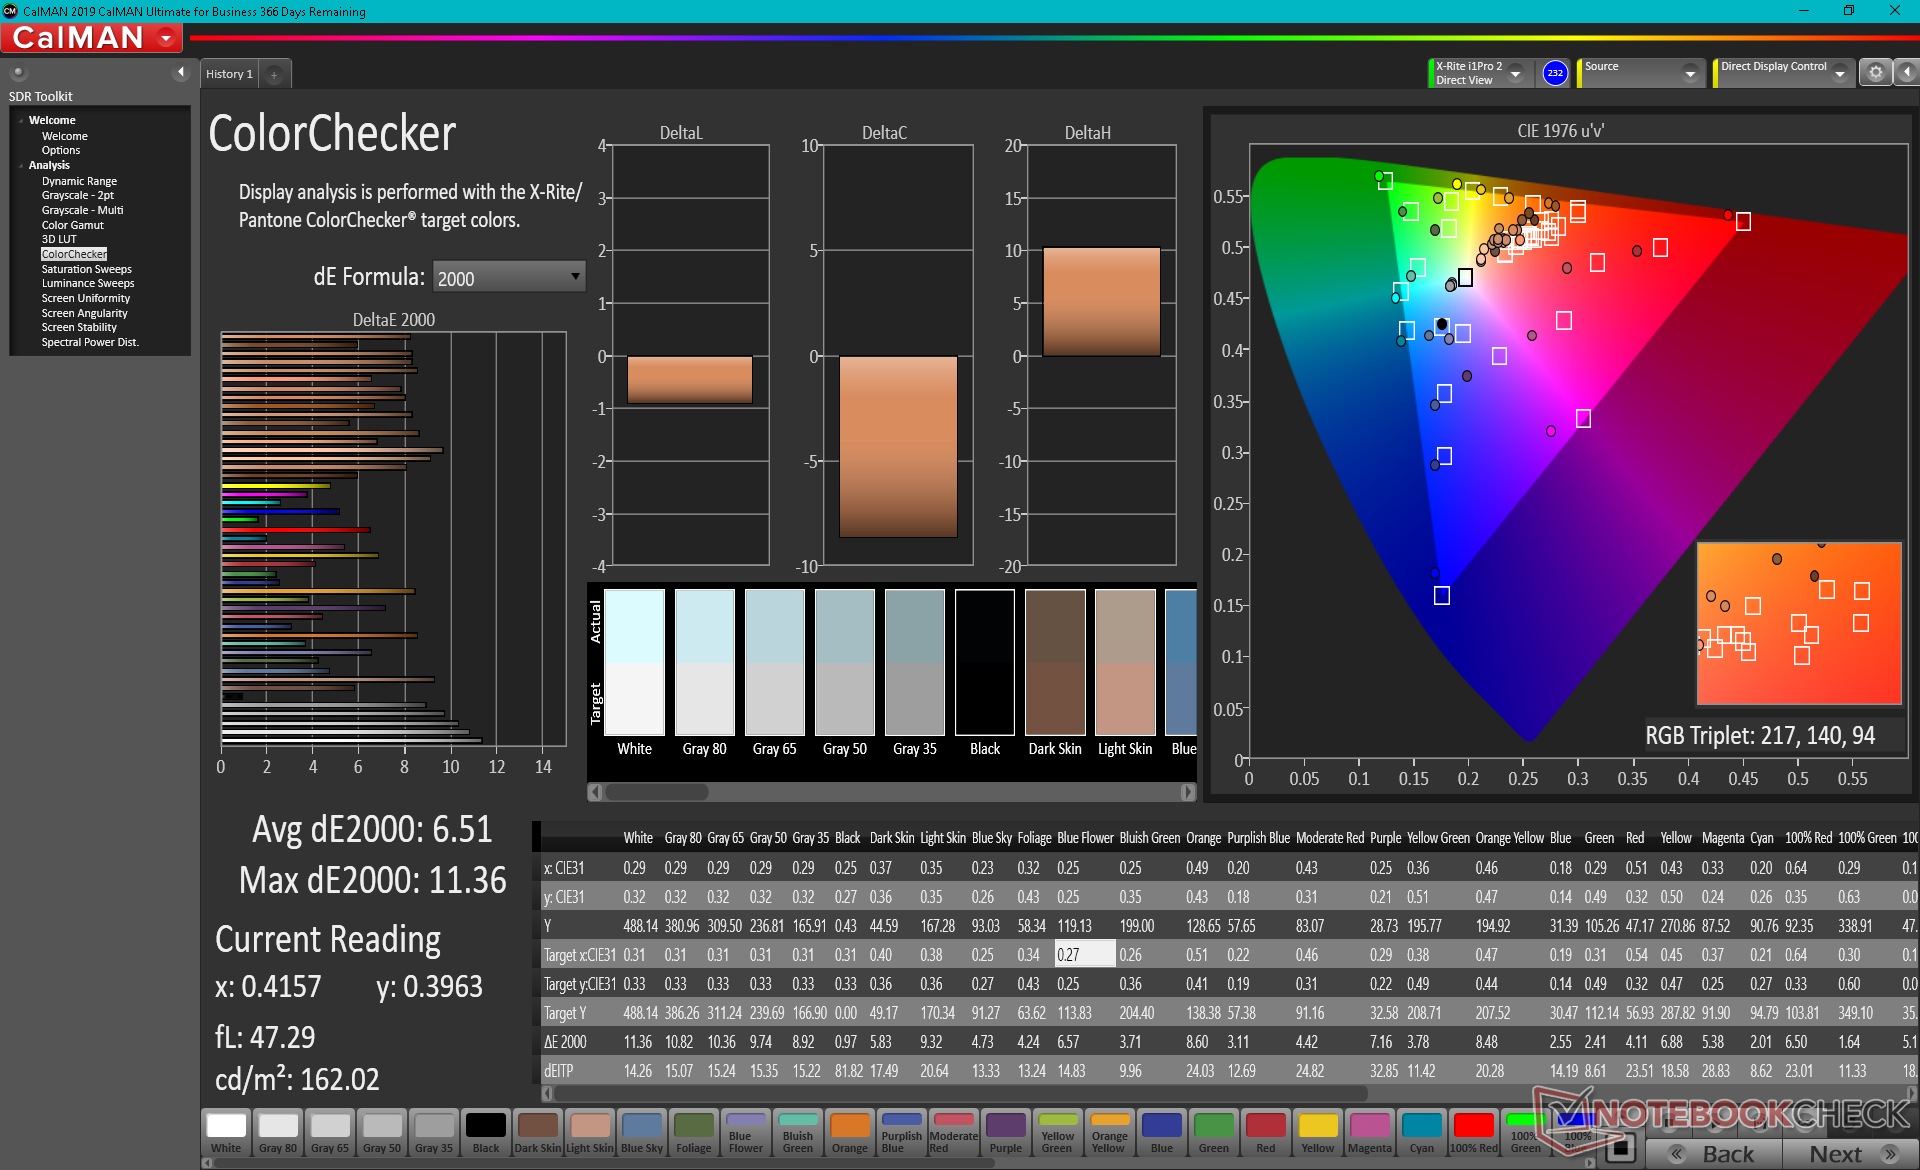
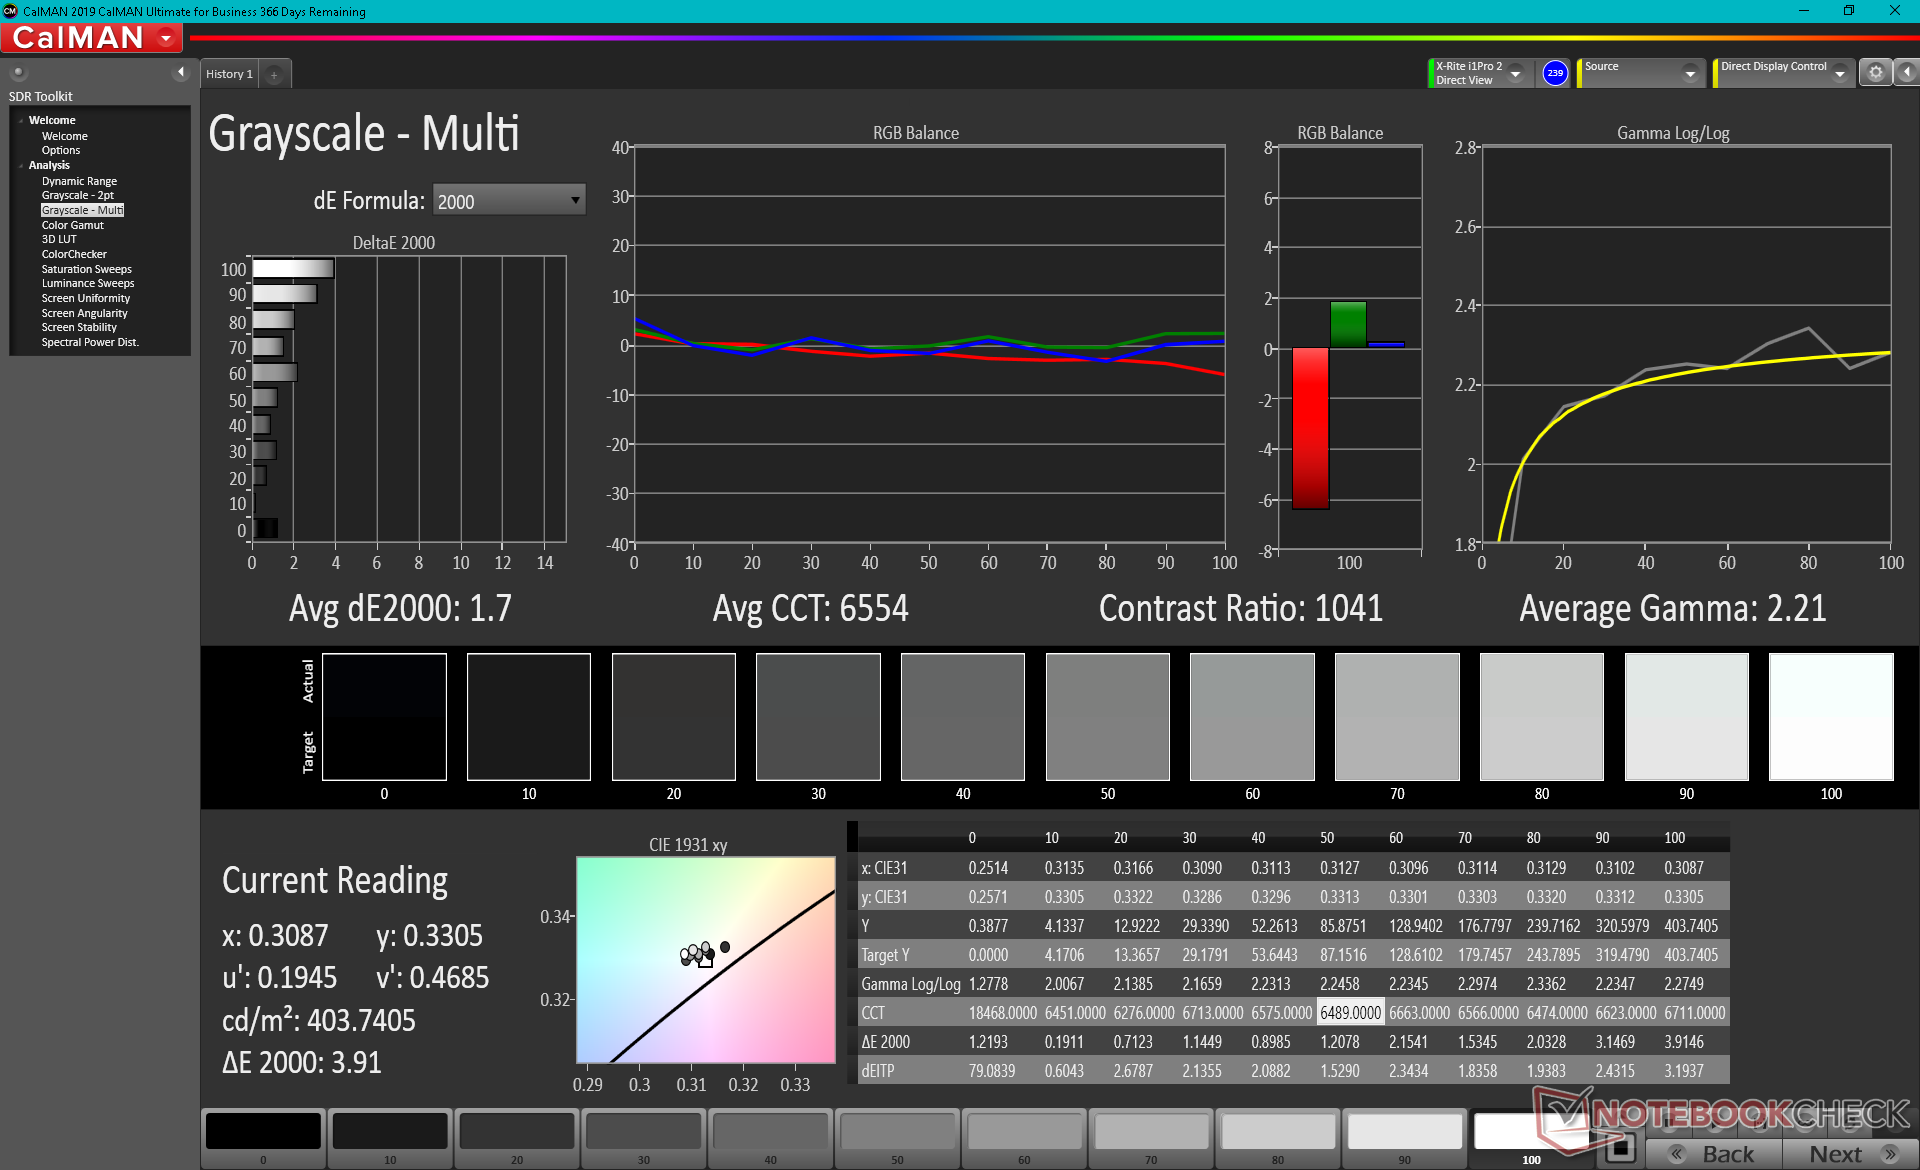
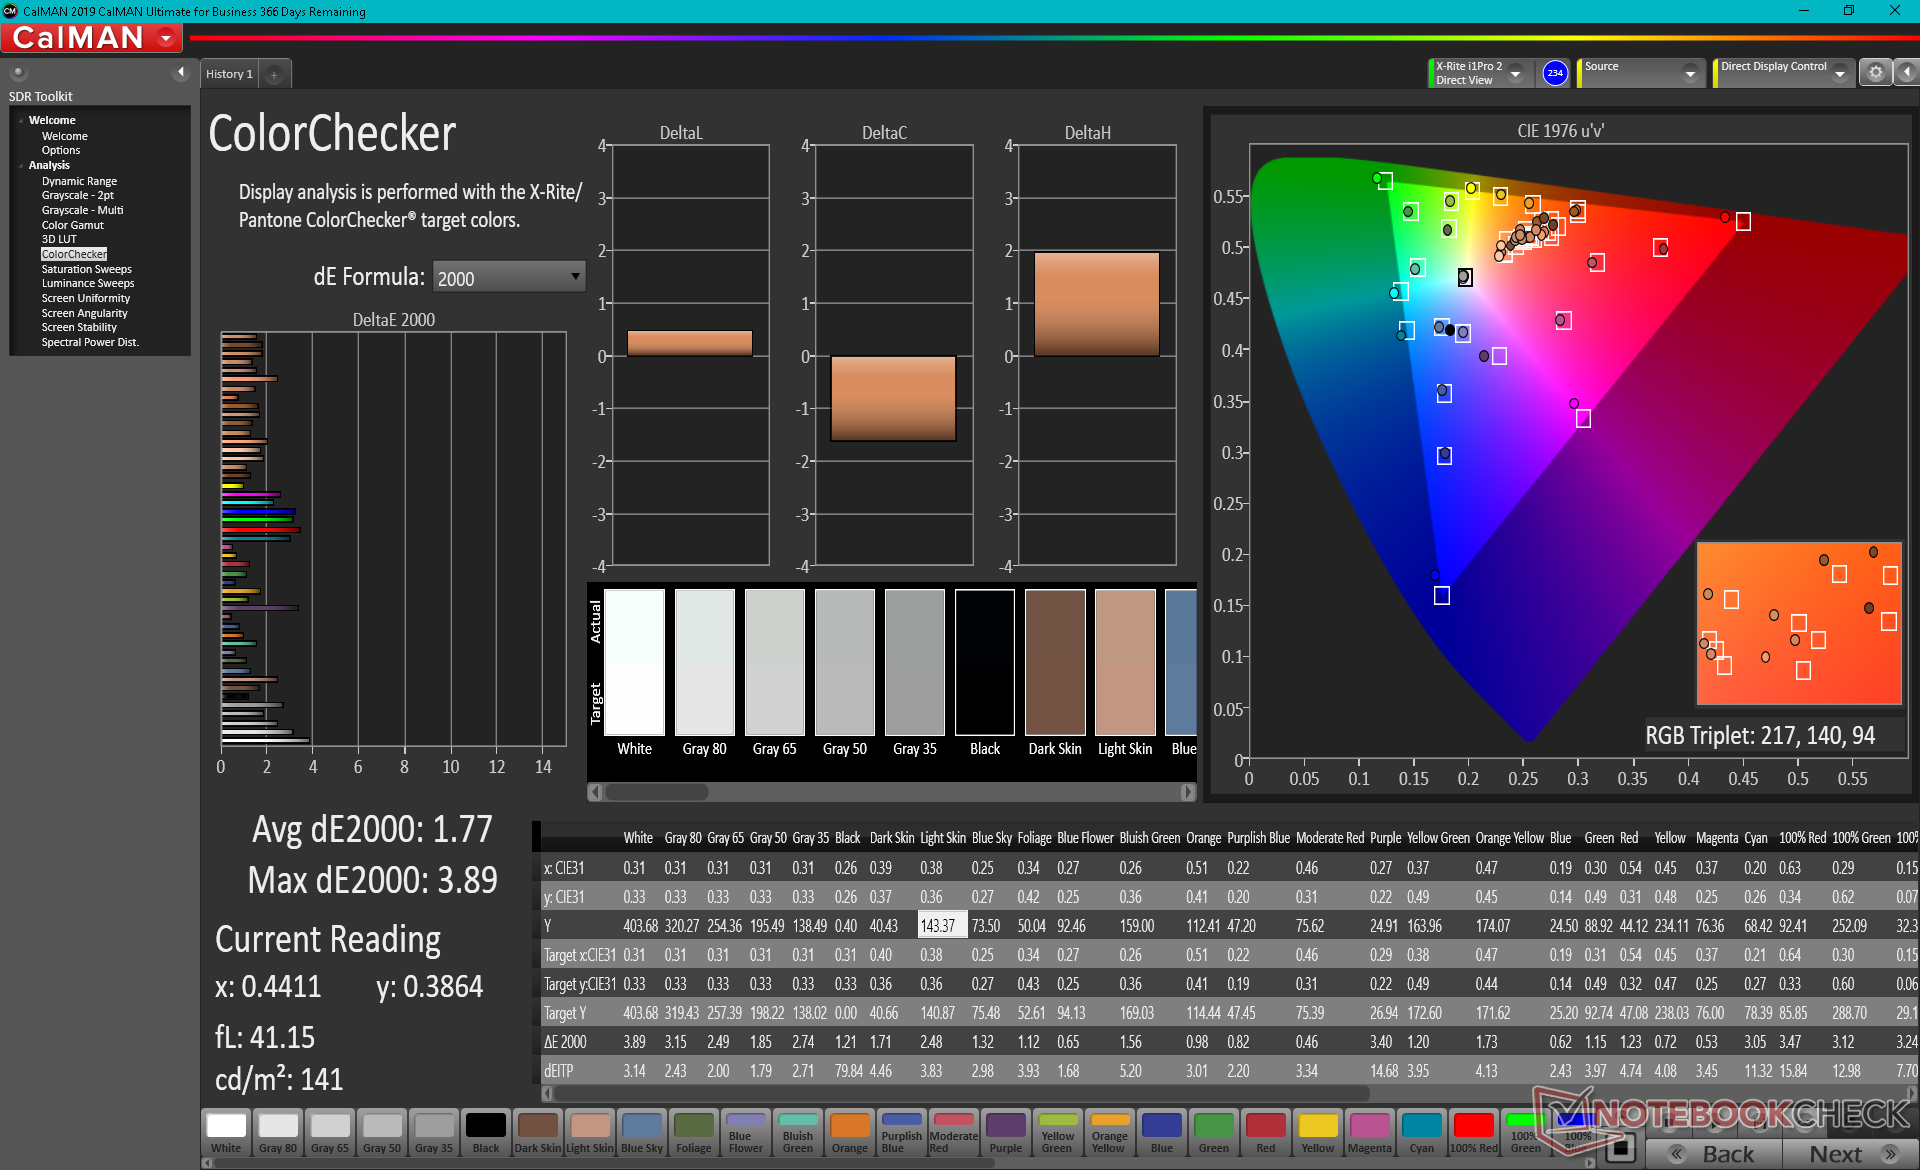
ΔE ColorChecker Calman: 6.51 | ∀{0.5-29.43 Ø4.71}
calibrated: 1.77
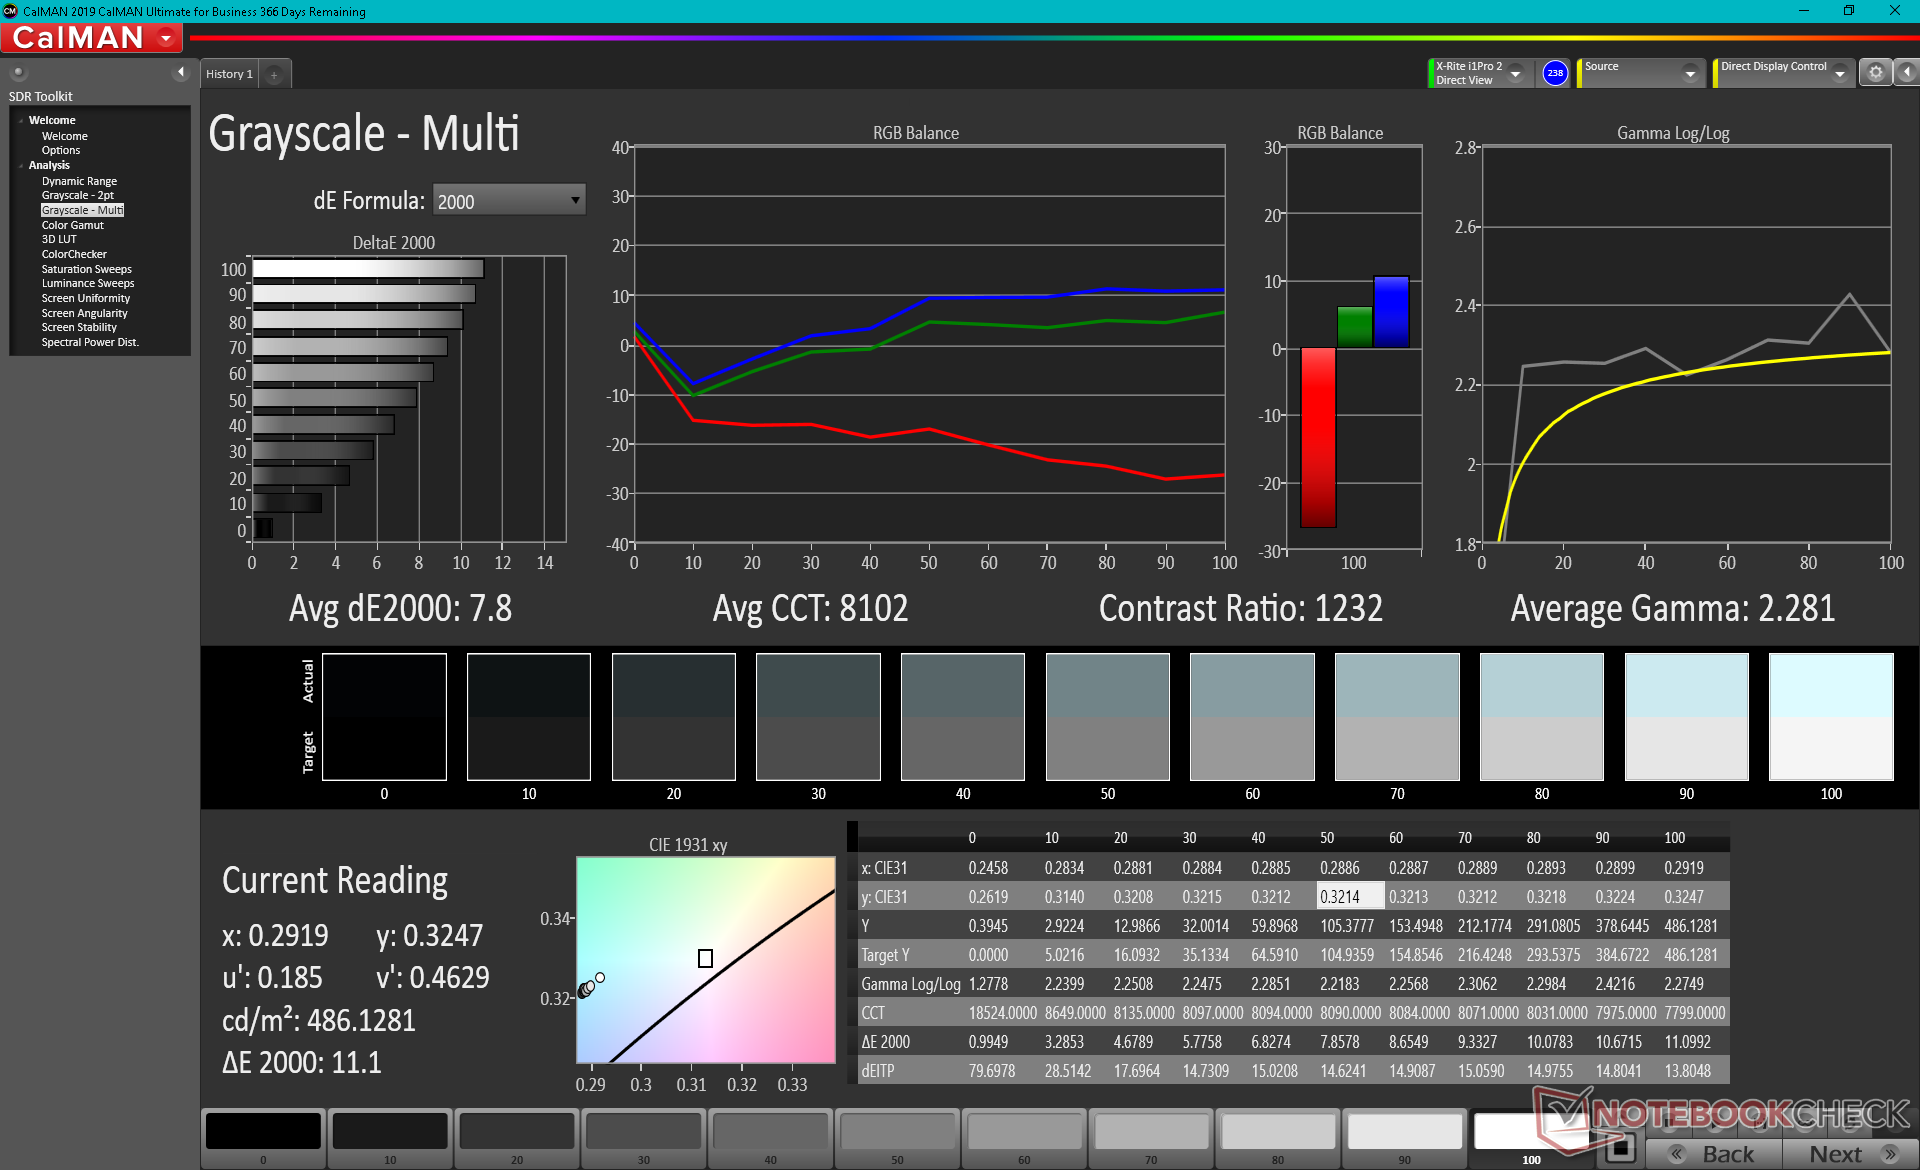
ΔE Greyscale Calman: 7.8 | ∀{0.09-98 Ø4.96}
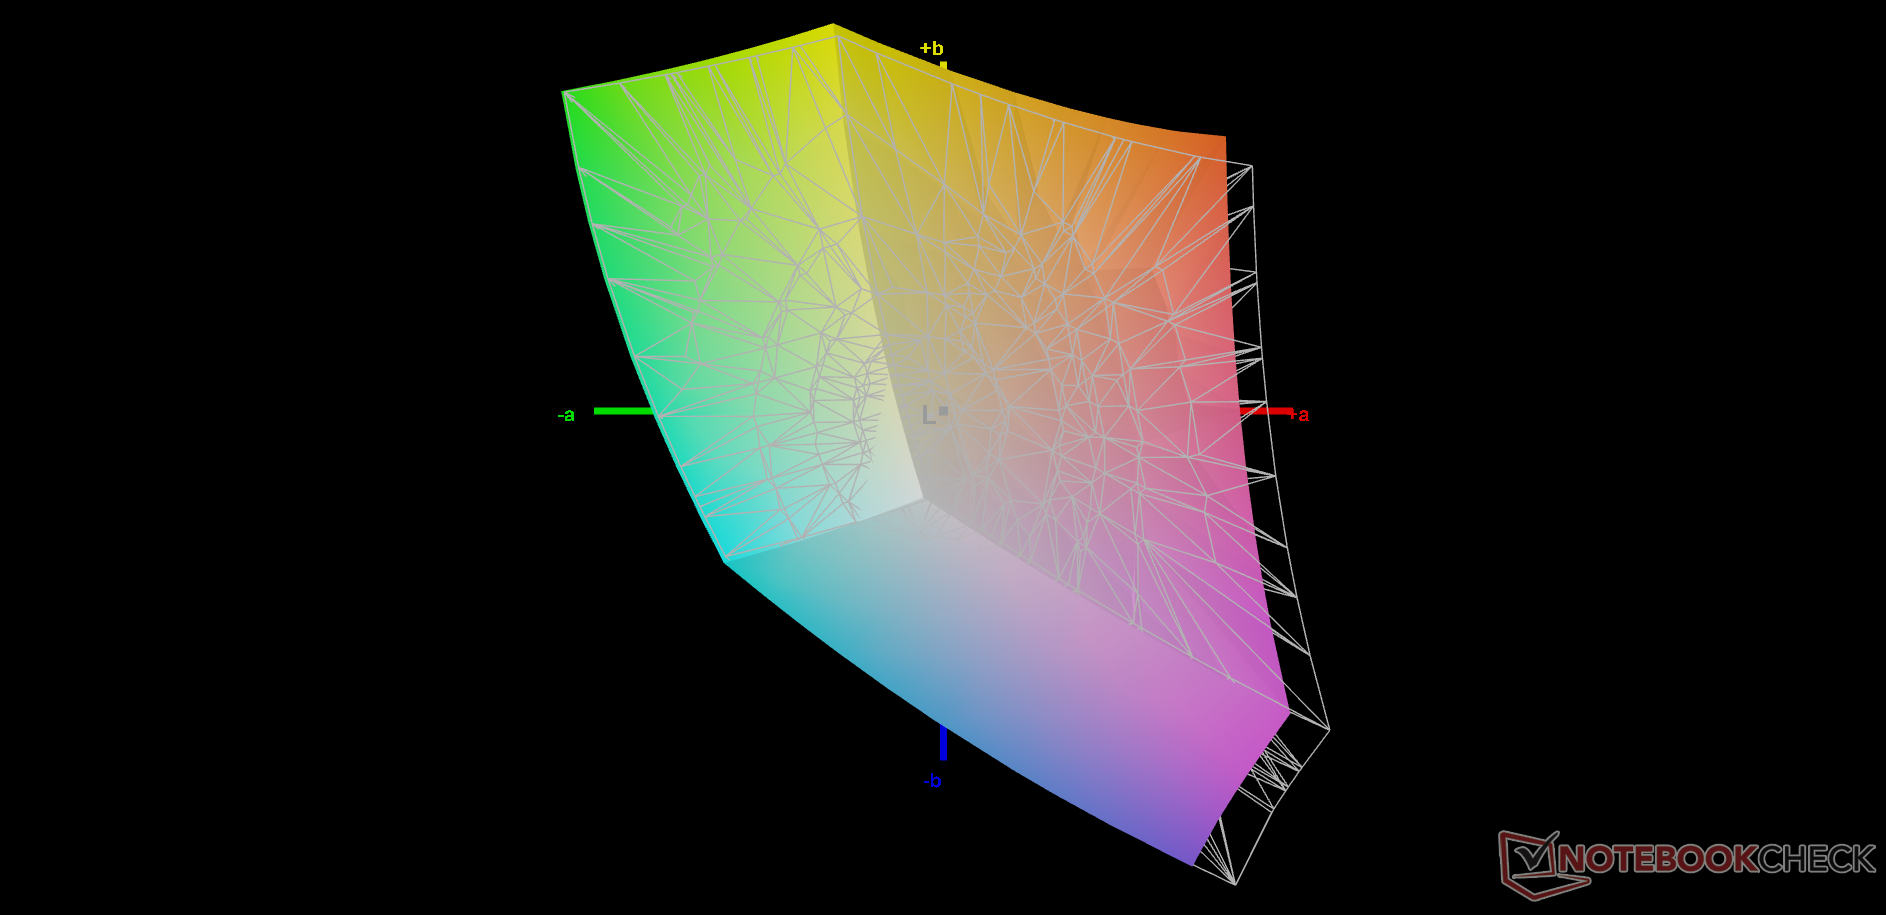
65.5% AdobeRGB 1998 (Argyll 3D)
91.9% sRGB (Argyll 3D)
63.5% Display P3 (Argyll 3D)
Gamma: 2.28
CCT: 8102 K
| Acer Enduro Urban N3 EUN314 XR140EA6T, IPS, 1920x1080, 14" | Dell Latitude 5420 Rugged-P85G AU Optronics AUO523D, IPS, 1920x1080, 14" | Panasonic Toughbook FZ-55 MK2 InfoVision M140NWF5 R3, IPS, 1920x1080, 14" | Durabook S14I KD140N0730A01, TN, 1920x1080, 14" | Getac S410 CMN N140BGE-E33, TN PED, 1366x768, 14" | |
|---|---|---|---|---|---|
| Display | -1% | -44% | -30% | -35% | |
| Display P3 Coverage (%) | 63.5 | 62.5 -2% | 34.8 -45% | 43.55 -31% | 40.46 -36% |
| sRGB Coverage (%) | 91.9 | 92.4 1% | 52.2 -43% | 65.4 -29% | 60.9 -34% |
| AdobeRGB 1998 Coverage (%) | 65.5 | 64.2 -2% | 36 -45% | 45 -31% | 41.8 -36% |
| Response Times | -8% | 32% | 56% | 43% | |
| Response Time Grey 50% / Grey 80% * (ms) | 56 ? | 68 ? -21% | 28.4 ? 49% | 30.4 ? 46% | 41.2 ? 26% |
| Response Time Black / White * (ms) | 35.2 ? | 33.6 ? 5% | 30 ? 15% | 11.8 ? 66% | 14 ? 60% |
| PWM Frequency (Hz) | 1000 ? | 735 ? | 685 ? | 304.9 ? | 877 ? |
| Screen | 26% | 21% | -49% | -71% | |
| Brightness middle (cd/m²) | 487.8 | 1111.7 128% | 1061.1 118% | 1180.7 142% | 265.1 -46% |
| Brightness (cd/m²) | 464 | 1026 121% | 997 115% | 1102 138% | 246 -47% |
| Brightness Distribution (%) | 89 | 80 -10% | 76 -15% | 89 0% | 81 -9% |
| Black Level * (cd/m²) | 0.48 | 0.81 -69% | 0.7 -46% | 1.91 -298% | 0.58 -21% |
| Contrast (:1) | 1016 | 1372 35% | 1516 49% | 618 -39% | 457 -55% |
| Colorchecker dE 2000 * | 6.51 | 3.83 41% | 4.64 29% | 13.45 -107% | 14.24 -119% |
| Colorchecker dE 2000 max. * | 11.36 | 7.85 31% | 20.92 -84% | 22.52 -98% | 26.66 -135% |
| Colorchecker dE 2000 calibrated * | 1.77 | 2.98 -68% | 2.52 -42% | 3.19 -80% | 3.94 -123% |
| Greyscale dE 2000 * | 7.8 | 5.6 28% | 2.8 64% | 15.4 -97% | 14.2 -82% |
| Gamma | 2.28 96% | 2.306 95% | 2.08 106% | 1.97 112% | 2.03 108% |
| CCT | 8102 80% | 7676 85% | 6364 102% | 21134 31% | 17152 38% |
| Color Space (Percent of AdobeRGB 1998) (%) | 59 | 41.6 | 38.7 | ||
| Color Space (Percent of sRGB) (%) | 93 | 65.5 | 61 | ||
| Media totale (Programma / Settaggio) | 6% /
16% | 3% /
9% | -8% /
-30% | -21% /
-47% |
* ... Meglio usare valori piccoli
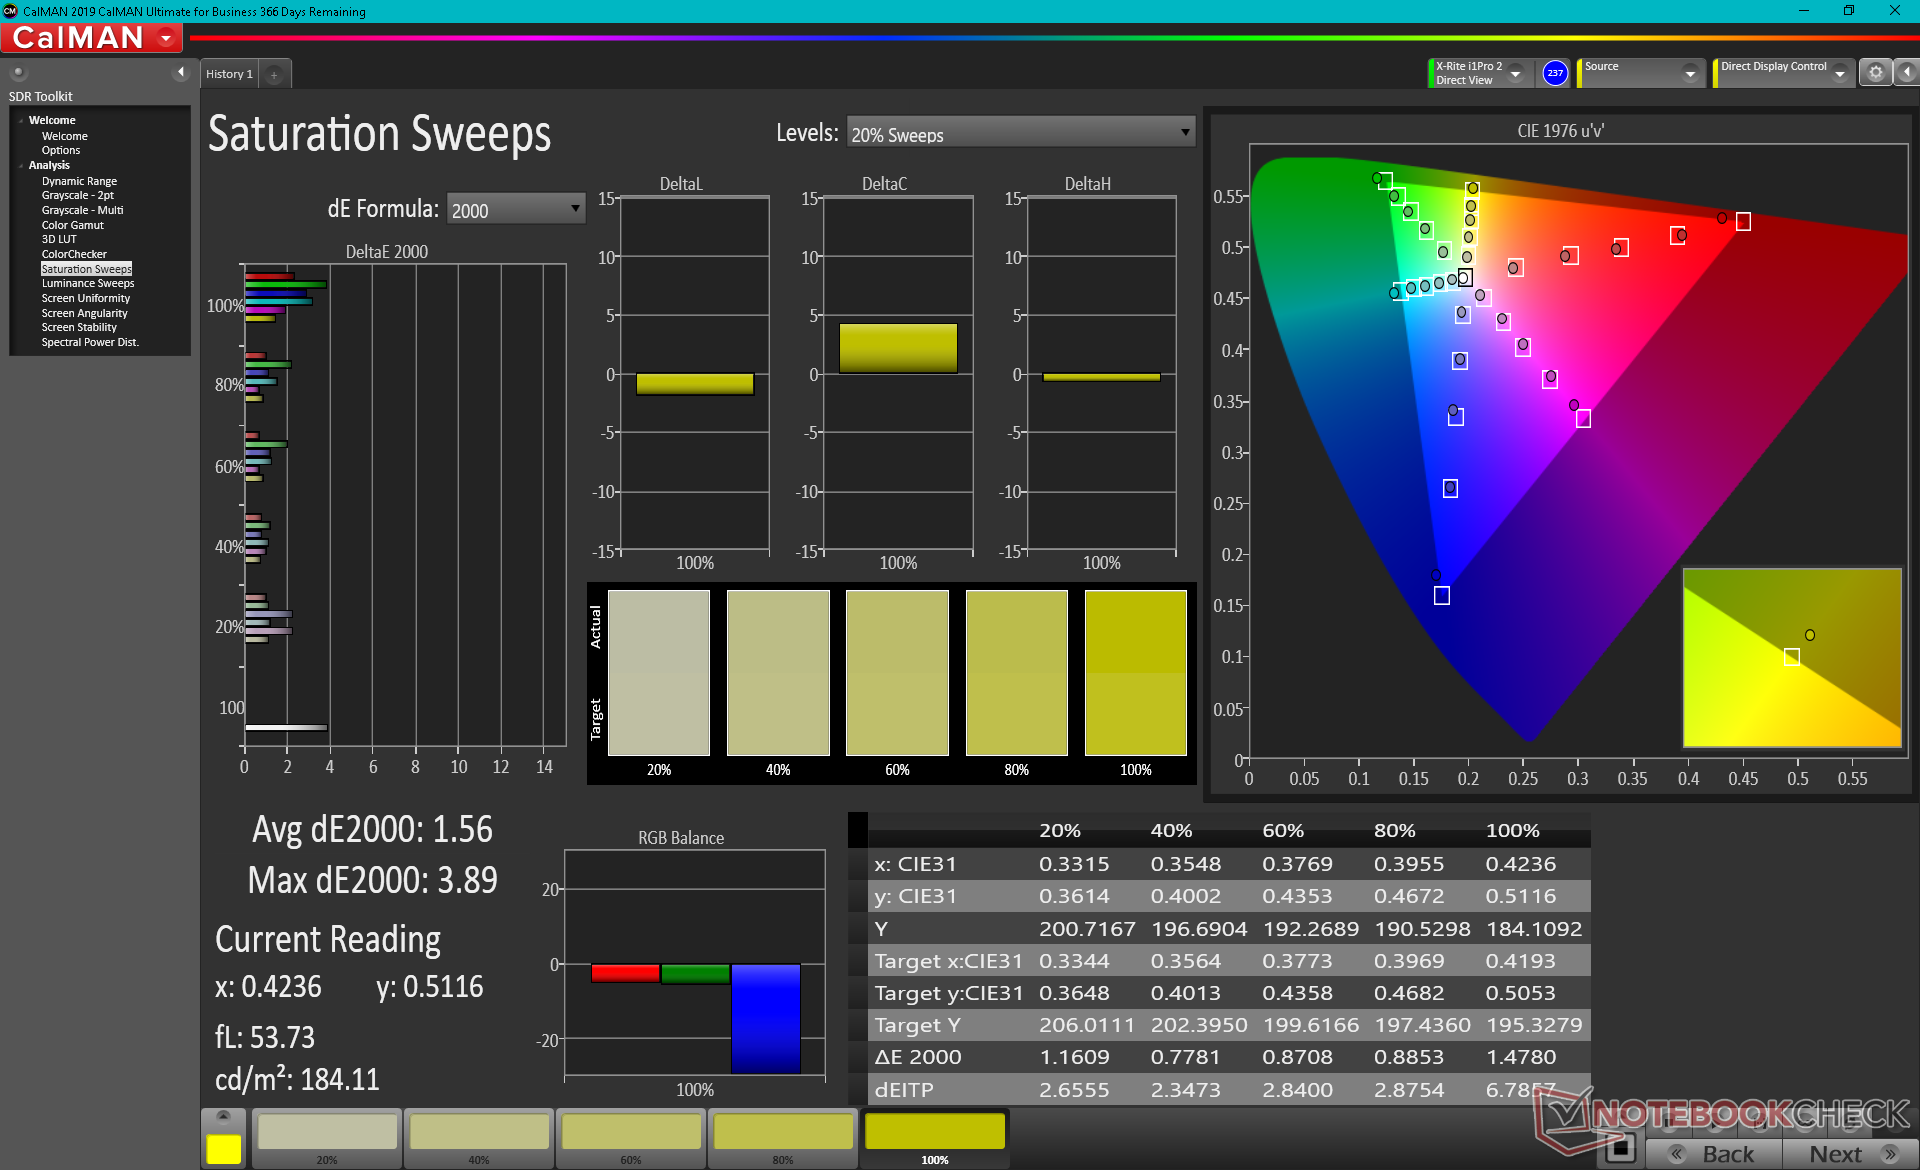
Il pannello offre >90 per cento di copertura sRGB, che è molto più alto rispetto a molti altri portatili rugged o semi-rugged dove i colori non sono tipicamente una priorità
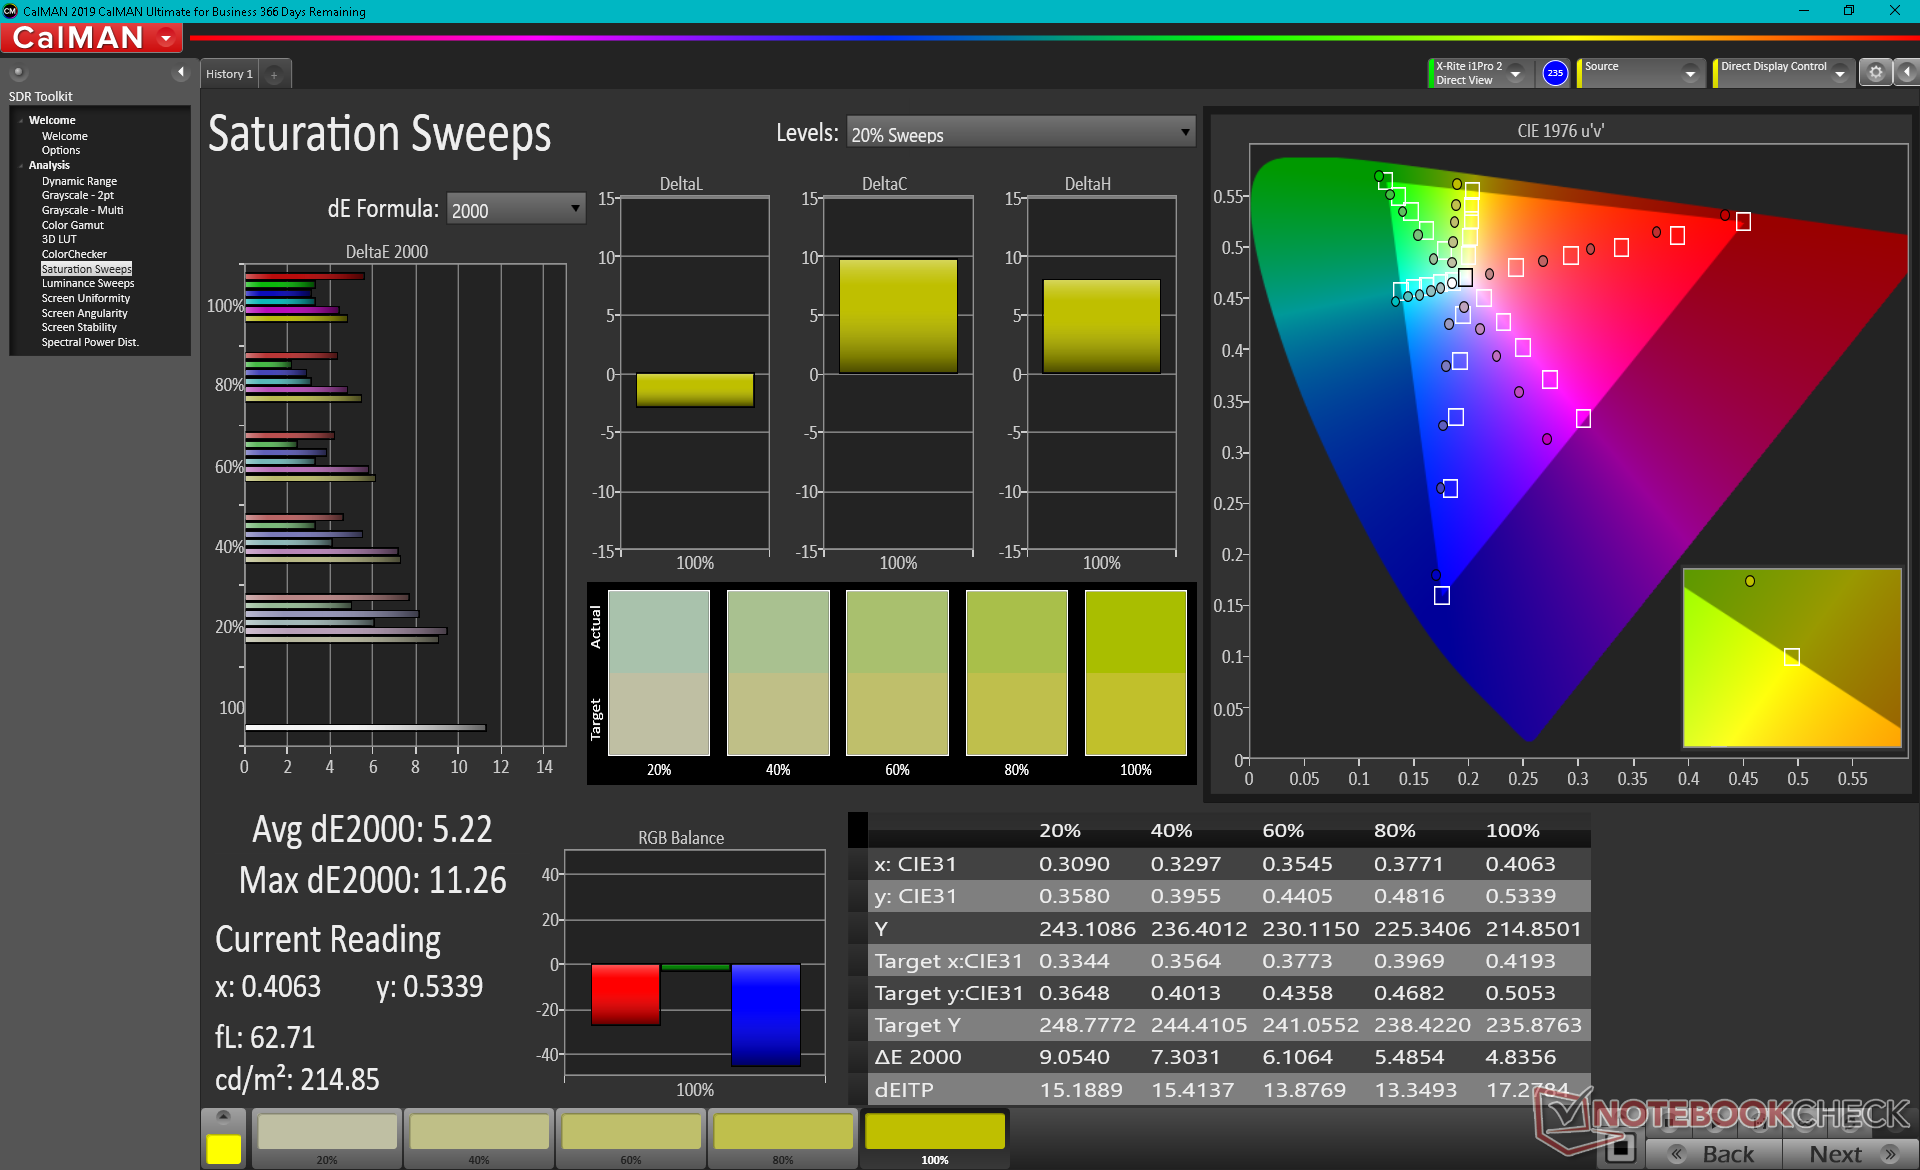
Le misurazioni del colorimetro X-Rite mostrano che la temperatura del colore è troppo fredda fuori dalla scatola. Una volta calibrati correttamente, la scala di grigi e i colori migliorerebbero drasticamente come mostrato dai nostri risultati CalMAN qui sotto. Raccomandiamo una calibrazione da parte dell'utente finale per sfruttare meglio lo spazio colore relativamente ampio del pannello.
Tempi di risposta del Display
| ↔ Tempi di risposta dal Nero al Bianco | ||
|---|---|---|
| 35.2 ms ... aumenta ↗ e diminuisce ↘ combinato | ↗ 16.4 ms Incremento | 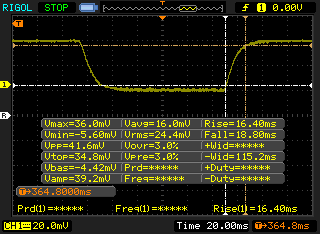 |
| ↘ 18.8 ms Calo | ||
| Lo schermo mostra tempi di risposta lenti nei nostri tests e sarà insoddisfacente per i gamers. In confronto, tutti i dispositivi di test variano da 0.1 (minimo) a 240 (massimo) ms. » 93 % di tutti i dispositivi è migliore. Questo significa che i tempi di risposta rilevati sono peggiori rispetto alla media di tutti i dispositivi testati (19.8 ms). | ||
| ↔ Tempo di risposta dal 50% Grigio all'80% Grigio | ||
| 56 ms ... aumenta ↗ e diminuisce ↘ combinato | ↗ 25.2 ms Incremento | 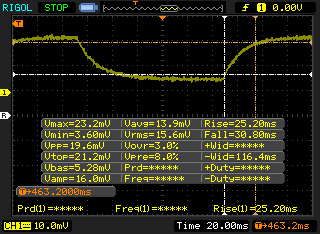 |
| ↘ 30.8 ms Calo | ||
| Lo schermo mostra tempi di risposta lenti nei nostri tests e sarà insoddisfacente per i gamers. In confronto, tutti i dispositivi di test variano da 0.165 (minimo) a 636 (massimo) ms. » 93 % di tutti i dispositivi è migliore. Questo significa che i tempi di risposta rilevati sono peggiori rispetto alla media di tutti i dispositivi testati (31 ms). | ||
Sfarfallio dello schermo / PWM (Pulse-Width Modulation)
| flickering dello schermo / PWM rilevato | 1000 Hz | ≤ 99 % settaggio luminosita' | 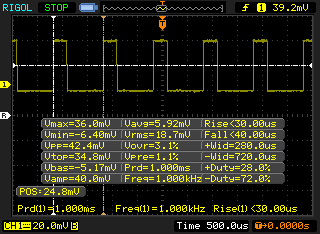 |
Il display sfarfalla a 1000 Hz (Probabilmente a causa dell'uso di PWM) Flickering rilevato ad una luminosita' di 99 % o inferiore. Non dovrebbe verificarsi flickering o PWM sopra questo valore di luminosita'. La frequenza di 1000 Hz è abbastanza alta, quindi la maggioranza degli utenti sensibili al PWM non dovrebbero notare alcun flickering. In confronto: 52 % di tutti i dispositivi testati non utilizza PWM per ridurre la luminosita' del display. Se è rilevato PWM, una media di 7754 (minimo: 5 - massimo: 343500) Hz è stata rilevata. | |||
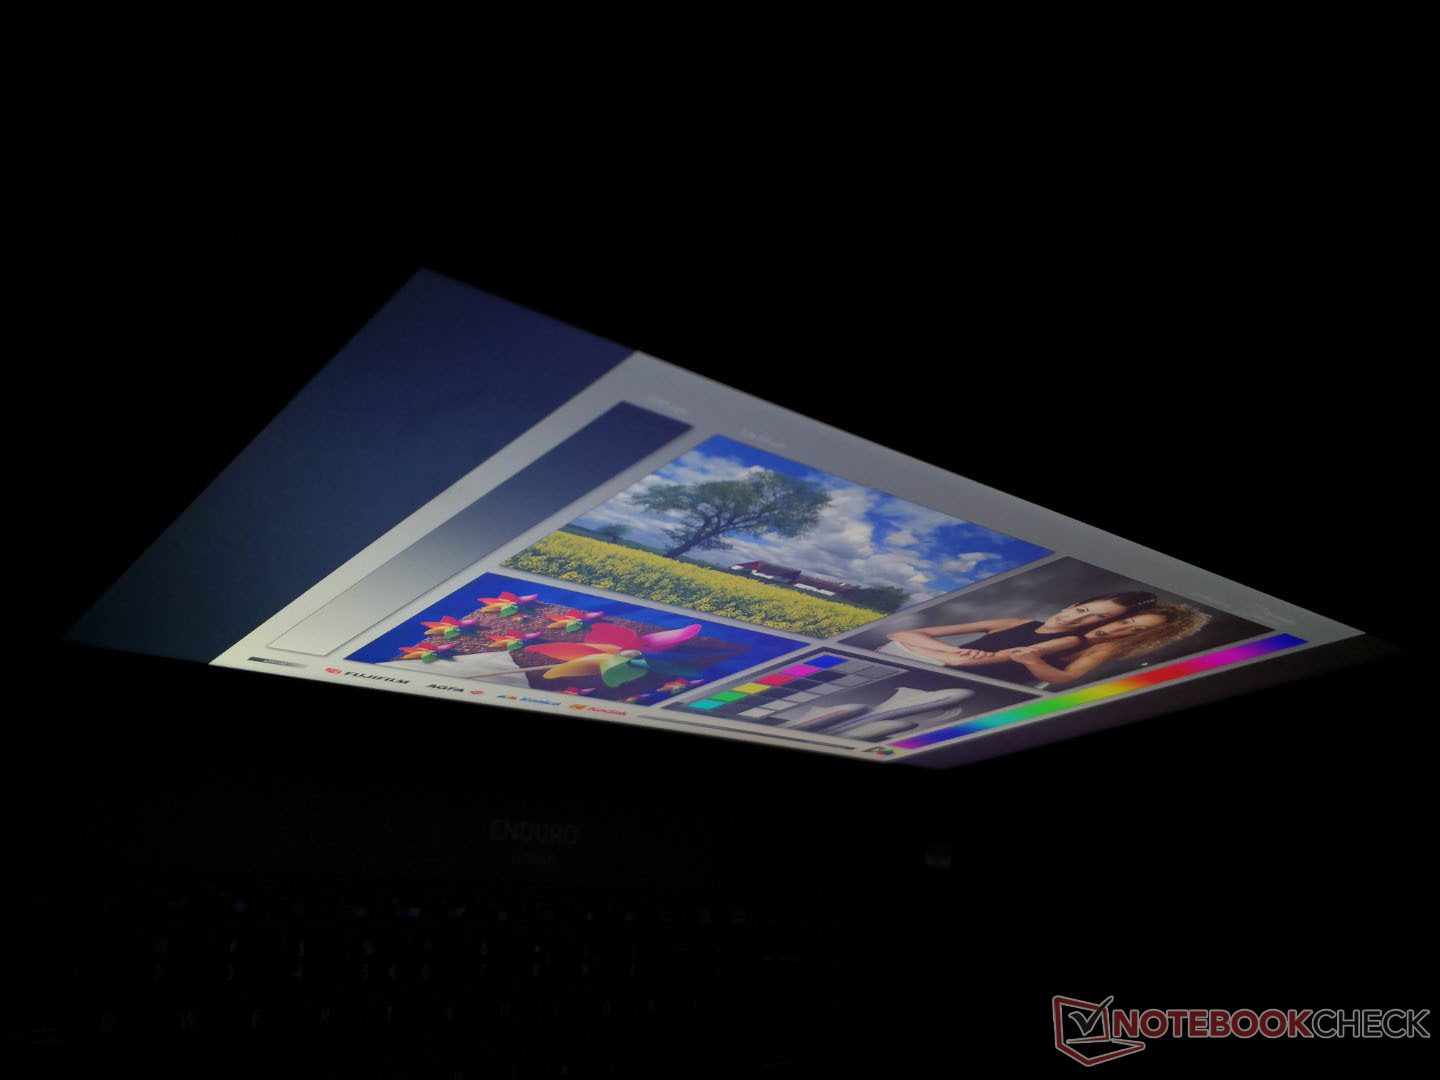
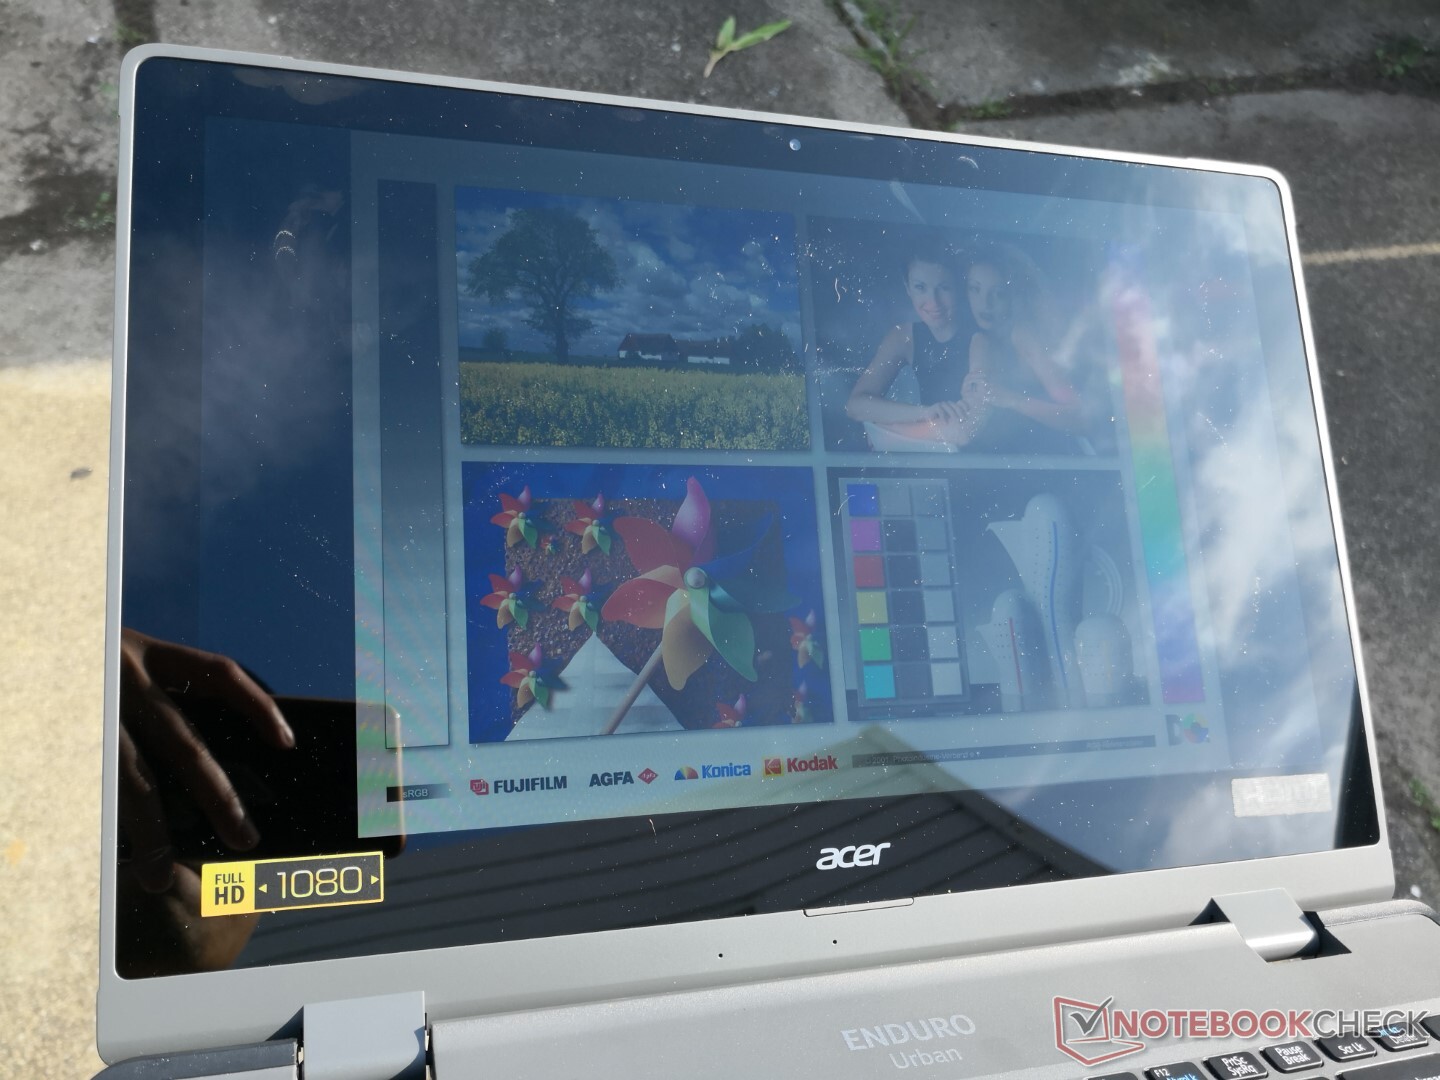
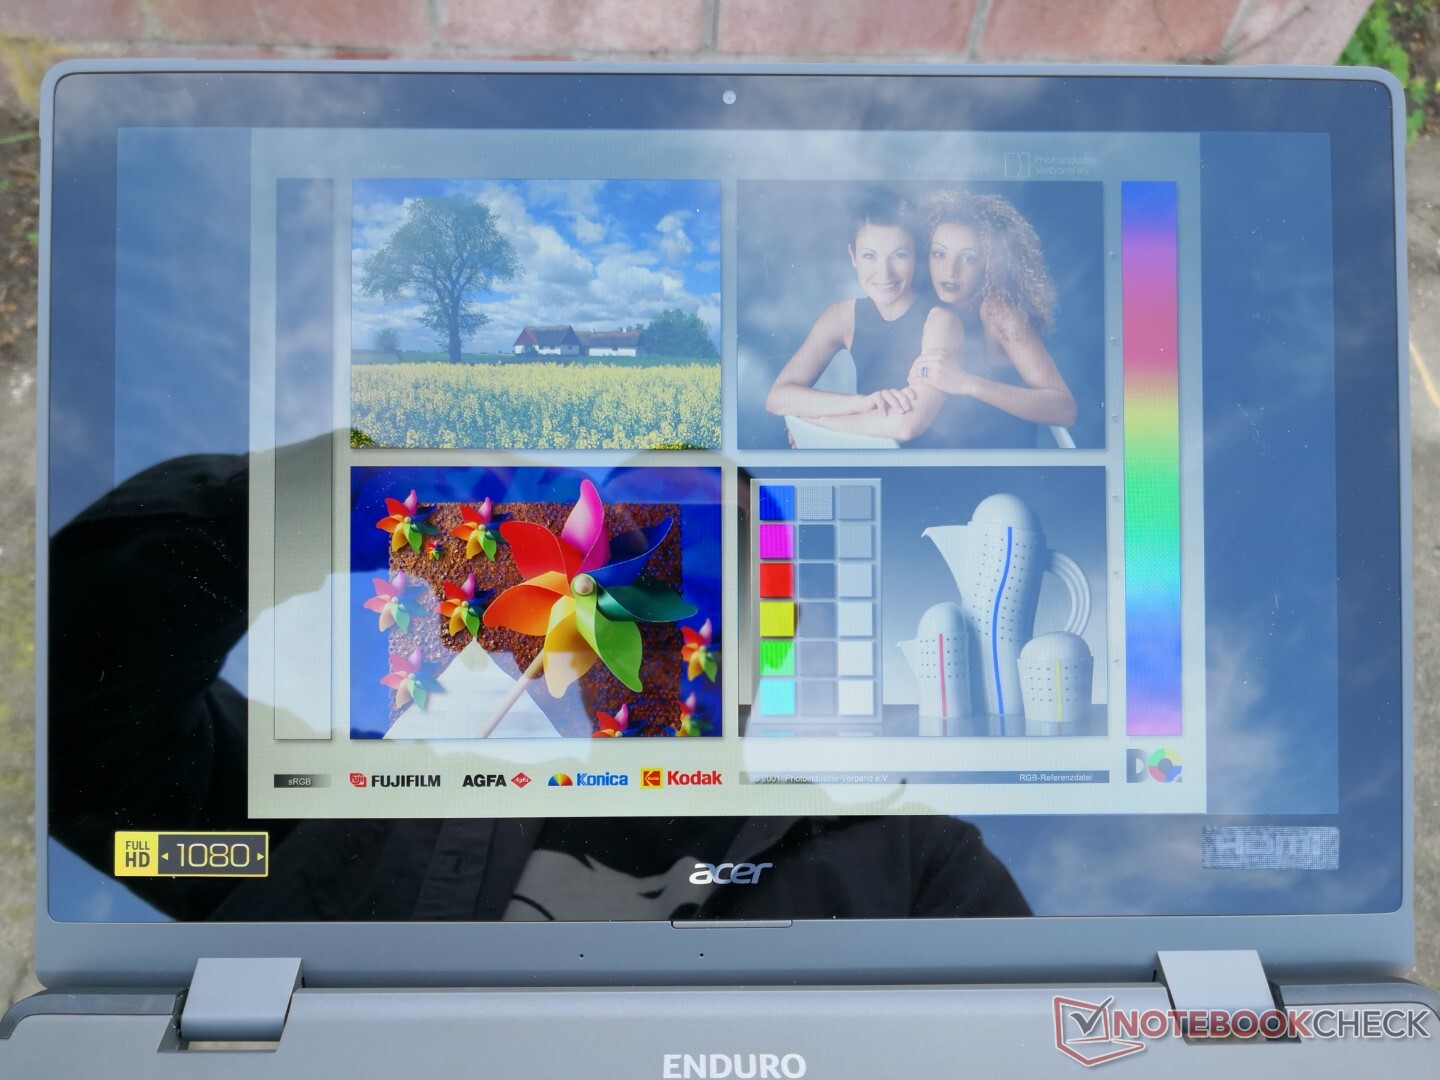
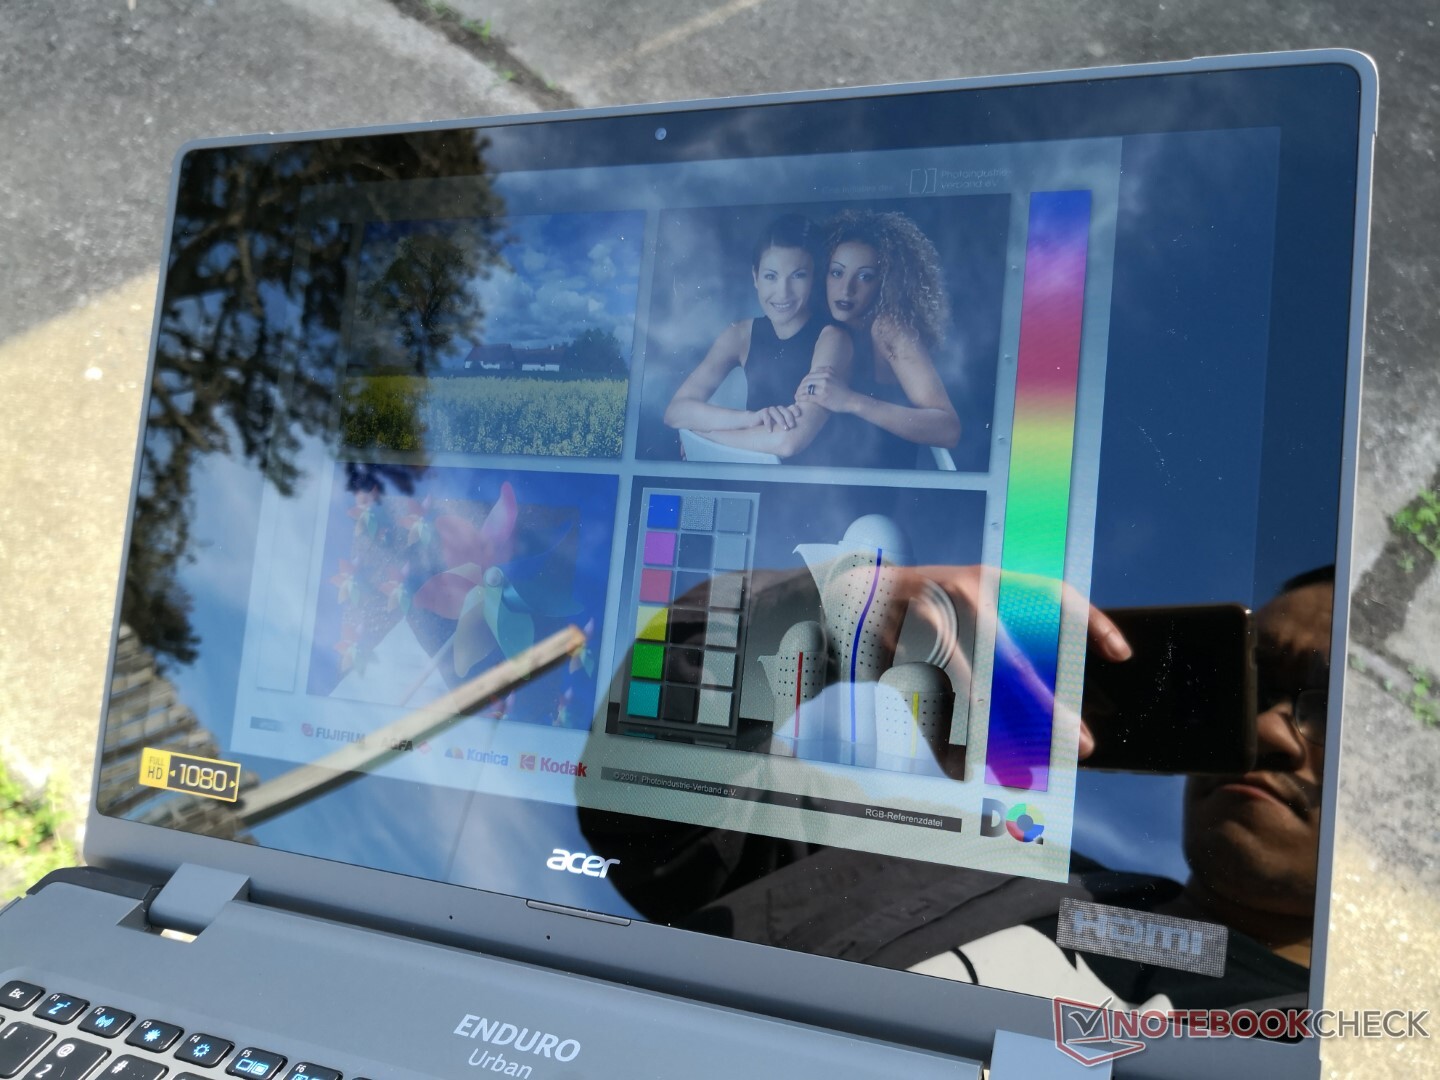
La visibilità all'aperto è generalmente migliore rispetto alla maggior parte dei portatili di fascia consumer come il Dell XPS, poiché il display Acer è notevolmente più luminoso. Tuttavia, il bagliore è ancora presente e difficile da ignorare a causa della copertura lucida. Un'opzione opaca sarebbe stata auspicabile invece di forzare il lucido su tutte le configurazioni
Performance
Condizioni di test
La nostra unità è stata impostata in modalità Best Performance tramite Windows prima di eseguire qualsiasi benchmark di prestazioni qui sotto per ottenere i punteggi più alti possibili.
Processore
Le prestazioni della CPU sono eccellenti e circa il 40% più veloci del Durabook S14I anche se entrambi hanno lo stesso Core i7-1165G7 CPU. Passando al Core i5-1135G7 dovrebbe comportare solo leggere perdite di prestazioni basate sulla nostra esperienza con altri portatili Core i5-1135G7.
Cinebench R15 Multi Loop
Cinebench R23: Multi Core | Single Core
Cinebench R20: CPU (Multi Core) | CPU (Single Core)
Cinebench R15: CPU Multi 64Bit | CPU Single 64Bit
Blender: v2.79 BMW27 CPU
7-Zip 18.03: 7z b 4 | 7z b 4 -mmt1
Geekbench 5.5: Multi-Core | Single-Core
HWBOT x265 Benchmark v2.2: 4k Preset
LibreOffice : 20 Documents To PDF
R Benchmark 2.5: Overall mean
* ... Meglio usare valori piccoli
AIDA64: FP32 Ray-Trace | FPU Julia | CPU SHA3 | CPU Queen | FPU SinJulia | FPU Mandel | CPU AES | CPU ZLib | FP64 Ray-Trace | CPU PhotoWorxx
| Performance rating | |
| Acer Enduro Urban N3 EUN314 | |
| Media Intel Core i7-1165G7 | |
| Panasonic Toughbook FZ-55 MK2 | |
| Durabook S14I | |
| AIDA64 / FP32 Ray-Trace | |
| Acer Enduro Urban N3 EUN314 | |
| Media Intel Core i7-1165G7 (3933 - 8184, n=58) | |
| Panasonic Toughbook FZ-55 MK2 | |
| Durabook S14I | |
| AIDA64 / FPU Julia | |
| Acer Enduro Urban N3 EUN314 | |
| Panasonic Toughbook FZ-55 MK2 | |
| Media Intel Core i7-1165G7 (17720 - 34369, n=58) | |
| Durabook S14I | |
| AIDA64 / CPU SHA3 | |
| Acer Enduro Urban N3 EUN314 | |
| Media Intel Core i7-1165G7 (958 - 2338, n=58) | |
| Panasonic Toughbook FZ-55 MK2 | |
| Durabook S14I | |
| AIDA64 / CPU Queen | |
| Acer Enduro Urban N3 EUN314 | |
| Durabook S14I | |
| Panasonic Toughbook FZ-55 MK2 | |
| Media Intel Core i7-1165G7 (44161 - 50624, n=58) | |
| AIDA64 / FPU SinJulia | |
| Acer Enduro Urban N3 EUN314 | |
| Panasonic Toughbook FZ-55 MK2 | |
| Media Intel Core i7-1165G7 (3183 - 4796, n=58) | |
| Durabook S14I | |
| AIDA64 / FPU Mandel | |
| Acer Enduro Urban N3 EUN314 | |
| Panasonic Toughbook FZ-55 MK2 | |
| Media Intel Core i7-1165G7 (11876 - 20468, n=58) | |
| Durabook S14I | |
| AIDA64 / CPU AES | |
| Acer Enduro Urban N3 EUN314 | |
| Media Intel Core i7-1165G7 (29506 - 73387, n=58) | |
| Durabook S14I | |
| Panasonic Toughbook FZ-55 MK2 | |
| AIDA64 / CPU ZLib | |
| Acer Enduro Urban N3 EUN314 | |
| Media Intel Core i7-1165G7 (169 - 402, n=65) | |
| Panasonic Toughbook FZ-55 MK2 | |
| Durabook S14I | |
| AIDA64 / FP64 Ray-Trace | |
| Acer Enduro Urban N3 EUN314 | |
| Panasonic Toughbook FZ-55 MK2 | |
| Media Intel Core i7-1165G7 (2033 - 4461, n=58) | |
| Durabook S14I | |
| AIDA64 / CPU PhotoWorxx | |
| Media Intel Core i7-1165G7 (12392 - 45694, n=58) | |
| Acer Enduro Urban N3 EUN314 | |
| Panasonic Toughbook FZ-55 MK2 | |
| Durabook S14I | |
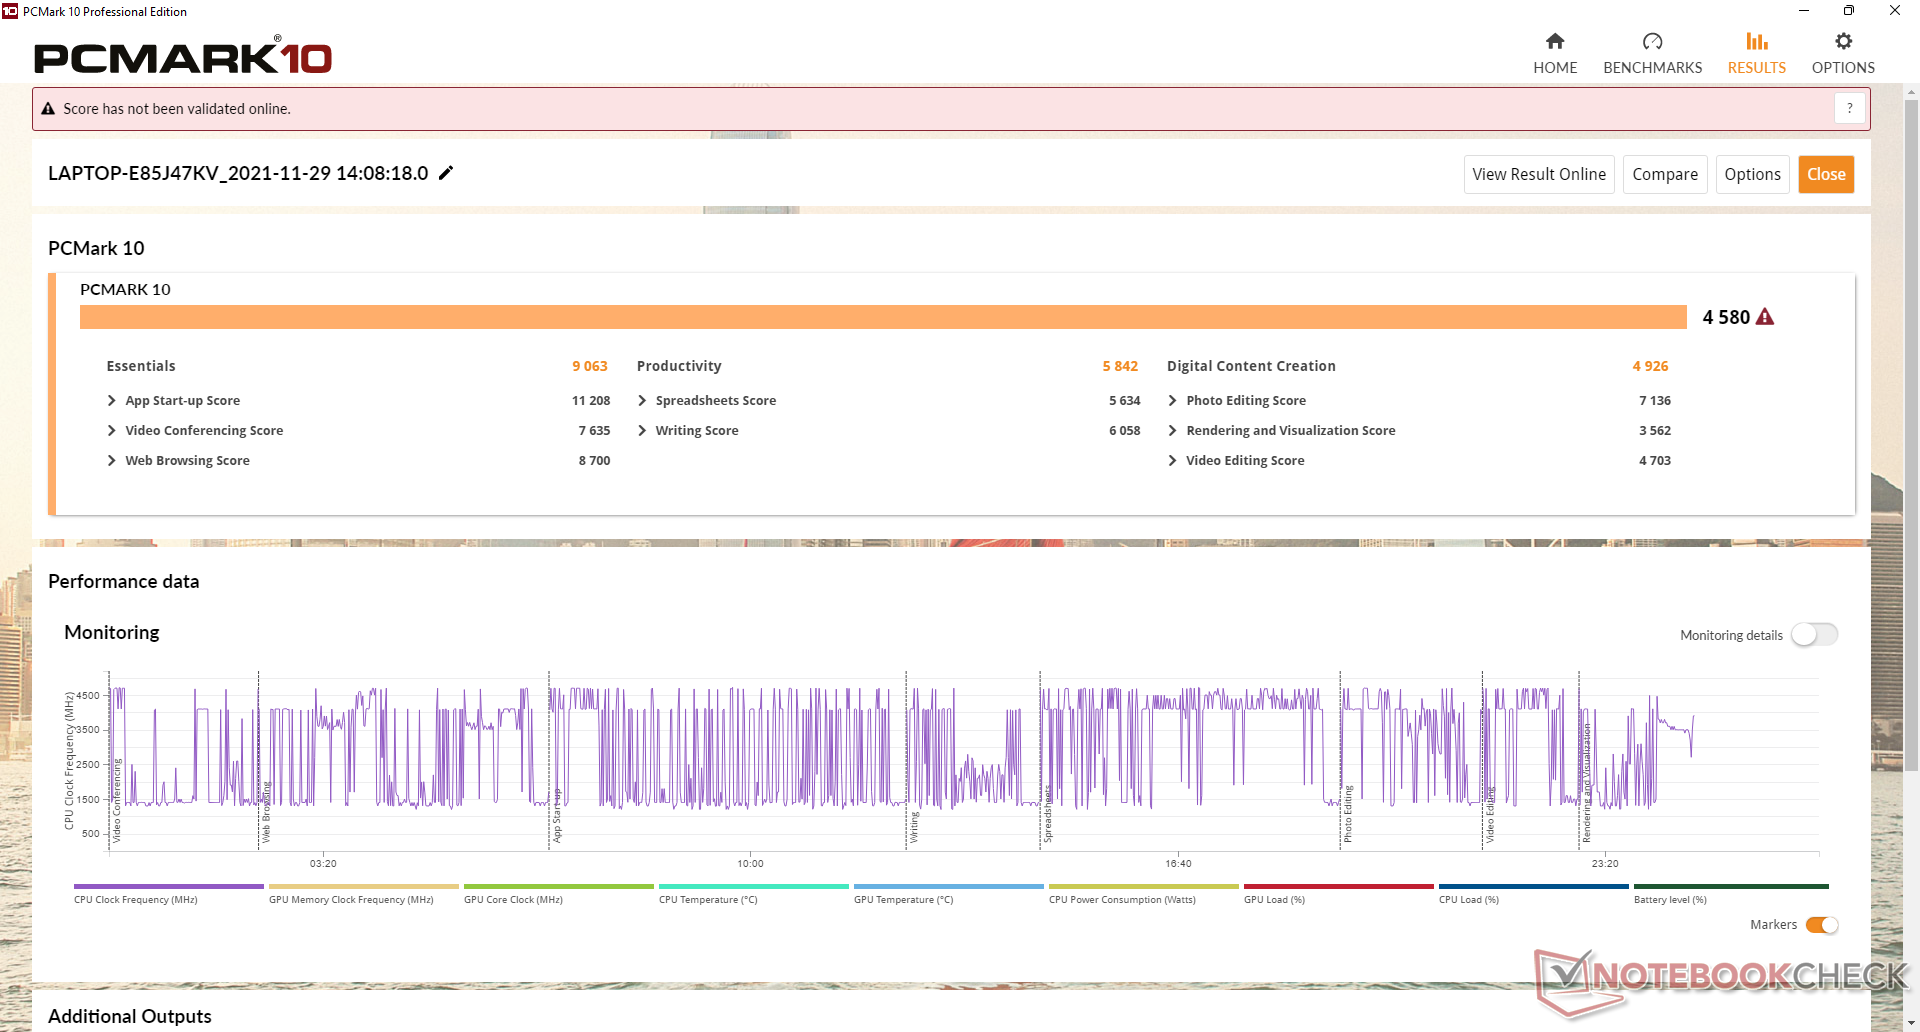
Prestazioni del sistema
I risultati di PCMark sono stranamente dietro al DuraBook S14I anche se il nostro Acer ha la stessa CPU ma con un obiettivo PL1 più alto (28 W contro 15 W).
| PCMark 10 / Score | |
| Panasonic Toughbook FZ-55 MK2 | |
| Media Intel Core i7-1165G7, Intel Iris Xe Graphics G7 96EUs (4531 - 5454, n=50) | |
| Durabook S14I | |
| Acer Enduro Urban N3 EUN314 | |
| Dell Latitude 5420 Rugged-P85G | |
| Getac S410 | |
| PCMark 10 / Essentials | |
| Panasonic Toughbook FZ-55 MK2 | |
| Durabook S14I | |
| Media Intel Core i7-1165G7, Intel Iris Xe Graphics G7 96EUs (8997 - 11505, n=50) | |
| Acer Enduro Urban N3 EUN314 | |
| Dell Latitude 5420 Rugged-P85G | |
| Getac S410 | |
| PCMark 10 / Productivity | |
| Dell Latitude 5420 Rugged-P85G | |
| Durabook S14I | |
| Getac S410 | |
| Media Intel Core i7-1165G7, Intel Iris Xe Graphics G7 96EUs (5570 - 7136, n=50) | |
| Panasonic Toughbook FZ-55 MK2 | |
| Acer Enduro Urban N3 EUN314 | |
| PCMark 10 / Digital Content Creation | |
| Panasonic Toughbook FZ-55 MK2 | |
| Media Intel Core i7-1165G7, Intel Iris Xe Graphics G7 96EUs (4083 - 5550, n=50) | |
| Acer Enduro Urban N3 EUN314 | |
| Durabook S14I | |
| Dell Latitude 5420 Rugged-P85G | |
| Getac S410 | |
| PCMark 10 Score | 4580 punti | |
Aiuto | ||
| AIDA64 / Memory Copy | |
| Media Intel Core i7-1165G7 (20032 - 65446, n=58) | |
| Acer Enduro Urban N3 EUN314 | |
| Panasonic Toughbook FZ-55 MK2 | |
| Durabook S14I | |
| AIDA64 / Memory Read | |
| Media Intel Core i7-1165G7 (23033 - 64524, n=58) | |
| Acer Enduro Urban N3 EUN314 | |
| Panasonic Toughbook FZ-55 MK2 | |
| Durabook S14I | |
| AIDA64 / Memory Write | |
| Media Intel Core i7-1165G7 (21736 - 66791, n=58) | |
| Acer Enduro Urban N3 EUN314 | |
| Panasonic Toughbook FZ-55 MK2 | |
| Durabook S14I | |
| AIDA64 / Memory Latency | |
| Acer Enduro Urban N3 EUN314 | |
| Panasonic Toughbook FZ-55 MK2 | |
| Media Intel Core i7-1165G7 (69 - 110, n=65) | |
| Durabook S14I | |
* ... Meglio usare valori piccoli
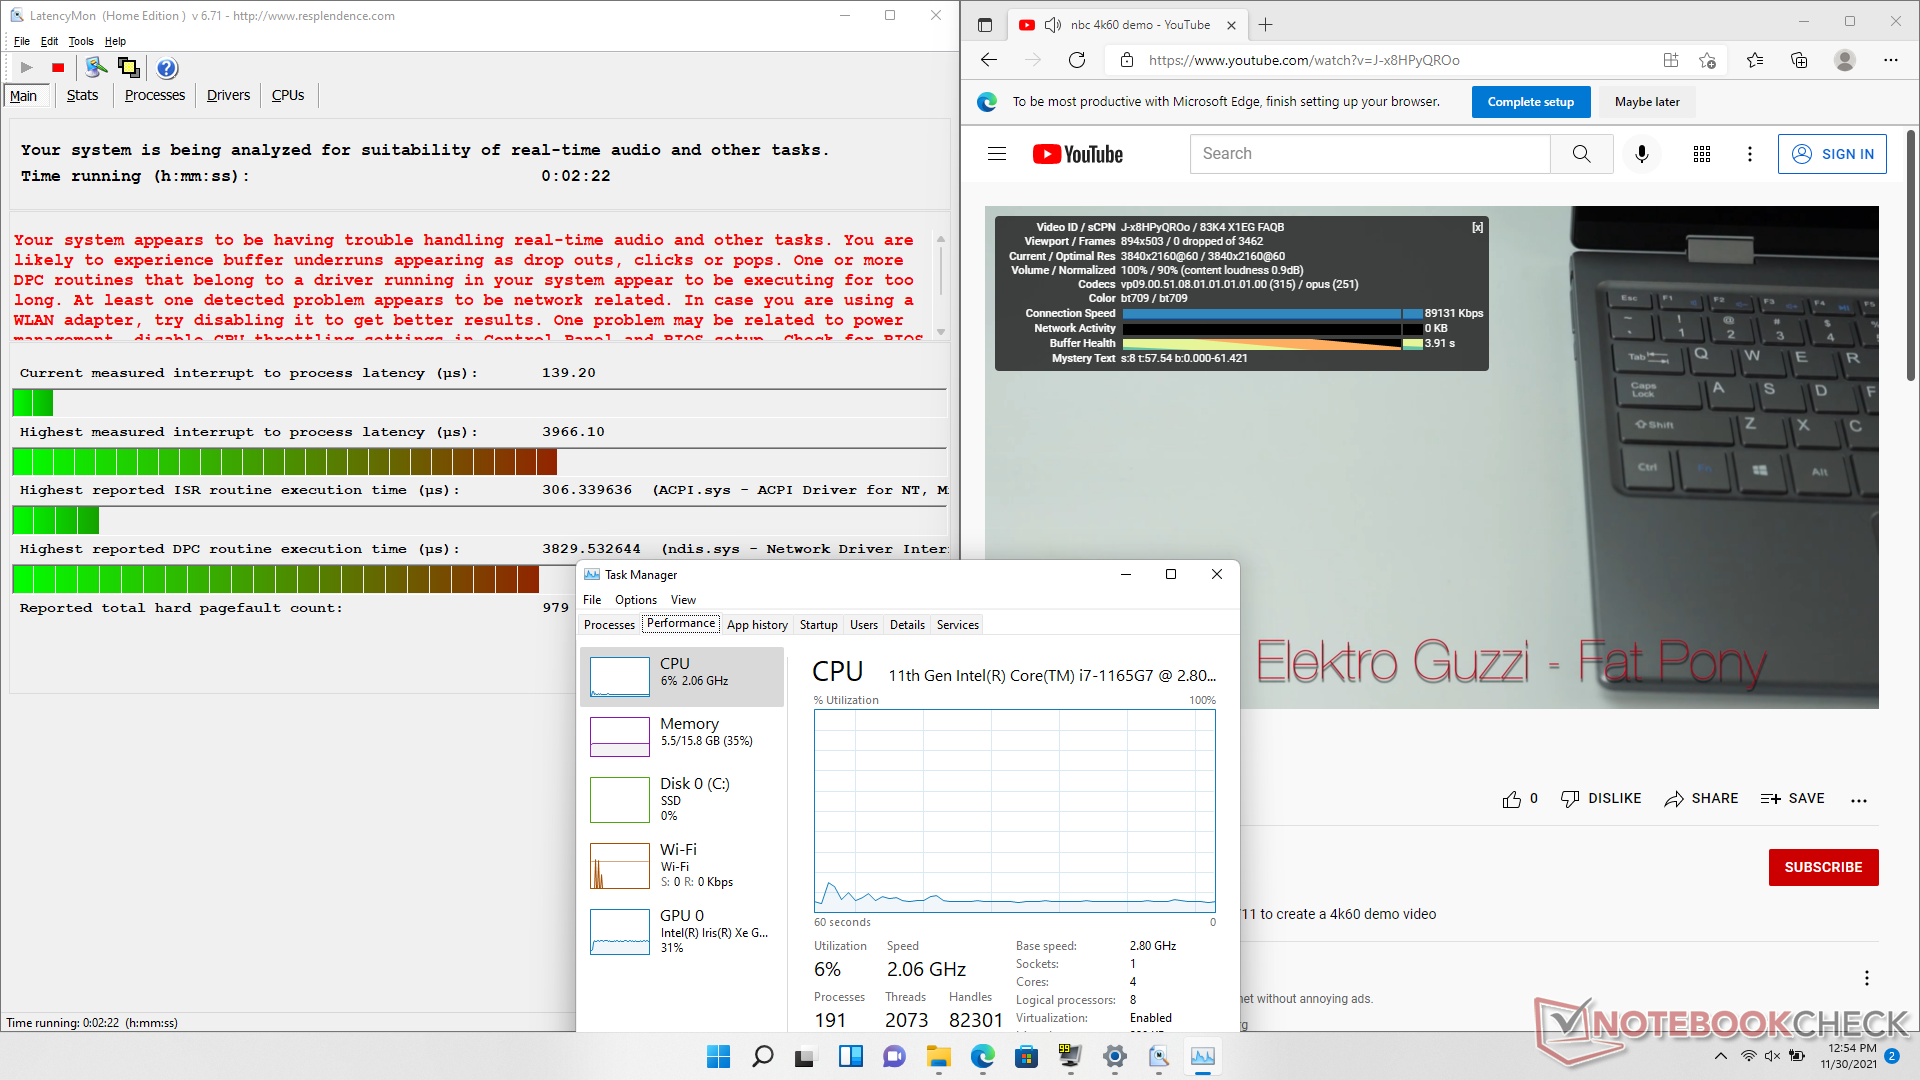
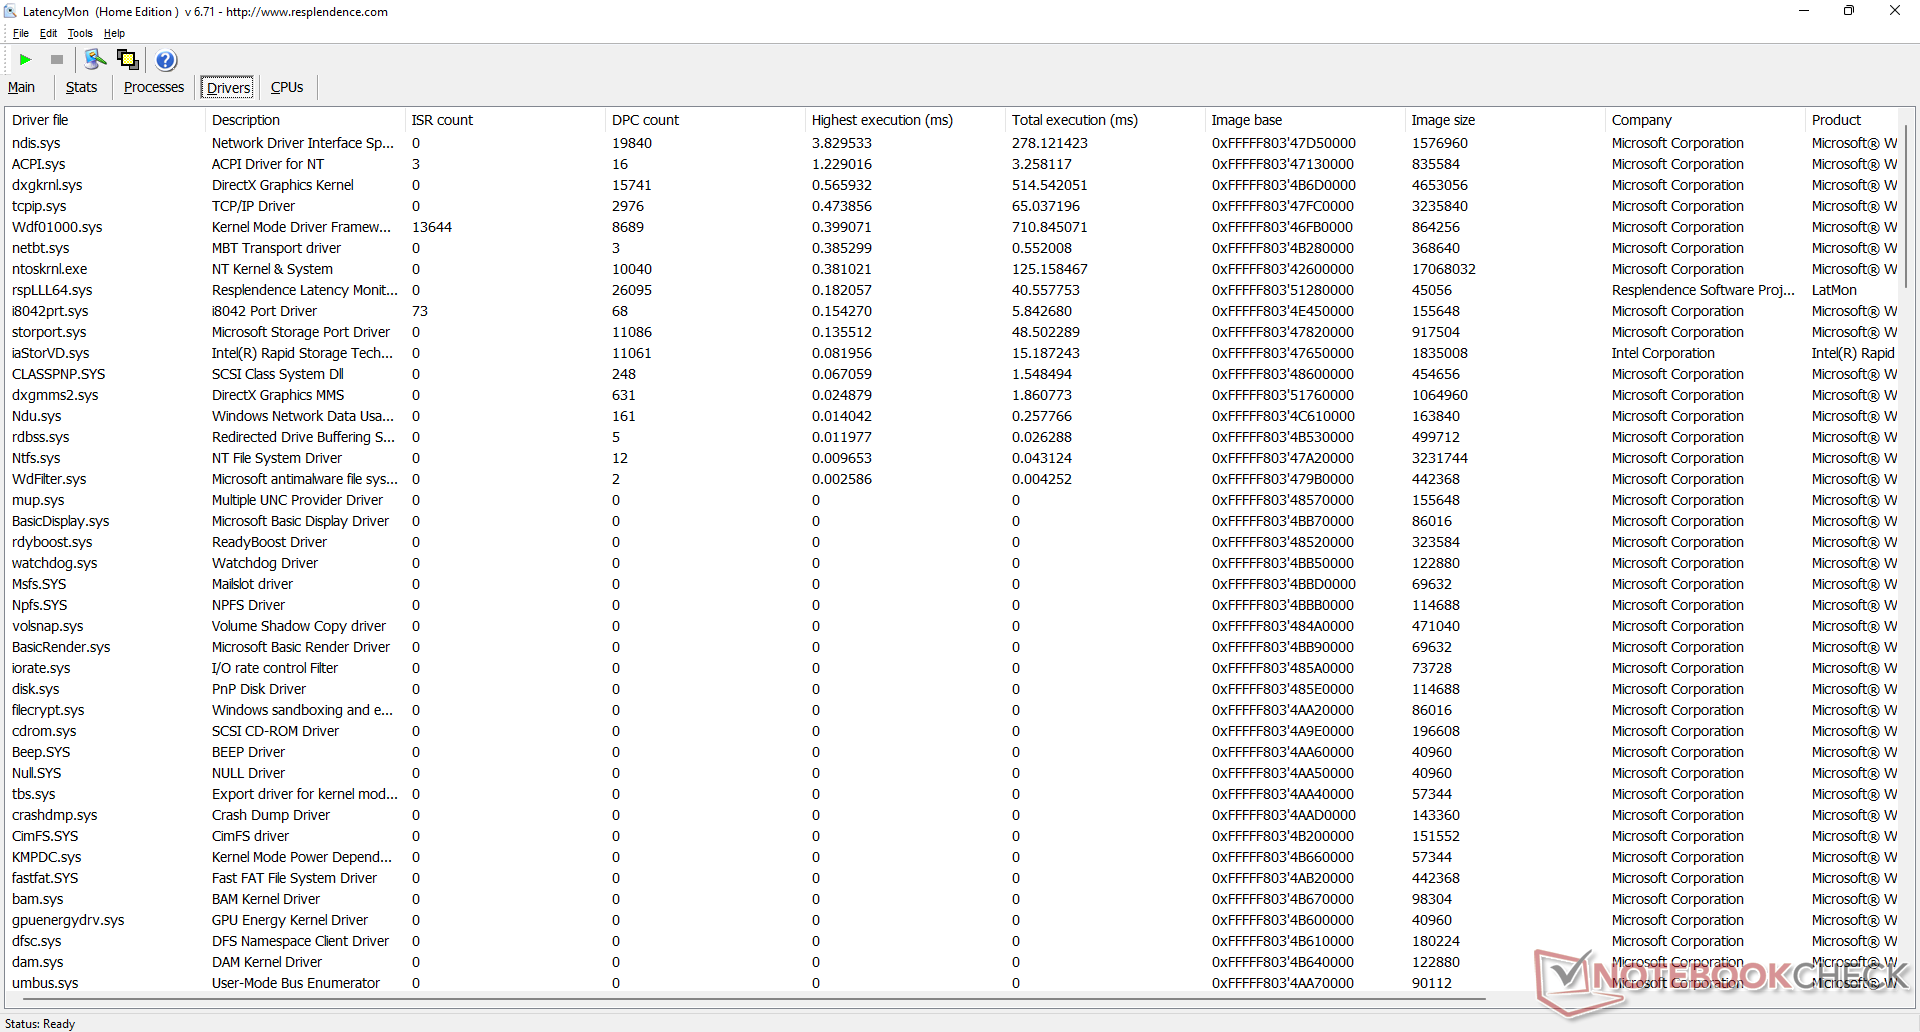
Latenza DPC
LatencyMon mostra problemi di DPC quando si aprono più schede del browser sulla nostra homepage. La riproduzione di video 4K a 60 FPS è altrimenti fluida e senza alcun calo di frame.
| DPC Latencies / LatencyMon - interrupt to process latency (max), Web, Youtube, Prime95 | |
| Acer Enduro Urban N3 EUN314 | |
| Panasonic Toughbook FZ-55 MK2 | |
| Durabook S14I | |
* ... Meglio usare valori piccoli
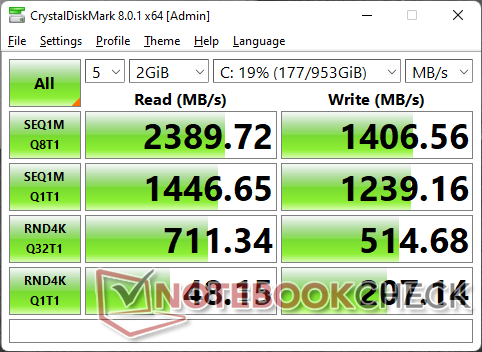
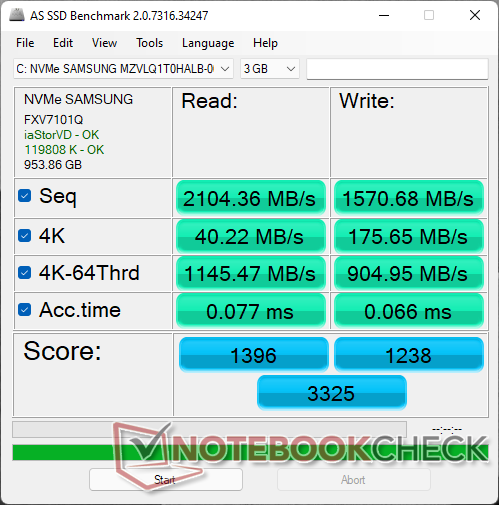
Dispositivi di archiviazione
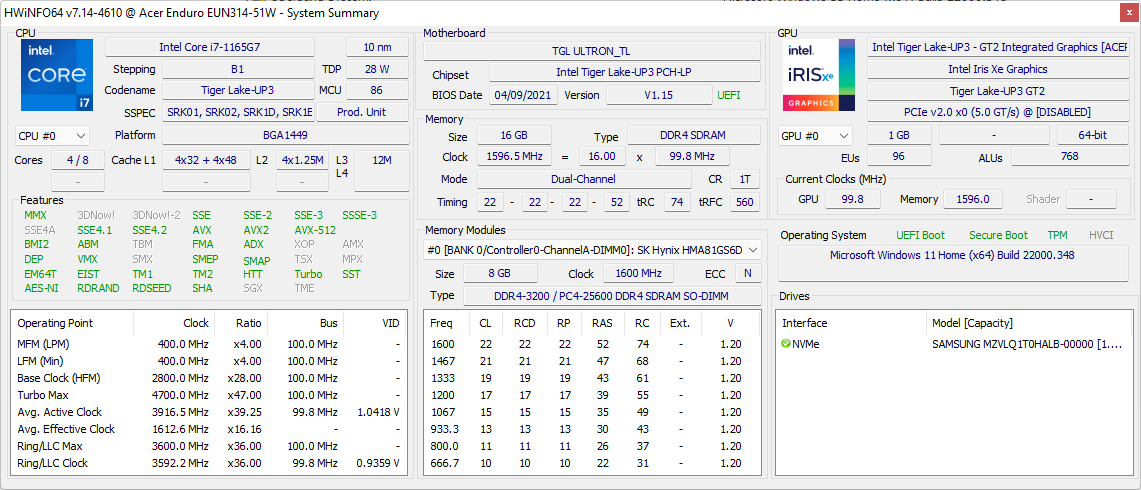
La nostra unità viene fornita con un 1 TB Samsung PM991 (non PM991a) che è un SSD NVMe PCIe3 di fascia media. I tassi di lettura sequenziale raggiungono i 2300 MB/s, ma la mancanza di un diffusore di calore per aiutare il raffreddamento significa che le prestazioni scenderanno quando sollecitato come mostrato dai nostri risultati del test DiskSpd Read Loop qui sotto. Fastidiosamente, gli utenti sono solo in grado di aggiungere una seconda unità di archiviazione su alcune SKU e non su tutte.

| Drive Performance rating - Percent | |
| Acer Enduro Urban N3 EUN314 | |
| Durabook S14I | |
| Dell Latitude 5420 Rugged-P85G -8! | |
| Panasonic Toughbook FZ-55 MK2 | |
| Getac S410 -8! | |
* ... Meglio usare valori piccoli
Disk Throttling: DiskSpd Read Loop, Queue Depth 8
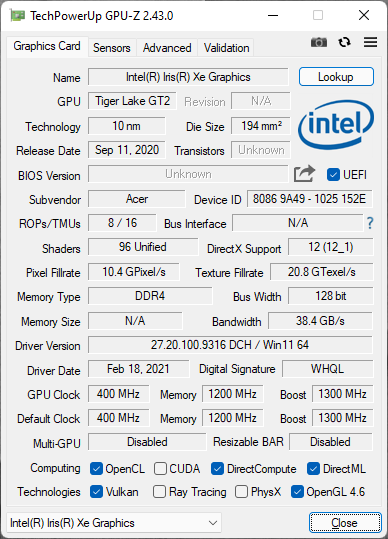
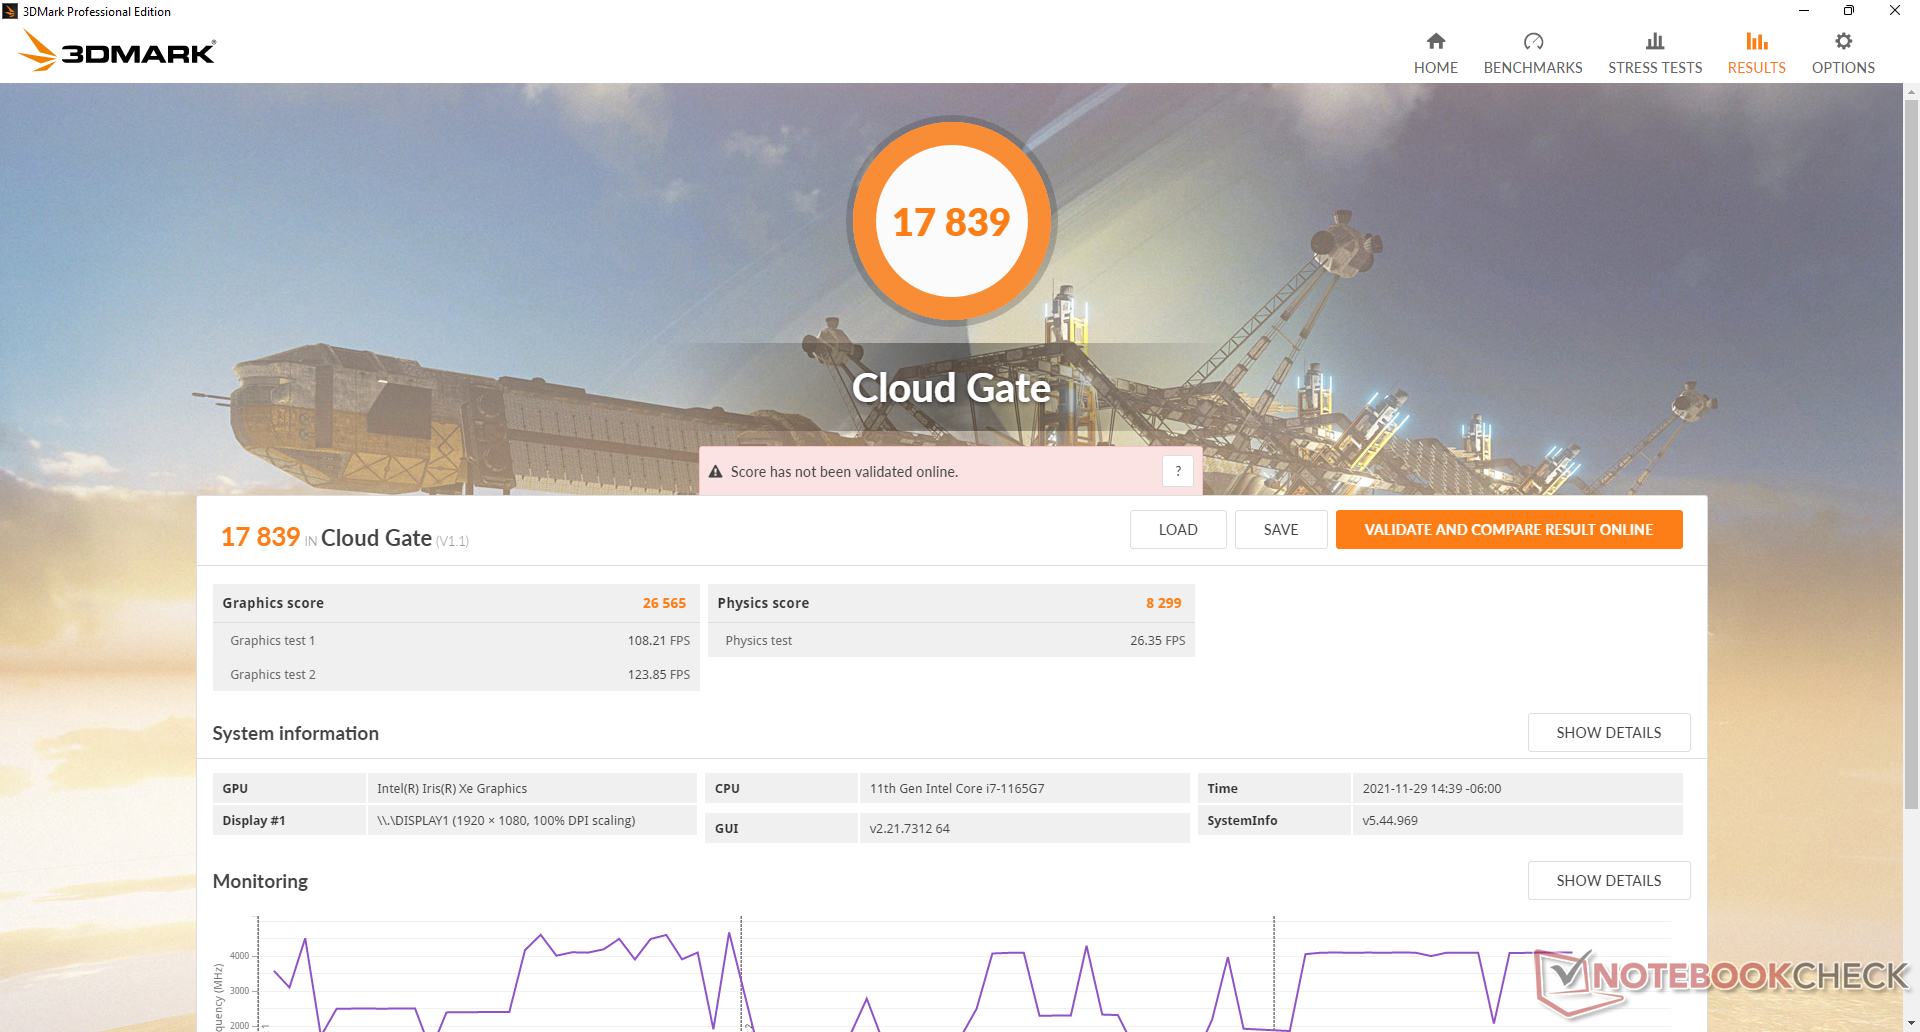
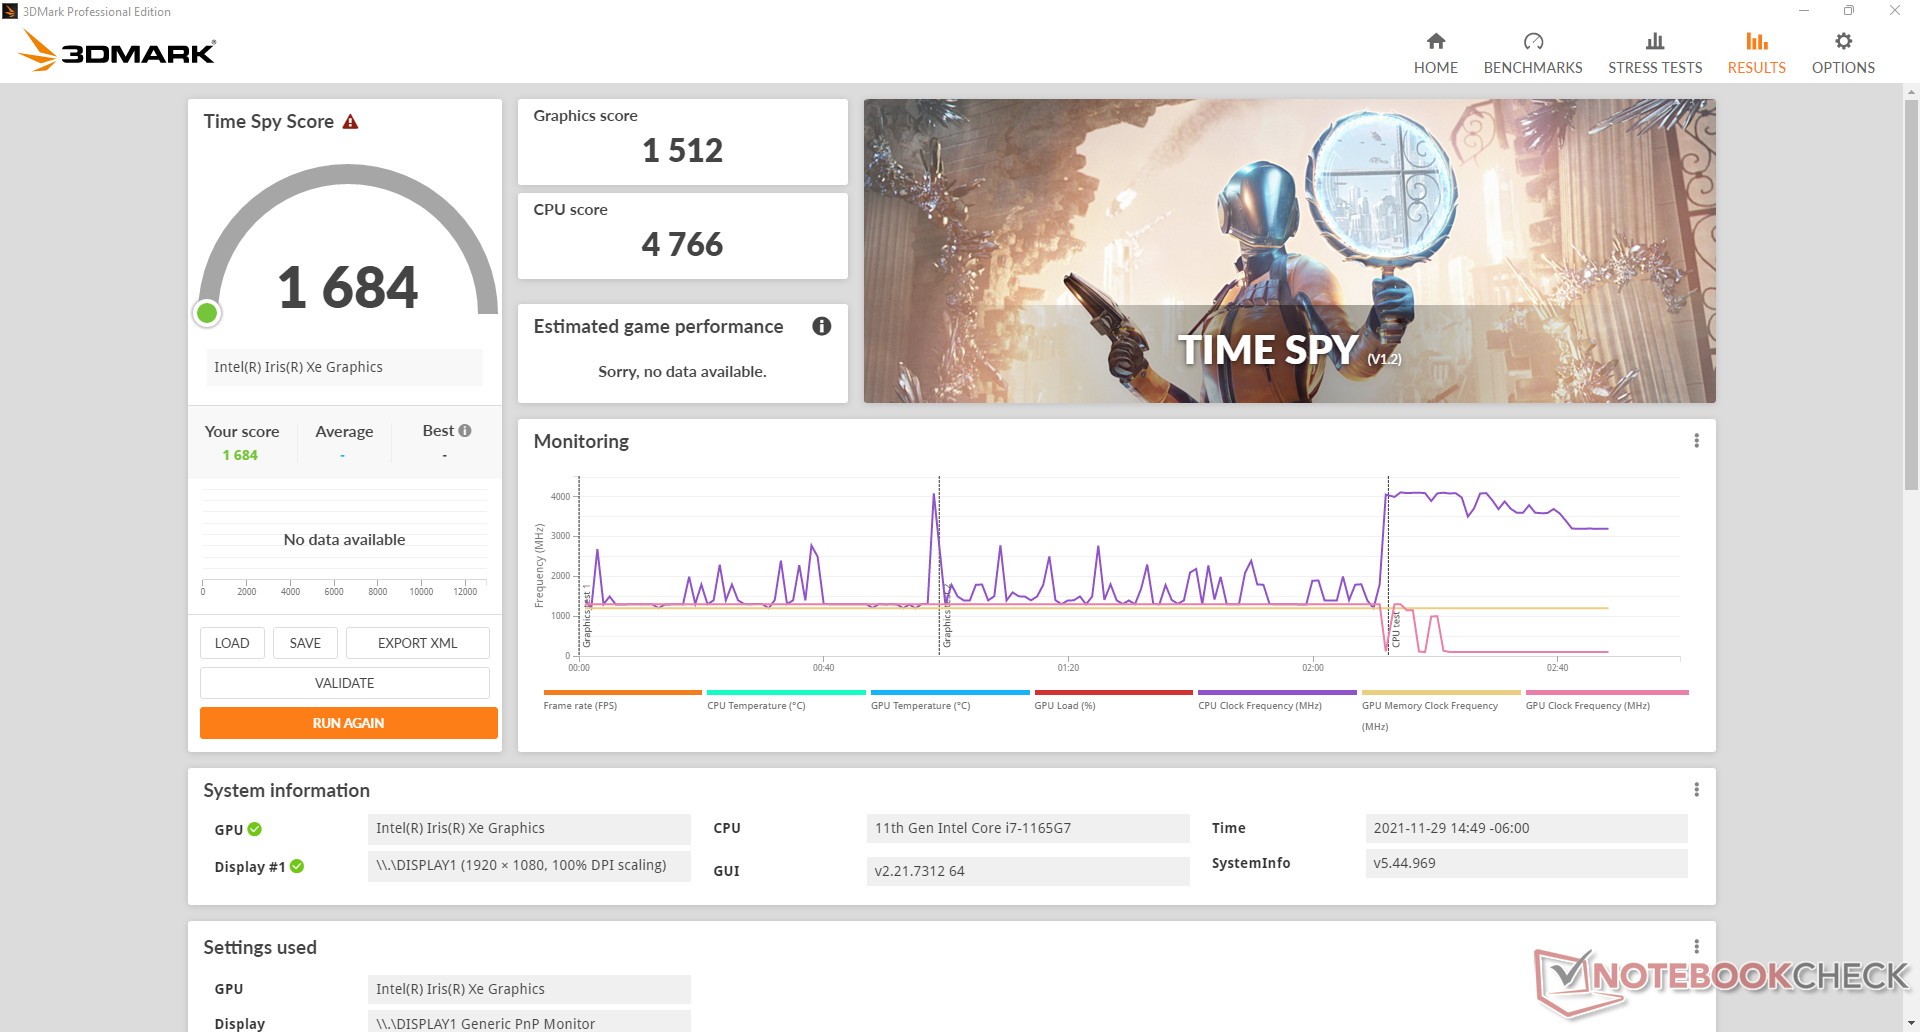
Prestazioni della GPU
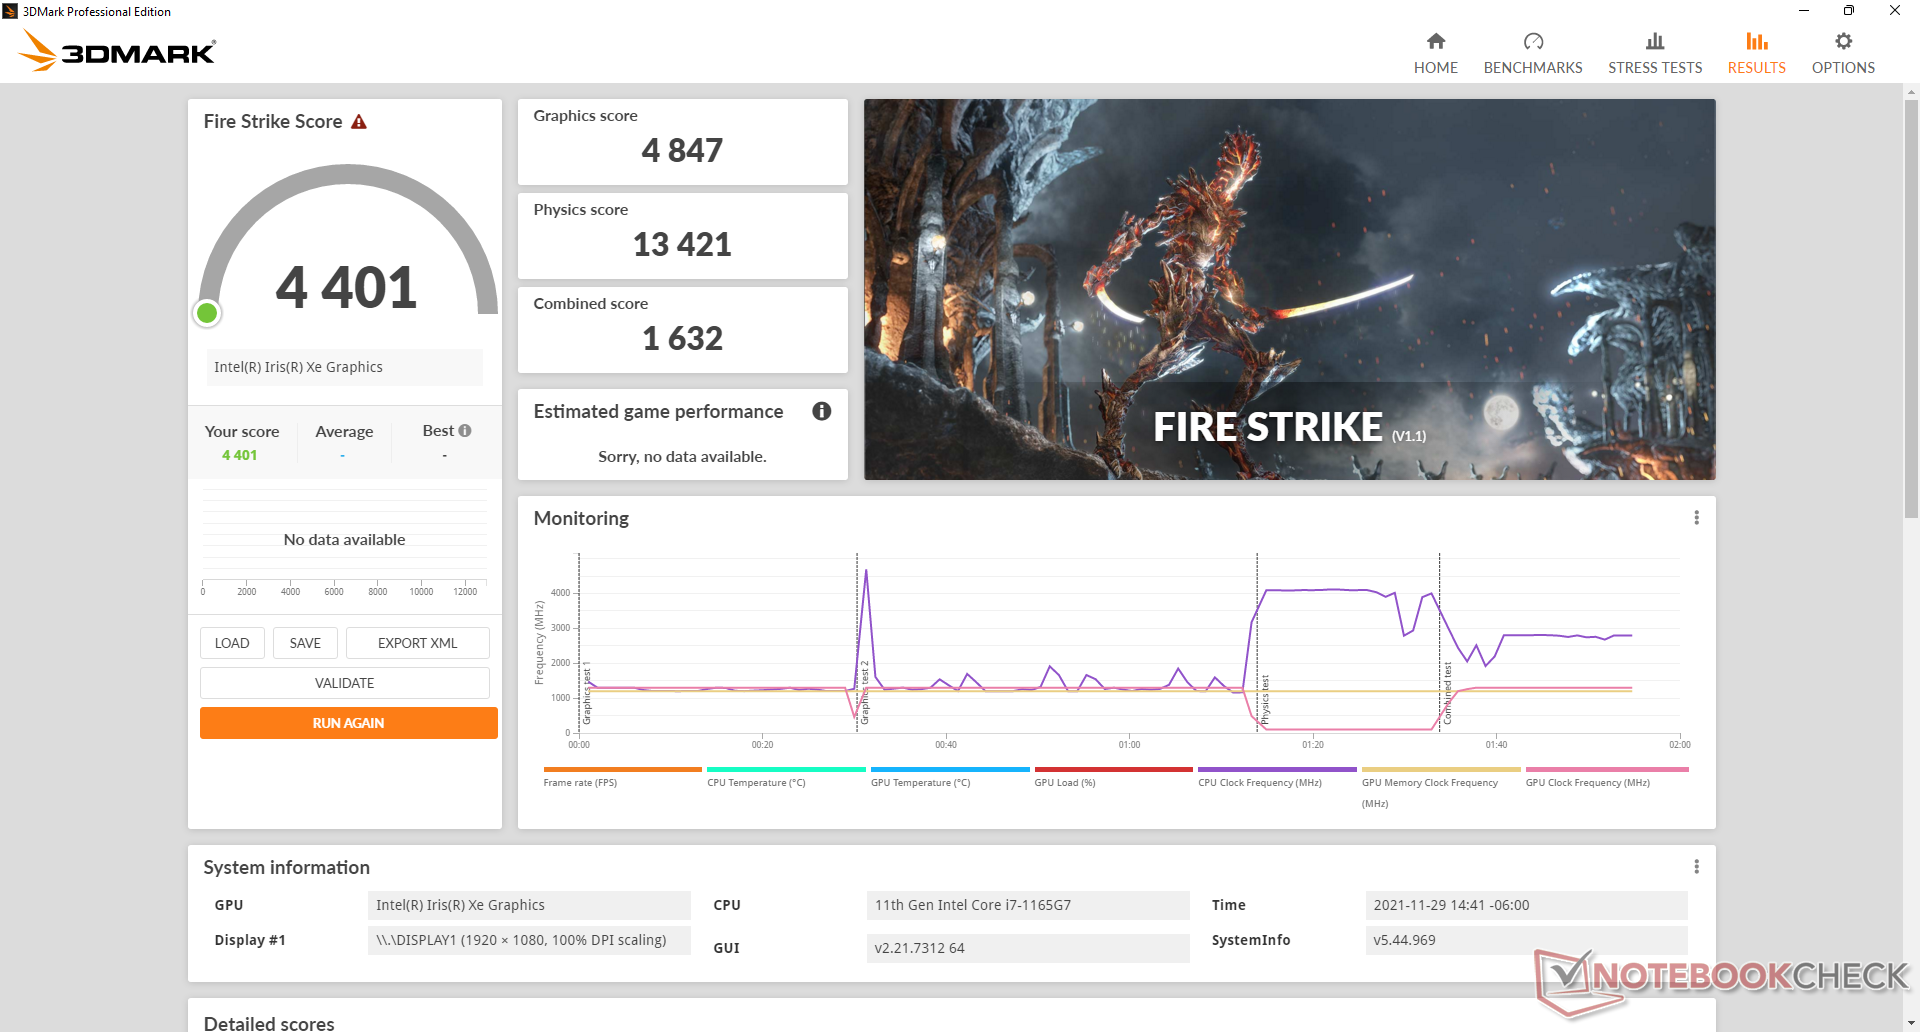
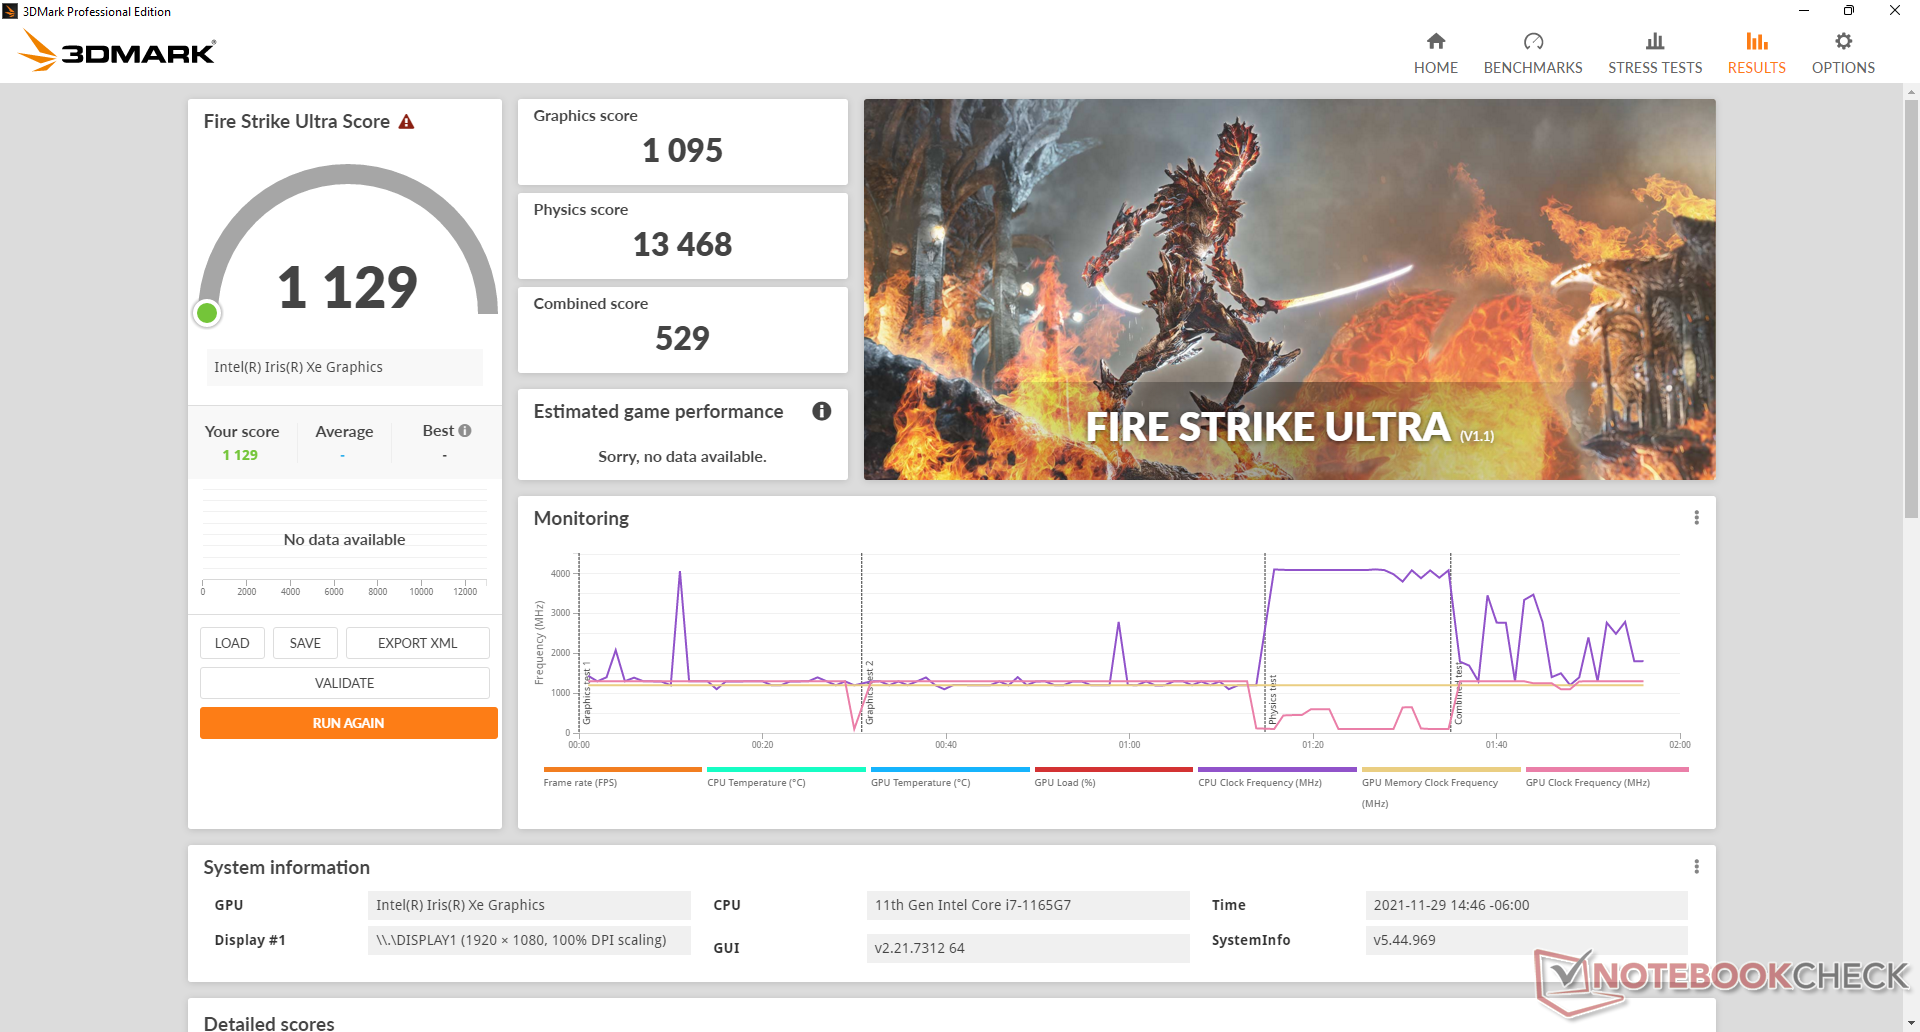
L'integrato Iris Xe 96 EUs La GPU si sta comportando dove ci aspettiamo che sia rispetto alla media del nostro database. Passando alla SKU Core i5 con la minore Iris Xe 80 EUs comporterebbe un calo di prestazioni di circa il 30-40 per cento.
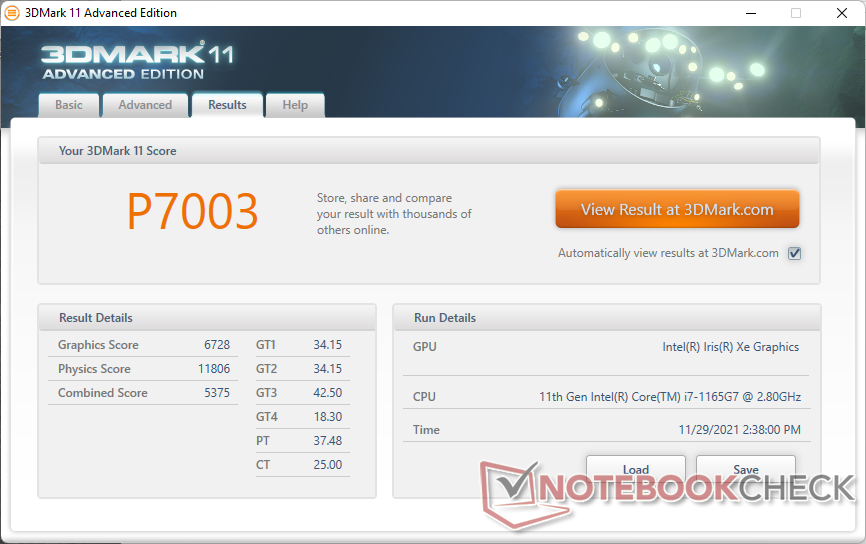
| 3DMark 11 Performance | 7003 punti | |
| 3DMark Cloud Gate Standard Score | 17839 punti | |
| 3DMark Fire Strike Score | 4401 punti | |
| 3DMark Time Spy Score | 1684 punti | |
Aiuto | ||
Witcher 3 FPS Chart
| basso | medio | alto | ultra | |
|---|---|---|---|---|
| GTA V (2015) | 91.1 | 78.1 | 19.2 | 8.32 |
| The Witcher 3 (2015) | 89.5 | 57.3 | 29.2 | 13.4 |
| Dota 2 Reborn (2015) | 78.5 | 81.6 | 48.7 | 43.4 |
| Final Fantasy XV Benchmark (2018) | 39.9 | 22.1 | 15.9 | |
| X-Plane 11.11 (2018) | 22.1 | 41.4 | 36.5 | |
| Far Cry 5 (2018) | 49 | 22 | 21 | 20 |
| Strange Brigade (2018) | 82.9 | 34.1 | 28.2 | 22.7 |
Emissioni
Rumore di sistema
Il rumore della ventola è silenzioso quando è al minimo sul desktop senza applicazioni in esecuzione. Più spesso che no, tuttavia, gli utenti navigheranno o faranno streaming video che indurranno un rumore della ventola di 27,9 dB(A) contro uno sfondo silenzioso di 23,8 dB(A). Sia il tono che il rumore sono bassi e facili da ignorare quando si è seduti a una distanza normale dal portatile.
Carichi più elevati come i giochi indurranno un rumore della ventola fino a 39 dB(A).
La nostra unità di test mostrava un piccolo fruscio della bobina che fortunatamente si notava solo quando si metteva un orecchio vicino ai tasti della tastiera.
Rumorosità
| Idle |
| 24.1 / 24.1 / 24.1 dB(A) |
| Sotto carico |
| 27.9 / 38.6 dB(A) |
 | ||
30 dB silenzioso 40 dB(A) udibile 50 dB(A) rumoroso |
||
min: | ||
| Acer Enduro Urban N3 EUN314 Iris Xe G7 96EUs, i7-1165G7, Samsung PM991 MZVLQ1T0HALB | Dell Latitude 5420 Rugged-P85G Radeon RX 540, i7-8650U, SK hynix PC401 NVMe 500 GB | Panasonic Toughbook FZ-55 MK2 Iris Xe G7 96EUs, i7-1185G7, Toshiba KIOXIA KBG4AZNV512G M.2 2280 OPAL | Durabook S14I Iris Xe G7 96EUs, i7-1165G7, UDinfo M2P M2P80DE512GBAEP | Getac S410 UHD Graphics 620, i5-8550U, CUKUSA 1 TB SATA SSD Q0526A | |
|---|---|---|---|---|---|
| Noise | -13% | -1% | -13% | -11% | |
| off /ambiente * (dB) | 23.8 | 28.3 -19% | 23.8 -0% | 25.2 -6% | 28.4 -19% |
| Idle Minimum * (dB) | 24.1 | 28.3 -17% | 24 -0% | 25.2 -5% | 28.4 -18% |
| Idle Average * (dB) | 24.1 | 28.3 -17% | 24 -0% | 25.2 -5% | 28.4 -18% |
| Idle Maximum * (dB) | 24.1 | 28.3 -17% | 24 -0% | 34.5 -43% | 28.4 -18% |
| Load Average * (dB) | 27.9 | 29.9 -7% | 26.7 4% | 34.5 -24% | 30.3 -9% |
| Witcher 3 ultra * (dB) | 35.7 | ||||
| Load Maximum * (dB) | 38.6 | 38 2% | 41.7 -8% | 36.2 6% | 33.3 14% |
* ... Meglio usare valori piccoli
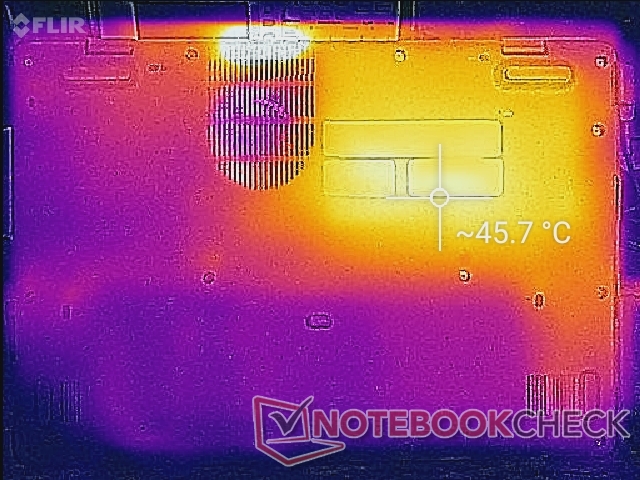
Temperatura
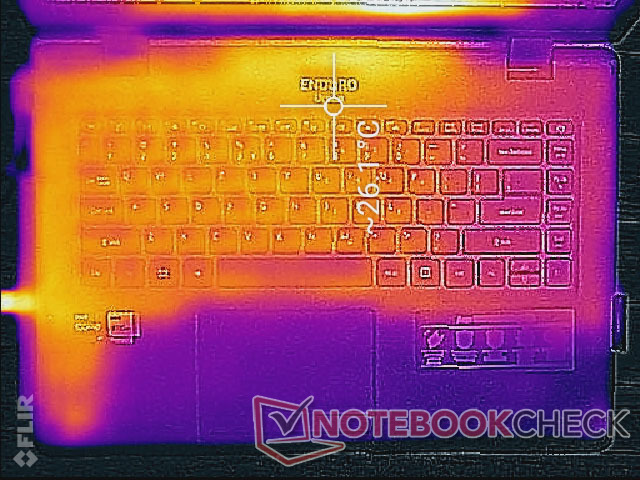
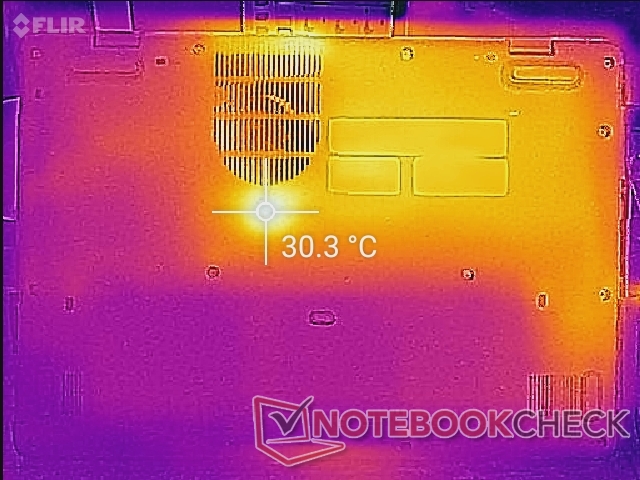
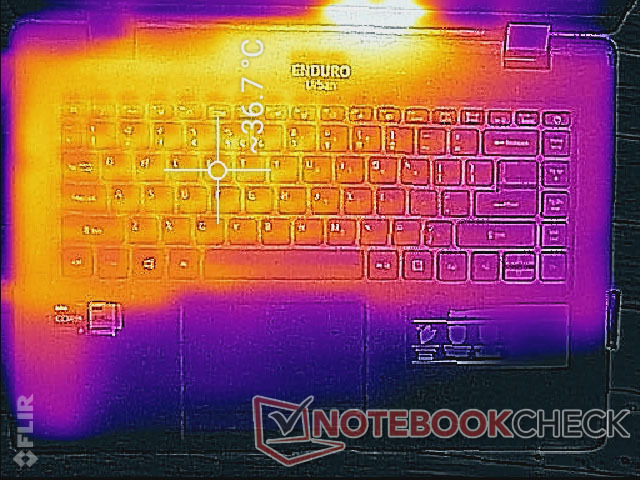
Le temperature superficiali sono più calde sulla metà sinistra del portatile rispetto alla metà destra a causa di come è stata progettata la soluzione di raffreddamento. I punti caldi possono raggiungere fino a 37 C e 46 C sulla parte superiore e inferiore, rispettivamente, mentre il più spesso Durabook S14I raggiungerebbe i 39 C su entrambi i lati se sottoposto a condizioni simili.
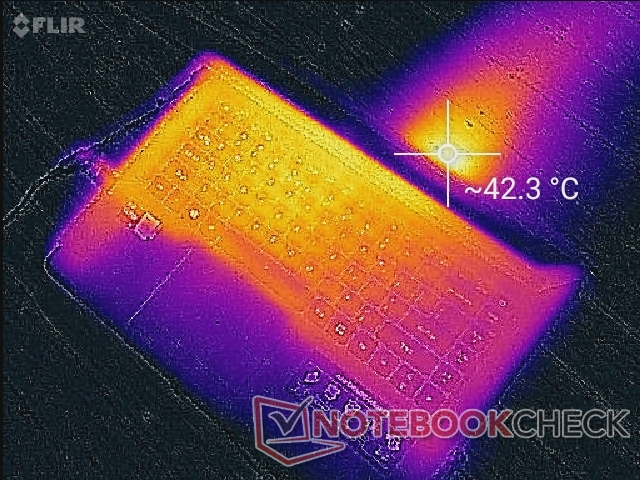
(+) La temperatura massima sul lato superiore è di 37.8 °C / 100 F, rispetto alla media di 34.3 °C / 94 F, che varia da 21.2 a 62.5 °C per questa classe Office.
(-) Il lato inferiore si riscalda fino ad un massimo di 45.8 °C / 114 F, rispetto alla media di 36.8 °C / 98 F
(+) In idle, la temperatura media del lato superiore è di 24.7 °C / 76 F, rispetto alla media deld ispositivo di 29.5 °C / 85 F.
(+) I poggiapolsi e il touchpad sono piu' freddi della temperatura della pelle con un massimo di 28.6 °C / 83.5 F e sono quindi freddi al tatto.
(±) La temperatura media della zona del palmo della mano di dispositivi simili e'stata di 27.5 °C / 81.5 F (-1.1 °C / -2 F).
| Acer Enduro Urban N3 EUN314 Intel Core i7-1165G7, Intel Iris Xe Graphics G7 96EUs | Dell Latitude 5420 Rugged-P85G Intel Core i7-8650U, AMD Radeon RX 540 | Panasonic Toughbook FZ-55 MK2 Intel Core i7-1185G7, Intel Iris Xe Graphics G7 96EUs | Durabook S14I Intel Core i7-1165G7, Intel Iris Xe Graphics G7 96EUs | Getac S410 Intel Core i7-8550U, Intel UHD Graphics 620 | |
|---|---|---|---|---|---|
| Heat | -7% | -5% | -4% | -13% | |
| Maximum Upper Side * (°C) | 37.8 | 42.2 -12% | 36.2 4% | 36.4 4% | 42.6 -13% |
| Maximum Bottom * (°C) | 45.8 | 42 8% | 42.2 8% | 38.6 16% | 49 -7% |
| Idle Upper Side * (°C) | 26.4 | 31.6 -20% | 31 -17% | 32.6 -23% | 30.8 -17% |
| Idle Bottom * (°C) | 30.2 | 31.8 -5% | 34 -13% | 33.8 -12% | 34.4 -14% |
* ... Meglio usare valori piccoli
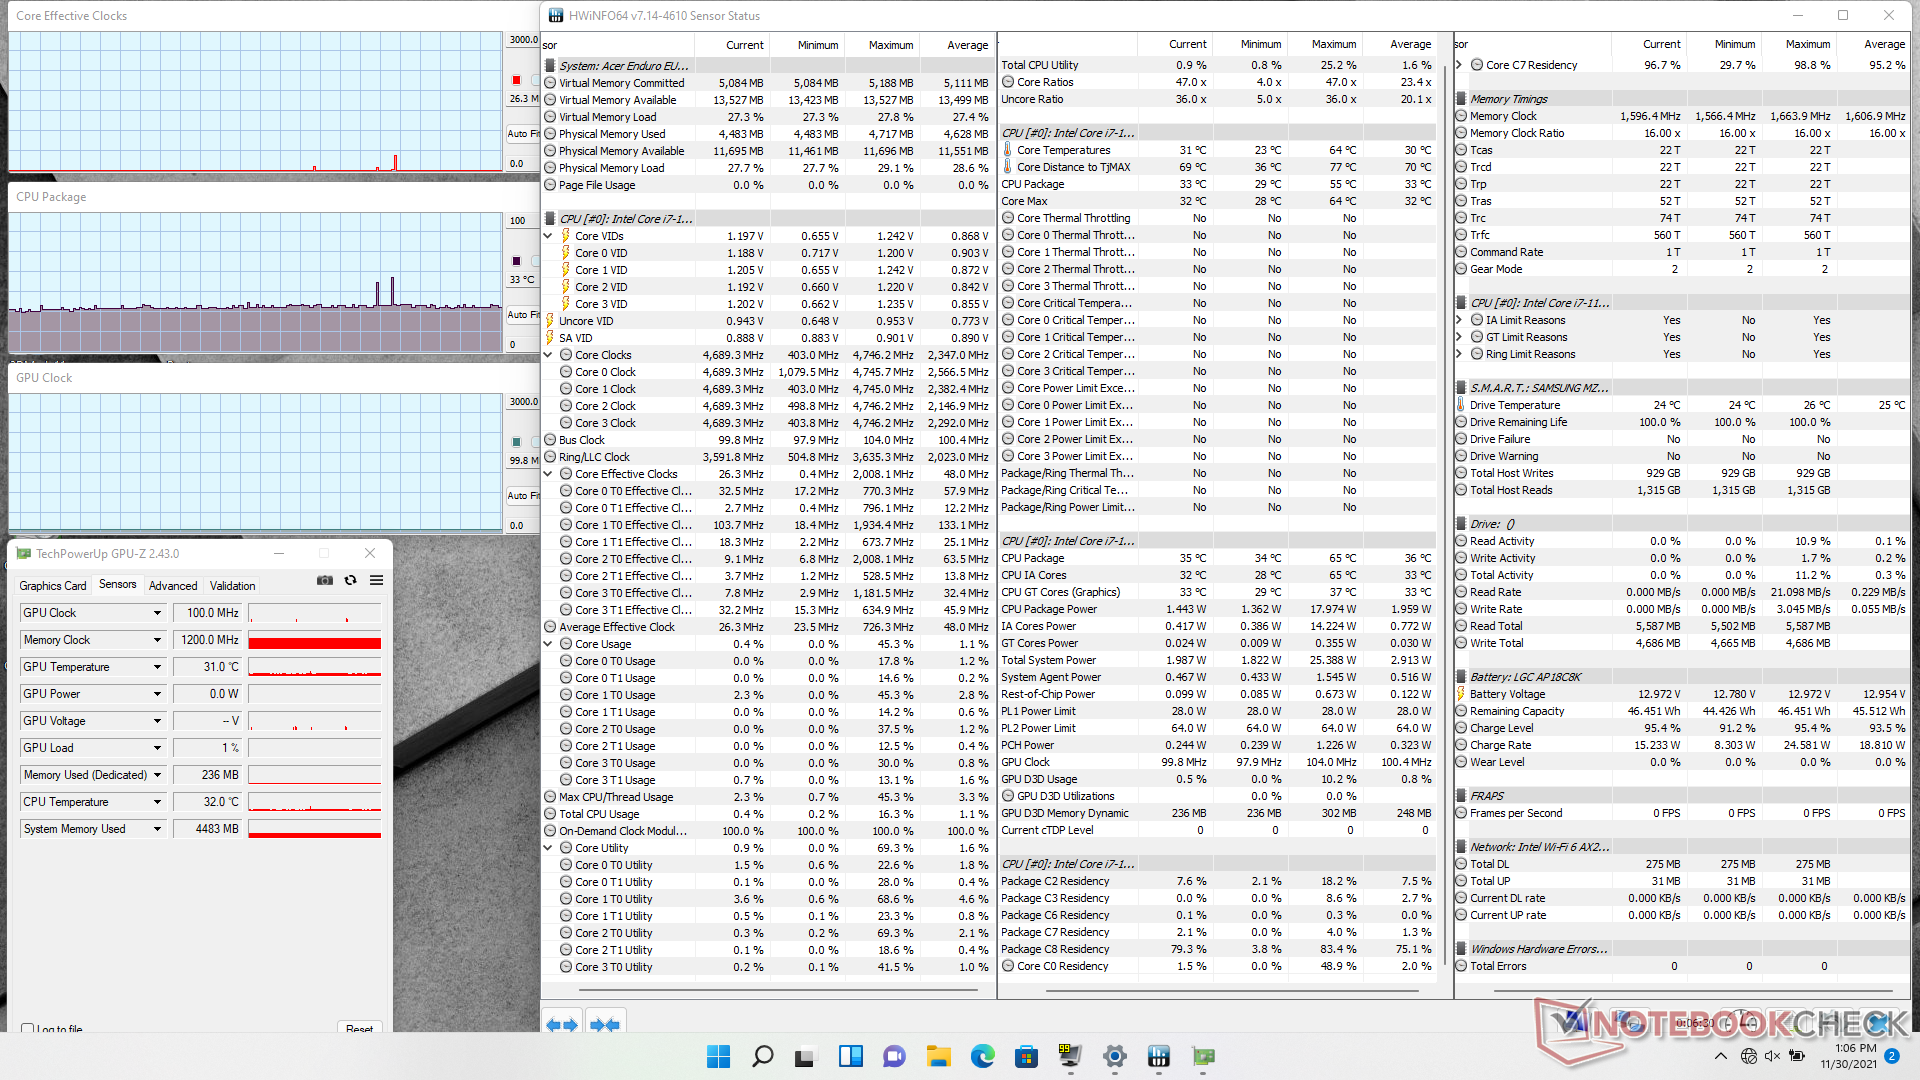
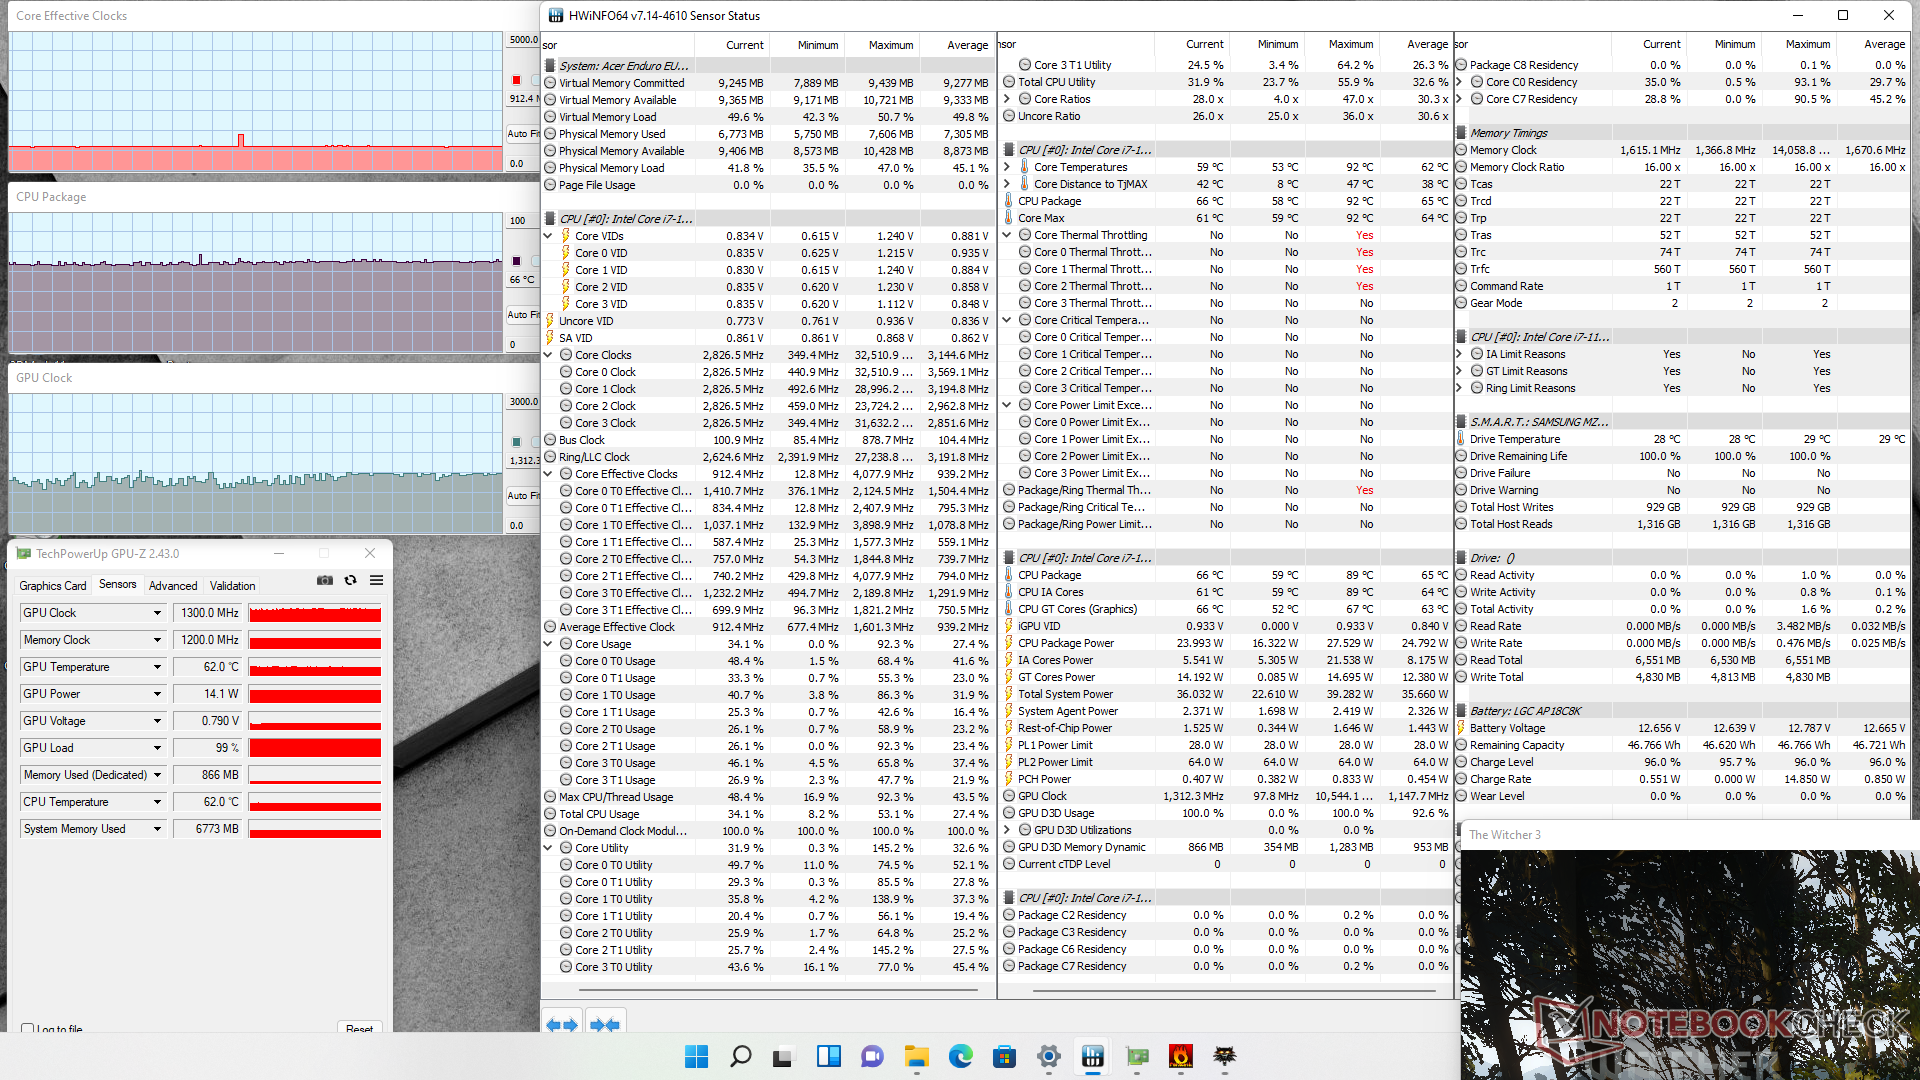
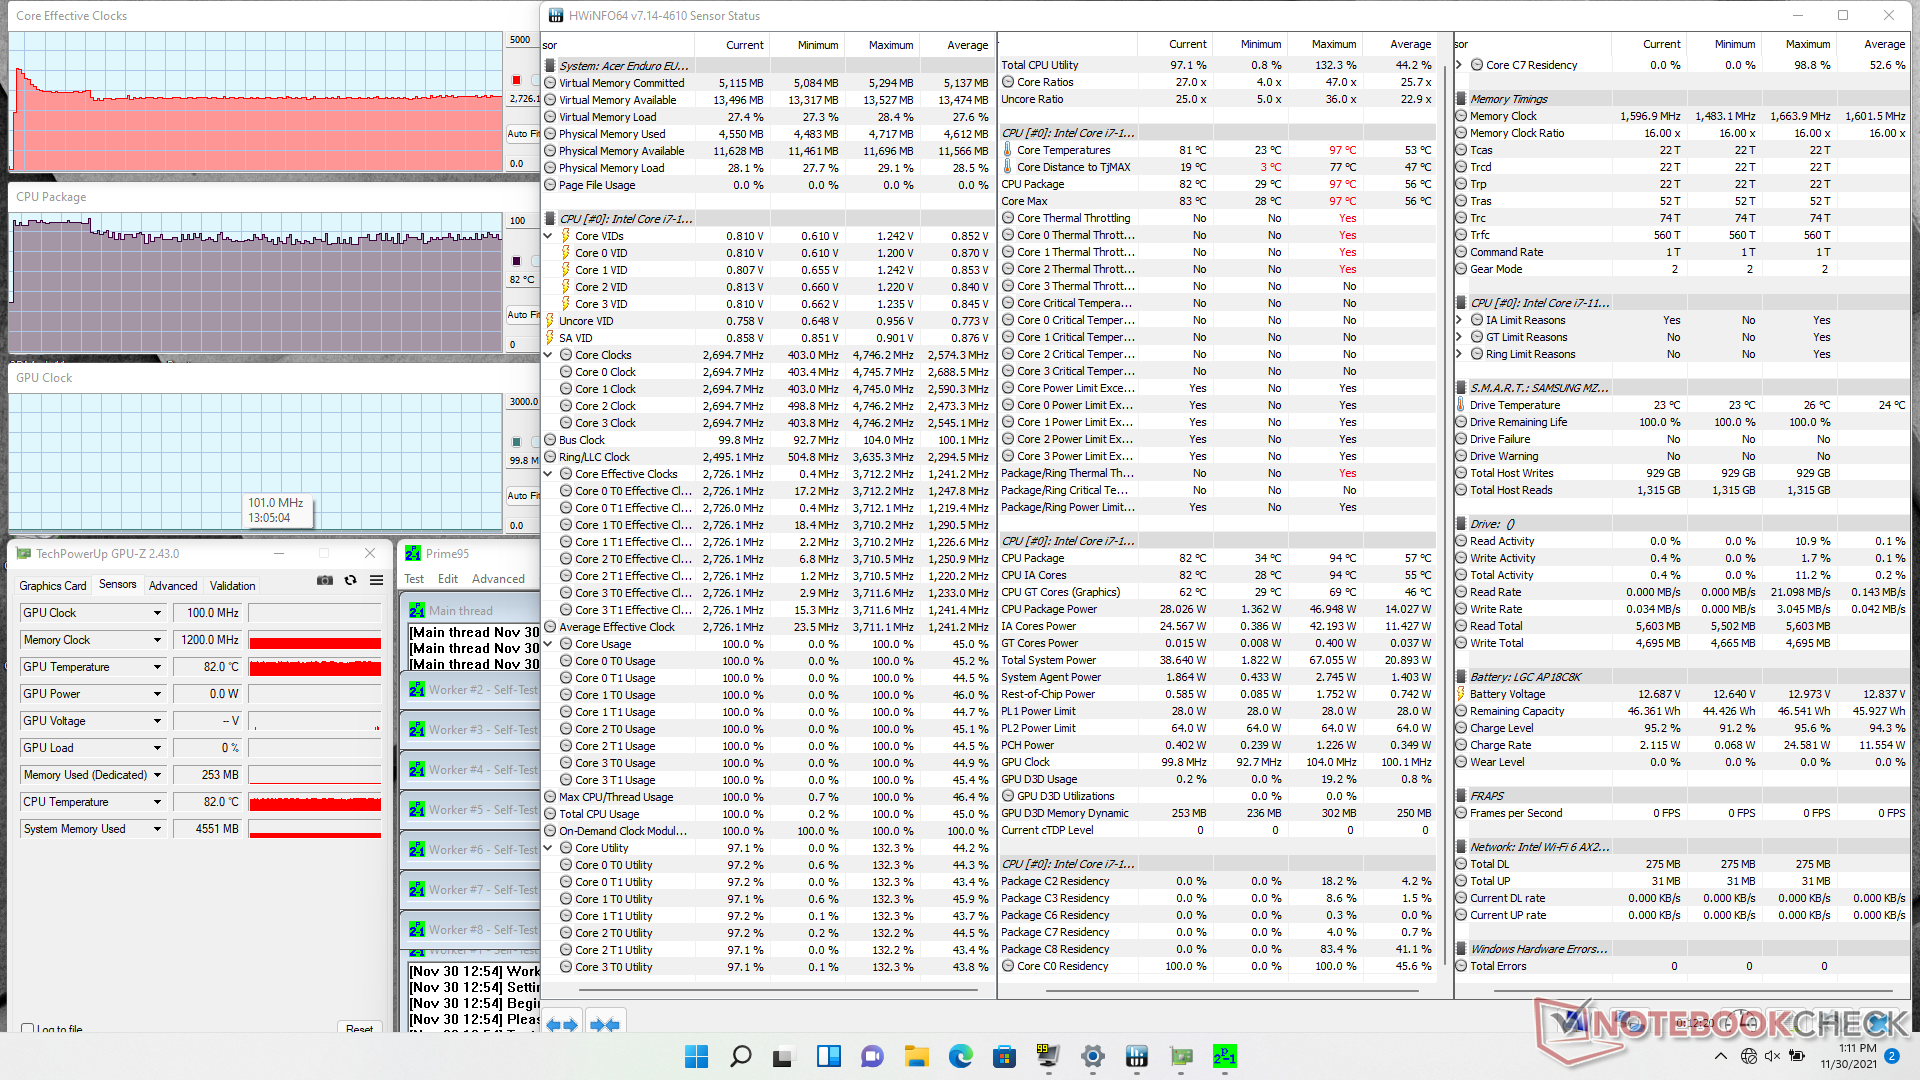
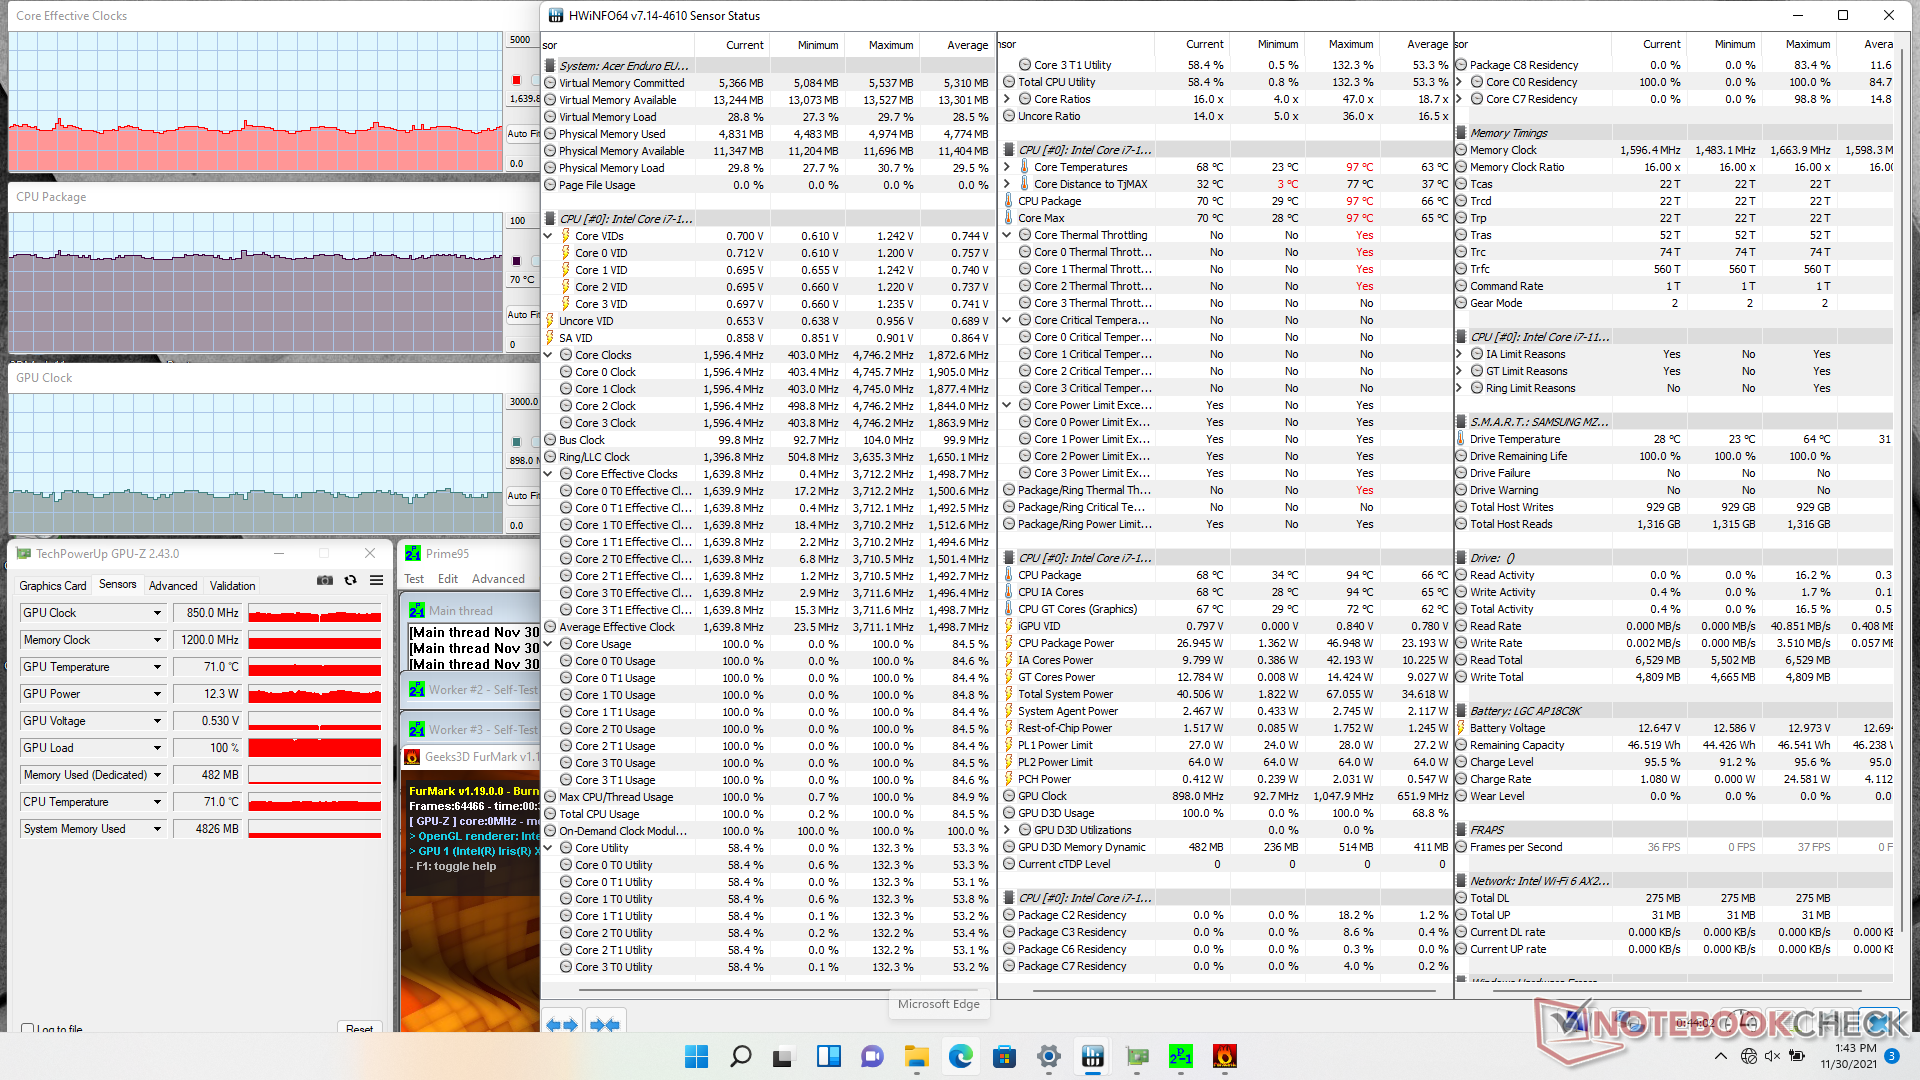
Test di stress
Quando si esegue Prime95 per stressare la CPU, le frequenze di clock salivano a 3,7 GHz per il primo secondo o due prima di scendere a 2,9 GHz e poi alla fine a 2,7 GHz. La temperatura del core e la potenza del pacchetto CPU si stabilizzavano rispettivamente a 82 C e 28 W. Il Durabook S14I si stabilizzerebbe a frequenze di clock più lente nella gamma da 1.8 a 1.9 GHz ma anche ad una temperatura del core più fredda di 63 C.
Il funzionamento a batterie limiterà le prestazioni. Un test 3DMark 11 a batteria restituirebbe i punteggi di Fisica e Grafica 10264 e 5615 punti, rispettivamente, rispetto a 11806 e 6728 punti quando è alimentato.
| Clock della CPU (GHz)Clock della GPU(MHz)Temperaturamedia dellaCPU (°C) | |
| Sistema inattivo | -- |
| Stress Prime95 | 2.7 |
| Prime95 + FurMark Stress | 1.4 - 1.6 |
| Witcher 3 Stress | 0.9 |
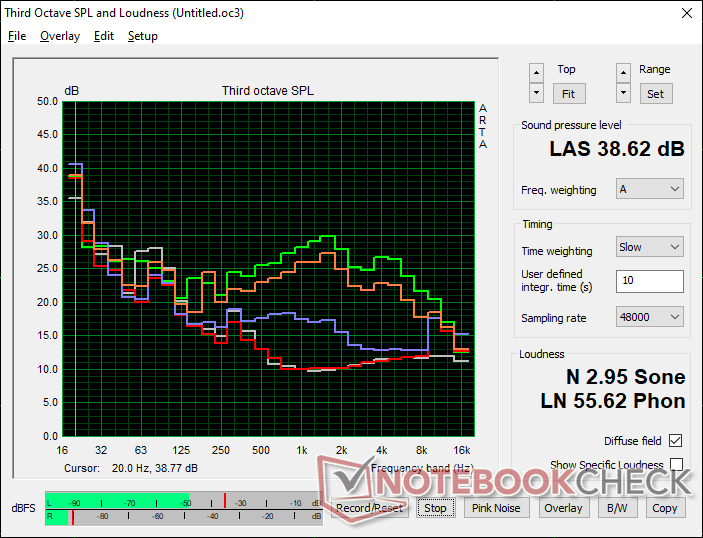
Altoparlanti
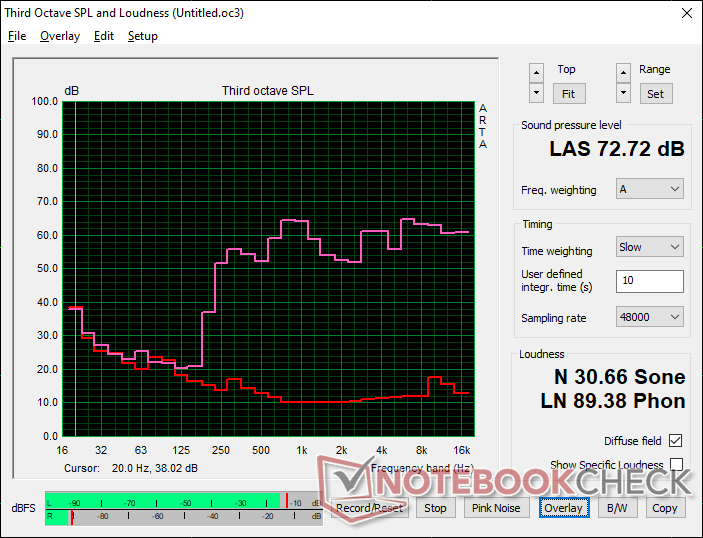
Acer Enduro Urban N3 EUN314 analisi audio
(±) | potenza degli altiparlanti media ma buona (72.7 dB)
Bassi 100 - 315 Hz
(-) | quasi nessun basso - in media 21.2% inferiori alla media
(±) | la linearità dei bassi è media (14.2% delta rispetto alla precedente frequenza)
Medi 400 - 2000 Hz
(+) | medi bilanciati - solo only 4.2% rispetto alla media
(±) | linearità dei medi adeguata (7.9% delta rispetto alla precedente frequenza)
Alti 2 - 16 kHz
(±) | alti elevati - circa 5.5% superiori alla media
(±) | la linearità degli alti è media (8.6% delta rispetto alla precedente frequenza)
Nel complesso 100 - 16.000 Hz
(±) | la linearità complessiva del suono è media (23% di differenza rispetto alla media
Rispetto alla stessa classe
» 64% di tutti i dispositivi testati in questa classe è stato migliore, 7% simile, 29% peggiore
» Il migliore ha avuto un delta di 7%, medio di 21%, peggiore di 53%
Rispetto a tutti i dispositivi testati
» 69% di tutti i dispositivi testati in questa classe è stato migliore, 5% similare, 26% peggiore
» Il migliore ha avuto un delta di 4%, medio di 23%, peggiore di 134%
Apple MacBook 12 (Early 2016) 1.1 GHz analisi audio
(+) | gli altoparlanti sono relativamente potenti (83.6 dB)
Bassi 100 - 315 Hz
(±) | bassi ridotti - in media 11.3% inferiori alla media
(±) | la linearità dei bassi è media (14.2% delta rispetto alla precedente frequenza)
Medi 400 - 2000 Hz
(+) | medi bilanciati - solo only 2.4% rispetto alla media
(+) | medi lineari (5.5% delta rispetto alla precedente frequenza)
Alti 2 - 16 kHz
(+) | Alti bilanciati - appena 2% dalla media
(+) | alti lineari (4.5% delta rispetto alla precedente frequenza)
Nel complesso 100 - 16.000 Hz
(+) | suono nel complesso lineare (10.2% differenza dalla media)
Rispetto alla stessa classe
» 7% di tutti i dispositivi testati in questa classe è stato migliore, 2% simile, 90% peggiore
» Il migliore ha avuto un delta di 5%, medio di 18%, peggiore di 53%
Rispetto a tutti i dispositivi testati
» 5% di tutti i dispositivi testati in questa classe è stato migliore, 1% similare, 94% peggiore
» Il migliore ha avuto un delta di 4%, medio di 23%, peggiore di 134%
Gestione dell'energia
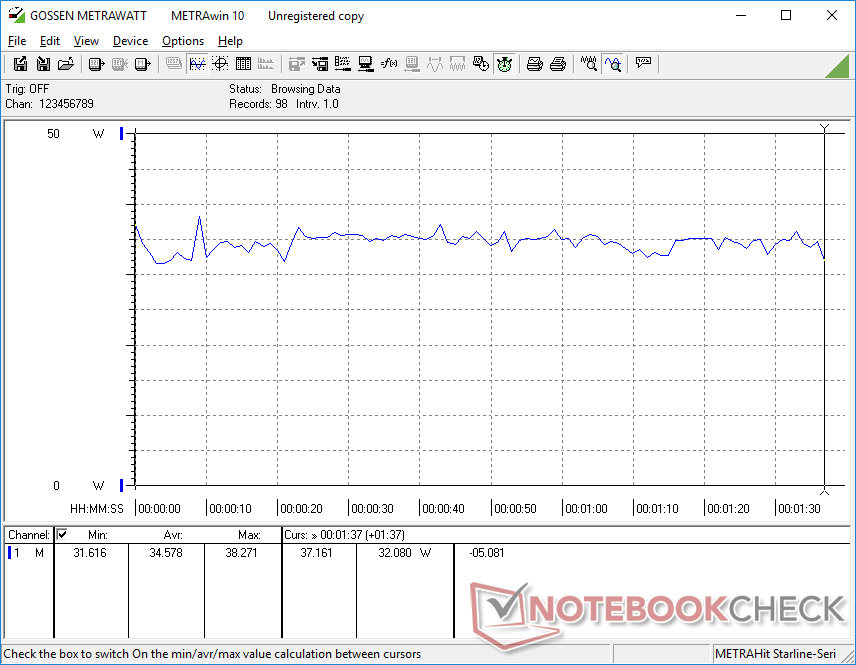
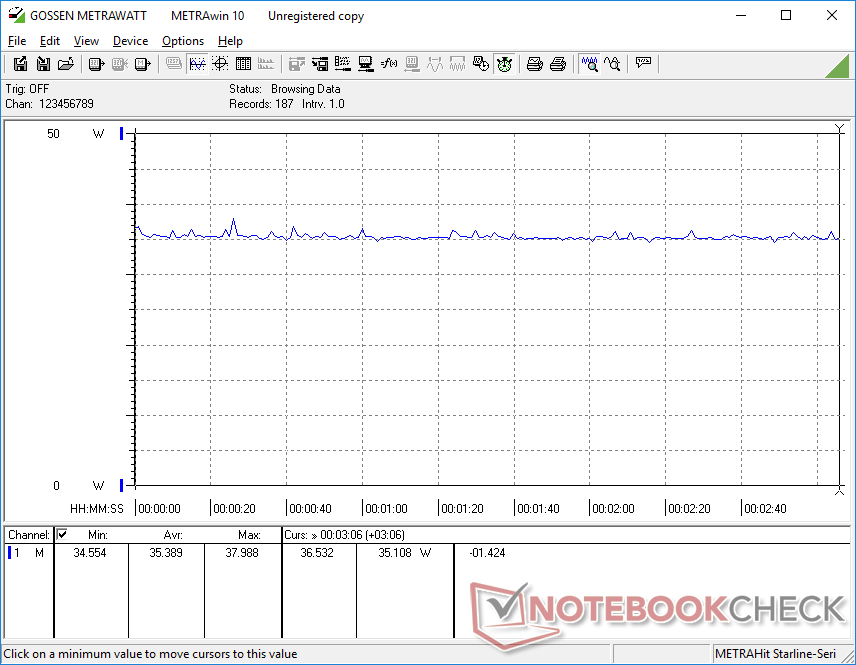
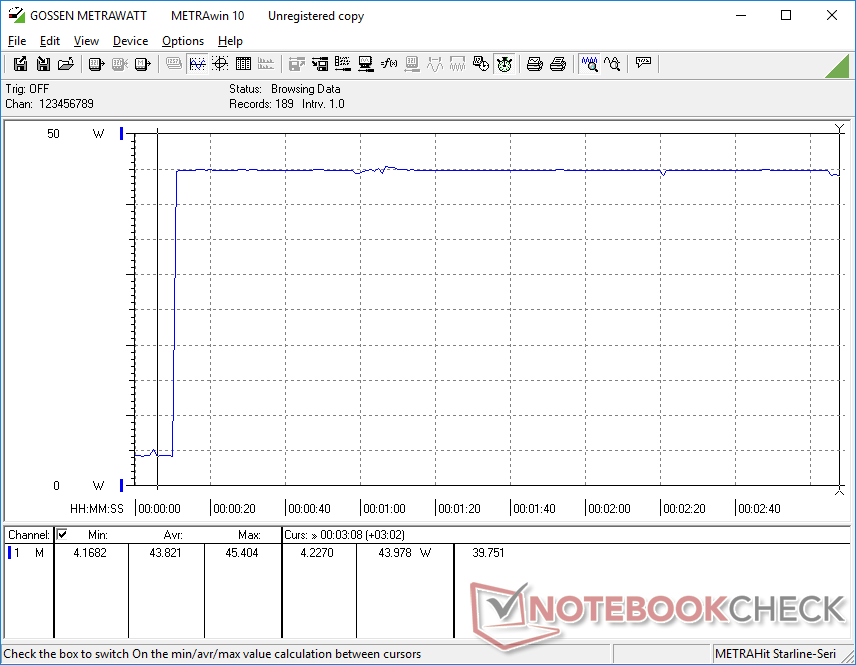
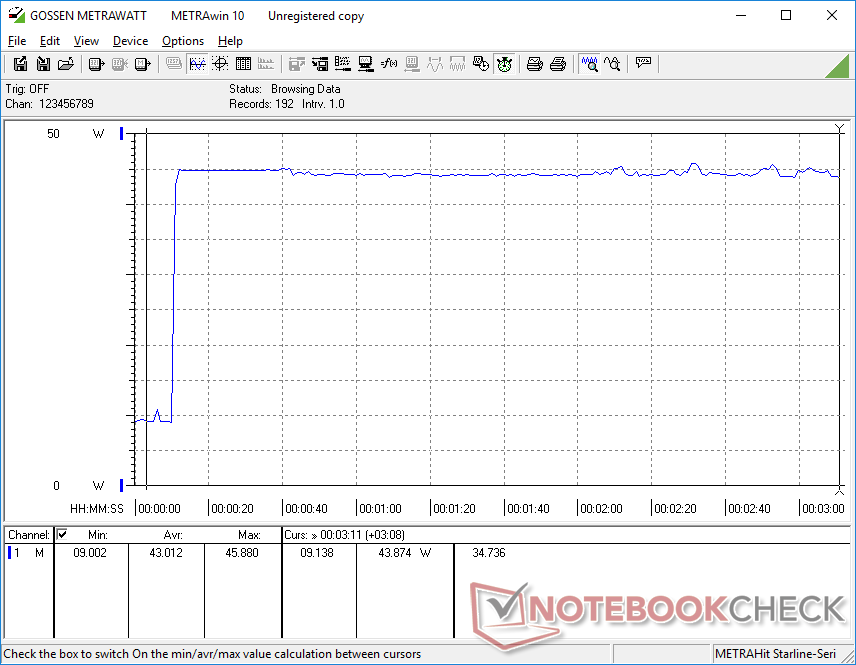
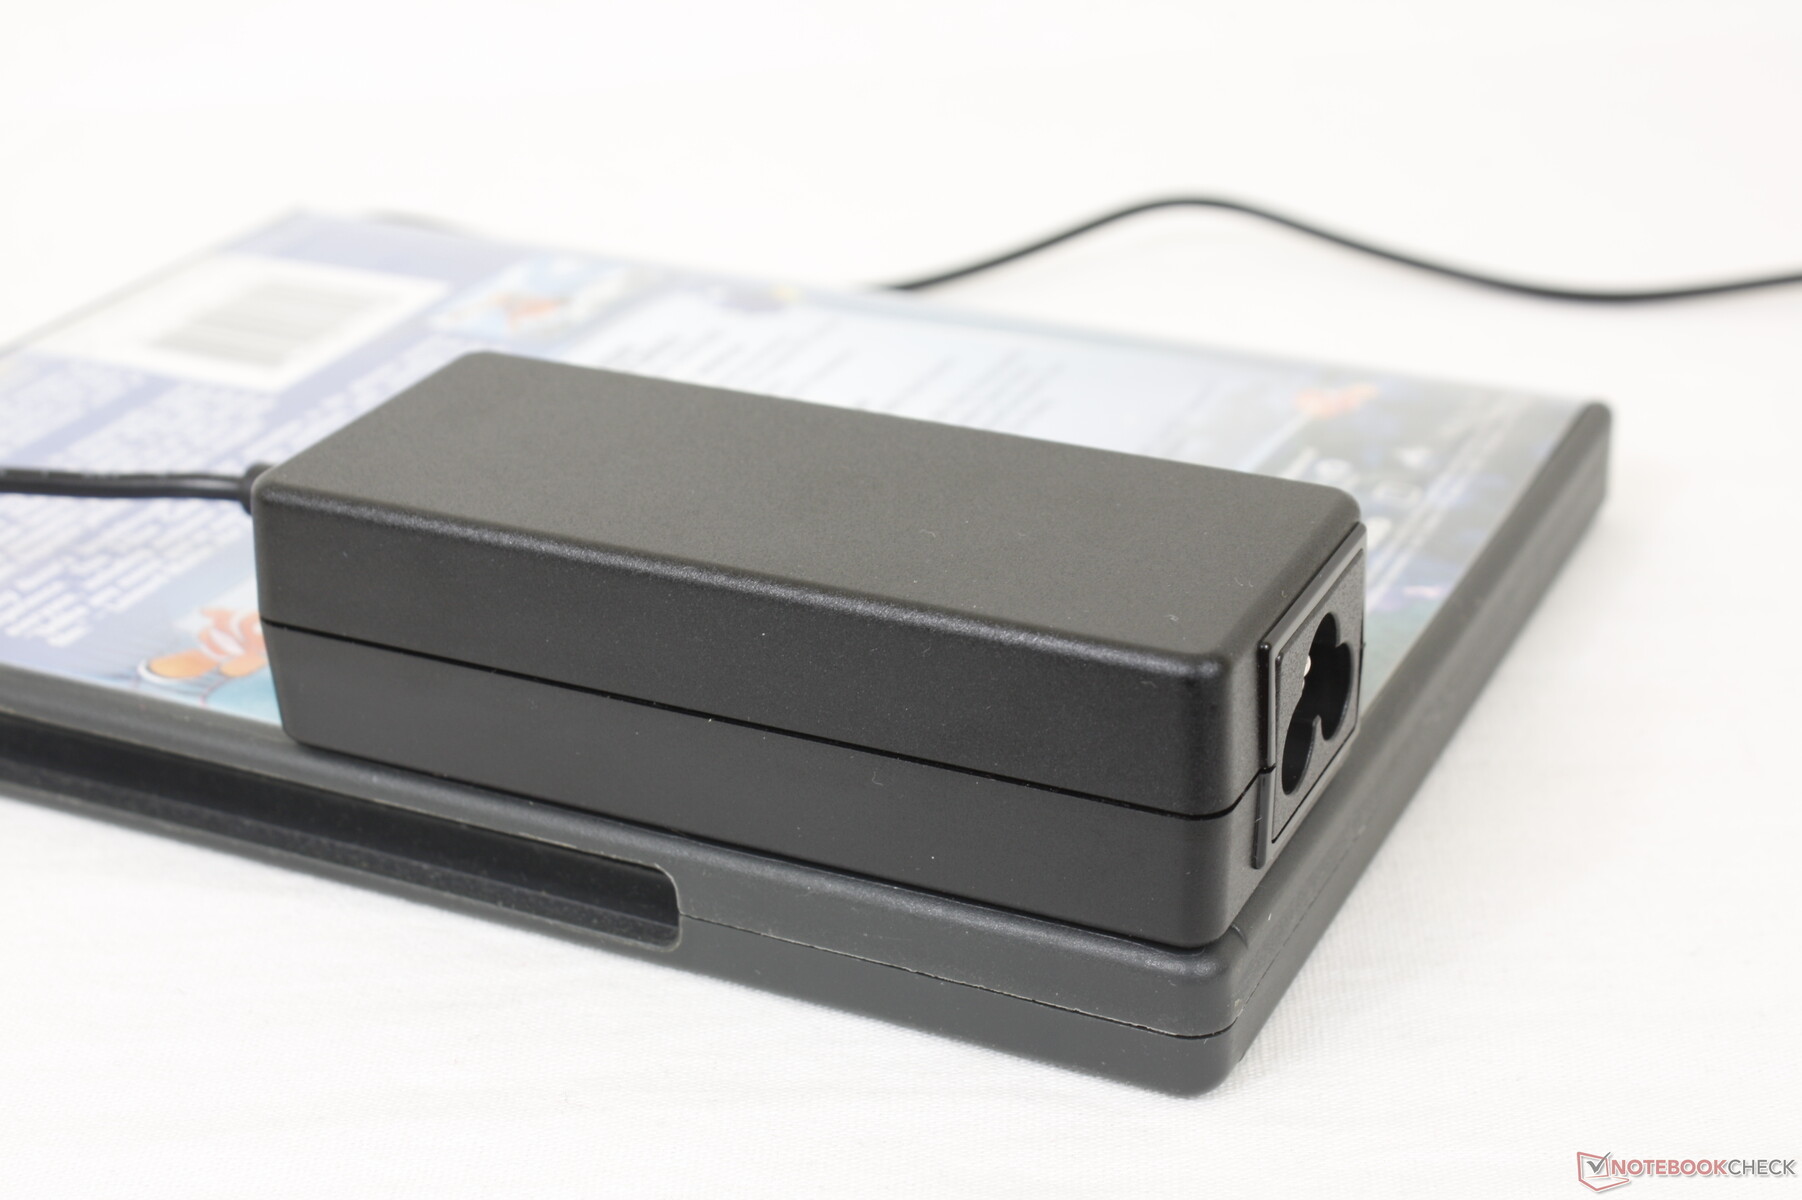
Consumo di energia
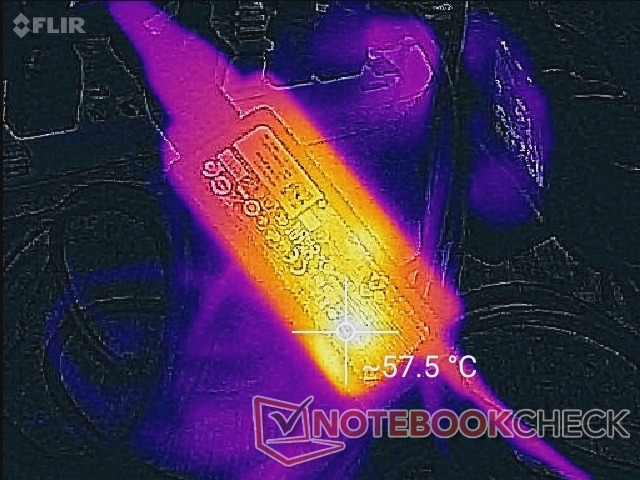
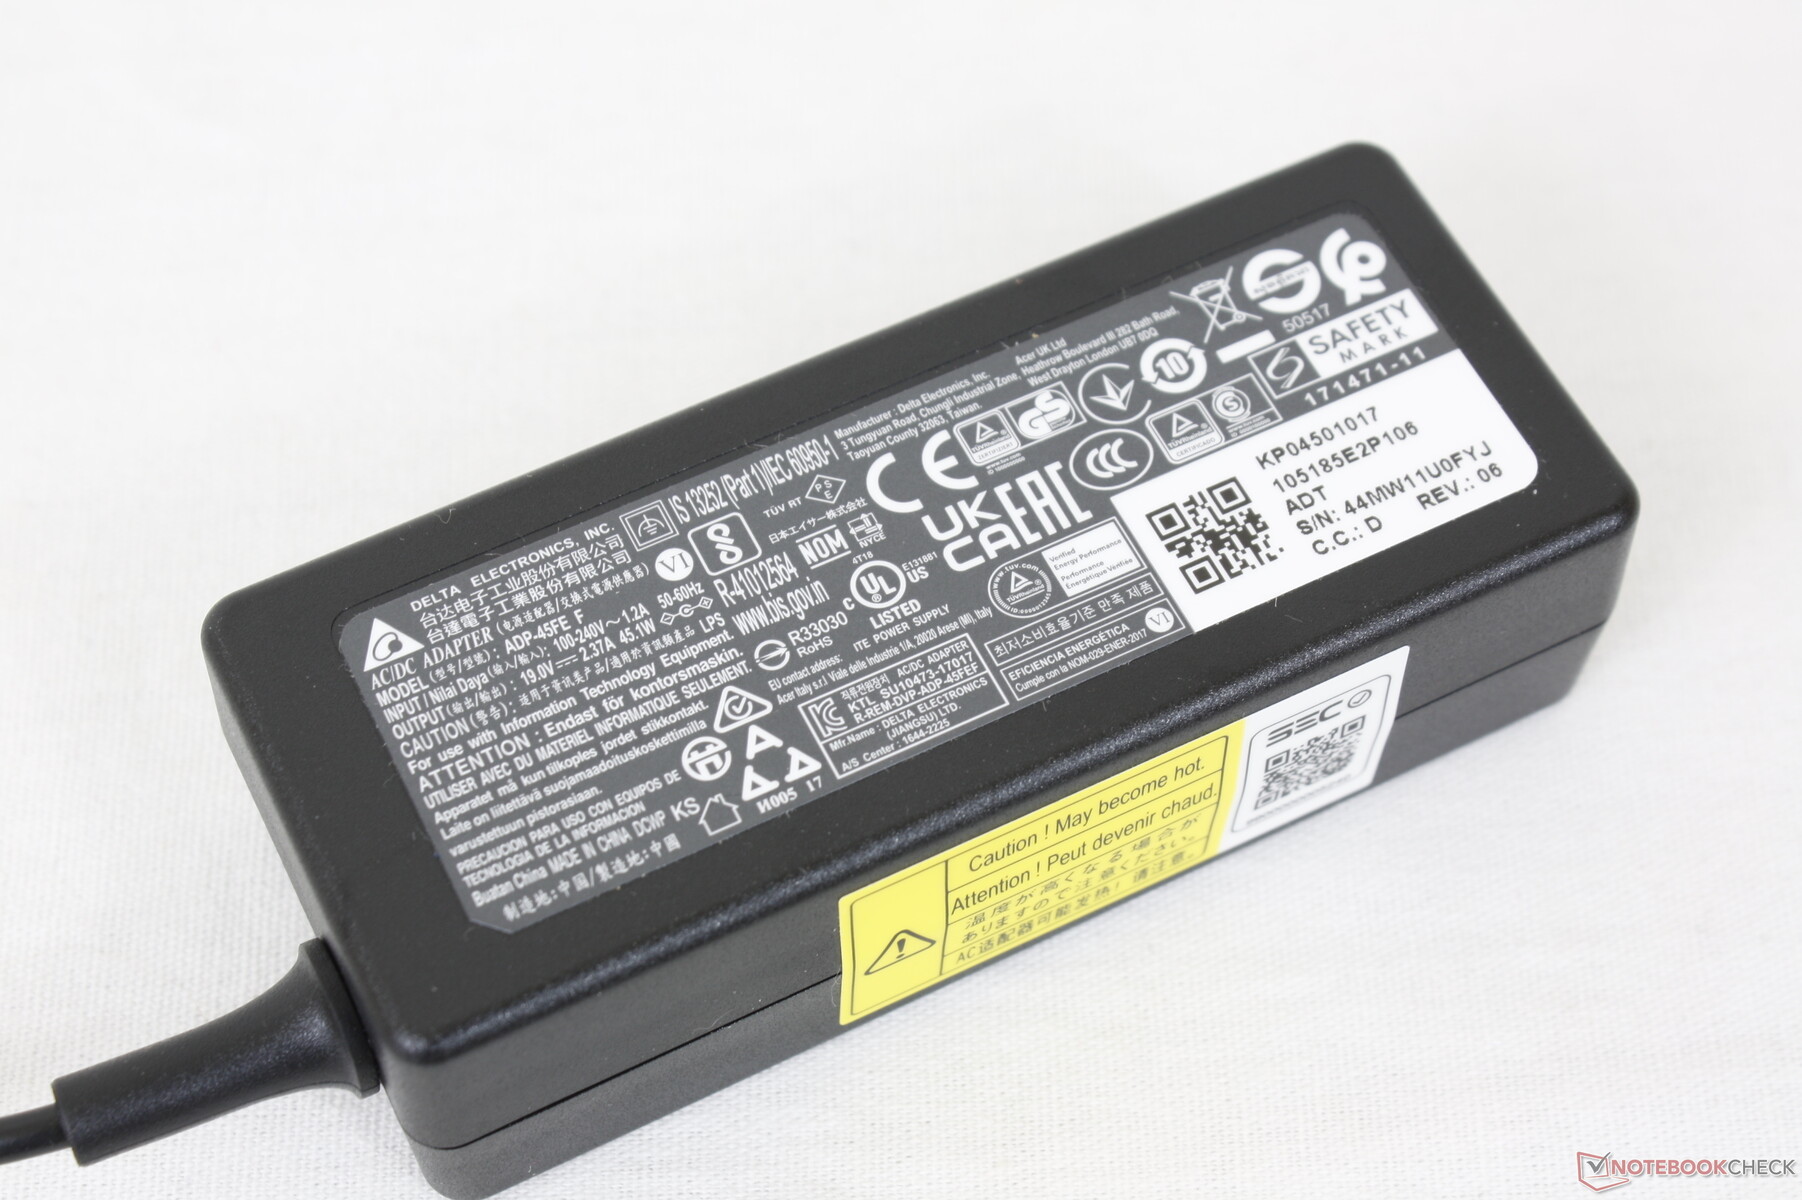
L'Acer è più efficiente del Durabook S14I con lo stesso processore Core i7, probabilmente perché il display del Durabook è oltre 2 volte più luminoso di quello dell'Acer. Siamo in grado di registrare un consumo massimo di 45.4 W dal piccolo (~9.3 x 3.8 x 2.7 cm) adattatore AC da 45 W quando si utilizzano carichi estremi. Il tasso di ricarica dell'Acer rallenterà quindi in modo significativo se il processore viene stressato.
| Off / Standby | |
| Idle | |
| Sotto carico |
|
Leggenda:
min: | |
| Acer Enduro Urban N3 EUN314 i7-1165G7, Iris Xe G7 96EUs, Samsung PM991 MZVLQ1T0HALB, IPS, 1920x1080, 14" | Dell Latitude 5420 Rugged-P85G i7-8650U, Radeon RX 540, SK hynix PC401 NVMe 500 GB, IPS, 1920x1080, 14" | Panasonic Toughbook FZ-55 MK2 i7-1185G7, Iris Xe G7 96EUs, Toshiba KIOXIA KBG4AZNV512G M.2 2280 OPAL, IPS, 1920x1080, 14" | Durabook S14I i7-1165G7, Iris Xe G7 96EUs, UDinfo M2P M2P80DE512GBAEP, TN, 1920x1080, 14" | Getac S410 i5-8550U, UHD Graphics 620, CUKUSA 1 TB SATA SSD Q0526A, TN PED, 1366x768, 14" | |
|---|---|---|---|---|---|
| Power Consumption | -75% | -36% | -70% | -3% | |
| Idle Minimum * (Watt) | 3.8 | 4.8 -26% | 3.5 8% | 6.8 -79% | 5.6 -47% |
| Idle Average * (Watt) | 8 | 13.6 -70% | 10.4 -30% | 16.4 -105% | 7.9 1% |
| Idle Maximum * (Watt) | 8.7 | 13.8 -59% | 10.5 -21% | 16.9 -94% | 8.4 3% |
| Load Average * (Watt) | 34.6 | 67.8 -96% | 45.4 -31% | 39.2 -13% | 32.8 5% |
| Witcher 3 ultra * (Watt) | 35.4 | 69.1 -95% | 43 -21% | ||
| Load Maximum * (Watt) | 45.4 | 93.5 -106% | 99.3 -119% | 73.1 -61% | 34.3 24% |
* ... Meglio usare valori piccoli
Power Consumption Witcher 3 / Stresstest
Power Consumption external Monitor
Durata della batteria
Siamo in grado di registrare un'autonomia WLAN reale di quasi 6,5 ore con una carica completa e con una luminosità del display di 150 nit. Caricare il sistema da pieno a vuoto richiede circa 100 minuti. Gli utenti possono anche caricare il sistema con adattatori generici USB-C AC.
| Acer Enduro Urban N3 EUN314 i7-1165G7, Iris Xe G7 96EUs, 50.3 Wh | Dell Latitude 5420 Rugged-P85G i7-8650U, Radeon RX 540, 102 Wh | Panasonic Toughbook FZ-55 MK2 i7-1185G7, Iris Xe G7 96EUs, 71 Wh | Durabook S14I i7-1165G7, Iris Xe G7 96EUs, 50 Wh | Getac S410 i5-8550U, UHD Graphics 620, 46.6 Wh | |
|---|---|---|---|---|---|
| Autonomia della batteria | 153% | 113% | -14% | -19% | |
| WiFi v1.3 (h) | 6.4 | 16.2 153% | 13.6 113% | 5.5 -14% | 5.2 -19% |
| Reader / Idle (h) | 31.4 | ||||
| Load (h) | 3.2 |
Pro
Contro
Verdetto
L'Enduro Urban N3 è un portatile da 14 pollici che sembra un portatile da 15,6 pollici. La circonferenza e lo spessore extra rispetto ai tradizionali portatili da 14 pollici incentrati sul consumatore come l'Asus VivoBook o Acer Swift 5 SF514 rendono l'Urban N3 più resistente agli elementi senza costare tanto quanto i "veri" portatili rugged o semi-rugged come il Durabook S14I o Panasonic Toughbook. se ti ritrovi a usare il tuo portatile sul campo o su mucchi di rocce più spesso di una scrivania ben organizzata, allora l'Urban N3 potrebbe essere per te.
L'Enduro Urban N3 è un portatile rugged economico che non lesina sulle prestazioni del processore o sulla qualità del display. Alcuni aspetti come la durata della batteria, il volume e la modulazione di larghezza d'impulso per il controllo della luminosità avrebbero potuto essere migliori.
Le prestazioni e il display sono notevoli punti di forza dell'Acer. Tuttavia, gli utenti dovranno calibrare il pannello da soli per sfruttare appieno i suoi colori relativamente profondi
Molti aspetti possono ancora essere migliorati. Il volume degli altoparlanti, per esempio, è sul lato basso mentre le cerniere potrebbero essere più rigide ad angoli più ampi per evitare che il coperchio cada all'indietro. Il PWM è deludente da vedere e la durata della batteria avrebbe potuto essere migliore con sole 6,5 ore. C'è un volume inutilizzato all'interno dello chassis che avrebbe potuto essere utilizzato per migliorare le caratteristiche del sistema. Un'opzione opaca sarebbe stata apprezzata anche per ridurre i riflessi.
Prezzo e disponibilità
Acer Enduro Urban N3 EUN314
- 12/03/2021 v7 (old)
Allen Ngo
Price comparison

