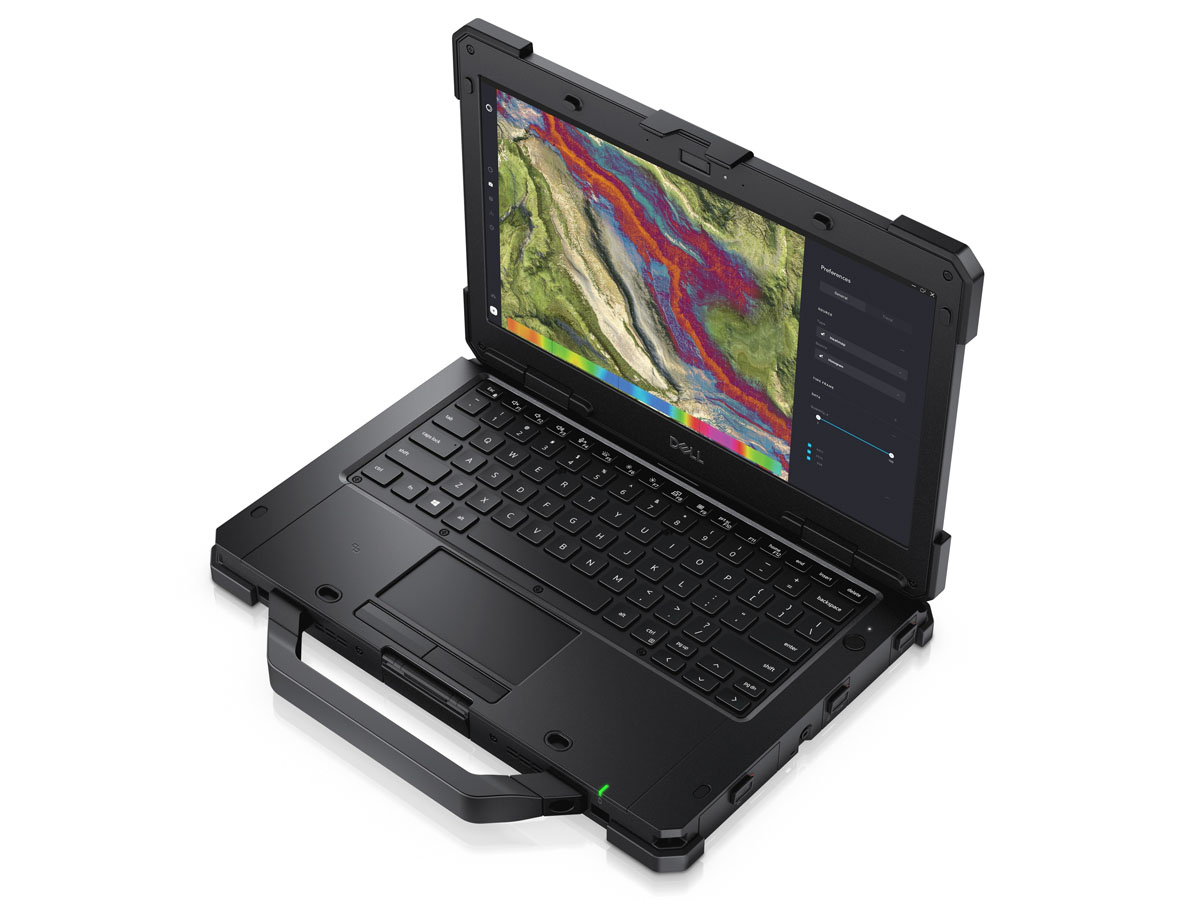
Recensione del Dell Latitude 7330 Rugged Extreme: Uno dei migliori portatili rugged da 13"
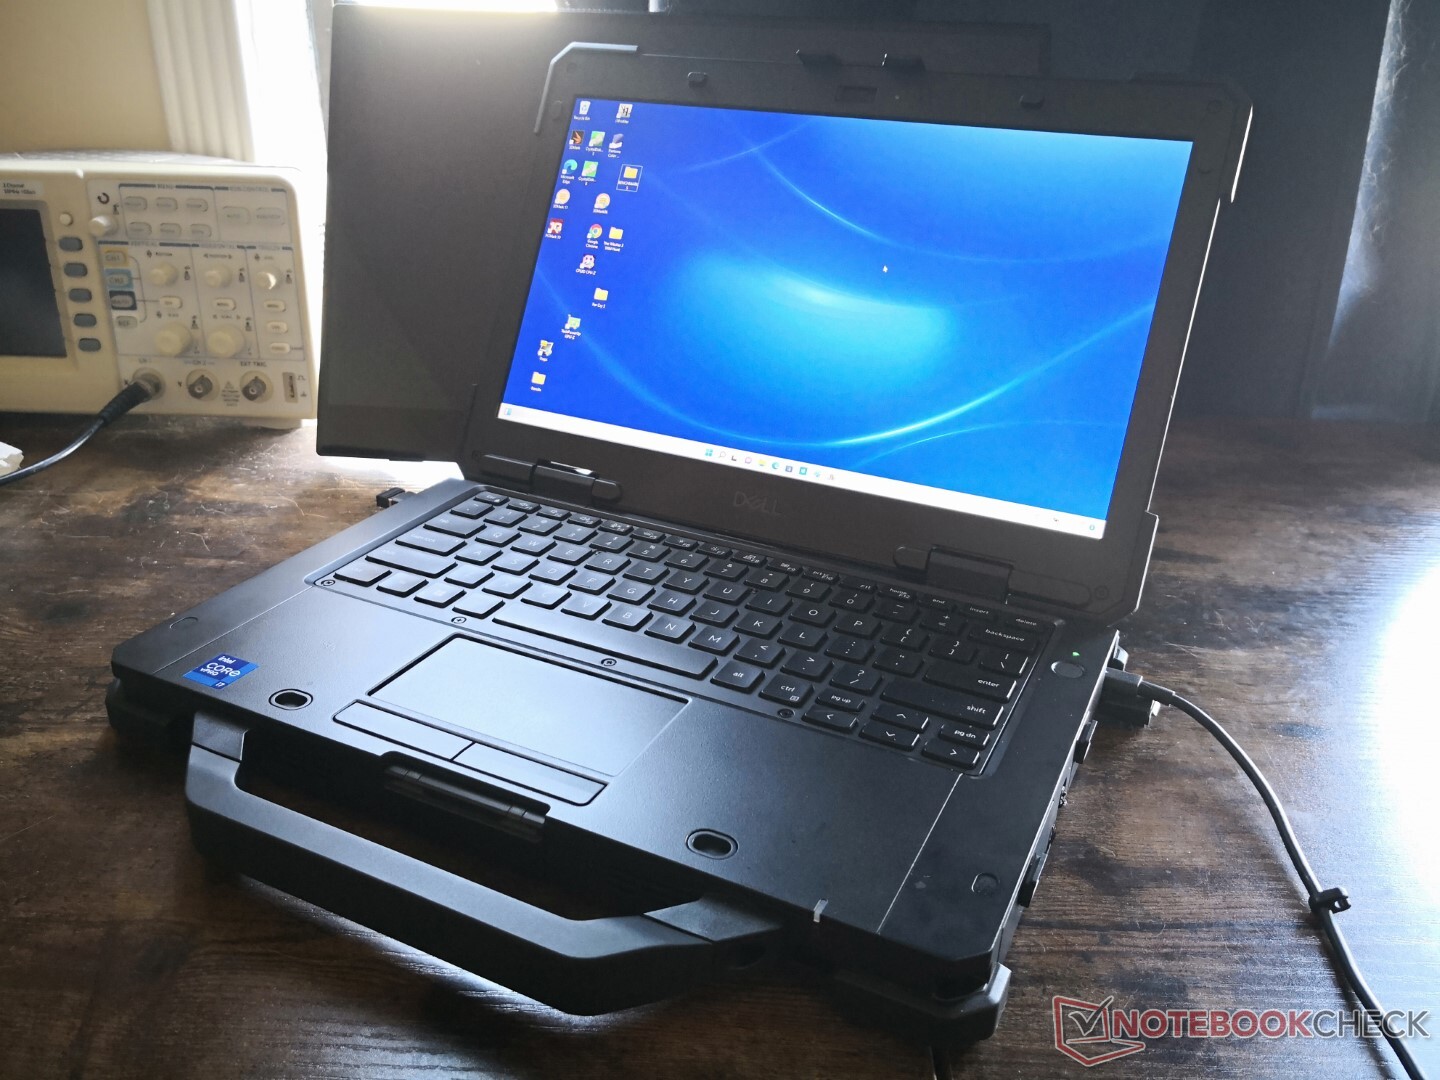
Il Latitude 7330 Rugged Extreme è uno dei pochissimi - se non l'unico - computer portatili rugged a conchiglia da 13.3 pollici di Dell. Prende in prestito pesantemente dai modelli rugged esistenti da 14 e 15 pollici Latitude ma per un fattore di forma più piccolo e compatto da 13 pollici.
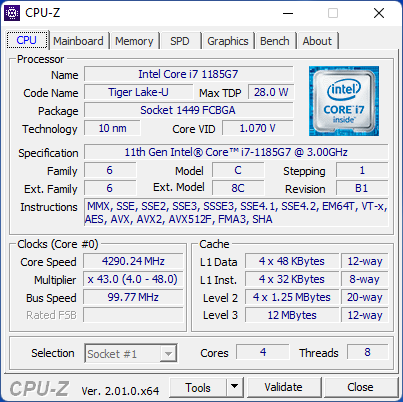
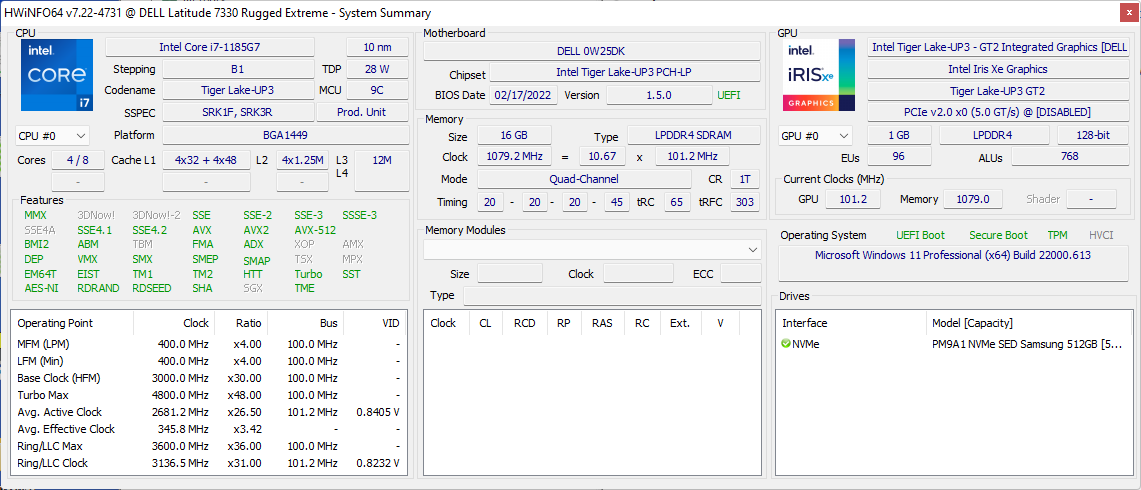
Come con la maggior parte degli altri portatili rugged, il Latitude 7330 Rugged Extreme è disponibile in una varietà molto ampia di configurazioni come dettagliato dalla pagina del prodotto qui. La nostra unità specifica è dotata di CPU Core i7-1185G7 vPro, 16 GB di RAM LPDDR4x-4266 e 512 GB di SSD Samsung PM9A1 NVMe al dettaglio per circa 5300 dollari. Tutte le SKU sono dotate di CPU Intel U-series di 11a generazione e dello stesso pannello IPS da 1400 nit 1080p al momento.
I concorrenti diretti includono altri portatili rugged da 13.3 pollici come il Getac B360 o alternative da 14 pollici come ilDurabook S14I oPanasonic Toughbook FZ-55 MK2.
Altre recensioni su Dell:
Potenziali concorrenti a confronto
Punteggio | Data | Modello | Peso | Altezza | Dimensione | Risoluzione | Prezzo |
|---|---|---|---|---|---|---|---|
v (old) | 05/2022 | Dell Latitude 7330 Rugged Extreme i7-1185G7, Iris Xe G7 96EUs | 2.7 kg | 36.5 mm | 13.30" | 1920x1080 | |
| 84.3 % v6 (old) | 04/2019 | Dell Latitude 7424 Rugged Extreme i7-8650U, Radeon RX 540 | 3.5 kg | 59.3 mm | 14.00" | 1920x1080 | |
| 89.2 % v6 (old) | 03/2019 | Dell Latitude 5420 Rugged-P85G i7-8650U, Radeon RX 540 | 2.8 kg | 32.9 mm | 14.00" | 1920x1080 | |
| 82.4 % v7 (old) | 12/2021 | Acer Enduro Urban N3 EUN314 i7-1165G7, Iris Xe G7 96EUs | 1.8 kg | 21.95 mm | 14.00" | 1920x1080 | |
| 83.9 % v7 (old) | 09/2021 | Panasonic Toughbook FZ-55 MK2 i7-1185G7, Iris Xe G7 96EUs | 2.3 kg | 33 mm | 14.00" | 1920x1080 | |
v (old) | 04/2021 | Durabook S14I i7-1165G7, Iris Xe G7 96EUs | 3 kg | 38.1 mm | 14.00" | 1920x1080 |
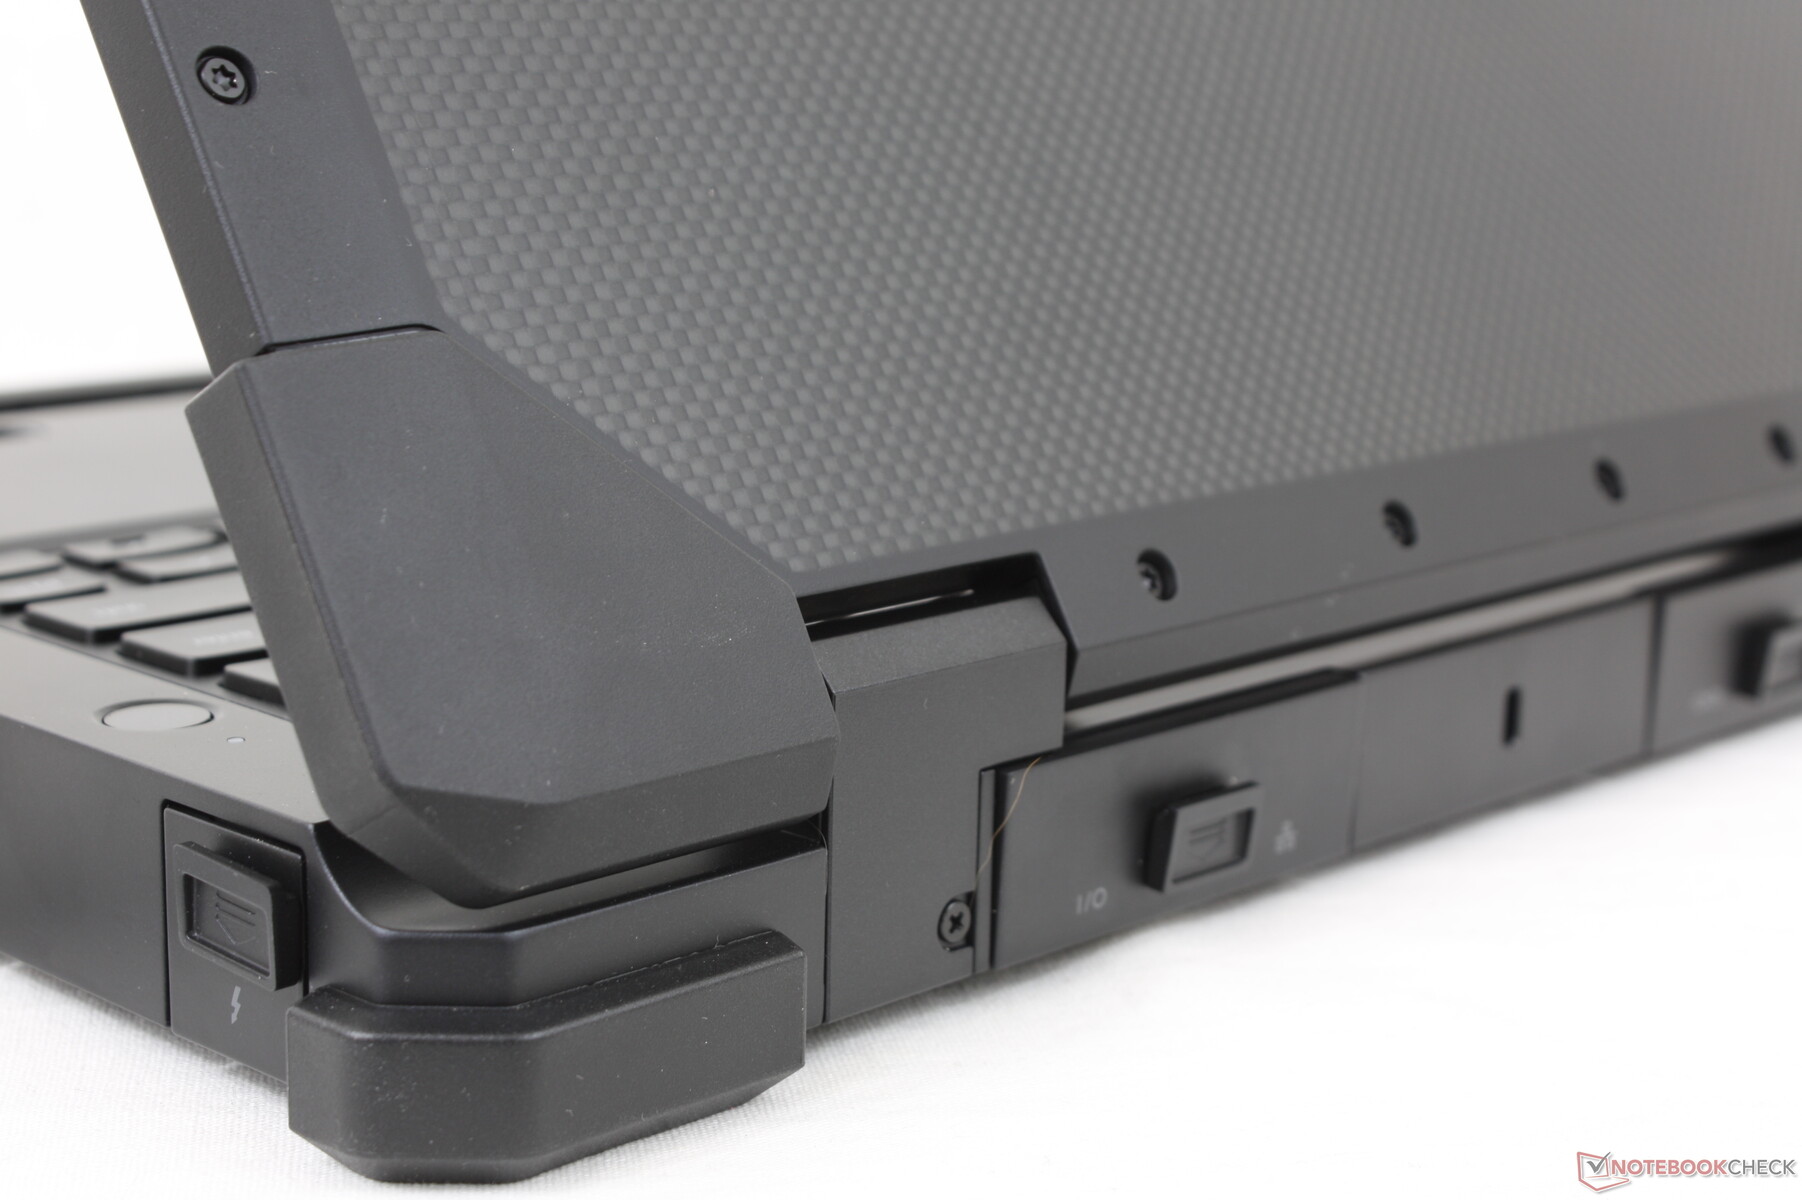
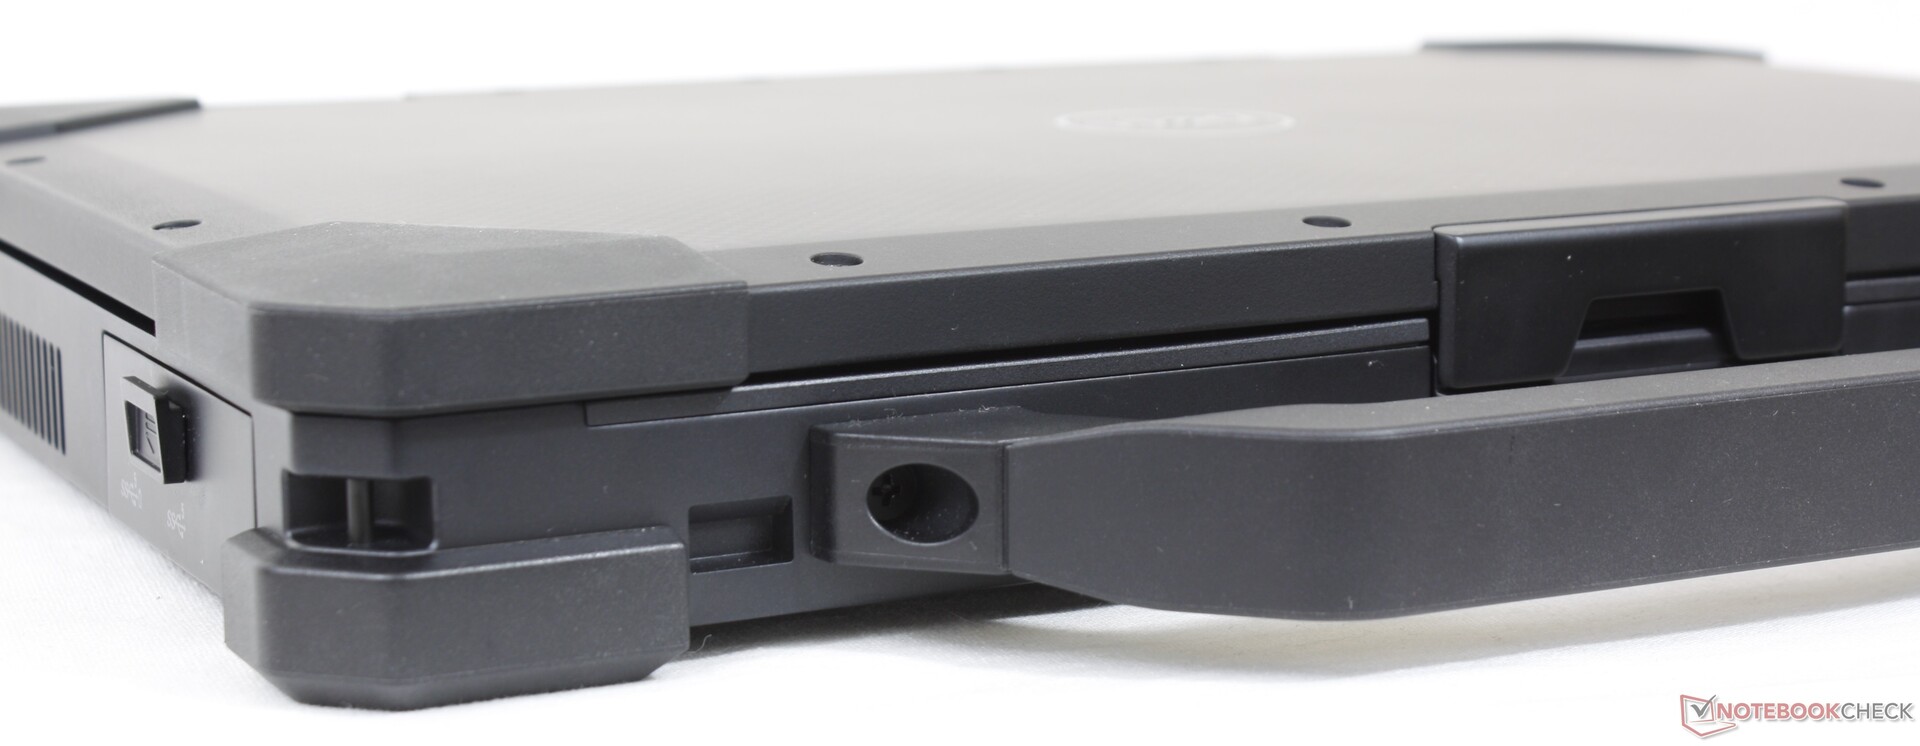
Caso
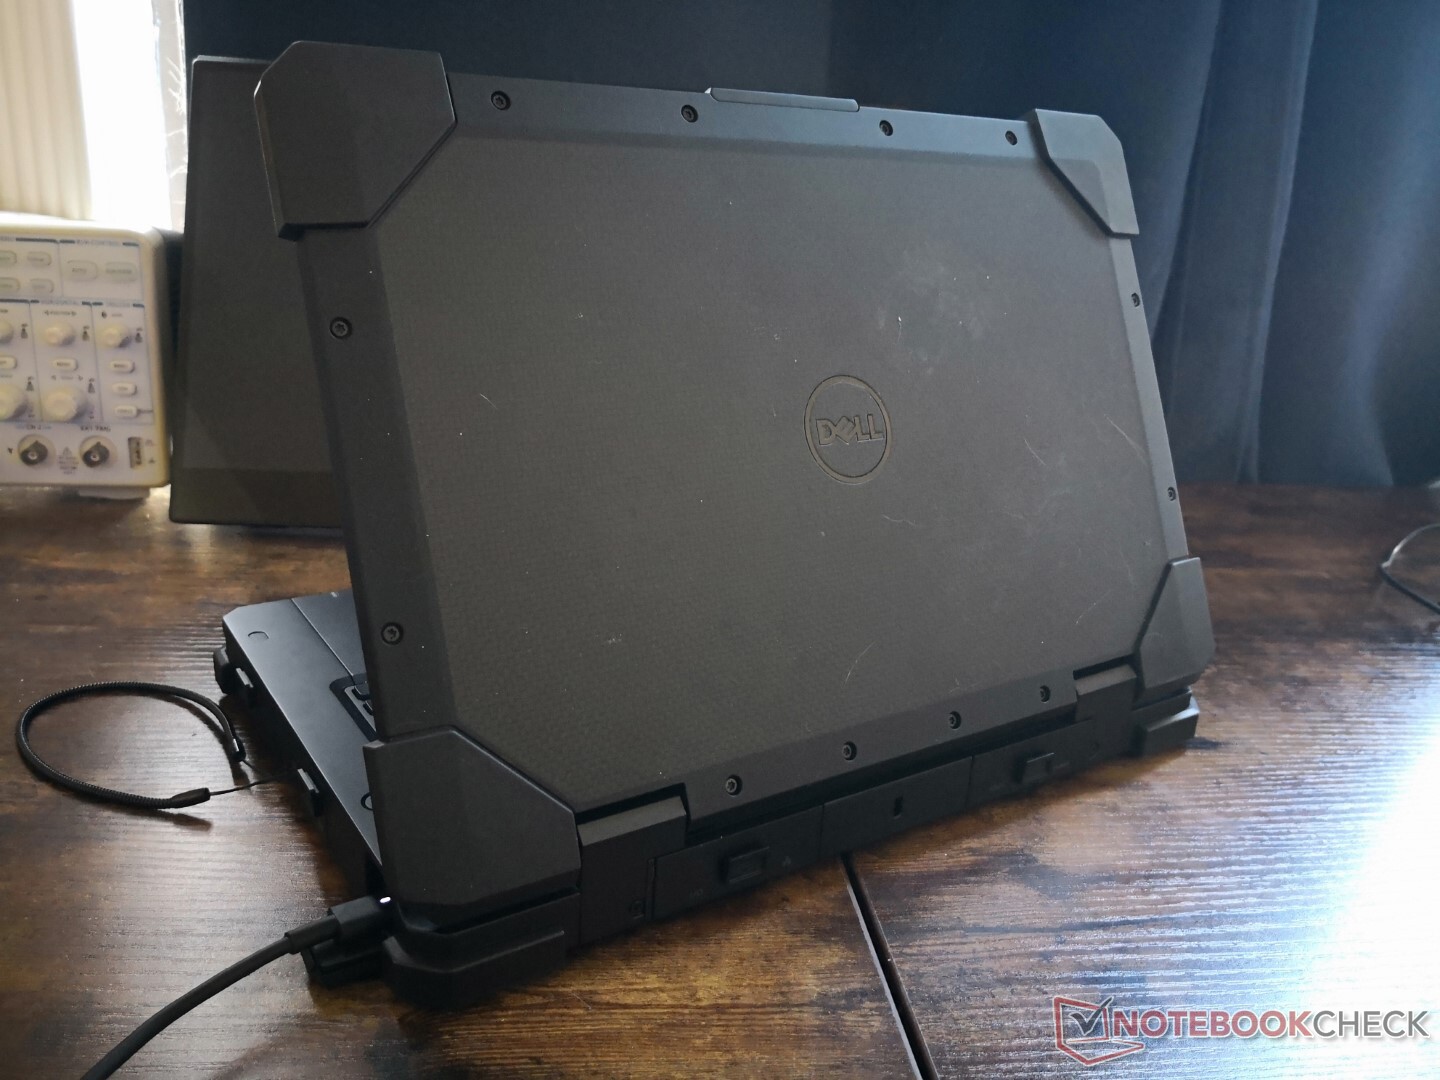
In termini di dimensioni e peso, il modello Dell è notevolmente più piccolo del Getac B360 da 14 pollici o del Panasonic Toughbook FZ-55 MK2 e tuttavia è più pesante di entrambi i modelli. La densità pura del Latitude 7330 Rugged Extreme non dovrebbe essere sottovalutata.
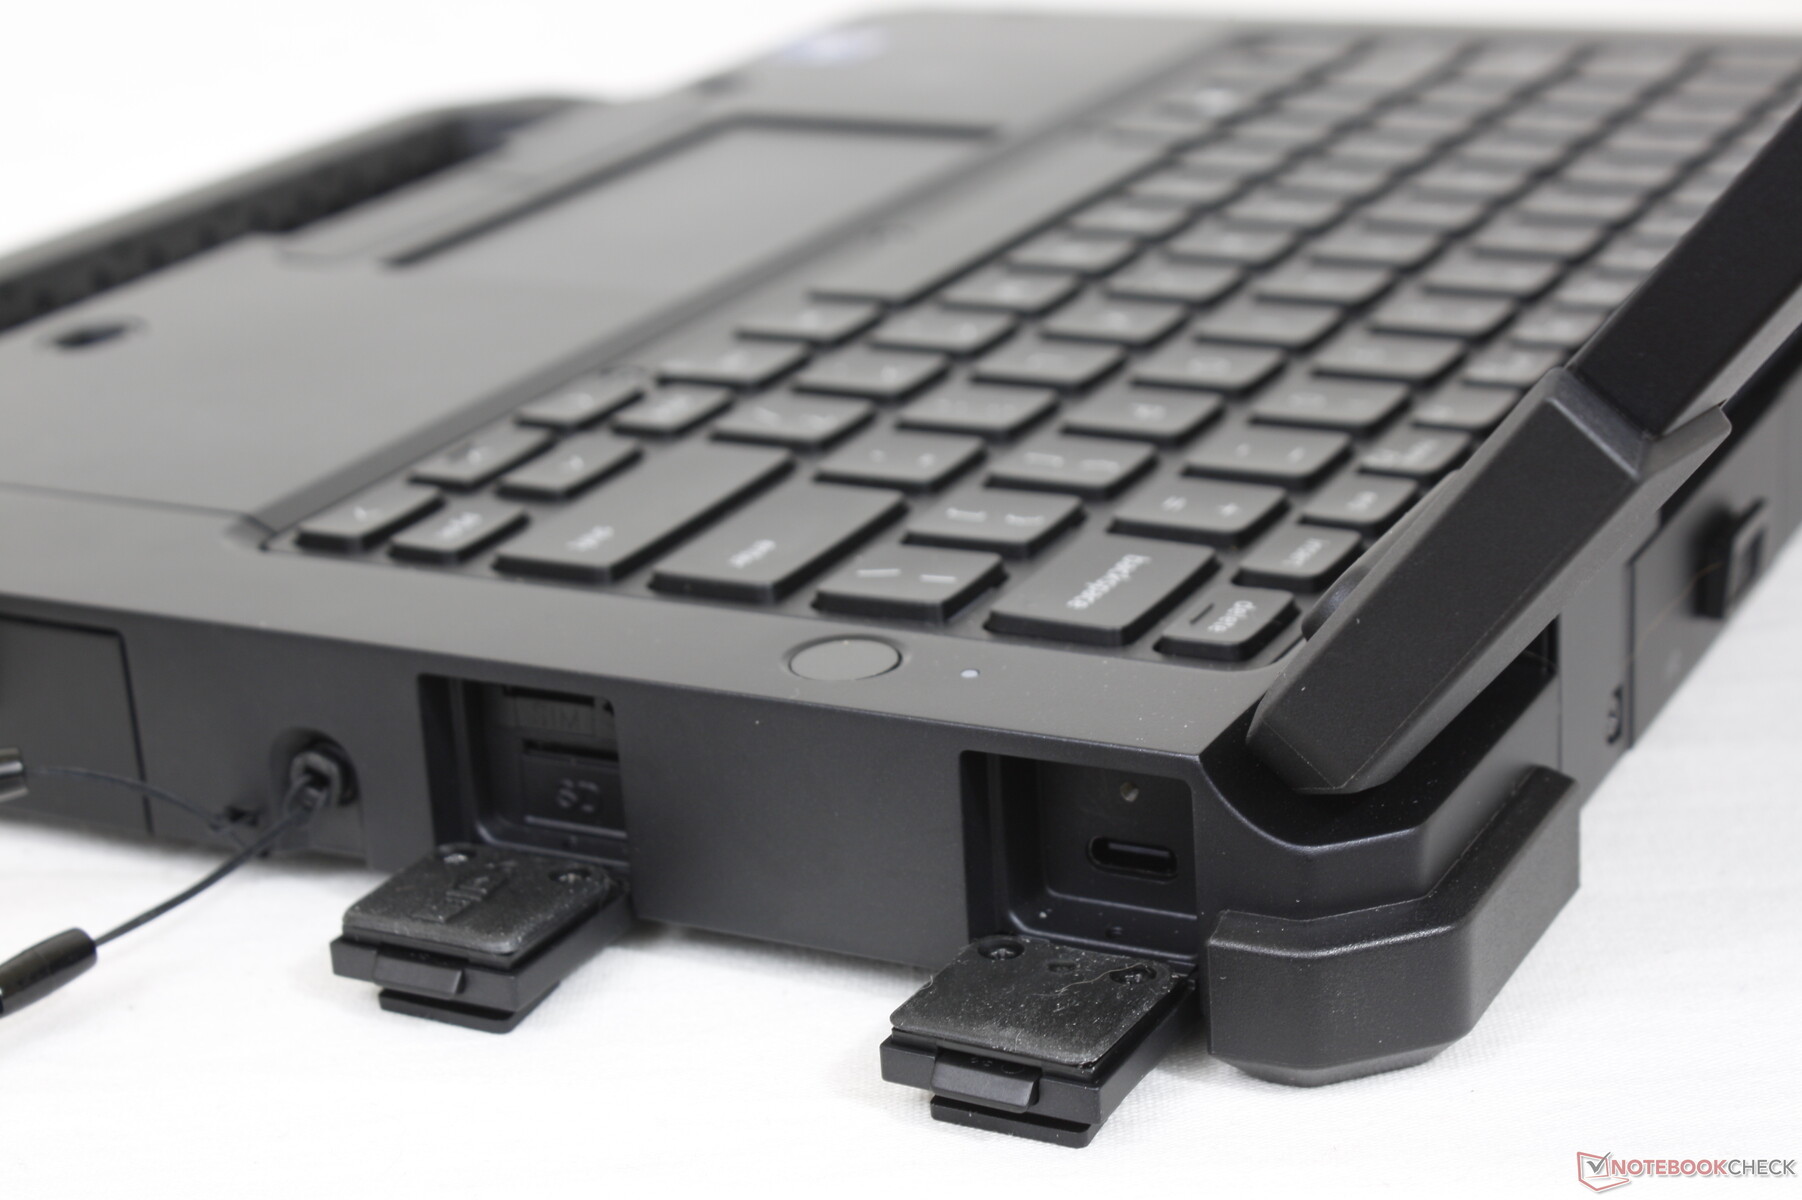
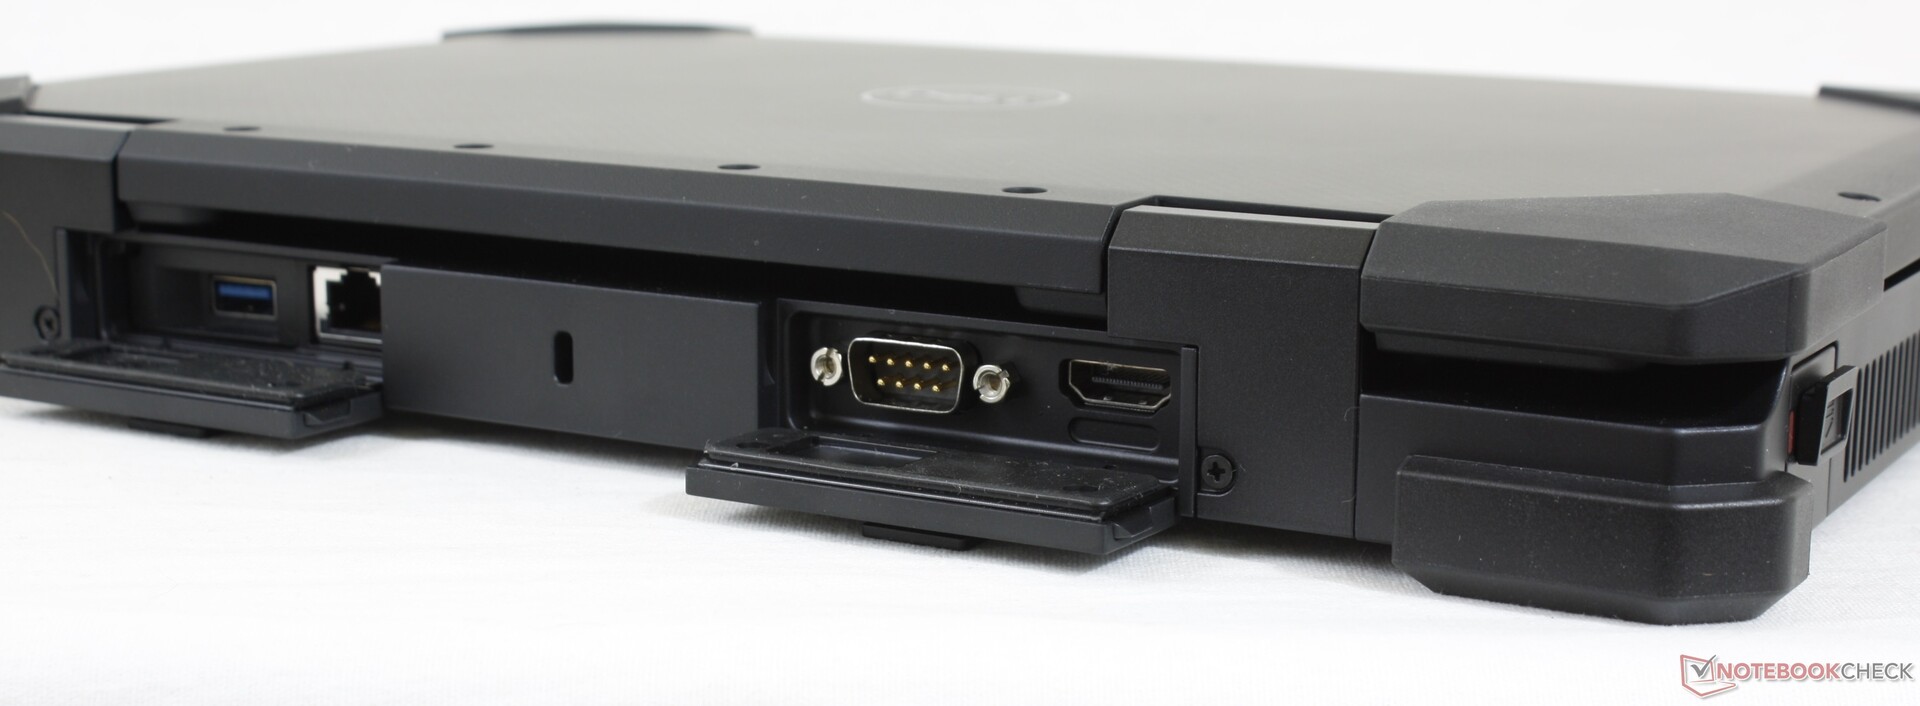
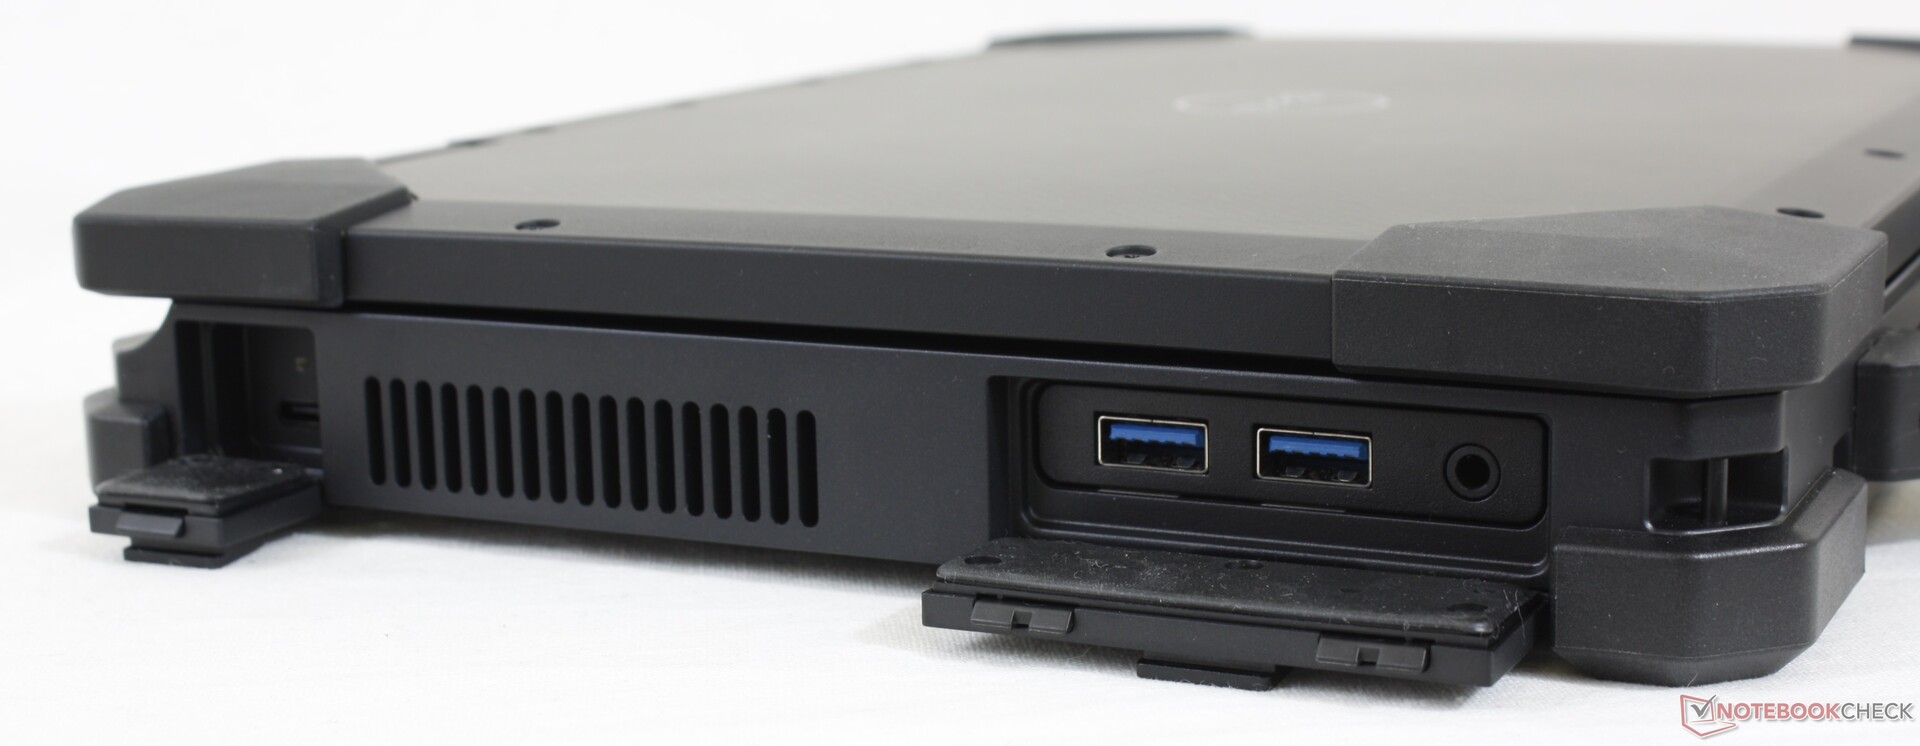
Connettività
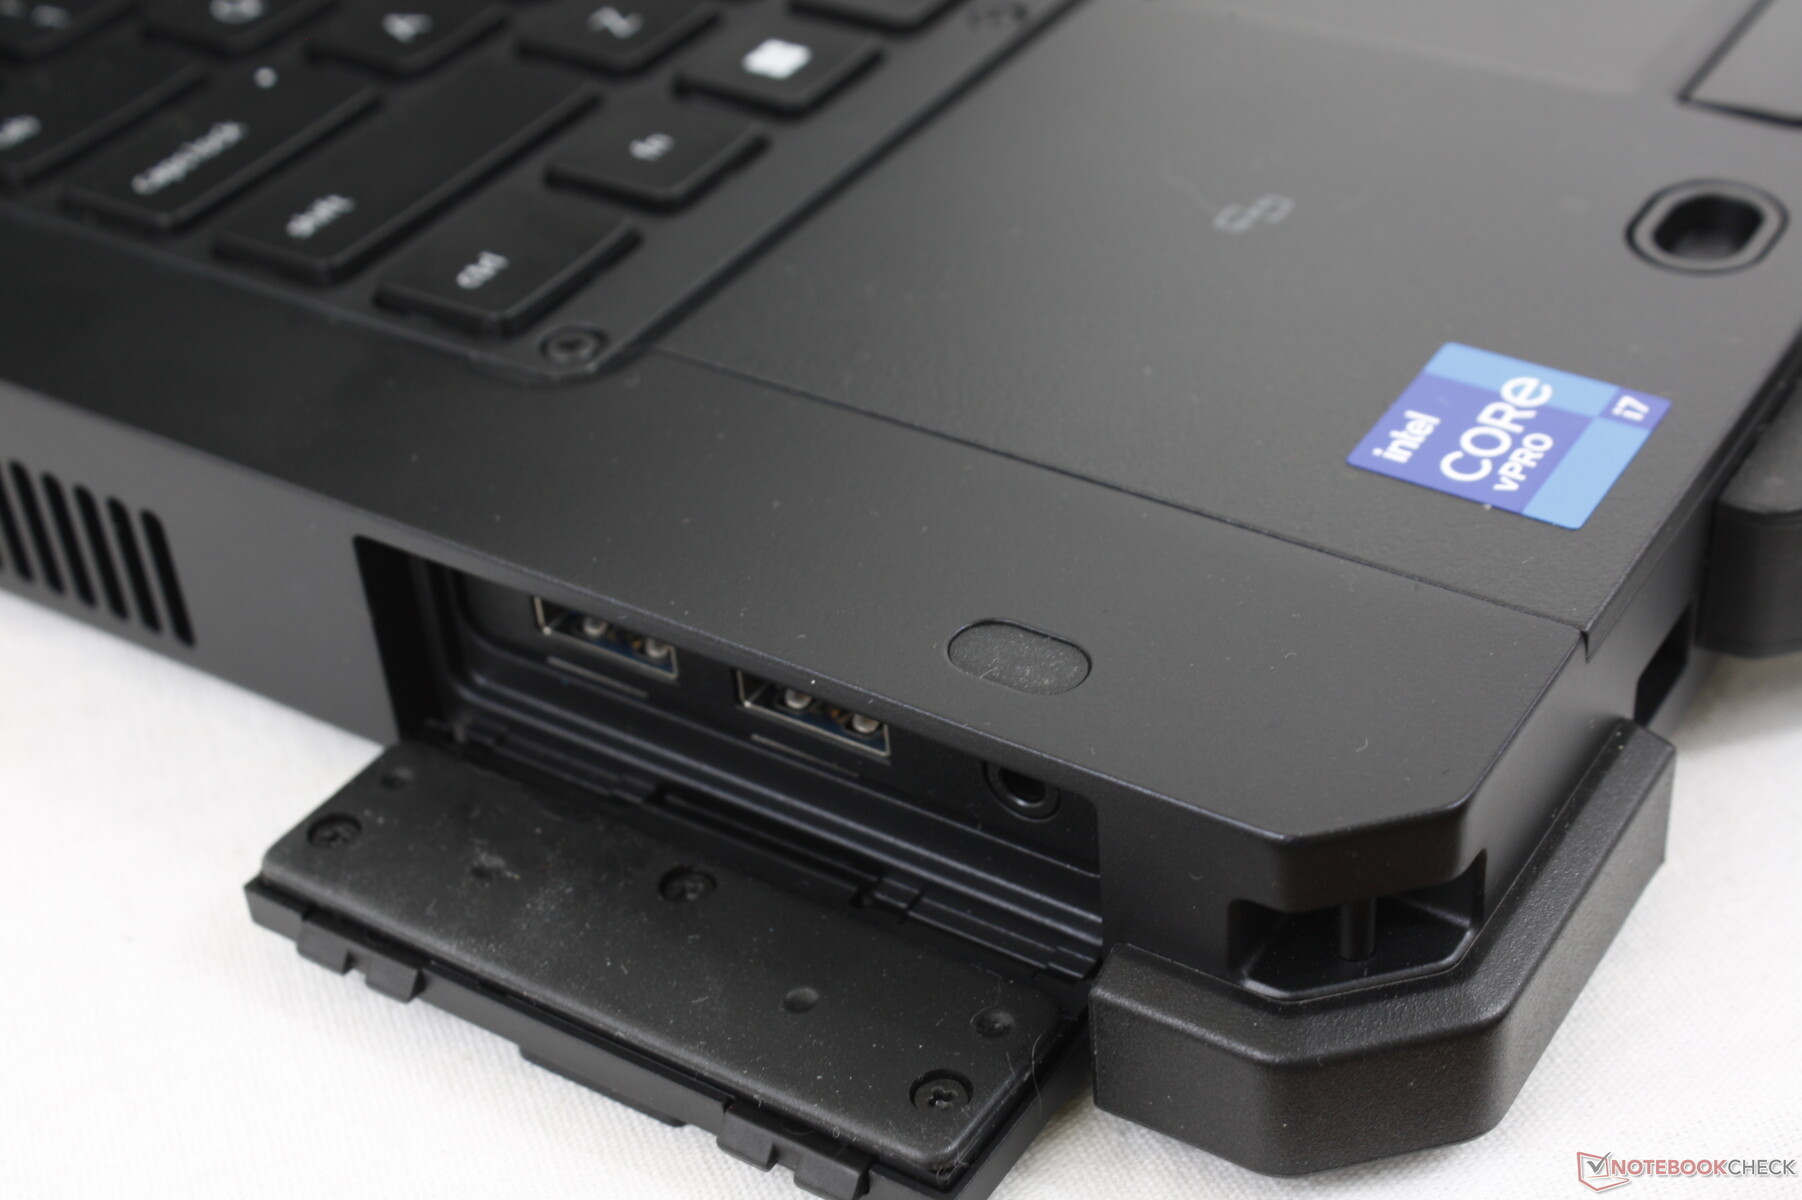
Le opzioni delle porte sono abbondanti, con molte che sono opzionali, inclusi i lettori di Smart Card e Express Card. A differenza del Getac B360, però, non c'è una porta VGA, un lettore DVD o un contenitore di archiviazione.
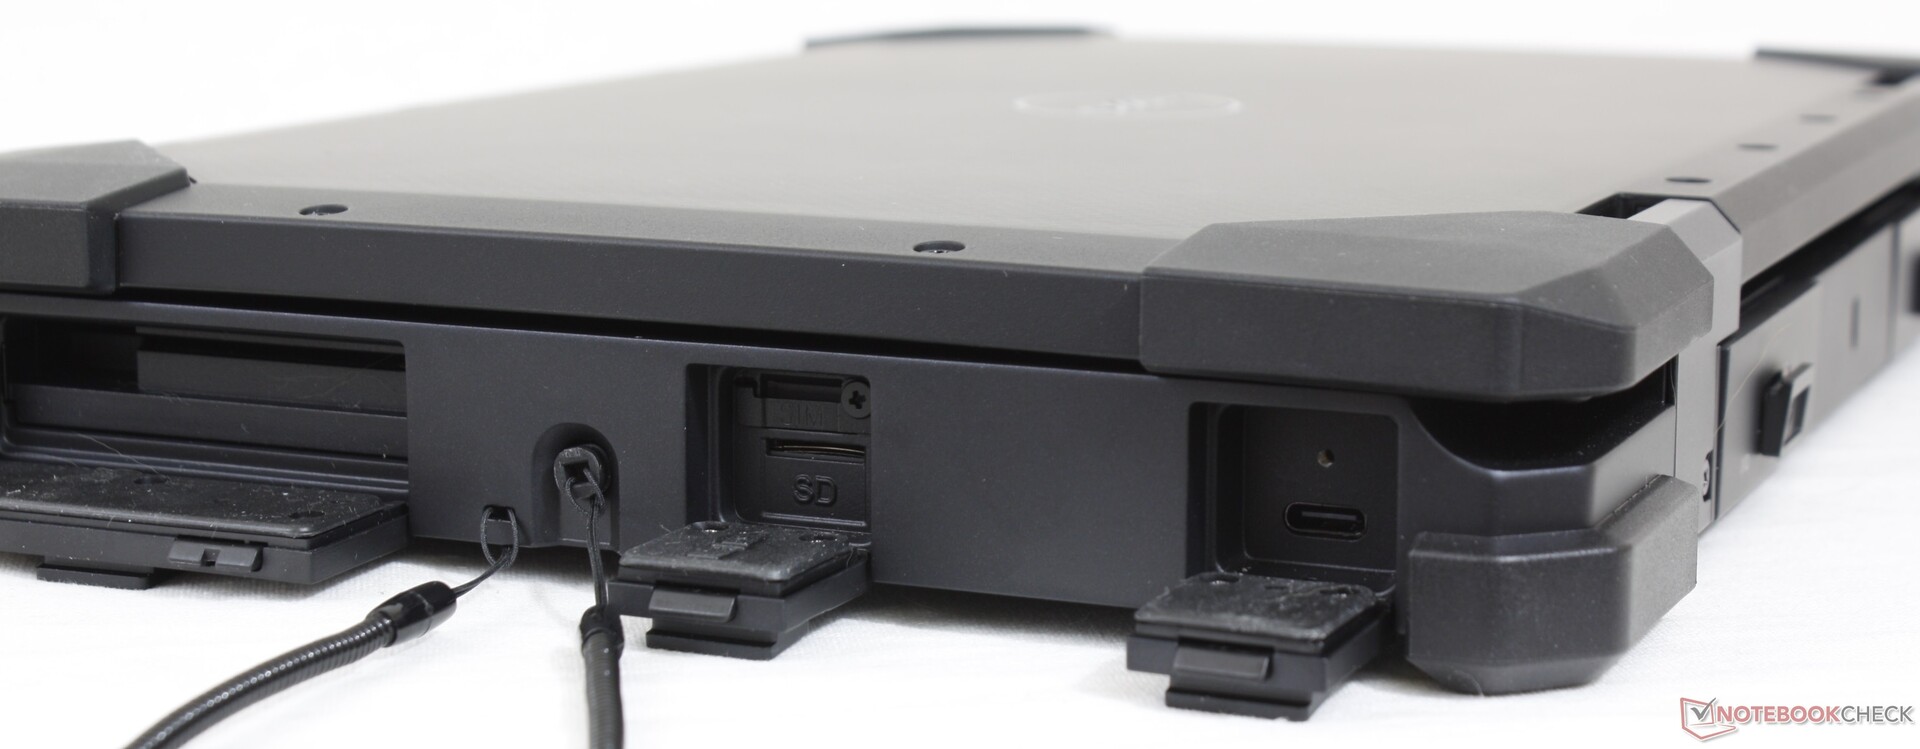
Lettore di schede SD
Le velocità di trasferimento dal lettore MicroSD a molla integrato sono significativamente più veloci che sulla maggior parte degli altri dispositivi rugged. Tieni presente che la scheda MicroSD deve essere inserita nell'unità a testa in giù.
L'accesso al lettore può essere particolarmente difficile per gli utenti con mani grandi poiché è incassato così dietro una spessa copertura lungo il bordo destro.
| SD Card Reader | |
| average JPG Copy Test (av. of 3 runs) | |
| Dell Latitude 5420 Rugged-P85G (Toshiba Exceria Pro SDXC 64 GB UHS-II) | |
| Dell Latitude 7424 Rugged Extreme (Toshiba Exceria Pro SDXC 64 GB UHS-II) | |
| Dell Latitude 7330 Rugged Extreme (AV Pro V60) | |
| Fujitsu LifeBook U7310 (Toshiba Exceria Pro SDXC 64 GB UHS-II) | |
| Lenovo ThinkPad P15s Gen1-20T4000JGE (Toshiba Exceria Pro M501 64 GB UHS-II) | |
| Panasonic Toughbook FZ-55 MK2 (AV Pro V60) | |
| Acer Enduro Urban N3 EUN314 (AV Pro V60) | |
| Durabook S14I (Angelbird 128GB AV Pro UHS-II) | |
| maximum AS SSD Seq Read Test (1GB) | |
| Dell Latitude 5420 Rugged-P85G (Toshiba Exceria Pro SDXC 64 GB UHS-II) | |
| Dell Latitude 7424 Rugged Extreme (Toshiba Exceria Pro SDXC 64 GB UHS-II) | |
| Dell Latitude 7330 Rugged Extreme (AV Pro V60) | |
| Panasonic Toughbook FZ-55 MK2 (AV Pro V60) | |
| Fujitsu LifeBook U7310 (Toshiba Exceria Pro SDXC 64 GB UHS-II) | |
| Lenovo ThinkPad P15s Gen1-20T4000JGE (Toshiba Exceria Pro M501 64 GB UHS-II) | |
| Durabook S14I (Angelbird 128GB AV Pro UHS-II) | |
| Acer Enduro Urban N3 EUN314 (AV Pro V60) | |
Comunicazione
L'Intel AX210 è opzionale per la connettività Wi-Fi 6. Gli utenti possono anche configurare con il Qualcomm SDX55 o Snapdragon X20 per la connettività WAN.
Webcam
Una webcam da 2.1 MP con otturatore manuale per la privacy è standard invece del solito sensore da 1 MP. Anche Windows Hello è supportato.


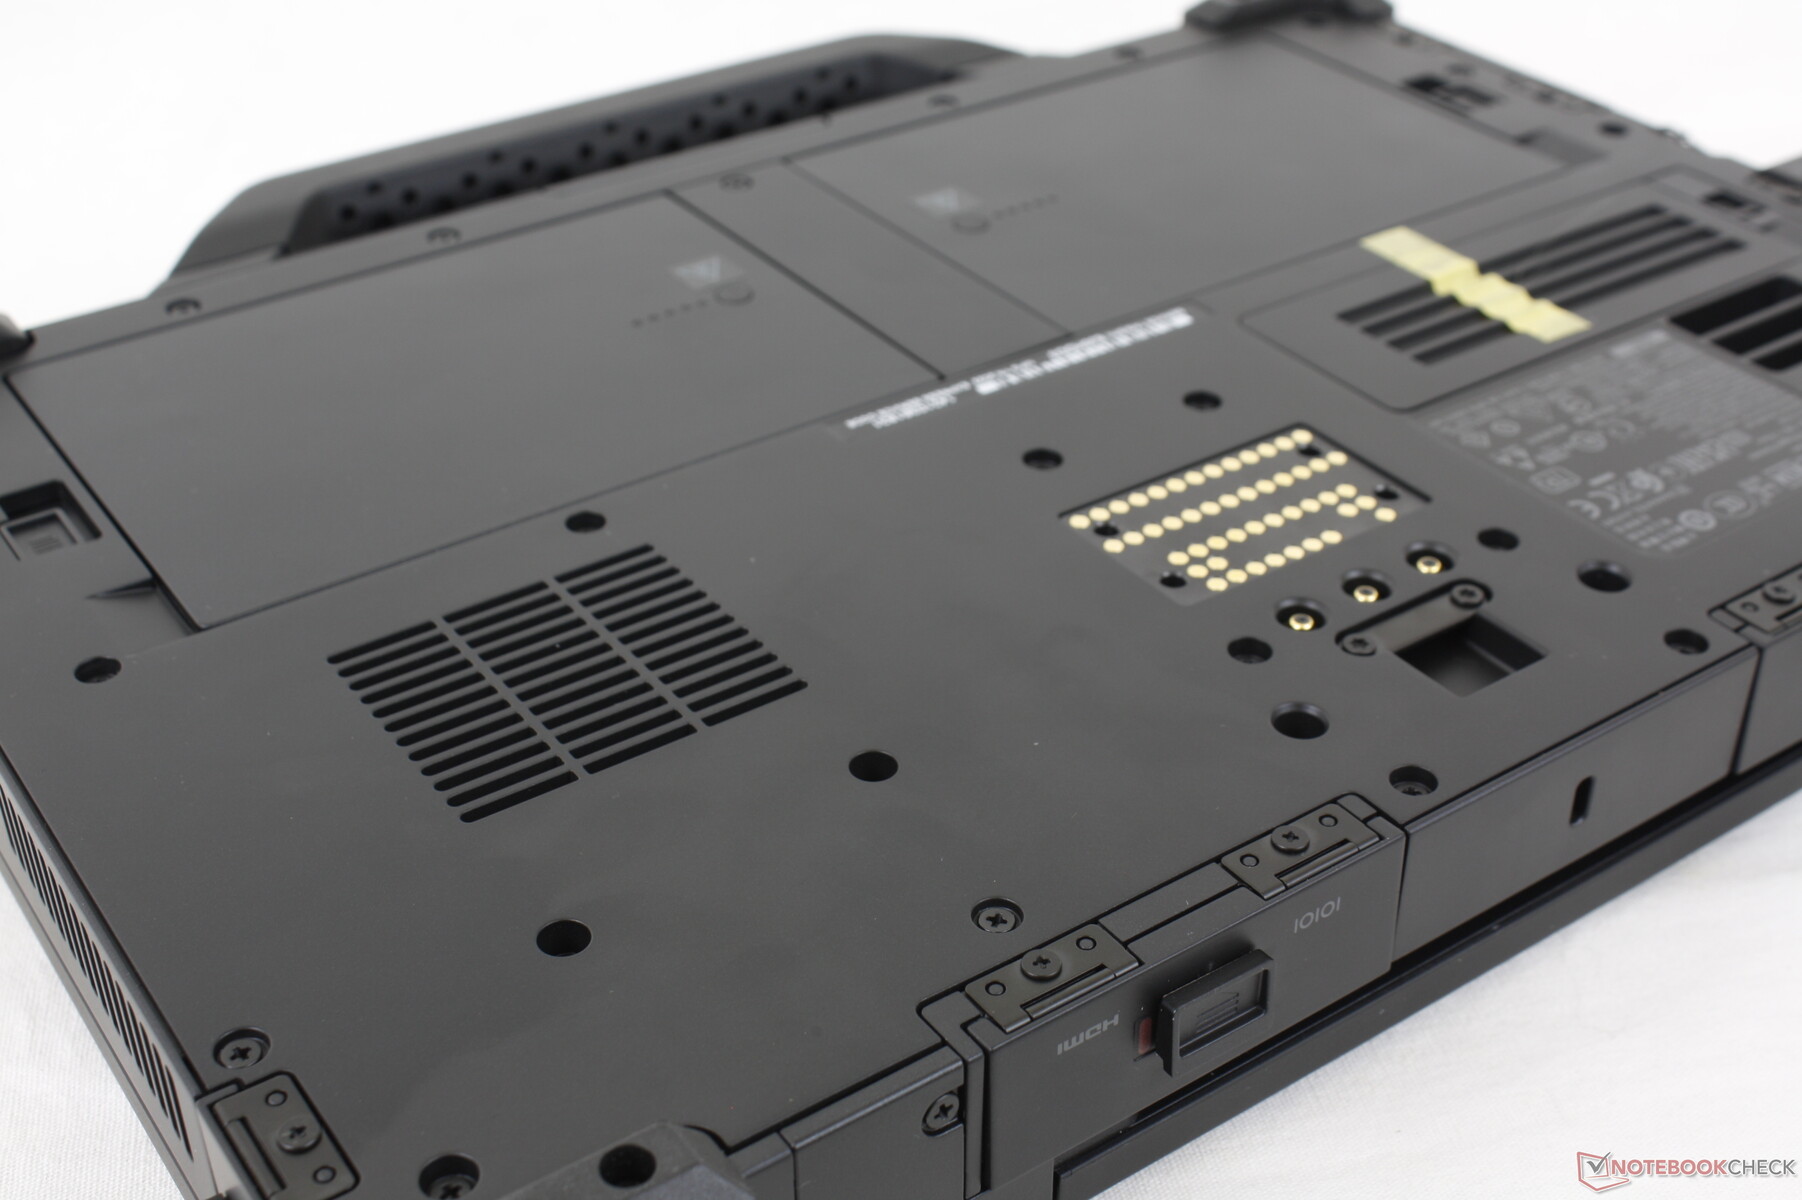
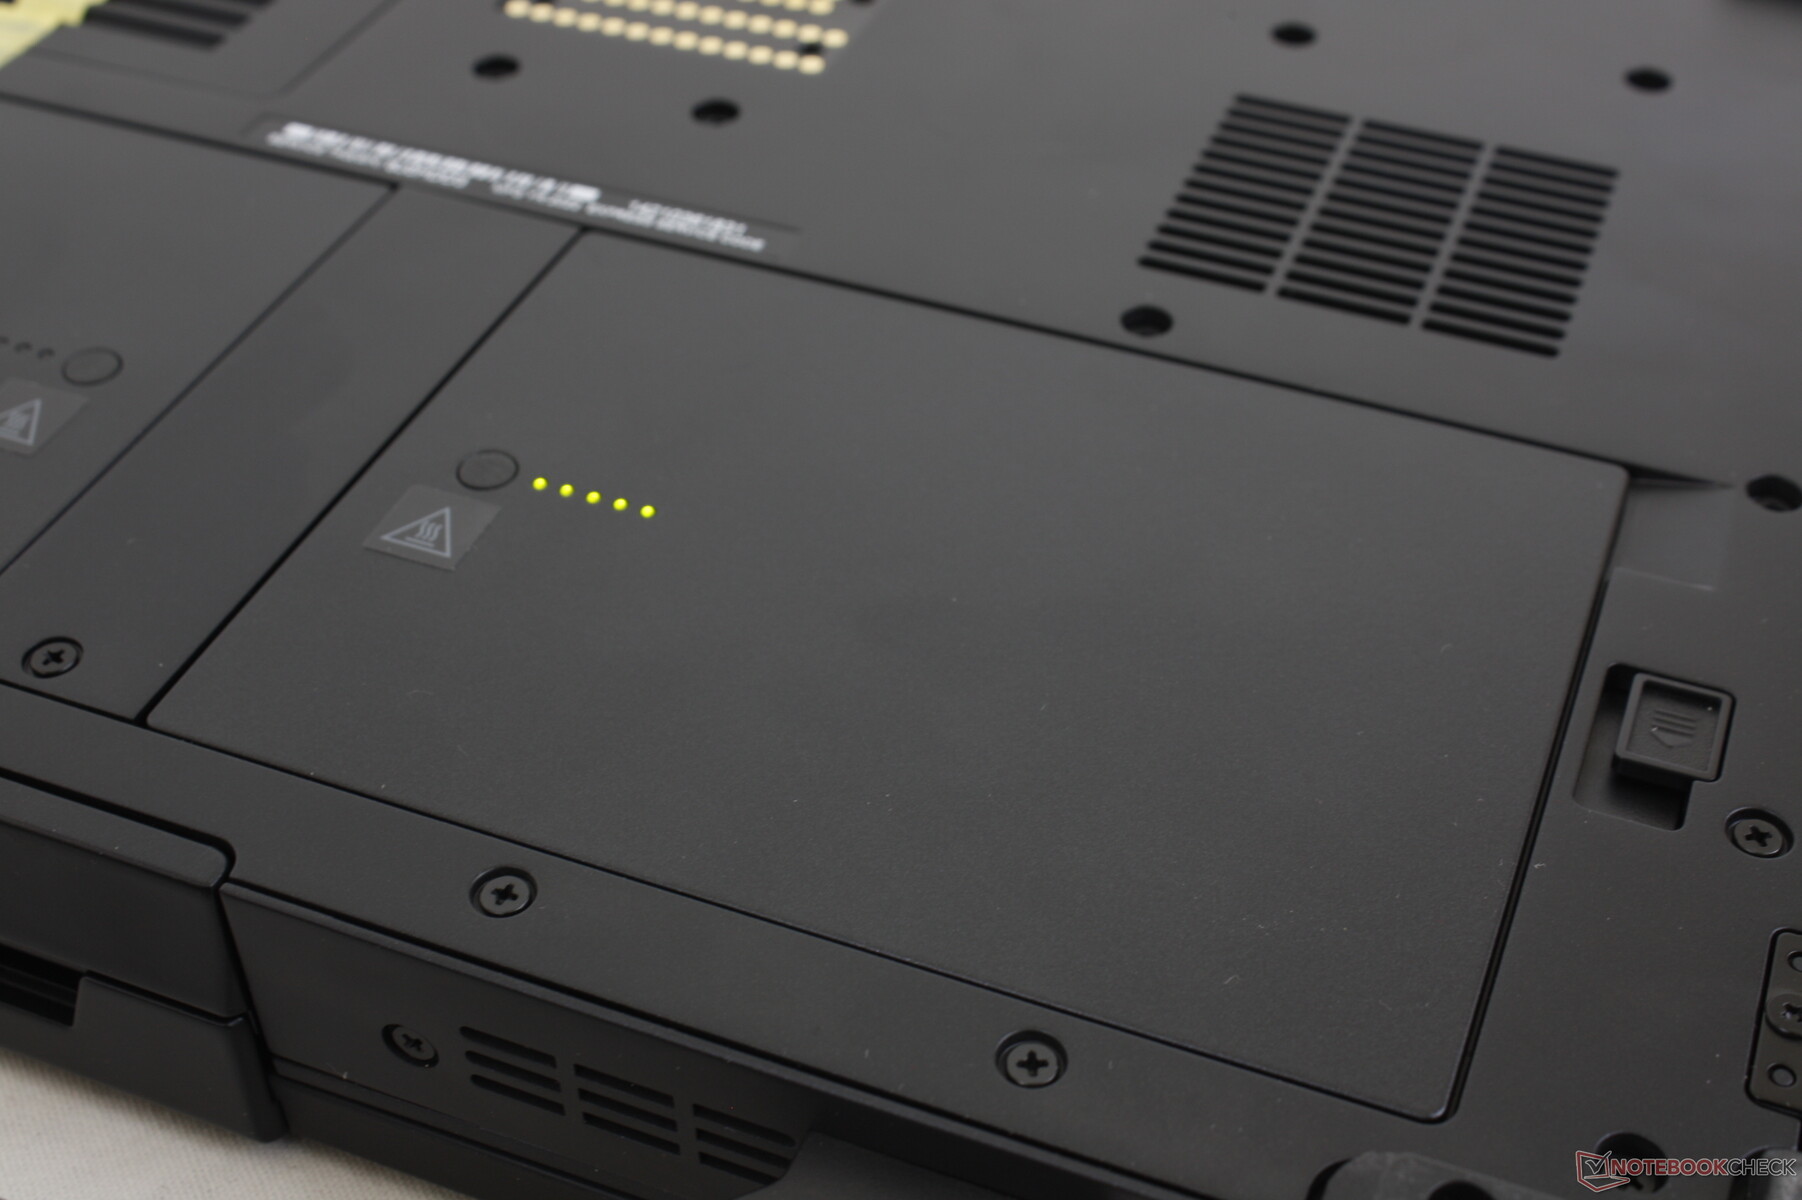
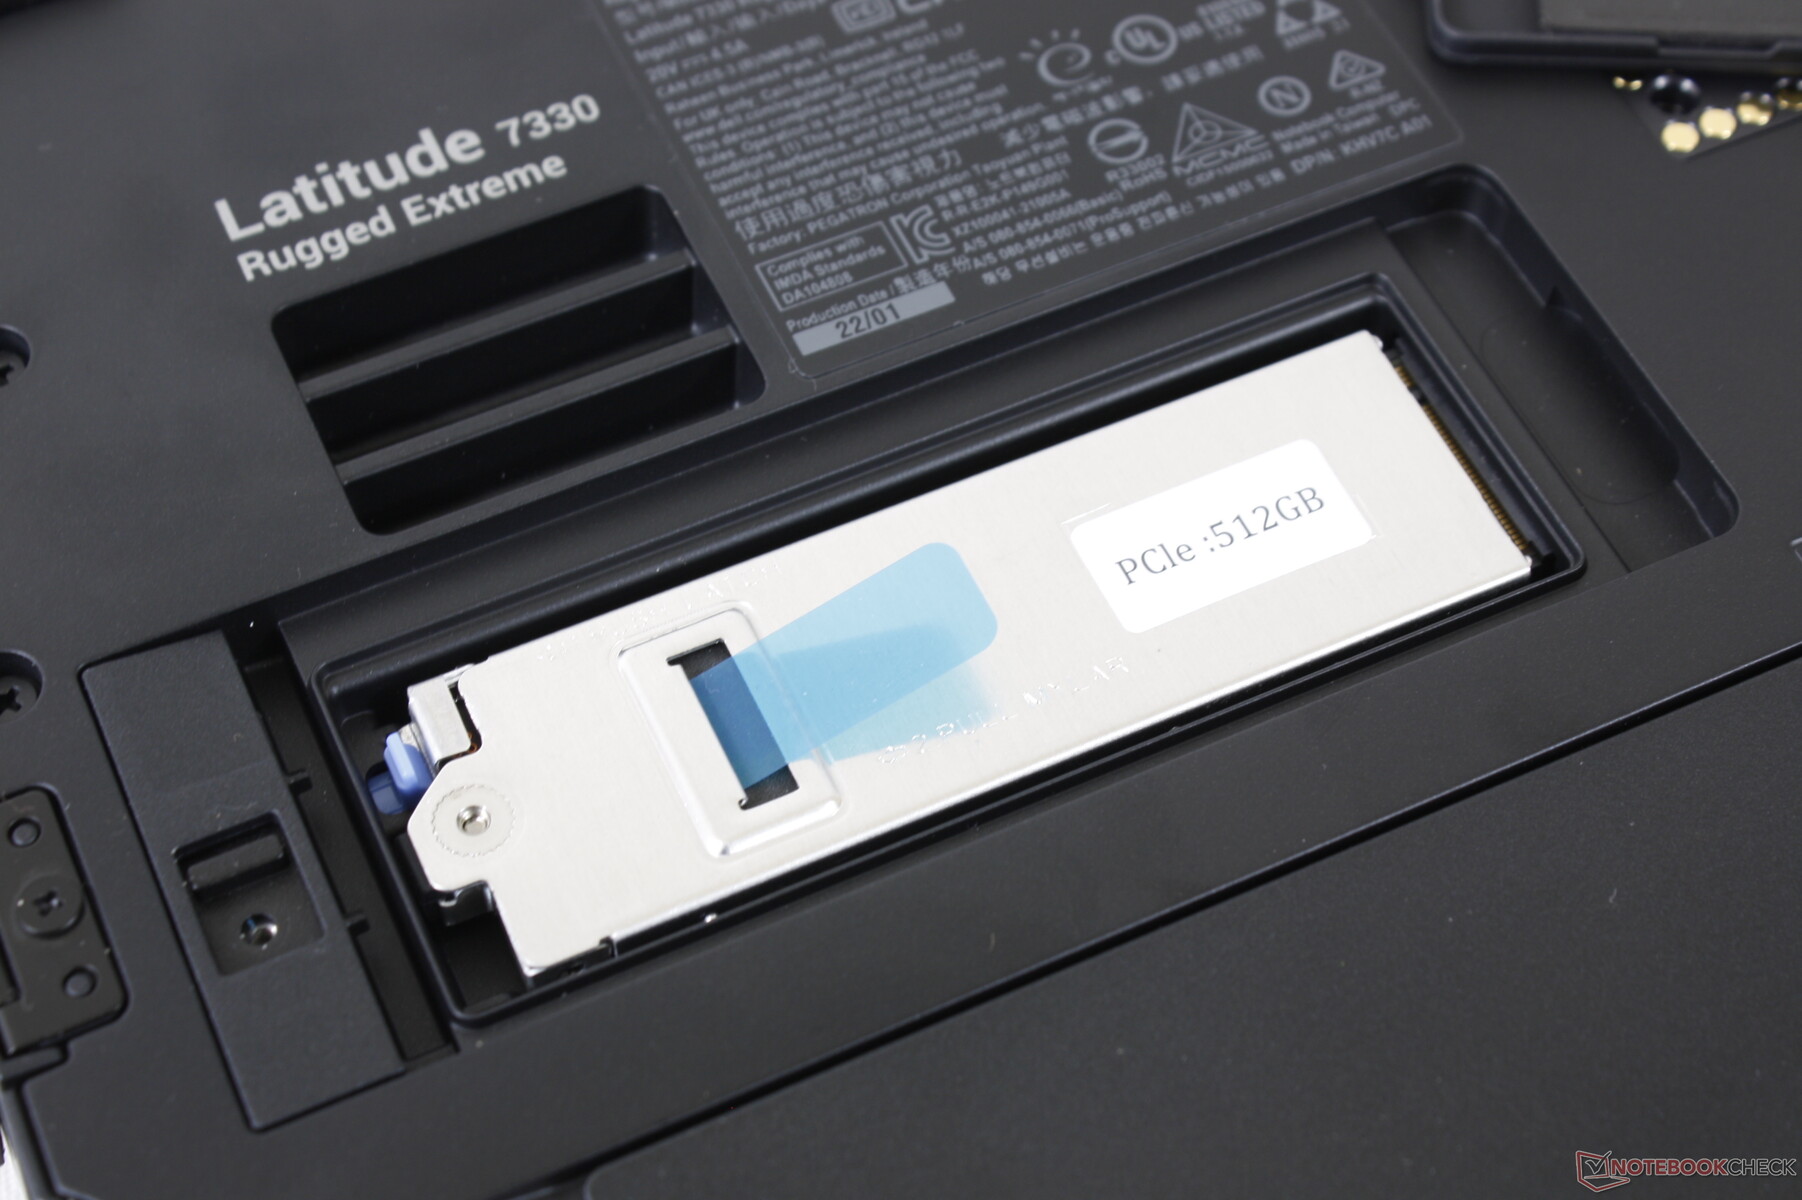
Manutenzione
Il pannello inferiore è relativamente facile da rimuovere se si ha la pazienza di svitare le sue due dozzine di viti Philips. Ci saranno poche ragioni per farlo nella maggior parte degli scenari, dato che la RAM è saldata e il singolo alloggiamento di archiviazione è già accessibile tramite un piccolo sportello.
Accessori e garanzia
Sono disponibili accessori opzionali per sfruttare i perni di aggancio proprietari sul fondo dell'unità. Una garanzia limitata di tre anni del produttore è standard.
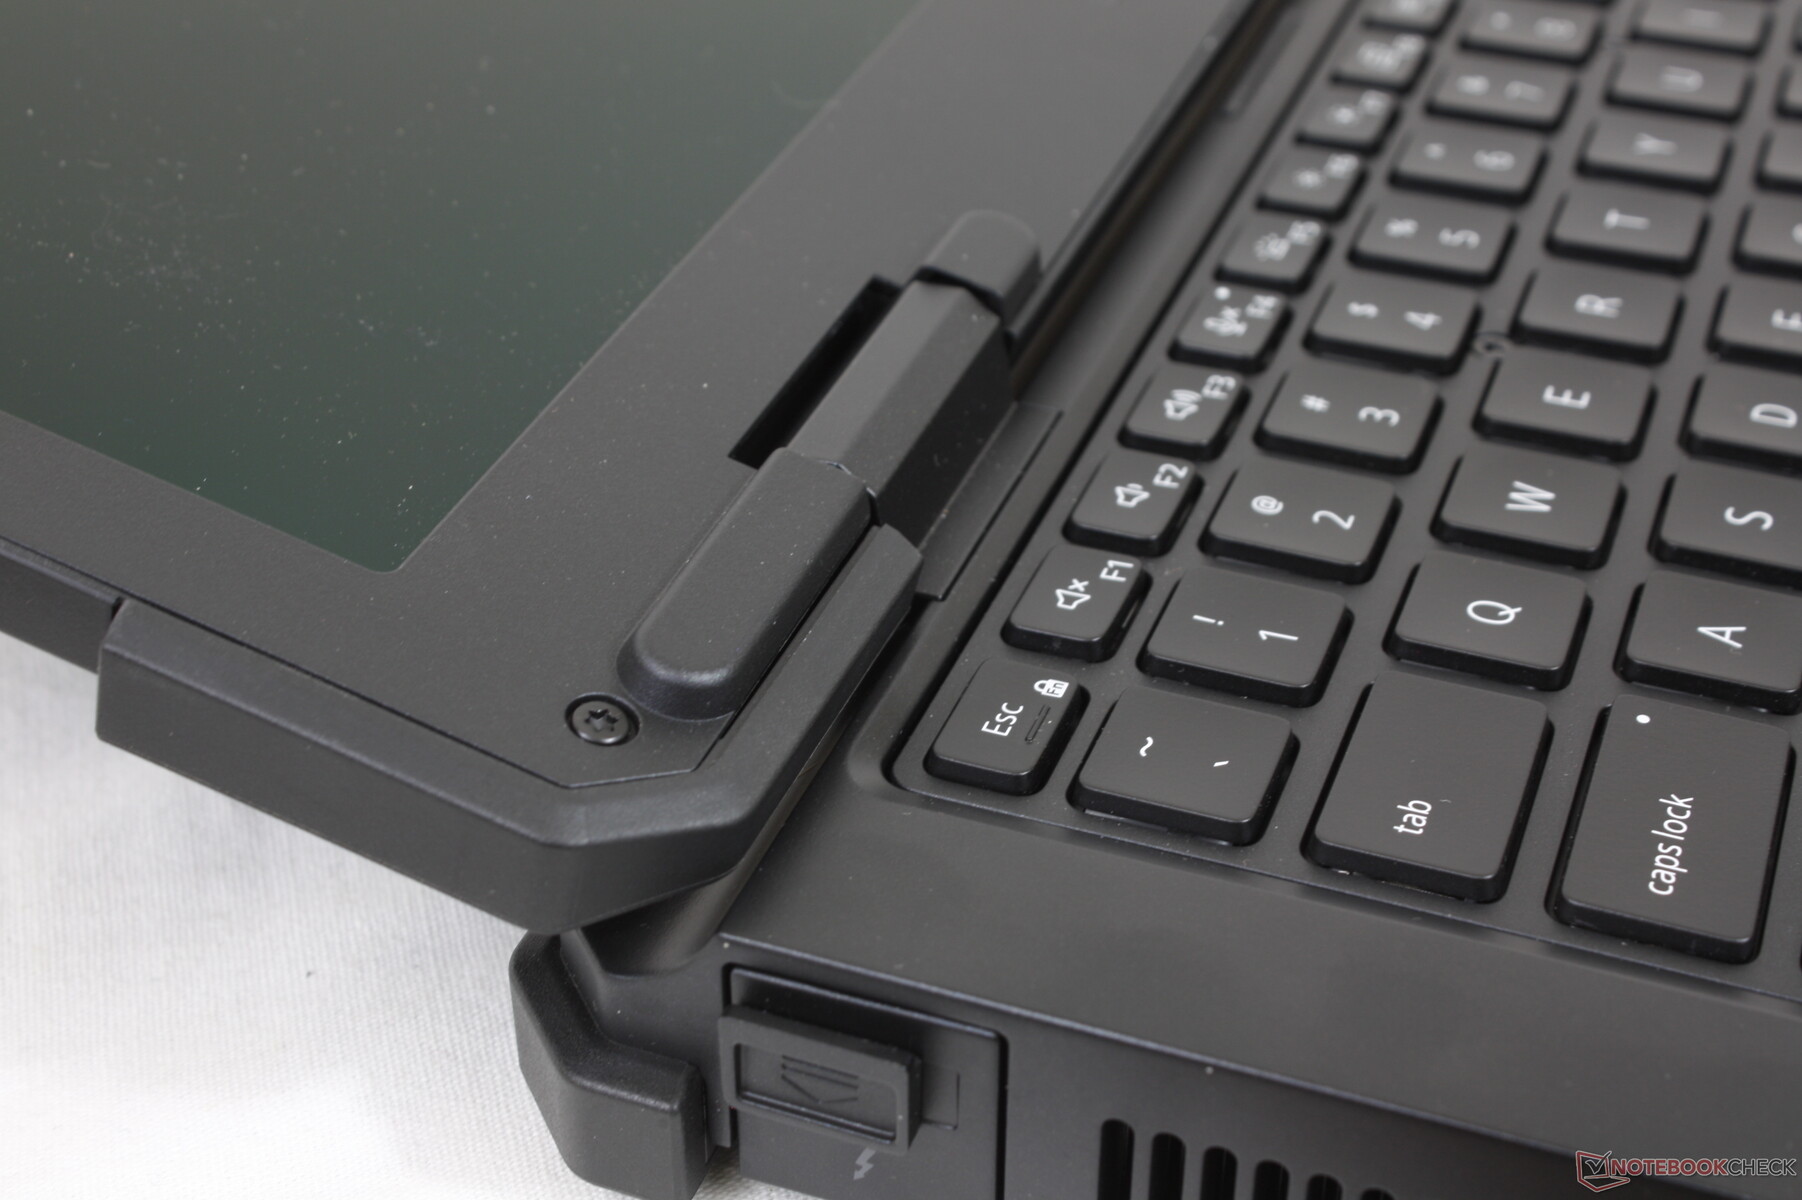
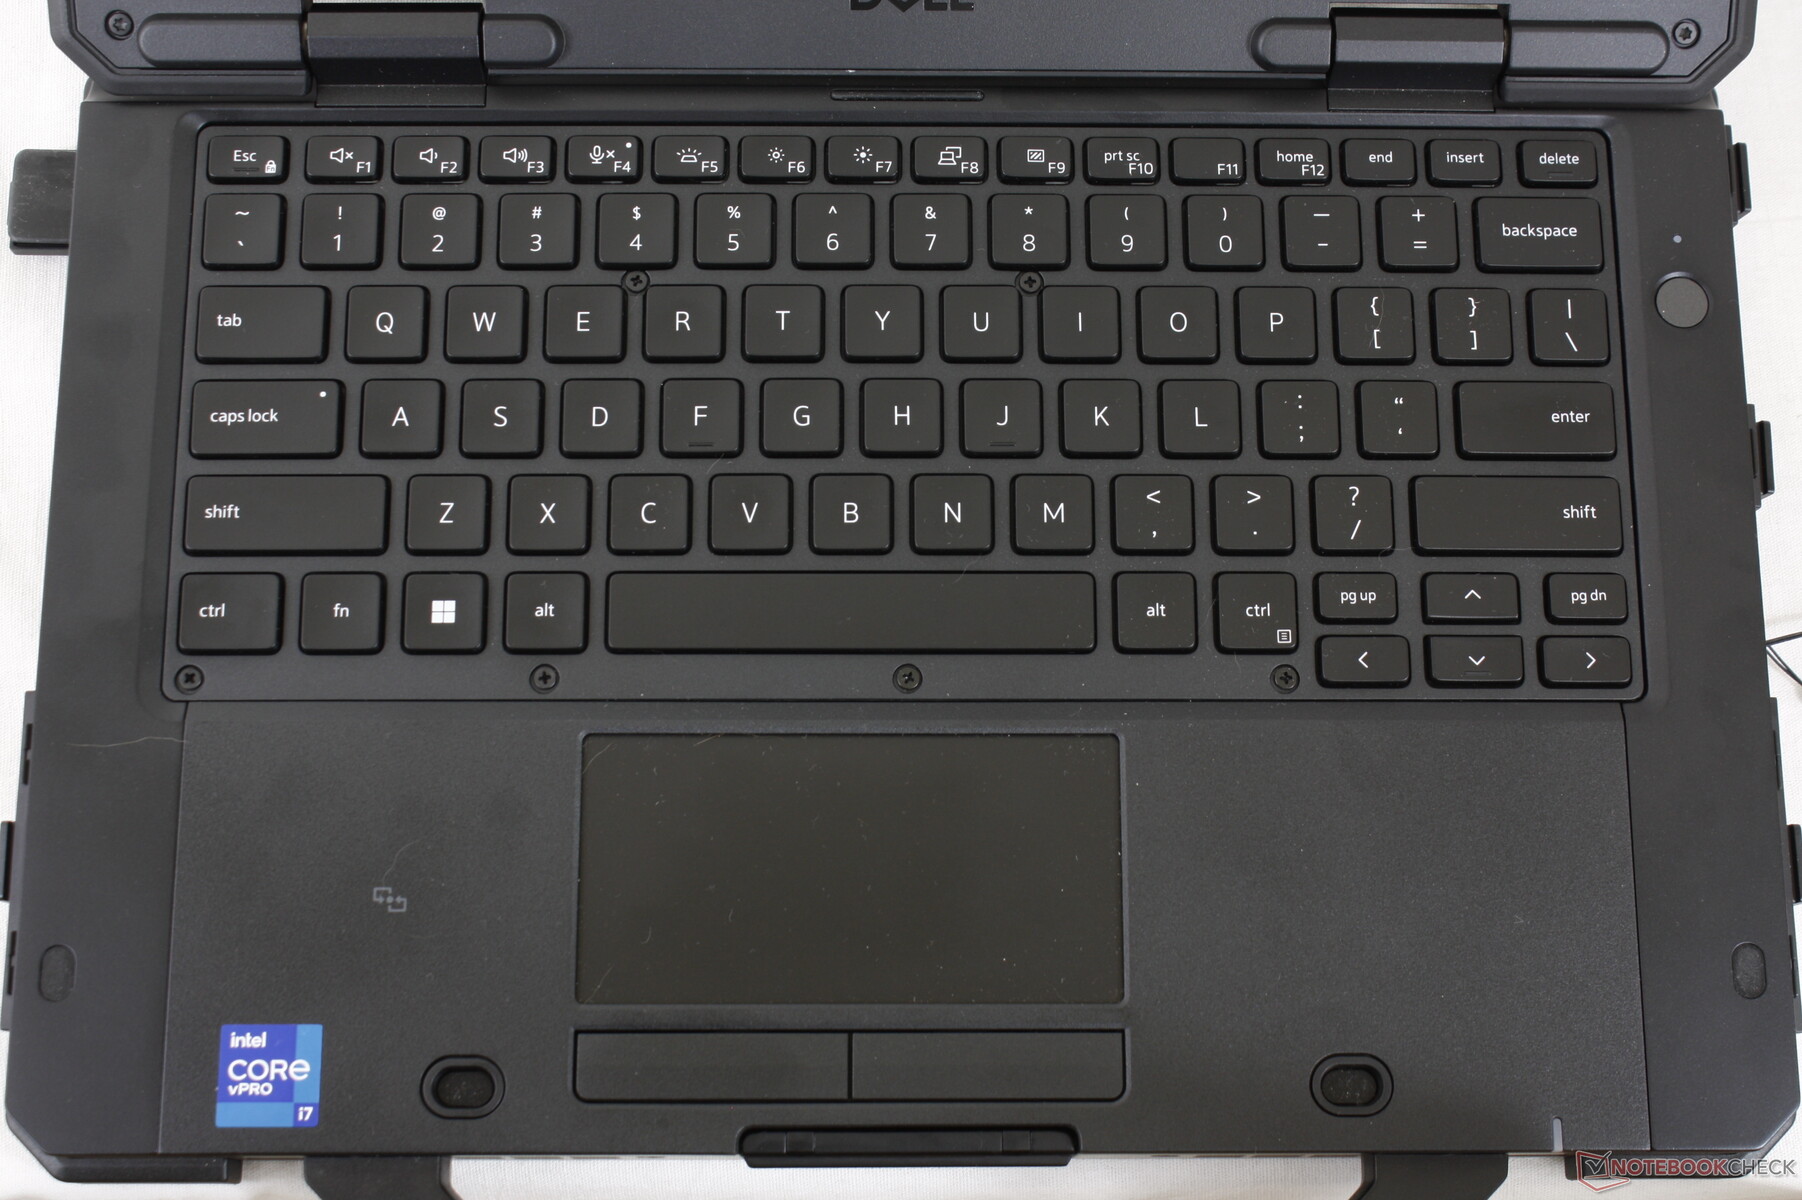
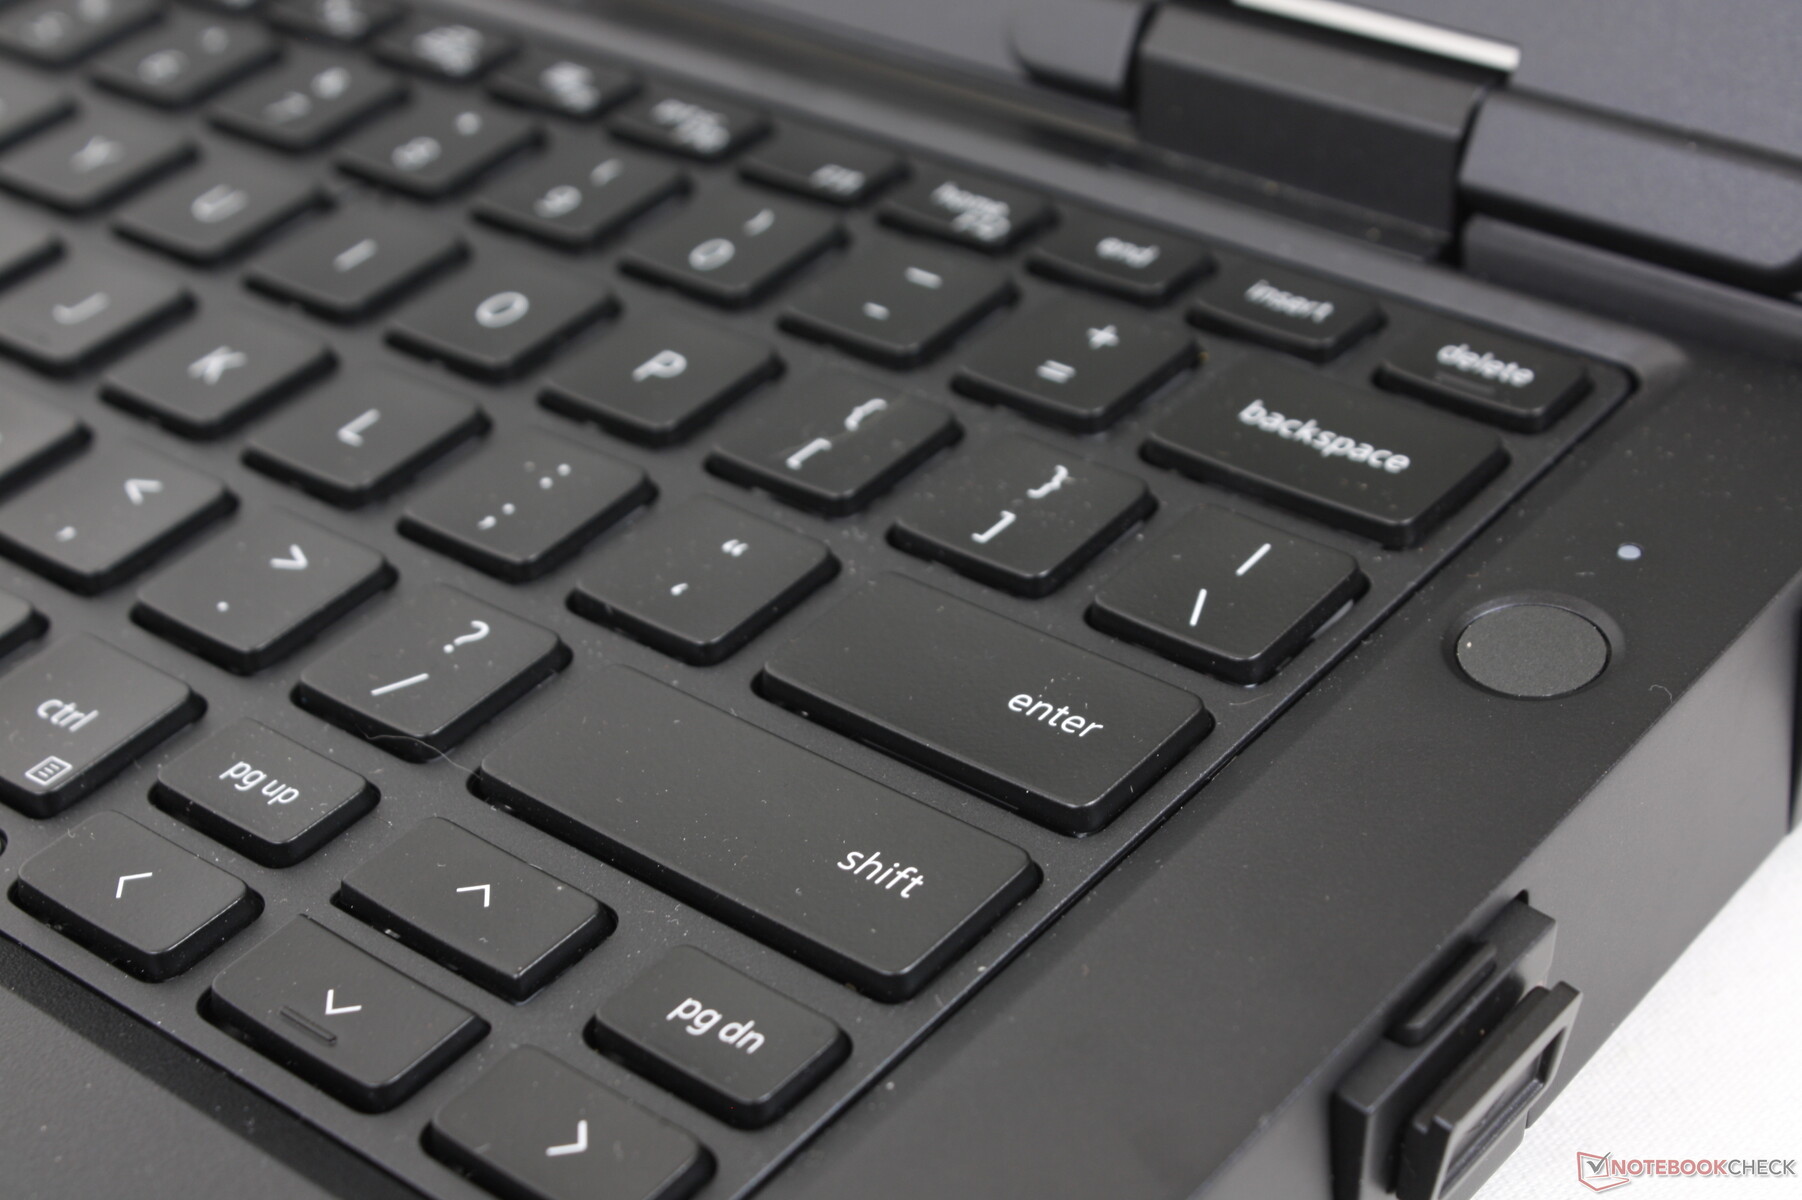
Dispositivi di input
Tastiera
Rispetto alla tastiera della serie Getac B360, la tastiera del Dell è leggermente più morbida e silenziosa, ma non necessariamente meno comoda da digitare. Gli utenti potrebbero preferire avere tasti più silenziosi a seconda dello scenario di utilizzo. Preferiamo la retroilluminazione rossa sul B360, tuttavia, perché è un po' più facile per gli occhi rispetto alla retroilluminazione bianca del Dell.
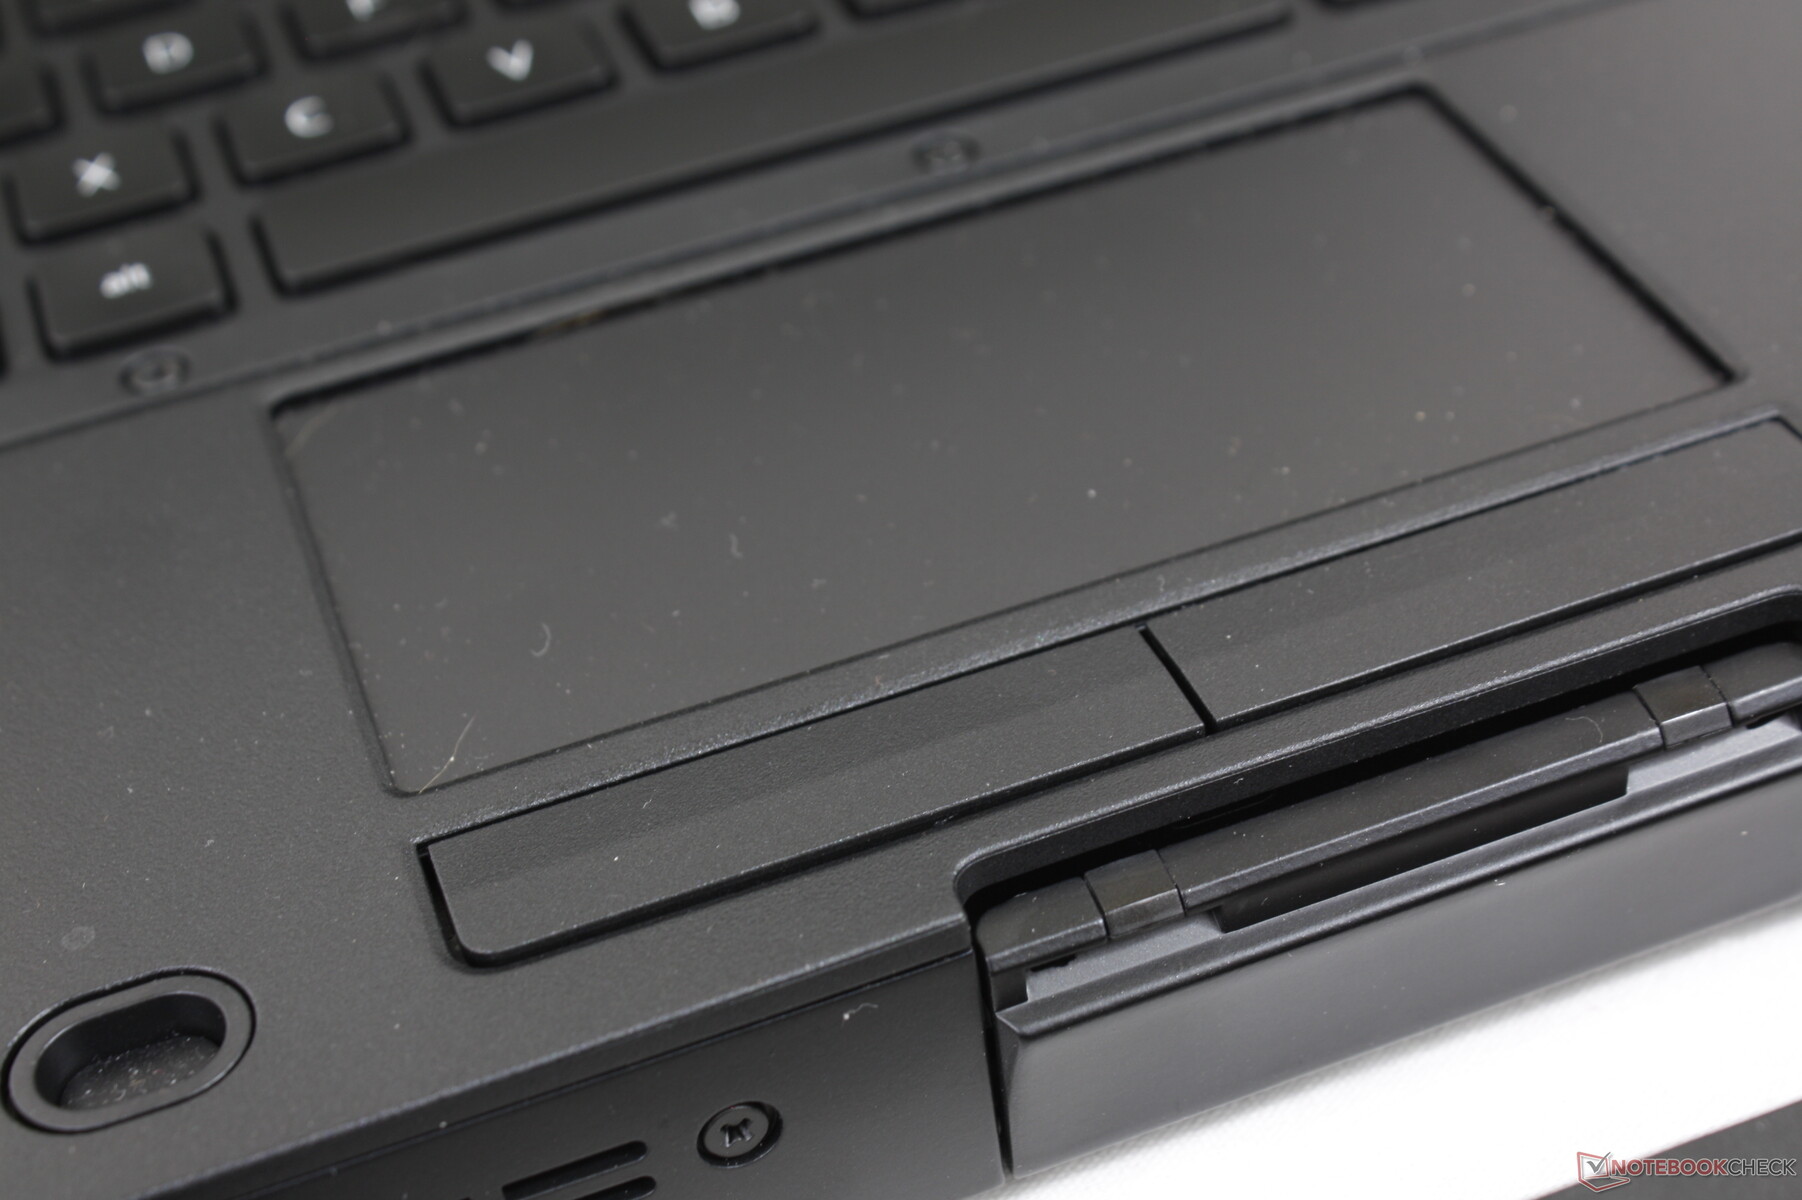
Touchpad
Il trackpad ha dimensioni ragionevoli: 10 x 5 cm contro i 9,3 x 5,3 cm del Getac B360. Anche se la trazione è fluida, il controllo del cursore è saltellante poiché il trackpad è stato progettato per riconoscere anche gli input dei guanti. Raccomandiamo di premere più fermamente sulla superficie del trackpad per ridurre i salti.

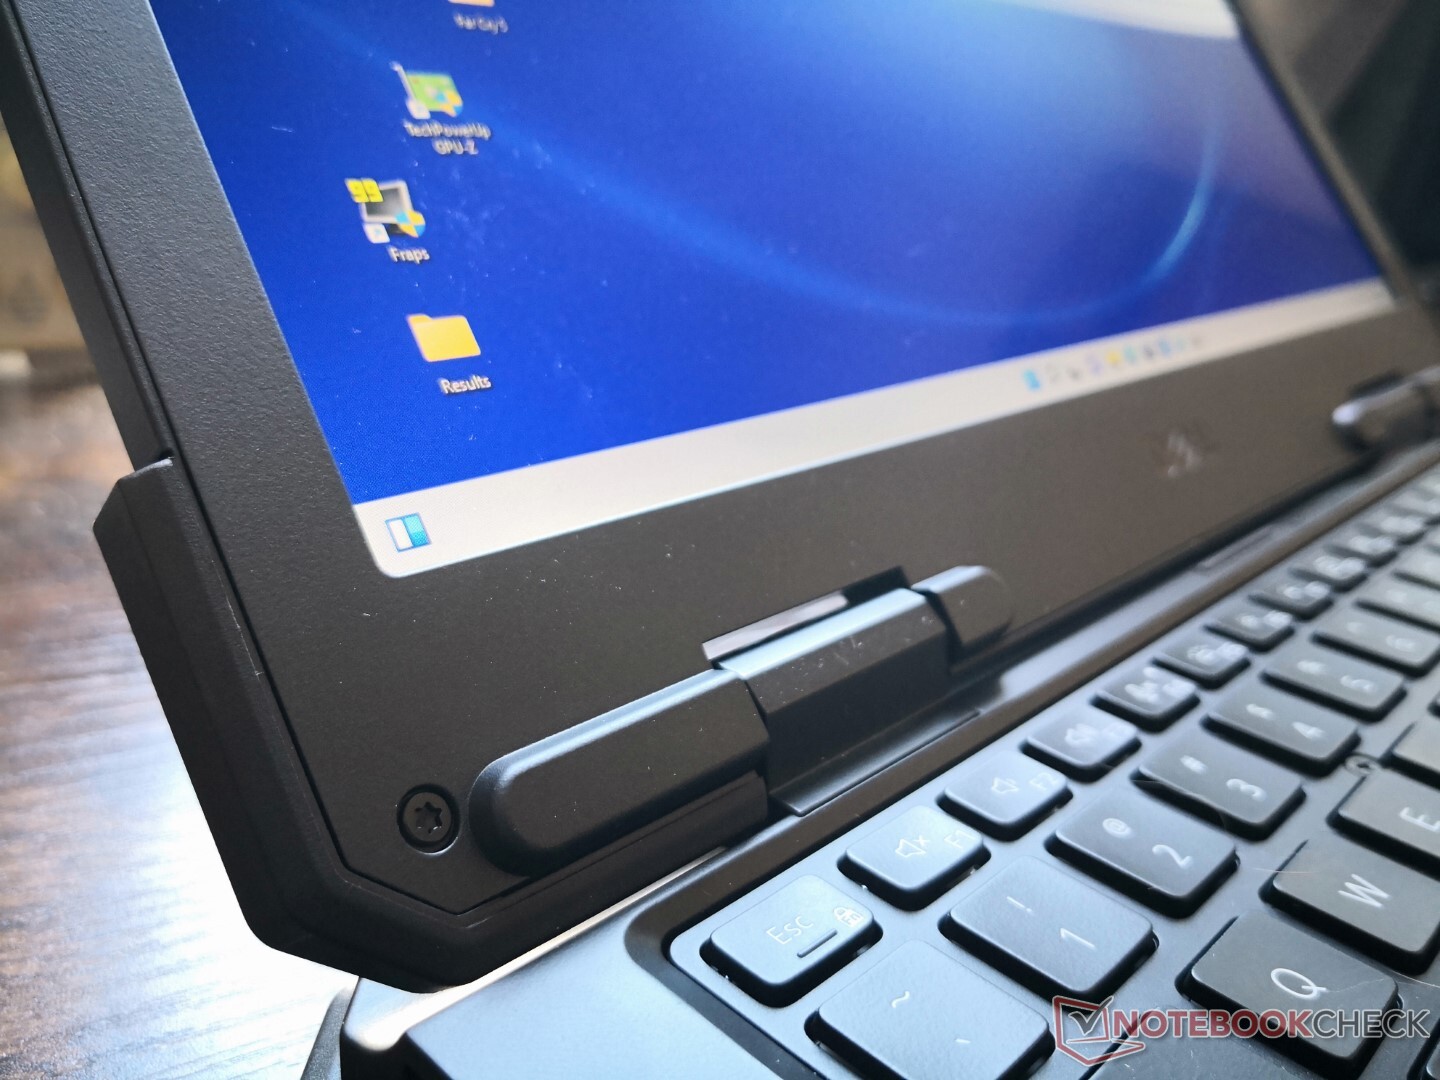
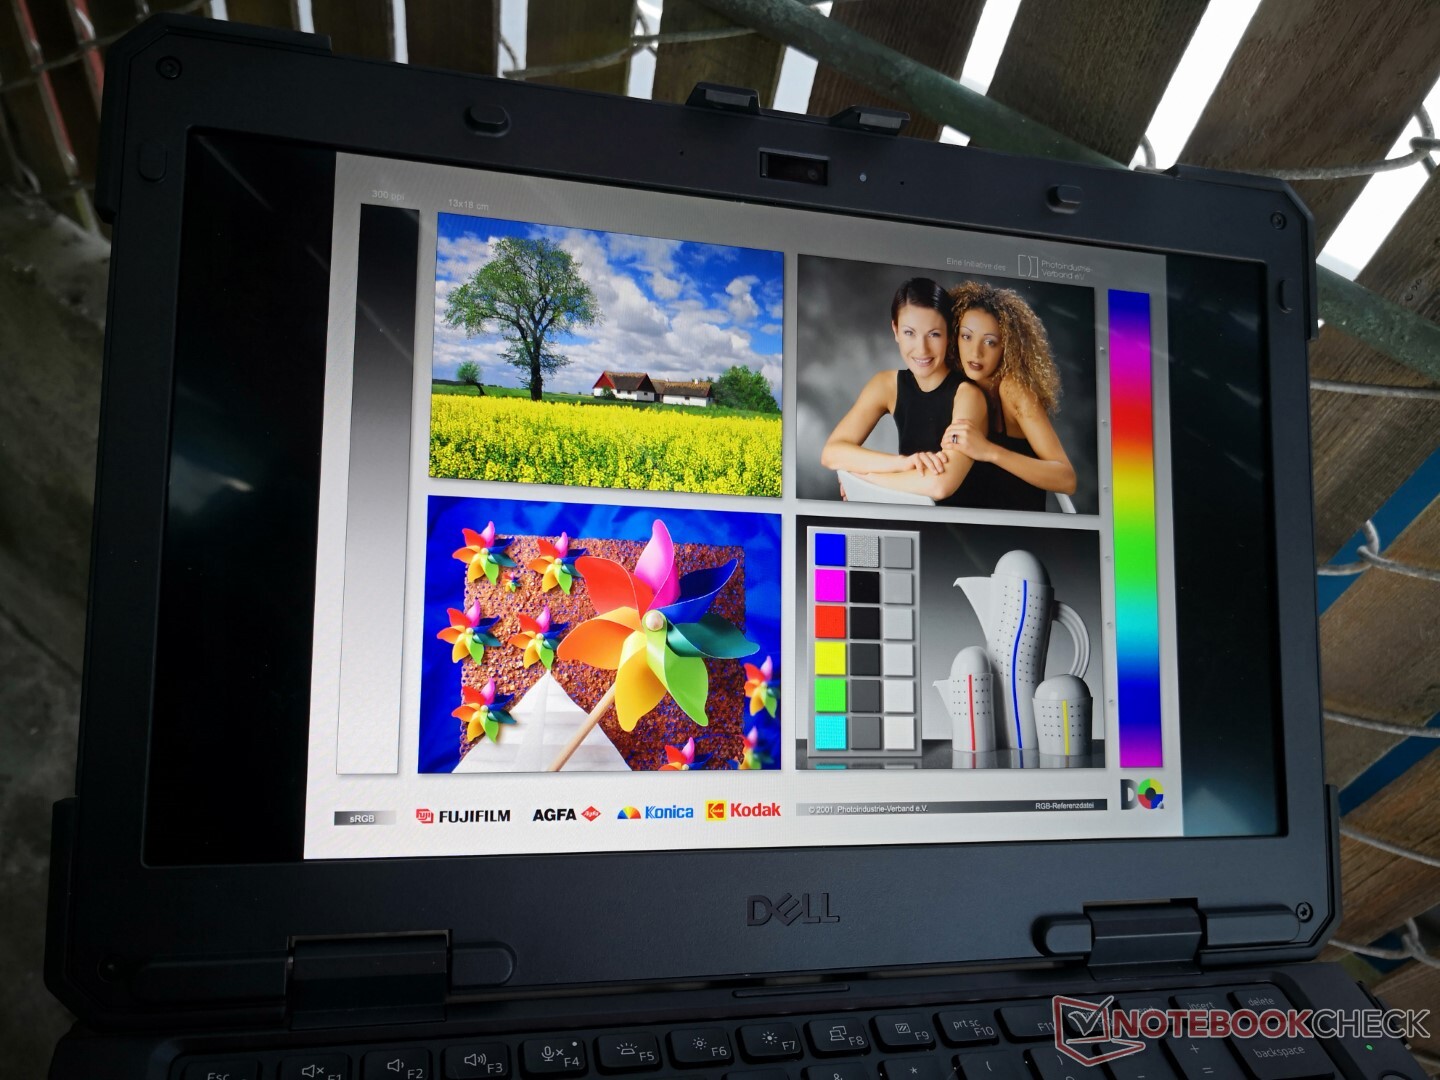
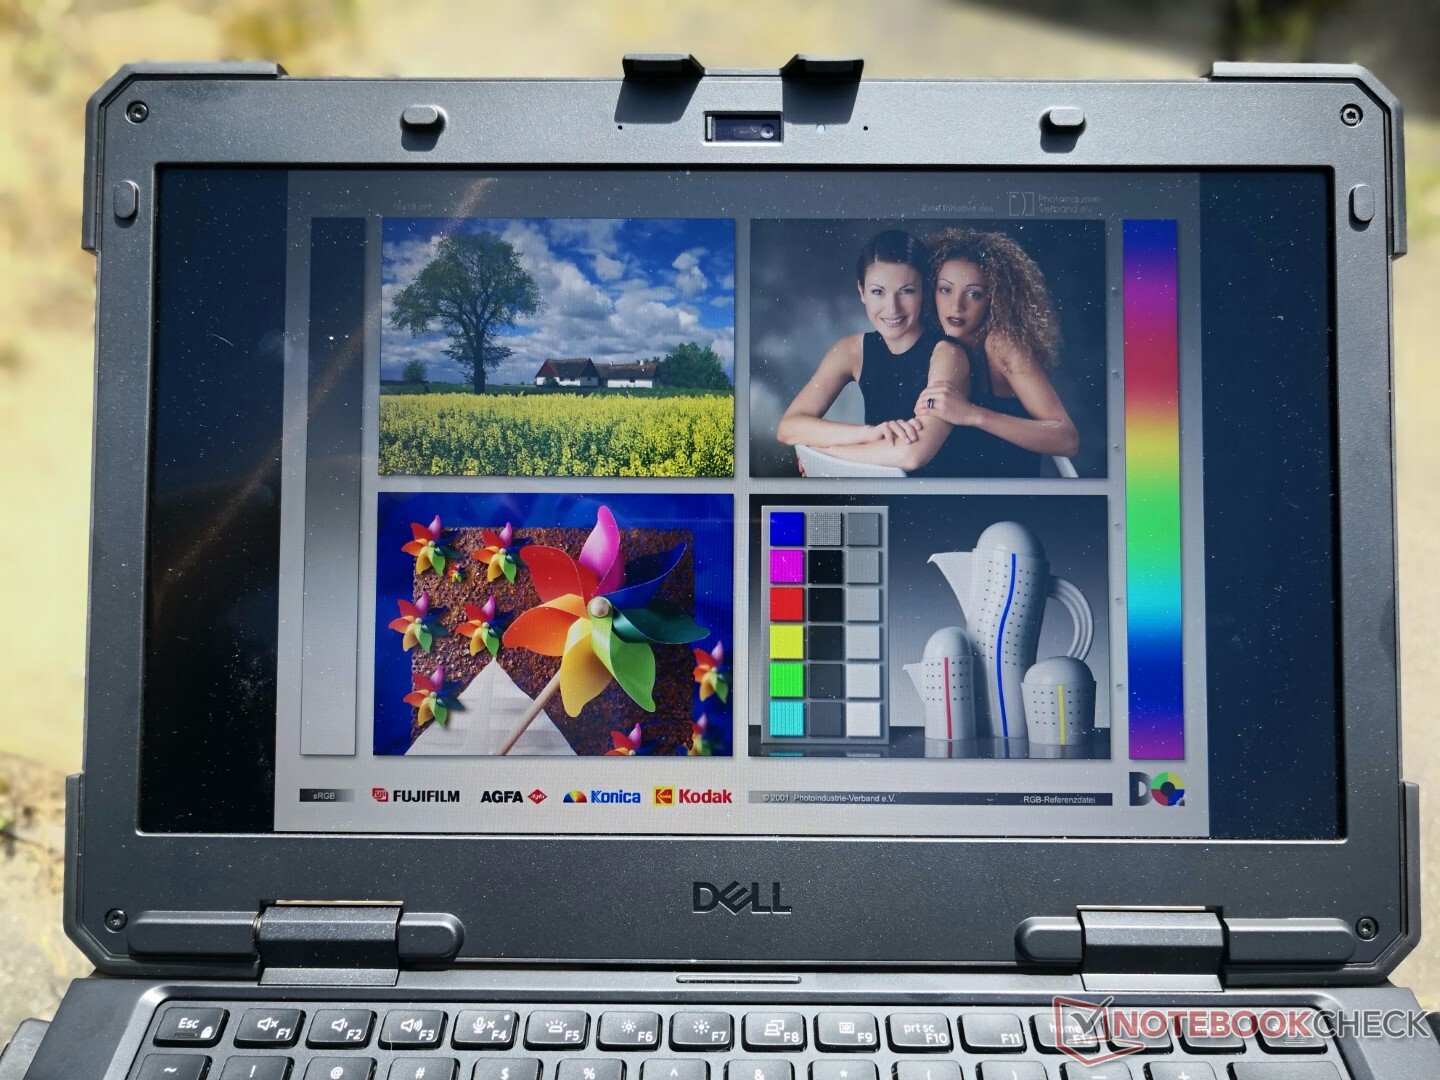
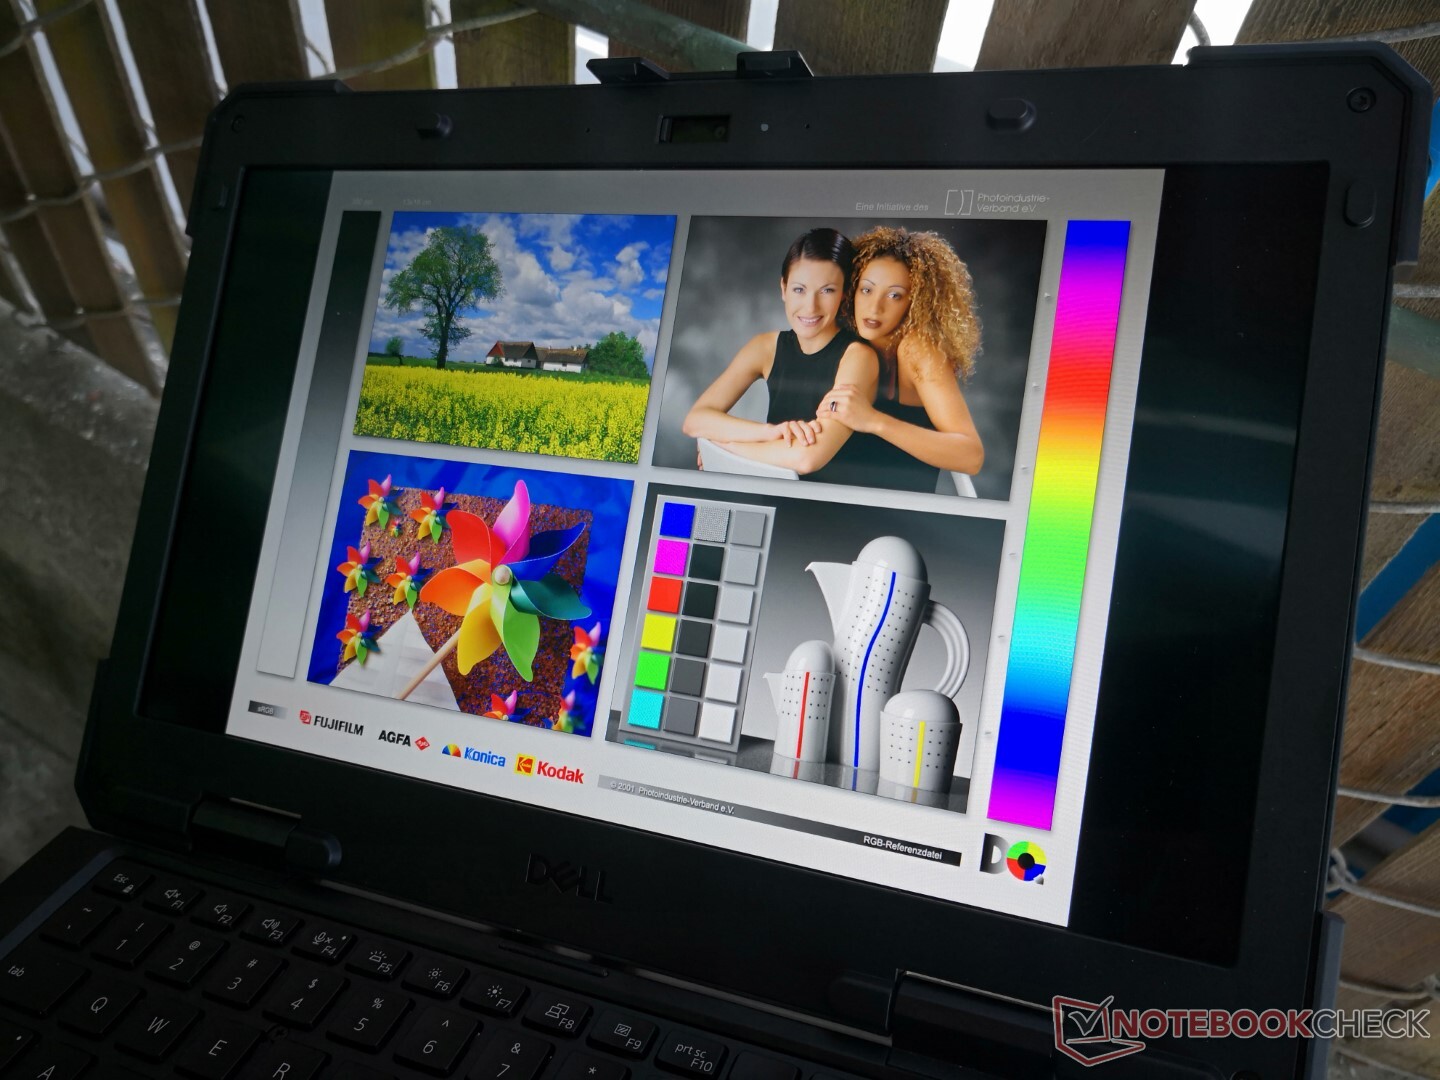
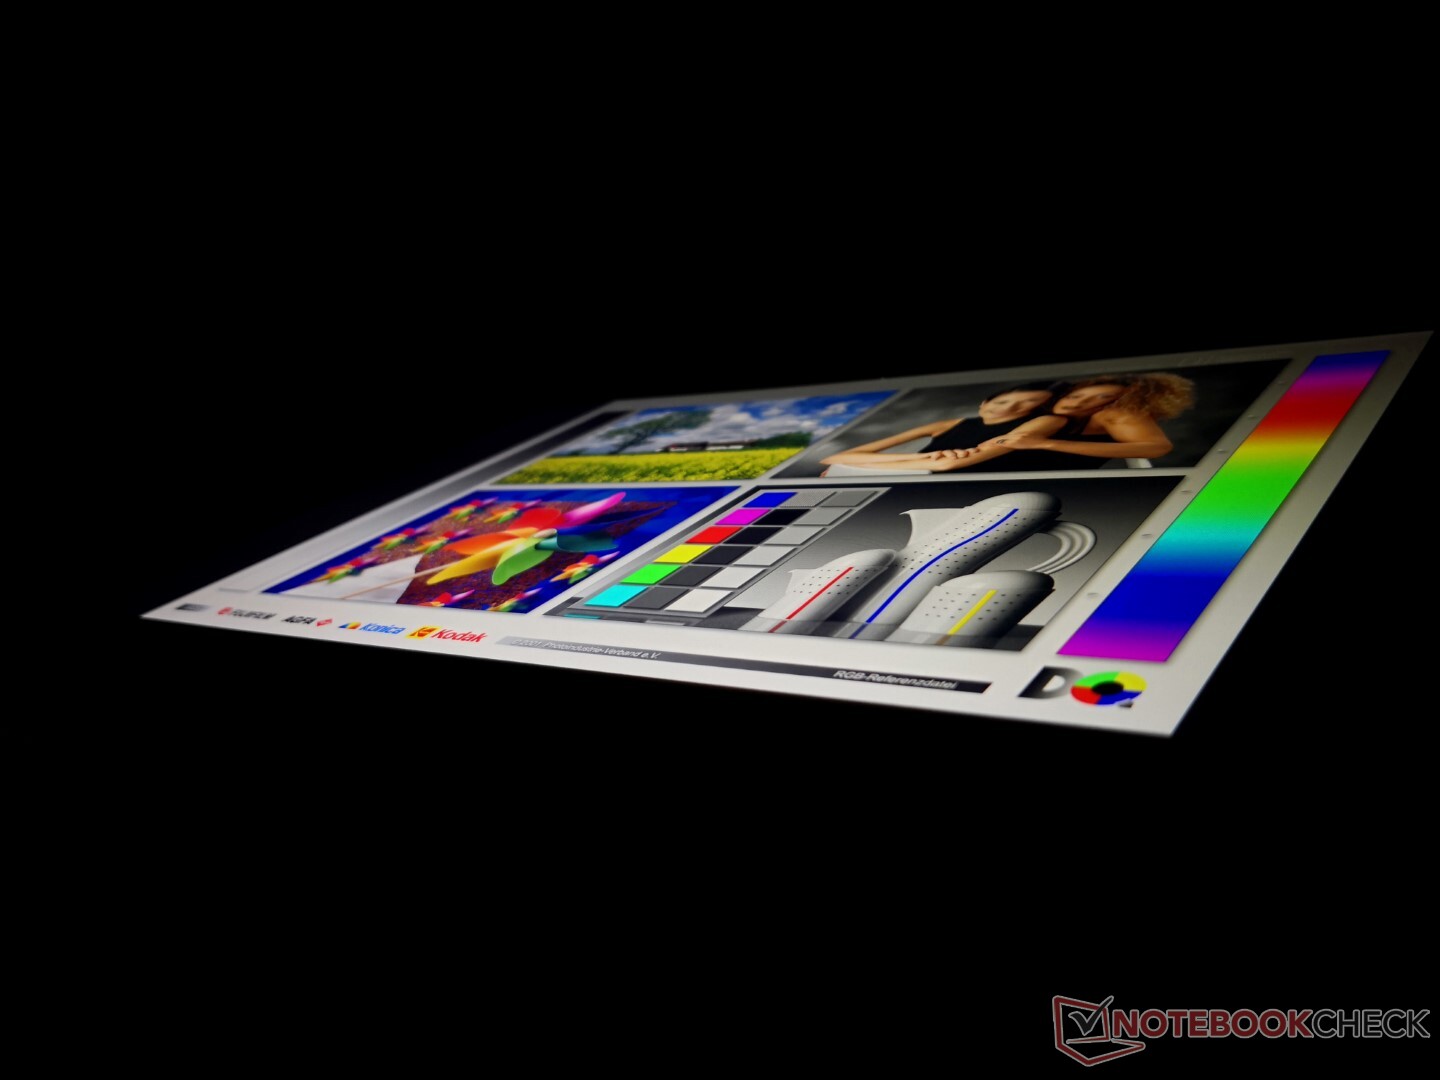
Visualizza
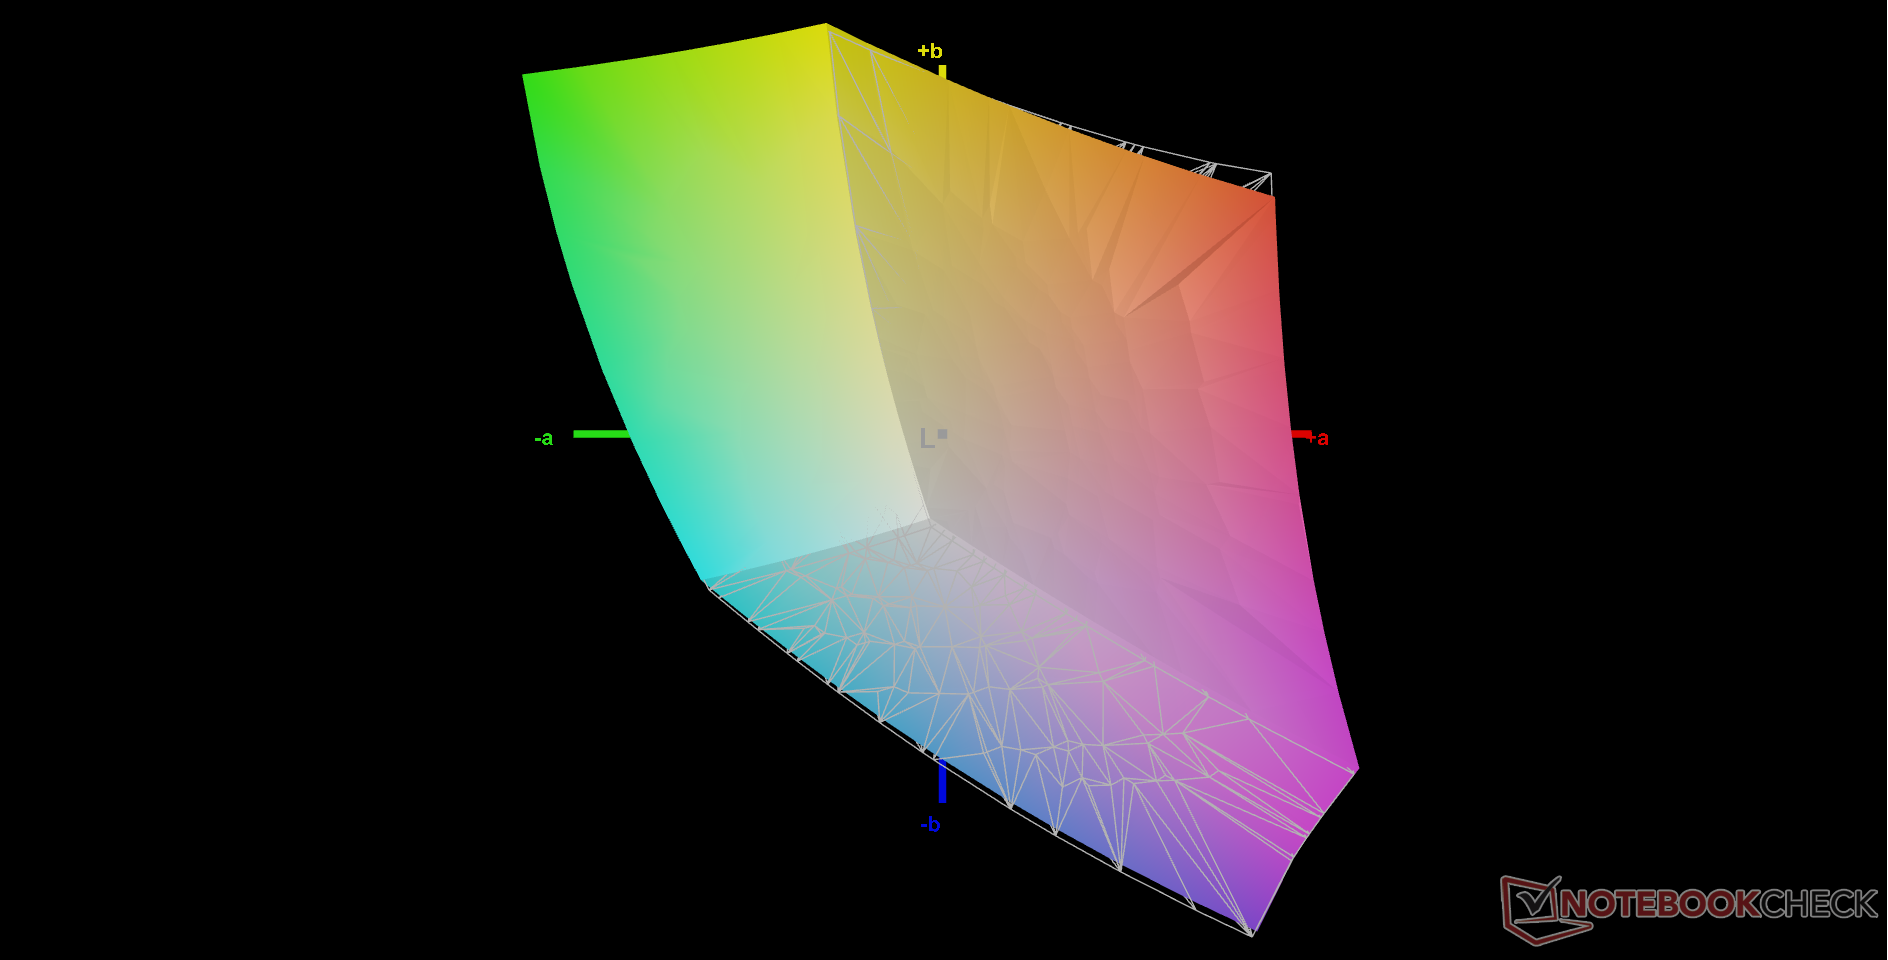
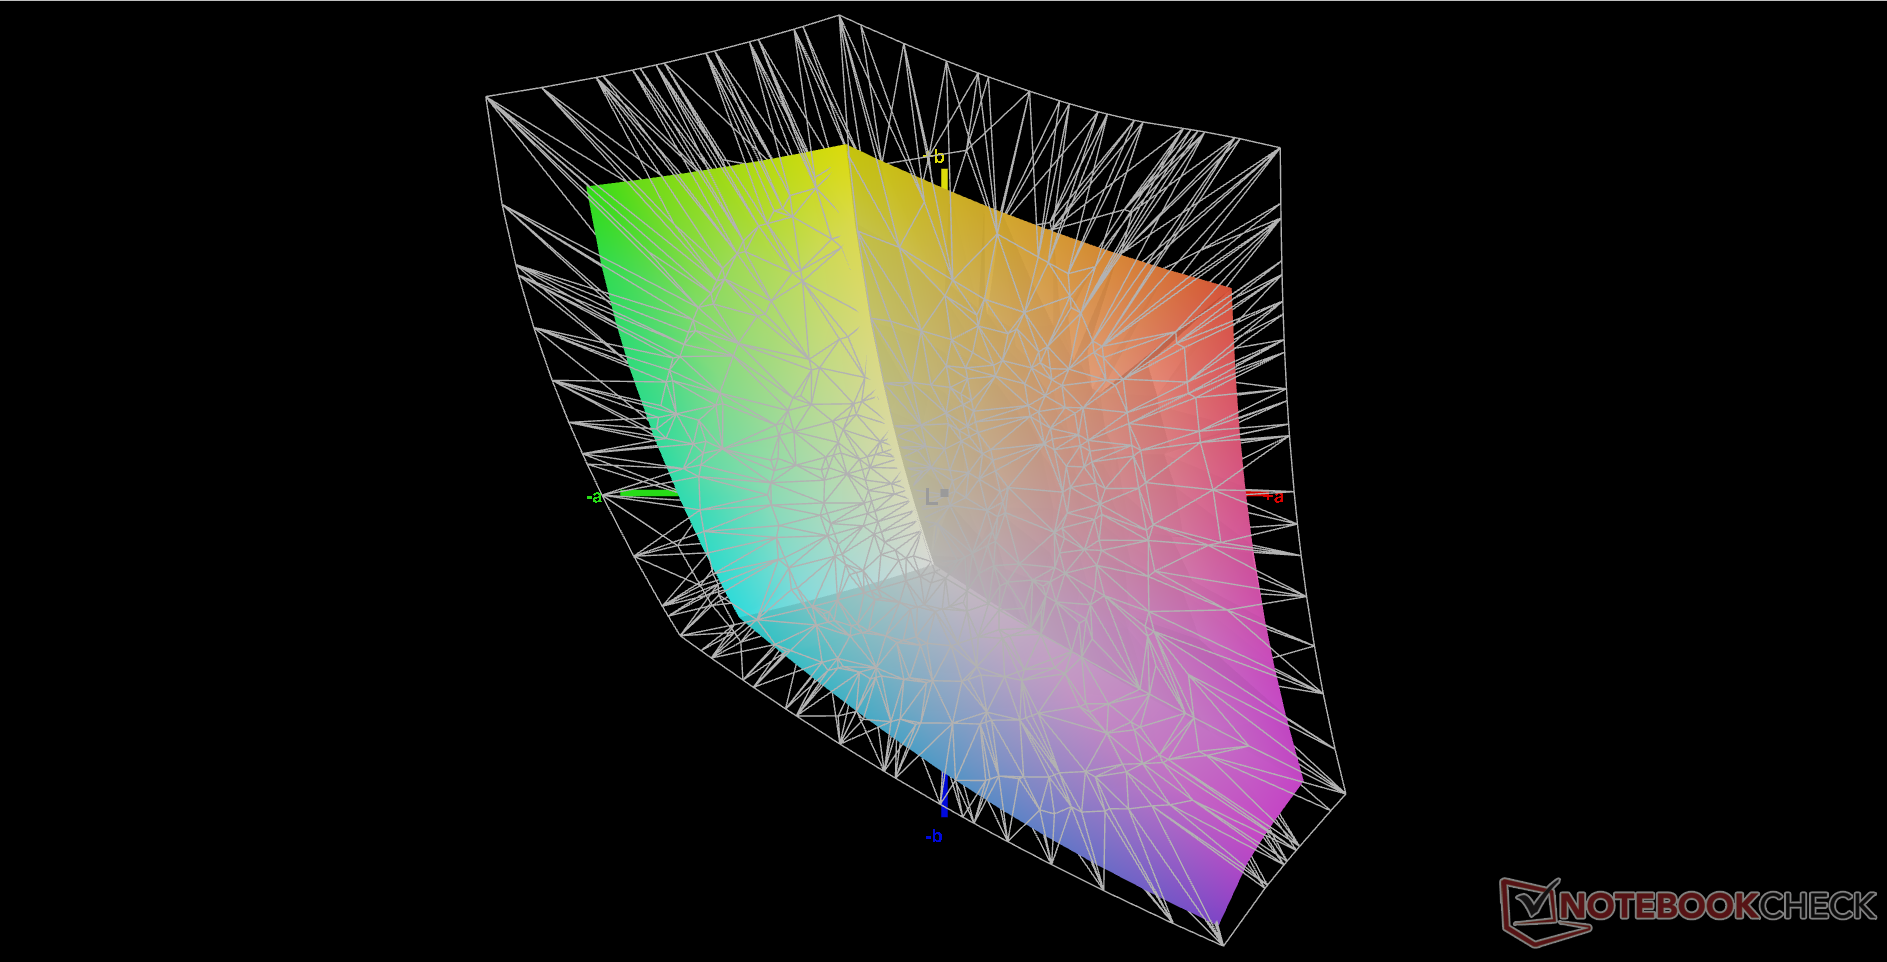
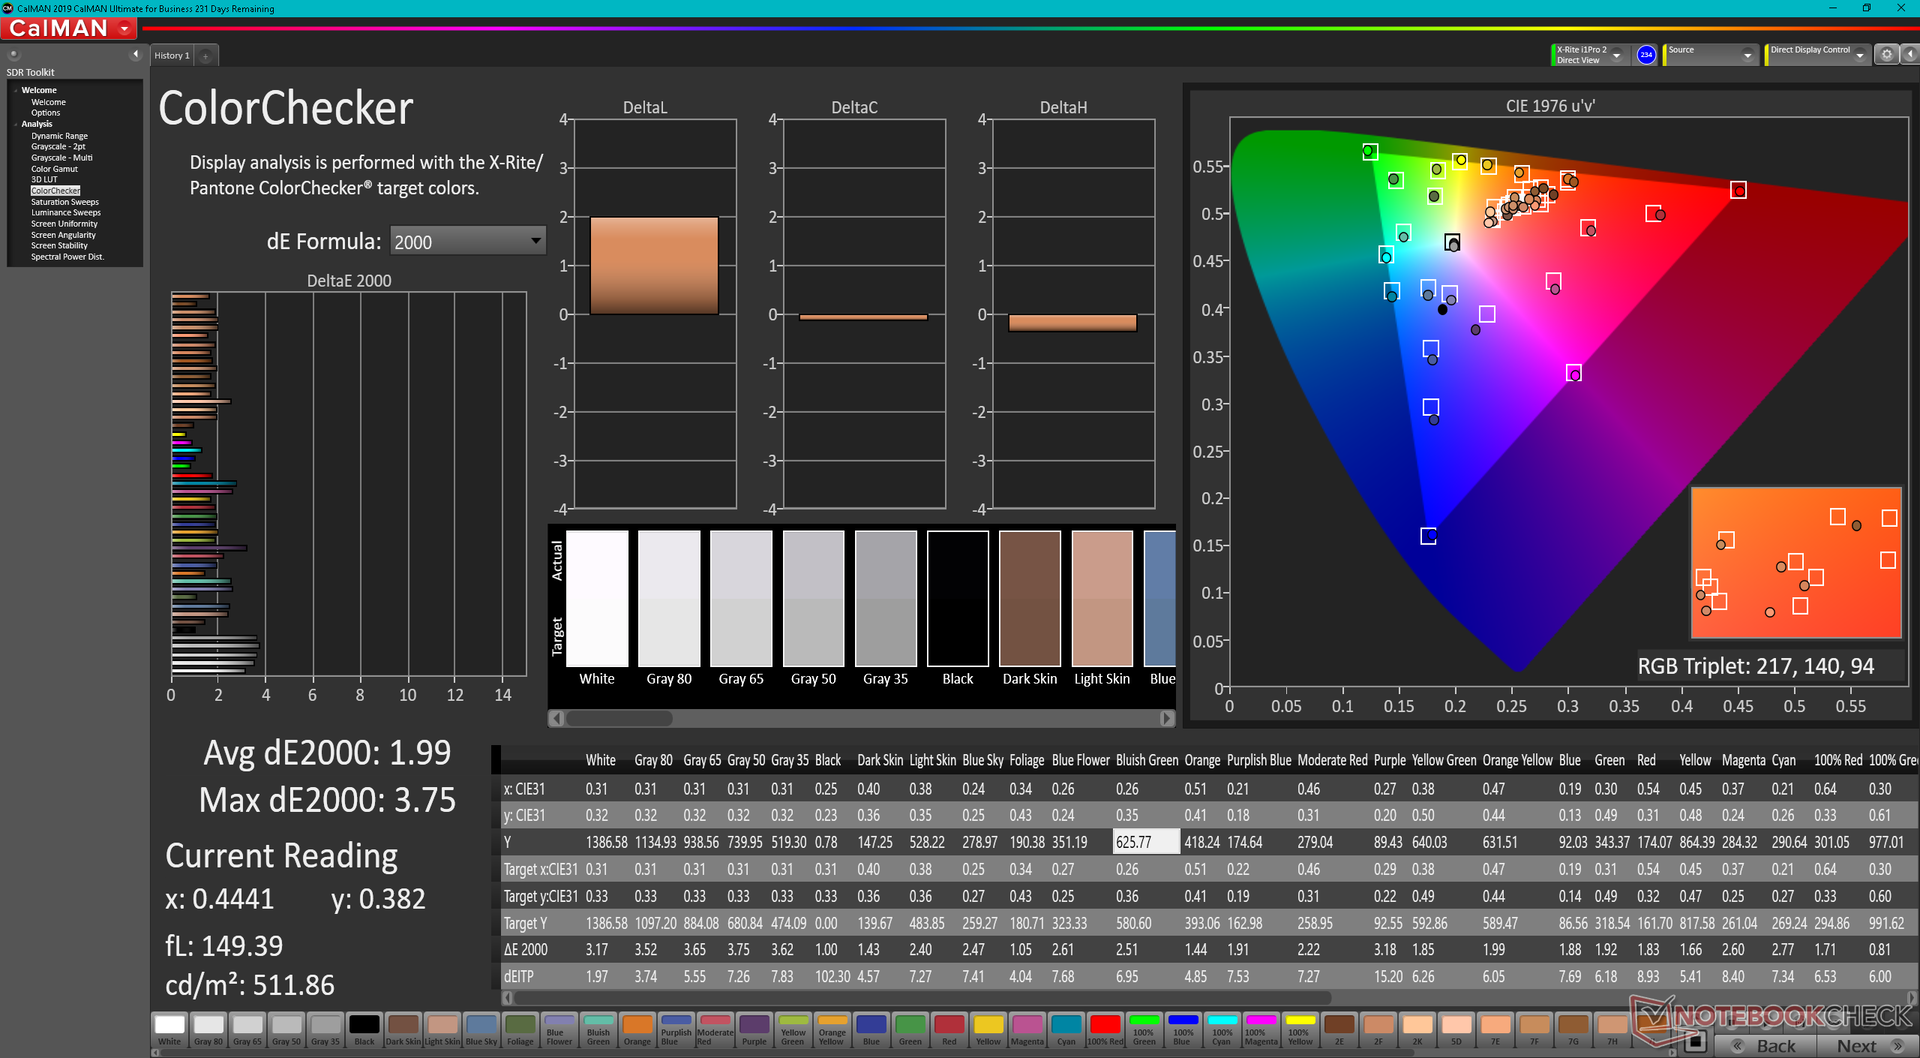
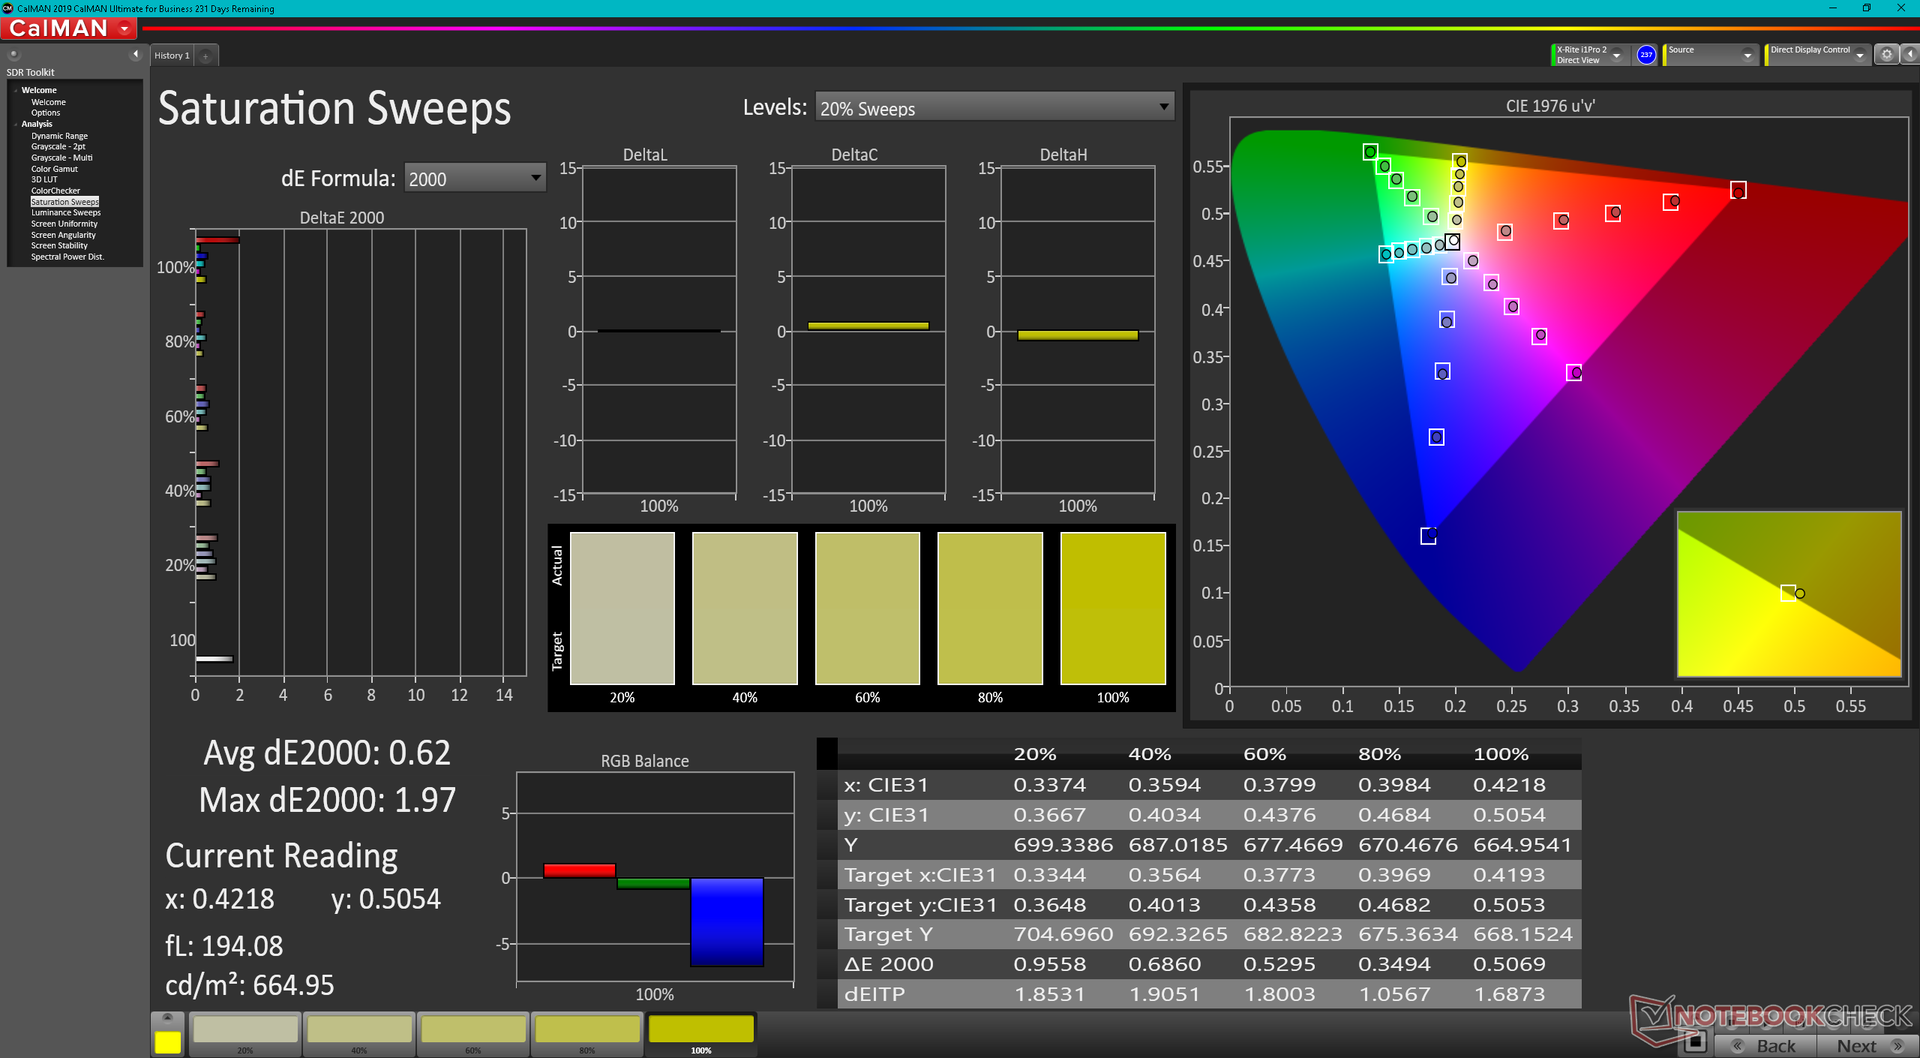
Il Latitude 7330 Rugged Extreme utilizza lo stesso pannello IPS Sharp LQ133M1 1080p che si trova sul vecchio 2016 XPS 13 9350 oLatitude 13 7370. Anche se questo può sembrare una cosa negativa, questo particolare pannello è migliore del pannello medio sulla maggior parte degli altri portatili rugged. Il Panasonic Toughbook FZ-55 MK2, Durabook S14I, o Getac B360, per esempio, tutti usano pannelli con una gamma significativamente più stretta e quindi colori notevolmente meno profondi. Questo è uno dei pochi modelli rugged ad offrire un display da 1400 nit, un contrasto profondo di oltre 1500:1 e una copertura completa sRGB tutto in uno. Apprezziamo anche la mancanza di PWM a differenza di molti altri dispositivi rugged.
Lo svantaggio più significativo di questo pannello è il suo molto lento tempo di risposta bianco-nero e grigio-grigio che significa che il ghosting è molto evidente. Questo fortunatamente non sarà un problema per le applicazioni più lente come i browser o gli editor di immagini.
| |||||||||||||||||||||||||
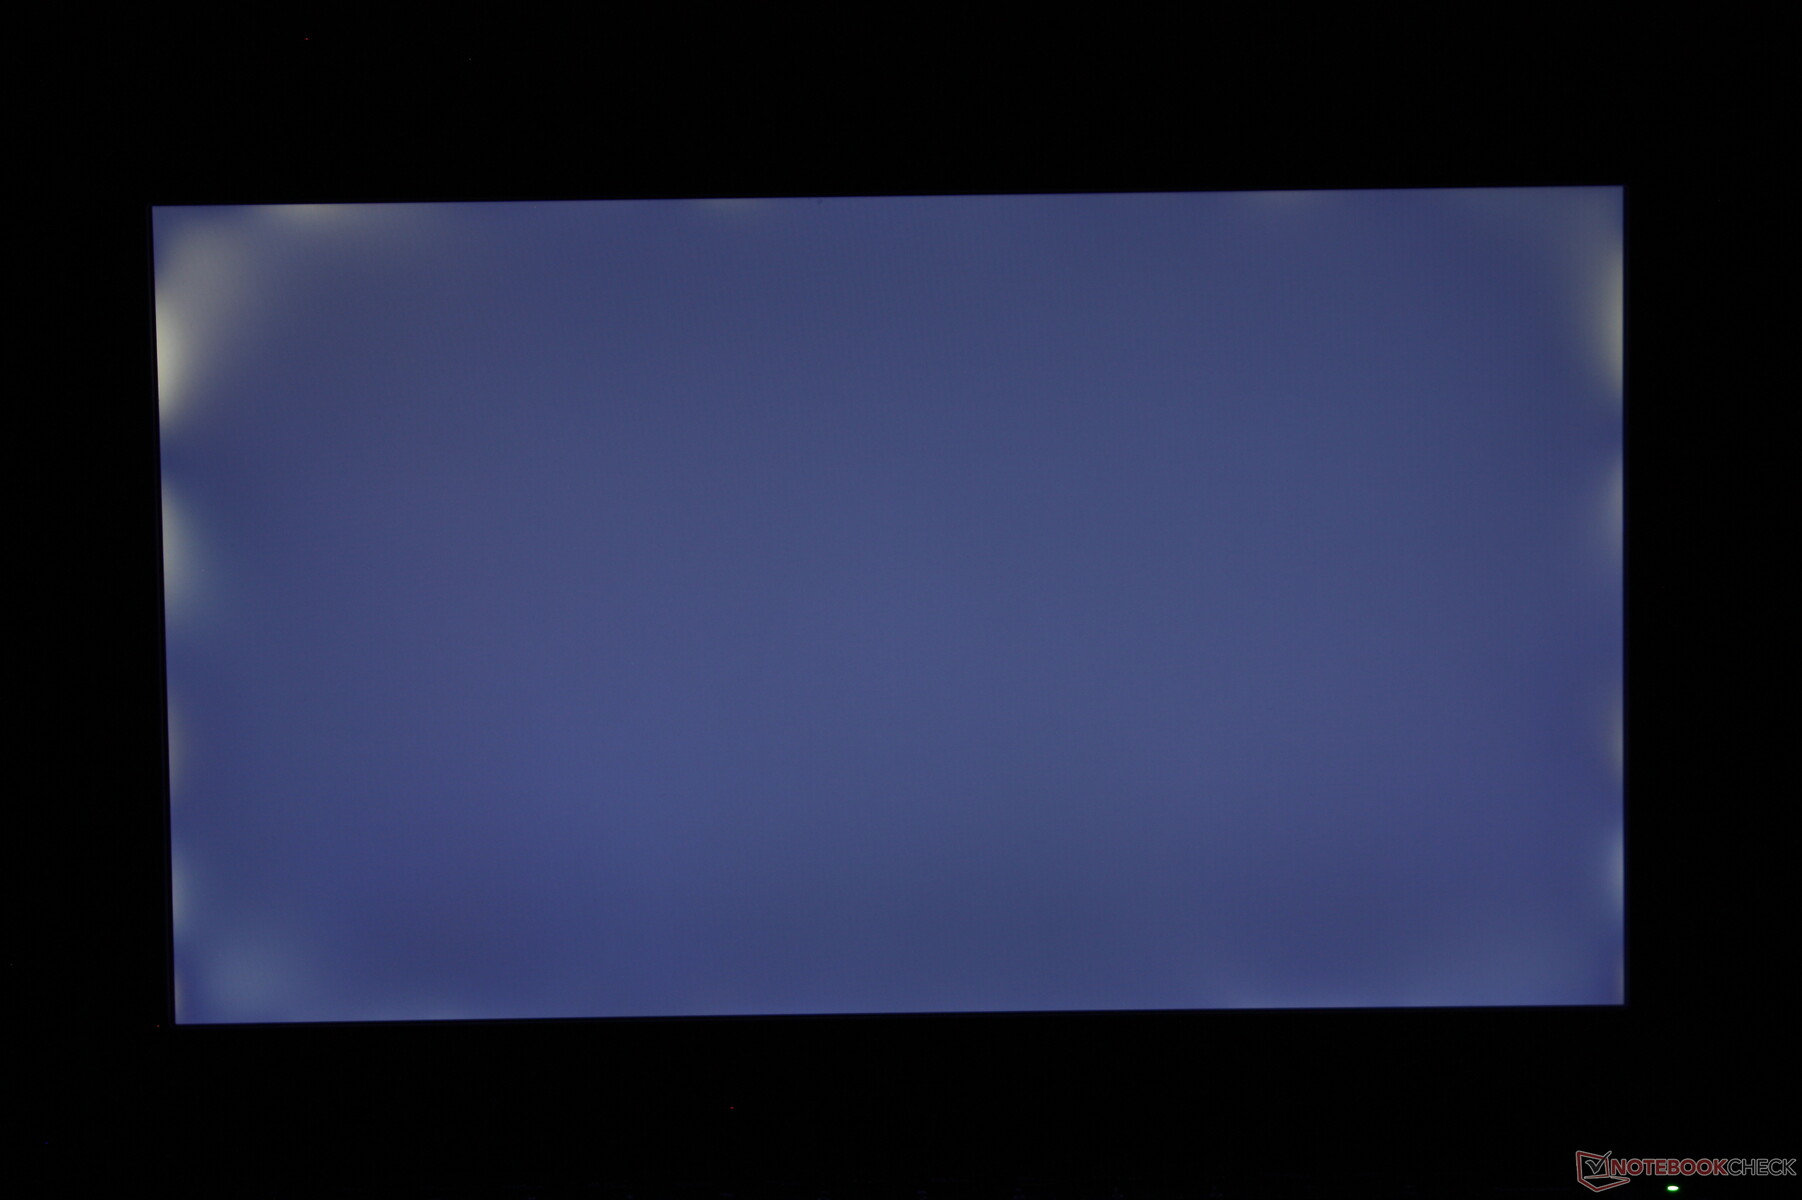
Distribuzione della luminosità: 84 %
Al centro con la batteria: 1414.1 cd/m²
Contrasto: 1704:1 (Nero: 0.83 cd/m²)
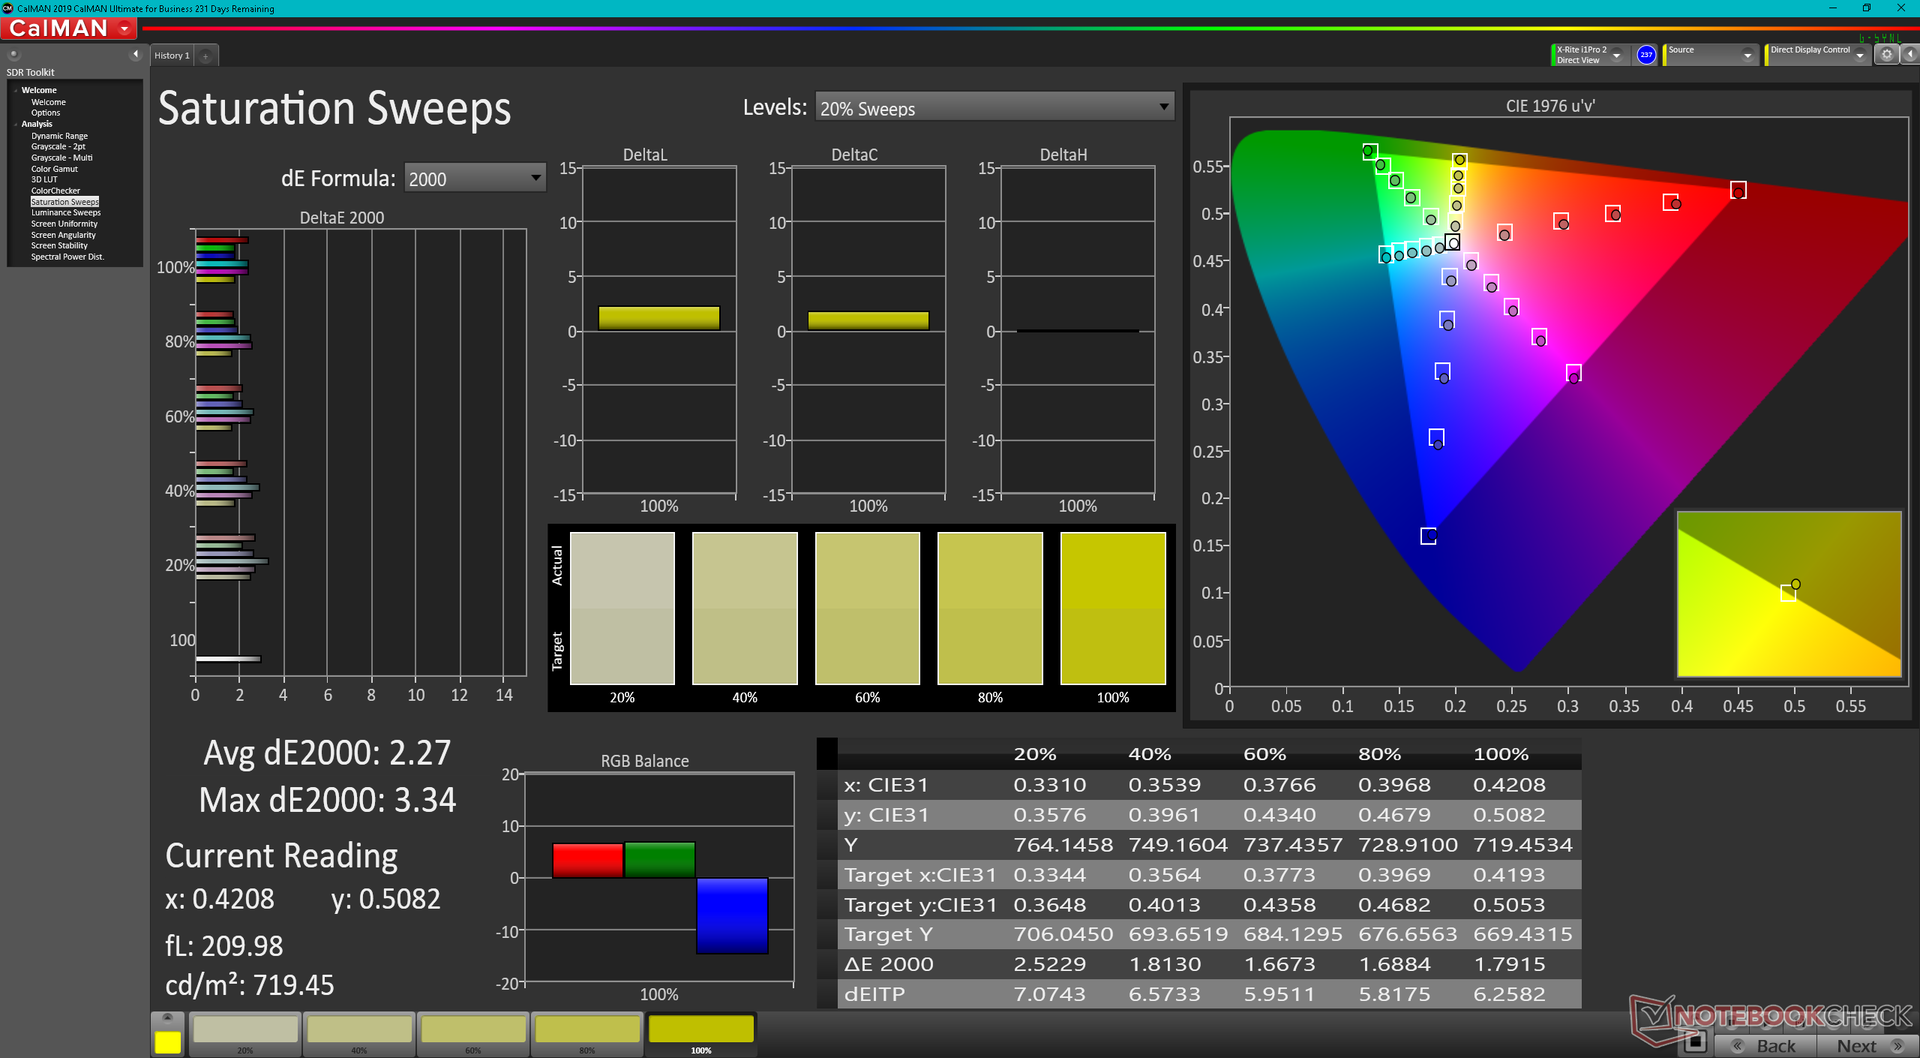
ΔE ColorChecker Calman: 1.99 | ∀{0.5-29.43 Ø4.71}
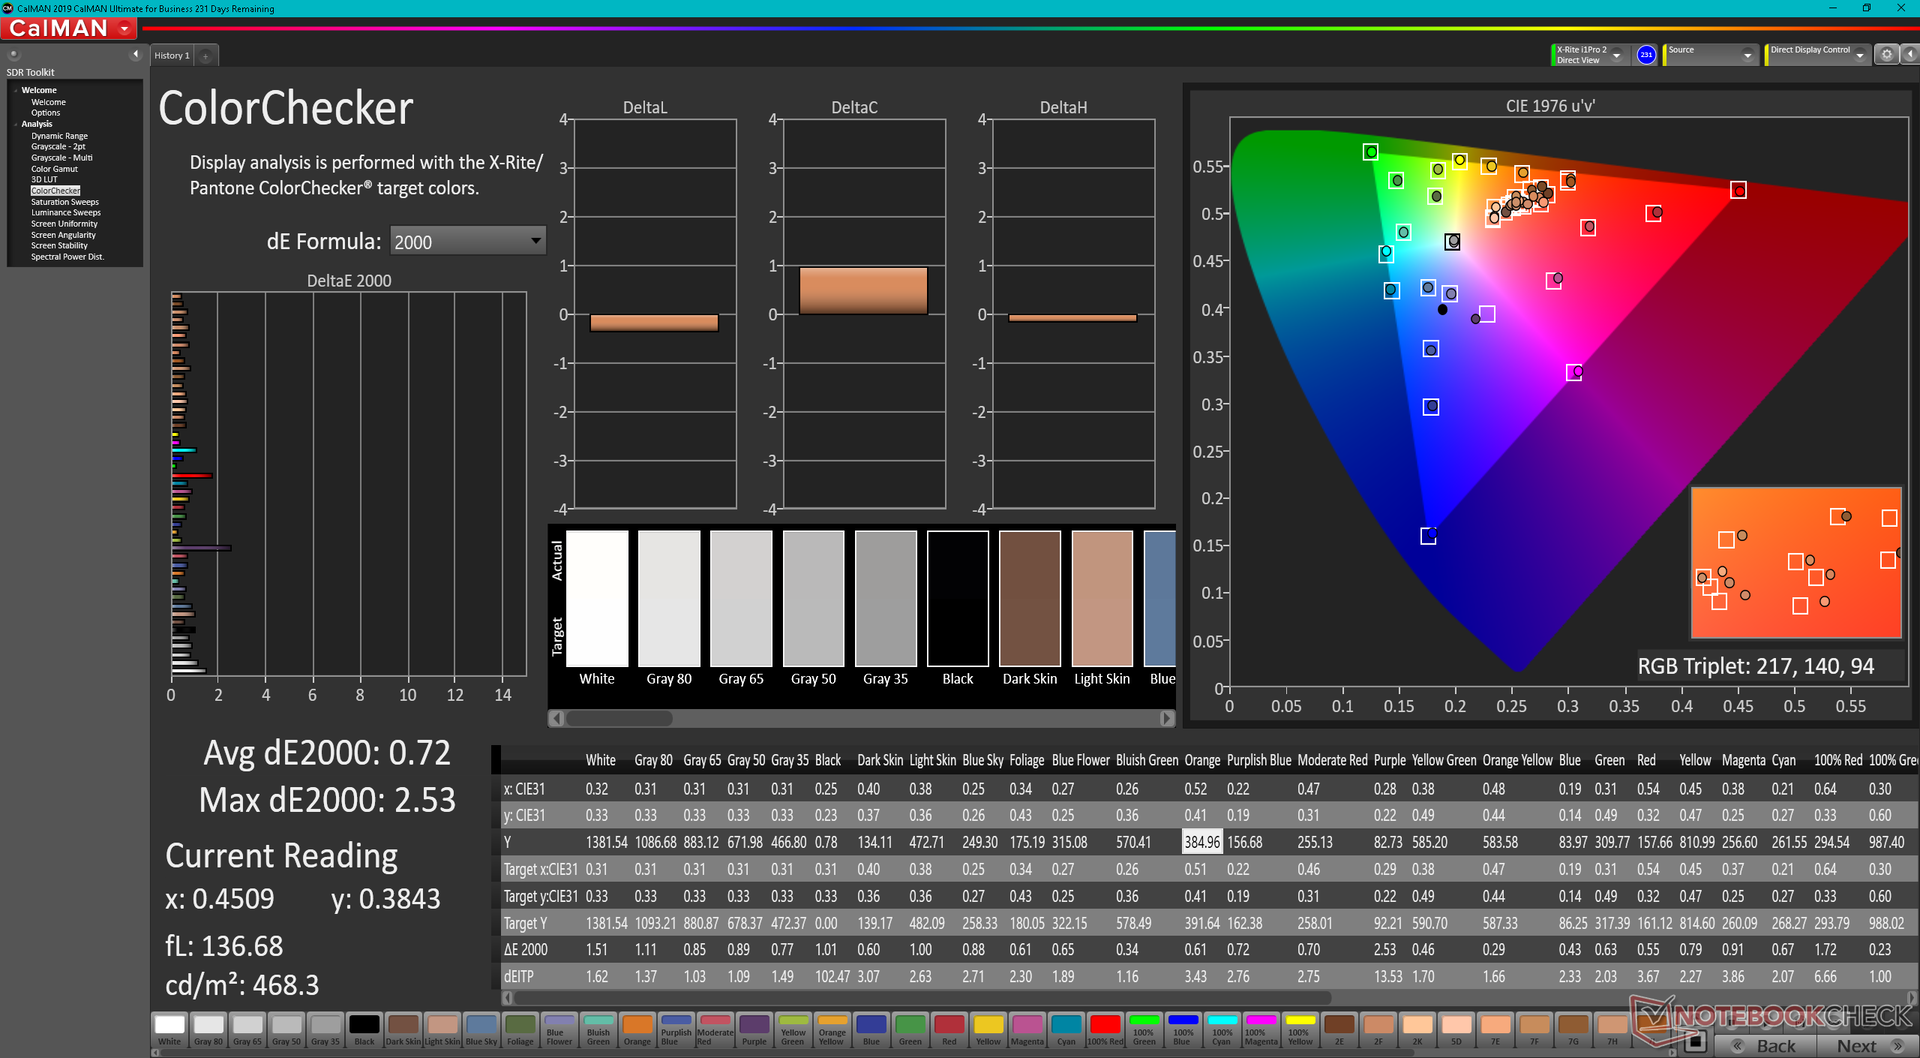
calibrated: 0.72
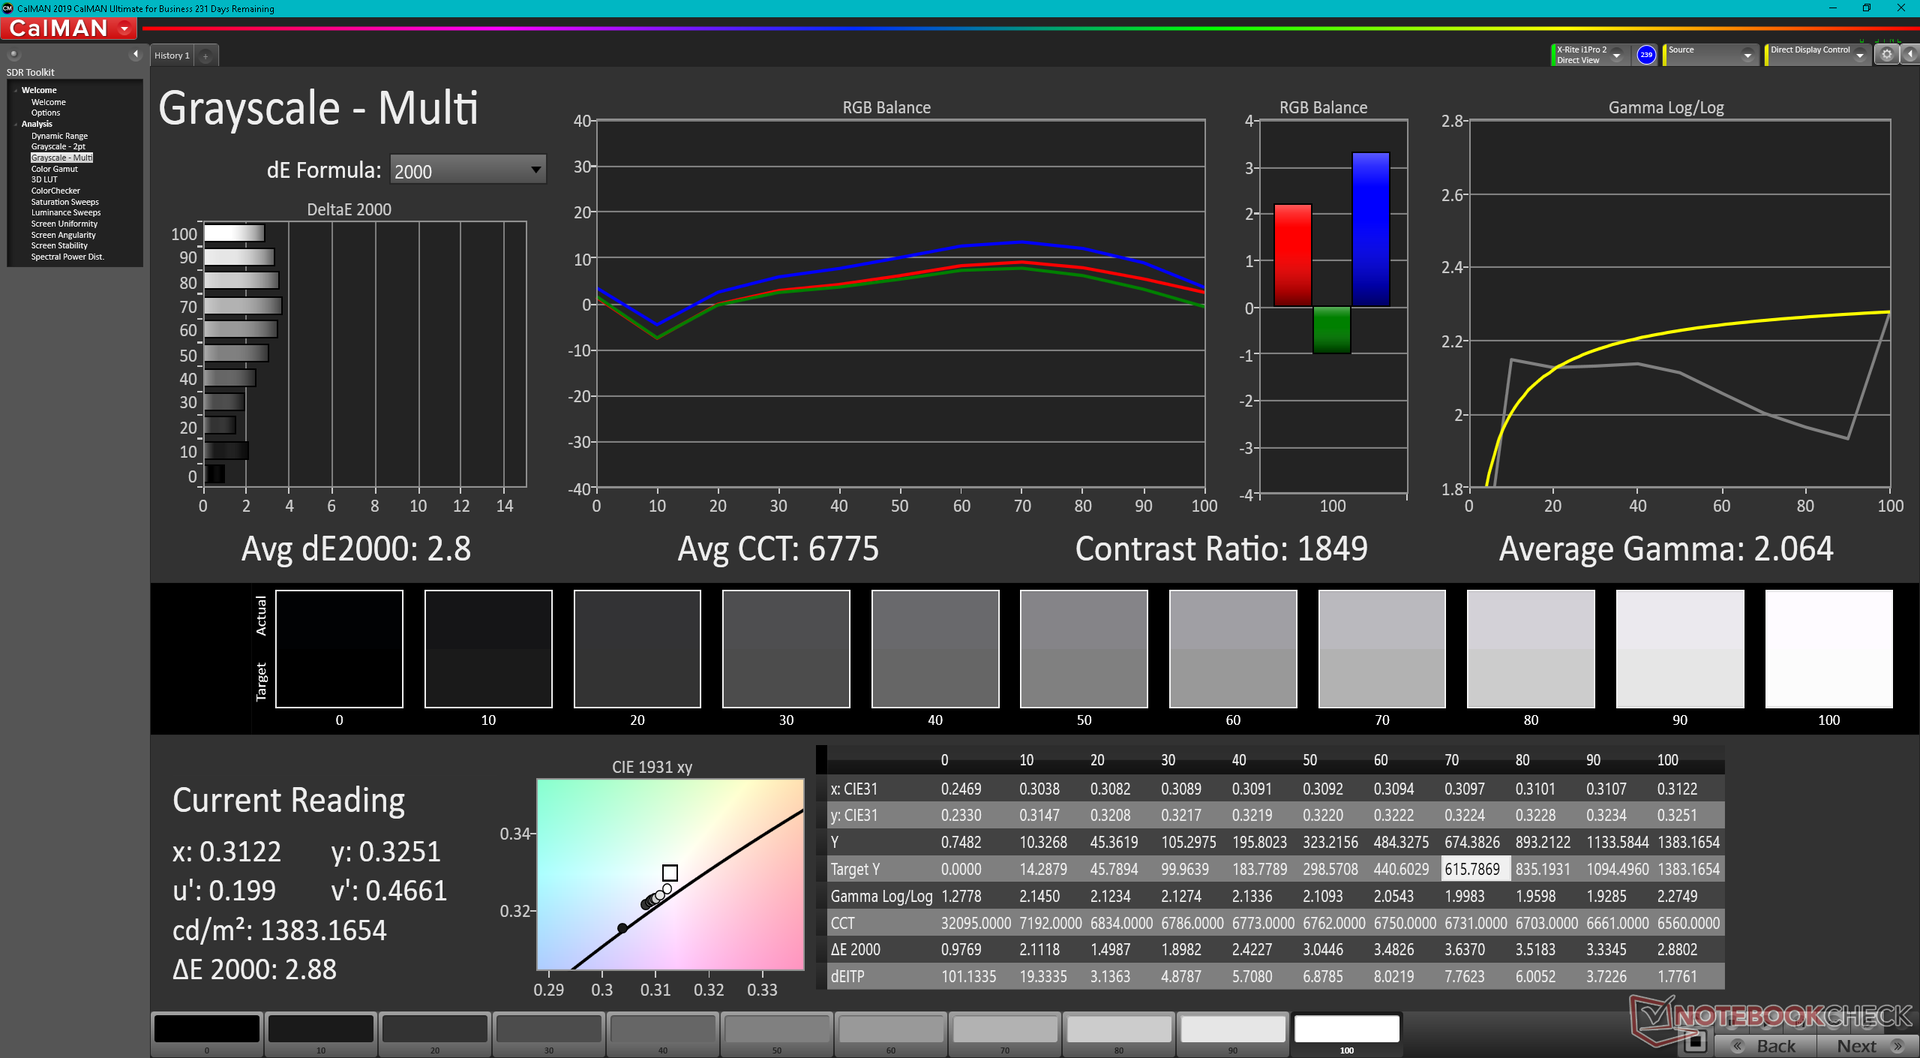
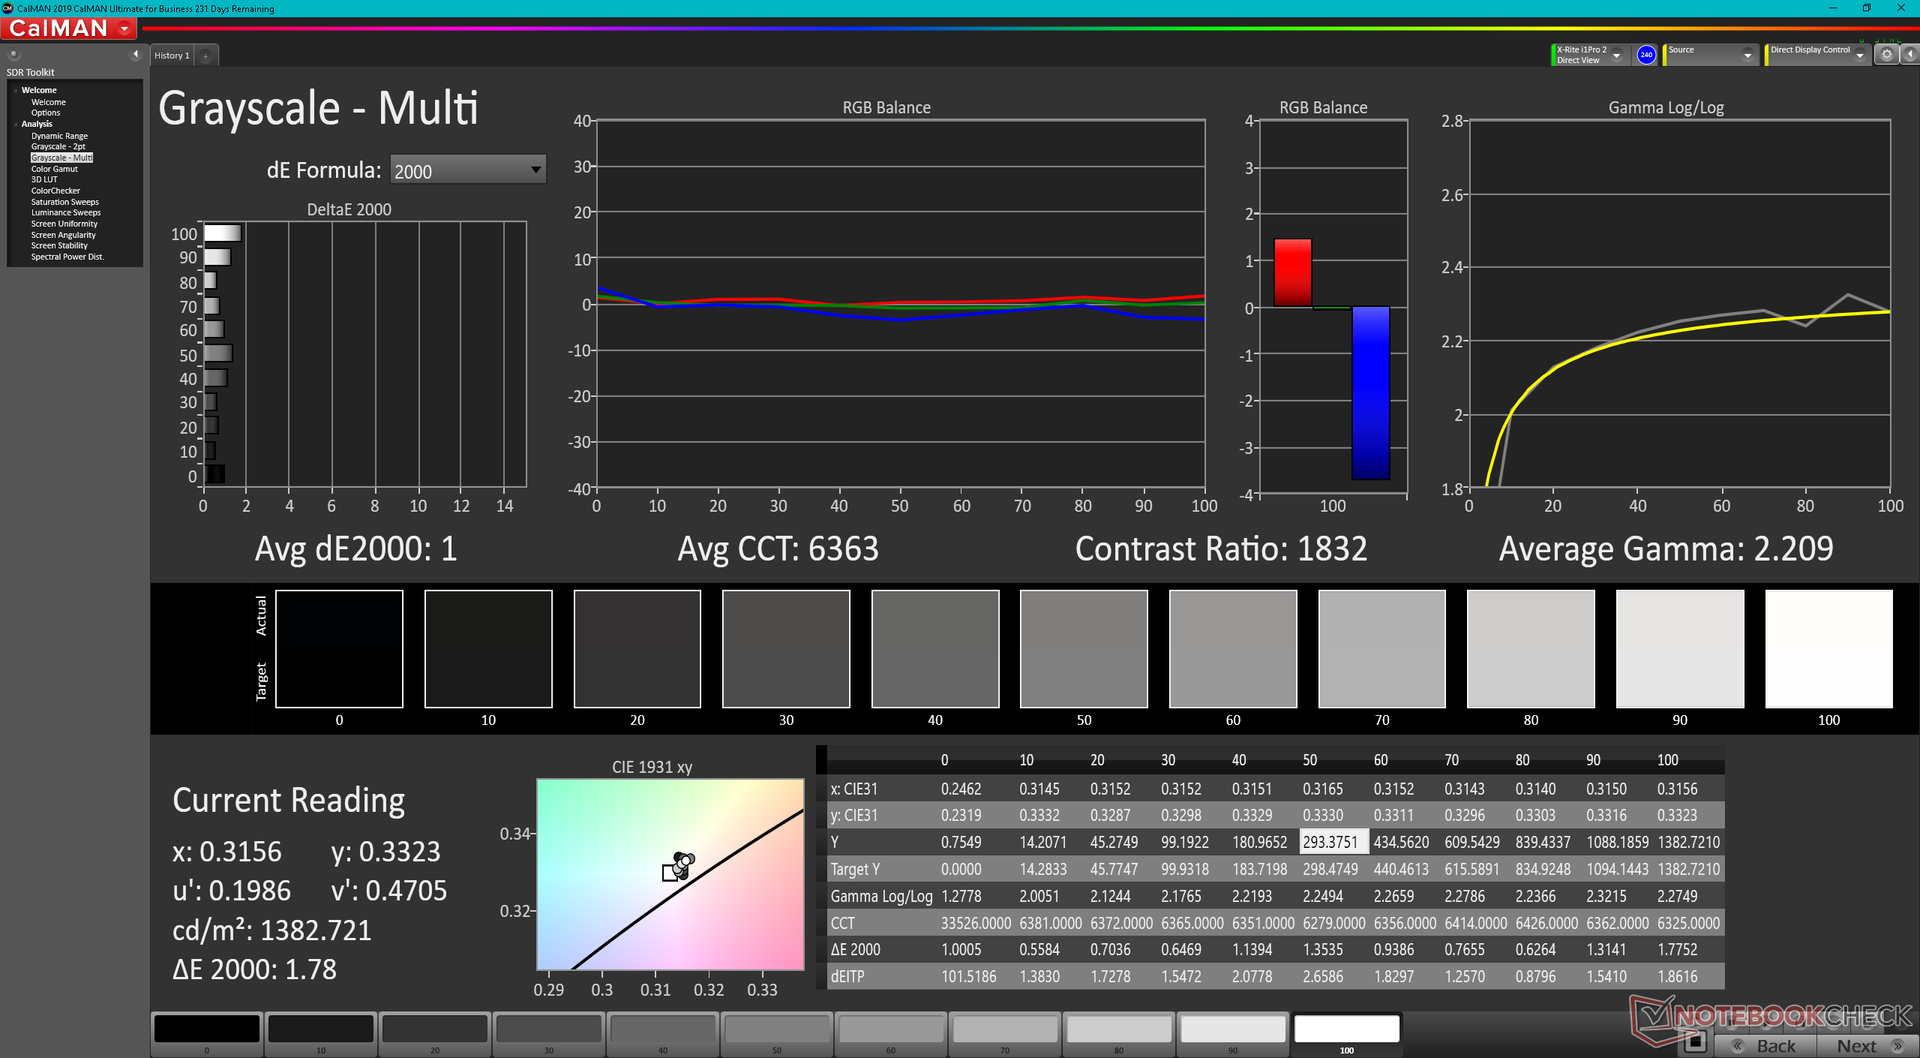
ΔE Greyscale Calman: 2.8 | ∀{0.09-98 Ø4.96}
69% AdobeRGB 1998 (Argyll 3D)
98.2% sRGB (Argyll 3D)
67.1% Display P3 (Argyll 3D)
Gamma: 2.06
CCT: 6775 K
| Dell Latitude 7330 Rugged Extreme Sharp LQ133M1, IPS, 1920x1080, 13.3" | Dell Latitude 7424 Rugged Extreme AU Optronics AUO523D, IPS, 1920x1080, 14" | Dell Latitude 5420 Rugged-P85G AU Optronics AUO523D, IPS, 1920x1080, 14" | Acer Enduro Urban N3 EUN314 XR140EA6T, IPS, 1920x1080, 14" | Panasonic Toughbook FZ-55 MK2 InfoVision M140NWF5 R3, IPS, 1920x1080, 14" | Durabook S14I KD140N0730A01, TN, 1920x1080, 14" | |
|---|---|---|---|---|---|---|
| Display | -2% | -7% | -5% | -48% | -34% | |
| Display P3 Coverage (%) | 67.1 | 65.3 -3% | 62.5 -7% | 63.5 -5% | 34.8 -48% | 43.55 -35% |
| sRGB Coverage (%) | 98.2 | 96.9 -1% | 92.4 -6% | 91.9 -6% | 52.2 -47% | 65.4 -33% |
| AdobeRGB 1998 Coverage (%) | 69 | 67.3 -2% | 64.2 -7% | 65.5 -5% | 36 -48% | 45 -35% |
| Response Times | 11% | 15% | 21% | 46% | 66% | |
| Response Time Grey 50% / Grey 80% * (ms) | 74.4 ? | 62.8 ? 16% | 68 ? 9% | 56 ? 25% | 28.4 ? 62% | 30.4 ? 59% |
| Response Time Black / White * (ms) | 42.4 ? | 40 ? 6% | 33.6 ? 21% | 35.2 ? 17% | 30 ? 29% | 11.8 ? 72% |
| PWM Frequency (Hz) | 763 | 735 ? | 1000 ? | 685 ? | 304.9 ? | |
| Screen | -71% | -75% | -97% | -99% | -232% | |
| Brightness middle (cd/m²) | 1414.1 | 844 -40% | 1111.7 -21% | 487.8 -66% | 1061.1 -25% | 1180.7 -17% |
| Brightness (cd/m²) | 1282 | 793 -38% | 1026 -20% | 464 -64% | 997 -22% | 1102 -14% |
| Brightness Distribution (%) | 84 | 88 5% | 80 -5% | 89 6% | 76 -10% | 89 6% |
| Black Level * (cd/m²) | 0.83 | 0.54 35% | 0.81 2% | 0.48 42% | 0.7 16% | 1.91 -130% |
| Contrast (:1) | 1704 | 1563 -8% | 1372 -19% | 1016 -40% | 1516 -11% | 618 -64% |
| Colorchecker dE 2000 * | 1.99 | 4.8 -141% | 3.83 -92% | 6.51 -227% | 4.64 -133% | 13.45 -576% |
| Colorchecker dE 2000 max. * | 3.75 | 11.88 -217% | 7.85 -109% | 11.36 -203% | 20.92 -458% | 22.52 -501% |
| Colorchecker dE 2000 calibrated * | 0.72 | 1.15 -60% | 2.98 -314% | 1.77 -146% | 2.52 -250% | 3.19 -343% |
| Greyscale dE 2000 * | 2.8 | 7.6 -171% | 5.6 -100% | 7.8 -179% | 2.8 -0% | 15.4 -450% |
| Gamma | 2.06 107% | 2.334 94% | 2.306 95% | 2.28 96% | 2.08 106% | 1.97 112% |
| CCT | 6775 96% | 6546 99% | 7676 85% | 8102 80% | 6364 102% | 21134 31% |
| Color Space (Percent of AdobeRGB 1998) (%) | 62 | 59 | 41.6 | |||
| Color Space (Percent of sRGB) (%) | 97 | 93 | 65.5 | |||
| Media totale (Programma / Settaggio) | -21% /
-44% | -22% /
-48% | -27% /
-61% | -34% /
-68% | -67% /
-147% |
* ... Meglio usare valori piccoli
Il pannello è già ben calibrato fuori dalla scatola e quindi la calibrazione dell'utente finale non è così necessaria. Calibrare il pannello da soli, comunque, diminuirebbe ancora di più i valori DeltaE medi della scala di grigi e del colore da 2,8 e 1,99 a solo 1,0 e 0,72, rispettivamente.
Tempi di risposta del Display
| ↔ Tempi di risposta dal Nero al Bianco | ||
|---|---|---|
| 42.4 ms ... aumenta ↗ e diminuisce ↘ combinato | ↗ 20.4 ms Incremento | 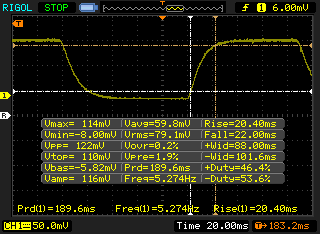 |
| ↘ 22 ms Calo | ||
| Lo schermo mostra tempi di risposta lenti nei nostri tests e sarà insoddisfacente per i gamers. In confronto, tutti i dispositivi di test variano da 0.1 (minimo) a 240 (massimo) ms. » 98 % di tutti i dispositivi è migliore. Questo significa che i tempi di risposta rilevati sono peggiori rispetto alla media di tutti i dispositivi testati (19.8 ms). | ||
| ↔ Tempo di risposta dal 50% Grigio all'80% Grigio | ||
| 74.4 ms ... aumenta ↗ e diminuisce ↘ combinato | ↗ 37.6 ms Incremento | 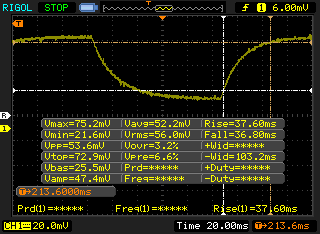 |
| ↘ 36.8 ms Calo | ||
| Lo schermo mostra tempi di risposta lenti nei nostri tests e sarà insoddisfacente per i gamers. In confronto, tutti i dispositivi di test variano da 0.165 (minimo) a 636 (massimo) ms. » 99 % di tutti i dispositivi è migliore. Questo significa che i tempi di risposta rilevati sono peggiori rispetto alla media di tutti i dispositivi testati (30.9 ms). | ||
Sfarfallio dello schermo / PWM (Pulse-Width Modulation)
| flickering dello schermo / PWM non rilevato | 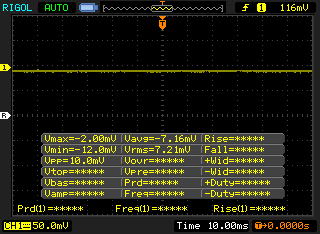 | ||
In confronto: 52 % di tutti i dispositivi testati non utilizza PWM per ridurre la luminosita' del display. Se è rilevato PWM, una media di 7741 (minimo: 5 - massimo: 343500) Hz è stata rilevata. | |||
Performance
Condizioni di test
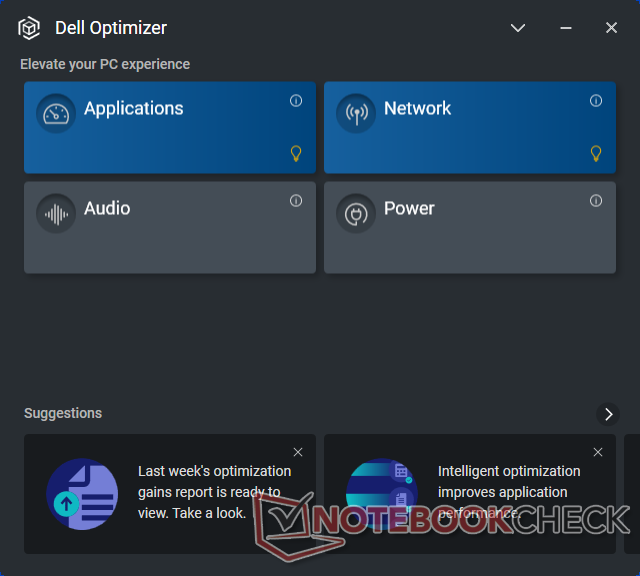
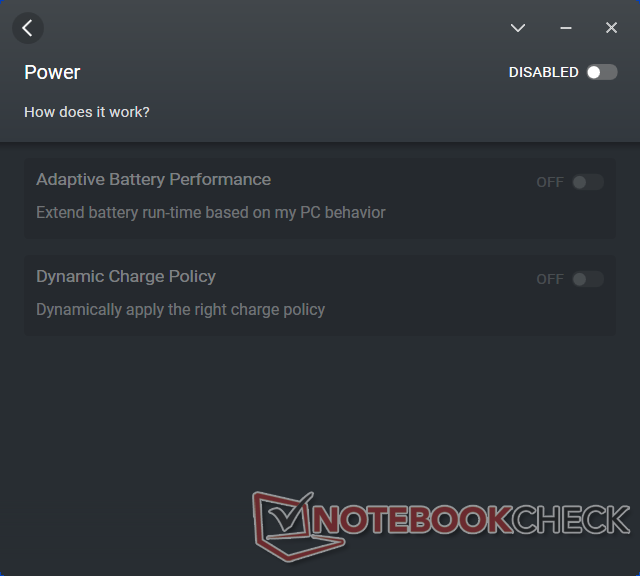
La nostra unità è stata impostata in modalità Performance e Ultra Performance tramite Windows e Dell Power Manager, rispettivamente, prima di eseguire qualsiasi benchmark qui sotto. Raccomandiamo vivamente agli utenti di familiarizzare con le applicazioni preinstallate Power Manager e Optimizer poiché alcune caratteristiche del portatile possono essere attivate solo attraverso questi software.

Processore
Le prestazioni grezze della CPU sono eccellenti con risultati che sono entro pochi punti percentuali della media Core i7-1185G7 nel nostro database. Anche la sostenibilità delle prestazioni è buona, dato che i punteggi non calano nel tempo quando si esegue CineBench R15 xT in un ciclo
Tenete a mente che il Core i7-1185G7 ha prestazioni simili al meno costoso Core i7-1165G7. Se vPro non è importante, allora il Core i7-1165G7 può fornire essenzialmente la stessa esperienza.
Cinebench R15 Multi Loop
Cinebench R20: CPU (Multi Core) | CPU (Single Core)
Cinebench R23: Multi Core | Single Core
Blender: v2.79 BMW27 CPU
7-Zip 18.03: 7z b 4 | 7z b 4 -mmt1
Geekbench 5.5: Multi-Core | Single-Core
HWBOT x265 Benchmark v2.2: 4k Preset
LibreOffice : 20 Documents To PDF
R Benchmark 2.5: Overall mean
| Cinebench R15 / CPU Single 64Bit | |
| Dell Latitude 7330 Rugged Extreme | |
| Panasonic Toughbook FZ-55 MK2 | |
| Media Intel Core i7-1185G7 (168 - 230, n=27) | |
| Acer Enduro Urban N3 EUN314 | |
| Durabook S14I | |
| Lenovo ThinkPad P15s Gen1-20T4000JGE | |
| Getac B360 | |
| Fujitsu LifeBook U7310 | |
| Dell Latitude 5420 Rugged-P85G | |
| Dell Latitude 7424 Rugged Extreme | |
| Cinebench R20 / CPU (Multi Core) | |
| Dell Latitude 7330 Rugged Extreme | |
| Panasonic Toughbook FZ-55 MK2 | |
| Media Intel Core i7-1185G7 (1425 - 2493, n=28) | |
| Acer Enduro Urban N3 EUN314 | |
| Lenovo ThinkPad P15s Gen1-20T4000JGE | |
| Getac B360 | |
| Durabook S14I | |
| Fujitsu LifeBook U7310 | |
| Cinebench R20 / CPU (Single Core) | |
| Dell Latitude 7330 Rugged Extreme | |
| Media Intel Core i7-1185G7 (489 - 593, n=28) | |
| Acer Enduro Urban N3 EUN314 | |
| Panasonic Toughbook FZ-55 MK2 | |
| Durabook S14I | |
| Lenovo ThinkPad P15s Gen1-20T4000JGE | |
| Getac B360 | |
| Fujitsu LifeBook U7310 | |
| Cinebench R23 / Multi Core | |
| Dell Latitude 7330 Rugged Extreme | |
| Media Intel Core i7-1185G7 (3610 - 6383, n=24) | |
| Panasonic Toughbook FZ-55 MK2 | |
| Acer Enduro Urban N3 EUN314 | |
| Getac B360 | |
| Durabook S14I | |
| Cinebench R23 / Single Core | |
| Dell Latitude 7330 Rugged Extreme | |
| Media Intel Core i7-1185G7 (1251 - 1532, n=24) | |
| Panasonic Toughbook FZ-55 MK2 | |
| Acer Enduro Urban N3 EUN314 | |
| Durabook S14I | |
| Getac B360 | |
| Blender / v2.79 BMW27 CPU | |
| Fujitsu LifeBook U7310 | |
| Durabook S14I | |
| Lenovo ThinkPad P15s Gen1-20T4000JGE | |
| Getac B360 | |
| Media Intel Core i7-1185G7 (478 - 745, n=28) | |
| Panasonic Toughbook FZ-55 MK2 | |
| Acer Enduro Urban N3 EUN314 | |
| Dell Latitude 7330 Rugged Extreme | |
| 7-Zip 18.03 / 7z b 4 | |
| Acer Enduro Urban N3 EUN314 | |
| Dell Latitude 7330 Rugged Extreme | |
| Panasonic Toughbook FZ-55 MK2 | |
| Media Intel Core i7-1185G7 (18812 - 27693, n=27) | |
| Getac B360 | |
| Lenovo ThinkPad P15s Gen1-20T4000JGE | |
| Durabook S14I | |
| Fujitsu LifeBook U7310 | |
| 7-Zip 18.03 / 7z b 4 -mmt1 | |
| Dell Latitude 7330 Rugged Extreme | |
| Acer Enduro Urban N3 EUN314 | |
| Panasonic Toughbook FZ-55 MK2 | |
| Durabook S14I | |
| Media Intel Core i7-1185G7 (3678 - 5507, n=27) | |
| Lenovo ThinkPad P15s Gen1-20T4000JGE | |
| Getac B360 | |
| Fujitsu LifeBook U7310 | |
| Geekbench 5.5 / Multi-Core | |
| Dell Latitude 7330 Rugged Extreme | |
| Media Intel Core i7-1185G7 (4620 - 5944, n=21) | |
| Acer Enduro Urban N3 EUN314 | |
| Getac B360 | |
| Lenovo ThinkPad P15s Gen1-20T4000JGE | |
| Durabook S14I | |
| Fujitsu LifeBook U7310 | |
| Geekbench 5.5 / Single-Core | |
| Dell Latitude 7330 Rugged Extreme | |
| Acer Enduro Urban N3 EUN314 | |
| Media Intel Core i7-1185G7 (1398 - 1626, n=21) | |
| Durabook S14I | |
| Getac B360 | |
| Lenovo ThinkPad P15s Gen1-20T4000JGE | |
| Fujitsu LifeBook U7310 | |
| HWBOT x265 Benchmark v2.2 / 4k Preset | |
| Dell Latitude 7330 Rugged Extreme | |
| Panasonic Toughbook FZ-55 MK2 | |
| Acer Enduro Urban N3 EUN314 | |
| Media Intel Core i7-1185G7 (5.02 - 8.13, n=27) | |
| Getac B360 | |
| Lenovo ThinkPad P15s Gen1-20T4000JGE | |
| Durabook S14I | |
| Fujitsu LifeBook U7310 | |
| LibreOffice / 20 Documents To PDF | |
| Lenovo ThinkPad P15s Gen1-20T4000JGE | |
| Acer Enduro Urban N3 EUN314 | |
| Fujitsu LifeBook U7310 | |
| Media Intel Core i7-1185G7 (41.3 - 61.7, n=26) | |
| Dell Latitude 7330 Rugged Extreme | |
| Panasonic Toughbook FZ-55 MK2 | |
| Durabook S14I | |
| R Benchmark 2.5 / Overall mean | |
| Fujitsu LifeBook U7310 | |
| Getac B360 | |
| Lenovo ThinkPad P15s Gen1-20T4000JGE | |
| Durabook S14I | |
| Media Intel Core i7-1185G7 (0.55 - 0.615, n=27) | |
| Acer Enduro Urban N3 EUN314 | |
| Panasonic Toughbook FZ-55 MK2 | |
| Dell Latitude 7330 Rugged Extreme | |
* ... Meglio usare valori piccoli
AIDA64: FP32 Ray-Trace | FPU Julia | CPU SHA3 | CPU Queen | FPU SinJulia | FPU Mandel | CPU AES | CPU ZLib | FP64 Ray-Trace | CPU PhotoWorxx
| Performance rating | |
| Dell Latitude 7330 Rugged Extreme | |
| Acer Enduro Urban N3 EUN314 | |
| Media Intel Core i7-1185G7 | |
| Panasonic Toughbook FZ-55 MK2 | |
| Durabook S14I | |
| AIDA64 / FP32 Ray-Trace | |
| Dell Latitude 7330 Rugged Extreme | |
| Acer Enduro Urban N3 EUN314 | |
| Media Intel Core i7-1185G7 (5621 - 7453, n=20) | |
| Panasonic Toughbook FZ-55 MK2 | |
| Durabook S14I | |
| AIDA64 / FPU Julia | |
| Dell Latitude 7330 Rugged Extreme | |
| Acer Enduro Urban N3 EUN314 | |
| Panasonic Toughbook FZ-55 MK2 | |
| Media Intel Core i7-1185G7 (23248 - 32614, n=20) | |
| Durabook S14I | |
| AIDA64 / CPU SHA3 | |
| Dell Latitude 7330 Rugged Extreme | |
| Acer Enduro Urban N3 EUN314 | |
| Media Intel Core i7-1185G7 (1530 - 2209, n=20) | |
| Panasonic Toughbook FZ-55 MK2 | |
| Durabook S14I | |
| AIDA64 / CPU Queen | |
| Dell Latitude 7330 Rugged Extreme | |
| Acer Enduro Urban N3 EUN314 | |
| Durabook S14I | |
| Panasonic Toughbook FZ-55 MK2 | |
| Media Intel Core i7-1185G7 (44677 - 52815, n=20) | |
| AIDA64 / FPU SinJulia | |
| Dell Latitude 7330 Rugged Extreme | |
| Acer Enduro Urban N3 EUN314 | |
| Panasonic Toughbook FZ-55 MK2 | |
| Media Intel Core i7-1185G7 (3870 - 5027, n=20) | |
| Durabook S14I | |
| AIDA64 / FPU Mandel | |
| Dell Latitude 7330 Rugged Extreme | |
| Acer Enduro Urban N3 EUN314 | |
| Panasonic Toughbook FZ-55 MK2 | |
| Media Intel Core i7-1185G7 (14584 - 19594, n=20) | |
| Durabook S14I | |
| AIDA64 / CPU AES | |
| Dell Latitude 7330 Rugged Extreme | |
| Acer Enduro Urban N3 EUN314 | |
| Durabook S14I | |
| Media Intel Core i7-1185G7 (33002 - 76826, n=20) | |
| Panasonic Toughbook FZ-55 MK2 | |
| AIDA64 / CPU ZLib | |
| Dell Latitude 7330 Rugged Extreme | |
| Acer Enduro Urban N3 EUN314 | |
| Media Intel Core i7-1185G7 (258 - 412, n=22) | |
| Panasonic Toughbook FZ-55 MK2 | |
| Durabook S14I | |
| AIDA64 / FP64 Ray-Trace | |
| Dell Latitude 7330 Rugged Extreme | |
| Acer Enduro Urban N3 EUN314 | |
| Panasonic Toughbook FZ-55 MK2 | |
| Media Intel Core i7-1185G7 (2821 - 4094, n=20) | |
| Durabook S14I | |
| AIDA64 / CPU PhotoWorxx | |
| Dell Latitude 7330 Rugged Extreme | |
| Media Intel Core i7-1185G7 (22349 - 43701, n=20) | |
| Acer Enduro Urban N3 EUN314 | |
| Panasonic Toughbook FZ-55 MK2 | |
| Durabook S14I | |
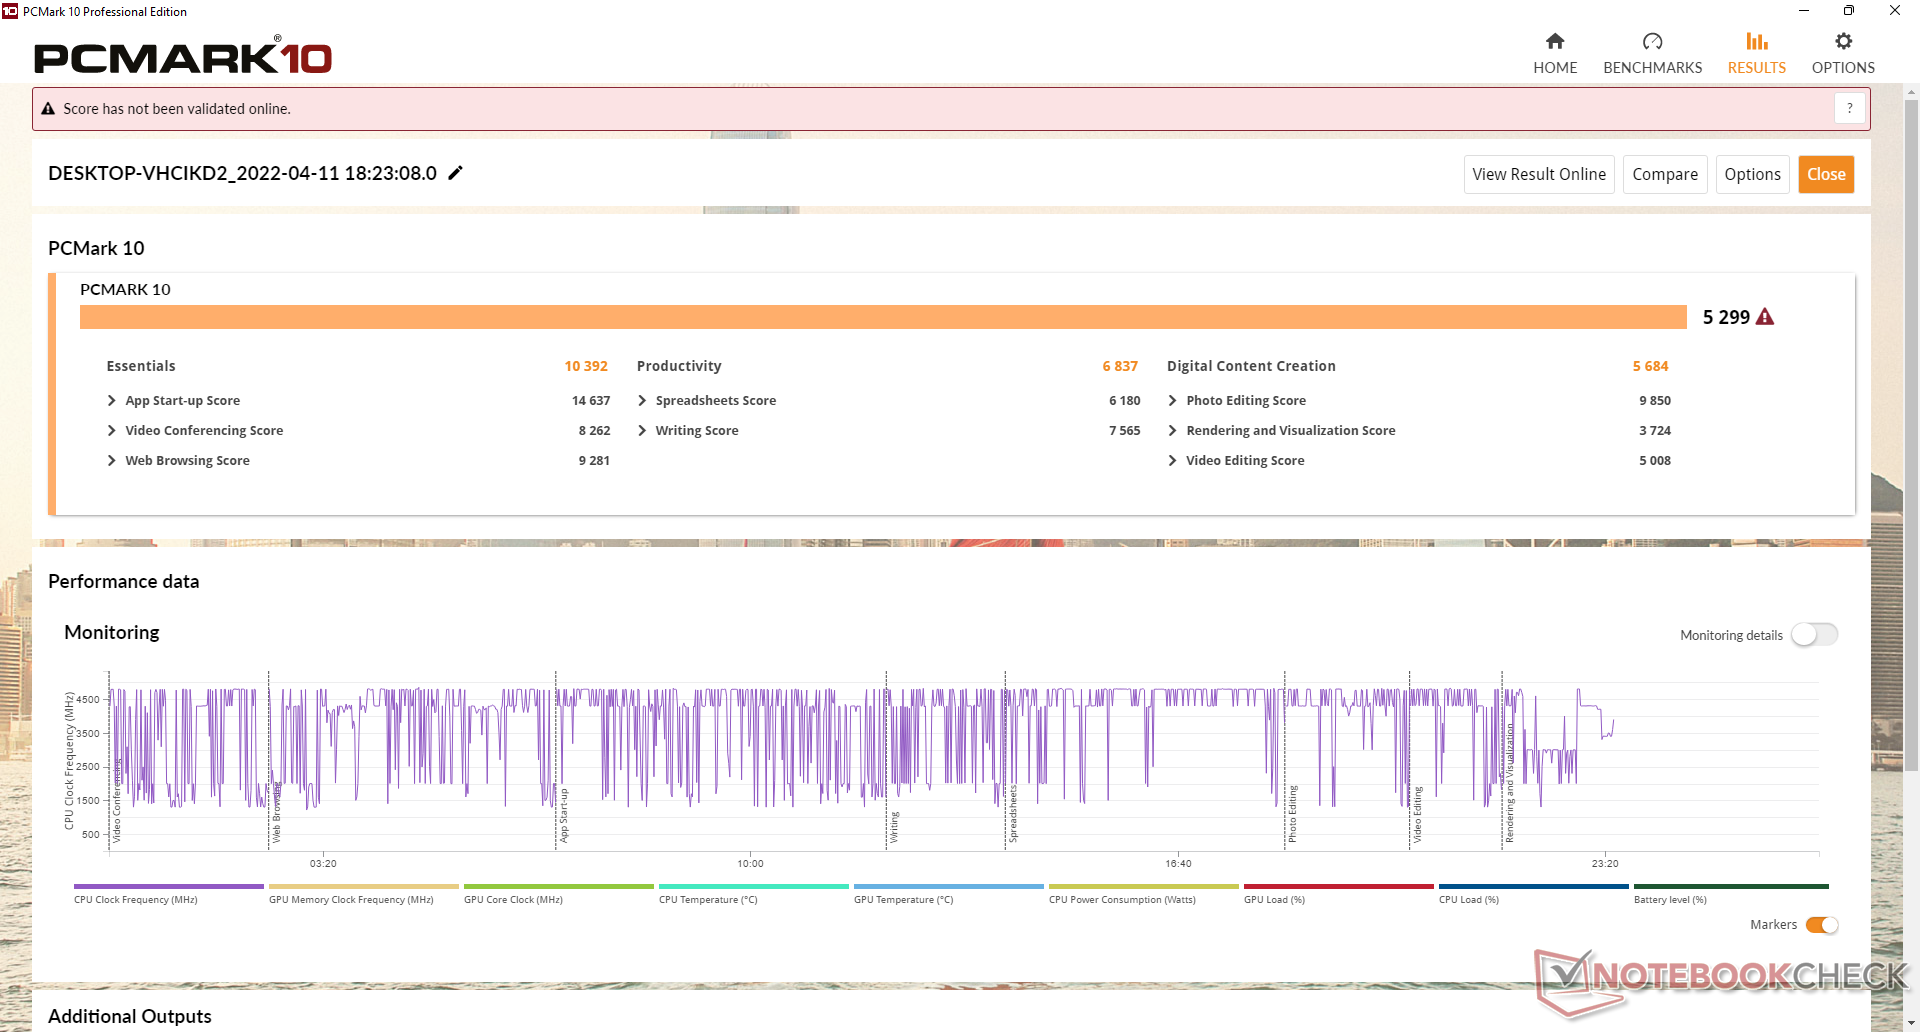
Prestazioni del sistema
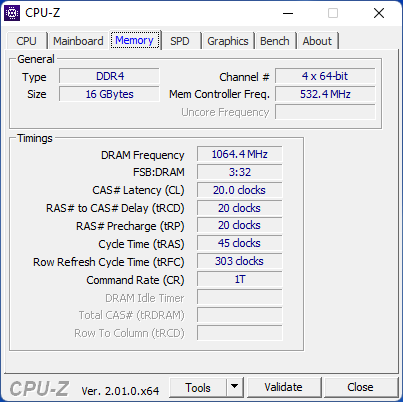
I risultati di PCMark sono costantemente superiori a quelli del Panasonic Toughbook FZ-55 MK2 che ha lo stesso processore della nostra unità Dell. Si raccomanda di configurare con RAM dual-channel se possibile, altrimenti le prestazioni grafiche ne risentiranno.
| PCMark 10 / Score | |
| Dell Latitude 7330 Rugged Extreme | |
| Panasonic Toughbook FZ-55 MK2 | |
| Durabook S14I | |
| Acer Enduro Urban N3 EUN314 | |
| Dell Latitude 7424 Rugged Extreme | |
| Dell Latitude 5420 Rugged-P85G | |
| PCMark 10 / Essentials | |
| Dell Latitude 7330 Rugged Extreme | |
| Panasonic Toughbook FZ-55 MK2 | |
| Durabook S14I | |
| Acer Enduro Urban N3 EUN314 | |
| Dell Latitude 7424 Rugged Extreme | |
| Dell Latitude 5420 Rugged-P85G | |
| PCMark 10 / Productivity | |
| Dell Latitude 7424 Rugged Extreme | |
| Dell Latitude 5420 Rugged-P85G | |
| Durabook S14I | |
| Dell Latitude 7330 Rugged Extreme | |
| Panasonic Toughbook FZ-55 MK2 | |
| Acer Enduro Urban N3 EUN314 | |
| PCMark 10 Score | 5299 punti | |
Aiuto | ||
| AIDA64 / Memory Copy | |
| Dell Latitude 7330 Rugged Extreme | |
| Media Intel Core i7-1185G7 (36515 - 68450, n=20) | |
| Acer Enduro Urban N3 EUN314 | |
| Panasonic Toughbook FZ-55 MK2 | |
| Durabook S14I | |
| AIDA64 / Memory Read | |
| Dell Latitude 7330 Rugged Extreme | |
| Media Intel Core i7-1185G7 (38394 - 64291, n=20) | |
| Acer Enduro Urban N3 EUN314 | |
| Panasonic Toughbook FZ-55 MK2 | |
| Durabook S14I | |
| AIDA64 / Memory Write | |
| Dell Latitude 7330 Rugged Extreme | |
| Media Intel Core i7-1185G7 (37684 - 66873, n=20) | |
| Acer Enduro Urban N3 EUN314 | |
| Panasonic Toughbook FZ-55 MK2 | |
| Durabook S14I | |
| AIDA64 / Memory Latency | |
| Dell Latitude 7330 Rugged Extreme | |
| Media Intel Core i7-1185G7 (78.3 - 117, n=22) | |
| Acer Enduro Urban N3 EUN314 | |
| Panasonic Toughbook FZ-55 MK2 | |
| Durabook S14I | |
* ... Meglio usare valori piccoli
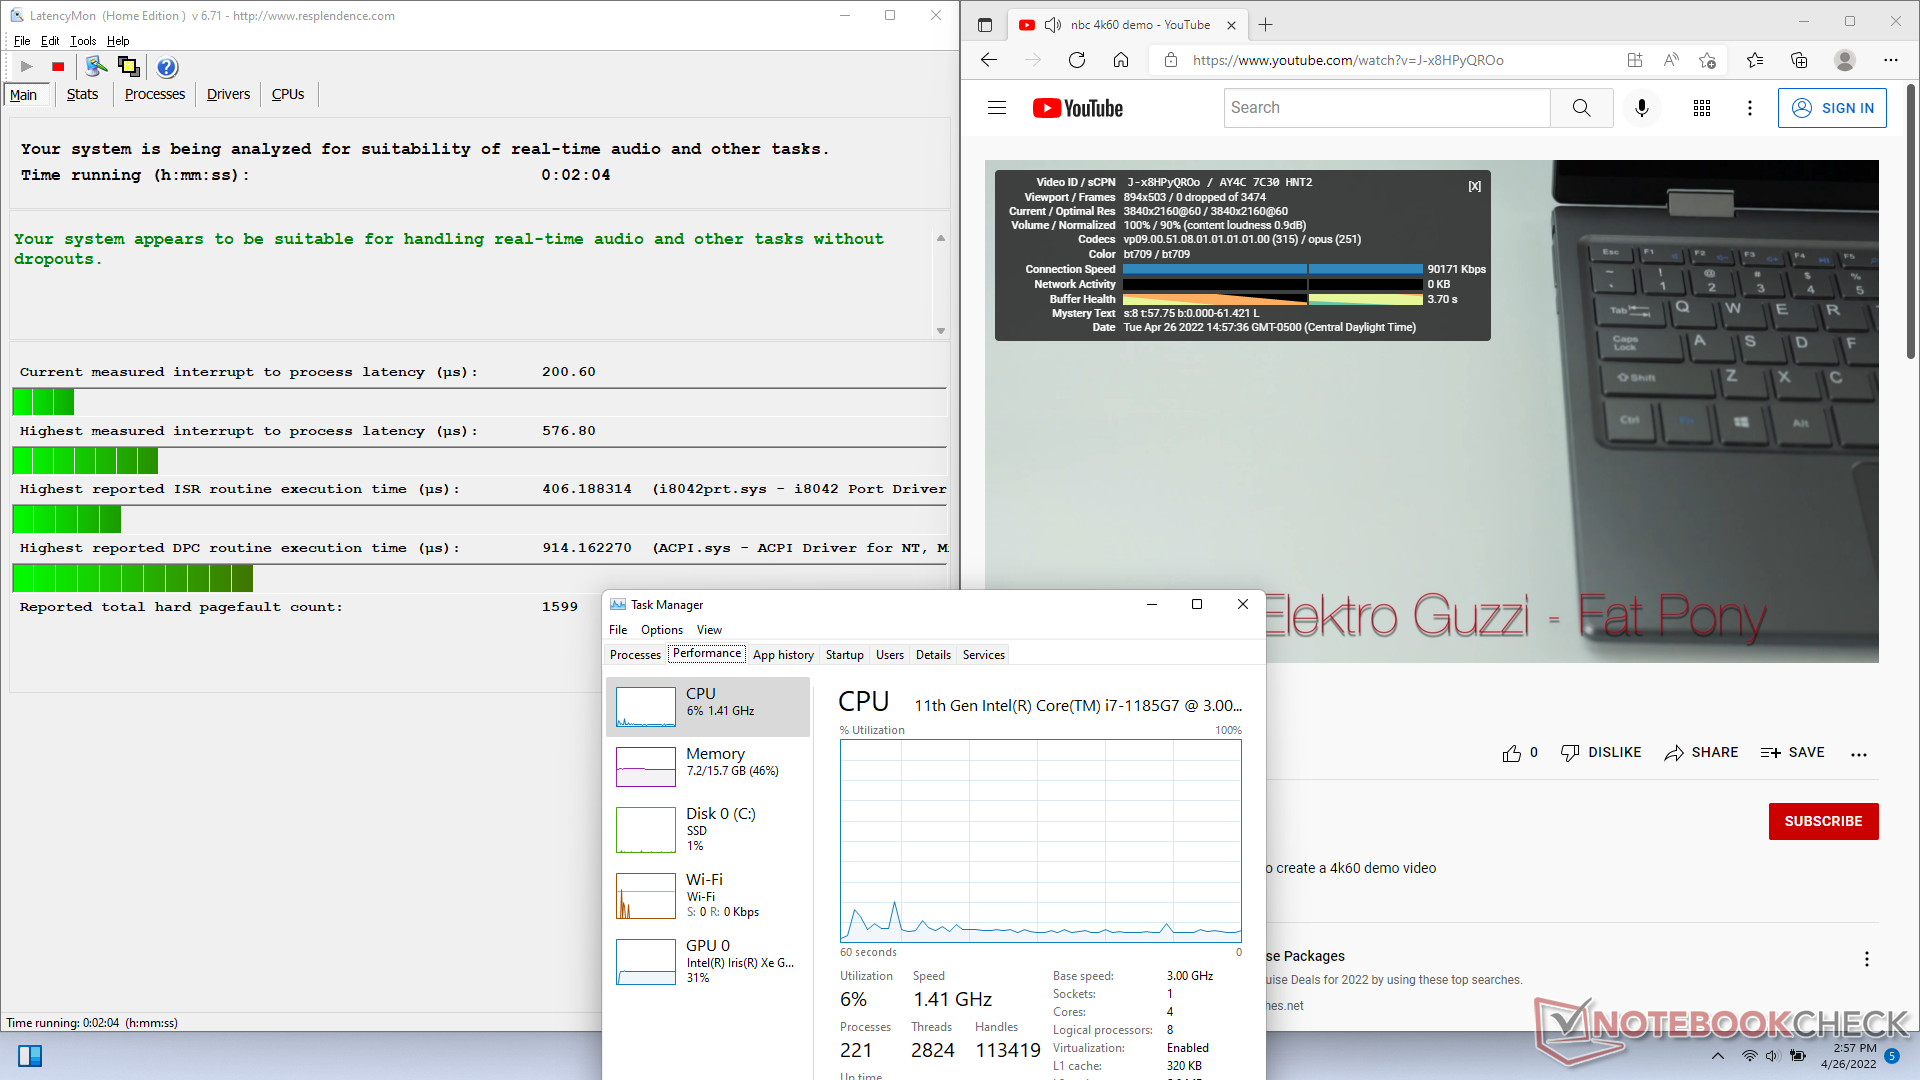
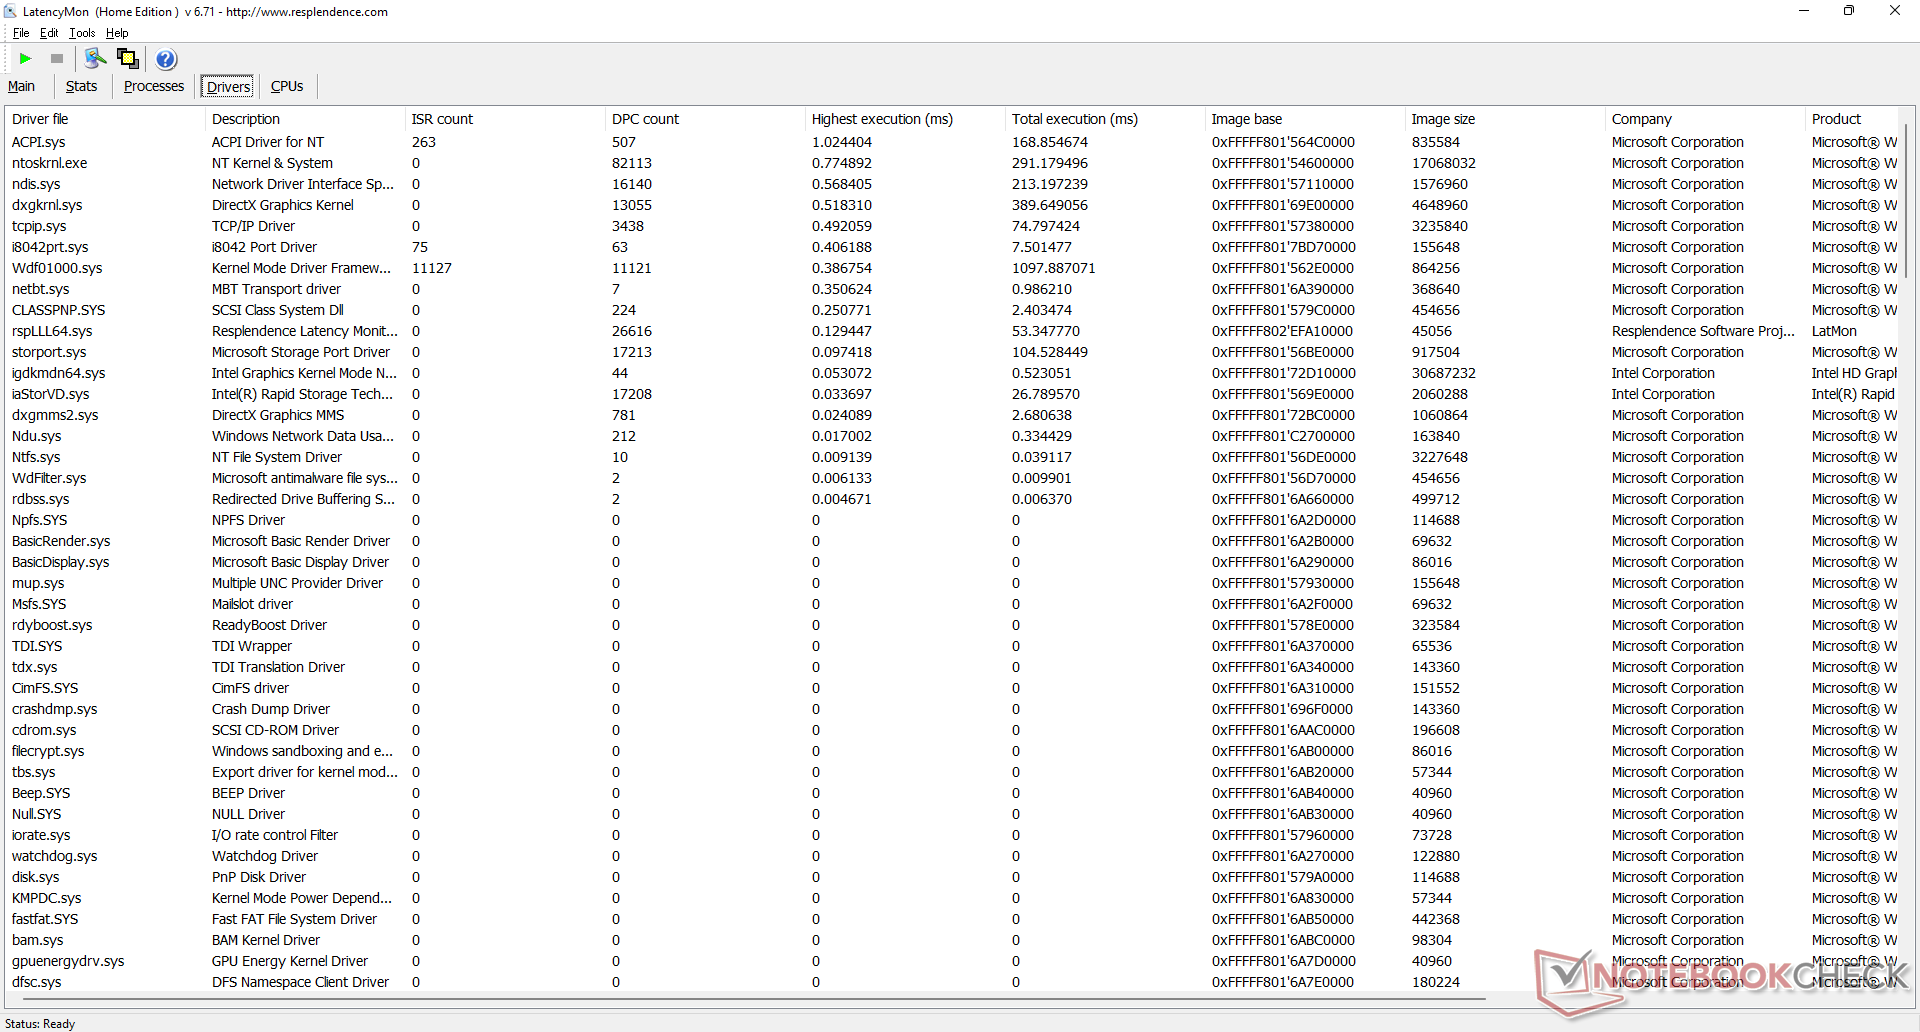
Latenza DPC
LatencyMon non rivela alcun problema di latenza quando si aprono più schede della nostra homepage. anche la riproduzione di video 4K a 60 FPS è fluida, senza alcun calo di frame registrato.
| DPC Latencies / LatencyMon - interrupt to process latency (max), Web, Youtube, Prime95 | |
| Acer Enduro Urban N3 EUN314 | |
| Panasonic Toughbook FZ-55 MK2 | |
| Durabook S14I | |
| Dell Latitude 7330 Rugged Extreme | |
* ... Meglio usare valori piccoli
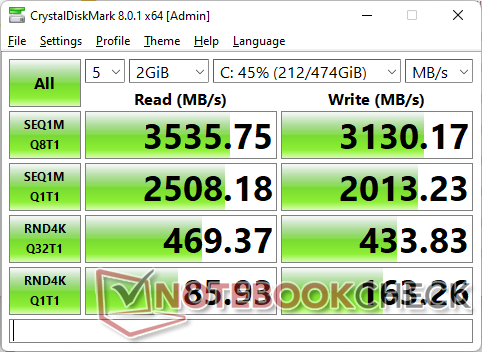
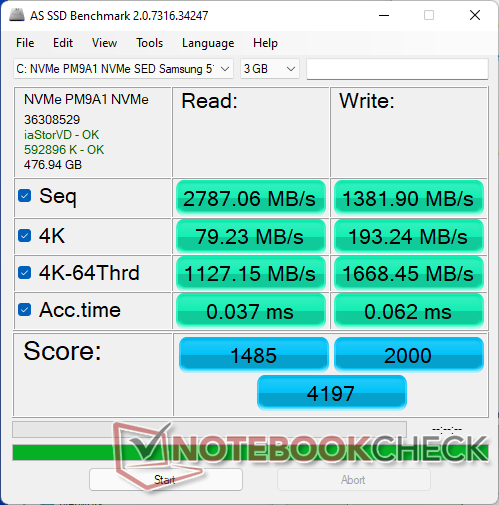
Dispositivi di archiviazione
Il sistema supporta solo un'unità interna M.2 2280 mentre le unità multiple sul Getac B360 possono essere scambiate rapidamente senza alcuno strumento. La nostra particolare unità di test è stata spedita con un Samsung PM9A1 SED NVMe SSDma sono disponibili anche opzioni standard non autocrittografate. Le prestazioni sono eccellenti, senza strozzature, anche se le velocità di trasferimento grezze non sono veloci come quelle di un'unità consumer standard non SED.

| Drive Performance rating - Percent | |
| Dell Latitude 7330 Rugged Extreme | |
| Acer Enduro Urban N3 EUN314 | |
| Durabook S14I | |
| Dell Latitude 5420 Rugged-P85G -8! | |
| Dell Latitude 7424 Rugged Extreme -8! | |
| Panasonic Toughbook FZ-55 MK2 | |
* ... Meglio usare valori piccoli
Disk Throttling: DiskSpd Read Loop, Queue Depth 8
Prestazioni della GPU
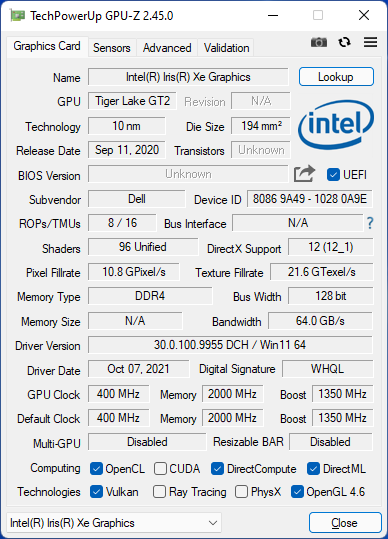
Le prestazioni grafiche sono eccellenti, circa il 10-15% più veloci rispetto alla media dei laptop del nostro database equipaggiati con lo stesso sistema integrato Iris Xe 96 EUs GPU. Le prestazioni sono anche costantemente più veloci di alcune vecchie GPU discrete come la Radeon RX 540.
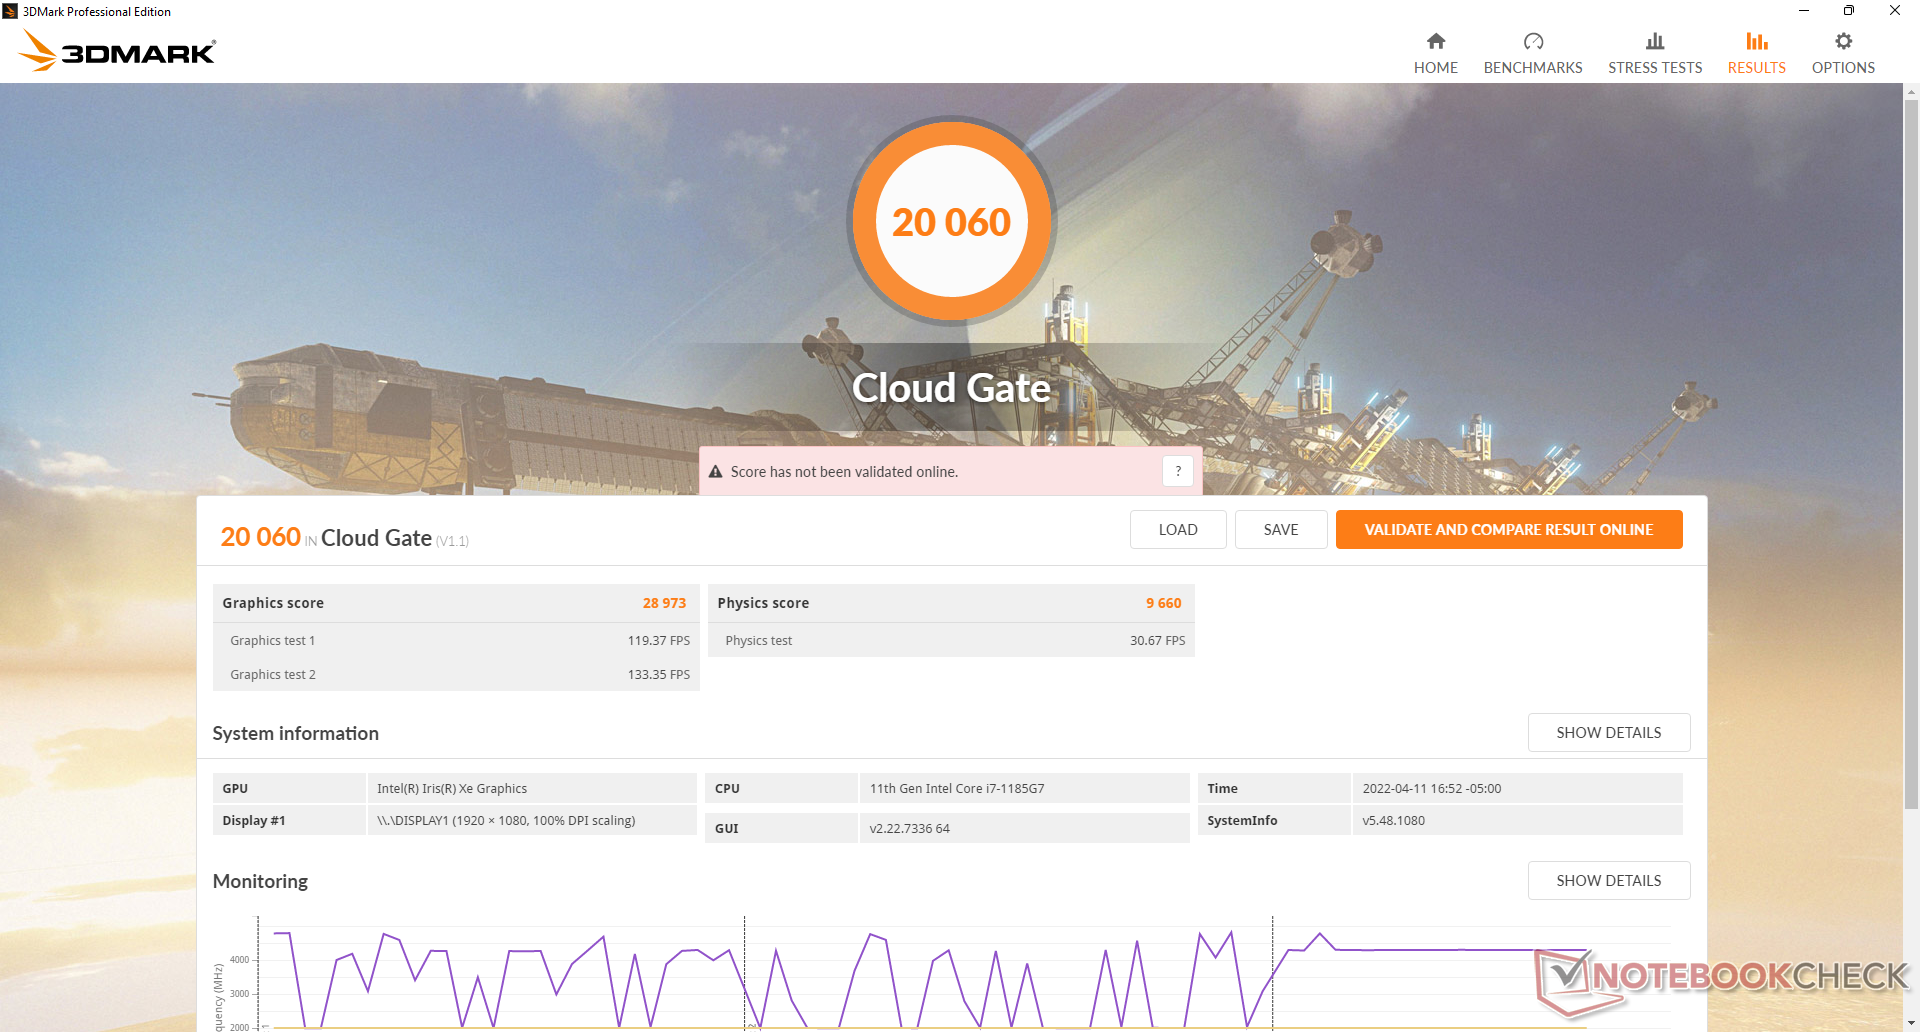
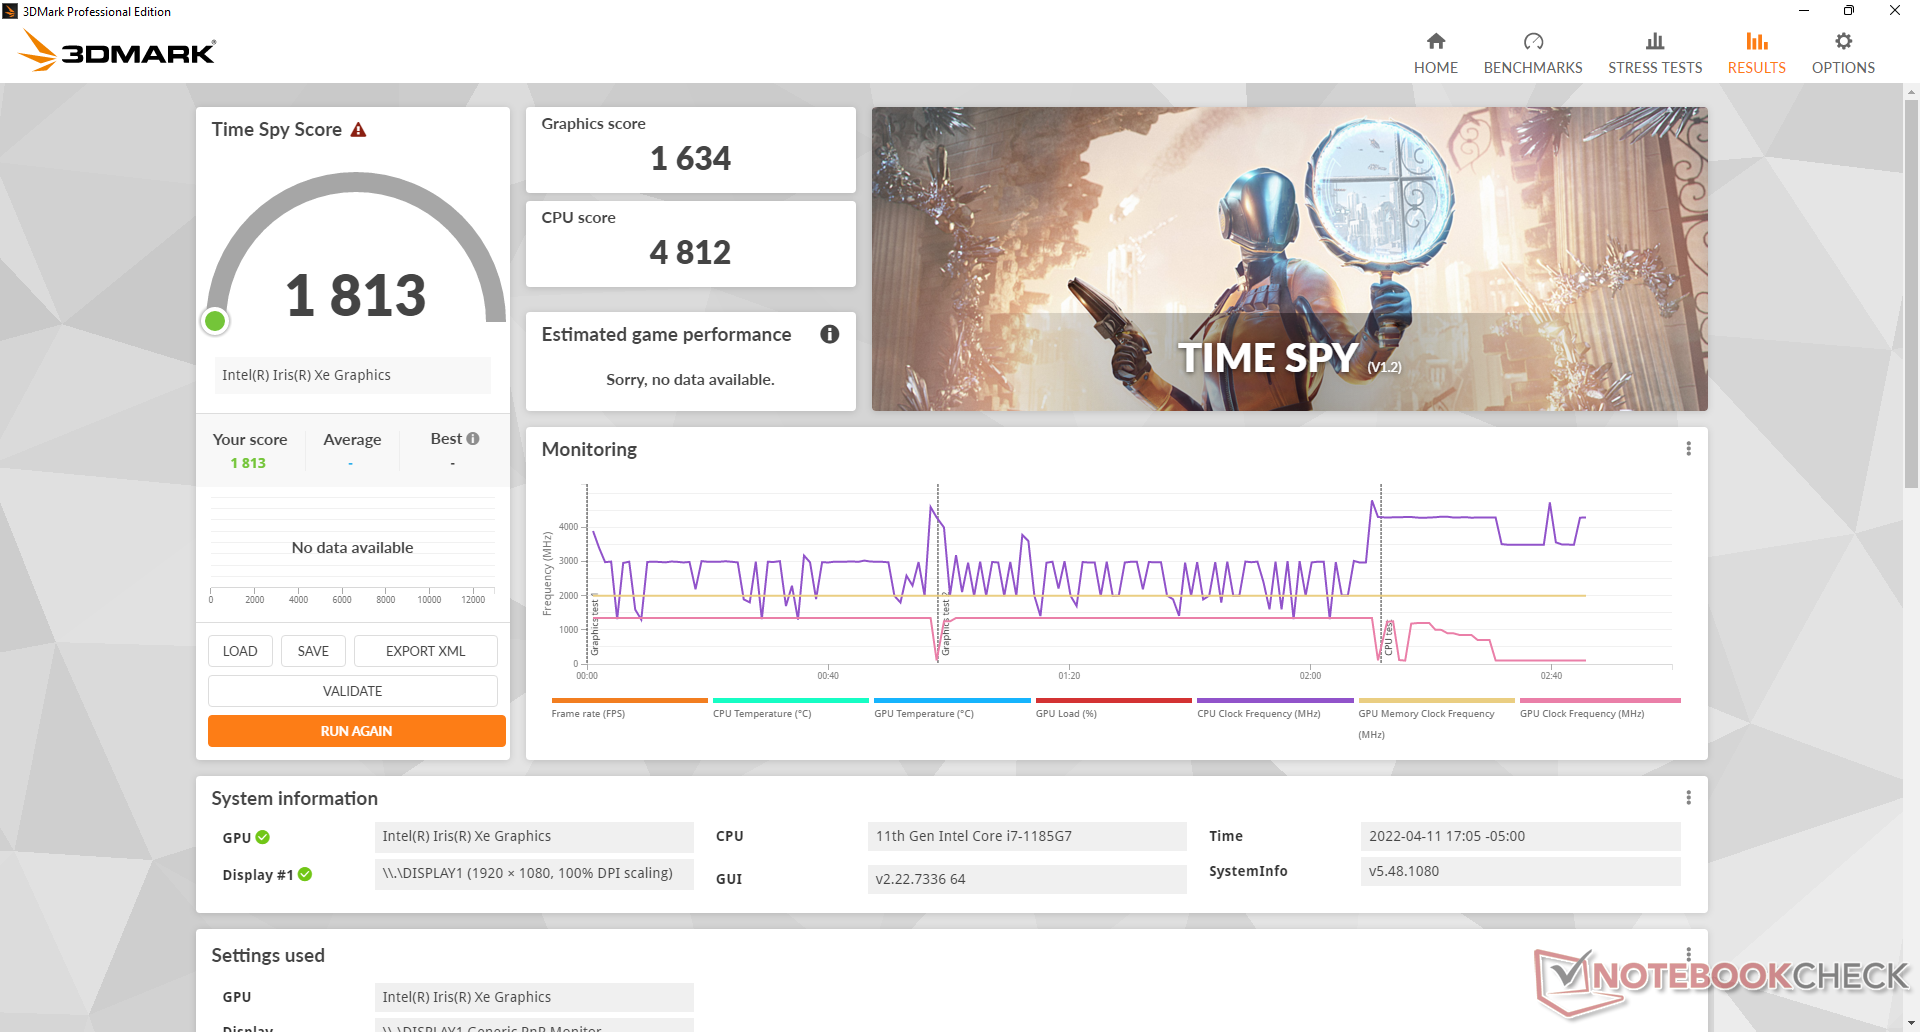
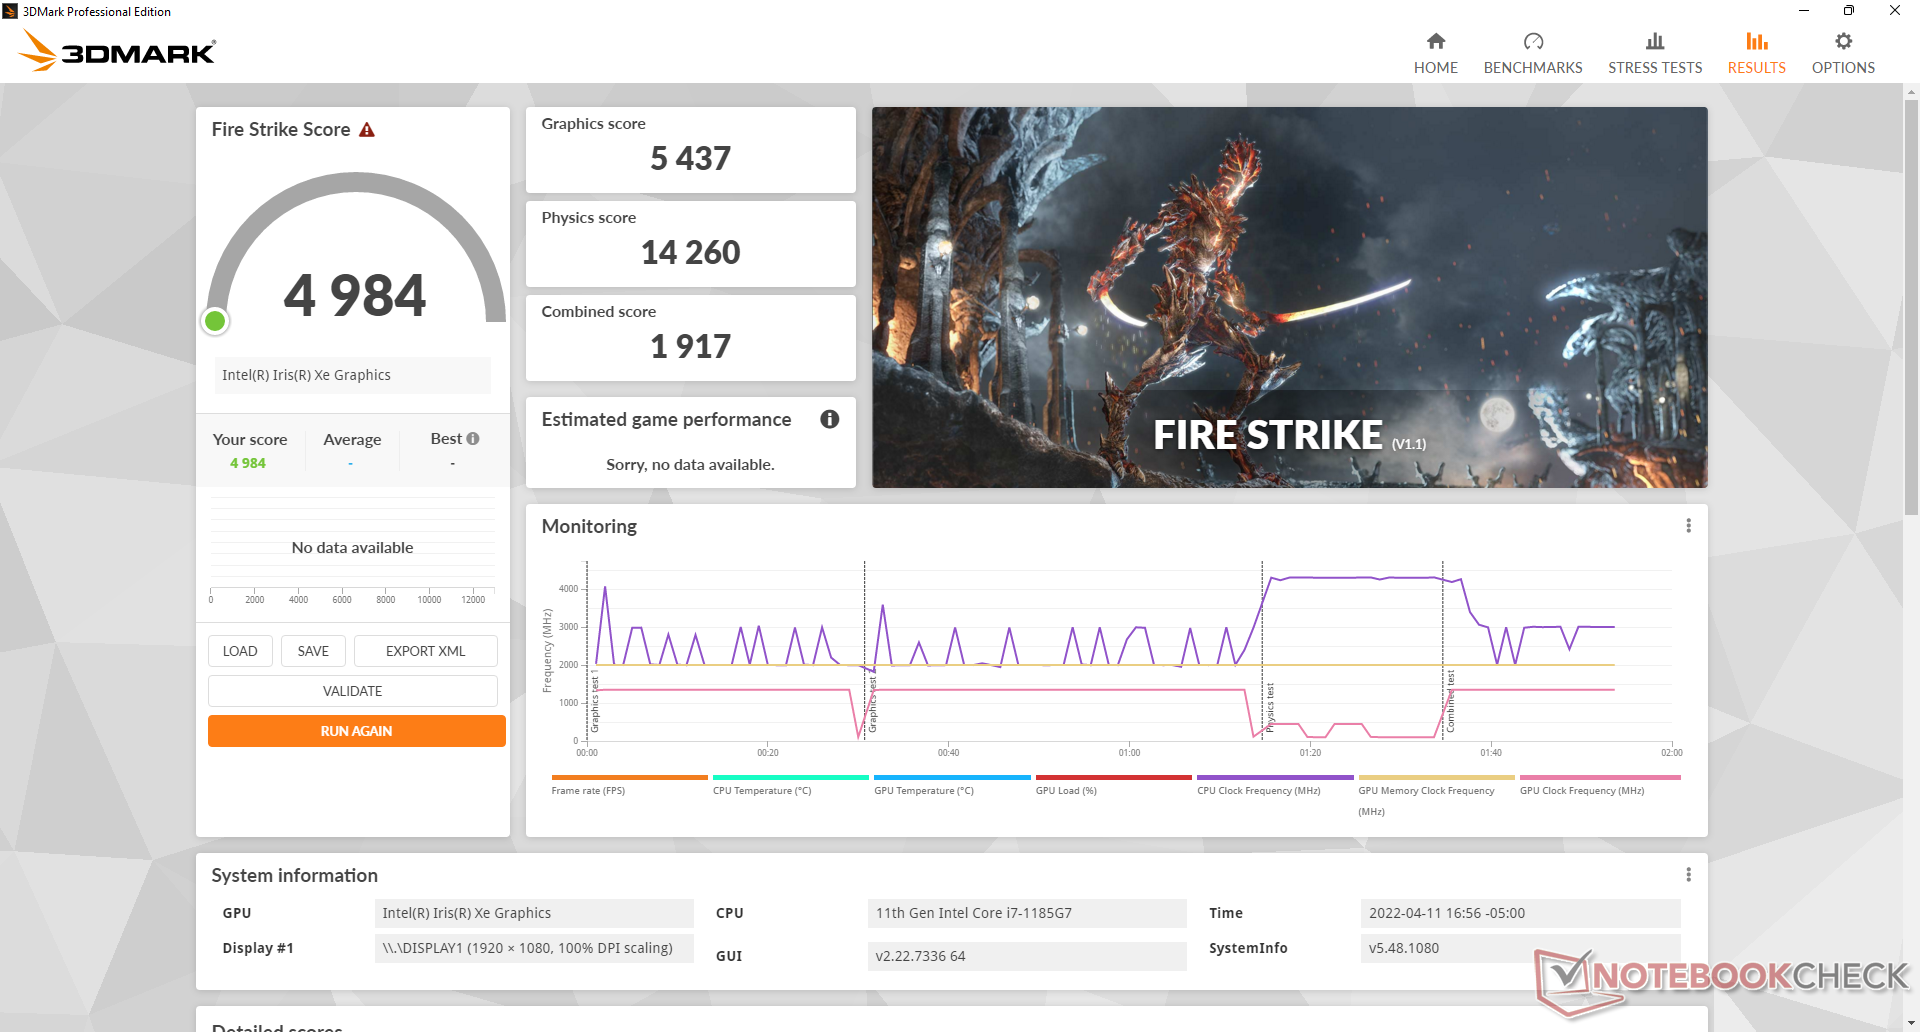
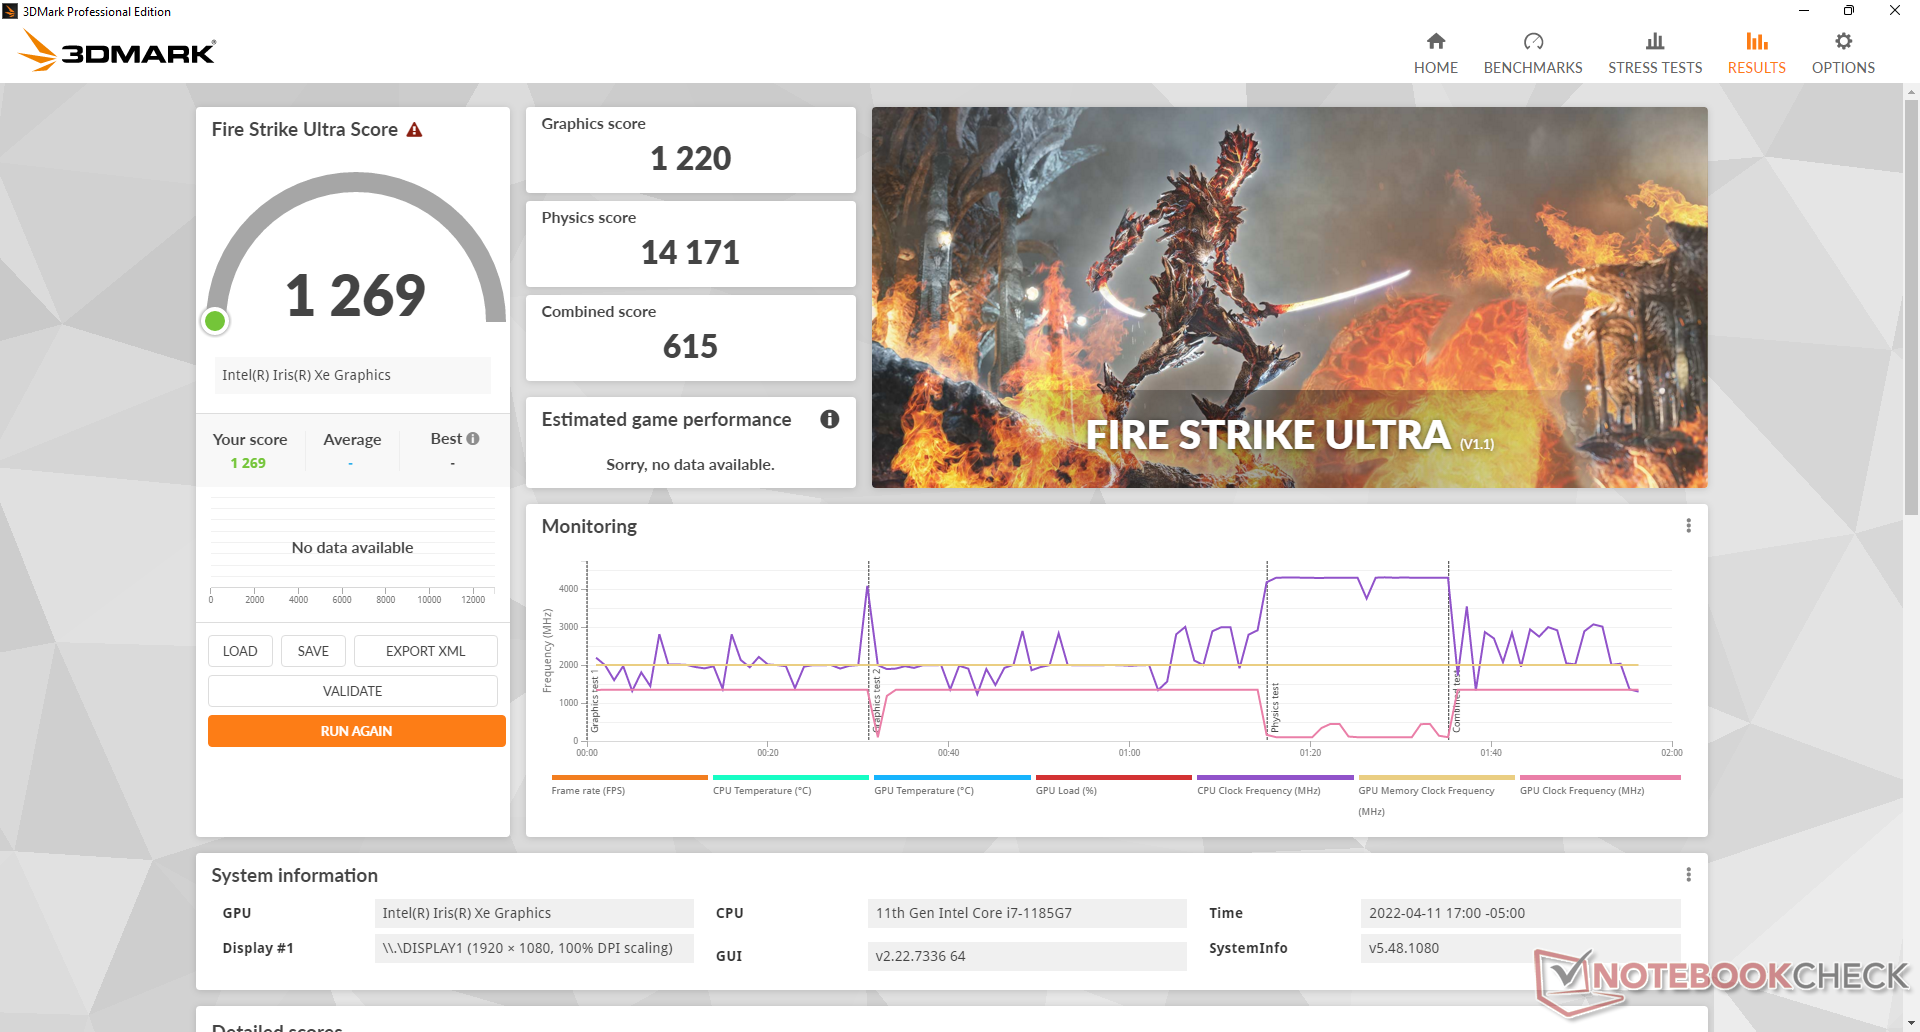
| 3DMark 11 Performance | 7197 punti | |
| 3DMark Cloud Gate Standard Score | 20060 punti | |
| 3DMark Fire Strike Score | 4984 punti | |
| 3DMark Time Spy Score | 1813 punti | |
Aiuto | ||
Witcher 3 FPS Chart
| basso | medio | alto | ultra | |
|---|---|---|---|---|
| The Witcher 3 (2015) | 99.3 | 65.3 | 34.3 | 15.8 |
| Dota 2 Reborn (2015) | 115.6 | 108.5 | 65 | 57.3 |
| Final Fantasy XV Benchmark (2018) | 46.8 | 26.2 | 26.2 | |
| X-Plane 11.11 (2018) | 27.5 | 25.3 | 22 |
Emissioni
Rumore di sistema
Il rumore della ventola è tranquillo poiché il modello utilizza la stessa CPU della serie U che si trova su portatili consumer molto più sottili come il Dell XPS 13. Siamo in grado di registrare un massimo di soli 36 dB(A) quando si esegue Prime95 per essere più silenzioso di molte altre alternative rugged.
Rumorosità
| Idle |
| 23.1 / 23.1 / 23.1 dB(A) |
| Sotto carico |
| 28 / 36.2 dB(A) |
 | ||
30 dB silenzioso 40 dB(A) udibile 50 dB(A) rumoroso |
||
min: | ||
| Dell Latitude 7330 Rugged Extreme Iris Xe G7 96EUs, i7-1185G7 | Dell Latitude 7424 Rugged Extreme Radeon RX 540, i7-8650U, SK Hynix PC401 512GB M.2 (HFS512GD9TNG) | Dell Latitude 5420 Rugged-P85G Radeon RX 540, i7-8650U, SK hynix PC401 NVMe 500 GB | Acer Enduro Urban N3 EUN314 Iris Xe G7 96EUs, i7-1165G7, Samsung PM991 MZVLQ1T0HALB | Panasonic Toughbook FZ-55 MK2 Iris Xe G7 96EUs, i7-1185G7, Toshiba KIOXIA KBG4AZNV512G M.2 2280 OPAL | Durabook S14I Iris Xe G7 96EUs, i7-1165G7, UDinfo M2P M2P80DE512GBAEP | |
|---|---|---|---|---|---|---|
| Noise | -21% | -18% | -5% | -4% | -17% | |
| off /ambiente * (dB) | 22.9 | 28.6 -25% | 28.3 -24% | 23.8 -4% | 23.8 -4% | 25.2 -10% |
| Idle Minimum * (dB) | 23.1 | 28.6 -24% | 28.3 -23% | 24.1 -4% | 24 -4% | 25.2 -9% |
| Idle Average * (dB) | 23.1 | 28.6 -24% | 28.3 -23% | 24.1 -4% | 24 -4% | 25.2 -9% |
| Idle Maximum * (dB) | 23.1 | 28.6 -24% | 28.3 -23% | 24.1 -4% | 24 -4% | 34.5 -49% |
| Load Average * (dB) | 28 | 32.9 -18% | 29.9 -7% | 27.9 -0% | 26.7 5% | 34.5 -23% |
| Witcher 3 ultra * (dB) | 31.2 | 35.7 -14% | ||||
| Load Maximum * (dB) | 36.2 | 39 -8% | 38 -5% | 38.6 -7% | 41.7 -15% | 36.2 -0% |
* ... Meglio usare valori piccoli
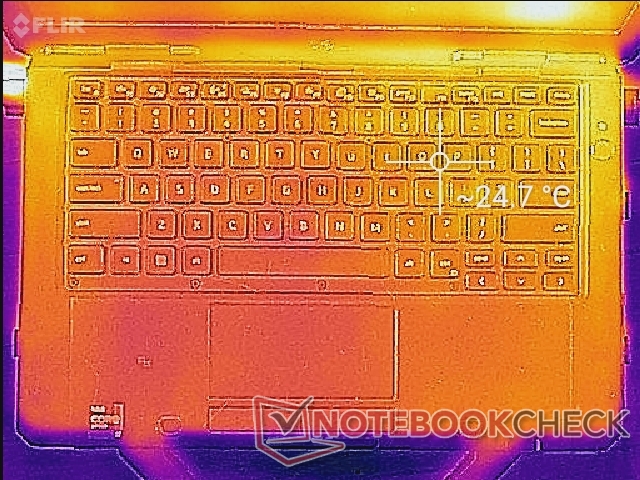
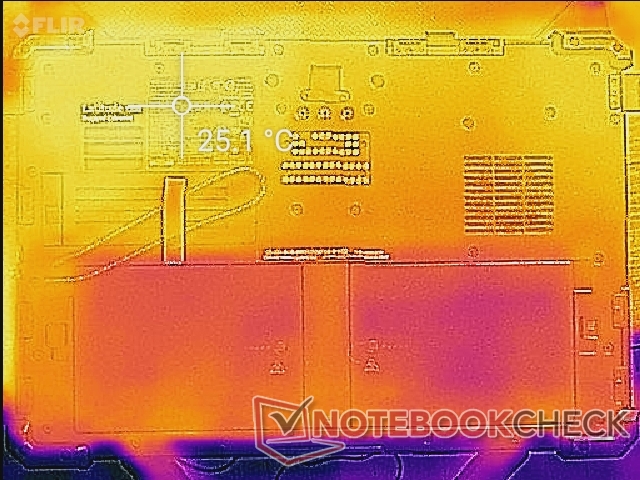
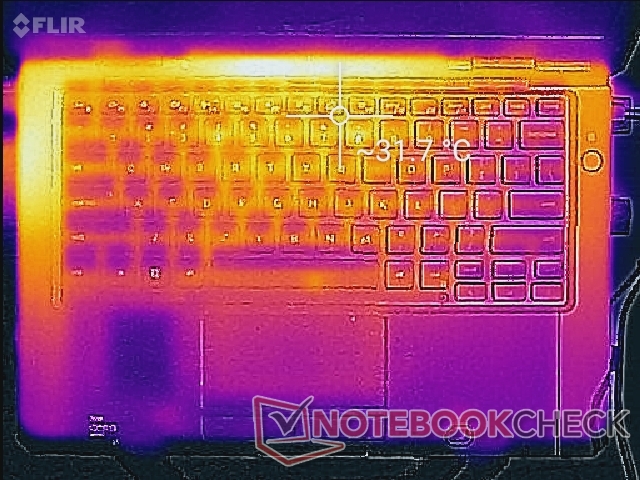
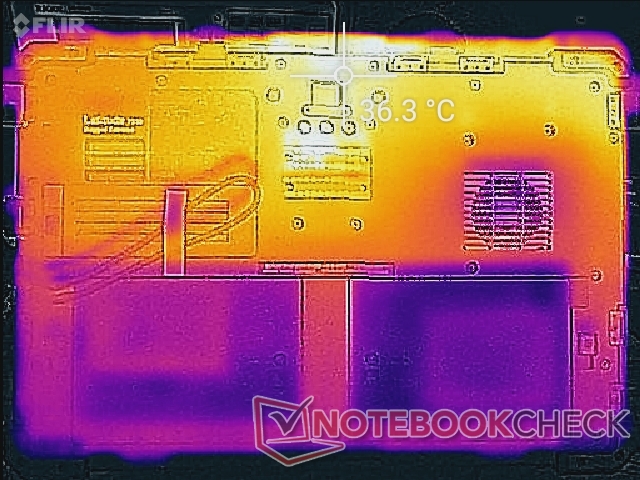
Temperatura
Le temperature superficiali non sono mai fastidiosamente calde, dato che avete uno chassis più grande del solito per una CPU ULV serie U. Siamo in grado di registrare punti caldi di soli 31 C e 36 C sulle superfici superiore e inferiore, rispettivamente, rispetto ai 37 C e 46 C dell'Acer Enduro Urban N3.
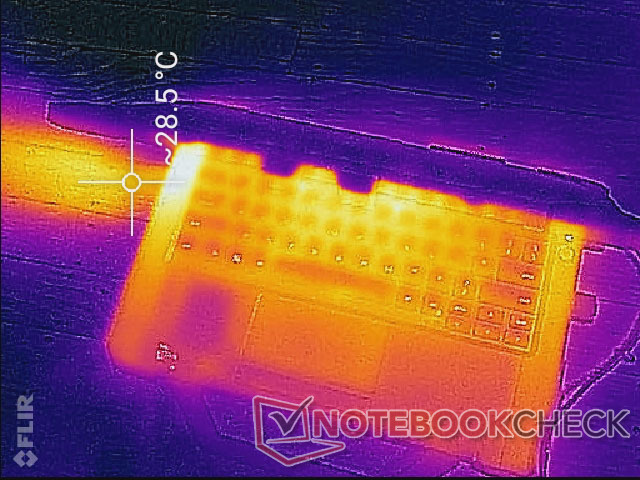
(+) La temperatura massima sul lato superiore è di 34.6 °C / 94 F, rispetto alla media di 37.5 °C / 100 F, che varia da 24.7 a 57 °C per questa classe .
(+) Il lato inferiore si riscalda fino ad un massimo di 36.6 °C / 98 F, rispetto alla media di 48.1 °C / 119 F
(+) In idle, la temperatura media del lato superiore è di 24.3 °C / 76 F, rispetto alla media deld ispositivo di 31.9 °C / 89 F.
(+) I poggiapolsi e il touchpad sono piu' freddi della temperatura della pelle con un massimo di 26 °C / 78.8 F e sono quindi freddi al tatto.
(+) La temperatura media della zona del palmo della mano di dispositivi simili e'stata di 29.5 °C / 85.1 F (+3.5 °C / 6.3 F).
| Dell Latitude 7330 Rugged Extreme Intel Core i7-1185G7, Intel Iris Xe Graphics G7 96EUs | Dell Latitude 7424 Rugged Extreme Intel Core i7-8650U, AMD Radeon RX 540 | Dell Latitude 5420 Rugged-P85G Intel Core i7-8650U, AMD Radeon RX 540 | Acer Enduro Urban N3 EUN314 Intel Core i7-1165G7, Intel Iris Xe Graphics G7 96EUs | Panasonic Toughbook FZ-55 MK2 Intel Core i7-1185G7, Intel Iris Xe Graphics G7 96EUs | Durabook S14I Intel Core i7-1165G7, Intel Iris Xe Graphics G7 96EUs | |
|---|---|---|---|---|---|---|
| Heat | -21% | -23% | -15% | -20% | -19% | |
| Maximum Upper Side * (°C) | 34.6 | 41.6 -20% | 42.2 -22% | 37.8 -9% | 36.2 -5% | 36.4 -5% |
| Maximum Bottom * (°C) | 36.6 | 47.6 -30% | 42 -15% | 45.8 -25% | 42.2 -15% | 38.6 -5% |
| Idle Upper Side * (°C) | 24.8 | 28.6 -15% | 31.6 -27% | 26.4 -6% | 31 -25% | 32.6 -31% |
| Idle Bottom * (°C) | 25.2 | 30.2 -20% | 31.8 -26% | 30.2 -20% | 34 -35% | 33.8 -34% |
* ... Meglio usare valori piccoli
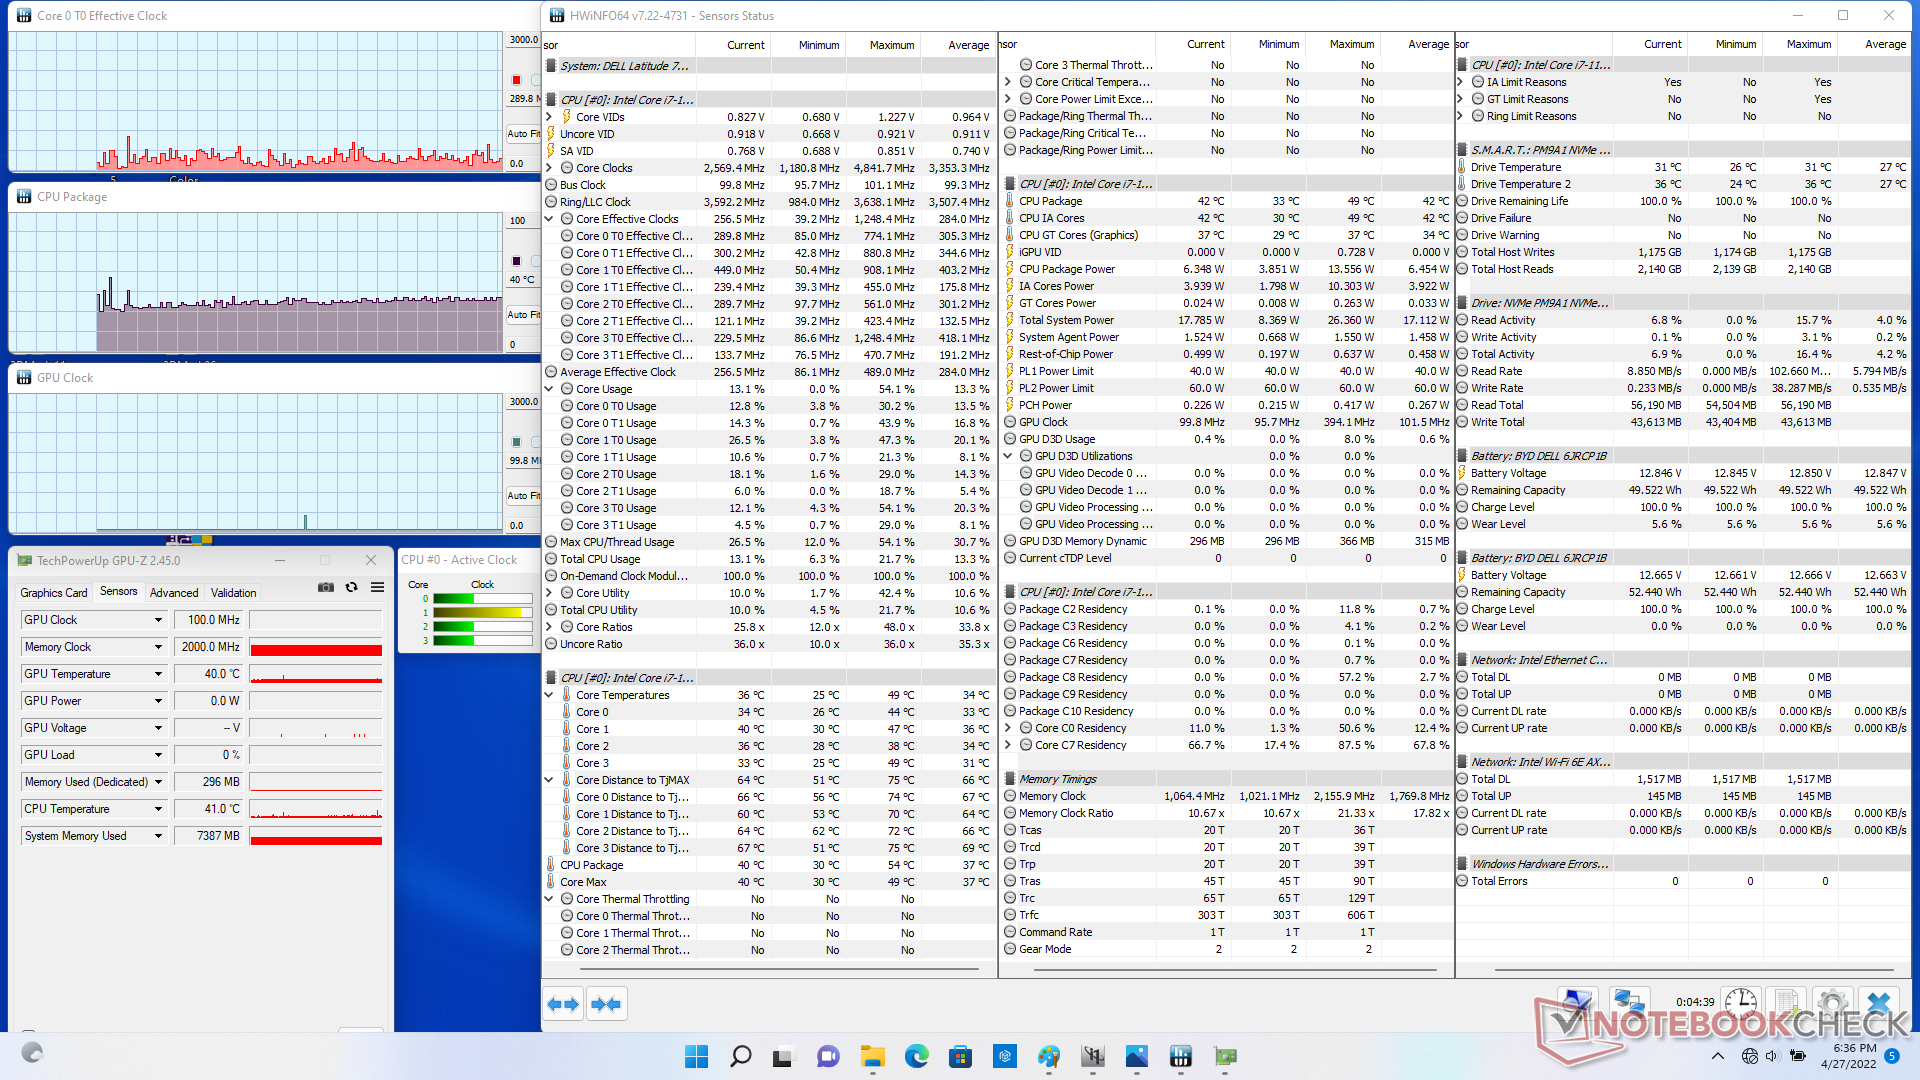
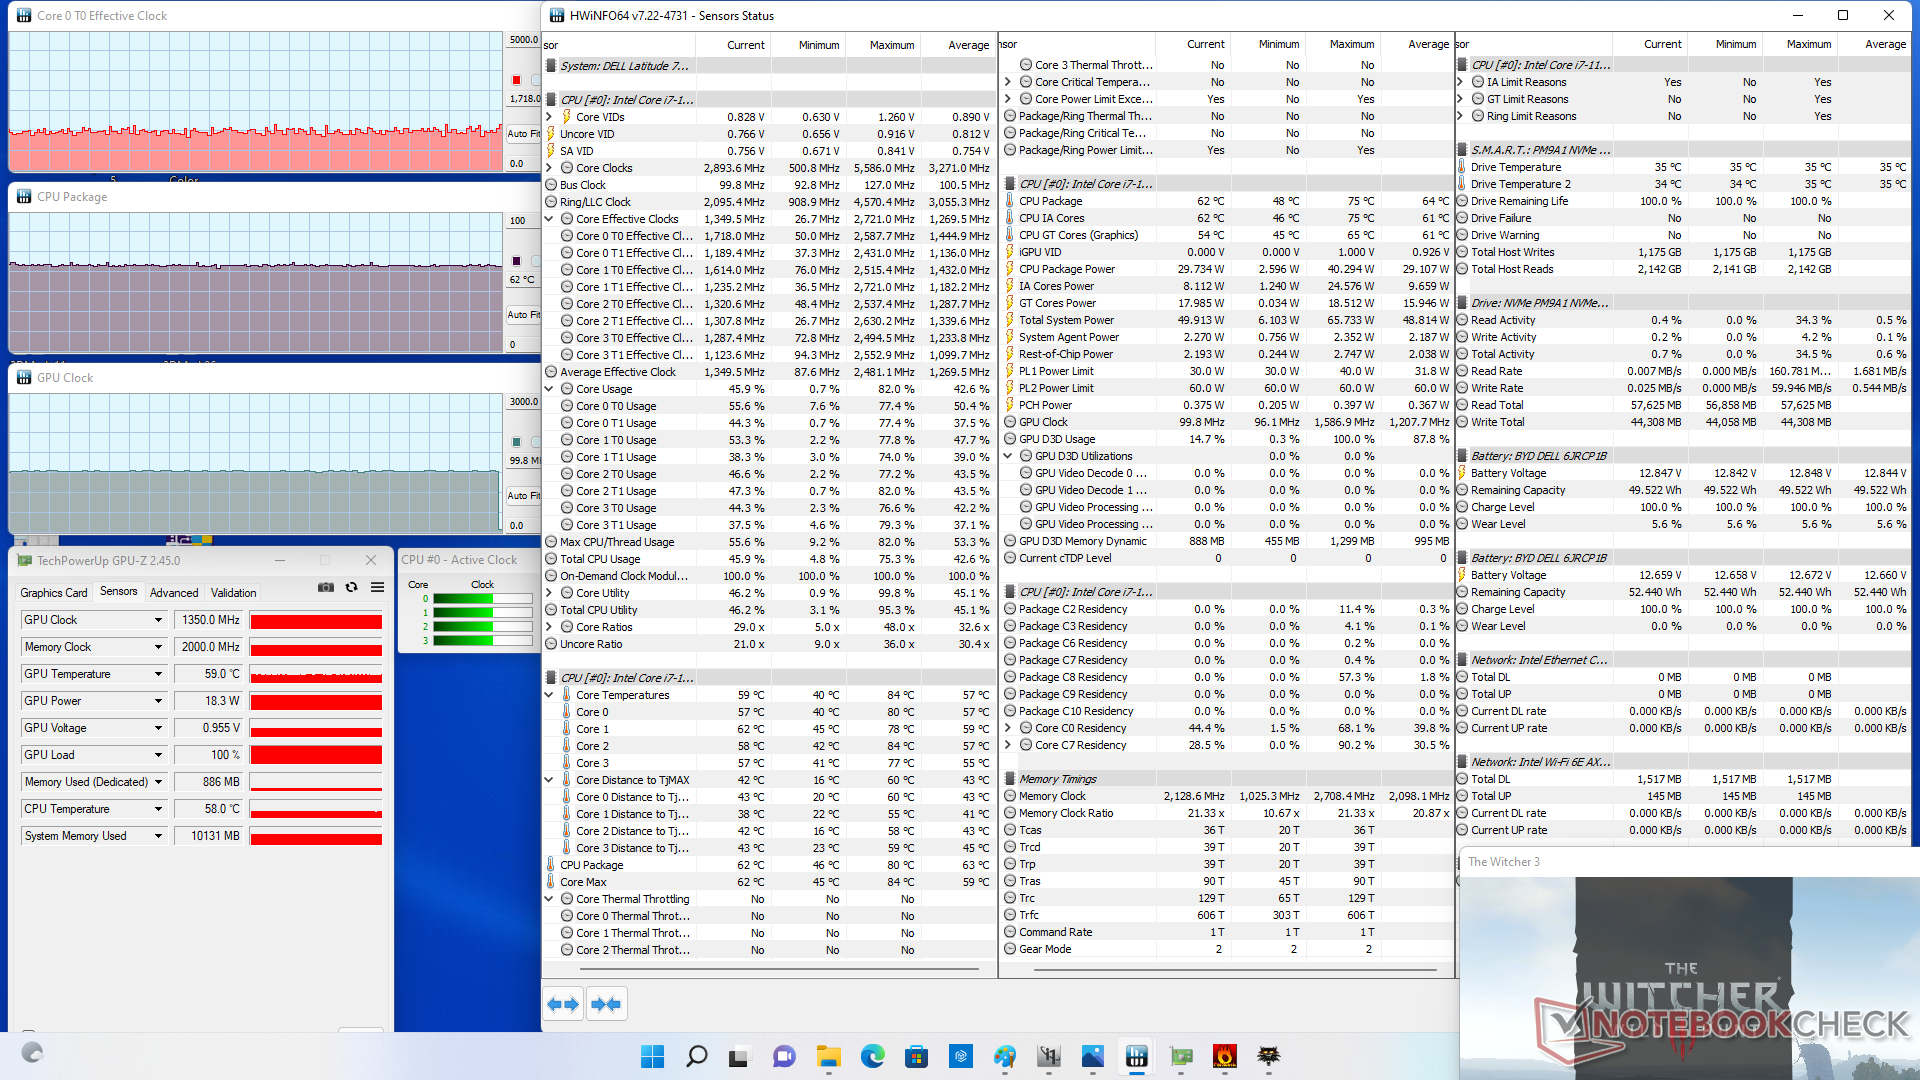
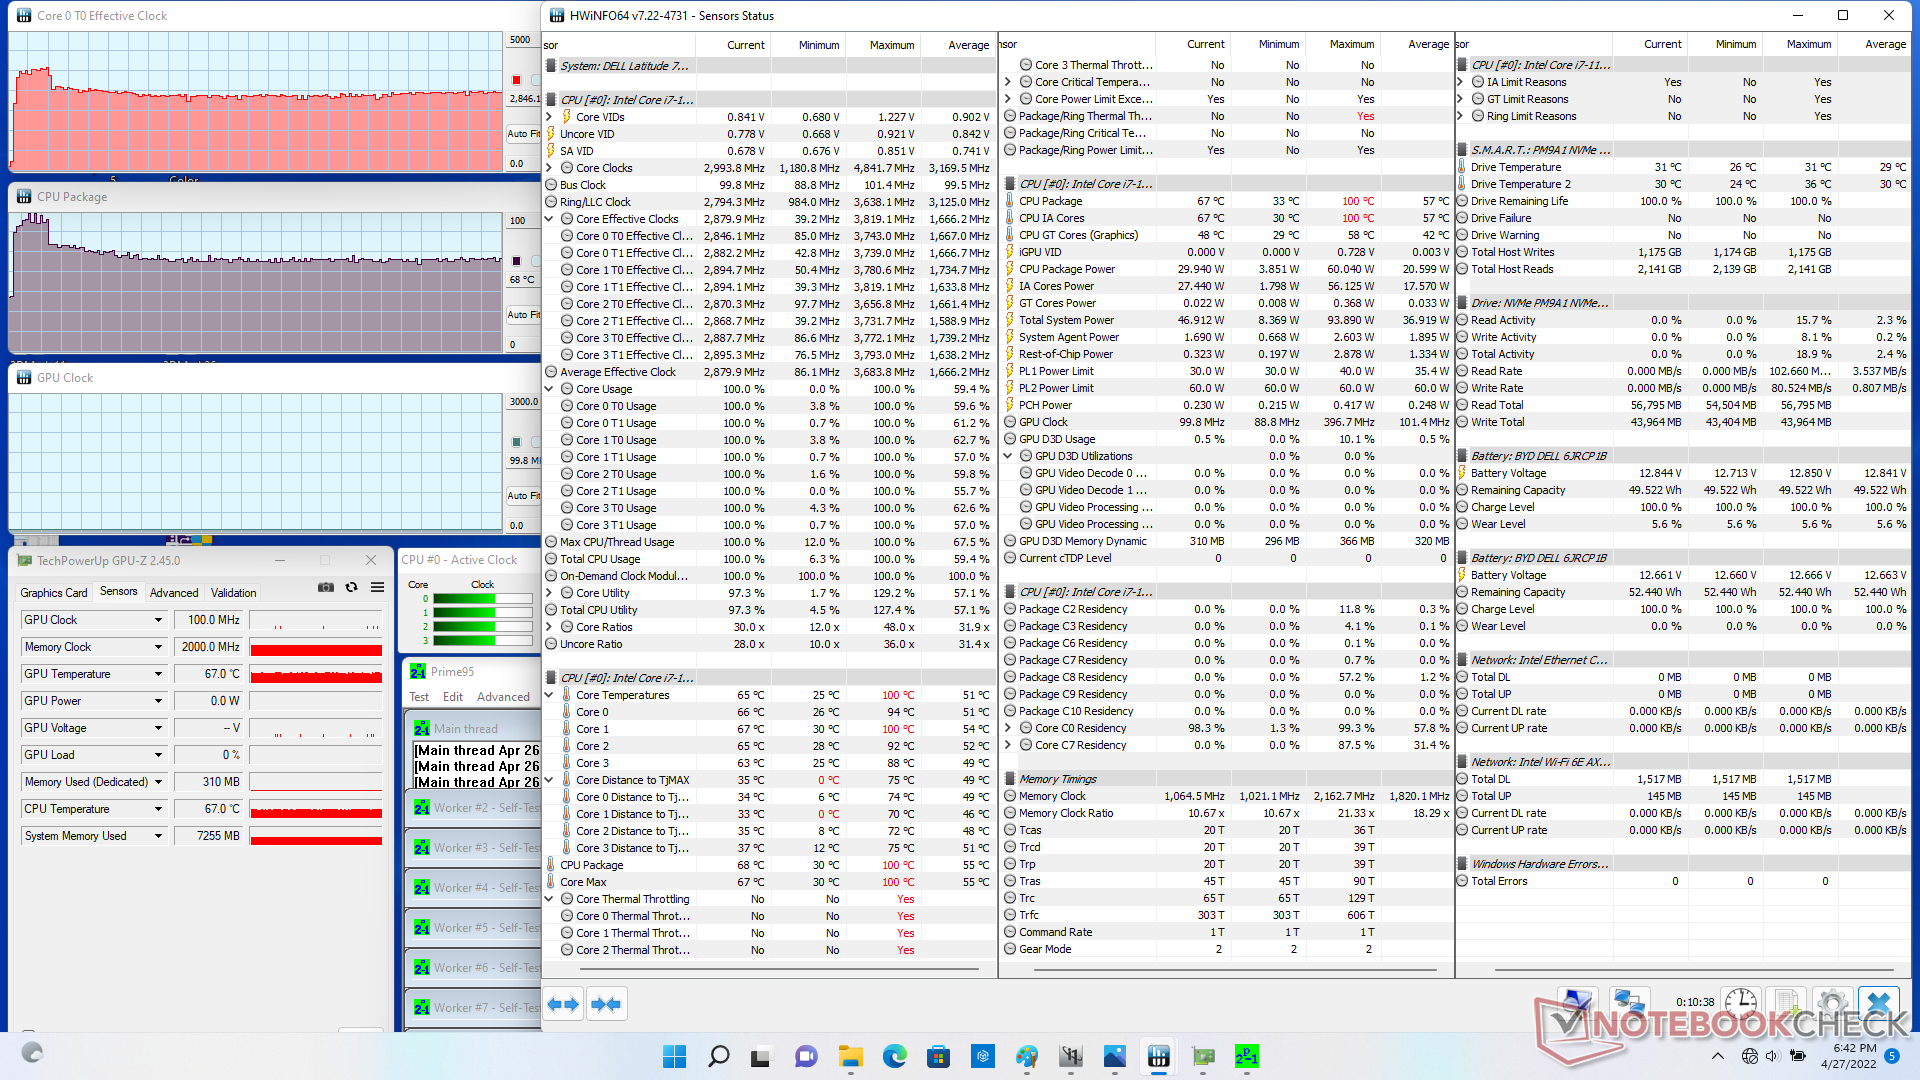
Test di stress
Sotto lo stress di Prime95, la CPU avrebbe raggiunto i 3,7 GHz per alcuni secondi e a una temperatura del core di 100 C. Il clock rate sarebbe poi rapidamente sceso e si sarebbe stabilizzato a 2,8 GHz per mantenere una temperatura del core più fredda di 68 C. Eseguendo questo stesso test sul Panasonic Toughbook FZ-55 MK2 si otterrebbe un clock rate della CPU simile ma una temperatura del core più calda di 81 C.
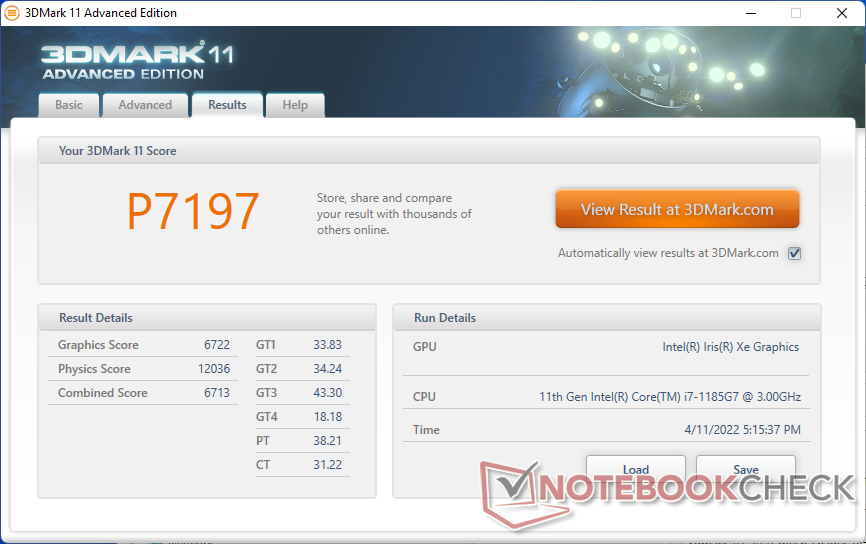
L'esecuzione a batteria purtroppo limita le prestazioni. Un test 3DMark 11 a batteria restituirebbe punteggi di Fisica e Grafica di 8010 e 3501 punti, rispettivamente, rispetto a 12036 e 6722 punti quando è alimentato.
| Clock della CPU (GHz) | Clock della GPU (MHz) | Temperatura media della CPU (°C) | |
| Sistema inattivo | -- | -- | 40 |
| Prime95 Stress | 2.8 | -- | 68 |
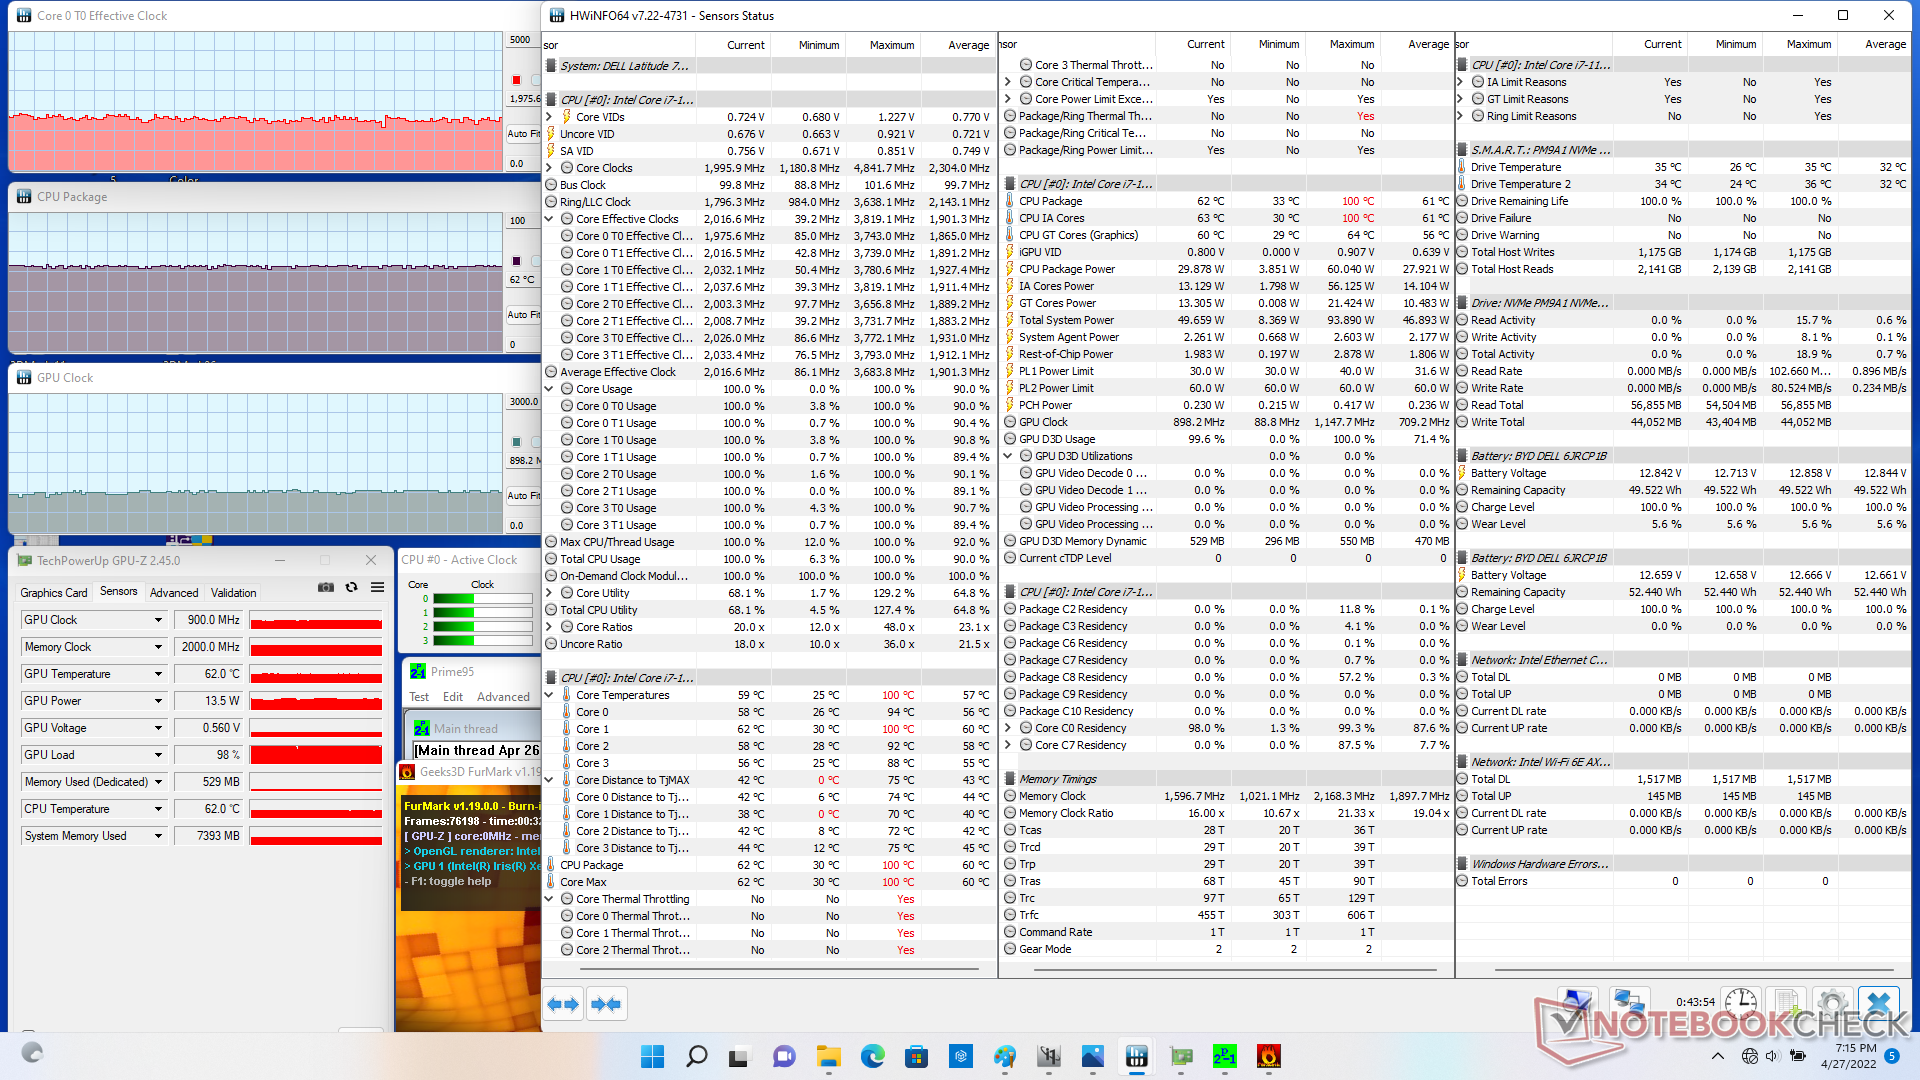
| Prime95 + FurMark Stress | ~2.0 | 900 | 62 |
| Witcher 3 Stress | ~1.7 | 1350 | 62 |
Altoparlanti
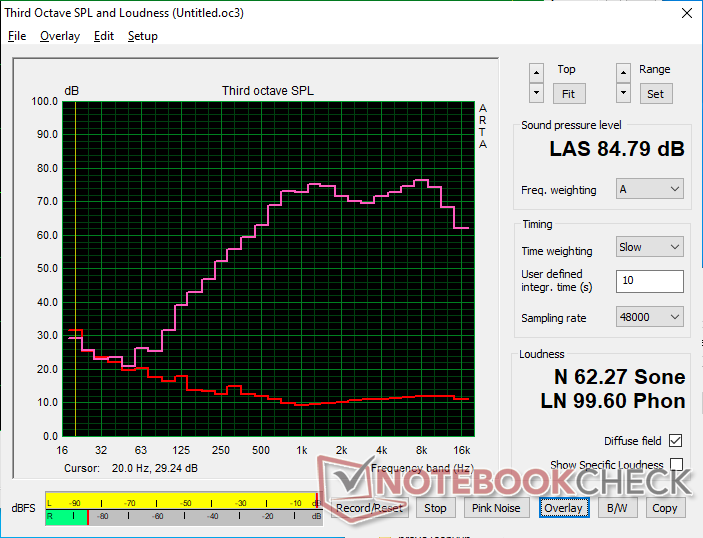
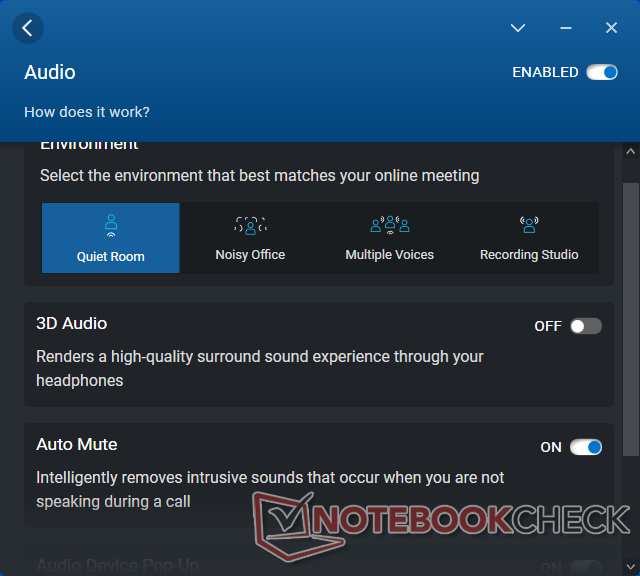
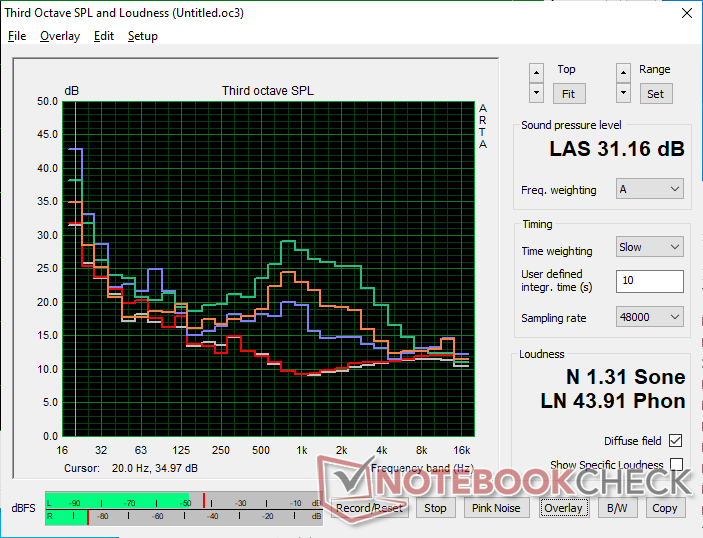
Dell Latitude 7330 Rugged Extreme analisi audio
(+) | gli altoparlanti sono relativamente potenti (84.8 dB)
Bassi 100 - 315 Hz
(-) | quasi nessun basso - in media 24.8% inferiori alla media
(±) | la linearità dei bassi è media (8.8% delta rispetto alla precedente frequenza)
Medi 400 - 2000 Hz
(+) | medi bilanciati - solo only 4.6% rispetto alla media
(+) | medi lineari (5.1% delta rispetto alla precedente frequenza)
Alti 2 - 16 kHz
(+) | Alti bilanciati - appena 3.2% dalla media
(+) | alti lineari (2.7% delta rispetto alla precedente frequenza)
Nel complesso 100 - 16.000 Hz
(±) | la linearità complessiva del suono è media (16.5% di differenza rispetto alla media
Rispetto alla stessa classe
» 28% di tutti i dispositivi testati in questa classe è stato migliore, 6% simile, 66% peggiore
» Il migliore ha avuto un delta di 4%, medio di 23%, peggiore di 134%
Rispetto a tutti i dispositivi testati
» 28% di tutti i dispositivi testati in questa classe è stato migliore, 6% similare, 66% peggiore
» Il migliore ha avuto un delta di 4%, medio di 23%, peggiore di 134%
Apple MacBook Pro 16 2021 M1 Pro analisi audio
(+) | gli altoparlanti sono relativamente potenti (84.7 dB)
Bassi 100 - 315 Hz
(+) | bassi buoni - solo 3.8% dalla media
(+) | bassi in lineaa (5.2% delta rispetto alla precedente frequenza)
Medi 400 - 2000 Hz
(+) | medi bilanciati - solo only 1.3% rispetto alla media
(+) | medi lineari (2.1% delta rispetto alla precedente frequenza)
Alti 2 - 16 kHz
(+) | Alti bilanciati - appena 1.9% dalla media
(+) | alti lineari (2.7% delta rispetto alla precedente frequenza)
Nel complesso 100 - 16.000 Hz
(+) | suono nel complesso lineare (4.6% differenza dalla media)
Rispetto alla stessa classe
» 0% di tutti i dispositivi testati in questa classe è stato migliore, 0% simile, 100% peggiore
» Il migliore ha avuto un delta di 5%, medio di 17%, peggiore di 45%
Rispetto a tutti i dispositivi testati
» 0% di tutti i dispositivi testati in questa classe è stato migliore, 0% similare, 100% peggiore
» Il migliore ha avuto un delta di 4%, medio di 23%, peggiore di 134%
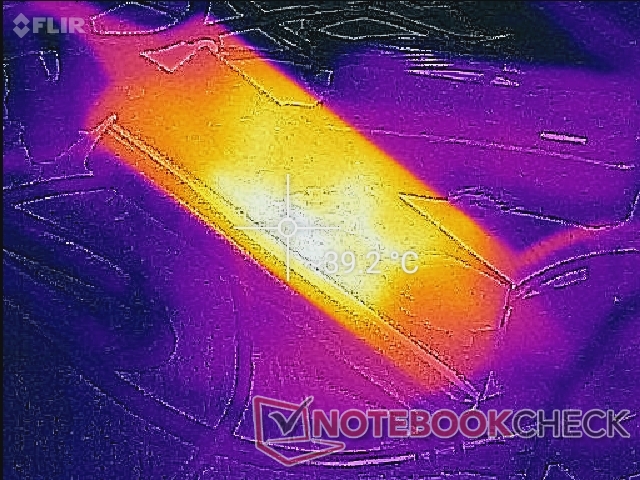
Gestione dell'energia
Consumo di energia
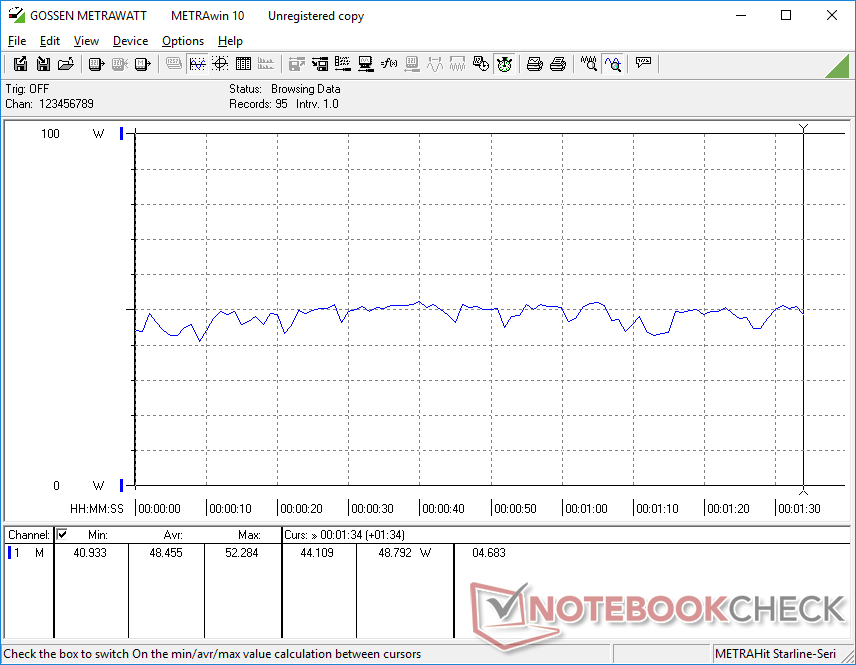
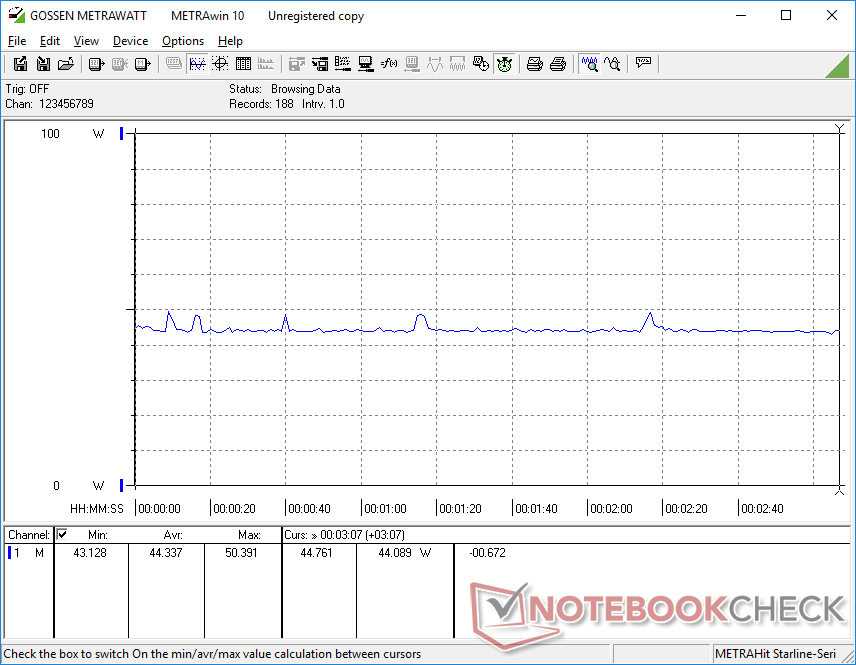
L'inattività sul desktop richiede circa 4 W se la luminosità è al minimo o fino a 12 W se la luminosità è impostata al massimo. L'esecuzione di carichi più elevati equivalenti ai giochi richiederà circa 45 W per essere solo leggermente superiore alla maggior parte degli altri portatili che girano con la stessa CPU Intel U-series di 11a generazione. Si noti che il consumo di energia è significativamente inferiore a quello del vecchio Dell Latitude 7424 Rugged Extreme alimentato dalla GPU Radeon RX 540 anche se il nostro Latitude 7330 Rugged Extreme è in grado di fornire una grafica fino al 40% più veloce
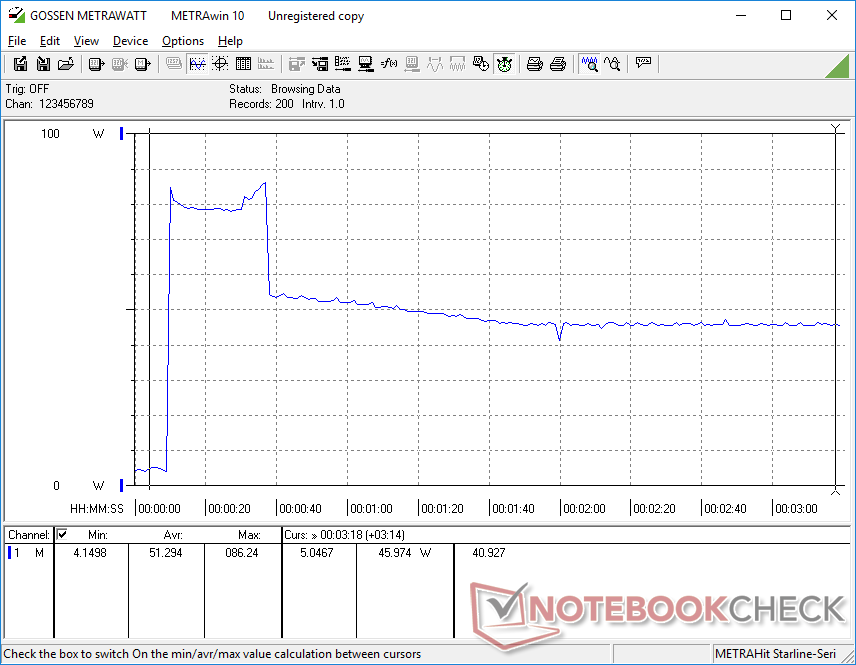
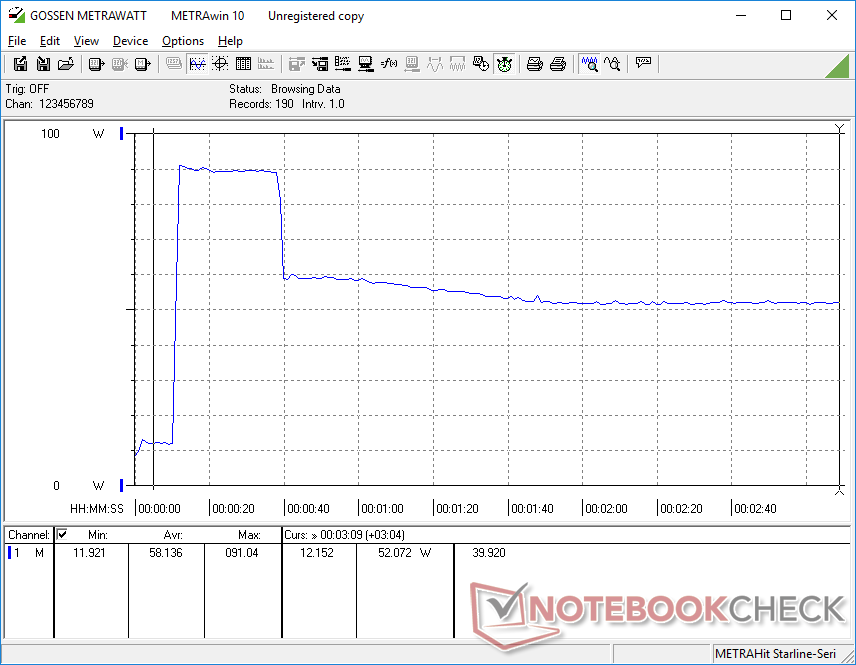
Siamo in grado di registrare un assorbimento massimo di 91 W dal piccolo-medio (~13 x 6,5 x 2,3 cm) 90 W dell'adattatore USB-C AC durante l'esecuzione simultanea di Prime95+FurMark. Questo tasso è solo temporaneo, come mostrato dai nostri screenshot qui sotto, probabilmente a causa di limitazioni termiche.
| Off / Standby | |
| Idle | |
| Sotto carico |
|
Leggenda:
min: | |
| Dell Latitude 7330 Rugged Extreme i7-1185G7, Iris Xe G7 96EUs, , IPS, 1920x1080, 13.3" | Dell Latitude 7424 Rugged Extreme i7-8650U, Radeon RX 540, SK Hynix PC401 512GB M.2 (HFS512GD9TNG), IPS, 1920x1080, 14" | Dell Latitude 5420 Rugged-P85G i7-8650U, Radeon RX 540, SK hynix PC401 NVMe 500 GB, IPS, 1920x1080, 14" | Acer Enduro Urban N3 EUN314 i7-1165G7, Iris Xe G7 96EUs, Samsung PM991 MZVLQ1T0HALB, IPS, 1920x1080, 14" | Panasonic Toughbook FZ-55 MK2 i7-1185G7, Iris Xe G7 96EUs, Toshiba KIOXIA KBG4AZNV512G M.2 2280 OPAL, IPS, 1920x1080, 14" | Durabook S14I i7-1165G7, Iris Xe G7 96EUs, UDinfo M2P M2P80DE512GBAEP, TN, 1920x1080, 14" | |
|---|---|---|---|---|---|---|
| Power Consumption | -38% | -25% | 27% | 6% | -22% | |
| Idle Minimum * (Watt) | 4.1 | 6.5 -59% | 4.8 -17% | 3.8 7% | 3.5 15% | 6.8 -66% |
| Idle Average * (Watt) | 11.7 | 15.1 -29% | 13.6 -16% | 8 32% | 10.4 11% | 16.4 -40% |
| Idle Maximum * (Watt) | 11.8 | 16.1 -36% | 13.8 -17% | 8.7 26% | 10.5 11% | 16.9 -43% |
| Load Average * (Watt) | 48.5 | 70.5 -45% | 67.8 -40% | 34.6 29% | 45.4 6% | 39.2 19% |
| Witcher 3 ultra * (Watt) | 44.3 | 68.1 -54% | 69.1 -56% | 35.4 20% | 43 3% | |
| Load Maximum * (Watt) | 91 | 95.2 -5% | 93.5 -3% | 45.4 50% | 99.3 -9% | 73.1 20% |
* ... Meglio usare valori piccoli
Power Consumption Witcher 3 / Stresstest
Power Consumption external Monitor
Durata della batteria
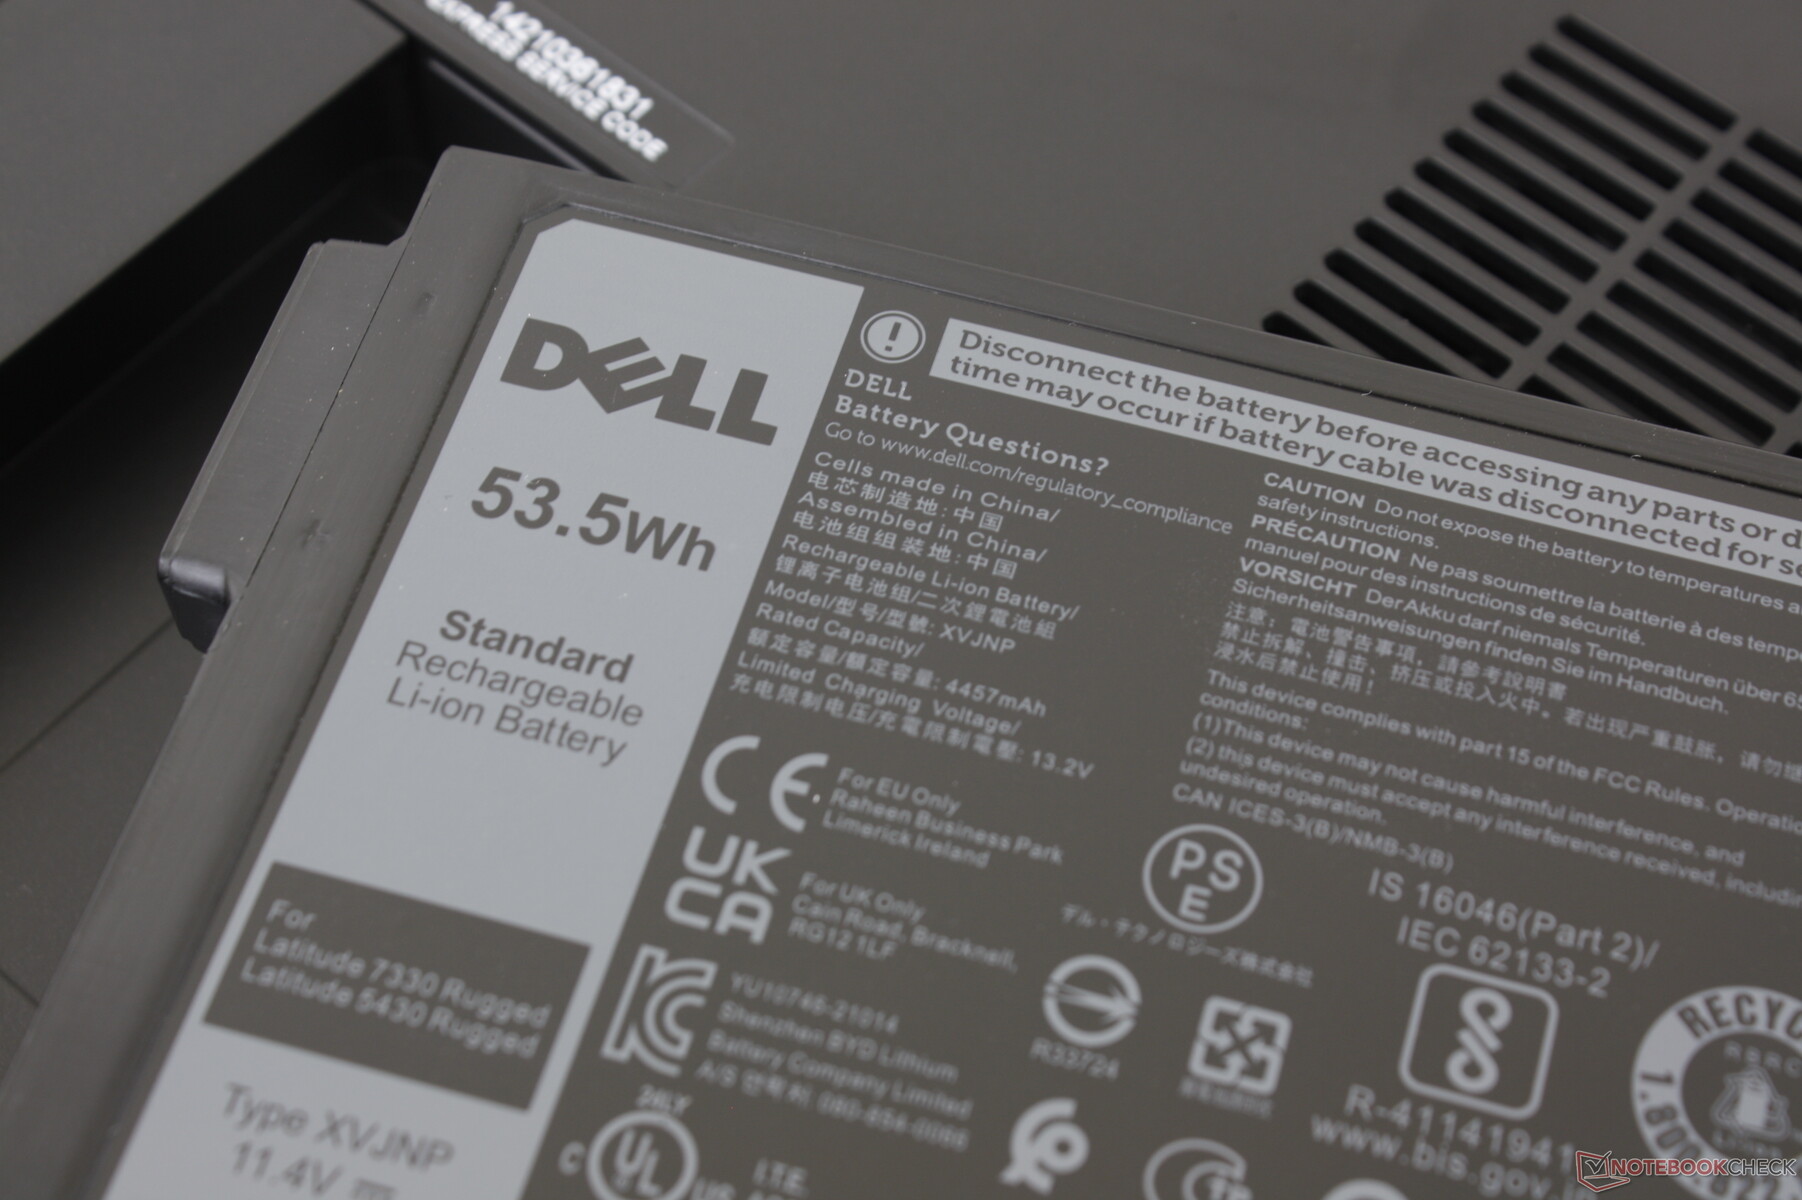
Aspettatevi tempi di esecuzione WLAN nel mondo reale di quasi 18 ore a 150-nit di luminosità del display quando entrambe le batterie da 53,5 Wh sono installate. Gli utenti possono funzionare con un solo pacco batterie per ridurre il peso, se lo desiderano. La ricarica da vuoto a piena capacità è relativamente lenta a più di 3 ore, tuttavia, rispetto alla metà della maggior parte degli Ultrabook consumer.
| Dell Latitude 7330 Rugged Extreme i7-1185G7, Iris Xe G7 96EUs, 107 Wh | Dell Latitude 7424 Rugged Extreme i7-8650U, Radeon RX 540, 102 Wh | Dell Latitude 5420 Rugged-P85G i7-8650U, Radeon RX 540, 102 Wh | Acer Enduro Urban N3 EUN314 i7-1165G7, Iris Xe G7 96EUs, 50.3 Wh | Panasonic Toughbook FZ-55 MK2 i7-1185G7, Iris Xe G7 96EUs, 71 Wh | Durabook S14I i7-1165G7, Iris Xe G7 96EUs, 50 Wh | |
|---|---|---|---|---|---|---|
| Autonomia della batteria | -35% | -10% | -64% | -24% | -69% | |
| WiFi v1.3 (h) | 18 | 11.7 -35% | 16.2 -10% | 6.4 -64% | 13.6 -24% | 5.5 -69% |
| Load (h) | 2.7 | 3.2 | ||||
| Reader / Idle (h) | 31.4 |
Pro
Contro
Verdetto
Il Latitude 7330 Rugged Extreme serve come standard per come dovrebbero essere gli altri portatili rugged. Le prestazioni della CPU sono elevate e senza strozzature, i tempi di esecuzione sono molto lunghi, l'adattatore AC USB-C è universale, il lettore di schede SD è estremamente veloce, e il rumore della ventola è quasi sempre silenzioso. La GPU integrata in particolare ha reso obsolete le vecchie GPU discrete come la Radeon RX 540.
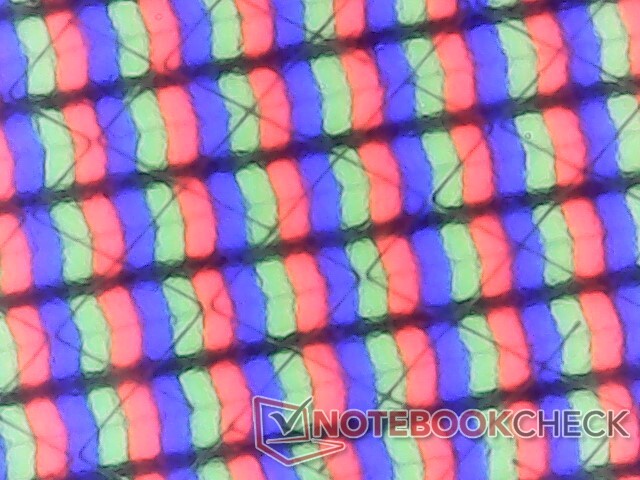
Una caratteristica degna di nota del modello è il suo touchscreen IPS di alta qualità. È raro trovare un portatile rugged con copertura completa sRGB, quasi nessun problema di granulosità, contrasto relativamente profondo, mancanza di PWM, e colori ben calibrati appena uscito dalla scatola. Anche se l'accuratezza dei colori non è una priorità, gli utenti probabilmente apprezzeranno ancora quanto sia buono il display considerando la concorrenza.
Gli svantaggi sono per lo più minori. Lo slot MicroSD è di difficile accesso, il ghosting è prevalente, e la retroilluminazione della tastiera è solo bianca senza altre opzioni di colore. Il modello è anche più pesante di molti portatili rugged da 14 pollici e quindi gli utenti non dovrebbero aspettarsi che il Latitude 7330 Rugged Extreme sia più leggero solo perché è un fattore di forma più piccolo. Ci piacerebbe vedere più accessori hot-swappable come il Getac B360 per una maggiore versatilità.
Prezzo e disponibilità
Dell sta attualmente spedendo il suo modello Latitude 7330 Rugged Extreme in tutte le configurazioni con un prezzo di partenza di $4350 USD.
Price comparison

