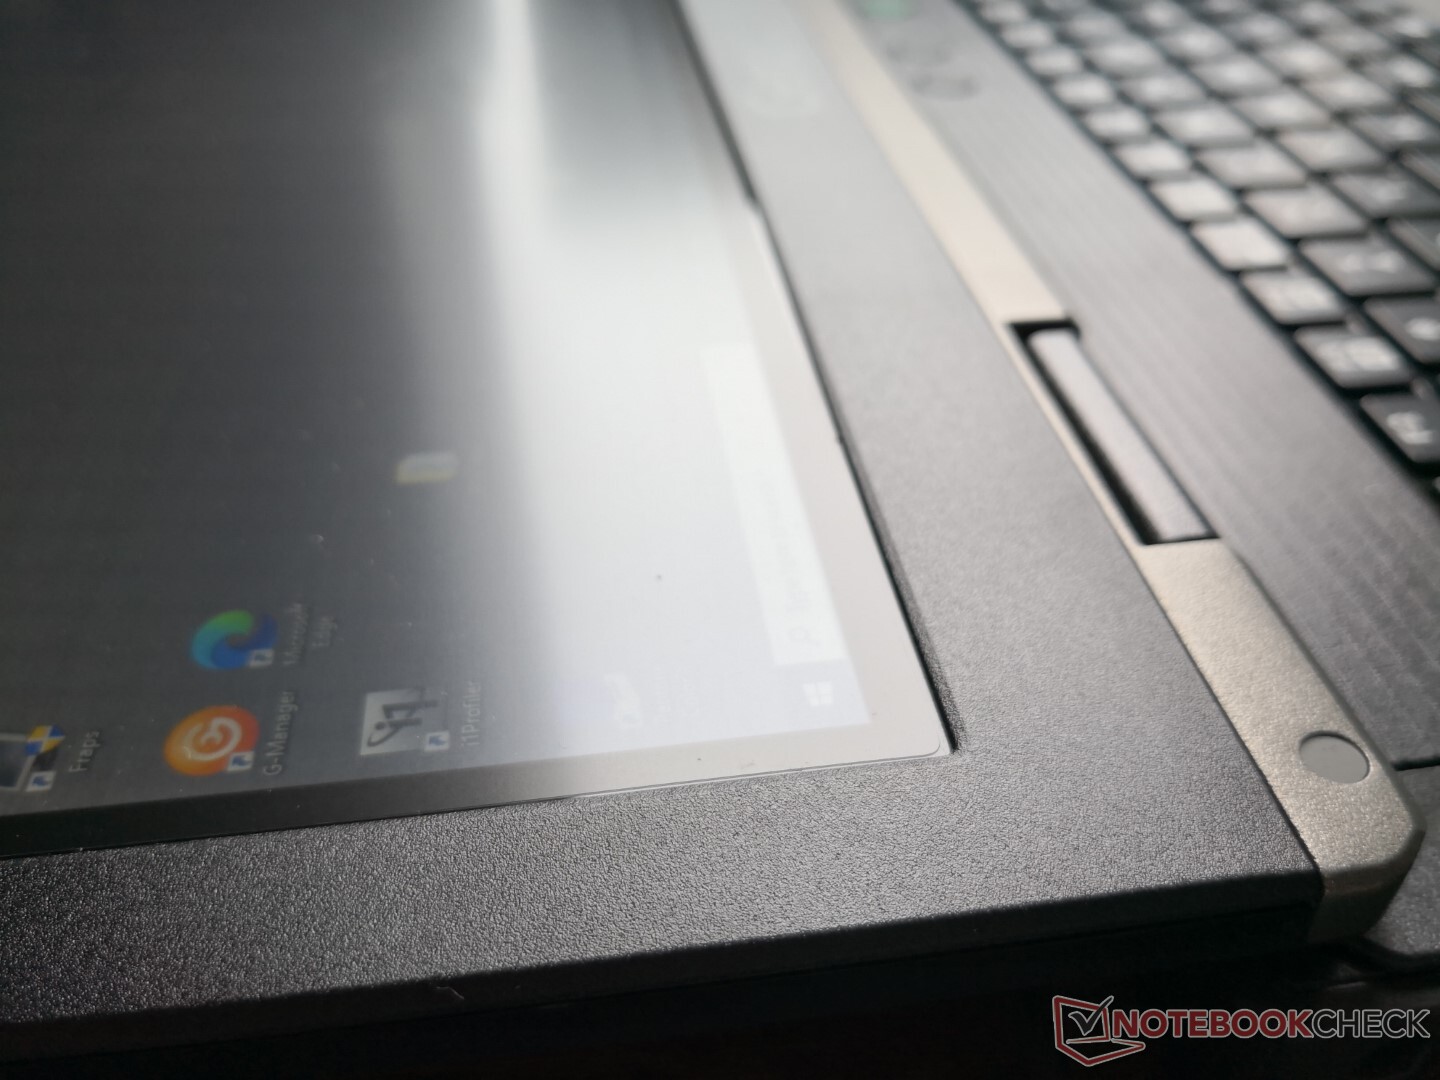
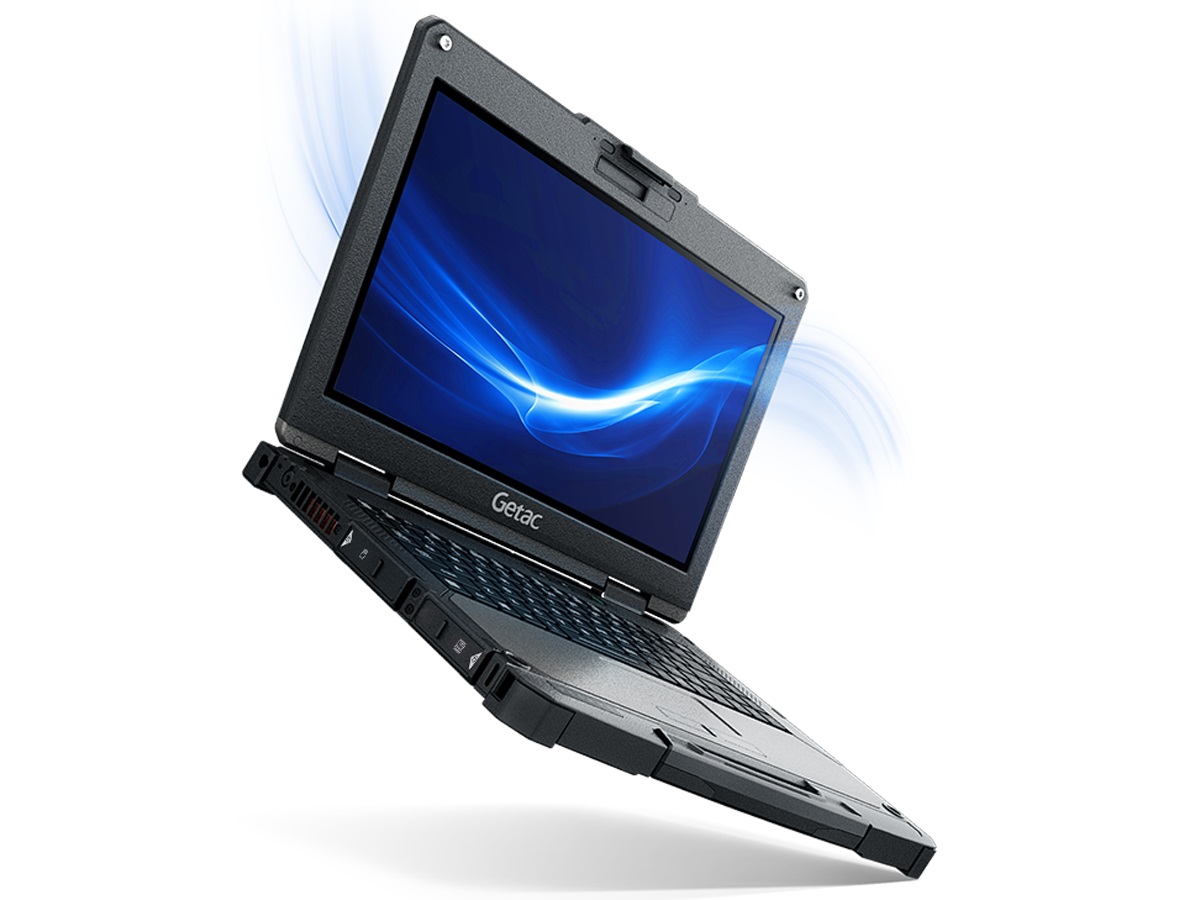
Recensione del portatile rugged Getac B360: Luminoso touchscreen da 1400 nit
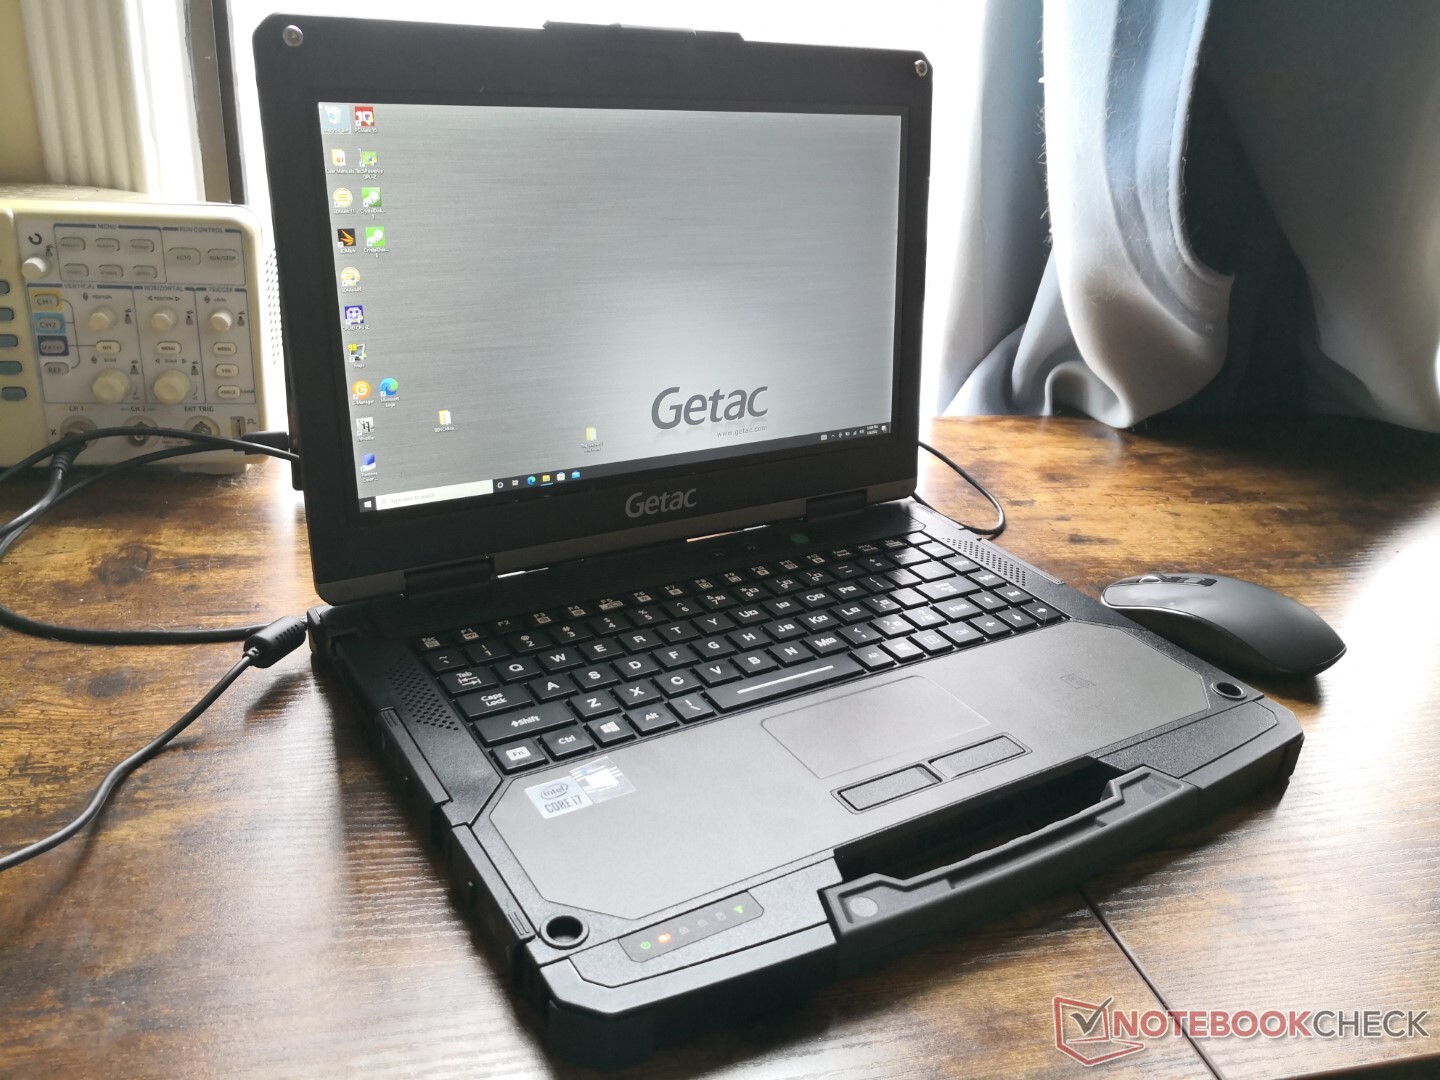
Il Getac B360 è un portatile da 13,3 pollici completamente robusto che integra molte delle moderne caratteristiche di connettività e degli aggiornamenti che ci aspettiamo dai dispositivi consumer. È il primo portatile rugged nel nostro database per questa particolare classe di dimensioni, dato che la maggior parte dei modelli rugged sono tipicamente da 14 pollici o più grandi. Consigliamo di controllare la pagina ufficiale del prodotto qui o il foglio delle specifiche completo qui sotto per tutte le opzioni disponibili oltre all'unità che abbiamo qui per la recensione
Altre recensioni di Getac:

Potential Competitors in Comparison
Punteggio | Data | Modello | Peso | Altezza | Dimensione | Risoluzione | Prezzo |
|---|---|---|---|---|---|---|---|
| 83.8 % v7 (old) | 01/2022 | Getac B360 i7-10710U, UHD Graphics 620 | 2.4 kg | 34.9 mm | 13.30" | 1920x1080 | |
| 89.2 % v6 (old) | 03/2019 | Dell Latitude 5420 Rugged-P85G i7-8650U, Radeon RX 540 | 2.8 kg | 32.9 mm | 14.00" | 1920x1080 | |
| 81.9 % v6 (old) | 10/2018 | Getac S410 i5-8550U, UHD Graphics 620 | 3.2 kg | 34.9 mm | 14.00" | 1366x768 | |
| 82.4 % v7 (old) | 12/2021 | Acer Enduro Urban N3 EUN314 i7-1165G7, Iris Xe G7 96EUs | 1.8 kg | 21.95 mm | 14.00" | 1920x1080 | |
| 83.9 % v7 (old) | 09/2021 | Panasonic Toughbook FZ-55 MK2 i7-1185G7, Iris Xe G7 96EUs | 2.3 kg | 33 mm | 14.00" | 1920x1080 | |
v (old) | 04/2021 | Durabook S14I i7-1165G7, Iris Xe G7 96EUs | 3 kg | 38.1 mm | 14.00" | 1920x1080 |
Caso
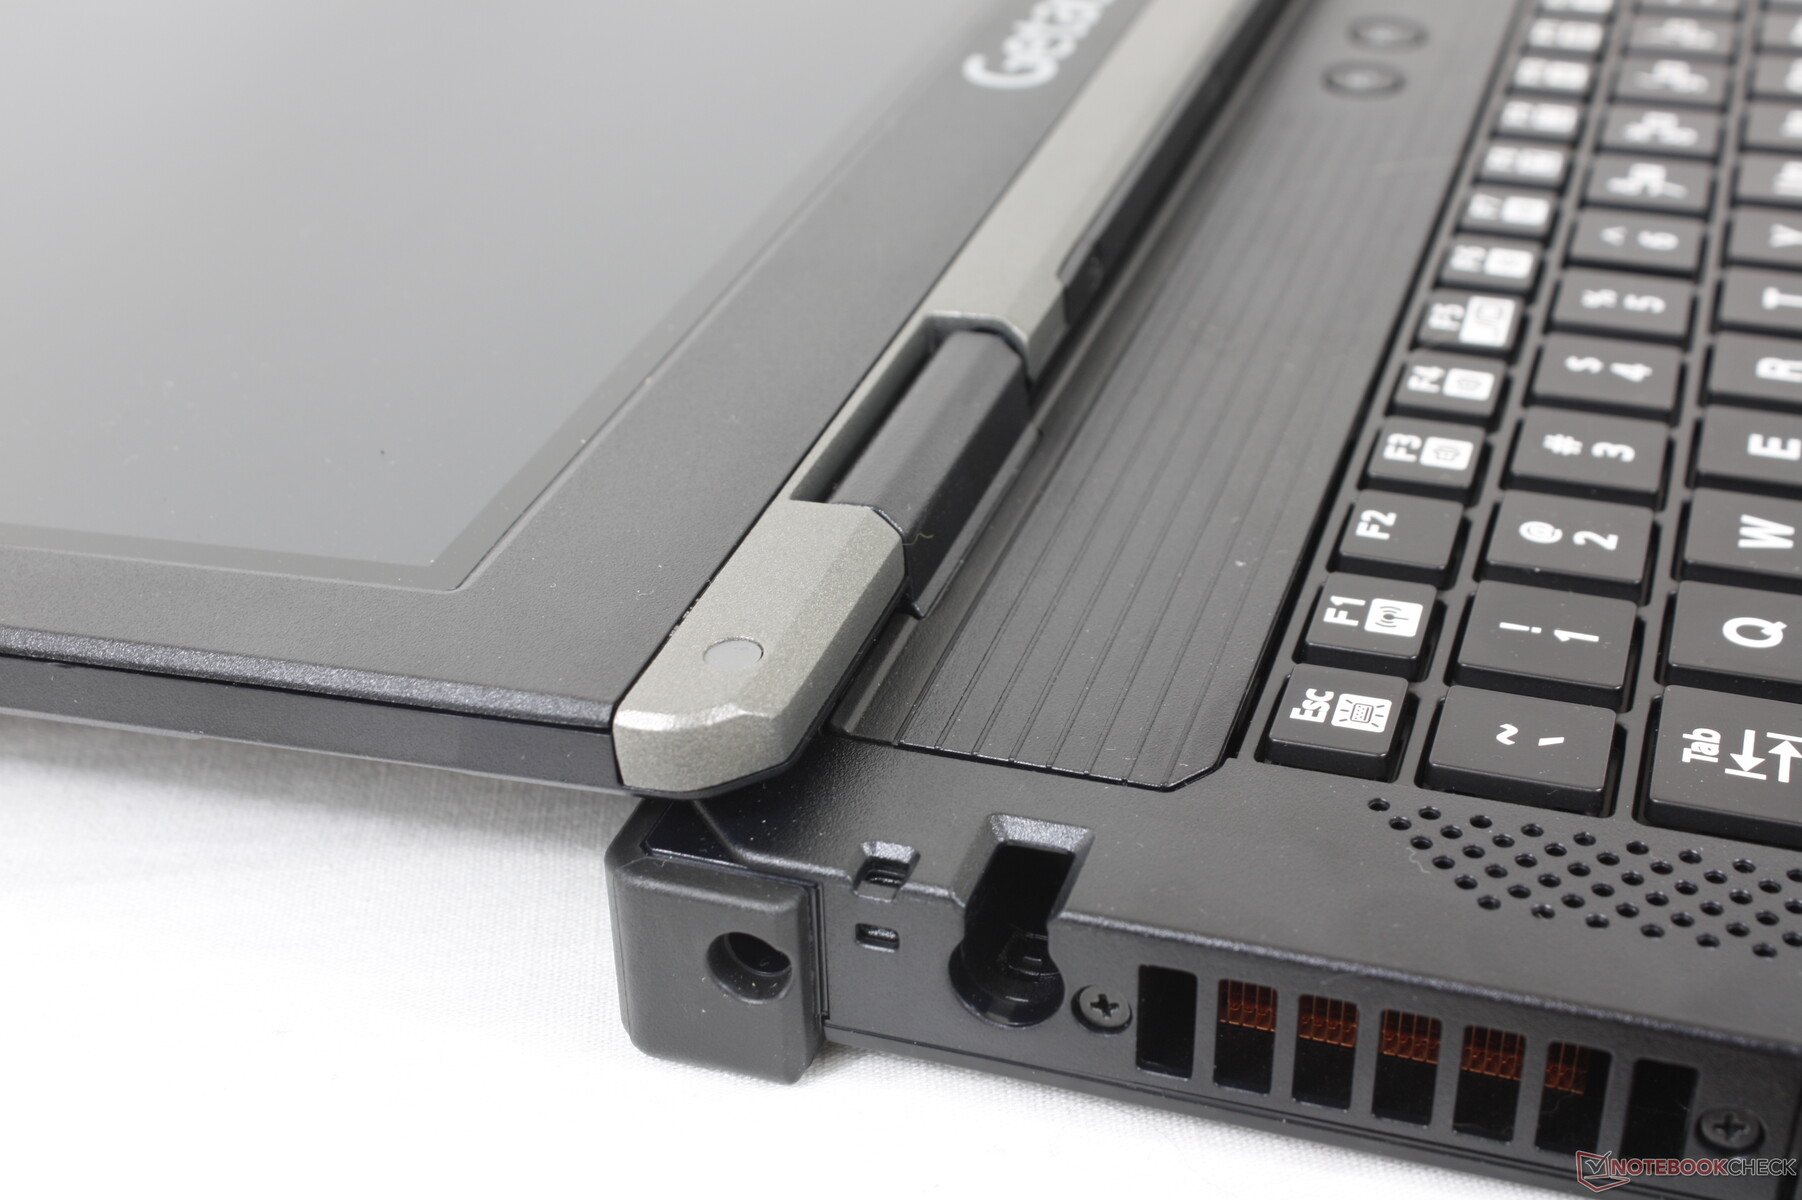
Nonostante offra uno schermo più piccolo del Panasonic Toughbook FZ-55 da 14 pollici o del Getac S410, il B360 è effettivamente più pesante e più spesso di entrambi i modelli. Il telaio supera le certificazioni MIL-STD 810H e IP66.
Connettività
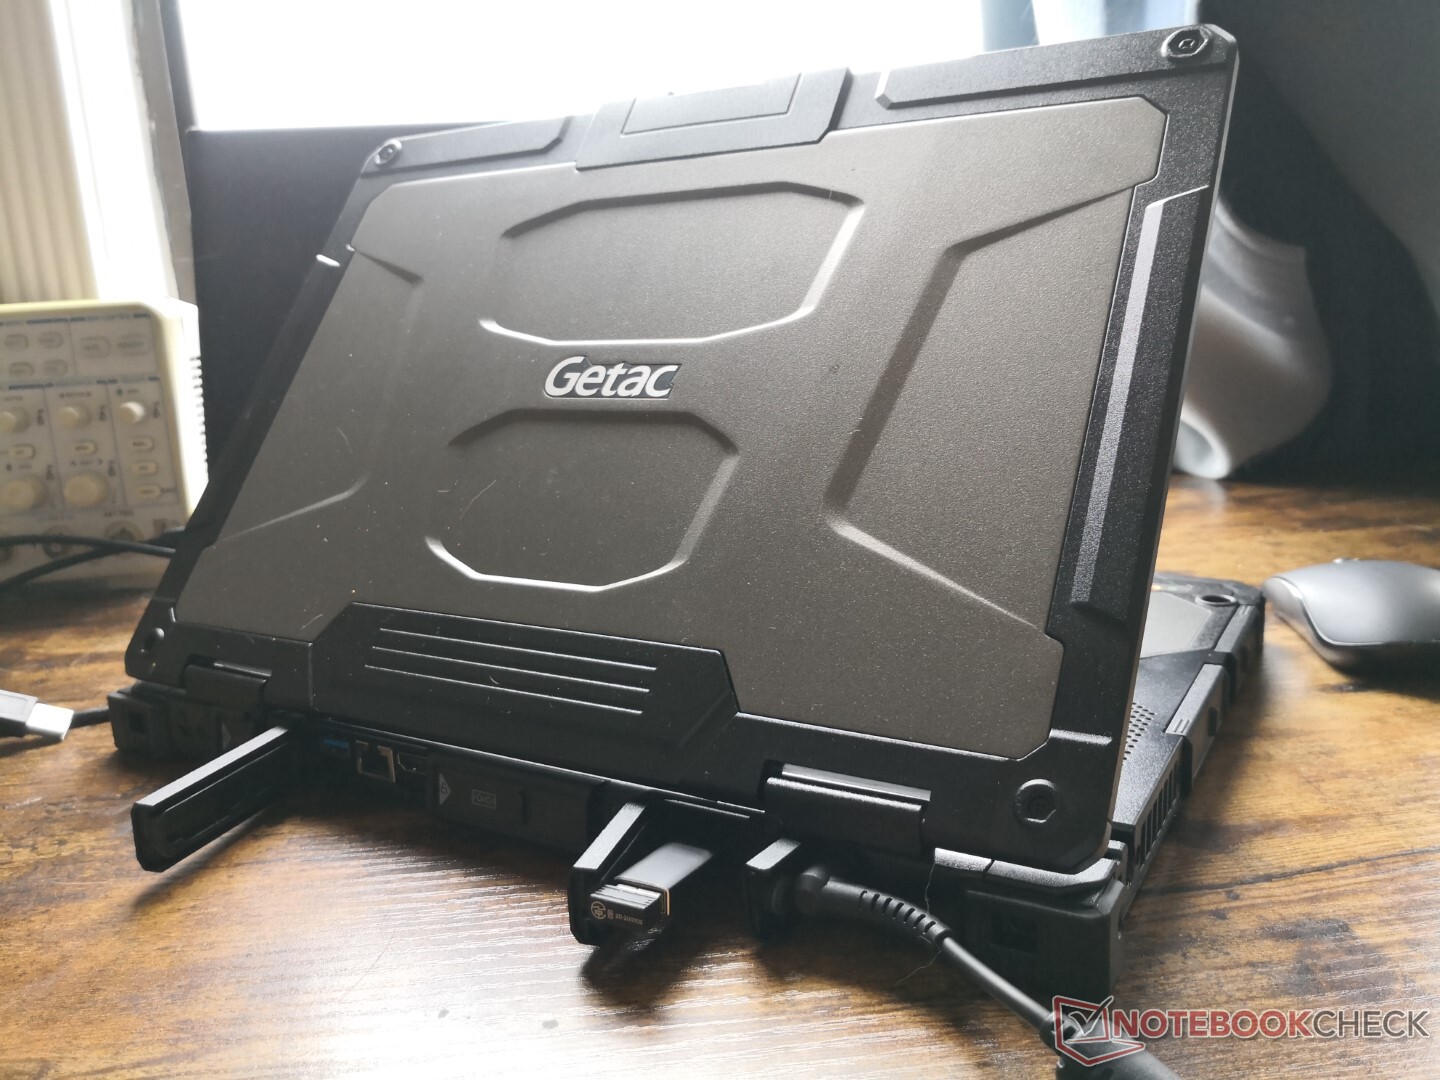
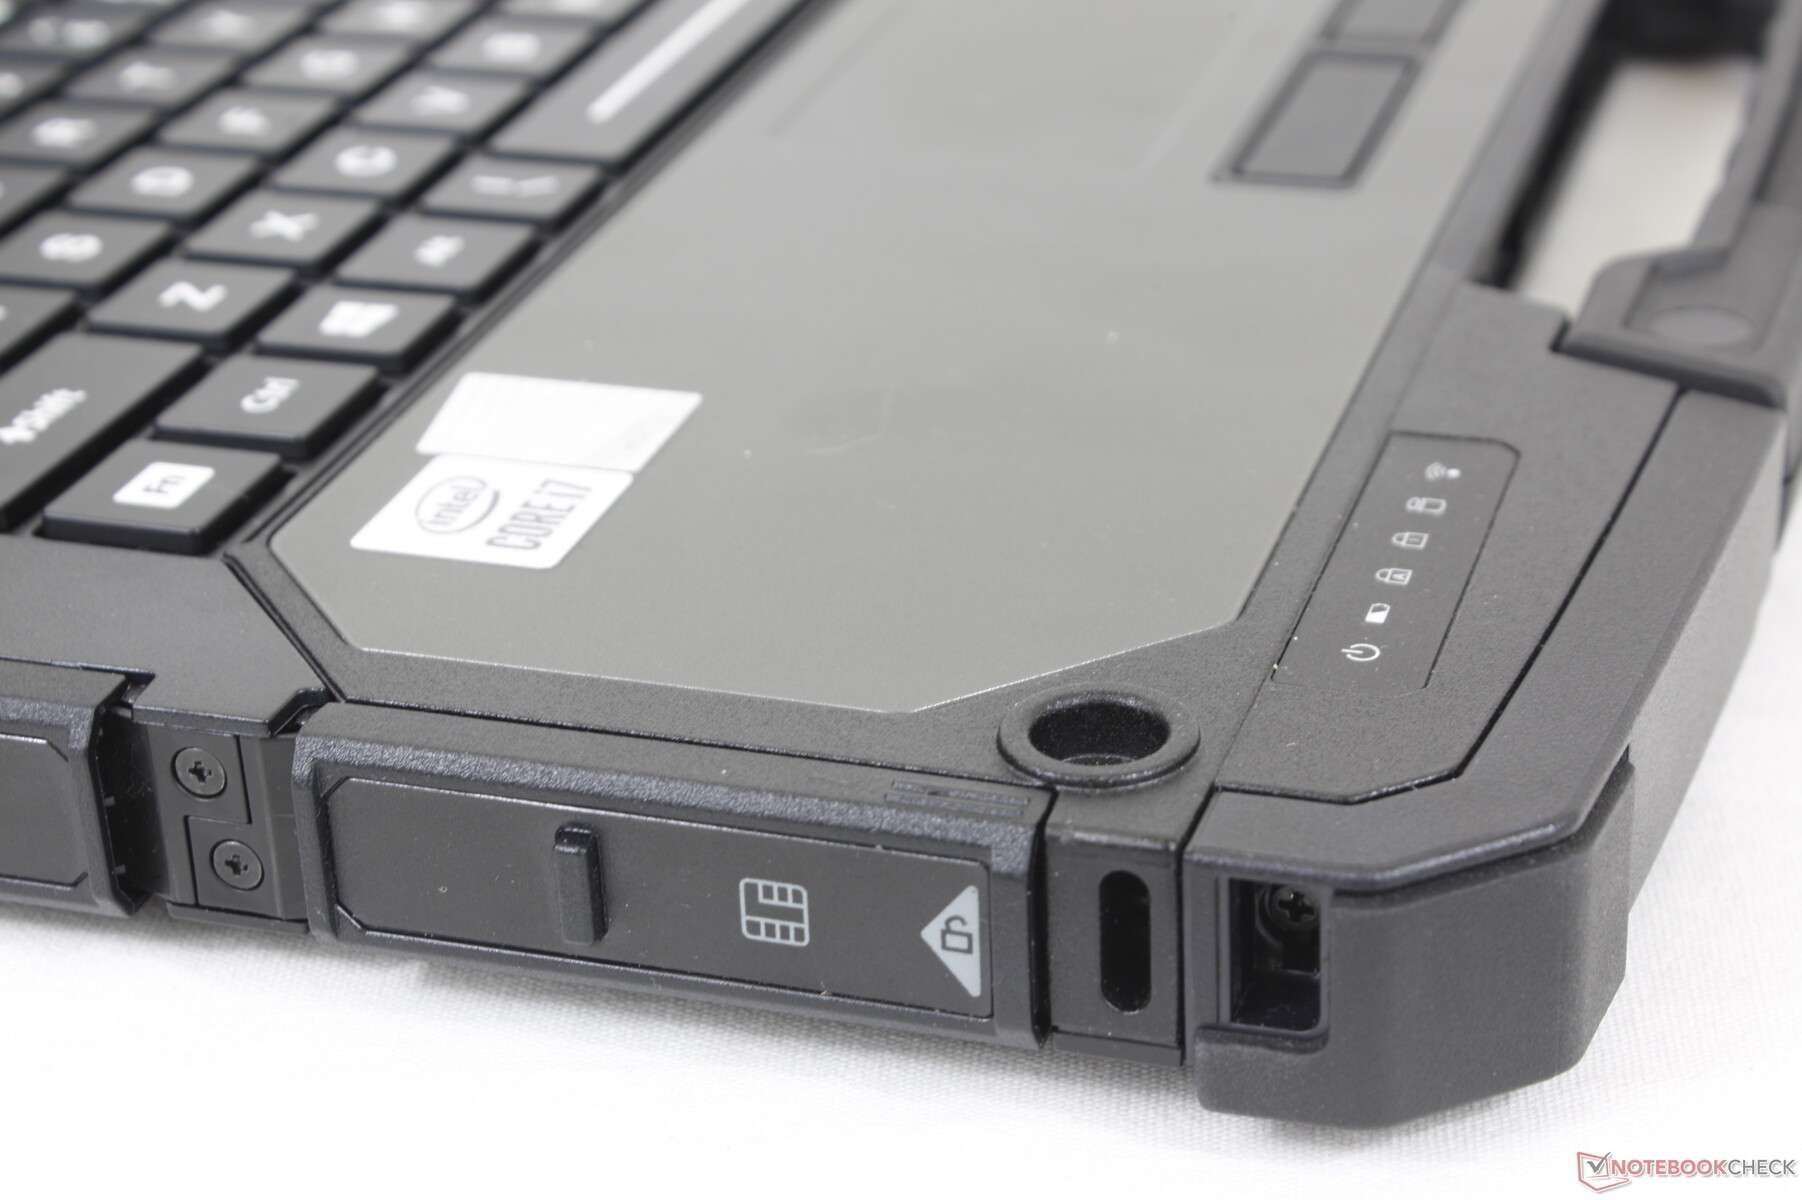
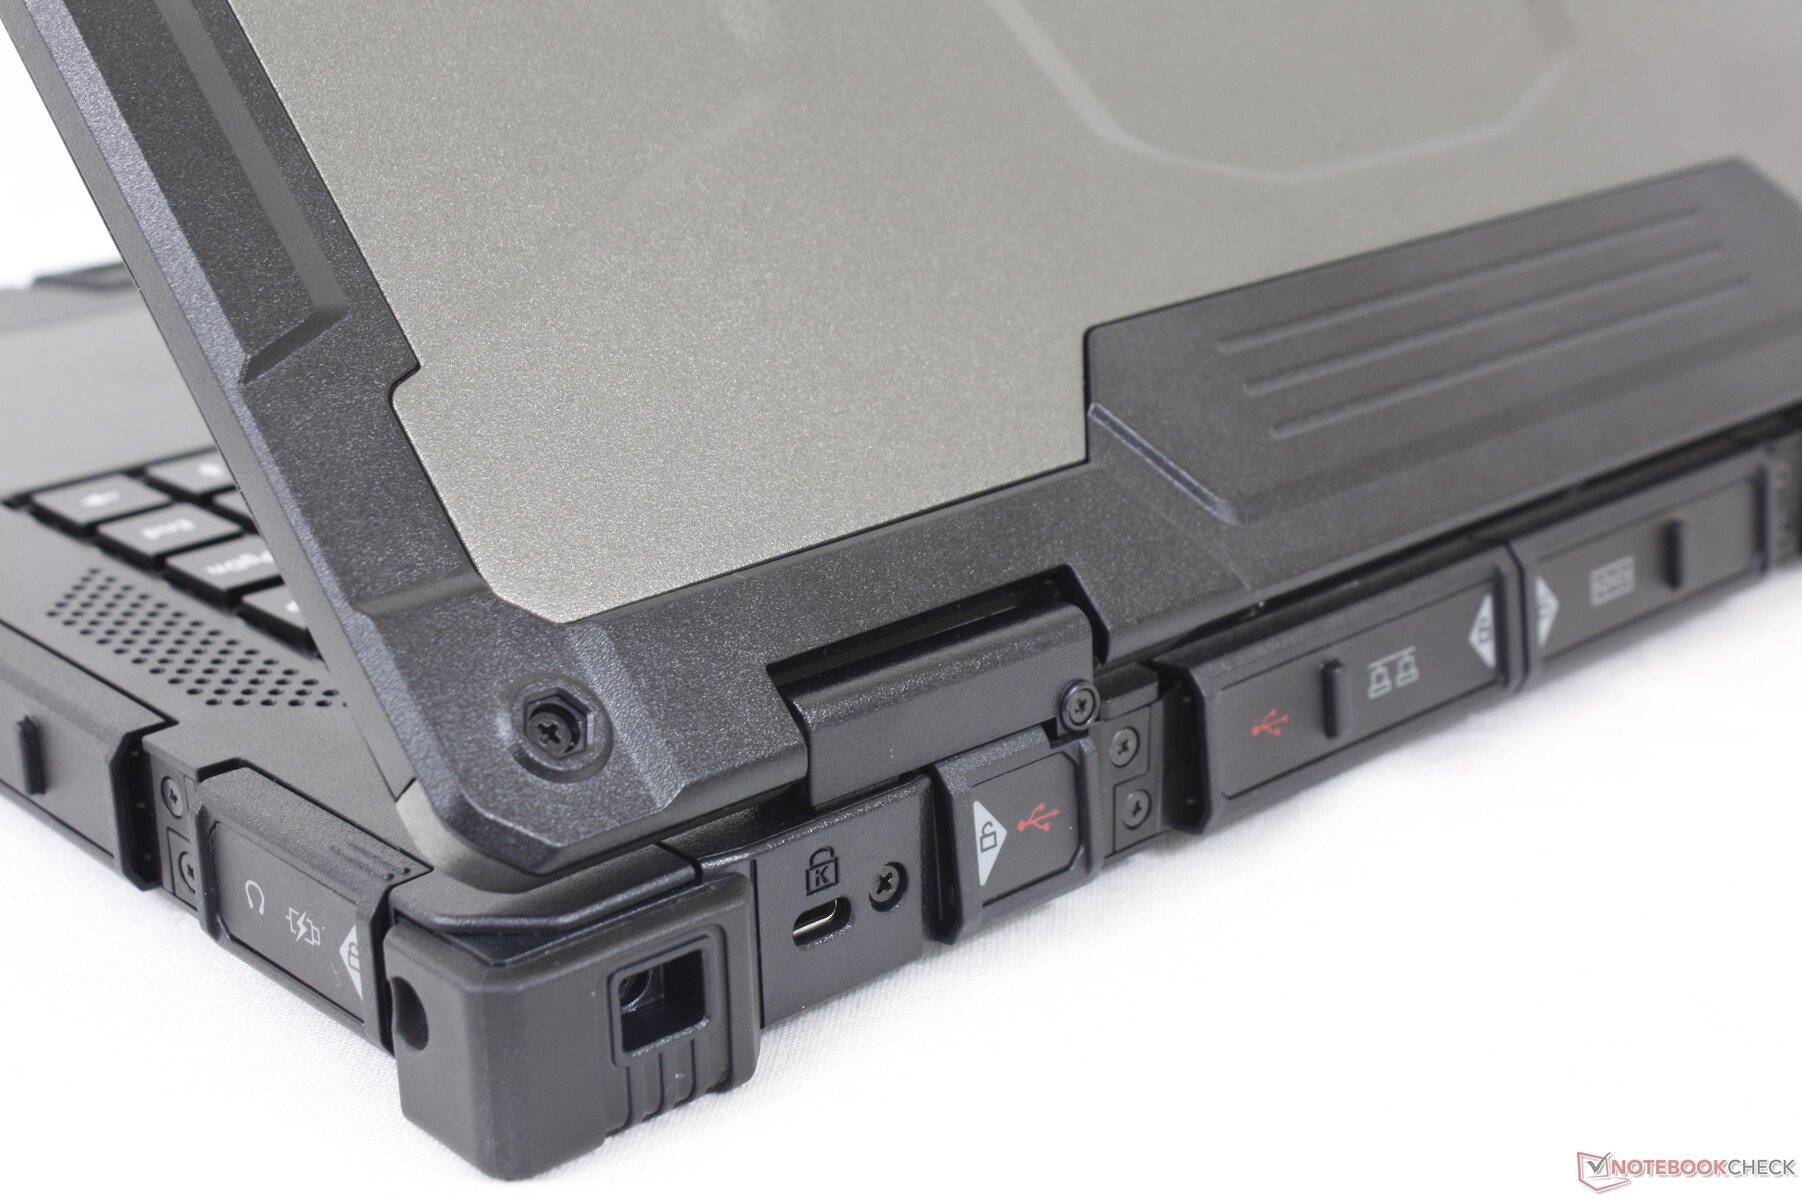
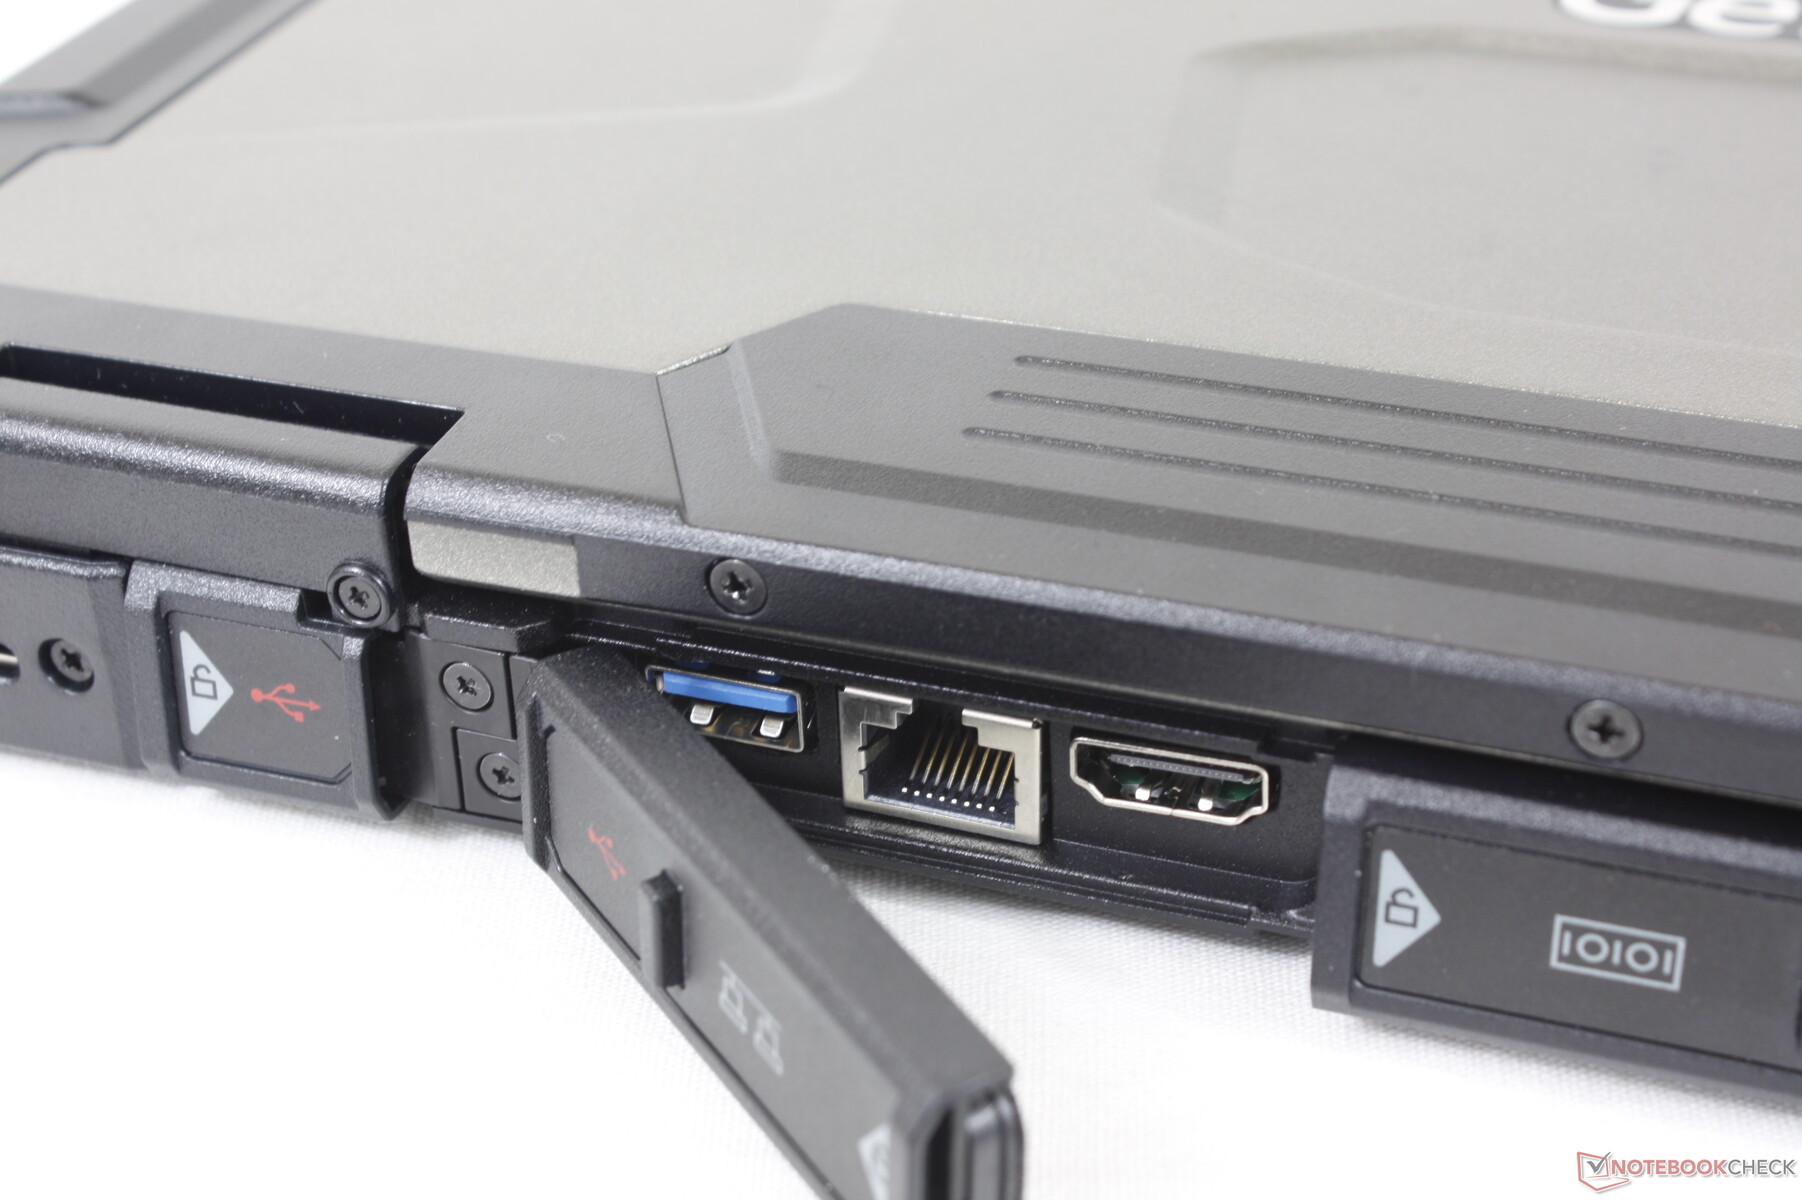
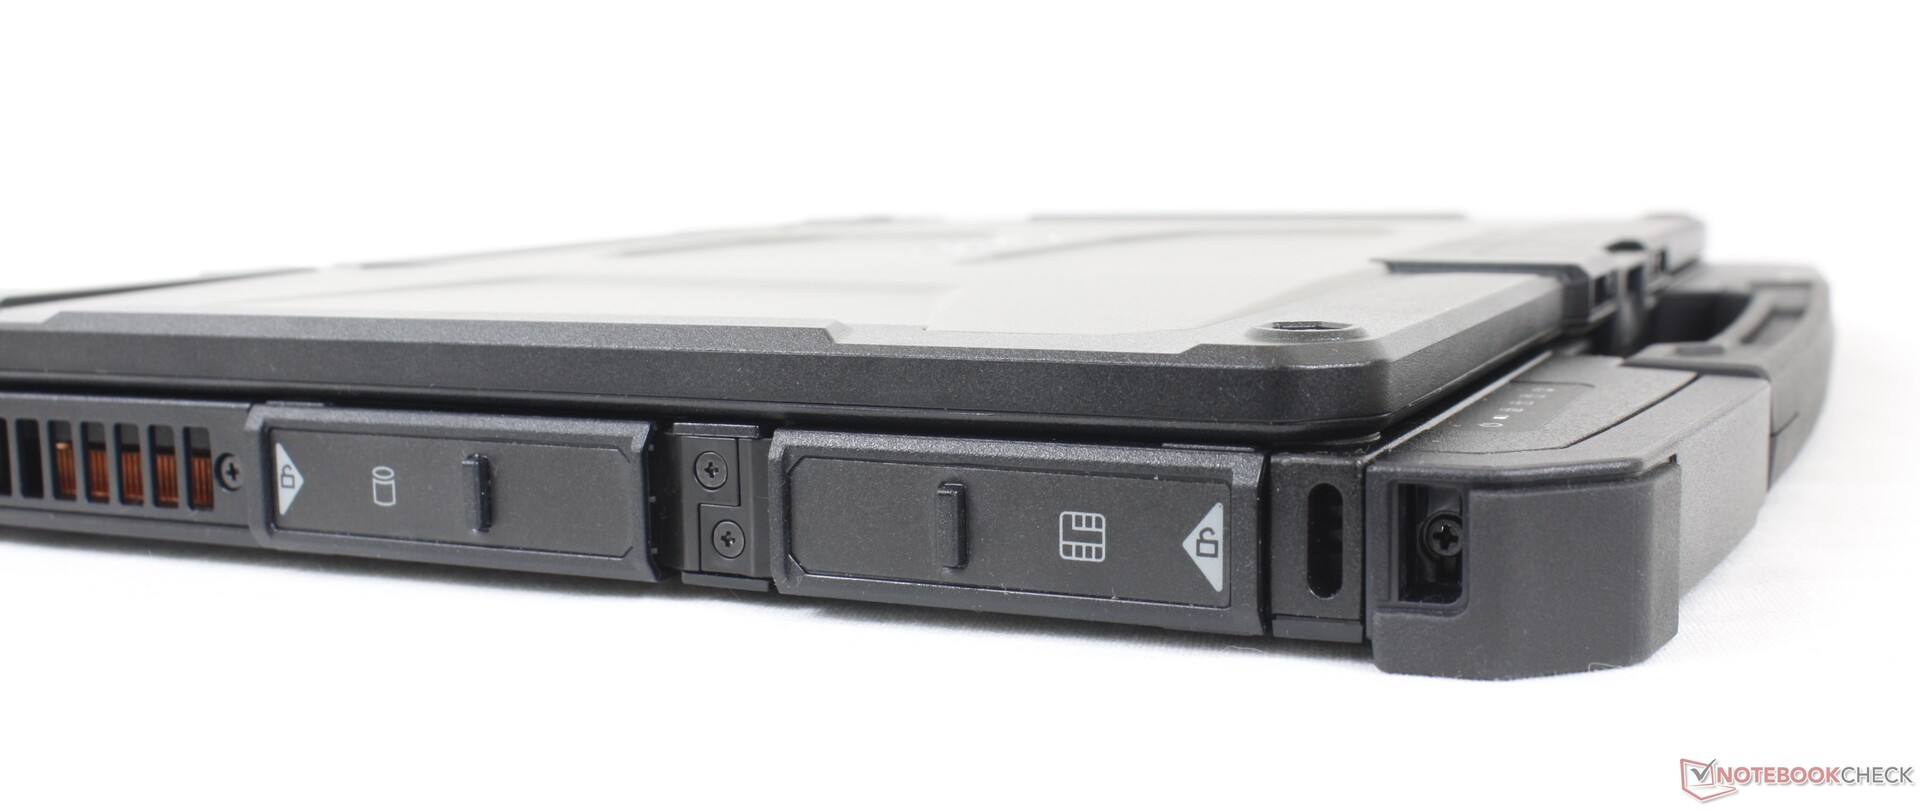
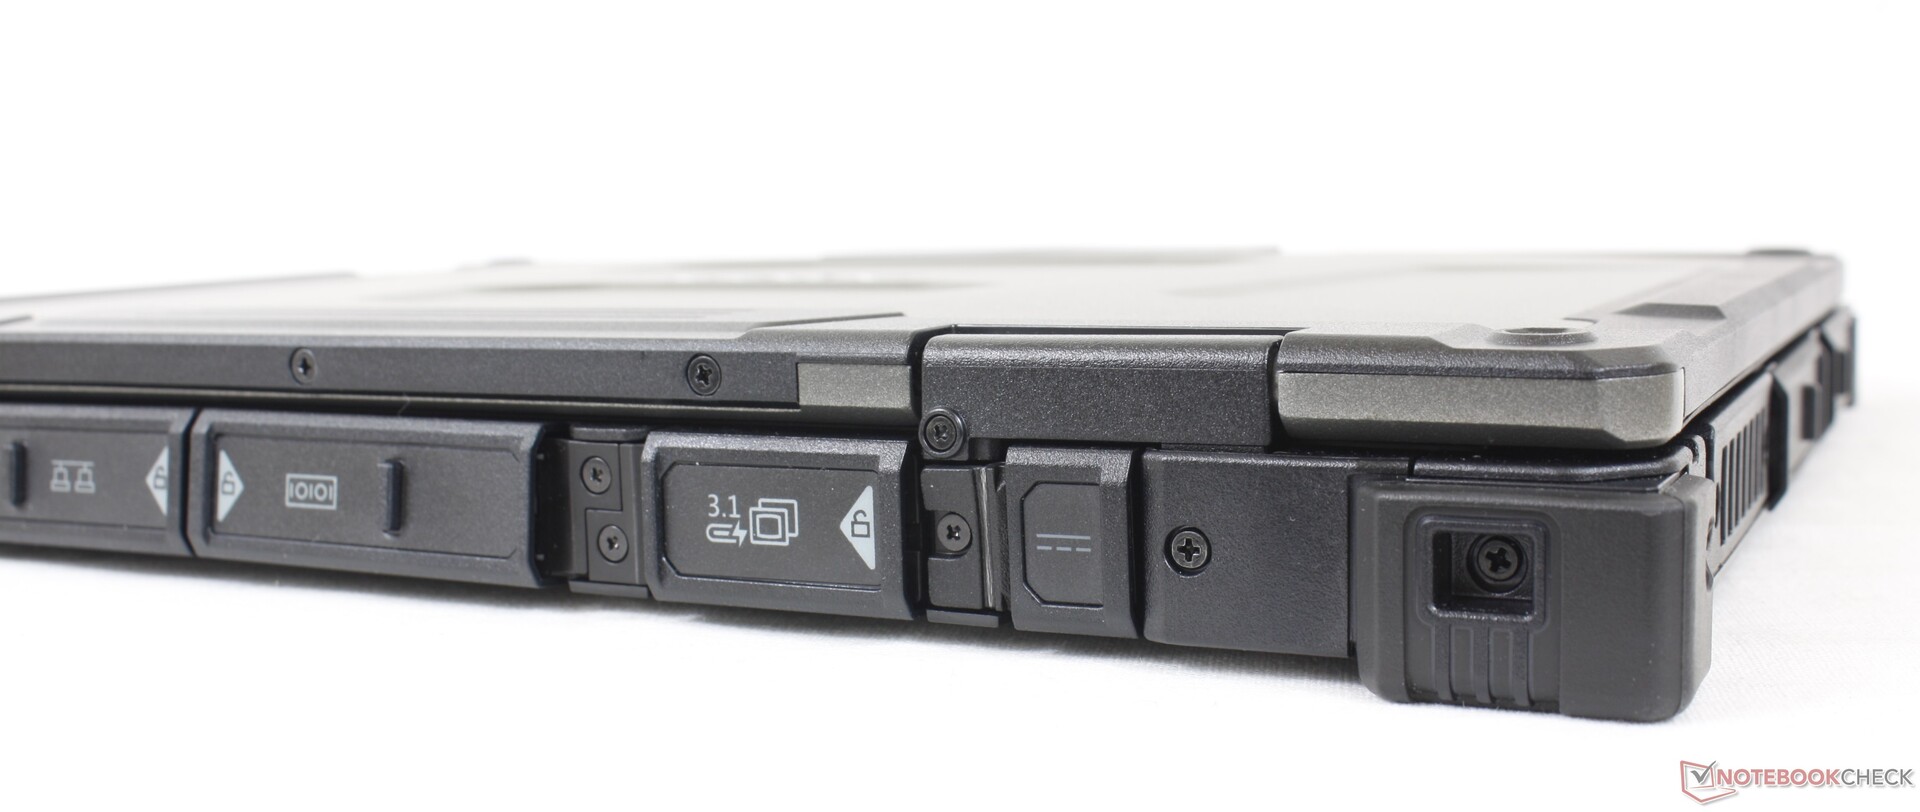
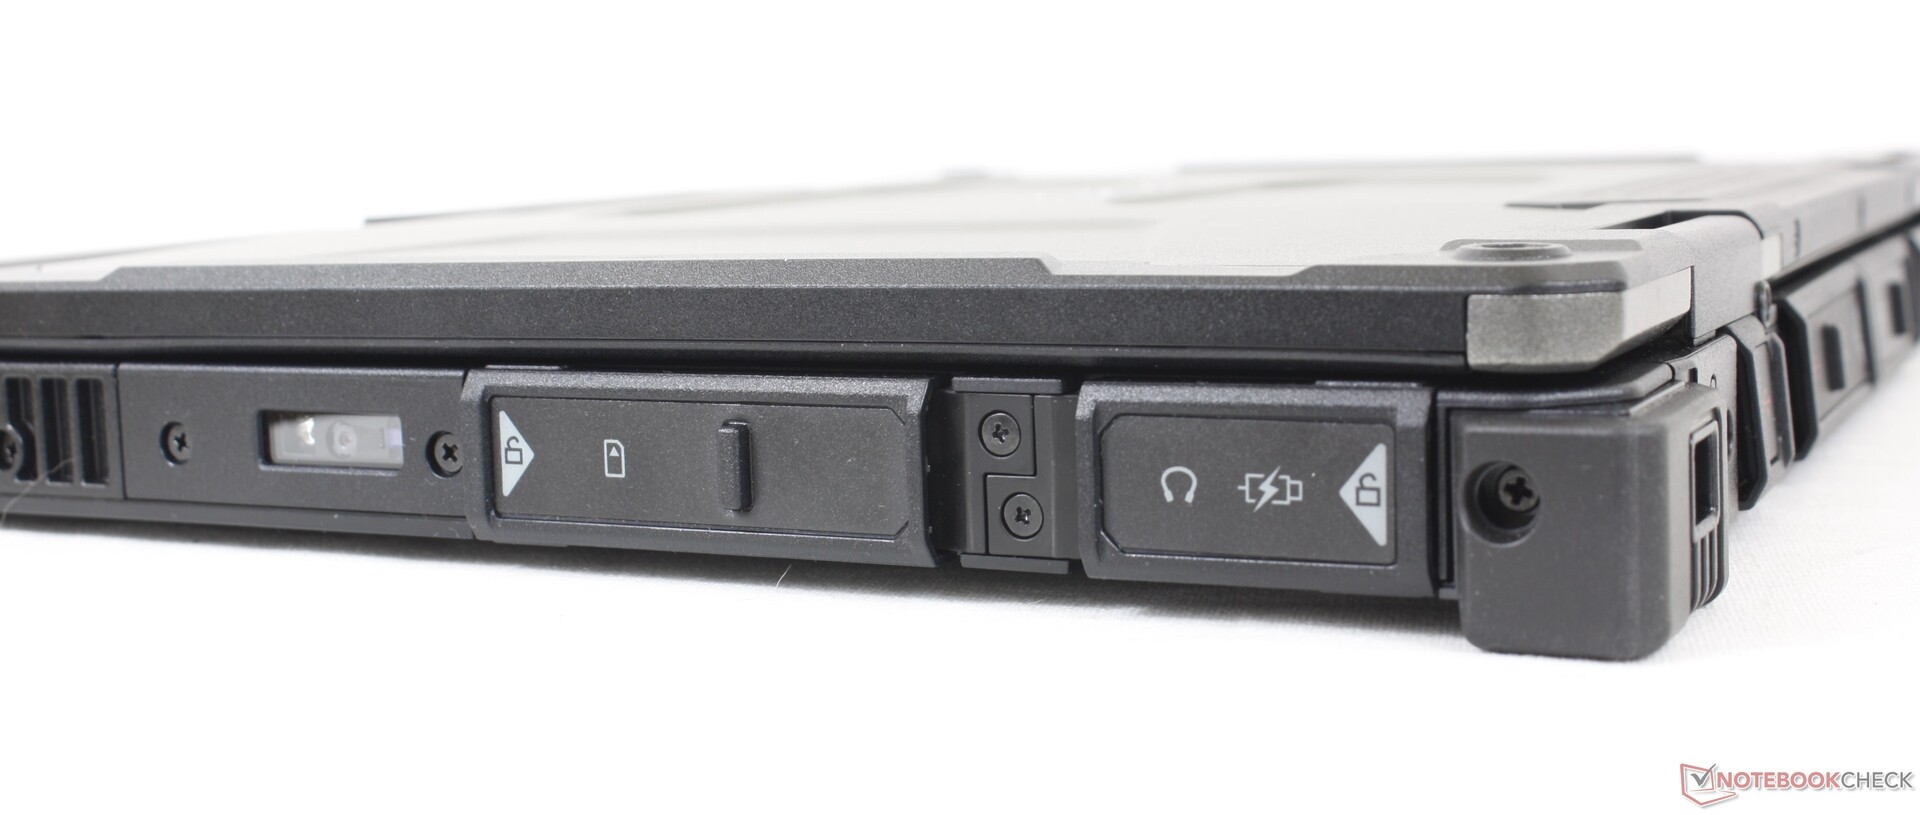
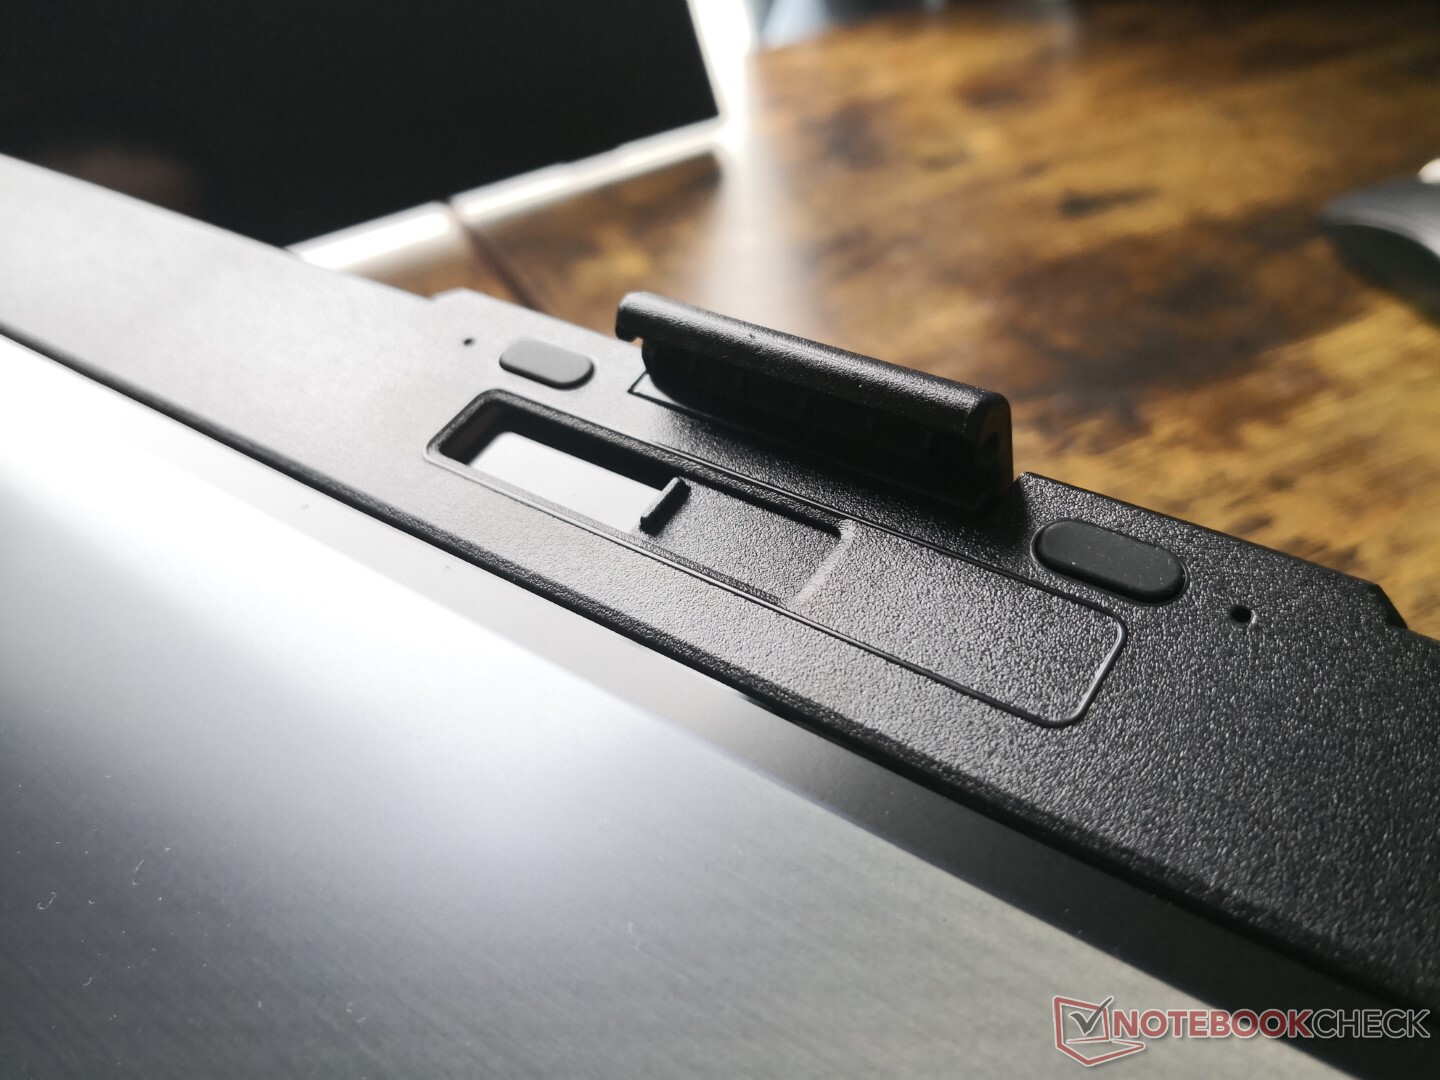
Unici al B360 sono i due scomparti M.2 2280 accessibili lungo il bordo sinistro del sistema che sostituiscono lo scomparto da 2,5 pollici sul più grande S410. La maggior parte delle altre porte sono lungo la parte posteriore del sistema e possono essere difficili da raggiungere soprattutto perché sono protette da piccole coperture che sono difficili da afferrare.
Comunicazione
Webcam
Una webcam 1080p viene fornita di serie per avere una risoluzione più alta rispetto alle solite webcam 720p della maggior parte degli altri portatili. I colori rimangono subparalleli e l'IR è opzionale per il supporto di Windows Hello.


Manutenzione
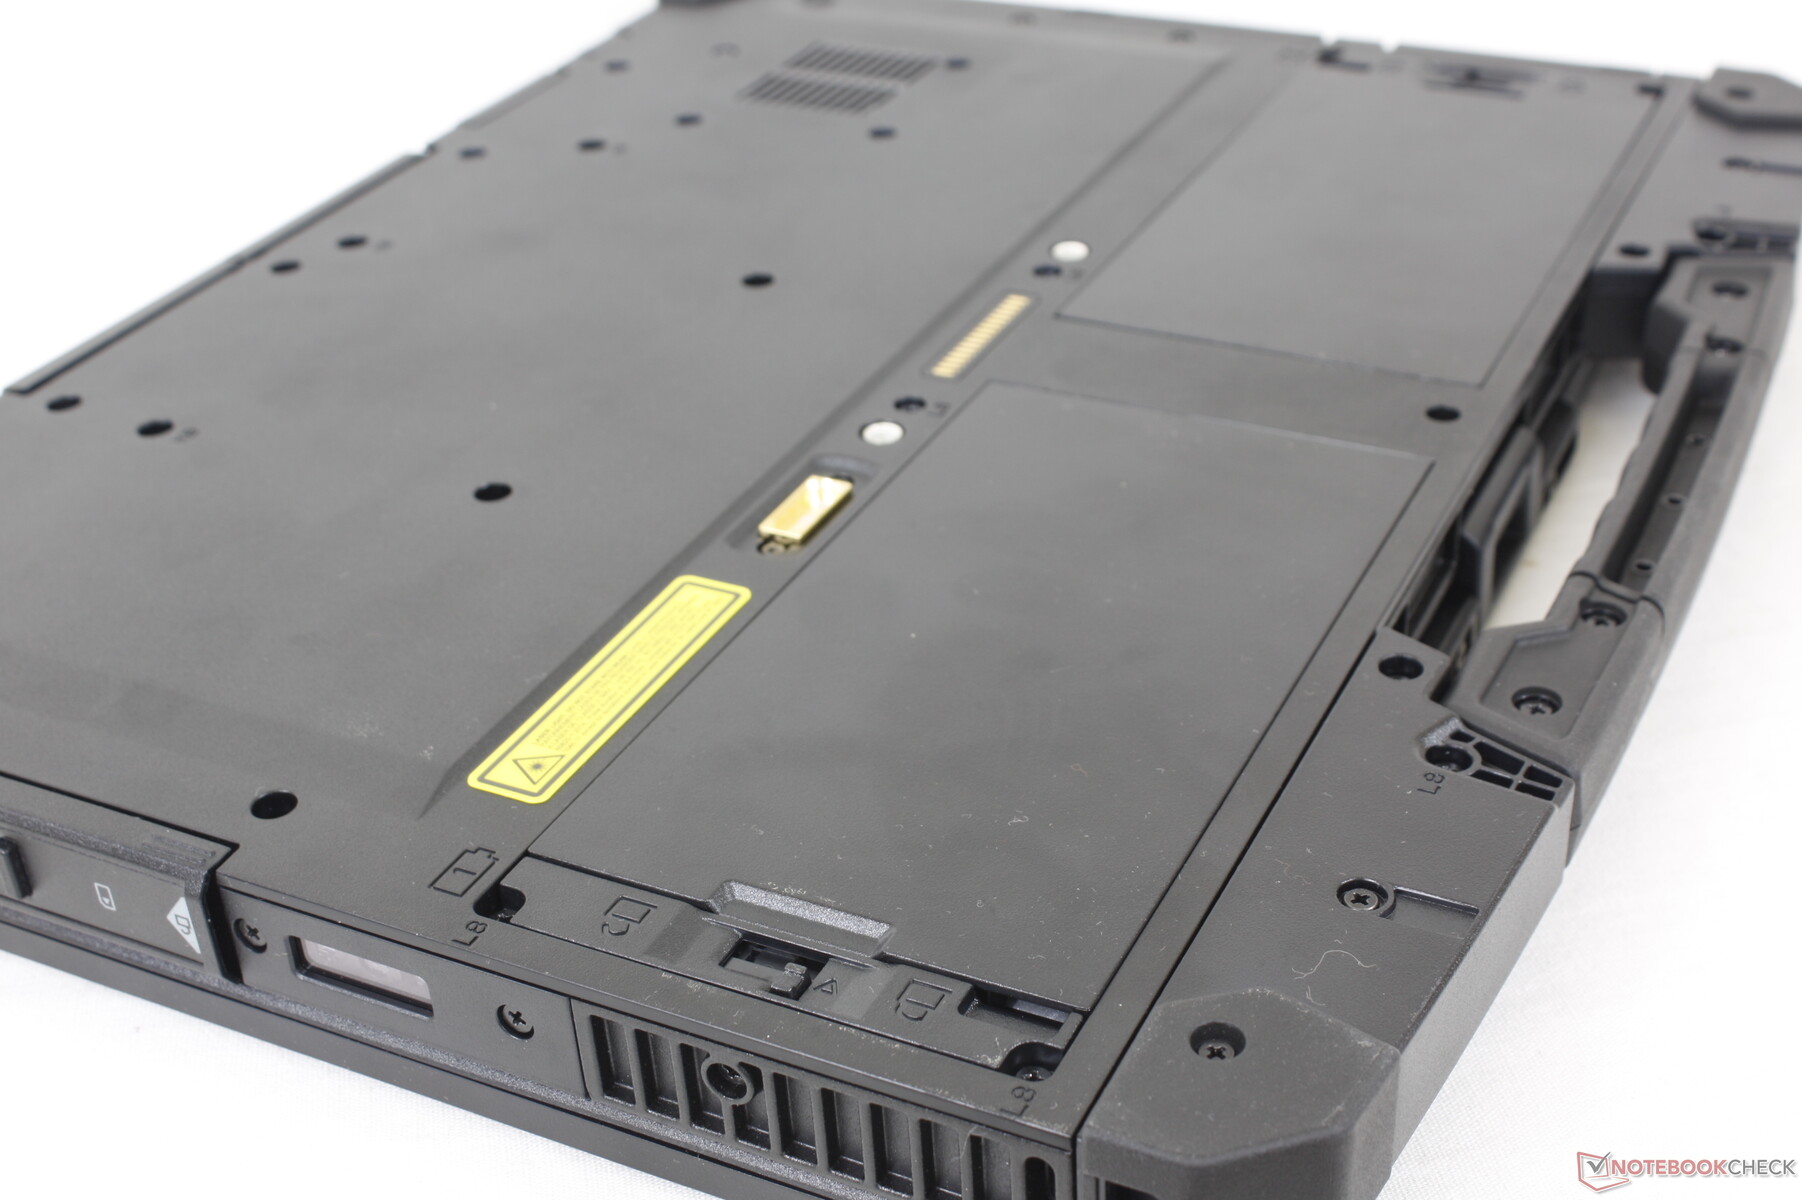
Getac non raccomanda di rimuovere il pannello inferiore per qualsiasi tipo di manutenzione o aggiornamento. Il fatto che il fondo sia assicurato da non meno di 34 (!) viti è già un indizio che la produzione sta scoraggiando l'armeggiare dell'utente finale.
Accessori e garanzia
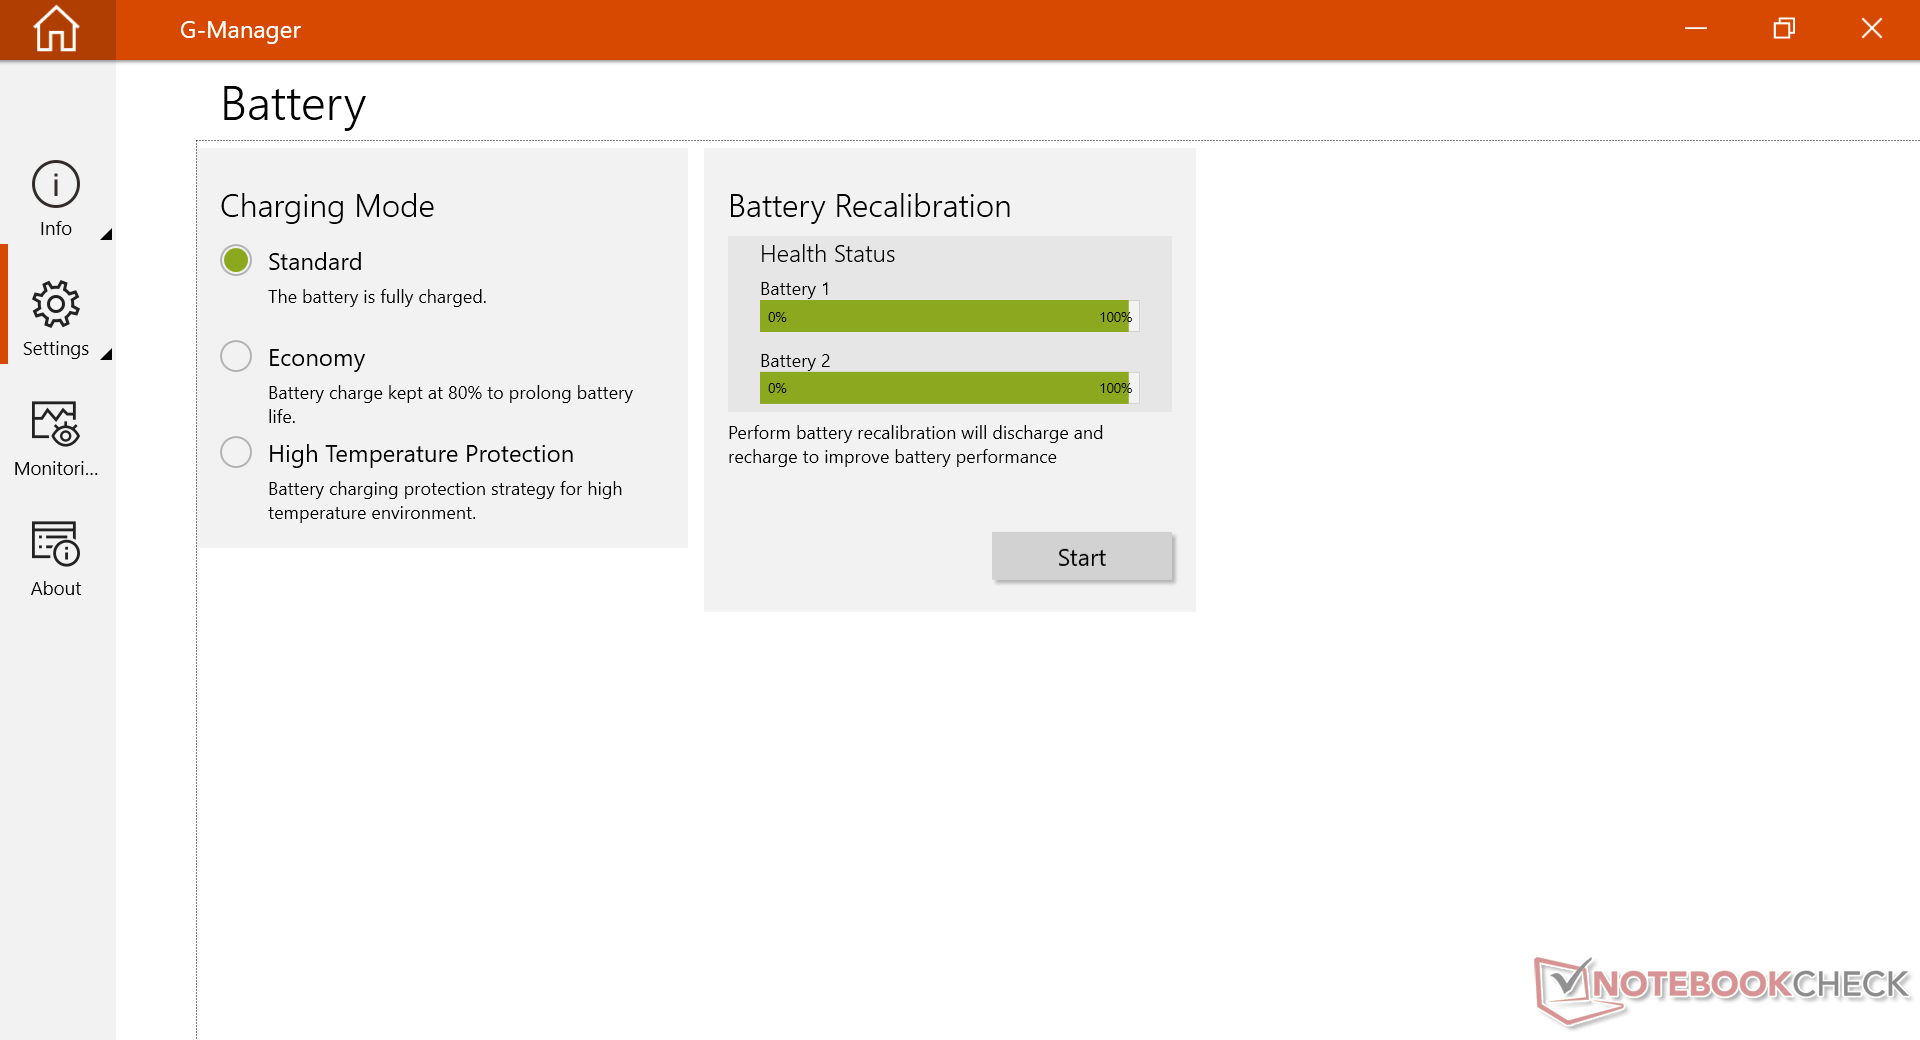
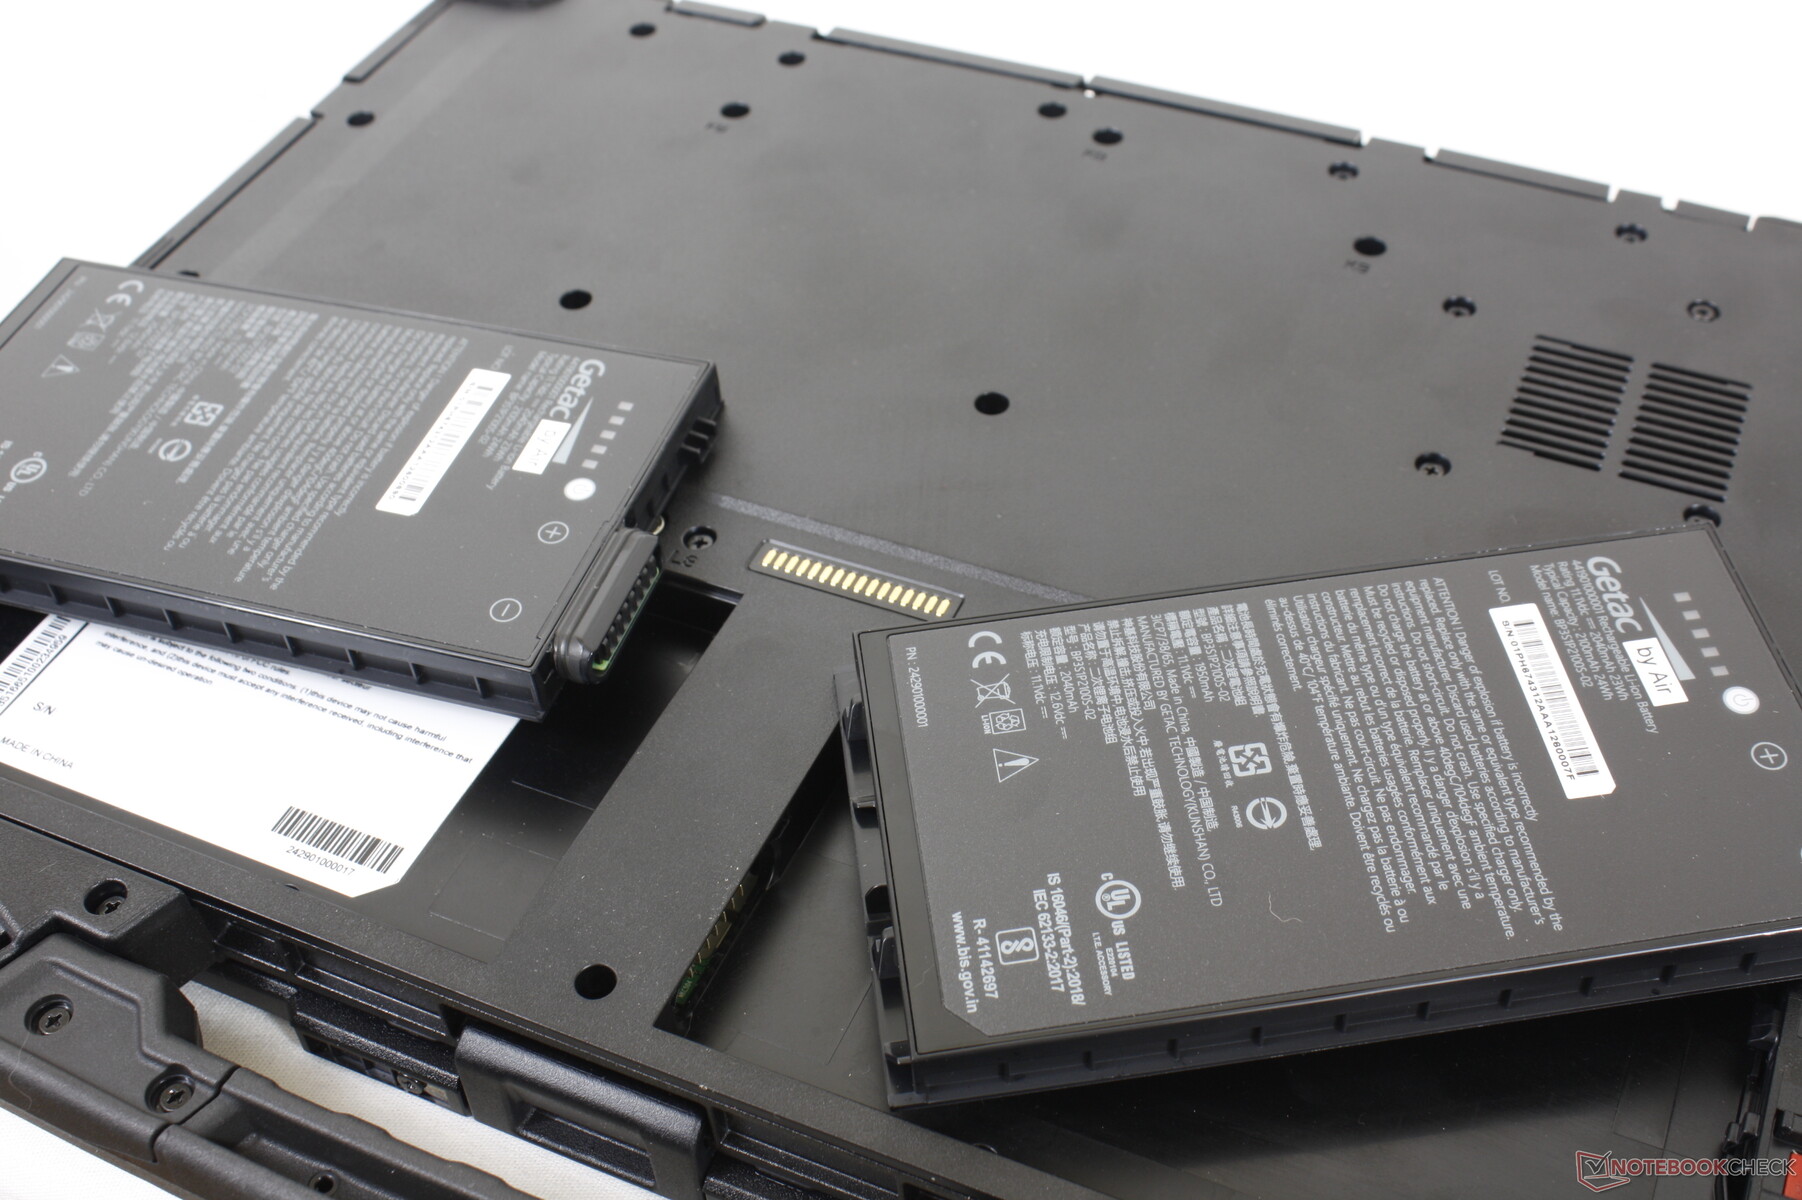
La confezione di base include una penna stilo passiva, le due batterie rimovibili, e la solita documentazione e l'adattatore AC. Una garanzia limitata di 3 anni è standard.
Sono disponibili ulteriori accessori che sfruttano i perni proprietari sul fondo dell'unità.
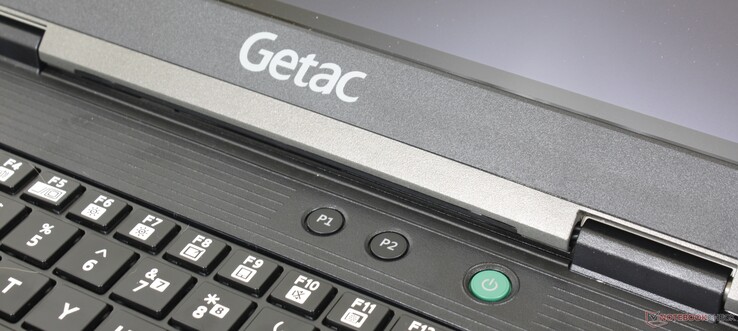
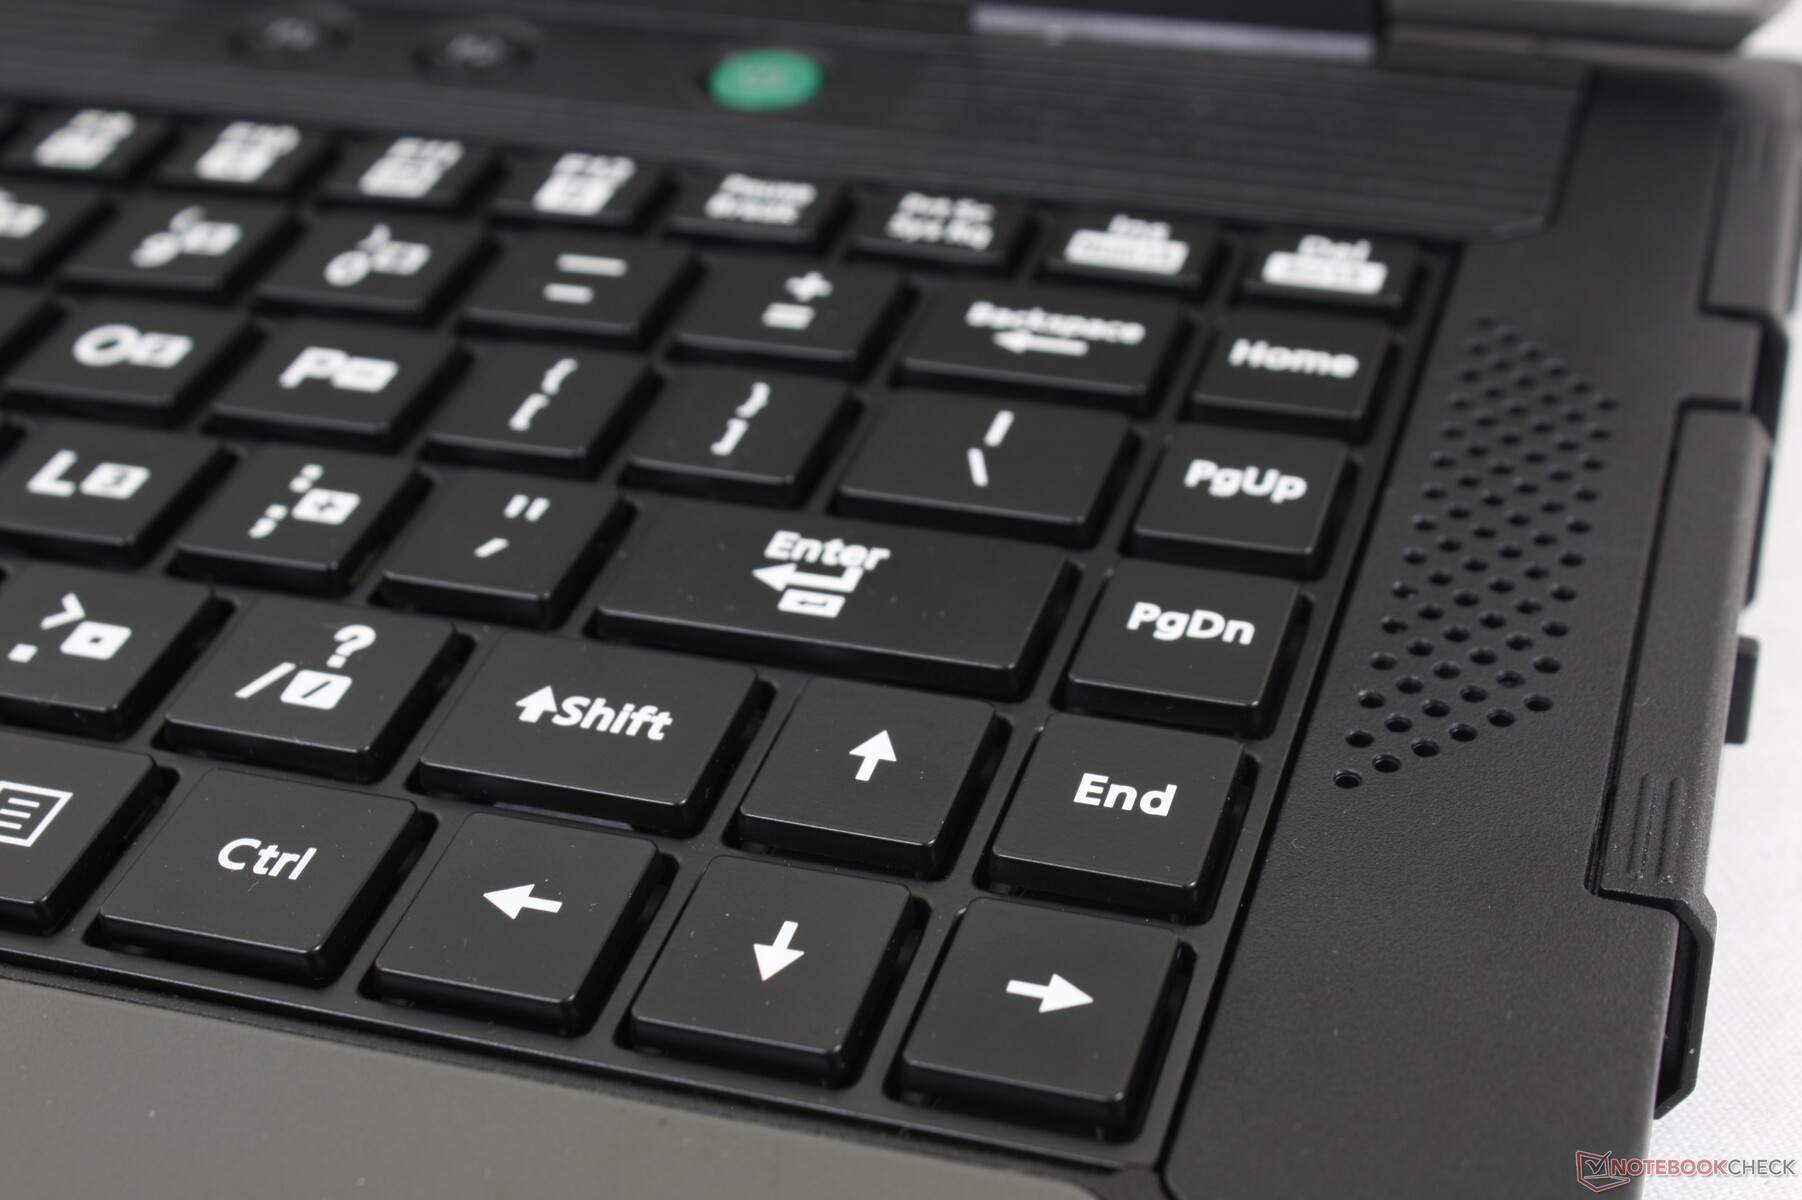
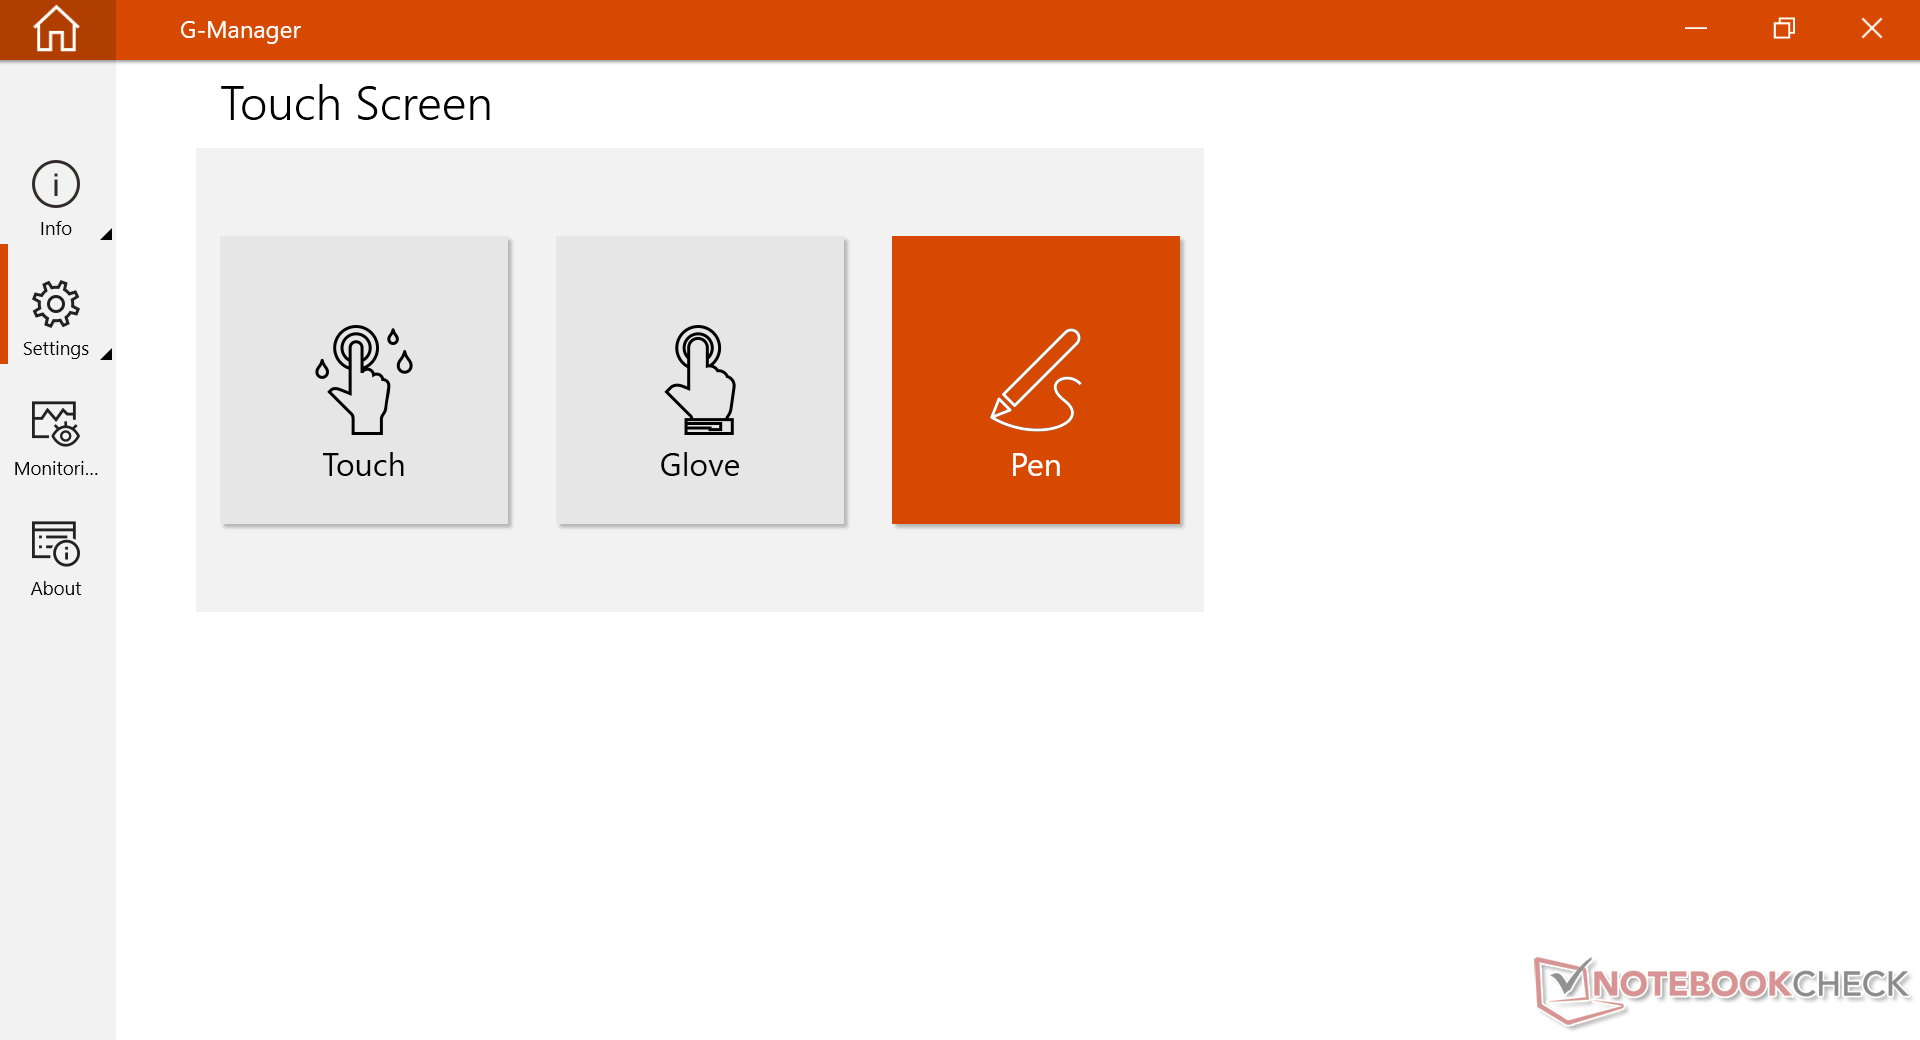
Dispositivi di input

Visualizza
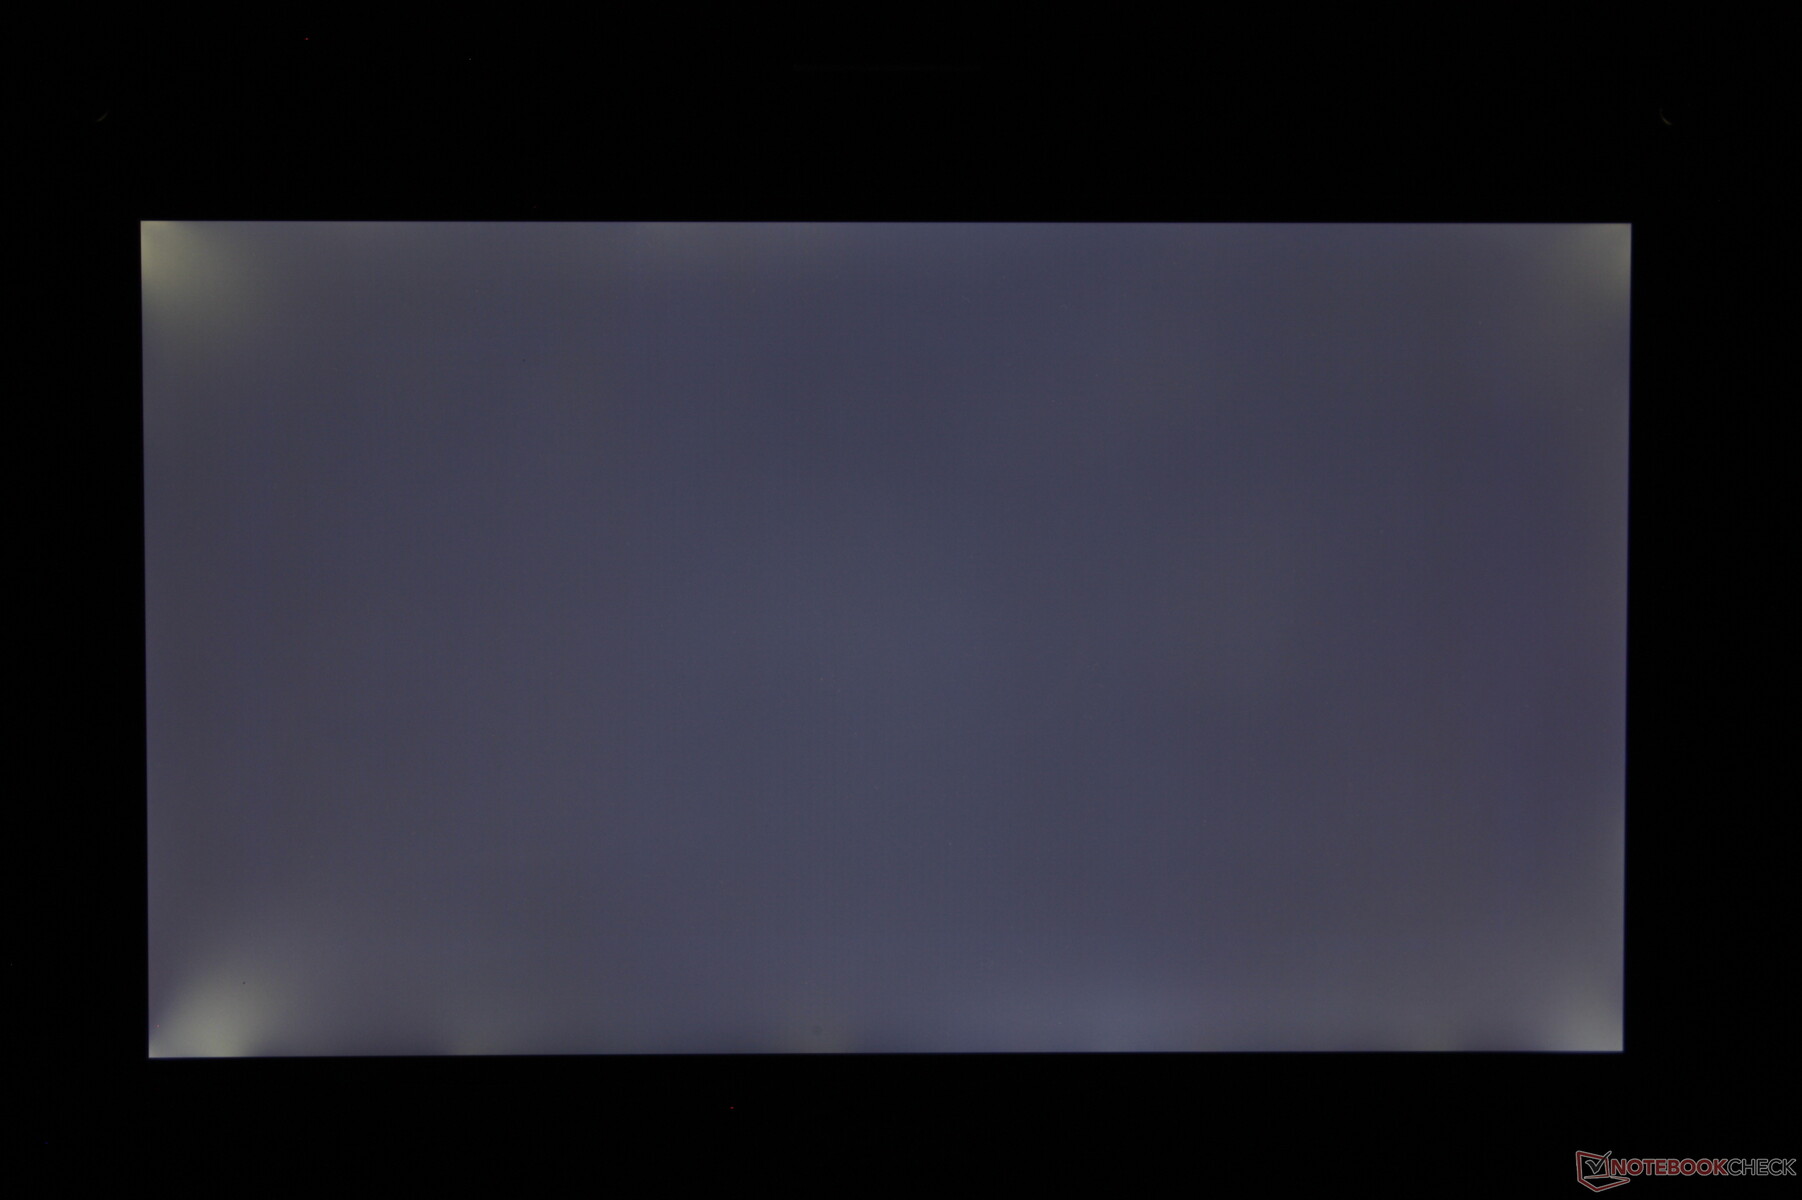
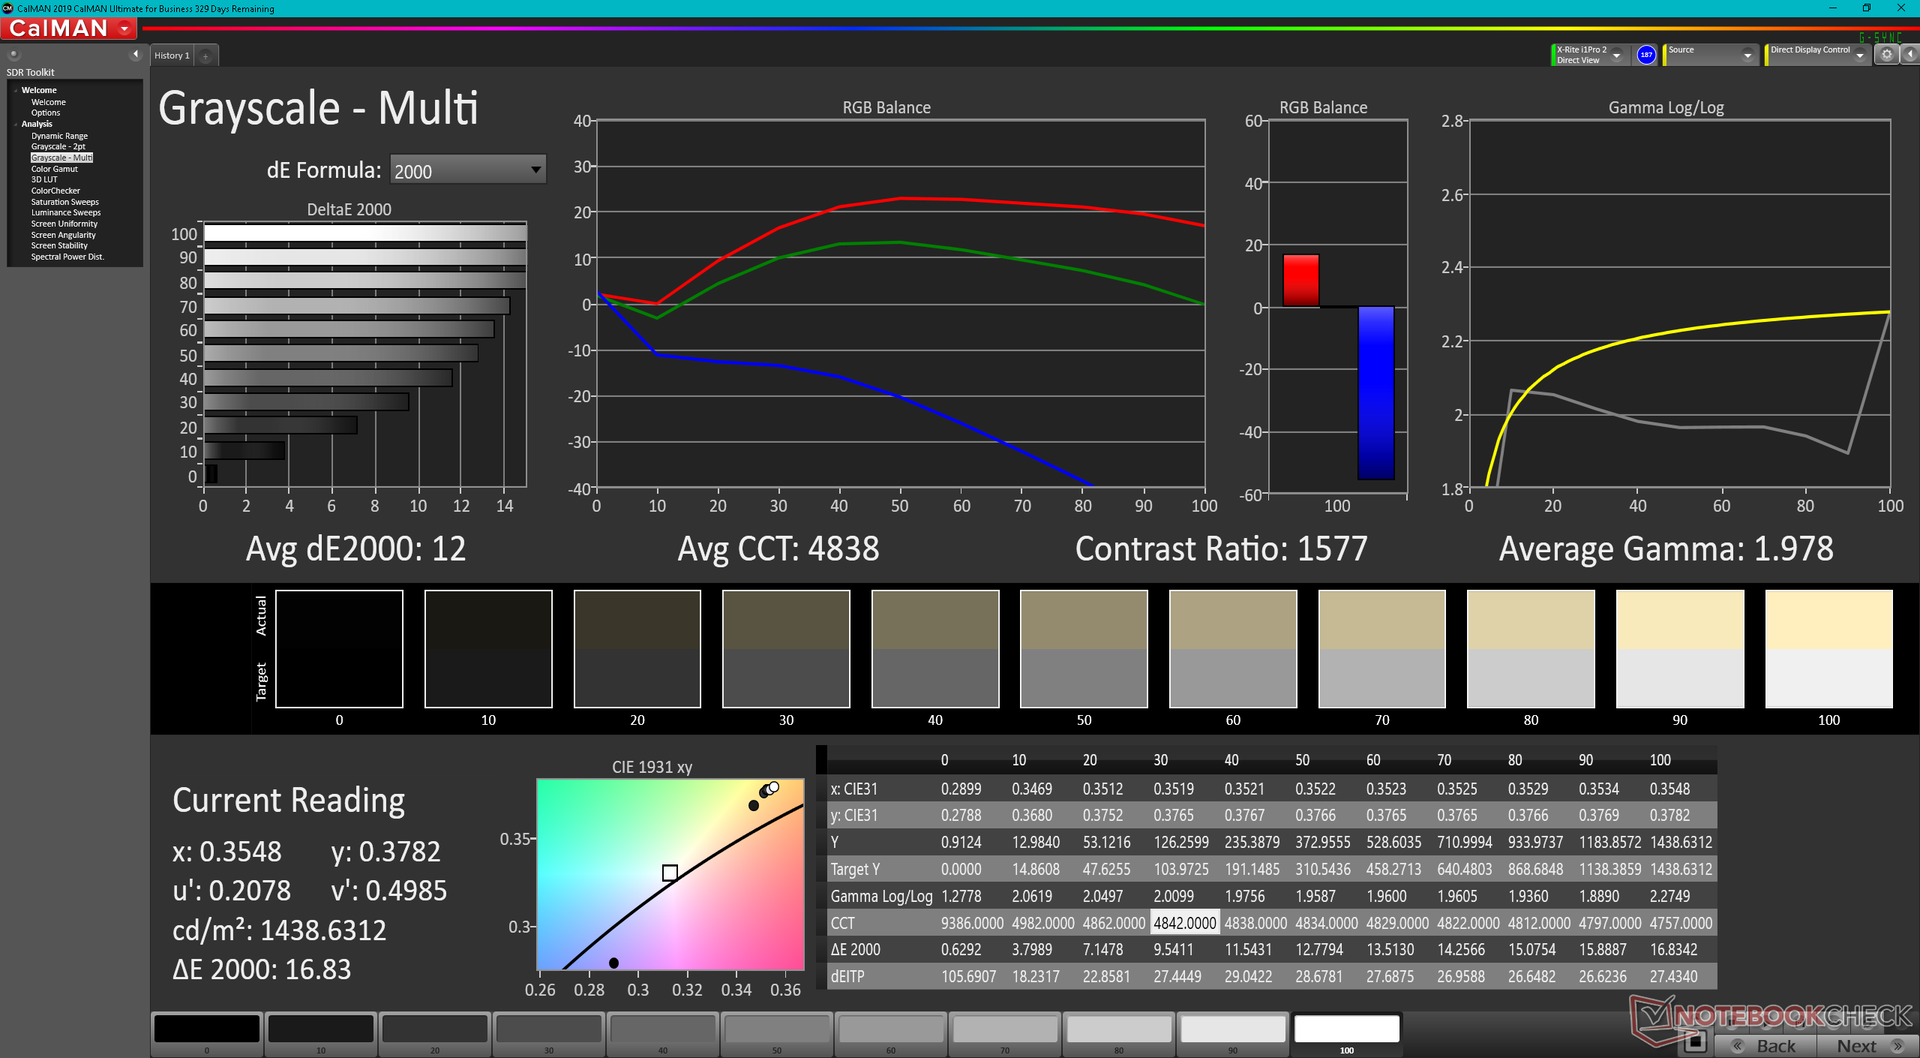
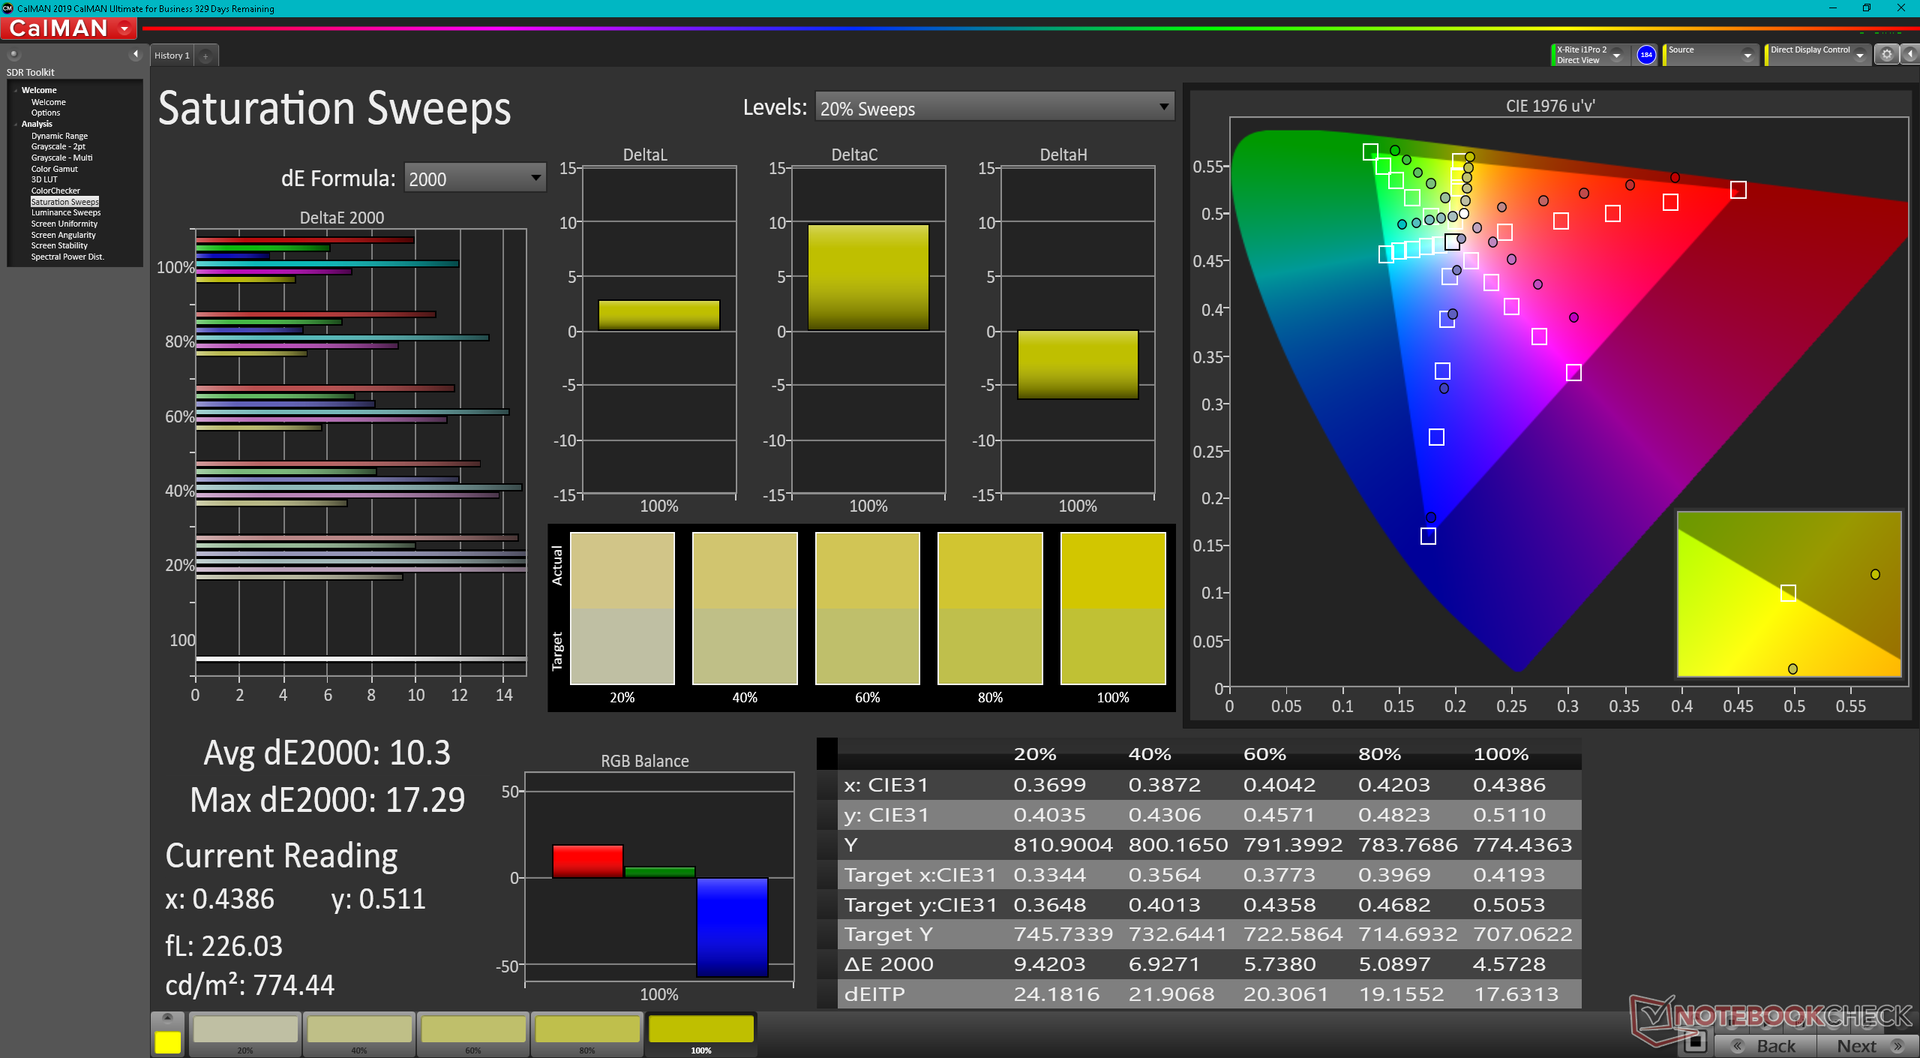
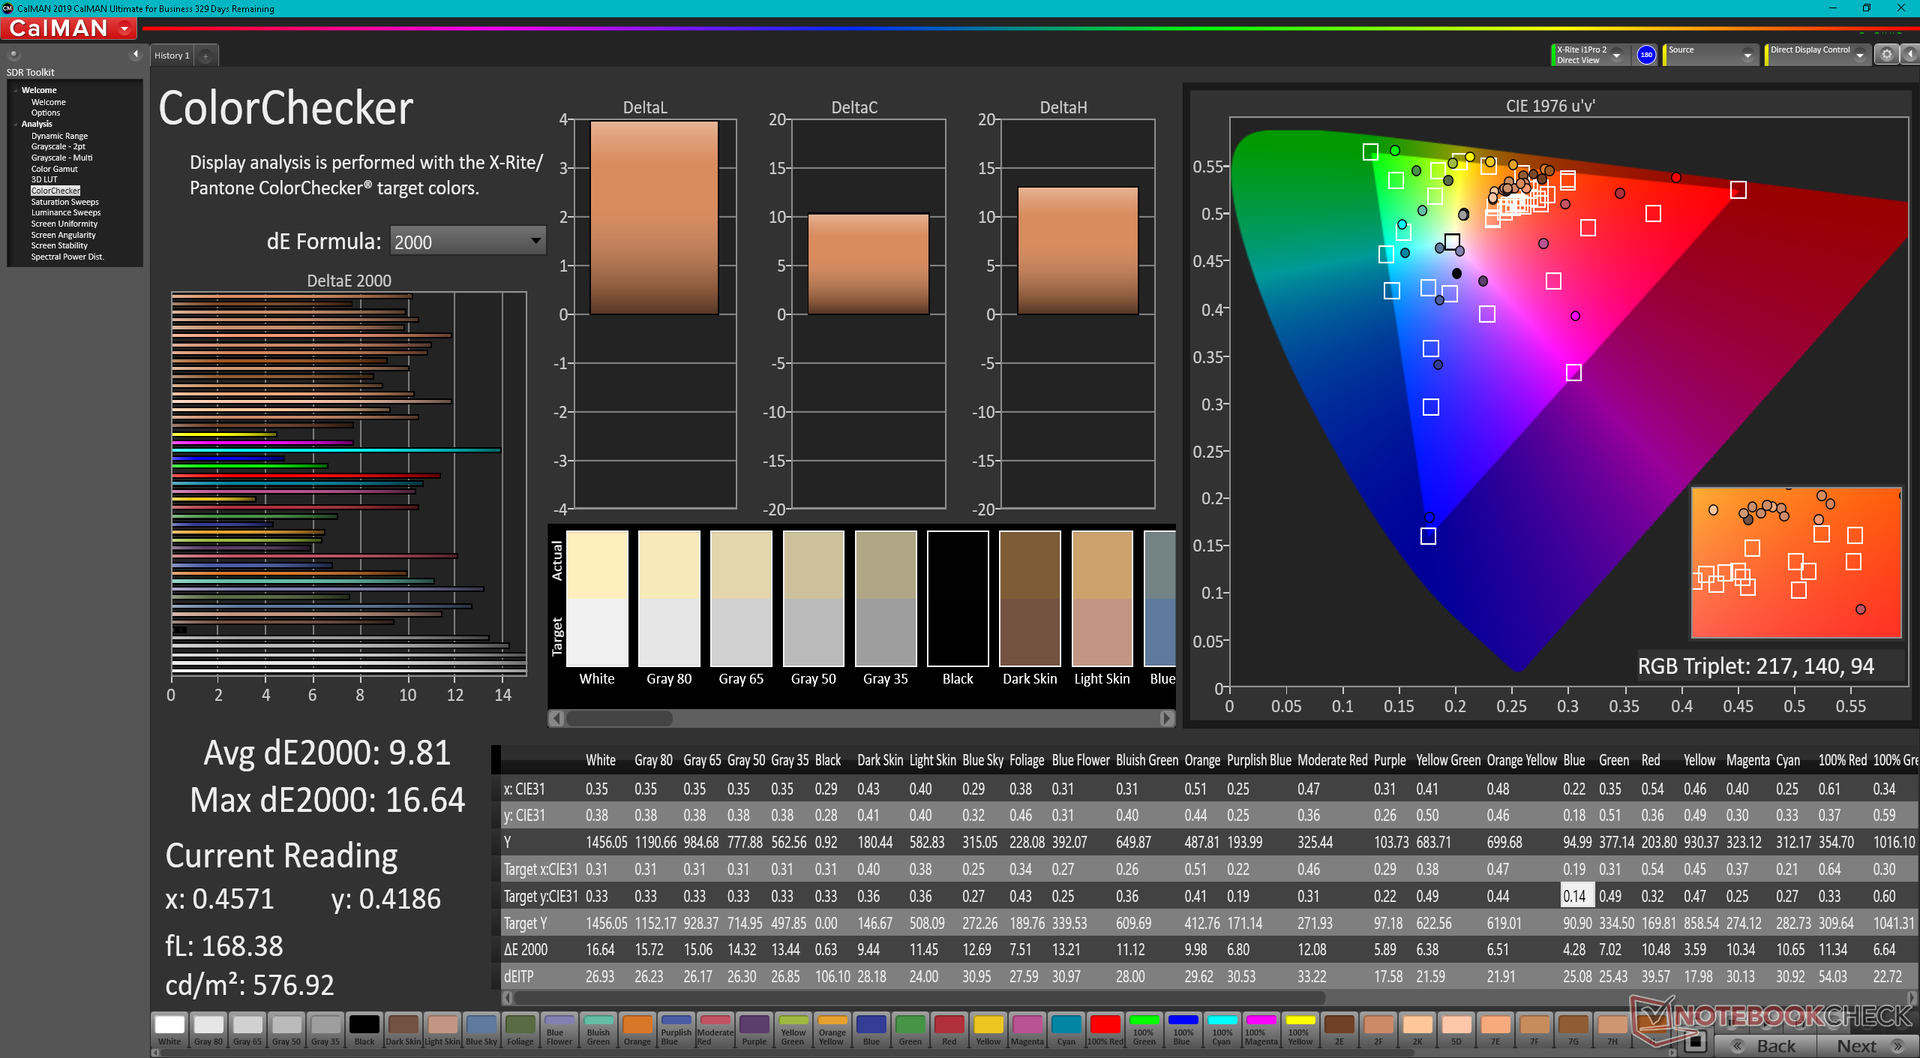
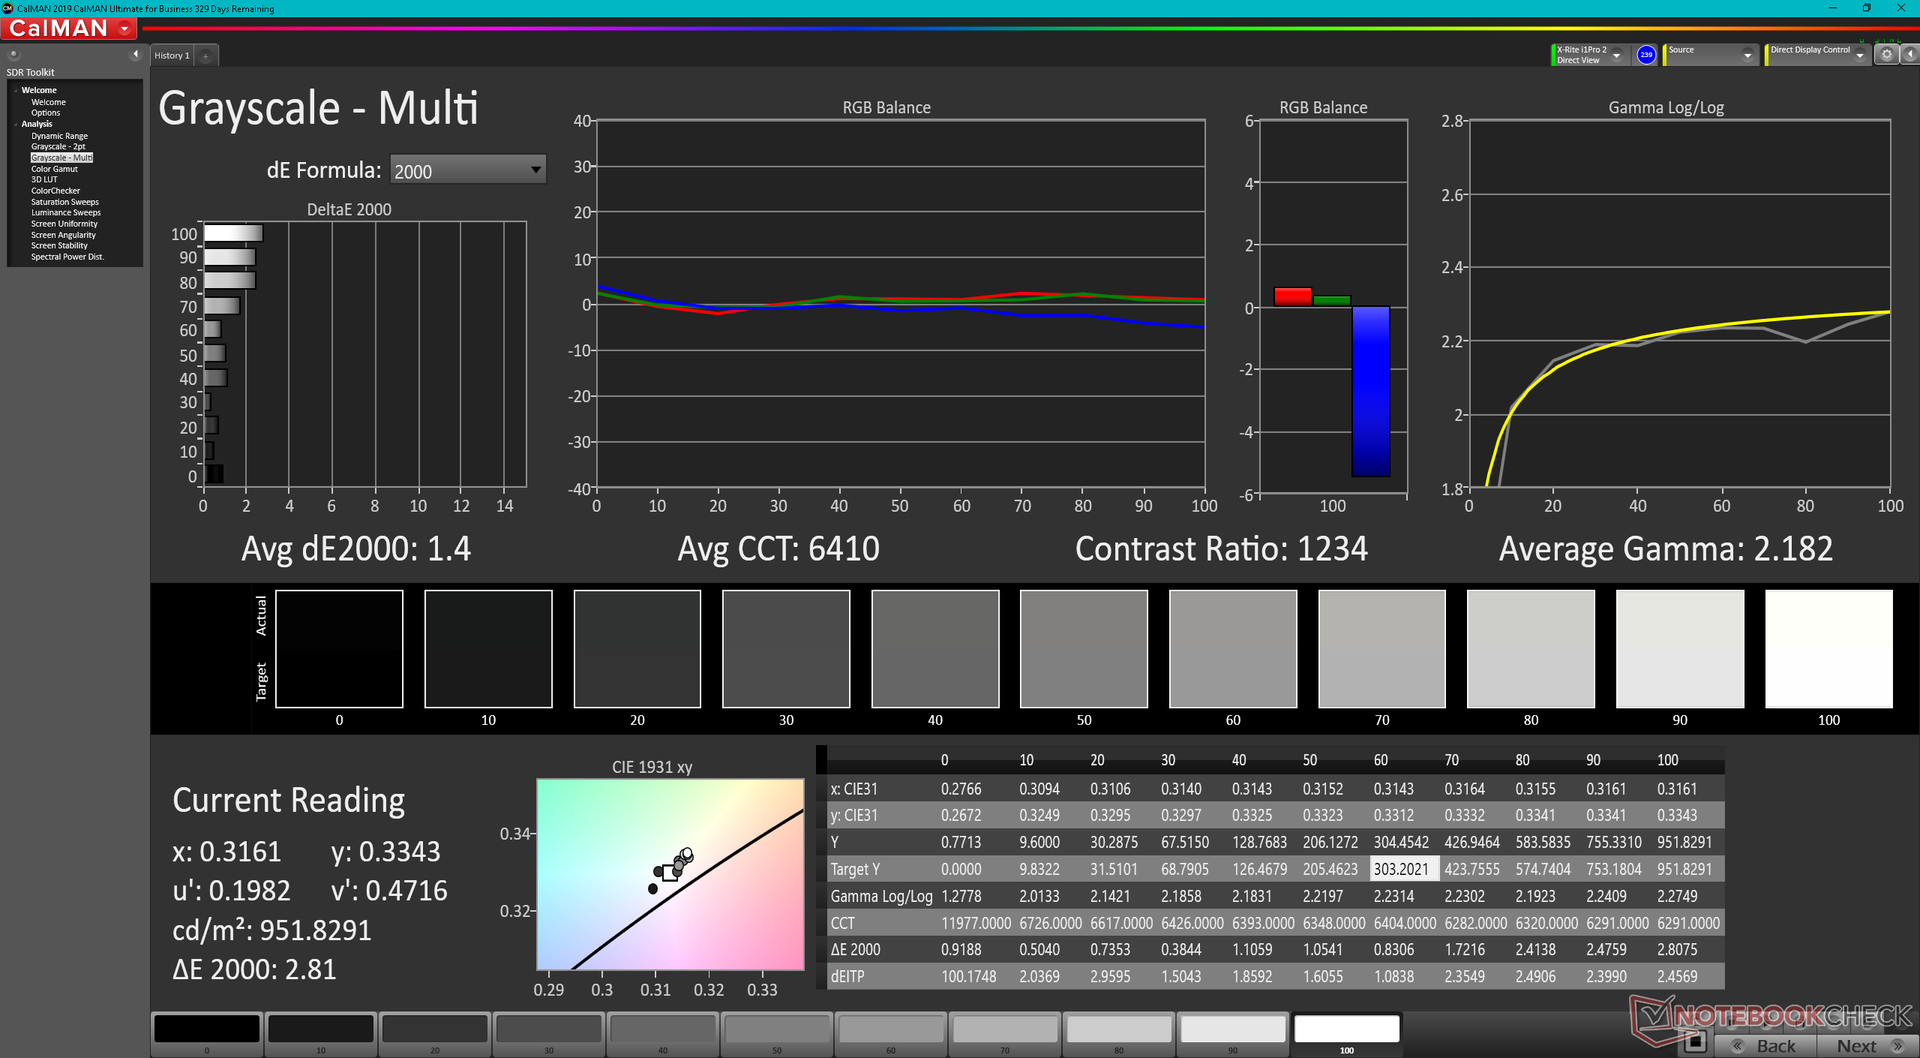
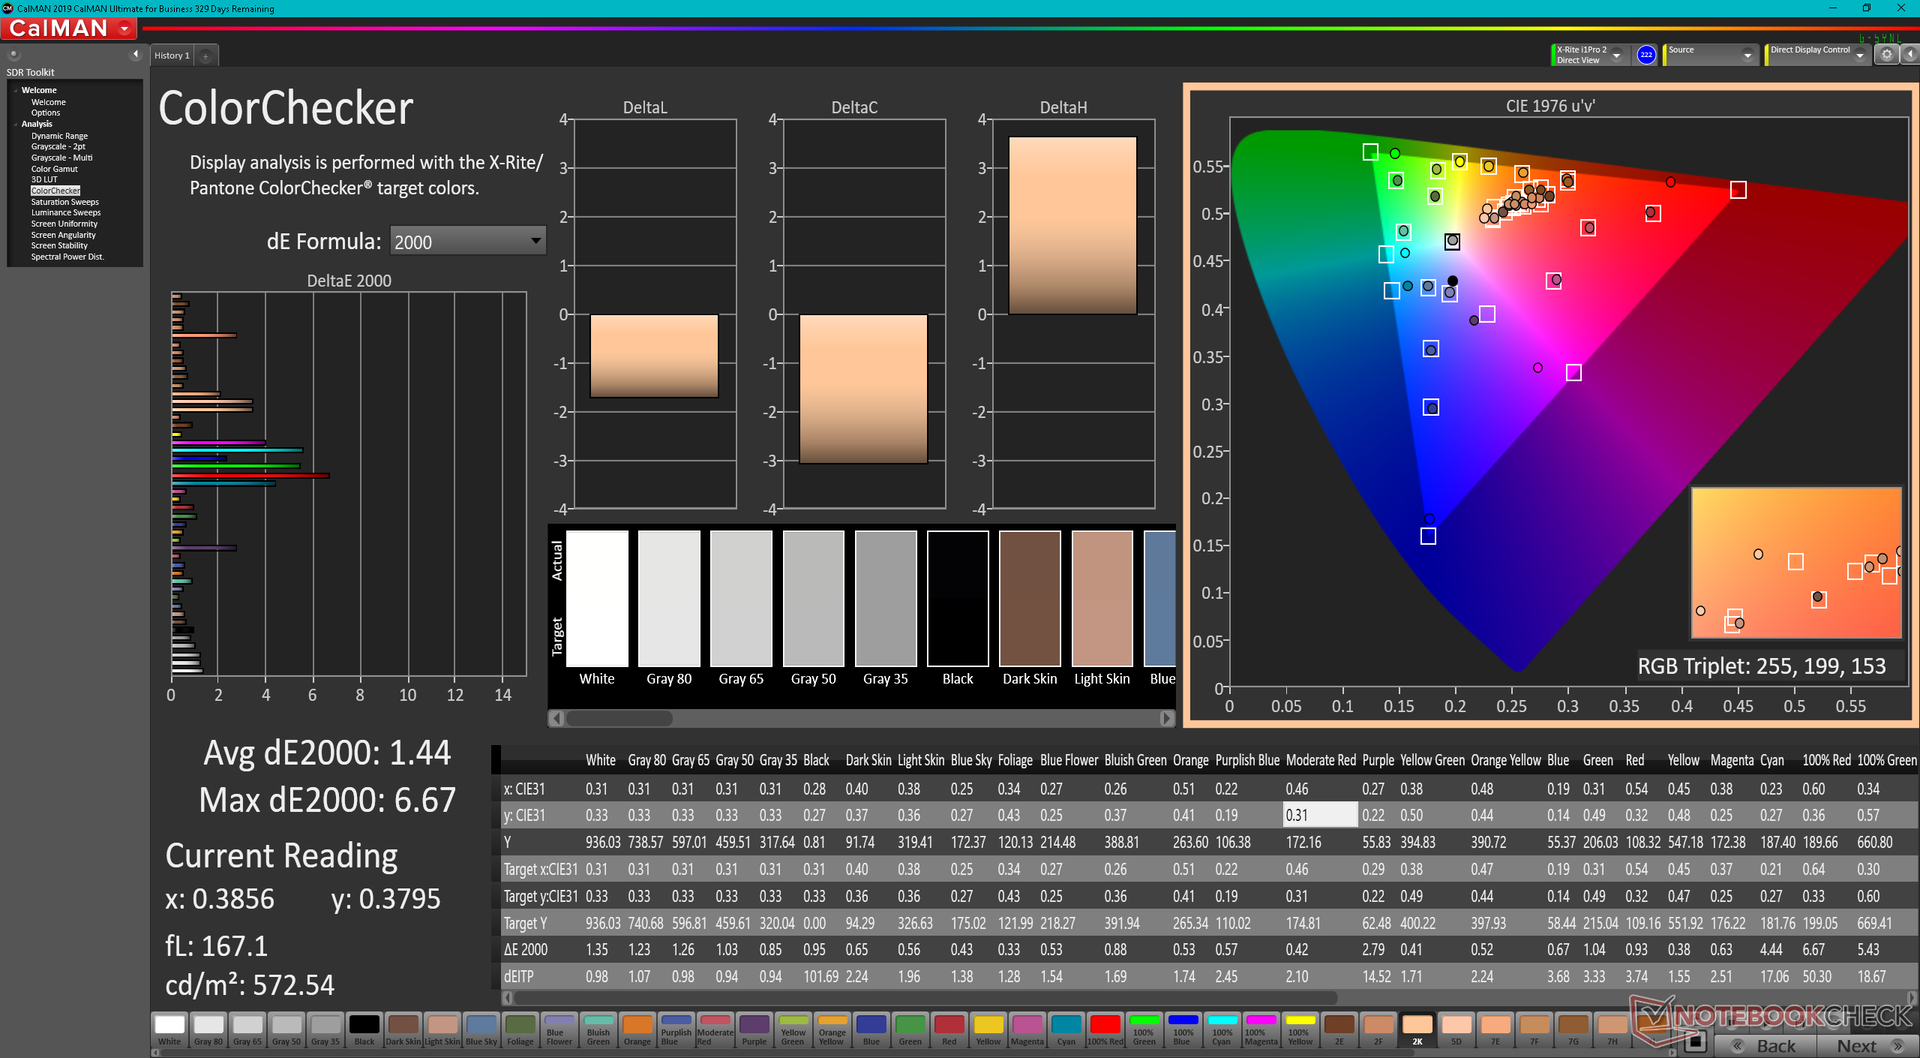
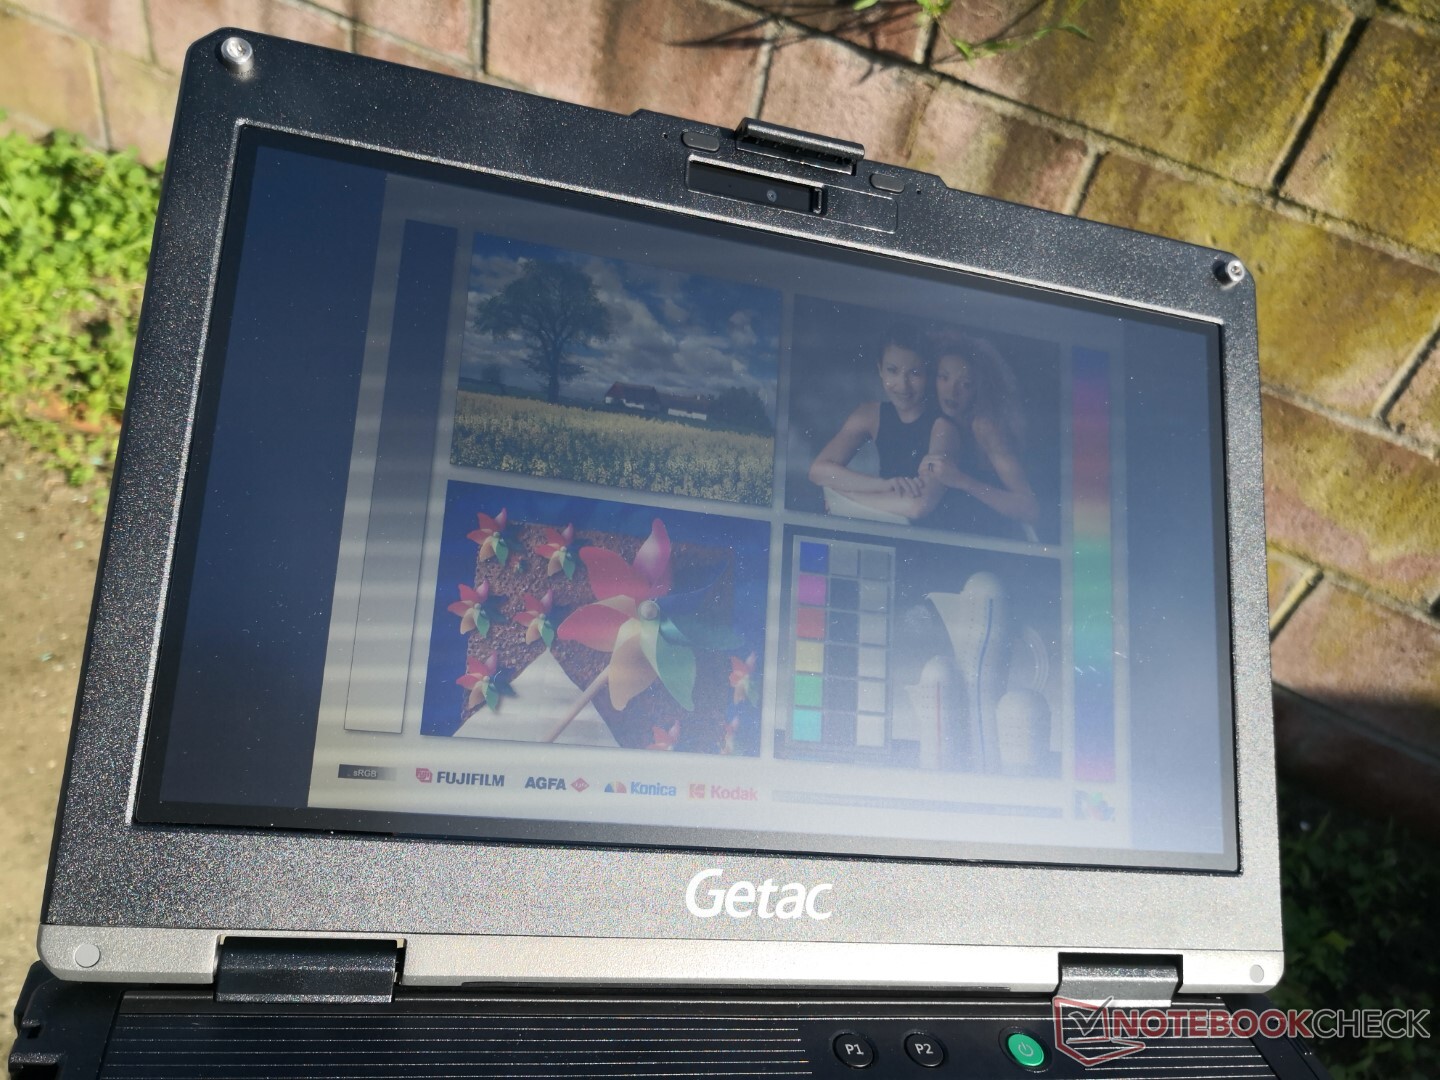
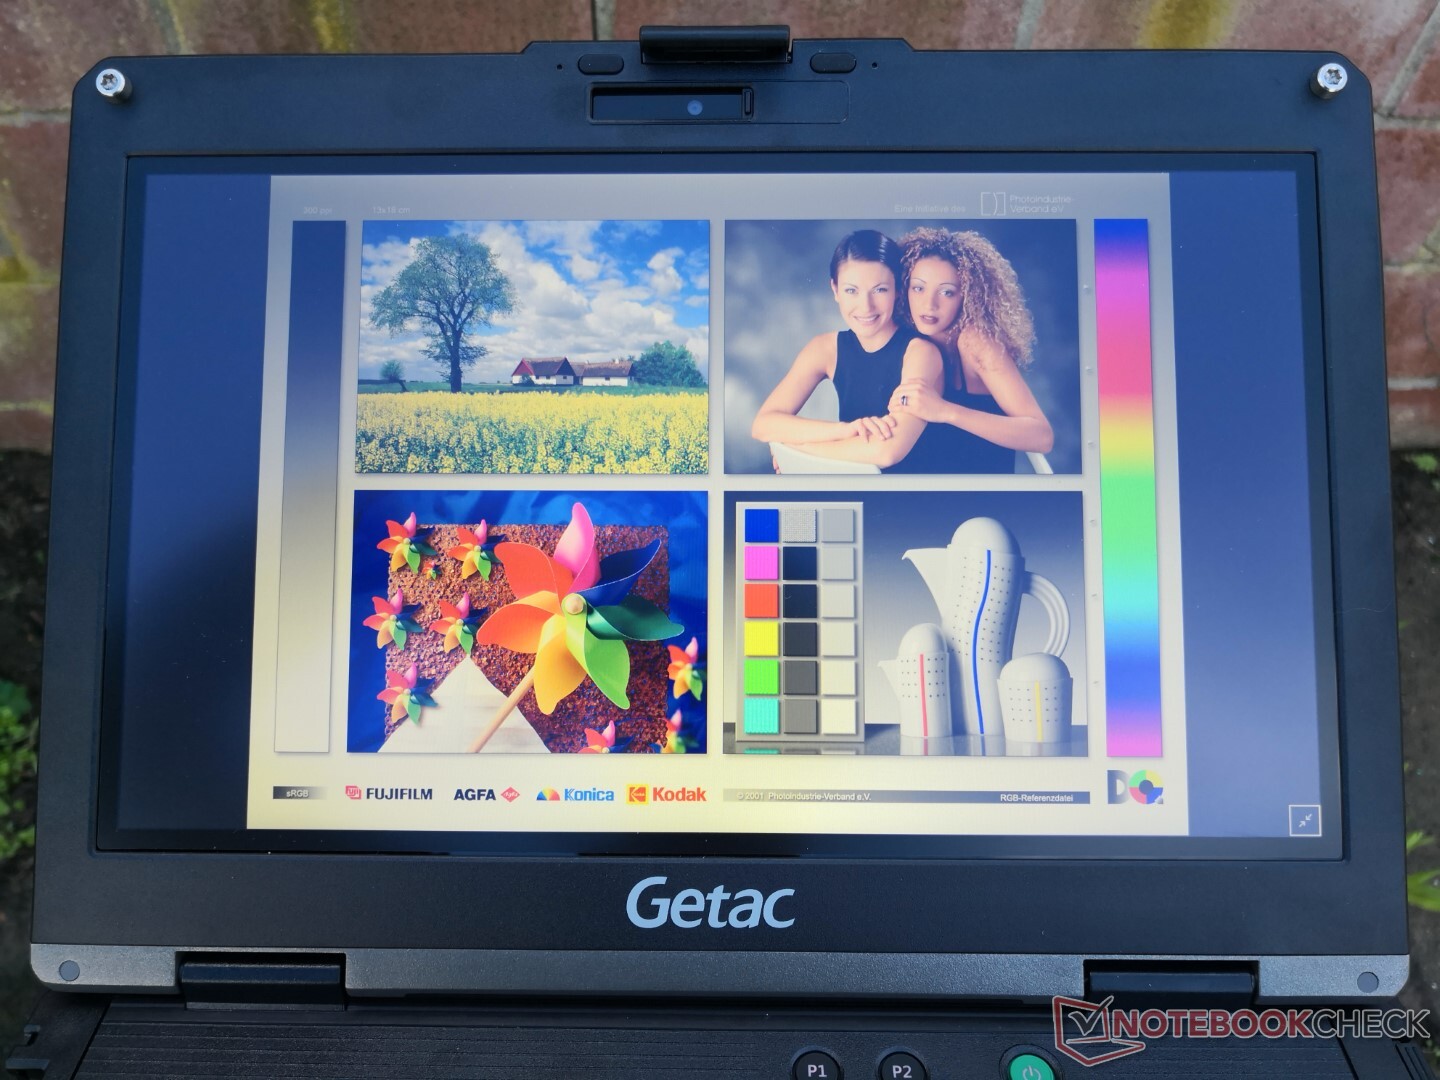
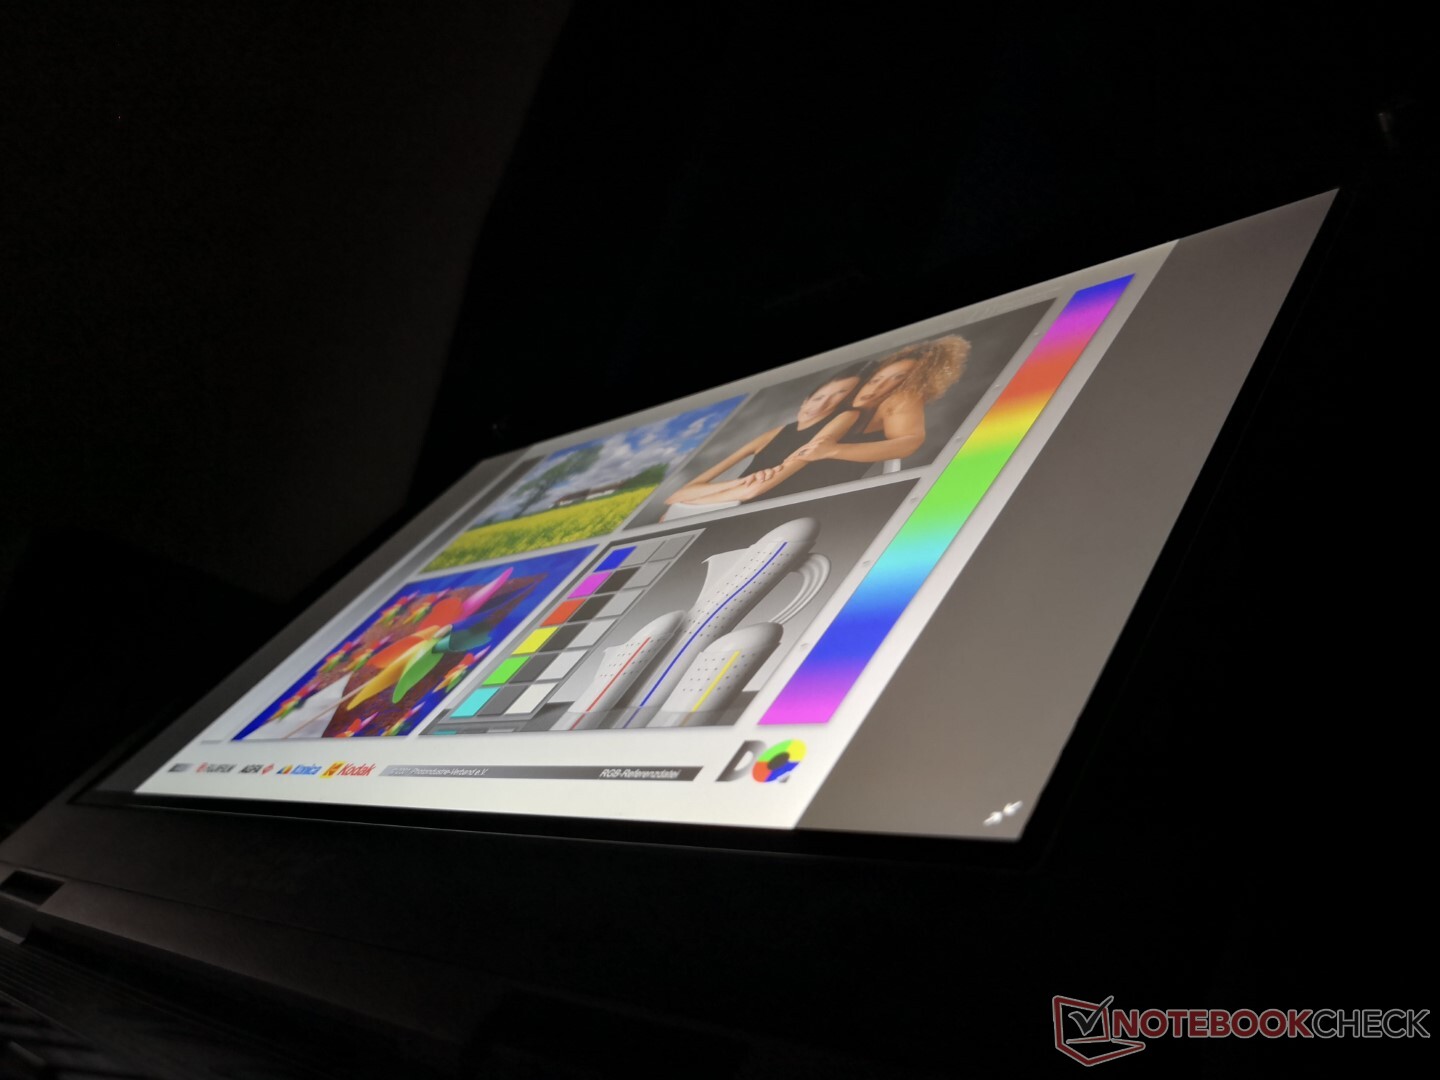
Il produttore dichiara una luminosità di 1400 nits per essere uno dei portatili più luminosi indipendentemente dalla categoria, cosa che possiamo confermare con le nostre misurazioni indipendenti. Forse più impressionante è il rapporto di contrasto relativamente profondo di ~1500:1 che è di nuovo migliore rispetto alla maggior parte degli altri modelli rugged
Tre svantaggi chiave del display sono la sua limitata riproduzione dei colori, i lenti tempi di risposta in bianco e nero, e la presenza di modulazione di larghezza d'impulso a tutti i livelli di luminosità. I primi due non sono problemi in quanto il B360 non è pensato per il fotoritocco professionale o il gioco, ma l'ultimo può essere fastidioso per gli utenti che possono essere sensibili alle luci tremolanti.
| |||||||||||||||||||||||||
Distribuzione della luminosità: 86 %
Al centro con la batteria: 1505.6 cd/m²
Contrasto: 1585:1 (Nero: 0.95 cd/m²)
ΔE ColorChecker Calman: 9.81 | ∀{0.5-29.43 Ø4.71}
calibrated: 1.44
ΔE Greyscale Calman: 12 | ∀{0.09-98 Ø4.96}
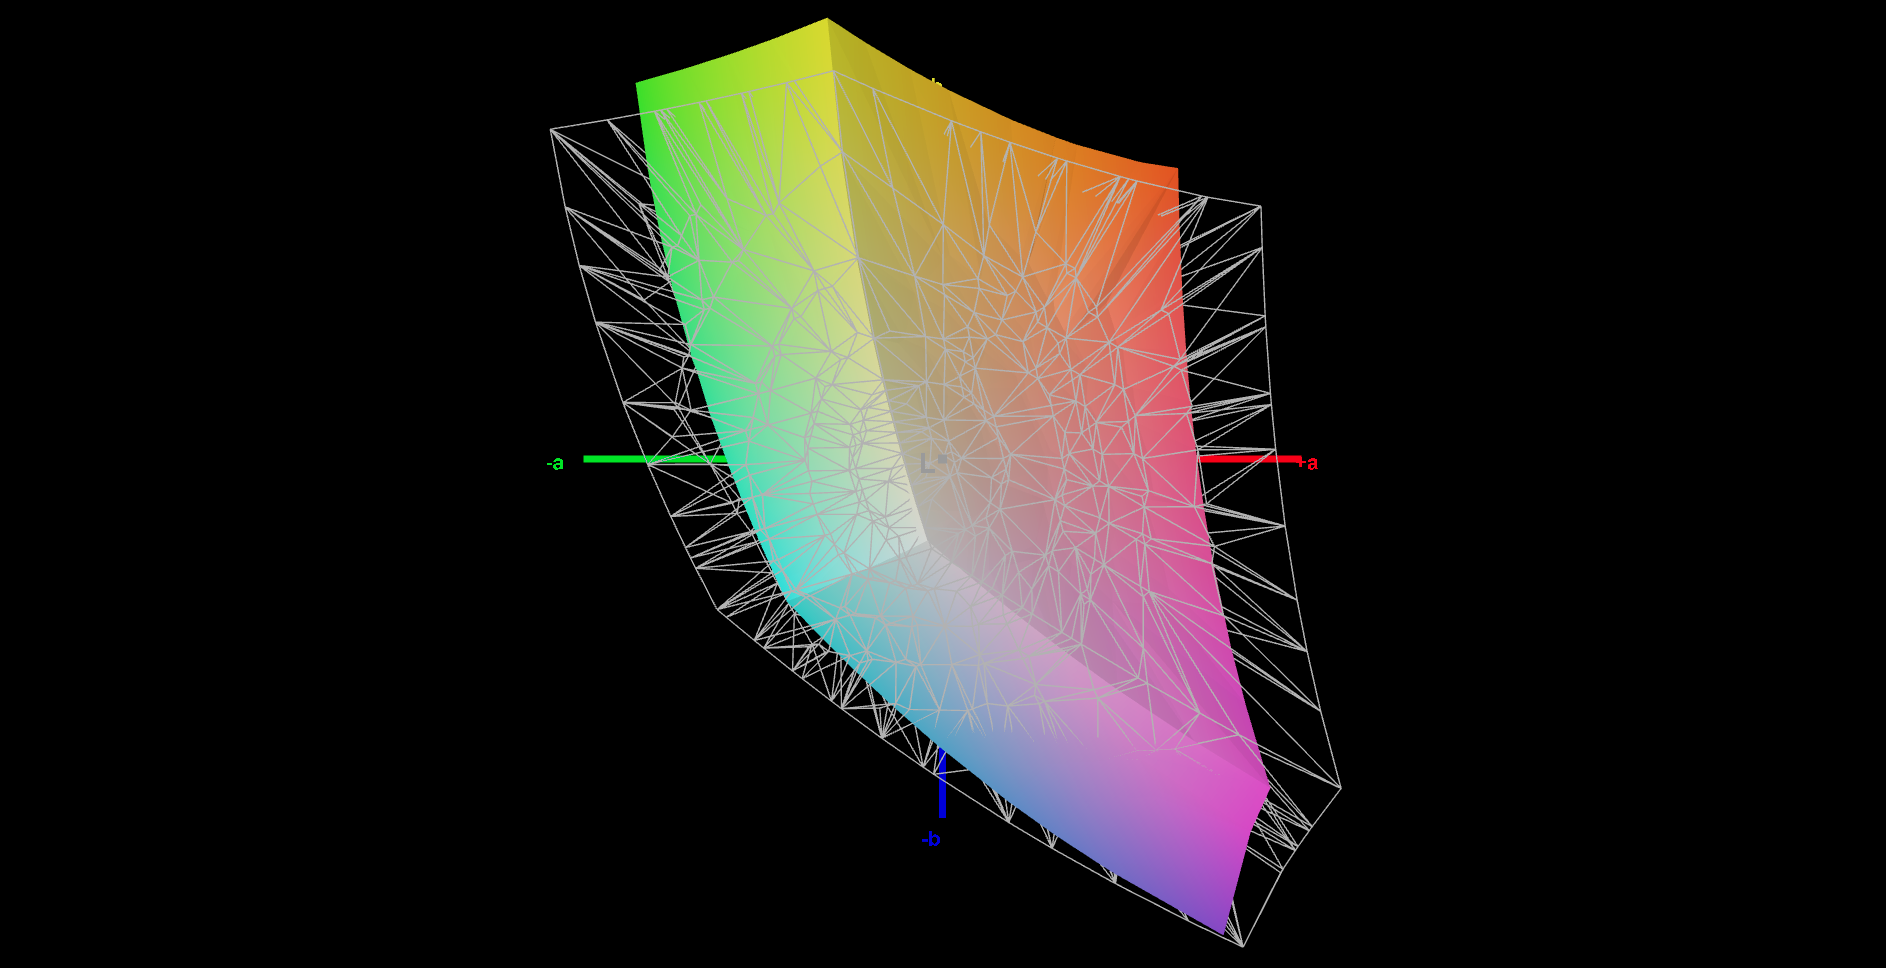
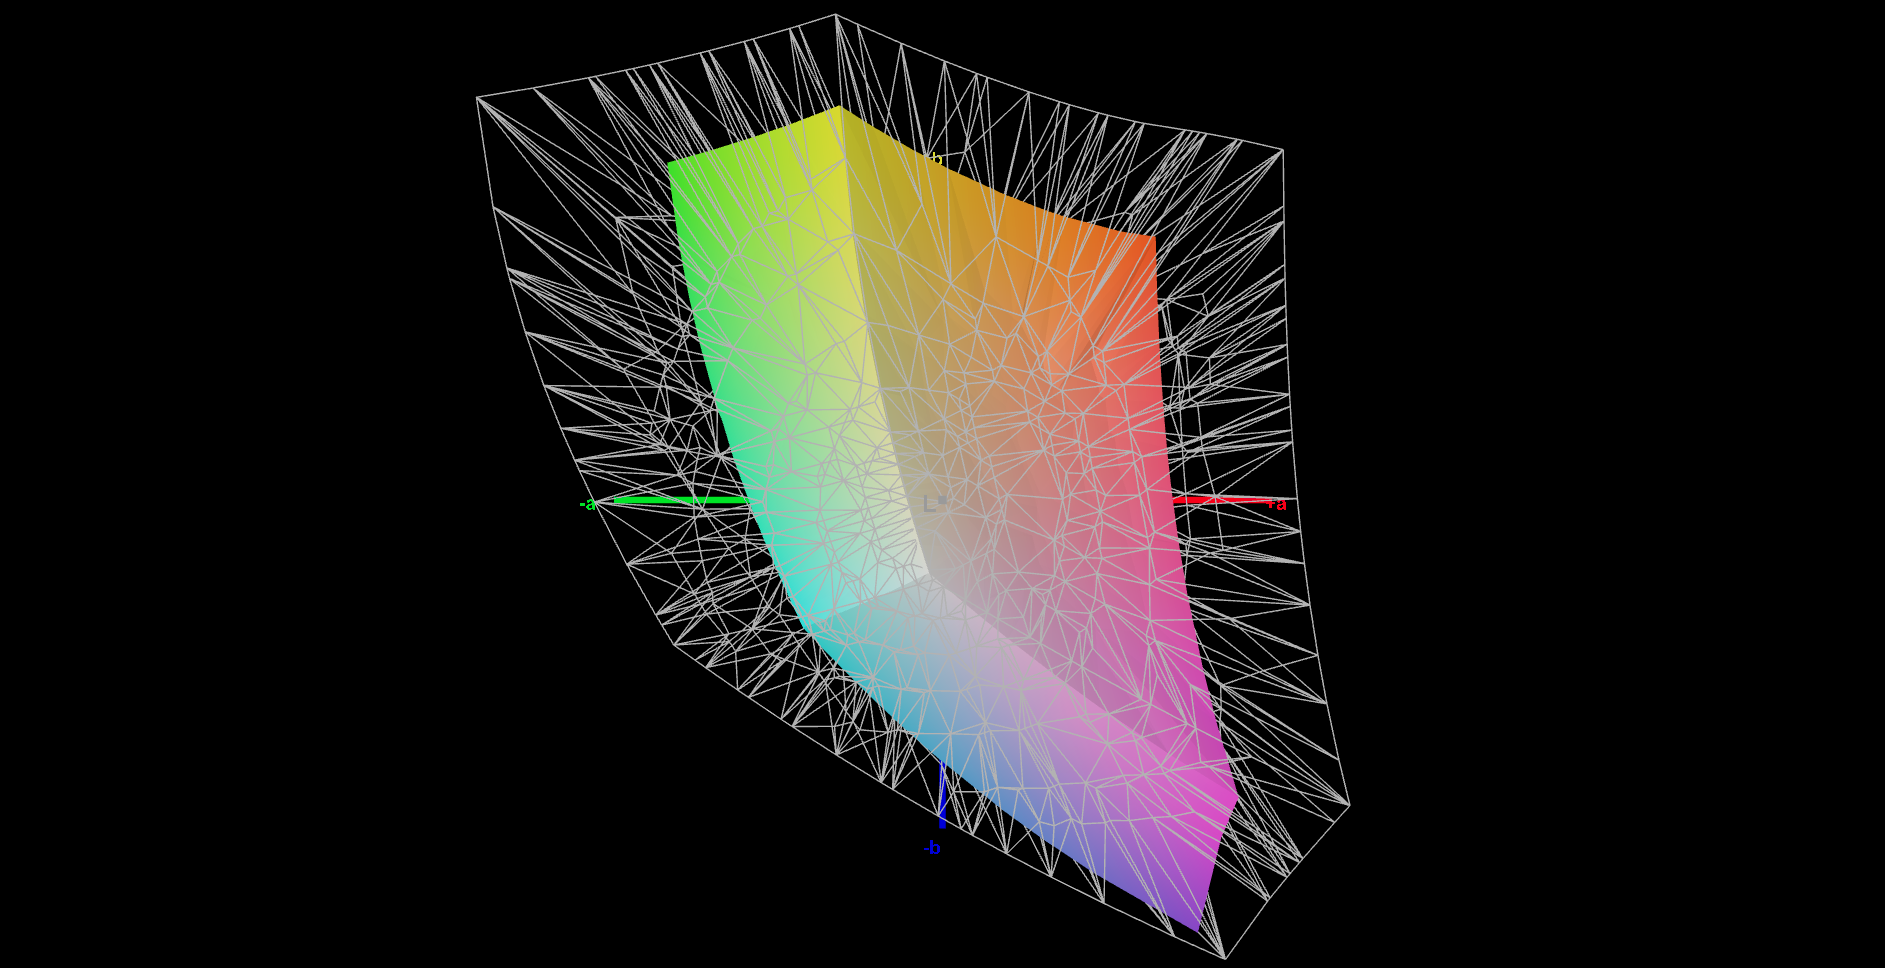
52.2% AdobeRGB 1998 (Argyll 3D)
72% sRGB (Argyll 3D)
51.3% Display P3 (Argyll 3D)
Gamma: 1.98
CCT: 4838 K
| Getac B360 AU Optronics AUO572D, IPS, 1920x1080, 13.3" | Dell Latitude 5420 Rugged-P85G AU Optronics AUO523D, IPS, 1920x1080, 14" | Getac S410 CMN N140BGE-E33, TN PED, 1366x768, 14" | Acer Enduro Urban N3 EUN314 XR140EA6T, IPS, 1920x1080, 14" | Panasonic Toughbook FZ-55 MK2 InfoVision M140NWF5 R3, IPS, 1920x1080, 14" | Durabook S14I KD140N0730A01, TN, 1920x1080, 14" | |
|---|---|---|---|---|---|---|
| Display | 24% | -19% | 26% | -30% | -13% | |
| Display P3 Coverage (%) | 51.3 | 62.5 22% | 40.46 -21% | 63.5 24% | 34.8 -32% | 43.55 -15% |
| sRGB Coverage (%) | 72 | 92.4 28% | 60.9 -15% | 91.9 28% | 52.2 -27% | 65.4 -9% |
| AdobeRGB 1998 Coverage (%) | 52.2 | 64.2 23% | 41.8 -20% | 65.5 25% | 36 -31% | 45 -14% |
| Response Times | -47% | 20% | -31% | 19% | 39% | |
| Response Time Grey 50% / Grey 80% * (ms) | 33 ? | 68 ? -106% | 41.2 ? -25% | 56 ? -70% | 28.4 ? 14% | 30.4 ? 8% |
| Response Time Black / White * (ms) | 38.8 ? | 33.6 ? 13% | 14 ? 64% | 35.2 ? 9% | 30 ? 23% | 11.8 ? 70% |
| PWM Frequency (Hz) | 870 ? | 735 ? | 877 ? | 1000 ? | 685 ? | 304.9 ? |
| Screen | 0% | -55% | -4% | -2% | -47% | |
| Brightness middle (cd/m²) | 1505.6 | 1111.7 -26% | 265.1 -82% | 487.8 -68% | 1061.1 -30% | 1180.7 -22% |
| Brightness (cd/m²) | 1383 | 1026 -26% | 246 -82% | 464 -66% | 997 -28% | 1102 -20% |
| Brightness Distribution (%) | 86 | 80 -7% | 81 -6% | 89 3% | 76 -12% | 89 3% |
| Black Level * (cd/m²) | 0.95 | 0.81 15% | 0.58 39% | 0.48 49% | 0.7 26% | 1.91 -101% |
| Contrast (:1) | 1585 | 1372 -13% | 457 -71% | 1016 -36% | 1516 -4% | 618 -61% |
| Colorchecker dE 2000 * | 9.81 | 3.83 61% | 14.24 -45% | 6.51 34% | 4.64 53% | 13.45 -37% |
| Colorchecker dE 2000 max. * | 16.64 | 7.85 53% | 26.66 -60% | 11.36 32% | 20.92 -26% | 22.52 -35% |
| Colorchecker dE 2000 calibrated * | 1.44 | 2.98 -107% | 3.94 -174% | 1.77 -23% | 2.52 -75% | 3.19 -122% |
| Greyscale dE 2000 * | 12 | 5.6 53% | 14.2 -18% | 7.8 35% | 2.8 77% | 15.4 -28% |
| Gamma | 1.98 111% | 2.306 95% | 2.03 108% | 2.28 96% | 2.08 106% | 1.97 112% |
| CCT | 4838 134% | 7676 85% | 17152 38% | 8102 80% | 6364 102% | 21134 31% |
| Color Space (Percent of AdobeRGB 1998) (%) | 59 | 38.7 | 41.6 | |||
| Color Space (Percent of sRGB) (%) | 93 | 61 | 65.5 | |||
| Media totale (Programma / Settaggio) | -8% /
-1% | -18% /
-37% | -3% /
-2% | -4% /
-5% | -7% /
-27% |
* ... Meglio usare valori piccoli
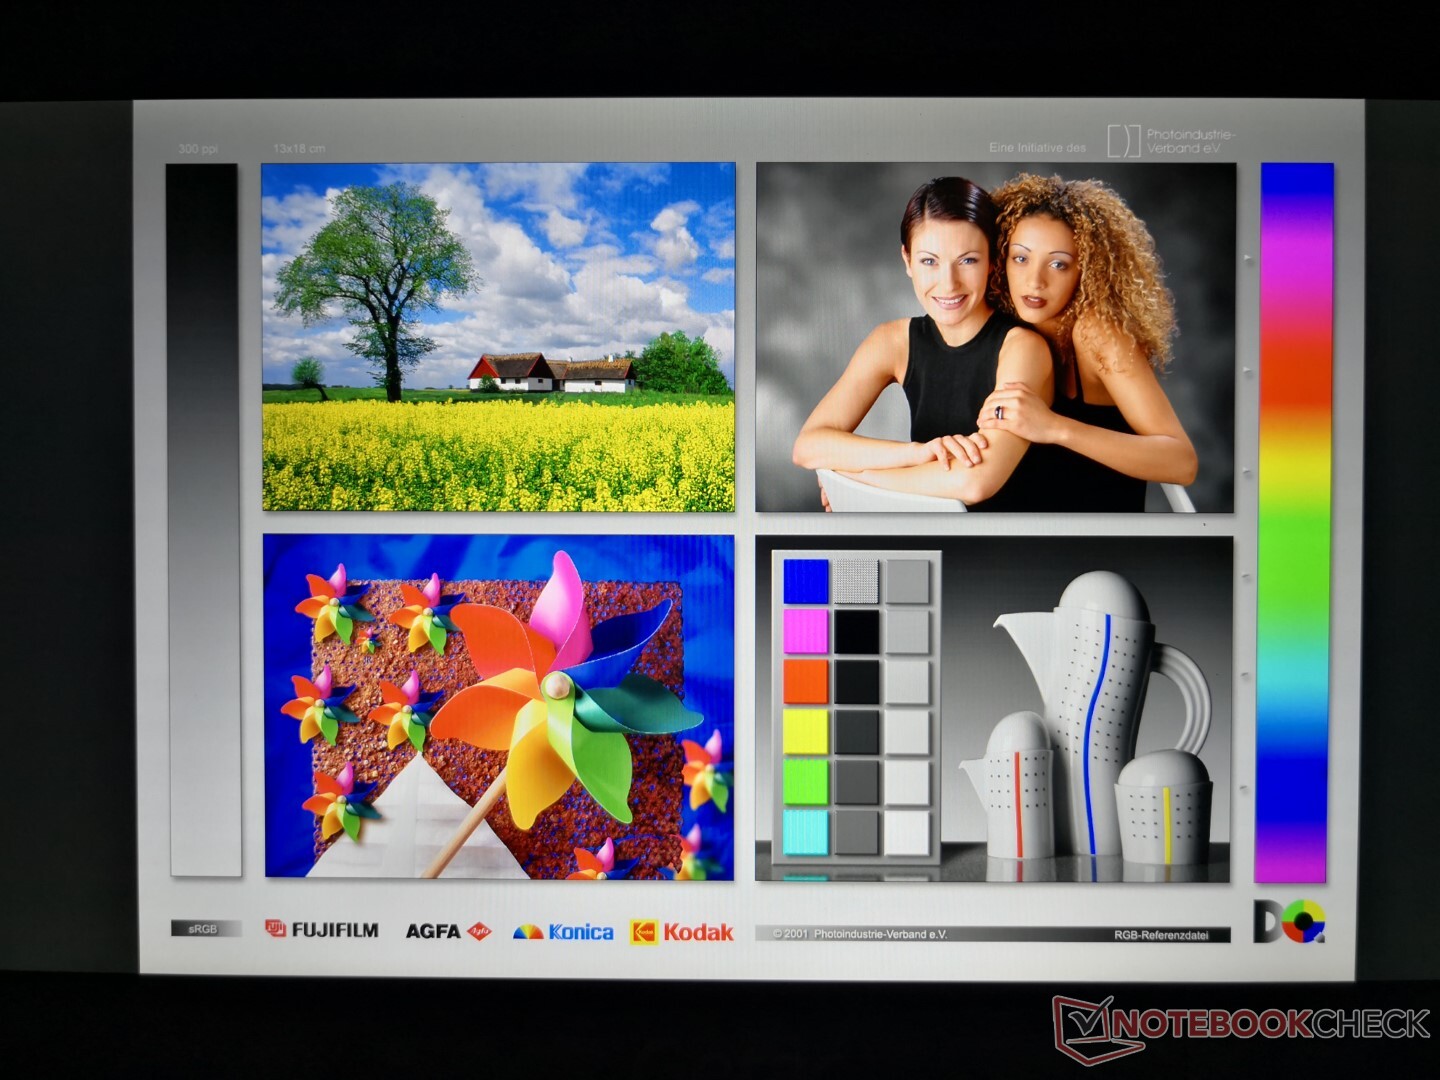
Lo spazio colore è ristretto a solo il 72% di sRGB per essere inadatto alla maggior parte delle modifiche grafiche
La temperatura del colore è molto calda fuori dalla scatola al punto che i valori medi di deltaE possono avvicinarsi a due cifre. La calibrazione del pannello risolve questo problema per colori significativamente più accurati, specialmente a livelli di saturazione più bassi
Tempi di risposta del Display
| ↔ Tempi di risposta dal Nero al Bianco | ||
|---|---|---|
| 38.8 ms ... aumenta ↗ e diminuisce ↘ combinato | ↗ 15.6 ms Incremento | 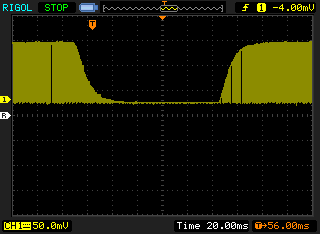 |
| ↘ 23.2 ms Calo | ||
| Lo schermo mostra tempi di risposta lenti nei nostri tests e sarà insoddisfacente per i gamers. In confronto, tutti i dispositivi di test variano da 0.1 (minimo) a 240 (massimo) ms. » 96 % di tutti i dispositivi è migliore. Questo significa che i tempi di risposta rilevati sono peggiori rispetto alla media di tutti i dispositivi testati (19.8 ms). | ||
| ↔ Tempo di risposta dal 50% Grigio all'80% Grigio | ||
| 33 ms ... aumenta ↗ e diminuisce ↘ combinato | ↗ 16 ms Incremento | 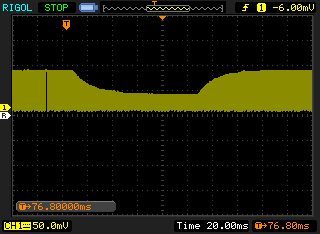 |
| ↘ 17 ms Calo | ||
| Lo schermo mostra tempi di risposta lenti nei nostri tests e sarà insoddisfacente per i gamers. In confronto, tutti i dispositivi di test variano da 0.165 (minimo) a 636 (massimo) ms. » 45 % di tutti i dispositivi è migliore. Questo significa che i tempi di risposta rilevati sono simili alla media di tutti i dispositivi testati (30.9 ms). | ||
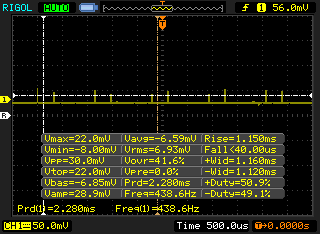
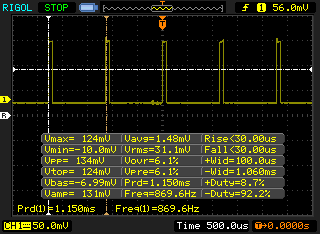
Sfarfallio dello schermo / PWM (Pulse-Width Modulation)
| flickering dello schermo / PWM rilevato | 870 Hz | ≤ 100 % settaggio luminosita' |  |
Il display sfarfalla a 870 Hz (Probabilmente a causa dell'uso di PWM) Flickering rilevato ad una luminosita' di 100 % o inferiore. Non dovrebbe verificarsi flickering o PWM sopra questo valore di luminosita'. La frequenza di 870 Hz è abbastanza alta, quindi la maggioranza degli utenti sensibili al PWM non dovrebbero notare alcun flickering. In confronto: 52 % di tutti i dispositivi testati non utilizza PWM per ridurre la luminosita' del display. Se è rilevato PWM, una media di 7741 (minimo: 5 - massimo: 343500) Hz è stata rilevata. | |||

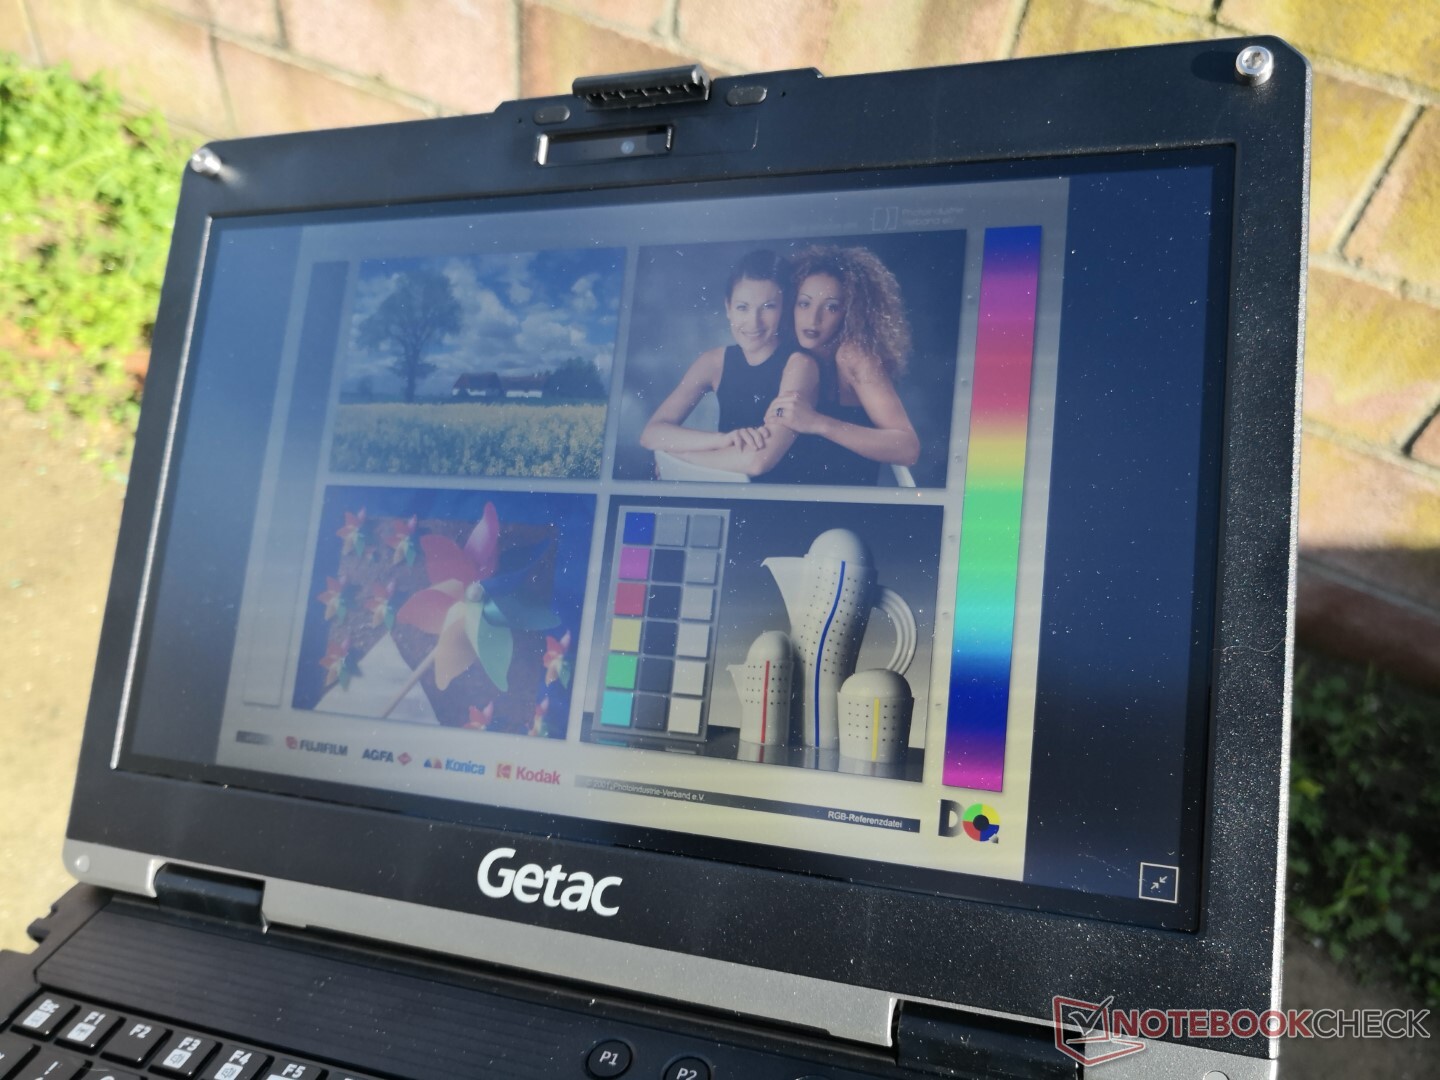
Il display è visibile nella maggior parte delle condizioni esterne, ma gli utenti vorranno comunque evitare la luce diretta del sole per limitare i riflessi e i colori slavati.
Performance
Condizioni di test
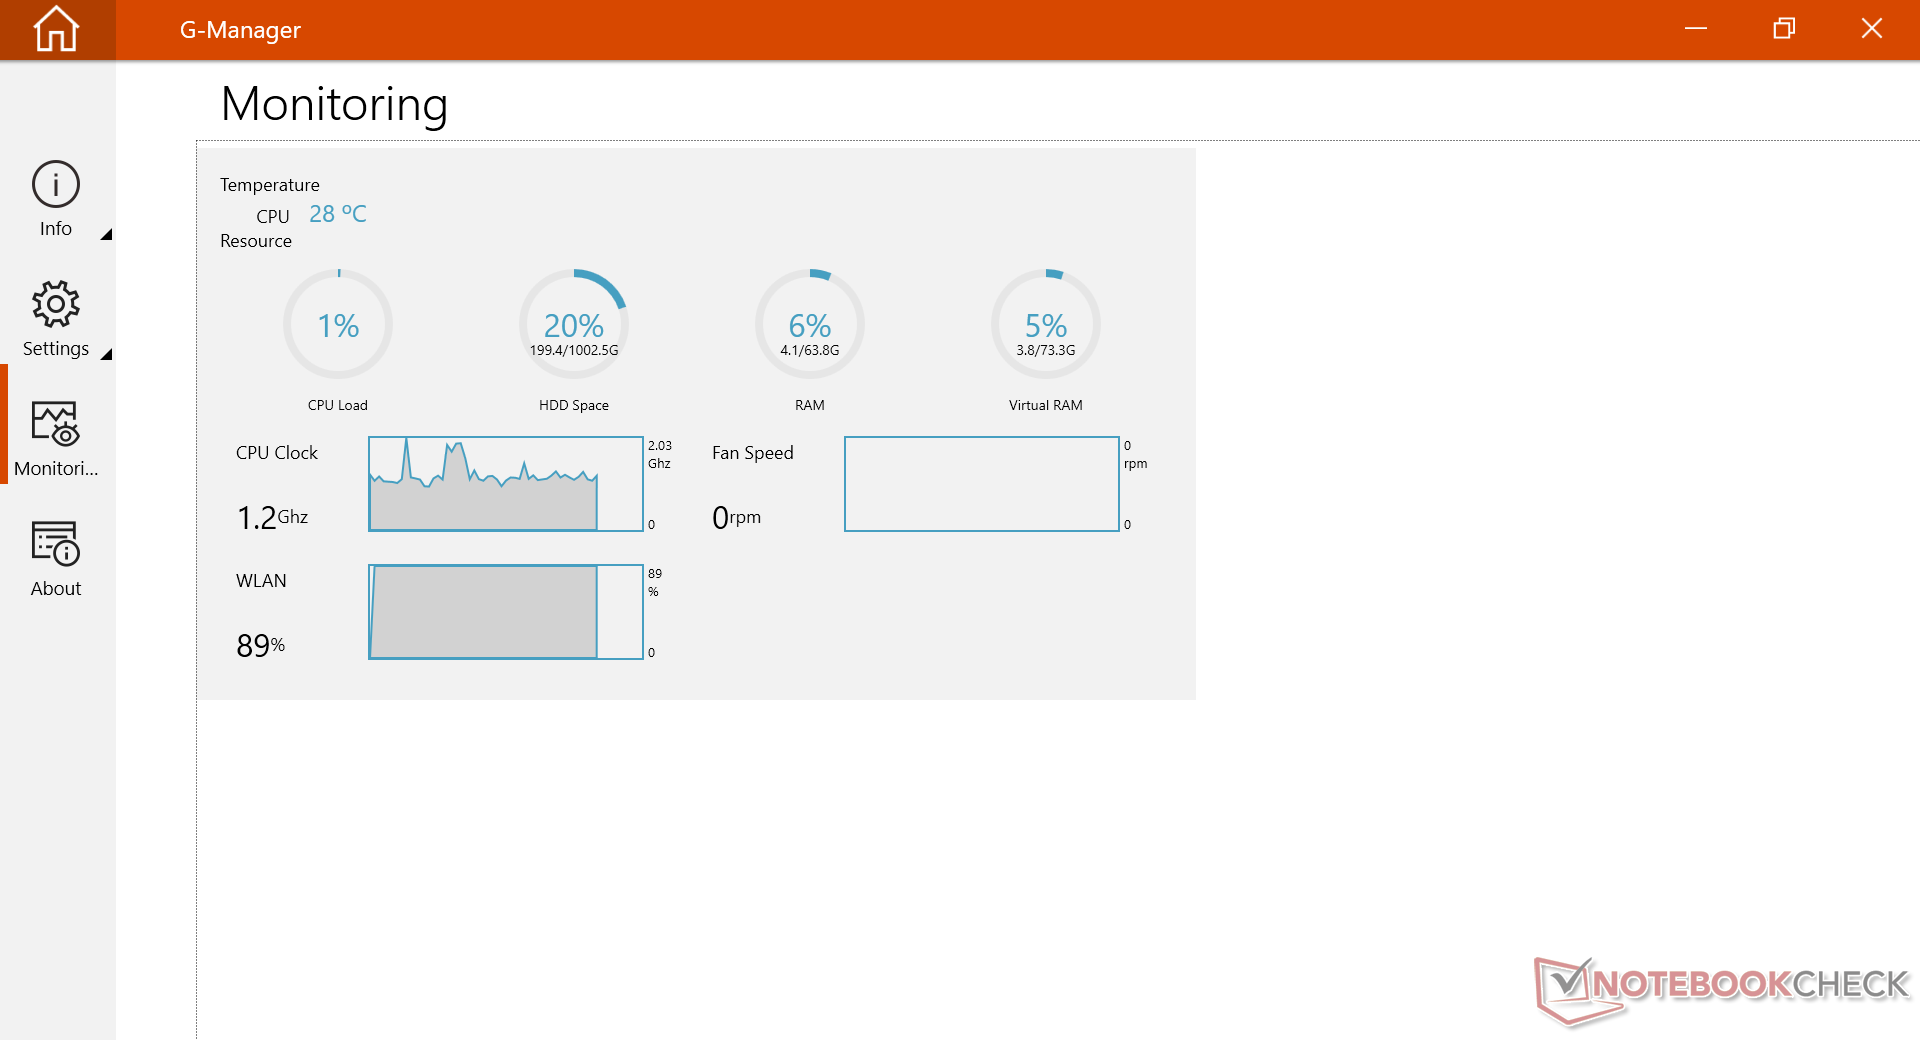
La nostra unità è stata impostata in modalità Extreme prima di eseguire qualsiasi benchmark per ottenere i punteggi più alti possibili. Gli utenti dovrebbero familiarizzare con il software G-Manager preinstallato, dato che molte funzioni di personalizzazione specifiche di Getac sono attivate qui.
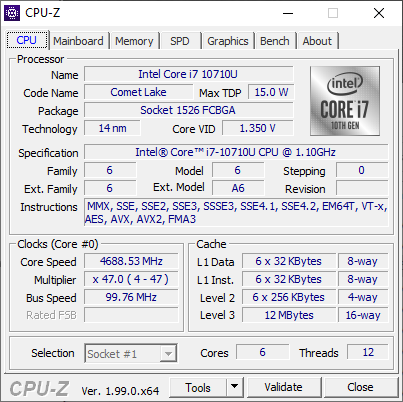
Processore
Le prestazioni della CPU multi-thread sono circa dal 20 al 30 per cento più lente del laptop medio nel nostro database equipaggiato con lo stesso Core i7-10710U processore. Questo non è insolito per i portatili rugged che probabilmente aumentano la stabilità e l'affidabilità generale al costo di alcune prestazioni grezze.
Cinebench R15 Multi Loop
Cinebench R23: Multi Core | Single Core
Cinebench R15: CPU Multi 64Bit | CPU Single 64Bit
Blender: v2.79 BMW27 CPU
7-Zip 18.03: 7z b 4 | 7z b 4 -mmt1
Geekbench 5.5: Multi-Core | Single-Core
HWBOT x265 Benchmark v2.2: 4k Preset
LibreOffice : 20 Documents To PDF
R Benchmark 2.5: Overall mean
| Cinebench R23 / Multi Core | |
| Lenovo Yoga 6 13ALC6 | |
| Lenovo IdeaPad 5 15ALC05 | |
| Panasonic Toughbook FZ-55 MK2 | |
| Acer Enduro Urban N3 EUN314 | |
| Honor MagicBook Pro 10210U | |
| Getac B360 | |
| Media Intel Core i7-10710U (n=1) | |
| Durabook S14I | |
| Infinix INBook X2 | |
| Cinebench R23 / Single Core | |
| Panasonic Toughbook FZ-55 MK2 | |
| Acer Enduro Urban N3 EUN314 | |
| Durabook S14I | |
| Lenovo Yoga 6 13ALC6 | |
| Lenovo IdeaPad 5 15ALC05 | |
| Honor MagicBook Pro 10210U | |
| Infinix INBook X2 | |
| Getac B360 | |
| Media Intel Core i7-10710U (n=1) | |
| Geekbench 5.5 / Single-Core | |
| Acer Enduro Urban N3 EUN314 | |
| Durabook S14I | |
| Media Intel Core i7-10710U (1225 - 1229, n=2) | |
| Getac B360 | |
| Lenovo ThinkPad P15s Gen1-20T4000JGE | |
| Infinix INBook X2 | |
| Asus ZenBook 14 UX434FL-DB77 | |
| Lenovo IdeaPad 5 15ALC05 | |
| Lenovo ThinkPad L14-20U50003GE | |
| Honor MagicBook Pro 10210U | |
Cinebench R23: Multi Core | Single Core
Cinebench R15: CPU Multi 64Bit | CPU Single 64Bit
Blender: v2.79 BMW27 CPU
7-Zip 18.03: 7z b 4 | 7z b 4 -mmt1
Geekbench 5.5: Multi-Core | Single-Core
HWBOT x265 Benchmark v2.2: 4k Preset
LibreOffice : 20 Documents To PDF
R Benchmark 2.5: Overall mean
* ... Meglio usare valori piccoli
AIDA64: FP32 Ray-Trace | FPU Julia | CPU SHA3 | CPU Queen | FPU SinJulia | FPU Mandel | CPU AES | CPU ZLib | FP64 Ray-Trace | CPU PhotoWorxx
| Performance rating | |
| Acer Enduro Urban N3 EUN314 | |
| Panasonic Toughbook FZ-55 MK2 | |
| Getac B360 | |
| Durabook S14I | |
| Media Intel Core i7-10710U | |
| AIDA64 / FP32 Ray-Trace | |
| Acer Enduro Urban N3 EUN314 | |
| Panasonic Toughbook FZ-55 MK2 | |
| Durabook S14I | |
| Getac B360 | |
| Media Intel Core i7-10710U (3674 - 4992, n=2) | |
| AIDA64 / FPU Julia | |
| Acer Enduro Urban N3 EUN314 | |
| Panasonic Toughbook FZ-55 MK2 | |
| Getac B360 | |
| Media Intel Core i7-10710U (21776 - 26990, n=2) | |
| Durabook S14I | |
| AIDA64 / CPU SHA3 | |
| Acer Enduro Urban N3 EUN314 | |
| Panasonic Toughbook FZ-55 MK2 | |
| Durabook S14I | |
| Getac B360 | |
| Media Intel Core i7-10710U (883 - 1289, n=2) | |
| AIDA64 / CPU Queen | |
| Getac B360 | |
| Media Intel Core i7-10710U (37935 - 64609, n=2) | |
| Acer Enduro Urban N3 EUN314 | |
| Durabook S14I | |
| Panasonic Toughbook FZ-55 MK2 | |
| AIDA64 / FPU SinJulia | |
| Acer Enduro Urban N3 EUN314 | |
| Getac B360 | |
| Panasonic Toughbook FZ-55 MK2 | |
| Media Intel Core i7-10710U (3580 - 4770, n=2) | |
| Durabook S14I | |
| AIDA64 / FPU Mandel | |
| Acer Enduro Urban N3 EUN314 | |
| Panasonic Toughbook FZ-55 MK2 | |
| Durabook S14I | |
| Getac B360 | |
| Media Intel Core i7-10710U (9533 - 12867, n=2) | |
| AIDA64 / CPU AES | |
| Acer Enduro Urban N3 EUN314 | |
| Durabook S14I | |
| Panasonic Toughbook FZ-55 MK2 | |
| Getac B360 | |
| Media Intel Core i7-10710U (13808 - 18491, n=2) | |
| AIDA64 / CPU ZLib | |
| Acer Enduro Urban N3 EUN314 | |
| Getac B360 | |
| Panasonic Toughbook FZ-55 MK2 | |
| Media Intel Core i7-10710U (242 - 300, n=2) | |
| Durabook S14I | |
| AIDA64 / FP64 Ray-Trace | |
| Acer Enduro Urban N3 EUN314 | |
| Panasonic Toughbook FZ-55 MK2 | |
| Durabook S14I | |
| Getac B360 | |
| Media Intel Core i7-10710U (1994 - 2672, n=2) | |
| AIDA64 / CPU PhotoWorxx | |
| Acer Enduro Urban N3 EUN314 | |
| Panasonic Toughbook FZ-55 MK2 | |
| Getac B360 | |
| Media Intel Core i7-10710U (10842 - 21733, n=2) | |
| Durabook S14I | |
Prestazioni del sistema
| PCMark 10 / Score | |
| Panasonic Toughbook FZ-55 MK2 | |
| Durabook S14I | |
| Media Intel Core i7-10710U (4161 - 5150, n=6) | |
| Acer Enduro Urban N3 EUN314 | |
| Dell Latitude 5420 Rugged-P85G | |
| Getac B360 | |
| Getac S410 | |
| PCMark 10 / Essentials | |
| Panasonic Toughbook FZ-55 MK2 | |
| Durabook S14I | |
| Acer Enduro Urban N3 EUN314 | |
| Getac B360 | |
| Media Intel Core i7-10710U (8785 - 9160, n=6) | |
| Dell Latitude 5420 Rugged-P85G | |
| Getac S410 | |
| PCMark 10 / Productivity | |
| Dell Latitude 5420 Rugged-P85G | |
| Getac B360 | |
| Durabook S14I | |
| Getac S410 | |
| Panasonic Toughbook FZ-55 MK2 | |
| Media Intel Core i7-10710U (5816 - 7222, n=6) | |
| Acer Enduro Urban N3 EUN314 | |
| PCMark 10 / Digital Content Creation | |
| Panasonic Toughbook FZ-55 MK2 | |
| Acer Enduro Urban N3 EUN314 | |
| Media Intel Core i7-10710U (3280 - 6248, n=6) | |
| Durabook S14I | |
| Dell Latitude 5420 Rugged-P85G | |
| Getac B360 | |
| Getac S410 | |
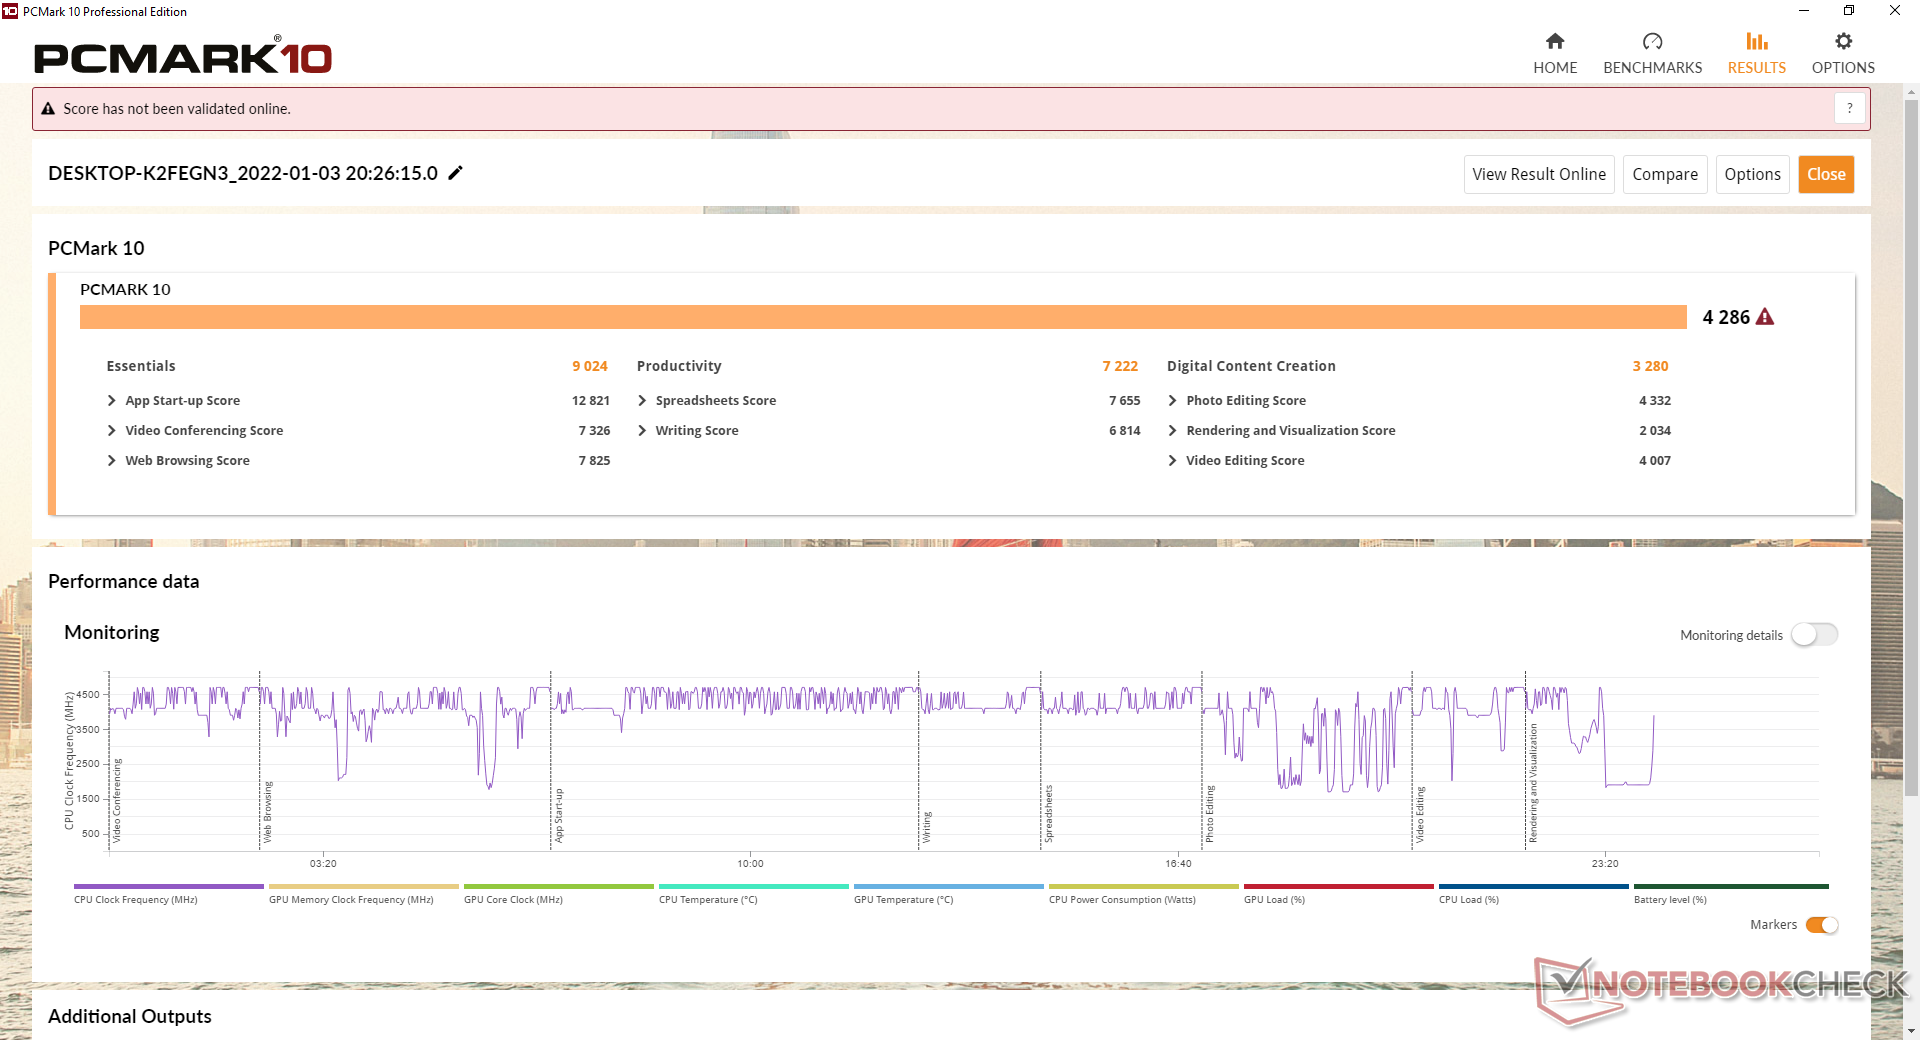
| PCMark 10 Score | 4286 punti | |
Aiuto | ||
| AIDA64 / Memory Copy | |
| Acer Enduro Urban N3 EUN314 | |
| Panasonic Toughbook FZ-55 MK2 | |
| Getac B360 | |
| Durabook S14I | |
| AIDA64 / Memory Read | |
| Acer Enduro Urban N3 EUN314 | |
| Panasonic Toughbook FZ-55 MK2 | |
| Getac B360 | |
| Durabook S14I | |
| AIDA64 / Memory Write | |
| Acer Enduro Urban N3 EUN314 | |
| Panasonic Toughbook FZ-55 MK2 | |
| Getac B360 | |
| Durabook S14I | |
| AIDA64 / Memory Latency | |
| Acer Enduro Urban N3 EUN314 | |
| Panasonic Toughbook FZ-55 MK2 | |
| Durabook S14I | |
| Getac B360 | |
* ... Meglio usare valori piccoli
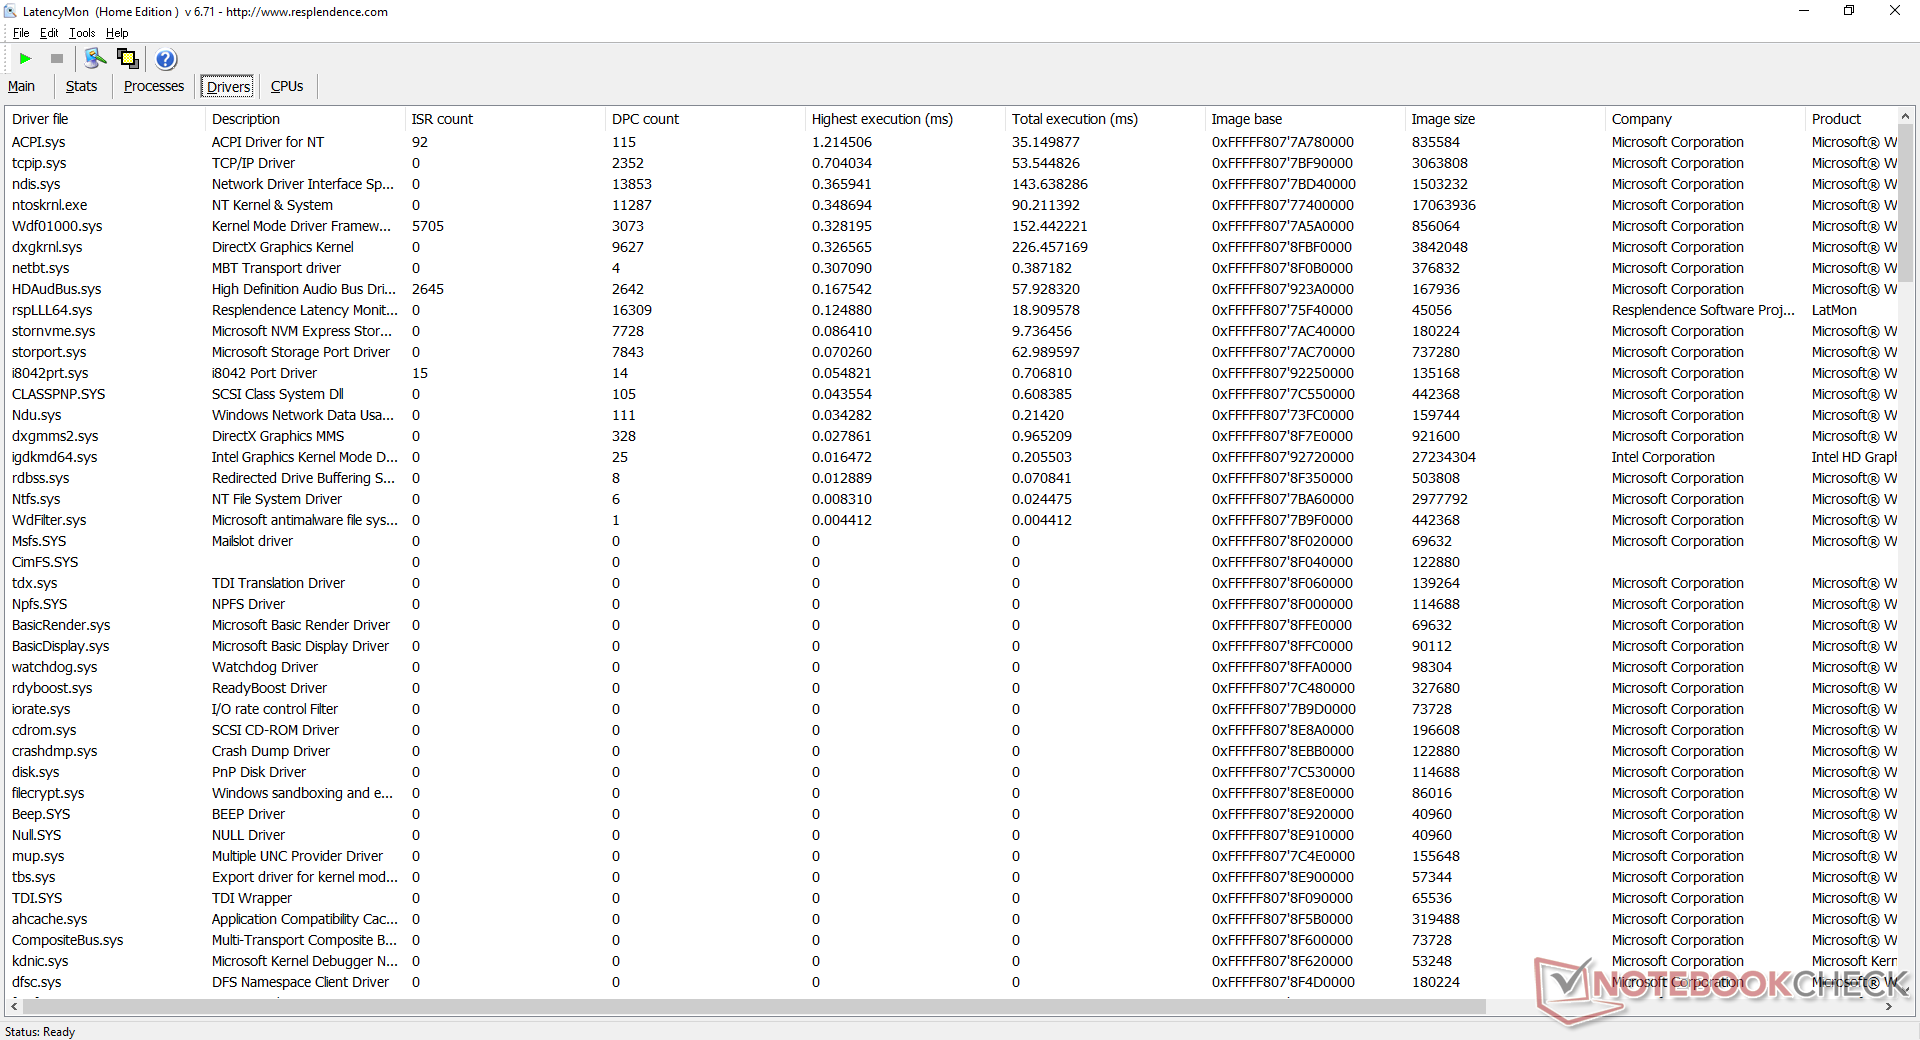
Latenza DPC
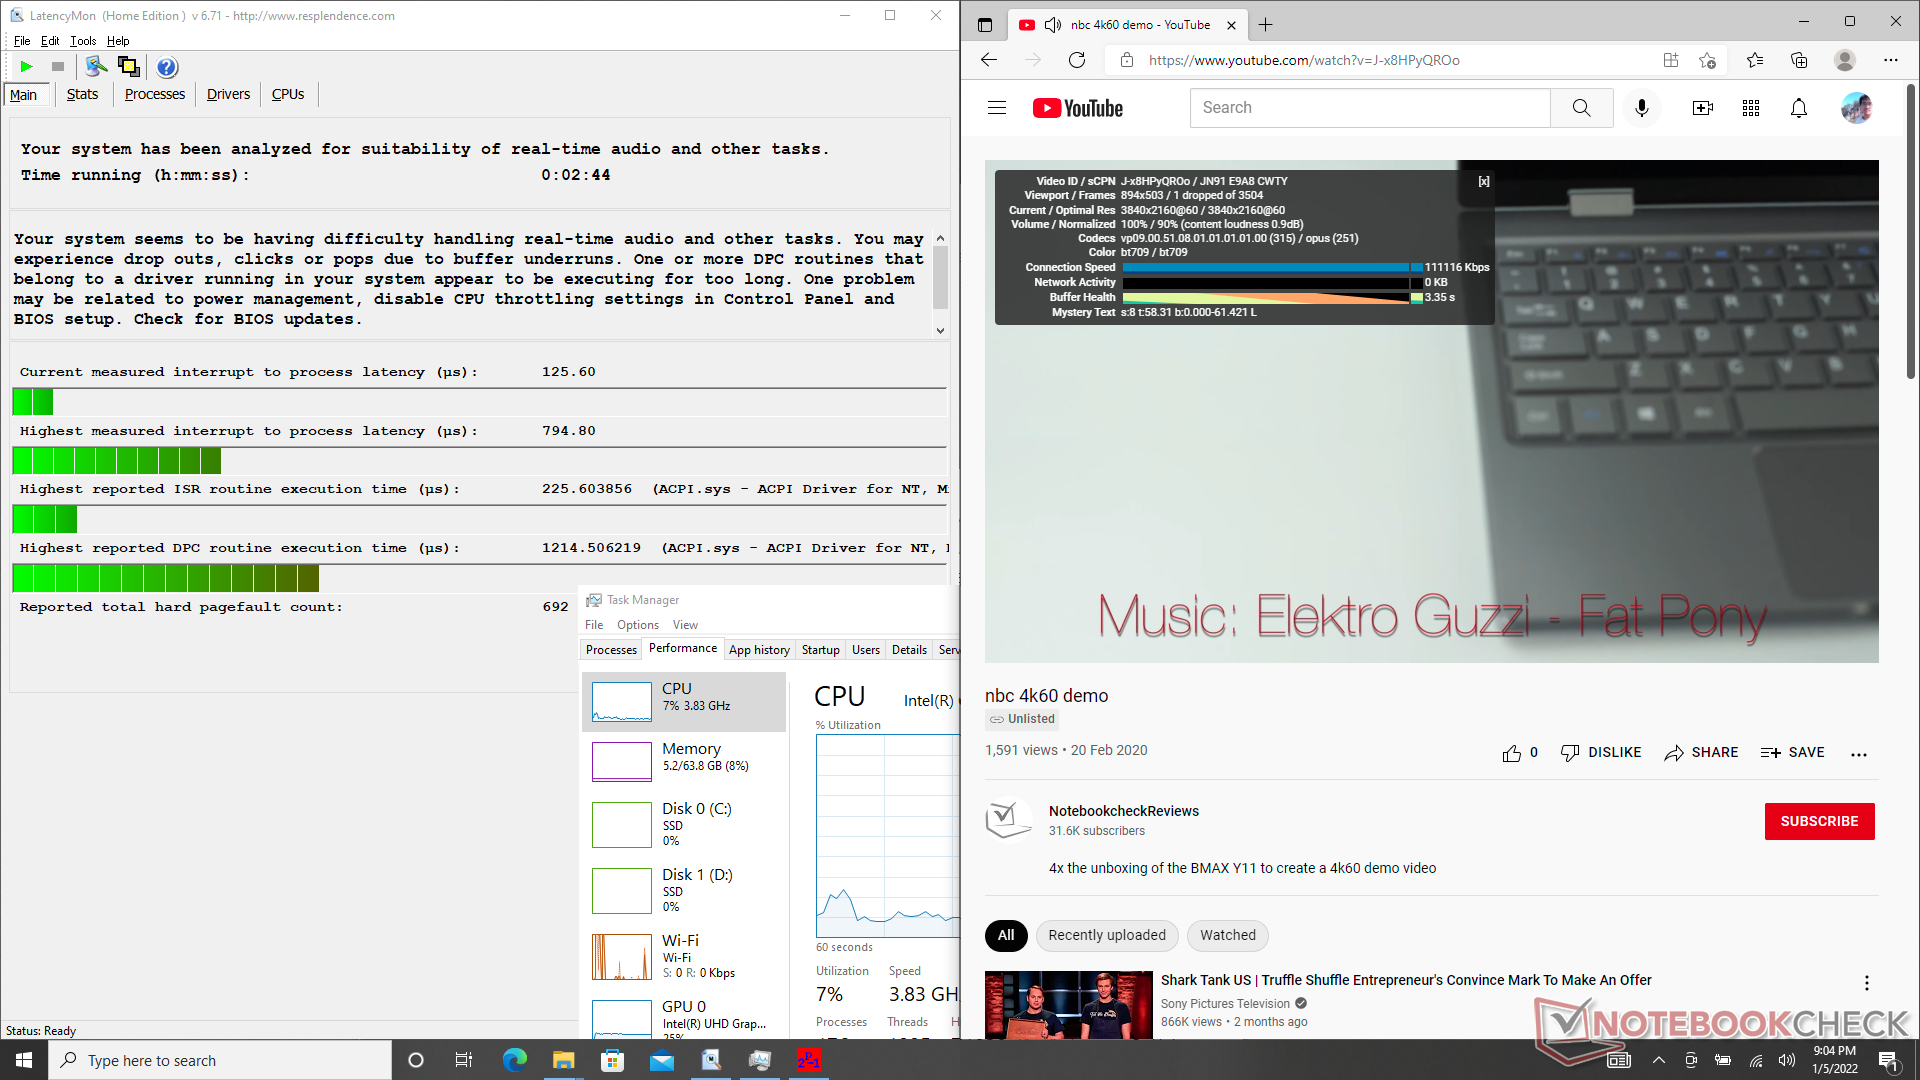
La nostra unità mostra leggeri problemi di latenza quando si aprono più schede sulla nostra homepage. la riproduzione di video 4K a 60 FPS è altrimenti liscia e solo un singolo fotogramma è caduto durante il nostro test video di un minuto.
| DPC Latencies / LatencyMon - interrupt to process latency (max), Web, Youtube, Prime95 | |
| Acer Enduro Urban N3 EUN314 | |
| Panasonic Toughbook FZ-55 MK2 | |
| Durabook S14I | |
| Getac B360 | |
* ... Meglio usare valori piccoli
Dispositivi di archiviazione
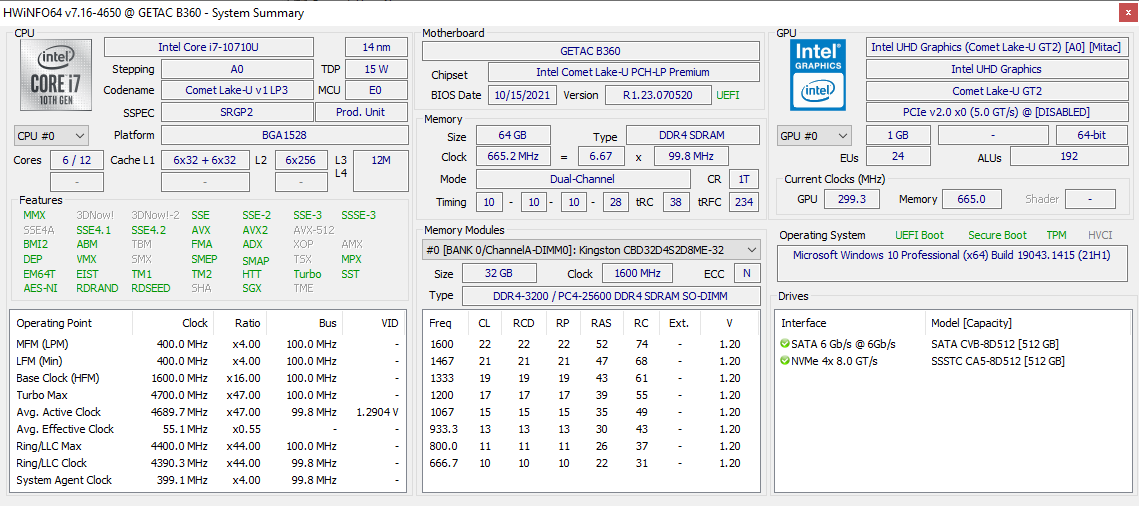
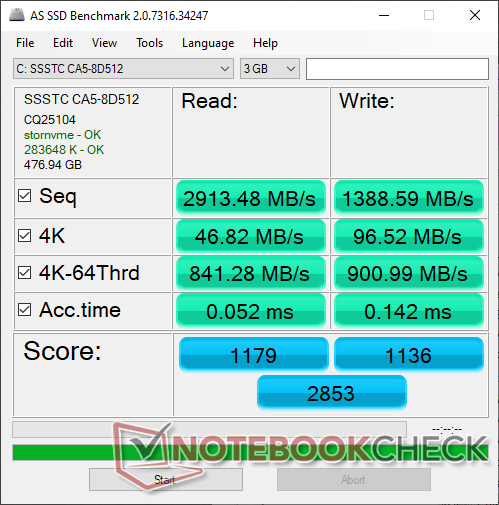
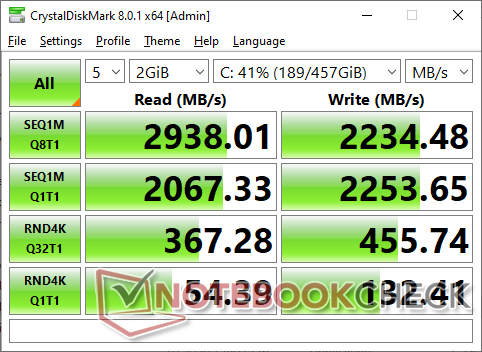
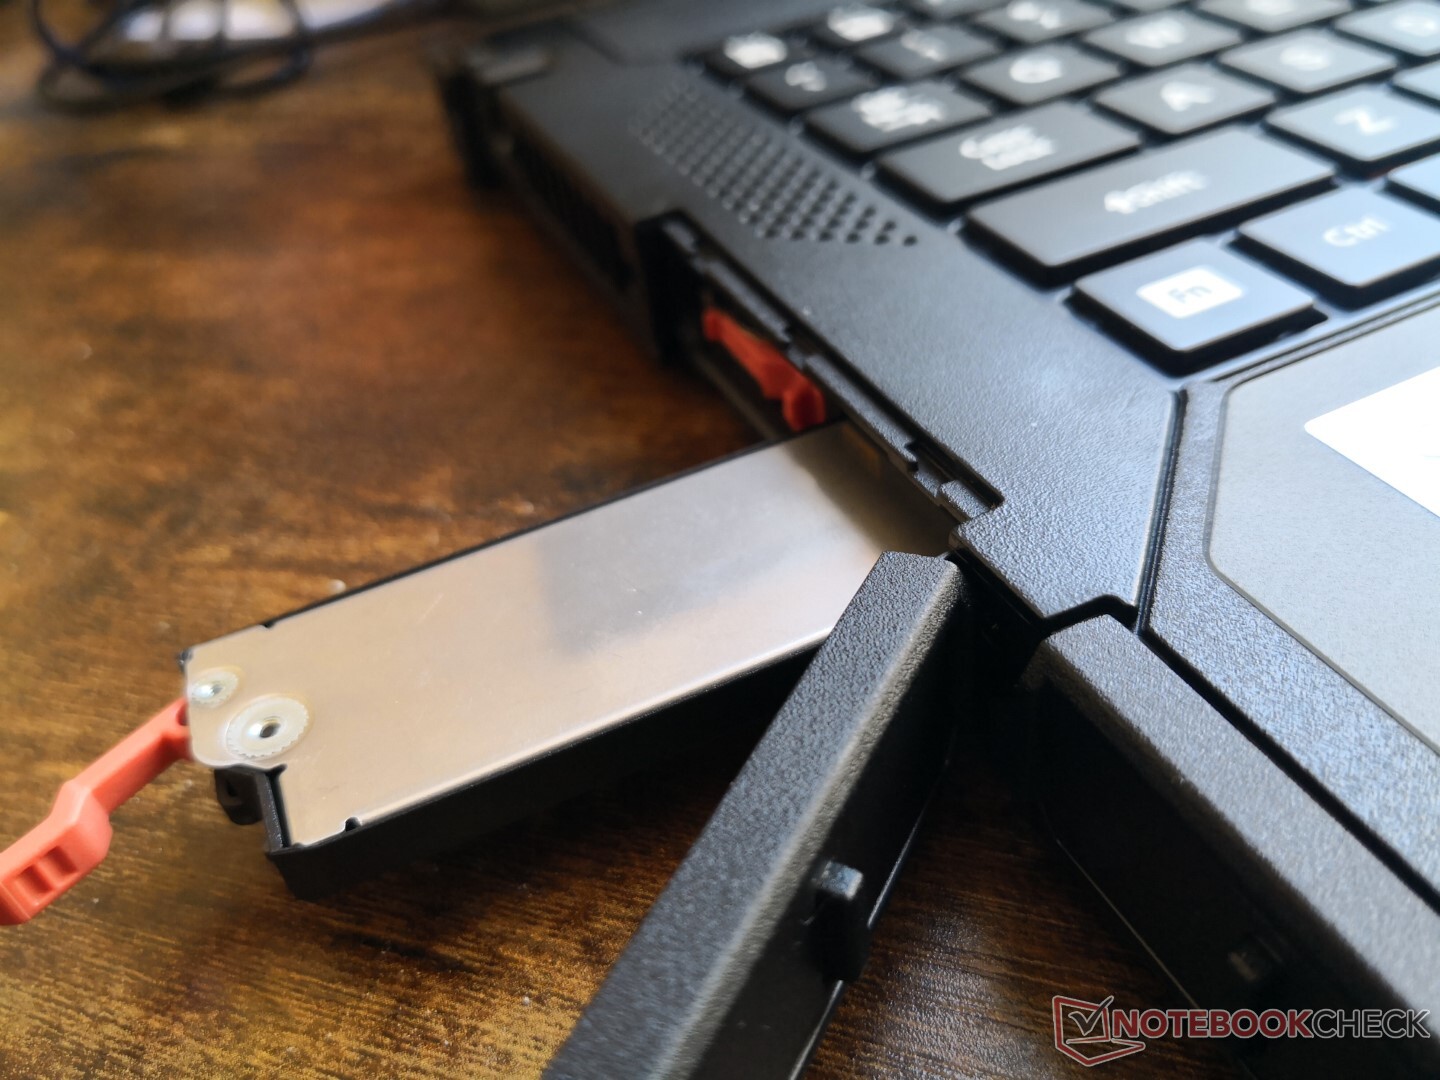
Sono supportate fino a due unità M.2 (1x PCIe + 1x SATA). La seconda unità, tuttavia, è un aggiornamento opzionale. Entrambi gli slot sono accessibili tramite due chiavistelli arancioni lungo il bordo sinistro dello chassis. Questi moduli rimovibili si collegano al portatile tramite USB-C, il che significa che è tecnicamente possibile collegare questi moduli ad altri portatili, ma Getac non lo consiglia. La nostra specifica unità da recensire è dotata di un modulo da 512 GBLite-On CA5-8D512 SSD PCIe3 x4 NVMe.

| Drive Performance rating - Percent | |
| Getac B360 | |
| Acer Enduro Urban N3 EUN314 | |
| Durabook S14I | |
| Dell Latitude 5420 Rugged-P85G -8! | |
| Panasonic Toughbook FZ-55 MK2 | |
| Getac S410 -8! | |
* ... Meglio usare valori piccoli
Disk Throttling: DiskSpd Read Loop, Queue Depth 8
Prestazioni della GPU
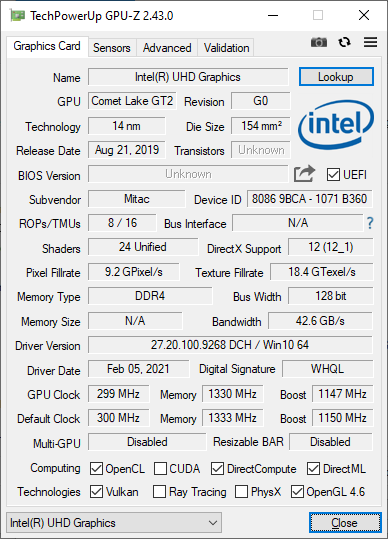
Il UHD Graphics 620 è diventato obsoleto. Aspettatevi che le prestazioni siano molto indietro rispetto alle ultime GPU integrate della serie Zen di AMD o delle serie Ice Lake o Tiger Lake di Intel.
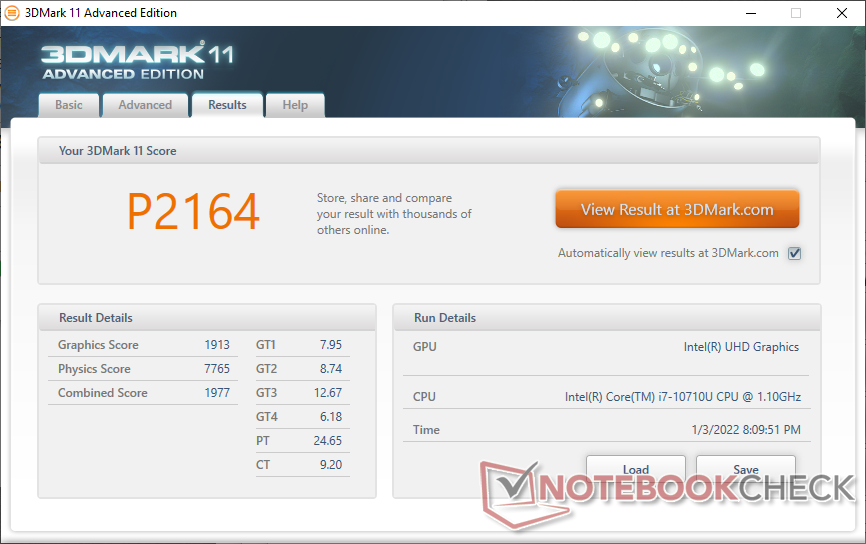
| 3DMark 11 Performance | 2164 punti | |
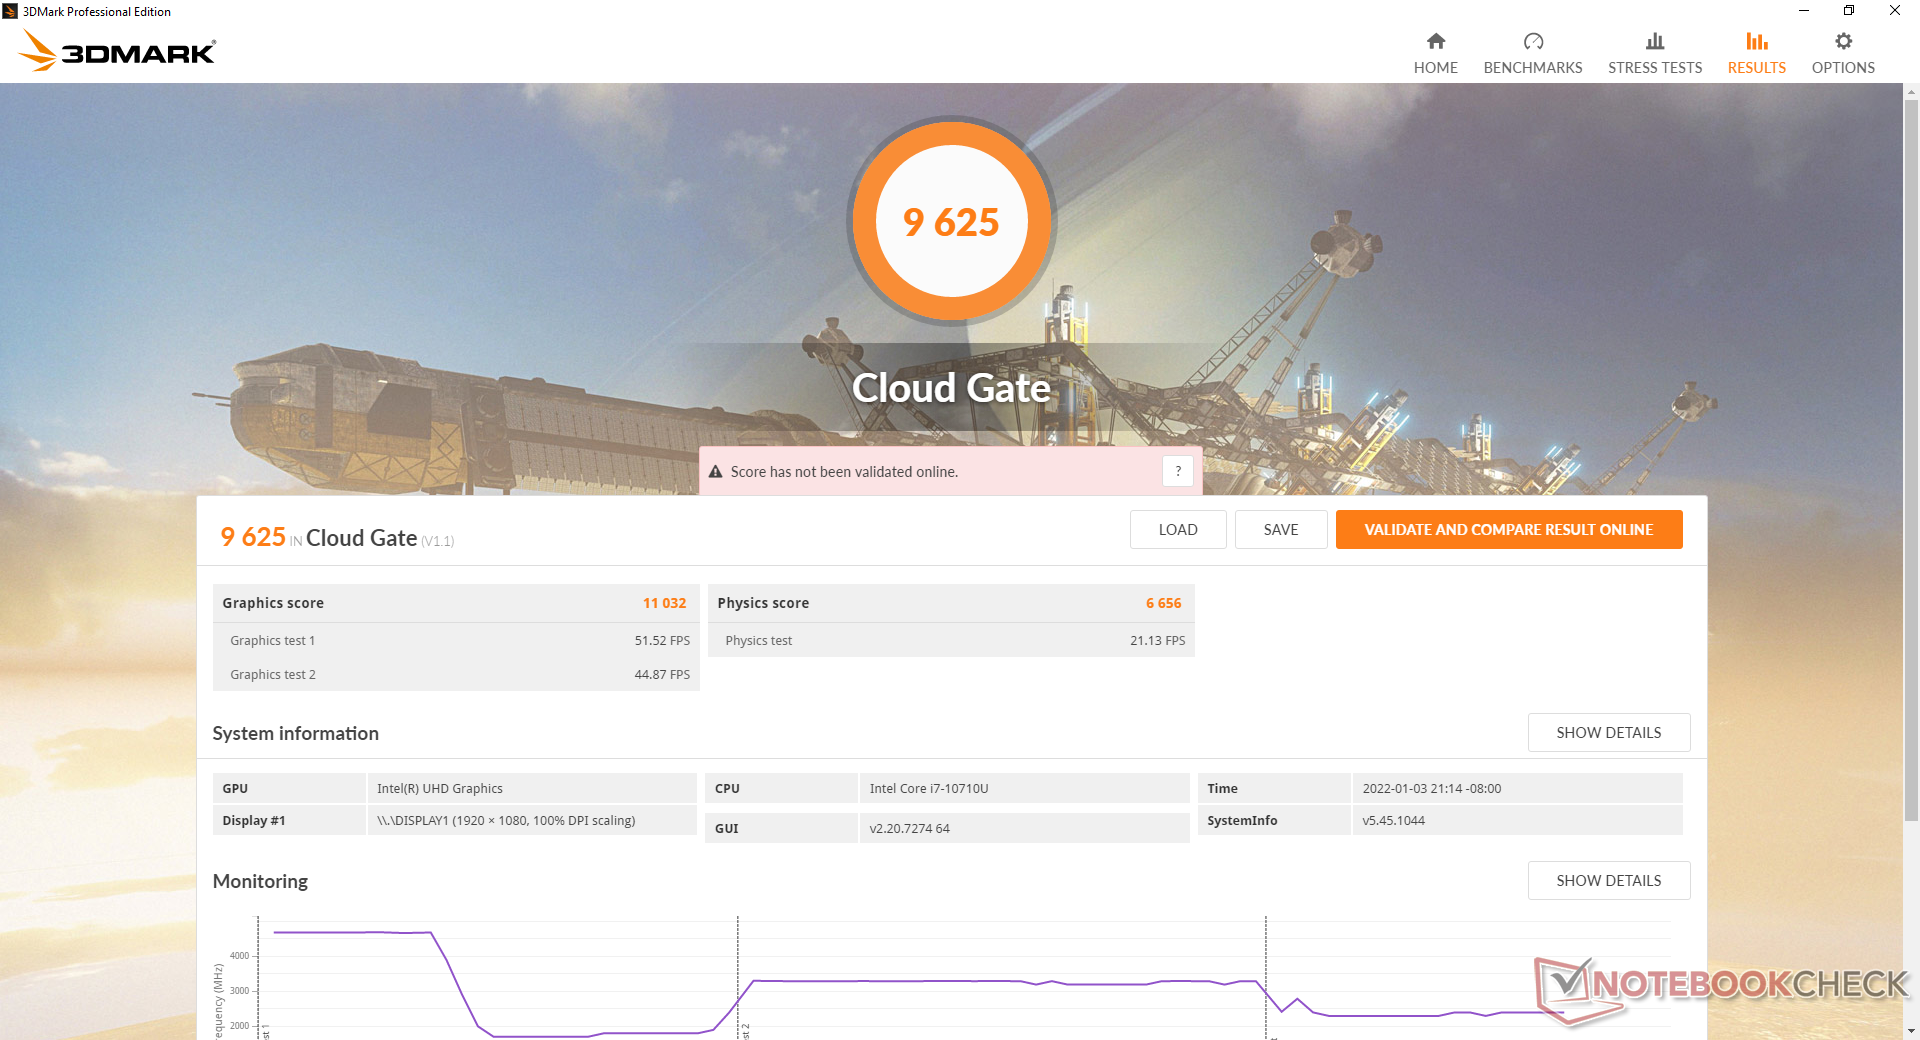
| 3DMark Cloud Gate Standard Score | 9625 punti | |
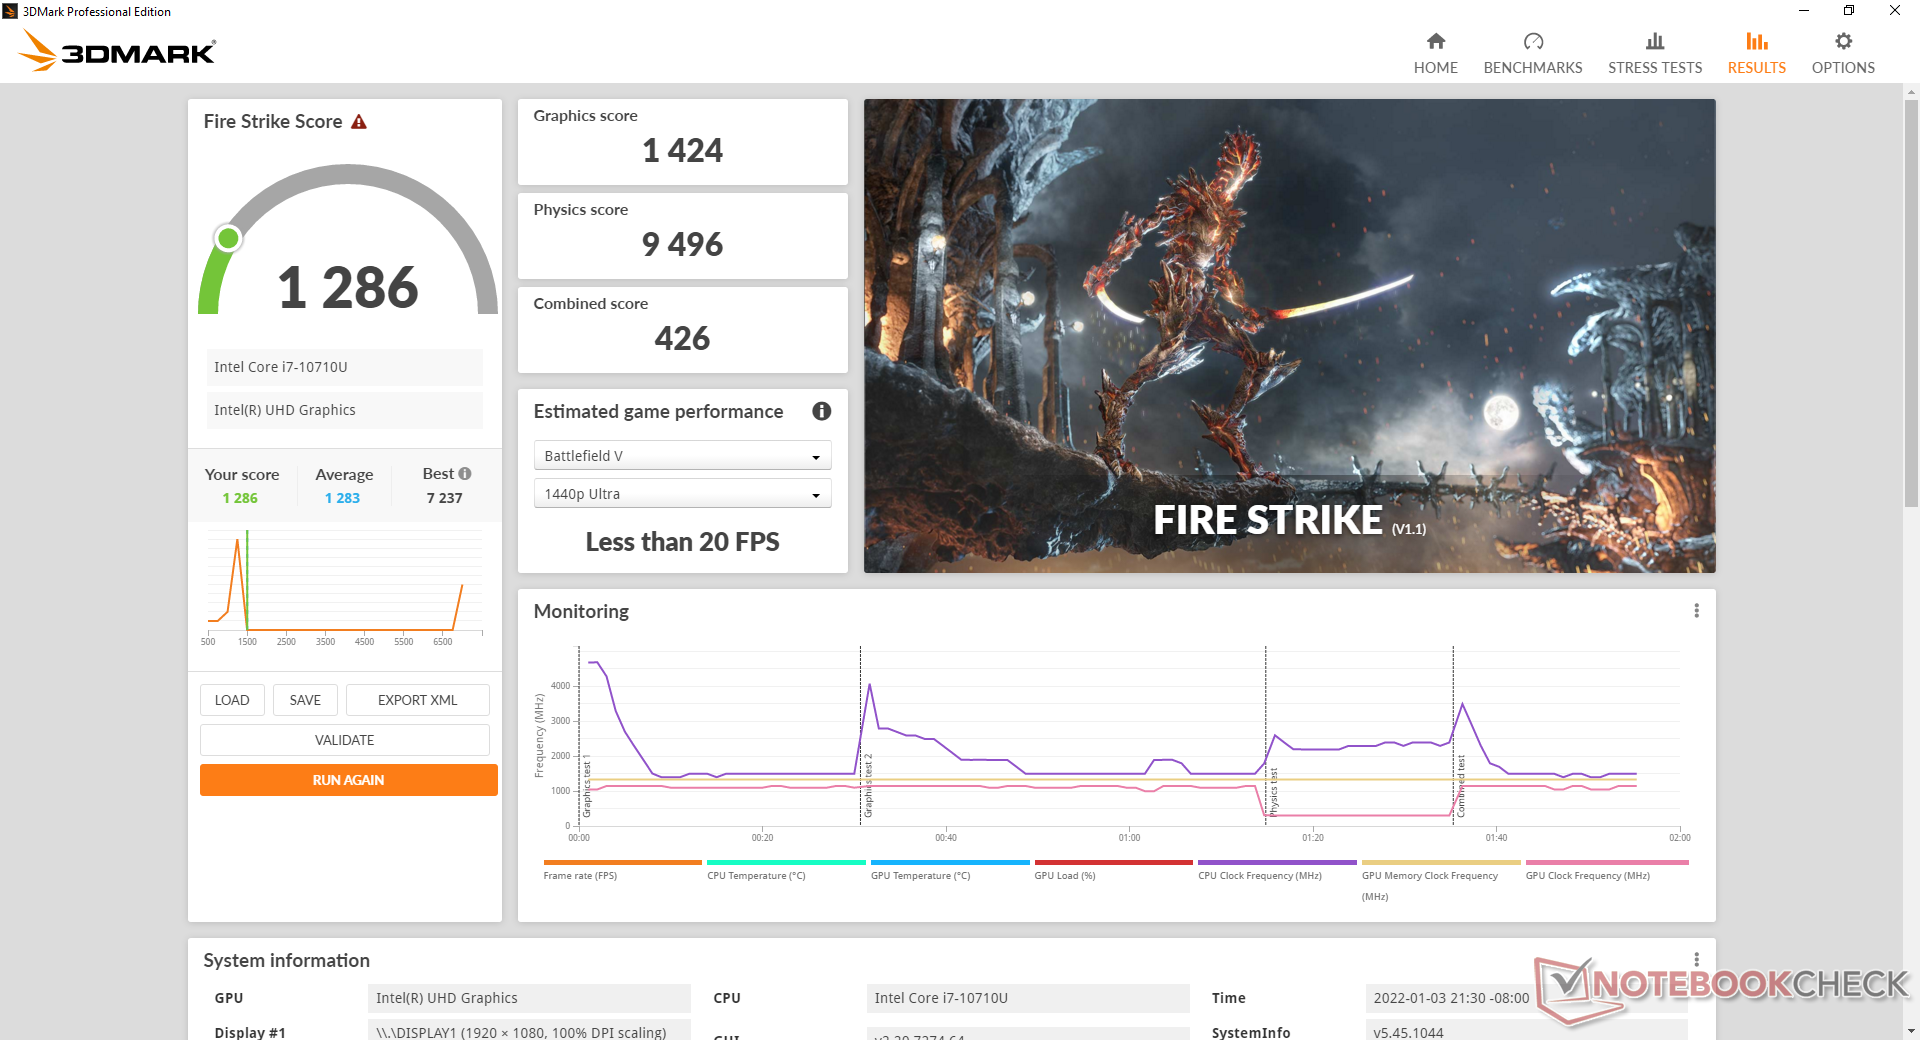
| 3DMark Fire Strike Score | 1286 punti | |
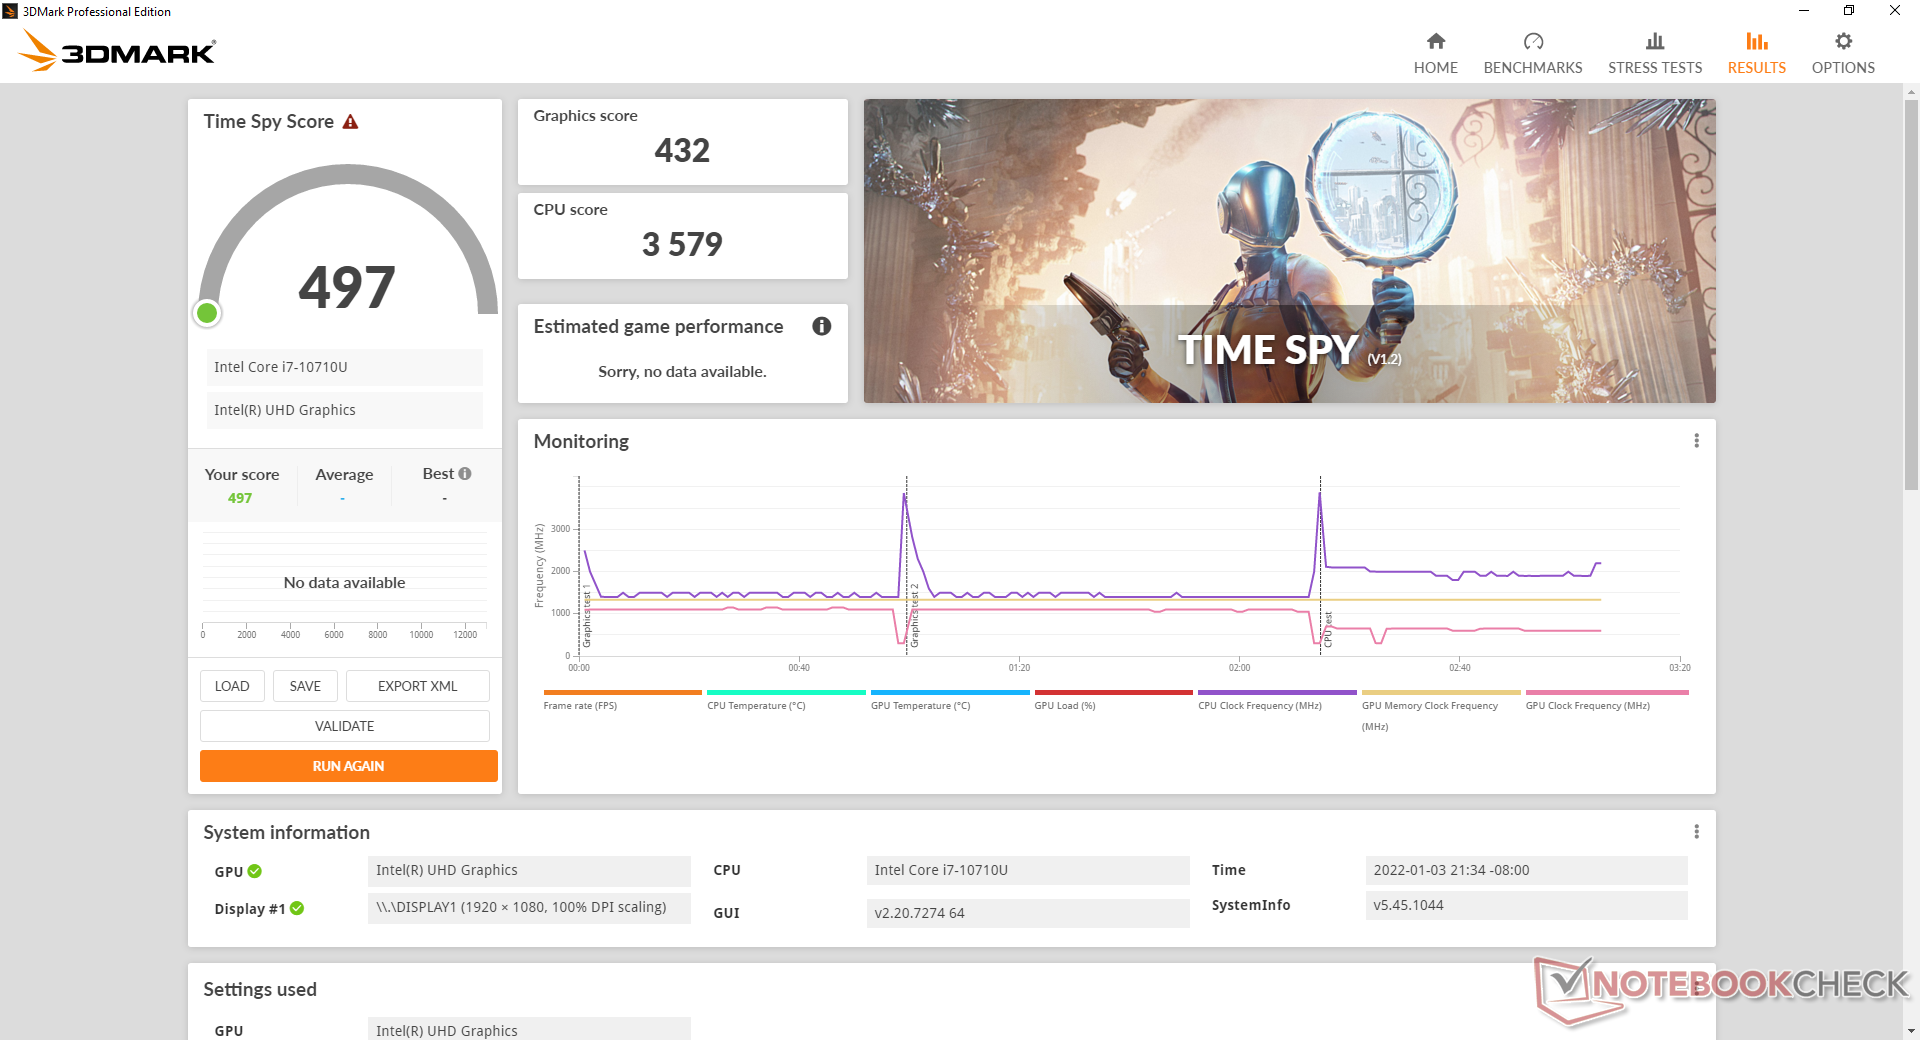
| 3DMark Time Spy Score | 497 punti | |
Aiuto | ||
Witcher 3 FPS Chart
| basso | medio | alto | ultra | |
|---|---|---|---|---|
| The Witcher 3 (2015) | 20.7 | 14.3 | 8.4 | 4.8 |
| Dota 2 Reborn (2015) | 85.9 | 56 | 22.8 | 20.3 |
| Final Fantasy XV Benchmark (2018) | 14.2 | 6.77 | 5.05 | |
| X-Plane 11.11 (2018) | 13.2 | 13.8 | 12.4 |
Emissioni
Rumore di sistema
Il rumore massimo della ventola è relativamente tranquillo a soli 31 dB(A), ma il tono elevato la rende più evidente di quanto vorremmo quando siamo in un ambiente tranquillo. Gli utenti probabilmente non noteranno affatto la ventola se lavorano all'aperto o sul campo.
Rumorosità
| Idle |
| 24.5 / 24.5 / 24.6 dB(A) |
| Sotto carico |
| 29.8 / 30.8 dB(A) |
 | ||
30 dB silenzioso 40 dB(A) udibile 50 dB(A) rumoroso |
||
min: | ||
| Getac B360 UHD Graphics 620, i7-10710U, Lite-On CA5-8D512 | Dell Latitude 5420 Rugged-P85G Radeon RX 540, i7-8650U, SK hynix PC401 NVMe 500 GB | Getac S410 UHD Graphics 620, i5-8550U, CUKUSA 1 TB SATA SSD Q0526A | Acer Enduro Urban N3 EUN314 Iris Xe G7 96EUs, i7-1165G7, Samsung PM991 MZVLQ1T0HALB | Panasonic Toughbook FZ-55 MK2 Iris Xe G7 96EUs, i7-1185G7, Toshiba KIOXIA KBG4AZNV512G M.2 2280 OPAL | Durabook S14I Iris Xe G7 96EUs, i7-1165G7, UDinfo M2P M2P80DE512GBAEP | |
|---|---|---|---|---|---|---|
| Noise | -14% | -12% | -6% | -3% | -14% | |
| off /ambiente * (dB) | 24.3 | 28.3 -16% | 28.4 -17% | 23.8 2% | 23.8 2% | 25.2 -4% |
| Idle Minimum * (dB) | 24.5 | 28.3 -16% | 28.4 -16% | 24.1 2% | 24 2% | 25.2 -3% |
| Idle Average * (dB) | 24.5 | 28.3 -16% | 28.4 -16% | 24.1 2% | 24 2% | 25.2 -3% |
| Idle Maximum * (dB) | 24.6 | 28.3 -15% | 28.4 -15% | 24.1 2% | 24 2% | 34.5 -40% |
| Load Average * (dB) | 29.8 | 29.9 -0% | 30.3 -2% | 27.9 6% | 26.7 10% | 34.5 -16% |
| Witcher 3 ultra * (dB) | 27.3 | 35.7 -31% | ||||
| Load Maximum * (dB) | 30.8 | 38 -23% | 33.3 -8% | 38.6 -25% | 41.7 -35% | 36.2 -18% |
* ... Meglio usare valori piccoli
Temperatura
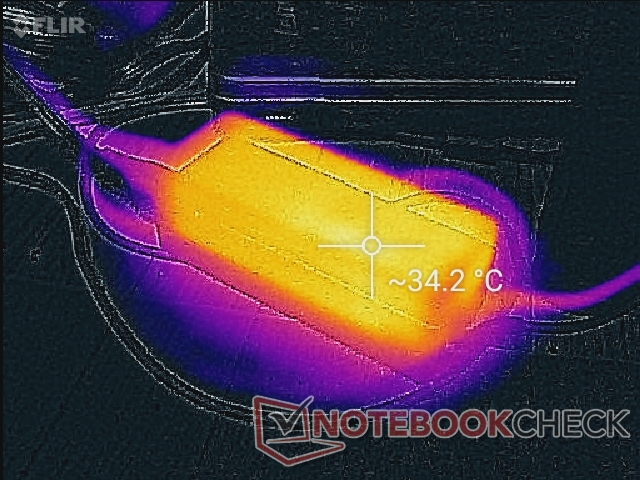
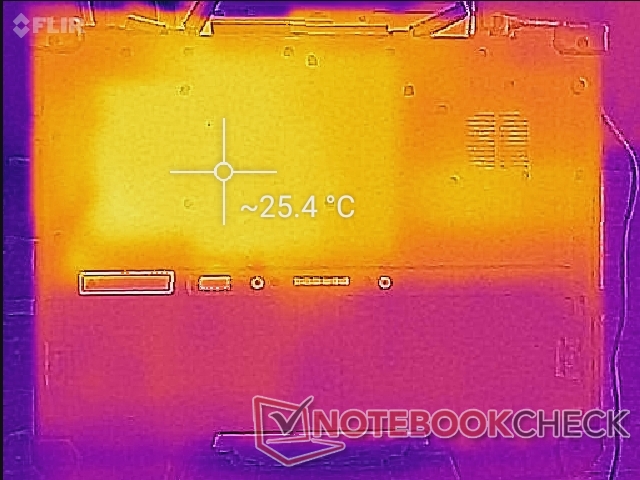
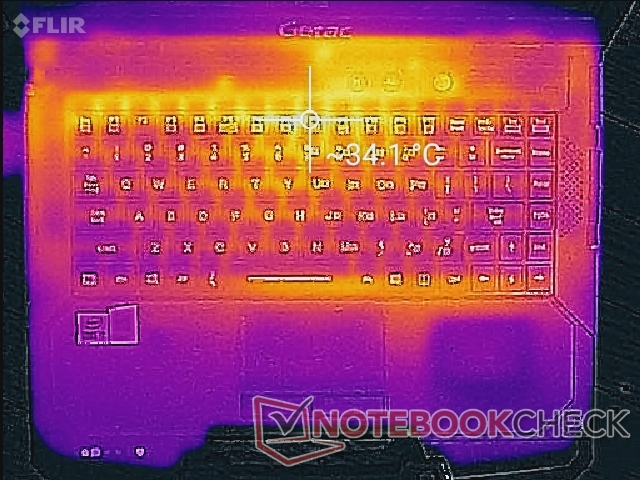
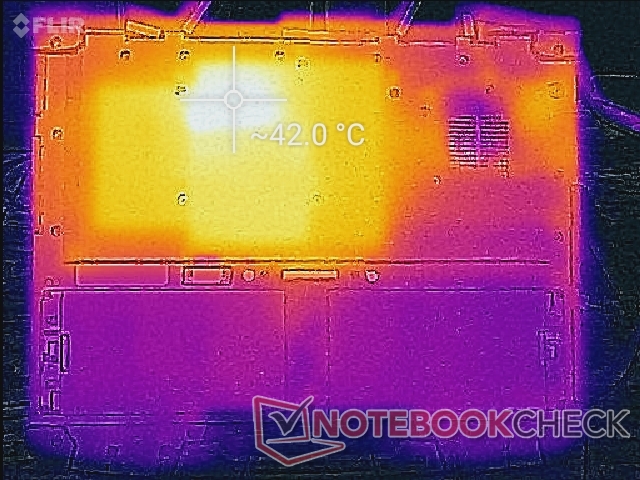
Le temperature di superficie non sono un problema poiché avete una CPU ULV in uno chassis che è almeno 2x o 3x più spesso della maggior parte degli Ultrabooks. Siamo in grado di registrare punti caldi di 34 C e 42 C sulle superfici superiore e inferiore quando si eseguono carichi impegnativi.
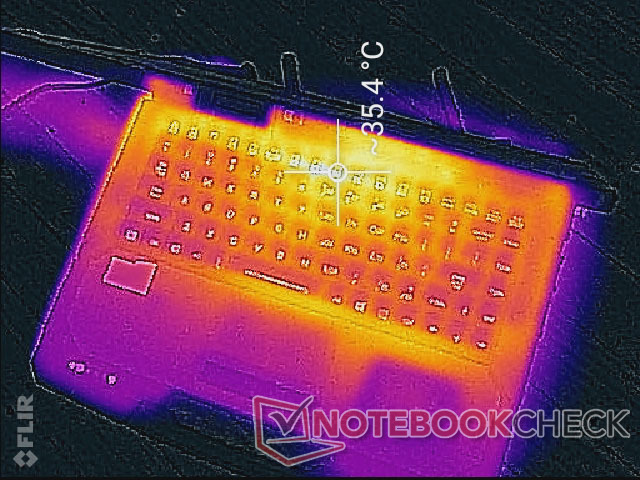
(+) La temperatura massima sul lato superiore è di 33.4 °C / 92 F, rispetto alla media di 34.3 °C / 94 F, che varia da 21.2 a 62.5 °C per questa classe Office.
(±) Il lato inferiore si riscalda fino ad un massimo di 42.6 °C / 109 F, rispetto alla media di 36.8 °C / 98 F
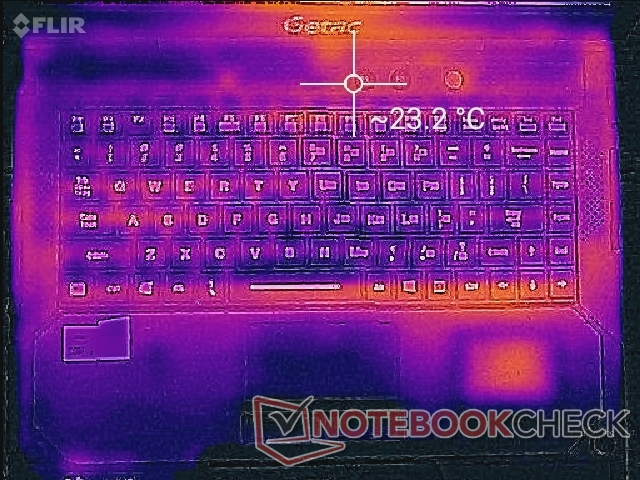
(+) In idle, la temperatura media del lato superiore è di 23.2 °C / 74 F, rispetto alla media deld ispositivo di 29.5 °C / 85 F.
(+) I poggiapolsi e il touchpad sono piu' freddi della temperatura della pelle con un massimo di 24.2 °C / 75.6 F e sono quindi freddi al tatto.
(+) La temperatura media della zona del palmo della mano di dispositivi simili e'stata di 27.6 °C / 81.7 F (+3.4 °C / 6.1 F).
| Getac B360 Intel Core i7-10710U, Intel UHD Graphics 620 | Dell Latitude 5420 Rugged-P85G Intel Core i7-8650U, AMD Radeon RX 540 | Getac S410 Intel Core i7-8550U, Intel UHD Graphics 620 | Acer Enduro Urban N3 EUN314 Intel Core i7-1165G7, Intel Iris Xe Graphics G7 96EUs | Panasonic Toughbook FZ-55 MK2 Intel Core i7-1185G7, Intel Iris Xe Graphics G7 96EUs | Durabook S14I Intel Core i7-1165G7, Intel Iris Xe Graphics G7 96EUs | |
|---|---|---|---|---|---|---|
| Heat | -19% | -25% | -11% | -16% | -16% | |
| Maximum Upper Side * (°C) | 33.4 | 42.2 -26% | 42.6 -28% | 37.8 -13% | 36.2 -8% | 36.4 -9% |
| Maximum Bottom * (°C) | 42.6 | 42 1% | 49 -15% | 45.8 -8% | 42.2 1% | 38.6 9% |
| Idle Upper Side * (°C) | 24.2 | 31.6 -31% | 30.8 -27% | 26.4 -9% | 31 -28% | 32.6 -35% |
| Idle Bottom * (°C) | 26.2 | 31.8 -21% | 34.4 -31% | 30.2 -15% | 34 -30% | 33.8 -29% |
* ... Meglio usare valori piccoli
Test di stress
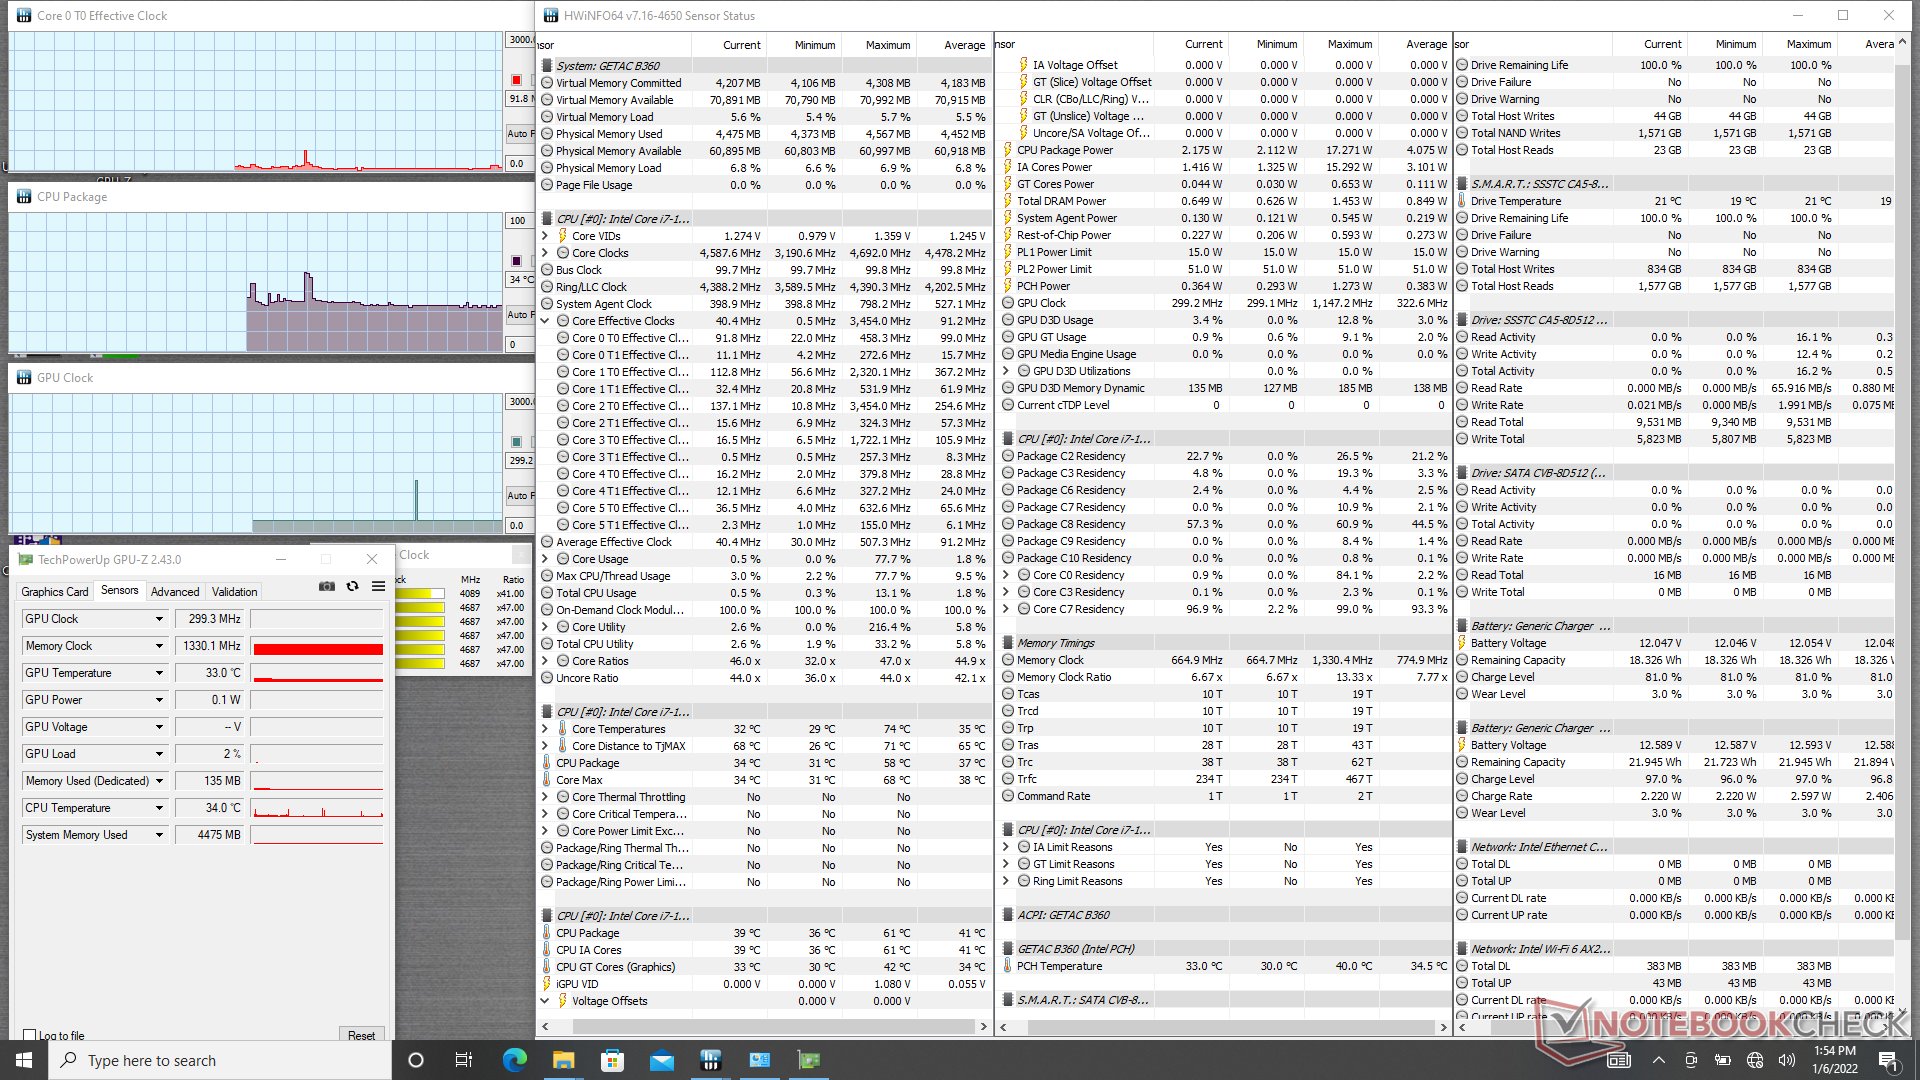
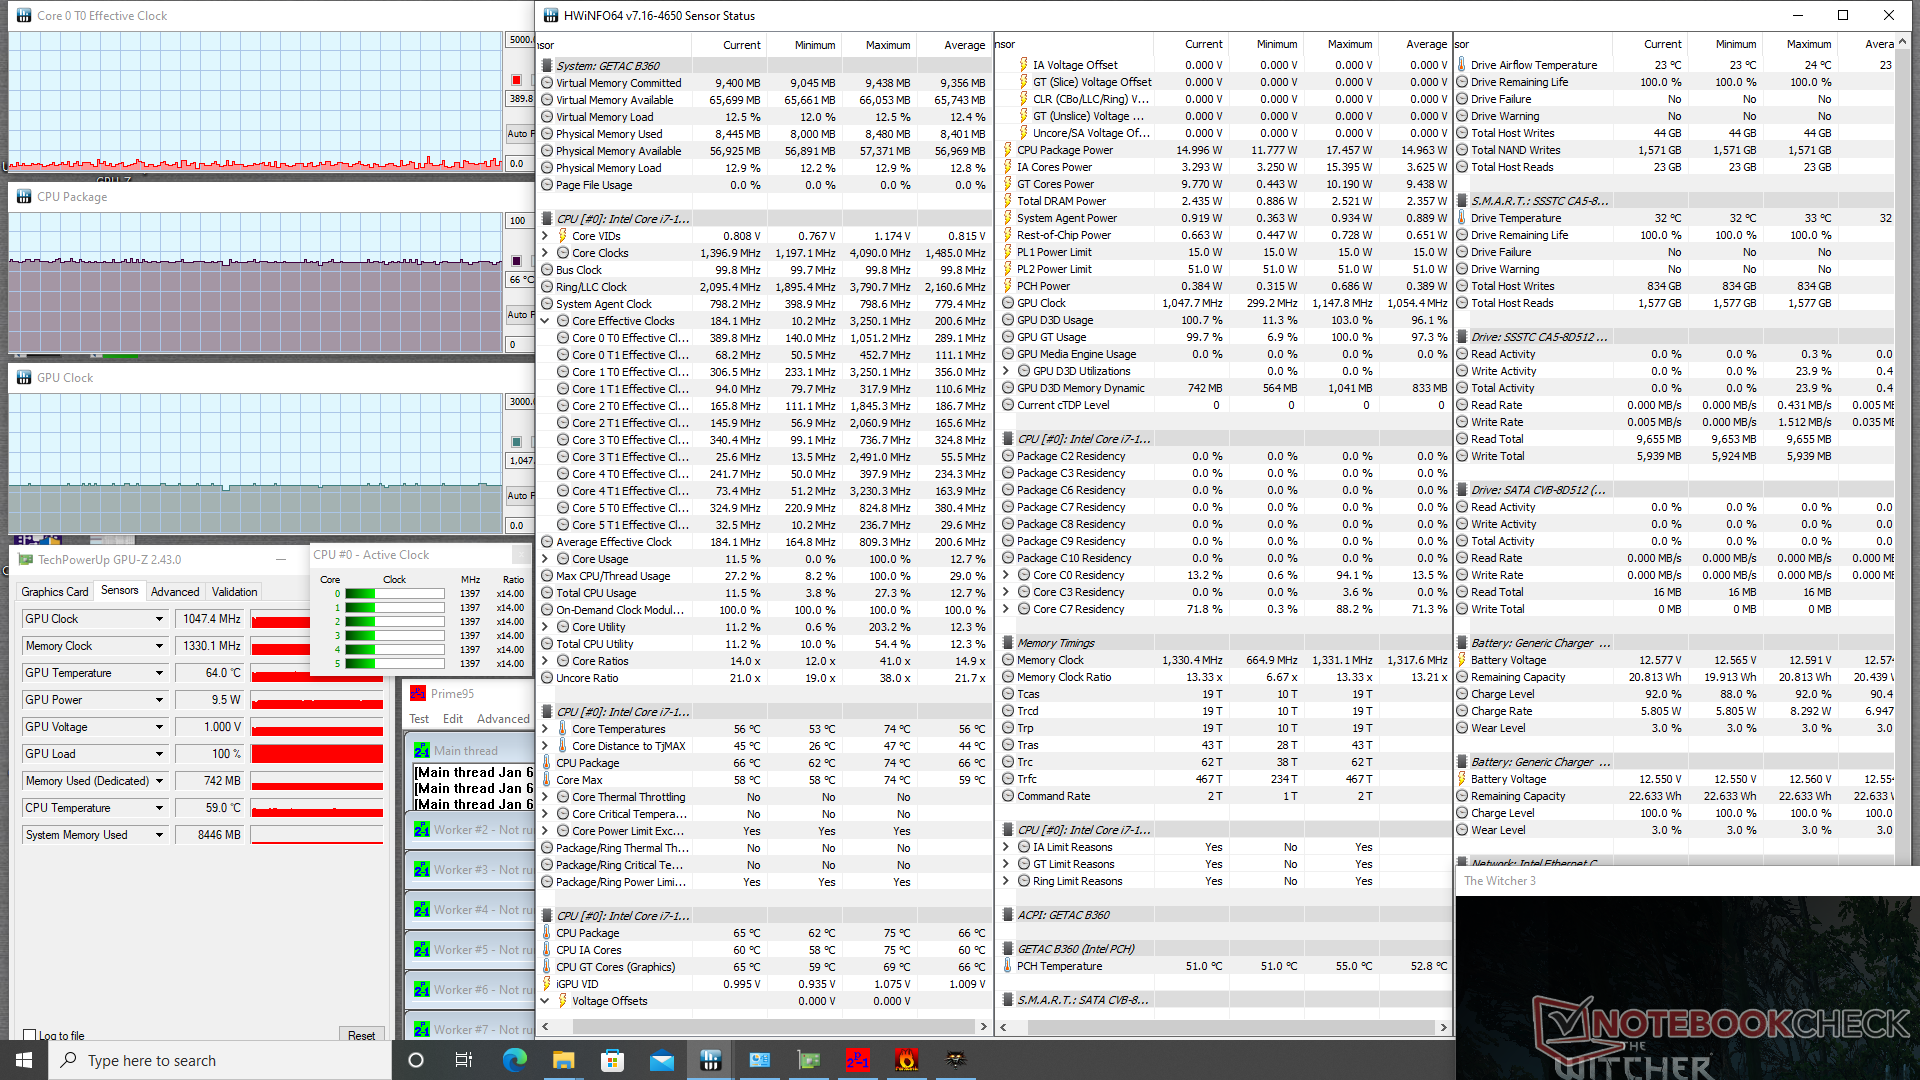
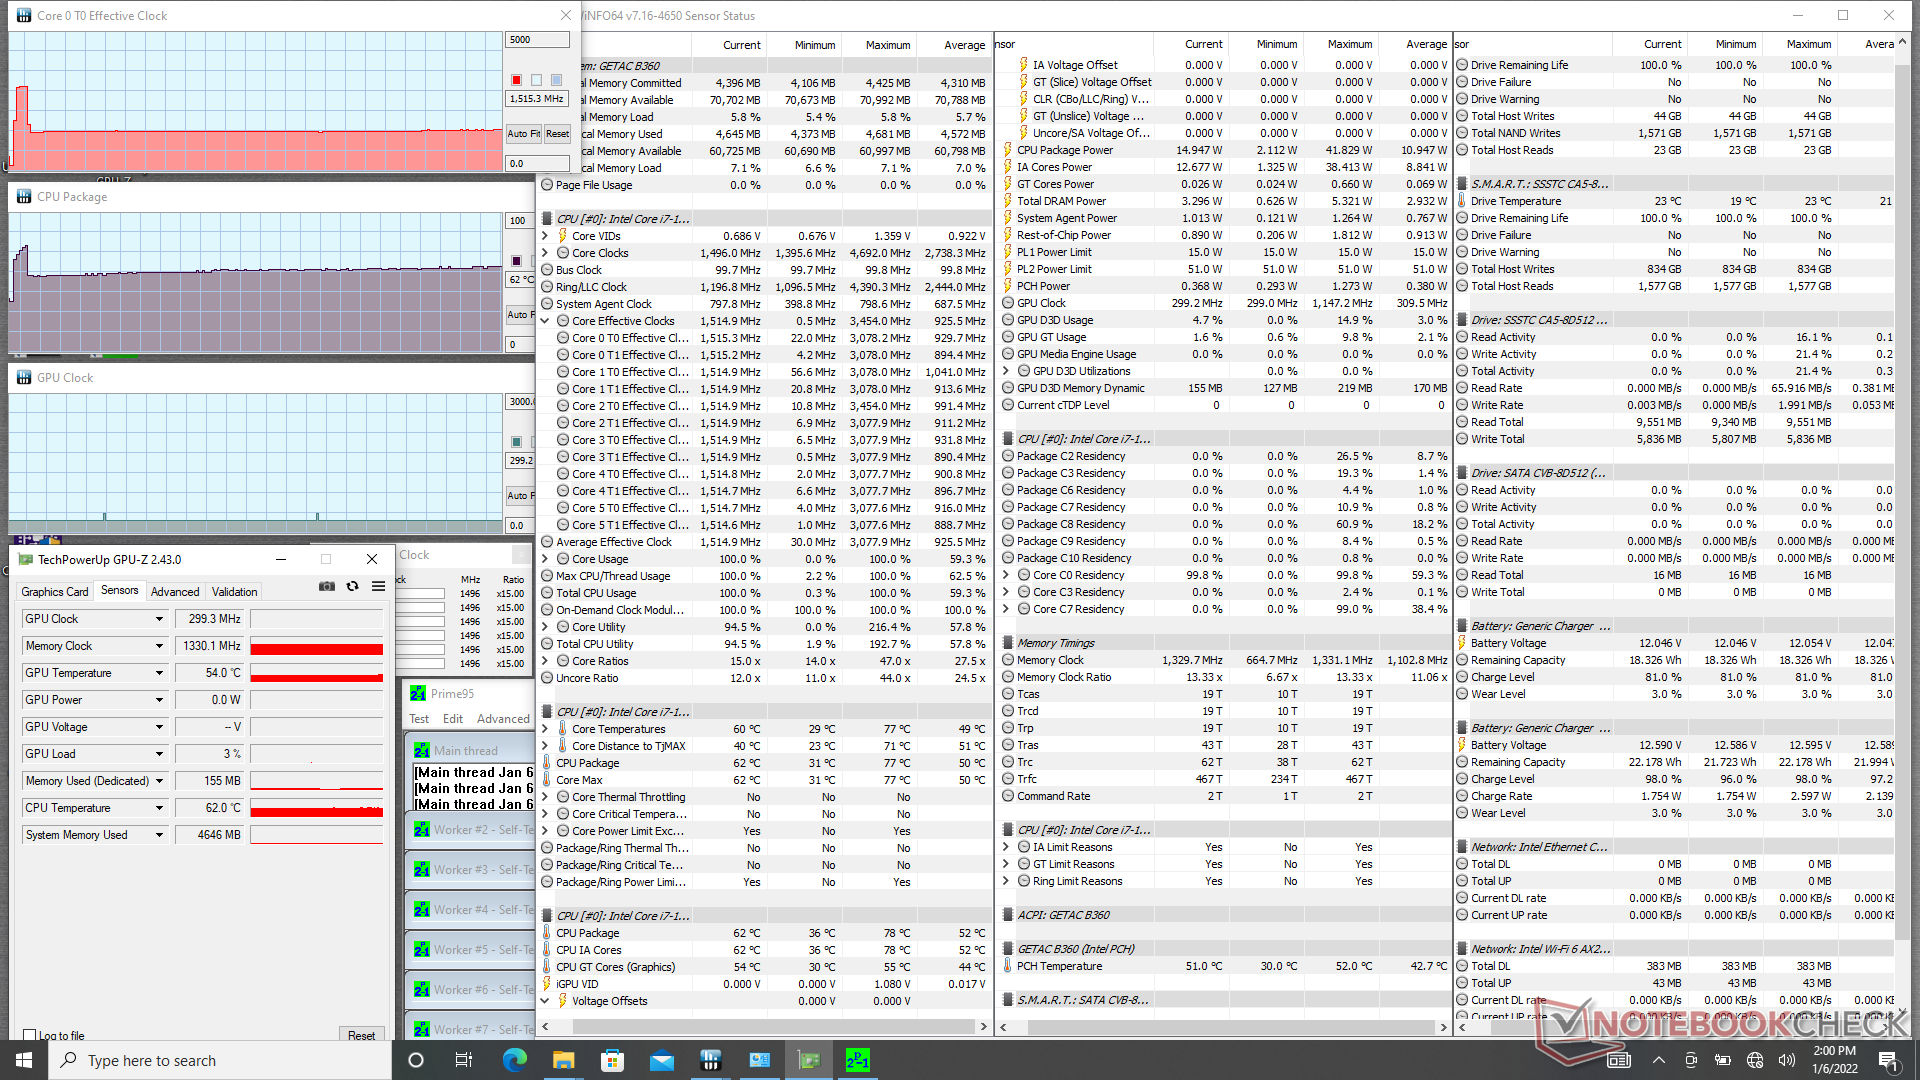
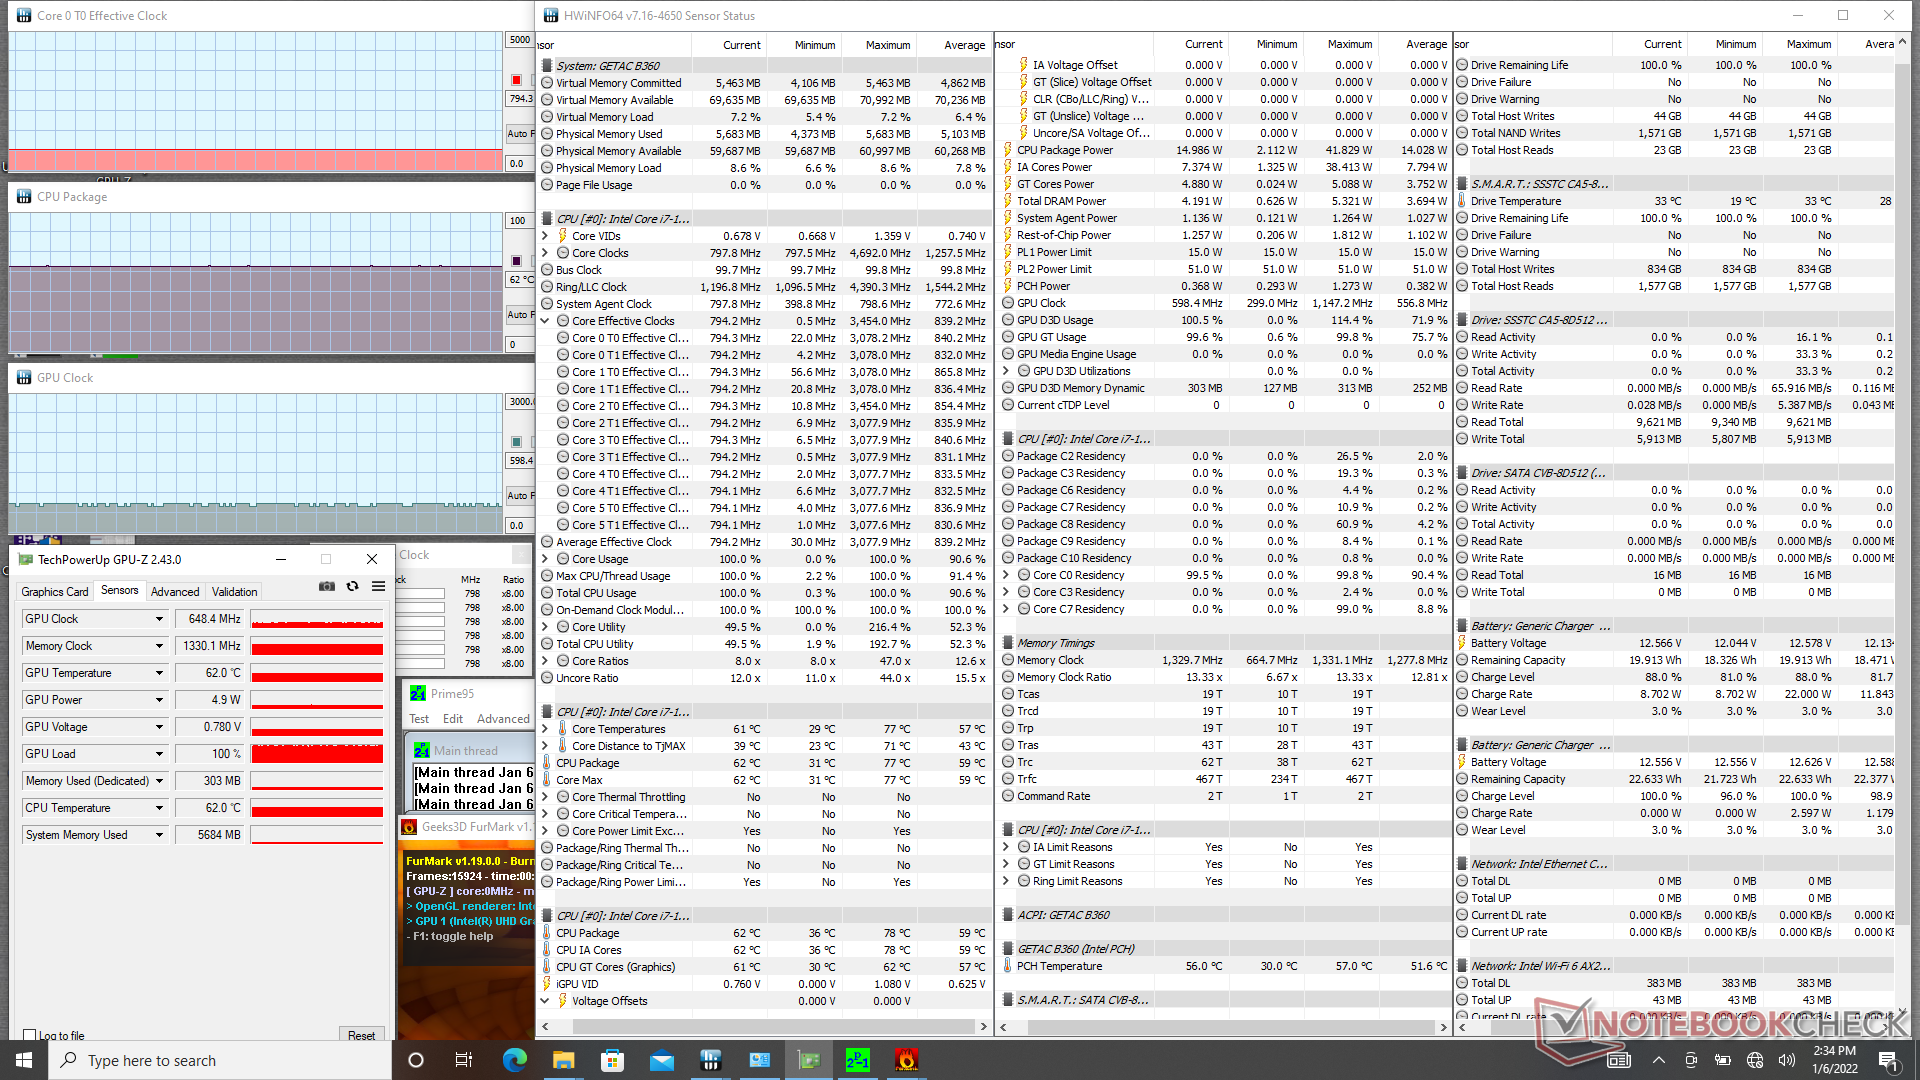
Quando si esegue Prime95, i tassi di clock della CPU aumentano fino a 3 GHz solo per i primi secondi fino a raggiungere una temperatura del core di 77 C. I tassi di clock poi scendono e si stabilizzano a soli 1,5 GHz e 62 C, rispettivamente. L'intervallo di 60 C sembra essere il punto ideale per questo sistema quando si eseguono carichi impegnativi.
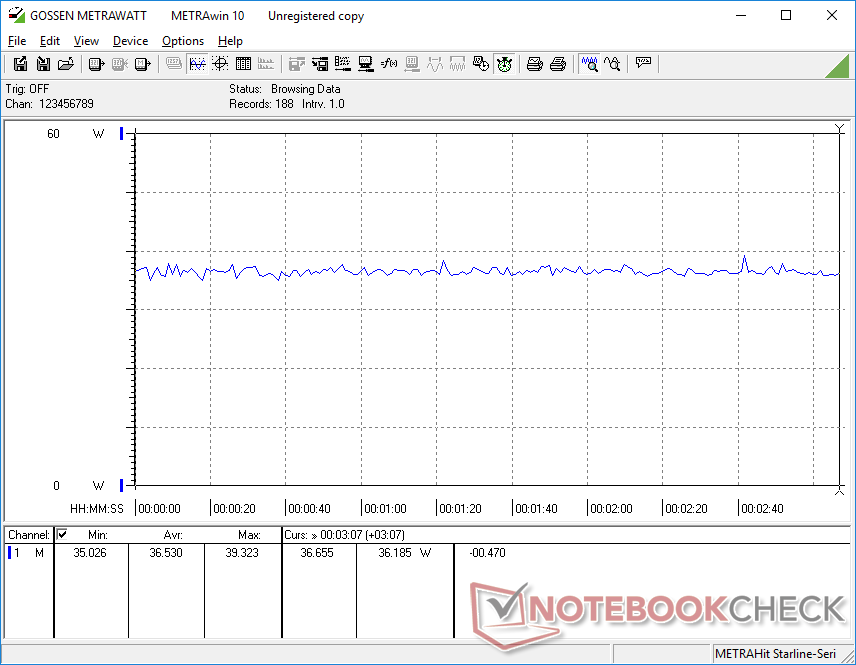
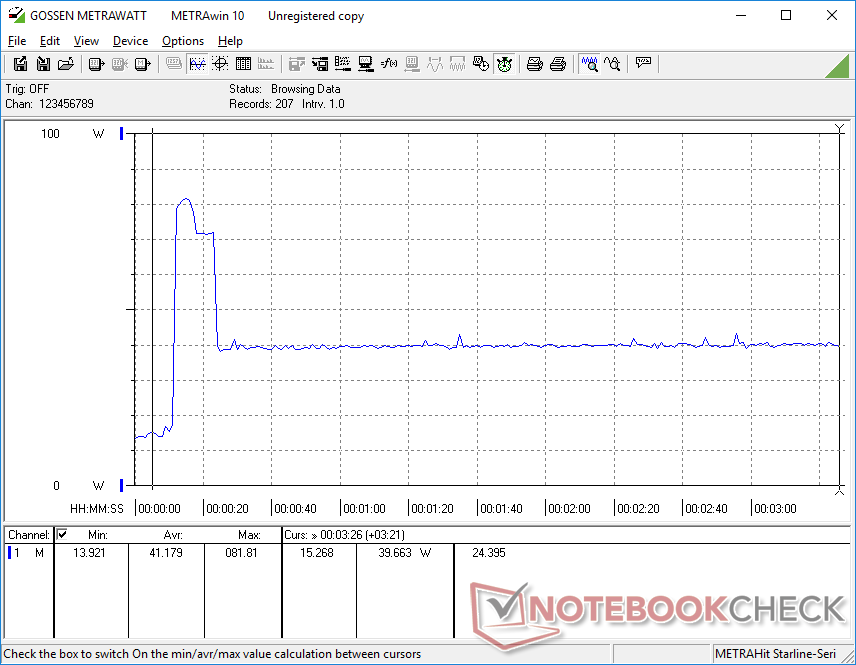
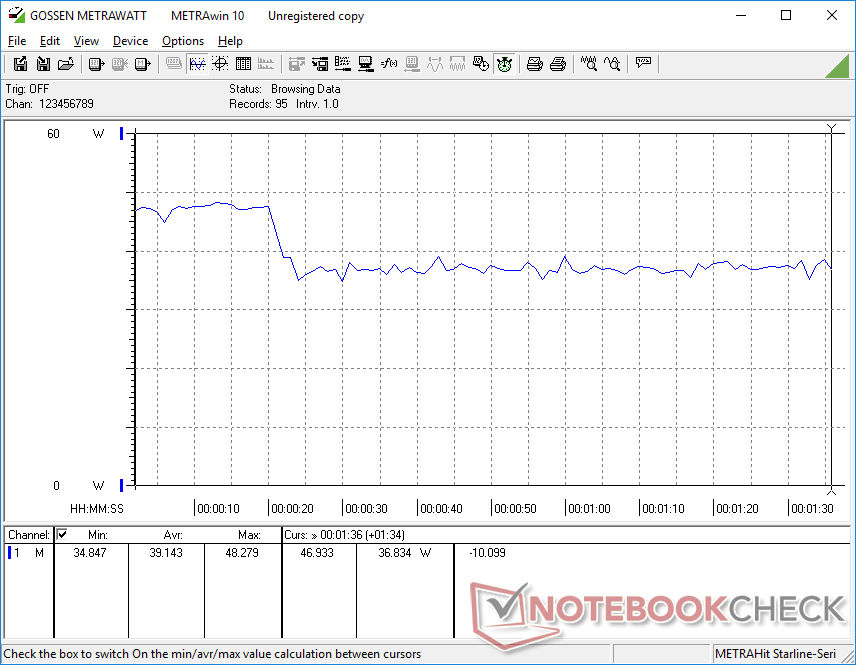
L'esecuzione a batteria non avrà un impatto sulle prestazioni. Un test 3DMark 11 con le batterie restituirebbe punteggi di Fisica e Grafica di 7884 e 1906 punti, rispettivamente, rispetto a 7765 e 1913 punti con l'alimentazione di rete.
| Clock della CPU (GHz)Clock della GPU(MHz)Temperaturamedia dellaCPU (°C) | |
| Sistema inattivo | -- |
| Stress Prime95 | 1.5 |
| Prime95 + FurMark Stress | 0.8 |
| Witcher 3 Stress | ~0.4 |
Altoparlanti
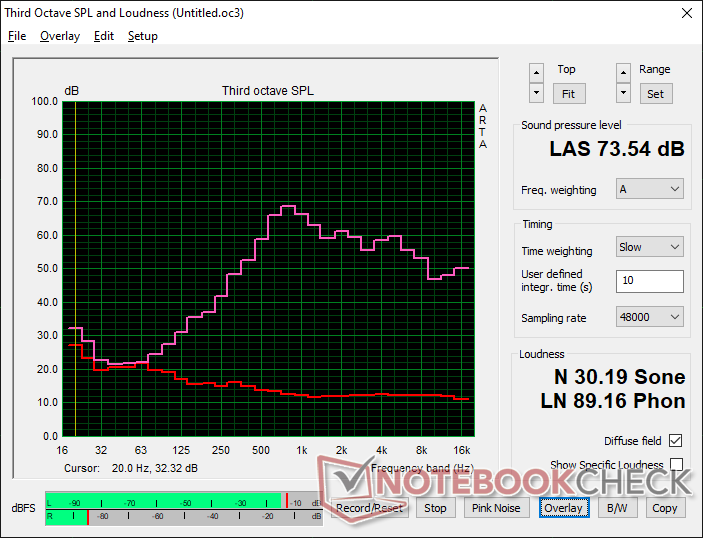
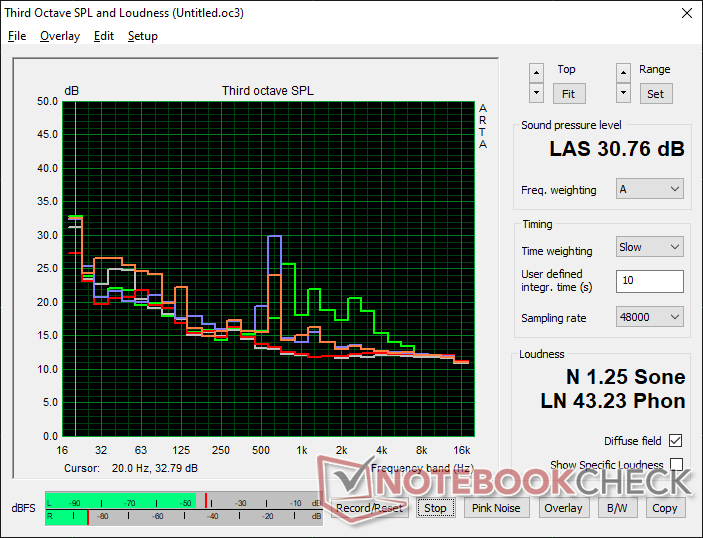
Getac B360 analisi audio
(±) | potenza degli altiparlanti media ma buona (73.5 dB)
Bassi 100 - 315 Hz
(-) | quasi nessun basso - in media 18.6% inferiori alla media
(±) | la linearità dei bassi è media (9.3% delta rispetto alla precedente frequenza)
Medi 400 - 2000 Hz
(±) | medi elevati - circa 7.2% superiore alla media
(±) | linearità dei medi adeguata (9.1% delta rispetto alla precedente frequenza)
Alti 2 - 16 kHz
(+) | Alti bilanciati - appena 3.1% dalla media
(±) | la linearità degli alti è media (7.4% delta rispetto alla precedente frequenza)
Nel complesso 100 - 16.000 Hz
(±) | la linearità complessiva del suono è media (22.9% di differenza rispetto alla media
Rispetto alla stessa classe
» 63% di tutti i dispositivi testati in questa classe è stato migliore, 8% simile, 29% peggiore
» Il migliore ha avuto un delta di 7%, medio di 21%, peggiore di 53%
Rispetto a tutti i dispositivi testati
» 68% di tutti i dispositivi testati in questa classe è stato migliore, 6% similare, 26% peggiore
» Il migliore ha avuto un delta di 4%, medio di 23%, peggiore di 134%
Apple MacBook Pro 16 2021 M1 Pro analisi audio
(+) | gli altoparlanti sono relativamente potenti (84.7 dB)
Bassi 100 - 315 Hz
(+) | bassi buoni - solo 3.8% dalla media
(+) | bassi in lineaa (5.2% delta rispetto alla precedente frequenza)
Medi 400 - 2000 Hz
(+) | medi bilanciati - solo only 1.3% rispetto alla media
(+) | medi lineari (2.1% delta rispetto alla precedente frequenza)
Alti 2 - 16 kHz
(+) | Alti bilanciati - appena 1.9% dalla media
(+) | alti lineari (2.7% delta rispetto alla precedente frequenza)
Nel complesso 100 - 16.000 Hz
(+) | suono nel complesso lineare (4.6% differenza dalla media)
Rispetto alla stessa classe
» 0% di tutti i dispositivi testati in questa classe è stato migliore, 0% simile, 100% peggiore
» Il migliore ha avuto un delta di 5%, medio di 17%, peggiore di 45%
Rispetto a tutti i dispositivi testati
» 0% di tutti i dispositivi testati in questa classe è stato migliore, 0% similare, 100% peggiore
» Il migliore ha avuto un delta di 4%, medio di 23%, peggiore di 134%
Gestione dell'energia
Consumo di energia
L'inattività sul desktop consumerà circa 5 W sull'impostazione di luminosità più bassa o fino a 13 W se sull'impostazione di luminosità più alta. La differenza di 8 W è superiore a quella di un tipico Ultrabook, poiché il display Getac può essere significativamente più luminoso.
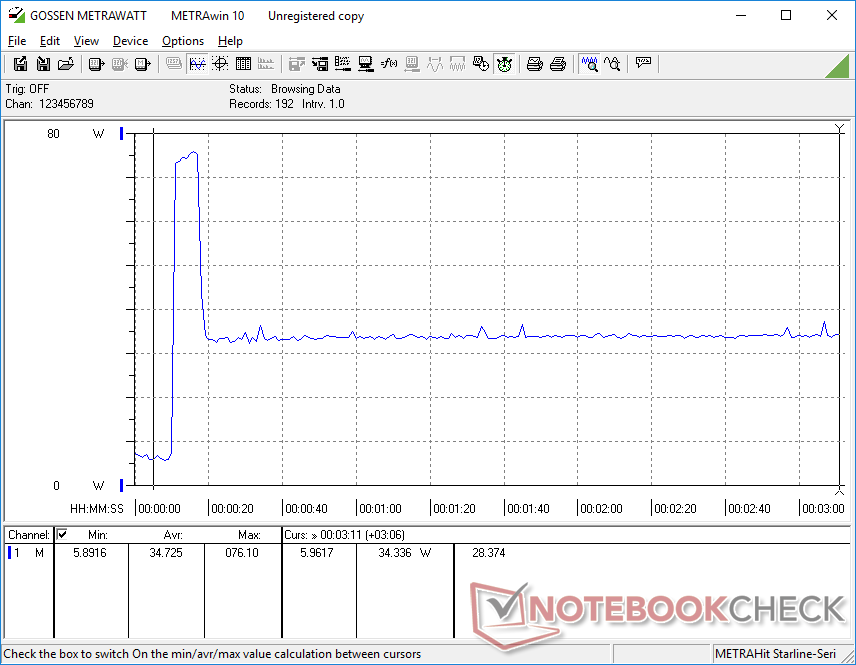
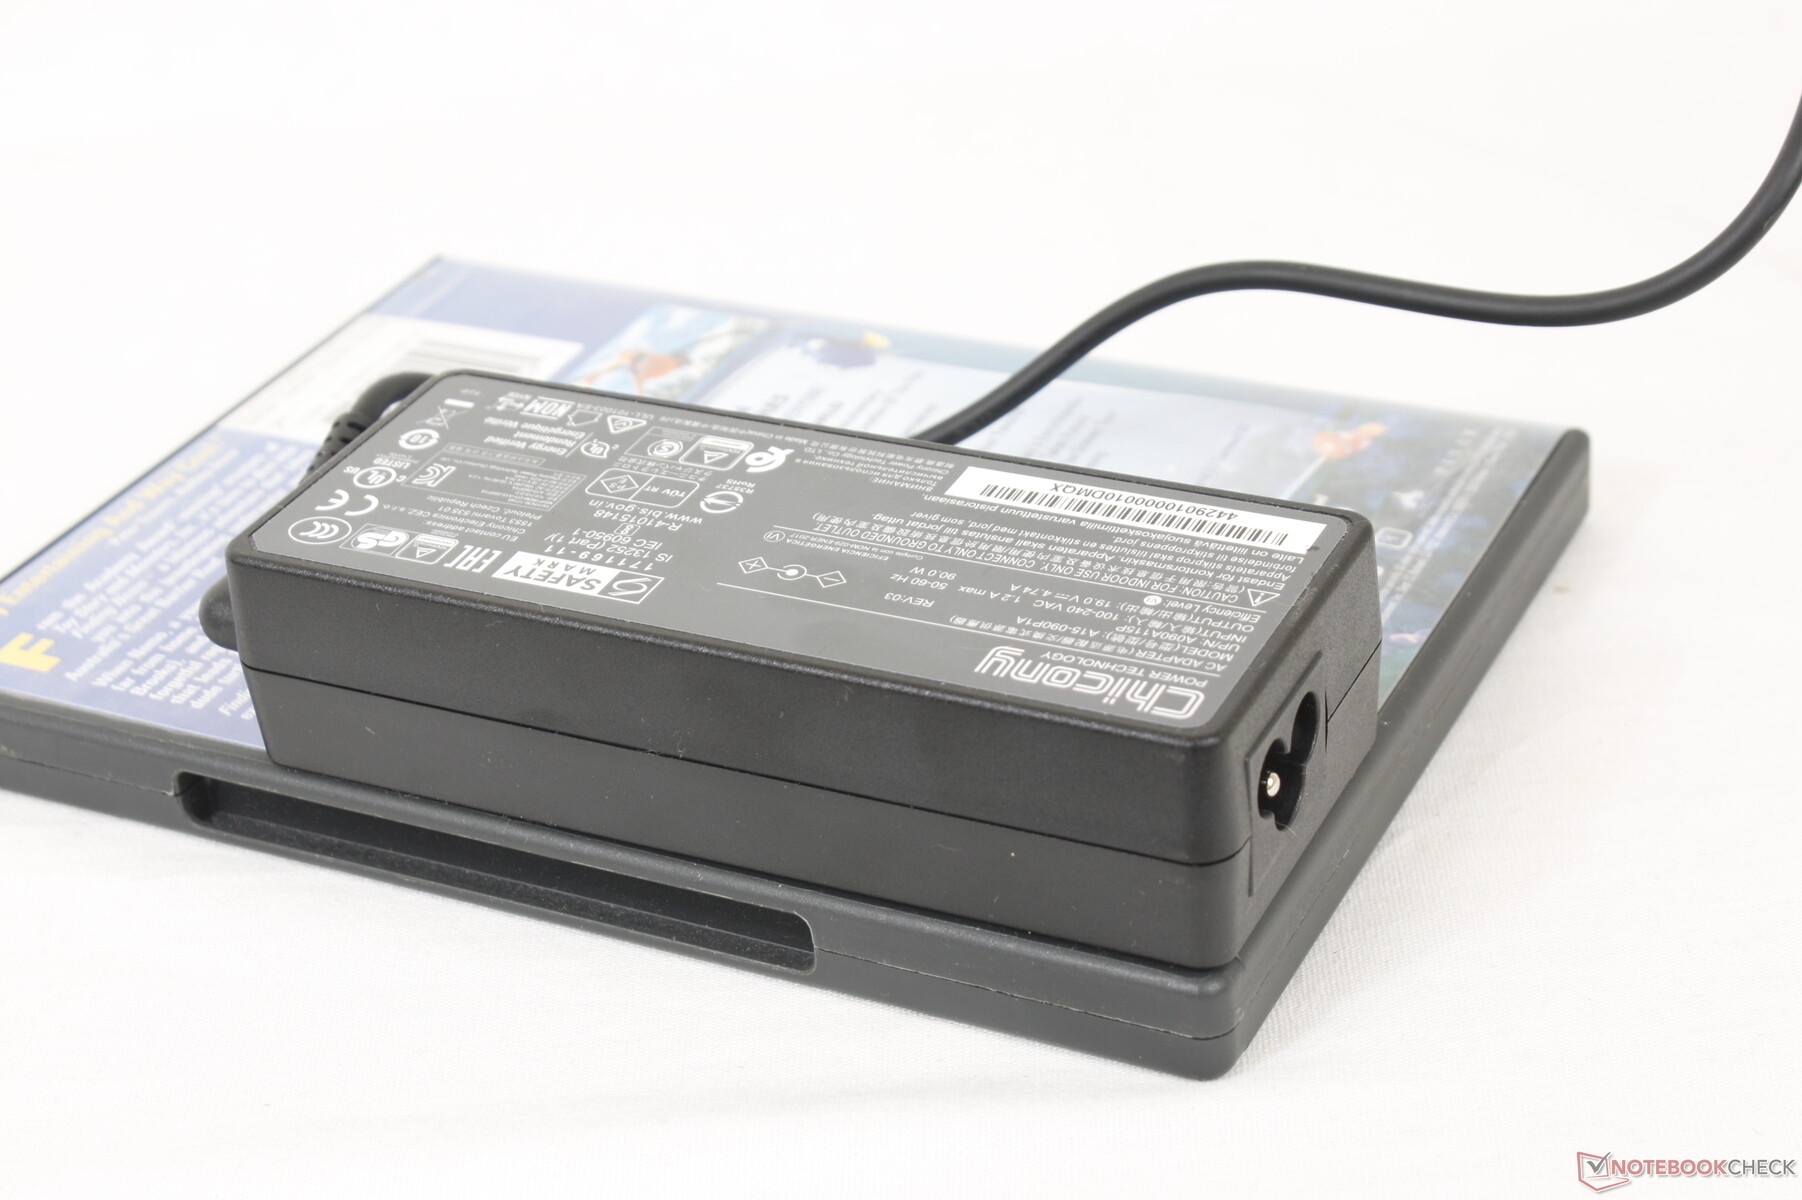
L'esecuzione di carichi medi o alti richiederà circa 36 W a 40 W per essere paragonabile alla maggior parte dei computer portatili che girano su nuovi processori Core di 11a generazione, nonostante il massiccio svantaggio della GPU del nostro UHD Graphics 620. Tuttavia, apprezziamo il fatto che il sistema viene spedito con un adattatore AC da 90 W (~12.8 x 5.2 x 3 cm), mentre molti altri portatili con CPU ULV hanno in genere adattatori da 60 W o inferiori.
| Off / Standby | |
| Idle | |
| Sotto carico |
|
Leggenda:
min: | |
| Getac B360 i7-10710U, UHD Graphics 620, Lite-On CA5-8D512, IPS, 1920x1080, 13.3" | Dell Latitude 5420 Rugged-P85G i7-8650U, Radeon RX 540, SK hynix PC401 NVMe 500 GB, IPS, 1920x1080, 14" | Getac S410 i5-8550U, UHD Graphics 620, CUKUSA 1 TB SATA SSD Q0526A, TN PED, 1366x768, 14" | Acer Enduro Urban N3 EUN314 i7-1165G7, Iris Xe G7 96EUs, Samsung PM991 MZVLQ1T0HALB, IPS, 1920x1080, 14" | Panasonic Toughbook FZ-55 MK2 i7-1185G7, Iris Xe G7 96EUs, Toshiba KIOXIA KBG4AZNV512G M.2 2280 OPAL, IPS, 1920x1080, 14" | Durabook S14I i7-1165G7, Iris Xe G7 96EUs, UDinfo M2P M2P80DE512GBAEP, TN, 1920x1080, 14" | |
|---|---|---|---|---|---|---|
| Power Consumption | -31% | 28% | 26% | 2% | -17% | |
| Idle Minimum * (Watt) | 5.4 | 4.8 11% | 5.6 -4% | 3.8 30% | 3.5 35% | 6.8 -26% |
| Idle Average * (Watt) | 12.2 | 13.6 -11% | 7.9 35% | 8 34% | 10.4 15% | 16.4 -34% |
| Idle Maximum * (Watt) | 12.6 | 13.8 -10% | 8.4 33% | 8.7 31% | 10.5 17% | 16.9 -34% |
| Load Average * (Watt) | 39.1 | 67.8 -73% | 32.8 16% | 34.6 12% | 45.4 -16% | 39.2 -0% |
| Witcher 3 ultra * (Watt) | 36.5 | 69.1 -89% | 35.4 3% | 43 -18% | ||
| Load Maximum * (Watt) | 81.8 | 93.5 -14% | 34.3 58% | 45.4 44% | 99.3 -21% | 73.1 11% |
* ... Meglio usare valori piccoli
Power Consumption Witcher 3 / Stresstest
Power Consumption external Monitor
Durata della batteria
Siamo in grado di spremere circa 8 ore di uso reale della WLAN quando entrambi i pacchi batteria rimovibili (2 x 23 Wh) sono installati. La ricarica da vuoto a piena capacità è un po' lenta a circa 2,5 ore rispetto a 1,5 ore sulla maggior parte degli altri portatili. Gli utenti possono anche ricaricare il portatile con adattatori USB-C di terze parti.
| Getac B360 i7-10710U, UHD Graphics 620, 46 Wh | Dell Latitude 5420 Rugged-P85G i7-8650U, Radeon RX 540, 102 Wh | Getac S410 i5-8550U, UHD Graphics 620, 46.6 Wh | Acer Enduro Urban N3 EUN314 i7-1165G7, Iris Xe G7 96EUs, 50.3 Wh | Panasonic Toughbook FZ-55 MK2 i7-1185G7, Iris Xe G7 96EUs, 71 Wh | Durabook S14I i7-1165G7, Iris Xe G7 96EUs, 50 Wh | |
|---|---|---|---|---|---|---|
| Autonomia della batteria | 100% | -36% | -21% | 68% | -32% | |
| WiFi v1.3 (h) | 8.1 | 16.2 100% | 5.2 -36% | 6.4 -21% | 13.6 68% | 5.5 -32% |
| Reader / Idle (h) | 31.4 | |||||
| Load (h) | 3.2 |
Pro
Contro
Verdetto
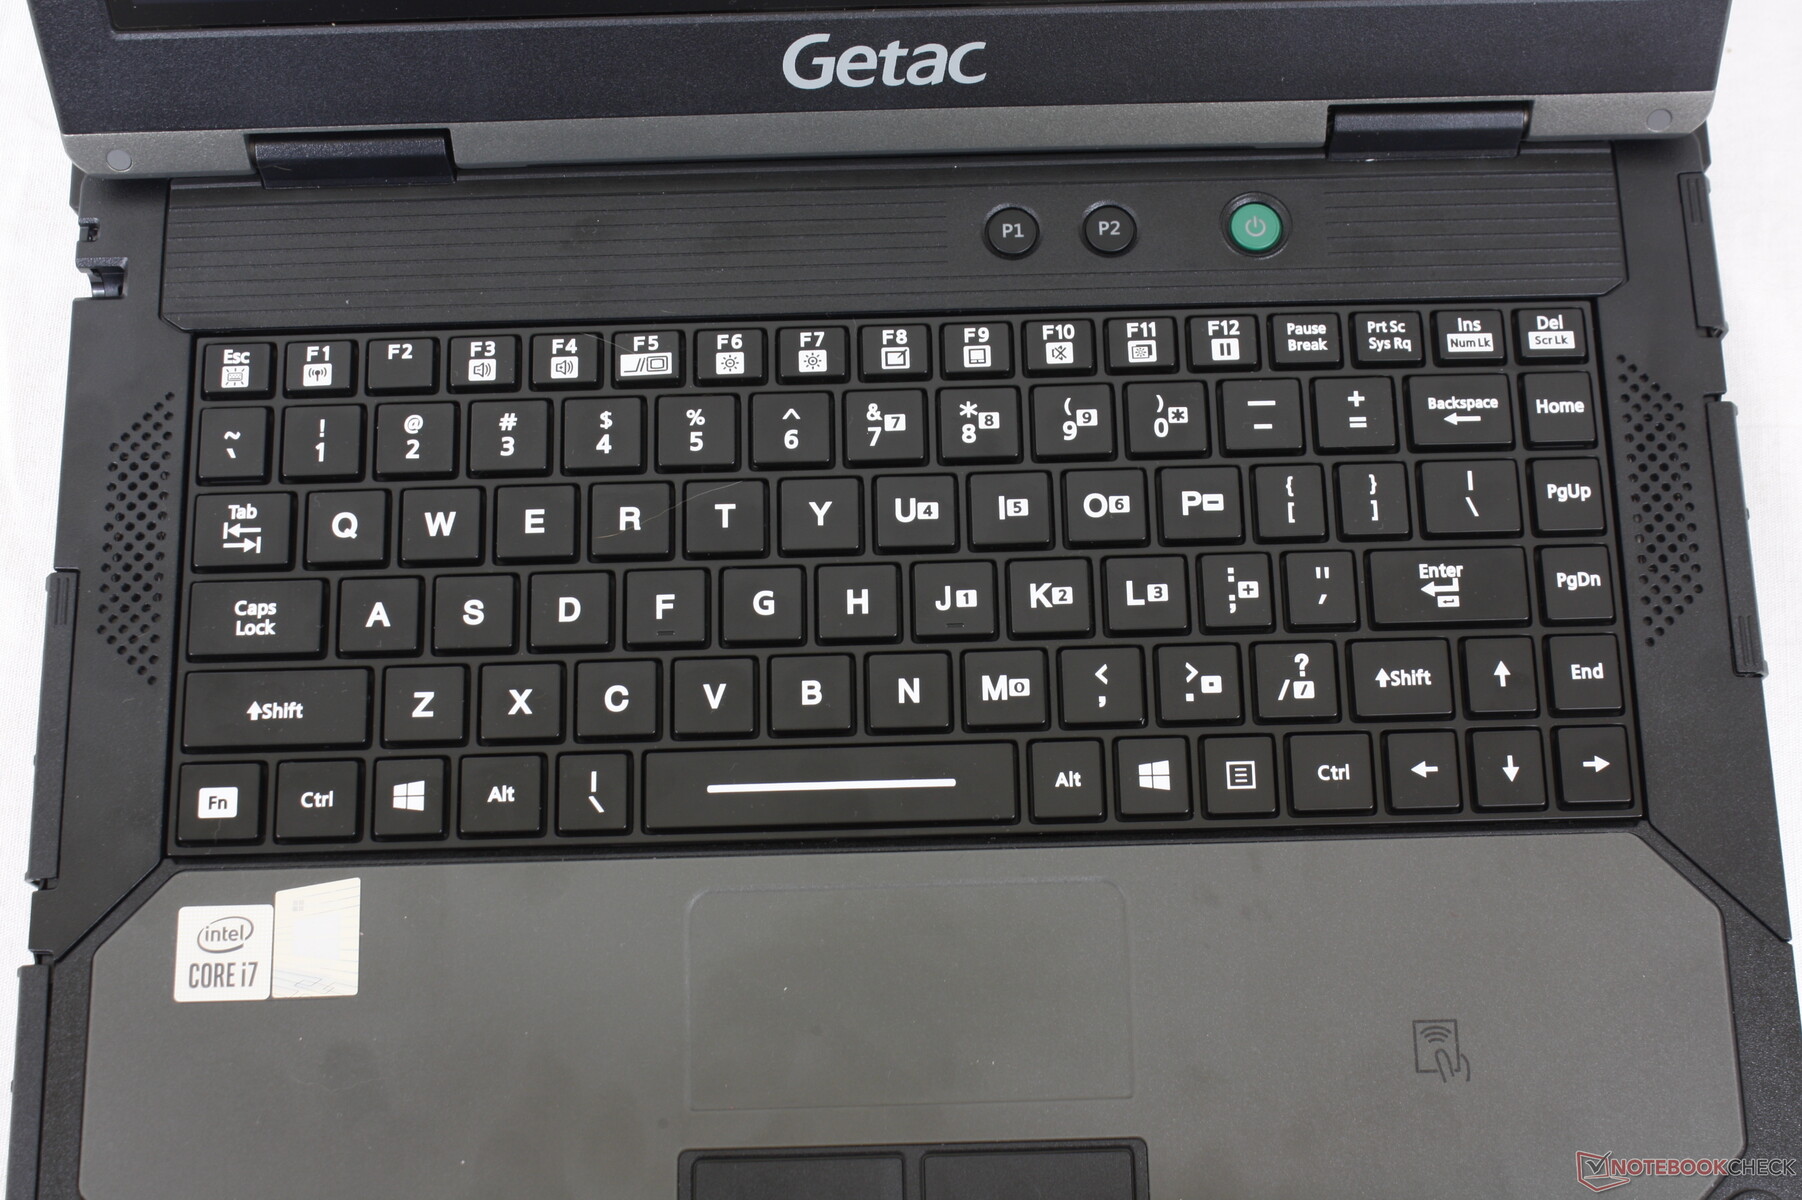
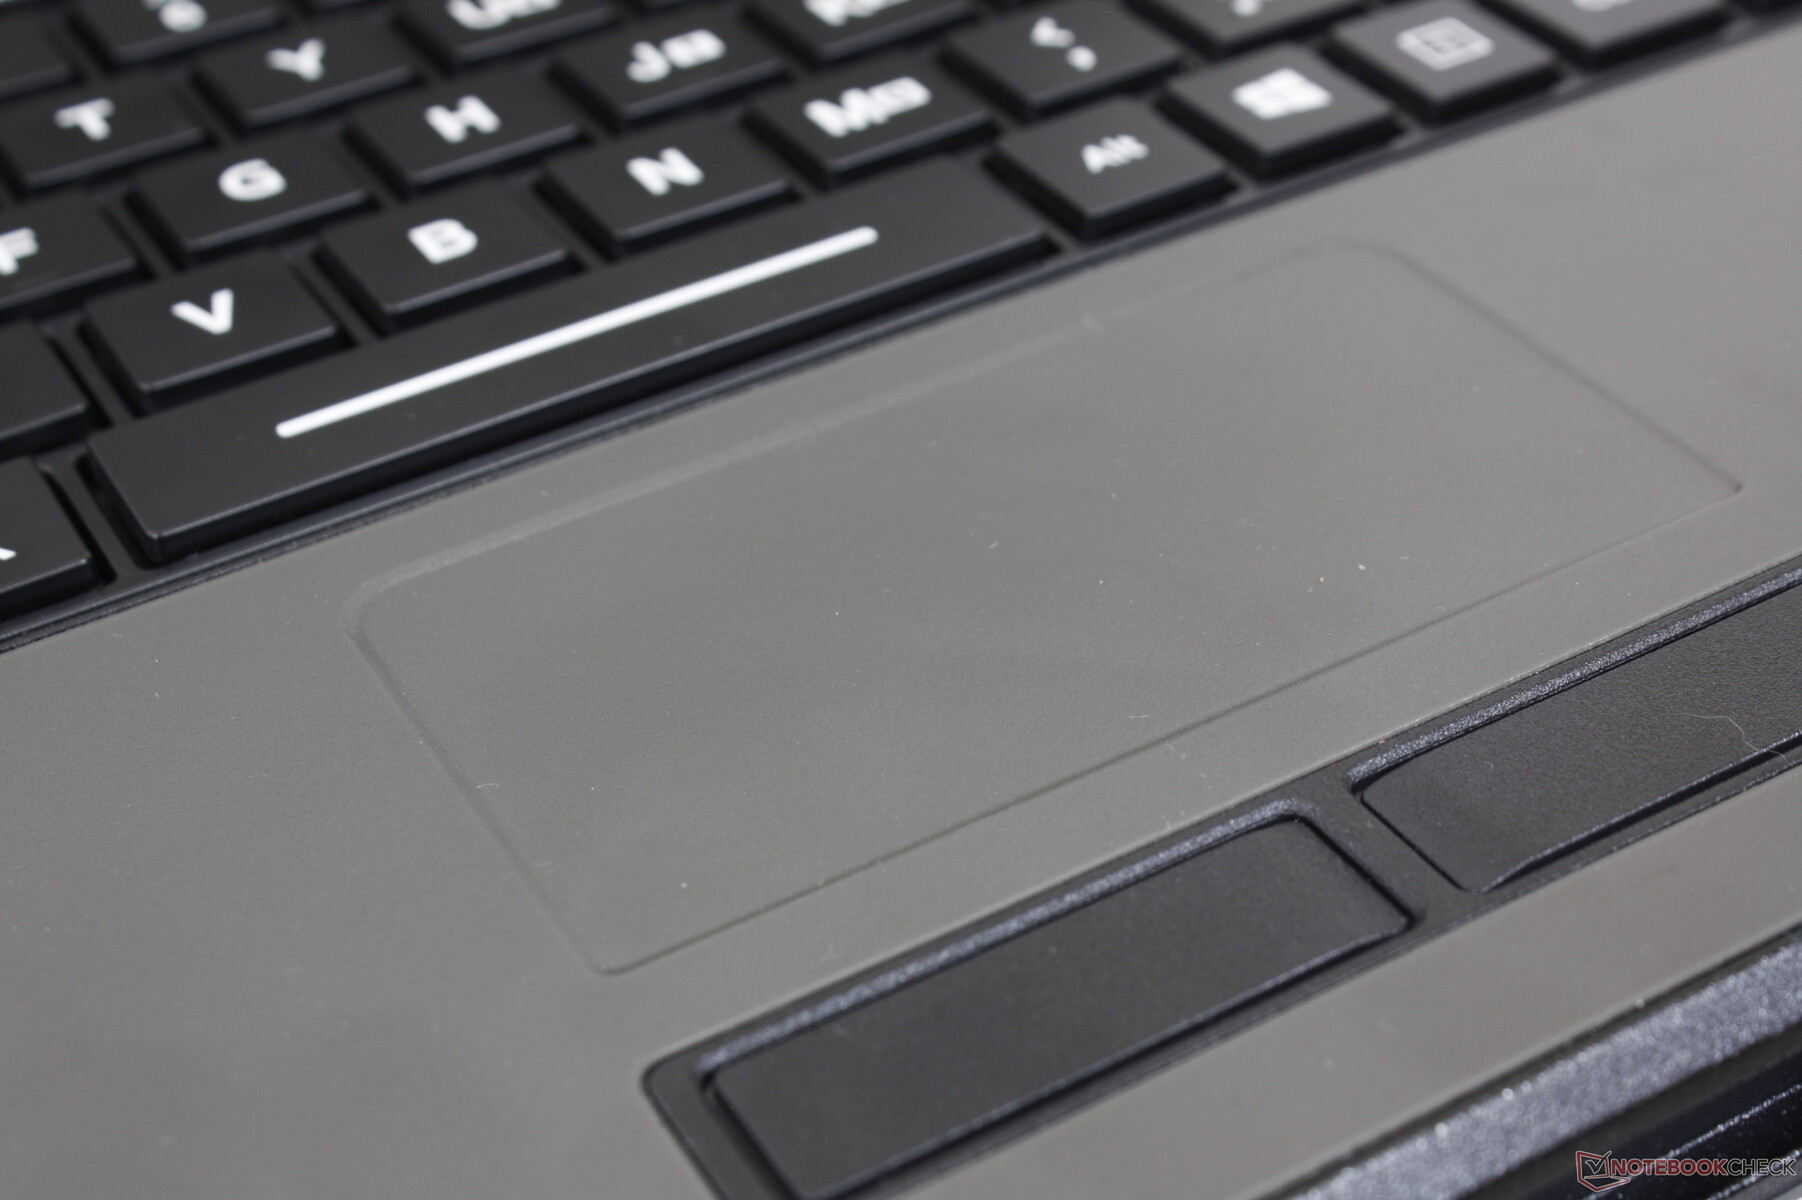
Il B360 fa bene alcune cose notevoli che molti altri portatili rugged mancano o ignorano. Il suo display, per esempio, ha colori più profondi e un contrasto più alto del previsto per una migliore esperienza visiva anche se il sistema non è stato progettato per qualsiasi tipo di editing grafico. Il touchpad è anche molto più reattivo quando non si indossano i guanti a differenza del Durabook S14I e del suo touchpad nervoso. Combinate queste caratteristiche con i tasti della tastiera comodi e scattanti e avrete un'esperienza utente piacevole e senza fronzoli a cui ogni dispositivo rugged dovrebbe mirare.
Display IPS sorprendentemente buono per un modello rugged in termini di luminosità, colori e contrasto. La vecchia CPU Intel 10th gen, tuttavia, sta cominciando a mostrare la sua età.
C'è molto margine di miglioramento. La modulazione di larghezza d'impulso è presente su tutti i livelli di luminosità che può influenzare gli utenti sensibili allo sfarfallio sullo schermo. Le coperture delle porte sono molto fastidiose da bloccare e sbloccare soprattutto perché tendono a saltare fuori da sole dopo il bloccaggio. La mancanza di opzioni di CPU Intel 11th gen più recenti significa che i proprietari si perderanno PCIe4, Thunderbolt, e prestazioni significativamente più elevate per watt. La RAM è di difficile accesso mentre il volume massimo è più morbido del previsto. Una ventola più grande avrebbe potuto potenzialmente mitigare il rumore acuto della ventola quando si eseguono carichi impegnativi. Ci aspettiamo pienamente che l'eventuale modello di prossima generazione faccia il salto a Intel Tiger Lake per l'aumento delle prestazioni come sul più veloceDurabook S14Io Acer Enduro Urban N3.
Prezzo e disponibilità
Configurazione e preventivi possono essere richiesti direttamente a Getac.
Getac B360
- 01/10/2022 v7 (old)
Allen Ngo
Price comparison

