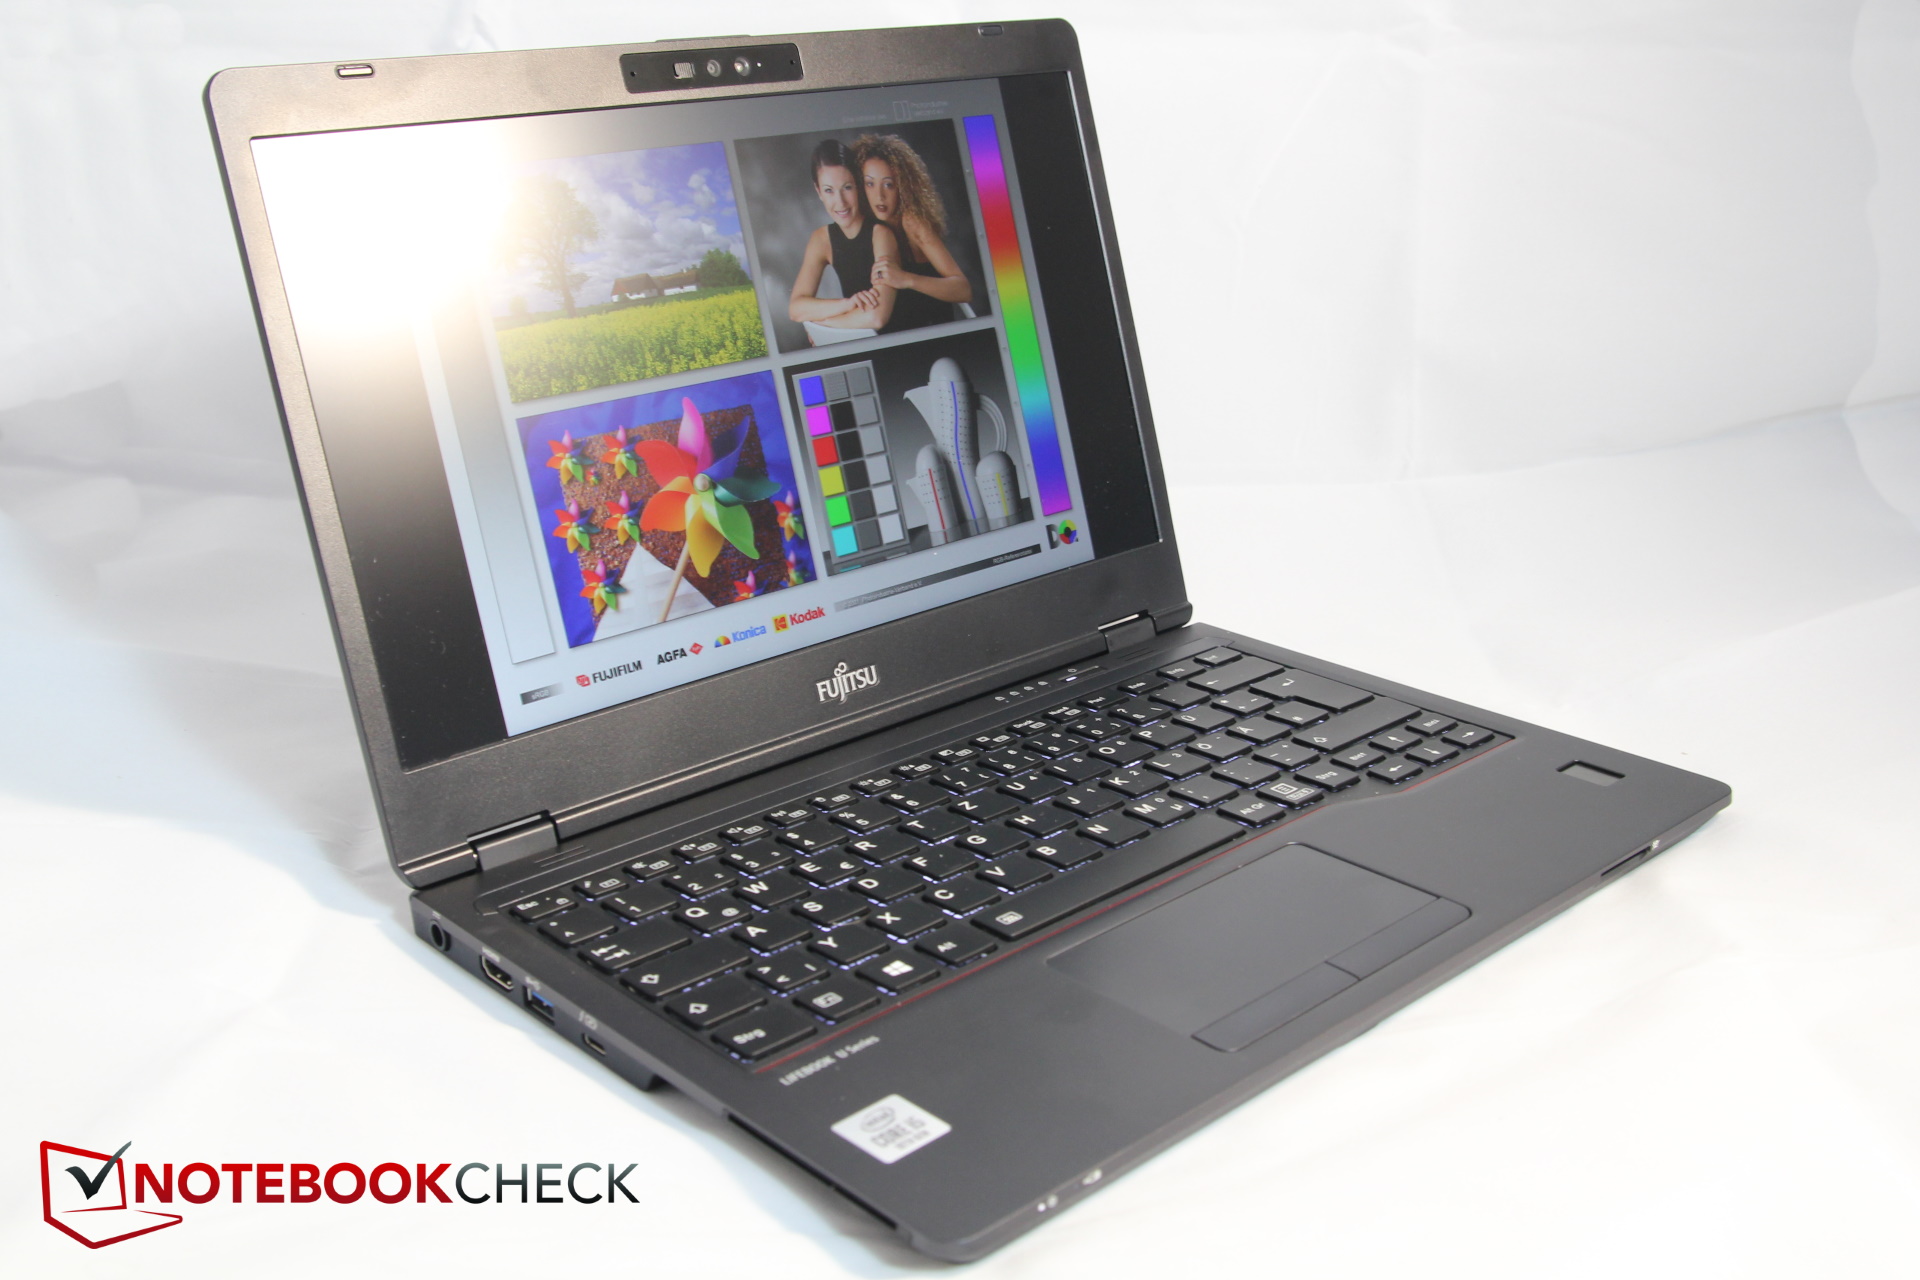
Recensione del laptop Fujitsu LifeBook U7310: Buon portatile business da 13" senza ambizioni di performance, ma con un punto di forza unico
Punteggio | Data | Modello | Peso | Altezza | Dimensione | Risoluzione | Prezzo |
|---|---|---|---|---|---|---|---|
| 86.7 % v7 (old) | 11/2020 | Fujitsu LifeBook U7310 i5-10210U, UHD Graphics 620 | 1.2 kg | 19 mm | 13.30" | 1920x1080 | |
| 88 % v7 (old) | 08/2020 | Lenovo ThinkPad X13-20T20033GE i5-10210U, UHD Graphics 620 | 1.3 kg | 16.9 mm | 13.30" | 1920x1080 | |
| 89.5 % v7 (old) | 08/2020 | Lenovo ThinkPad X13-20UGS00800 R7 PRO 4750U, Vega 7 | 1.3 kg | 16.9 mm | 13.30" | 1920x1080 | |
| 86 % v7 (old) | 06/2020 | HP EliteBook 735 G6 7KN29EA R5 PRO 3500U, Vega 8 | 1.5 kg | 17.7 mm | 13.30" | 1920x1080 | |
| 83.7 % v7 (old) | 07/2020 | Fujitsu Lifebook U939 i5 i5-8265U, UHD Graphics 620 | 900 gr | 15 mm | 13.30" | 1920x1080 | |
| 83.8 % v7 (old) | 07/2020 | Samsung Galaxy Book Ion 13.3 i5-10210U, UHD Graphics 620 | 970 gr | 12.9 mm | 13.30" | 1920x1080 |
| SD Card Reader | |
| average JPG Copy Test (av. of 3 runs) | |
| Fujitsu LifeBook U7310 (Toshiba Exceria Pro SDXC 64 GB UHS-II) | |
| Samsung Galaxy Book Ion 13.3 (Toshiba Exceria Pro M501 microSDXC 64GB) | |
| Lenovo ThinkPad X13-20UGS00800 (Toshiba Exceria Pro M501 64 GB UHS-II) | |
| Media della classe Office (19.8 - 198.5, n=22, ultimi 2 anni) | |
| Lenovo ThinkPad X13-20T20033GE (Toshiba Exceria Pro M501 64 GB UHS-II) | |
| maximum AS SSD Seq Read Test (1GB) | |
| Samsung Galaxy Book Ion 13.3 (Toshiba Exceria Pro M501 microSDXC 64GB) | |
| Fujitsu LifeBook U7310 (Toshiba Exceria Pro SDXC 64 GB UHS-II) | |
| Lenovo ThinkPad X13-20UGS00800 (Toshiba Exceria Pro M501 64 GB UHS-II) | |
| Media della classe Office (27.4 - 249, n=21, ultimi 2 anni) | |
| Lenovo ThinkPad X13-20T20033GE (Toshiba Exceria Pro M501 64 GB UHS-II) | |


| |||||||||||||||||||||||||
Distribuzione della luminosità: 92 %
Al centro con la batteria: 349 cd/m²
Contrasto: 1123:1 (Nero: 0.31 cd/m²)
ΔE ColorChecker Calman: 2.1 | ∀{0.5-29.43 Ø4.71}
calibrated: 0.7
ΔE Greyscale Calman: 2.8 | ∀{0.09-98 Ø4.96}
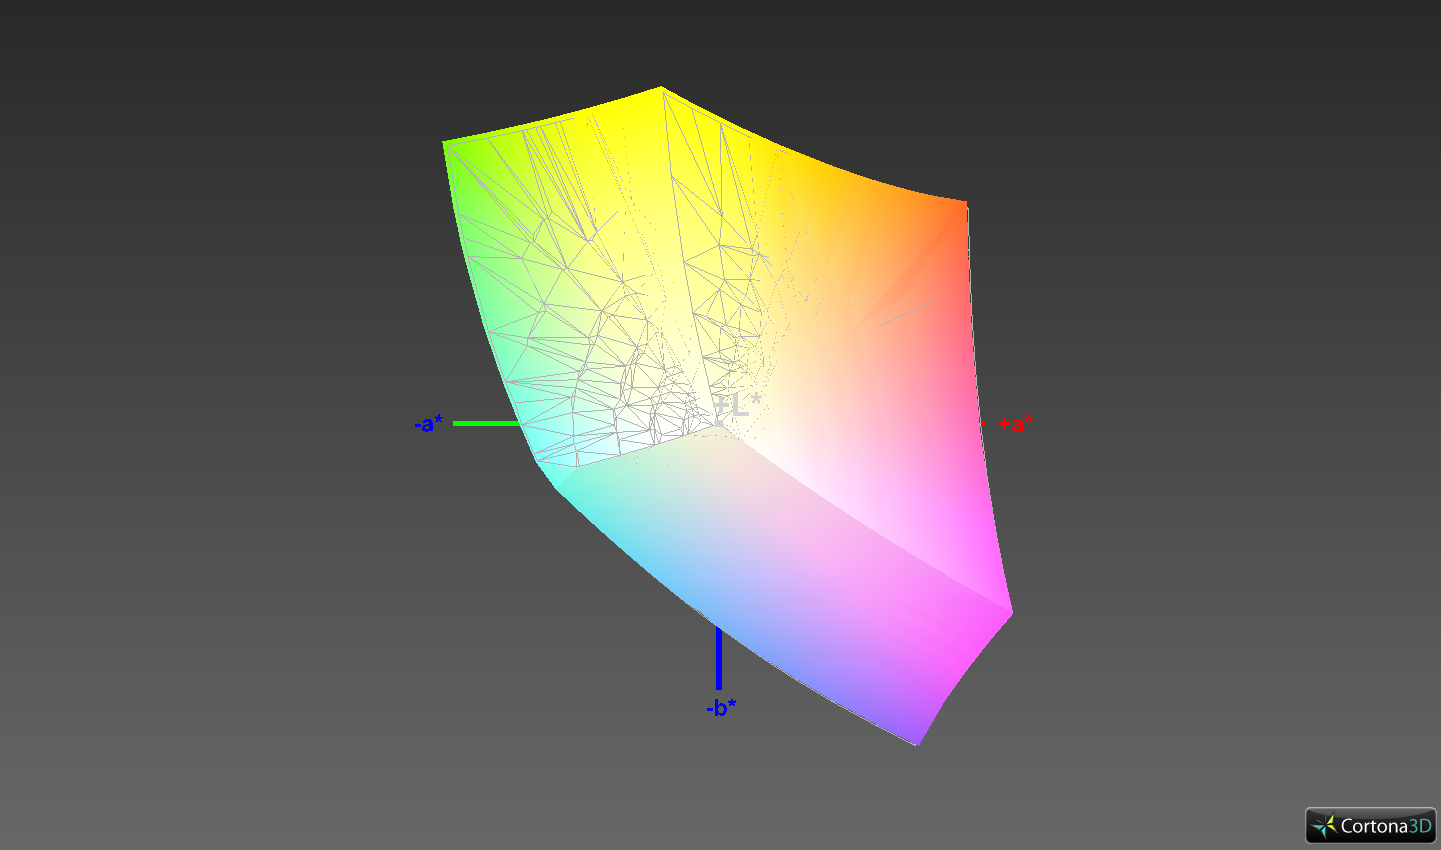
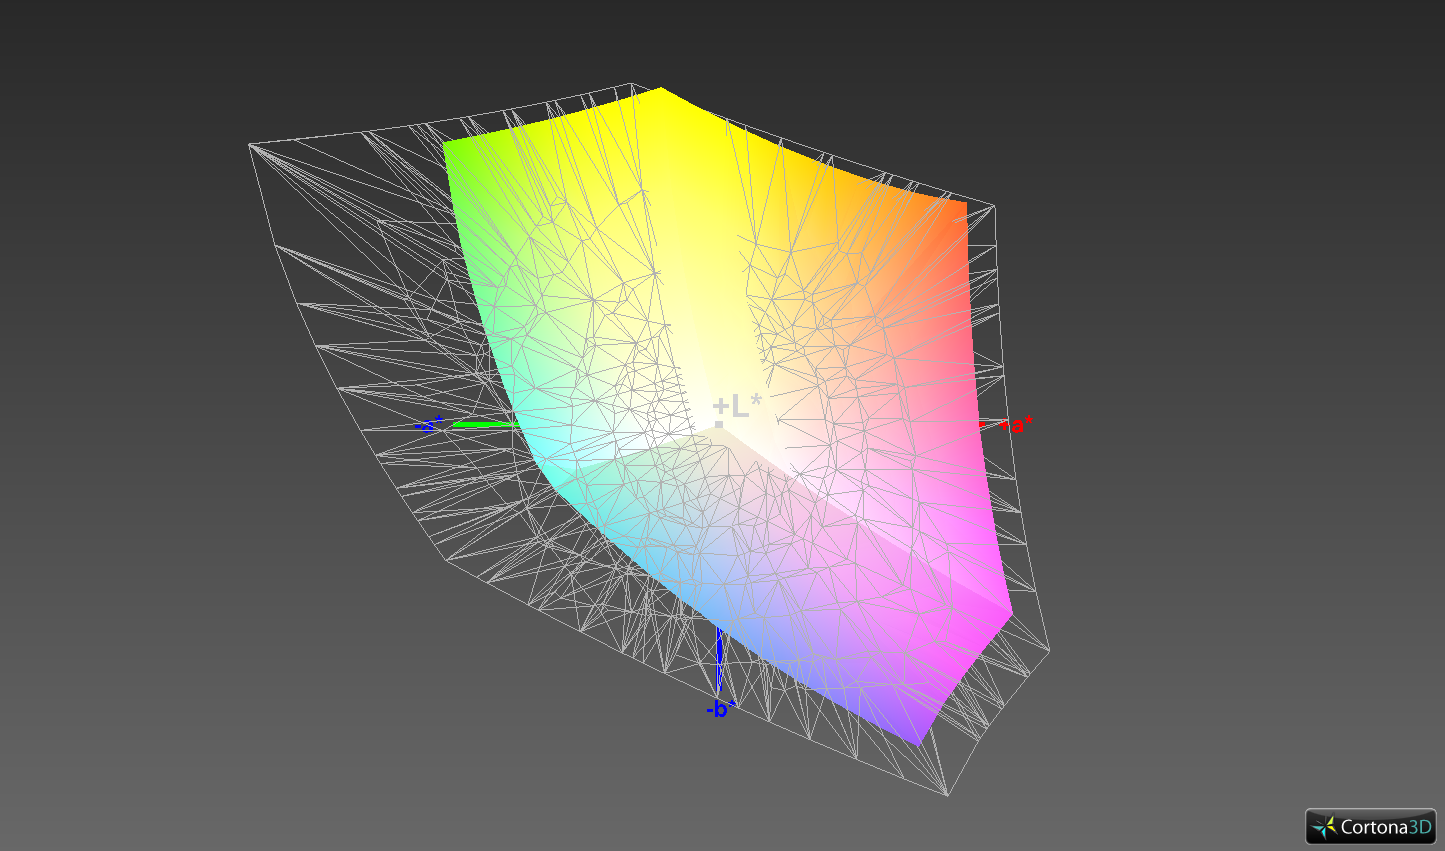
99.5% sRGB (Argyll 1.6.3 3D)
63.6% AdobeRGB 1998 (Argyll 1.6.3 3D)
69.7% AdobeRGB 1998 (Argyll 3D)
99.5% sRGB (Argyll 3D)
67.4% Display P3 (Argyll 3D)
Gamma: 2.07
CCT: 6878 K
| Fujitsu LifeBook U7310 Chi Mei N133HCE-EN2 (CMN1388), IPS, 1920x1080, 13.3" | Lenovo ThinkPad X13-20T20033GE Lenovo B133HAK01.1, IPS, 1920x1080, 13.3" | Lenovo ThinkPad X13-20UGS00800 B133HAK01.1, IPS LED, 1920x1080, 13.3" | HP EliteBook 735 G6 7KN29EA CMN139E, IPS LED, 1920x1080, 13.3" | Fujitsu Lifebook U939 i5 Sharp SHP14BD, IPS, 1920x1080, 13.3" | Samsung Galaxy Book Ion 13.3 BOE087A, IPS (QLED), 1920x1080, 13.3" | |
|---|---|---|---|---|---|---|
| Display | -3% | -5% | -38% | -4% | ||
| Display P3 Coverage (%) | 67.4 | 66 -2% | 64.8 -4% | 41.53 -38% | 65.3 -3% | |
| sRGB Coverage (%) | 99.5 | 96.2 -3% | 95.6 -4% | 61.7 -38% | 95 -5% | |
| AdobeRGB 1998 Coverage (%) | 69.7 | 67.2 -4% | 65.7 -6% | 43 -38% | 66 -5% | |
| Response Times | -29% | -36% | -4% | -33% | -21% | |
| Response Time Grey 50% / Grey 80% * (ms) | 37.6 ? | 52.8 ? -40% | 56.8 ? -51% | 38 ? -1% | 55.2 ? -47% | 47 ? -25% |
| Response Time Black / White * (ms) | 24.8 ? | 29.2 ? -18% | 30 ? -21% | 26.4 ? -6% | 29.6 ? -19% | 29 ? -17% |
| PWM Frequency (Hz) | 26040 | 211.9 ? | ||||
| Screen | -51% | -44% | -131% | -44% | -16% | |
| Brightness middle (cd/m²) | 348 | 359 3% | 331 -5% | 294 -16% | 384 10% | 467 34% |
| Brightness (cd/m²) | 341 | 342 0% | 315 -8% | 277 -19% | 362 6% | 437 28% |
| Brightness Distribution (%) | 92 | 90 -2% | 90 -2% | 87 -5% | 90 -2% | 88 -4% |
| Black Level * (cd/m²) | 0.31 | 0.21 32% | 0.21 32% | 0.18 42% | 0.31 -0% | 0.29 6% |
| Contrast (:1) | 1123 | 1710 52% | 1576 40% | 1633 45% | 1239 10% | 1610 43% |
| Colorchecker dE 2000 * | 2.1 | 6.7 -219% | 6.1 -190% | 6.8 -224% | 4.8 -129% | 4.73 -125% |
| Colorchecker dE 2000 max. * | 4 | 10.9 -173% | 10 -150% | 23.8 -495% | 9.4 -135% | 6.07 -52% |
| Colorchecker dE 2000 calibrated * | 0.7 | 1.3 -86% | 1.2 -71% | 4.8 -586% | 1.4 -100% | |
| Greyscale dE 2000 * | 2.8 | 7.4 -164% | 6.3 -125% | 5.9 -111% | 6.6 -136% | 4.33 -55% |
| Gamma | 2.07 106% | 2.85 77% | 2.77 79% | 1.96 112% | 2.2 100% | 2.34 94% |
| CCT | 6878 95% | 6309 103% | 6938 94% | 6979 93% | 7999 81% | 6954 93% |
| Color Space (Percent of AdobeRGB 1998) (%) | 63.6 | 61.7 -3% | 60.7 -5% | 39.6 -38% | 61.2 -4% | |
| Color Space (Percent of sRGB) (%) | 99.5 | 95.9 -4% | 95.4 -4% | 61.5 -38% | 95 -5% | |
| Media totale (Programma / Settaggio) | -28% /
-39% | -28% /
-36% | -58% /
-98% | -27% /
-35% | -19% /
-17% |
* ... Meglio usare valori piccoli
Tempi di risposta del Display
| ↔ Tempi di risposta dal Nero al Bianco | ||
|---|---|---|
| 24.8 ms ... aumenta ↗ e diminuisce ↘ combinato | ↗ 14.4 ms Incremento | 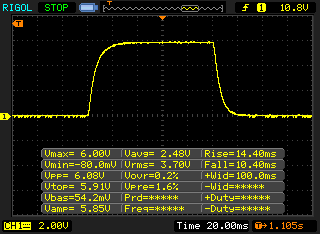 |
| ↘ 10.4 ms Calo | ||
| Lo schermo mostra buoni tempi di risposta durante i nostri tests, ma potrebbe essere troppo lento per i gamers competitivi. In confronto, tutti i dispositivi di test variano da 0.1 (minimo) a 240 (massimo) ms. » 58 % di tutti i dispositivi è migliore. Questo significa che i tempi di risposta rilevati sono peggiori rispetto alla media di tutti i dispositivi testati (19.8 ms). | ||
| ↔ Tempo di risposta dal 50% Grigio all'80% Grigio | ||
| 37.6 ms ... aumenta ↗ e diminuisce ↘ combinato | ↗ 18.8 ms Incremento | 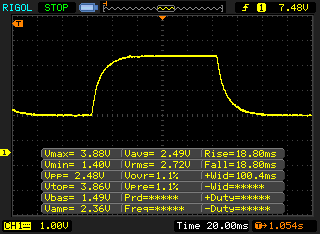 |
| ↘ 18.8 ms Calo | ||
| Lo schermo mostra tempi di risposta lenti nei nostri tests e sarà insoddisfacente per i gamers. In confronto, tutti i dispositivi di test variano da 0.165 (minimo) a 636 (massimo) ms. » 55 % di tutti i dispositivi è migliore. Questo significa che i tempi di risposta rilevati sono peggiori rispetto alla media di tutti i dispositivi testati (31 ms). | ||
Sfarfallio dello schermo / PWM (Pulse-Width Modulation)
| flickering dello schermo / PWM non rilevato | 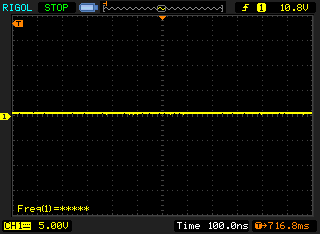 | ||
In confronto: 52 % di tutti i dispositivi testati non utilizza PWM per ridurre la luminosita' del display. Se è rilevato PWM, una media di 7747 (minimo: 5 - massimo: 343500) Hz è stata rilevata. | |||
Cinebench R15: CPU Single 64Bit | CPU Multi 64Bit
Blender: v2.79 BMW27 CPU
7-Zip 18.03: 7z b 4 -mmt1 | 7z b 4
Geekbench 5.5: Single-Core | Multi-Core
HWBOT x265 Benchmark v2.2: 4k Preset
LibreOffice : 20 Documents To PDF
R Benchmark 2.5: Overall mean
| Cinebench R20 / CPU (Single Core) | |
| Media della classe Office (345 - 816, n=74, ultimi 2 anni) | |
| Lenovo ThinkPad X13-20UGS00800 | |
| Samsung Galaxy Book Ion 13.3 | |
| Fujitsu LifeBook U7310 | |
| Media Intel Core i5-10210U (322 - 428, n=30) | |
| Fujitsu Lifebook U939 i5 | |
| HP EliteBook 735 G6 7KN29EA | |
| Lenovo ThinkPad X13-20T20033GE | |
| Cinebench R20 / CPU (Multi Core) | |
| Media della classe Office (648 - 8840, n=74, ultimi 2 anni) | |
| Lenovo ThinkPad X13-20UGS00800 | |
| Lenovo ThinkPad X13-20T20033GE | |
| HP EliteBook 735 G6 7KN29EA | |
| Media Intel Core i5-10210U (722 - 1820, n=30) | |
| Samsung Galaxy Book Ion 13.3 | |
| Fujitsu LifeBook U7310 | |
| Fujitsu Lifebook U939 i5 | |
| Cinebench R15 / CPU Single 64Bit | |
| Media della classe Office (99.5 - 316, n=76, ultimi 2 anni) | |
| Lenovo ThinkPad X13-20UGS00800 | |
| Lenovo ThinkPad X13-20T20033GE | |
| Media Intel Core i5-10210U (134 - 174, n=35) | |
| Samsung Galaxy Book Ion 13.3 | |
| Fujitsu LifeBook U7310 | |
| Fujitsu Lifebook U939 i5 | |
| HP EliteBook 735 G6 7KN29EA | |
| Cinebench R15 / CPU Multi 64Bit | |
| Media della classe Office (250 - 3380, n=76, ultimi 2 anni) | |
| Lenovo ThinkPad X13-20UGS00800 | |
| Lenovo ThinkPad X13-20T20033GE | |
| HP EliteBook 735 G6 7KN29EA | |
| Media Intel Core i5-10210U (320 - 790, n=35) | |
| Fujitsu Lifebook U939 i5 | |
| Fujitsu LifeBook U7310 | |
| Samsung Galaxy Book Ion 13.3 | |
| Blender / v2.79 BMW27 CPU | |
| Samsung Galaxy Book Ion 13.3 | |
| Fujitsu Lifebook U939 i5 | |
| Fujitsu LifeBook U7310 | |
| Media Intel Core i5-10210U (585 - 1339, n=24) | |
| HP EliteBook 735 G6 7KN29EA | |
| Lenovo ThinkPad X13-20T20033GE | |
| Lenovo ThinkPad X13-20UGS00800 | |
| Media della classe Office (158 - 1940, n=75, ultimi 2 anni) | |
| 7-Zip 18.03 / 7z b 4 -mmt1 | |
| Media della classe Office (3387 - 6469, n=76, ultimi 2 anni) | |
| Lenovo ThinkPad X13-20UGS00800 | |
| Lenovo ThinkPad X13-20T20033GE | |
| Fujitsu LifeBook U7310 | |
| Samsung Galaxy Book Ion 13.3 | |
| Media Intel Core i5-10210U (3504 - 4467, n=24) | |
| Fujitsu Lifebook U939 i5 | |
| HP EliteBook 735 G6 7KN29EA | |
| 7-Zip 18.03 / 7z b 4 | |
| Media della classe Office (7098 - 76886, n=76, ultimi 2 anni) | |
| Lenovo ThinkPad X13-20UGS00800 | |
| Lenovo ThinkPad X13-20T20033GE | |
| Media Intel Core i5-10210U (10920 - 21679, n=24) | |
| HP EliteBook 735 G6 7KN29EA | |
| Fujitsu Lifebook U939 i5 | |
| Samsung Galaxy Book Ion 13.3 | |
| Fujitsu LifeBook U7310 | |
| Geekbench 5.5 / Single-Core | |
| Media della classe Office (811 - 2175, n=72, ultimi 2 anni) | |
| Lenovo ThinkPad X13-20UGS00800 | |
| Lenovo ThinkPad X13-20T20033GE | |
| Samsung Galaxy Book Ion 13.3 | |
| Media Intel Core i5-10210U (949 - 1133, n=27) | |
| Fujitsu Lifebook U939 i5 | |
| Fujitsu LifeBook U7310 | |
| HP EliteBook 735 G6 7KN29EA | |
| Geekbench 5.5 / Multi-Core | |
| Media della classe Office (1483 - 16999, n=72, ultimi 2 anni) | |
| Lenovo ThinkPad X13-20UGS00800 | |
| Lenovo ThinkPad X13-20T20033GE | |
| Samsung Galaxy Book Ion 13.3 | |
| Media Intel Core i5-10210U (2079 - 4256, n=27) | |
| Fujitsu Lifebook U939 i5 | |
| Fujitsu LifeBook U7310 | |
| HP EliteBook 735 G6 7KN29EA | |
| HWBOT x265 Benchmark v2.2 / 4k Preset | |
| Media della classe Office (2.21 - 26, n=75, ultimi 2 anni) | |
| Lenovo ThinkPad X13-20UGS00800 | |
| Lenovo ThinkPad X13-20T20033GE | |
| Media Intel Core i5-10210U (2.36 - 6.28, n=24) | |
| Fujitsu Lifebook U939 i5 | |
| Fujitsu LifeBook U7310 | |
| Samsung Galaxy Book Ion 13.3 | |
| HP EliteBook 735 G6 7KN29EA | |
| LibreOffice / 20 Documents To PDF | |
| HP EliteBook 735 G6 7KN29EA | |
| Media Intel Core i5-10210U (49.6 - 80.3, n=18) | |
| Fujitsu Lifebook U939 i5 | |
| Lenovo ThinkPad X13-20UGS00800 | |
| Media della classe Office (39.9 - 102.3, n=75, ultimi 2 anni) | |
| Lenovo ThinkPad X13-20T20033GE | |
| Fujitsu LifeBook U7310 | |
| Samsung Galaxy Book Ion 13.3 | |
| R Benchmark 2.5 / Overall mean | |
| HP EliteBook 735 G6 7KN29EA | |
| Media Intel Core i5-10210U (0.658 - 0.901, n=24) | |
| Fujitsu Lifebook U939 i5 | |
| Fujitsu LifeBook U7310 | |
| Samsung Galaxy Book Ion 13.3 | |
| Lenovo ThinkPad X13-20T20033GE | |
| Lenovo ThinkPad X13-20UGS00800 | |
| Media della classe Office (0.393 - 0.888, n=75, ultimi 2 anni) | |
* ... Meglio usare valori piccoli
| PCMark 8 Home Score Accelerated v2 | 3333 punti | |
| PCMark 8 Work Score Accelerated v2 | 4926 punti | |
| PCMark 10 Score | 3712 punti | |
Aiuto | ||
| DPC Latencies / LatencyMon - interrupt to process latency (max), Web, Youtube, Prime95 | |
| Fujitsu LifeBook U7310 | |
| Lenovo ThinkPad X13-20UGS00800 | |
| Samsung Galaxy Book Ion 13.3 | |
| Lenovo ThinkPad X13-20T20033GE | |
* ... Meglio usare valori piccoli
| Fujitsu LifeBook U7310 WDC PC SN520 SDAPNUW-256G | Lenovo ThinkPad X13-20T20033GE Samsung SSD PM981a MZVLB512HBJQ | Lenovo ThinkPad X13-20UGS00800 Samsung SSD PM981a MZVLB512HBJQ | HP EliteBook 735 G6 7KN29EA WDC PC SN520 SDAPNUW-256G | Fujitsu Lifebook U939 i5 Samsung SSD PM981 MZVLB512HAJQ | Samsung Galaxy Book Ion 13.3 Samsung SSD PM981a MZVLB256HBHQ | Media WDC PC SN520 SDAPNUW-256G | Media della classe Office | |
|---|---|---|---|---|---|---|---|---|
| CrystalDiskMark 5.2 / 6 | 98% | 96% | 7% | 62% | 92% | 9% | 174% | |
| Write 4K (MB/s) | 172.9 | 131.1 -24% | 95.7 -45% | 116 -33% | 159 -8% | 159.6 -8% | 118.5 ? -31% | 153.5 ? -11% |
| Read 4K (MB/s) | 47.94 | 45.48 -5% | 37.47 -22% | 39.81 -17% | 48.12 0% | 48.22 1% | 42 ? -12% | 73.5 ? 53% |
| Write Seq (MB/s) | 645 | 2042 217% | 2032 215% | 1300 102% | 1657 157% | 2343 263% | 1123 ? 74% | 2531 ? 292% |
| Read Seq (MB/s) | 1194 | 2259 89% | 2207 85% | 803 -33% | 1522 27% | 2184 83% | 1208 ? 1% | 3292 ? 176% |
| Write 4K Q32T1 (MB/s) | 383.8 | 429.1 12% | 517 35% | 187.6 -51% | 349.2 -9% | 342.2 -11% | 324 ? -16% | 431 ? 12% |
| Read 4K Q32T1 (MB/s) | 506 | 370.7 -27% | 387 -24% | 305.9 -40% | 452.2 -11% | 485.4 -4% | 322 ? -36% | 517 ? 2% |
| Write Seq Q32T1 (MB/s) | 573 | 2963 417% | 2977 420% | 1299 127% | 1941 239% | 2354 311% | 1091 ? 90% | 4142 ? 623% |
| Read Seq Q32T1 (MB/s) | 1739 | 3564 105% | 3556 104% | 1741 0% | 3510 102% | 3555 104% | 1729 ? -1% | 6024 ? 246% |
| AS SSD | 80% | 86% | -19% | 89% | 25% | 2% | 129% | |
| Seq Read (MB/s) | 1479 | 2714 84% | 2553 73% | 1499 1% | 2677 81% | 2980 101% | 1362 ? -8% | 4315 ? 192% |
| Seq Write (MB/s) | 1144 | 1374 20% | 1406 23% | 1172 2% | 1819 59% | 2175 90% | 976 ? -15% | 2764 ? 142% |
| 4K Read (MB/s) | 40.34 | 51.2 27% | 48.53 20% | 35.42 -12% | 53.7 33% | 52.8 31% | 37.3 ? -8% | 58 ? 44% |
| 4K Write (MB/s) | 152.8 | 135.7 -11% | 119.6 -22% | 77.2 -49% | 145.8 -5% | 147.8 -3% | 109.8 ? -28% | 162.4 ? 6% |
| 4K-64 Read (MB/s) | 551 | 962 75% | 808 47% | 463.6 -16% | 1202 118% | 542 -2% | 560 ? 2% | 962 ? 75% |
| 4K-64 Write (MB/s) | 375.3 | 1420 278% | 1846 392% | 413.3 10% | 1290 244% | 282.4 -25% | 479 ? 28% | 1648 ? 339% |
| Access Time Read * (ms) | 0.118 | 0.043 64% | 0.062 47% | 0.133 -13% | 0.044 63% | 0.077 35% | 0.1046 ? 11% | 0.08485 ? 28% |
| Access Time Write * (ms) | 0.028 | 0.028 -0% | 0.031 -11% | 0.049 -75% | 0.026 7% | 0.025 11% | 0.03554 ? -27% | 0.05977 ? -113% |
| Score Read (Points) | 739 | 1284 74% | 1112 50% | 649 -12% | 1523 106% | 893 21% | 733 ? -1% | 1451 ? 96% |
| Score Write (Points) | 643 | 1693 163% | 2107 228% | 608 -5% | 1618 152% | 648 1% | 687 ? 7% | 2087 ? 225% |
| Score Total (Points) | 1755 | 3579 104% | 3742 113% | 1582 -10% | 3887 121% | 1974 12% | 1787 ? 2% | 4215 ? 140% |
| Copy ISO MB/s (MB/s) | 841 | 1395 66% | 1249 49% | 990 ? 18% | 2541 ? 202% | |||
| Copy Program MB/s (MB/s) | 289.3 | 491.8 70% | 53.5 -82% | 368 ? 27% | 790 ? 173% | |||
| Copy Game MB/s (MB/s) | 471.1 | 948 101% | 201.3 -57% | 592 ? 26% | 1648 ? 250% | |||
| Media totale (Programma / Settaggio) | 89% /
87% | 91% /
89% | -6% /
-10% | 76% /
78% | 59% /
53% | 6% /
5% | 152% /
145% |
* ... Meglio usare valori piccoli

Carico di lettura continuo: DiskSpd Read Loop, Queue Depth 8
| 3DMark 11 Performance | 1715 punti | |
| 3DMark Cloud Gate Standard Score | 7233 punti | |
| 3DMark Fire Strike Score | 882 punti | |
| 3DMark Time Spy Score | 376 punti | |
Aiuto | ||
| basso | medio | alto | ultra | |
|---|---|---|---|---|
| The Witcher 3 (2015) | 9.6 | |||
| Dota 2 Reborn (2015) | 58.2 | 30.6 | 15.5 | 13.7 |
| X-Plane 11.11 (2018) | 20 | 13.5 | 12 |
Rumorosità
| Idle |
| 29.4 / 29.4 / 30 dB(A) |
| Sotto carico |
| 30.6 / 30.6 dB(A) |
 | ||
30 dB silenzioso 40 dB(A) udibile 50 dB(A) rumoroso |
||
min: | ||
| Fujitsu LifeBook U7310 UHD Graphics 620, i5-10210U, WDC PC SN520 SDAPNUW-256G | Lenovo ThinkPad X13-20T20033GE UHD Graphics 620, i5-10210U, Samsung SSD PM981a MZVLB512HBJQ | Lenovo ThinkPad X13-20UGS00800 Vega 7, R7 PRO 4750U, Samsung SSD PM981a MZVLB512HBJQ | HP EliteBook 735 G6 7KN29EA Vega 8, R5 PRO 3500U, WDC PC SN520 SDAPNUW-256G | Fujitsu Lifebook U939 i5 UHD Graphics 620, i5-8265U, Samsung SSD PM981 MZVLB512HAJQ | Samsung Galaxy Book Ion 13.3 UHD Graphics 620, i5-10210U, Samsung SSD PM981a MZVLB256HBHQ | |
|---|---|---|---|---|---|---|
| Noise | -2% | 0% | -5% | -4% | -9% | |
| off /ambiente * (dB) | 29.4 | 29.3 -0% | 29.1 1% | 29.6 -1% | 29.8 -1% | 30.7 -4% |
| Idle Minimum * (dB) | 29.4 | 29.3 -0% | 29.1 1% | 29.6 -1% | 29.8 -1% | 30.7 -4% |
| Idle Average * (dB) | 29.4 | 29.3 -0% | 29.1 1% | 29.6 -1% | 29.8 -1% | 30.7 -4% |
| Idle Maximum * (dB) | 30 | 29.3 2% | 29.1 3% | 30.9 -3% | 29.8 1% | 30.7 -2% |
| Load Average * (dB) | 30.6 | 30.7 -0% | 31.1 -2% | 33.9 -11% | 31.7 -4% | 36.6 -20% |
| Load Maximum * (dB) | 30.6 | 34 -11% | 31.8 -4% | 33.9 -11% | 36.3 -19% | 36.3 -19% |
| Witcher 3 ultra * (dB) | 35.8 |
* ... Meglio usare valori piccoli
(+) La temperatura massima sul lato superiore è di 36.3 °C / 97 F, rispetto alla media di 34.3 °C / 94 F, che varia da 21.2 a 62.5 °C per questa classe Office.
(±) Il lato inferiore si riscalda fino ad un massimo di 42 °C / 108 F, rispetto alla media di 36.8 °C / 98 F
(+) In idle, la temperatura media del lato superiore è di 23.4 °C / 74 F, rispetto alla media deld ispositivo di 29.5 °C / 85 F.
(+) I poggiapolsi e il touchpad sono piu' freddi della temperatura della pelle con un massimo di 27.1 °C / 80.8 F e sono quindi freddi al tatto.
(±) La temperatura media della zona del palmo della mano di dispositivi simili e'stata di 27.5 °C / 81.5 F (+0.4 °C / 0.7 F).
| Fujitsu LifeBook U7310 UHD Graphics 620, i5-10210U, WDC PC SN520 SDAPNUW-256G | Lenovo ThinkPad X13-20T20033GE UHD Graphics 620, i5-10210U, Samsung SSD PM981a MZVLB512HBJQ | Lenovo ThinkPad X13-20UGS00800 Vega 7, R7 PRO 4750U, Samsung SSD PM981a MZVLB512HBJQ | HP EliteBook 735 G6 7KN29EA Vega 8, R5 PRO 3500U, WDC PC SN520 SDAPNUW-256G | Fujitsu Lifebook U939 i5 UHD Graphics 620, i5-8265U, Samsung SSD PM981 MZVLB512HAJQ | Samsung Galaxy Book Ion 13.3 UHD Graphics 620, i5-10210U, Samsung SSD PM981a MZVLB256HBHQ | |
|---|---|---|---|---|---|---|
| Heat | -12% | -6% | -13% | -12% | -10% | |
| Maximum Upper Side * (°C) | 36.3 | 48.4 -33% | 44.8 -23% | 39.5 -9% | 46.3 -28% | 41.8 -15% |
| Maximum Bottom * (°C) | 42 | 43.8 -4% | 42.1 -0% | 41.8 -0% | 44.9 -7% | 43 -2% |
| Idle Upper Side * (°C) | 23.9 | 25.2 -5% | 24.1 -1% | 28.5 -19% | 25.8 -8% | 26.6 -11% |
| Idle Bottom * (°C) | 24.8 | 25.7 -4% | 25.1 -1% | 30.6 -23% | 25.8 -4% | 27.2 -10% |
* ... Meglio usare valori piccoli
Fujitsu LifeBook U7310 analisi audio
(-) | altoparlanti non molto potenti (71.4 dB)
Bassi 100 - 315 Hz
(-) | quasi nessun basso - in media 21.3% inferiori alla media
(±) | la linearità dei bassi è media (9.9% delta rispetto alla precedente frequenza)
Medi 400 - 2000 Hz
(±) | medi elevati - circa 5.1% superiore alla media
(±) | linearità dei medi adeguata (7.3% delta rispetto alla precedente frequenza)
Alti 2 - 16 kHz
(+) | Alti bilanciati - appena 3.1% dalla media
(±) | la linearità degli alti è media (10.2% delta rispetto alla precedente frequenza)
Nel complesso 100 - 16.000 Hz
(±) | la linearità complessiva del suono è media (27.9% di differenza rispetto alla media
Rispetto alla stessa classe
» 87% di tutti i dispositivi testati in questa classe è stato migliore, 3% simile, 10% peggiore
» Il migliore ha avuto un delta di 7%, medio di 21%, peggiore di 53%
Rispetto a tutti i dispositivi testati
» 85% di tutti i dispositivi testati in questa classe è stato migliore, 3% similare, 12% peggiore
» Il migliore ha avuto un delta di 4%, medio di 23%, peggiore di 134%
Apple MacBook 12 (Early 2016) 1.1 GHz analisi audio
(+) | gli altoparlanti sono relativamente potenti (83.6 dB)
Bassi 100 - 315 Hz
(±) | bassi ridotti - in media 11.3% inferiori alla media
(±) | la linearità dei bassi è media (14.2% delta rispetto alla precedente frequenza)
Medi 400 - 2000 Hz
(+) | medi bilanciati - solo only 2.4% rispetto alla media
(+) | medi lineari (5.5% delta rispetto alla precedente frequenza)
Alti 2 - 16 kHz
(+) | Alti bilanciati - appena 2% dalla media
(+) | alti lineari (4.5% delta rispetto alla precedente frequenza)
Nel complesso 100 - 16.000 Hz
(+) | suono nel complesso lineare (10.2% differenza dalla media)
Rispetto alla stessa classe
» 7% di tutti i dispositivi testati in questa classe è stato migliore, 2% simile, 90% peggiore
» Il migliore ha avuto un delta di 5%, medio di 18%, peggiore di 53%
Rispetto a tutti i dispositivi testati
» 5% di tutti i dispositivi testati in questa classe è stato migliore, 1% similare, 94% peggiore
» Il migliore ha avuto un delta di 4%, medio di 23%, peggiore di 134%
| Off / Standby | |
| Idle | |
| Sotto carico |
|
Leggenda:
min: | |
| Fujitsu LifeBook U7310 UHD Graphics 620, i5-10210U, WDC PC SN520 SDAPNUW-256G | Lenovo ThinkPad X13-20T20033GE UHD Graphics 620, i5-10210U, Samsung SSD PM981a MZVLB512HBJQ | Lenovo ThinkPad X13-20UGS00800 Vega 7, R7 PRO 4750U, Samsung SSD PM981a MZVLB512HBJQ | HP EliteBook 735 G6 7KN29EA Vega 8, R5 PRO 3500U, WDC PC SN520 SDAPNUW-256G | Fujitsu Lifebook U939 i5 UHD Graphics 620, i5-8265U, Samsung SSD PM981 MZVLB512HAJQ | Samsung Galaxy Book Ion 13.3 UHD Graphics 620, i5-10210U, Samsung SSD PM981a MZVLB256HBHQ | |
|---|---|---|---|---|---|---|
| Power Consumption | -8% | -42% | -36% | -12% | -5% | |
| Idle Minimum * (Watt) | 2.9 | 2.9 -0% | 6 -107% | 5.6 -93% | 3.1 -7% | 2.2 24% |
| Idle Average * (Watt) | 5.3 | 5.6 -6% | 8.9 -68% | 8.1 -53% | 5.9 -11% | 5.9 -11% |
| Idle Maximum * (Watt) | 7.1 | 8.9 -25% | 11.3 -59% | 9.6 -35% | 9.2 -30% | 8.9 -25% |
| Load Average * (Watt) | 30.7 | 30.1 2% | 34.2 -11% | 34.3 -12% | 35.8 -17% | 46 -50% |
| Load Maximum * (Watt) | 55.3 | 61.3 -11% | 37.2 33% | 48.6 12% | 51.9 6% | 34 39% |
| Witcher 3 ultra * (Watt) | 25.5 |
* ... Meglio usare valori piccoli
Pro
Contro
Tutto ciò che riguarda il Fujitsu LifeBook U7310 è progettato per un funzionamento silenzioso, fresco e sicuro in ufficio. Di per sé questa è una buona decisione, ma forse Fujitsu si sta spingendo un po' troppo oltre e sta sacrificando troppe prestazioni.
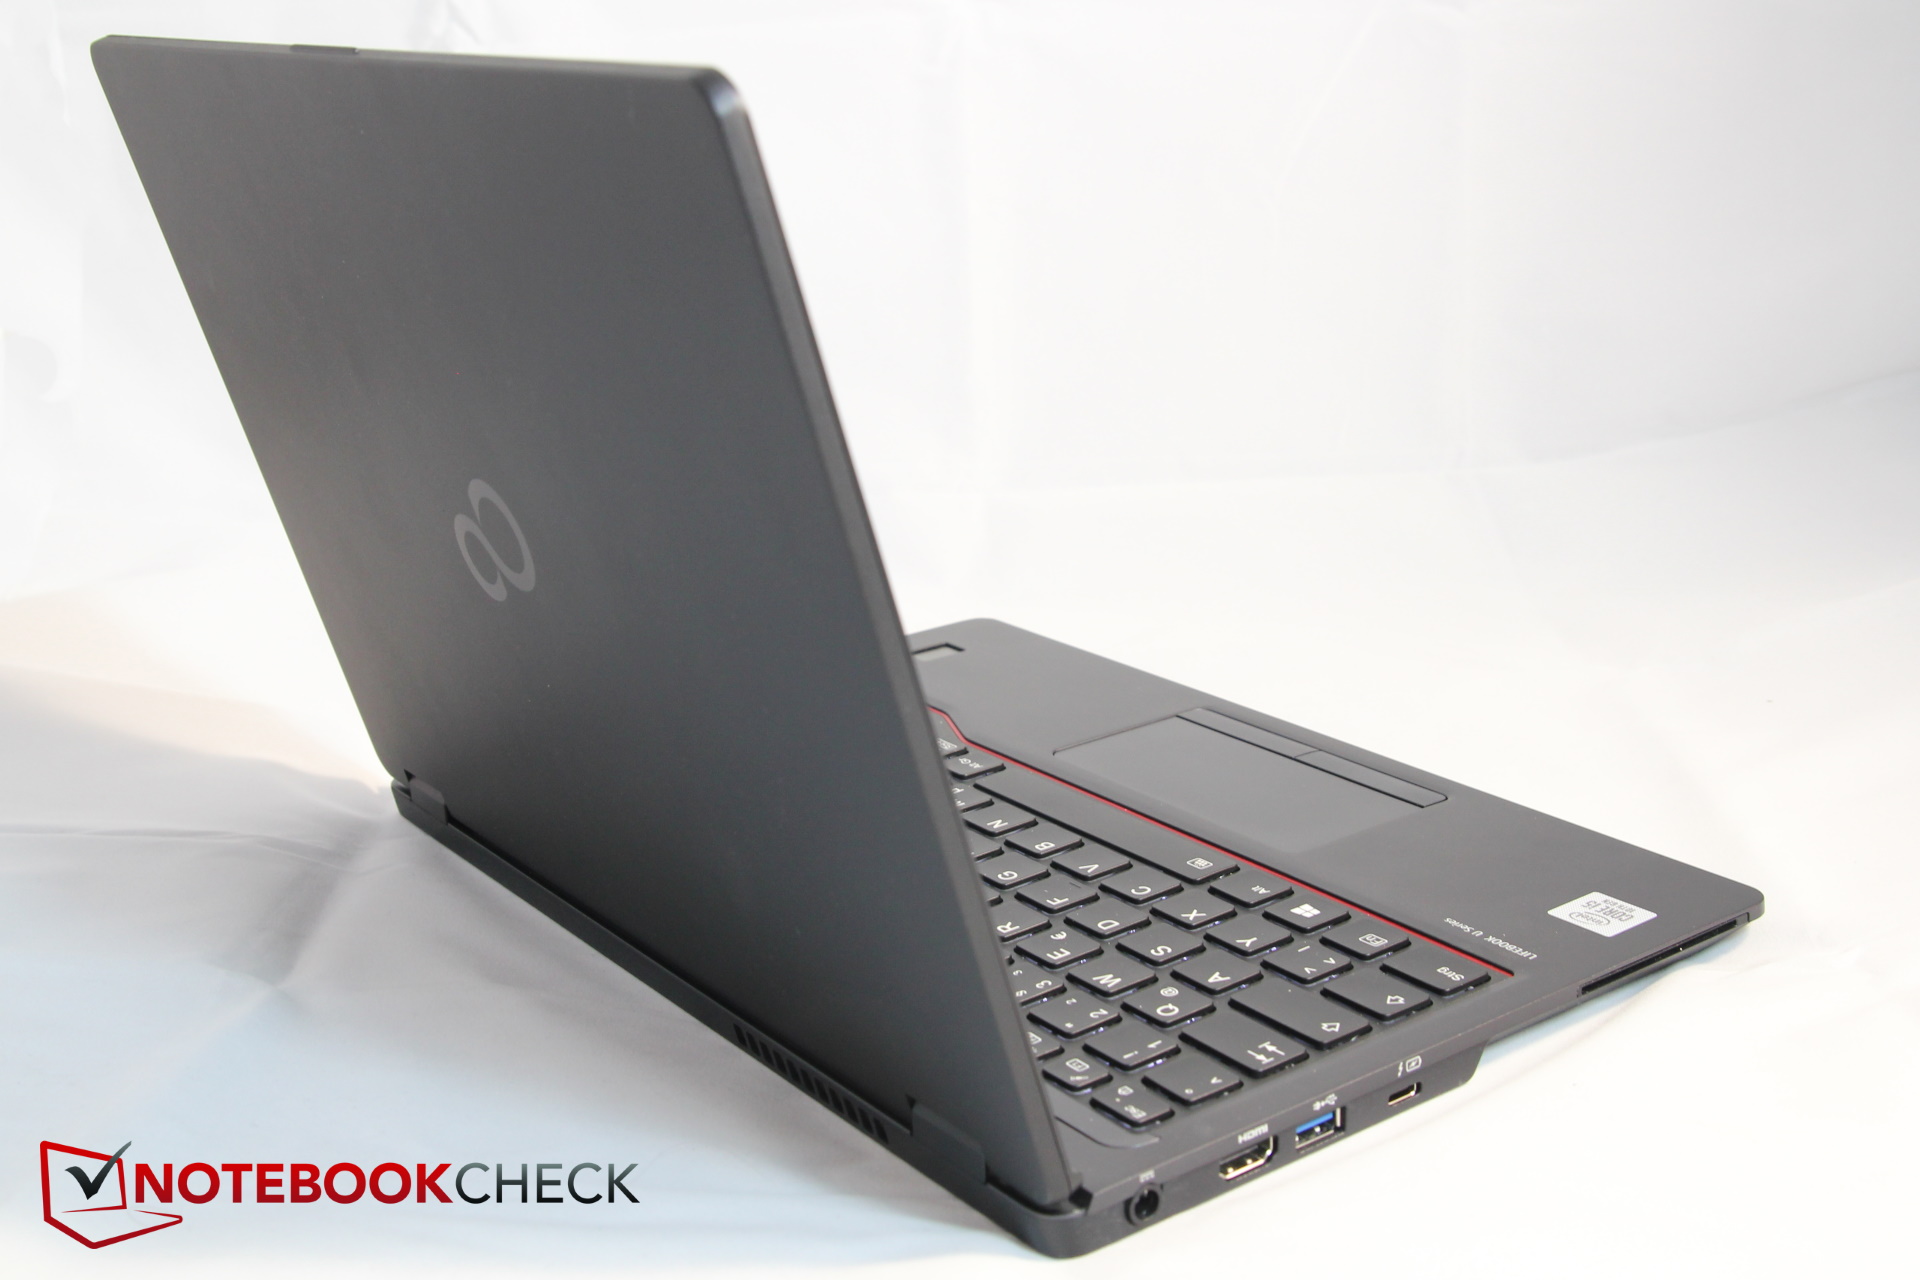
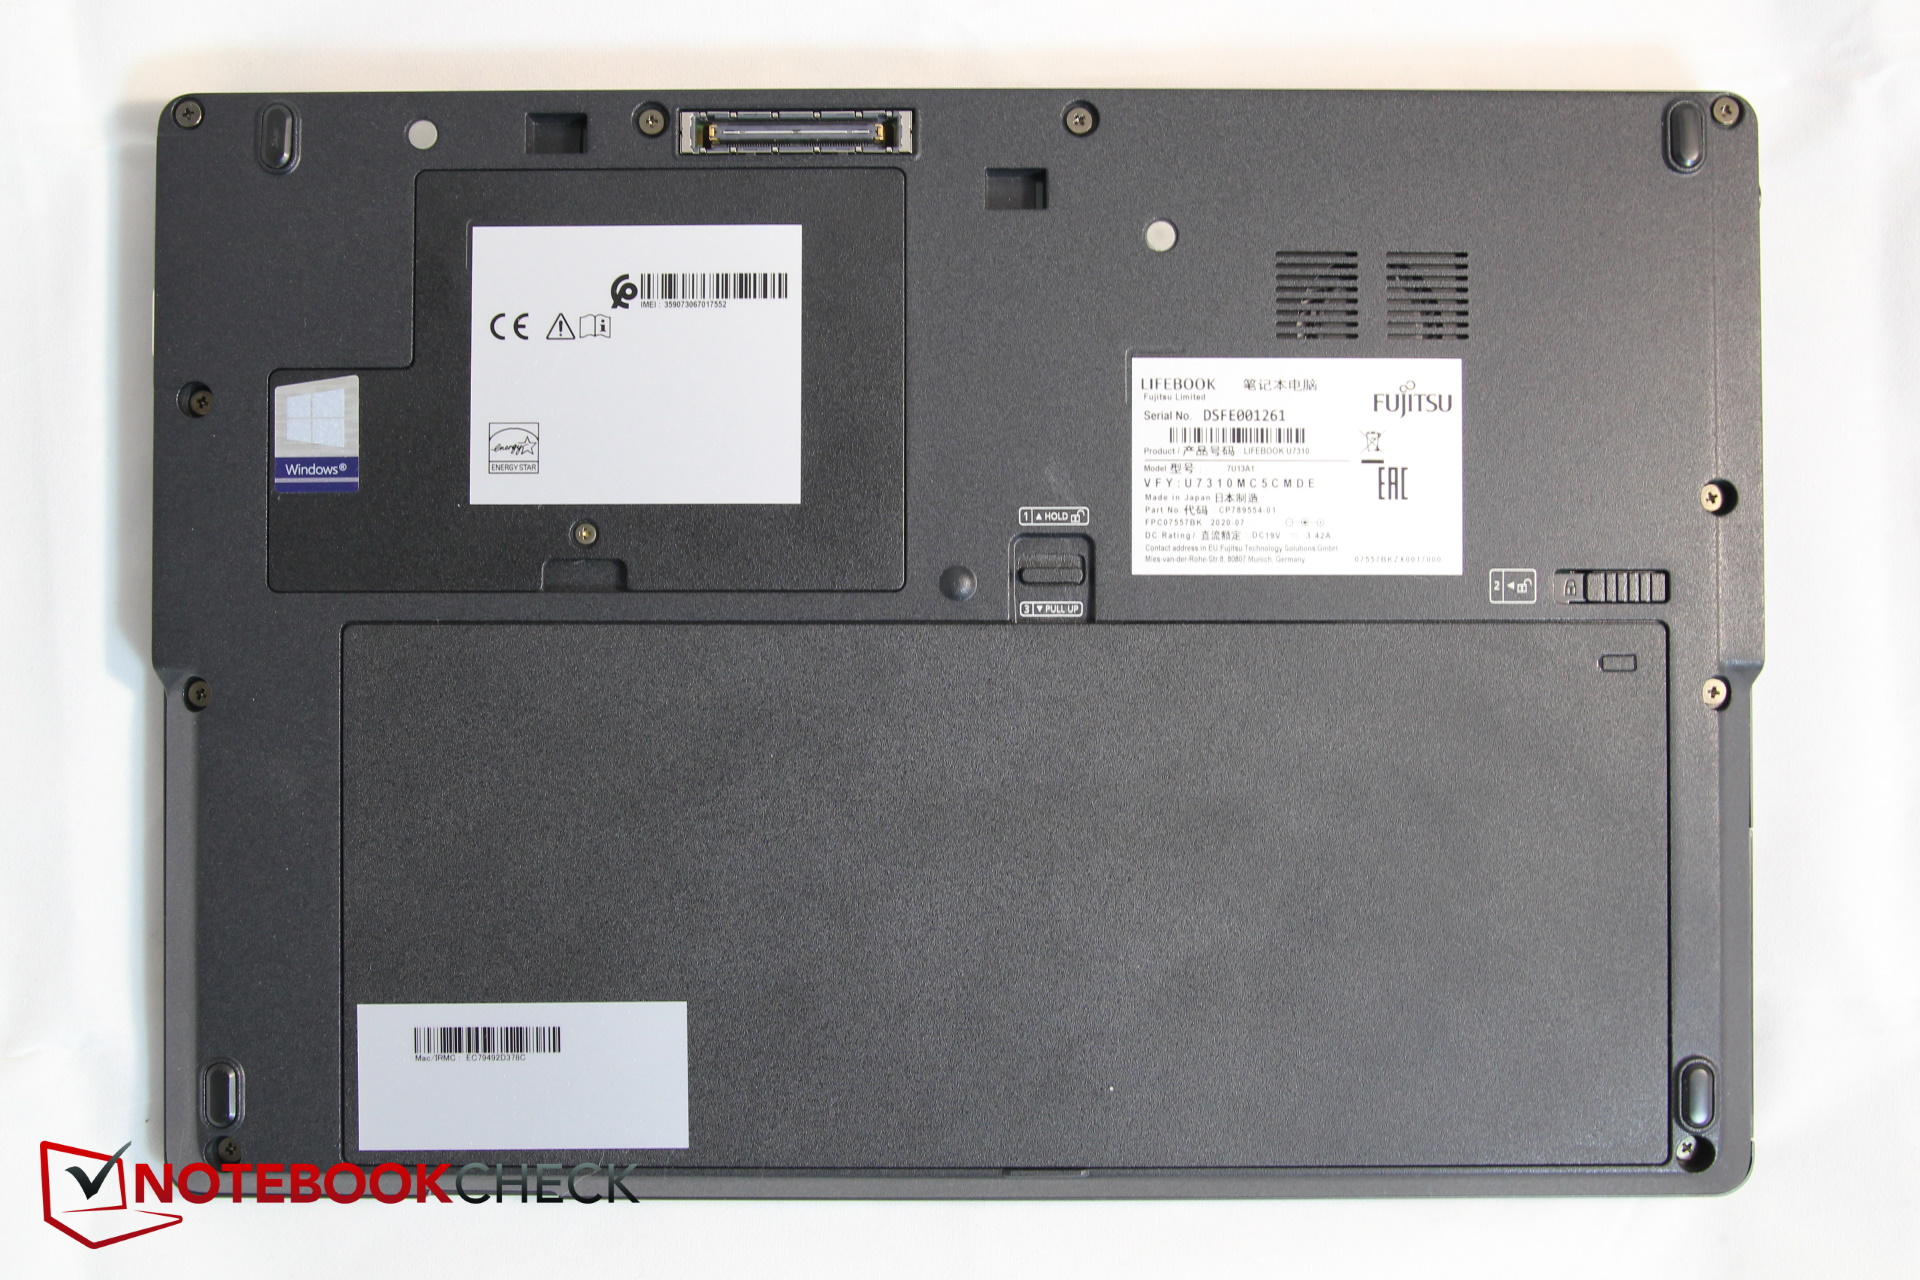
L'U7310 ha alcuni punti in più o addirittura punti di vendita unici dalla sua parte, come la batteria rimovibile, il pannello per la manutenzione, il sensore opzionale delle vene, lo slot SIM e il lettore di schede SD completo.
I clienti business ottengono un buon portatile funzionante con molte caratteristiche di sicurezza, ma gli utenti che vogliono anche eseguire applicazioni grafiche saranno probabilmente delusi dalle prestazioni del Fujitsu. Nella vita di tutti i giorni in ufficio, tuttavia, è improbabile che questo sia un problema - i piccoli difetti di qualità come il pulsante destro del mouse che vibra o la spina di alimentazione traballante, d'altra parte, sono un problema - soprattutto ad un prezzo di ben oltre 1.000 euro (~$1.188). Sono fastidiosi anche i problemi del driver e le conseguenti latenze e le perdite di fotogrammi durante la riproduzione di video su YouTube.
Il LifeBook U7310 è un notebook da lavoro silenzioso e fresco, con utili funzioni di sicurezza e una batteria rimovibile. Per ottenere questo, tuttavia, Fujitsu limita fortemente le prestazioni, e ci sono anche lievi difetti di lavorazione.
Fujitsu LifeBook U7310
- 10/29/2020 v7 (old)
Christian Hintze
Price comparison
