Recensione del Portatile Dell Inspiron 13 7380 (Core i7-8565U, SSD, FHD)
| SD Card Reader | |
| average JPG Copy Test (av. of 3 runs) | |
| HP Envy 13-ah0003ng (Toshiba Exceria Pro M501 microSDXC 64GB) | |
| Media della classe Subnotebook (23.7 - 188, n=9, ultimi 2 anni) | |
| Dell Inspiron 13 7370 (Toshiba Exceria Pro SDXC 64 GB UHS-II) | |
| Asus ZenBook 13 UX333FA (Toshiba Exceria Pro M501 microSDXC 64GB) | |
| Dell Inspiron 13 7380 (Toshiba Exceria Pro SDXC 64 GB UHS-II) | |
| maximum AS SSD Seq Read Test (1GB) | |
| Media della classe Subnotebook (24.9 - 195, n=8, ultimi 2 anni) | |
| HP Envy 13-ah0003ng (Toshiba Exceria Pro M501 microSDXC 64GB) | |
| Dell Inspiron 13 7370 (Toshiba Exceria Pro SDXC 64 GB UHS-II) | |
| Dell Inspiron 13 7380 (Toshiba Exceria Pro SDXC 64 GB UHS-II) | |
| Asus ZenBook 13 UX333FA (Toshiba Exceria Pro M501 microSDXC 64GB) | |
| |||||||||||||||||||||||||
Distribuzione della luminosità: 84 %
Al centro con la batteria: 314 cd/m²
Contrasto: 1028:1 (Nero: 0.32 cd/m²)
ΔE ColorChecker Calman: 5.81 | ∀{0.5-29.43 Ø4.72}
ΔE Greyscale Calman: 3.77 | ∀{0.09-98 Ø4.97}
85% sRGB (Argyll 1.6.3 3D)
56% AdobeRGB 1998 (Argyll 1.6.3 3D)
61.9% AdobeRGB 1998 (Argyll 3D)
84.7% sRGB (Argyll 3D)
65.8% Display P3 (Argyll 3D)
Gamma: 2.13
CCT: 6940 K
| Dell Inspiron 13 7380 IPS, 1920x1080, 13.3" | Lenovo IdeaPad 730S-13IWL 81JB0004US IPS, 1920x1080, 13.3" | Acer Swift 3 SF313-51-59SZ IPS, 1920x1080, 13.3" | Asus ZenBook 13 UX333FA IPS, 1920x1080, 13.3" | HP Envy 13-ah0003ng IPS, 1920x1080, 13.3" | Apple MacBook Air 2018 IPS, 2560x1600, 13.3" | Dell Inspiron 13 7370 IPS, 1920x1080, 13.3" | Lenovo Ideapad 720S-13ARR IPS, 1920x1080, 13.3" | |
|---|---|---|---|---|---|---|---|---|
| Display | 7% | 3% | 10% | -10% | 10% | 2% | -2% | |
| Display P3 Coverage (%) | 65.8 | 65.6 0% | 67 2% | 67.9 3% | 54.8 -17% | 67.8 3% | 66.7 1% | 65.1 -1% |
| sRGB Coverage (%) | 84.7 | 95.5 13% | 88 4% | 97.4 15% | 82.5 -3% | 96.1 13% | 86.2 2% | 83.1 -2% |
| AdobeRGB 1998 Coverage (%) | 61.9 | 66.7 8% | 64.3 4% | 69.2 12% | 56.6 -9% | 69.8 13% | 63 2% | 60.8 -2% |
| Response Times | -101% | -50% | -70% | -3% | -25% | -46% | 7% | |
| Response Time Grey 50% / Grey 80% * (ms) | 34 ? | 75.2 ? -121% | 44 ? -29% | 54.4 ? -60% | 31 ? 9% | 39.6 ? -16% | 46 ? -35% | 31 ? 9% |
| Response Time Black / White * (ms) | 21 ? | 38 ? -81% | 36 ? -71% | 37.6 ? -79% | 24 ? -14% | 28 ? -33% | 33 ? -57% | 20 ? 5% |
| PWM Frequency (Hz) | 135000 ? | 544 | 500 ? | 1000 ? | 113600 ? | 201 ? | 65000 ? | |
| Screen | 17% | -7% | 7% | 23% | 29% | -4% | 1% | |
| Brightness middle (cd/m²) | 329 | 355.1 8% | 300 -9% | 276 -16% | 289 -12% | 320 -3% | 301 -9% | 324 -2% |
| Brightness (cd/m²) | 301 | 336 12% | 277 -8% | 263 -13% | 310 3% | 315 5% | 291 -3% | 293 -3% |
| Brightness Distribution (%) | 84 | 83 -1% | 87 4% | 89 6% | 85 1% | 95 13% | 87 4% | 78 -7% |
| Black Level * (cd/m²) | 0.32 | 0.32 -0% | 0.26 19% | 0.21 34% | 0.23 28% | 0.29 9% | 0.33 -3% | 0.32 -0% |
| Contrast (:1) | 1028 | 1110 8% | 1154 12% | 1314 28% | 1257 22% | 1103 7% | 912 -11% | 1013 -1% |
| Colorchecker dE 2000 * | 5.81 | 2.93 50% | 5.96 -3% | 4.85 17% | 1.64 72% | 1.2 79% | 5.39 7% | 5.52 5% |
| Colorchecker dE 2000 max. * | 12.17 | 4.39 64% | 10.6 13% | 8.24 32% | 3.31 73% | 3.2 74% | 8.56 30% | 10.91 10% |
| Greyscale dE 2000 * | 3.77 | 3.6 5% | 7.64 -103% | 5.7 -51% | 1.71 55% | 0.8 79% | 5.93 -57% | 3.36 11% |
| Gamma | 2.13 103% | 2.071 106% | 2.44 90% | 2.08 106% | 2.32 95% | 2.2 100% | 2.6 85% | 2.23 99% |
| CCT | 6940 94% | 7161 91% | 6877 95% | 7424 88% | 6291 103% | 6548 99% | 6358 102% | 6687 97% |
| Color Space (Percent of AdobeRGB 1998) (%) | 56 | 61 9% | 57 2% | 63 13% | 52 -7% | 62.1 11% | 56 0% | 55 -2% |
| Color Space (Percent of sRGB) (%) | 85 | 95 12% | 88 4% | 98 15% | 82 -4% | 96 13% | 86 1% | 83 -2% |
| Colorchecker dE 2000 calibrated * | 1.83 | 2.47 | 1.6 | 0.99 | 0.5 | |||
| Media totale (Programma / Settaggio) | -26% /
-1% | -18% /
-11% | -18% /
-3% | 3% /
13% | 5% /
18% | -16% /
-9% | 2% /
1% |
* ... Meglio usare valori piccoli
Tempi di risposta del Display
| ↔ Tempi di risposta dal Nero al Bianco | ||
|---|---|---|
| 21 ms ... aumenta ↗ e diminuisce ↘ combinato | ↗ 12 ms Incremento | 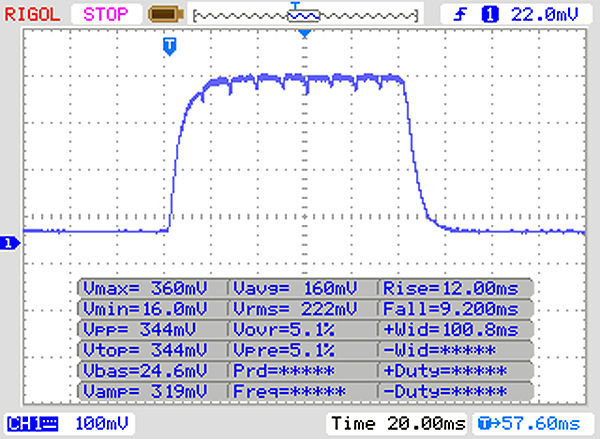 |
| ↘ 9 ms Calo | ||
| Lo schermo mostra buoni tempi di risposta durante i nostri tests, ma potrebbe essere troppo lento per i gamers competitivi. In confronto, tutti i dispositivi di test variano da 0.1 (minimo) a 240 (massimo) ms. » 47 % di tutti i dispositivi è migliore. Questo significa che i tempi di risposta rilevati sono simili alla media di tutti i dispositivi testati (19.8 ms). | ||
| ↔ Tempo di risposta dal 50% Grigio all'80% Grigio | ||
| 34 ms ... aumenta ↗ e diminuisce ↘ combinato | ↗ 19 ms Incremento | 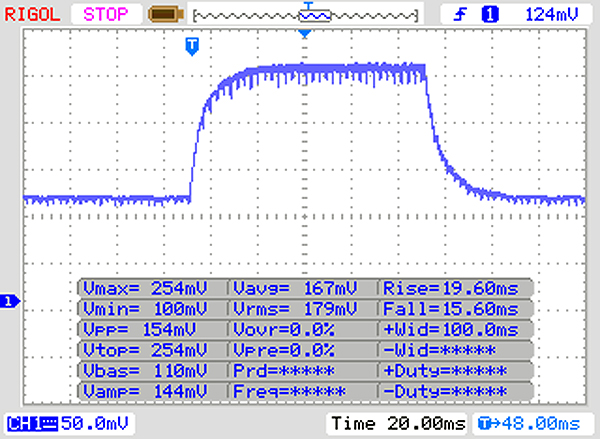 |
| ↘ 15 ms Calo | ||
| Lo schermo mostra tempi di risposta lenti nei nostri tests e sarà insoddisfacente per i gamers. In confronto, tutti i dispositivi di test variano da 0.165 (minimo) a 636 (massimo) ms. » 47 % di tutti i dispositivi è migliore. Questo significa che i tempi di risposta rilevati sono simili alla media di tutti i dispositivi testati (31 ms). | ||
Sfarfallio dello schermo / PWM (Pulse-Width Modulation)
| flickering dello schermo / PWM rilevato | 135000 Hz | ≤ 90 % settaggio luminosita' | 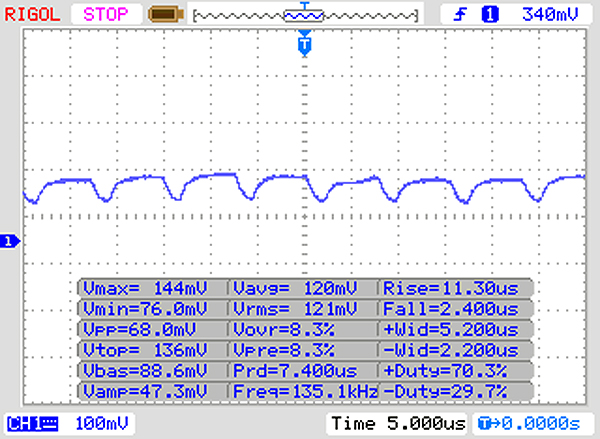 |
Il display sfarfalla a 135000 Hz (Probabilmente a causa dell'uso di PWM) Flickering rilevato ad una luminosita' di 90 % o inferiore. Non dovrebbe verificarsi flickering o PWM sopra questo valore di luminosita'. La frequenza di 135000 Hz è abbastanza alta, quindi la maggioranza degli utenti sensibili al PWM non dovrebbero notare alcun flickering. In confronto: 52 % di tutti i dispositivi testati non utilizza PWM per ridurre la luminosita' del display. Se è rilevato PWM, una media di 7781 (minimo: 5 - massimo: 343500) Hz è stata rilevata. | |||
| JetStream 1.1 - 1.1 Total | |
| Media della classe Subnotebook (215 - 476, n=2, ultimi 2 anni) | |
| Dell Inspiron 13 7380 (Edge 44) | |
| Lenovo IdeaPad 730S-13IWL 81JB0004US (Microsoft Edge 44.17763.1.0) | |
| Media Intel Core i7-8565U (107.6 - 277, n=37) | |
| Apple MacBook Air 2018 (Safari 12.0.1) | |
| HP Envy 13-ah0003ng (Edge 42) | |
| Acer Swift 3 SF313-51-59SZ (Edge: 42.17134.1.0) | |
| Lenovo Ideapad 720S-13ARR (Edge 42) | |
| PCMark 8 Home Score Accelerated v2 | 4010 punti | |
| PCMark 8 Creative Score Accelerated v2 | 5051 punti | |
| PCMark 8 Work Score Accelerated v2 | 5098 punti | |
| PCMark 10 Score | 3981 punti | |
Aiuto | ||

| Dell Inspiron 13 7380 Toshiba BG3 KBG30ZMS256G | Lenovo IdeaPad 730S-13IWL 81JB0004US Samsung SSD PM981 MZVLB256HAHQ | Tuxedo Book BU1307 Samsung SSD 970 EVO 250GB | Acer Swift 3 SF313-51-59SZ Kingston RBUSNS8154P3256GJ1 | Asus ZenBook 13 UX333FA WDC PC SN520 SDAPNUW-256G | HP Envy 13-ah0003ng SK Hynix BC501 HFM512GDJTNG | Apple MacBook Air 2018 Apple SSD AP0256 | Dell Inspiron 13 7370 Micron 1100 MTFDDAV256TBN | Lenovo Ideapad 720S-13ARR Samsung PM961 MZVLW256HEHP | Media Toshiba BG3 KBG30ZMS256G | Media della classe Subnotebook | |
|---|---|---|---|---|---|---|---|---|---|---|---|
| CrystalDiskMark 5.2 / 6 | 167% | 189% | 155% | 90% | 77% | 105% | 132% | 10% | 497% | ||
| Write 4K (MB/s) | 75 | 117 56% | 158.2 111% | 113.7 52% | 113.7 52% | 112.9 51% | 118 57% | 87.5 17% | 80.3 ? 7% | 155.4 ? 107% | |
| Read 4K (MB/s) | 31.61 | 40.65 29% | 38.78 23% | 40.6 28% | 43.18 37% | 38.69 22% | 29.97 -5% | 31.39 -1% | 30.1 ? -5% | 64.3 ? 103% | |
| Write Seq (MB/s) | 235.7 | 1456 518% | 1487 531% | 845 259% | 970 312% | 654 177% | 1000 324% | 1281 443% | 338 ? 43% | 2846 ? 1107% | |
| Read Seq (MB/s) | 901 | 1181 31% | 913 1% | 1137 26% | 1085 20% | 642 -29% | 1218 35% | 1453 61% | 863 ? -4% | 3299 ? 266% | |
| Write 4K Q32T1 (MB/s) | 154.3 | 232.3 51% | 330.5 114% | 868 463% | 396.8 157% | 305.9 98% | 232.1 50% | 169.4 10% | 155 ? 0% | 431 ? 179% | |
| Read 4K Q32T1 (MB/s) | 294.4 | 311.3 6% | 423.8 44% | 1580 437% | 317.8 8% | 351.6 19% | 254 -14% | 241.8 -18% | 297 ? 1% | 504 ? 71% | |
| Write Seq Q32T1 (MB/s) | 241.5 | 1463 506% | 1540 538% | 345.6 43% | 518 114% | 869 260% | 1001 314% | 1337 454% | 331 ? 37% | 4671 ? 1834% | |
| Read Seq Q32T1 (MB/s) | 1440 | 3480 142% | 3556 147% | 411.7 -71% | 1741 21% | 1683 17% | 2555 77% | 2786 93% | 1397 ? -3% | 5833 ? 305% |
| 3DMark 11 Performance | 2051 punti | |
| 3DMark Cloud Gate Standard Score | 8938 punti | |
| 3DMark Fire Strike Score | 1155 punti | |
Aiuto | ||
| basso | medio | alto | ultra | |
|---|---|---|---|---|
| BioShock Infinite (2013) | 73.8 | 37.9 | 31.2 | 9.8 |
| Far Cry New Dawn (2019) | 13 | 7 | ||
| Metro Exodus (2019) | 12.7 | 5.9 |
Rumorosità
| Idle |
| 30.4 / 30.4 / 30.4 dB(A) |
| Sotto carico |
| / 39 dB(A) |
 | ||
30 dB silenzioso 40 dB(A) udibile 50 dB(A) rumoroso |
||
min: | ||
(±) La temperatura massima sul lato superiore è di 44.2 °C / 112 F, rispetto alla media di 35.9 °C / 97 F, che varia da 21.4 a 59 °C per questa classe Subnotebook.
(-) Il lato inferiore si riscalda fino ad un massimo di 53.5 °C / 128 F, rispetto alla media di 39.2 °C / 103 F
(+) In idle, la temperatura media del lato superiore è di 25.1 °C / 77 F, rispetto alla media deld ispositivo di 30.8 °C / 87 F.
(+) I poggiapolsi e il touchpad sono piu' freddi della temperatura della pelle con un massimo di 30.2 °C / 86.4 F e sono quindi freddi al tatto.
(±) La temperatura media della zona del palmo della mano di dispositivi simili e'stata di 28.2 °C / 82.8 F (-2 °C / -3.6 F).
Dell Inspiron 13 7380 analisi audio
(-) | altoparlanti non molto potenti (64.4 dB)
Bassi 100 - 315 Hz
(±) | bassi ridotti - in media 14.6% inferiori alla media
(-) | bassi non lineari (16.5% delta rispetto alla precedente frequenza)
Medi 400 - 2000 Hz
(+) | medi bilanciati - solo only 2.8% rispetto alla media
(+) | medi lineari (3.4% delta rispetto alla precedente frequenza)
Alti 2 - 16 kHz
(+) | Alti bilanciati - appena 0.8% dalla media
(+) | alti lineari (4.2% delta rispetto alla precedente frequenza)
Nel complesso 100 - 16.000 Hz
(±) | la linearità complessiva del suono è media (17.1% di differenza rispetto alla media
Rispetto alla stessa classe
» 43% di tutti i dispositivi testati in questa classe è stato migliore, 9% simile, 48% peggiore
» Il migliore ha avuto un delta di 5%, medio di 18%, peggiore di 53%
Rispetto a tutti i dispositivi testati
» 31% di tutti i dispositivi testati in questa classe è stato migliore, 8% similare, 61% peggiore
» Il migliore ha avuto un delta di 4%, medio di 24%, peggiore di 134%
Acer Swift 3 SF313-51-59SZ analisi audio
(-) | altoparlanti non molto potenti (60.7 dB)
Bassi 100 - 315 Hz
(-) | quasi nessun basso - in media 21.8% inferiori alla media
(±) | la linearità dei bassi è media (7.6% delta rispetto alla precedente frequenza)
Medi 400 - 2000 Hz
(±) | medi elevati - circa 7.2% superiore alla media
(±) | linearità dei medi adeguata (13.9% delta rispetto alla precedente frequenza)
Alti 2 - 16 kHz
(+) | Alti bilanciati - appena 4.8% dalla media
(±) | la linearità degli alti è media (8.6% delta rispetto alla precedente frequenza)
Nel complesso 100 - 16.000 Hz
(-) | suono nel complesso non lineare (36.7% di differenza rispetto alla media
Rispetto alla stessa classe
» 97% di tutti i dispositivi testati in questa classe è stato migliore, 2% simile, 1% peggiore
» Il migliore ha avuto un delta di 5%, medio di 18%, peggiore di 53%
Rispetto a tutti i dispositivi testati
» 94% di tutti i dispositivi testati in questa classe è stato migliore, 1% similare, 5% peggiore
» Il migliore ha avuto un delta di 4%, medio di 24%, peggiore di 134%
Asus ZenBook 13 UX333FA analisi audio
(-) | altoparlanti non molto potenti (66 dB)
Bassi 100 - 315 Hz
(±) | bassi ridotti - in media 14.6% inferiori alla media
(±) | la linearità dei bassi è media (12.2% delta rispetto alla precedente frequenza)
Medi 400 - 2000 Hz
(+) | medi bilanciati - solo only 3.3% rispetto alla media
(+) | medi lineari (6.4% delta rispetto alla precedente frequenza)
Alti 2 - 16 kHz
(+) | Alti bilanciati - appena 3.7% dalla media
(±) | la linearità degli alti è media (8.7% delta rispetto alla precedente frequenza)
Nel complesso 100 - 16.000 Hz
(±) | la linearità complessiva del suono è media (21.2% di differenza rispetto alla media
Rispetto alla stessa classe
» 72% di tutti i dispositivi testati in questa classe è stato migliore, 5% simile, 23% peggiore
» Il migliore ha avuto un delta di 5%, medio di 18%, peggiore di 53%
Rispetto a tutti i dispositivi testati
» 59% di tutti i dispositivi testati in questa classe è stato migliore, 7% similare, 34% peggiore
» Il migliore ha avuto un delta di 4%, medio di 24%, peggiore di 134%
| Off / Standby | |
| Idle | |
| Sotto carico |
|
Leggenda:
min: | |
| Battery Runtime - WiFi Websurfing | |
| Media della classe Subnotebook (7.25 - 26.4, n=59, ultimi 2 anni) | |
| Apple MacBook Air 2018 (Safari) | |
| Apple MacBook Air 2018 (Chrome) | |
| Lenovo IdeaPad 730S-13IWL 81JB0004US | |
| Asus ZenBook 13 UX333FA | |
| Acer Swift 3 SF313-51-59SZ (Edge: 42.17134.1.0) | |
| HP Envy 13-ah0003ng (Edge 42) | |
| Lenovo Ideapad 720S-13ARR (Edge 42) | |
| Dell Inspiron 13 7380 (Edge 44) | |
| Dell Inspiron 13 7370 | |
Pro
Contro
Il Dell Inspiron 13 7380 è un solido portatile aziendale da 13 pollici che ha un case in metallo elegante e compatto, che condivide con il suo predecessore. Il suo processore Whiskey Lake fornisce una potenza più che sufficiente per i programmi Office e basati su Internet, ma non necessariamente funziona meglio del suo predecessore Kaby Lake R. Inoltre, il Core i7-8565U ha ottenuto solo punteggi di riferimento sintetici equivalenti ai nostri migliori dispositivi di confronto con alimentazione Core i5-8265U, quindi ci chiediamo quale sia il valore dell'aggiornamento al processore più costoso.
Il Dell Inspiron 7380 è un solido computer portatile da 13 pollici che funziona molto bene senza migliorare rispetto al suo predecessore. Purtroppo, il 7380 condivide la terribile durata della batteria del 7370, che è molto inferiore alla maggior parte dei moderni computer portatili aziendali.
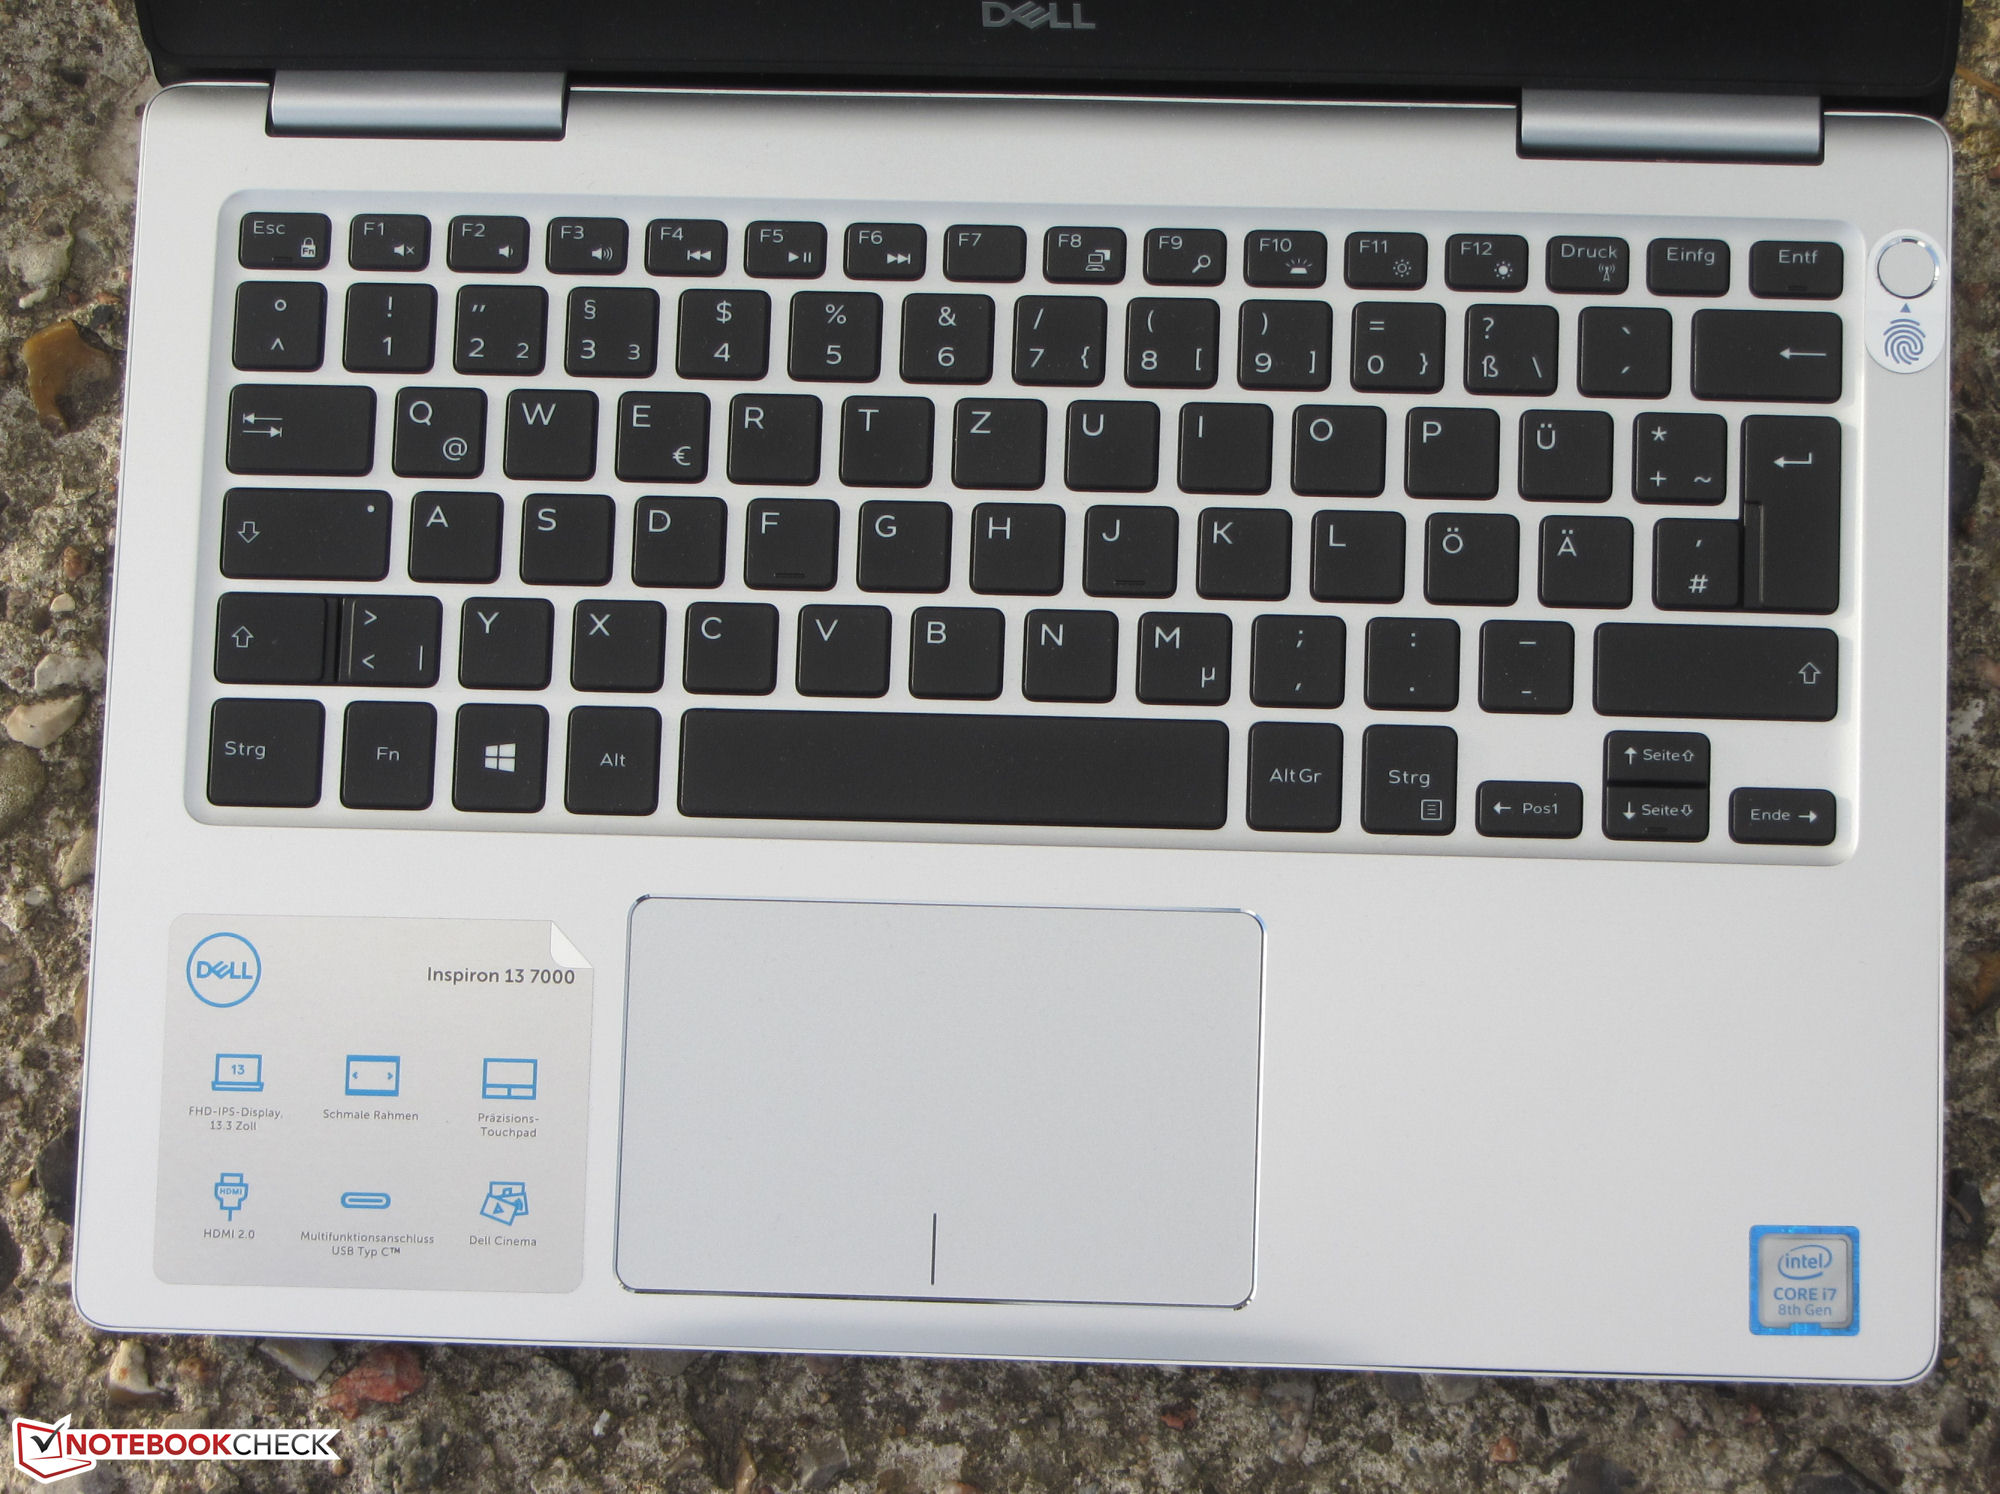
L'unità SSD NVMe assicura che il sistema funzioni senza intoppi, ma sul mercato ci sono unità SSD molto più veloci. La tastiera è decente, mentre la sua retroilluminazione è sempre gradita. Ci è piaciuto anche che la porta USB Type-C della nostra unità di prova supporti DisplayPort e USB PD, che gli permette di essere caricata con la maggior parte dei caricabatterie Type-C da 45 W o potenza superiore.
Il 7380 ha anche un display decente, che ha angoli di visualizzazione stabili, un buon rapporto di contrasto e una luminosità massima rispettabile. Tuttavia, non siamo entusiasti della sua finitura lucida, e avremmo preferito vedere un'opzione opaca disponibile come opzione almeno perché è difficile da leggere all'esterno.
La palla al piede è la durata della batteria del 7380, che è incredibilmente scarsa. Non capiamo perché Dell continui ad equipaggiare la sua serie Inspiron 13 7000 con batterie così piccole, perché rovina quello che altrimenti sarebbe un portatile da 13 pollici decente.
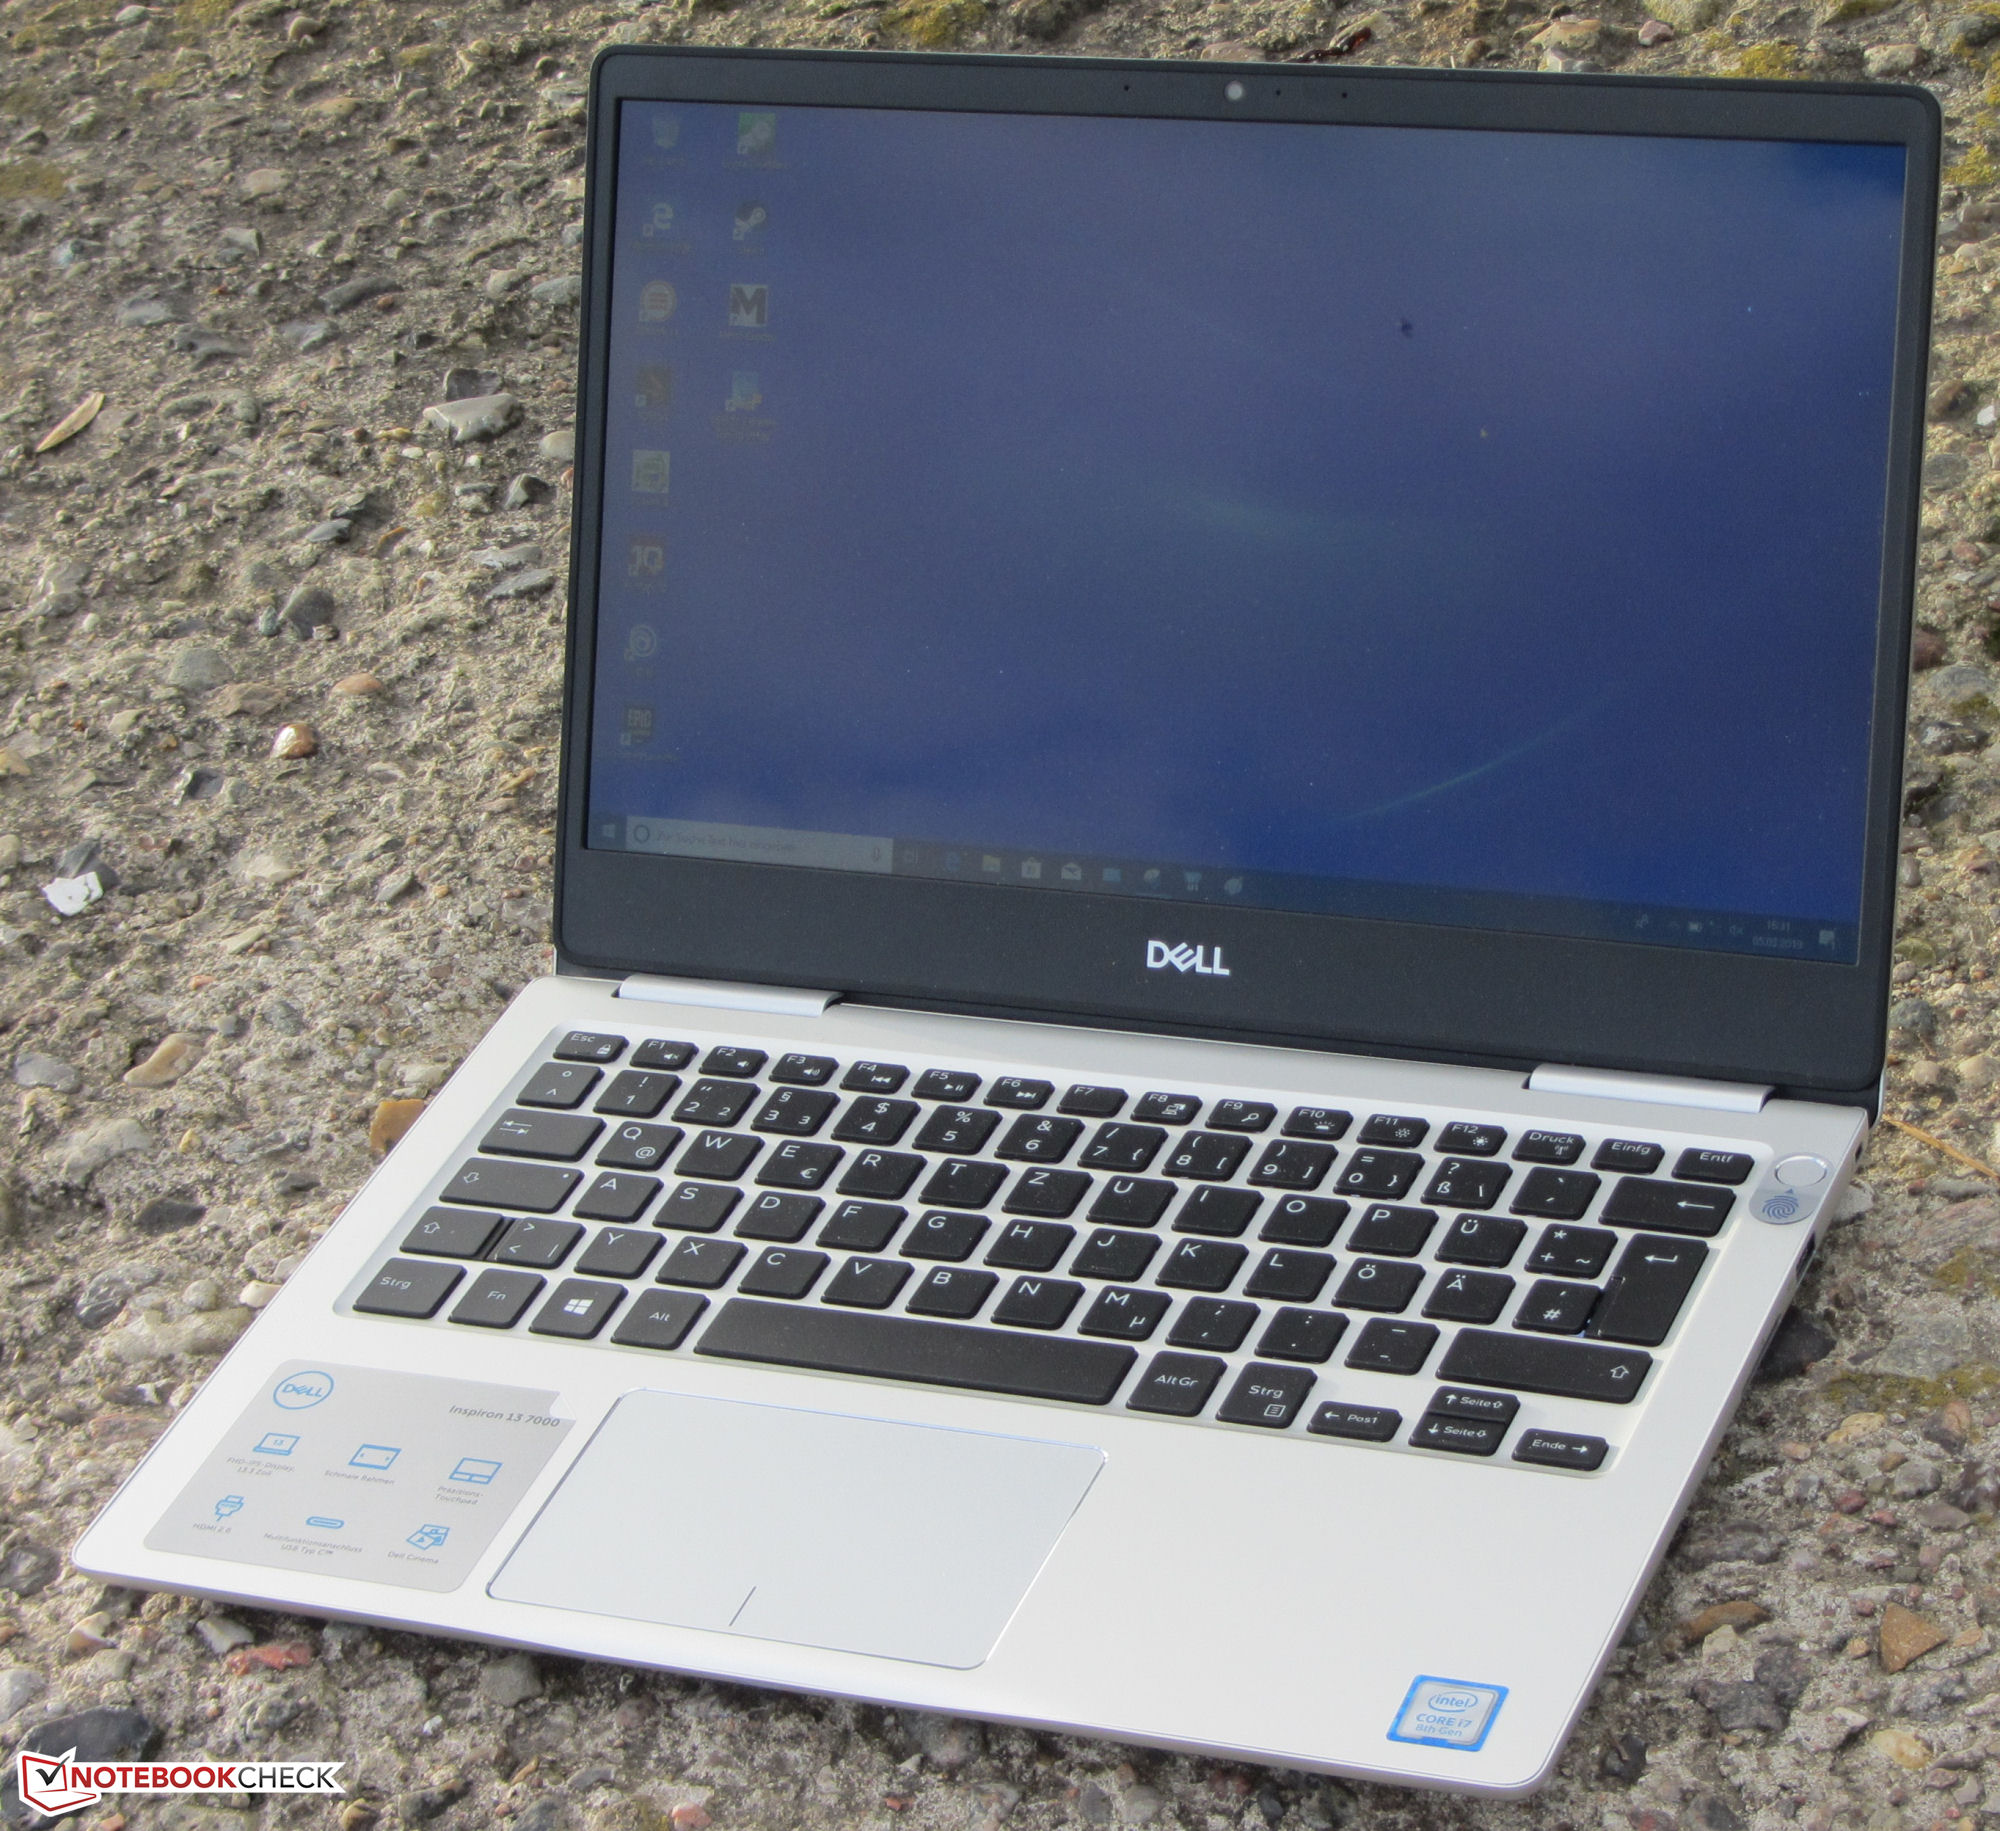
Dell Inspiron 13 7380
- 03/08/2019 v6 (old)
Sascha Mölck
Price comparison
