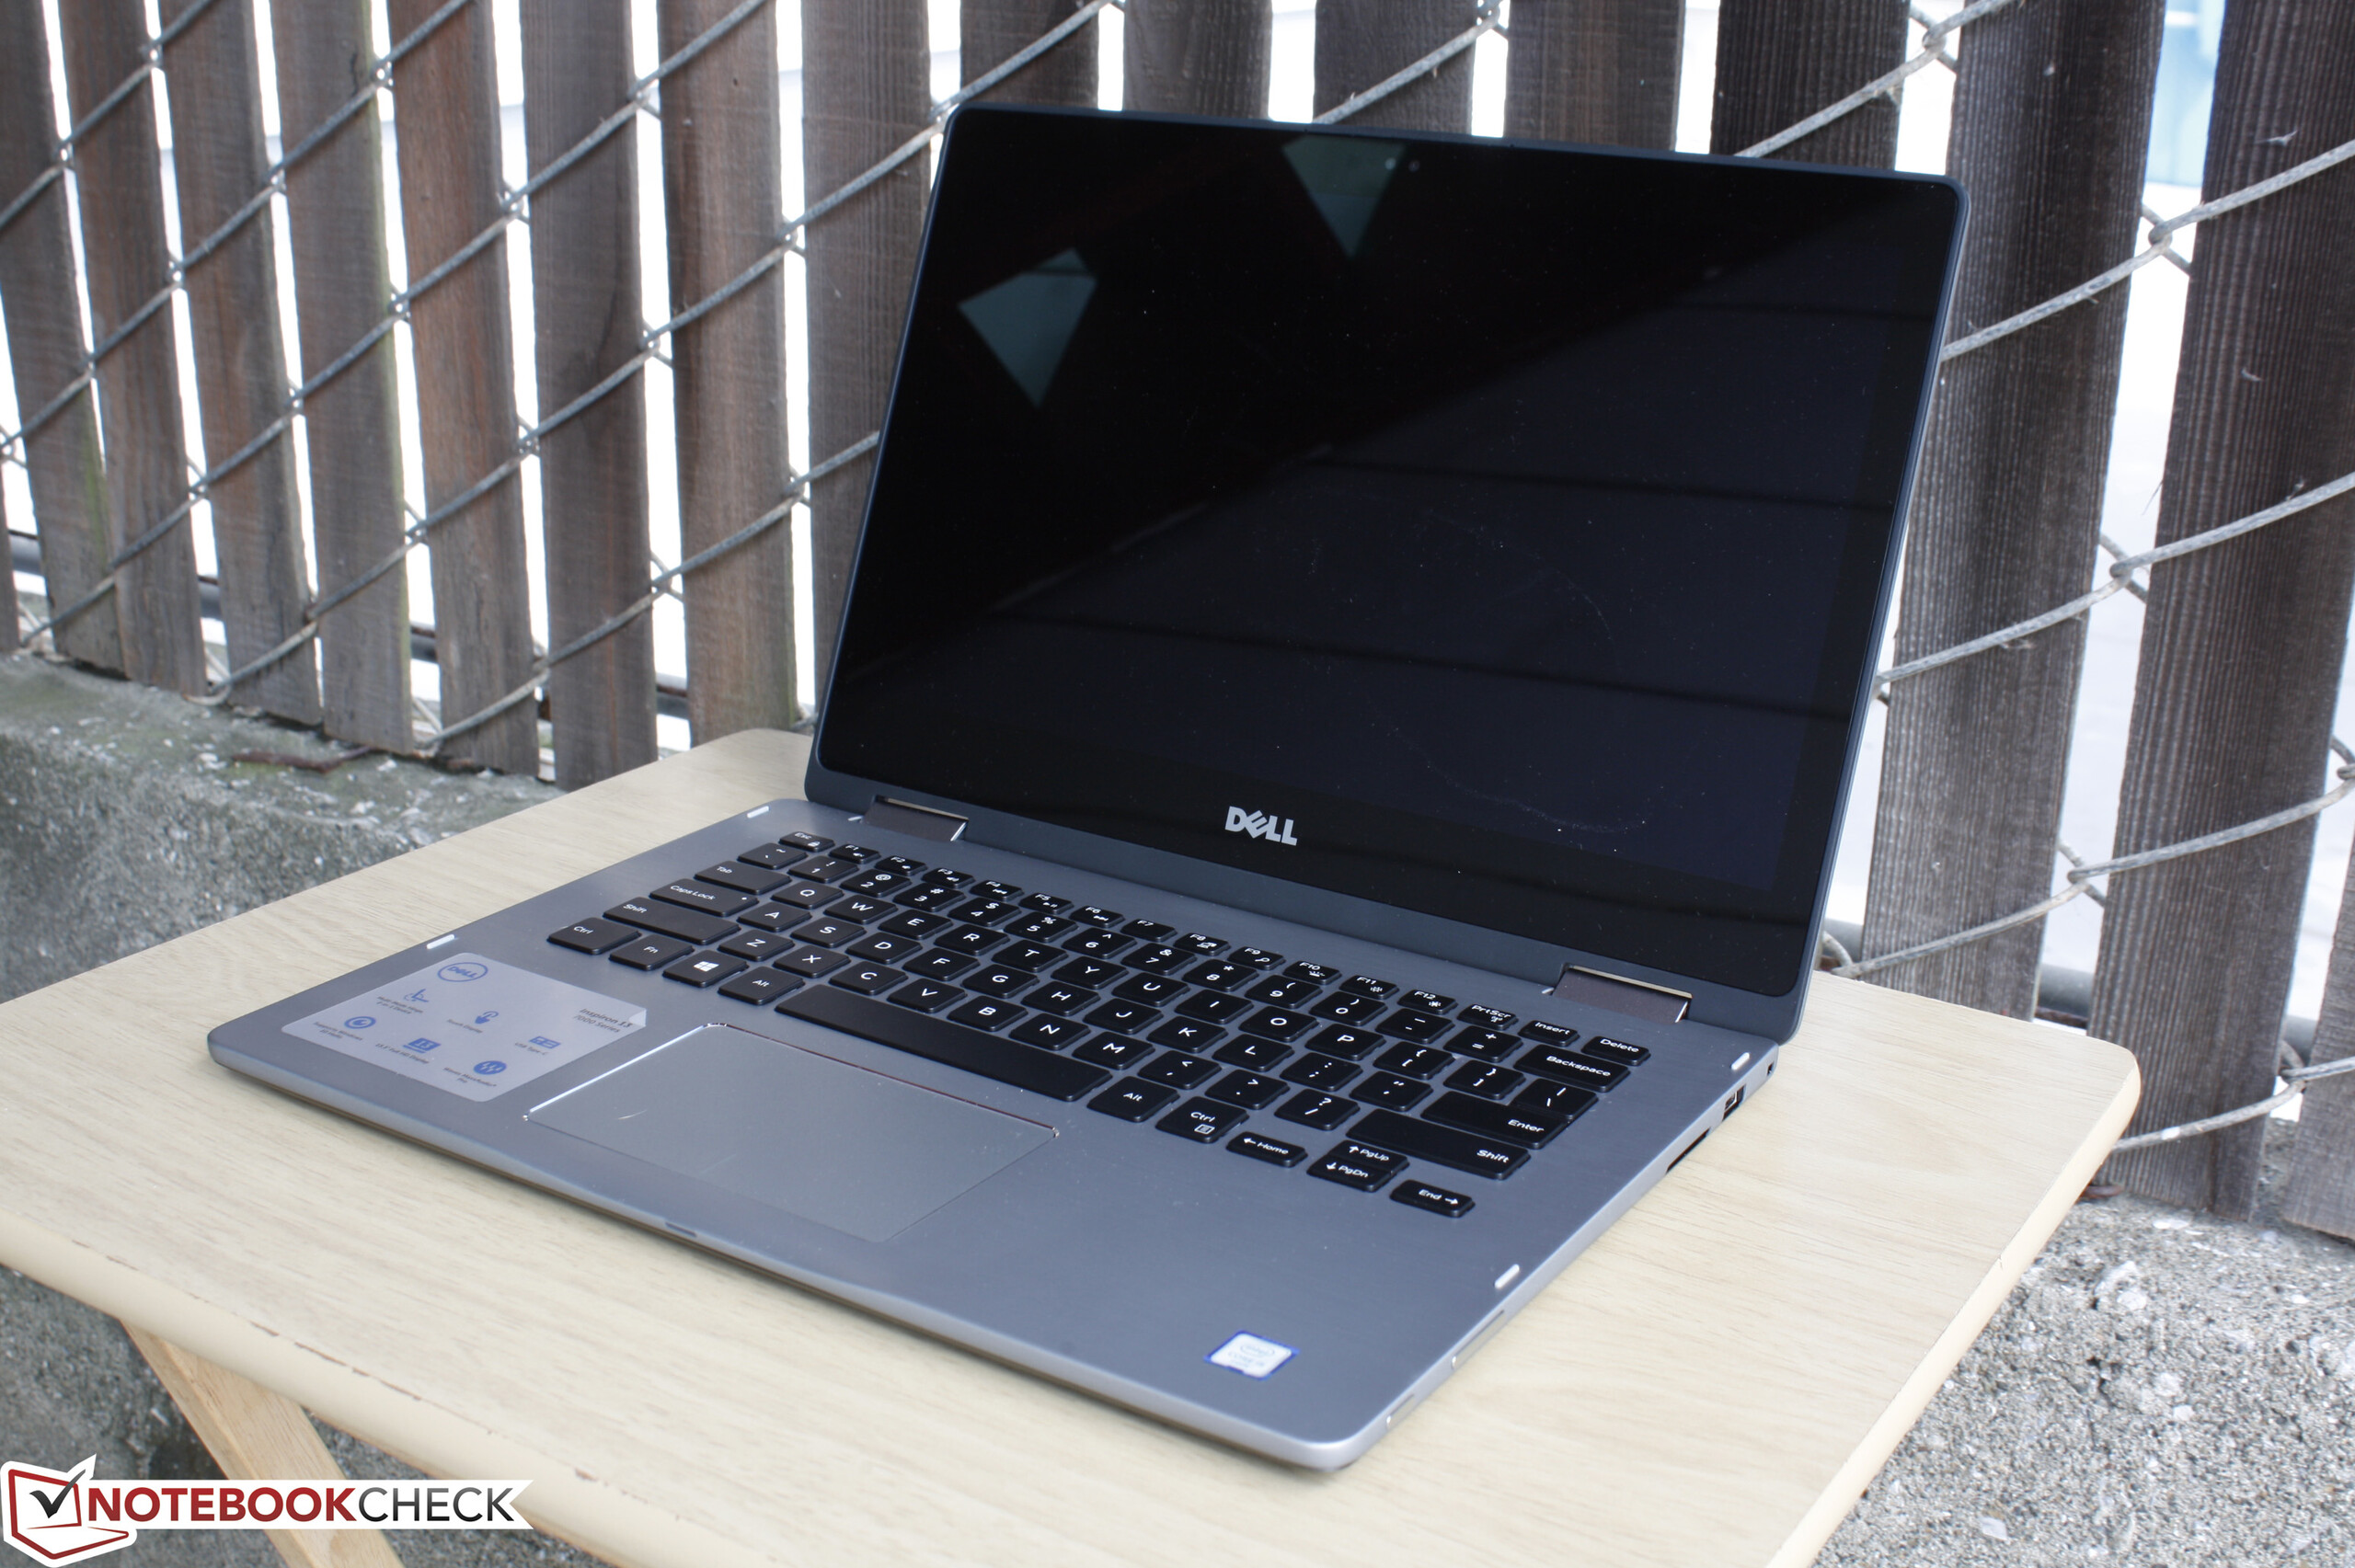
Recensione breve del notebook convertibile Dell Inspiron 13 7368

| SD Card Reader | |
| average JPG Copy Test (av. of 3 runs) | |
| Dell XPS 13 2016 9350 (FHD, i7-6560U) | |
| Apple MacBook Pro Retina 13 inch 2013-10 | |
| Lenovo IdeaPad 710S-13ISK 80SW0031US | |
| Dell Inspiron 13 7386 | |
| maximum AS SSD Seq Read Test (1GB) | |
| Dell XPS 13 2016 9350 (FHD, i7-6560U) | |
| Lenovo IdeaPad 710S-13ISK 80SW0031US | |
| Dell Inspiron 13 7386 | |
| |||||||||||||||||||||||||
Distribuzione della luminosità: 91 %
Al centro con la batteria: 226.4 cd/m²
Contrasto: 858:1 (Nero: 0.264 cd/m²)
ΔE ColorChecker Calman: 4.96 | ∀{0.5-29.43 Ø4.71}
ΔE Greyscale Calman: 3.71 | ∀{0.09-98 Ø4.96}
60.5% sRGB (Argyll 1.6.3 3D)
38.6% AdobeRGB 1998 (Argyll 1.6.3 3D)
42.19% AdobeRGB 1998 (Argyll 3D)
61.1% sRGB (Argyll 3D)
40.82% Display P3 (Argyll 3D)
Gamma: 2.18
CCT: 7215 K
| Dell Inspiron 13 7386 IPS, 13.3", 1920x1080 | Acer Aspire R13 R7-372T-746N Sharp LQ133T1JW02, IPS, 13.3", 2560x1440 | Dell Inspiron 13-7348 IPS, 13.3", 1920x1080 | HP Spectre x360 13-4104ng LG Philips LGD0000, IPS, 13.3", 2560x1440 | Lenovo Yoga 900-13ISK 80MK IPS, 13.3", 3200x1800 | Microsoft Surface Book Core i5 IPS, 13.5", 3000x2000 | |
|---|---|---|---|---|---|---|
| Display | 66% | 57% | 59% | 51% | 61% | |
| Display P3 Coverage (%) | 40.82 | 69.6 71% | 65.2 60% | 66.8 64% | 63.2 55% | 67 64% |
| sRGB Coverage (%) | 61.1 | 98 60% | 93.5 53% | 92.8 52% | 88.7 45% | 95.8 57% |
| AdobeRGB 1998 Coverage (%) | 42.19 | 70.7 68% | 67.1 59% | 67.3 60% | 64.9 54% | 68.9 63% |
| Response Times | 17% | 46% | 27% | 1% | ||
| Response Time Grey 50% / Grey 80% * (ms) | 56 ? | 36 ? 36% | 24 ? 57% | 38.8 ? 31% | 48.4 ? 14% | |
| Response Time Black / White * (ms) | 29.2 ? | 30 ? -3% | 19 ? 35% | 22.4 ? 23% | 32.8 ? -12% | |
| PWM Frequency (Hz) | 203.3 ? | 1000 ? | 1316 | |||
| Screen | 42% | -11% | 19% | -2% | 56% | |
| Brightness middle (cd/m²) | 226.4 | 320 41% | 375 66% | 324 43% | 319.8 41% | 430.9 90% |
| Brightness (cd/m²) | 218 | 308 41% | 351 61% | 324 49% | 302 39% | 410 88% |
| Brightness Distribution (%) | 91 | 91 0% | 89 -2% | 90 -1% | 88 -3% | 93 2% |
| Black Level * (cd/m²) | 0.264 | 0.17 36% | 0.44 -67% | 0.34 -29% | 0.835 -216% | 0.254 4% |
| Contrast (:1) | 858 | 1882 119% | 852 -1% | 953 11% | 383 -55% | 1696 98% |
| Colorchecker dE 2000 * | 4.96 | 3.18 36% | 7.37 -49% | 4.36 12% | 2.68 46% | 2.06 58% |
| Colorchecker dE 2000 max. * | 13 | 9.91 24% | ||||
| Greyscale dE 2000 * | 3.71 | 4.13 -11% | 9.54 -157% | 4.62 -25% | 2.35 37% | 2.22 40% |
| Gamma | 2.18 101% | 2.03 108% | 2.69 82% | 2.18 101% | 2.09 105% | 2.13 103% |
| CCT | 7215 90% | 6752 96% | 6685 97% | 6857 95% | 6975 93% | 6520 100% |
| Color Space (Percent of AdobeRGB 1998) (%) | 38.6 | 65 68% | 61 58% | 60 55% | 57 48% | 64 66% |
| Color Space (Percent of sRGB) (%) | 60.5 | 98 62% | 93 54% | 88 45% | 96 59% | |
| Media totale (Programma / Settaggio) | 42% /
43% | 23% /
7% | 41% /
31% | 25% /
14% | 39% /
49% |
* ... Meglio usare valori piccoli
Tempi di risposta del Display
| ↔ Tempi di risposta dal Nero al Bianco | ||
|---|---|---|
| 29.2 ms ... aumenta ↗ e diminuisce ↘ combinato | ↗ 7.6 ms Incremento | 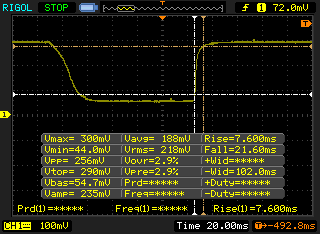 |
| ↘ 21.6 ms Calo | ||
| Lo schermo mostra tempi di risposta relativamente lenti nei nostri tests e potrebbe essere troppo lento per i gamers. In confronto, tutti i dispositivi di test variano da 0.1 (minimo) a 240 (massimo) ms. » 78 % di tutti i dispositivi è migliore. Questo significa che i tempi di risposta rilevati sono peggiori rispetto alla media di tutti i dispositivi testati (19.8 ms). | ||
| ↔ Tempo di risposta dal 50% Grigio all'80% Grigio | ||
| 56 ms ... aumenta ↗ e diminuisce ↘ combinato | ↗ 22.8 ms Incremento | 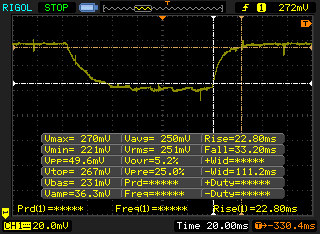 |
| ↘ 33.2 ms Calo | ||
| Lo schermo mostra tempi di risposta lenti nei nostri tests e sarà insoddisfacente per i gamers. In confronto, tutti i dispositivi di test variano da 0.165 (minimo) a 636 (massimo) ms. » 93 % di tutti i dispositivi è migliore. Questo significa che i tempi di risposta rilevati sono peggiori rispetto alla media di tutti i dispositivi testati (31 ms). | ||
Sfarfallio dello schermo / PWM (Pulse-Width Modulation)
| flickering dello schermo / PWM rilevato | 203.3 Hz | ≤ 99 % settaggio luminosita' | 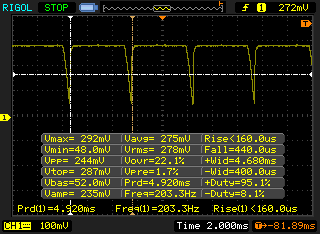 |
Il display sfarfalla a 203.3 Hz (Probabilmente a causa dell'uso di PWM) Flickering rilevato ad una luminosita' di 99 % o inferiore. Non dovrebbe verificarsi flickering o PWM sopra questo valore di luminosita'. La frequenza di 203.3 Hz è relativamente bassa, quindi gli utenti sensibili potrebbero notare il flickering ed accusare stanchezza agli occhi a questo livello di luminosità e a livelli inferiori. In confronto: 52 % di tutti i dispositivi testati non utilizza PWM per ridurre la luminosita' del display. Se è rilevato PWM, una media di 7754 (minimo: 5 - massimo: 343500) Hz è stata rilevata. | |||
* ... Meglio usare valori piccoli
| PCMark 8 Home Score Accelerated v2 | 3223 punti | |
| PCMark 8 Creative Score Accelerated v2 | 4072 punti | |
| PCMark 8 Work Score Accelerated v2 | 4343 punti | |
Aiuto | ||
| Dell Inspiron 13 7386 SanDisk Z400s 256 GB M.2 2280 | Acer Aspire R13 R7-372T-746N Lite-On CV1-8B256 | Dell Inspiron 13-7348 Samsung PM851 Series MZMTE256HMHP | HP Spectre 13-4001ng x360 ADATA AXNS381E-256GM-B | Lenovo Yoga 900-13ISK 80MK Samsung SSD PM871 MZNLN512HCJH | Microsoft Surface Book Core i7 Samsung MZFLV512 NVMe | |
|---|---|---|---|---|---|---|
| CrystalDiskMark 3.0 | 27% | 22% | 22% | 37% | 120% | |
| Read Seq (MB/s) | 493.5 | 507 3% | 514 4% | 475.6 -4% | 514 4% | 953 93% |
| Write Seq (MB/s) | 329.4 | 354.4 8% | 268 -19% | 288.6 -12% | 459.5 39% | 592 80% |
| Read 512 (MB/s) | 289.8 | 355.3 23% | 411.8 42% | 322.9 11% | 413.4 43% | 520 79% |
| Write 512 (MB/s) | 304.1 | 353.9 16% | 268.6 -12% | 285.2 -6% | 424.5 40% | 591 94% |
| Read 4k (MB/s) | 19.62 | 32.66 66% | 26.94 37% | 31.87 62% | 36.34 85% | 42.66 117% |
| Write 4k (MB/s) | 72.3 | 81.6 13% | 74.5 3% | 102.7 42% | 100.1 38% | 136.3 89% |
| Read 4k QD32 (MB/s) | 147.8 | 277.6 88% | 325.9 121% | 276.7 87% | 313.8 112% | 615 316% |
| Write 4k QD32 (MB/s) | 268 | 261.2 -3% | 266.7 0% | 261.6 -2% | 96.8 -64% | 517 93% |

| 3DMark 11 | |
| 1280x720 Performance GPU (ordina per valore) | |
| Dell Inspiron 13 7386 | |
| Acer TravelMate P278-MG-76L2 | |
| Toshiba Tecra Z40-C-11F | |
| Dell Latitude 3470 N2P7L347014EMEA | |
| Fujitsu Lifebook E544 | |
| Asus Transformer Book T300LA-C4006H | |
| 1280x720 Performance Combined (ordina per valore) | |
| Dell Inspiron 13 7386 | |
| Acer TravelMate P278-MG-76L2 | |
| Toshiba Tecra Z40-C-11F | |
| Dell Latitude 3470 N2P7L347014EMEA | |
| Fujitsu Lifebook E544 | |
| Asus Transformer Book T300LA-C4006H | |
| 3DMark | |
| 1280x720 Cloud Gate Standard Graphics (ordina per valore) | |
| Dell Inspiron 13 7386 | |
| Acer TravelMate P278-MG-76L2 | |
| Toshiba Tecra Z40-C-11F | |
| Dell Latitude 3470 N2P7L347014EMEA | |
| Fujitsu Lifebook E544 | |
| Asus Transformer Book T300LA-C4006H | |
| 1920x1080 Fire Strike Graphics (ordina per valore) | |
| Dell Inspiron 13 7386 | |
| Acer TravelMate P278-MG-76L2 | |
| Toshiba Tecra Z40-C-11F | |
| Dell Latitude 3470 N2P7L347014EMEA | |
| Asus Transformer Book T300LA-C4006H | |
| 1920x1080 Ice Storm Extreme Graphics (ordina per valore) | |
| Dell Inspiron 13 7386 | |
| Acer TravelMate P278-MG-76L2 | |
| Toshiba Tecra Z40-C-11F | |
| Dell Latitude 3470 N2P7L347014EMEA | |
| 3DMark 11 Performance | 1615 punti | |
| 3DMark Ice Storm Standard Score | 55696 punti | |
| 3DMark Cloud Gate Standard Score | 5941 punti | |
| 3DMark Fire Strike Score | 882 punti | |
| 3DMark Fire Strike Extreme Score | 401 punti | |
Aiuto | ||
| BioShock Infinite | |
| 1366x768 Medium Preset | |
| Acer TravelMate P278-MG-76L2 | |
| Intel NUC6i5SYH | |
| Dell Inspiron 13 7386 | |
| Dell Latitude 3470 N2P7L347014EMEA | |
| Lenovo B50-70 MCC2GGE | |
| Fujitsu Lifebook E544 | |
| 1366x768 High Preset | |
| Acer TravelMate P278-MG-76L2 | |
| Intel NUC6i5SYH | |
| Dell Inspiron 13 7386 | |
| Dell Latitude 3470 N2P7L347014EMEA | |
| Lenovo B50-70 MCC2GGE | |
| Fujitsu Lifebook E544 | |
| basso | medio | alto | ultra | |
|---|---|---|---|---|
| StarCraft II: Heart of the Swarm (2013) | 156.2 | 52.5 | 35.5 | 18.4 |
| BioShock Infinite (2013) | 31.3 | 19.5 | 16.7 | 7.1 |
| Overwatch (2016) | 34.1 | 24.8 | 15.8 |
Rumorosità
| Idle |
| 29.4 / 29.4 / 29.4 dB(A) |
| Sotto carico |
| 32.2 / 35 dB(A) |
 | ||
30 dB silenzioso 40 dB(A) udibile 50 dB(A) rumoroso |
||
min: | ||
| Dell Inspiron 13 7386 HD Graphics 520, 6200U, SanDisk Z400s 256 GB M.2 2280 | Acer Aspire R13 R7-372T-746N HD Graphics 520, 6500U, Lite-On CV1-8B256 | Dell Inspiron 13-7348 HD Graphics 5500, 5500U, Samsung PM851 Series MZMTE256HMHP | HP Spectre x360 13-4104ng HD Graphics 520, 6200U, Samsung SSD PM851 256 GB MZNTE256HMHP | Lenovo Yoga 900-13ISK 80MK HD Graphics 520, 6500U, Samsung SSD PM871 MZNLN512HCJH | Microsoft Surface Book Core i7 Maxwell GPU (940M, GDDR5), 6600U, Samsung MZFLV512 NVMe | |
|---|---|---|---|---|---|---|
| Noise | -10% | -6% | -7% | -3% | -10% | |
| off /ambiente * (dB) | 29.4 | 31.3 -6% | 31.3 -6% | |||
| Idle Minimum * (dB) | 29.4 | 31.3 -6% | 29.6 -1% | 29.6 -1% | 29.7 -1% | 31.3 -6% |
| Idle Average * (dB) | 29.4 | 31.3 -6% | 29.6 -1% | 29.6 -1% | 29.8 -1% | 31.3 -6% |
| Idle Maximum * (dB) | 29.4 | 31.8 -8% | 29.6 -1% | 34.6 -18% | 30 -2% | 31.3 -6% |
| Load Average * (dB) | 32.2 | 39.2 -22% | 35.4 -10% | 34.7 -8% | 32 1% | 38 -18% |
| Load Maximum * (dB) | 35 | 39.1 -12% | 41.4 -18% | 37.9 -8% | 38.5 -10% | 40.5 -16% |
* ... Meglio usare valori piccoli
(±) La temperatura massima sul lato superiore è di 43.2 °C / 110 F, rispetto alla media di 35.4 °C / 96 F, che varia da 19.6 a 60 °C per questa classe Convertible.
(-) Il lato inferiore si riscalda fino ad un massimo di 45.2 °C / 113 F, rispetto alla media di 36.9 °C / 98 F
(+) In idle, la temperatura media del lato superiore è di 26.3 °C / 79 F, rispetto alla media deld ispositivo di 30.3 °C / 87 F.
(+) I poggiapolsi e il touchpad raggiungono la temperatura massima della pelle (33.6 °C / 92.5 F) e quindi non sono caldi.
(-) La temperatura media della zona del palmo della mano di dispositivi simili e'stata di 28 °C / 82.4 F (-5.6 °C / -10.1 F).
| Off / Standby | |
| Idle | |
| Sotto carico |
|
Leggenda:
min: | |
| Dell Inspiron 13 7386 6200U, HD Graphics 520, SanDisk Z400s 256 GB M.2 2280, IPS, 1920x1080, 13.3" | Acer Aspire R13 R7-372T-746N 6500U, HD Graphics 520, Lite-On CV1-8B256, IPS, 2560x1440, 13.3" | Dell Inspiron 13-7348 5500U, HD Graphics 5500, Samsung PM851 Series MZMTE256HMHP, IPS, 1920x1080, 13.3" | HP Spectre x360 13-4104ng 6200U, HD Graphics 520, Samsung SSD PM851 256 GB MZNTE256HMHP, IPS, 2560x1440, 13.3" | HP Spectre 13 6500U, HD Graphics 520, Samsung PM951 NVMe MZVLV256, IPS UWVA, 1920x1080, 13.3" | Microsoft Surface Book Core i7 6600U, Maxwell GPU (940M, GDDR5), Samsung MZFLV512 NVMe, IPS, 3000x2000, 13.5" | |
|---|---|---|---|---|---|---|
| Power Consumption | -37% | 8% | -3% | -50% | -54% | |
| Idle Minimum * (Watt) | 4.6 | 6.2 -35% | 3.5 24% | 3.9 15% | 8.6 -87% | 4.5 2% |
| Idle Average * (Watt) | 7 | 8 -14% | 5.6 20% | 7.4 -6% | 11 -57% | 9.8 -40% |
| Idle Maximum * (Watt) | 7.7 | 11.6 -51% | 7.6 1% | 9.2 -19% | 11.3 -47% | 12.2 -58% |
| Load Average * (Watt) | 24.8 | 40 -61% | 26.3 -6% | 28.1 -13% | 33.8 -36% | 46 -85% |
| Load Maximum * (Watt) | 29.3 | 36.6 -25% | 29 1% | 27.6 6% | 36.2 -24% | 56 -91% |
* ... Meglio usare valori piccoli
| Dell Inspiron 13 7386 6200U, HD Graphics 520, 42 Wh | Acer Aspire R13 R7-372T-746N 6500U, HD Graphics 520, 49 Wh | Dell Inspiron 13-7348 5500U, HD Graphics 5500, 43 Wh | HP Spectre x360 13-4104ng 6200U, HD Graphics 520, 56 Wh | Lenovo Yoga 900-13ISK 80MK 6500U, HD Graphics 520, 66 Wh | Microsoft Surface Book Core i5 6300U, Maxwell GPU (940M, GDDR5), 78 Wh | |
|---|---|---|---|---|---|---|
| Autonomia della batteria | -9% | -19% | 32% | 14% | 33% | |
| Reader / Idle (h) | 12.6 | 11.2 -11% | 8.7 -31% | 14.1 12% | 17.8 41% | |
| WiFi v1.3 (h) | 6.3 | 6.4 2% | 8.3 32% | 6.7 6% | 6.7 6% | |
| Load (h) | 1.7 | 1.4 -18% | 1.6 -6% | 2.1 24% | 2.6 53% | |
| WiFi (h) | 6.6 |
Pro
Contro
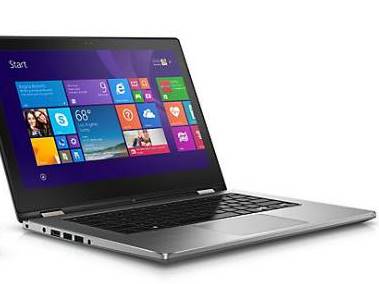
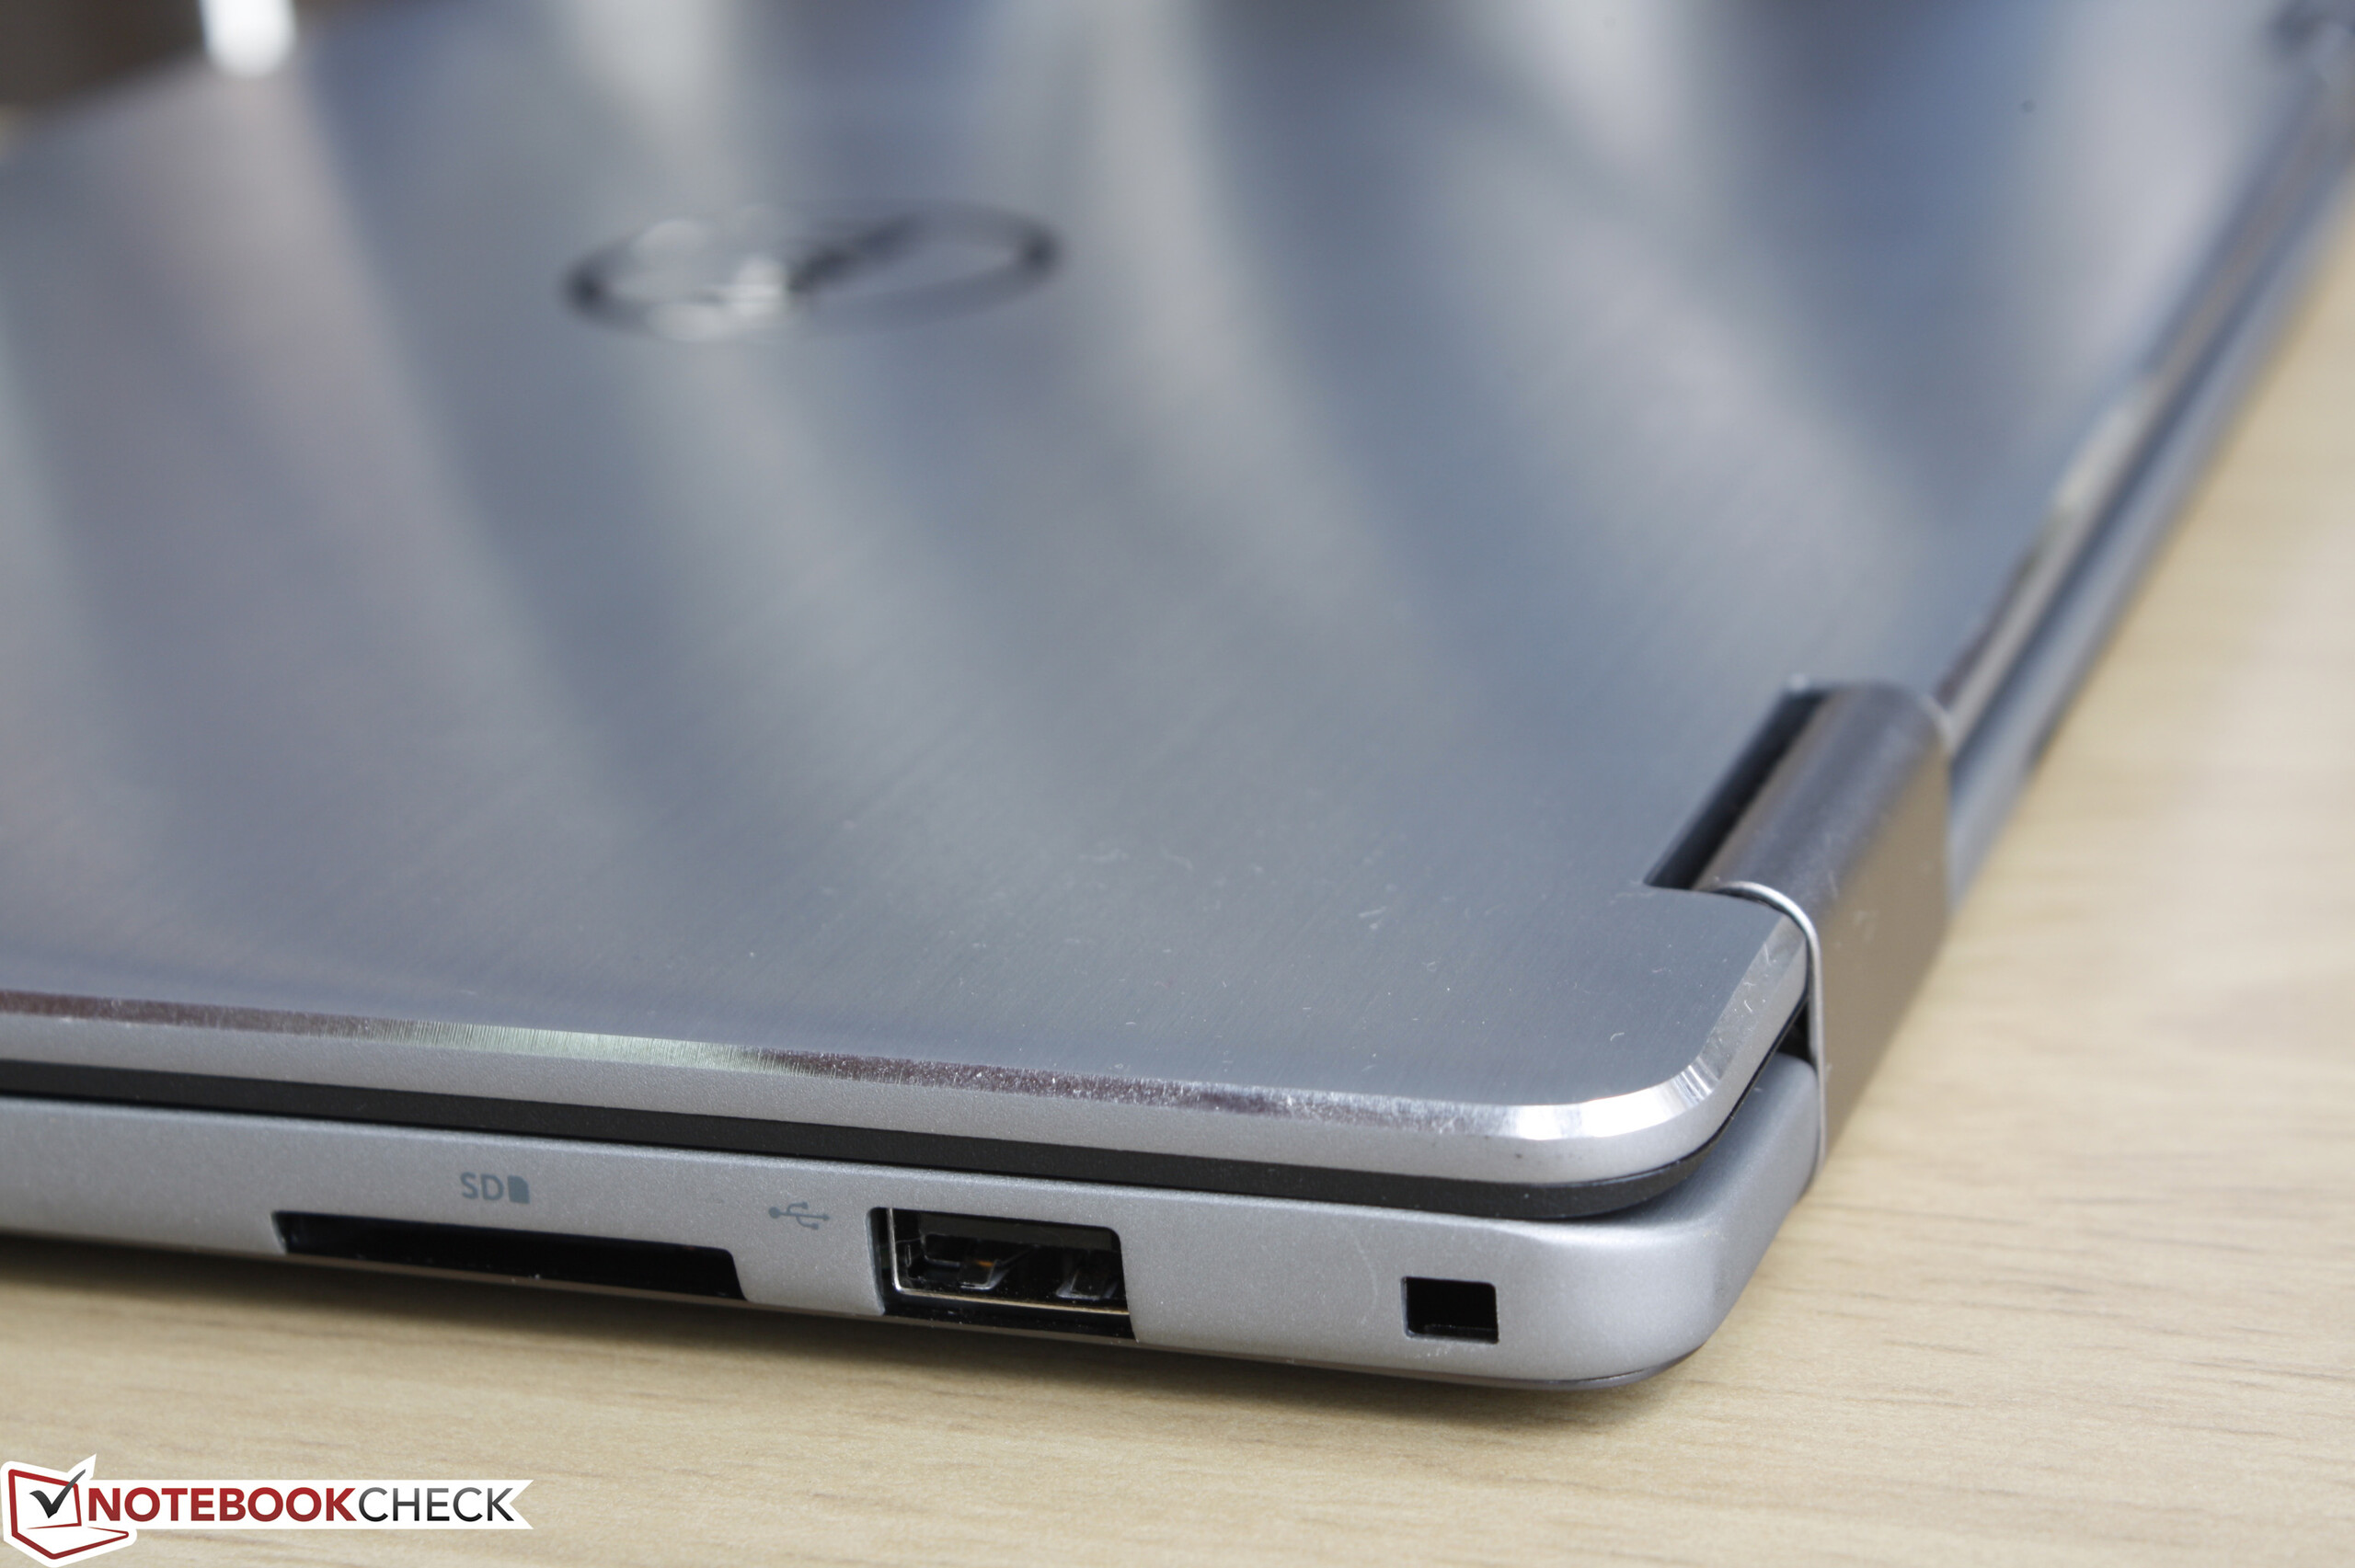
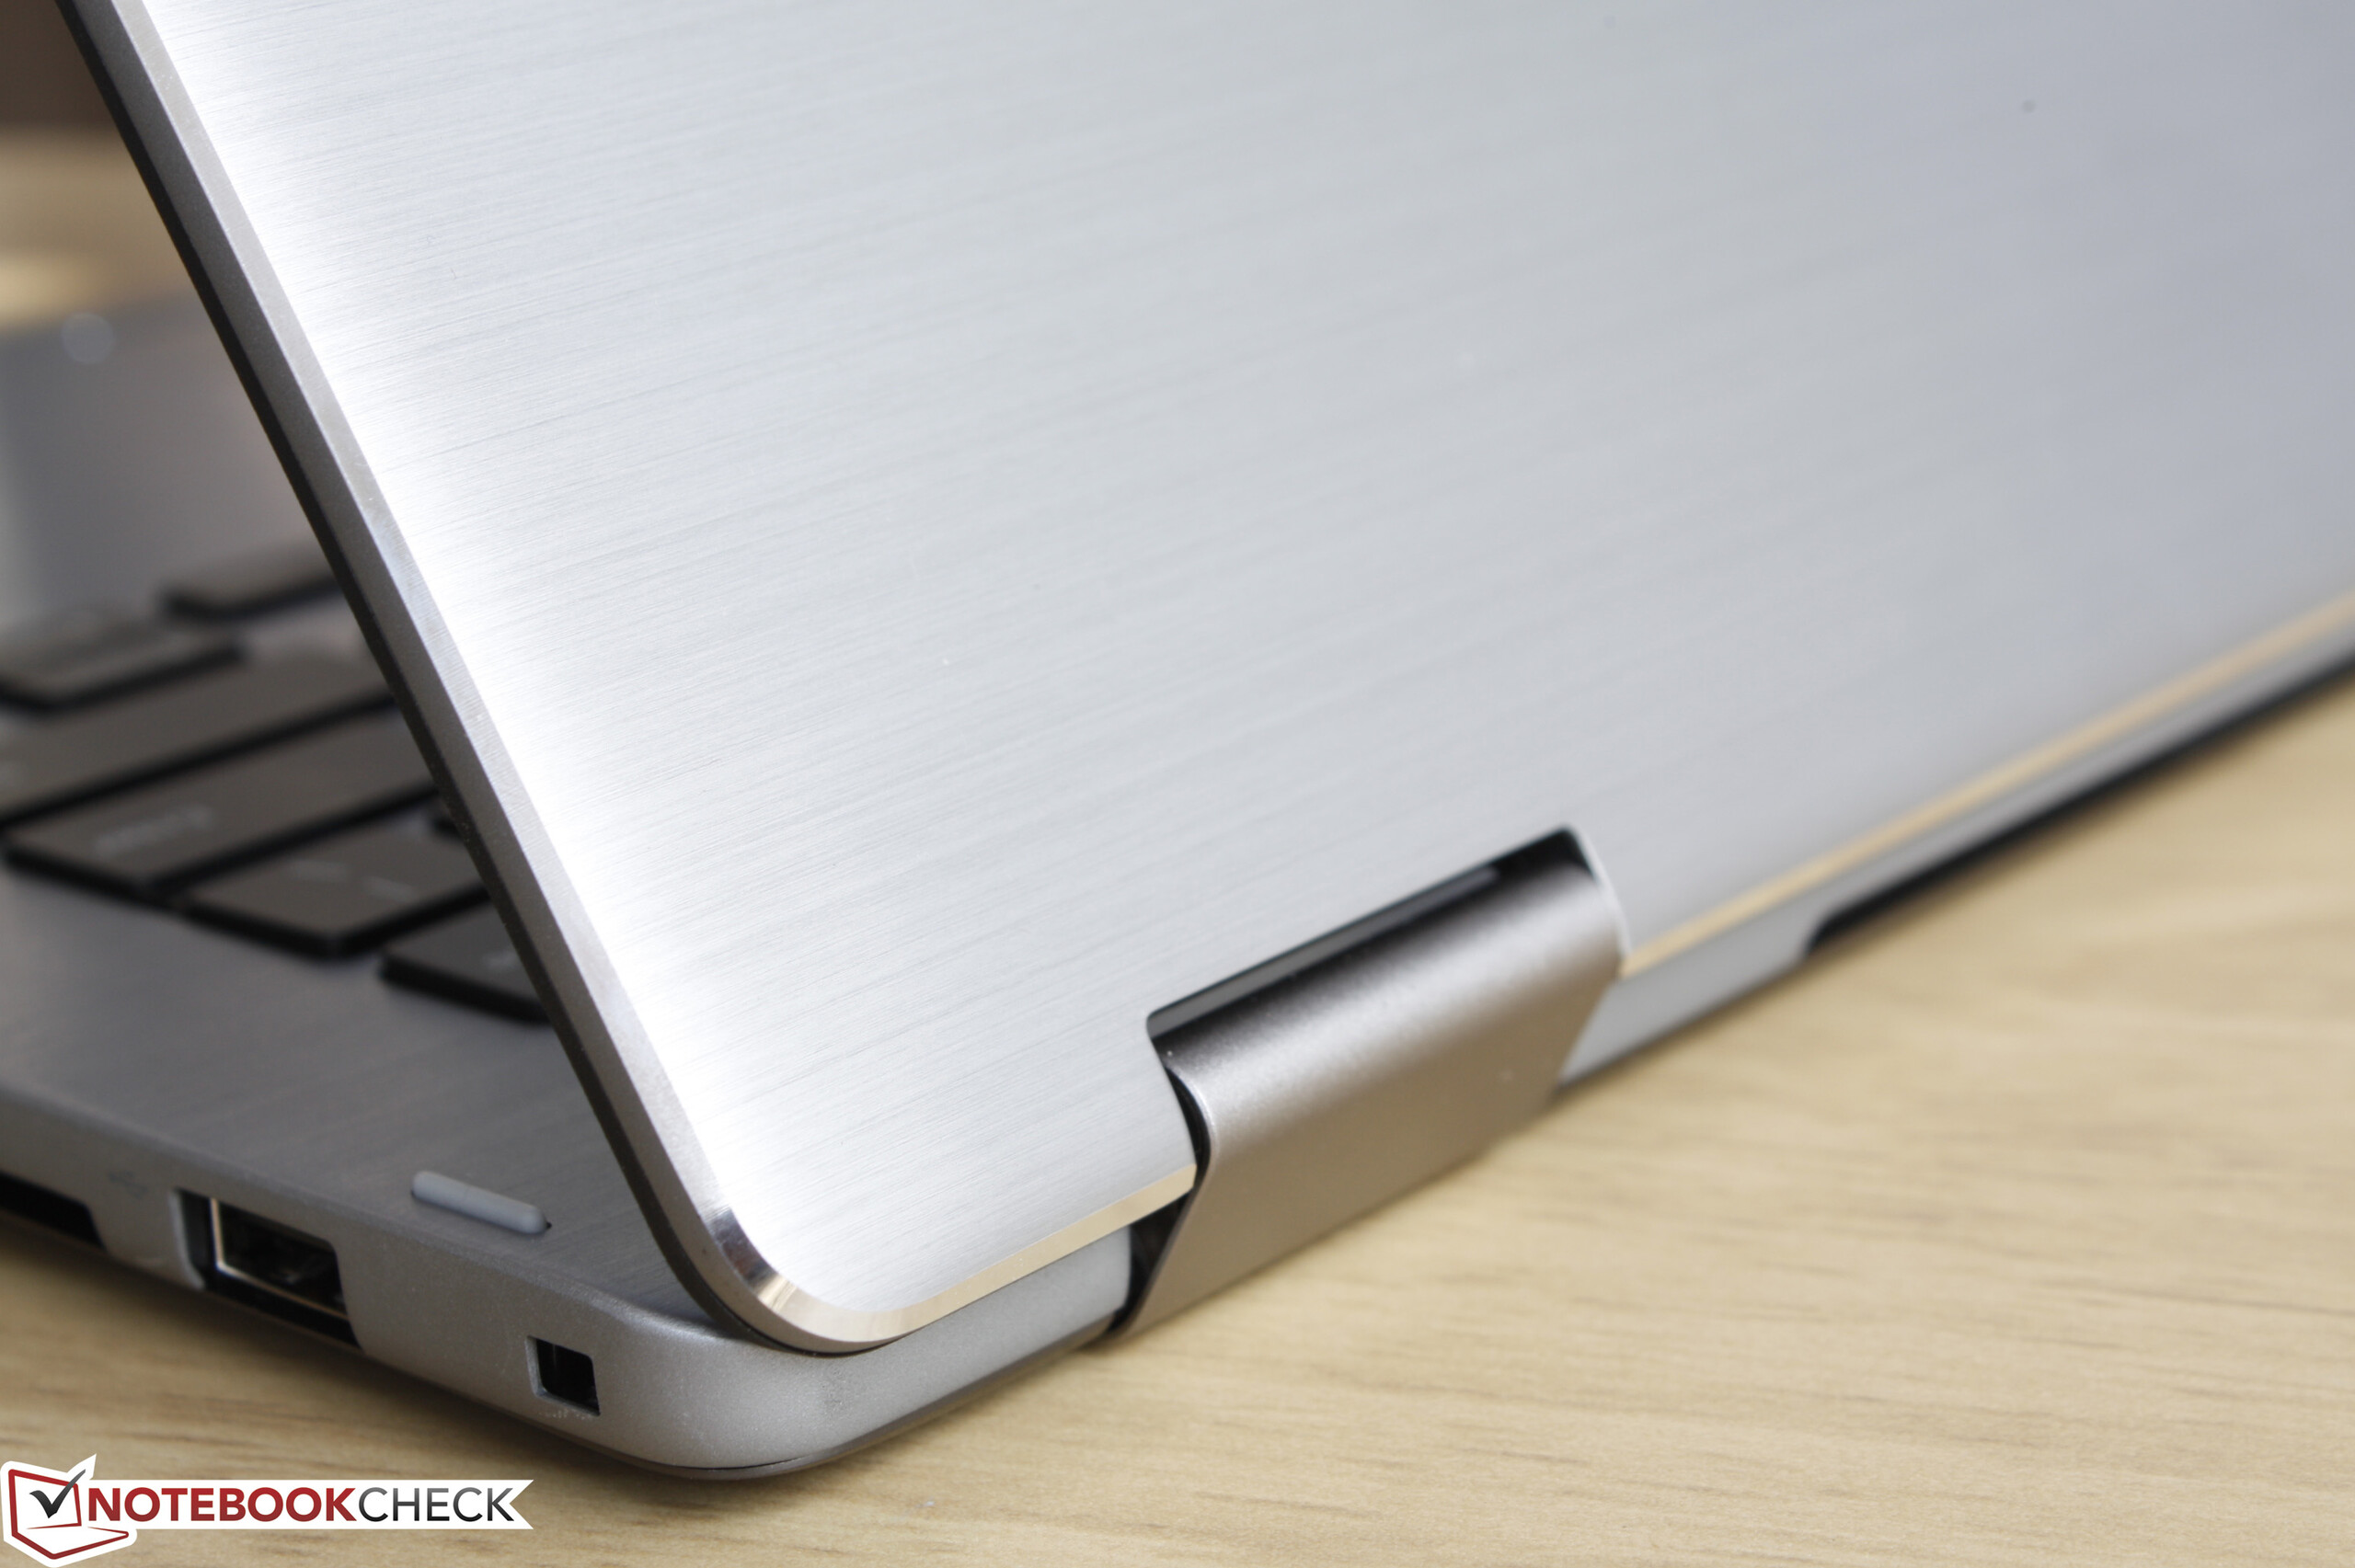
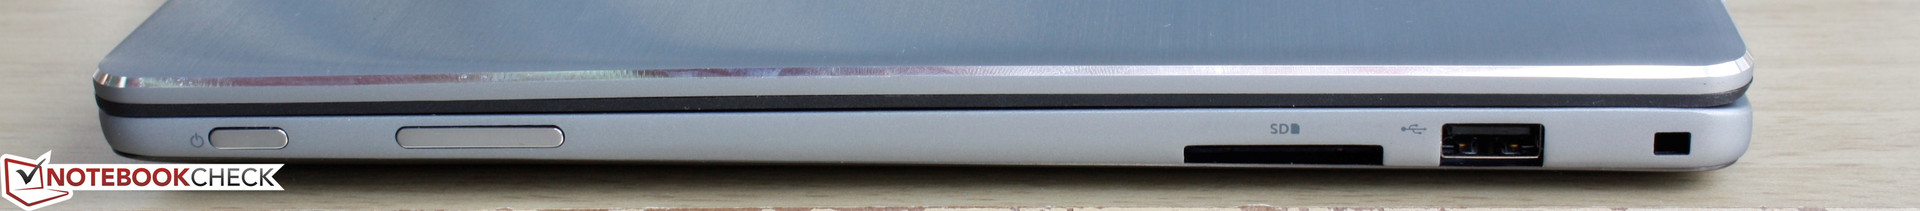
L'Inspiron 13 7368 è più silenzioso e ha un aspetto migliore rispetto al predecessore Inspiron 7348. Sfortunatamente, è piuttosto pesante e la luminosità del display è inferiore, quindi la sua utilità come tablet Windows si limita sostanzialmente agli ambienti interni. I tasti della tastiera sono troppo "morbidi" e il sistema ha meno porte USB a disposizione. Inoltre, le dimensioni leggermente inferiori e l'aggiunta di una porta USB Type-C non ci sembrano sufficienti per raccomandare questo modello rispetto al vecchio.
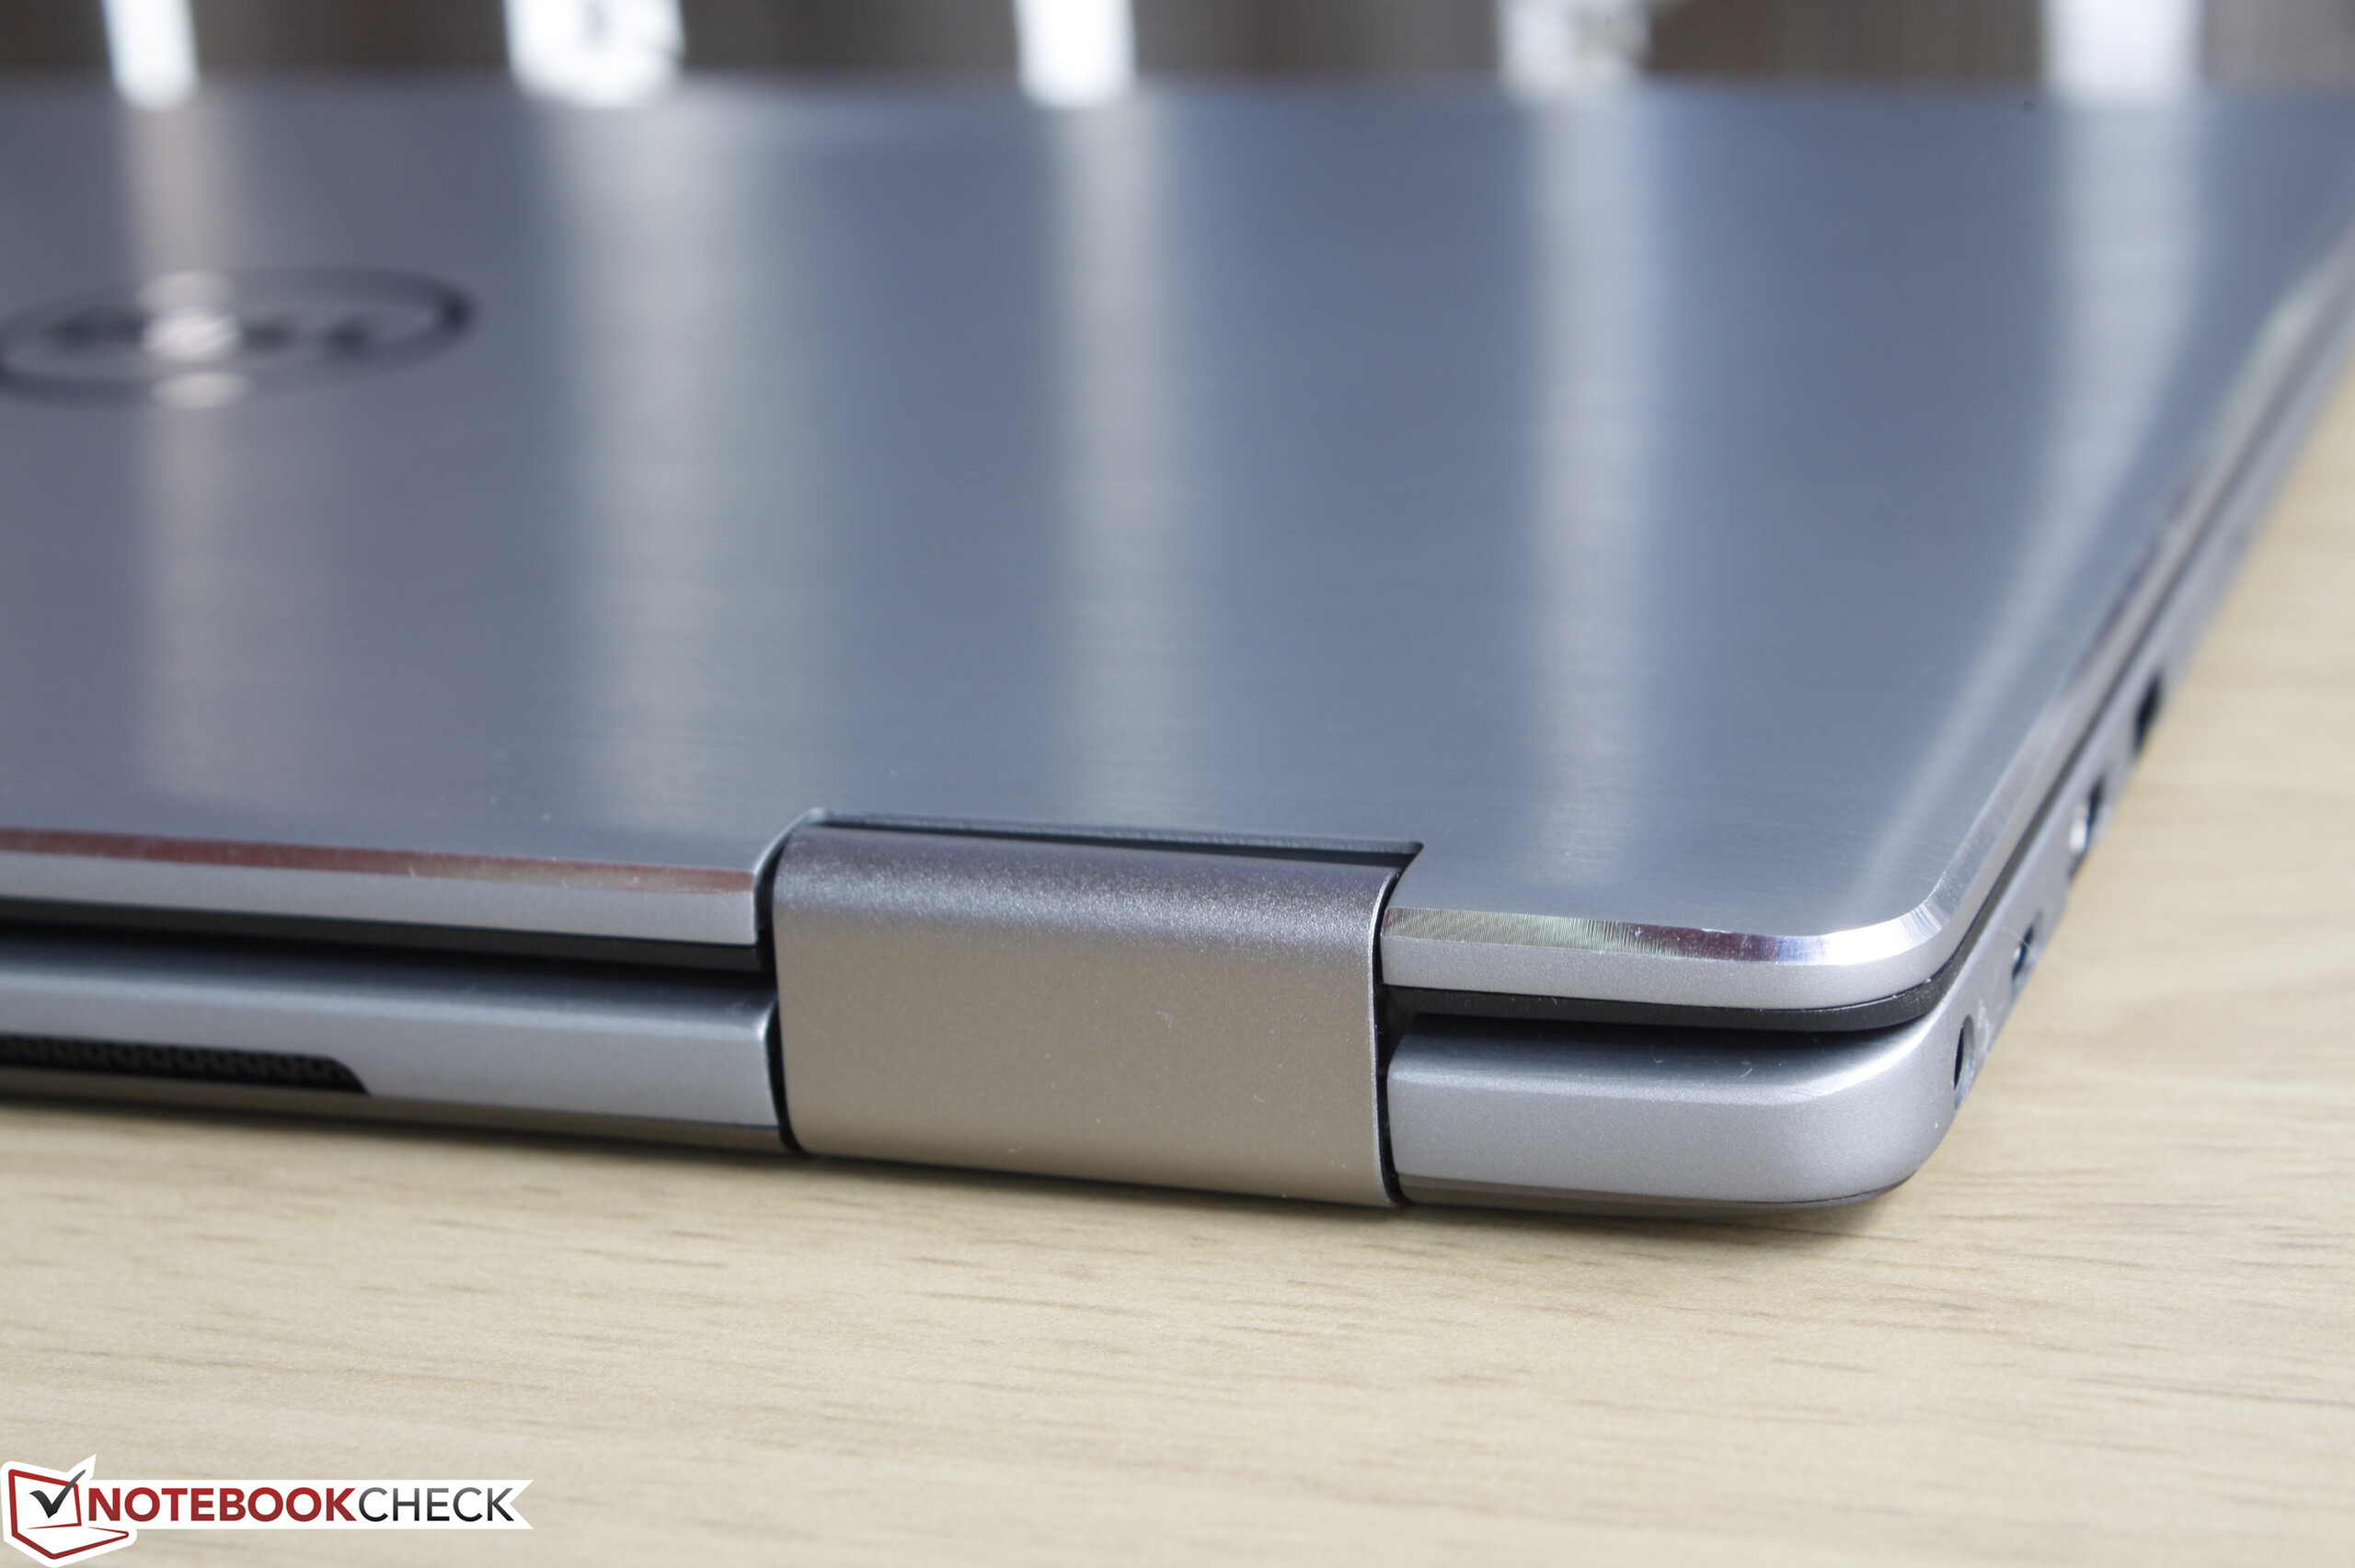
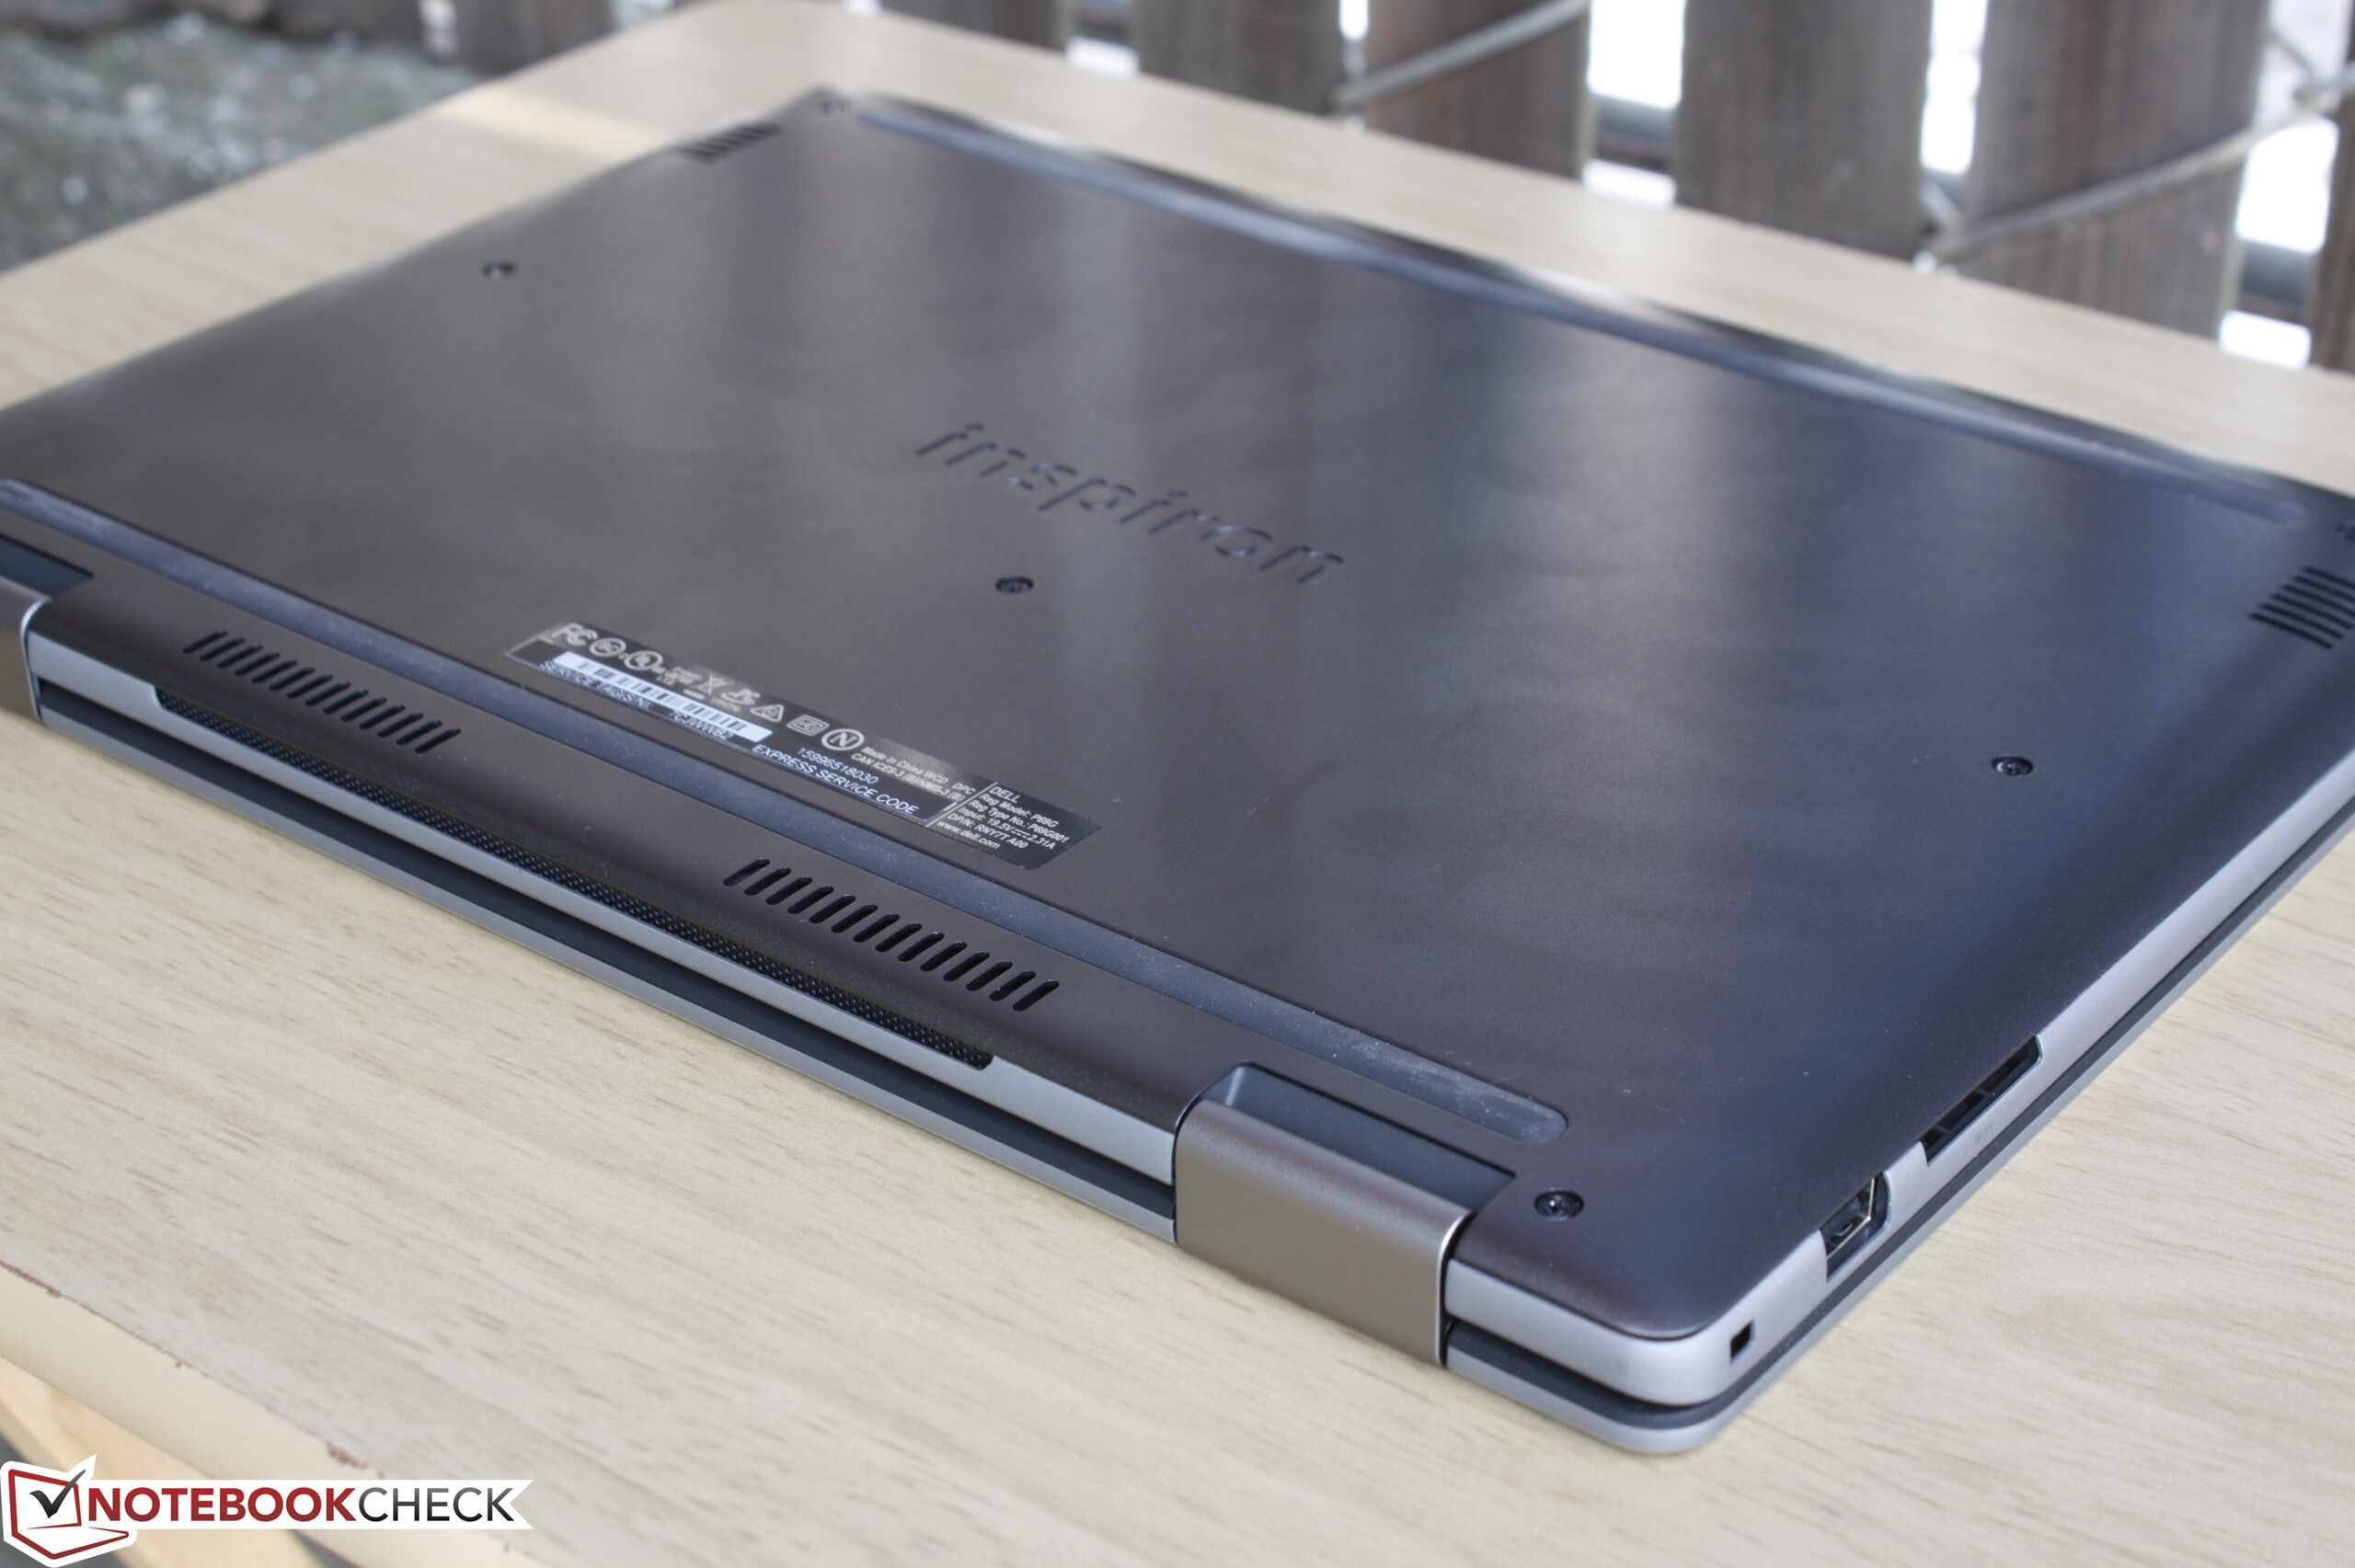
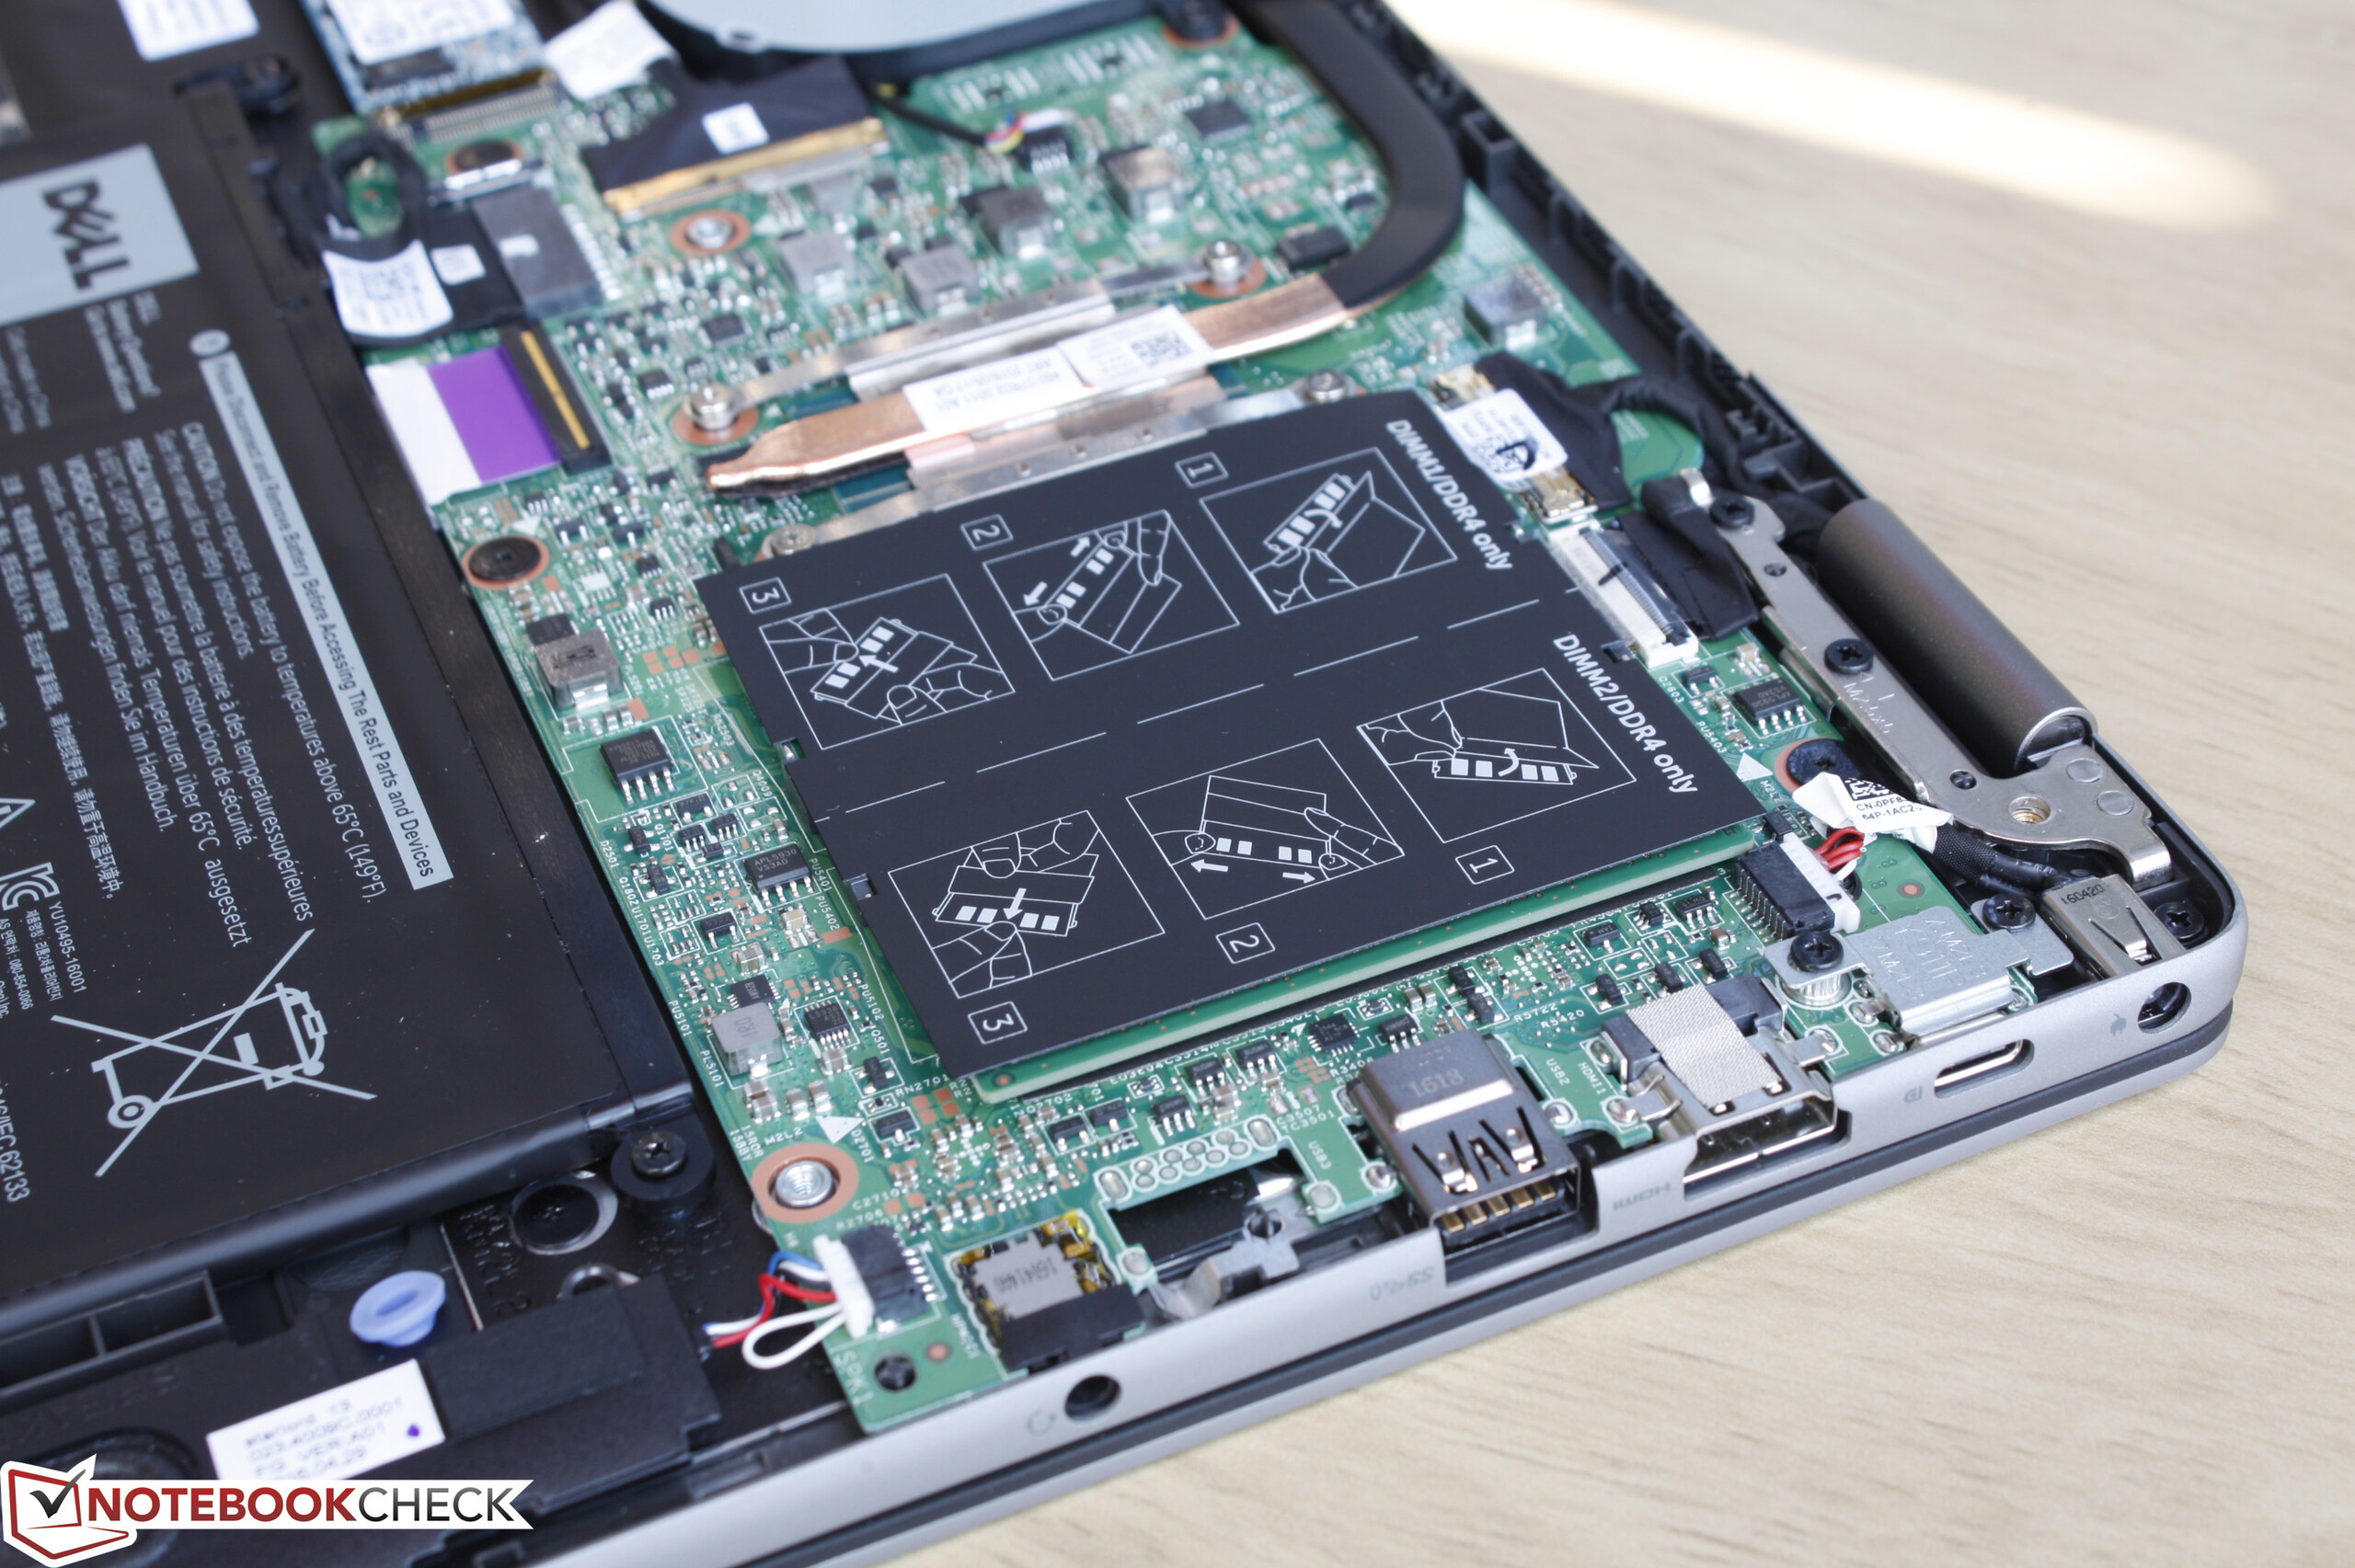
I difetti, comunque, non eliminano il fatto che questo dispositivo è dotato di un ottimo design, molto robusto, con una manutenzione abbastanza semplice e ottimi altoparlanti. Può sicuramente sostituire un vecchio notebook, ma gli utenti che non necessitano di una modalità tablet troveranno l'XPS 13 di gran lunga superiore rispetto all'Inspiron 13 7368 in portabilità e usabilità. Allo stesso modo, gli utenti che desiderano acquistare un convertibile da 13 pollici potrebbero trovare che la maggior parte dei modelli rivali sono sia più leggeri che di dimensioni più ridotte per un trasporto più comodo.
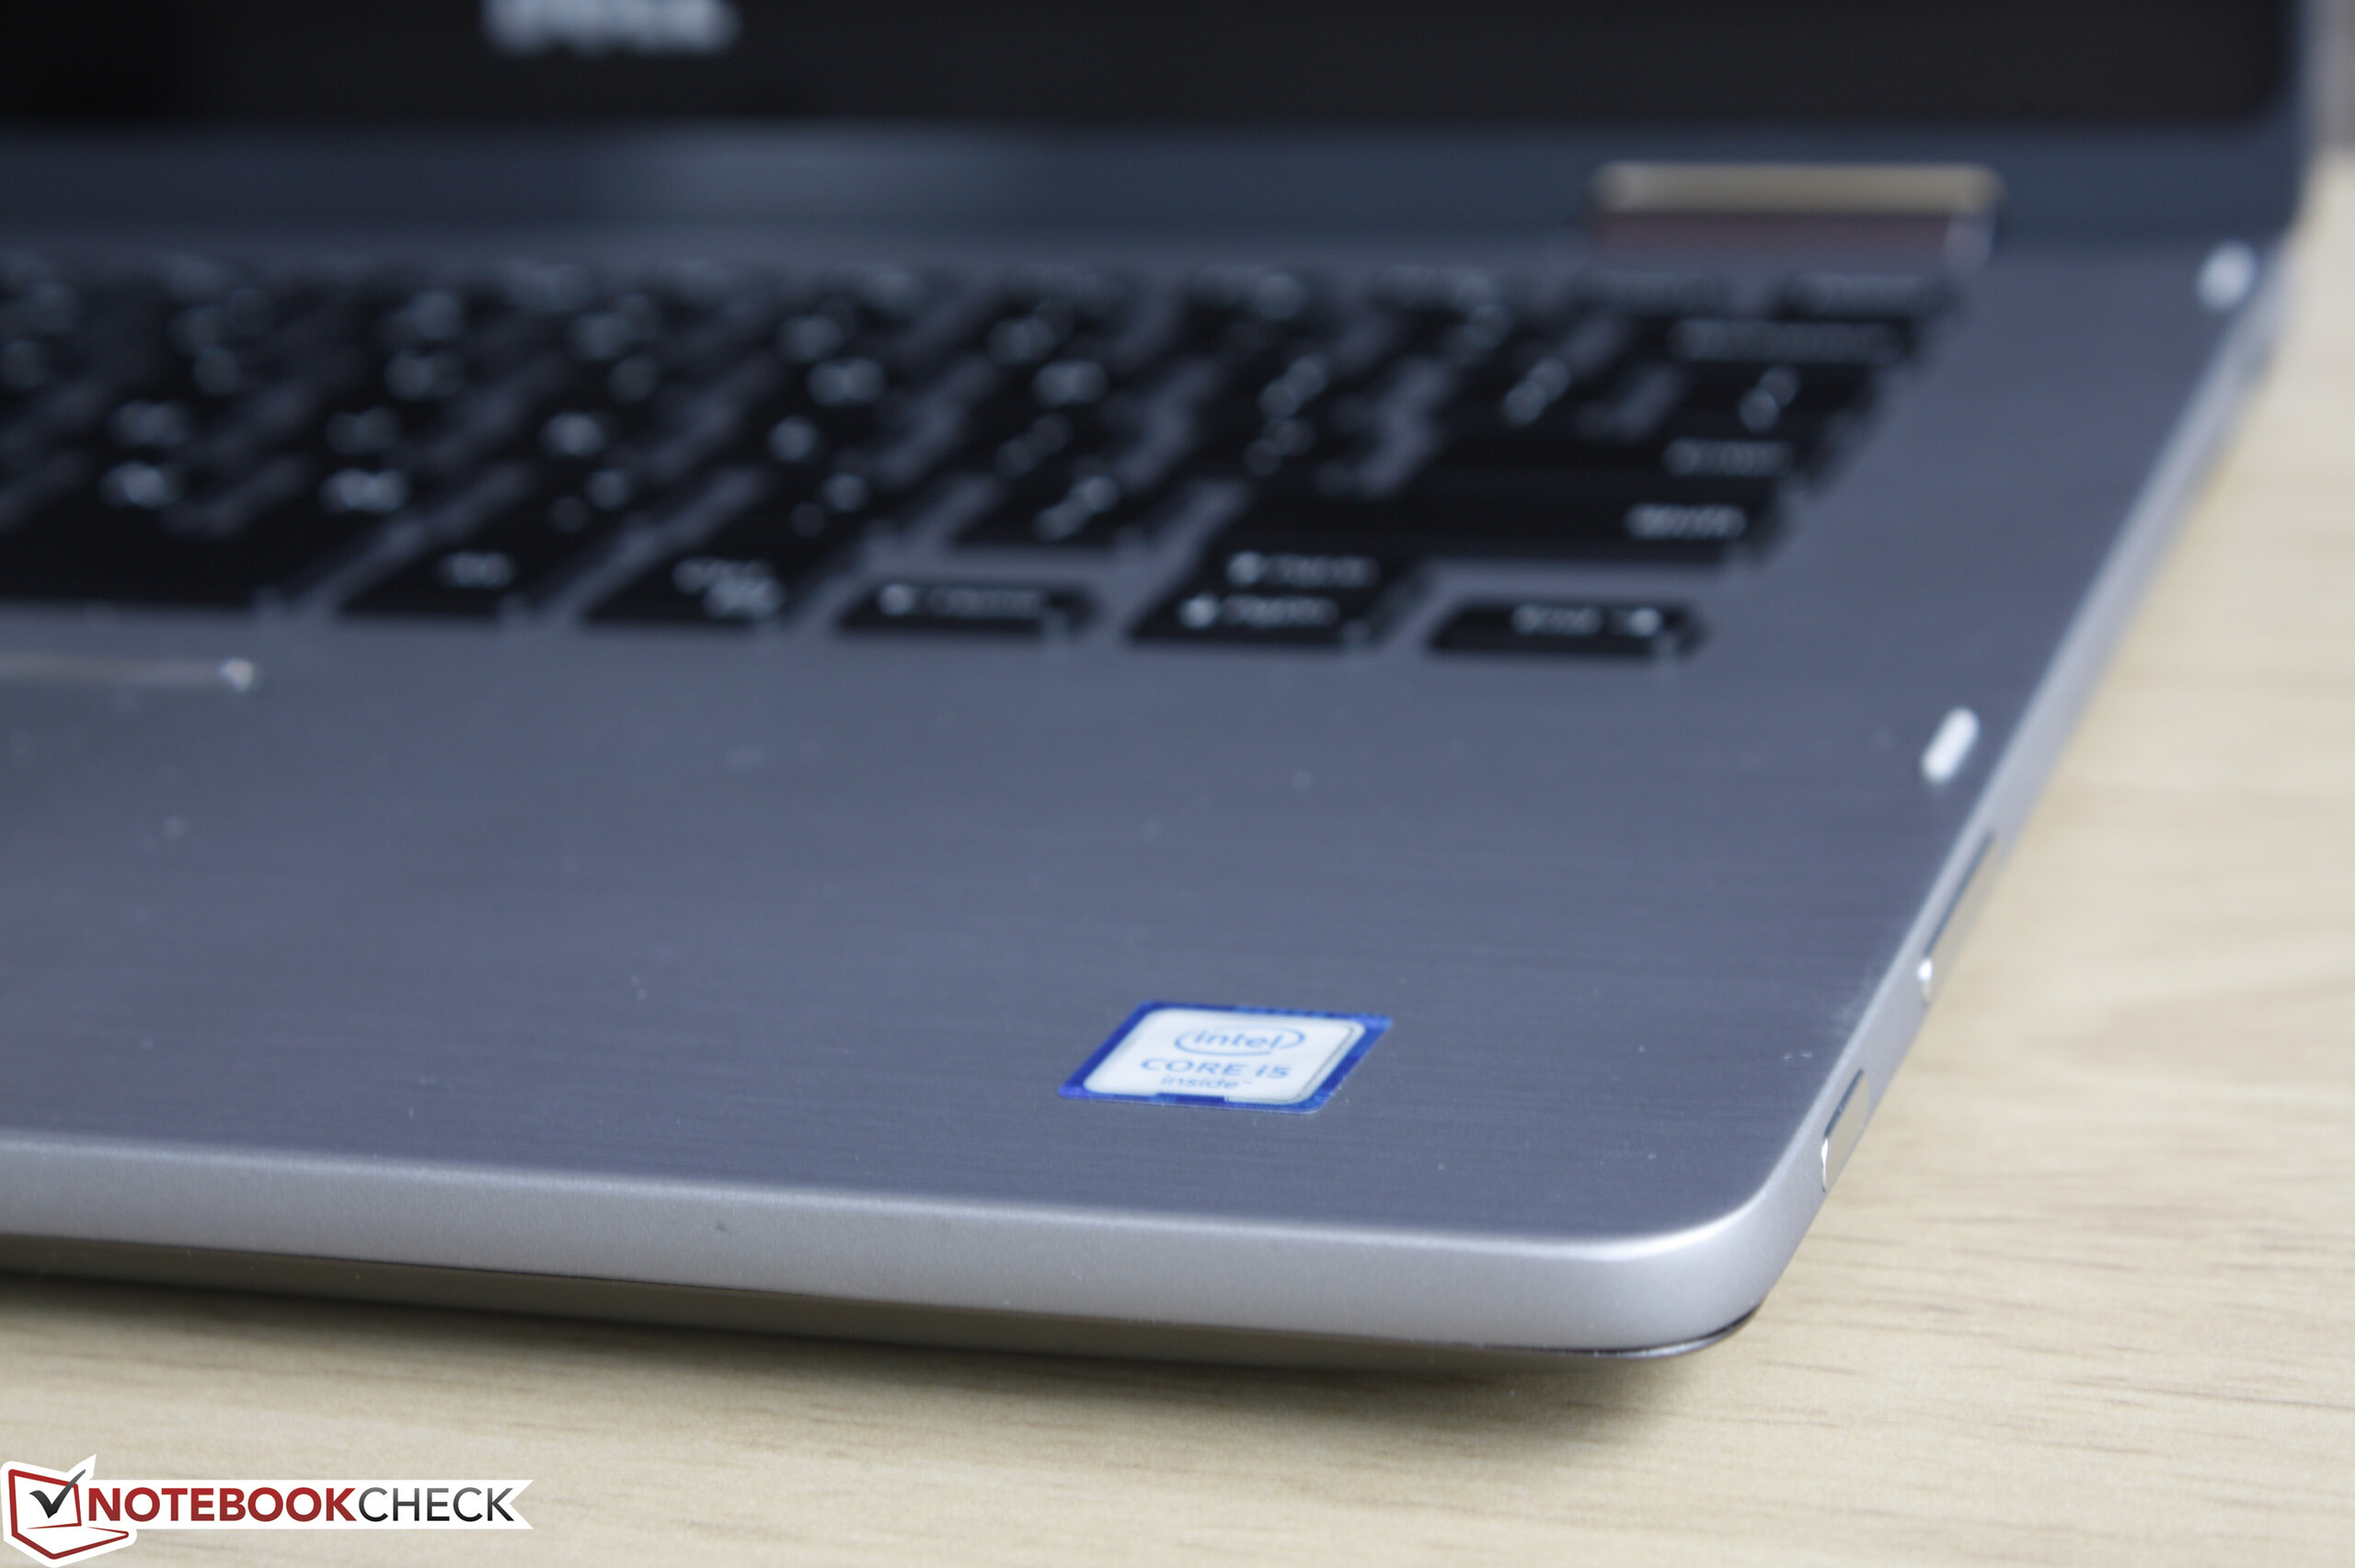
L'Inspiron 13 7368 non è il grande passo in avanti che ci aspettavamo per questa serie. Peso e dimensioni lo rendono un tablet da interno, mentre ci sono ultrabook da 13 pollici con maggior portabilità in grado di offrire le stesse prestazioni e funzionalità.
Nota: è una recensione breve. Per la recensione completa in inglese leggete qui.
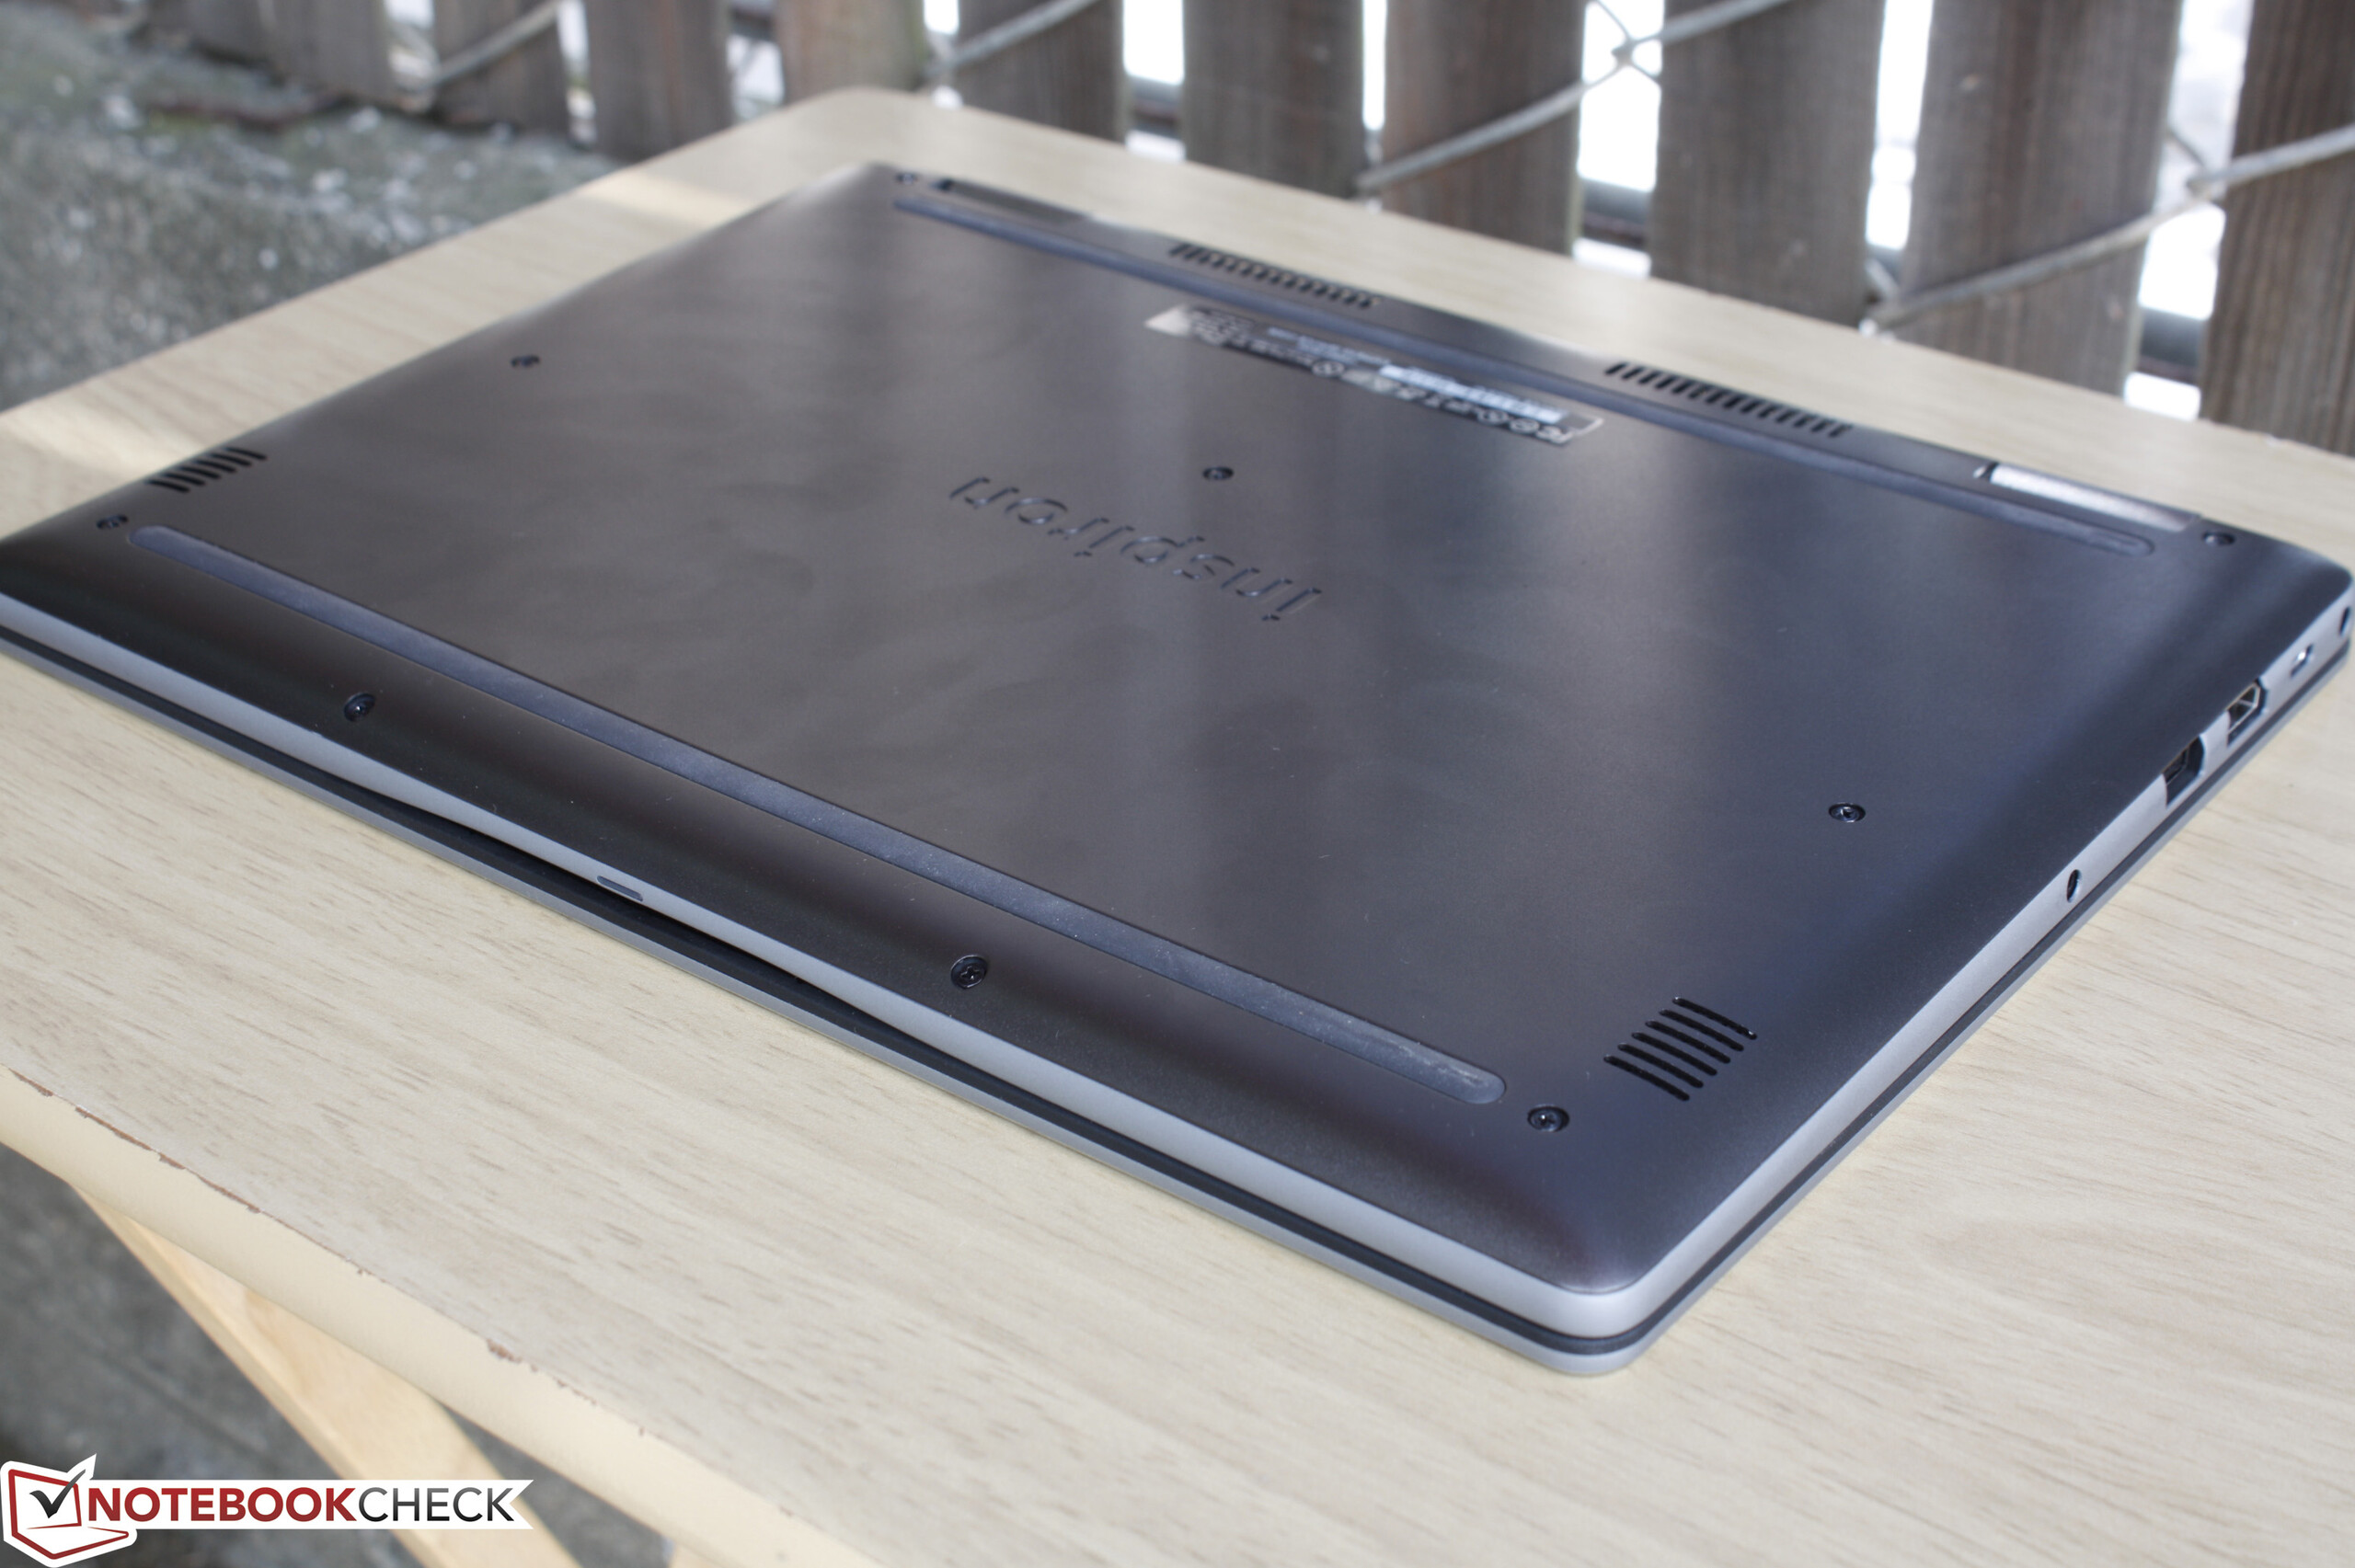
Dell Inspiron 13 7386
- 07/15/2016 v5.1 (old)
Allen Ngo
Price comparison
