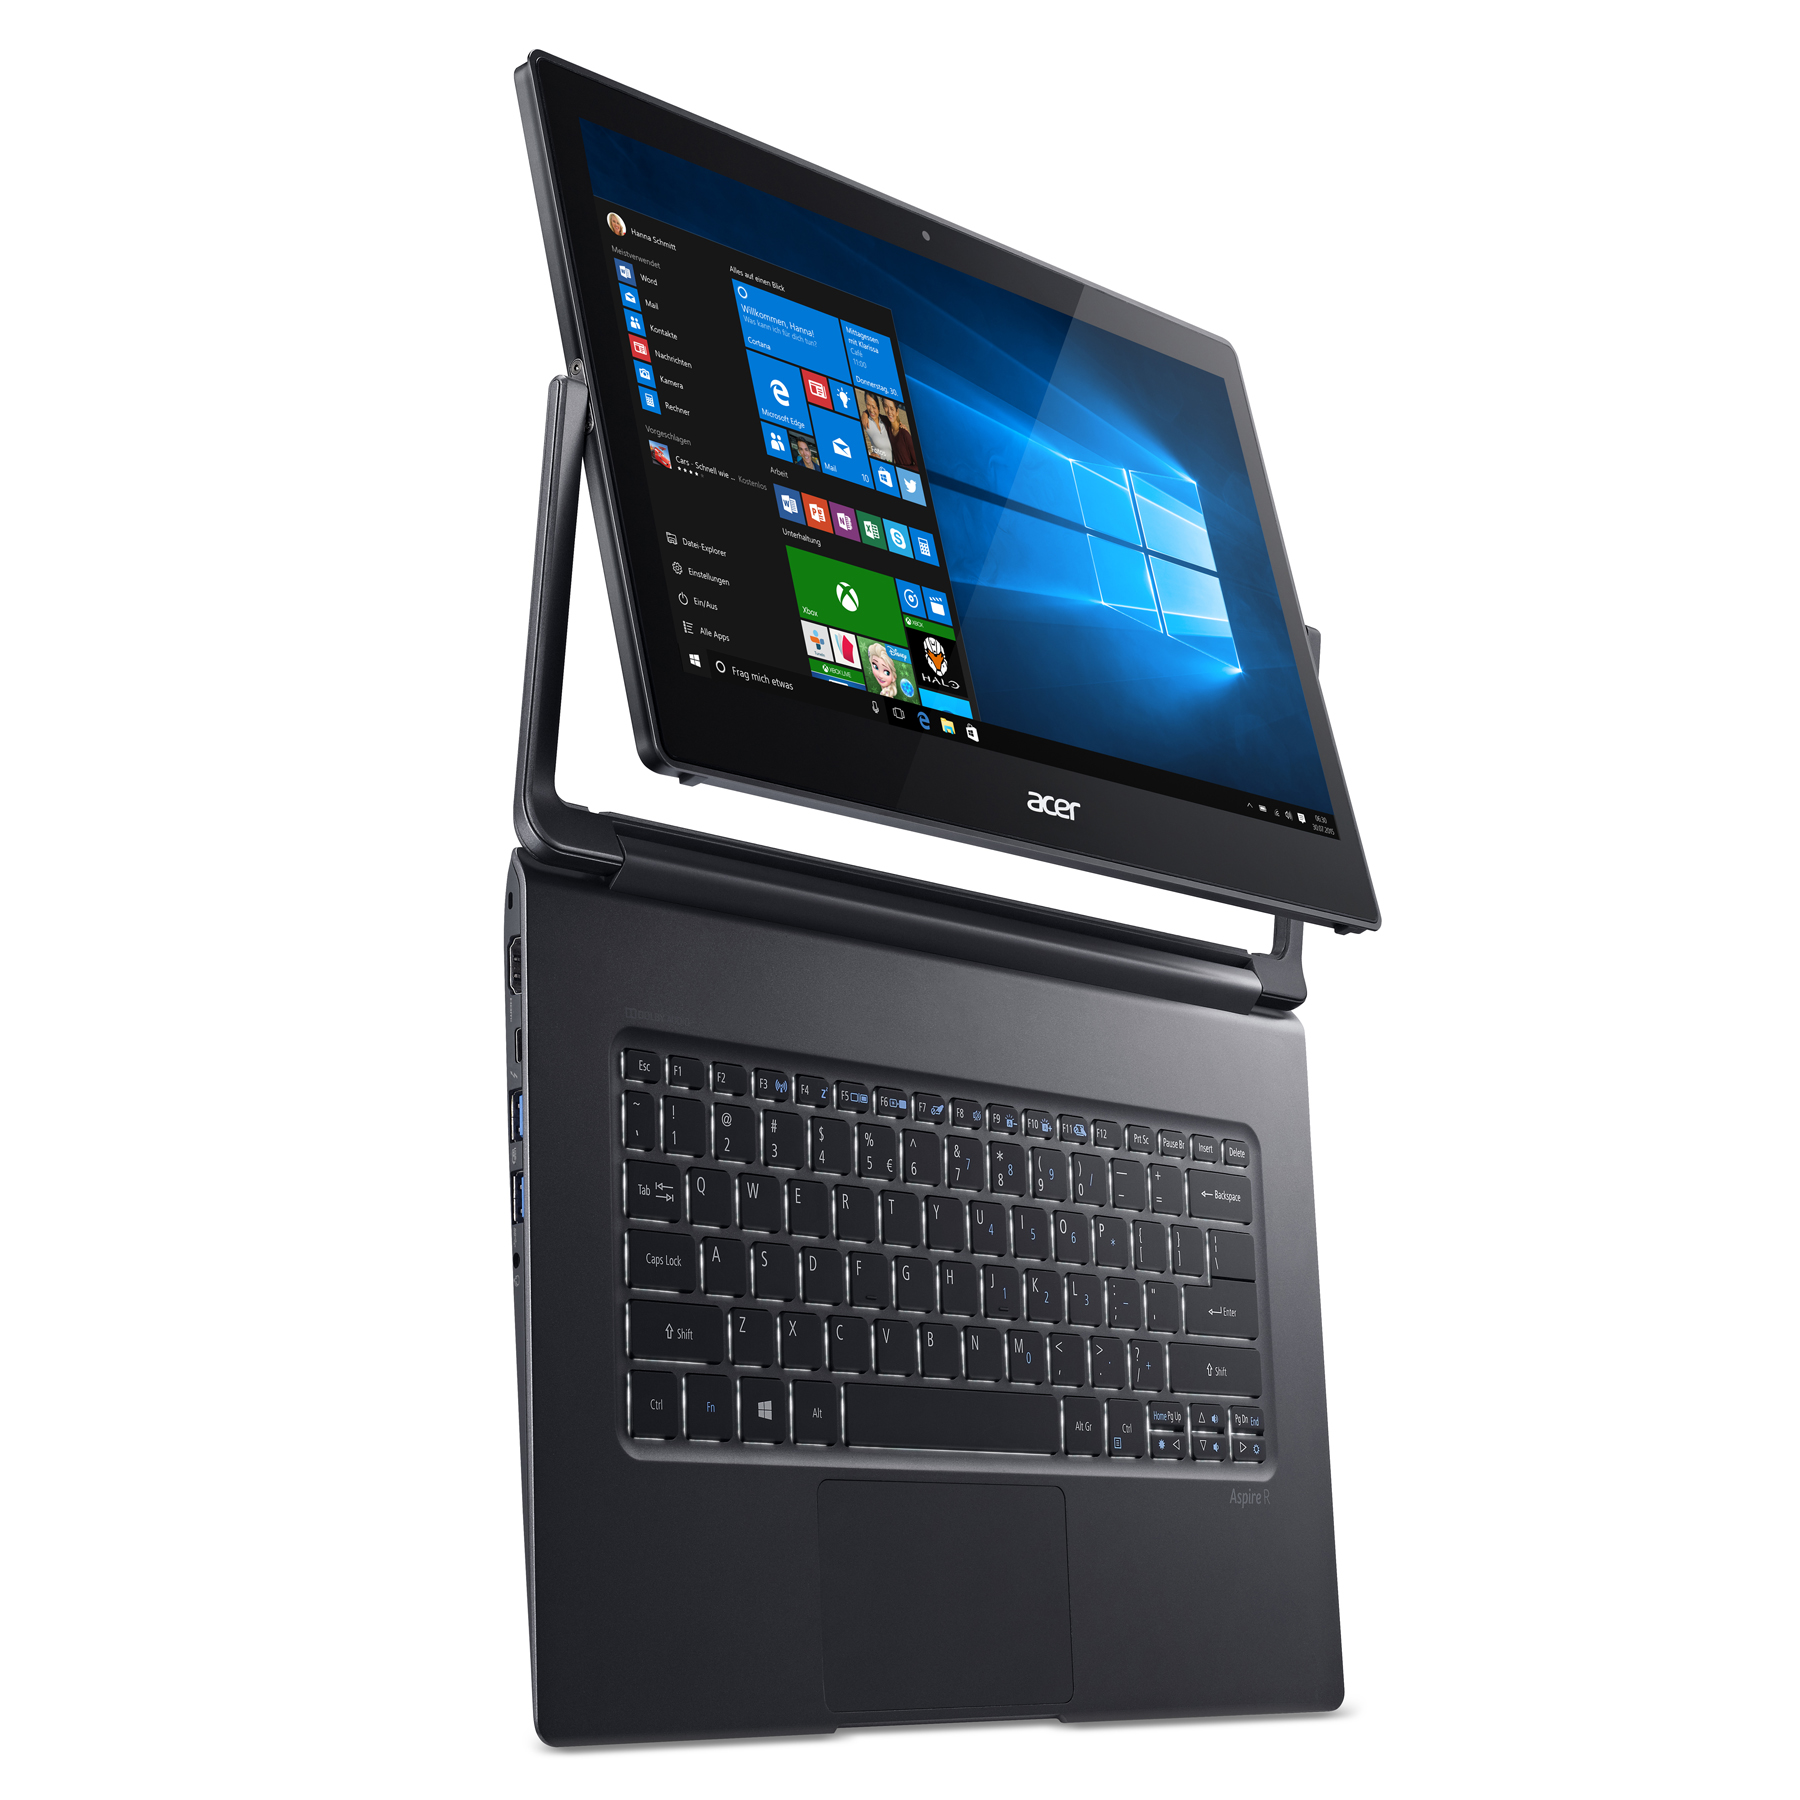
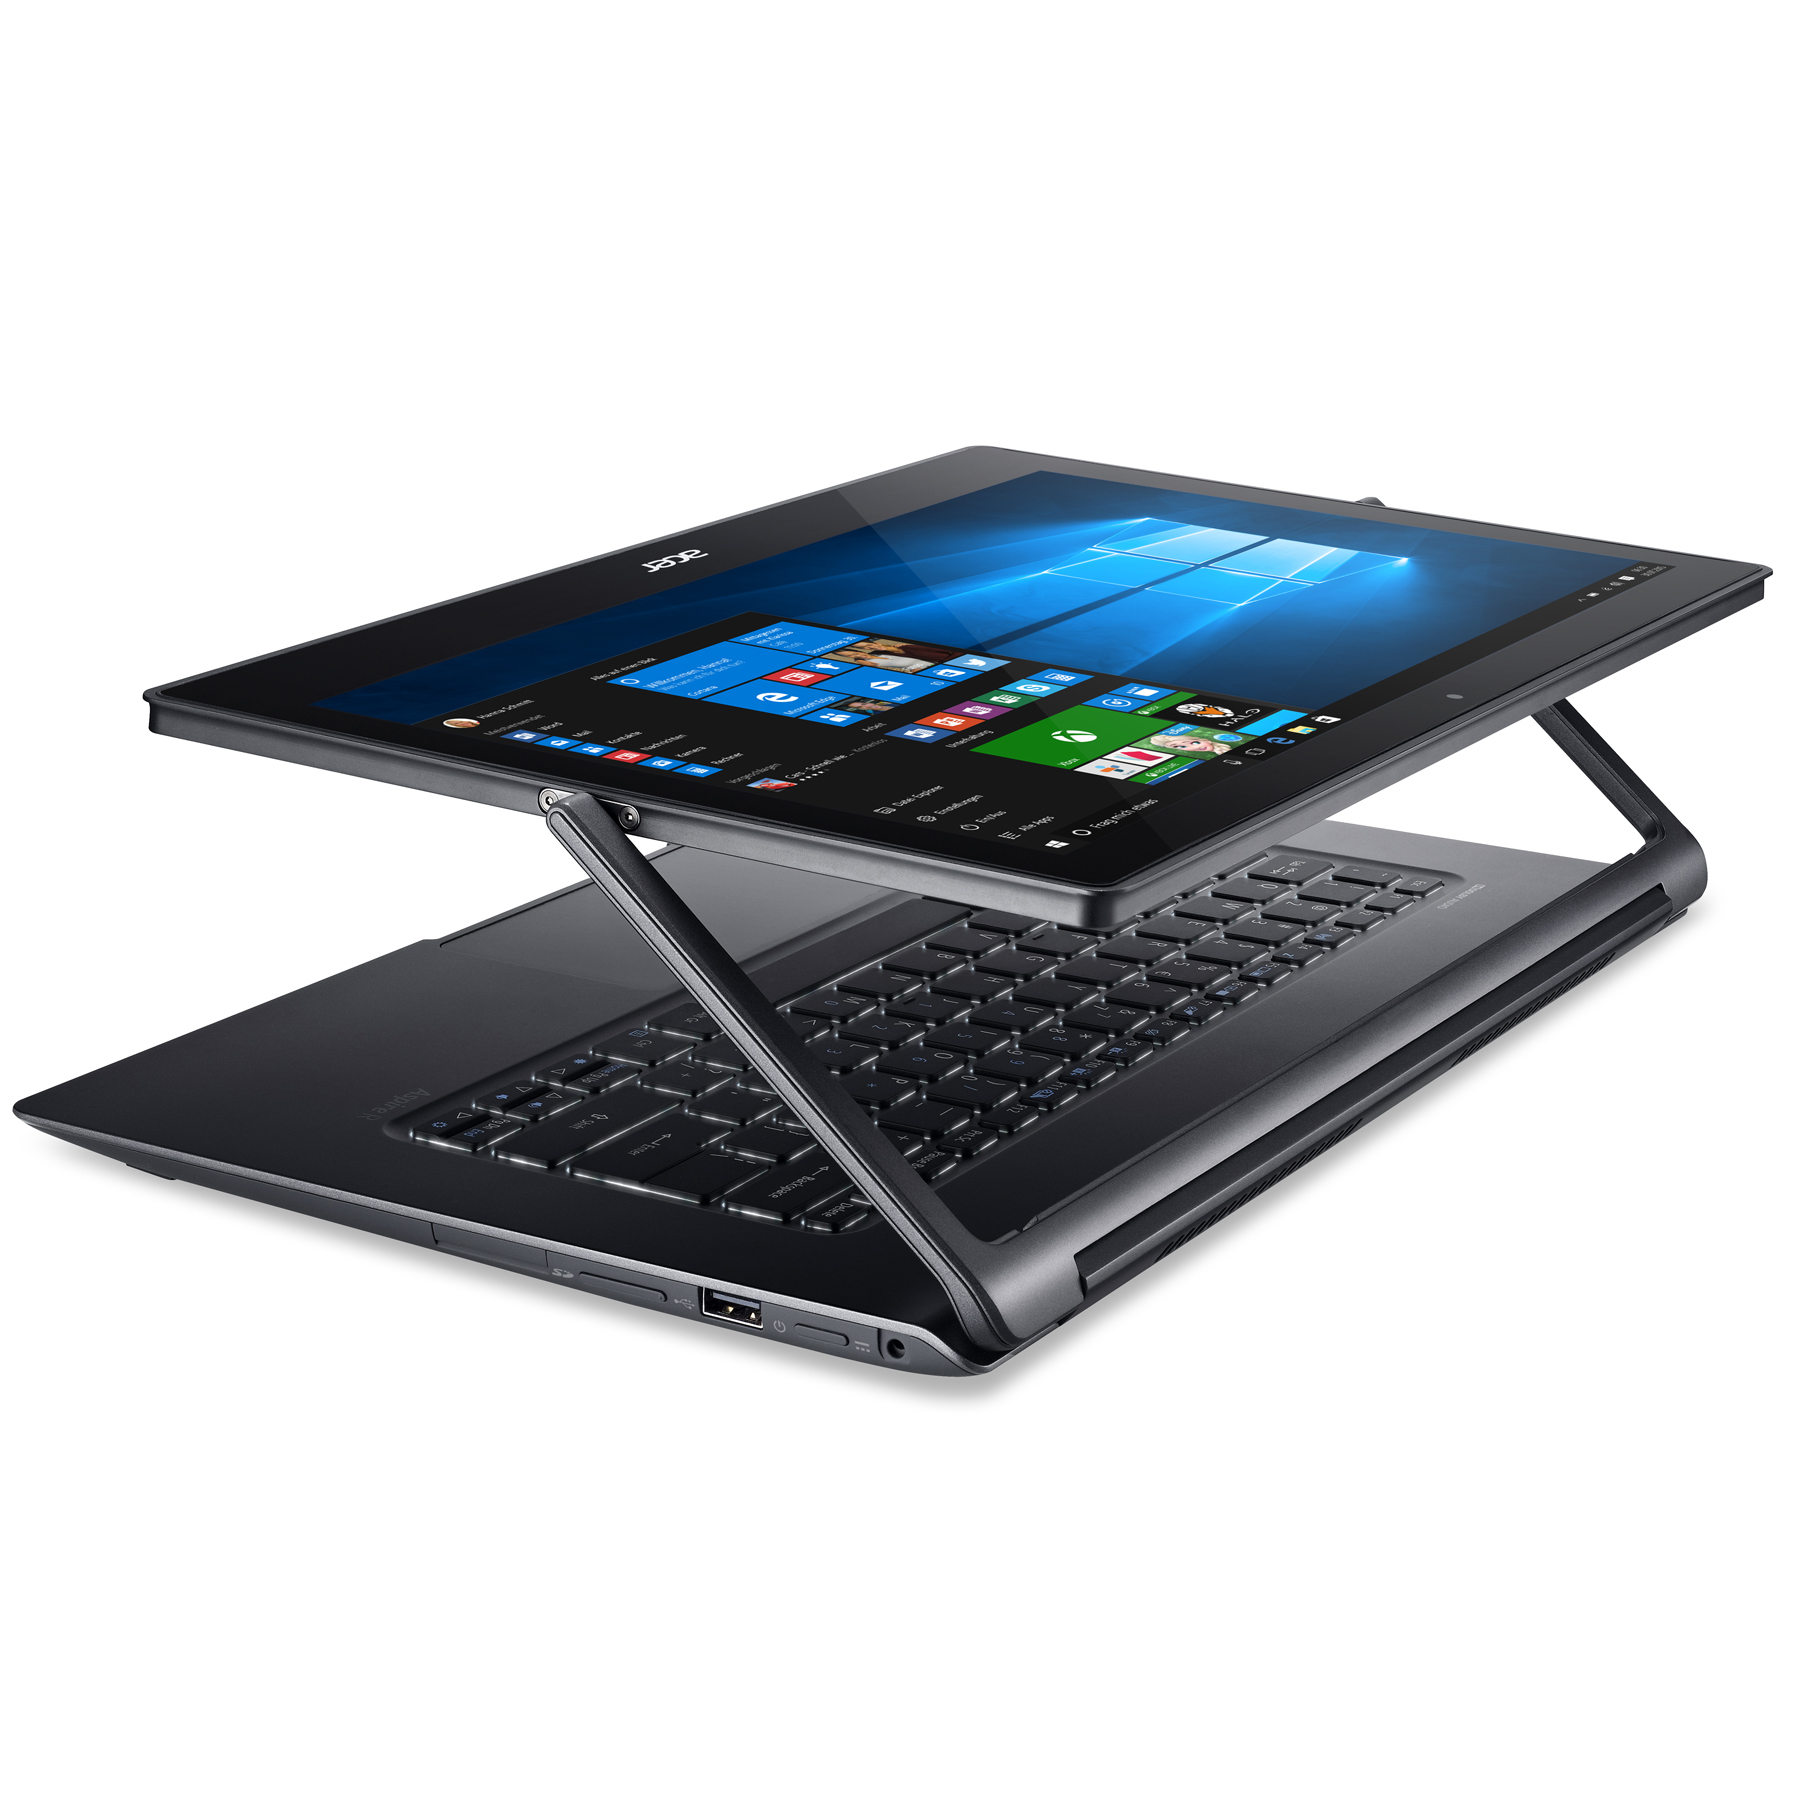
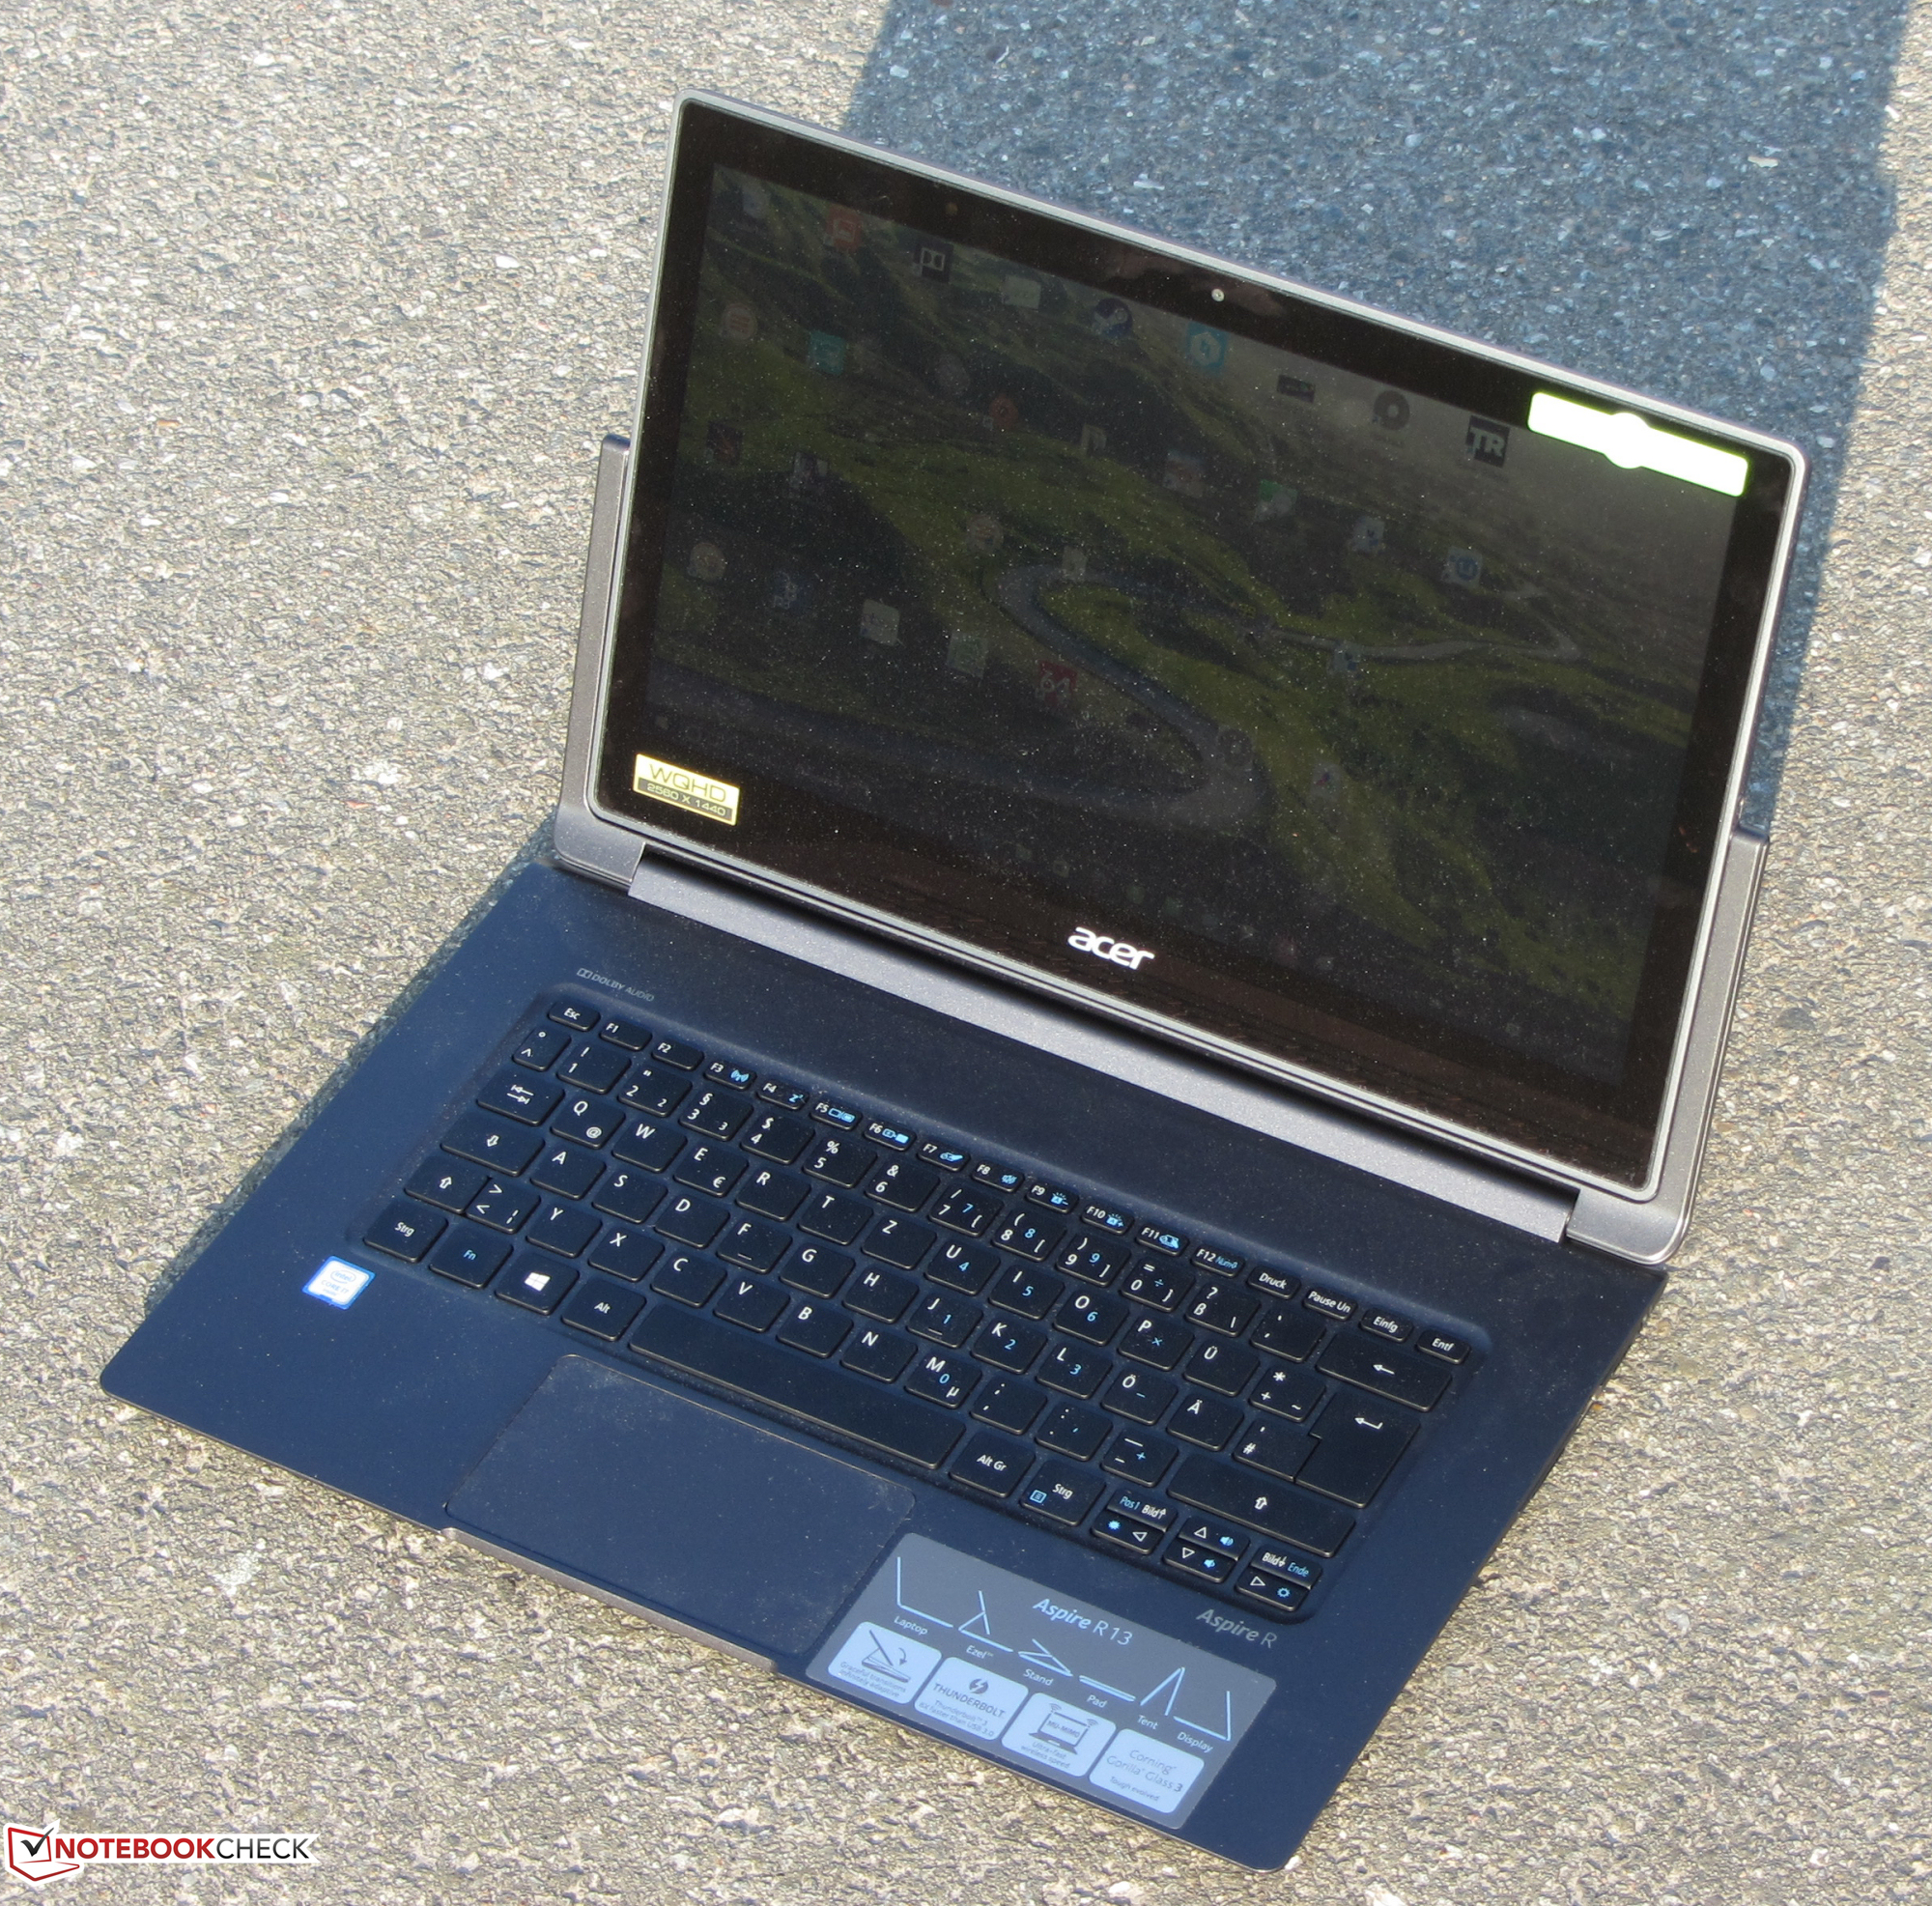
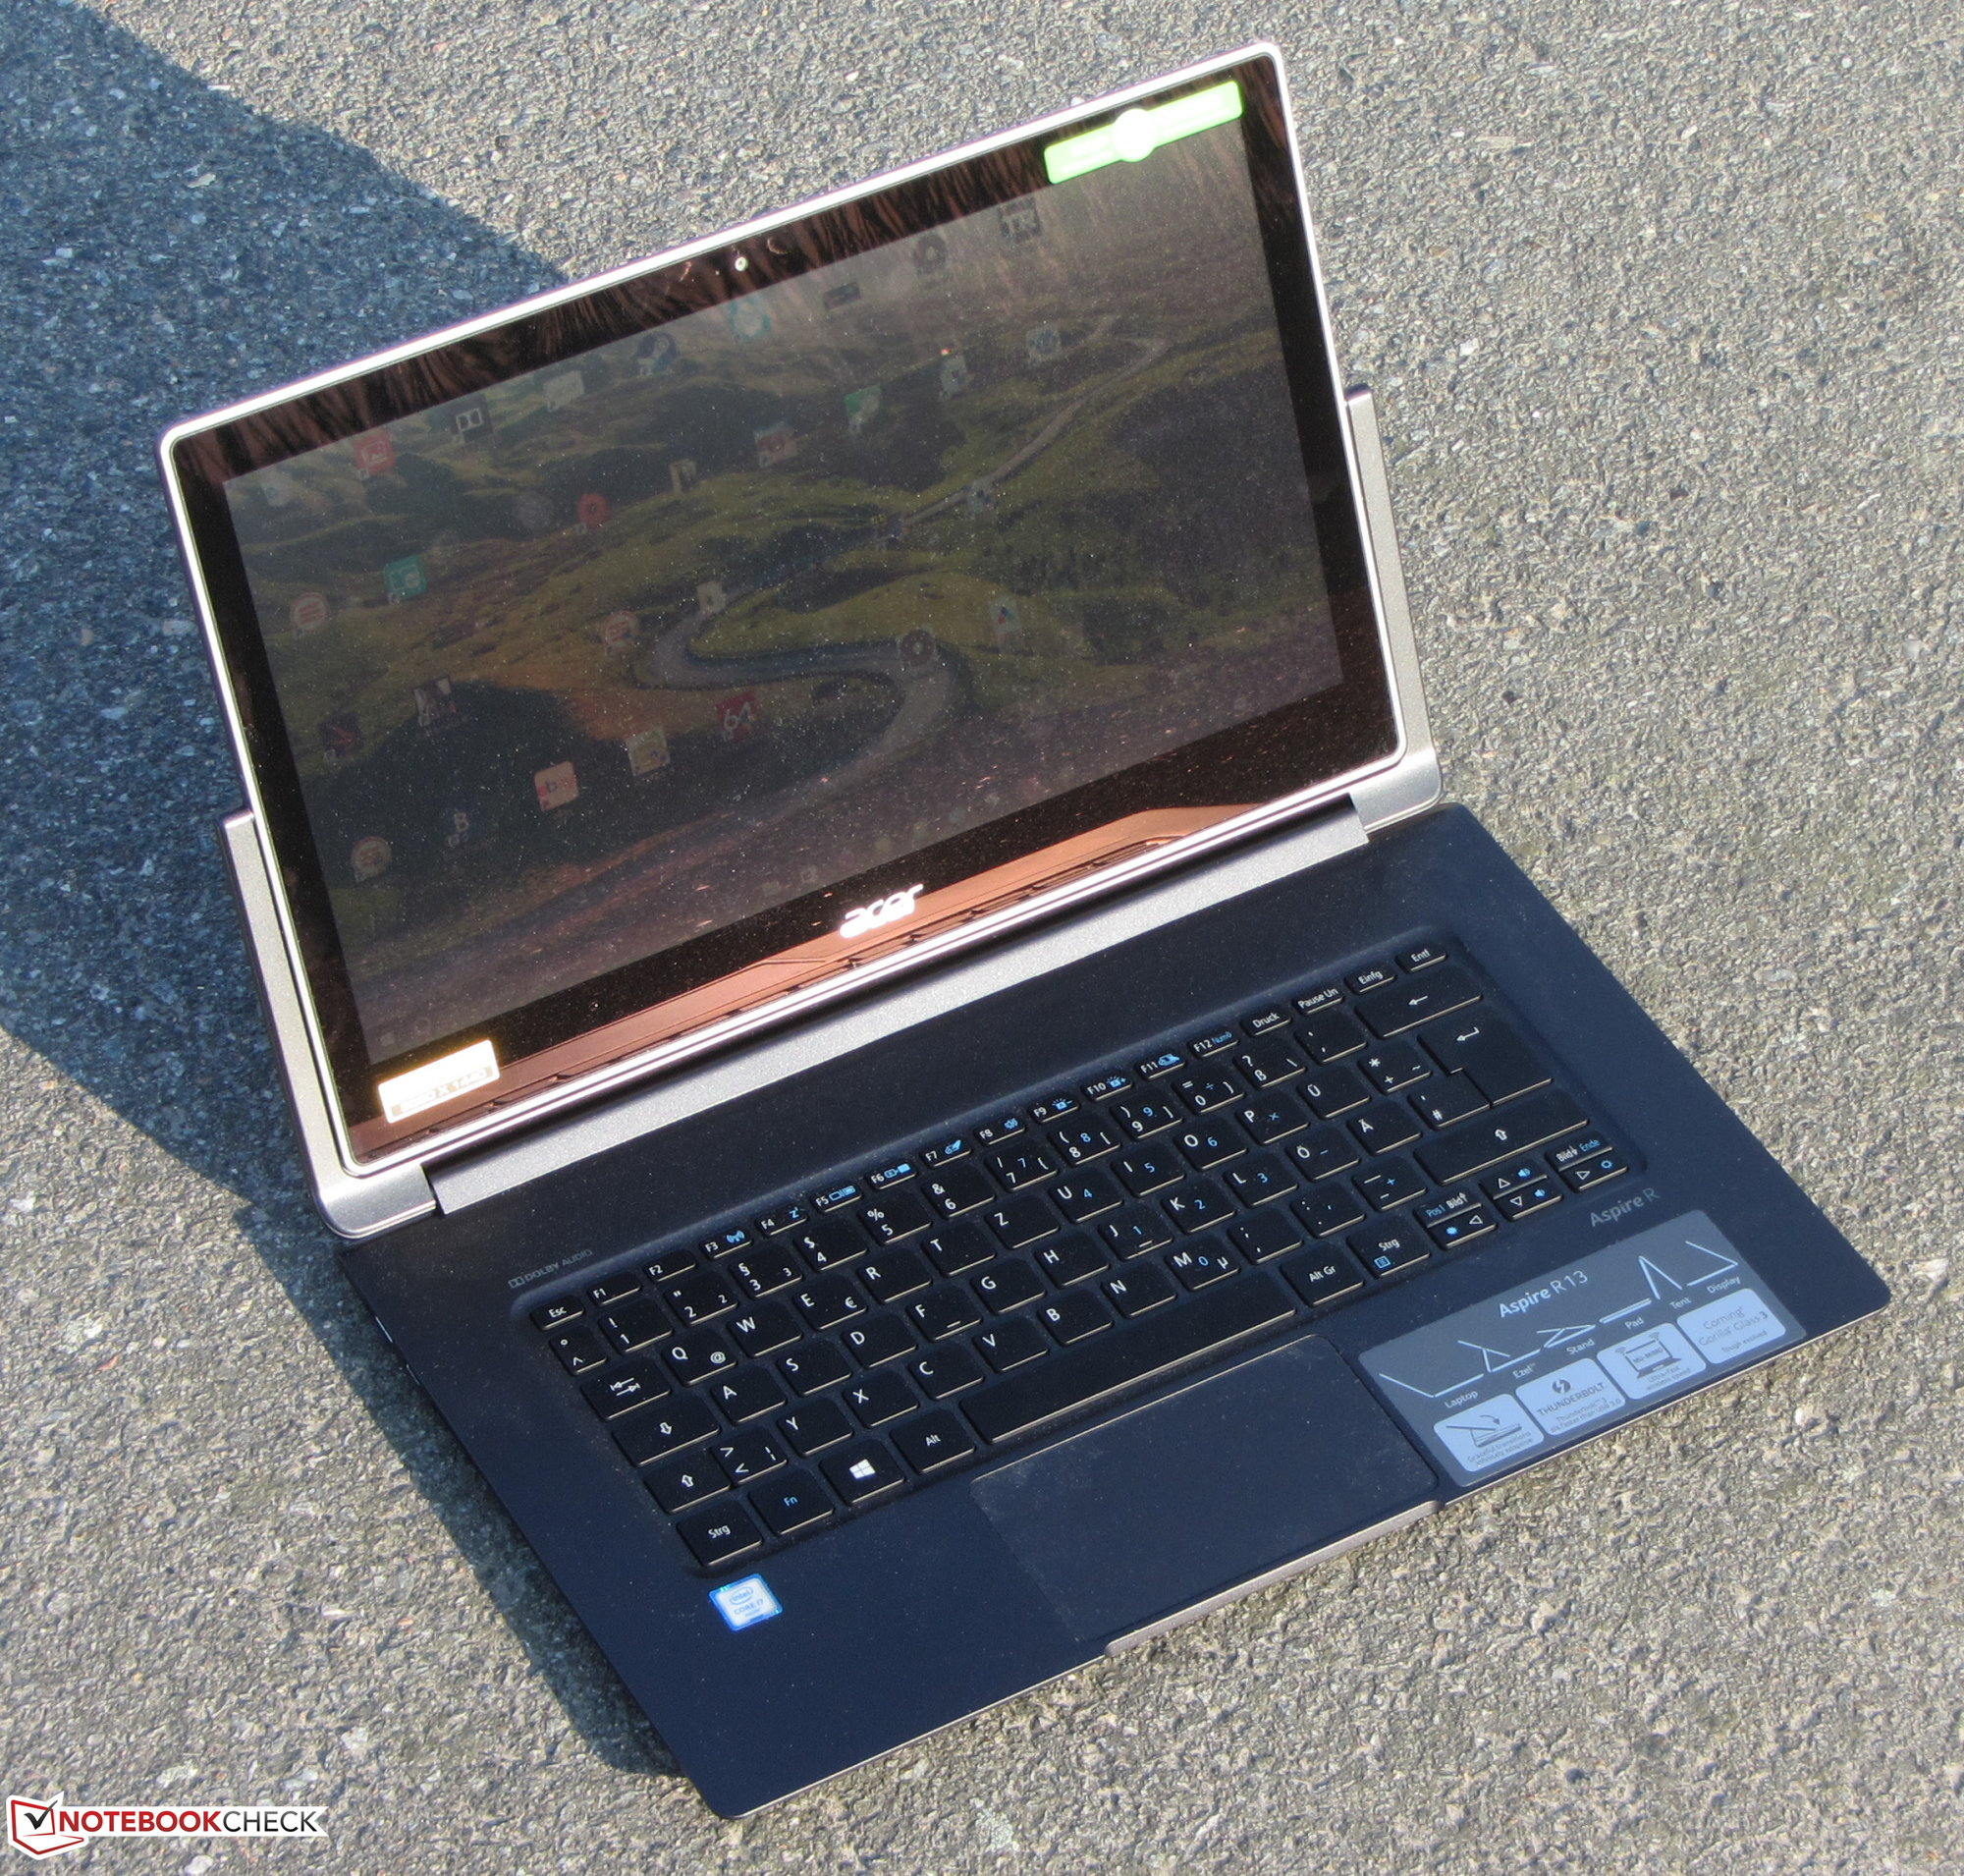
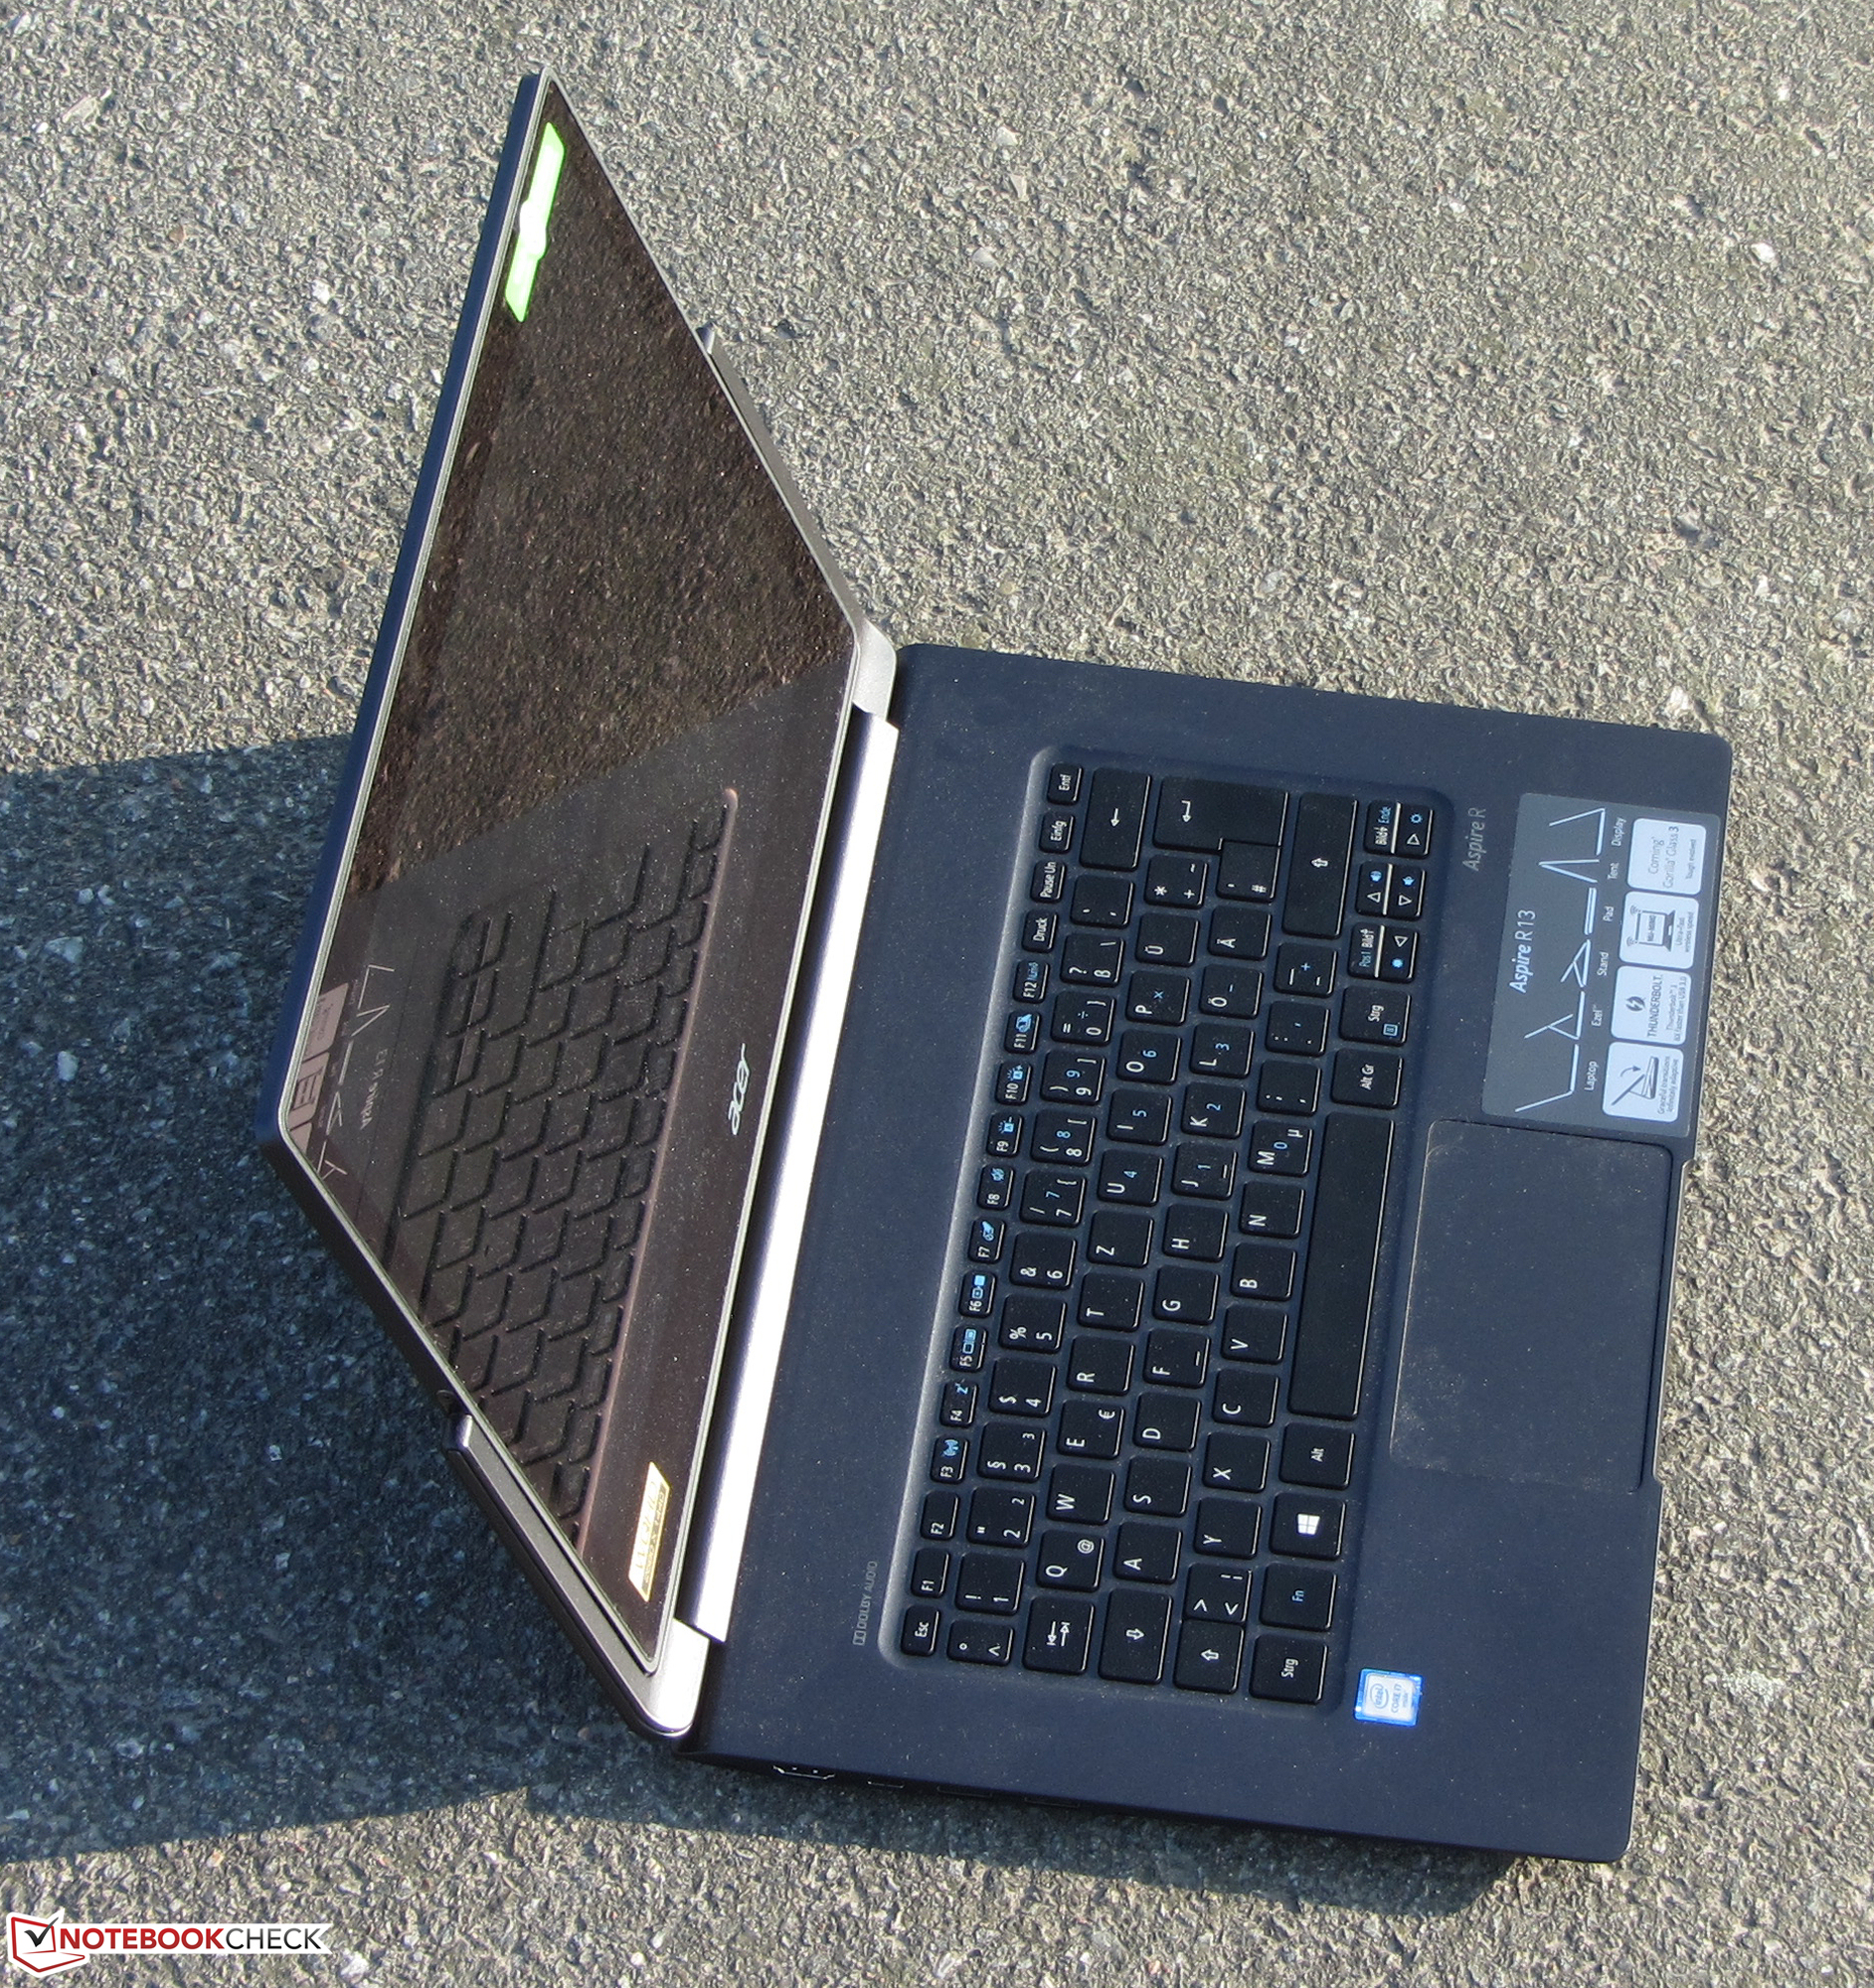
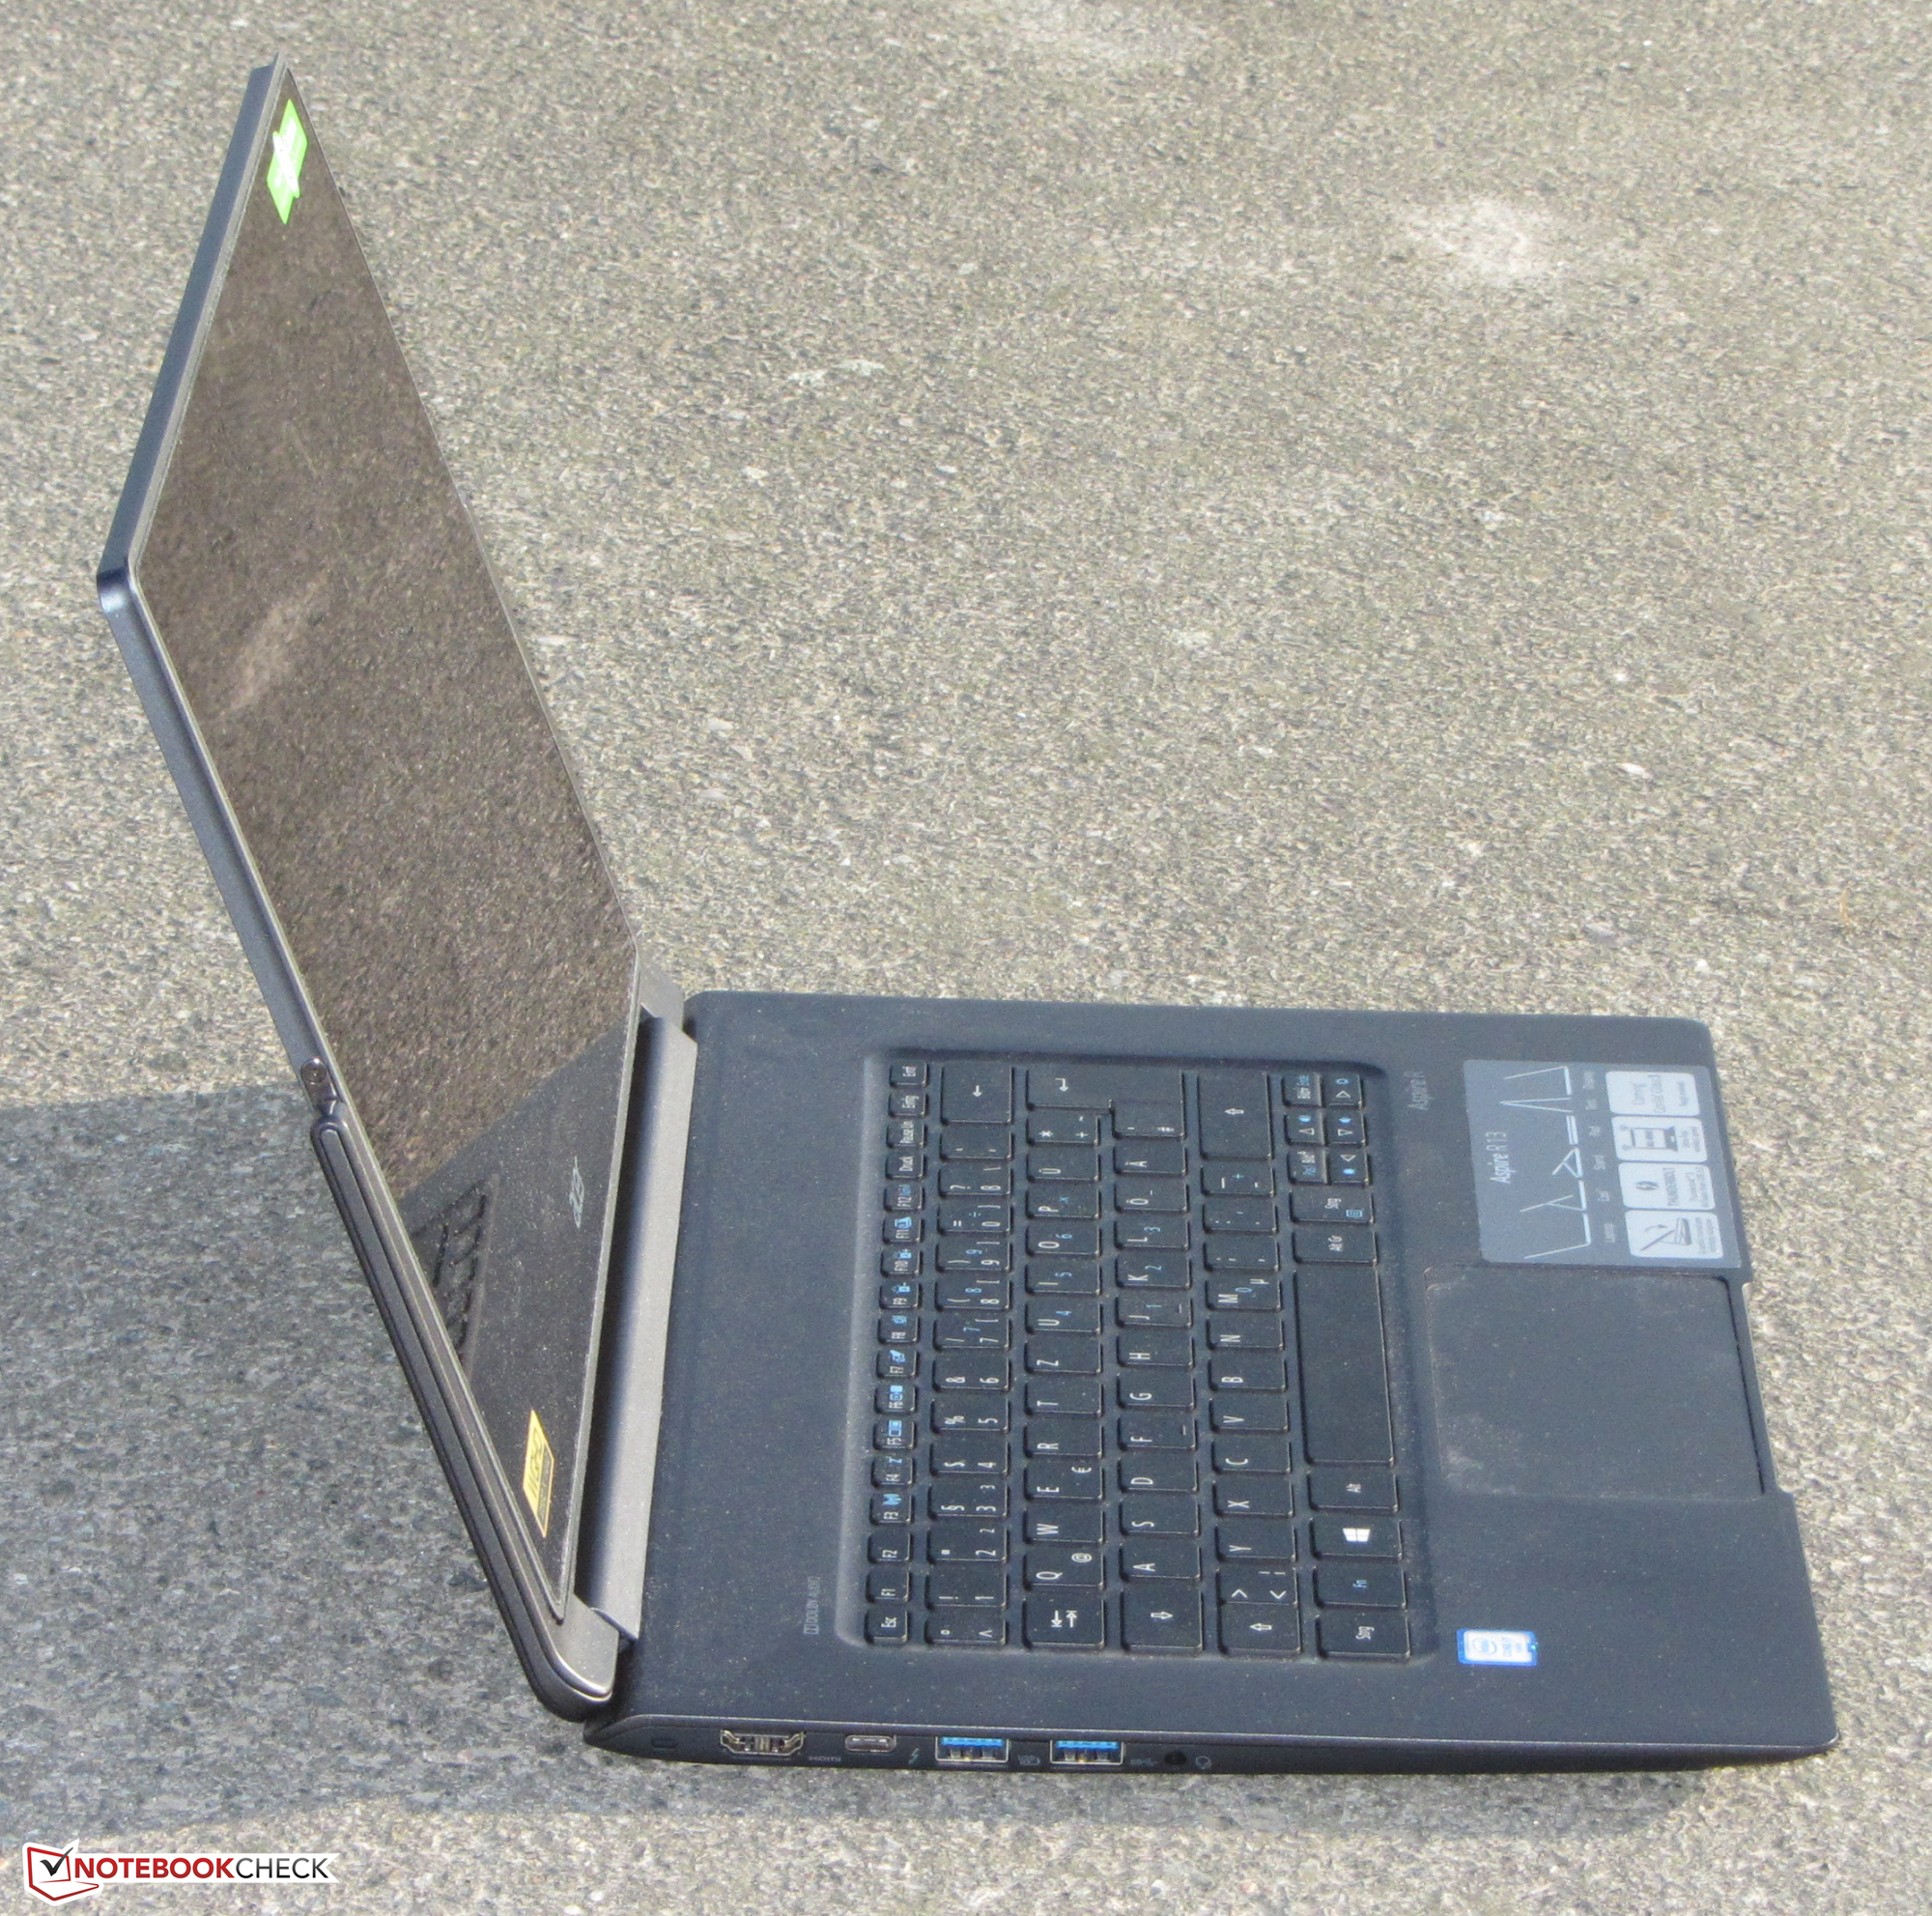
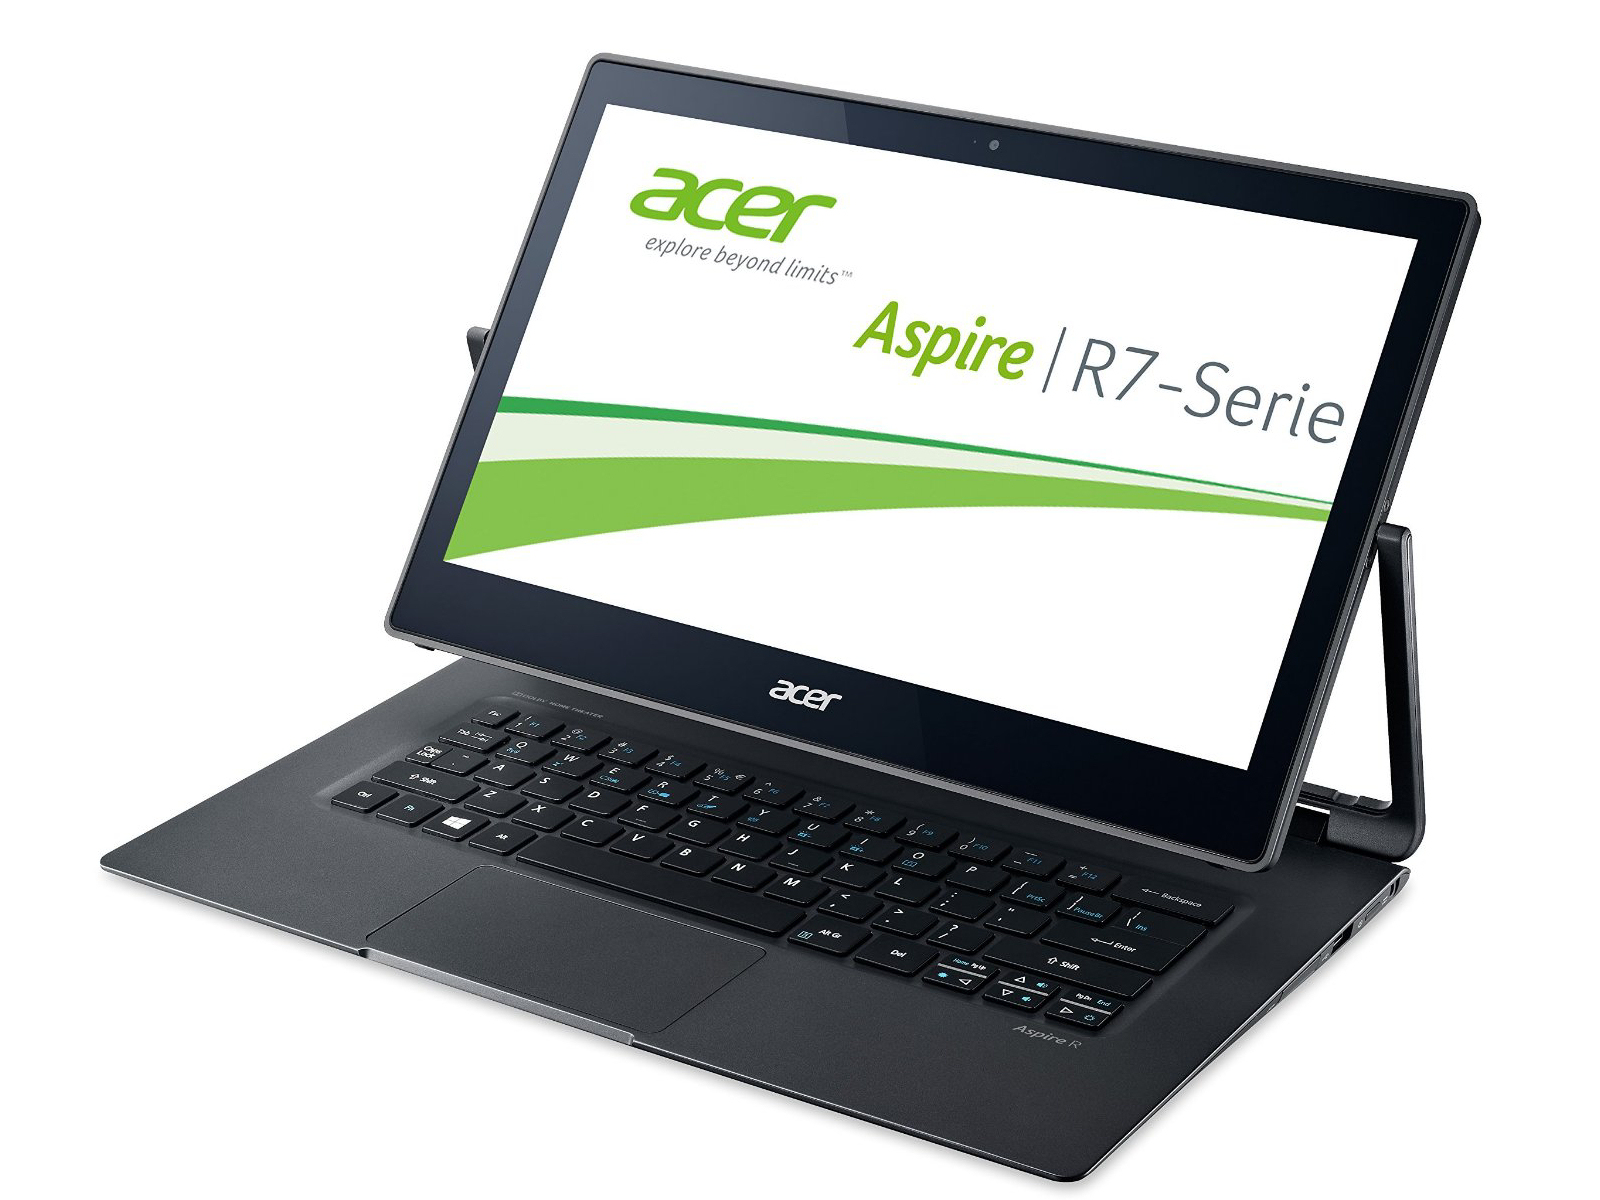
Recensione breve del Convertible Acer Aspire R13 R7-372T-746N
| |||||||||||||||||||||||||
Distribuzione della luminosità: 91 %
Al centro con la batteria: 323 cd/m²
Contrasto: 1882:1 (Nero: 0.17 cd/m²)
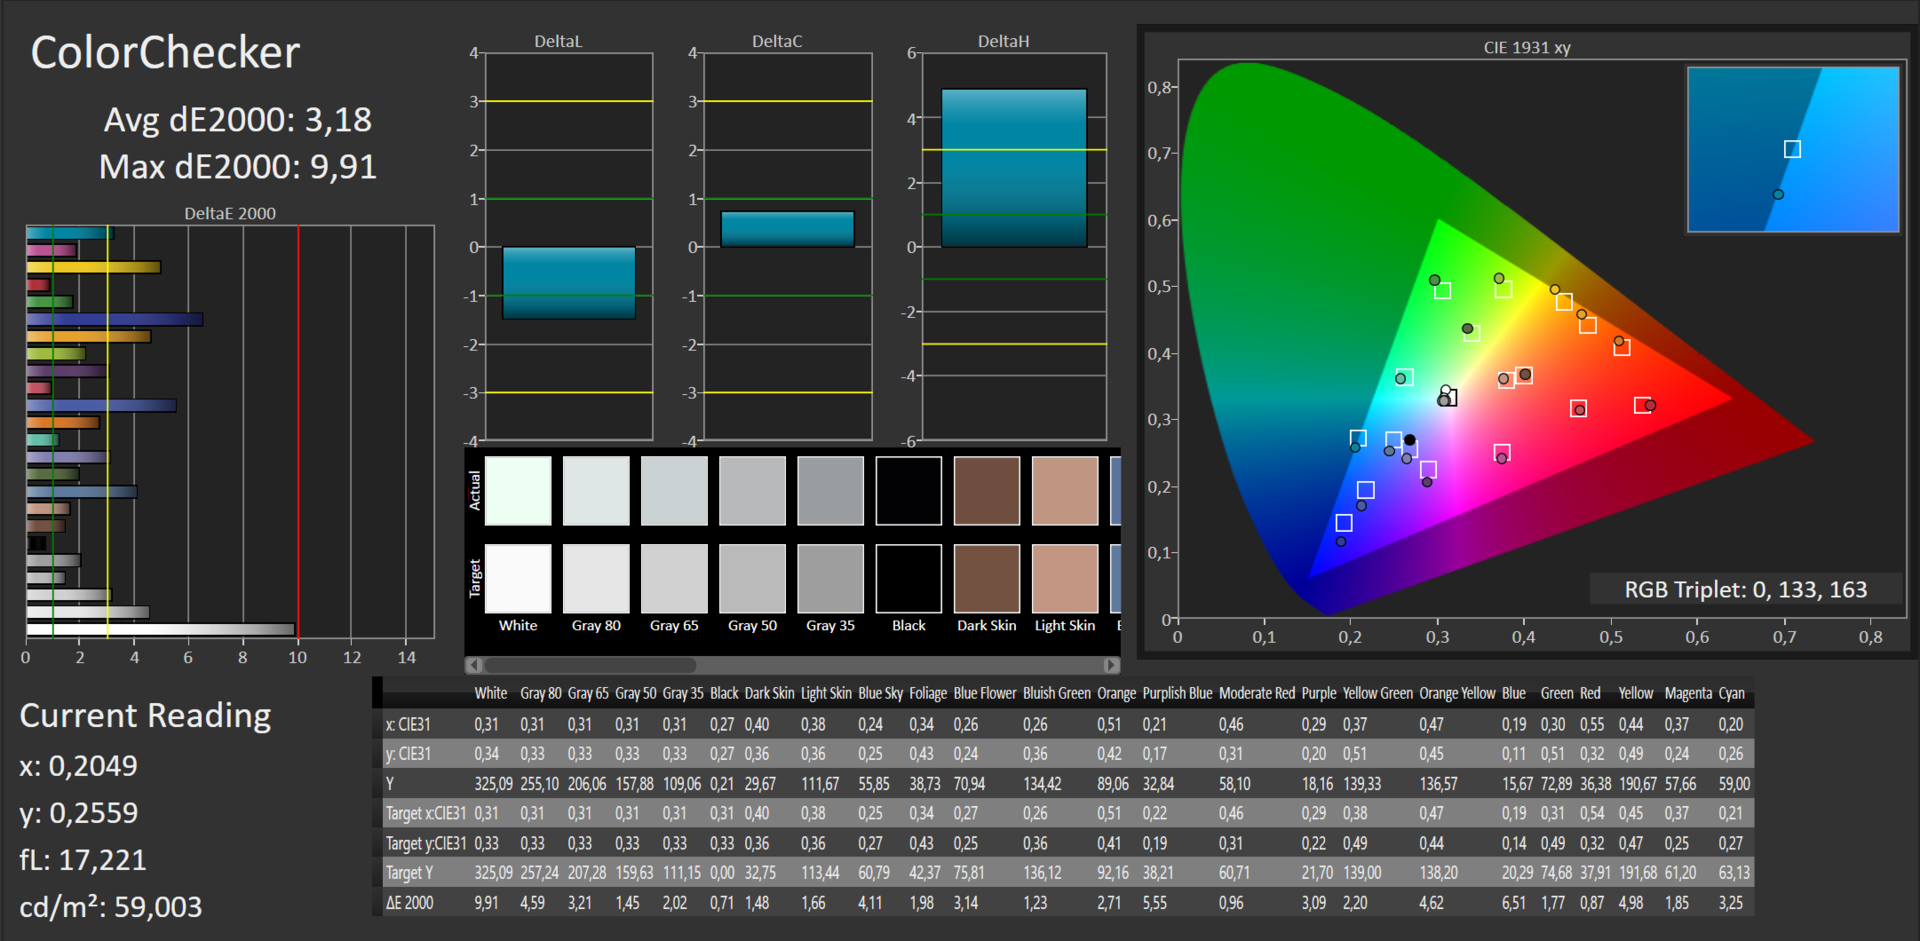
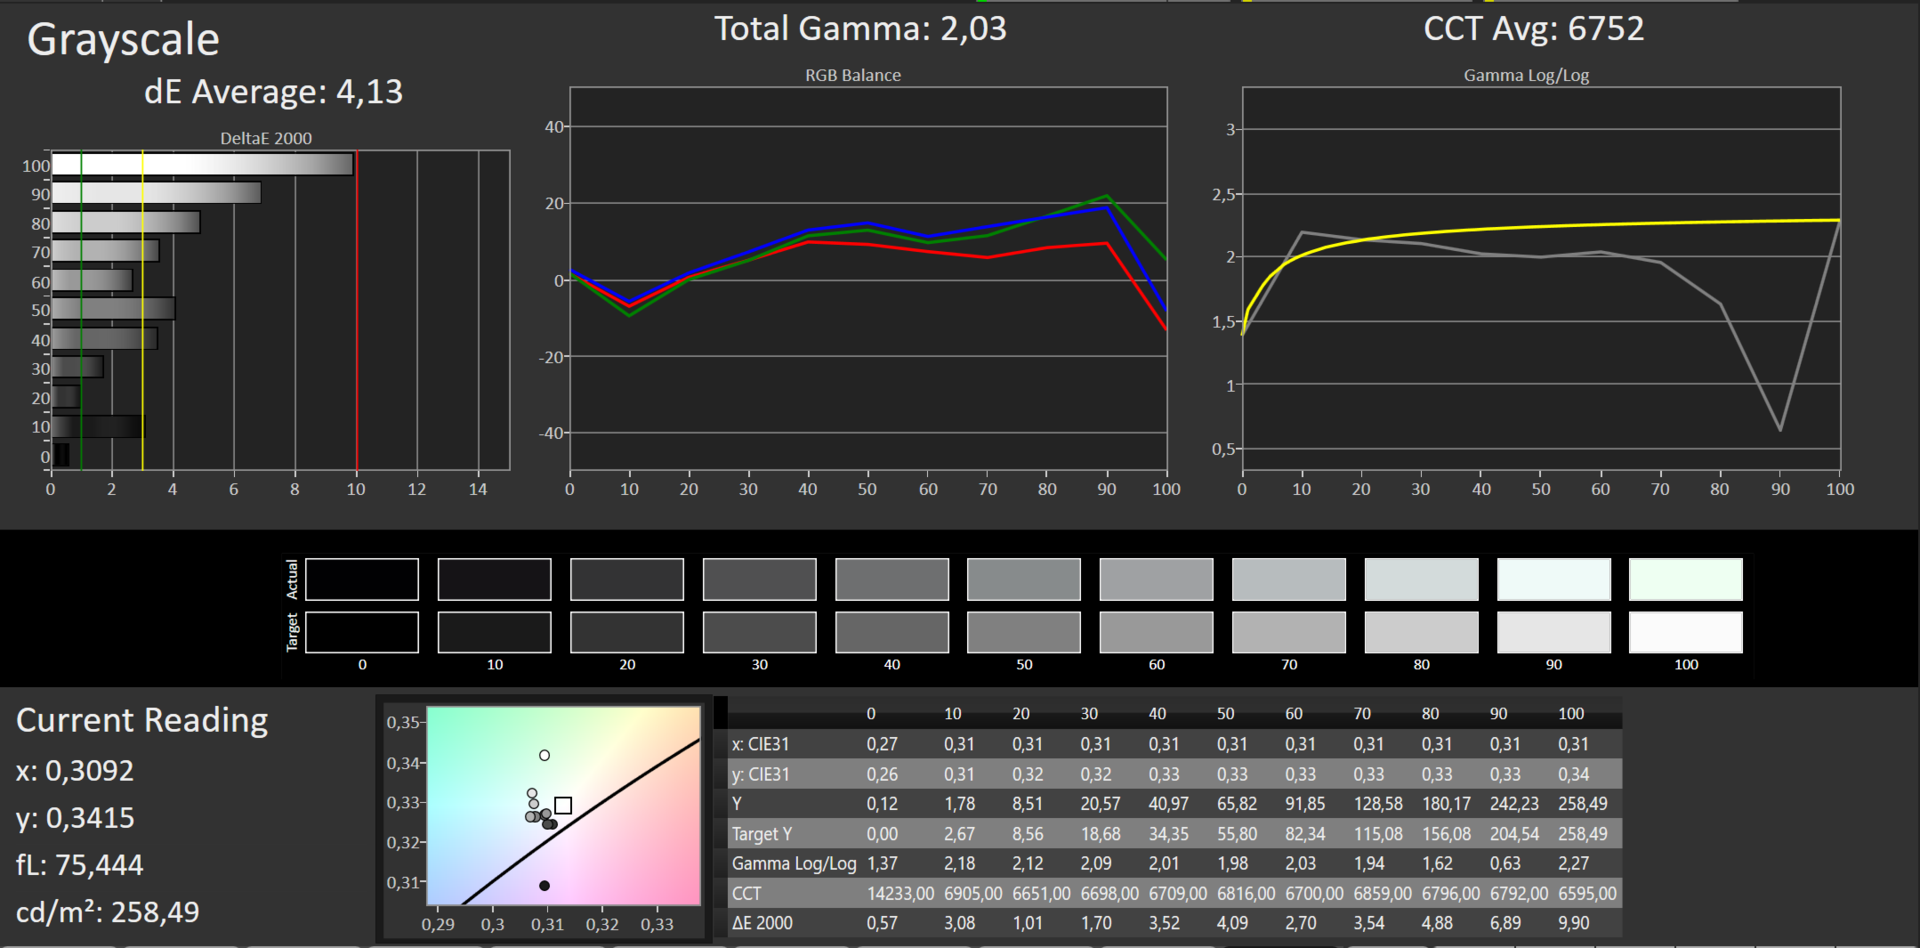
ΔE ColorChecker Calman: 3.18 | ∀{0.5-29.43 Ø4.73}
ΔE Greyscale Calman: 4.13 | ∀{0.09-98 Ø4.97}
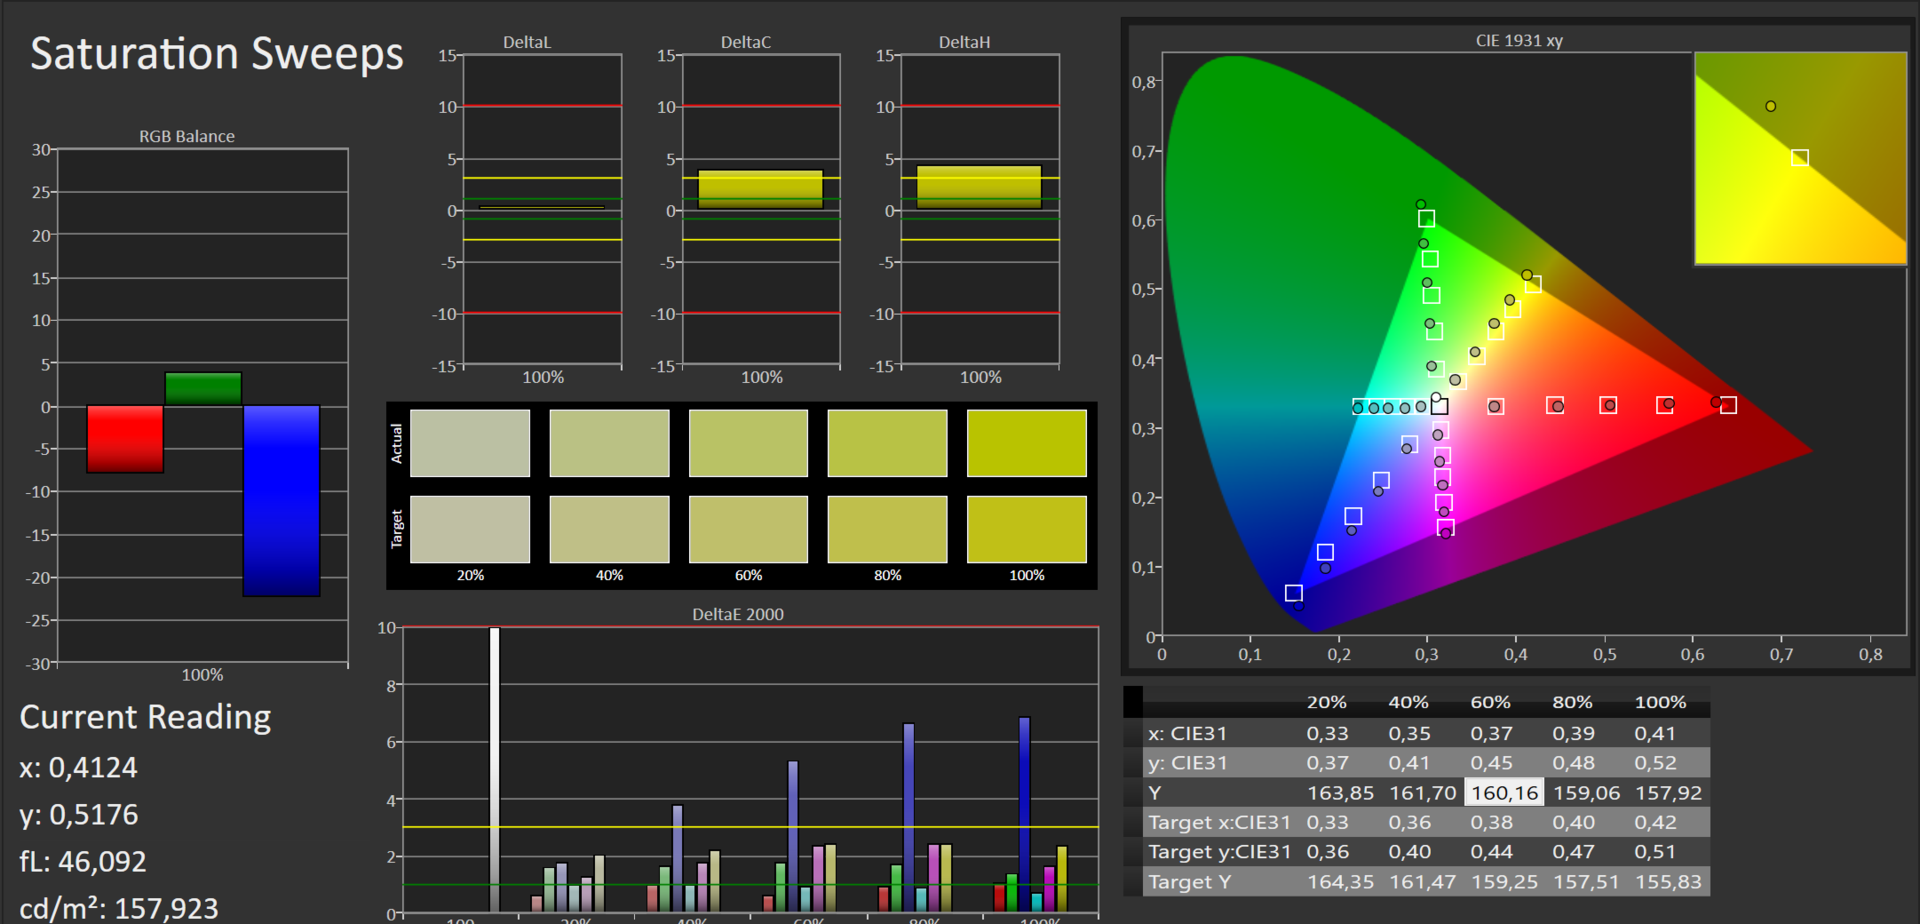
98% sRGB (Argyll 1.6.3 3D)
65% AdobeRGB 1998 (Argyll 1.6.3 3D)
70.7% AdobeRGB 1998 (Argyll 3D)
98% sRGB (Argyll 3D)
69.6% Display P3 (Argyll 3D)
Gamma: 2.03
CCT: 6752 K
Sfarfallio dello schermo / PWM (Pulse-Width Modulation)
| flickering dello schermo / PWM rilevato | 1000 Hz | ≤ 10 % settaggio luminosita' | 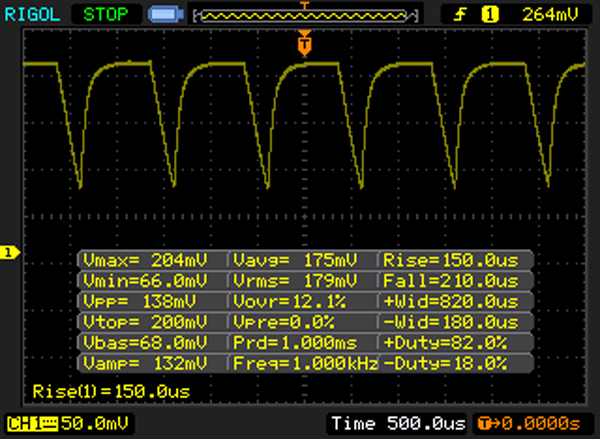 |
Il display sfarfalla a 1000 Hz (Probabilmente a causa dell'uso di PWM) Flickering rilevato ad una luminosita' di 10 % o inferiore. Non dovrebbe verificarsi flickering o PWM sopra questo valore di luminosita'. La frequenza di 1000 Hz è abbastanza alta, quindi la maggioranza degli utenti sensibili al PWM non dovrebbero notare alcun flickering. In confronto: 52 % di tutti i dispositivi testati non utilizza PWM per ridurre la luminosita' del display. Se è rilevato PWM, una media di 7798 (minimo: 5 - massimo: 343500) Hz è stata rilevata. | |||
Tempi di risposta del Display
| ↔ Tempi di risposta dal Nero al Bianco | ||
|---|---|---|
| 30 ms ... aumenta ↗ e diminuisce ↘ combinato | ↗ 8 ms Incremento | 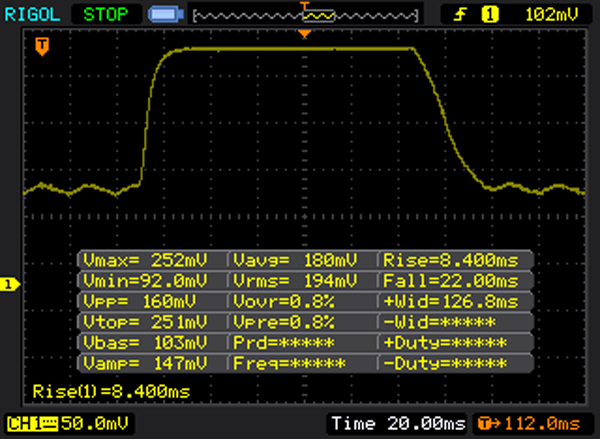 |
| ↘ 22 ms Calo | ||
| Lo schermo mostra tempi di risposta lenti nei nostri tests e sarà insoddisfacente per i gamers. In confronto, tutti i dispositivi di test variano da 0.1 (minimo) a 240 (massimo) ms. » 80 % di tutti i dispositivi è migliore. Questo significa che i tempi di risposta rilevati sono peggiori rispetto alla media di tutti i dispositivi testati (19.9 ms). | ||
| ↔ Tempo di risposta dal 50% Grigio all'80% Grigio | ||
| 36 ms ... aumenta ↗ e diminuisce ↘ combinato | ↗ 12 ms Incremento | 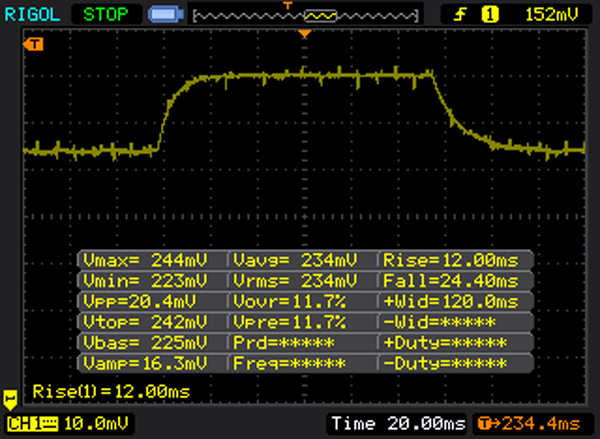 |
| ↘ 24 ms Calo | ||
| Lo schermo mostra tempi di risposta lenti nei nostri tests e sarà insoddisfacente per i gamers. In confronto, tutti i dispositivi di test variano da 0.165 (minimo) a 636 (massimo) ms. » 50 % di tutti i dispositivi è migliore. Questo significa che i tempi di risposta rilevati sono peggiori rispetto alla media di tutti i dispositivi testati (31.1 ms). | ||
| Acer Aspire R13 R7-372T-746N IPS, 2560x1440 | Acer Aspire R13 R7-372T IPS, 1920x1080 | Acer Aspire R13 R7-371T-779K IPS, 2560x1440 | HP Spectre x360 13-4104ng IPS, 2560x1440 | Lenovo Yoga 900-13ISK 80MK IPS, 3200x1800 | Asus Zenbook UX303UB-R4100T IPS, 1920x1080 | Asus Zenbook UX305CA-FB055T IPS, 3200x1800 | Dell XPS 13 2016 i7 256GB QHD IGZO , 3200x1800 | HP Envy 13-d000ng IPS, 3200x1800 | |
|---|---|---|---|---|---|---|---|---|---|
| Display | -8% | -5% | -9% | -5% | -14% | -7% | -8% | ||
| Display P3 Coverage (%) | 69.6 | 63.2 -9% | 66.8 -4% | 63.2 -9% | 66.9 -4% | 59.1 -15% | 63.6 -9% | 64 -8% | |
| sRGB Coverage (%) | 98 | 92.3 -6% | 92.8 -5% | 88.7 -9% | 92.3 -6% | 85.5 -13% | 93.6 -4% | 88.8 -9% | |
| AdobeRGB 1998 Coverage (%) | 70.7 | 64.3 -9% | 67.3 -5% | 64.9 -8% | 67.6 -4% | 61 -14% | 65.5 -7% | 65 -8% | |
| Response Times | -10% | 35% | 9% | -53% | 2% | -6% | 5% | ||
| Response Time Grey 50% / Grey 80% * (ms) | 36 ? | 48 ? -33% | 24 ? 33% | 38.8 ? -8% | 68 ? -89% | 38 ? -6% | 40 ? -11% | 37.6 ? -4% | |
| Response Time Black / White * (ms) | 30 ? | 26 ? 13% | 19 ? 37% | 22.4 ? 25% | 35 ? -17% | 27 ? 10% | 30 ? -0% | 26 ? 13% | |
| PWM Frequency (Hz) | 1000 ? | 1316 | 178 ? | 1429 ? | 4900 ? | 1316 ? | |||
| Screen | -17% | -17% | -23% | -49% | -19% | -32% | -15% | -38% | |
| Brightness middle (cd/m²) | 320 | 339 6% | 316 -1% | 324 1% | 319.8 0% | 385 20% | 390 22% | 285 -11% | 291 -9% |
| Brightness (cd/m²) | 308 | 331 7% | 305 -1% | 324 5% | 302 -2% | 394 28% | 352 14% | 281 -9% | 276 -10% |
| Brightness Distribution (%) | 91 | 90 -1% | 90 -1% | 90 -1% | 88 -3% | 89 -2% | 81 -11% | 90 -1% | 82 -10% |
| Black Level * (cd/m²) | 0.17 | 0.22 -29% | 0.23 -35% | 0.34 -100% | 0.835 -391% | 0.41 -141% | 0.69 -306% | 0.18 -6% | 0.63 -271% |
| Contrast (:1) | 1882 | 1541 -18% | 1374 -27% | 953 -49% | 383 -80% | 939 -50% | 565 -70% | 1583 -16% | 462 -75% |
| Colorchecker dE 2000 * | 3.18 | 5.72 -80% | 4.21 -32% | 4.36 -37% | 2.68 16% | 3.84 -21% | 3.04 4% | 4.89 -54% | 2.76 13% |
| Colorchecker dE 2000 max. * | 9.91 | 10.45 -5% | 7.01 29% | ||||||
| Greyscale dE 2000 * | 4.13 | 5.74 -39% | 5.16 -25% | 4.62 -12% | 2.35 43% | 3.79 8% | 2.88 30% | 5.16 -25% | 2.61 37% |
| Gamma | 2.03 108% | 2.18 101% | 2.58 85% | 2.18 101% | 2.09 105% | 2.23 99% | 2.43 91% | 2.15 102% | 2.31 95% |
| CCT | 6752 96% | 7393 88% | 6934 94% | 6857 95% | 6975 93% | 6499 100% | 6848 95% | 7106 91% | 6731 97% |
| Color Space (Percent of AdobeRGB 1998) (%) | 65 | 59 -9% | 60 -8% | 57 -12% | 60 -8% | 55 -15% | 59 -9% | 57.5 -12% | |
| Color Space (Percent of sRGB) (%) | 98 | 92 -6% | 93 -5% | 88 -10% | 92 -6% | 85 -13% | 93 -5% | 88.7 -9% | |
| Media totale (Programma / Settaggio) | -12% /
-15% | -17% /
-17% | 2% /
-11% | -16% /
-32% | -26% /
-21% | -15% /
-24% | -9% /
-12% | -14% /
-26% |
* ... Meglio usare valori piccoli
| Cinebench R15 | |
| CPU Multi 64Bit (ordina per valore) | |
| Acer Aspire R13 R7-372T-746N | |
| Acer Aspire R13 R7-372T | |
| Acer Aspire R7-371T-52EL | |
| Acer Aspire R13 R7-371T-779K | |
| HP Spectre x360 13-4104ng | |
| Lenovo Yoga 900-13ISK 80MK | |
| Asus Zenbook UX303UB-R4100T | |
| Asus Zenbook UX305CA-FB055T | |
| Dell XPS 13 2016 i7 256GB QHD | |
| CPU Single 64Bit (ordina per valore) | |
| Acer Aspire R13 R7-372T-746N | |
| Acer Aspire R13 R7-372T | |
| Acer Aspire R7-371T-52EL | |
| Acer Aspire R13 R7-371T-779K | |
| HP Spectre x360 13-4104ng | |
| Lenovo Yoga 900-13ISK 80MK | |
| Asus Zenbook UX303UB-R4100T | |
| Asus Zenbook UX305CA-FB055T | |
| Dell XPS 13 2016 i7 256GB QHD | |
| Cinebench R11.5 | |
| CPU Multi 64Bit (ordina per valore) | |
| Acer Aspire R13 R7-372T-746N | |
| Acer Aspire R13 R7-372T | |
| Acer Aspire R7-371T-52EL | |
| Acer Aspire R13 R7-371T-779K | |
| HP Spectre x360 13-4104ng | |
| Lenovo Yoga 900-13ISK 80MK | |
| Asus Zenbook UX303UB-R4100T | |
| Asus Zenbook UX305CA-FB055T | |
| Dell XPS 13 2016 i7 256GB QHD | |
| CPU Single 64Bit (ordina per valore) | |
| Acer Aspire R13 R7-372T-746N | |
| Acer Aspire R13 R7-372T | |
| Acer Aspire R7-371T-52EL | |
| Acer Aspire R13 R7-371T-779K | |
| HP Spectre x360 13-4104ng | |
| Lenovo Yoga 900-13ISK 80MK | |
| Asus Zenbook UX303UB-R4100T | |
| Asus Zenbook UX305CA-FB055T | |
| Dell XPS 13 2016 i7 256GB QHD | |
| Cinebench R10 | |
| Rendering Multiple CPUs 32Bit (ordina per valore) | |
| Acer Aspire R13 R7-372T-746N | |
| Acer Aspire R13 R7-372T | |
| Acer Aspire R7-371T-52EL | |
| HP Spectre x360 13-4104ng | |
| Lenovo Yoga 900-13ISK 80MK | |
| Asus Zenbook UX303UB-R4100T | |
| Asus Zenbook UX305CA-FB055T | |
| Dell XPS 13 2016 i7 256GB QHD | |
| Rendering Single 32Bit (ordina per valore) | |
| Acer Aspire R13 R7-372T-746N | |
| Acer Aspire R13 R7-372T | |
| Acer Aspire R7-371T-52EL | |
| HP Spectre x360 13-4104ng | |
| Lenovo Yoga 900-13ISK 80MK | |
| Asus Zenbook UX303UB-R4100T | |
| Asus Zenbook UX305CA-FB055T | |
| Dell XPS 13 2016 i7 256GB QHD | |
| Geekbench 3 | |
| 32 Bit Single-Core Score (ordina per valore) | |
| Acer Aspire R13 R7-372T-746N | |
| Acer Aspire R13 R7-372T | |
| Acer Aspire R7-371T-52EL | |
| HP Spectre x360 13-4104ng | |
| Asus Zenbook UX303UB-R4100T | |
| Asus Zenbook UX305CA-FB055T | |
| 32 Bit Multi-Core Score (ordina per valore) | |
| Acer Aspire R13 R7-372T-746N | |
| Acer Aspire R13 R7-372T | |
| Acer Aspire R7-371T-52EL | |
| HP Spectre x360 13-4104ng | |
| Asus Zenbook UX303UB-R4100T | |
| Asus Zenbook UX305CA-FB055T | |
| Sunspider - 1.0 Total Score (ordina per valore) | |
| Acer Aspire R13 R7-372T-746N | |
| Acer Aspire R13 R7-372T | |
| Acer Aspire R7-371T-52EL | |
| Acer Aspire R13 R7-371T-779K | |
| HP Spectre x360 13-4104ng | |
| Asus Zenbook UX303UB-R4100T | |
| Asus Zenbook UX305CA-FB055T | |
| Dell XPS 13 2016 i7 256GB QHD | |
| JetStream 1.1 - 1.1 Total (ordina per valore) | |
| Acer Aspire R13 R7-372T-746N | |
| Acer Aspire R13 R7-372T | |
| Asus Zenbook UX303UB-R4100T | |
| Asus Zenbook UX305CA-FB055T | |
| Mozilla Kraken 1.1 - Total (ordina per valore) | |
| Acer Aspire R13 R7-372T-746N | |
| Acer Aspire R13 R7-372T | |
| Acer Aspire R7-371T-52EL | |
| Acer Aspire R13 R7-371T-779K | |
| HP Spectre x360 13-4104ng | |
| Asus Zenbook UX303UB-R4100T | |
| Asus Zenbook UX305CA-FB055T | |
| Dell XPS 13 2016 i7 256GB QHD | |
| Octane V2 - Total Score (ordina per valore) | |
| Acer Aspire R13 R7-372T-746N | |
| Acer Aspire R13 R7-372T | |
| Acer Aspire R7-371T-52EL | |
| Acer Aspire R13 R7-371T-779K | |
| HP Spectre x360 13-4104ng | |
| Asus Zenbook UX303UB-R4100T | |
| Asus Zenbook UX305CA-FB055T | |
| Dell XPS 13 2016 i7 256GB QHD | |
| Peacekeeper - --- (ordina per valore) | |
| Acer Aspire R13 R7-372T-746N | |
| Acer Aspire R13 R7-372T | |
| Acer Aspire R7-371T-52EL | |
| Asus Zenbook UX303UB-R4100T | |
| Asus Zenbook UX305CA-FB055T | |
* ... Meglio usare valori piccoli
| PCMark 7 Score | 5415 punti | |
| PCMark 8 Home Score Accelerated v2 | 3161 punti | |
| PCMark 8 Creative Score Accelerated v2 | 3987 punti | |
| PCMark 8 Work Score Accelerated v2 | 3971 punti | |
Aiuto | ||
| PCMark 8 - Home Score Accelerated v2 (ordina per valore) | |
| Acer Aspire R13 R7-372T-746N | |
| Acer Aspire R13 R7-372T | |
| Acer Aspire R7-371T-52EL | |
| Acer Aspire R13 R7-371T-779K | |
| Lenovo Yoga 900-13ISK 80MK | |
| Asus Zenbook UX303UB-R4100T | |
| Asus Zenbook UX305CA-FB055T | |
| Dell XPS 13 2016 i7 256GB QHD | |
| PCMark 7 - Score (ordina per valore) | |
| Acer Aspire R13 R7-372T-746N | |
| Acer Aspire R13 R7-372T | |
| Acer Aspire R13 R7-371T-779K | |
| HP Spectre x360 13-4104ng | |
| HP Spectre x360 13-4104ng | |
| Lenovo Yoga 900-13ISK 80MK | |
| Asus Zenbook UX303UB-R4100T | |
| Asus Zenbook UX305CA-FB055T | |
| Dell XPS 13 2016 i7 256GB QHD | |

| 3DMark 06 Standard Score | 9829 punti | |
| 3DMark 11 Performance | 1596 punti | |
| 3DMark Ice Storm Standard Score | 57060 punti | |
| 3DMark Cloud Gate Standard Score | 6139 punti | |
| 3DMark Fire Strike Score | 847 punti | |
Aiuto | ||
| 3DMark 11 - 1280x720 Performance (ordina per valore) | |
| Acer Aspire R13 R7-372T-746N | |
| Acer Aspire R13 R7-372T | |
| Acer Aspire R7-371T-52EL | |
| Acer Aspire R13 R7-371T-779K | |
| HP Spectre x360 13-4104ng | |
| HP Spectre x360 13-4104ng | |
| Lenovo Yoga 900-13ISK 80MK | |
| Asus Zenbook UX303UB-R4100T | |
| Asus Zenbook UX305CA-FB055T | |
| Dell XPS 13 2016 i7 256GB QHD | |
| 3DMark 06 - 1280x1024 Standard Score AA:0x AF:0x (ordina per valore) | |
| Acer Aspire R13 R7-372T-746N | |
| Acer Aspire R13 R7-372T | |
| HP Spectre x360 13-4104ng | |
| Asus Zenbook UX303UB-R4100T | |
| Asus Zenbook UX305CA-FB055T | |
| basso | medio | alto | ultra | |
|---|---|---|---|---|
| Tomb Raider (2013) | 79.5 | 41 | 25.1 | 11.4 |
| BioShock Infinite (2013) | 57.3 | 29.6 | 24.7 | 7.2 |
| Battlefield 4 (2013) | 45.7 | 32.4 | 21.1 | 6.2 |
| Far Cry Primal (2016) | 15 | 7 | ||
| Hitman 2016 (2016) | 20.4 | 14.5 |
Rumorosità
| Idle |
| 31.3 / 31.3 / 31.8 dB(A) |
| Sotto carico |
| 39.2 / 39.1 dB(A) |
 | ||
30 dB silenzioso 40 dB(A) udibile 50 dB(A) rumoroso |
||
min: | ||
| Acer Aspire R13 R7-372T-746N 6500U, HD Graphics 520 | Acer Aspire R13 R7-372T 6200U, HD Graphics 520 | Acer Aspire R13 R7-371T-779K 4510U, HD Graphics 4400 | HP Spectre x360 13-4104ng 6200U, HD Graphics 520 | Lenovo Yoga 900-13ISK 80MK 6500U, HD Graphics 520 | Asus Zenbook UX303UB-R4100T 6500U, GeForce 940M | Asus Zenbook UX305CA-FB055T 6Y75, HD Graphics 515 | Dell XPS 13 2016 i7 256GB QHD 6500U, HD Graphics 520 | HP Envy 13-d000ng 6200U, HD Graphics 520 | |
|---|---|---|---|---|---|---|---|---|---|
| Noise | -1% | 2% | 3% | 7% | 2% | 7% | 2% | 2% | |
| off /ambiente * (dB) | 31.3 | 31.3 -0% | |||||||
| Idle Minimum * (dB) | 31.3 | 31.5 -1% | 30.9 1% | 29.6 5% | 29.7 5% | 31.5 -1% | 31.3 -0% | 31.8 -2% | 31.5 -1% |
| Idle Average * (dB) | 31.3 | 31.5 -1% | 30.9 1% | 29.6 5% | 29.8 5% | 31.5 -1% | 31.3 -0% | 31.8 -2% | 31.5 -1% |
| Idle Maximum * (dB) | 31.8 | 31.7 -0% | 32 -1% | 34.6 -9% | 30 6% | 31.5 1% | 31.3 2% | 34.8 -9% | 31.5 1% |
| Load Average * (dB) | 39.2 | 39.7 -1% | 37.6 4% | 34.7 11% | 32 18% | 35.9 8% | 31.3 20% | 34.8 11% | 35.6 9% |
| Load Maximum * (dB) | 39.1 | 39.4 -1% | 37.6 4% | 37.9 3% | 38.5 2% | 38.2 2% | 31.3 20% | 34.8 11% | 38.8 1% |
* ... Meglio usare valori piccoli
(±) La temperatura massima sul lato superiore è di 40 °C / 104 F, rispetto alla media di 35.4 °C / 96 F, che varia da 19.6 a 60 °C per questa classe Convertible.
(+) Il lato inferiore si riscalda fino ad un massimo di 37.6 °C / 100 F, rispetto alla media di 36.9 °C / 98 F
(+) In idle, la temperatura media del lato superiore è di 23.7 °C / 75 F, rispetto alla media deld ispositivo di 30.3 °C / 87 F.
(+) I poggiapolsi e il touchpad sono piu' freddi della temperatura della pelle con un massimo di 24.9 °C / 76.8 F e sono quindi freddi al tatto.
(+) La temperatura media della zona del palmo della mano di dispositivi simili e'stata di 28 °C / 82.4 F (+3.1 °C / 5.6 F).
| Acer Aspire R13 R7-372T-746N 6500U, HD Graphics 520 | Acer Aspire R13 R7-372T 6200U, HD Graphics 520 | Acer Aspire R13 R7-371T-779K 4510U, HD Graphics 4400 | HP Spectre x360 13-4104ng 6200U, HD Graphics 520 | Lenovo Yoga 900-13ISK 80MK 6500U, HD Graphics 520 | Asus Zenbook UX303UB-R4100T 6500U, GeForce 940M | Asus Zenbook UX305CA-FB055T 6Y75, HD Graphics 515 | Dell XPS 13 2016 i7 256GB QHD 6500U, HD Graphics 520 | HP Envy 13-d000ng 6200U, HD Graphics 520 | |
|---|---|---|---|---|---|---|---|---|---|
| Heat | -9% | -22% | -5% | 1% | -19% | -1% | -40% | -30% | |
| Maximum Upper Side * (°C) | 40 | 45.2 -13% | 46 -15% | 39.6 1% | 37.4 6% | 56.6 -42% | 39.1 2% | 57 -43% | 49.8 -24% |
| Maximum Bottom * (°C) | 37.6 | 41 -9% | 51.8 -38% | 39.7 -6% | 36.4 3% | 54.3 -44% | 38.7 -3% | 56 -49% | 50.9 -35% |
| Idle Upper Side * (°C) | 25.1 | 26.9 -7% | 28.5 -14% | 25 -0% | 26.6 -6% | 24 4% | 26 -4% | 34.1 -36% | 33.3 -33% |
| Idle Bottom * (°C) | 26 | 27.6 -6% | 31.1 -20% | 29.8 -15% | 25.6 2% | 24.2 7% | 25.7 1% | 34.3 -32% | 32.7 -26% |
* ... Meglio usare valori piccoli
| Off / Standby | |
| Idle | |
| Sotto carico |
|
Leggenda:
min: | |
| Acer Aspire R13 R7-372T-746N 6500U, HD Graphics 520 | Acer Aspire R13 R7-372T 6200U, HD Graphics 520 | Acer Aspire R13 R7-371T-779K 4510U, HD Graphics 4400 | HP Spectre x360 13-4104ng 6200U, HD Graphics 520 | Asus Zenbook UX303UB-R4100T 6500U, GeForce 940M | Asus Zenbook UX305CA-FB055T 6Y75, HD Graphics 515 | Dell XPS 13 2016 i7 256GB QHD 6500U, HD Graphics 520 | HP Envy 13-d000ng 6200U, HD Graphics 520 | |
|---|---|---|---|---|---|---|---|---|
| Power Consumption | 13% | 21% | 24% | 3% | 30% | 1% | 0% | |
| Idle Minimum * (Watt) | 6.2 | 5.1 18% | 4.8 23% | 3.9 37% | 3.2 48% | 4.2 32% | 6.8 -10% | 5.4 13% |
| Idle Average * (Watt) | 8 | 7.2 10% | 8.2 -2% | 7.4 7% | 7.6 5% | 8.4 -5% | 10 -25% | 10.1 -26% |
| Idle Maximum * (Watt) | 11.6 | 9 22% | 8.3 28% | 9.2 21% | 8 31% | 8.9 23% | 10.5 9% | 11.1 4% |
| Load Average * (Watt) | 40 | 34.2 14% | 27 32% | 28.1 30% | 47 -18% | 15.9 60% | 30.2 24% | 32.1 20% |
| Load Maximum * (Watt) | 36.6 | 37 -1% | 28.3 23% | 27.6 25% | 55 -50% | 22.5 39% | 33.6 8% | 40.1 -10% |
* ... Meglio usare valori piccoli
| Acer Aspire R13 R7-372T-746N 49 Wh | Acer Aspire R13 R7-372T 50 Wh | Acer Aspire R13 R7-371T-779K 61 Wh | HP Spectre x360 13-4104ng 56 Wh | Lenovo Yoga 900-13ISK 80MK 66 Wh | Asus Zenbook UX303UB-R4100T 50 Wh | Asus Zenbook UX305CA-FB055T 45 Wh | Dell XPS 13 2016 i7 256GB QHD 56 Wh | HP Envy 13-d000ng 45 Wh | |
|---|---|---|---|---|---|---|---|---|---|
| Autonomia della batteria | 14% | 17% | 30% | 27% | 26% | 44% | 17% | -6% | |
| Reader / Idle (h) | 11.2 | 12.3 10% | 8.7 -22% | 14.1 26% | 16.6 48% | 16.9 51% | 13.1 17% | 8.6 -23% | |
| H.264 (h) | 6.6 | 6.7 2% | 6.2 -6% | 6.9 5% | 7 6% | 5.7 -14% | |||
| WiFi v1.3 (h) | 6.4 | 7.4 16% | 8.3 30% | 6.7 5% | 6.8 6% | 6.7 5% | 7.2 13% | 5.4 -16% | |
| Load (h) | 1.4 | 1.8 29% | 2.5 79% | 2.1 50% | 2 43% | 3 114% | 1.7 21% | 1.8 29% | |
| WiFi (h) | 6.6 |
Pro
Contro
Il convertibile Acer ha potenza più che sufficiente per le varie applicazioni quotidiane che possono incontrarsi. La GPU integrata offre -unitamente alla RAM dual-channel - performance sufficienti per consentire almeno in parte il gaming. Il portatile non si scalda molto e resta quasi sempre silenzioso. Grazie al veloce SSD, l'Acer è molto reattivo. In aggiunta, i dispositivi di input sono molto buoni, l'autonomia è discreta, e il convertibile monta una porta Thunderbolt 3. La feature principale è il display WQHD. Grazie alla tecnologia IPS, gli angoli di visuale sono stabili, sebbene i colori sbiadiscano ad angolazioni estreme.
L'Aspire con WQHD è abbastanza impressionante e non troviamo evidenti pecche. Coloro che cercano mobilità dovrebbero considerare le versione Full-HD, in quanto l'autonomia è migliore.
Nota: si tratta di una recensione breve, con alcune sezioni non tradotte, per la versione integrale in inglese guardate qui.
Acer Aspire R13 R7-372T-746N
- 04/18/2016 v5.1 (old)
Sascha Mölck
Price comparison
