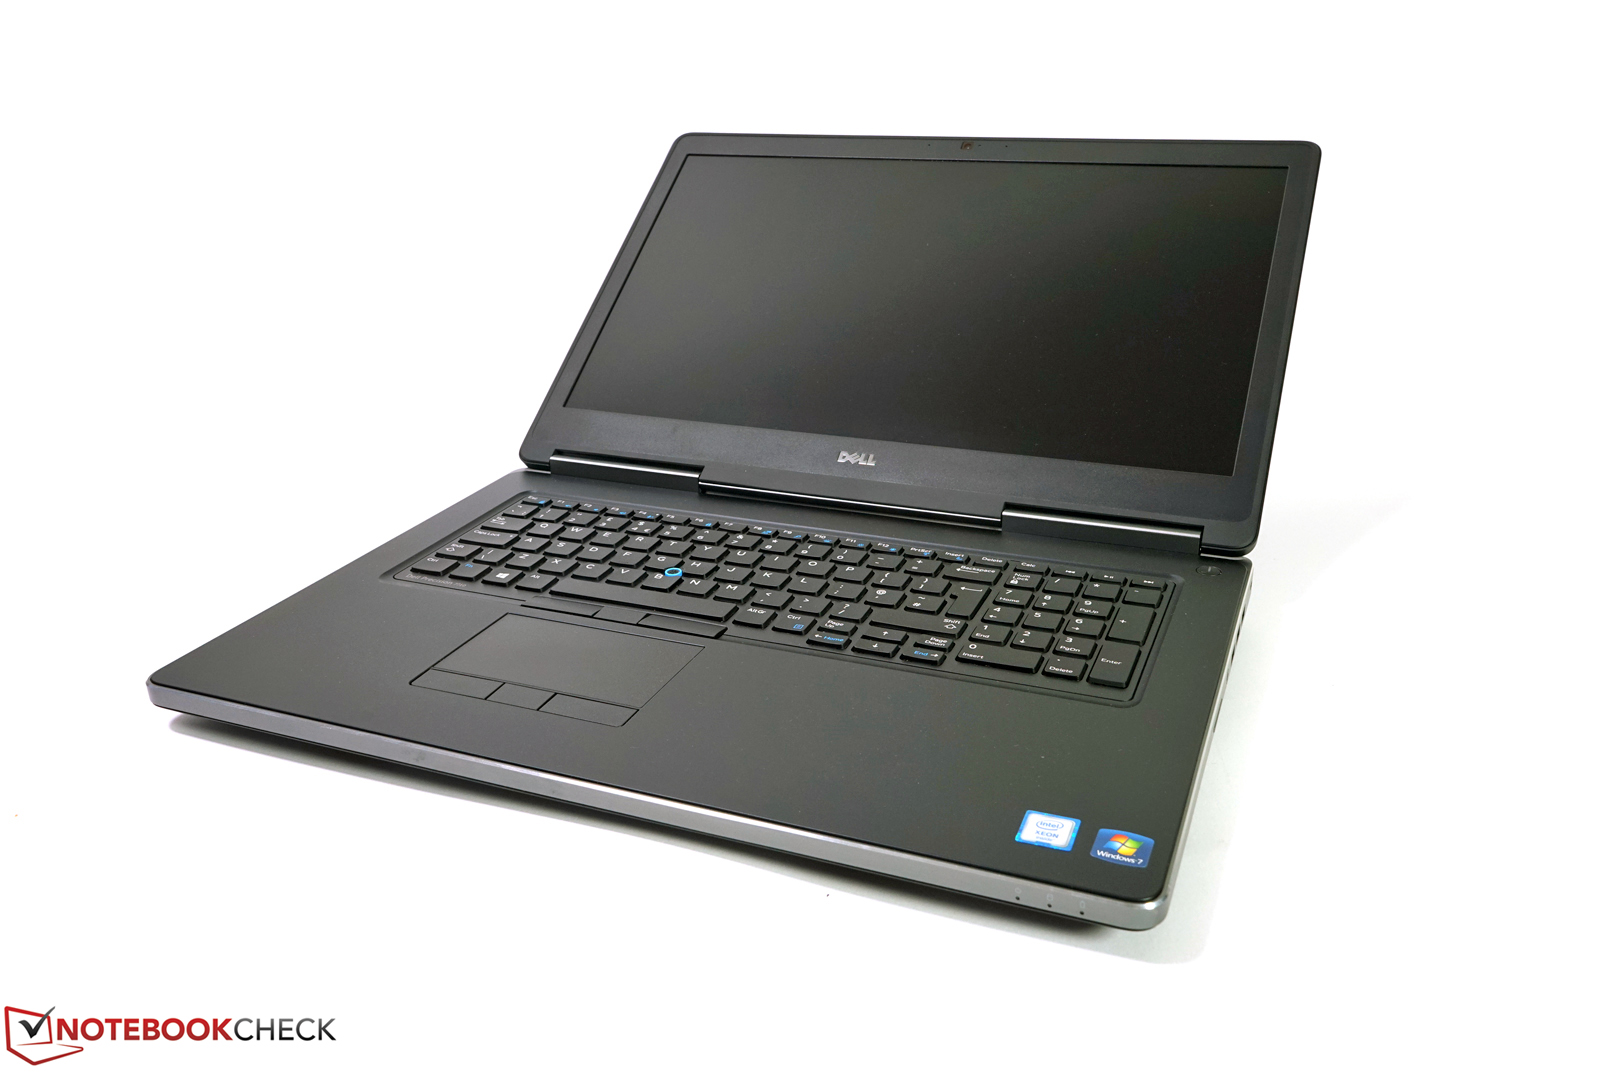
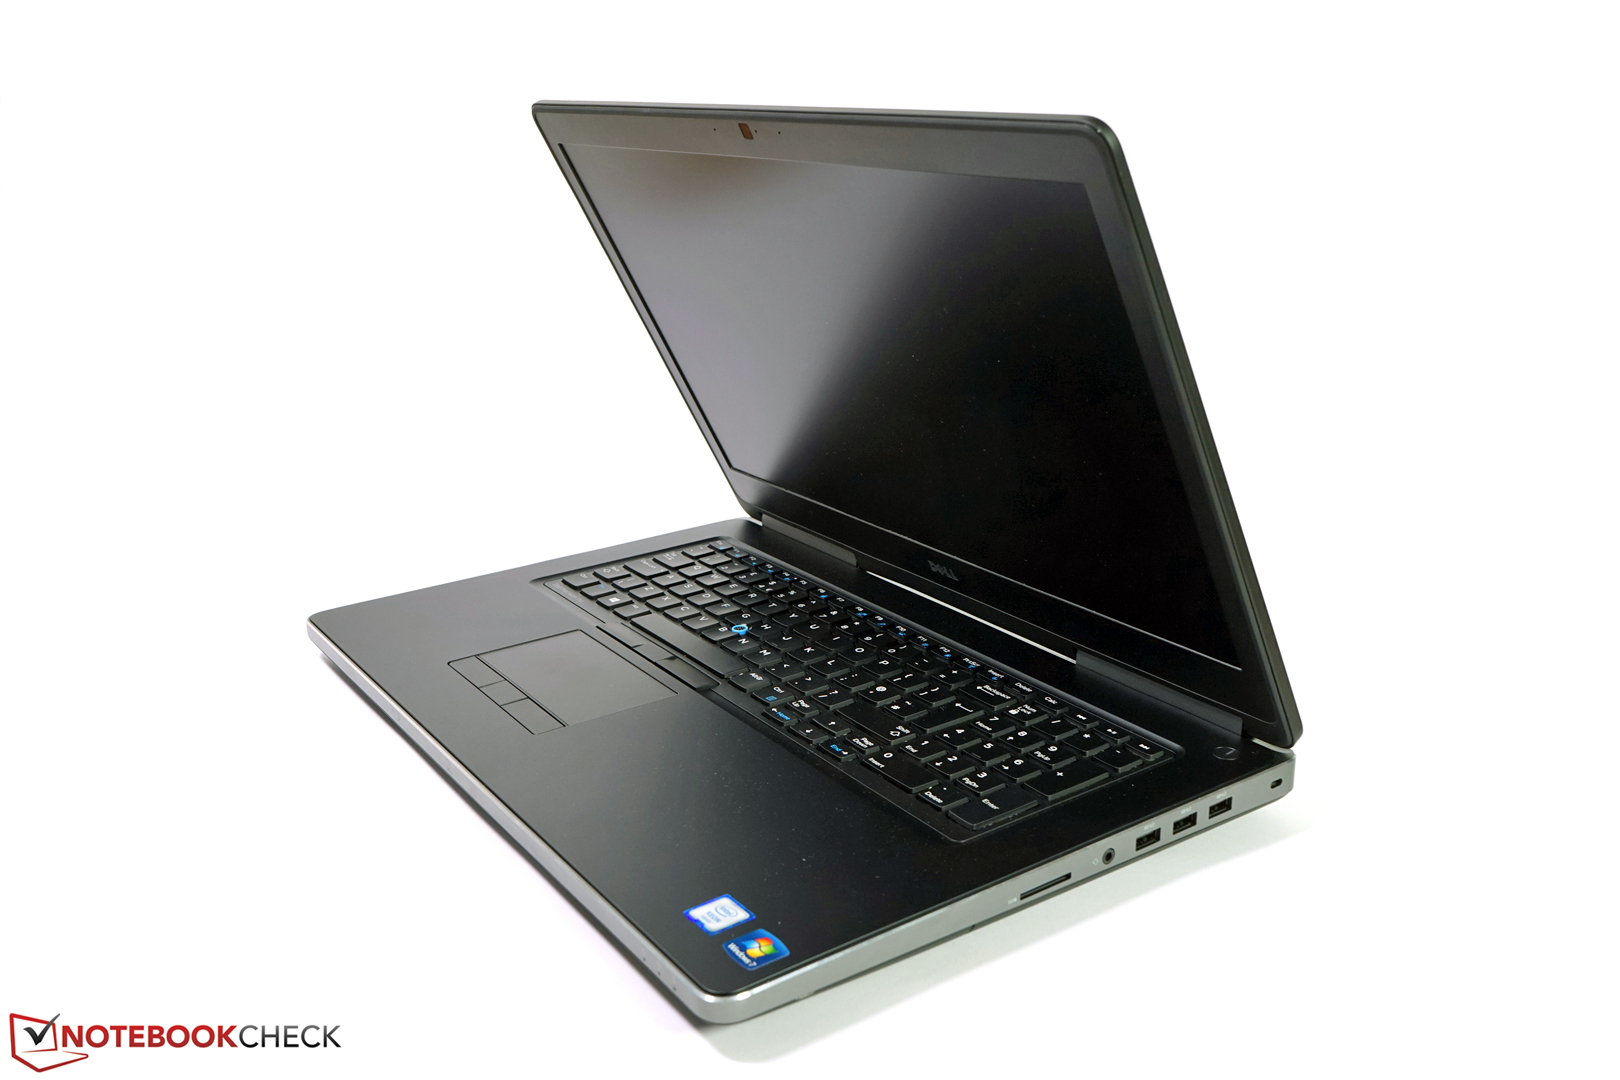
Recensione breve della Workstation Dell Precision 7720 (Xeon, P5000, 4K)
Sfarfallio dello schermo / PWM (Pulse-Width Modulation)
| flickering dello schermo / PWM rilevato | 1020 Hz | ≤ 20 % settaggio luminosita' | 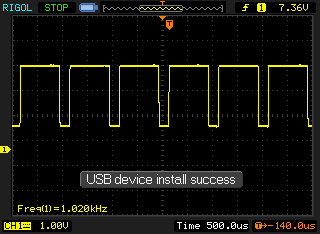 |
Il display sfarfalla a 1020 Hz (Probabilmente a causa dell'uso di PWM) Flickering rilevato ad una luminosita' di 20 % o inferiore. Non dovrebbe verificarsi flickering o PWM sopra questo valore di luminosita'. La frequenza di 1020 Hz è abbastanza alta, quindi la maggioranza degli utenti sensibili al PWM non dovrebbero notare alcun flickering. In confronto: 52 % di tutti i dispositivi testati non utilizza PWM per ridurre la luminosita' del display. Se è rilevato PWM, una media di 7772 (minimo: 5 - massimo: 343500) Hz è stata rilevata. | |||
| |||||||||||||||||||||||||
Distribuzione della luminosità: 89 %
Al centro con la batteria: 462 cd/m²
Contrasto: 1031:1 (Nero: 0.45 cd/m²)
ΔE ColorChecker Calman: 3.2 | ∀{0.5-29.43 Ø4.72}
ΔE Greyscale Calman: 4.2 | ∀{0.09-98 Ø4.97}
100% sRGB (Argyll 1.6.3 3D)
88.1% AdobeRGB 1998 (Argyll 1.6.3 3D)
99.2% AdobeRGB 1998 (Argyll 3D)
100% sRGB (Argyll 3D)
87.6% Display P3 (Argyll 3D)
Gamma: 2.01
CCT: 6736 K
| Dell Precision 7720 SHP1446 (LQ173D1), , 3840x2160, 17.3" | Lenovo ThinkPad P71-20HK0004GE LEN4123, VVX17P051J00, , 3840x2160, 17.3" | HP ZBook 17 G4-Y3J82AV Sharp SHP144C, , 3840x2160, 17.3" | MSI WE72 7RJ LP173WF4-SPF1, , 1920x1080, 17.3" | Fujitsu Celsius H970 LP173WF4-SPF3, , 1920x1080, 17.3" | Dell Precision 7710 SDC8151, VHN17_173HL, , 1920x1080, 17.3" | |
|---|---|---|---|---|---|---|
| Display | 0% | -25% | -26% | -19% | ||
| Display P3 Coverage (%) | 87.6 | 88 0% | 67.4 -23% | 66.8 -24% | 66.6 -24% | |
| sRGB Coverage (%) | 100 | 100 0% | 85.3 -15% | 84.6 -15% | 96.9 -3% | |
| AdobeRGB 1998 Coverage (%) | 99.2 | 99.6 0% | 62.4 -37% | 61.8 -38% | 68.6 -31% | |
| Response Times | 43% | 11% | 34% | 45% | 20% | |
| Response Time Grey 50% / Grey 80% * (ms) | 60 ? | 39.2 ? 35% | 56.8 ? 5% | 45.2 ? 25% | 32 ? 47% | 50 ? 17% |
| Response Time Black / White * (ms) | 46.4 ? | 23.2 ? 50% | 38.4 ? 17% | 26.4 ? 43% | 26.4 ? 43% | 36 ? 22% |
| PWM Frequency (Hz) | 1020 ? | 1412 ? | 1020 ? | 198 ? | ||
| Screen | 10% | 17% | -33% | -28% | -7% | |
| Brightness middle (cd/m²) | 464 | 358 -23% | 391 -16% | 302 -35% | 368 -21% | 332 -28% |
| Brightness (cd/m²) | 441 | 338 -23% | 360 -18% | 306 -31% | 360 -18% | 307 -30% |
| Brightness Distribution (%) | 89 | 83 -7% | 87 -2% | 93 4% | 91 2% | 83 -7% |
| Black Level * (cd/m²) | 0.45 | 0.31 31% | 0.35 22% | 0.31 31% | 0.3 33% | 0.33 27% |
| Contrast (:1) | 1031 | 1155 12% | 1117 8% | 974 -6% | 1227 19% | 1006 -2% |
| Colorchecker dE 2000 * | 3.2 | 2.1 34% | 1.3 59% | 6.2 -94% | 6.4 -100% | 3 6% |
| Colorchecker dE 2000 max. * | 6.1 | 3.6 41% | 2.5 59% | 10.6 -74% | 10.1 -66% | |
| Greyscale dE 2000 * | 4.2 | 2 52% | 1.8 57% | 7.3 -74% | 7.2 -71% | 4 5% |
| Gamma | 2.01 109% | 2.16 102% | 2.11 104% | 2.08 106% | 2.02 109% | 2 110% |
| CCT | 6736 96% | 6216 105% | 6461 101% | 7020 93% | 6882 94% | 7089 92% |
| Color Space (Percent of AdobeRGB 1998) (%) | 88.1 | 77 -13% | 87.9 0% | 56 -36% | 55.5 -37% | 62 -30% |
| Color Space (Percent of sRGB) (%) | 100 | 99.97 0% | 100 0% | 85.2 -15% | 84.4 -16% | 97 -3% |
| Media totale (Programma / Settaggio) | 27% /
16% | 9% /
13% | -8% /
-22% | -3% /
-17% | -2% /
-6% |
* ... Meglio usare valori piccoli
Tempi di risposta del Display
| ↔ Tempi di risposta dal Nero al Bianco | ||
|---|---|---|
| 46.4 ms ... aumenta ↗ e diminuisce ↘ combinato | ↗ 28.4 ms Incremento | 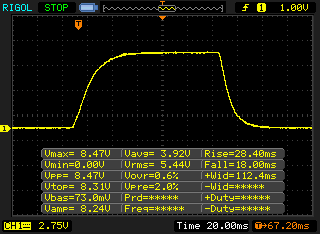 |
| ↘ 18 ms Calo | ||
| Lo schermo mostra tempi di risposta lenti nei nostri tests e sarà insoddisfacente per i gamers. In confronto, tutti i dispositivi di test variano da 0.1 (minimo) a 240 (massimo) ms. » 99 % di tutti i dispositivi è migliore. Questo significa che i tempi di risposta rilevati sono peggiori rispetto alla media di tutti i dispositivi testati (19.8 ms). | ||
| ↔ Tempo di risposta dal 50% Grigio all'80% Grigio | ||
| 60 ms ... aumenta ↗ e diminuisce ↘ combinato | ↗ 26.8 ms Incremento | 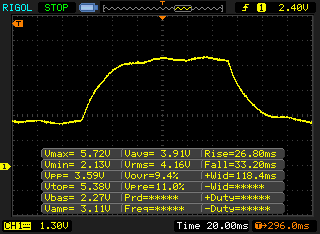 |
| ↘ 33.2 ms Calo | ||
| Lo schermo mostra tempi di risposta lenti nei nostri tests e sarà insoddisfacente per i gamers. In confronto, tutti i dispositivi di test variano da 0.165 (minimo) a 636 (massimo) ms. » 96 % di tutti i dispositivi è migliore. Questo significa che i tempi di risposta rilevati sono peggiori rispetto alla media di tutti i dispositivi testati (31 ms). | ||
| PCMark 8 | |
| Home Score Accelerated v2 | |
| Dell Precision 7710 | |
| HP ZBook 17 G4-Y3J82AV | |
| MSI WE72 7RJ | |
| Dell Precision 7720 | |
| Lenovo ThinkPad P71-20HK0004GE | |
| Work Score Accelerated v2 | |
| Dell Precision 7710 | |
| Fujitsu Celsius H970 | |
| MSI WE72 7RJ | |
| HP ZBook 17 G4-Y3J82AV | |
| Dell Precision 7720 | |
| Creative Score Accelerated v2 | |
| HP ZBook 17 G4-Y3J82AV | |
| Fujitsu Celsius H970 | |
| Lenovo ThinkPad P71-20HK0004GE | |
| Dell Precision 7710 | |
| Dell Precision 7720 | |
| PCMark 10 - Score | |
| HP ZBook 17 G4-Y3J82AV | |
| Dell Precision 7720 | |
| Fujitsu Celsius H970 | |
| PCMark 8 Home Score Accelerated v2 | 3772 punti | |
| PCMark 8 Creative Score Accelerated v2 | 5498 punti | |
| PCMark 8 Work Score Accelerated v2 | 4460 punti | |
| PCMark 10 Score | 5248 punti | |
Aiuto | ||

| LuxMark v2.0 64Bit | |
| Room GPUs-only | |
| Dell Precision 7720 | |
| HP ZBook 17 G4-Y3J82AV | |
| Fujitsu Celsius H970 | |
| Lenovo ThinkPad P71-20HK0004GE | |
| MSI WT72-6QM | |
| MSI WE72 7RJ | |
| Dell Precision 7710 | |
| Sala GPUs-only | |
| Dell Precision 7720 | |
| HP ZBook 17 G4-Y3J82AV | |
| Fujitsu Celsius H970 | |
| Lenovo ThinkPad P71-20HK0004GE | |
| MSI WT72-6QM | |
| MSI WE72 7RJ | |
| Dell Precision 7710 | |
| SiSoft Sandra 2016 | |
| Image Processing | |
| Dell Precision 7720 | |
| HP ZBook 17 G4-Y3J82AV | |
| Dell Precision 7710 | |
| Lenovo ThinkPad P71-20HK0004GE | |
| GP Cryptography (Higher Security AES256+SHA2-512) | |
| HP ZBook 17 G4-Y3J82AV | |
| Dell Precision 7720 | |
| Lenovo ThinkPad P71-20HK0004GE | |
| Dell Precision 7710 | |
| GP Financial Analysis (FP High/Double Precision) | |
| Dell Precision 7720 | |
| HP ZBook 17 G4-Y3J82AV | |
| Dell Precision 7710 | |
| Lenovo ThinkPad P71-20HK0004GE | |
| Unigine Heaven 4.0 | |
| Extreme Preset DX11 | |
| Schenker XMG U507 2017 | |
| Asus Zephyrus GX501 | |
| Dell Precision 7720 | |
| HP ZBook 17 G4-Y3J82AV | |
| Lenovo ThinkPad P71-20HK0004GE | |
| MSI WE72 7RJ | |
| Extreme Preset OpenGL | |
| Dell Precision 7720 | |
| HP ZBook 17 G4-Y3J82AV | |
| Lenovo ThinkPad P71-20HK0004GE | |
| MSI WE72 7RJ | |
| Unigine Valley 1.0 | |
| 1920x1080 Extreme HD DirectX AA:x8 | |
| HP ZBook 17 G4-Y3J82AV | |
| Dell Precision 7720 | |
| Lenovo ThinkPad P71-20HK0004GE | |
| MSI WT72-6QM | |
| Dell Precision 7710 | |
| MSI WE72 7RJ | |
| 1920x1080 Extreme HD Preset OpenGL AA:x8 | |
| HP ZBook 17 G4-Y3J82AV | |
| Dell Precision 7720 | |
| Lenovo ThinkPad P71-20HK0004GE | |
| Dell Precision 7710 | |
| MSI WE72 7RJ | |
| 3DMark 11 Performance | 16158 punti | |
| 3DMark Ice Storm Standard Score | 58131 punti | |
| 3DMark Cloud Gate Standard Score | 28999 punti | |
| 3DMark Fire Strike Score | 12298 punti | |
| 3DMark Time Spy Score | 4823 punti | |
Aiuto | ||
| basso | medio | alto | ultra | 4K | |
|---|---|---|---|---|---|
| The Witcher 3 (2015) | 53.4 | 36 | |||
| Star Wars Battlefront (2015) | 118.5 | 44 | |||
| Rainbow Six Siege (2015) | 55.6 | ||||
| Rise of the Tomb Raider (2016) | 97.9 | 84 | 35.8 | ||
| Battlefield 1 (2016) | 40.8 | ||||
| For Honor (2017) | 127.9 | 121.1 | 95.1 | 37.6 | |
| Ghost Recon Wildlands (2017) | 83.9 | 76.5 | 42.8 | 27.5 | |
| Prey (2017) | 125.2 | 47.8 |
Rumorosità
| Idle |
| 29.5 / 29.5 / 29.5 dB(A) |
| Sotto carico |
| 35 / 47.8 dB(A) |
 | ||
30 dB silenzioso 40 dB(A) udibile 50 dB(A) rumoroso |
||
min: | ||
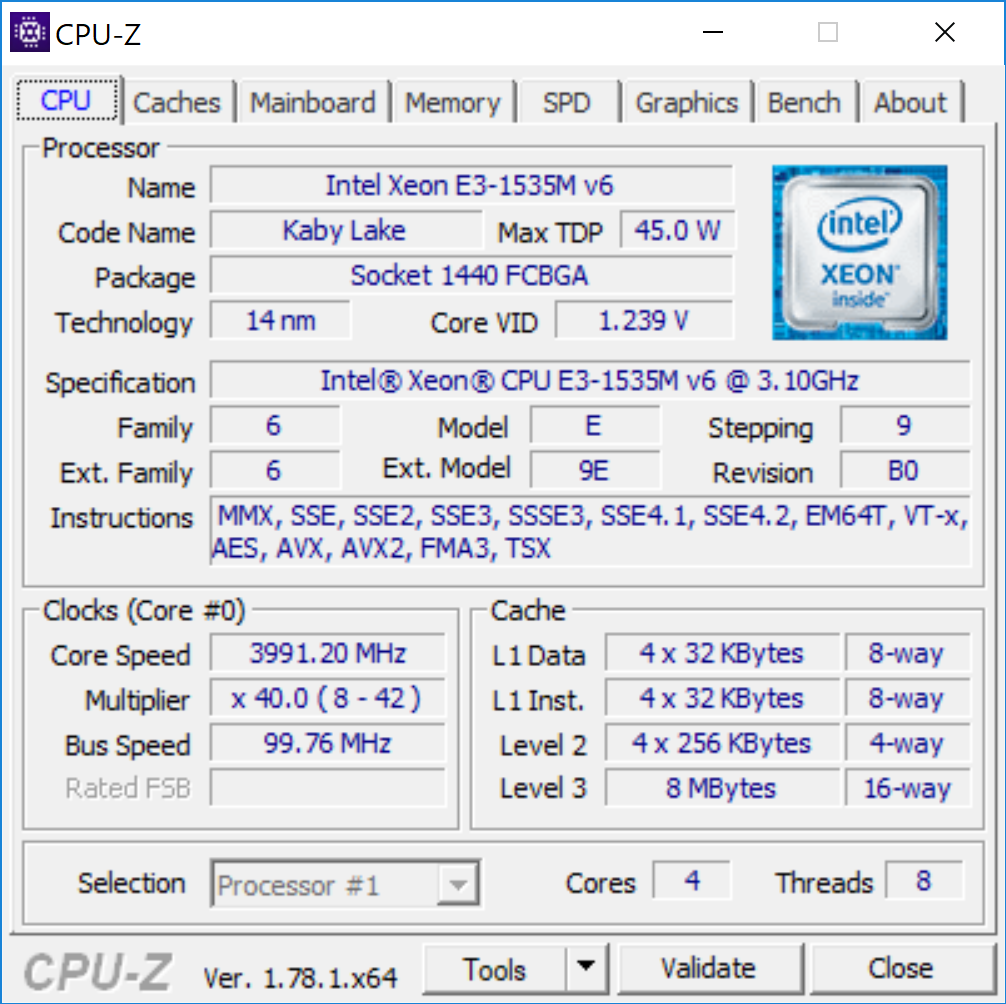
| Dell Precision 7720 Quadro P5000, E3-1535M v6, Toshiba NVMe THNSN5512GPU7 | Lenovo ThinkPad P71-20HK0004GE Quadro P3000, i7-7820HQ, Samsung PM961 NVMe MZVLW512HMJP | HP ZBook 17 G4-Y3J82AV Quadro P5000, E3-1535M v6, Samsung SSD SM961 1TB M.2 MZVKW1T0HMLH | MSI WE72 7RJ Quadro M2200, i7-7700HQ, Samsung SM961 MZVPW256 m.2 PCI-e | Fujitsu Celsius H970 Quadro P4000, E3-1535M v6, Samsung SM961 MZVKW512HMJP m.2 PCI-e | |
|---|---|---|---|---|---|
| Noise | 2% | -7% | -14% | -10% | |
| off /ambiente * (dB) | 29.5 | 29.2 1% | 29.6 -0% | 29.3 1% | 30.2 -2% |
| Idle Minimum * (dB) | 29.5 | 29.2 1% | 29.6 -0% | 36.3 -23% | 30.2 -2% |
| Idle Average * (dB) | 29.5 | 29.2 1% | 31.7 -7% | 36.3 -23% | 32.8 -11% |
| Idle Maximum * (dB) | 29.5 | 32.2 -9% | 34.4 -17% | 36.6 -24% | 32.8 -11% |
| Load Average * (dB) | 35 | 34.7 1% | 41.3 -18% | 40.4 -15% | 47.3 -35% |
| Witcher 3 ultra * (dB) | 41 | 45.6 -11% | |||
| Load Maximum * (dB) | 47.8 | 39.1 18% | 45.6 5% | 46.6 3% | 47.3 1% |
* ... Meglio usare valori piccoli
(±) La temperatura massima sul lato superiore è di 42.3 °C / 108 F, rispetto alla media di 38.2 °C / 101 F, che varia da 22.2 a 69.8 °C per questa classe Workstation.
(±) Il lato inferiore si riscalda fino ad un massimo di 44.9 °C / 113 F, rispetto alla media di 41.1 °C / 106 F
(+) In idle, la temperatura media del lato superiore è di 25.2 °C / 77 F, rispetto alla media deld ispositivo di 32 °C / 90 F.
(±) Riproducendo The Witcher 3, la temperatura media per il lato superiore e' di 35.1 °C / 95 F, rispetto alla media del dispositivo di 32 °C / 90 F.
(+) I poggiapolsi e il touchpad sono piu' freddi della temperatura della pelle con un massimo di 27.3 °C / 81.1 F e sono quindi freddi al tatto.
(±) La temperatura media della zona del palmo della mano di dispositivi simili e'stata di 27.8 °C / 82 F (+0.5 °C / 0.9 F).
| Off / Standby | |
| Idle | |
| Sotto carico |
|
Leggenda:
min: | |
| Dell Precision 7720 E3-1535M v6, Quadro P5000, Toshiba NVMe THNSN5512GPU7, IGZO, 3840x2160, 17.3" | Lenovo ThinkPad P71-20HK0004GE i7-7820HQ, Quadro P3000, Samsung PM961 NVMe MZVLW512HMJP, IPS, 3840x2160, 17.3" | HP ZBook 17 G4-Y3J82AV E3-1535M v6, Quadro P5000, Samsung SSD SM961 1TB M.2 MZVKW1T0HMLH, IPS, 3840x2160, 17.3" | MSI WE72 7RJ i7-7700HQ, Quadro M2200, Samsung SM961 MZVPW256 m.2 PCI-e, IPS, 1920x1080, 17.3" | Fujitsu Celsius H970 E3-1535M v6, Quadro P4000, Samsung SM961 MZVKW512HMJP m.2 PCI-e, IPS LED, 1920x1080, 17.3" | MSI WT72-6QM E3-1505M v5, Quadro M5000M, Toshiba NVMe THNSN5256GPU7, IPS, 1920x1080, 17.3" | |
|---|---|---|---|---|---|---|
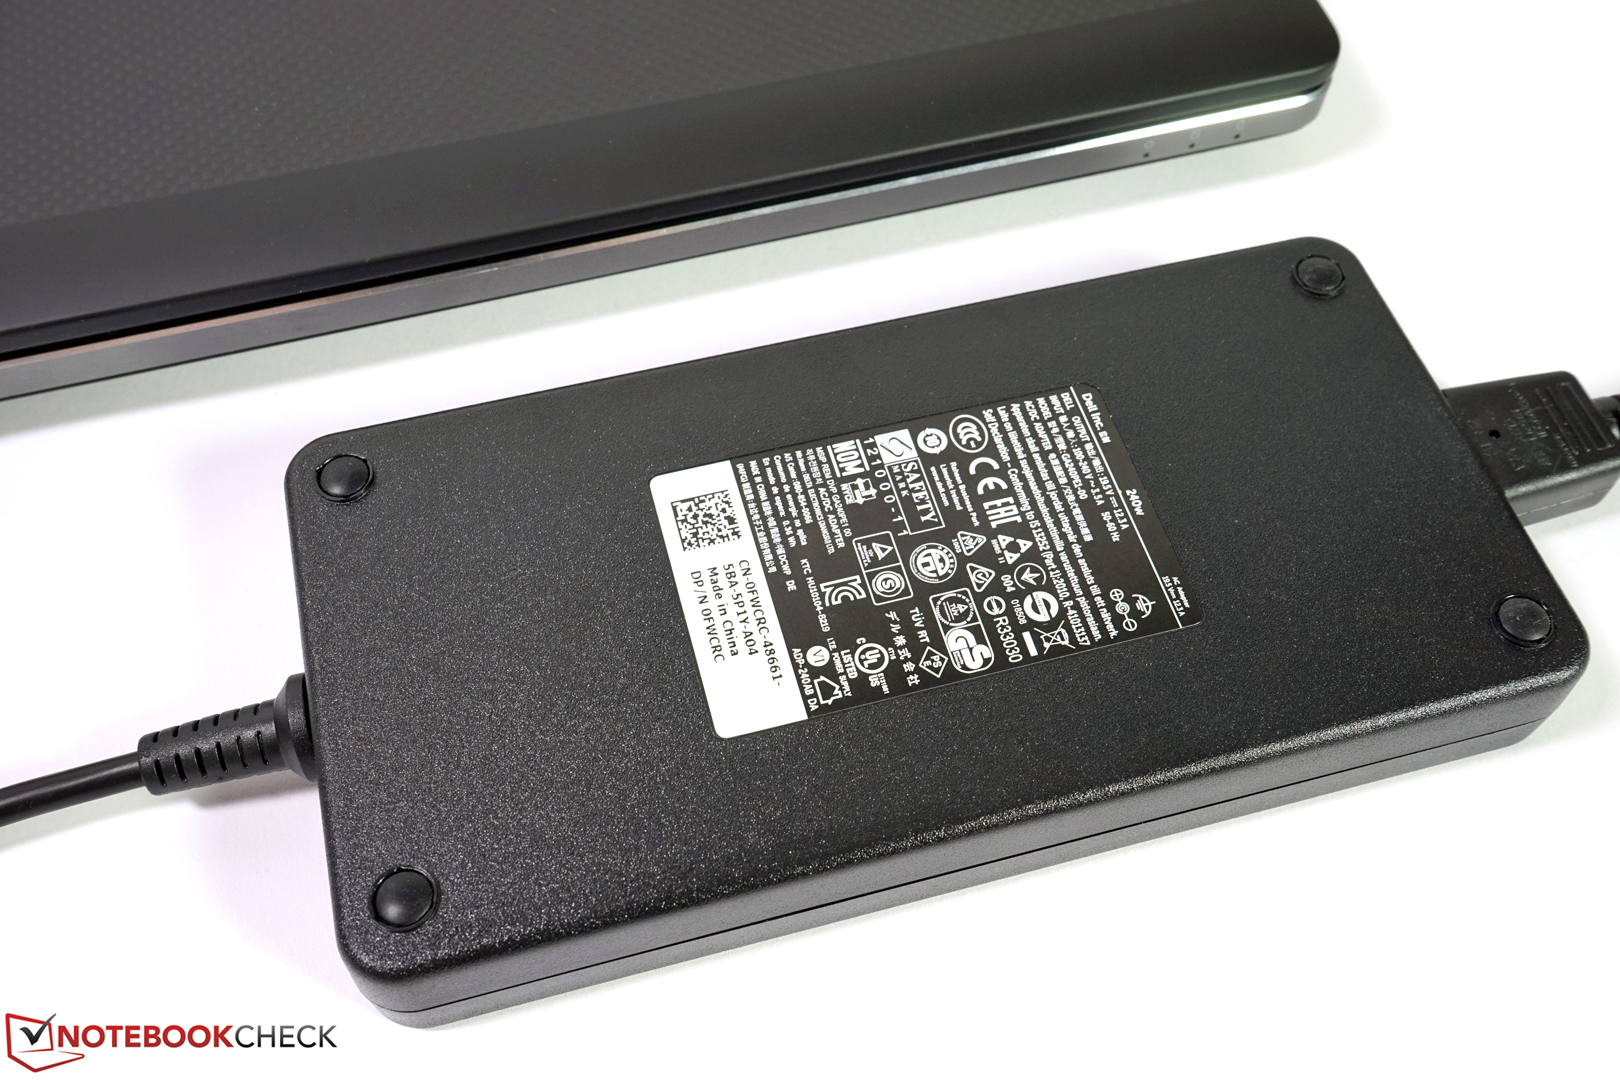
| Power Consumption | 17% | -5% | -2% | 14% | -48% | |
| Idle Minimum * (Watt) | 9.6 | 7.44 22% | 12.9 -34% | 15 -56% | 10.7 -11% | 24.8 -158% |
| Idle Average * (Watt) | 20.5 | 18 12% | 19.6 4% | 20.1 2% | 15.8 23% | 29.7 -45% |
| Idle Maximum * (Watt) | 22.9 | 21.8 5% | 23.6 -3% | 23.8 -4% | 17.8 22% | 30.1 -31% |
| Load Average * (Watt) | 96.8 | 77.1 20% | 92.8 4% | 85.6 12% | 92 5% | 105.2 -9% |
| Load Maximum * (Watt) | 202.1 | 150.5 26% | 190 6% | 128 37% | 137 32% | 192.2 5% |
| Witcher 3 ultra * (Watt) | 148.5 |
* ... Meglio usare valori piccoli
| Dell Precision 7720 E3-1535M v6, Quadro P5000, 91 Wh | Lenovo ThinkPad P71-20HK0004GE i7-7820HQ, Quadro P3000, 96 Wh | HP ZBook 17 G4-Y3J82AV E3-1535M v6, Quadro P5000, 95 Wh | MSI WE72 7RJ i7-7700HQ, Quadro M2200, 51 Wh | Fujitsu Celsius H970 E3-1535M v6, Quadro P4000, 96 Wh | Dell Precision 7710 E3-1535M v5, FirePro W7170M, 72 Wh | |
|---|---|---|---|---|---|---|
| Autonomia della batteria | 10% | -13% | -53% | 33% | -1% | |
| Reader / Idle (h) | 11.4 | 14.5 27% | 7.8 -32% | 4.5 -61% | 16.7 46% | 12.9 13% |
| H.264 (h) | 6.8 | 8.6 26% | 5.3 -22% | 3 -56% | 9.6 41% | 4.7 -31% |
| WiFi v1.3 (h) | 6.3 | 6 -5% | 4.9 -22% | 3 -52% | 9 43% | 6.1 -3% |
| Load (h) | 1.2 | 1.1 -8% | 1.5 25% | 0.7 -42% | 1.2 0% | 1.4 17% |
Pro
Contro
Il Dell Precision 7720 è una workstation mobile molto potente. Il case high-quality di base è identico alla generazione precedente e ora avrete una porta Thunderbolt 3 di default. Il predecessore ha ancora problemi a fruttare tutto il suo potenziale con carichi di lavoro combinati CPU & GPU, ma sembra che il produttore abbia comunque fatto dei miglioramenti a riguardo. Il nostro modello di test monta i componenti più potenti, e le performance sono gestite molto bene, anche con carichi estremi. Se avrete bisogno di questa potenza dipende dalle vostre esigenze ovviamente. La scheda grafica in particolare non è necessaria in molti scenari.
Ci ha deluso il display 4K PremierColor. Si tratta di una critica elevata, ma ci saremmo aspettati dei risultati migliori per questo prezzo. Raccomandiamo una calibrazione. L'effetto bleeding della retroulluminazione sull'estremità inferiore è un po' fastidioso, e il pannello usa la PWM con livelli di luminosità bassi.
Il Precision 7720 è una buona scelta se avete bisogno di prestazioni elevate, in quanto questa workstation mobile monta i componenti più costosi del momento.
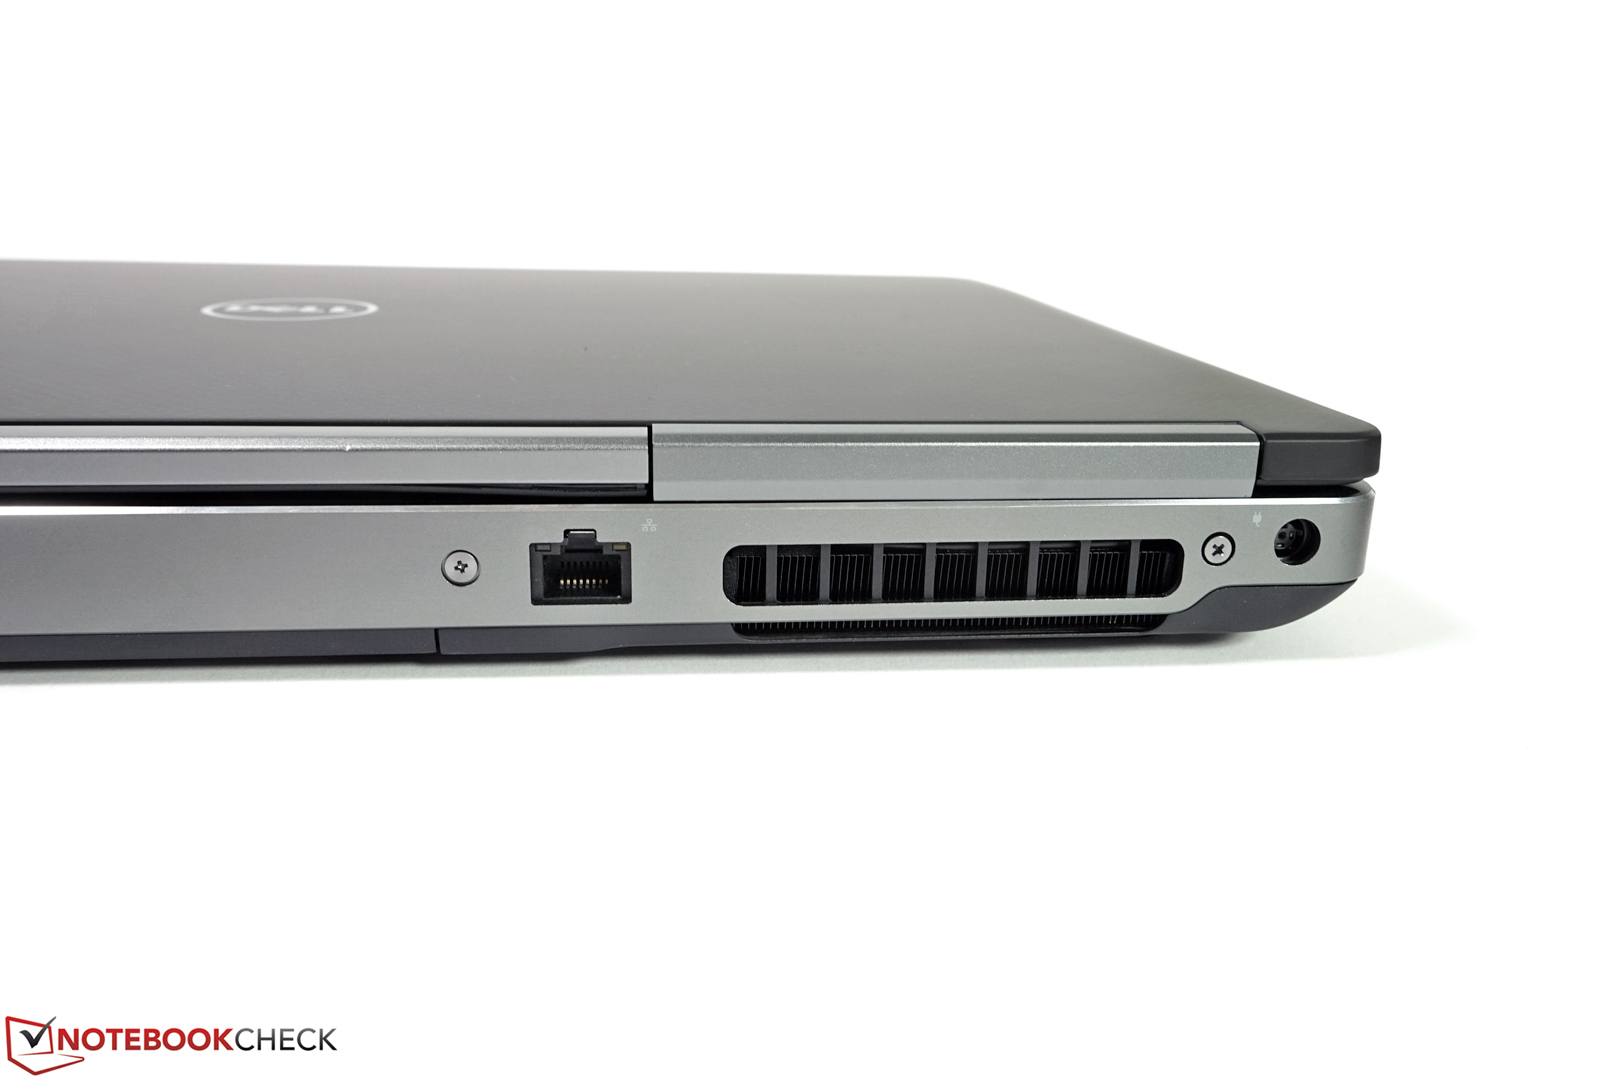
Non ci sono problemi con la rumorosità delle ventole, nonostante le prestazioni elevate. Di certo le sentirete con carichi di lavoro elevati, ma spesso sono ferme quando usate applicazioni semplici. Non possiamo criticare le temperature, e lo stesso vale per l'autonomia.
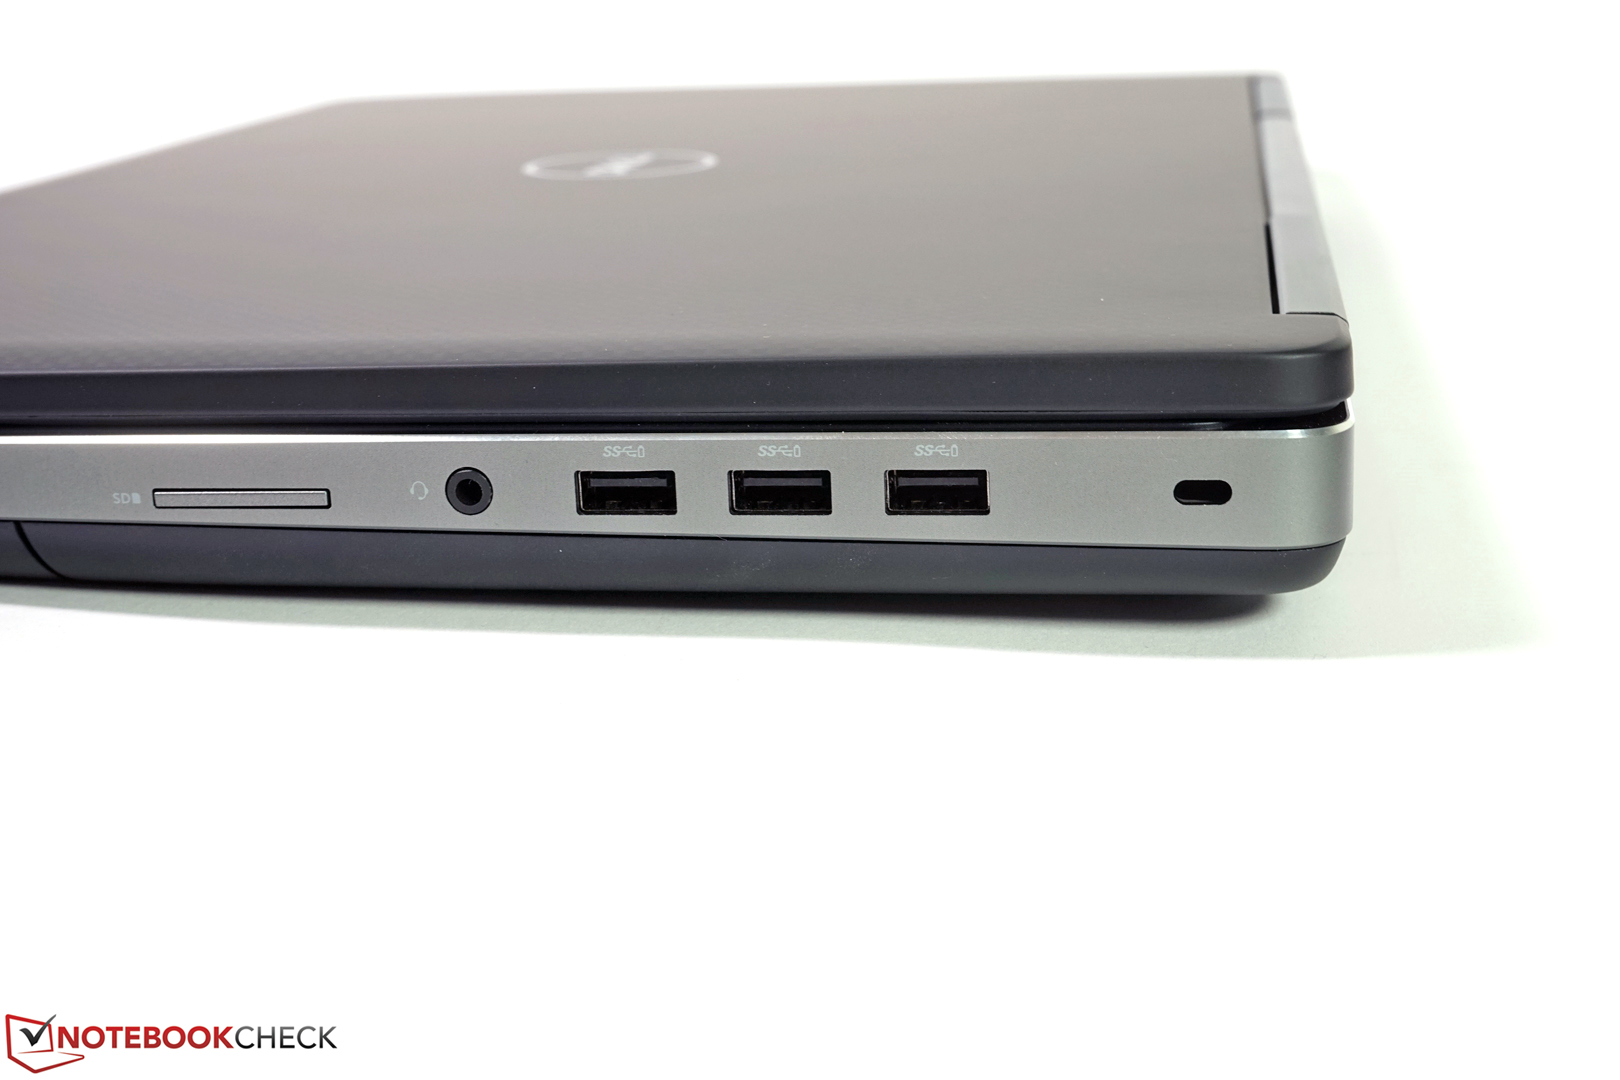
Ad eccezione delle pecche del display, dovete guardare molto da vicino per trovare problemi. La lista ovviamente include il lettore SD, che non funzionava sul nostro modello, ma potrebbe essere un caso isolato. Lo slot SIM si trova all'interno dello chassis ed è difficile da raggiungere, il che impedisce uno switch rapido delle schede quando siete all'estero, ad esempio.
Tutte queste performance hanno ovviamente un costo, ma lo stesso vale anche per la concorrenza. Nel complesso, il Precision 7720 ottiene un punteggio molto buono (89%).
Nota: si tratta di una recensione breve, con alcune sezioni non tradotte, per la versione integrale in inglese guardate qui.
Dell Precision 7720
- 01/21/2018 v6 (old)
Andreas Osthoff
