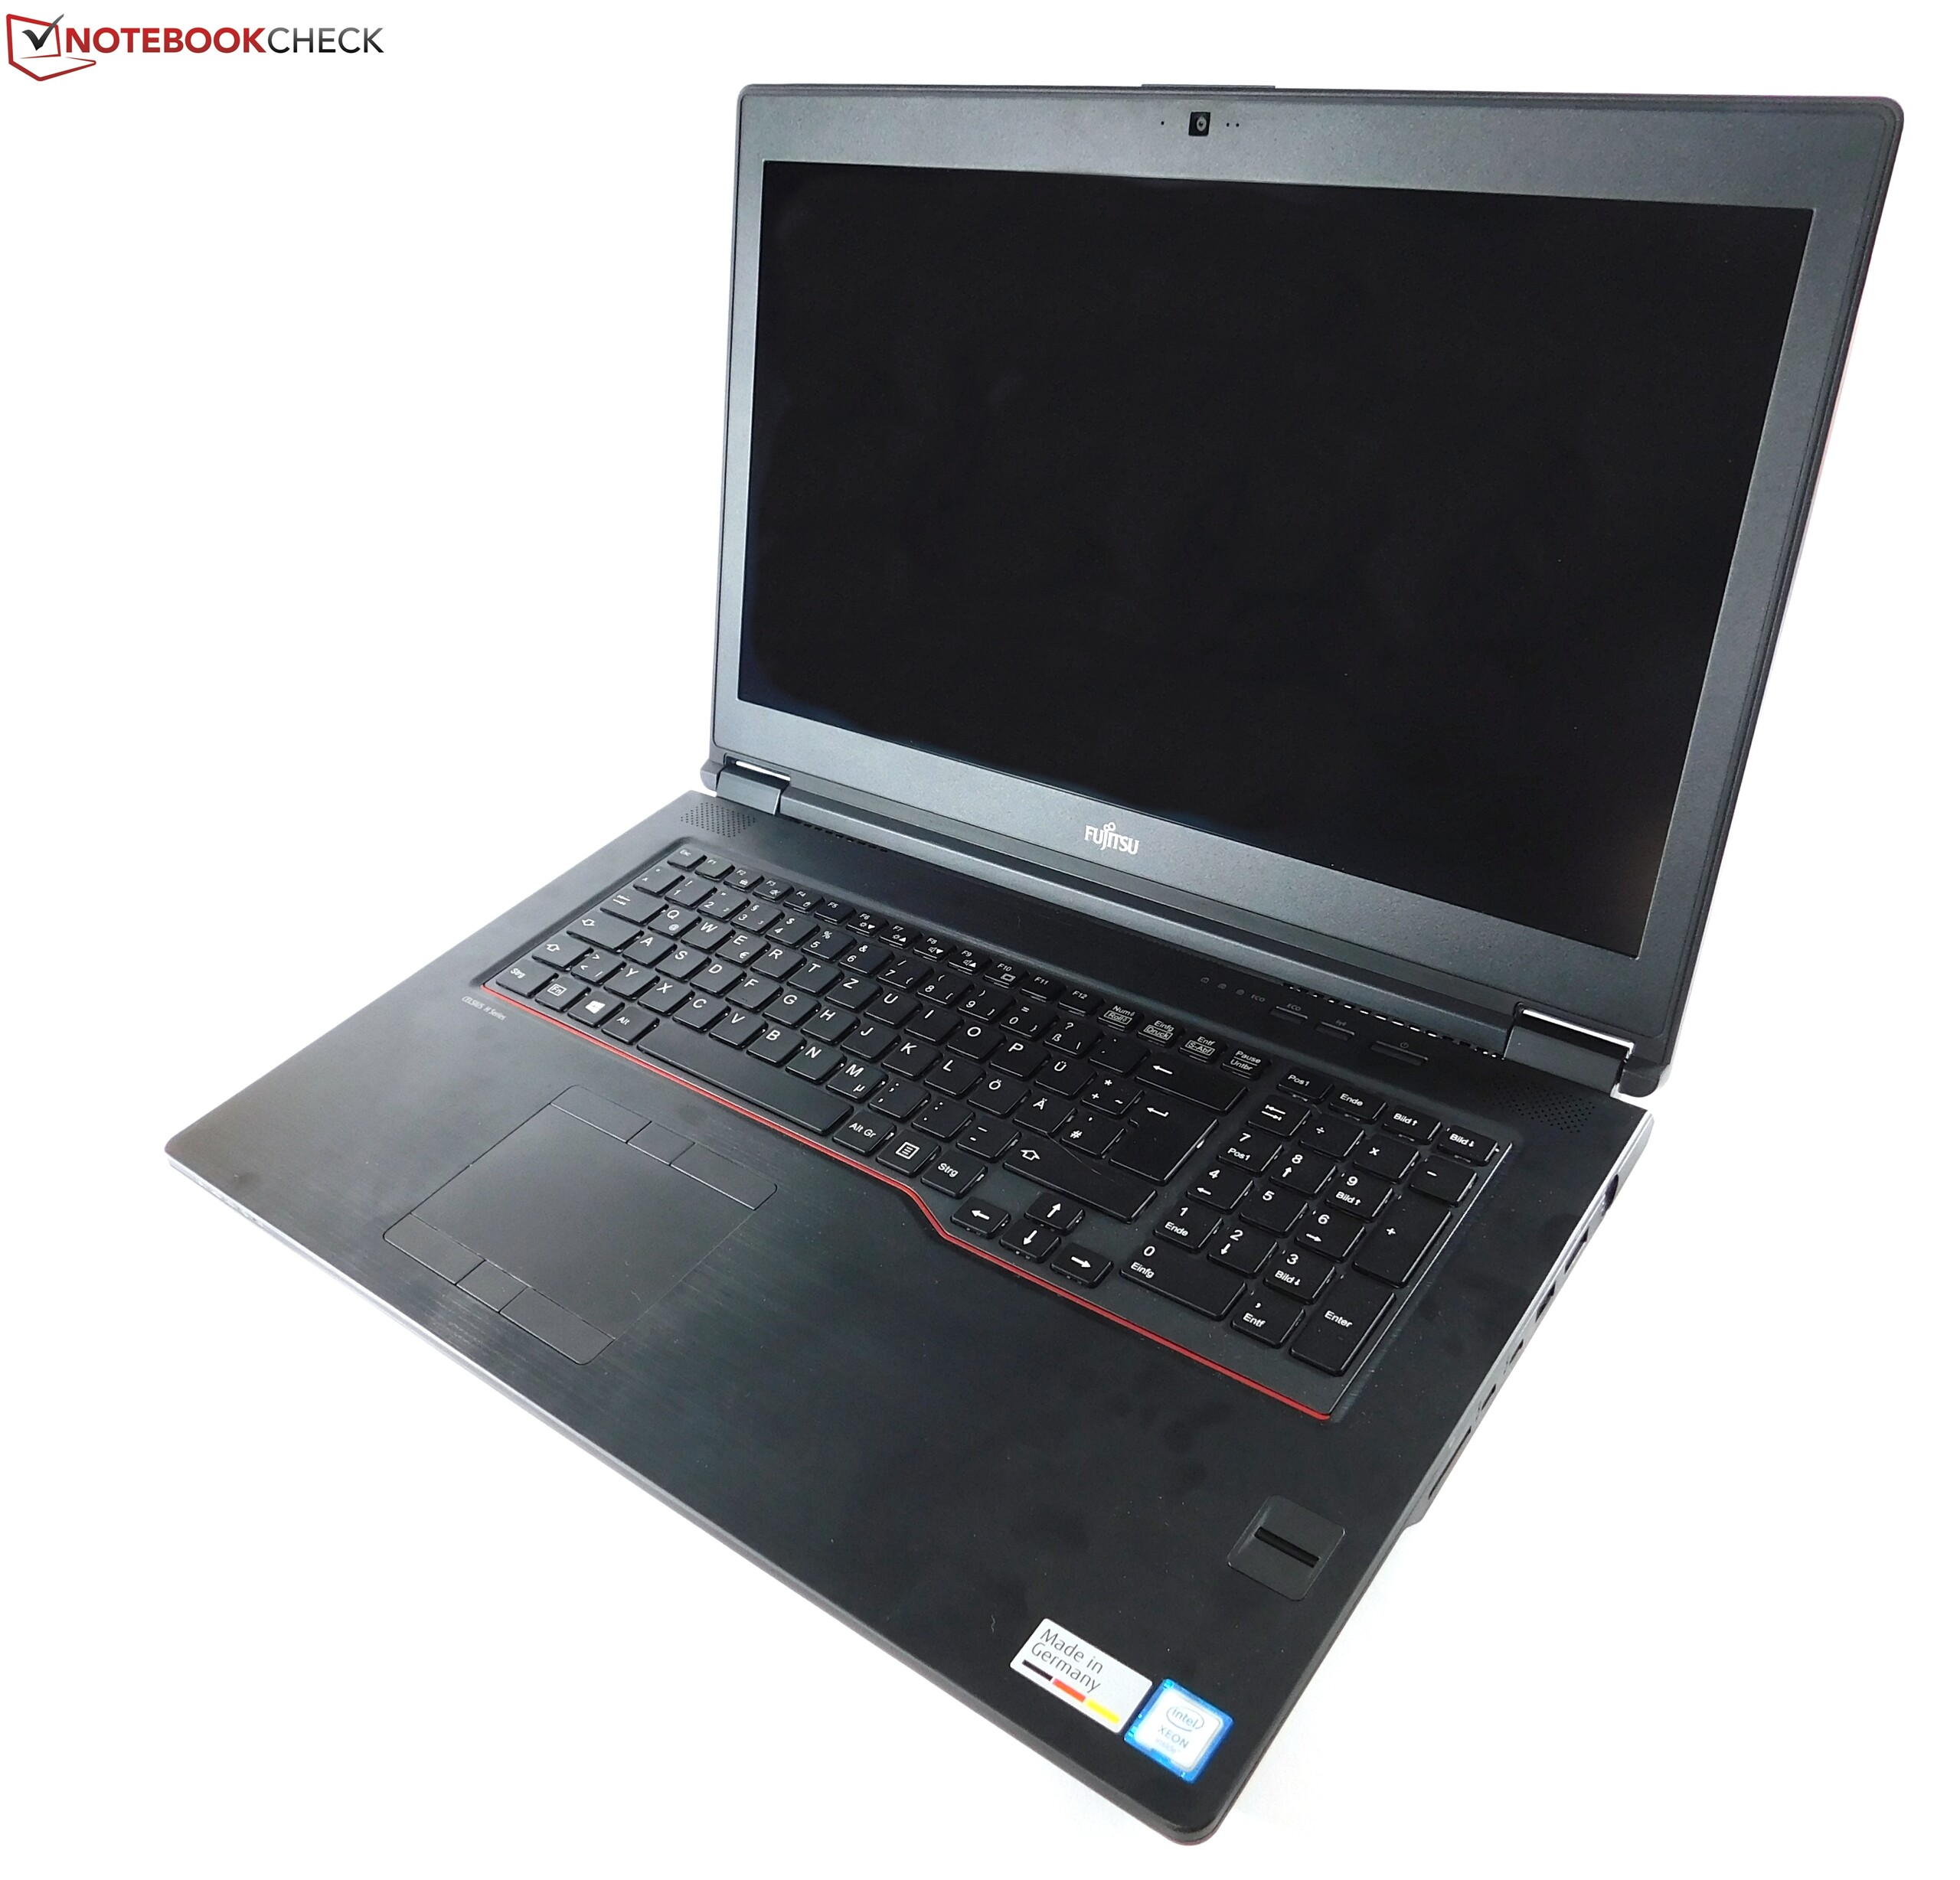
Recensione breve della Workstation Fujitsu Celsius H970 (E3-1535M v6, P4000)

| SD Card Reader | |
| average JPG Copy Test (av. of 3 runs) | |
| Dell Precision 7710 | |
| Lenovo ThinkPad P71-20HK0004GE | |
| Fujitsu Celsius H970 | |
| HP ZBook 17 G3 TZV66eA | |
| maximum AS SSD Seq Read Test (1GB) | |
| Lenovo ThinkPad P71-20HK0004GE | |
| HP ZBook 17 G3 TZV66eA | |
| Fujitsu Celsius H970 | |
| Dell Precision 7710 | |
| Networking | |
| iperf3 transmit AX12 | |
| Lenovo ThinkPad P71-20HK0004GE | |
| Fujitsu Celsius H970 | |
| MSI WE72 7RJ | |
| iperf3 receive AX12 | |
| Fujitsu Celsius H970 | |
| Lenovo ThinkPad P71-20HK0004GE | |
| MSI WE72 7RJ | |
| |||||||||||||||||||||||||
Distribuzione della luminosità: 91 %
Al centro con la batteria: 373 cd/m²
Contrasto: 1227:1 (Nero: 0.3 cd/m²)
ΔE ColorChecker Calman: 6.4 | ∀{0.5-29.43 Ø4.72}
ΔE Greyscale Calman: 7.2 | ∀{0.09-98 Ø4.97}
84.4% sRGB (Argyll 1.6.3 3D)
55.5% AdobeRGB 1998 (Argyll 1.6.3 3D)
61.8% AdobeRGB 1998 (Argyll 3D)
84.6% sRGB (Argyll 3D)
66.8% Display P3 (Argyll 3D)
Gamma: 2.02
CCT: 6882 K
| Fujitsu Celsius H970 LP173WF4-SPF3, , 1920x1080, 17.3" | Lenovo ThinkPad P71-20HK0004GE LEN4123, VVX17P051J00, , 3840x2160, 17.3" | HP ZBook 17 G3 TZV66eA SDC3854, , 1920x1080, 17.3" | Dell Precision 7710 SDC8151, VHN17_173HL, , 1920x1080, 17.3" | MSI WE72 7RJ LP173WF4-SPF1, , 1920x1080, 17.3" | Schenker W706 LP173WF4-SPD1, LGD046C, , 1920x1080, 17.3" | |
|---|---|---|---|---|---|---|
| Display | 9% | 9% | 1% | -0% | ||
| Display P3 Coverage (%) | 66.8 | 67.3 1% | 66.6 0% | 67.4 1% | 66.2 -1% | |
| sRGB Coverage (%) | 84.6 | 95.9 13% | 96.9 15% | 85.3 1% | 84.2 0% | |
| AdobeRGB 1998 Coverage (%) | 61.8 | 69 12% | 68.6 11% | 62.4 1% | 61.5 0% | |
| Response Times | -6% | -33% | -46% | -21% | -25% | |
| Response Time Grey 50% / Grey 80% * (ms) | 32 ? | 39.2 ? -23% | 50.4 ? -58% | 50 ? -56% | 45.2 ? -41% | 44 ? -38% |
| Response Time Black / White * (ms) | 26.4 ? | 23.2 ? 12% | 28.4 ? -8% | 36 ? -36% | 26.4 ? -0% | 29.2 ? -11% |
| PWM Frequency (Hz) | 1412 ? | 200 ? | 198 ? | |||
| Screen | 23% | 18% | 7% | -6% | -4% | |
| Brightness middle (cd/m²) | 368 | 358 -3% | 252 -32% | 332 -10% | 302 -18% | 356 -3% |
| Brightness (cd/m²) | 360 | 338 -6% | 243 -32% | 307 -15% | 306 -15% | 331 -8% |
| Brightness Distribution (%) | 91 | 83 -9% | 86 -5% | 83 -9% | 93 2% | 86 -5% |
| Black Level * (cd/m²) | 0.3 | 0.31 -3% | 0.21 30% | 0.33 -10% | 0.31 -3% | 0.48 -60% |
| Contrast (:1) | 1227 | 1155 -6% | 1200 -2% | 1006 -18% | 974 -21% | 742 -40% |
| Colorchecker dE 2000 * | 6.4 | 2.1 67% | 2.2 66% | 3 53% | 6.2 3% | 4.64 28% |
| Colorchecker dE 2000 max. * | 10.1 | 3.6 64% | 3.8 62% | 10.6 -5% | ||
| Greyscale dE 2000 * | 7.2 | 2 72% | 2.7 62% | 4 44% | 7.3 -1% | 3.65 49% |
| Gamma | 2.02 109% | 2.16 102% | 2.28 96% | 2 110% | 2.08 106% | 2.02 109% |
| CCT | 6882 94% | 6216 105% | 6686 97% | 7089 92% | 7020 93% | 6393 102% |
| Color Space (Percent of AdobeRGB 1998) (%) | 55.5 | 77 39% | 62 12% | 62 12% | 56 1% | 55 -1% |
| Color Space (Percent of sRGB) (%) | 84.4 | 99.97 18% | 96 14% | 97 15% | 85.2 1% | 84 0% |
| Media totale (Programma / Settaggio) | 9% /
19% | -2% /
9% | -10% /
-0% | -9% /
-6% | -10% /
-6% |
* ... Meglio usare valori piccoli
Tempi di risposta del Display
| ↔ Tempi di risposta dal Nero al Bianco | ||
|---|---|---|
| 26.4 ms ... aumenta ↗ e diminuisce ↘ combinato | ↗ 14.8 ms Incremento | 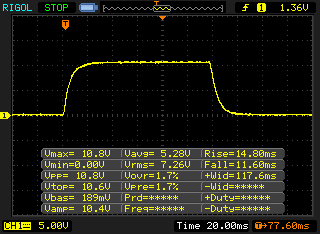 |
| ↘ 11.6 ms Calo | ||
| Lo schermo mostra tempi di risposta relativamente lenti nei nostri tests e potrebbe essere troppo lento per i gamers. In confronto, tutti i dispositivi di test variano da 0.1 (minimo) a 240 (massimo) ms. » 66 % di tutti i dispositivi è migliore. Questo significa che i tempi di risposta rilevati sono peggiori rispetto alla media di tutti i dispositivi testati (19.8 ms). | ||
| ↔ Tempo di risposta dal 50% Grigio all'80% Grigio | ||
| 32 ms ... aumenta ↗ e diminuisce ↘ combinato | ↗ 14.8 ms Incremento | 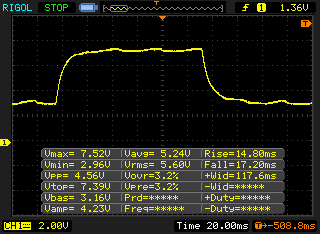 |
| ↘ 17.2 ms Calo | ||
| Lo schermo mostra tempi di risposta lenti nei nostri tests e sarà insoddisfacente per i gamers. In confronto, tutti i dispositivi di test variano da 0.165 (minimo) a 636 (massimo) ms. » 43 % di tutti i dispositivi è migliore. Questo significa che i tempi di risposta rilevati sono simili alla media di tutti i dispositivi testati (31 ms). | ||
Sfarfallio dello schermo / PWM (Pulse-Width Modulation)
| flickering dello schermo / PWM non rilevato |  | ||
In confronto: 52 % di tutti i dispositivi testati non utilizza PWM per ridurre la luminosita' del display. Se è rilevato PWM, una media di 7763 (minimo: 5 - massimo: 343500) Hz è stata rilevata. | |||
| Cinebench R15 | |
| CPU Single 64Bit | |
| Fujitsu Celsius H970 | |
| Lenovo ThinkPad P71-20HK0004GE | |
| Dell Precision 7710 | |
| MSI WE72 7RJ | |
| HP ZBook 17 G3 TZV66eA | |
| Schenker W706 | |
| CPU Multi 64Bit | |
| Lenovo ThinkPad P71-20HK0004GE | |
| Dell Precision 7710 | |
| Schenker W706 | |
| MSI WE72 7RJ | |
| HP ZBook 17 G3 TZV66eA | |
| Fujitsu Celsius H970 | |
| PCMark 8 | |
| Work Score Accelerated v2 | |
| Dell Precision 7710 | |
| Fujitsu Celsius H970 | |
| HP ZBook 17 G3 TZV66eA | |
| Schenker W706 | |
| MSI WE72 7RJ | |
| Creative Score Accelerated v2 | |
| Fujitsu Celsius H970 | |
| Schenker W706 | |
| Lenovo ThinkPad P71-20HK0004GE | |
| Dell Precision 7710 | |
| HP ZBook 17 G3 TZV66eA | |
| PCMark 8 Creative Score Accelerated v2 | 7135 punti | |
| PCMark 8 Work Score Accelerated v2 | 5277 punti | |
| PCMark 10 Score | 5041 punti | |
Aiuto | ||
| Fujitsu Celsius H970 Samsung SM961 MZVKW512HMJP m.2 PCI-e | HP ZBook 17 G3 TZV66eA Samsung SM951 MZVPV256HDGL m.2 PCI-e | MSI WE72 7RJ Samsung SM961 MZVPW256 m.2 PCI-e | Lenovo ThinkPad P71-20HK0004GE Samsung PM961 NVMe MZVLW512HMJP | Dell Precision 7710 Samsung SM951 MZVPV256HDGL m.2 PCI-e | Schenker W706 Samsung SM951 MZVPV512HDGL m.2 PCI-e | |
|---|---|---|---|---|---|---|
| AS SSD | -15% | 18% | 14% | -7% | -2% | |
| Seq Read (MB/s) | 2726 | 1596 -41% | 2586 -5% | 2447 -10% | 1886 -31% | 1915 -30% |
| Seq Write (MB/s) | 1609 | 703 -56% | 1441 -10% | 1596 -1% | 626 -61% | 1511 -6% |
| 4K Read (MB/s) | 38.88 | 51.1 31% | 53 36% | 53.3 37% | 51 31% | 49.71 28% |
| 4K Write (MB/s) | 78.1 | 148.2 90% | 148.1 90% | 144.1 85% | 179 129% | 146.2 87% |
| 4K-64 Read (MB/s) | 1246 | 1037 -17% | 1517 22% | 1362 9% | 1064 -15% | 1115 -11% |
| 4K-64 Write (MB/s) | 971 | 230.4 -76% | 826 -15% | 740 -24% | 275 -72% | 375 -61% |
| Score Total (Points) | 3509 | 2302 -34% | 3831 9% | 3517 0% | 2435 -31% | 2712 -23% |

| 3DMark 11 - 1280x720 Performance GPU | |
| Fujitsu Celsius H970 | |
| Schenker W706 | |
| Lenovo ThinkPad P71-20HK0004GE | |
| Lenovo ThinkPad P70-20ER000XUS | |
| Dell Precision 7710 | |
| HP ZBook 17 G3 TZV66eA | |
| MSI WE72 7RJ | |
| 3DMark | |
| 1280x720 Cloud Gate Standard Graphics | |
| Schenker W706 | |
| Lenovo ThinkPad P71-20HK0004GE | |
| Fujitsu Celsius H970 | |
| HP ZBook 17 G3 TZV66eA | |
| Lenovo ThinkPad P70-20ER000XUS | |
| Dell Precision 7710 | |
| MSI WE72 7RJ | |
| 1920x1080 Fire Strike Graphics | |
| Fujitsu Celsius H970 | |
| Schenker W706 | |
| Lenovo ThinkPad P71-20HK0004GE | |
| Lenovo ThinkPad P70-20ER000XUS | |
| Dell Precision 7710 | |
| HP ZBook 17 G3 TZV66eA | |
| MSI WE72 7RJ | |
| LuxMark v2.0 64Bit | |
| Room GPUs-only | |
| Fujitsu Celsius H970 | |
| Lenovo ThinkPad P71-20HK0004GE | |
| Schenker W706 | |
| HP ZBook 17 G3 TZV66eA | |
| MSI WE72 7RJ | |
| Dell Precision 7710 | |
| Sala GPUs-only | |
| Fujitsu Celsius H970 | |
| Lenovo ThinkPad P71-20HK0004GE | |
| HP ZBook 17 G3 TZV66eA | |
| Schenker W706 | |
| MSI WE72 7RJ | |
| Dell Precision 7710 | |
| ComputeMark v2.1 - 1024x600 Normal, Score | |
| Fujitsu Celsius H970 | |
| Lenovo ThinkPad P71-20HK0004GE | |
| Schenker W706 | |
| Lenovo ThinkPad P70-20ER000XUS | |
| MSI WE72 7RJ | |
| Dell Precision 7710 | |
| GFXBench | |
| 1920x1080 Car Chase Offscreen | |
| Fujitsu Celsius H970 | |
| Lenovo ThinkPad P71-20HK0004GE | |
| MSI WE72 7RJ | |
| on screen Car Chase Onscreen | |
| MSI WE72 7RJ | |
| Fujitsu Celsius H970 | |
| Lenovo ThinkPad P71-20HK0004GE | |
| 3DMark Vantage - 1280x1024 P Result | |
| Fujitsu Celsius H970 | |
| Lenovo ThinkPad P71-20HK0004GE | |
| Dell Precision 7710 | |
| MSI WE72 7RJ | |
| 3DMark 06 Standard Score | 29155 punti | |
| 3DMark Vantage P Result | 36260 punti | |
| 3DMark 11 Performance | 12346 punti | |
| 3DMark Ice Storm Standard Score | 68394 punti | |
| 3DMark Cloud Gate Standard Score | 18726 punti | |
| 3DMark Fire Strike Score | 10158 punti | |
| 3DMark Fire Strike Extreme Score | 5526 punti | |
| 3DMark Time Spy Score | 3825 punti | |
Aiuto | ||
| Rise of the Tomb Raider - 1920x1080 Very High Preset AA:FX AF:16x | |
| MSI GT62VR-6RE16H21 | |
| Fujitsu Celsius H970 | |
| Schenker XMG P507 | |
| Lenovo ThinkPad P71-20HK0004GE | |
| MSI GE72 7RE-046 | |
| MSI WE72 7RJ | |
| HP ZBook 17 G3 TZV66eA | |
| basso | medio | alto | ultra | |
|---|---|---|---|---|
| BioShock Infinite (2013) | 196.9 | 174.4 | 162.4 | 96 |
| Company of Heroes 2 (2013) | 67.6 | 61.1 | 59.7 | 44.94 |
| Total War: Rome II (2013) | 236.7 | 184.1 | 151.4 | 63.3 |
| GRID: Autosport (2014) | 153.8 | 106.3 | 96.9 | 84.5 |
| The Witcher 3 (2015) | 159.7 | 113.6 | 77.2 | 41.09 |
| Star Wars Battlefront (2015) | 122.5 | 116.4 | 89.2 | 85.7 |
| Rise of the Tomb Raider (2016) | 115.9 | 103.2 | 76.8 | 65.5 |
| Doom (2016) | 119.5 | 112.4 | 91 | 87.1 |
| Civilization 6 (2016) | 66.7 | 55.2 | 45.13 | 43.7 |
| Warhammer 40.000: Dawn of War III (2017) | 70.3 | 61.6 | 58.8 | 54 |
Rumorosità
| Idle |
| 30.2 / 32.8 / 32.8 dB(A) |
| Sotto carico |
| 47.3 / 47.3 dB(A) |
 | ||
30 dB silenzioso 40 dB(A) udibile 50 dB(A) rumoroso |
||
min: | ||
(±) La temperatura massima sul lato superiore è di 41.4 °C / 107 F, rispetto alla media di 38.2 °C / 101 F, che varia da 22.2 a 69.8 °C per questa classe Workstation.
(-) Il lato inferiore si riscalda fino ad un massimo di 48.7 °C / 120 F, rispetto alla media di 41.1 °C / 106 F
(+) In idle, la temperatura media del lato superiore è di 25.9 °C / 79 F, rispetto alla media deld ispositivo di 32 °C / 90 F.
(+) I poggiapolsi e il touchpad sono piu' freddi della temperatura della pelle con un massimo di 26.6 °C / 79.9 F e sono quindi freddi al tatto.
(±) La temperatura media della zona del palmo della mano di dispositivi simili e'stata di 27.8 °C / 82 F (+1.2 °C / 2.1 F).
Fujitsu Celsius H970 analisi audio
(±) | potenza degli altiparlanti media ma buona (73.8 dB)
Bassi 100 - 315 Hz
(-) | quasi nessun basso - in media 26.7% inferiori alla media
(+) | bassi in lineaa (5.1% delta rispetto alla precedente frequenza)
Medi 400 - 2000 Hz
(±) | medi ridotti - circa 5.4% inferiori alla media
(±) | linearità dei medi adeguata (8.3% delta rispetto alla precedente frequenza)
Alti 2 - 16 kHz
(+) | Alti bilanciati - appena 4.1% dalla media
(+) | alti lineari (6.2% delta rispetto alla precedente frequenza)
Nel complesso 100 - 16.000 Hz
(±) | la linearità complessiva del suono è media (29.1% di differenza rispetto alla media
Rispetto alla stessa classe
» 96% di tutti i dispositivi testati in questa classe è stato migliore, 1% simile, 3% peggiore
» Il migliore ha avuto un delta di 7%, medio di 17%, peggiore di 35%
Rispetto a tutti i dispositivi testati
» 87% di tutti i dispositivi testati in questa classe è stato migliore, 2% similare, 11% peggiore
» Il migliore ha avuto un delta di 4%, medio di 24%, peggiore di 134%
Lenovo ThinkPad P71-20HK0004GE analisi audio
(-) | altoparlanti non molto potenti (70.9 dB)
Bassi 100 - 315 Hz
(±) | bassi ridotti - in media 12.4% inferiori alla media
(±) | la linearità dei bassi è media (10.5% delta rispetto alla precedente frequenza)
Medi 400 - 2000 Hz
(±) | medi elevati - circa 5.9% superiore alla media
(+) | medi lineari (6.4% delta rispetto alla precedente frequenza)
Alti 2 - 16 kHz
(±) | alti ridotti - circa 5% inferiori alla media
(±) | la linearità degli alti è media (13.6% delta rispetto alla precedente frequenza)
Nel complesso 100 - 16.000 Hz
(±) | la linearità complessiva del suono è media (26.6% di differenza rispetto alla media
Rispetto alla stessa classe
» 90% di tutti i dispositivi testati in questa classe è stato migliore, 4% simile, 6% peggiore
» Il migliore ha avuto un delta di 7%, medio di 17%, peggiore di 35%
Rispetto a tutti i dispositivi testati
» 82% di tutti i dispositivi testati in questa classe è stato migliore, 3% similare, 15% peggiore
» Il migliore ha avuto un delta di 4%, medio di 24%, peggiore di 134%
| Off / Standby | |
| Idle | |
| Sotto carico |
|
Leggenda:
min: | |
| Fujitsu Celsius H970 E3-1535M v6, Quadro P4000, Samsung SM961 MZVKW512HMJP m.2 PCI-e, IPS LED, 1920x1080, 17.3" | HP ZBook 17 G3 TZV66eA E3-1535M v5, Quadro M3000M, Samsung SM951 MZVPV256HDGL m.2 PCI-e, IPS, 1920x1080, 17.3" | Dell Precision 7710 E3-1535M v5, FirePro W7170M, Samsung SM951 MZVPV256HDGL m.2 PCI-e, IPS LED, 1920x1080, 17.3" | MSI WE72 7RJ i7-7700HQ, Quadro M2200, Samsung SM961 MZVPW256 m.2 PCI-e, IPS, 1920x1080, 17.3" | Schenker W706 6700, Quadro M5000M, Samsung SM951 MZVPV512HDGL m.2 PCI-e, IPS LED, 1920x1080, 17.3" | Lenovo ThinkPad P71-20HK0004GE i7-7820HQ, Quadro P3000, Samsung PM961 NVMe MZVLW512HMJP, IPS, 3840x2160, 17.3" | |
|---|---|---|---|---|---|---|
| Power Consumption | 6% | -29% | -17% | -74% | 0% | |
| Idle Minimum * (Watt) | 10.7 | 6.7 37% | 6.04 44% | 15 -40% | 25.9 -142% | 7.44 30% |
| Idle Average * (Watt) | 15.8 | 12.5 21% | 15.2 4% | 20.1 -27% | 31 -96% | 18 -14% |
| Idle Maximum * (Watt) | 17.8 | 13.2 26% | 42.3 -138% | 23.8 -34% | 31.9 -79% | 21.8 -22% |
| Load Average * (Watt) | 92 | 128.2 -39% | 112.8 -23% | 85.6 7% | 104.7 -14% | 77.1 16% |
| Load Maximum * (Watt) | 137 | 158.9 -16% | 182.2 -33% | 128 7% | 193 -41% | 150.5 -10% |
* ... Meglio usare valori piccoli
| Fujitsu Celsius H970 E3-1535M v6, Quadro P4000, 96 Wh | HP ZBook 17 G3 TZV66eA E3-1535M v5, Quadro M3000M, 96 Wh | Dell Precision 7710 E3-1535M v5, FirePro W7170M, 72 Wh | MSI WE72 7RJ i7-7700HQ, Quadro M2200, 51 Wh | Schenker W706 6700, Quadro M5000M, 82 Wh | Lenovo ThinkPad P71-20HK0004GE i7-7820HQ, Quadro P3000, 96 Wh | |
|---|---|---|---|---|---|---|
| Autonomia della batteria | -13% | -22% | -63% | -47% | -16% | |
| Reader / Idle (h) | 16.7 | 15.9 -5% | 12.9 -23% | 4.5 -73% | 3.4 -80% | 14.5 -13% |
| H.264 (h) | 9.6 | 5 -48% | 4.7 -51% | 3 -69% | 2.5 -74% | 8.6 -10% |
| WiFi v1.3 (h) | 9 | 4.8 -47% | 6.1 -32% | 3 -67% | 3 -67% | 6 -33% |
| Load (h) | 1.2 | 1.8 50% | 1.4 17% | 0.7 -42% | 1.6 33% | 1.1 -8% |
Pro
Contro
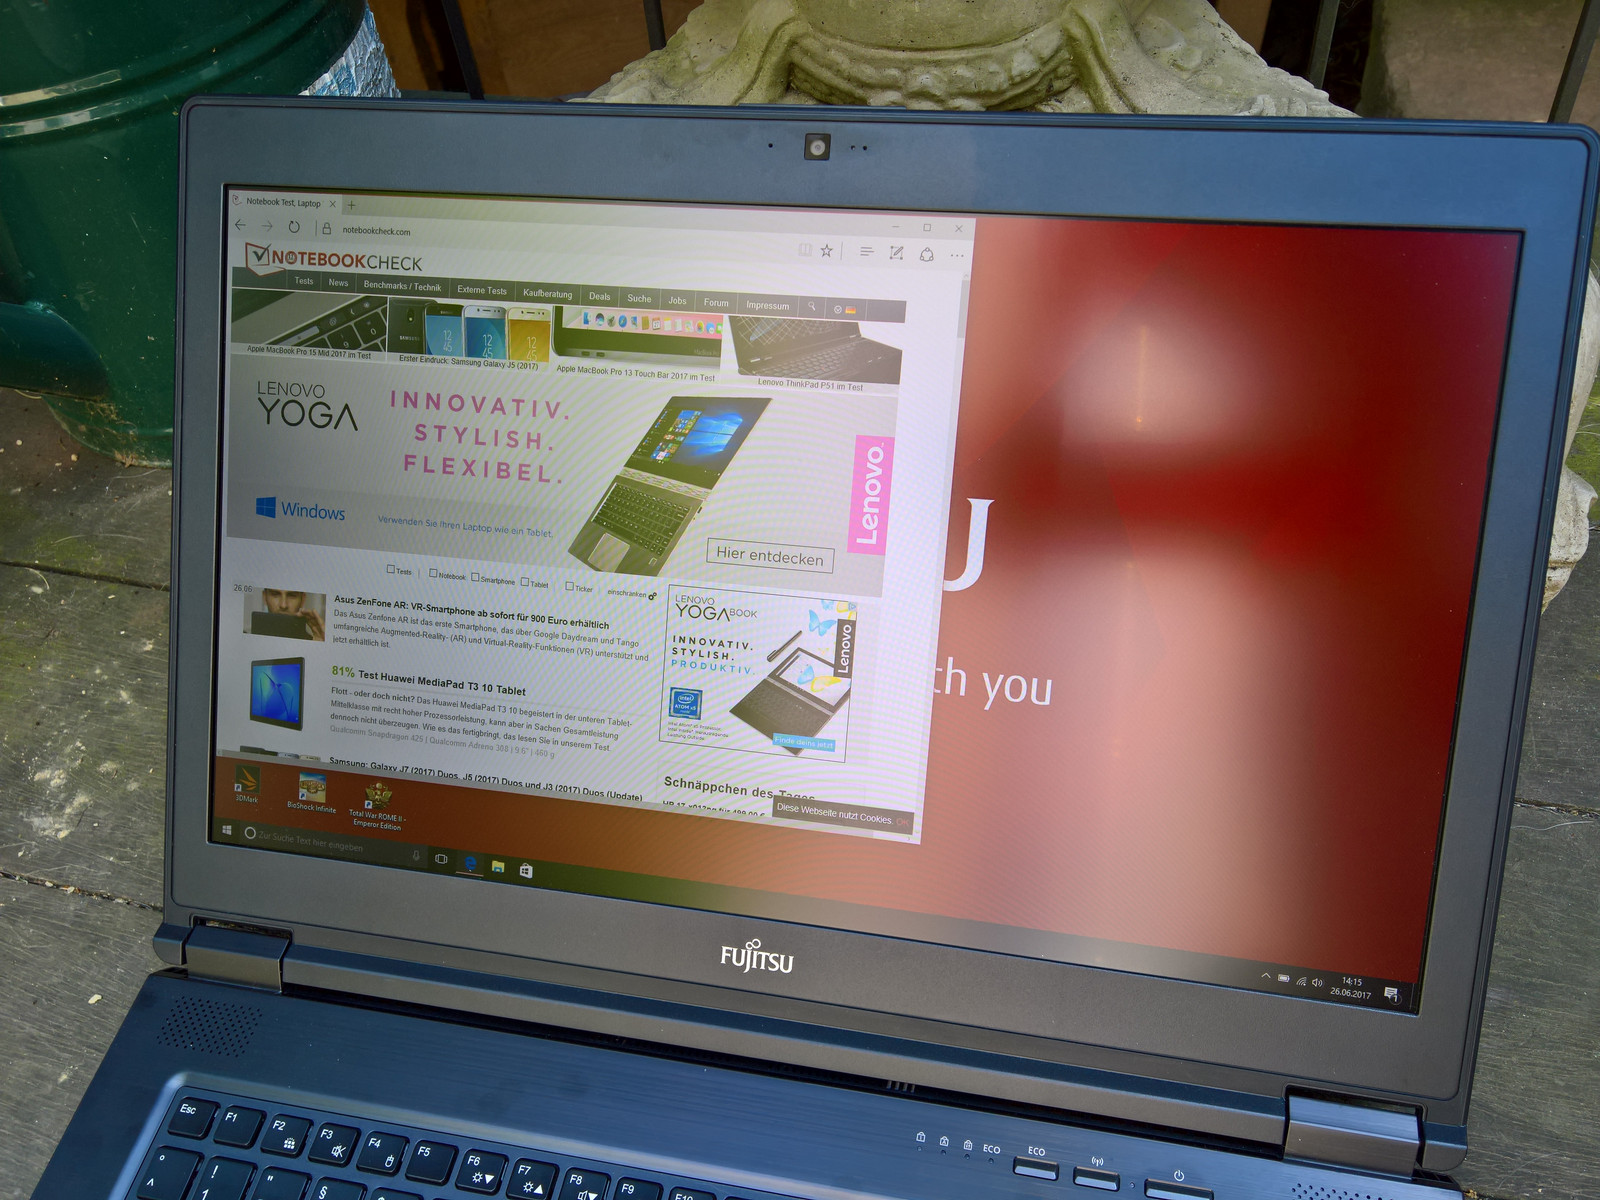
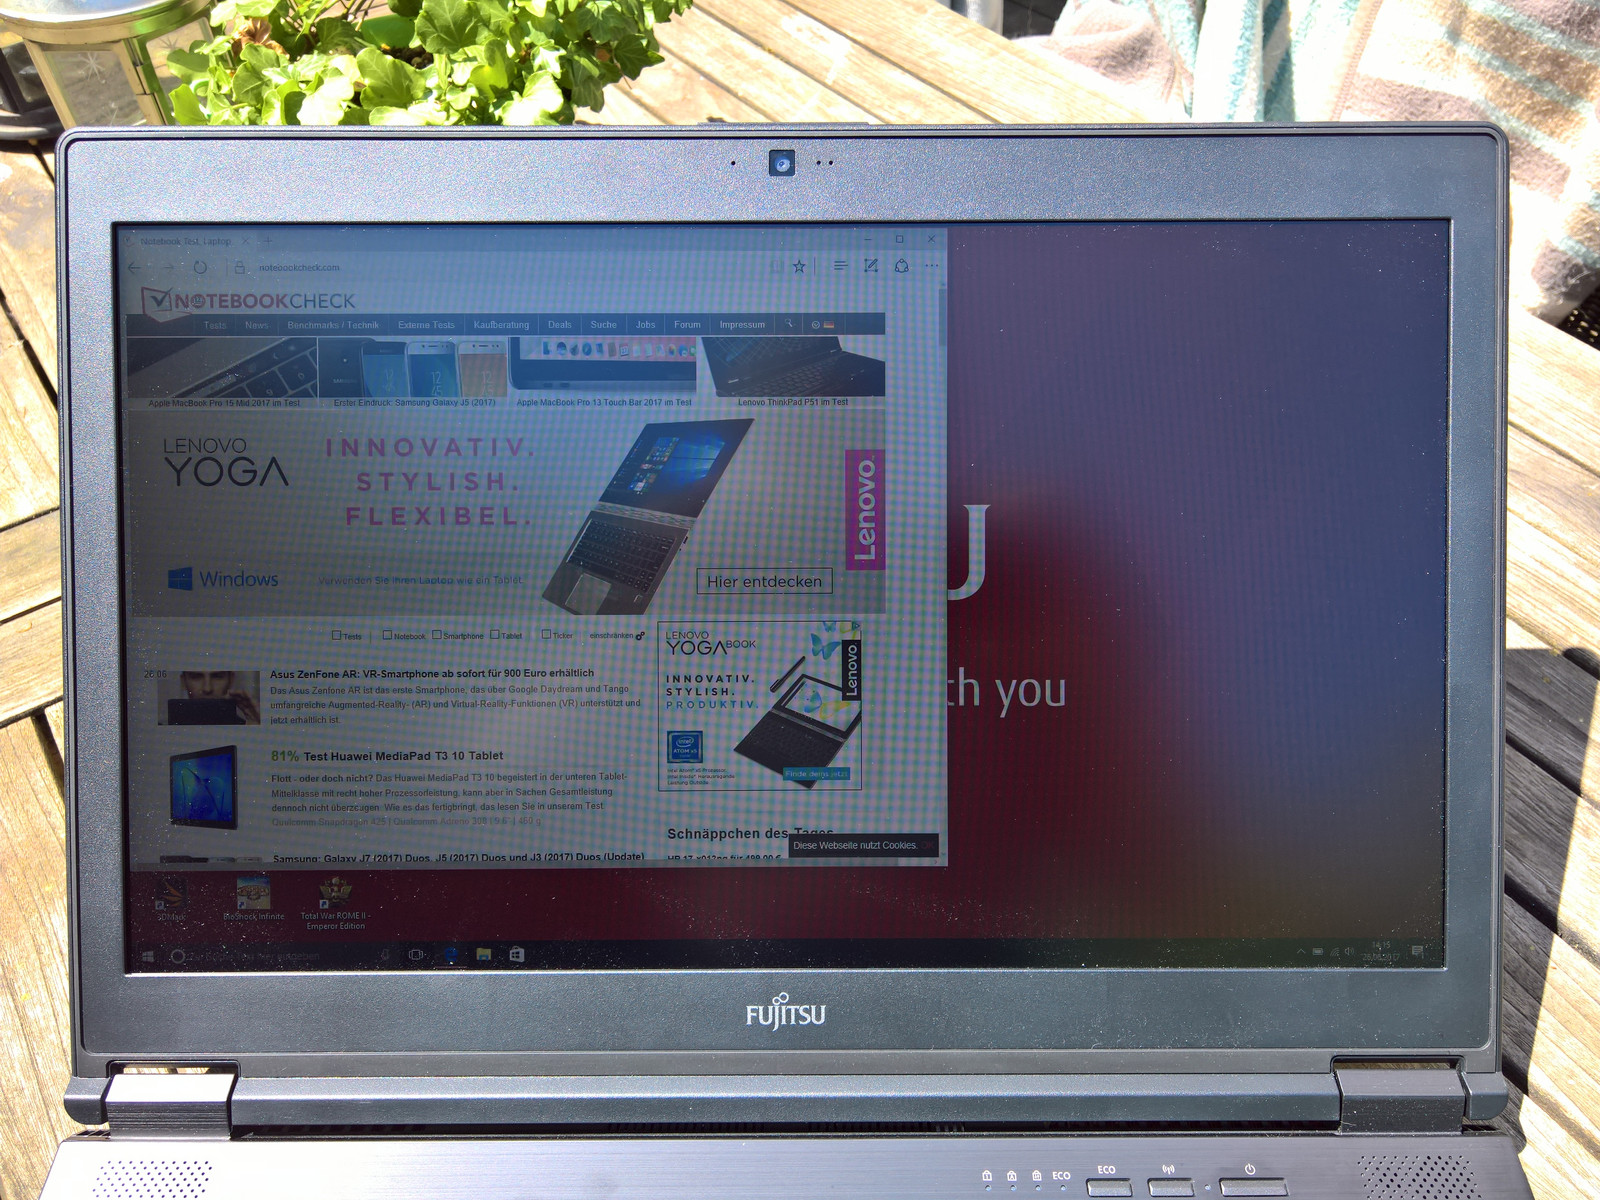
Non è facile servire il mercato delle workstations. Cii sono solo pochi produttori con sufficiente esperienza e reputazione per stare nella classe "reale" dei portatili. Fujitsu vuole essere uno di questi produttori - almeno per adesso. Tuttavia, il Fujitsu Celsius H970 non riesce a convincersi. Fujitsu realizza una workstation mobile che è sorprendentemente buono in alcune aree ma troppo debole in altre. Le aree buone sicuramente includono l'autonomia della batteria, che è più che decente per un portatile workstation. Qui si evidenzia che con le nuove e più efficienti generazioni di CPU, i processori quad-core non necessariamente intaccano l'autonomia della batteria. La luminosità del display è buona, e come per l'autonomia, il Celsius è il migliore della sua classe. Le performance GPU sono top class, grazie al sistema di raffreddamento della GPU. Infine, dobbiamo citare l'eccellente possibilità di manutenzione come uno dei vantaggi del Celsius. C'è solo da dire che avrete bisogno di cavi speciali per collegare i drives da 2.5".
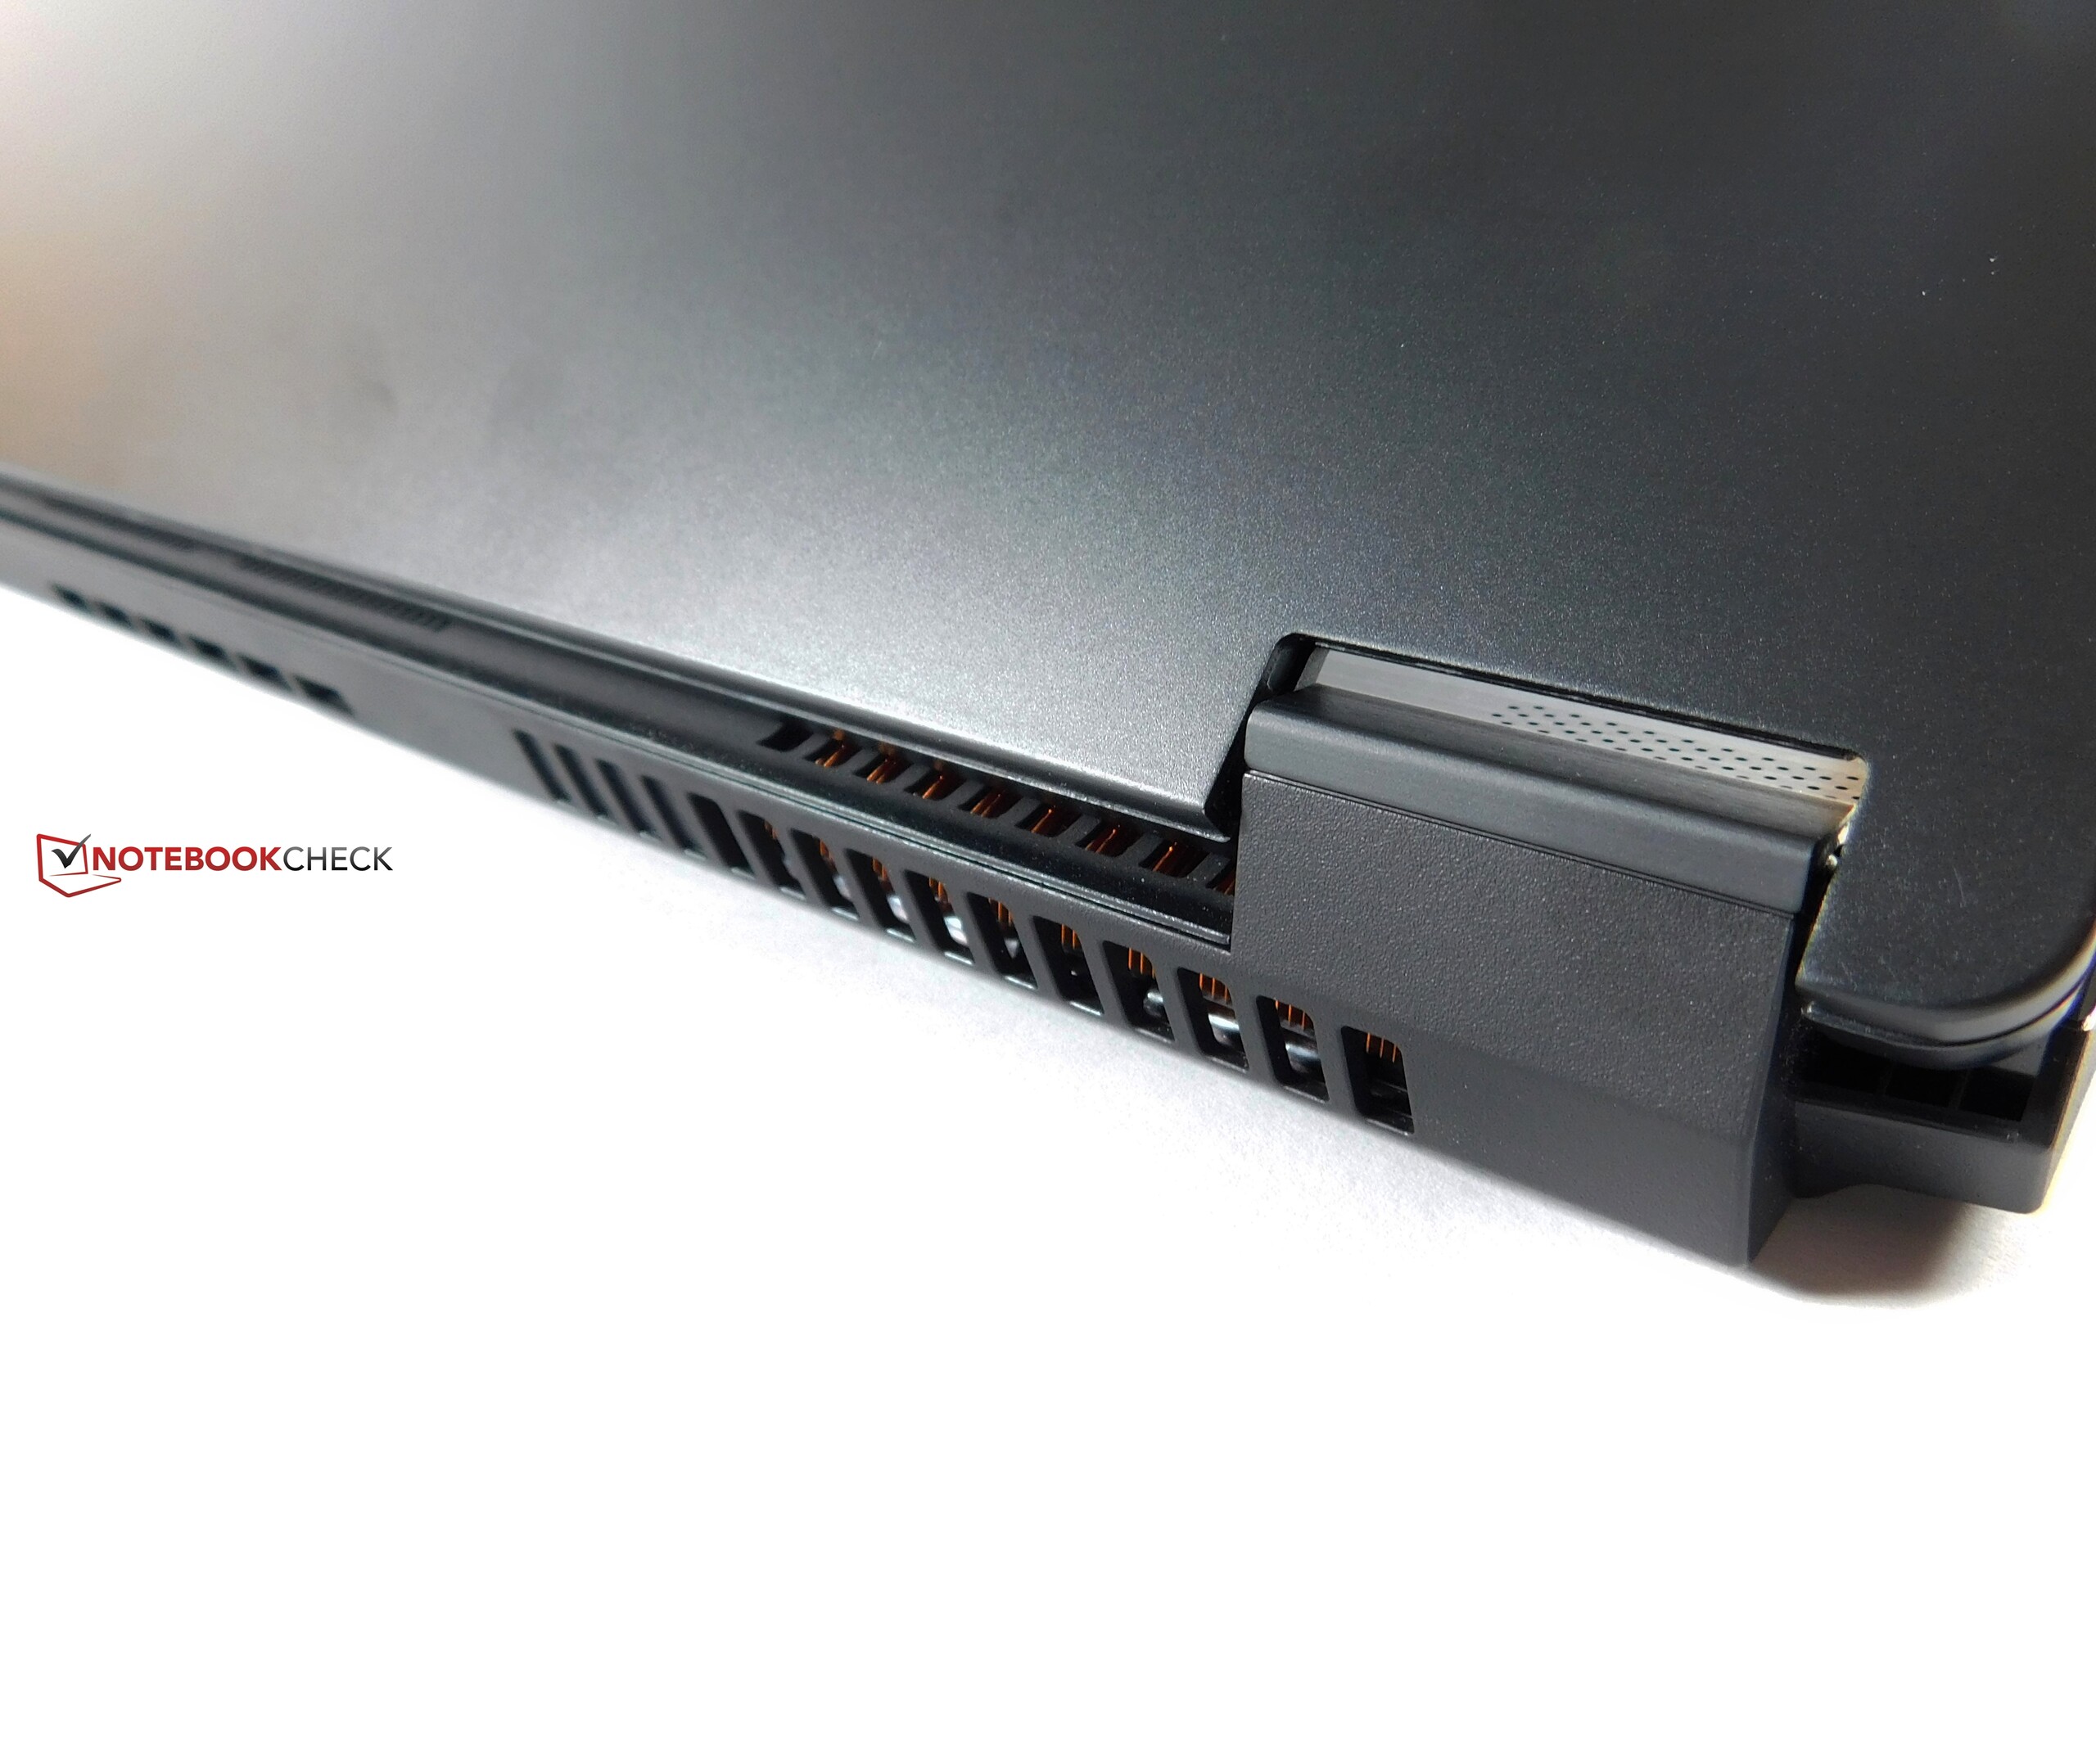
L'autonomia e la luminosità del display - questi gli aspetti più importanti per un portatile che probabilmente si muoverà solo da una scrivania all'altra considerando dimensioni e peso? Forse no! Sfortunatamente, il Fujitsu fallisce su aspetti molto importanti, come il raffreddamento della CPU. Se il raffreddamento della GPU funziona bene, quello della CPU no. E' troppo piccolo. Questo rende il dispositivo molto rumoroso, in quanto deve lavorare parecchio per raffreddare la CPU. Ma nonostante questo, non è possibile evitare il throttling termico. Questo si verifica nel test Cinebench che non carica molto, quindi nell'utilizzo quotidiano, il Celsius non è in grado di dare il suo massimo con la CPU. In questo modo il costoso Xeon E3-1535M V6, che ha la CPU mobile Kaby-Lake più veloce, diventa il chip più lento del gruppo di confronto. E se questo non bastasse, il Fujitsu commette un ulteriore grande errore con la tastiera che oscilla. Sebbene il display sia luminoso, i colori non sono molto forti e non copre la gamma sRGB. Fujitsu non offre un display con risoluzione superiore e migliore copertura del colore.
Non va: se il Fujitsu Celsius H970 ha le sue qualità, in particolare lo scarso raffreddamento della CPU è fuori luogo per una workstation mobile.
A causa di questi problemi, il Celsius ha vita difficile contro la concorrenza come ThinkPad P71, ZBook 17 G3, o Precision 7710. Raggiunge la sufficienza solo grazie alle elevate prestazioni della nuova scheda grafica professionale.
Nota: si tratta di una recensione breve, con alcune sezioni non tradotte, per la versione integrale in inglese guardate qui.
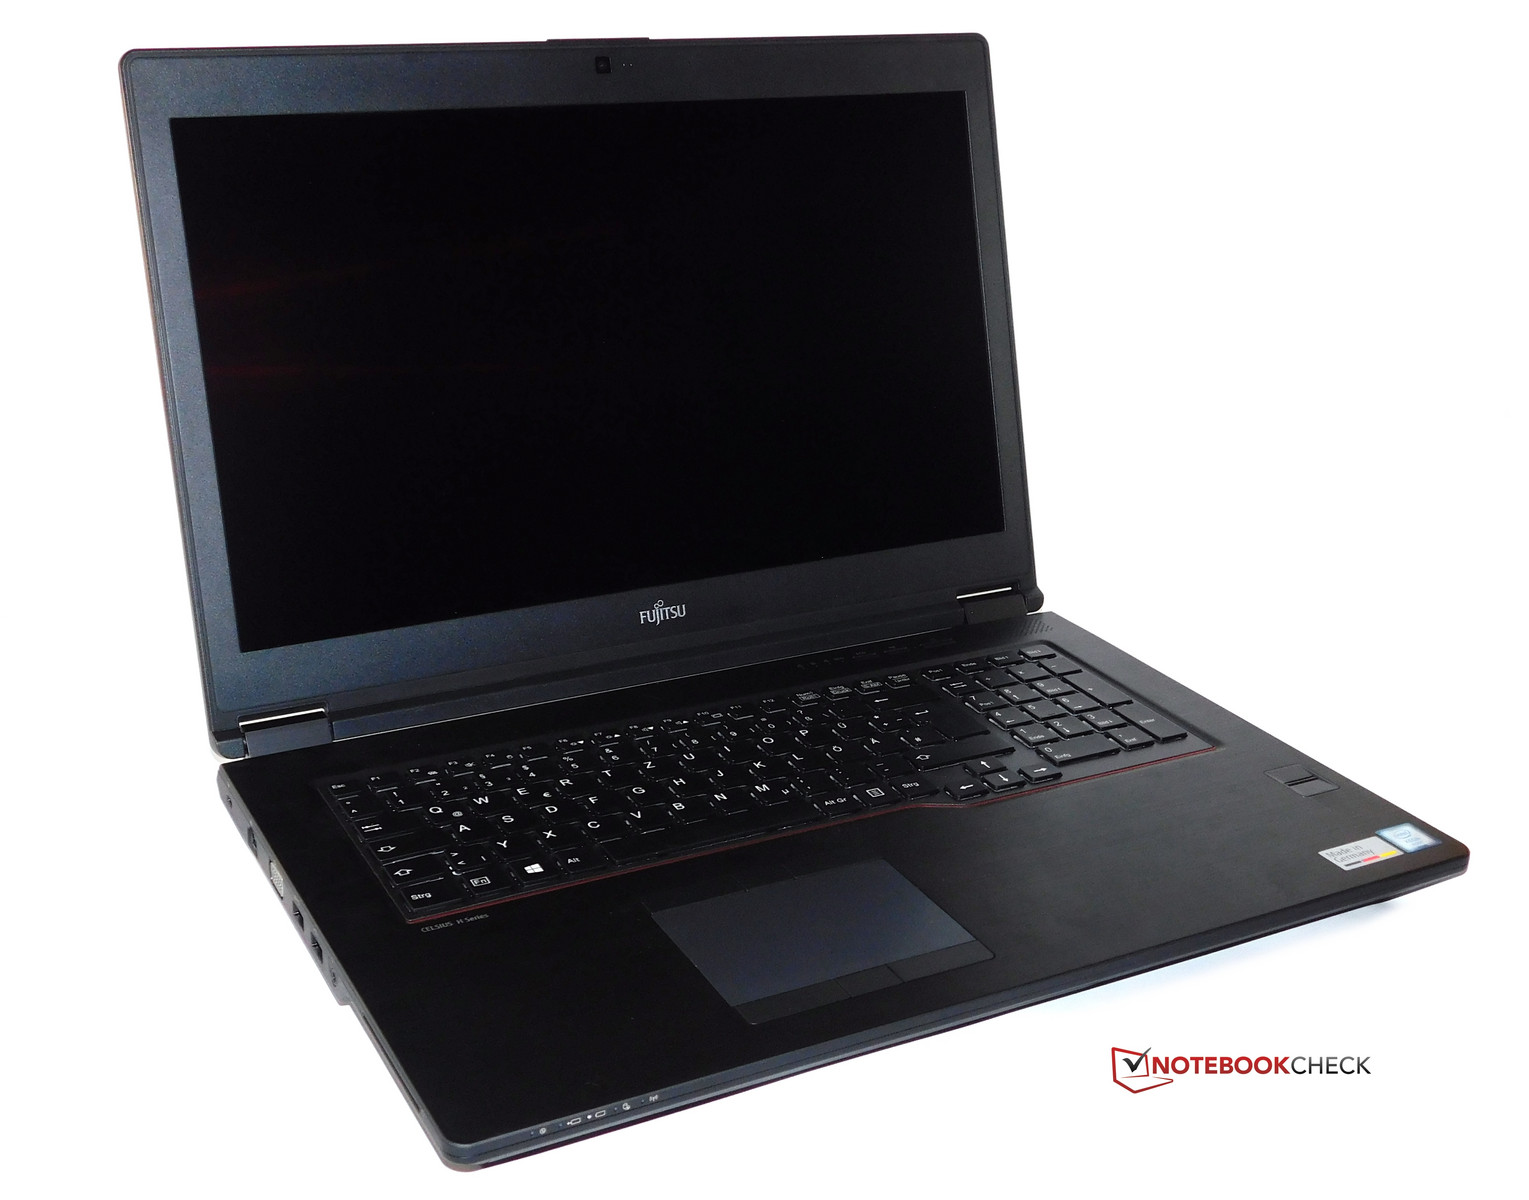
Fujitsu Celsius H970
- 07/07/2017 v6 (old)
Benjamin Herzig