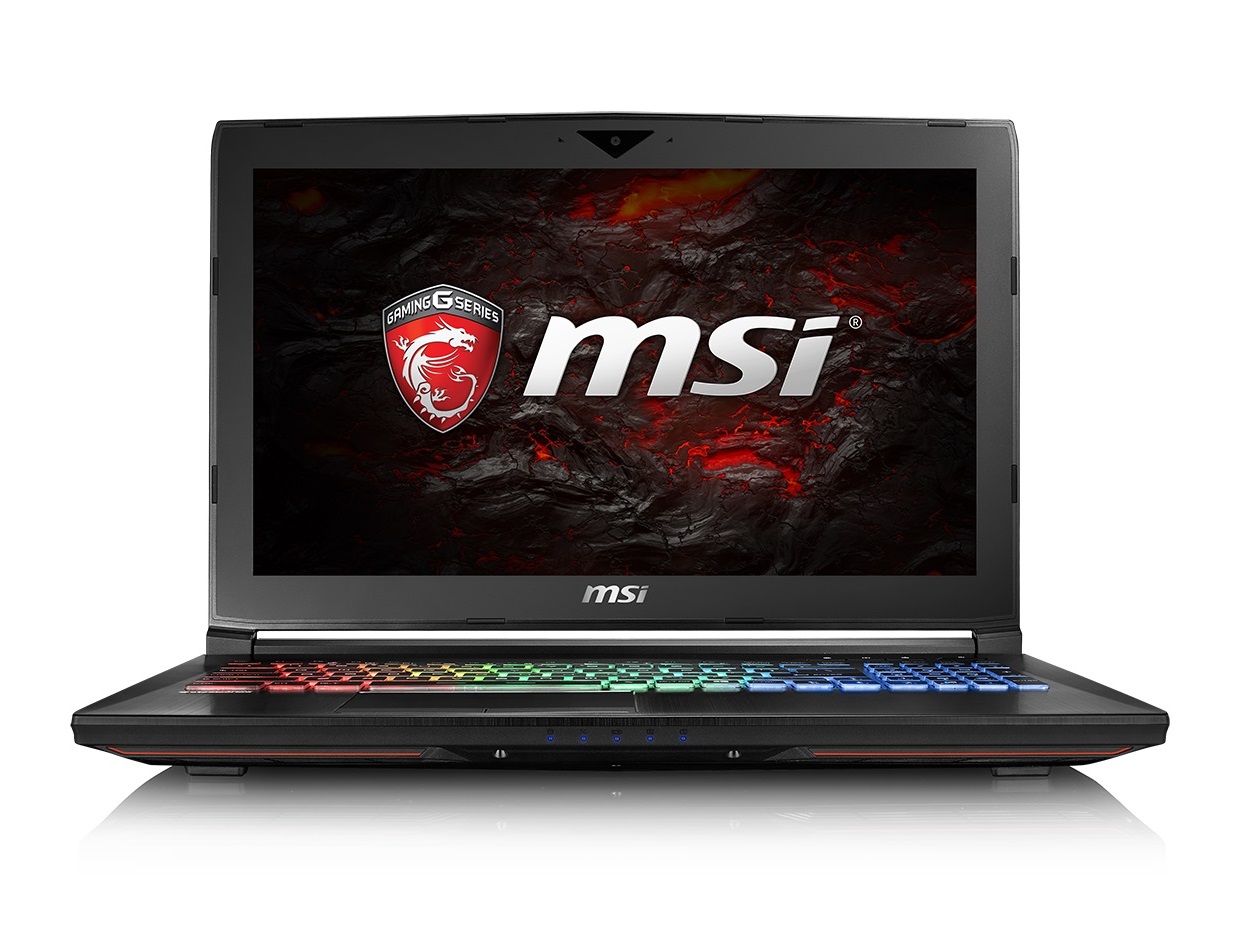
Recensione completa del portatile MSI GT62VR 6RE Dominator Pro
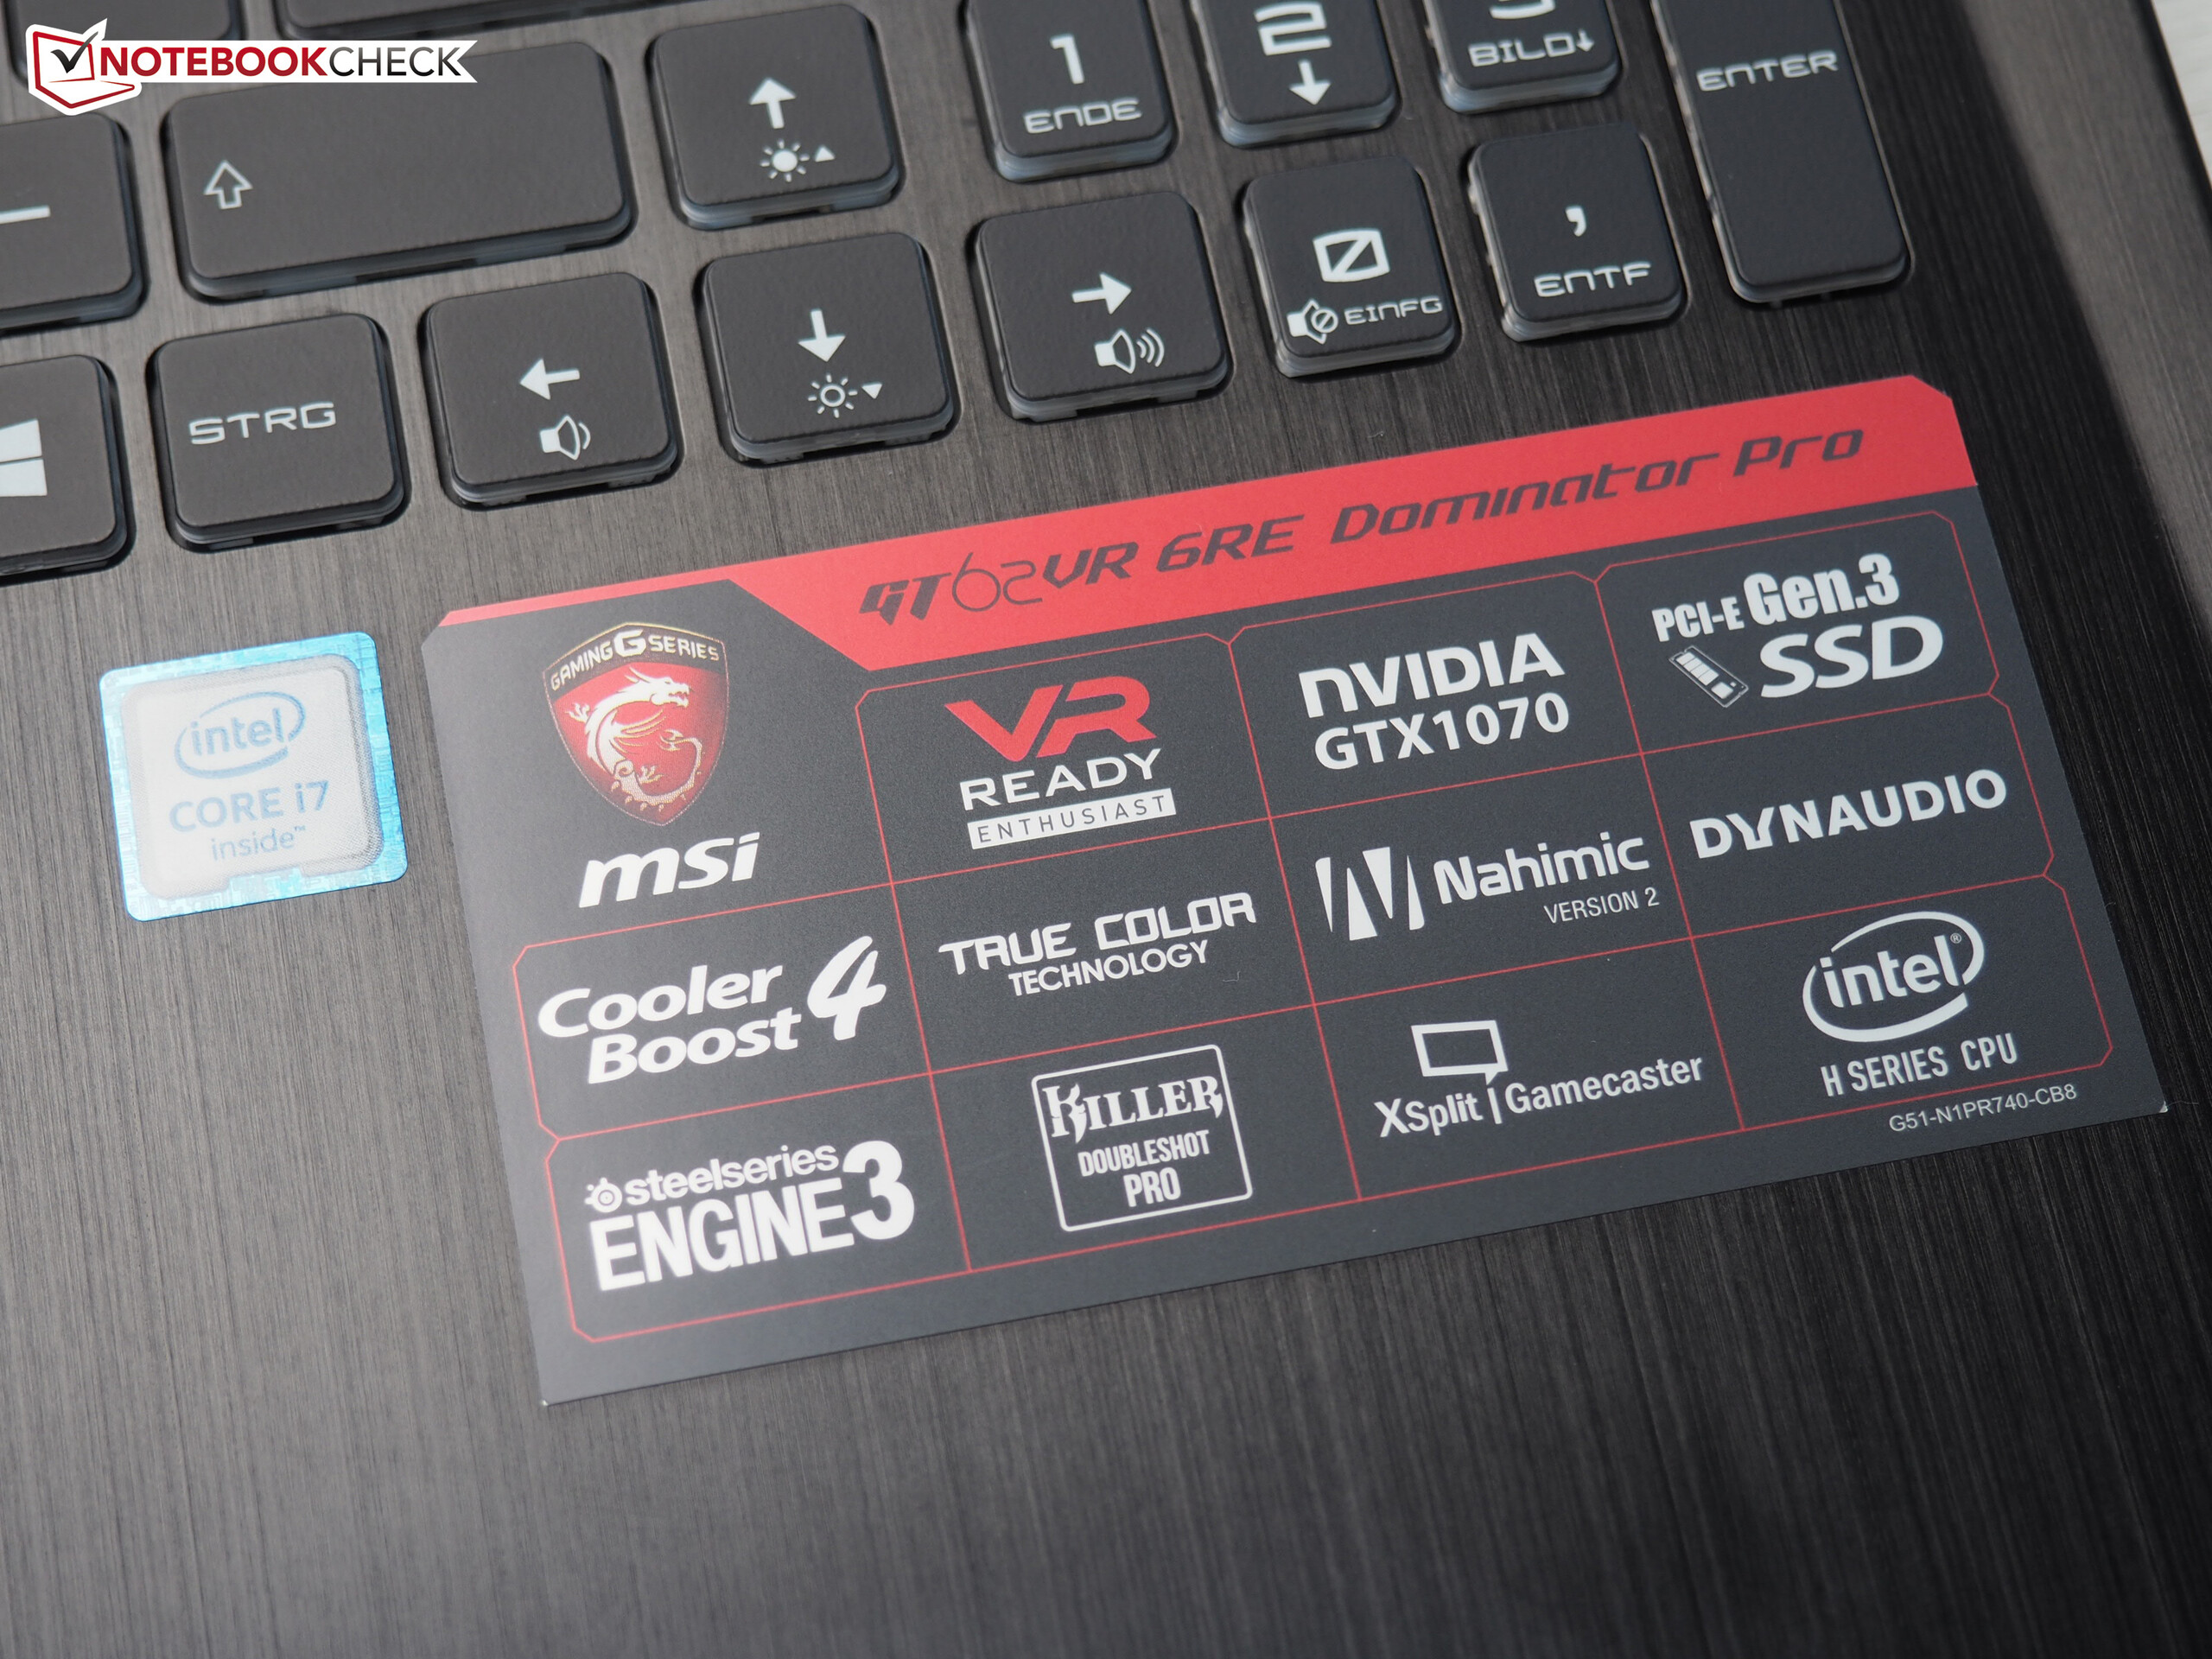
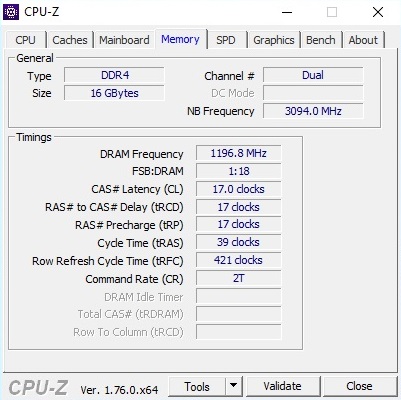
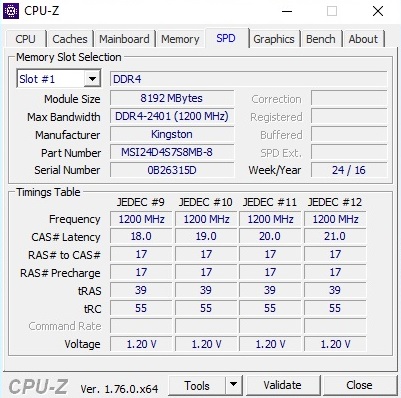
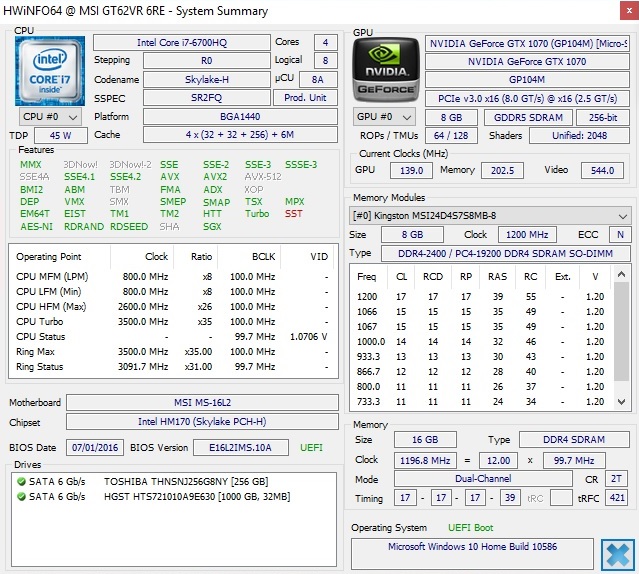
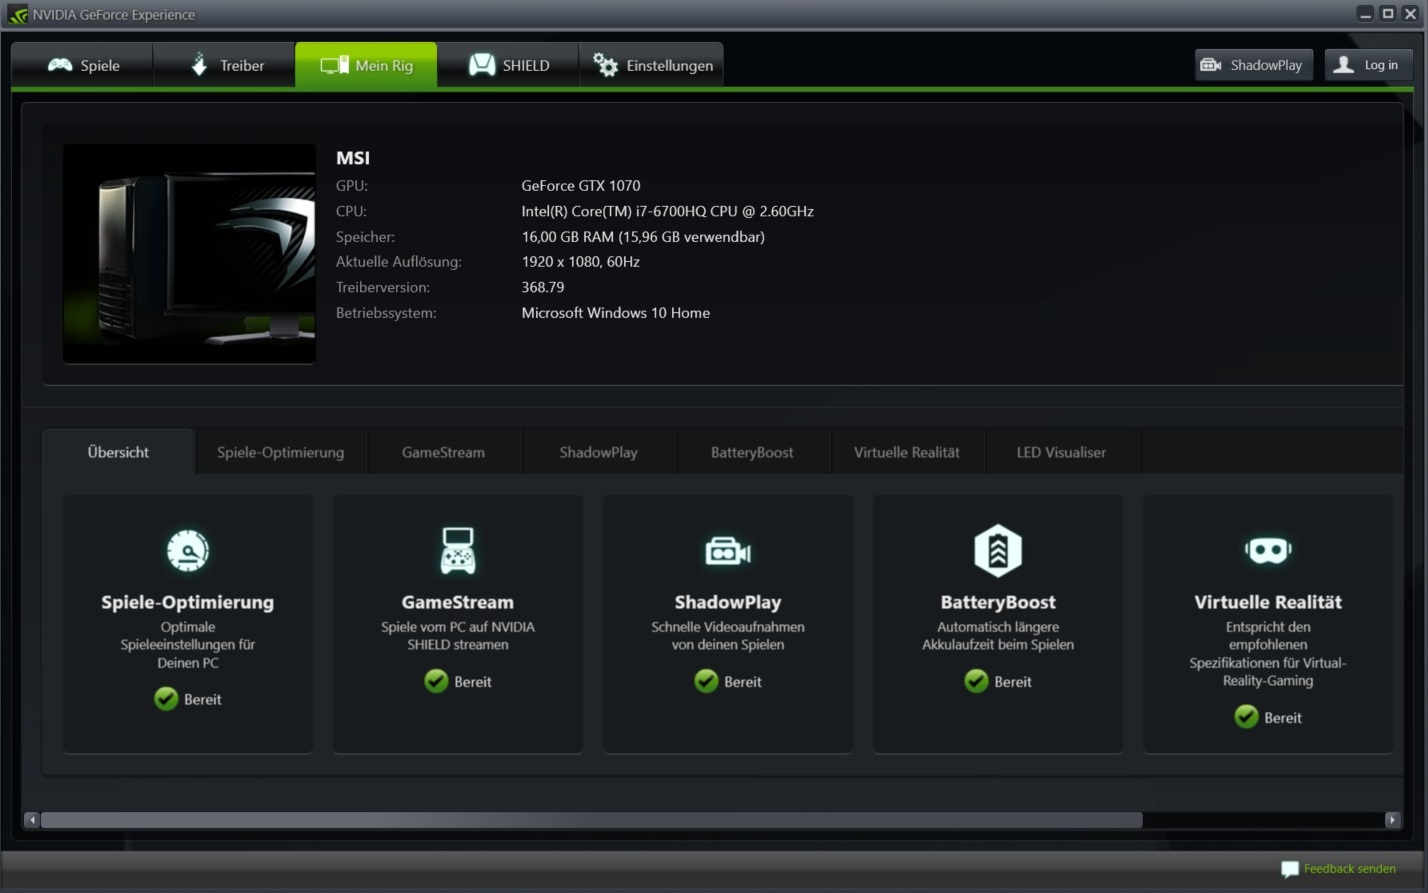
L'MSI GT62VR è una piattaforma gaming da 15", classificabile anche come un desktop replacement grazie alle sue generose features ed al potente hardware. La nostra unità è la 6RE16H21 ed ha un prezzo di 2.100 Euro e monta un pannello matto Full-HD IPS con supporto G-Sync, 16 GB di DDR4-RAM (2x 8 GB @2400 MHz) ed una combinazione SSD-HDD con una capacità totale di 1.25 TB.
La principale highlight è la nuova GPU. Similmente alla GeForce GTX 980 della generazione Maxwell, Nvidia utilizza il chip desktop per il segmento mobile. Grazie al processo di produzione più piccolo e a varie ottimizzazioni, la Pascal dovrebbe offrire molta più potenza con consumi inferiori, il che è un vantaggio soprattutto per i portatili. Tutti i dettagli sulla nuova architettura GPU li trovate nel nostro articolo dedicato.
Case
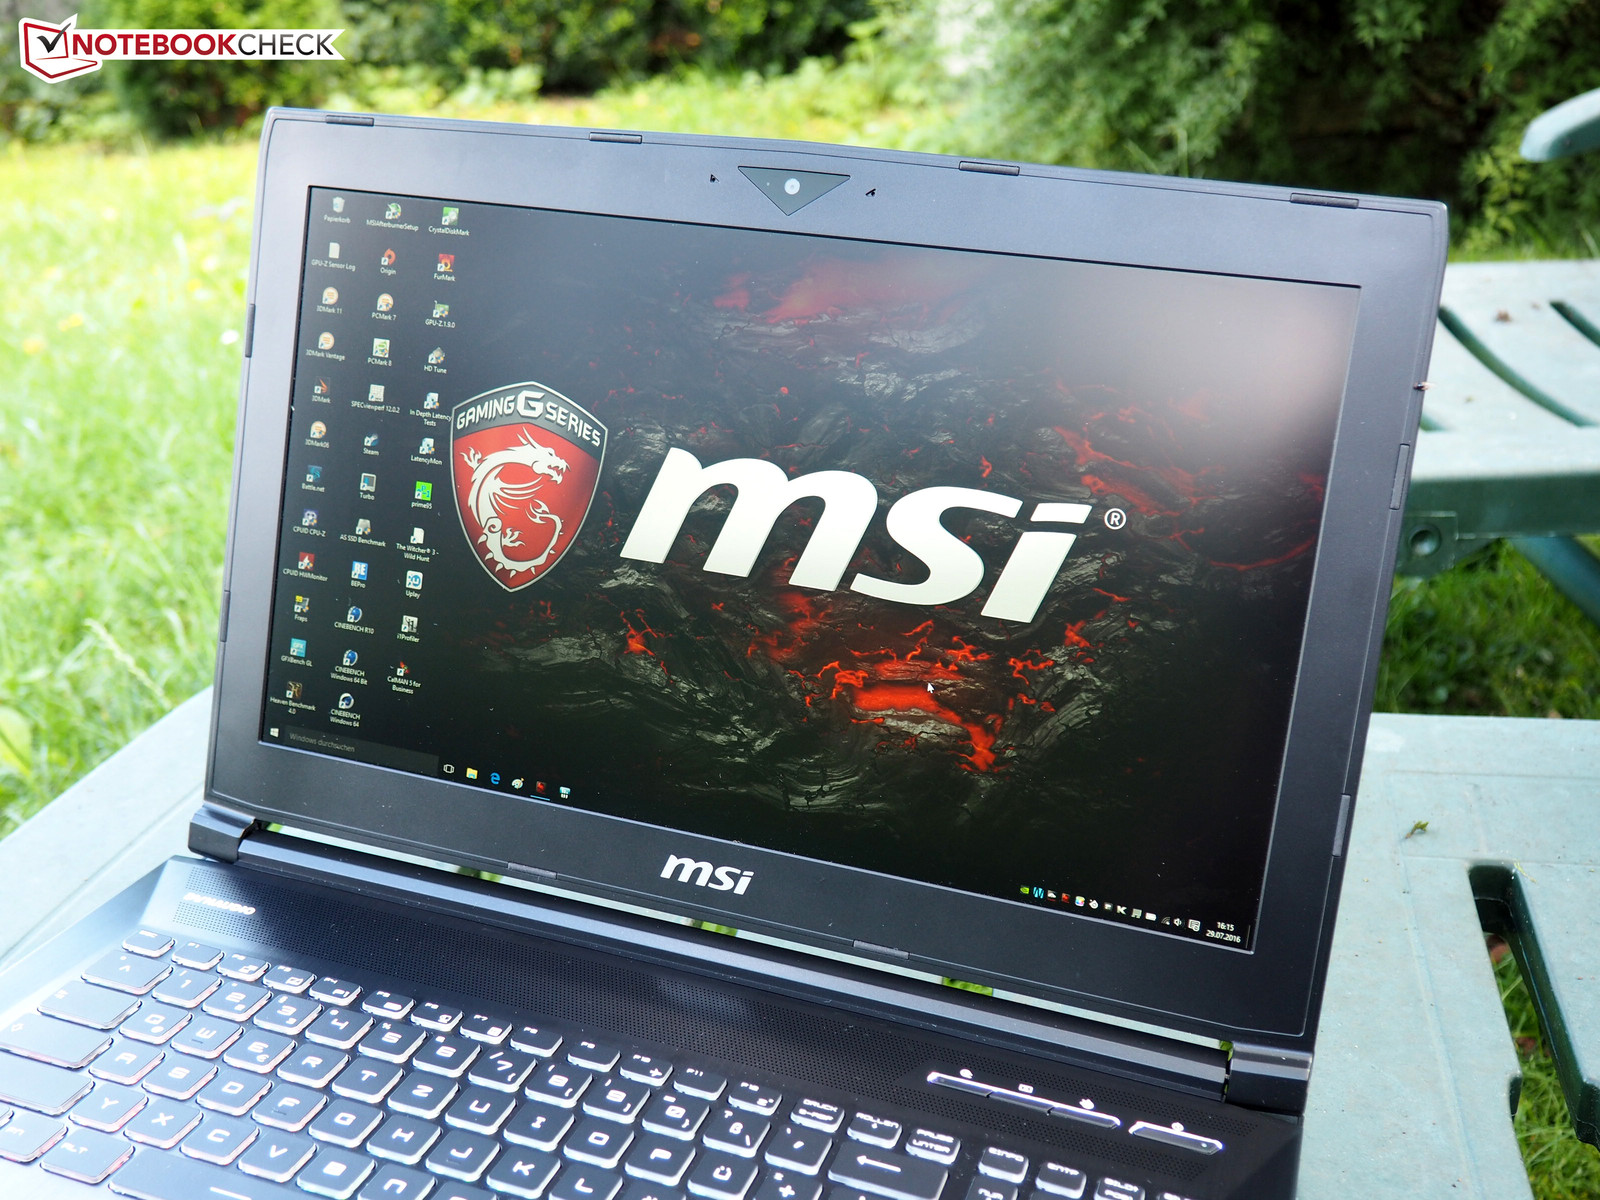
Dopo il modello 2014 della GT60 abbiamo avuto sempre chassis ingombranti, MSI ora utilizza un design più raffinato per il GT62VR, che si basa sulla GE-series. Non c'è molto da criticare in termini di qualità. Il lato inferiore dell'unità base è in plastica, ma sia i poggiapolsi che la cover sono in metallo (alluminio spazzolato). La stabilità di questo 15" è decente. Se da un lato potete leggermente torcere la cover, dall'altro anche una forte pressione non crea problemi all'unità base. Tra i motivi l'assenza di un drive ottico. Le cerniere non sono nulla id speciale, ed è facile aprire la cover con una sola mano.
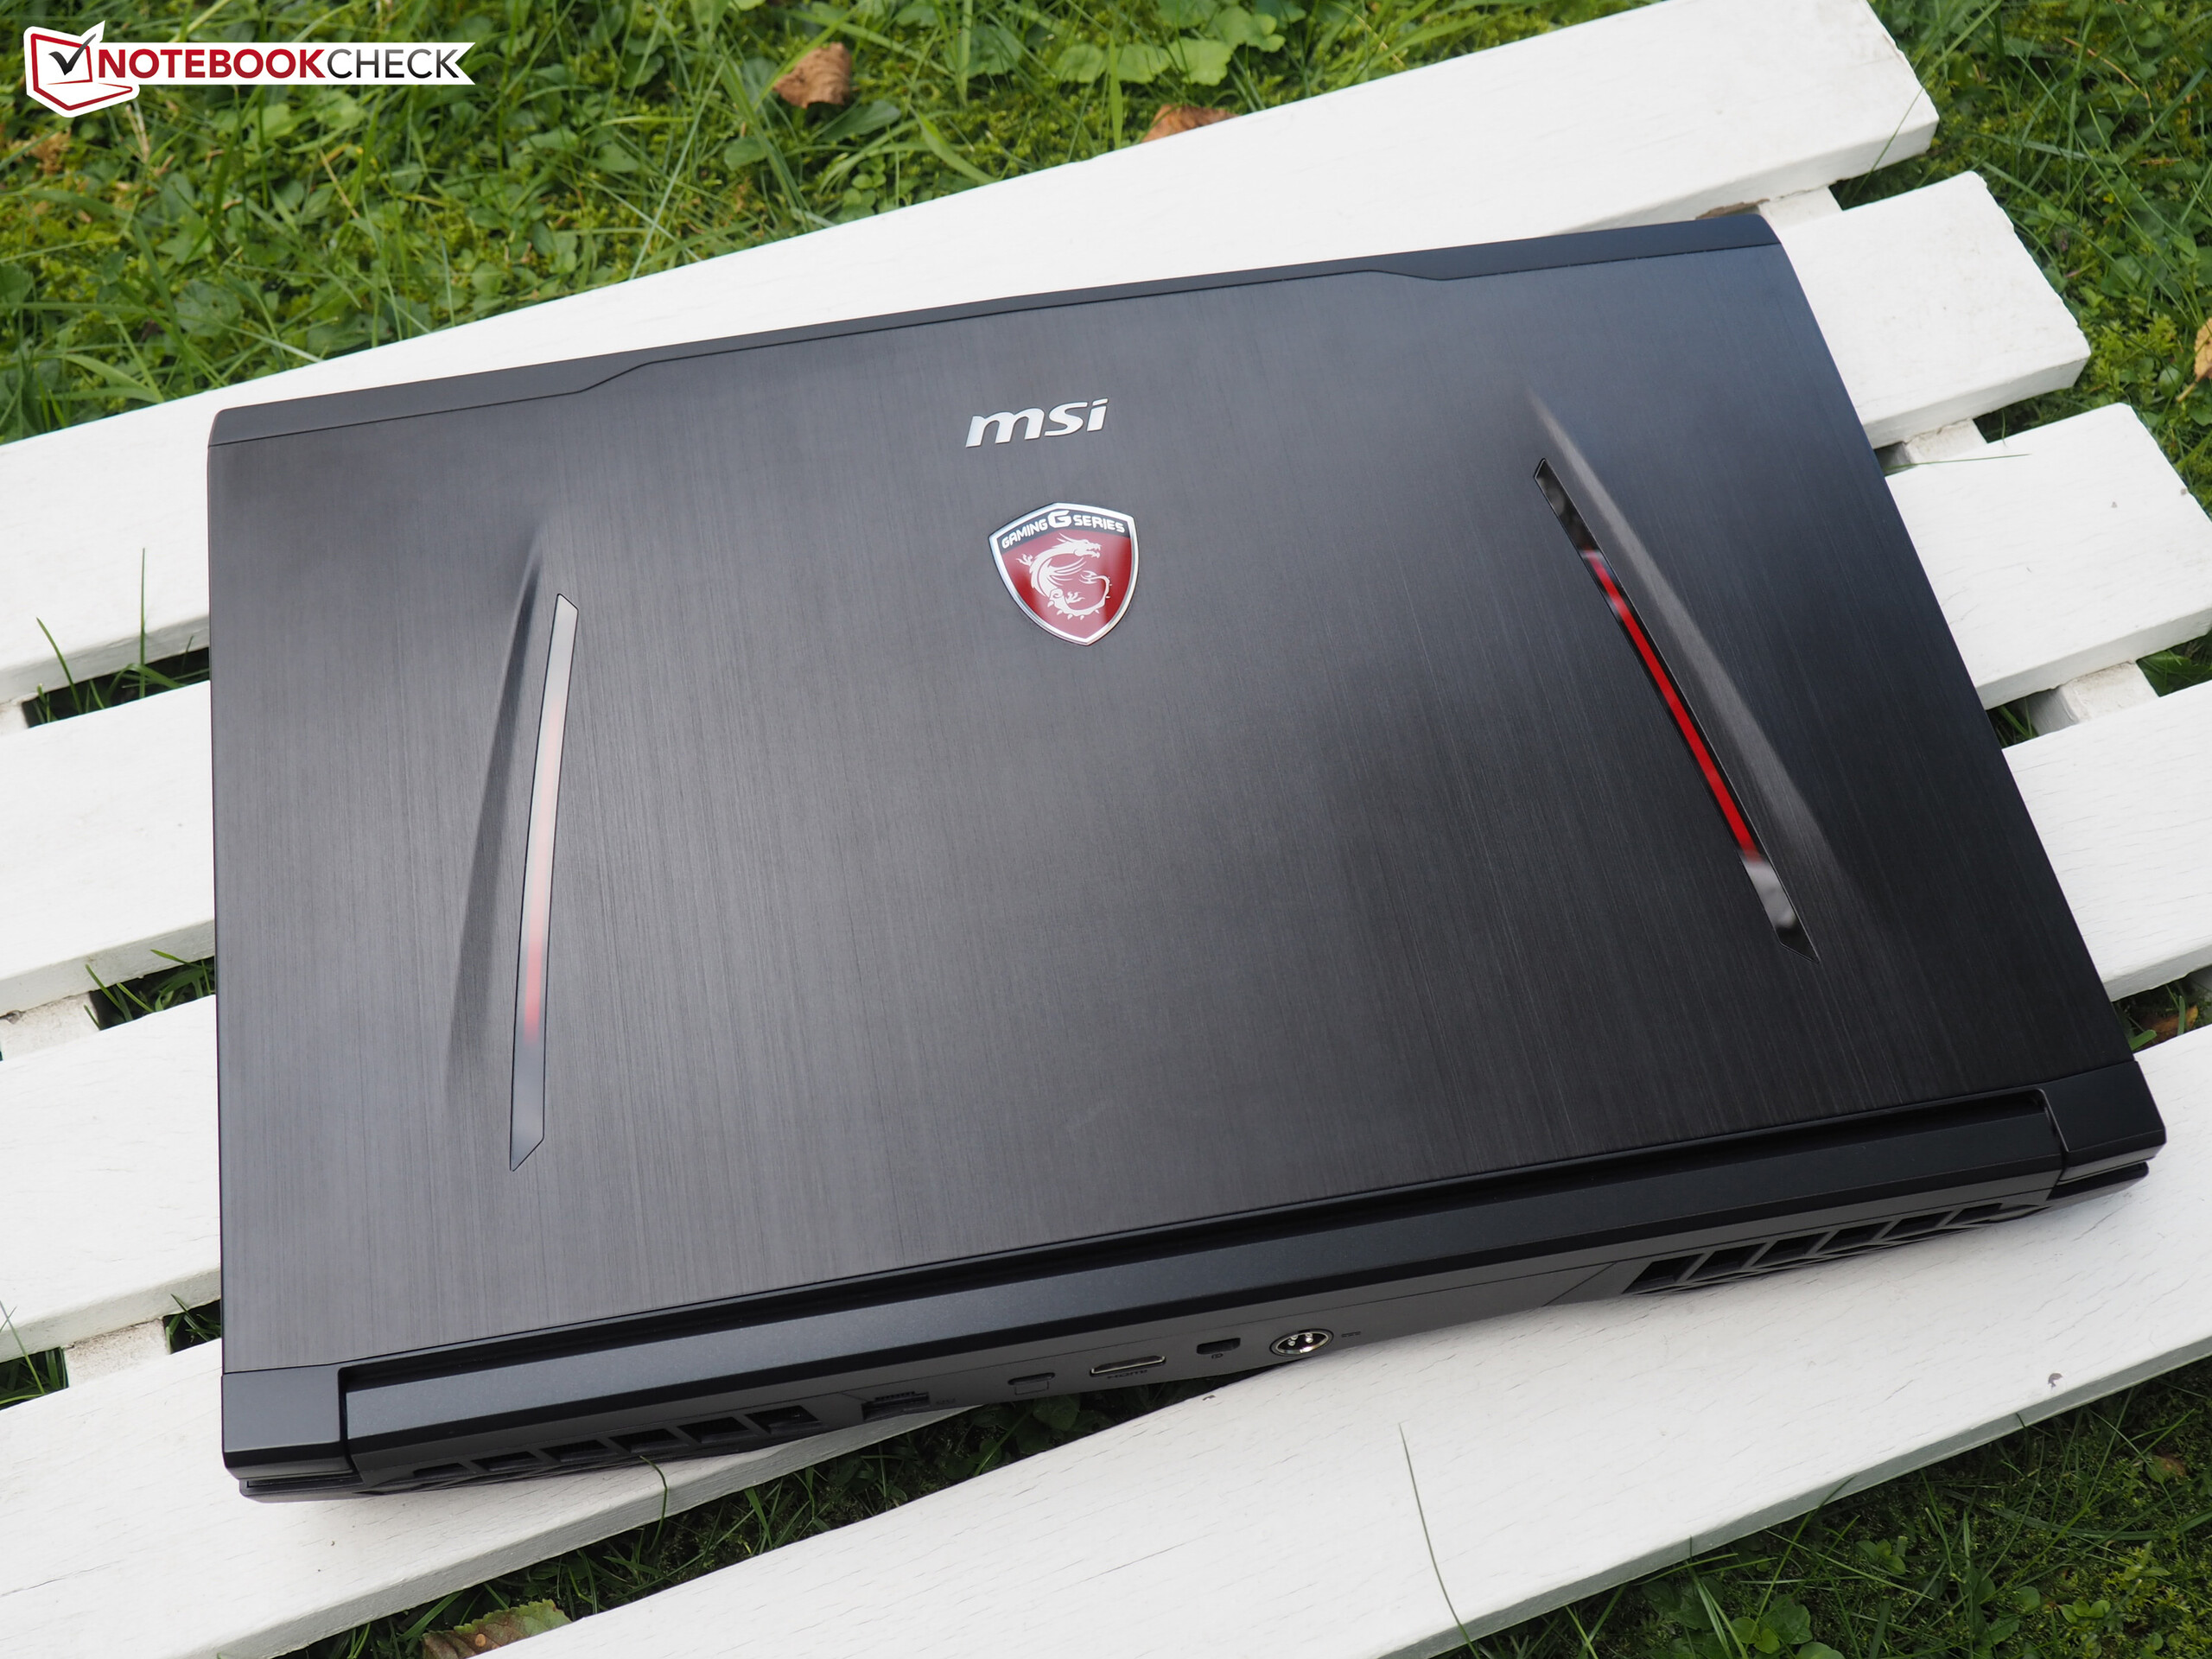
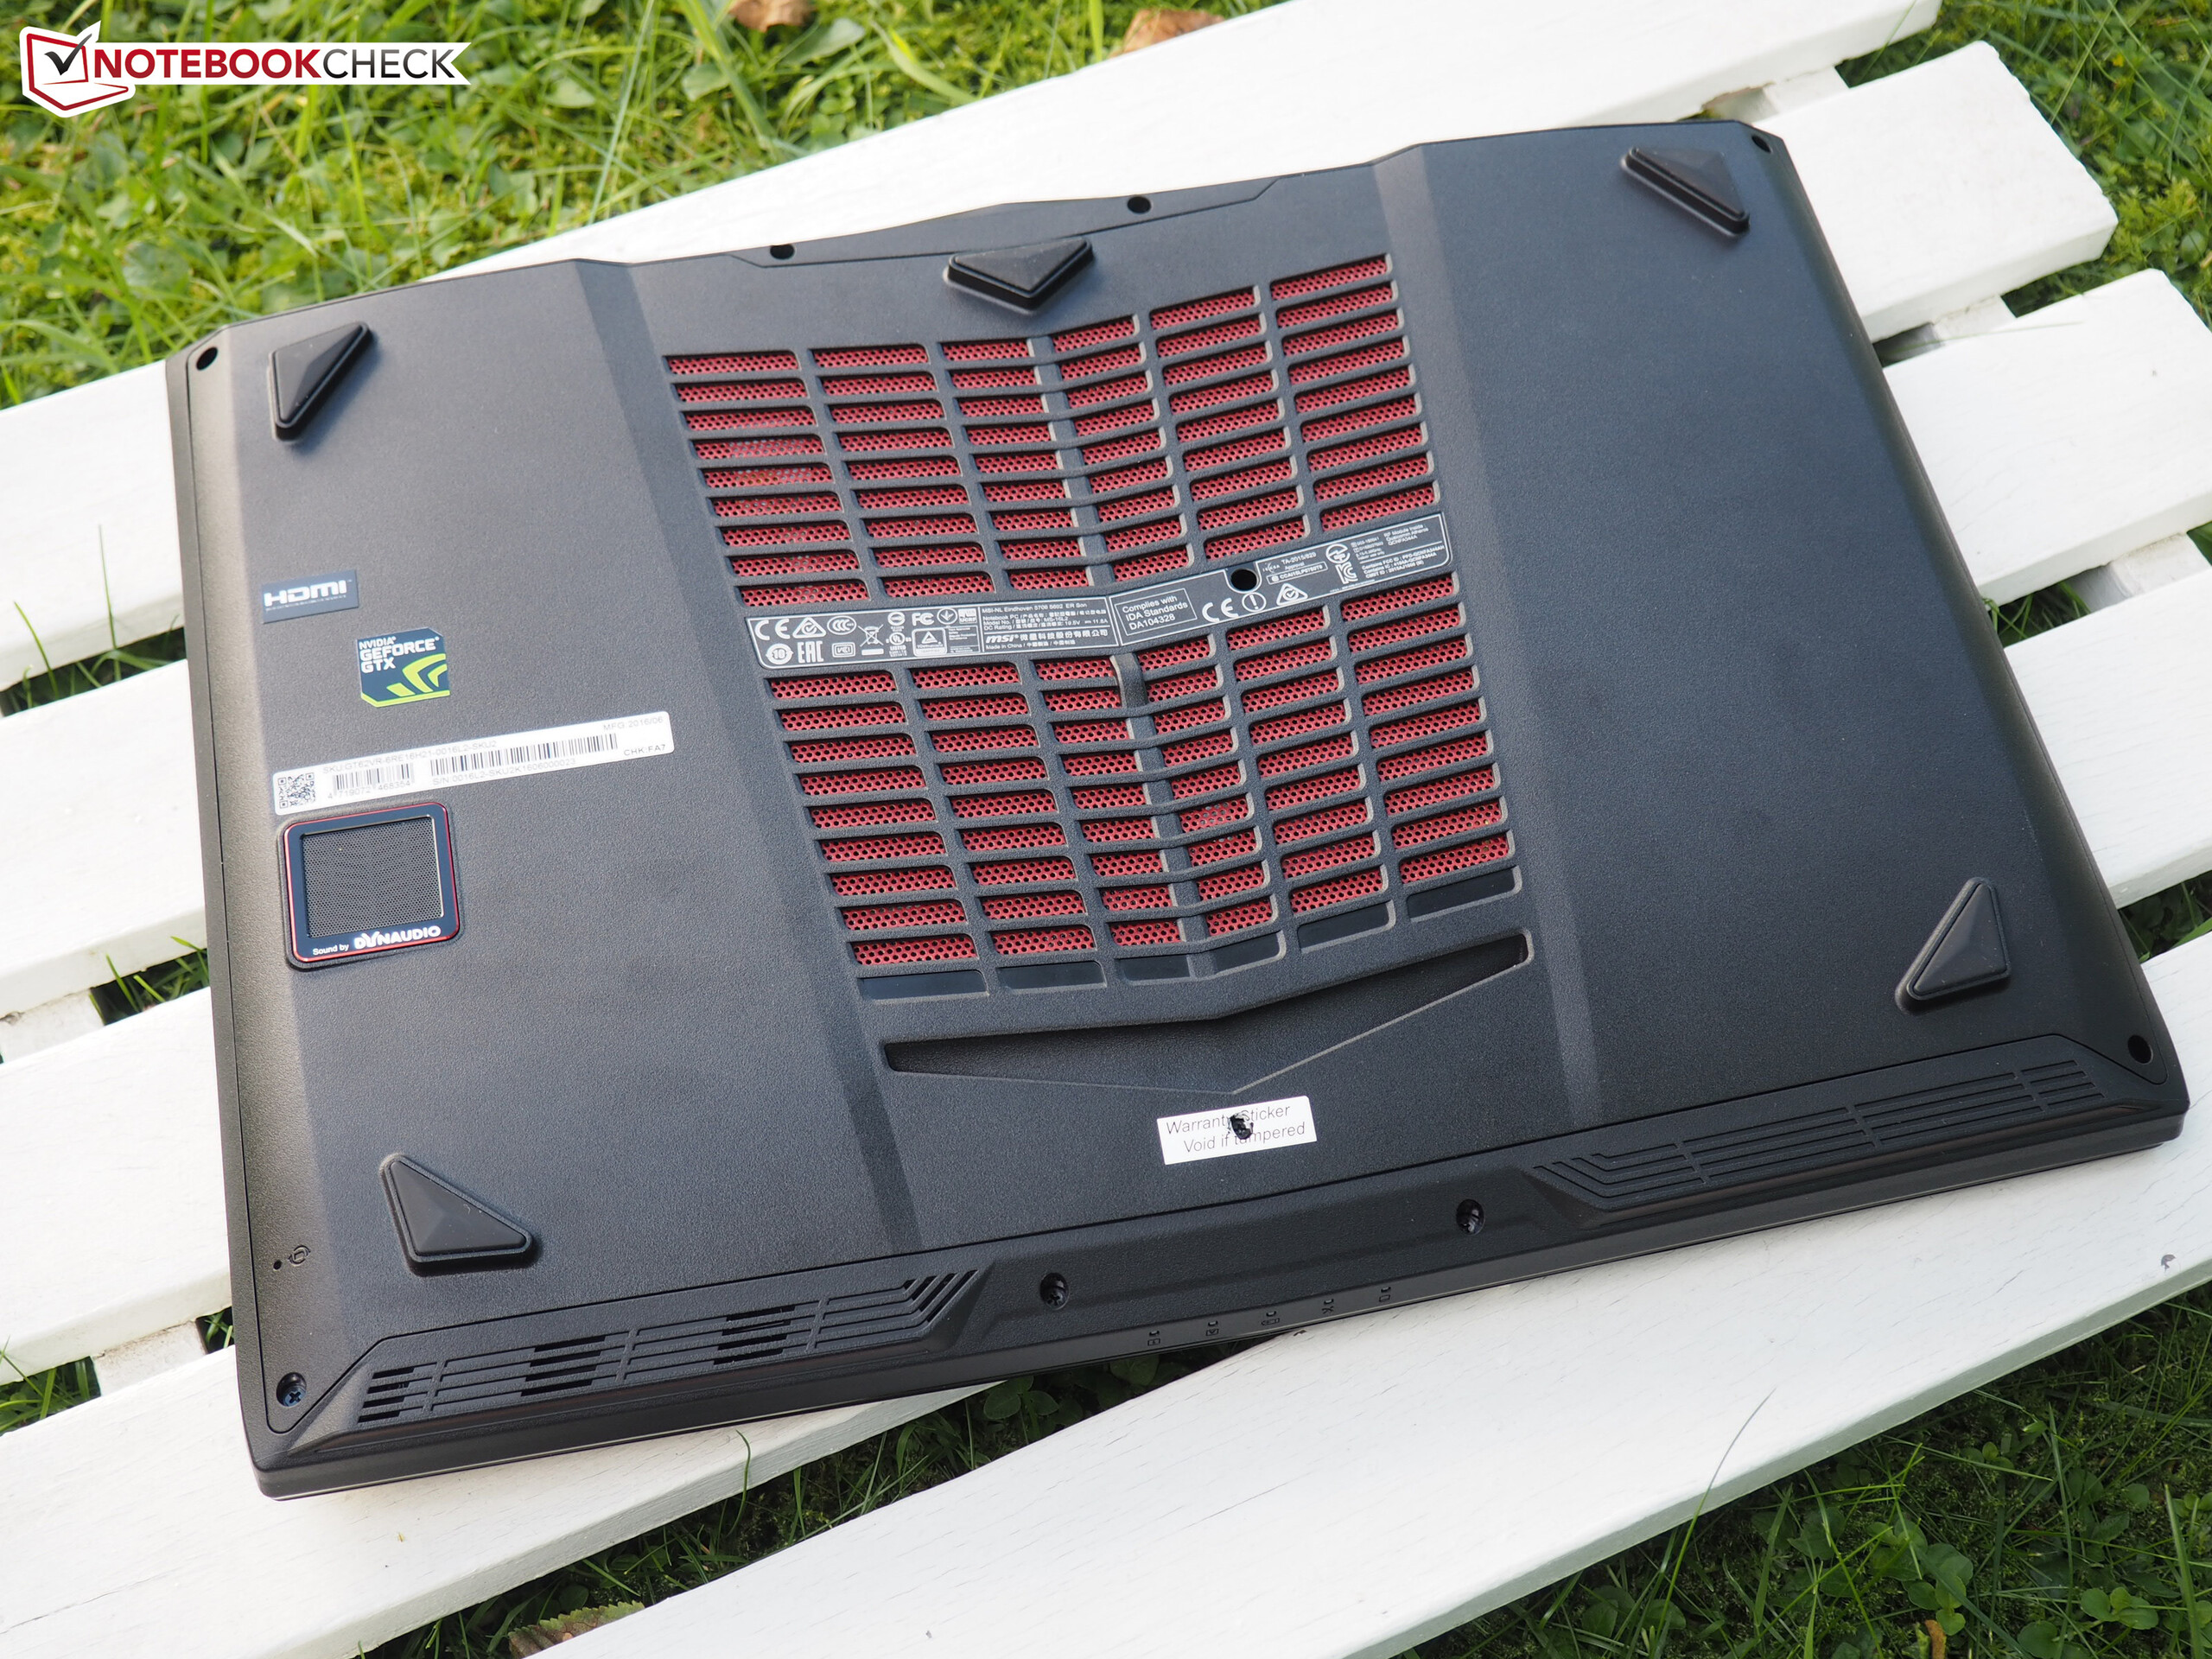
Dimensioni e peso sono nella media. Con 2,9 kg ed uno spessore di 4 cm, il GT62VR è tra il GE62 (2,4 kg, 2,9 cm) ed il vecchio GT60 (3,3 kg, 5,5 cm). La qualità di costruzione rispecchia il prezzo. Quasi tutte le superficie e gli elementi appaiono integrati. Il design del portatile MSI è abbastanza convenzionale e questo gaming notebook sembra essere abbastanza sobrio ad eccezione del logo del dragone, due strisce rosse sulla cover e una ventola rossa sul lato inferiore. Diventa più colorato quando si usa la tastiera illuminata chiclet con le sue tre zone configurabili.
Connettività
Porte
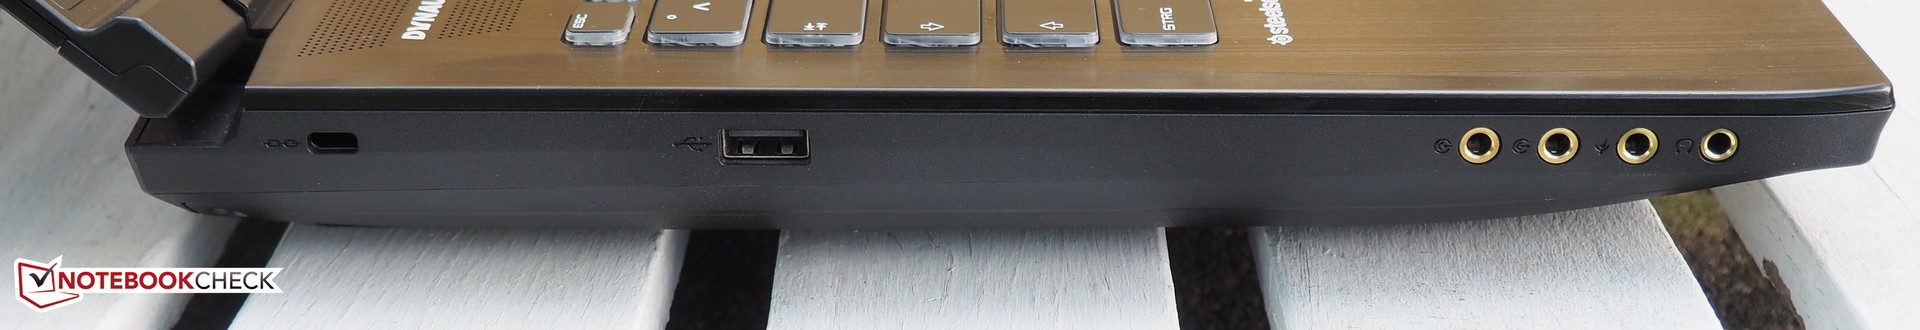
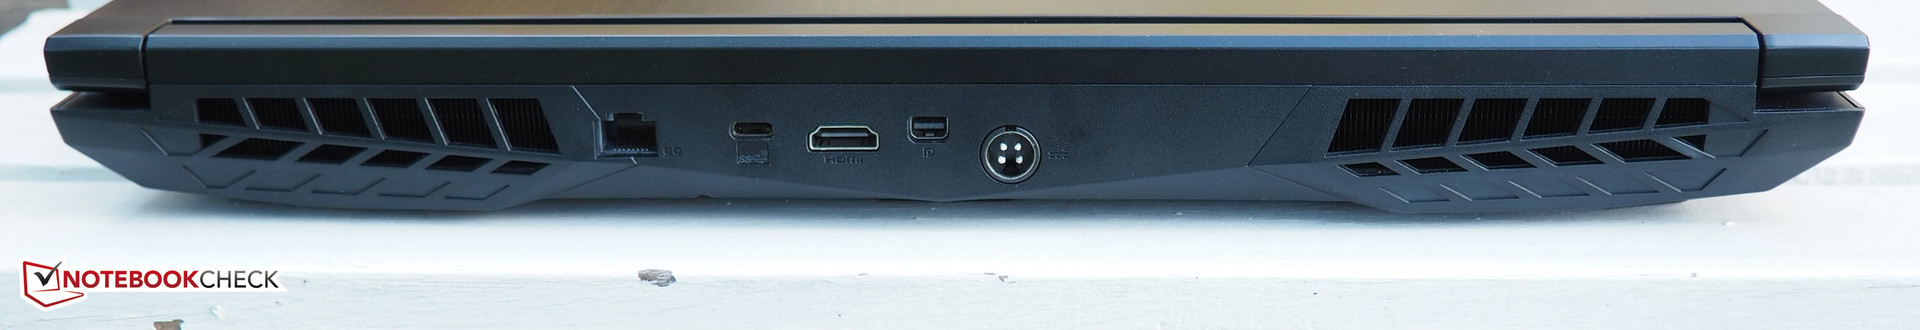
La varietà di porte non lascia nulla a desiderare. MSI monta cinque porte USB (1x 2.0, 1x 3.0, 1x 3.1 Type-C), che sono distribuite sui lati e da dietro. Avrete anche due uscite video digitali con HDMI 1.4 (sfortunatamente non HDMI 2.0) ed una Mini-DisplayPort 1.2, che consente un setup a tre monitor incluso il display del portatile. Per il resto, ci sono una porta RJ45 Gigabit Ethernet ed uno slot per un Kensington Lock. Il pacchetto è completato da quattro porte audio dorate (S/PDIF & 7.1 analogica), ma si trovano troppo lontane dal lato frontale a nostro parere.
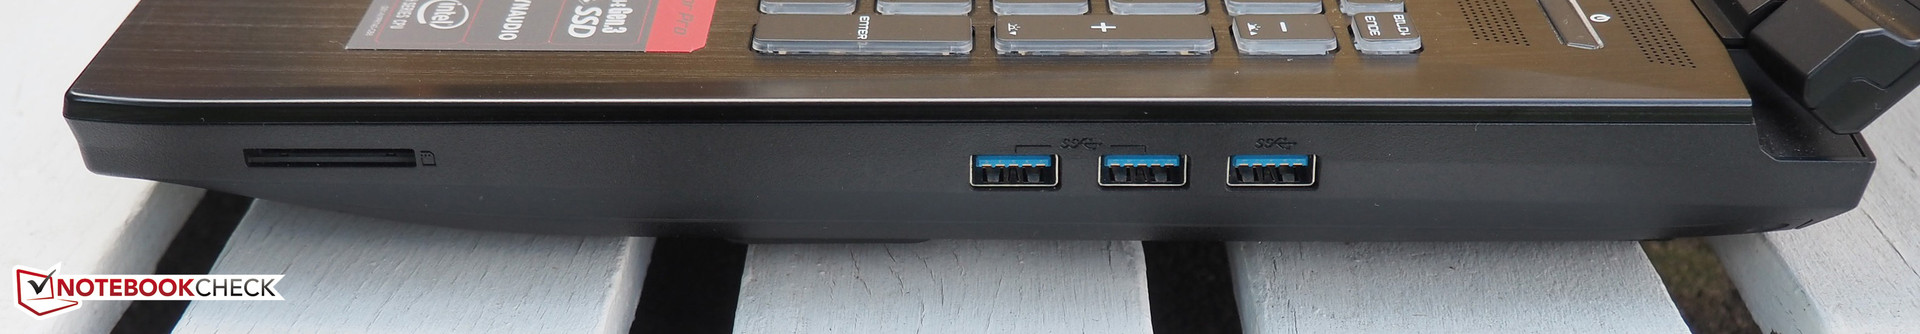
SD-Card Reader
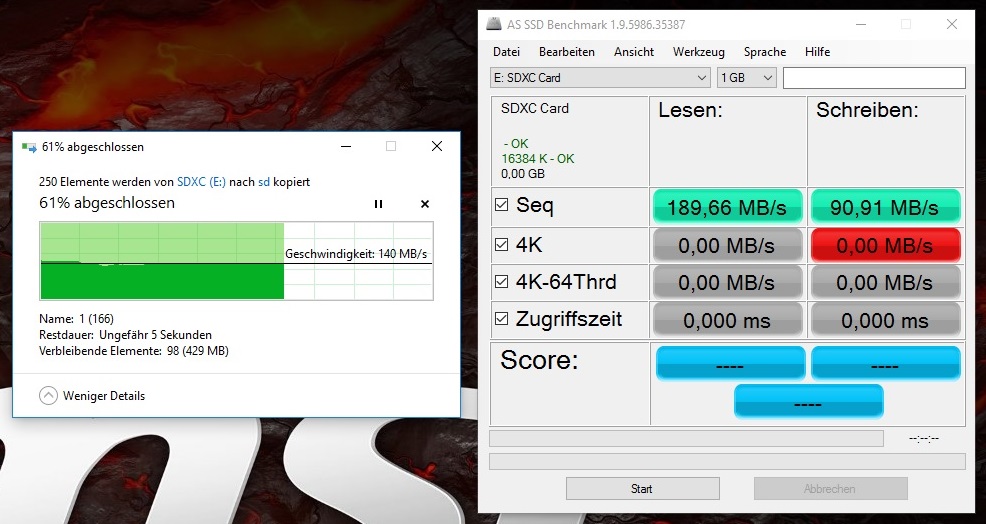
Ovviamente c'è anche un card reader. Rispetto ai concorrenti da 15", il GT62VR ha un valore di trasferimento dati superiore. Abbiamo registrato tra 140 (copia immagini) e 190 MB/s (lettura sequenziale) unitamente alla nostra scheda di riferimento Toshiba Exceria Pro SDXC 64 GB UHS-II. Oltre all'Acer Predator 15, sia lo Schenker XMG P506 che il Gigabyte P55W v5 si fermano ad un valore di trasferimento sotto i 100 MB/s.
| SD Card Reader | |
| average JPG Copy Test (av. of 3 runs) | |
| MSI GT62VR-6RE16H21 | |
| Acer Predator 15 G9-592-7925 | |
| Schenker XMG P506 PRO | |
| Gigabyte P55W v5 | |
| maximum AS SSD Seq Read Test (1GB) | |
| MSI GT62VR-6RE16H21 | |
| Acer Predator 15 G9-592-7925 | |
| Schenker XMG P506 PRO | |
| Gigabyte P55W v5 | |
Comunicazioni
Tutte le comunicazioni sono gestite da moduli Qualcomm/Atheros. I collegamenti via cavo sono gestiti dal controller Killer E2400 Gigabit-Ethernet, mentre i collegamenti wireless possono essere stabiliti da un adattatore Killer Wireless-n/a/ac 1435. Quest'ultimo non solo supporta tutti gli standars, ma anche il Bluetooth 4.1. Non sorprendono i risultati del nostro recente test WLAN. Il modello di test è arrivato a 559-630 Mbps in media ad una distanza di un metro - un buon risultato.
| Networking | |
| iperf Server (receive) TCP 1 m | |
| MSI GT62VR-6RE16H21 | |
| iperf Client (transmit) TCP 1 m | |
| MSI GT62VR-6RE16H21 | |
Manutenzione
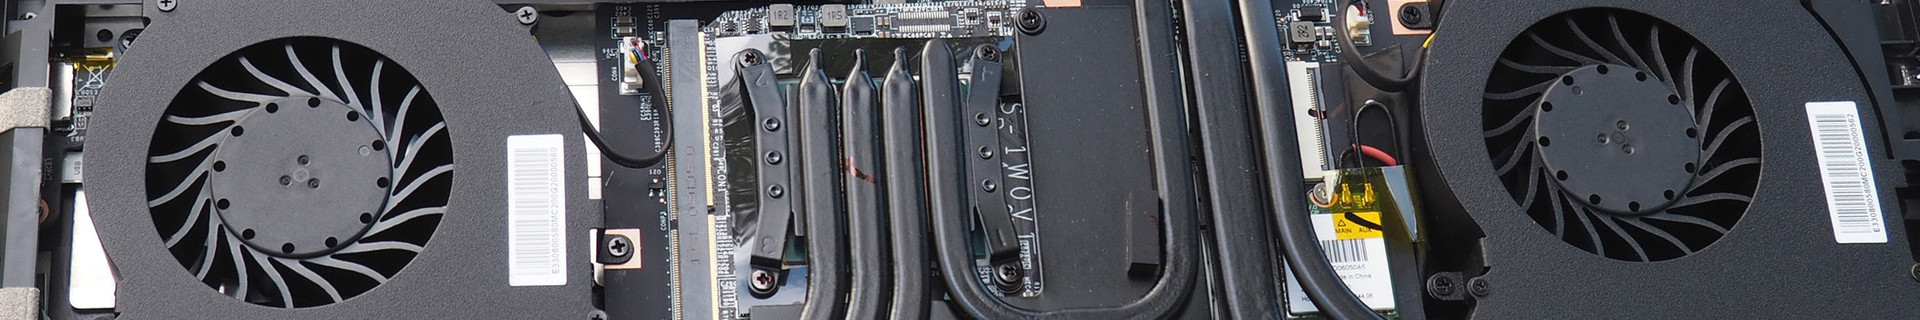
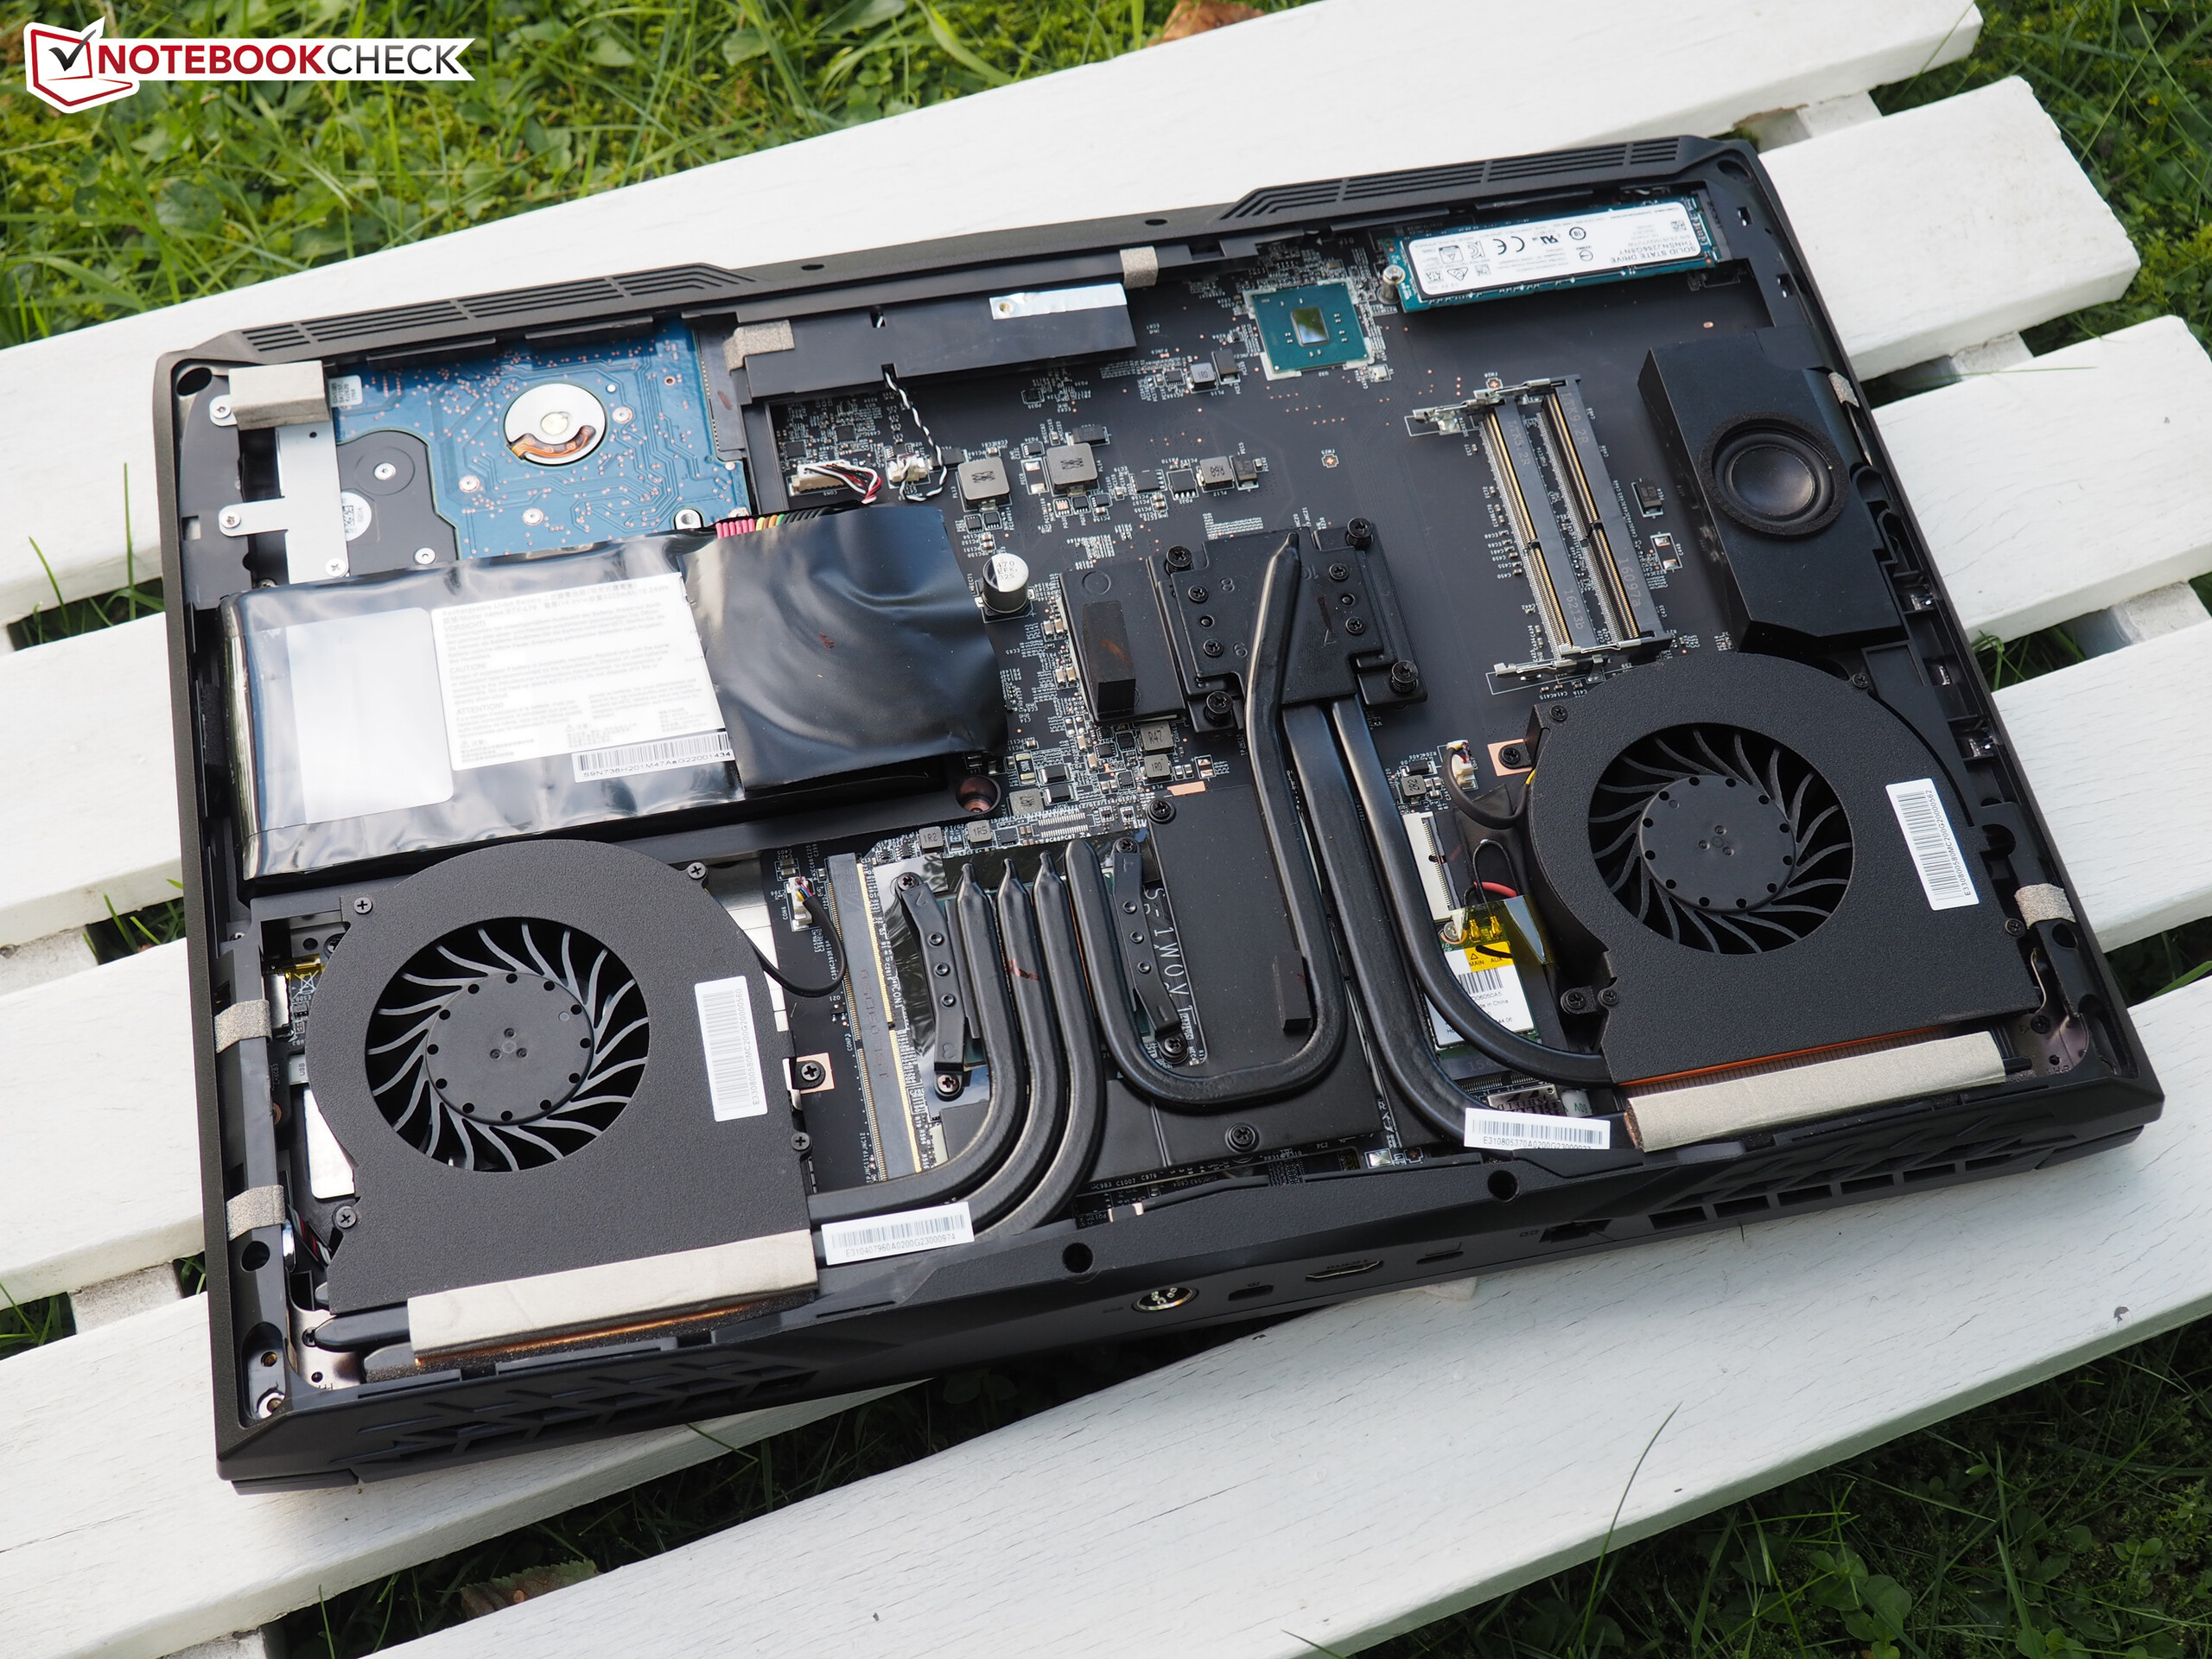
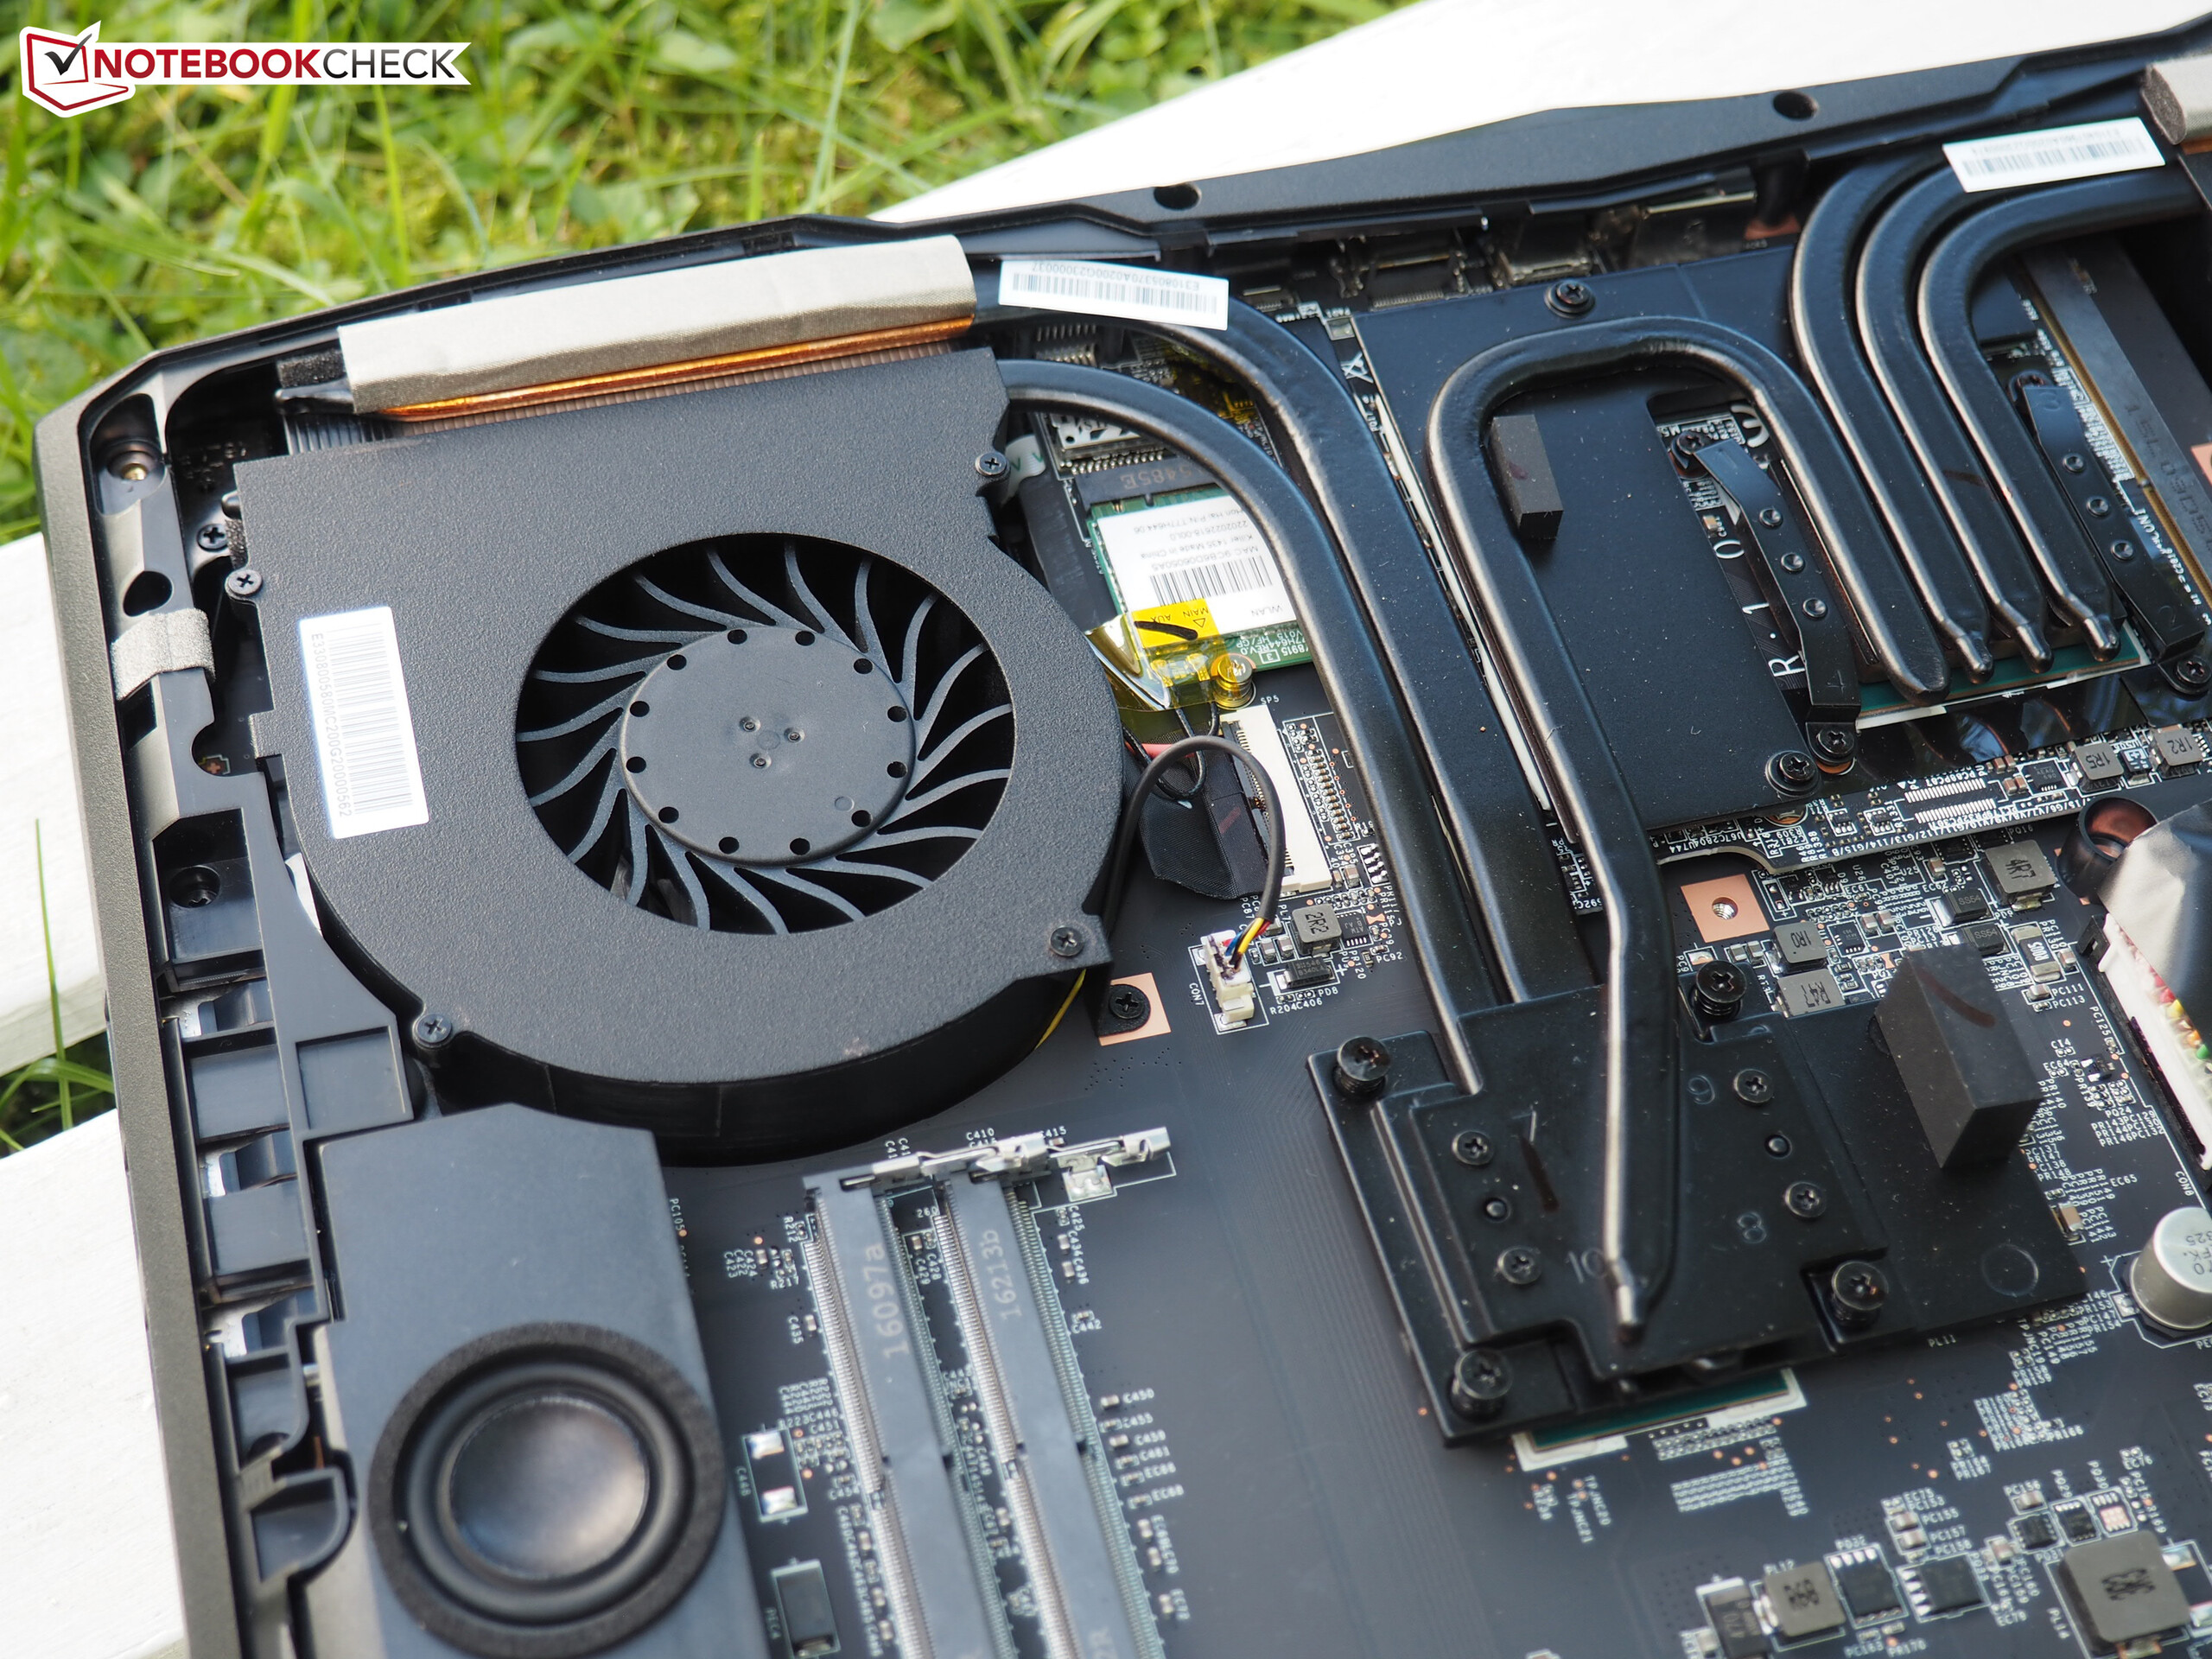
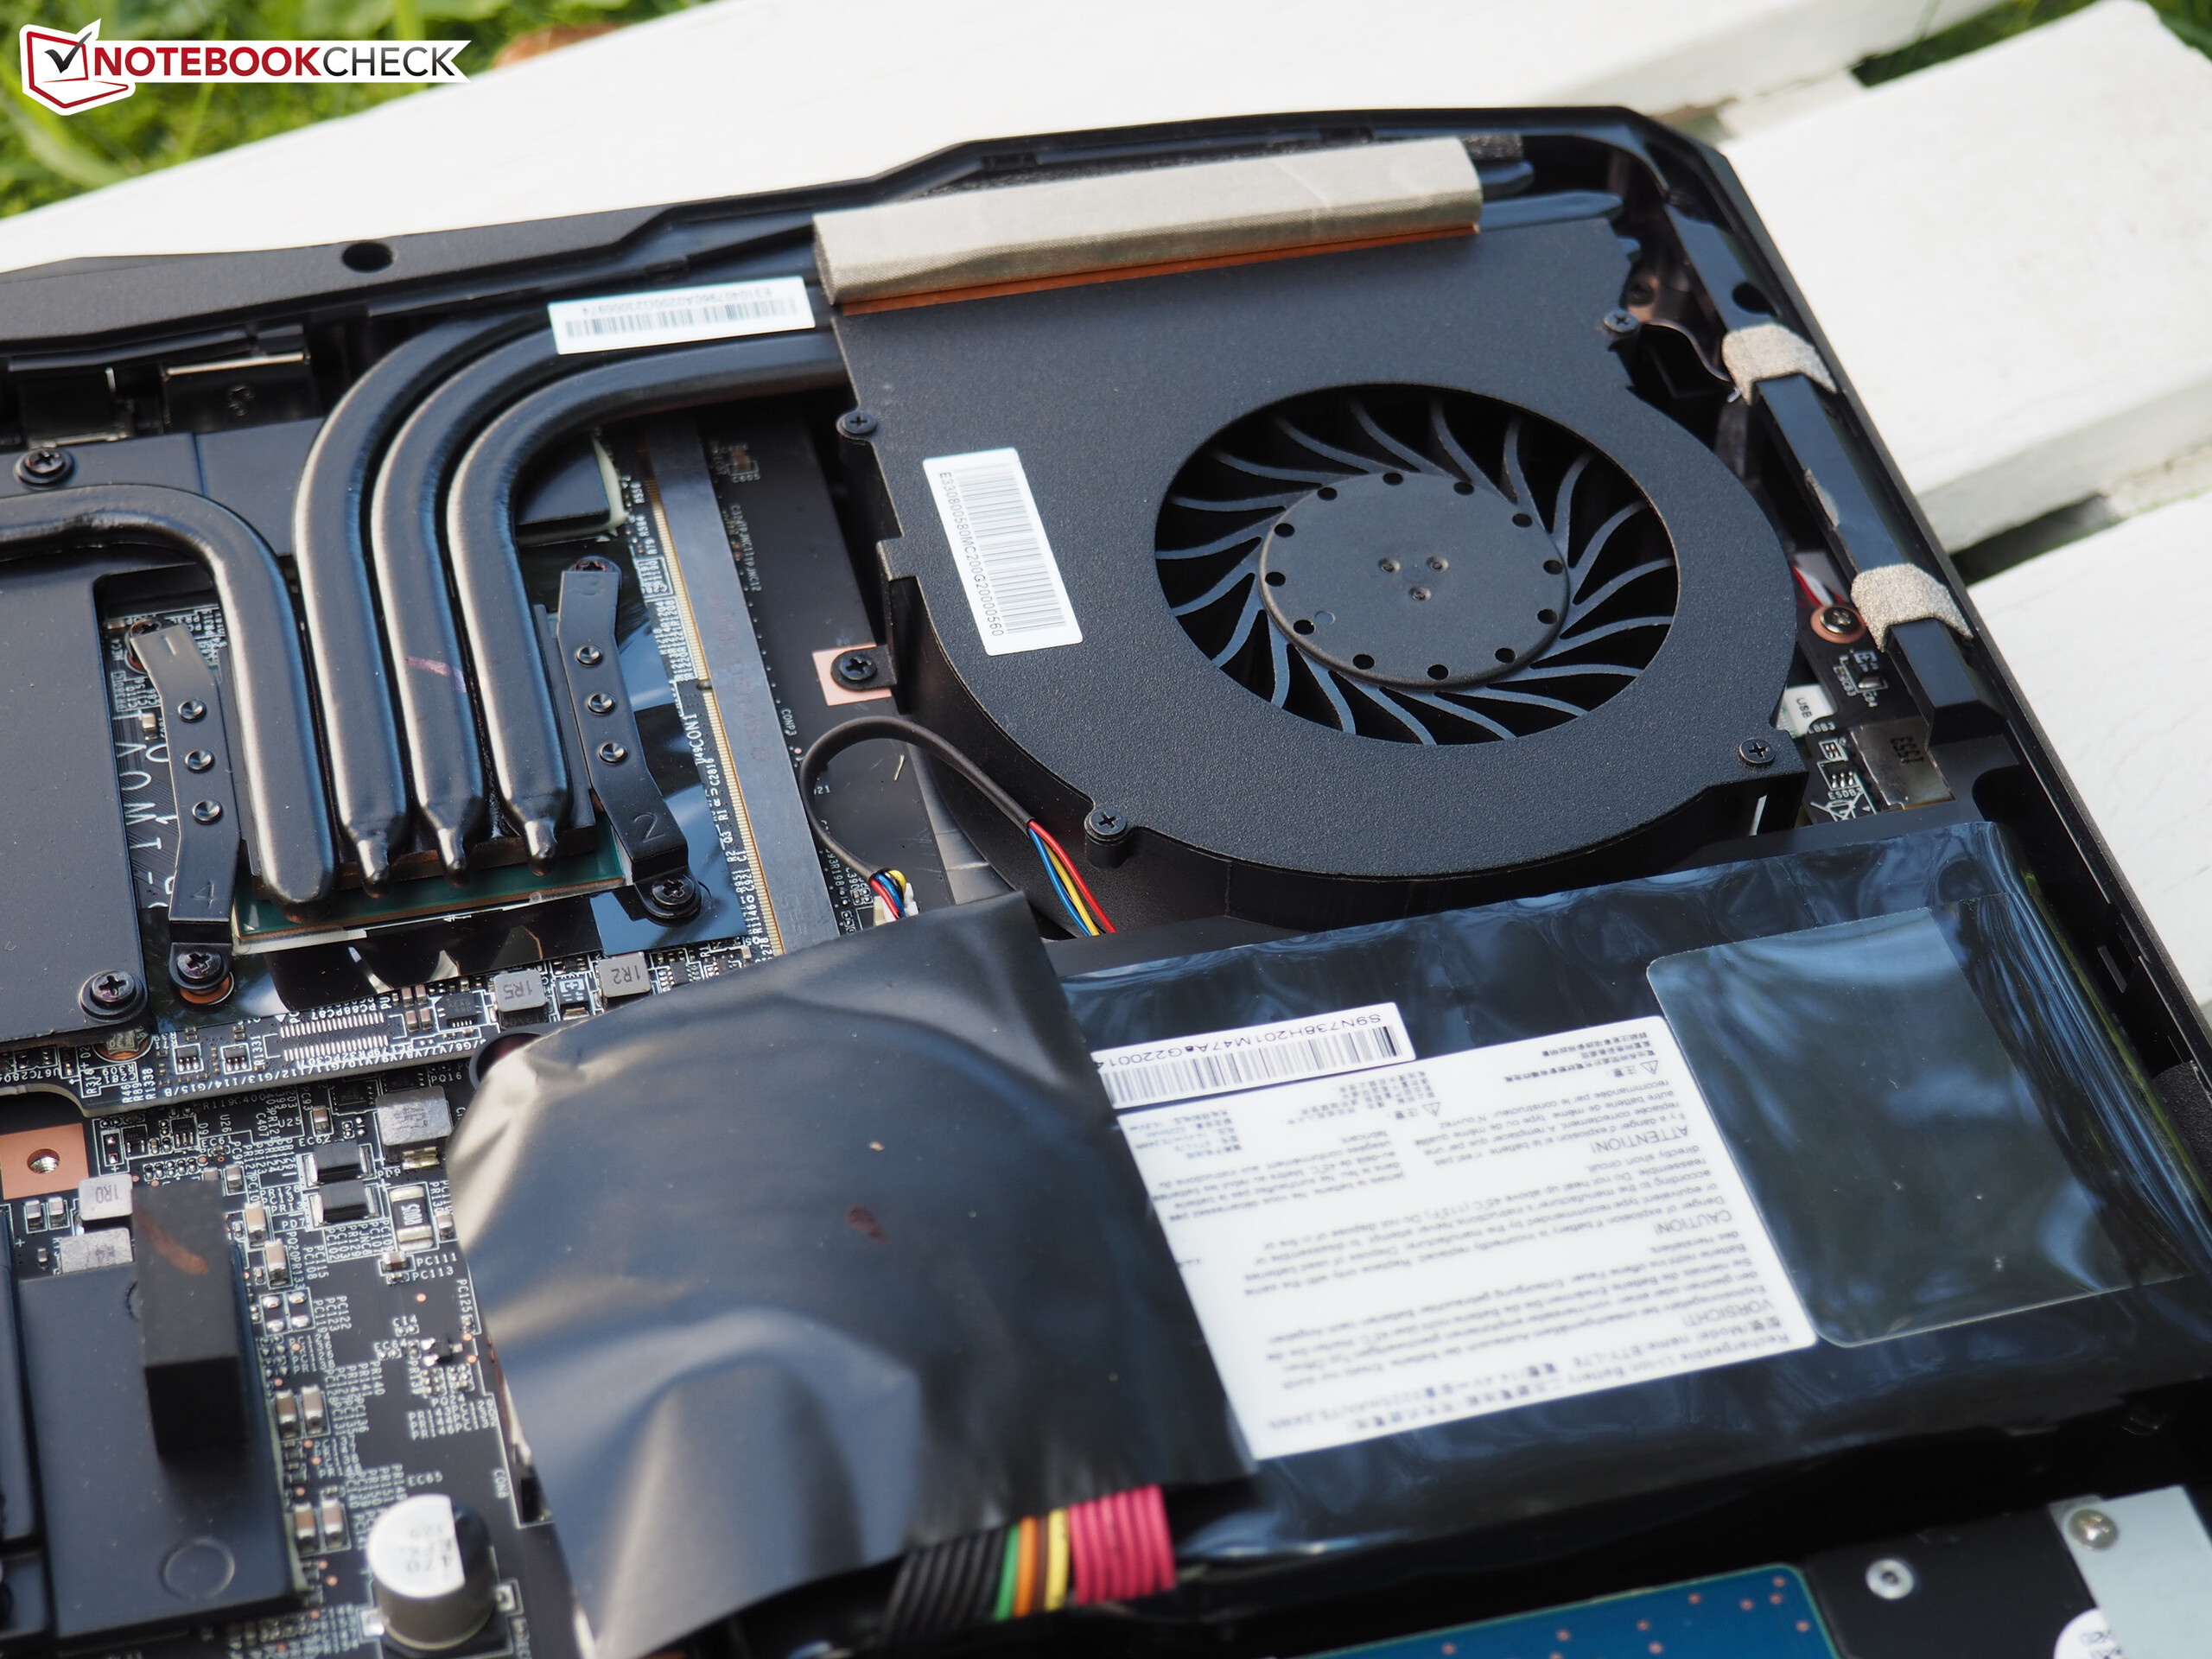
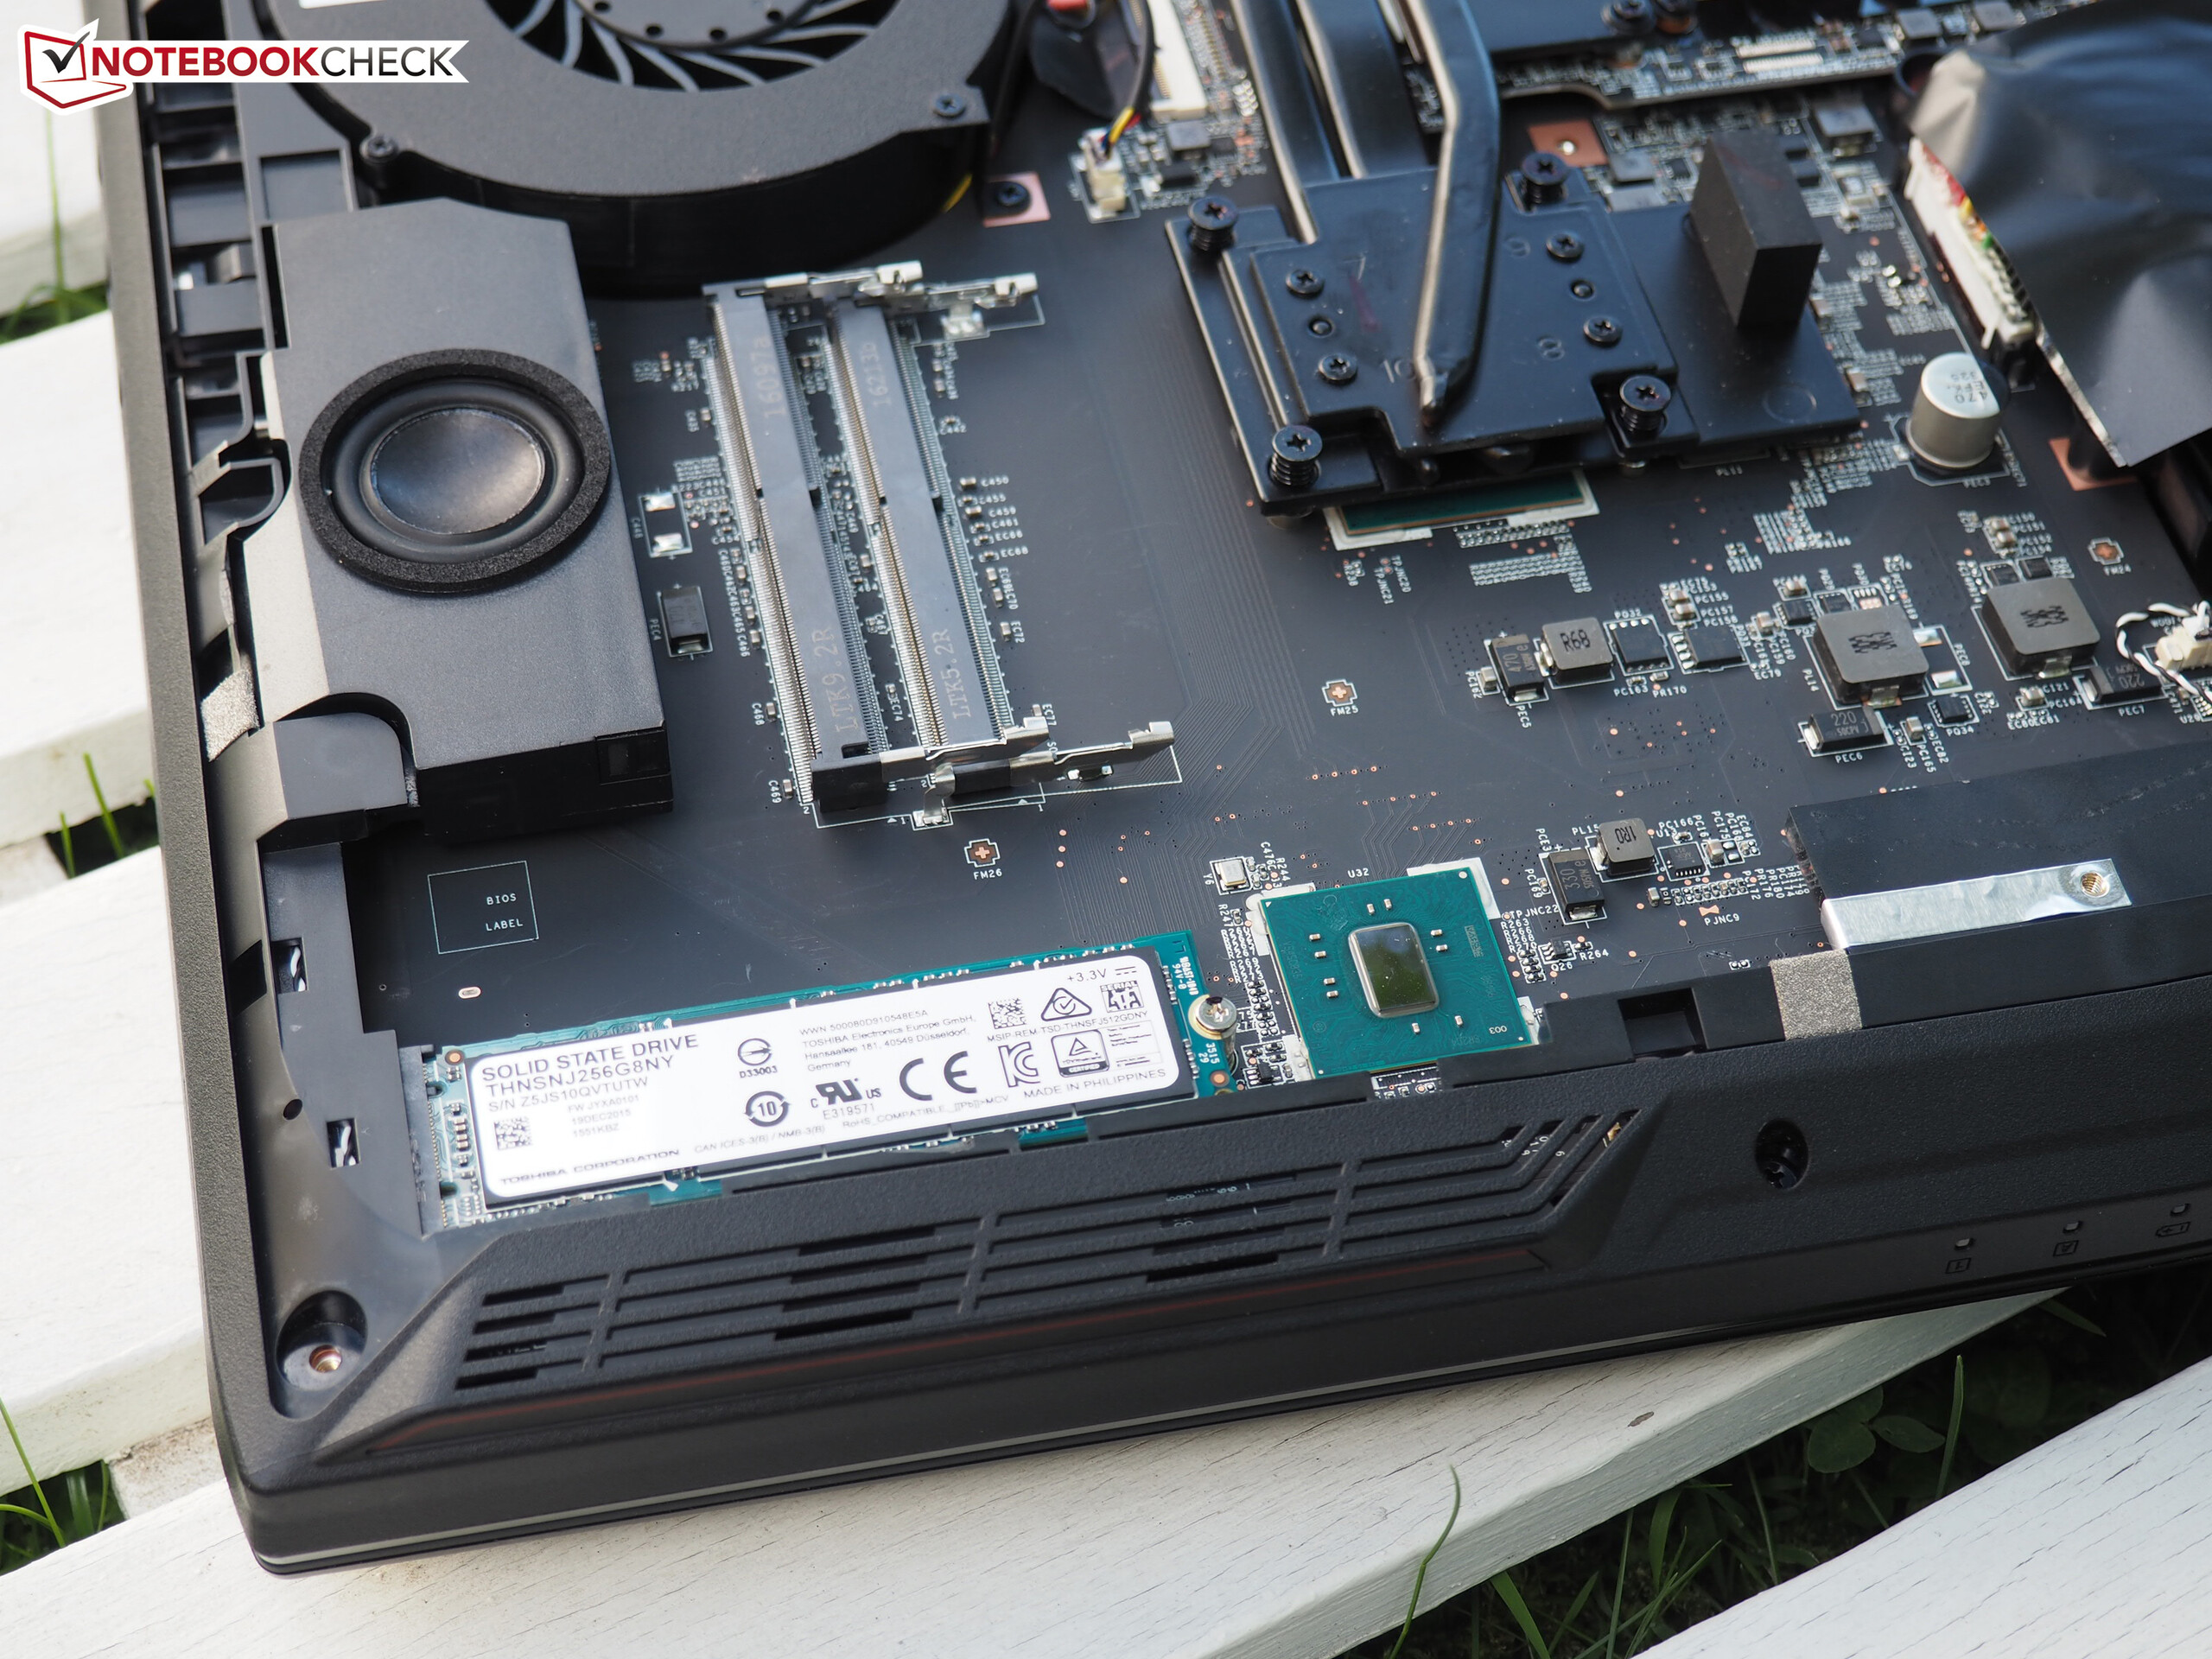
Anche la possibilità di manutenzione del GT62VR è buona. MSI implementa un ampio pannello inferiore, fissato con sei viti. Dopo averle allentate e rimosso il pannello (il che richiede un po' di forza), avrete accesso all'interno. Qui trovate i sistemi di archiviazione, il modulo wireless o il secondo slot di memoria, che è ancora libero nel nostro modello. Il sistema di raffreddamento è a due ventole e un totale di sei dissipatori. MSI mette un dissipatore sopra il processore e alla scheda grafica per ottimizzare la gestione del calore.
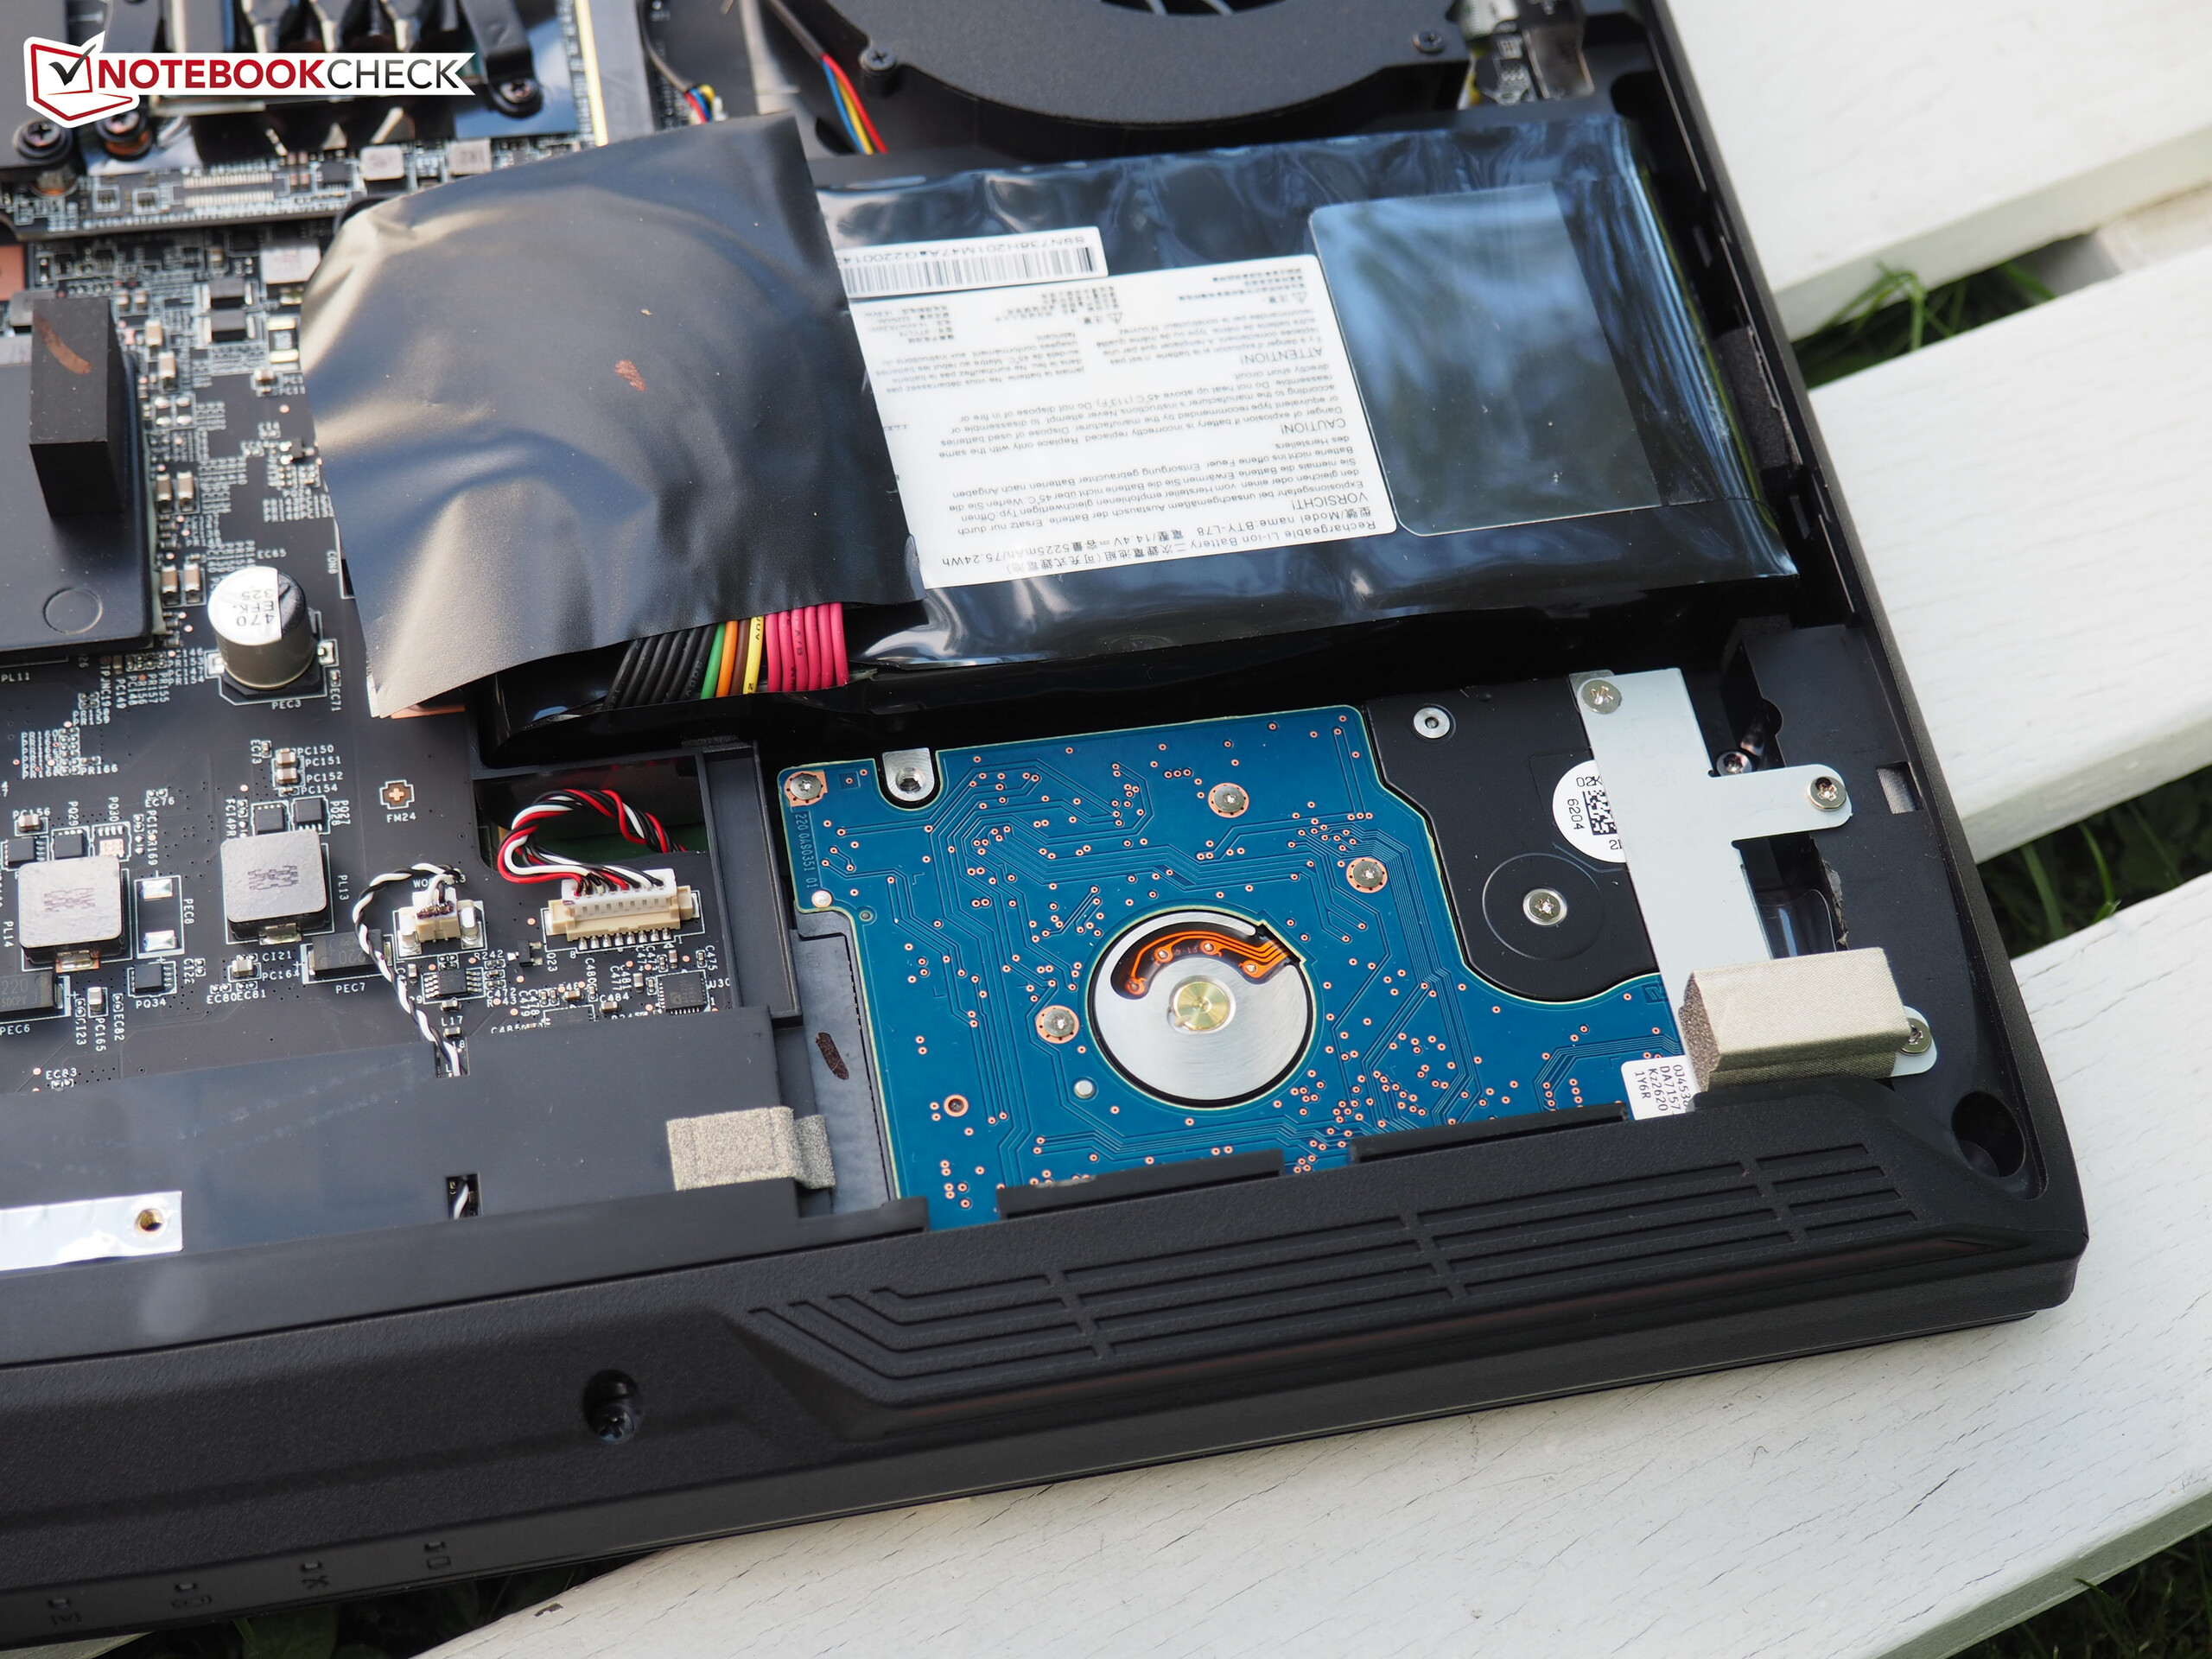
Occorre molto spazio per la batteria, che è - diversamente dal GT60 – non accessibile dall'esterno. Non riusciamo bene a capire se c'è solo uno slot M.2 all'interno del GT62VR. Ci dovrebbe essere abbastanza spazio per un secondo ed un terzo slot. MSI limita questa feature per i modelli da 17" e 18" (come GT73 & GT83). Nota: non dovrebbe essere un problema rompere l'adesivo della garanzia in Germania, in quanto i lavori di manutenzione e gli upgrades sono effettuati da esperti.
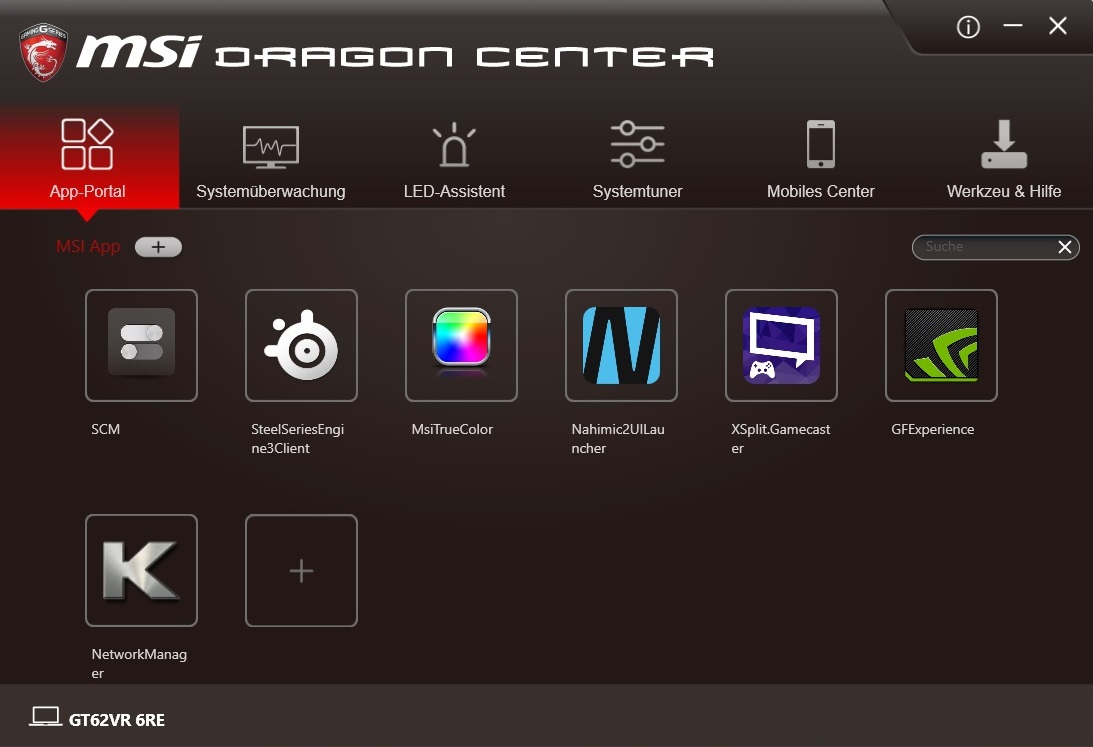
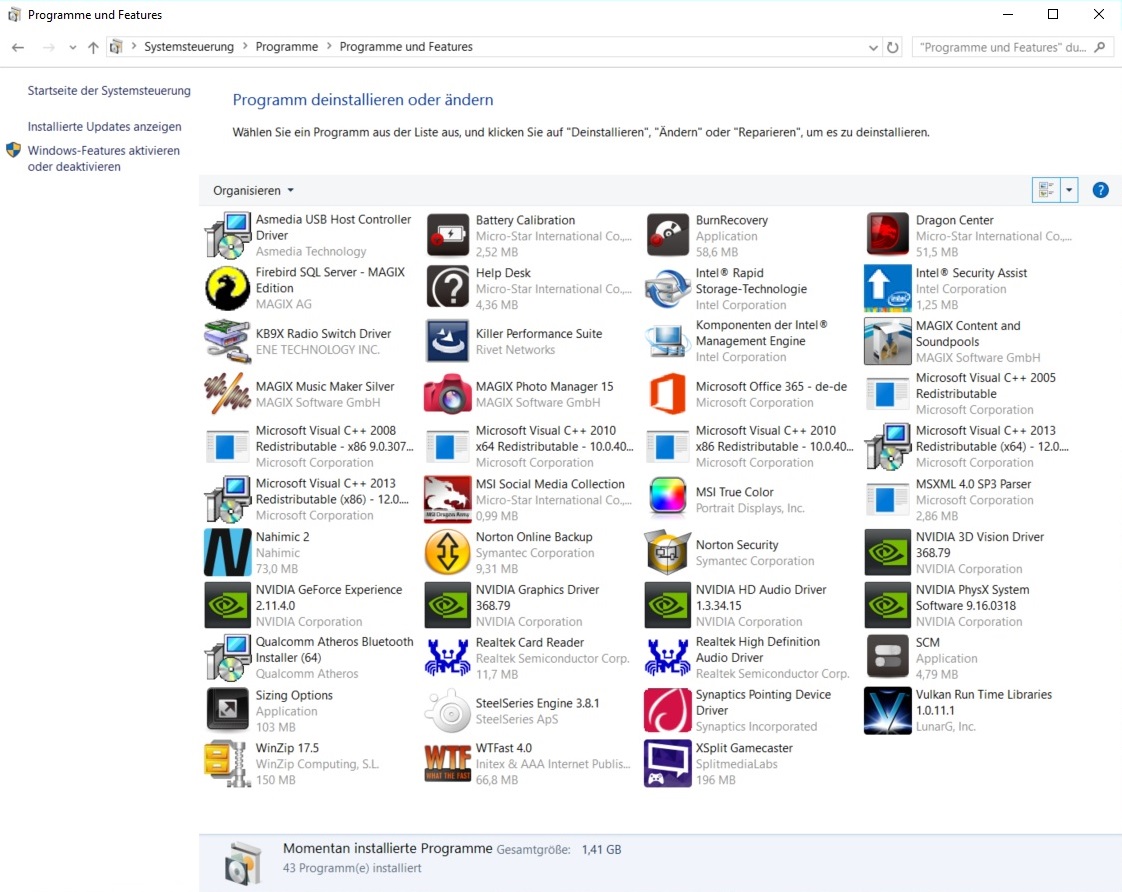
Software
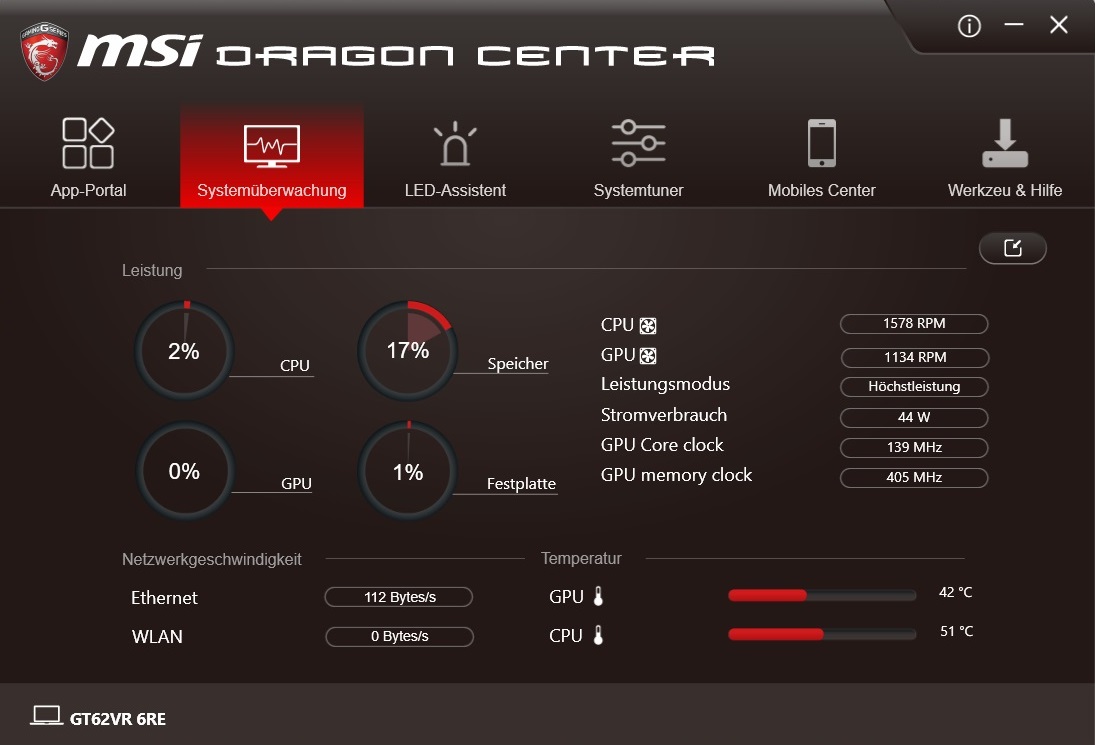
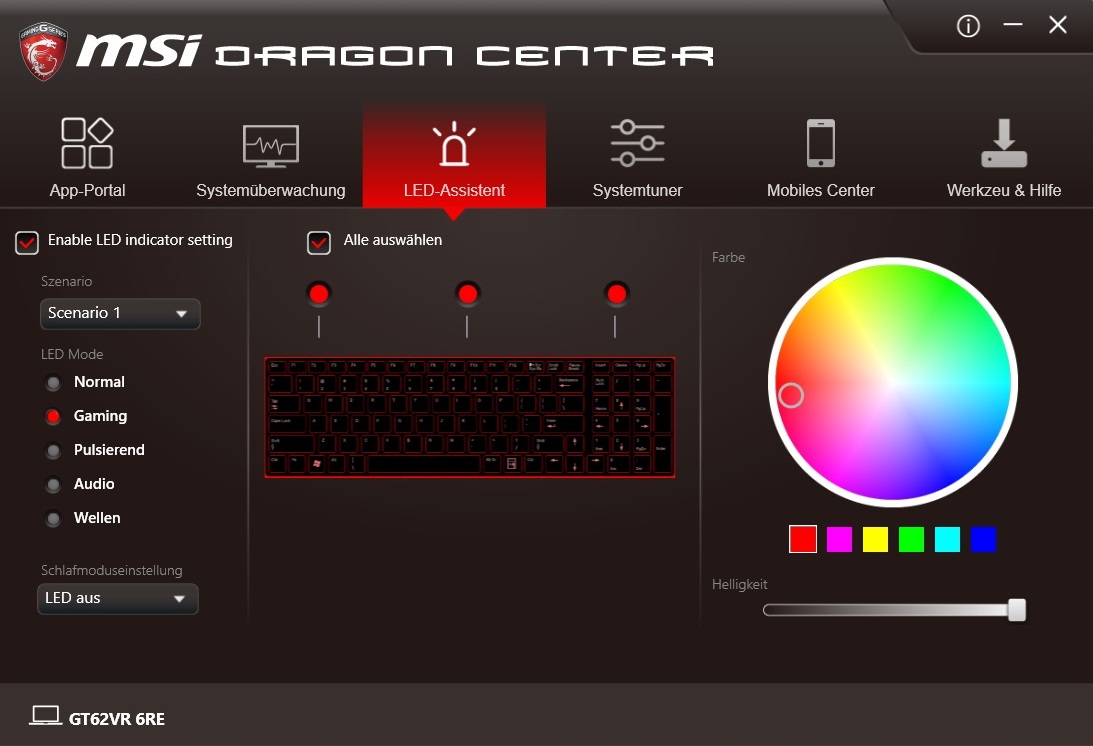
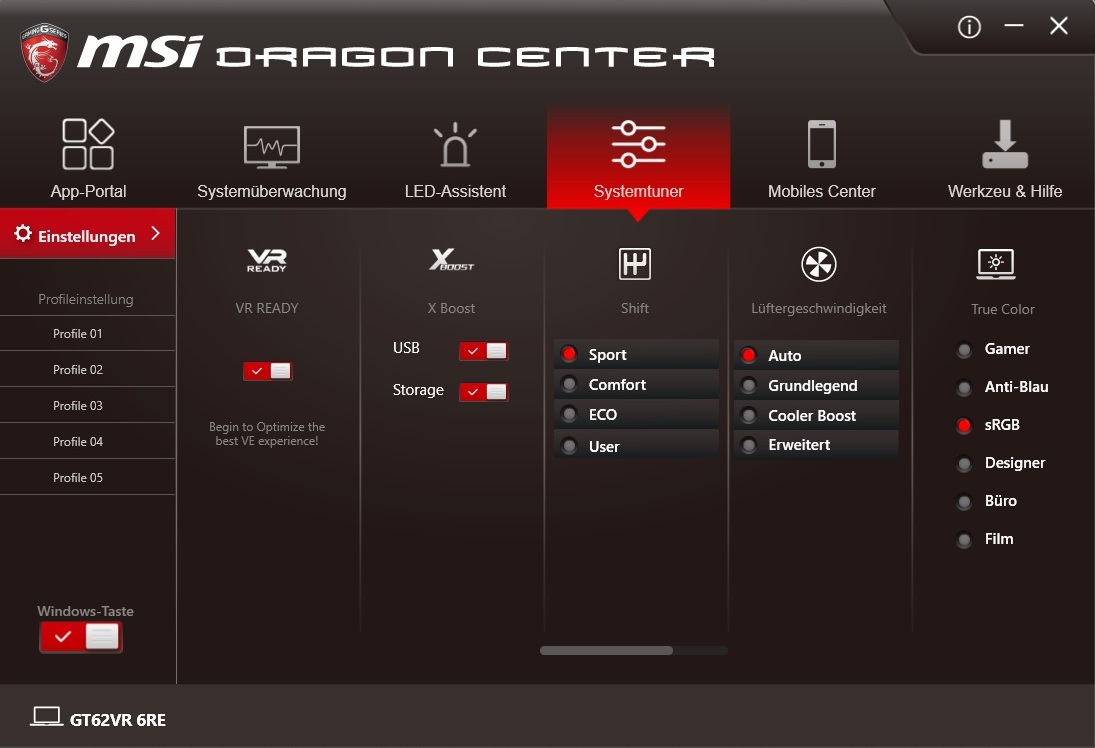
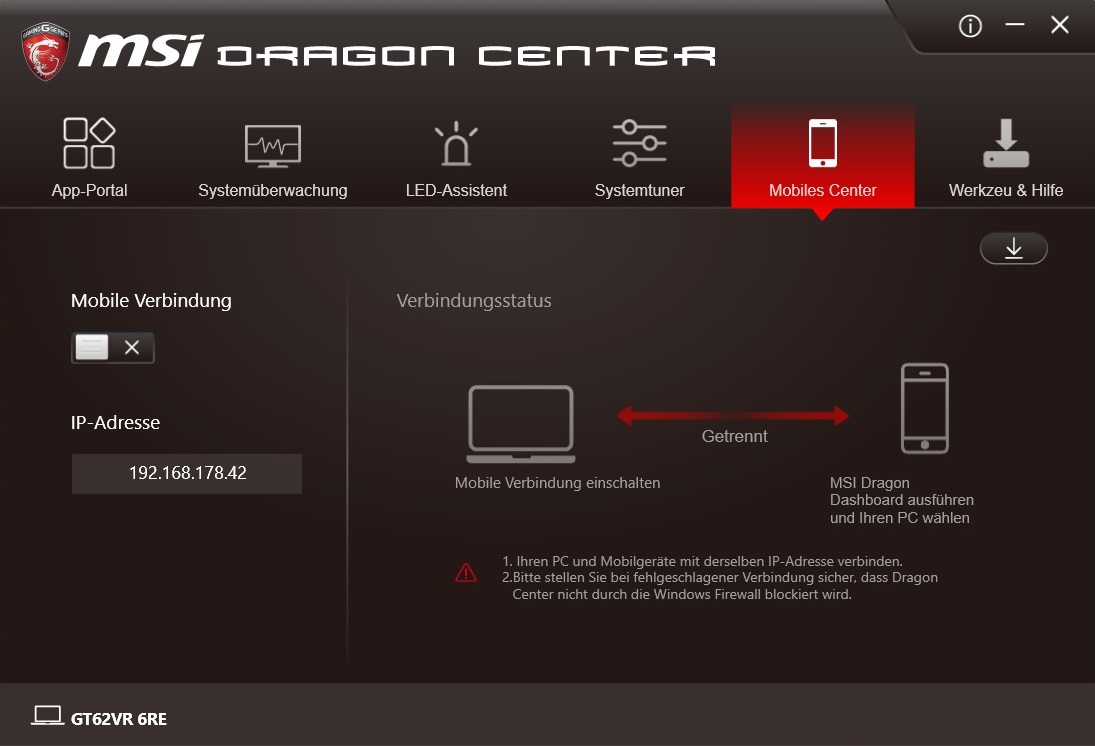
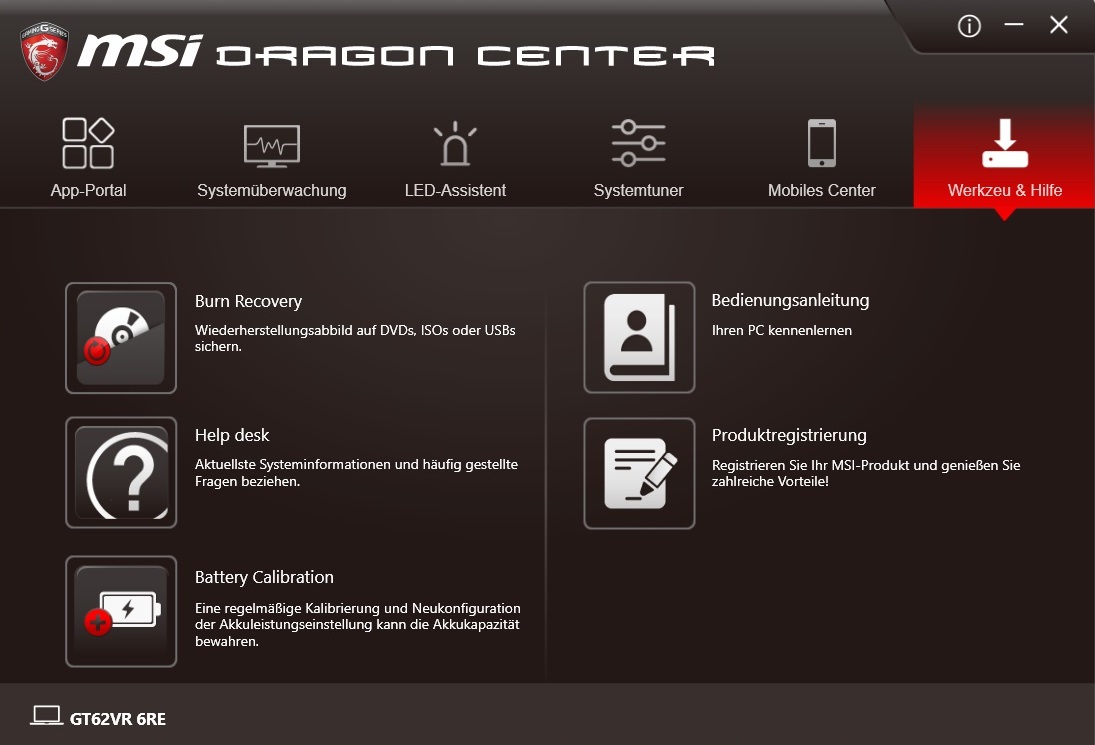
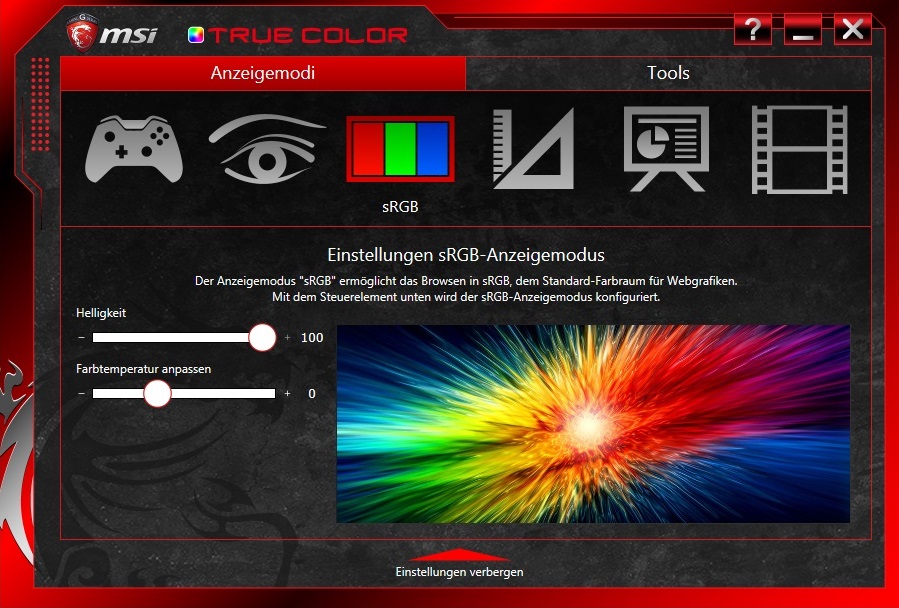
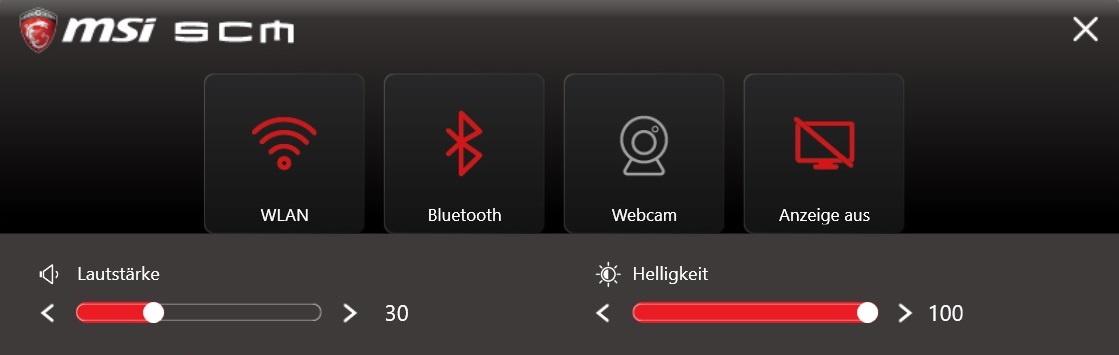
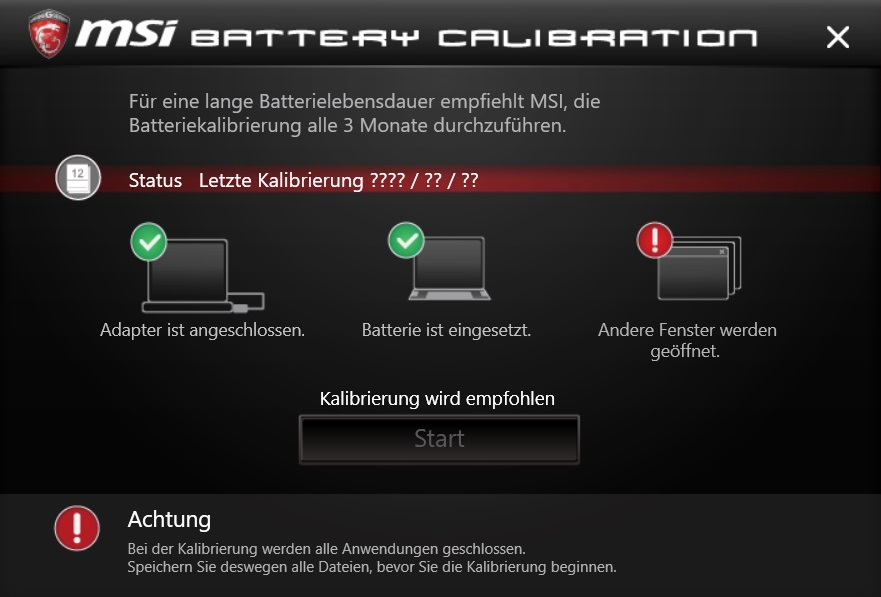
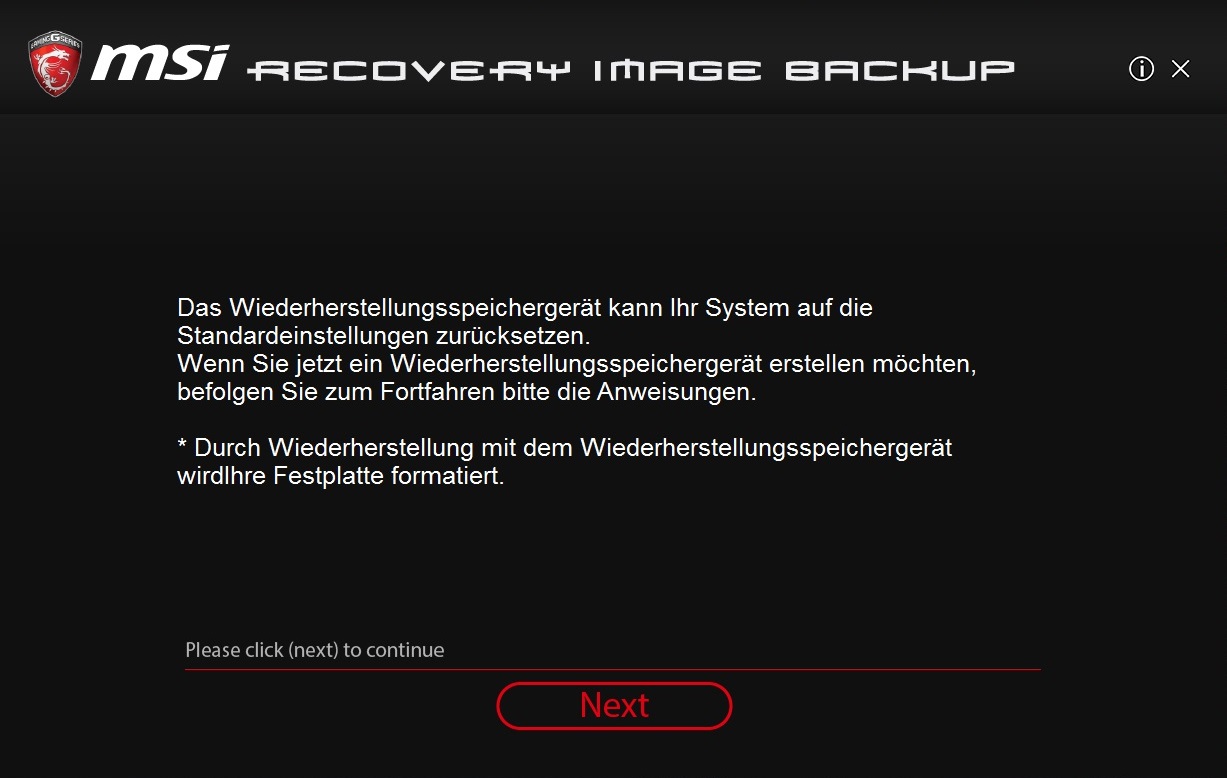
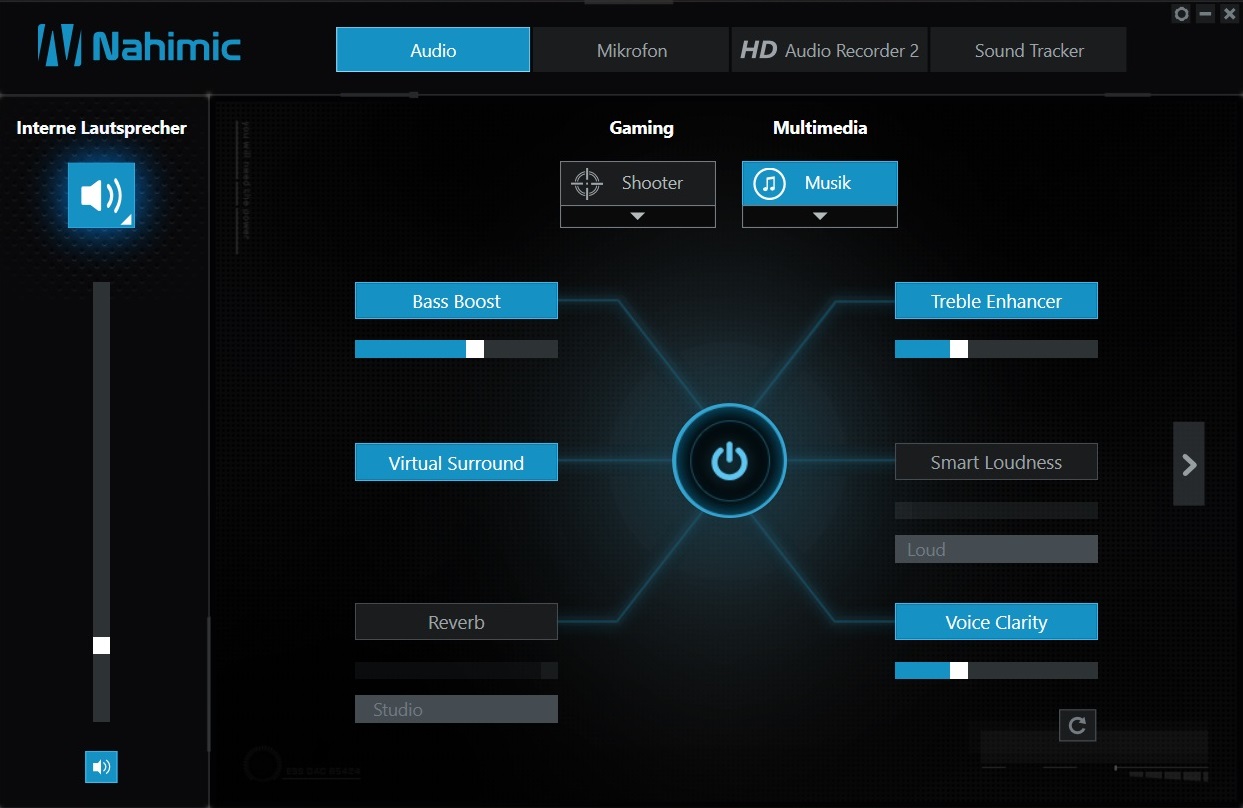
Come ci si aspettava dal produttore, avrete molti software. Recovery Manager, software audio o calibrazione della batteria: MSI sembra aver pensato quasi a tutto. Il tool più importante, il Dragon Center, è stato ampiamente rielaborato rispetto alla nostra ultima recensione e ora ci sono nuove funzioni. Abbiamo aggiunto vari screenshots in modo da rendere l'idea.
Particolarmente interessante sono le tabs "System Control" (utilizzo, temperature, velocità ventola ...) ed il "System Tuner". Quest'ultimo può essere usato per regolare l'immagine (True Color) o la velocità della ventola, ad esempio. Noi usiamo i settaggi di default "sRGB" e "Auto", rispettivamente. L'esclusiva modalità MSI Shift-mode è stata regolata in base allo scenario.
Accessori
Gli accessori in dotazione sono limitati a una guida rapida, brochure garanzia, guida recovery e panno pulizia. L'ingombrante adattatore pesa ben 780 grammi, e misura 17 x 8 x 3.5 cm con un output nominale di 230 Watts.
Garanzia
La garanzia è di 24 mesi (servizio ritiro e consegna).
Dispositivi di Input
Tastiera
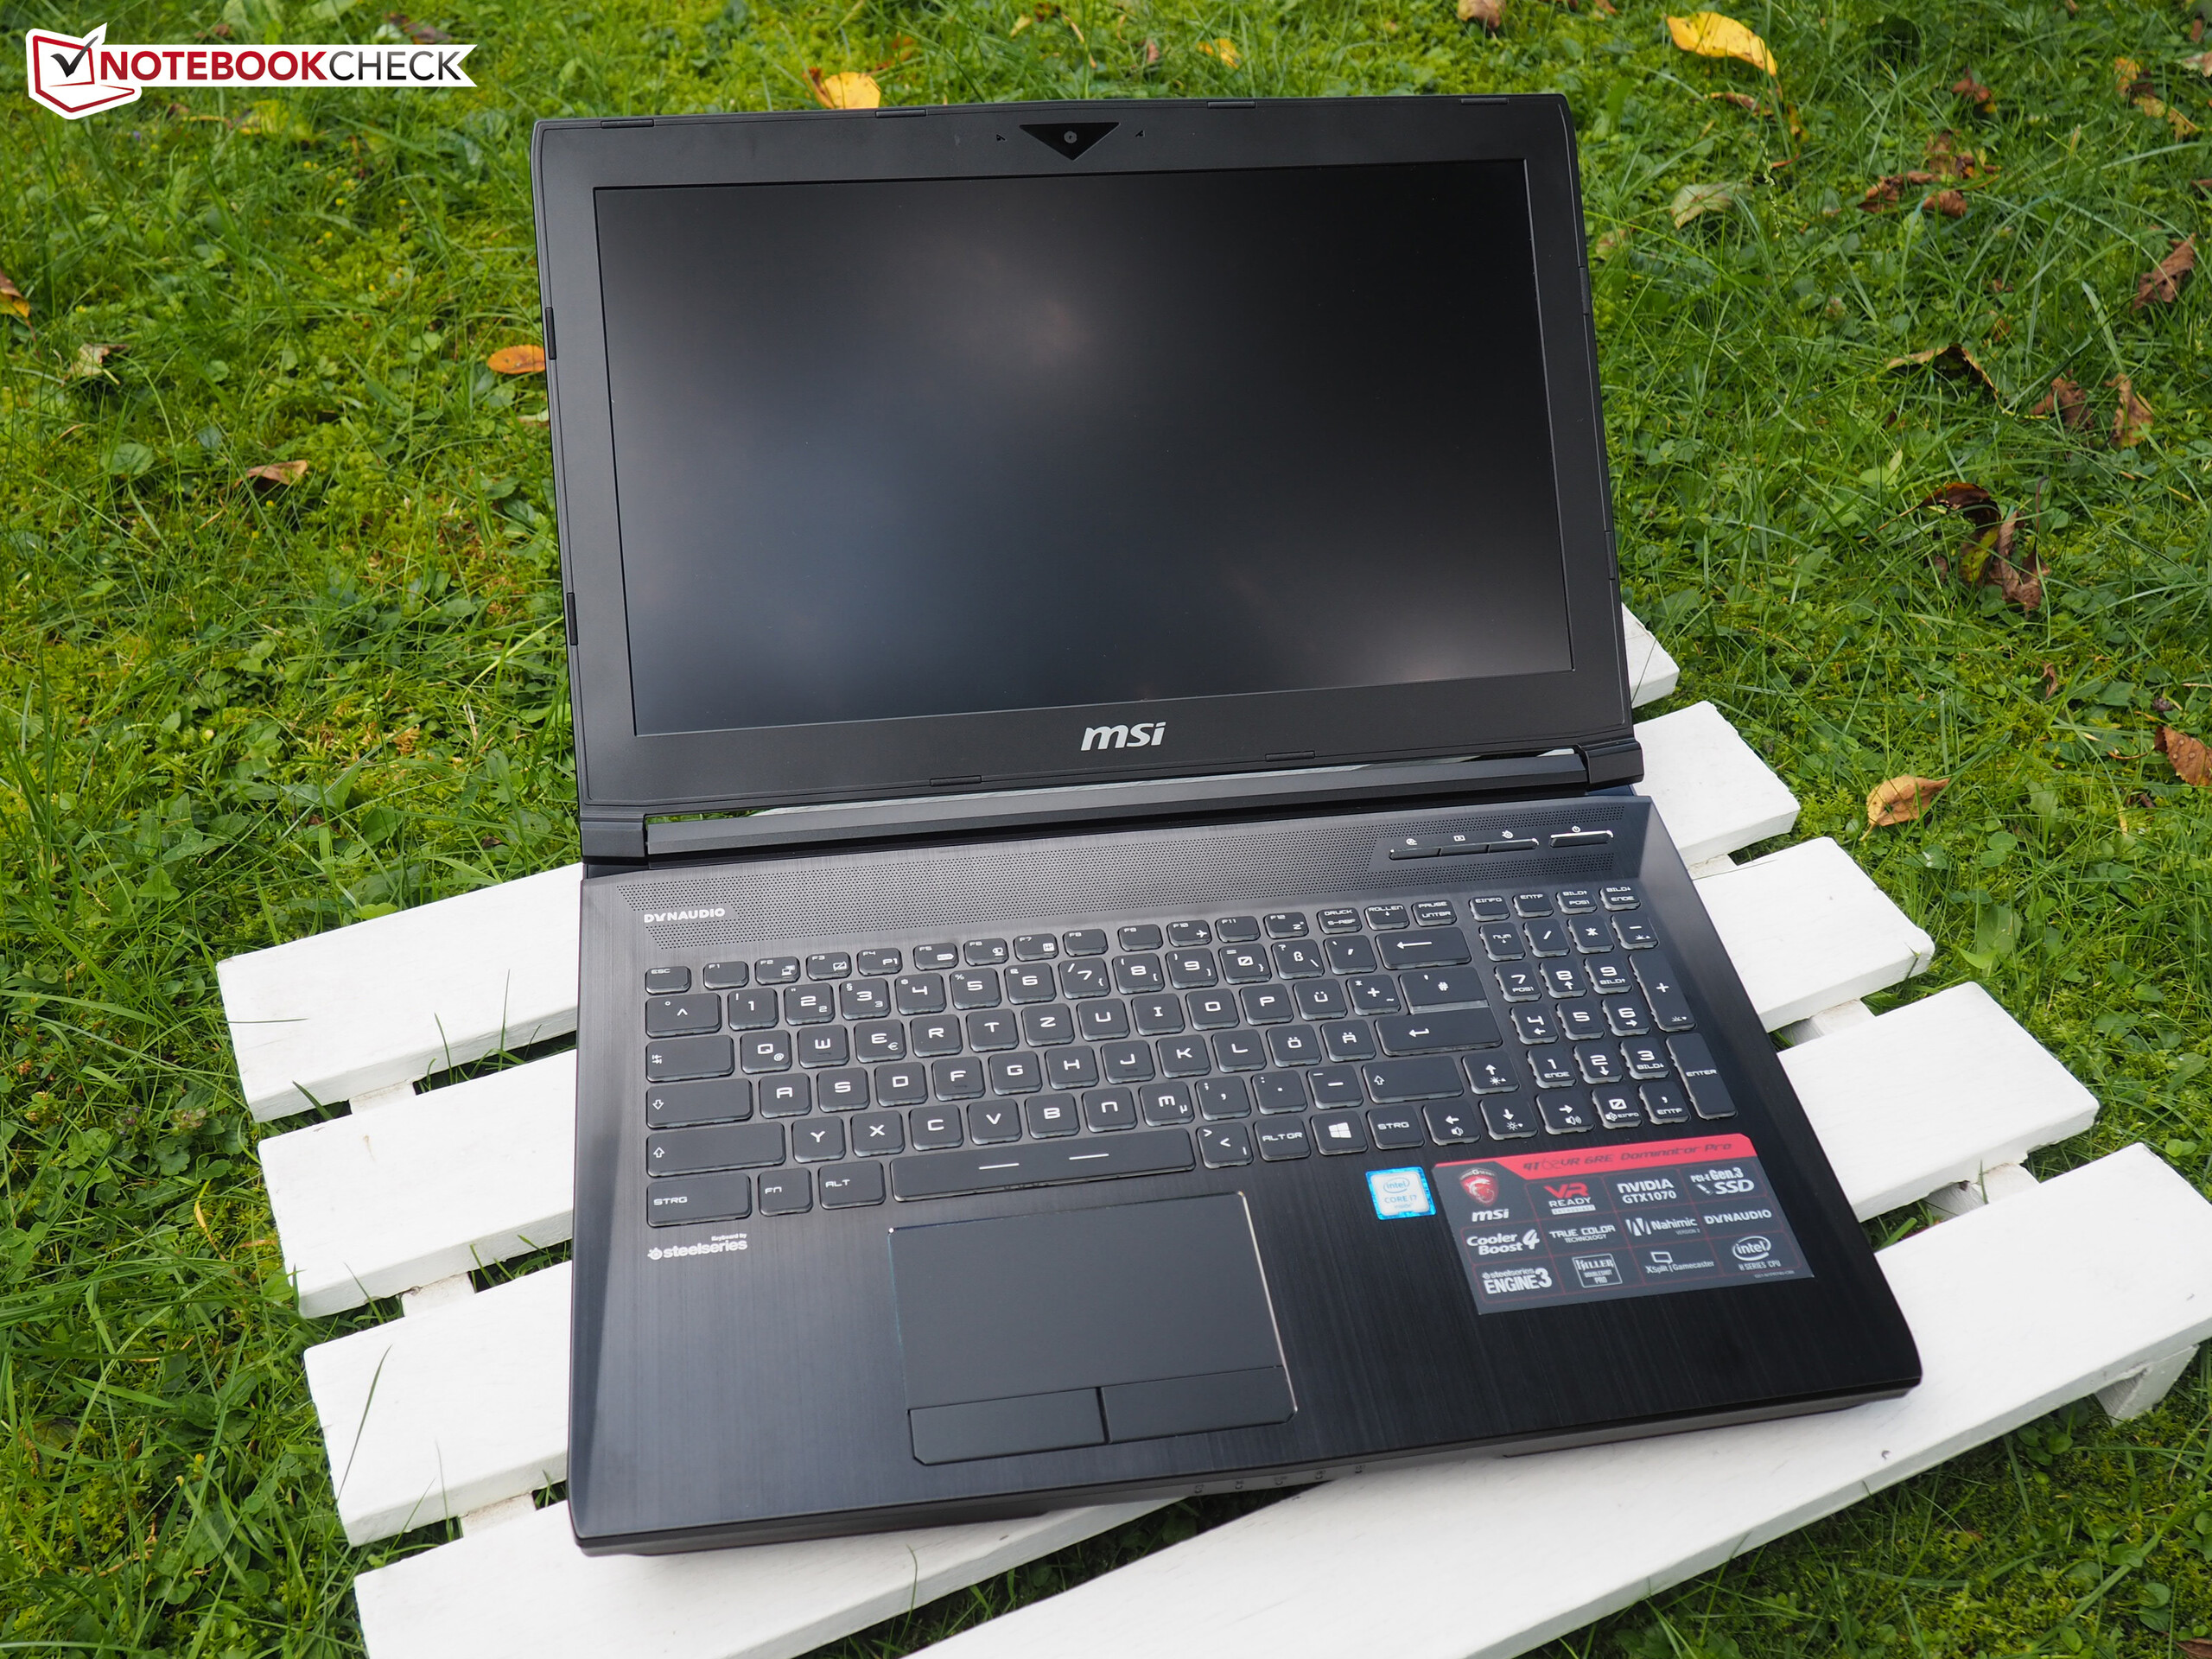
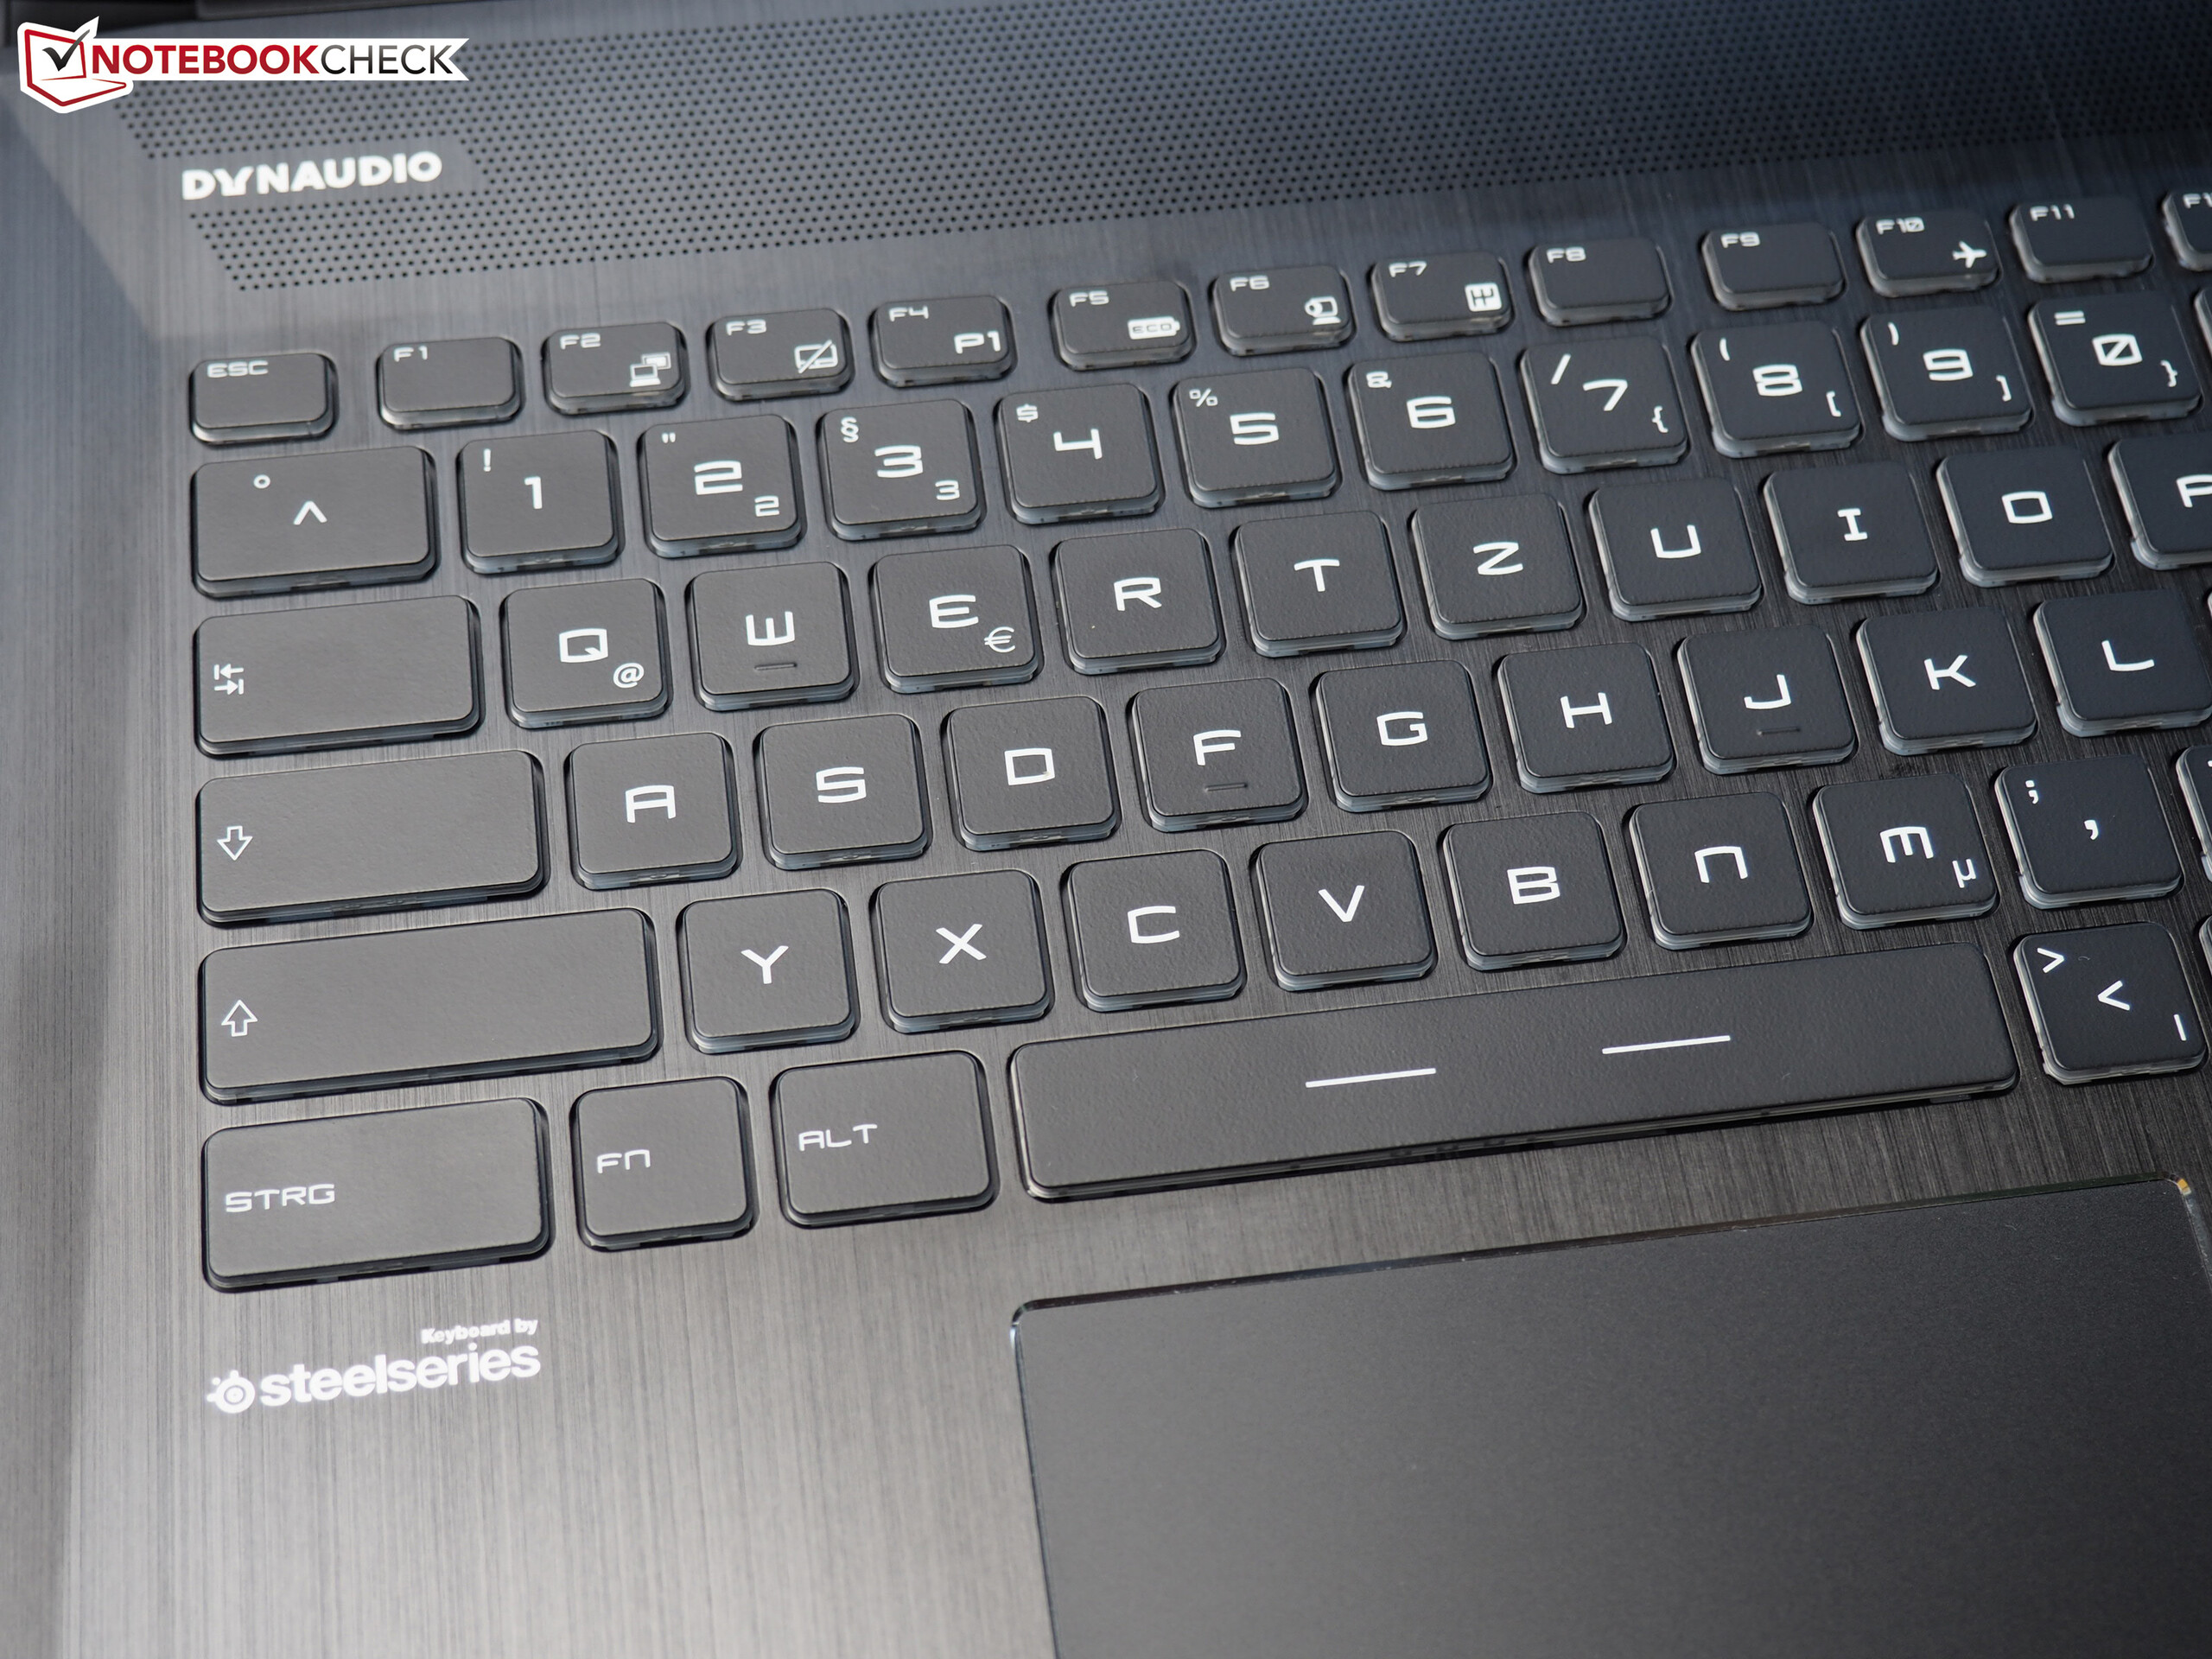
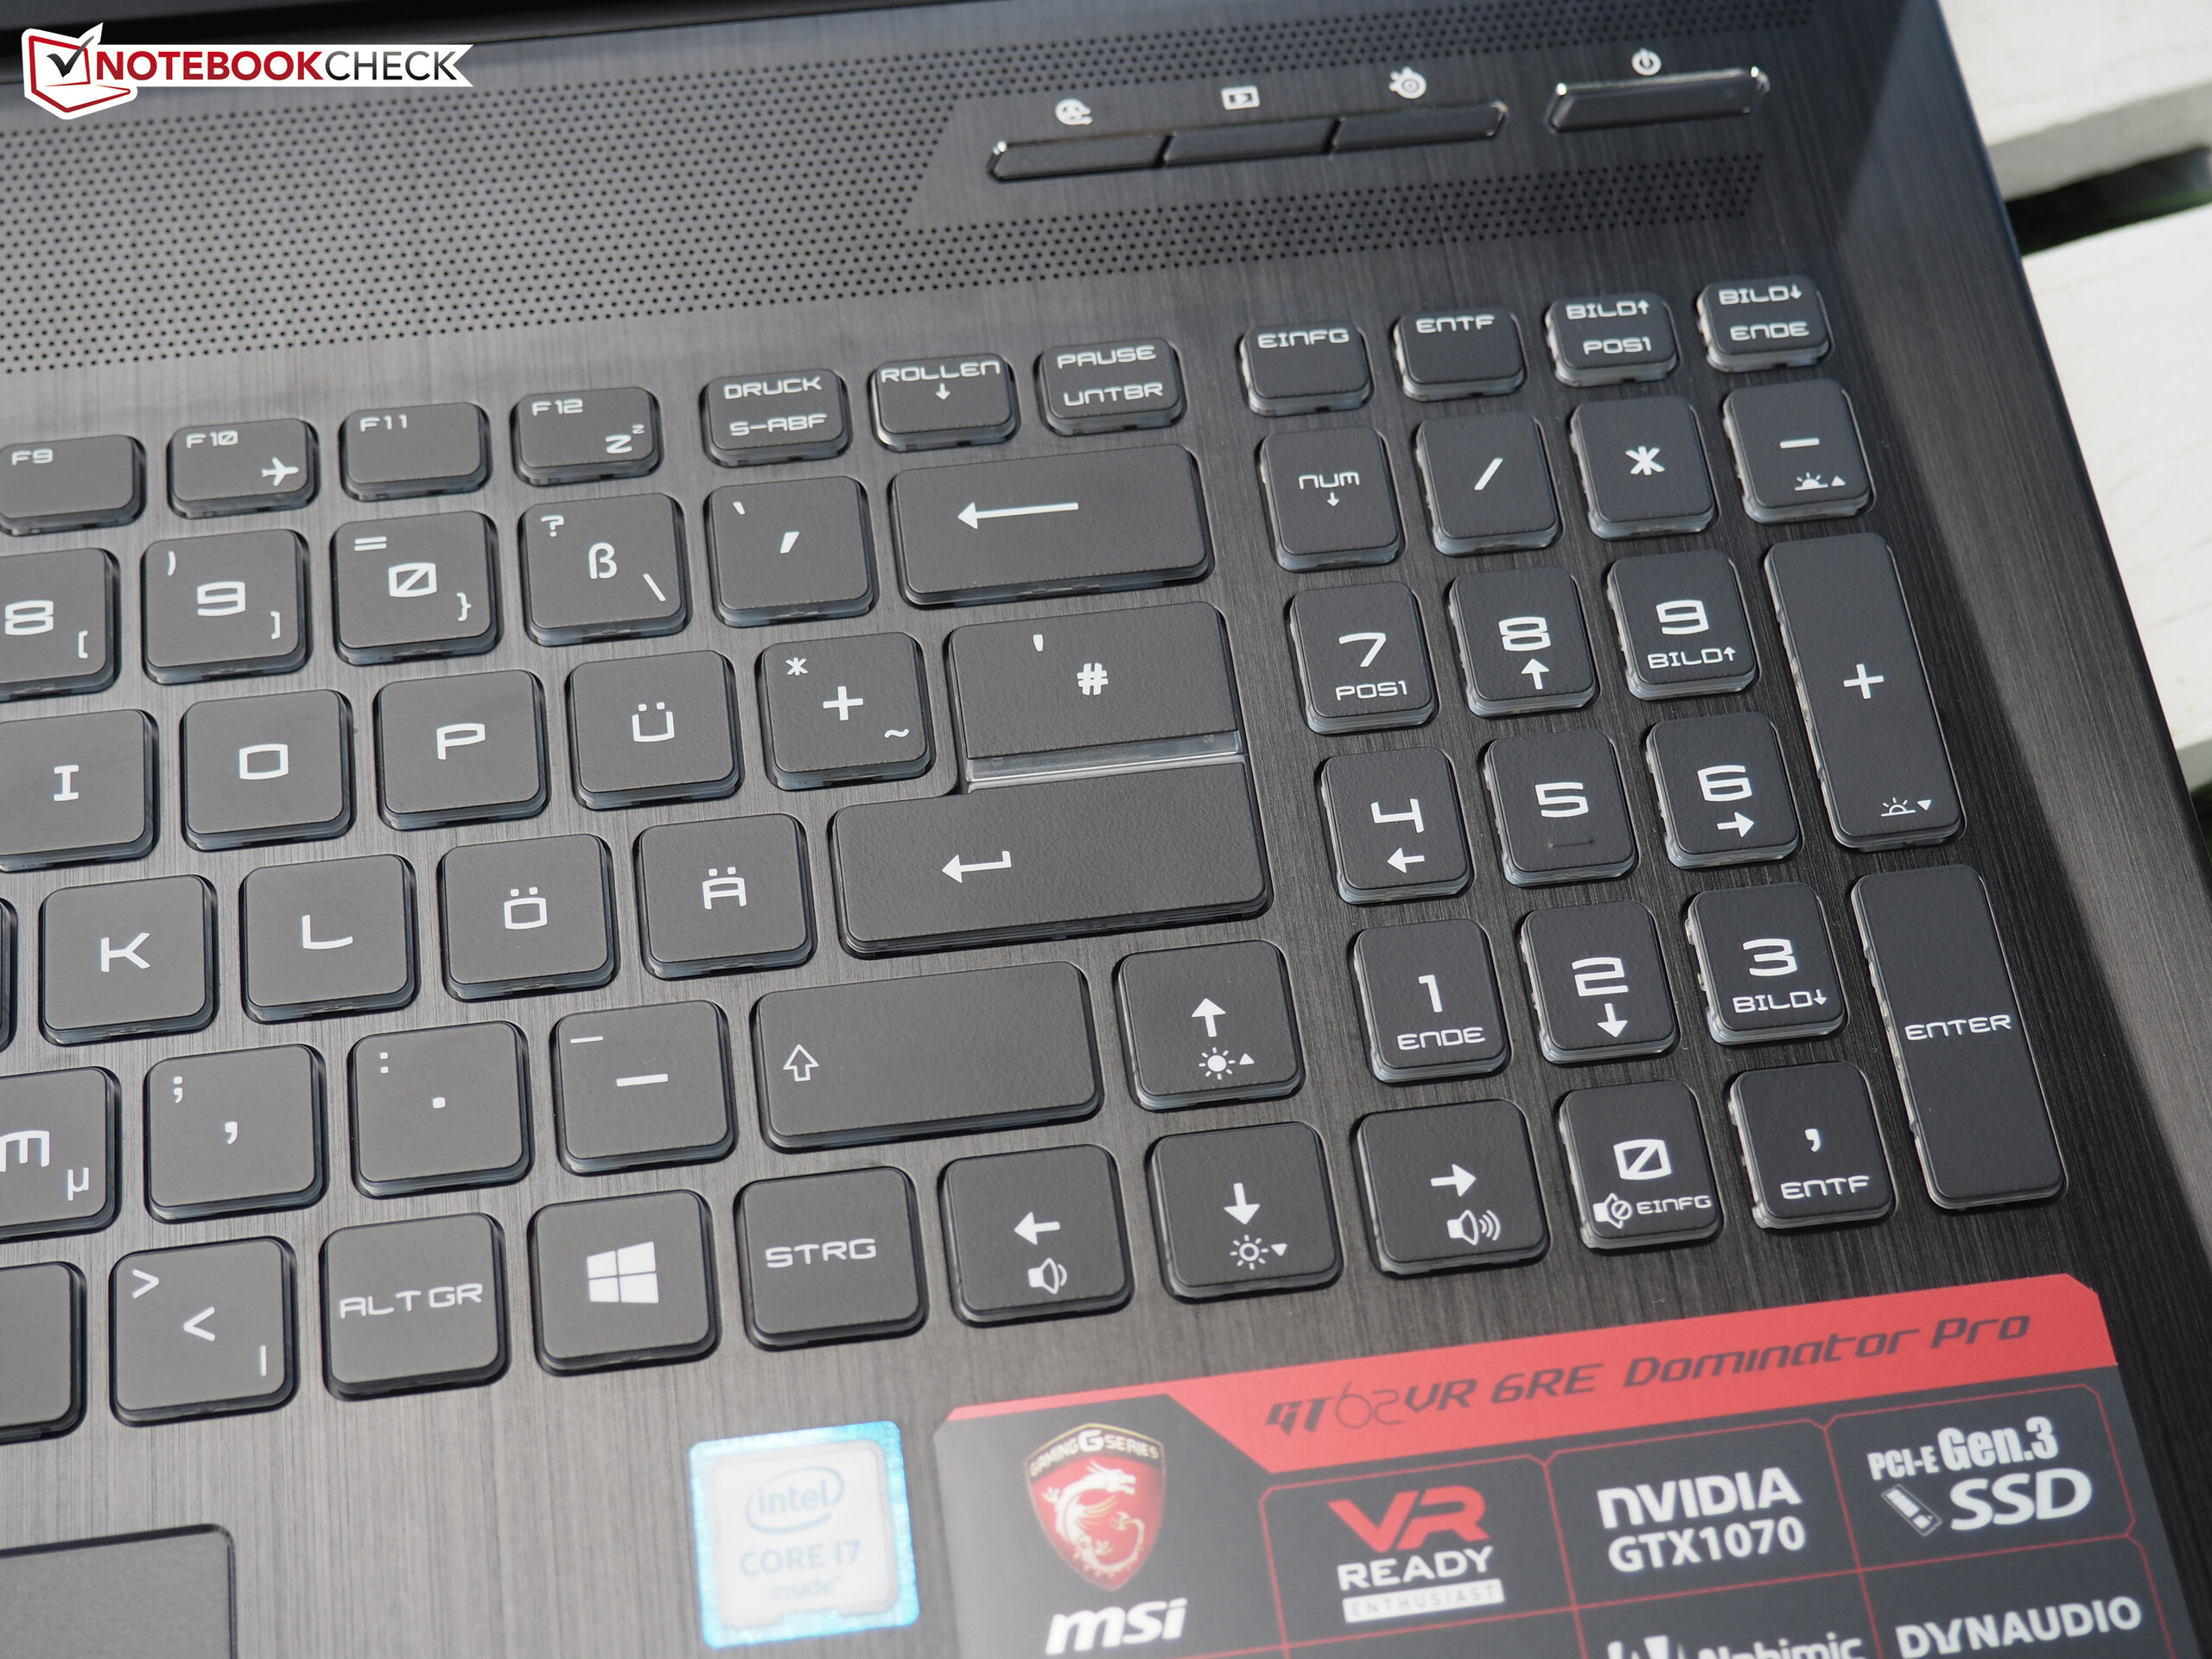
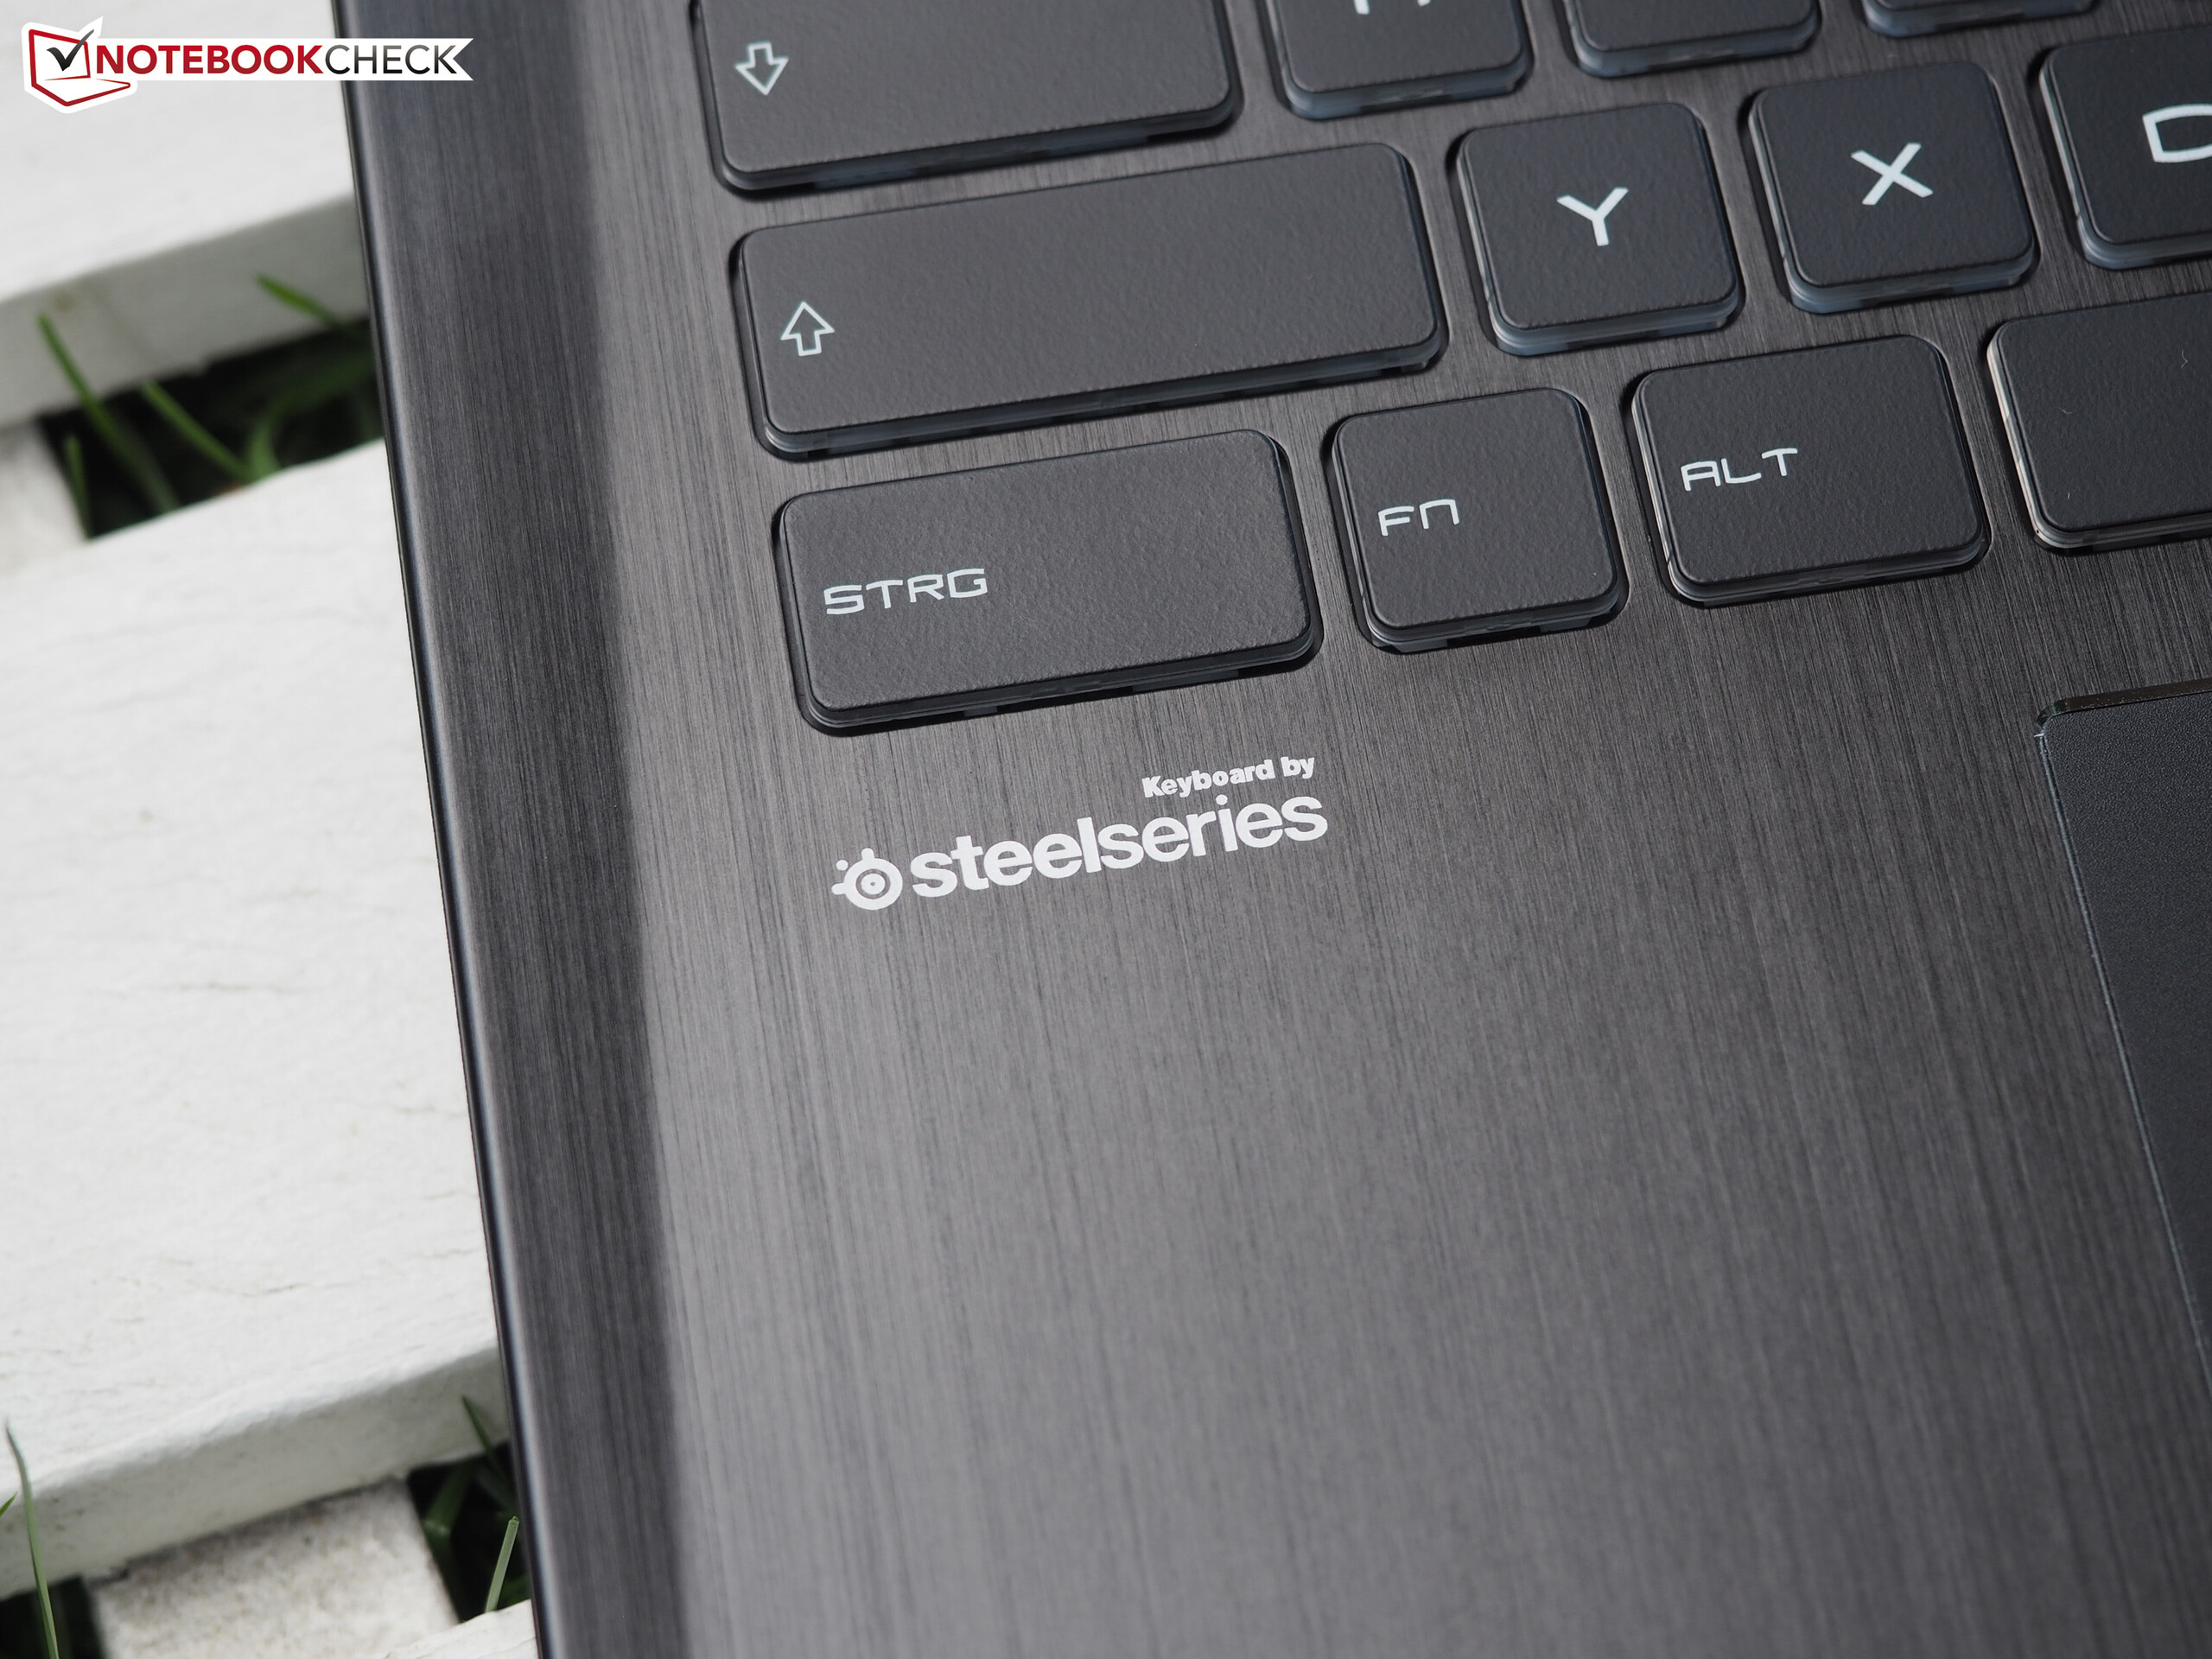
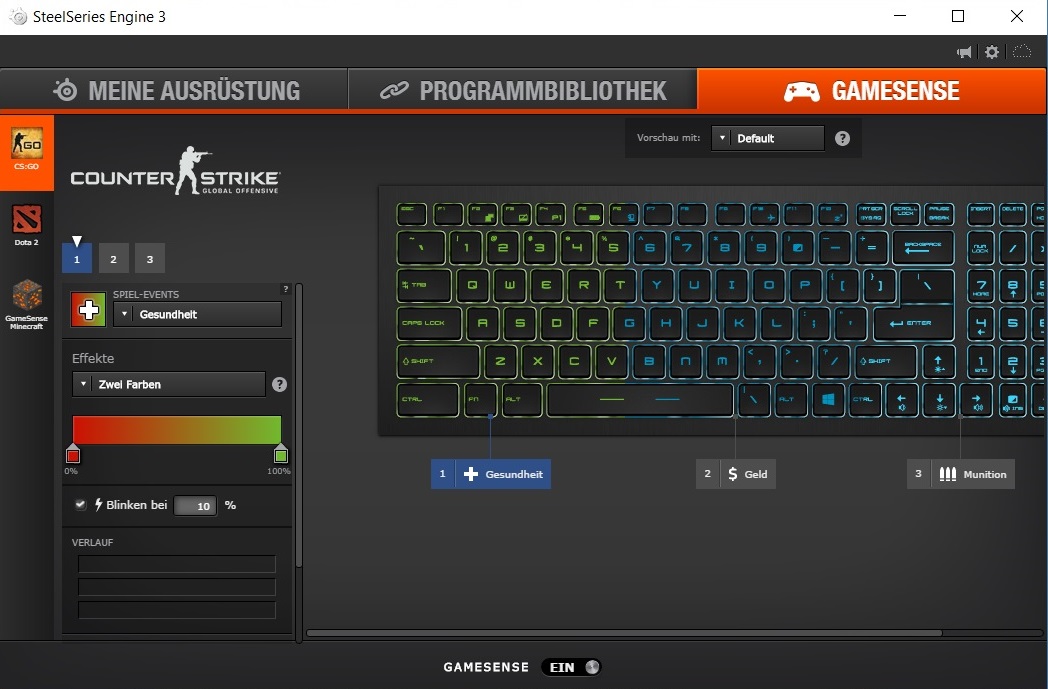
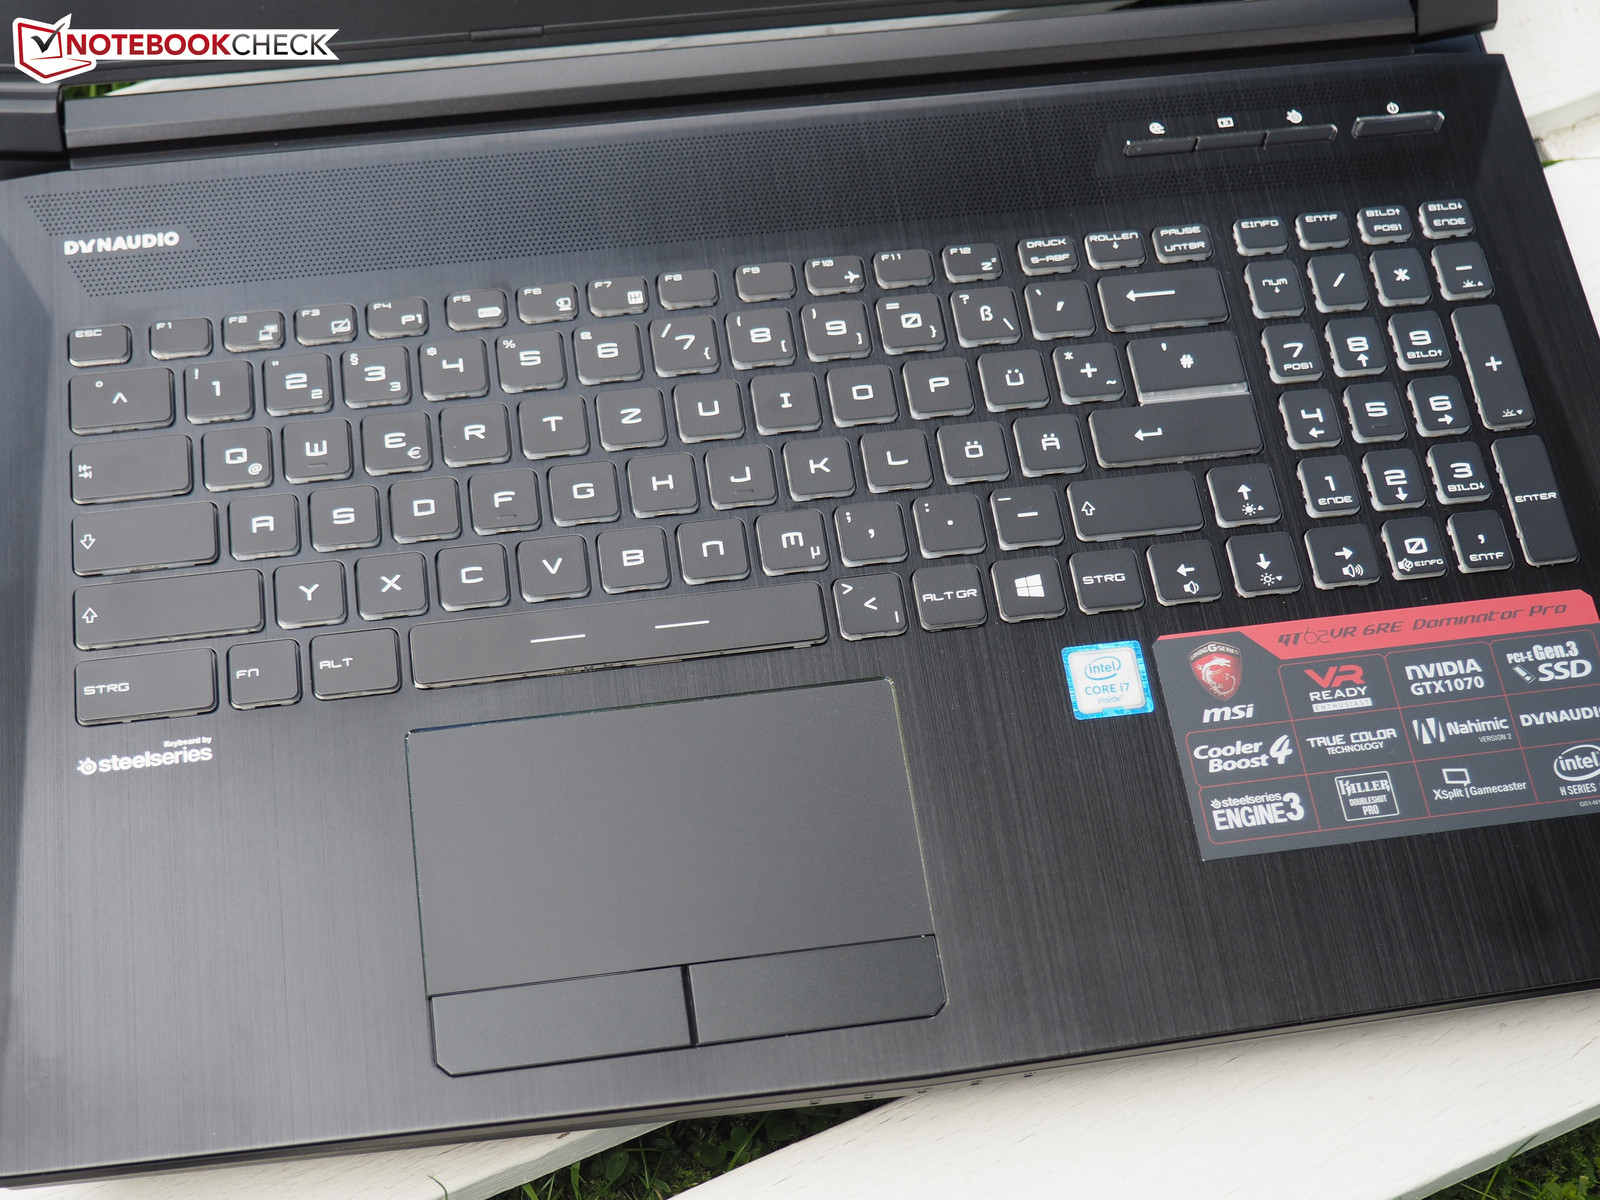
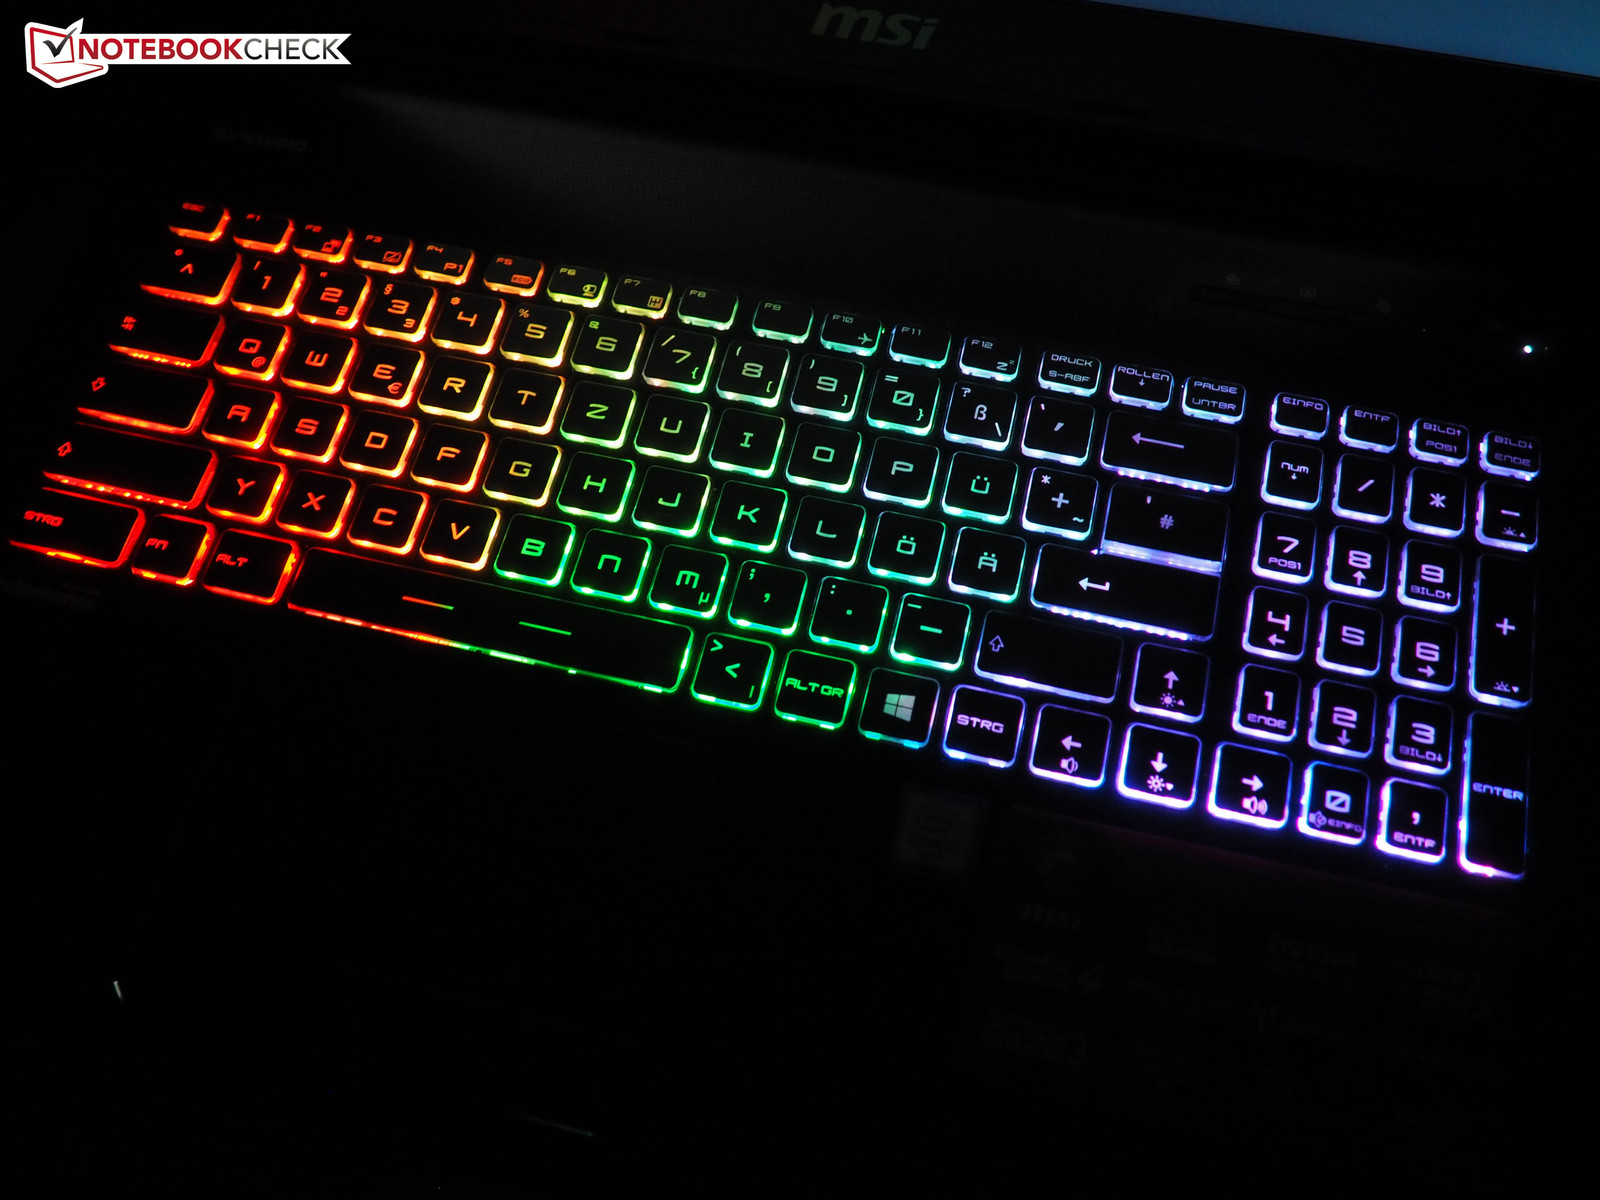
La tastiera è stata ancora una volta progettata in cooperazione con SteelSeries. MSI usa lo stesso identico modello chiclet già visto nei gemelli da 15" GS60 e GE62. Grazie all'illuminazione ed ai tasti island-style, è bella da vedere e non ci sono problemi anche al buio. Abbiamo apprezzato anche la digitazione ad eccezione di qualche piccolo dettaglio. La corsa è media o breve, il punto di pressione e la battuta sono ben definiti.
C'è solo una critica per il layout, che devia rispetto allo standard. Il layout dovrebbe migliorare l'esperienza di gioco, ma spesso chi scrive troverà qualche problema. Dobbiamo lodare le dimensioni. Sia i tasti lettere che numeri sono ampi 15 x 15 mm. Solo il tastierino numerico e i tasti F-row sono leggermente più stretti.
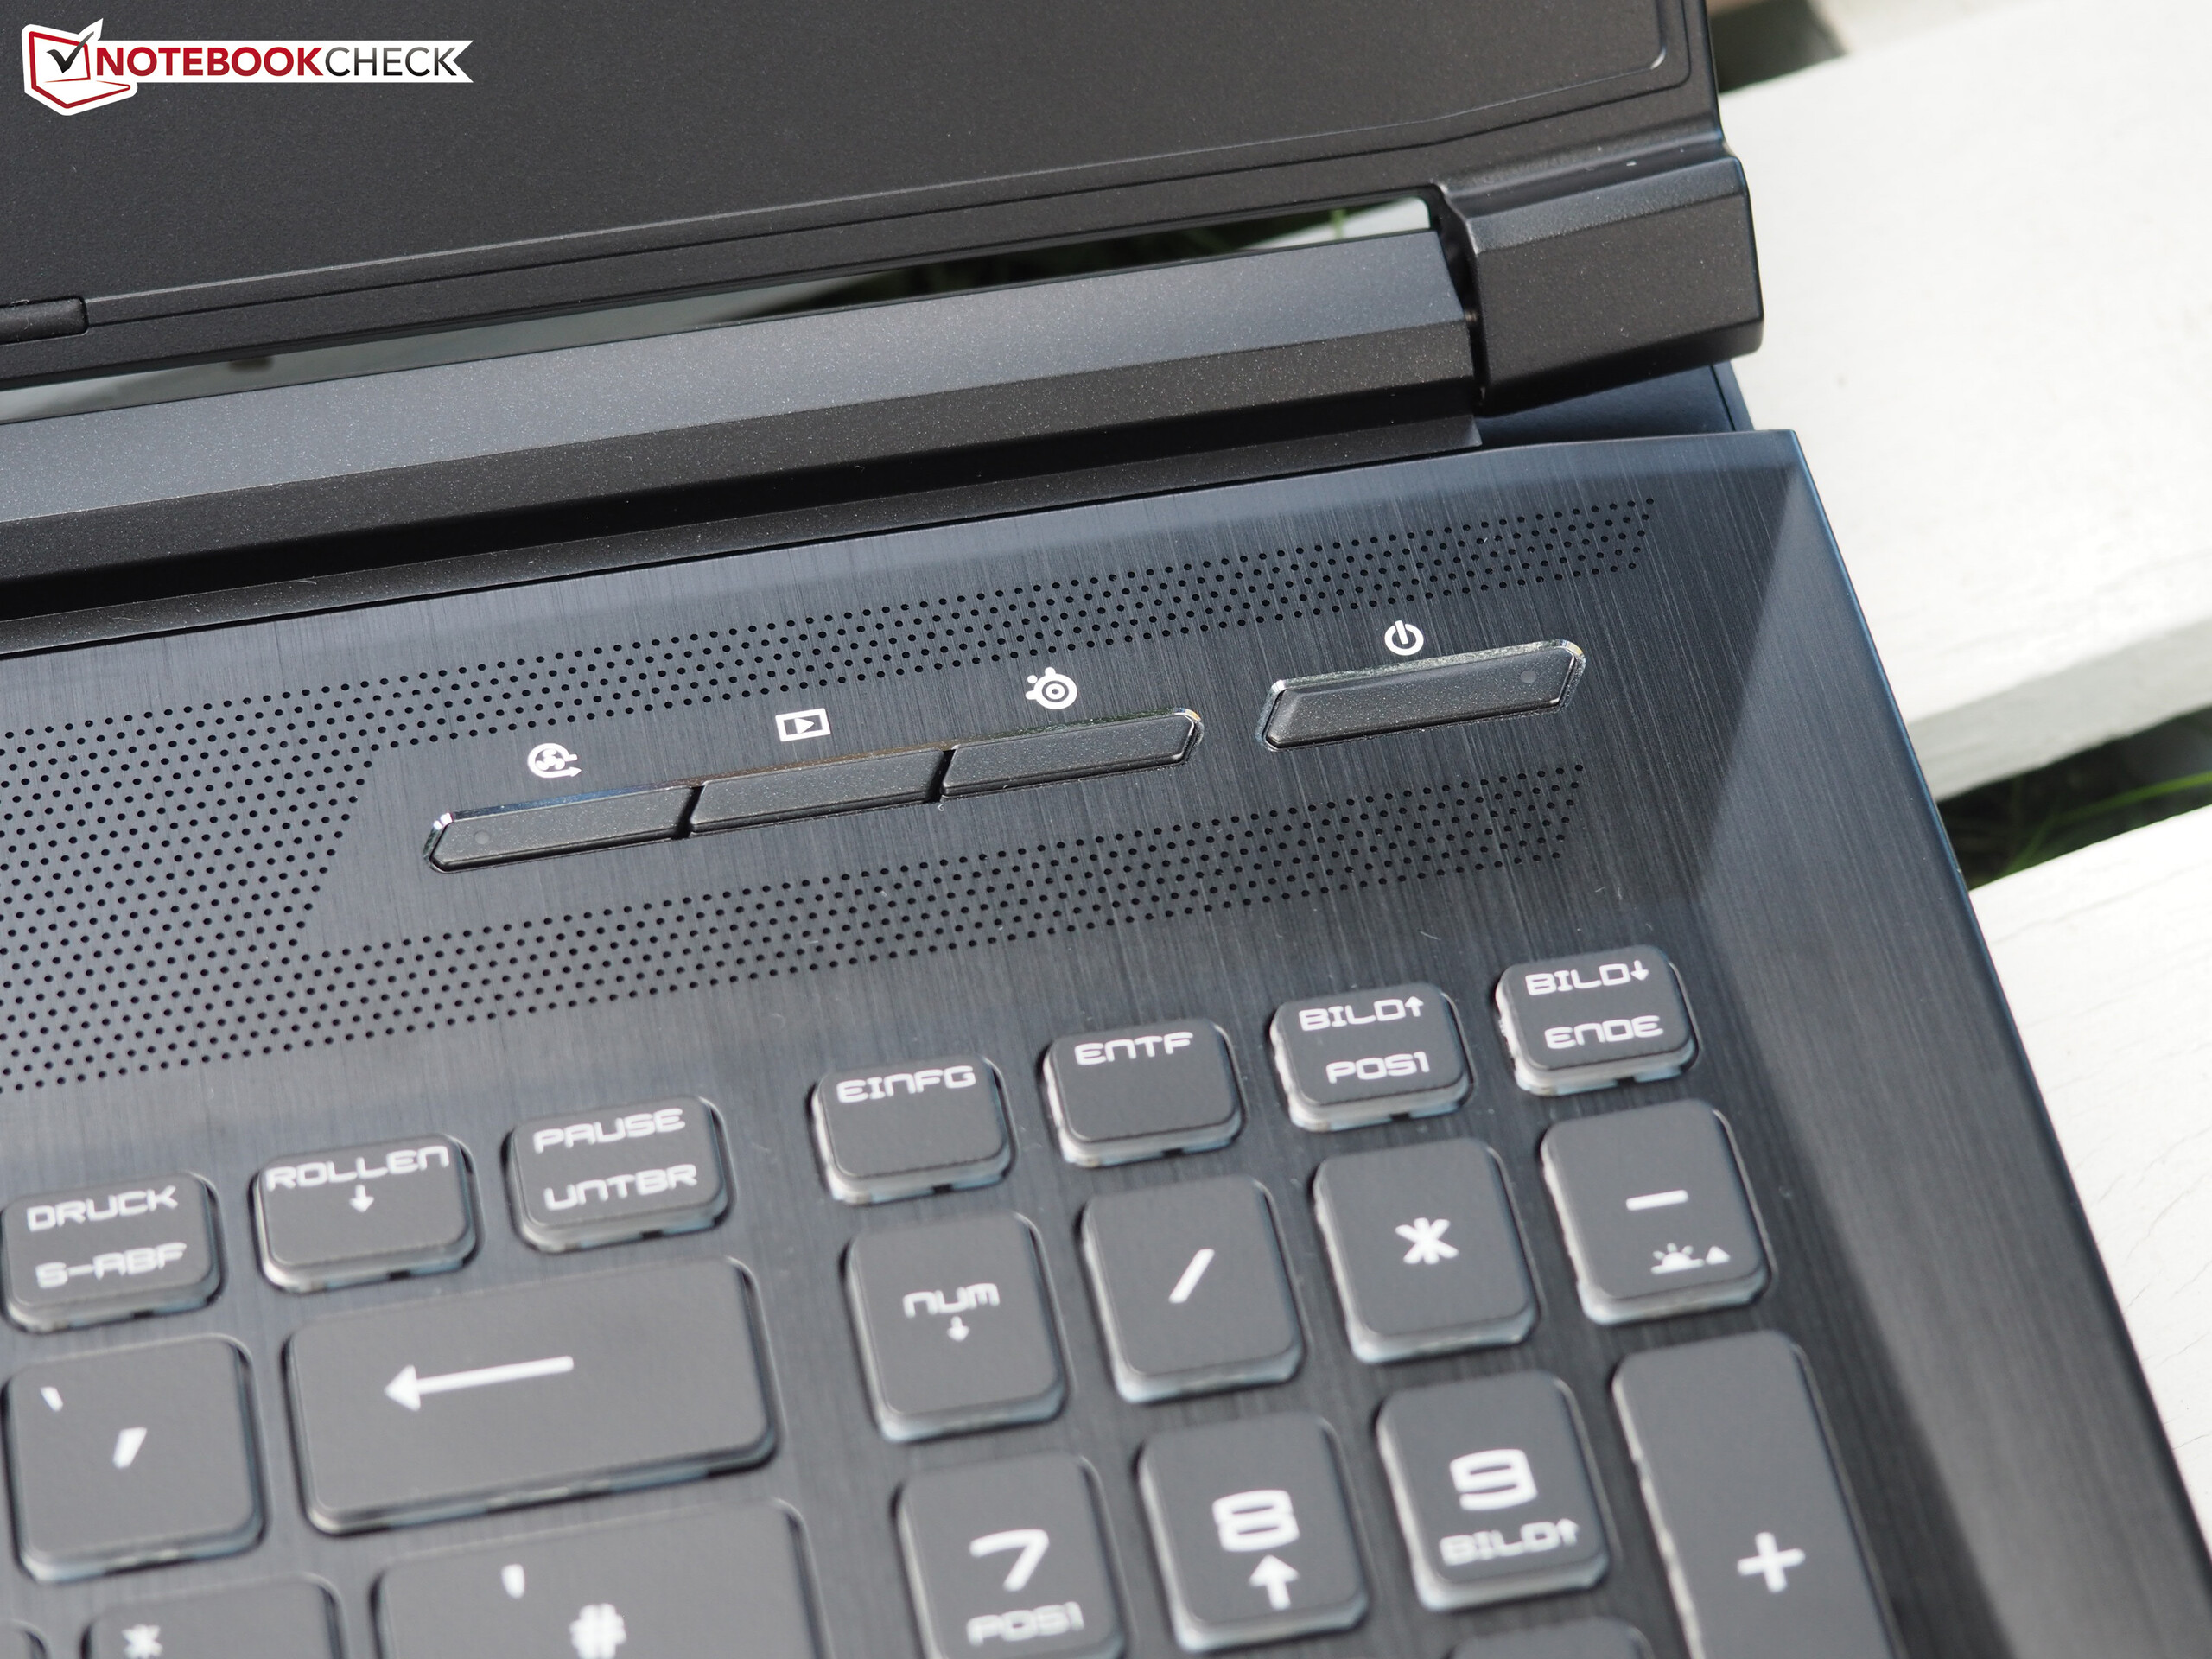
Accanto al pulsante di accensione ci sono tre tasti speciali. Mentre quello sinistro attiva il turbo della ventola, quello centrale lancia l'XSplit Gamecaster (versione trial di un anno). Il tasto destro modifica l'illuminazione.
Touchpad
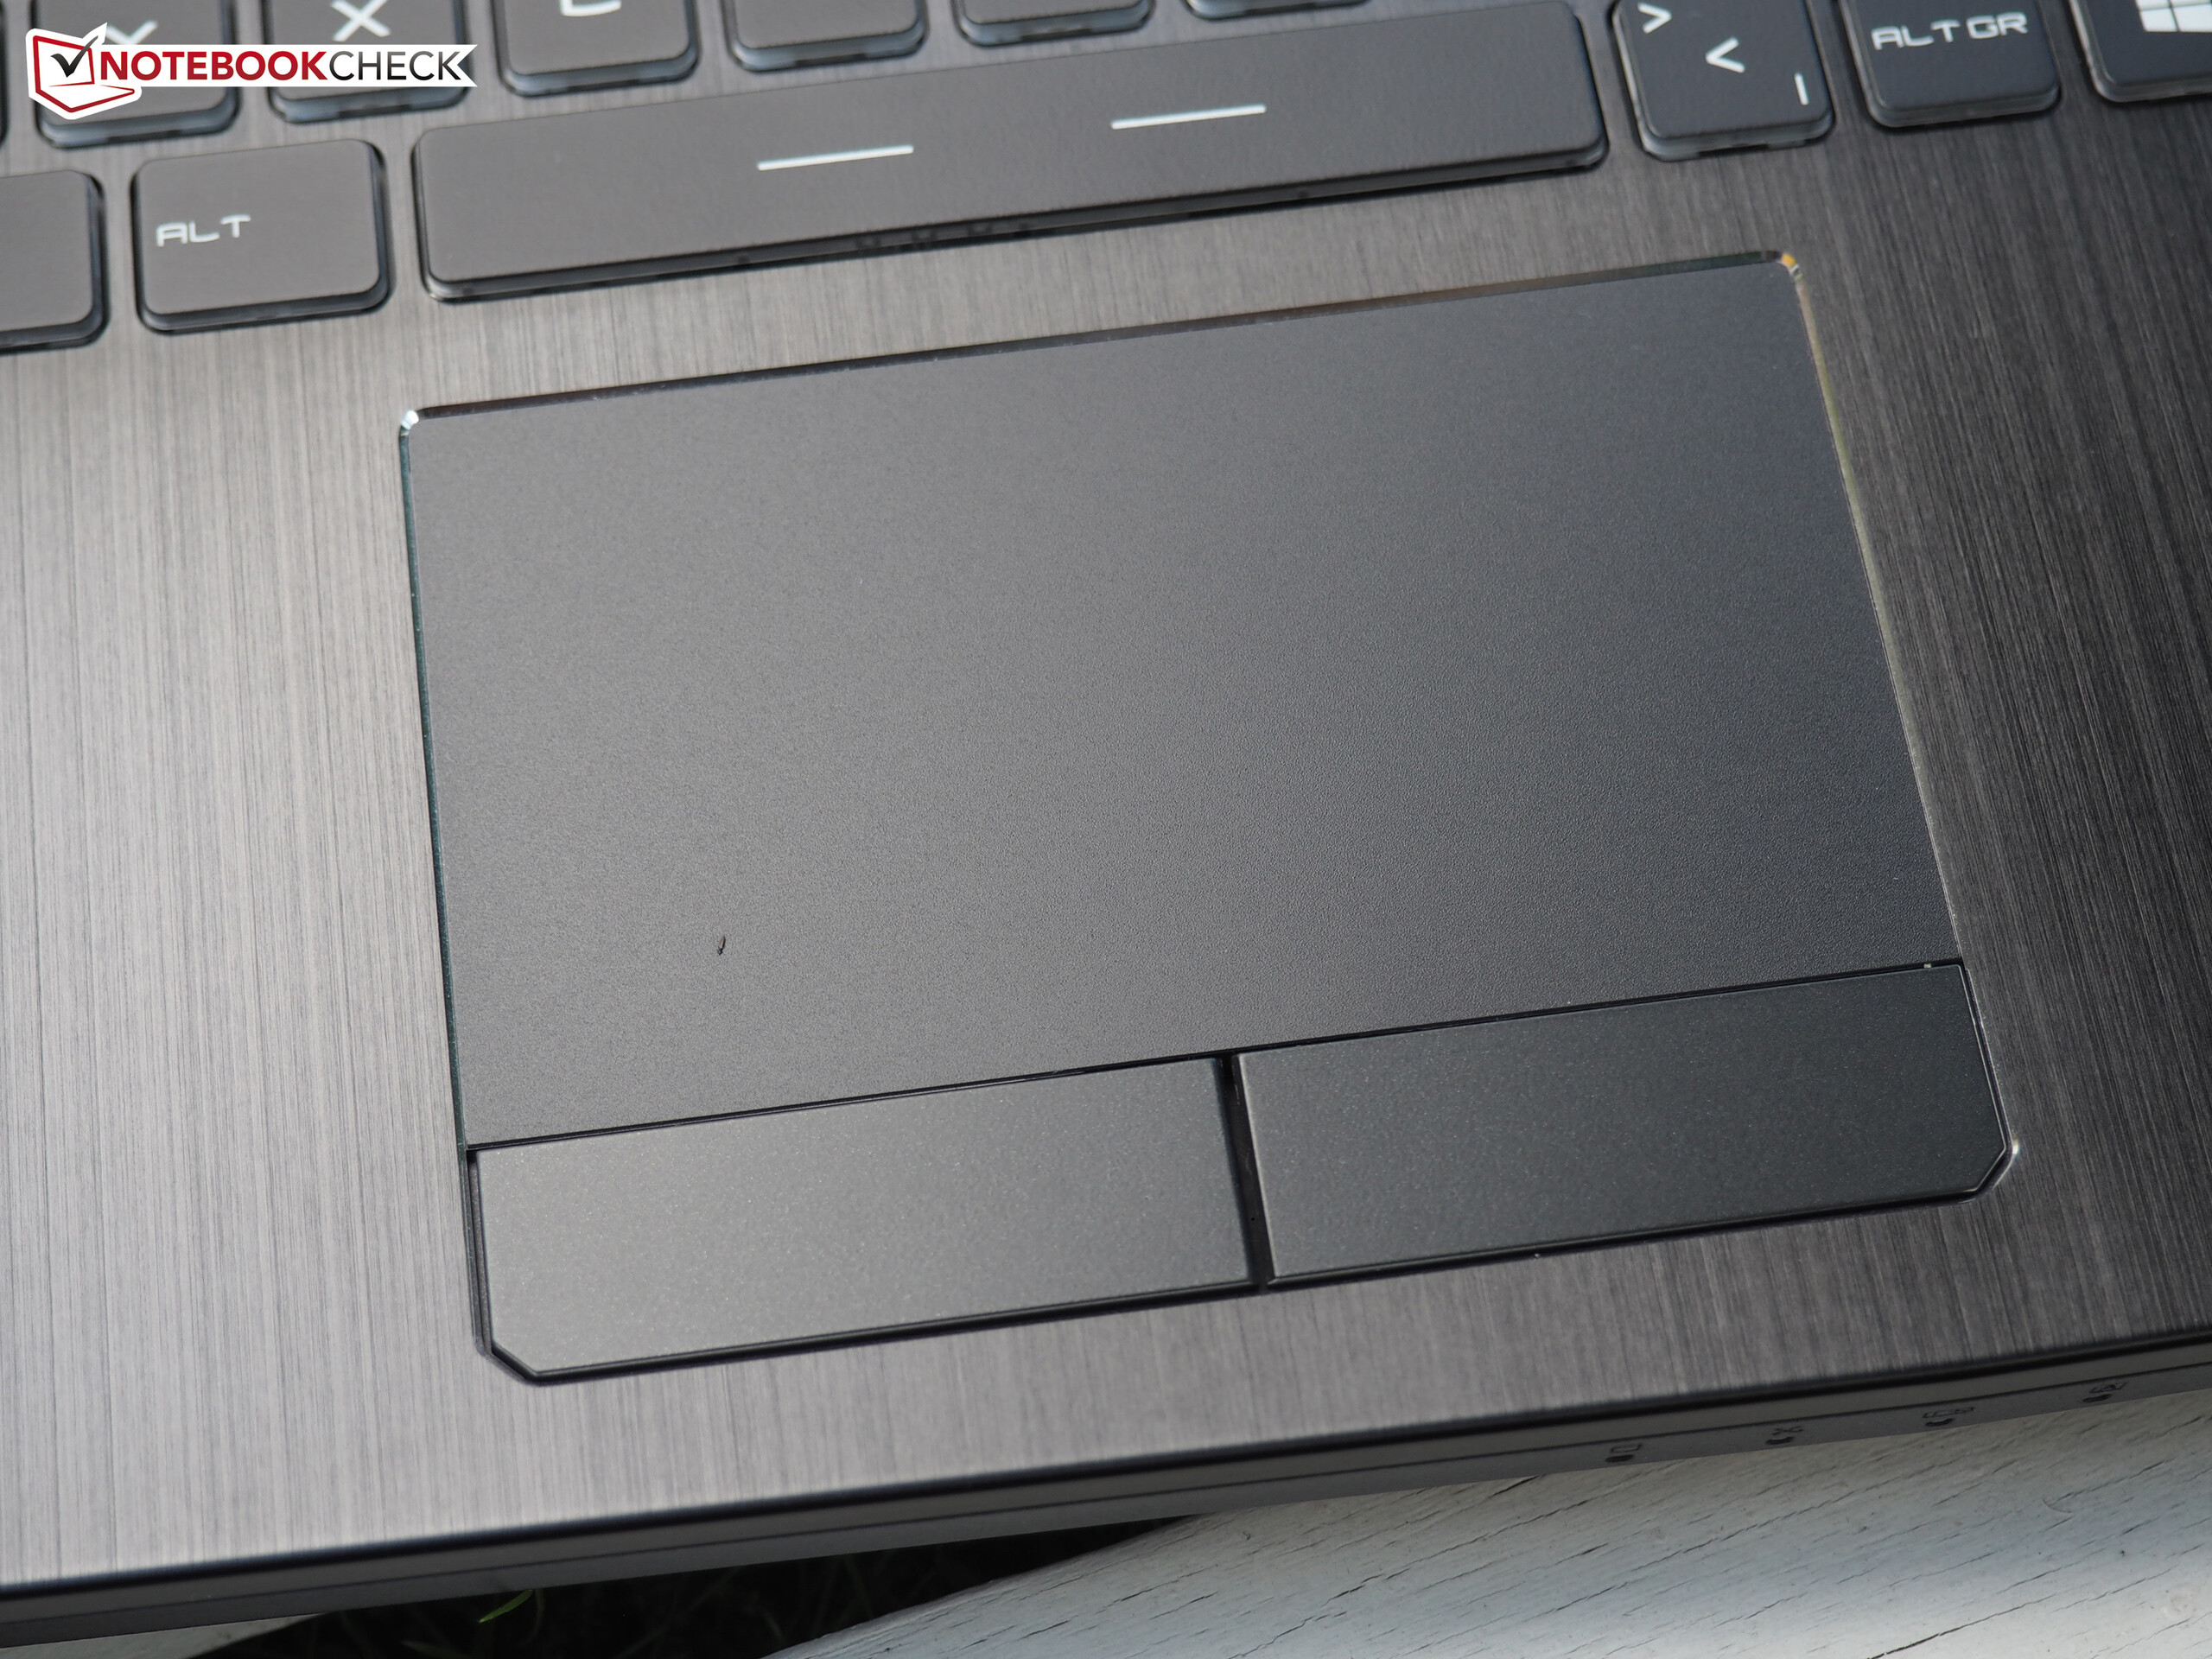
Il touchpad leggermente ribassato è ben evidenziato. MSI rinuncia al click pad per il GT62VR e monta su questo 15" un mouse replacement convenzionale con pulsanti dedicati. Funziona egregiamente, ma è piuttosto rumoroso.
Il feedback beneficia della struttura sottostante. Nonostante la superficie ruvida, abbiamo apprezzato la scorrevolezza. E' simile la situazione relativamente alle dimensioni. 11 x 6 cm sono più che buoni per un dispositivo da 15". Siamo stati leggermente sorpresi dal fatto che una parte delle gestures supportate, più precisamente lo scrolling, deve essere attivata manualmente nel driver del touchpad (Synaptics V7.5). Lo zooming e la rotazione con due dita funzionano di default.
Display
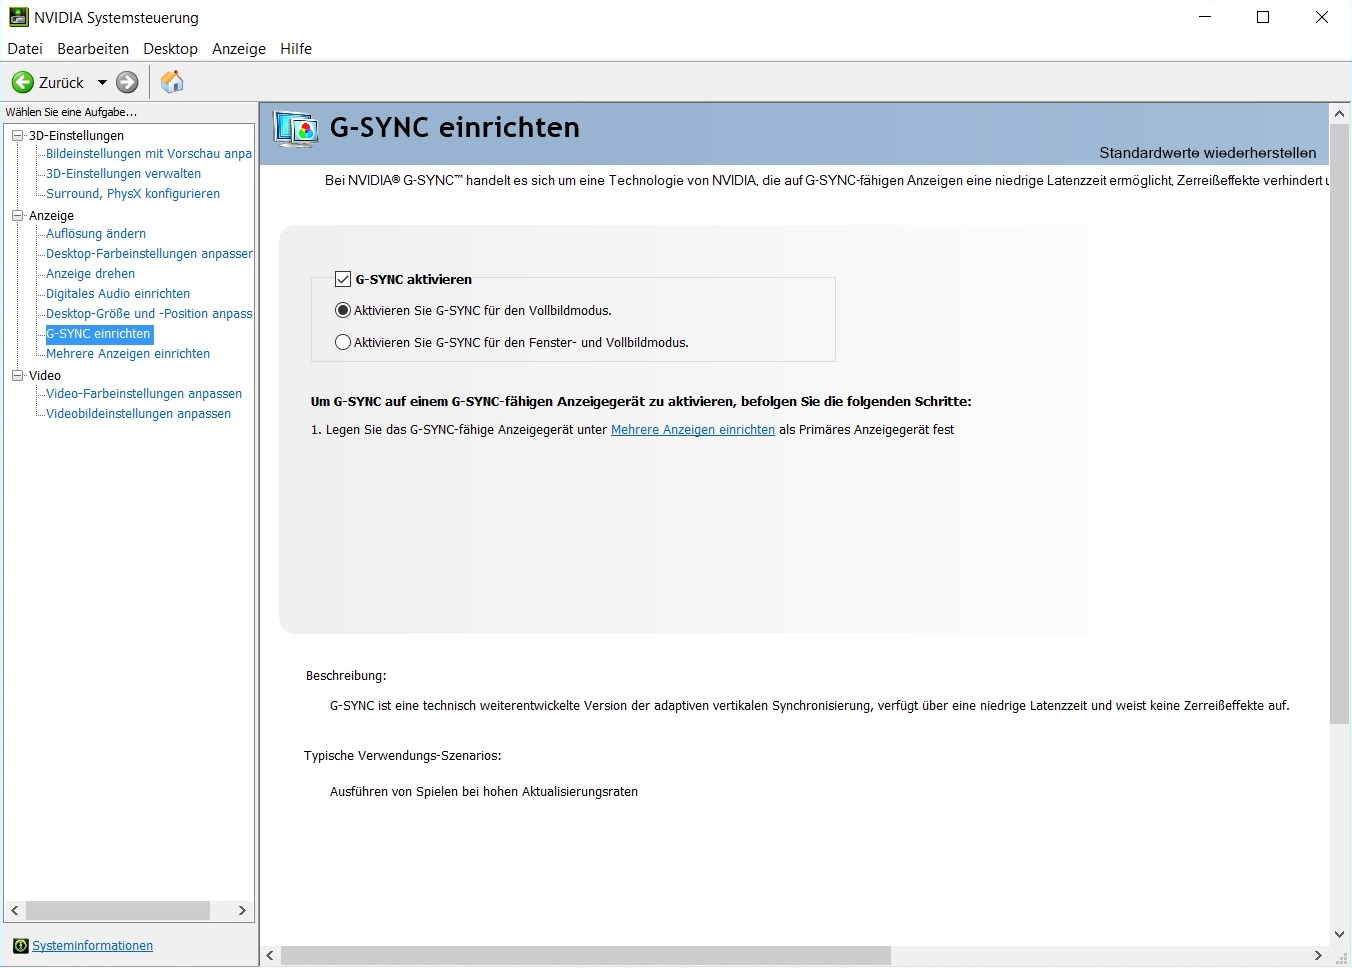
Come ci si aspettava da un moderno portatile high-end gaming, il GT62VR è G-Sync certified. La tecnolgoia Nvidia del display sincronizza il refresh rate del panello con la GPU GeForce per evitare disallineamenti e minimizzare lo stuttering e le latenze. MSI pubblicizza questo 15" gamer come VR-ready, ma ovviamente vi occorre un hardware addizionale per questo (i.e. Oculus Rift).
| |||||||||||||||||||||||||
Distribuzione della luminosità: 88 %
Al centro con la batteria: 273 cd/m²
Contrasto: 1011:1 (Nero: 0.27 cd/m²)
ΔE ColorChecker Calman: 3.67 | ∀{0.5-29.43 Ø4.72}
ΔE Greyscale Calman: 2.73 | ∀{0.09-98 Ø4.97}
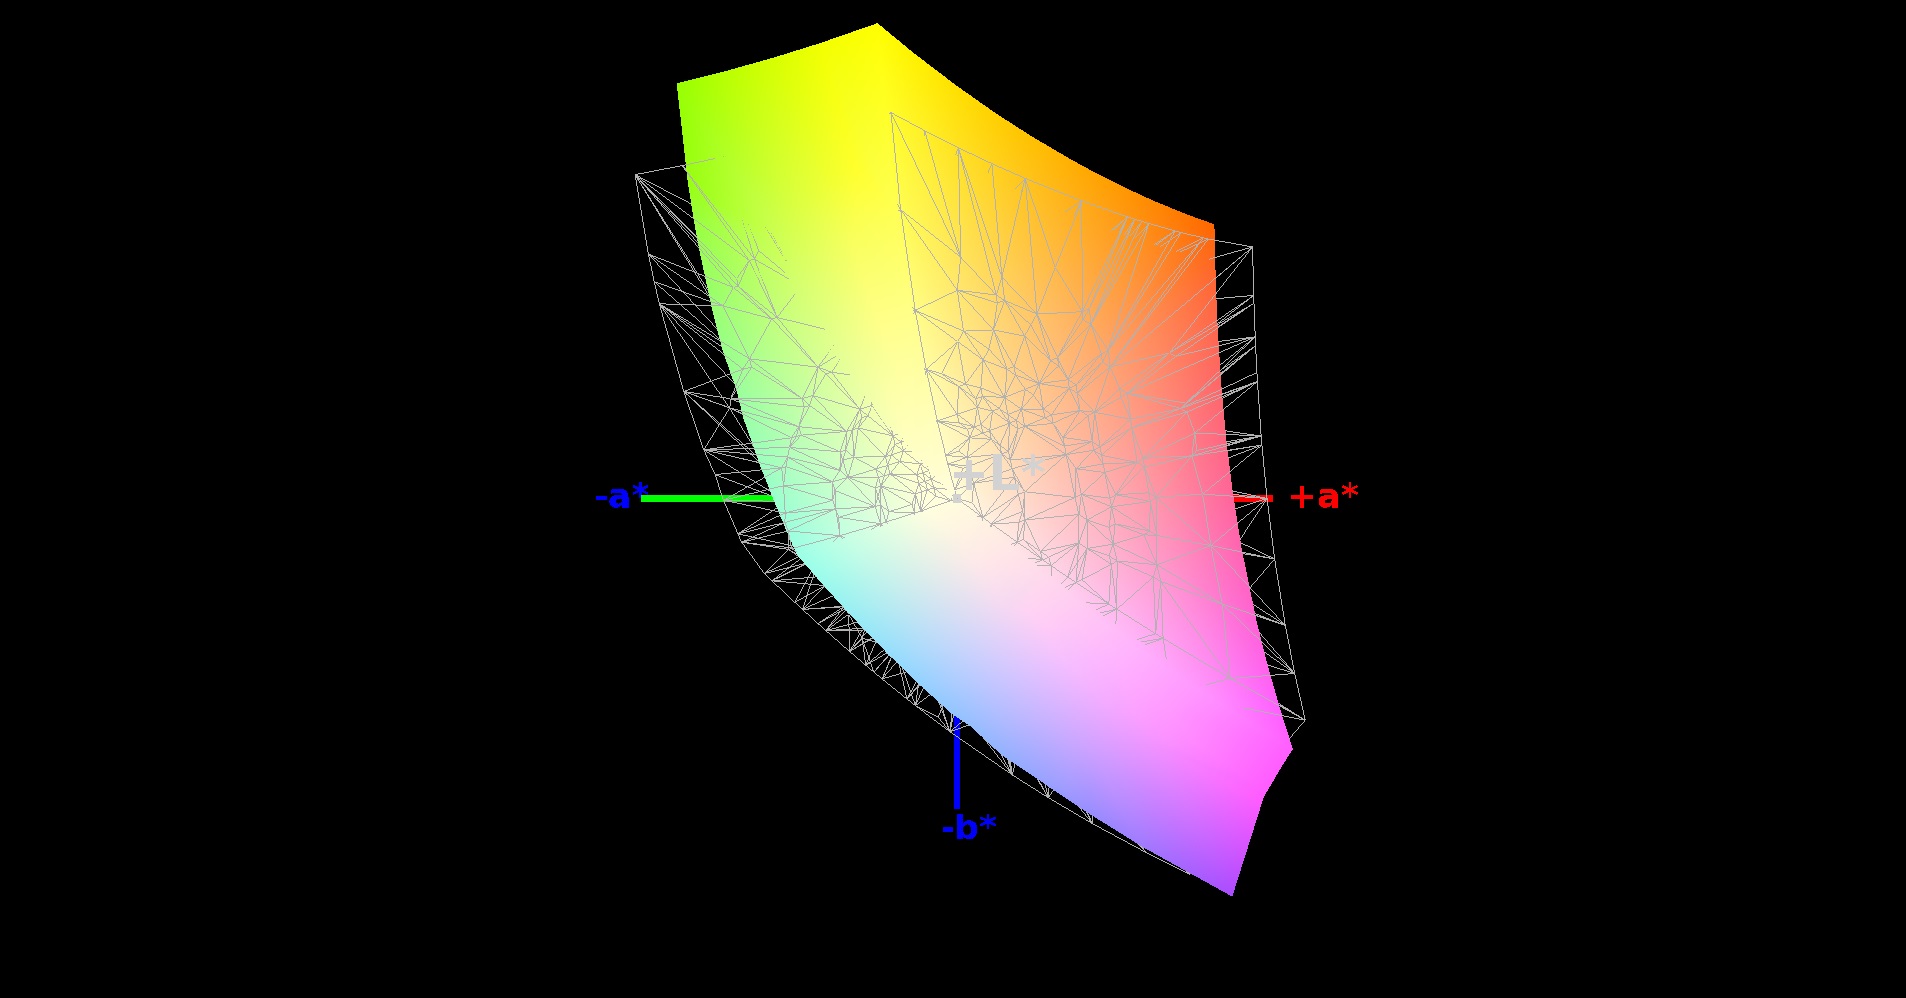
84% sRGB (Argyll 1.6.3 3D)
55% AdobeRGB 1998 (Argyll 1.6.3 3D)
61.8% AdobeRGB 1998 (Argyll 3D)
84.6% sRGB (Argyll 3D)
64.6% Display P3 (Argyll 3D)
Gamma: 2.49
CCT: 7029 K
| MSI GT62VR-6RE16H21 LG Philips LP156WF6 (LGD046F) | Gigabyte P55W v5 LG Philips LP156WF4-SPH1 | Acer Predator 15 G9-592-7925 LG Philips LP156WF6-SPP1 (LGD04D5) | Schenker XMG P506 PRO LG Philips LP156WF6 (LGD046F) | Alienware 15 R2 (Skylake) Samsung 4NDDJ_156HL (SDC4C48) | |
|---|---|---|---|---|---|
| Display | -17% | -3% | -0% | -33% | |
| Display P3 Coverage (%) | 64.6 | 50.1 -22% | 63 -2% | 65.1 1% | 40.3 -38% |
| sRGB Coverage (%) | 84.6 | 73.5 -13% | 82.2 -3% | 83.7 -1% | 60.2 -29% |
| AdobeRGB 1998 Coverage (%) | 61.8 | 51.2 -17% | 60.1 -3% | 61.2 -1% | 41.67 -33% |
| Response Times | -26% | -18% | -12% | -36% | |
| Response Time Grey 50% / Grey 80% * (ms) | 34 ? | 44 ? -29% | 43 ? -26% | 37 ? -9% | 48.8 ? -44% |
| Response Time Black / White * (ms) | 22 ? | 27 ? -23% | 24 ? -9% | 25 ? -14% | 28 ? -27% |
| PWM Frequency (Hz) | 200 ? | ||||
| Screen | -10% | -15% | -4% | -37% | |
| Brightness middle (cd/m²) | 273 | 254 -7% | 302 11% | 312 14% | 180 -34% |
| Brightness (cd/m²) | 278 | 267 -4% | 287 3% | 293 5% | 179 -36% |
| Brightness Distribution (%) | 88 | 89 1% | 91 3% | 87 -1% | 83 -6% |
| Black Level * (cd/m²) | 0.27 | 0.28 -4% | 0.36 -33% | 0.32 -19% | 0.19 30% |
| Contrast (:1) | 1011 | 907 -10% | 839 -17% | 975 -4% | 947 -6% |
| Colorchecker dE 2000 * | 3.67 | 4.28 -17% | 4.93 -34% | 4.45 -21% | 6.74 -84% |
| Colorchecker dE 2000 max. * | 8.33 | 10.6 -27% | 12.34 -48% | 8.5 -2% | |
| Greyscale dE 2000 * | 2.73 | 2.77 -1% | 3.47 -27% | 3.05 -12% | 6.44 -136% |
| Gamma | 2.49 88% | 2.28 96% | 2.16 102% | 2.58 85% | 2.29 96% |
| CCT | 7029 92% | 6284 103% | 6622 98% | 6495 100% | 6465 101% |
| Color Space (Percent of AdobeRGB 1998) (%) | 55 | 47 -15% | 54 -2% | 55 0% | 38 -31% |
| Color Space (Percent of sRGB) (%) | 84 | 73 -13% | 82 -2% | 84 0% | 60 -29% |
| Media totale (Programma / Settaggio) | -18% /
-13% | -12% /
-13% | -5% /
-4% | -35% /
-36% |
* ... Meglio usare valori piccoli
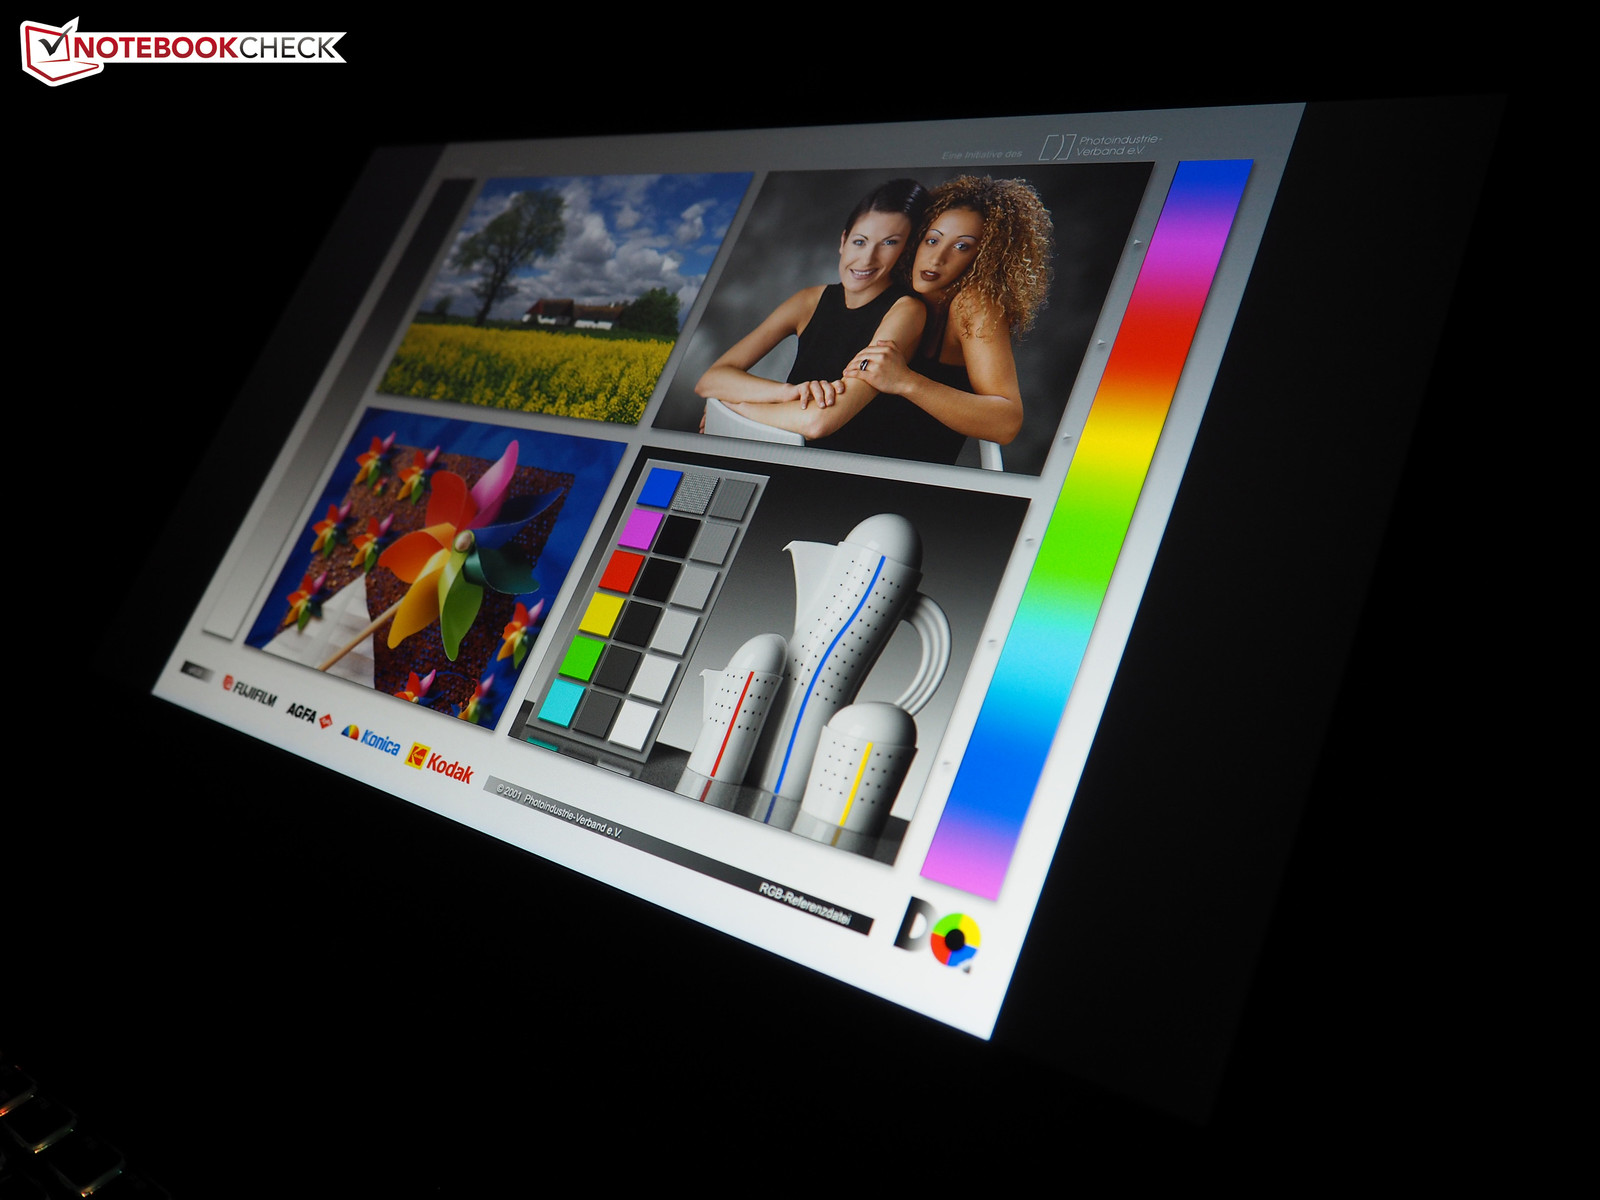
La qualità dell'immagine del pannello LG Philips non deve nascondersi rispetto ai concorrenti. Il modello Full-HD LP156WF6 usa la tecnologia IPS, che è nota per i colori ricchi e gli ampi angoli di visuale. Il GT62VR ha buoni punteggi anche in molte altre categorie. Non importa se parliamo di luminosità (~280 cd/m²), distribuzione della luminosità (88 %), valore del nero (0.27 cd/m²) o contrasto (~1000:1): I rilievi del display non mostrano alcun problema.
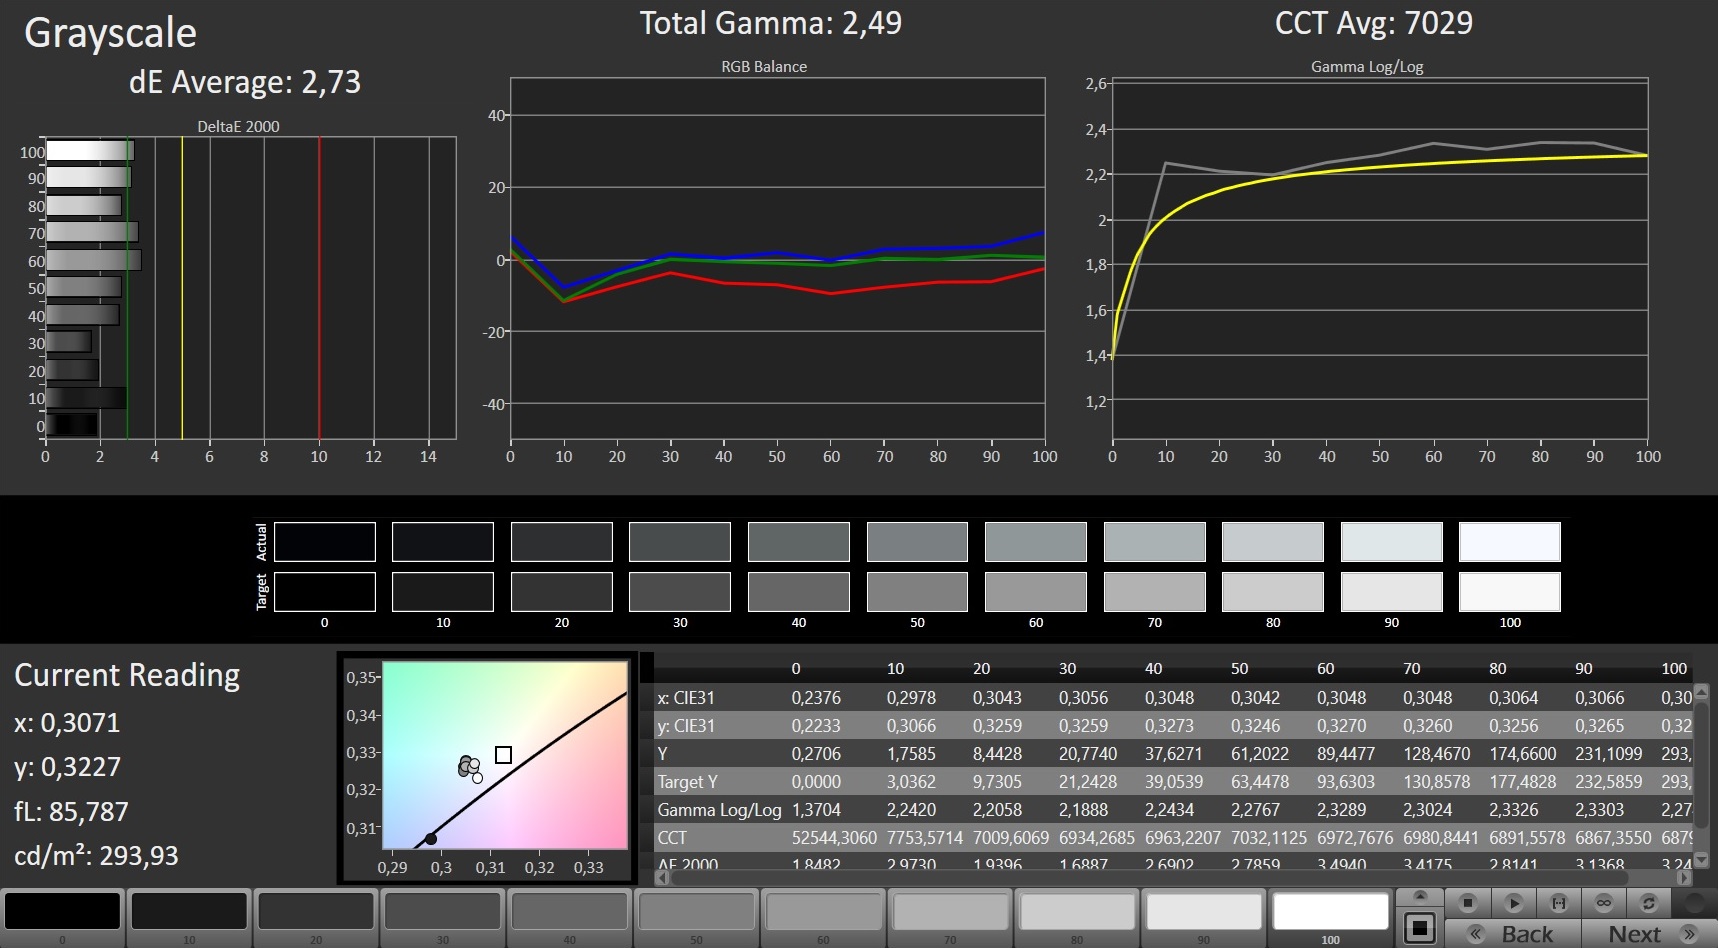
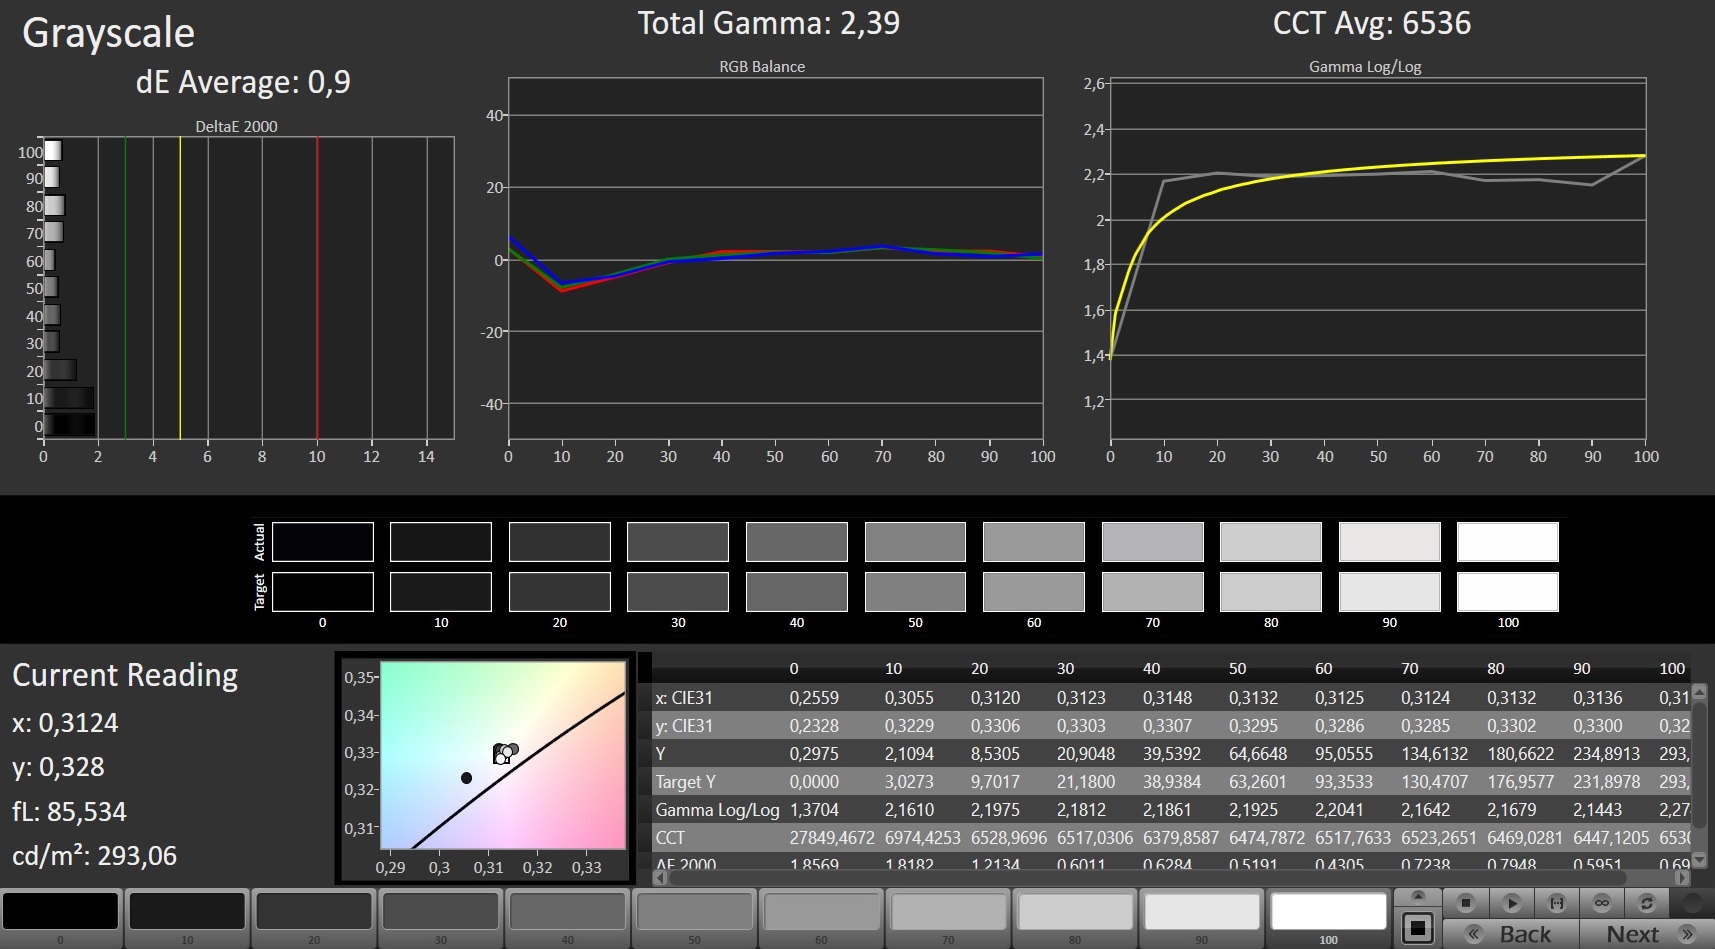
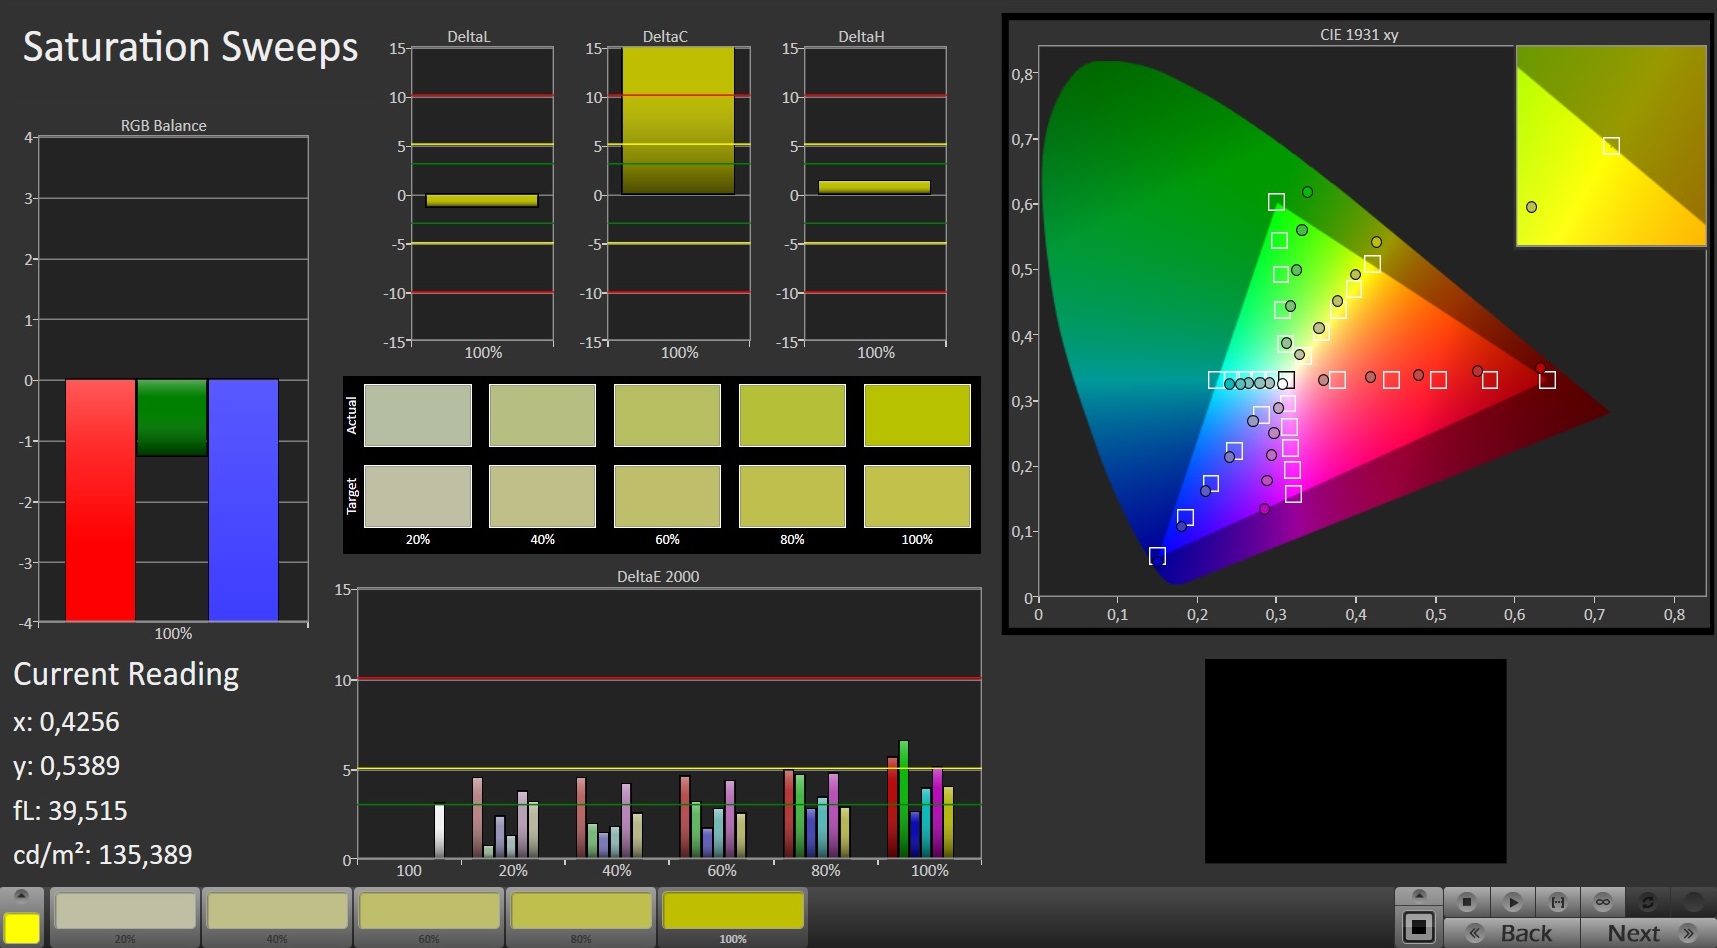
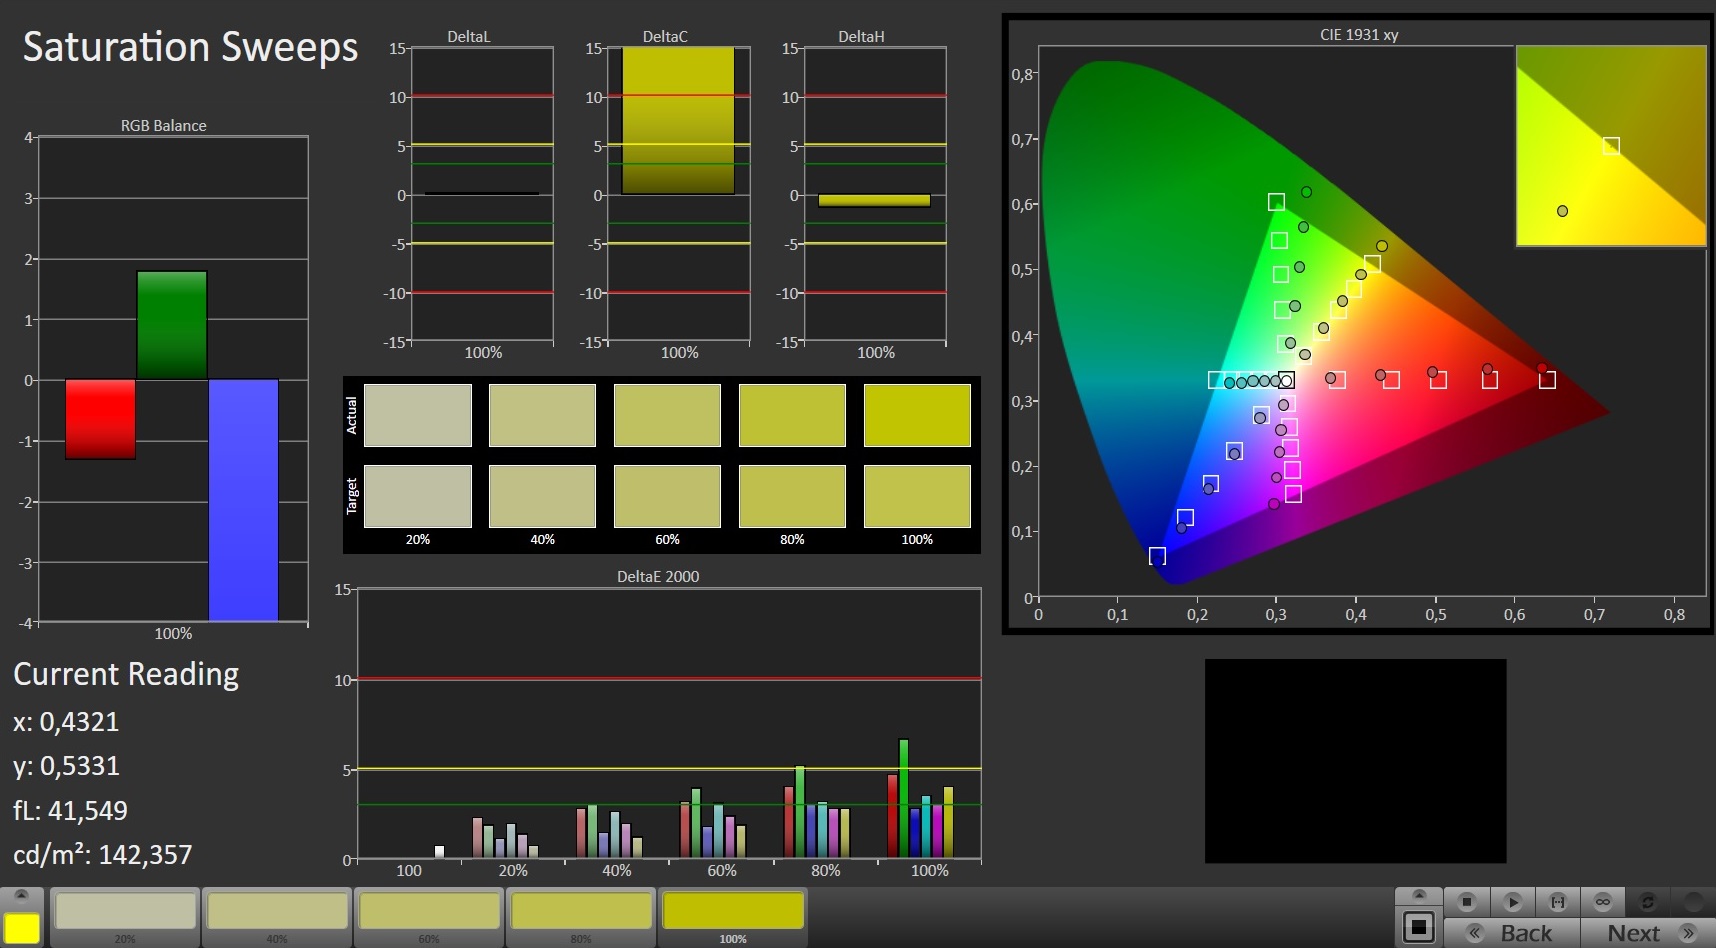
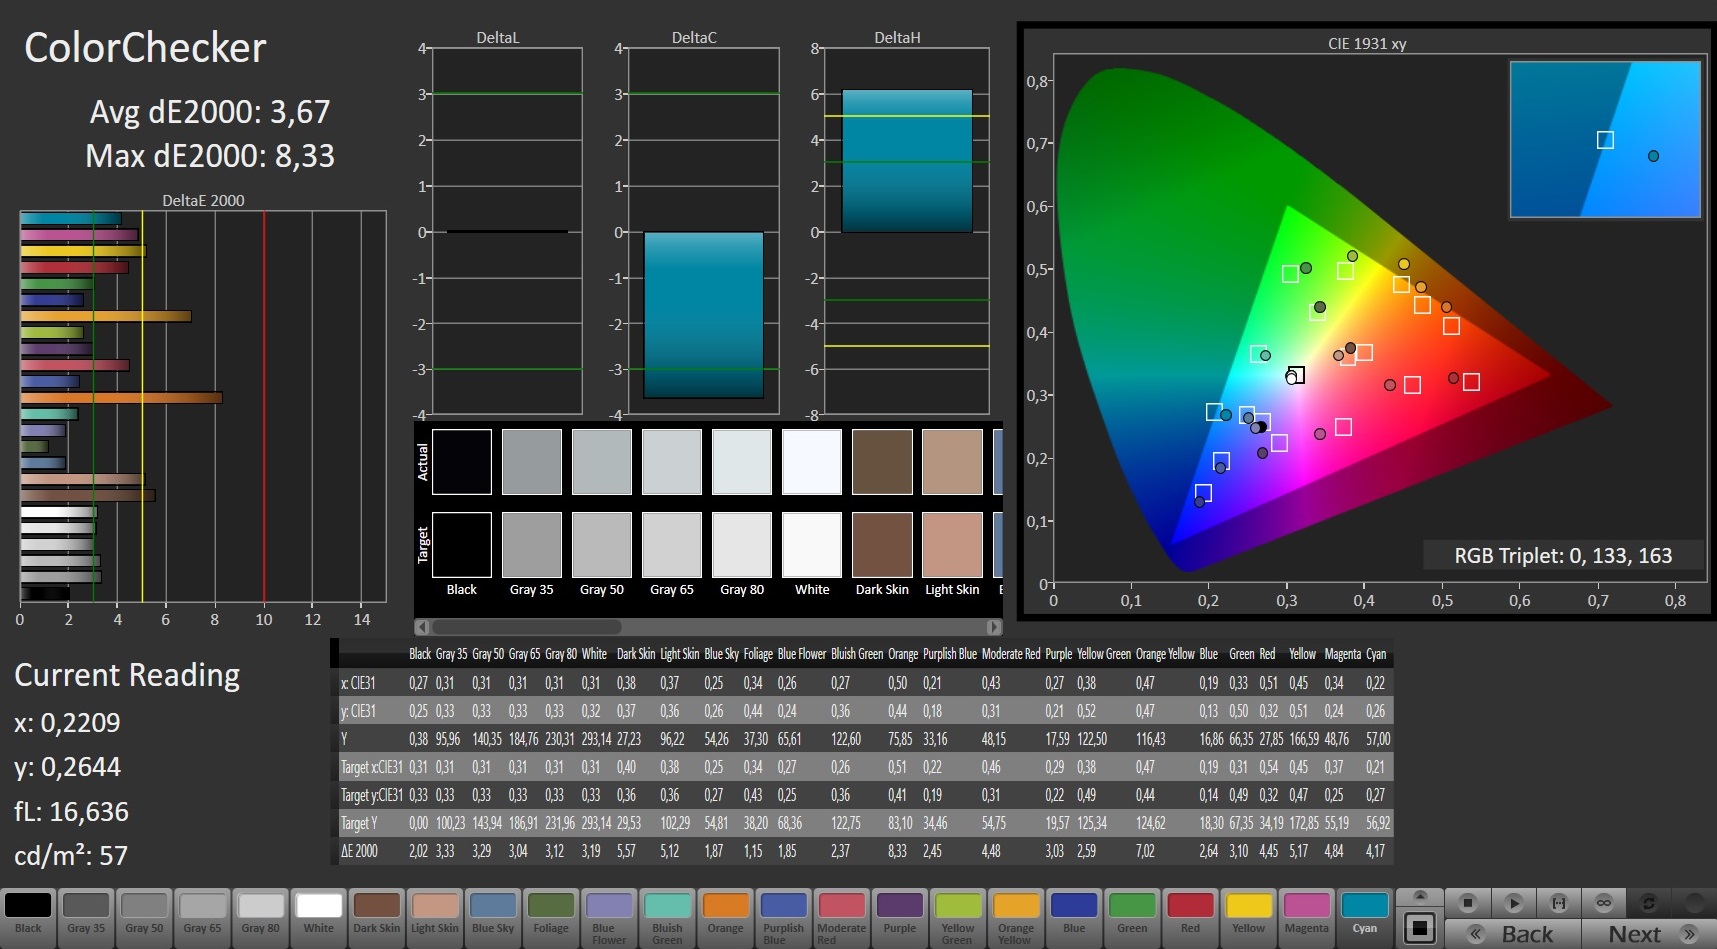
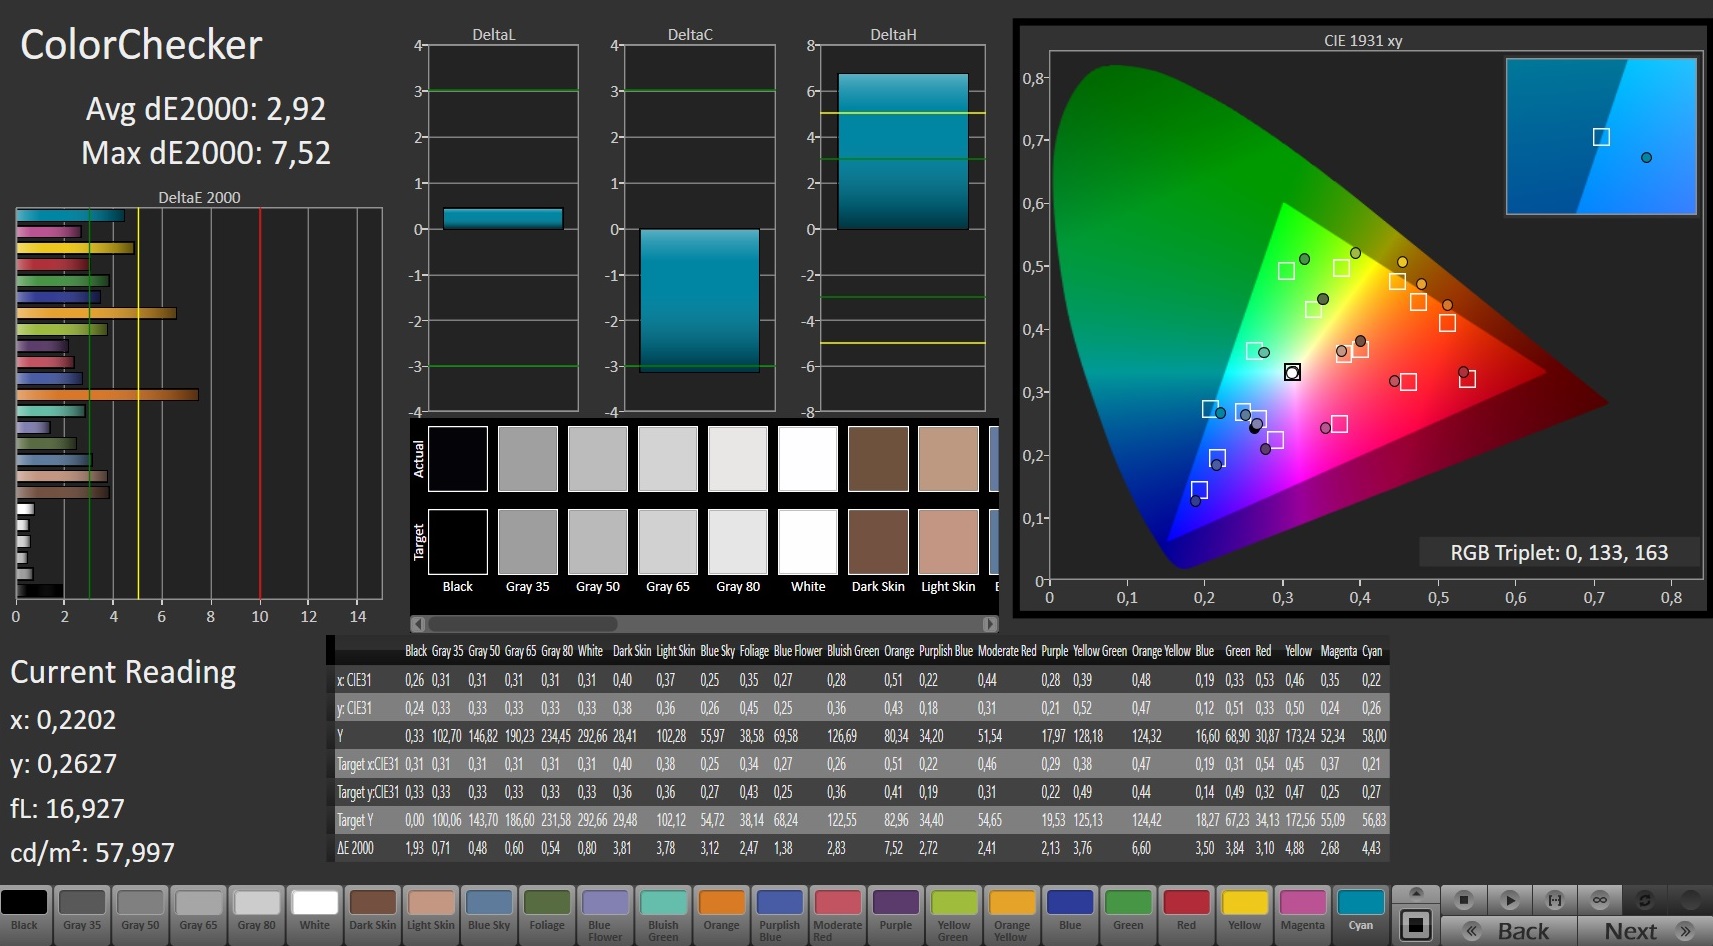

Lo stesso vale per i test estesi sul colore con il software CalMAN. Questo non sorprende in quanto MSI installa vari profili display. Il panello, tuttavia, può andare anche meglio. Siamo riusciti a migliorare la scala di grigi da 2.73 a ben 0.9 ed il ColorChecker da 3.67 a 2.92 (entrambi DeltaE 2000) con la calibrazione.
Abbiamo rilevato l'84 % sRGB ed il 55 % AdobeRGB di copertura, il che è completamente sufficiente per i giocatori. Il nostro modello di test non mostra fastidiosi effetti bleeding alle estremità. Attenzione per i fan del 4K: il GT62VR sarà lanciato anche con un pannello UHD.
Tempi di risposta del Display
| ↔ Tempi di risposta dal Nero al Bianco | ||
|---|---|---|
| 22 ms ... aumenta ↗ e diminuisce ↘ combinato | ↗ 5 ms Incremento | 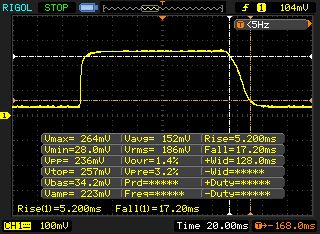 |
| ↘ 17 ms Calo | ||
| Lo schermo mostra buoni tempi di risposta durante i nostri tests, ma potrebbe essere troppo lento per i gamers competitivi. In confronto, tutti i dispositivi di test variano da 0.1 (minimo) a 240 (massimo) ms. » 49 % di tutti i dispositivi è migliore. Questo significa che i tempi di risposta rilevati sono peggiori rispetto alla media di tutti i dispositivi testati (19.8 ms). | ||
| ↔ Tempo di risposta dal 50% Grigio all'80% Grigio | ||
| 34 ms ... aumenta ↗ e diminuisce ↘ combinato | ↗ 14 ms Incremento | 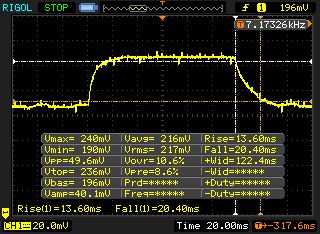 |
| ↘ 20 ms Calo | ||
| Lo schermo mostra tempi di risposta lenti nei nostri tests e sarà insoddisfacente per i gamers. In confronto, tutti i dispositivi di test variano da 0.165 (minimo) a 636 (massimo) ms. » 47 % di tutti i dispositivi è migliore. Questo significa che i tempi di risposta rilevati sono simili alla media di tutti i dispositivi testati (31 ms). | ||
Sfarfallio dello schermo / PWM (Pulse-Width Modulation)
| flickering dello schermo / PWM non rilevato |  | ||
In confronto: 52 % di tutti i dispositivi testati non utilizza PWM per ridurre la luminosita' del display. Se è rilevato PWM, una media di 7747 (minimo: 5 - massimo: 343500) Hz è stata rilevata. | |||
Performance
CPU Quad-core e GPU high-end? C'è. 16 GB di DDR4-RAM? C'è. Solid State Drive? C'è. L'MSI GT62VR offre molte prestazioni per tutti gli scenari che sia ufficio, multimedia o web fino ai giochi AAA. Questa configurazione del 15" non dovrebbe avere problemi di prestazioni per i prossimi due anni.
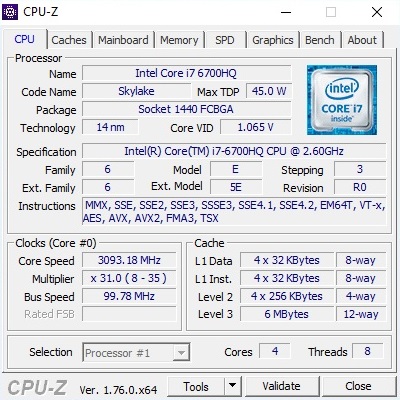
Processore
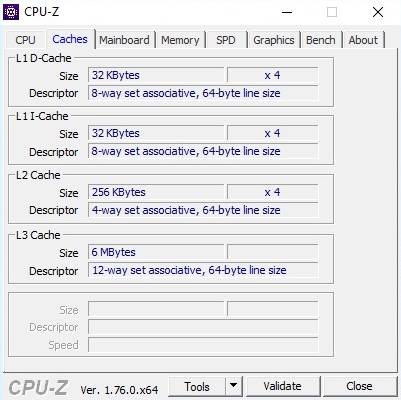
Il processore è un quad-core della generazione Intel Skylake (14 nm). Il Core i7-6700HQ è attualmente la base di quasi tutti i portatili gaming, grazie al rapporto prezzo-prestazioni e all'assenza di concorrenza AMD. Il Core i7-6820HK ha clocks leggermente superiori, ma il prezzo aggiuntivo per un paio di punti percentuali in più non vale la pena. Intel monta il Core i7-6700HQ con 6 MB di L3-cache e una unità grafica chiamata HD Graphics 530, ma è disattivata nel caso del GT62VR (manca lo switching grafico via Optimus). Il produttore specifica un TDP di 45 Watts.
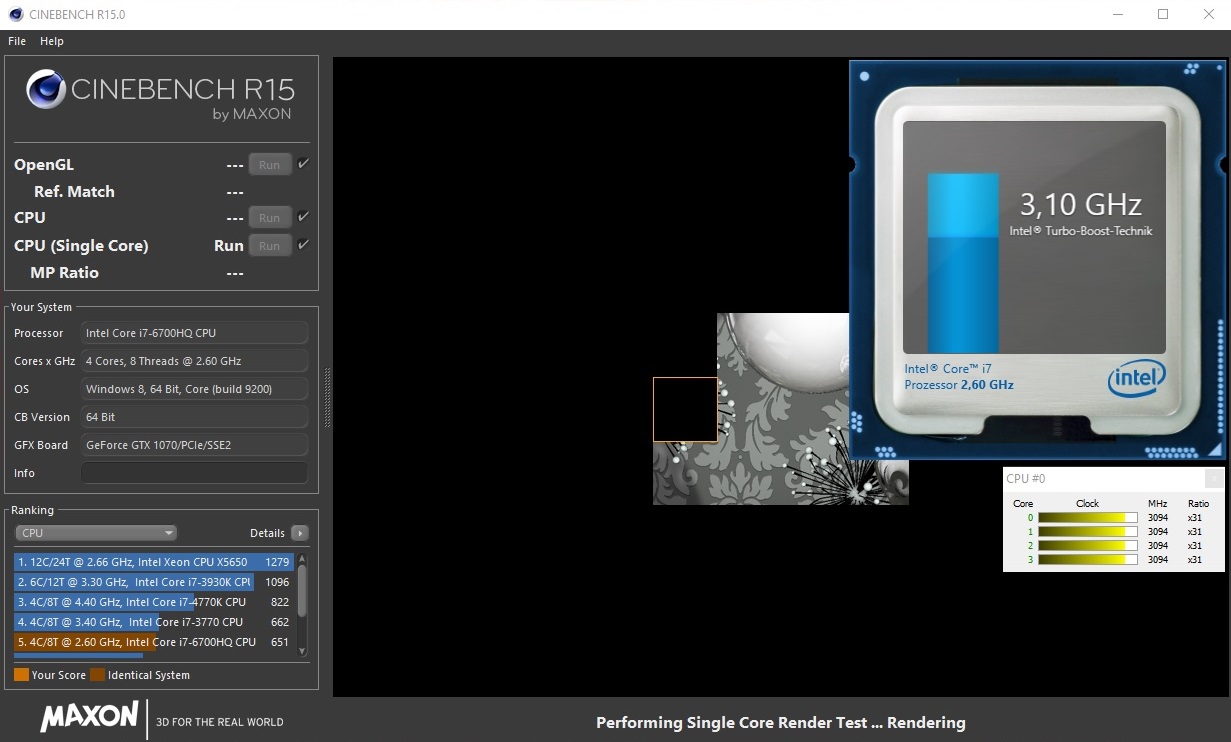
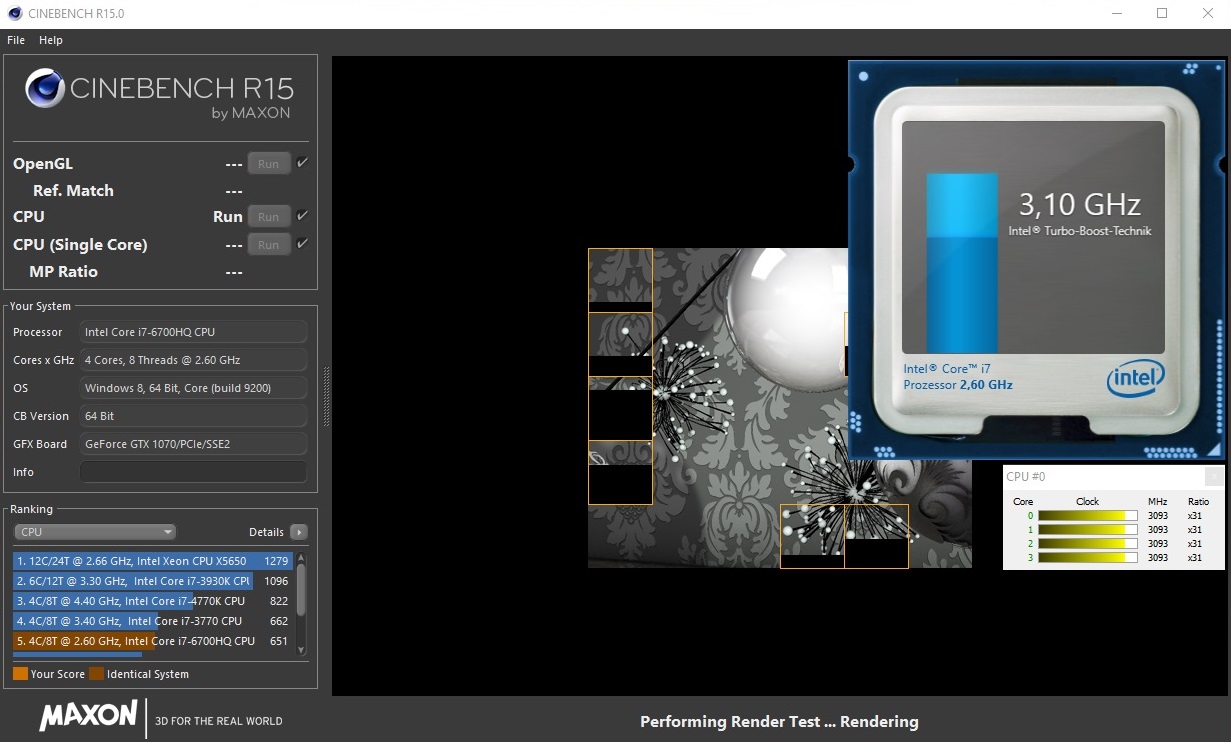
Come sempre, abbiamo testato clocks e performance con i benchmarks Cinebench. Mentre la maggioranza dei portatili ha comportamenti abbastanza inconsistenti, il GT62VR dava qualche perplessità all'inizio. I punteggi single-core erano molto più bassi rispetto alle attese di un i7-6700HQ, nonostante i clocks buoni. La CPU a volte scendeva al livello del modello ULV Core i5-6200U. Il clock era sempre fermo a 3.1 GHz secondo HWiNFO ed il monitor Intel Turbo Boost.
Dopo esserci confrontati con MSI, il problema è risultato essere il software Dragon Center, quindi abbiamo ricevuto un secondo dispositivo di test con gli aggiornamenti. La funzione Shift usa ancora 3.1 GHz nelle modalità "Sport", "Comfort" ed "Eco" (quindi la feature non ha molto senso), ma le modalità utente "Presentation", "Movie", "Gaming", ed "Office" hanno un chiaro effetto sui clocks, quindi ora siamo in grado di effettuare correttamente le misurazioni idle. Tutti i corrispondenti valori sono stati già sostituiti. Il punteggio complessivo tuttavia è ancora dell'85%.
Quando il Core i7-6700HQ riesce ad usare tutto il suo potenziale, i risultati sono alla pari con la concorrenza. 143 punti nel test Cinebench R15 Single-Core e 673 punti nel test Multi-Core sono simili al Gigabyte P55W v5.
| Cinebench R15 | |
| CPU Multi 64Bit | |
| Schenker XMG P506 PRO | |
| Alienware 15 R2 (Skylake) | |
| Acer Predator 15 G9-592-7925 | |
| Gigabyte P55W v5 | |
| MSI GT62VR-6RE16H21 | |
| CPU Single 64Bit | |
| Schenker XMG P506 PRO | |
| Alienware 15 R2 (Skylake) | |
| Gigabyte P55W v5 | |
| MSI GT62VR-6RE16H21 | |
| Acer Predator 15 G9-592-7925 | |
| Cinebench R11.5 | |
| CPU Multi 64Bit | |
| Schenker XMG P506 PRO | |
| Alienware 15 R2 (Skylake) | |
| Acer Predator 15 G9-592-7925 | |
| MSI GT62VR-6RE16H21 | |
| Gigabyte P55W v5 | |
| CPU Single 64Bit | |
| Schenker XMG P506 PRO | |
| Alienware 15 R2 (Skylake) | |
| Gigabyte P55W v5 | |
| Acer Predator 15 G9-592-7925 | |
| MSI GT62VR-6RE16H21 | |
Prestazioni di sistema
Le prestazioni di sistema rispecchiano completamente le nostre attese. 5926 punti nel PCMark 7 sono tipiche per un portatile high-end che monta un SATA-III-SSD. Questo colloca l'MSI GT62VR tra le configurazioni recensite dell'Alienware 15 R2 (5846 punti) e dell'Acer Predator 15 (5974 punti).
| PCMark 7 Score | 5926 punti | |
| PCMark 8 Home Score Accelerated v2 | 4541 punti | |
| PCMark 8 Work Score Accelerated v2 | 4924 punti | |
Aiuto | ||
| PCMark 7 - Score | |
| Schenker XMG P506 PRO | |
| Acer Predator 15 G9-592-7925 | |
| MSI GT62VR-6RE16H21 | |
| Alienware 15 R2 (Skylake) | |
| Gigabyte P55W v5 | |
| PCMark 8 | |
| Home Score Accelerated v2 | |
| MSI GT62VR-6RE16H21 | |
| Gigabyte P55W v5 | |
| Alienware 15 R2 (Skylake) | |
| Work Score Accelerated v2 | |
| Alienware 15 R2 (Skylake) | |
| MSI GT62VR-6RE16H21 | |
| Gigabyte P55W v5 | |
Dispositivi di archiviazione
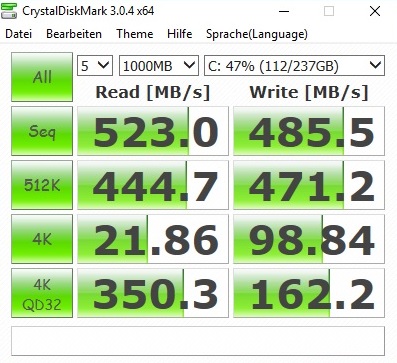
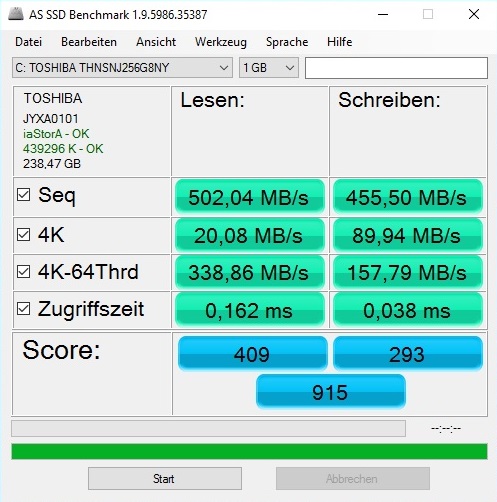
Sebbene lo slot M.2 supporti Solid State Drives PCIe/NVMe, MSI – come detto prima - usa solo un modello SATA-III, quindi i valori di trasferimento sono limitati a circa 500 MB/s. Dentro il modello di test c'è un drive da 256 GB Toshiba, che arriva ad un punteggio totale di 915 punti nel benchmark AS SSD. Per confronto: l'SSD NVMe dello Schenker XMG P506 arriva a 2716 punti (+ 200 %).
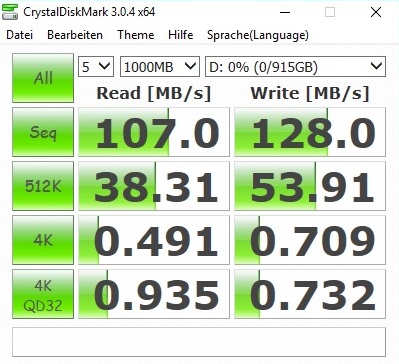
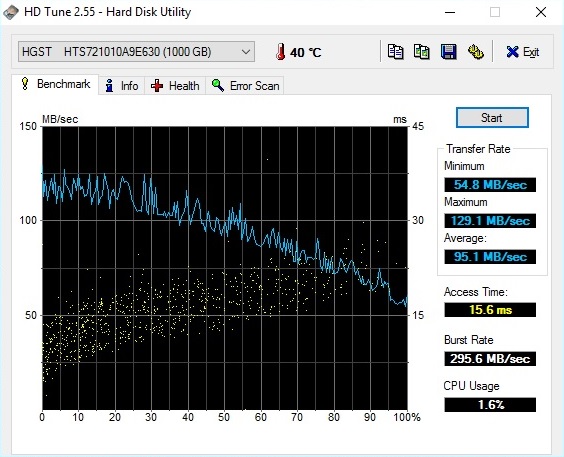
Difficilmente noterete tuttavia una differenza in pratica, dove le prestazioni con i files piccoli sono più importanti rispetto ad operazioni di lettura e scrittura sequenziali. MSI monta sul GT62VR anche un HDD da 2.5" per evitare problemi di spazio. L'HGST Travelstar 7K1000 ha una capacità di 1000 GB e gira a 7200 rpm.

| MSI GT62VR-6RE16H21 Toshiba HG6 THNSNJ256G8NY | Gigabyte P55W v5 Samsung SM951 MZVPV128 NVMe | Acer Predator 15 G9-592-7925 Samsung SSD PM871 MZNLN512HCJH | Schenker XMG P506 PRO Samsung SSD 950 Pro 512GB m.2 NVMe | Alienware 15 R2 (Skylake) Samsung PM951 NVMe MZ-VLV256D | |
|---|---|---|---|---|---|
| AS SSD | 111% | 9% | 185% | ||
| Seq Read (MB/s) | 502 | 1739 246% | 511 2% | 2104 319% | |
| Seq Write (MB/s) | 455.5 | 536 18% | 447.3 -2% | 1416 211% | |
| 4K Read (MB/s) | 20.08 | 45.15 125% | 29.54 47% | 48.71 143% | |
| 4K Write (MB/s) | 89.9 | 112.7 25% | 79.4 -12% | 138.3 54% | |
| Score Total (Points) | 915 | 2201 141% | 1029 12% | 2716 197% |
Prestazioni GPU
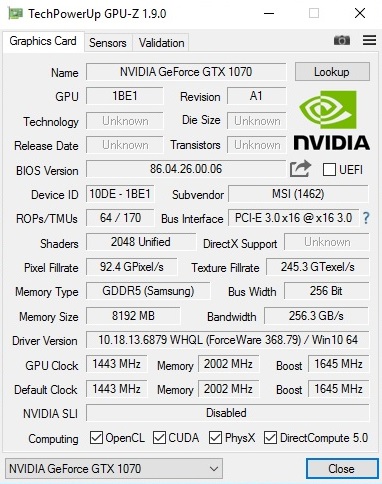
Ora arriviamo alla parte più interessante, la scheda grafica. Ci sono state molte discussioni sull'architettura Nvidia Pascal prima del lancio. Ci sono versioni di portatili più sottili e portano una M che dovrebbe indicare i modelli mobile? O le prestazioni saranno simili alle desktop con nome identico? Per quello che riguarda la GeForce GTX 1070, sicuramente si. Il modello desktop di riferimento gira a 1506-1683 invece di 1443-1645 MHz, ma Nvidia monta la versione mobile con il 7 % in più di unità shader (2048 vs. 1920) per compensare i MHz più bassi. Quindi molti chips desktop hanno, tuttavia, un pesante overclock, e le edizioni notebook resteranno ancora dietro.
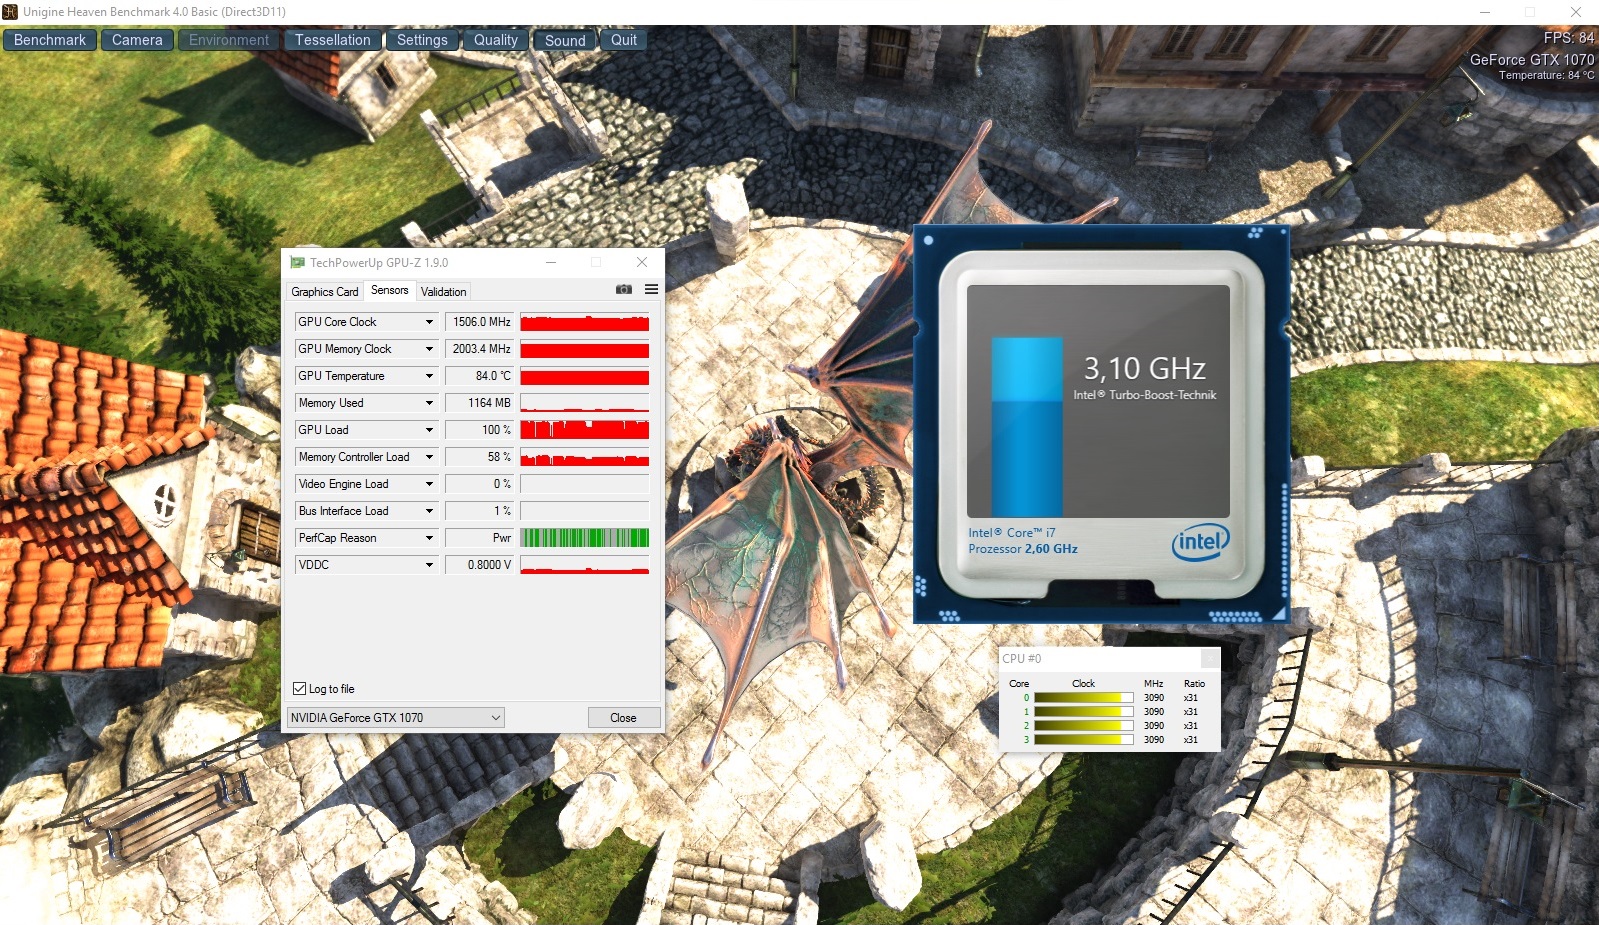
A causa dell'enorme fluttuazione del clock, le performance della GTX 1070 differiranno molto da portatile a portatile. In base al sistema di raffreddamento, il chip da 16 nm gira a clocks superiori. La proiezione test di GPU-Z è stata eseguita fino a 1900 MHz nel caso del GT62VR, sebbene il core si è livellato a circa 1,500 MHz dopo molti avvii con il benchmark Unigine Heaven 4.0.
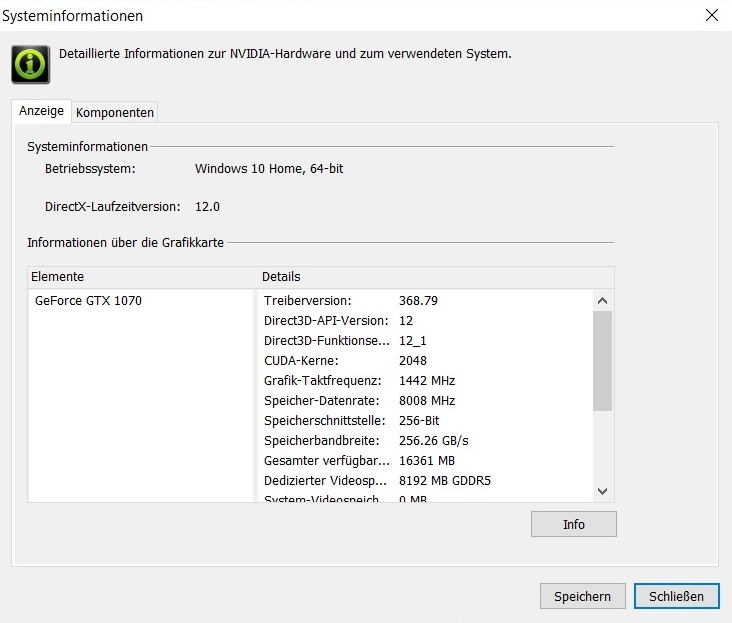
Il modello di test è stato dotato di ForceWare 368.79, ma non dà l'impressione di essere completo. Non ci sono schermate blu o errori grafici, ma in alcuni titoli abbiamo avuto l'impressione che le prestazioni potevano essere superiori. Nel migliore dei casi, la GTX 1070 sarà alla pari con la sua concorrente desktop, e resta dietro la GTX 980(M) nel peggiore dei casi. Dirt Rally, Just Cause 3, e Mad Max non sono partiti sul nostro monitor 4K (freeze o crash, rispettivamente).
Poiché abbiamo ritestato le misurazioni idle (come detto prima), abbiamo anche installato il driver ufficiale 372.53 e rapidamente controllato i benchmarks Unigine Heaven 4.0 oltre che il 3DMark 11. Il risultato: le prestazioni non sono cambiate.
| 3DMark Vantage P Result | 34389 punti | |
| 3DMark 11 Performance | 15492 punti | |
| 3DMark Ice Storm Standard Score | 113149 punti | |
| 3DMark Cloud Gate Standard Score | 23368 punti | |
| 3DMark Fire Strike Score | 12317 punti | |
| 3DMark Time Spy Score | 4910 punti | |
Aiuto | ||
Il GT62VR mostra prestazioni impressionanti nei synthetic benchmarks, che sono limitati dalla GPU. Un punteggio grafico di 17066 punti per il GTX 1070 nell'attuale test 3DMark Fire Strike è del 124 % superiore rispetto ad una GTX 970M (7624 punti @Acer Predator 15) e del 76 % più veloci rispetto ad una GTX 980M (9671 punti @Schenker XMG P506). Anche il precedente modello top GTX 980, che era usato solo sui dispositivi da 17" e 18", è superato del 34% (12691 punti @Schenker XMG U716). Il vantaggio rispetto alla desktop GTX 1060 è di oltre il 30 %. Solo una GTX 980 Ti può competere con la mobile GTX 1070. In breve: Nvidia ha fatto un ottimo lavoro con l'architettura Pascal. Grazie agli 8 GB di GDDR5-VRAM e alla interfaccia di memoria a 256-bit, questo modello high-end è anche estremamente future-proof.
| 3DMark | |
| 1920x1080 Fire Strike Graphics | |
| MSI Gaming Z GeForce GTX 1070 Desktop PC | |
| MSI GT62VR-6RE16H21 | |
| Nvidia GeForce GTX 1060 Founders Edition 6 GB | |
| Schenker XMG U716 | |
| Schenker XMG P506 PRO | |
| Acer Predator 15 G9-592-7925 | |
| 2560x1440 Time Spy Graphics | |
| MSI GT62VR-6RE16H21 | |
| 3DMark 11 - 1280x720 Performance GPU | |
| MSI Gaming Z GeForce GTX 1070 Desktop PC | |
| MSI GT62VR-6RE16H21 | |
| Nvidia GeForce GTX 1060 Founders Edition 6 GB | |
| Schenker XMG U716 | |
| Schenker XMG P506 PRO | |
| Acer Predator 15 G9-592-7925 | |
| Unigine Heaven 4.0 - Extreme Preset DX11 | |
| MSI GT62VR-6RE16H21 | |
| Nvidia GeForce GTX 1060 Founders Edition 6 GB | |
| Schenker XMG U716 | |
Prestazioni Gaming
Iniziamo con il miglior messaggio possibile: in quanto una delle poche GPU per notebook, la GeForce GTX 1070 riesce a gestire quasi tutti i giochi in 3840 x 2160 pixels in modo adeguato (35+ fps @High). Le schede grafiche della serie Maxwell spesso in questo caso mostrano stuttering. Ogni titolo può essere usato con i dettagli elevati ed anti-aliasing multiplo con la risoluzione nativa del GT62VR. Anche i giochi molto pesanti come Assassin's Creed Syndicate ed Anno 2205 non hanno problemi con questo sistema.
Se date uno sguardo ai nostri risultati del benchmark 4K/High e FHD/Ultra, la GTX 1070 è avanti del 10 % rispetto alla GTX 980, del 14% rispetto alla desktop GTX 1060 e addirittura del 60% avanti alla GTX 980M. Le prestazioni della GTX 970M sono superate del 100 %, quindi il successore Pascal è veloce il doppio. Un tale salto di prestazioni difficilmente si è visto in passato, questo dà un senso all'acquisto di un portatile nuovo adesso.
| Mirror's Edge Catalyst | |
| 3840x2160 High Preset AF:16x | |
| MSI Gaming Z GeForce GTX 1070 OC Bios Desktop PC | |
| MSI GT62VR-6RE16H21 | |
| Asus GX800 Prototype | |
| Nvidia GeForce GTX 1060 Founders Edition 6 GB | |
| Schenker W504 | |
| Schenker W504 | |
| 1920x1080 Ultra Preset AF:16x | |
| MSI Gaming Z GeForce GTX 1070 OC Bios Desktop PC | |
| MSI GT62VR-6RE16H21 | |
| Asus GX800 Prototype | |
| Nvidia GeForce GTX 1060 Founders Edition 6 GB | |
| Schenker W504 | |
| Schenker W504 | |
| Overwatch | |
| 3840x2160 High (Render Scale 100 %) AA:SM AF:4x | |
| MSI Gaming Z GeForce GTX 1070 OC Bios Desktop PC | |
| MSI GT62VR-6RE16H21 | |
| Asus GX800 Prototype | |
| Nvidia GeForce GTX 1060 Founders Edition 6 GB | |
| Schenker W504 | |
| Schenker W504 | |
| 1920x1080 Epic (Render Scale 100 %) AA:SM AF:16x | |
| MSI Gaming Z GeForce GTX 1070 OC Bios Desktop PC | |
| MSI GT62VR-6RE16H21 | |
| Asus GX800 Prototype | |
| Nvidia GeForce GTX 1060 Founders Edition 6 GB | |
| Schenker W504 | |
| Schenker W504 | |
| Doom | |
| 3840x2160 High Preset AA:FX | |
| MSI Gaming Z GeForce GTX 1070 OC Bios Desktop PC | |
| MSI GT62VR-6RE16H21 | |
| Asus GX800 Prototype | |
| Nvidia GeForce GTX 1060 Founders Edition 6 GB | |
| Schenker W504 | |
| Schenker W504 | |
| 1920x1080 Ultra Preset AA:SM | |
| MSI Gaming Z GeForce GTX 1070 OC Bios Desktop PC | |
| MSI GT62VR-6RE16H21 | |
| Asus GX800 Prototype | |
| Nvidia GeForce GTX 1060 Founders Edition 6 GB | |
| Schenker W504 | |
| Schenker W504 | |
| Need for Speed 2016 | |
| 3840x2160 High / On AA:FX | |
| MSI Gaming Z GeForce GTX 1070 OC Bios Desktop PC | |
| MSI GT62VR-6RE16H21 | |
| Asus GX800 Prototype | |
| Nvidia GeForce GTX 1060 Founders Edition 6 GB | |
| Schenker W504 | |
| Schenker W504 | |
| 1920x1080 Ultra / On AA:T | |
| MSI Gaming Z GeForce GTX 1070 OC Bios Desktop PC | |
| Nvidia GeForce GTX 1060 Founders Edition 6 GB | |
| Asus GX800 Prototype | |
| MSI GT62VR-6RE16H21 | |
| Schenker W504 | |
| Schenker W504 | |
| Hitman 2016 | |
| 3840x2160 High / On AA:FX AF:8x | |
| MSI Gaming Z GeForce GTX 1070 OC Bios Desktop PC | |
| MSI GT62VR-6RE16H21 | |
| Asus GX800 Prototype | |
| Nvidia GeForce GTX 1060 Founders Edition 6 GB | |
| Nvidia GeForce GTX 1060 Founders Edition 6 GB | |
| Schenker W504 | |
| Schenker W504 | |
| 1920x1080 Ultra / On AA:SM AF:16x | |
| MSI Gaming Z GeForce GTX 1070 OC Bios Desktop PC | |
| Asus GX800 Prototype | |
| MSI GT62VR-6RE16H21 | |
| Nvidia GeForce GTX 1060 Founders Edition 6 GB | |
| Nvidia GeForce GTX 1060 Founders Edition 6 GB | |
| Schenker W504 | |
| Schenker W504 | |
| The Division | |
| 3840x2160 High Preset AF:8x | |
| MSI Gaming Z GeForce GTX 1070 OC Bios Desktop PC | |
| MSI GT62VR-6RE16H21 | |
| Asus GX800 Prototype | |
| Nvidia GeForce GTX 1060 Founders Edition 6 GB | |
| 1920x1080 Ultra Preset AF:16x | |
| MSI Gaming Z GeForce GTX 1070 OC Bios Desktop PC | |
| MSI GT62VR-6RE16H21 | |
| Asus GX800 Prototype | |
| Nvidia GeForce GTX 1060 Founders Edition 6 GB | |
| Schenker W504 | |
| Schenker W504 | |
| Far Cry Primal | |
| 3840x2160 High Preset AA:SM | |
| MSI Gaming Z GeForce GTX 1070 OC Bios Desktop PC | |
| MSI GT62VR-6RE16H21 | |
| Asus GX800 Prototype | |
| Nvidia GeForce GTX 1060 Founders Edition 6 GB | |
| Schenker W504 | |
| Schenker W504 | |
| 1920x1080 Ultra Preset AA:SM | |
| MSI Gaming Z GeForce GTX 1070 OC Bios Desktop PC | |
| MSI GT62VR-6RE16H21 | |
| Asus GX800 Prototype | |
| Nvidia GeForce GTX 1060 Founders Edition 6 GB | |
| Schenker W504 | |
| Schenker W504 | |
| XCOM 2 | |
| 3840x2160 High Preset AA:FX AF:8x | |
| MSI Gaming Z GeForce GTX 1070 OC Bios Desktop PC | |
| MSI GT62VR-6RE16H21 | |
| Asus GX800 Prototype | |
| Nvidia GeForce GTX 1060 Founders Edition 6 GB | |
| 1920x1080 Maximum Preset (8xMSAA instead of FXAA) AA:8xMS AF:16x | |
| MSI Gaming Z GeForce GTX 1070 OC Bios Desktop PC | |
| MSI GT62VR-6RE16H21 | |
| Asus GX800 Prototype | |
| Nvidia GeForce GTX 1060 Founders Edition 6 GB | |
| Schenker W504 | |
| Schenker W504 | |
| Rise of the Tomb Raider | |
| 3840x2160 High Preset AA:FX AF:4x | |
| MSI Gaming Z GeForce GTX 1070 OC Bios Desktop PC | |
| MSI GT62VR-6RE16H21 | |
| Asus GX800 Prototype | |
| Nvidia GeForce GTX 1060 Founders Edition 6 GB | |
| Nvidia GeForce GTX 1060 Founders Edition 6 GB | |
| Schenker W504 | |
| Schenker W504 | |
| 1920x1080 Very High Preset AA:FX AF:16x | |
| MSI Gaming Z GeForce GTX 1070 OC Bios Desktop PC | |
| MSI GT62VR-6RE16H21 | |
| Asus GX800 Prototype | |
| Nvidia GeForce GTX 1060 Founders Edition 6 GB | |
| Nvidia GeForce GTX 1060 Founders Edition 6 GB | |
| Schenker W504 | |
| Schenker W504 | |
| Just Cause 3 | |
| 3840x2160 High / On AA:FX AF:8x | |
| MSI Gaming Z GeForce GTX 1070 OC Bios Desktop PC | |
| Nvidia GeForce GTX 1060 Founders Edition 6 GB | |
| Schenker W504 | |
| Schenker W504 | |
| 1920x1080 Very High / On AA:SM AF:16x | |
| MSI Gaming Z GeForce GTX 1070 OC Bios Desktop PC | |
| MSI GT62VR-6RE16H21 | |
| Nvidia GeForce GTX 1060 Founders Edition 6 GB | |
| Schenker W504 | |
| Schenker W504 | |
| Rainbow Six Siege | |
| 3840x2160 High Preset AA:T AF:4x | |
| MSI Gaming Z GeForce GTX 1070 OC Bios Desktop PC | |
| MSI GT62VR-6RE16H21 | |
| Nvidia GeForce GTX 1060 Founders Edition 6 GB | |
| Schenker W504 | |
| Schenker W504 | |
| 1920x1080 Ultra Preset AA:T AF:16x | |
| MSI Gaming Z GeForce GTX 1070 OC Bios Desktop PC | |
| MSI GT62VR-6RE16H21 | |
| Nvidia GeForce GTX 1060 Founders Edition 6 GB | |
| Schenker W504 | |
| Schenker W504 | |
| Assassin's Creed Syndicate | |
| 3840x2160 High Preset AA:FX | |
| MSI Gaming Z GeForce GTX 1070 OC Bios Desktop PC | |
| MSI GT62VR-6RE16H21 | |
| Schenker XMG U716 | |
| Nvidia GeForce GTX 1060 Founders Edition 6 GB | |
| Schenker W504 | |
| Schenker W504 | |
| 1920x1080 Ultra High Preset AA:4x MSAA + FX | |
| MSI Gaming Z GeForce GTX 1070 OC Bios Desktop PC | |
| MSI GT62VR-6RE16H21 | |
| Nvidia GeForce GTX 1060 Founders Edition 6 GB | |
| Schenker XMG U716 | |
| Schenker W504 | |
| Schenker W504 | |
| Star Wars Battlefront | |
| 3840x2160 High Preset AA:FX | |
| MSI Gaming Z GeForce GTX 1070 OC Bios Desktop PC | |
| MSI GT62VR-6RE16H21 | |
| Schenker XMG U716 | |
| Nvidia GeForce GTX 1060 Founders Edition 6 GB | |
| Schenker W504 | |
| Schenker W504 | |
| 1920x1080 Ultra Preset AA:FX | |
| MSI Gaming Z GeForce GTX 1070 OC Bios Desktop PC | |
| MSI GT62VR-6RE16H21 | |
| Schenker XMG U716 | |
| Nvidia GeForce GTX 1060 Founders Edition 6 GB | |
| Schenker W504 | |
| Schenker W504 | |
| Fallout 4 | |
| 3840x2160 High Preset AA:T AF:16x | |
| MSI Gaming Z GeForce GTX 1070 OC Bios Desktop PC | |
| MSI GT62VR-6RE16H21 | |
| Schenker XMG U716 | |
| Nvidia GeForce GTX 1060 Founders Edition 6 GB | |
| Schenker W504 | |
| Schenker W504 | |
| 1920x1080 Ultra Preset AA:T AF:16x | |
| MSI Gaming Z GeForce GTX 1070 OC Bios Desktop PC | |
| MSI GT62VR-6RE16H21 | |
| Schenker XMG U716 | |
| Nvidia GeForce GTX 1060 Founders Edition 6 GB | |
| Schenker W504 | |
| Schenker W504 | |
| Call of Duty: Black Ops 3 | |
| 3840x2160 High / On AA:FX | |
| MSI Gaming Z GeForce GTX 1070 OC Bios Desktop PC | |
| MSI GT62VR-6RE16H21 | |
| Schenker XMG U716 | |
| Nvidia GeForce GTX 1060 Founders Edition 6 GB | |
| Schenker W504 | |
| Schenker W504 | |
| 1920x1080 Extra / On AA:T2x SM | |
| MSI Gaming Z GeForce GTX 1070 OC Bios Desktop PC | |
| MSI GT62VR-6RE16H21 | |
| Schenker XMG U716 | |
| Nvidia GeForce GTX 1060 Founders Edition 6 GB | |
| Schenker W504 | |
| Schenker W504 | |
| Anno 2205 | |
| 3840x2160 High Preset AA:4x | |
| MSI Gaming Z GeForce GTX 1070 OC Bios Desktop PC | |
| MSI GT62VR-6RE16H21 | |
| Nvidia GeForce GTX 1060 Founders Edition 6 GB | |
| Schenker XMG U716 | |
| Schenker W504 | |
| Schenker W504 | |
| 1920x1080 Ultra High Preset AA:8x | |
| MSI Gaming Z GeForce GTX 1070 OC Bios Desktop PC | |
| MSI GT62VR-6RE16H21 | |
| Nvidia GeForce GTX 1060 Founders Edition 6 GB | |
| Schenker XMG U716 | |
| Schenker W504 | |
| Schenker W504 | |
| FIFA 16 | |
| 3840x2160 High Preset AA:2x MS | |
| MSI GT62VR-6RE16H21 | |
| Nvidia GeForce GTX 1060 Founders Edition 6 GB | |
| Schenker XMG U716 | |
| Schenker W504 | |
| Schenker W504 | |
| 1920x1080 High Preset AA:4x MS | |
| Nvidia GeForce GTX 1060 Founders Edition 6 GB | |
| Schenker XMG U716 | |
| MSI GT62VR-6RE16H21 | |
| Schenker W504 | |
| Schenker W504 | |
| Mad Max | |
| 3840x2160 High Preset AF:6x | |
| MSI Gaming Z GeForce GTX 1070 OC Bios Desktop PC | |
| Schenker XMG U716 | |
| Nvidia GeForce GTX 1060 Founders Edition 6 GB | |
| Schenker W504 | |
| Schenker W504 | |
| 1920x1080 Very High Preset AF:12x | |
| MSI Gaming Z GeForce GTX 1070 OC Bios Desktop PC | |
| MSI GT62VR-6RE16H21 | |
| Schenker XMG U716 | |
| Nvidia GeForce GTX 1060 Founders Edition 6 GB | |
| Schenker W504 | |
| Schenker W504 | |
| Batman: Arkham Knight | |
| 3840x2160 High / On (Interactive Smoke & Paper Debris Off) AA:SM AF:8x | |
| MSI GT62VR-6RE16H21 | |
| Schenker XMG U716 | |
| Nvidia GeForce GTX 1060 Founders Edition 6 GB | |
| Schenker W504 | |
| Schenker W504 | |
| 1920x1080 High / On AA:SM AF:16x | |
| MSI GT62VR-6RE16H21 | |
| Schenker XMG U716 | |
| Nvidia GeForce GTX 1060 Founders Edition 6 GB | |
| Schenker W504 | |
| Schenker W504 | |
| The Witcher 3 | |
| 3840x2160 High Graphics & Postprocessing (Nvidia HairWorks Off) | |
| MSI Gaming Z GeForce GTX 1070 OC Bios Desktop PC | |
| MSI GT62VR-6RE16H21 | |
| Schenker XMG U716 | |
| Nvidia GeForce GTX 1060 Founders Edition 6 GB | |
| Schenker W504 | |
| Schenker W504 | |
| 1920x1080 Ultra Graphics & Postprocessing (HBAO+) | |
| MSI GT62VR-6RE16H21 | |
| Nvidia GeForce GTX 1060 Founders Edition 6 GB | |
| Schenker XMG U716 | |
| Schenker W504 | |
| Schenker W504 | |
| Dirt Rally | |
| 3840x2160 High Preset | |
| MSI Gaming Z GeForce GTX 1070 OC Bios Desktop PC | |
| Nvidia GeForce GTX 1060 Founders Edition 6 GB | |
| Schenker XMG U716 | |
| Schenker W504 | |
| Schenker W504 | |
| 1920x1080 Ultra Preset AA:4x MS | |
| MSI Gaming Z GeForce GTX 1070 OC Bios Desktop PC | |
| Nvidia GeForce GTX 1060 Founders Edition 6 GB | |
| Schenker XMG U716 | |
| MSI GT62VR-6RE16H21 | |
| Schenker W504 | |
| Schenker W504 | |
| Dragon Age: Inquisition - 1920x1080 Ultra Graphics Quality AA:2x MS | |
| MSI Gaming Z GeForce GTX 1070 OC Bios Desktop PC | |
| MSI GT62VR-6RE16H21 | |
| Nvidia GeForce GTX 1060 Founders Edition 6 GB | |
| Schenker XMG U716 | |
| One K73-5N | |
| Alien: Isolation - 1920x1080 Ultra, On, Shadow Map 2048, HDAO AA:2x SM AF:16x | |
| MSI Gaming Z GeForce GTX 1070 OC Bios Desktop PC | |
| MSI GT62VR-6RE16H21 | |
| Schenker XMG U716 | |
| Nvidia GeForce GTX 1060 Founders Edition 6 GB | |
| One K73-5N | |
| Schenker XMG P505 | |
| Sims 4 - 1920x1080 Ultra Preset | |
| Nvidia GeForce GTX 1060 Founders Edition 6 GB | |
| Schenker XMG U716 | |
| One K73-5N | |
| MSI GT62VR-6RE16H21 | |
| Schenker XMG P505 | |
| GRID: Autosport - 1920x1080 Ultra Preset AA:4x MS | |
| Nvidia GeForce GTX 1060 Founders Edition 6 GB | |
| Schenker XMG U716 | |
| MSI GT62VR-6RE16H21 | |
| Schenker XMG P505 | |
| Watch Dogs - 1920x1080 Ultra Overall Quality, Ultra Textures AA:4x MS | |
| Nvidia GeForce GTX 1060 Founders Edition 6 GB | |
| Schenker XMG U716 | |
| MSI GT62VR-6RE16H21 | |
| One K73-5N | |
| Schenker XMG P505 | |
| Thief - 1920x1080 Very High Preset AA:FXAA & High SS AF:8x | |
| Schenker XMG U716 | |
| MSI GT62VR-6RE16H21 | |
| Schenker XMG P505 | |
| Battlefield 4 | |
| 3840x2160 High Preset | |
| MSI Gaming Z GeForce GTX 1070 OC Bios Desktop PC | |
| MSI GT62VR-6RE16H21 | |
| Schenker XMG U716 | |
| Schenker W504 | |
| Schenker W504 | |
| 1920x1080 Ultra Preset AA:4x MS | |
| MSI Gaming Z GeForce GTX 1070 OC Bios Desktop PC | |
| MSI GT62VR-6RE16H21 | |
| Schenker XMG U716 | |
| Schenker XMG P505 | |
| Metro: Last Light - 1920x1080 Very High (DX11) AF:16x | |
| MSI Gaming Z GeForce GTX 1070 OC Bios Desktop PC | |
| MSI GT62VR-6RE16H21 | |
| Schenker XMG U716 | |
| Schenker XMG P505 | |
| BioShock Infinite - 1920x1080 Ultra Preset, DX11 (DDOF) | |
| MSI Gaming Z GeForce GTX 1070 OC Bios Desktop PC | |
| MSI GT62VR-6RE16H21 | |
| Schenker XMG U716 | |
| Schenker XMG P505 | |
| Crysis 3 - 1920x1080 Very High Preset AA:2xSM AF:16x | |
| MSI Gaming Z GeForce GTX 1070 OC Bios Desktop PC | |
| MSI GT62VR-6RE16H21 | |
| Schenker XMG U716 | |
| Schenker XMG P505 | |
| basso | medio | alto | ultra | 4K | |
|---|---|---|---|---|---|
| Crysis 3 (2013) | 70.2 | ||||
| BioShock Infinite (2013) | 124 | ||||
| Metro: Last Light (2013) | 103.3 | ||||
| Battlefield 4 (2013) | 138 | 67.2 | |||
| Thief (2014) | 77 | ||||
| Watch Dogs (2014) | 67.1 | 57.7 | |||
| GRID: Autosport (2014) | 98.5 | 86.4 | |||
| Sims 4 (2014) | 118 | 112 | |||
| Alien: Isolation (2014) | 145 | 139 | |||
| Dragon Age: Inquisition (2014) | 114 | 92.7 | |||
| Dirt Rally (2015) | 86.1 | 84.7 | |||
| The Witcher 3 (2015) | 103 | 58 | 38.3 | ||
| Batman: Arkham Knight (2015) | 96 | 77 | 40 | ||
| Mad Max (2015) | 177 | 166 | |||
| FIFA 16 (2015) | 220 | 161 | |||
| Anno 2205 (2015) | 80.4 | 44.6 | 48.9 | ||
| Call of Duty: Black Ops 3 (2015) | 114 | 103 | 42.7 | ||
| Fallout 4 (2015) | 106 | 95.4 | 41.9 | ||
| Star Wars Battlefront (2015) | 140 | 128 | 49.9 | ||
| Assassin's Creed Syndicate (2015) | 66.4 | 45 | 35.6 | ||
| Rainbow Six Siege (2015) | 182 | 163 | 62.7 | ||
| Just Cause 3 (2015) | 100 | 96 | |||
| Rise of the Tomb Raider (2016) | 102 | 84.6 | 37.5 | ||
| XCOM 2 (2016) | 58.7 | 38.5 | 23.6 | ||
| Far Cry Primal (2016) | 84 | 78 | 36 | ||
| The Division (2016) | 94.3 | 75.7 | 37 | ||
| Hitman 2016 (2016) | 57.5 | 57.3 | 33 | ||
| Need for Speed 2016 (2016) | 88.3 | 69.2 | 47.8 | ||
| Doom (2016) | 123 | 117 | 45.6 | ||
| Overwatch (2016) | 235 | 147 | 78.7 | ||
| Mirror's Edge Catalyst (2016) | 101 | 92.4 | 36.4 |
Emissioni
Rumorosità di sistema
Considerando le eccellenti prestazioni, il GT62VR non è molto rumoroso – anzi quasi il contrario. 40 dB(A) in media con il 3DMark 06 e 46 dB(A) con carico massimo non sono molti rispetto a portatili Maxwell molto più lenti. L'MSI è anche più leggero rispetto ai concorrenti 15" Acer, Alienware, Gigabyte, e Schenker (guardate la tabella) nel nostro stress test con i tools FurMark and Prime95.
Un altro vantaggio è la velocità costante della ventola. Durante i nostri rilievi, le ventole non hanno mai pulsato. Ma abbiamo notato un leggero fischio di tanto in tanto, ma è accaduto solo in alcuni scenari di carico. Le ventole sono attive anche in idle, quindi di solito non sentirete l'hard drive; si sentirà un rumore solo con accessi intensivi.
Rumorosità
| Idle |
| 32 / 33 / 34 dB(A) |
| HDD |
| 33 dB(A) |
| Sotto carico |
| 40 / 46 dB(A) |
 | ||
30 dB silenzioso 40 dB(A) udibile 50 dB(A) rumoroso |
||
min: | ||
| MSI GT62VR-6RE16H21 GeForce GTX 1070 Mobile, 6700HQ | Gigabyte P55W v5 GeForce GTX 970M, 6700HQ | Acer Predator 15 G9-592-7925 GeForce GTX 970M, 6700HQ | Schenker XMG P506 PRO GeForce GTX 980M, 6820HK | Alienware 15 R2 (Skylake) GeForce GTX 980M, 6700HQ | |
|---|---|---|---|---|---|
| Noise | -5% | -0% | -3% | -3% | |
| off /ambiente * (dB) | 30 | 30 -0% | |||
| Idle Minimum * (dB) | 32 | 33 -3% | 31 3% | 32 -0% | 33.6 -5% |
| Idle Average * (dB) | 33 | 34 -3% | 32 3% | 33 -0% | 33.8 -2% |
| Idle Maximum * (dB) | 34 | 35 -3% | 36 -6% | 37 -9% | 34 -0% |
| Load Average * (dB) | 40 | 43 -8% | 40 -0% | 41 -2% | 39.3 2% |
| Load Maximum * (dB) | 46 | 49 -7% | 47 -2% | 49 -7% | 51.4 -12% |
* ... Meglio usare valori piccoli
Temperature
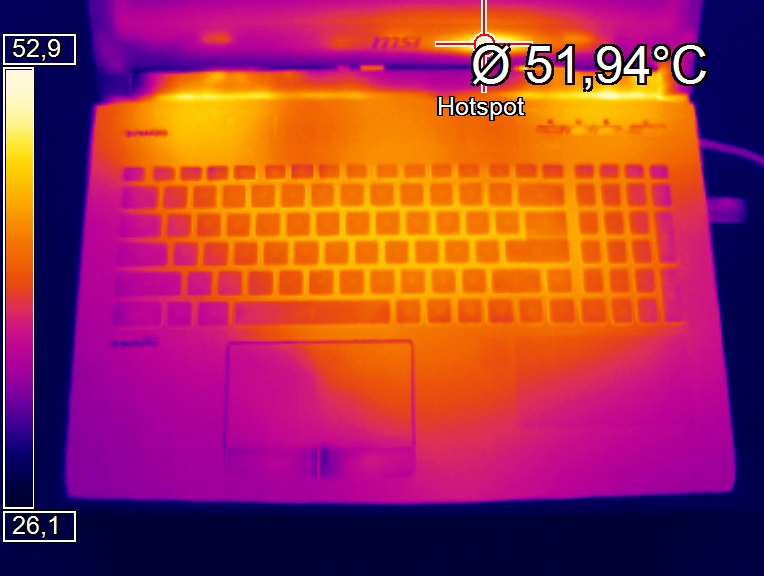
Le temperature del GT62VR ci ricordano altri portatili high-end. Fino a 44 °C sul lato superiore e fino a 53 °C sul lato inferiore sono nella media con altri portatili da 15". MSI potrebbe migliorare la distribuzione del calore. I punti di appoggio dei polsi raggiungono oltre 35 °C durante le pesanti applicazioni 3D. Alcuni portatili gaming si fermano ad appena 25-30 °C in questi punti.
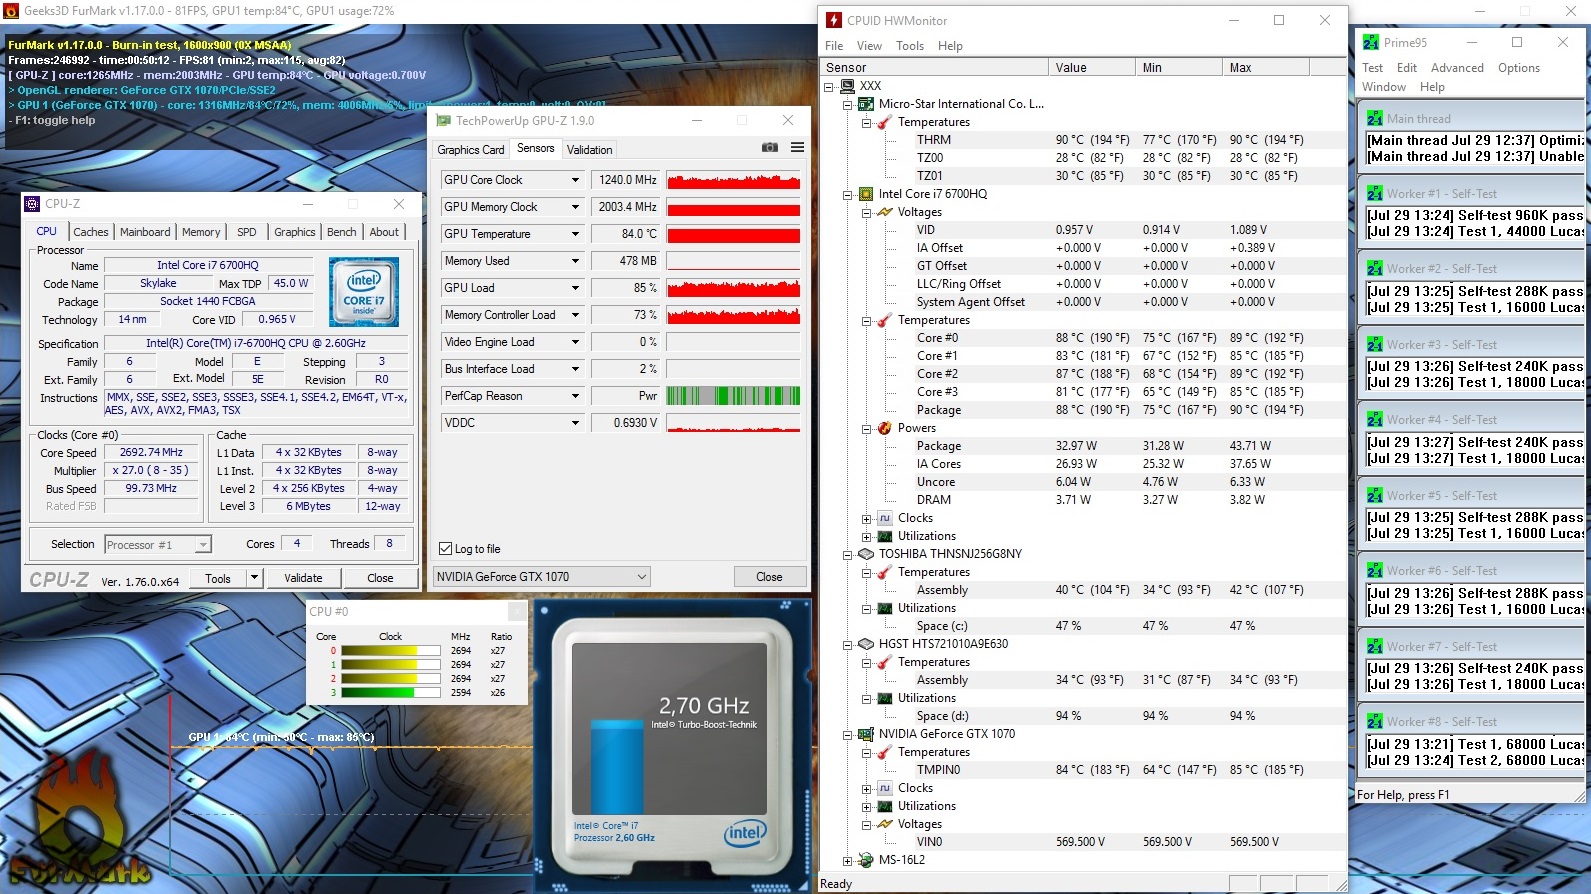
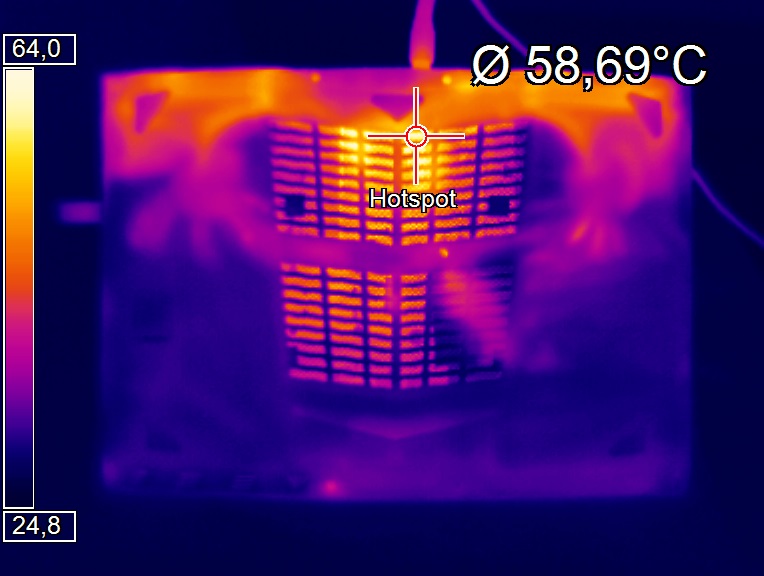
I componenti hanno avuto più problemi con il nostro stress test. Dopo un'ora di carico massimo, la GeForce GTX 1070 si è attestata ad 84 °C. Tuttavia, la GPU ha avuto throttling (~1240 MHz) in scenari estremi. L'Intel Core i7-6700HQ non ha avuto throttling, ma si è scaldato fino ad arrivare a 90 °C.
(±) La temperatura massima sul lato superiore è di 44 °C / 111 F, rispetto alla media di 40.4 °C / 105 F, che varia da 21.2 a 68.8 °C per questa classe Gaming.
(-) Il lato inferiore si riscalda fino ad un massimo di 53.1 °C / 128 F, rispetto alla media di 43.2 °C / 110 F
(+) In idle, la temperatura media del lato superiore è di 28 °C / 82 F, rispetto alla media deld ispositivo di 33.9 °C / 93 F.
(±) I poggiapolsi e il touchpad possono diventare molto caldi al tatto con un massimo di 39.4 °C / 102.9 F.
(-) La temperatura media della zona del palmo della mano di dispositivi simili e'stata di 28.8 °C / 83.8 F (-10.6 °C / -19.1 F).
| MSI GT62VR-6RE16H21 GeForce GTX 1070 Mobile, 6700HQ | Gigabyte P55W v5 GeForce GTX 970M, 6700HQ | Acer Predator 15 G9-592-7925 GeForce GTX 970M, 6700HQ | Schenker XMG P506 PRO GeForce GTX 980M, 6820HK | Alienware 15 R2 (Skylake) GeForce GTX 980M, 6700HQ | |
|---|---|---|---|---|---|
| Heat | -2% | 14% | -16% | -12% | |
| Maximum Upper Side * (°C) | 44 | 50 -14% | 42.6 3% | 53 -20% | 48 -9% |
| Maximum Bottom * (°C) | 53.1 | 57.7 -9% | 38.7 27% | 58 -9% | 57.3 -8% |
| Idle Upper Side * (°C) | 28.8 | 25.7 11% | 27.2 6% | 33.7 -17% | 31.9 -11% |
| Idle Bottom * (°C) | 28.2 | 27.2 4% | 22.8 19% | 33.2 -18% | 33.4 -18% |
* ... Meglio usare valori piccoli
Casse
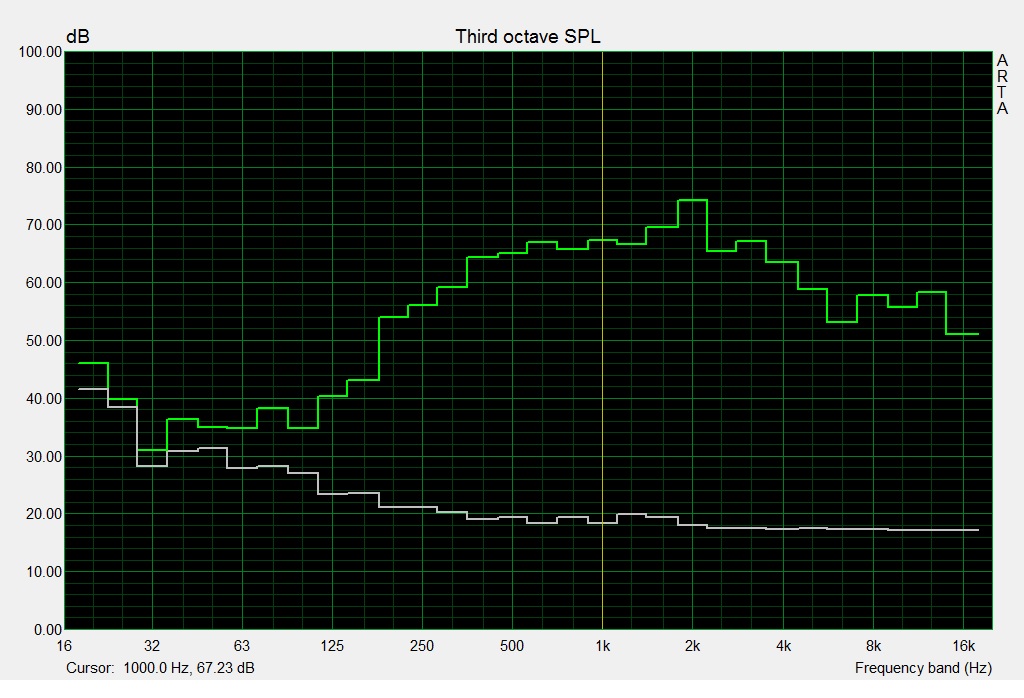
Il sistema 2.1 Dynaudio crea un buon suono unitamente al Nahimic Sound Enhancer. MSI usa due casse ed un subwoofer sul lato frontale ed inferiore del GT62VR, rispettivamente. Grazie al subwoofer, questo 15" crea dei bassi relativamente buoni. Il volume massimo è buono e sufficiente per stanze medio-grandi.
Sulla base della nostra esperienza, non occorrono casse esterne o cuffie - diversamente da molti altri portatili. Giochi, videos e musica sono abbastanza buoni.
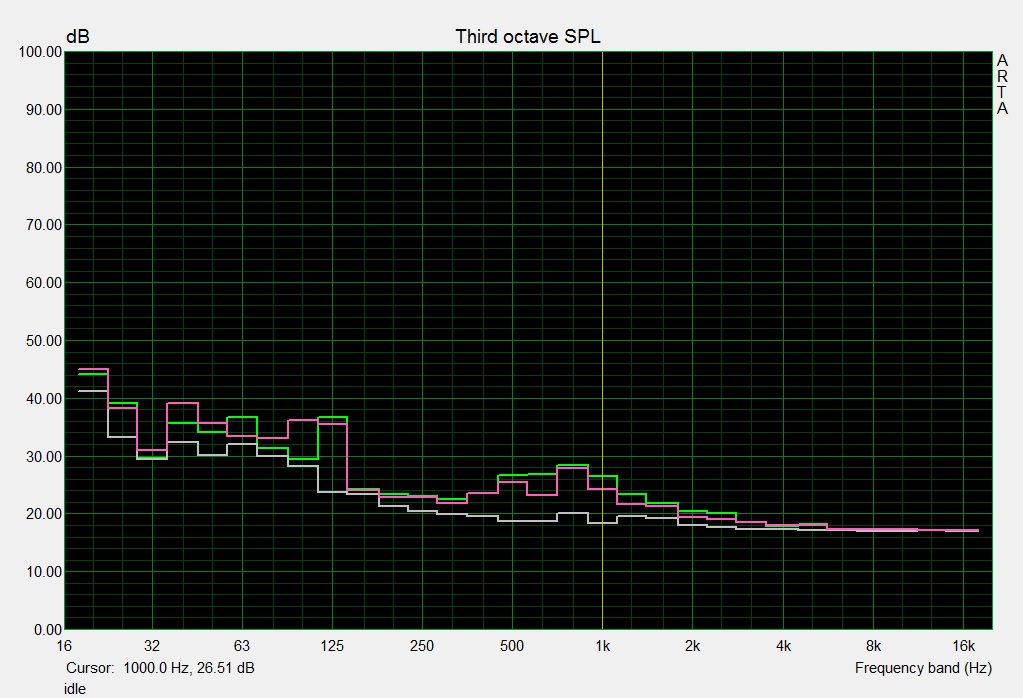
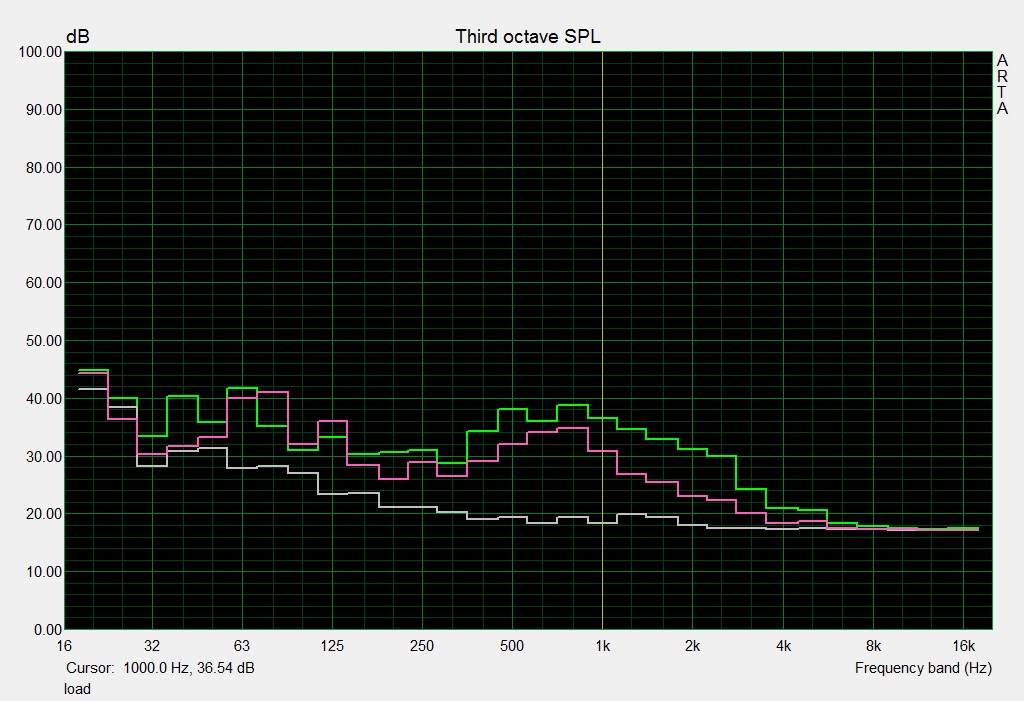
MSI GT62VR-6RE16H21 analisi audio
(±) | potenza degli altiparlanti media ma buona (79 dB)
Bassi 100 - 315 Hz
(±) | bassi ridotti - in media 11.3% inferiori alla media
(±) | la linearità dei bassi è media (11.4% delta rispetto alla precedente frequenza)
Medi 400 - 2000 Hz
(±) | medi elevati - circa 8.3% superiore alla media
(+) | medi lineari (5.7% delta rispetto alla precedente frequenza)
Alti 2 - 16 kHz
(+) | Alti bilanciati - appena 4.3% dalla media
(±) | la linearità degli alti è media (11% delta rispetto alla precedente frequenza)
Nel complesso 100 - 16.000 Hz
(±) | la linearità complessiva del suono è media (20.5% di differenza rispetto alla media
Rispetto alla stessa classe
» 73% di tutti i dispositivi testati in questa classe è stato migliore, 5% simile, 22% peggiore
» Il migliore ha avuto un delta di 6%, medio di 18%, peggiore di 132%
Rispetto a tutti i dispositivi testati
» 54% di tutti i dispositivi testati in questa classe è stato migliore, 8% similare, 38% peggiore
» Il migliore ha avuto un delta di 4%, medio di 23%, peggiore di 134%
Frequency Comparison (Checkboxen select/deselectable!)
Graph 1: Pink Noise 100% Vol.; Graph 2: Audio off
Gestione Energetica
Consumo energetico
Poiché il GT62VR non supporta lo switching grafico, abbiamo consumi molto più alti rispetto ai dispositivi con Optimus. 40-46 Watts in idle sono tuttavia ancora ragionevoli a nostro parere.
Il GT62VR merita una lode per i consumi sotto carico. Circa 100 Watts nella prima scena di 3DMark 06 e fino a 202 Watts nello stress test sono abbastanza a primo impatto, ma il GT62VR consuma davvero poco considerando le prestazioni. Il consumo è quasi alla pari con l'Alienware 15 R2, ma la sua GTX 980M non ha chance contro la GTX 1070. Pascal di conseguenza non è solo veloce, ma anche abbastanza efficiente.
| Off / Standby | |
| Idle | |
| Sotto carico |
|
Leggenda:
min: | |
| MSI GT62VR-6RE16H21 GeForce GTX 1070 Mobile, 6700HQ | Gigabyte P55W v5 GeForce GTX 970M, 6700HQ | Acer Predator 15 G9-592-7925 GeForce GTX 970M, 6700HQ | Schenker XMG P506 PRO GeForce GTX 980M, 6820HK | Alienware 15 R2 (Skylake) GeForce GTX 980M, 6700HQ | |
|---|---|---|---|---|---|
| Power Consumption | 39% | 26% | 12% | 24% | |
| Idle Minimum * (Watt) | 20 | 9 55% | 12 40% | 15 25% | 11.4 43% |
| Idle Average * (Watt) | 26 | 13 50% | 16 38% | 20 23% | 16.5 37% |
| Idle Maximum * (Watt) | 32 | 17 47% | 22 31% | 27 16% | 22 31% |
| Load Average * (Watt) | 100 | 81 19% | 96 4% | 98 2% | 94.2 6% |
| Load Maximum * (Watt) | 202 | 152 25% | 166 18% | 210 -4% | 192.2 5% |
* ... Meglio usare valori piccoli
Autonomia della batteria
L'assenza della tecnologia Nvidia Optimus impatta innanzitutto sull'autonomia. La batteria fissa da 8-celle (75 Wh, 5225 mAh) in modalità power-saving e con luminosità minima del display dura 5 ore nel nostro test idle. Circa 4 ore per il web browsing (luminosità media) non sono molte. La concorrenza Maxwell arriva tra 4,5 ed 8 ore.
| MSI GT62VR-6RE16H21 75.24 Wh | Gigabyte P55W v5 61 Wh | Acer Predator 15 G9-592-7925 Wh | Schenker XMG P506 PRO 60 Wh | Alienware 15 R2 (Skylake) 96 Wh | |
|---|---|---|---|---|---|
| Autonomia della batteria | 48% | 93% | 5% | 85% | |
| Reader / Idle (h) | 5 | 10.1 102% | 5.2 4% | 12.8 156% | |
| WiFi v1.3 (h) | 4.1 | 5.8 41% | 7.9 93% | 4.5 10% | 7.4 80% |
| Load (h) | 1.6 | 1.6 0% | 1.6 0% | 1.9 19% | |
| H.264 (h) | 5.5 | 3.6 | 7.6 |
Pro
Contro
Giudizio Complessivo
MSI in genere offre quello che vogliono i gamers. Oltre ad un processore quad-core, ci sono 16 GB DDR4-RAM ed un Solid State Drive, ed una GPU high-end con capacità 4K e VR. La Nvidia GeForce GTX 1070 è ciò che si desidera sia come desktop che come versione mobile. L'architettura Pascal impressiona per le eccellenti performance unitamente all'elevata efficienza.
Il display Full-HD IPS, il suono ed i dispositivi di input non sono male. E la situazione è simile per la varietà di porte, sebbene alcuni utenti sentiranno la mancanza di Thunderbolt 3 ed HDMI 2.0. Il sistema di raffreddamento è abbastanza potente considerato l'hardware, e rumorosità e temperature sono decenti.
Gli utenti avranno solo qualche pecca in termini di autonomia (manca lo switching grafico).
Poiché il GT62VR pesa poco meno di tre kg, si colloca in una buona posizione della nostra Top 10 di dispositivi mobile gaming.
MSI GT62VR-6RE16H21
- 08/19/2016 v5.1 (old)
Florian Glaser
Price comparison
