

Notebookcheck Logo
Teaser

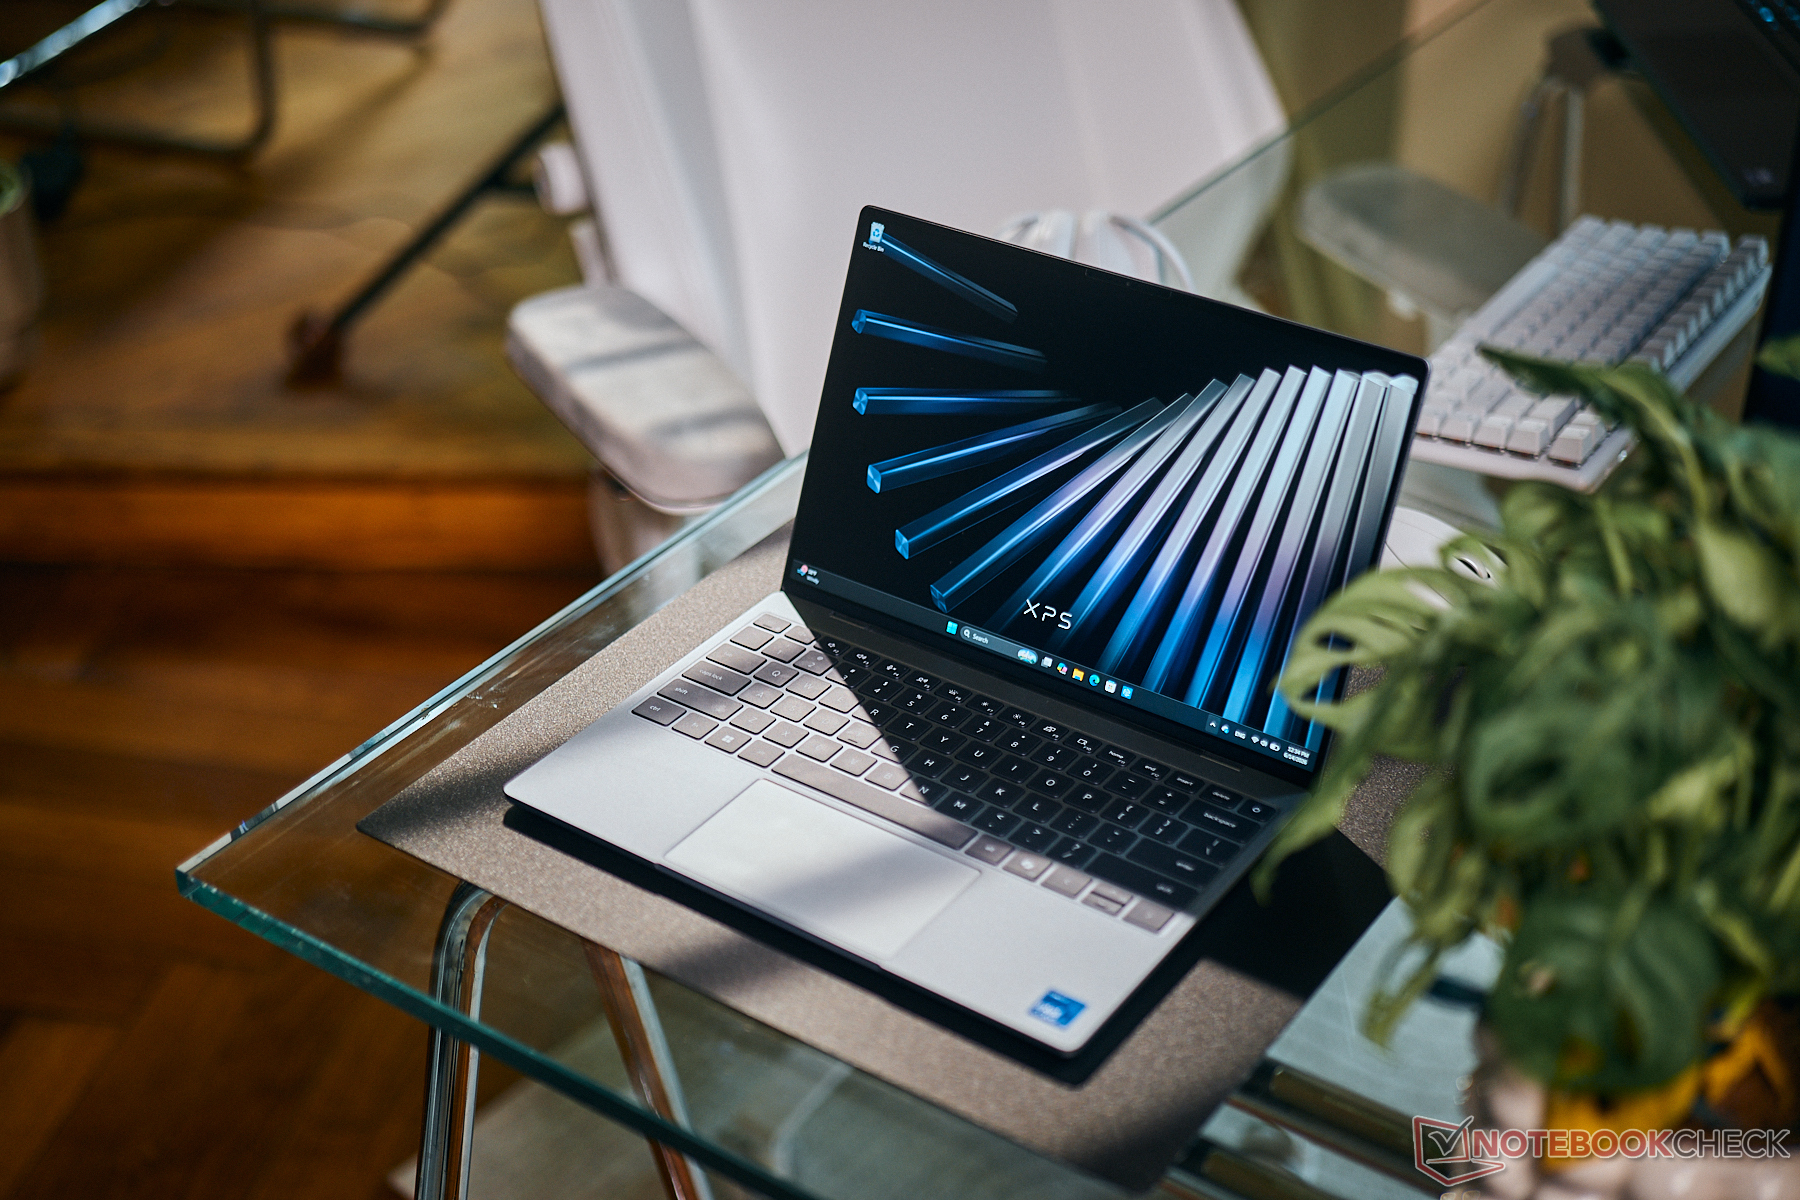
Recensione del Dell XPS 13 Wildcat Lake: ridefinire la categoria dei PC Windows economici

Il lusso a prezzi accessibili.

L’XPS 13 è ora disponibile a un prezzo notevolmente ridotto per attirare gli utenti con budget più limitati. I inevitabili tagli alle specifiche compromettono il prestigio del marchio XPS o si tratta del nuovo portatile sotto i 1.000 dollari da battere?
Allen Ngo, 👁 Allen Ngo (traduzione a cura di DeepL / Ninh Duy) Pubblicato 🇺🇸 🇳🇱 ...
Laptop / Notebook XPS Wildcat Lake Intel

Verdetto — Un aspetto di alta gamma senza il prezzo di alta gamma

La scelta di un portatile Windows economico comporta spesso compromessi significativi, tra cui un design poco accattivante e schermi di qualità inferiore. Il nuovo XPS 13 risponde direttamente a queste preoccupazioni, affermandosi senza difficoltà come uno dei portatili Windows da 13 pollici più eleganti nella fascia di prezzo inferiore ai 1.000 dollari. Il modello sembra e appare più costoso di quanto non sia in realtà, superando senza sforzo i diretti concorrenti come l’HP Pavilion o il Lenovo IdeaPad 3 o 5, i cui design possono dare l’impressione di essere stati concepiti come un ripensamento, al fine di valorizzare le loro alternative più attraenti e costose. Anche il display del Dell è davvero sorprendente: non troverete un touchscreen da 2,5K con gamma cromatica P3 completa di questa qualità su nessun altro portatile con un prezzo inferiore a 700 dollari.

Probabilmente i due principali compromessi del nuovo XPS 13 riguardano le prestazioni e la rigidità del telaio. La CPU Core 5 320 a basso consumo e i limitati 8 GB di RAM faticano a gestire la maggior parte delle applicazioni al di fuori di browser, elaboratori di testi o fogli di calcolo. Si consiglia di prendere in considerazione la configurazione da 16 GB per garantire una maggiore autonomia, che fortunatamente mantiene il modello al di sotto dei 1.000 dollari. Il nuovo design, pur essendo più leggero e migliore rispetto alla maggior parte degli altri PC Windows nella stessa fascia di prezzo, risulta più fragile rispetto al tradizionale e solido design dell’XPS 13 di un tempo. Ciononostante, l’XPS 13 non è mai stato così allettante per le esigenze di base degli studenti e per l’utilizzo multimediale.

Pro

+ leggero e accattivante, soprattutto considerando il prezzo
+ eccellente touchscreen a 120 Hz con gamma cromatica P3
+ standard Wi-Fi 7 e Bluetooth 6
+ lunga durata della batteria; basso consumo energetico
+ conveniente, ben al di sotto dei 1000 dollari

Contro

- Gli 8 GB di RAM a canale singolo e non espandibile limitano la versatilità
- lo chassis è più fragile rispetto ai modelli XPS 13 precedenti
- tempi di risposta in bianco e nero relativamente lenti
- prestazioni grafiche molto limitate
- il tasto Spazio può risultare un po’ molle

Prezzo e disponibilità

Dell sta attualmente commercializzando l’XPS 13 nella configurazione descritta in questa recensione al prezzo di soli 700 dollari.

Amazon Logo
$1,399.99
Dell XPS 14 Premium Laptop DA14250-14.5-inch Touch 3.2K OLED 48-120Hz Display, Intel Core Ultra 7 255H, Intel Arc Graphics, 32GB Memory, 1TB SSD, Backlit English Keyboard with Fingerprint Reader

A differenza degli XPS 14 e XPS 16, l’XPS 13 del 2026 è stato riprogettato da zero per offrire un prezzo di partenza notevolmente inferiore, pari a soli 699 dollari o addirittura 599 dollari con gli sconti riservati al settore dell’istruzione. Questa mossa è particolarmente degna di nota, poiché la serie XPS ha sempre ospitato modelli prosumer più costosi, spesso venduti al dettaglio a un prezzo doppio o triplo.

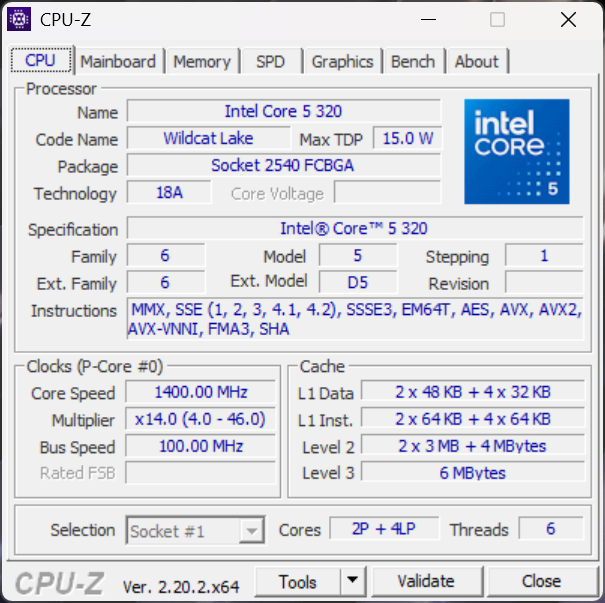
Il nostro modello di prova presenta la configurazione più basilare, con CPU Intel Wildcat Core 5 320 e 8 GB di RAM saldata. Raddoppiare la RAM comporta un aumento di prezzo di 200 dollari, ma al momento tutti i modelli vengono forniti con memoria a canale singolo e lo stesso touchscreen IPS da 120 Hz con risoluzione 2560 x 1600. L’opzione più veloce, il Core Ultra 7 355, è prevista per le configurazioni future.

L’Intel Wildcat XPS 13 è stato progettato per essere l’alternativa Windows al popolarissimo MacBook Neo. Tra gli altri concorrenti figurano modelli orientati al risparmio come la serie Lenovo IdeaPad 3, la serie HP Pavilion e altri portatili economici in vendita a meno di 1.000 dollari.

Altre recensioni Dell:

Specifiche

Dell XPS 13 DX13260
Processore
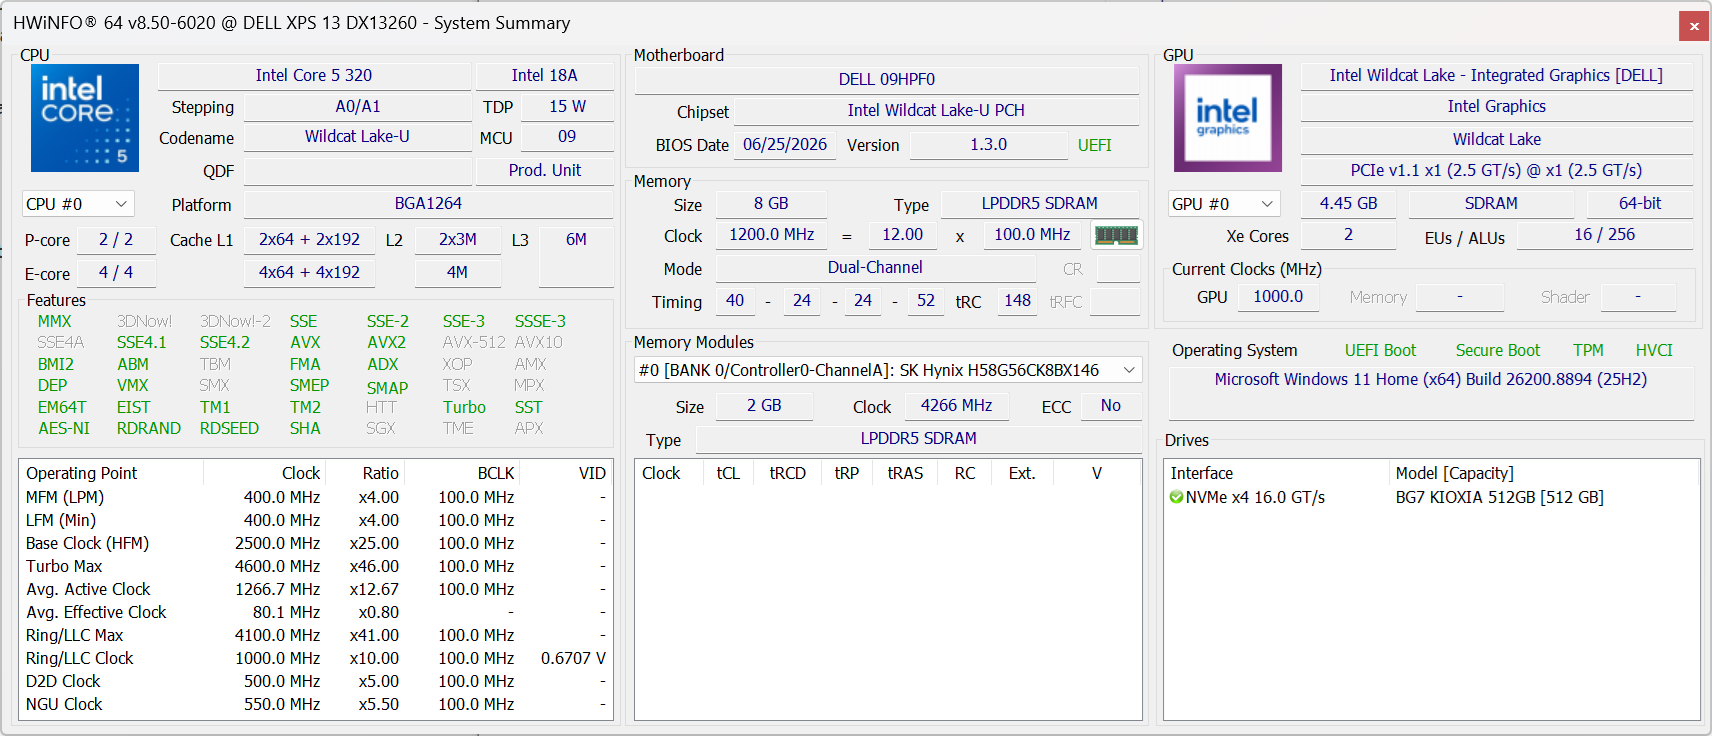
Intel Core 5 320 6c/6t, 2 x 4.6 GHz Intel Cougar Cove P-Core, 4 x 3.4 GHz Intel Darkmont LP E-Core, 37 W PL2 / Short Burst, 18 W PL1 / Sustained, Wildcat Lake
Scheda grafica
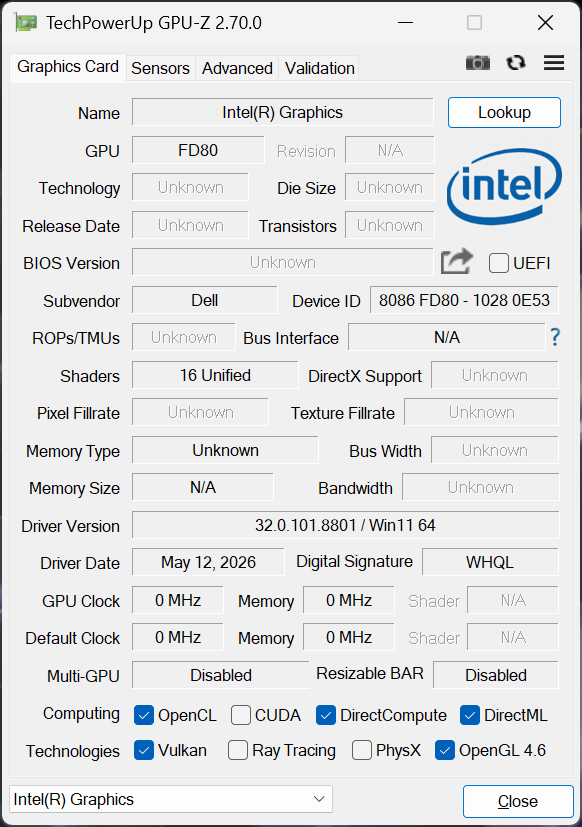
Intel Graphics 2 Xe3 Wildcat Lake iGPU, Core: 2500 MHz, LPDDR5x, 32.0.101.8801
Memoria
8 GB 
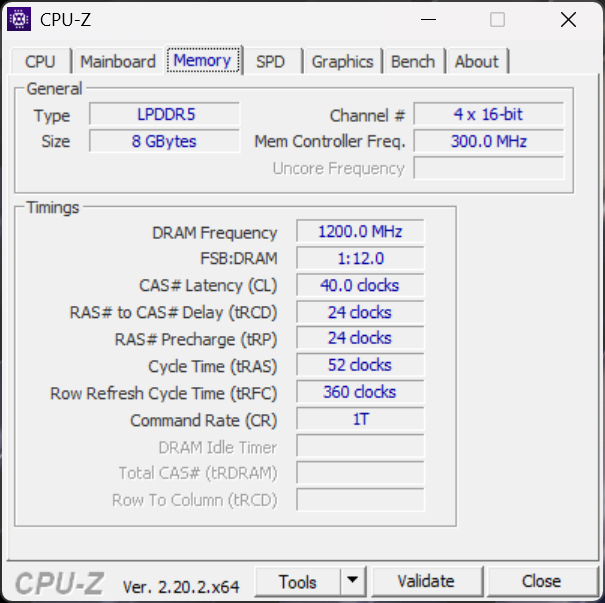
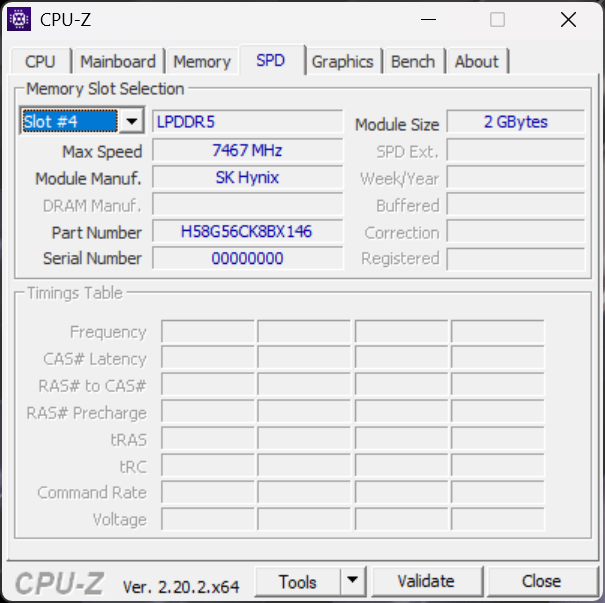
, LPDDR5x-7467, Single-Channel, Soldered
Schermo
13.40 pollici 16:10, 2560 x 1600 pixel 225 PPI, 10-point capacitive, LG Philips LP134WQ, IPS, Dell P/N: RNYV4, lucido: no, 120 Hz
Scheda madre
Intel Wildcat Lake-U PCH
Scheda audio
Intel Wildcat Lake-U PCH - High Definition Audio - AVS (Audio, Video, Speech)
Porte di connessione
2 USB 3.1 Gen 2, USB-C Power Delivery (PD), 2 DisplayPort, Sensore luminosità
Rete
Intel Wi-Fi 7 BE213 160MHz ( be = Wi-Fi 7), Bluetooth 6.0
Dimensioni
altezza x larghezza x profondità (in mm): 12.7 x 296.9 x 200.66
Batteria
52 Wh polimeri di litio
Sistema Operativo
Microsoft Windows 11 Home
Camera
Webcam: 1080p30, IR
Fotocamera Principale: 2 MPix
Altre caratteristiche
Casse: Quad (2x 2 W main + 2x 2 W tweeter), Tastiera: Chiclet, Illuminazione Tastiera: si, Dell Optimizer, 12 Mesi Garanzia
Peso
1.062 kg, Alimentazione: 166 gr
Prezzo
700 USD
Amazon
Nota: il produttore potrebbe usare componenti di fornitori diversi pannelli dei diplay, drive o banchi di memoria con specifiche simili.


Caso

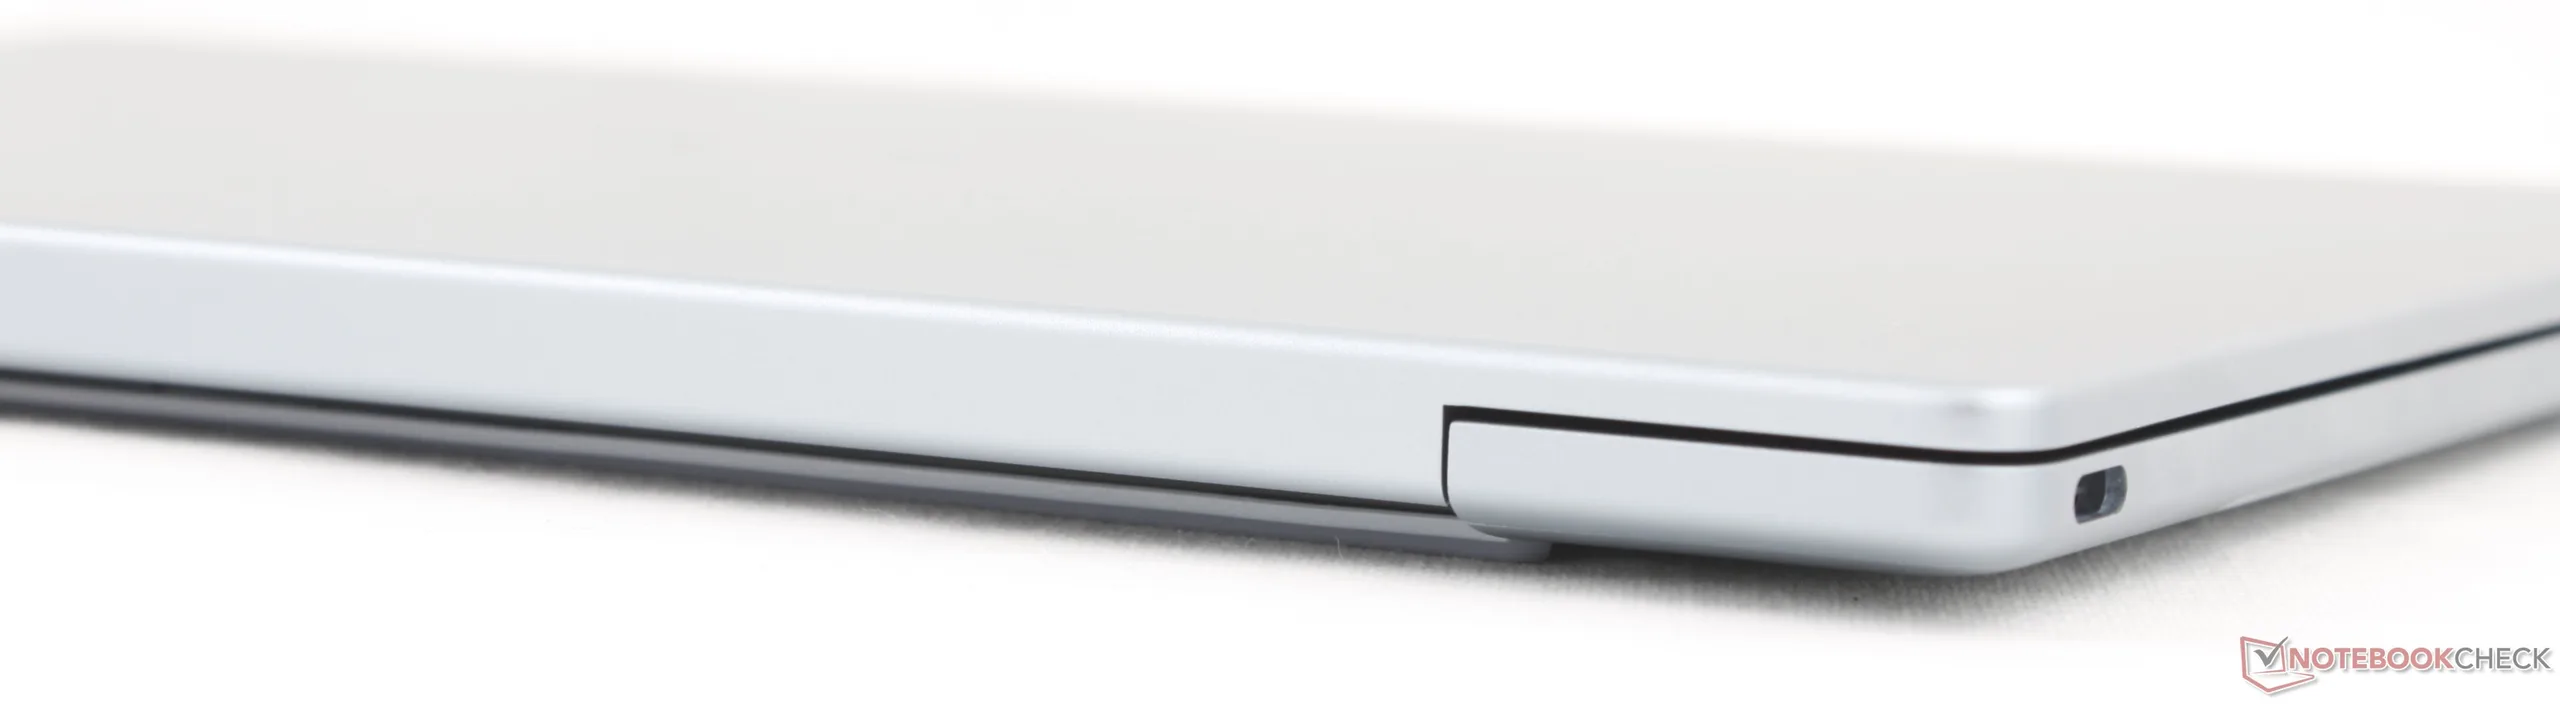
L’XPS 13 del 2026 è ancora più sottile e leggero rispetto all’XPS 13 del 2024. Da chiuso, sembra una versione in miniatura del recente restyling dell’XPS 16. I modelli XPS 13 più datati e pesanti sono tuttavia meno soggetti a deformazioni rispetto a questa ultima versione; pertanto, la riduzione delle dimensioni e del peso ha probabilmente influito sulla rigidità.
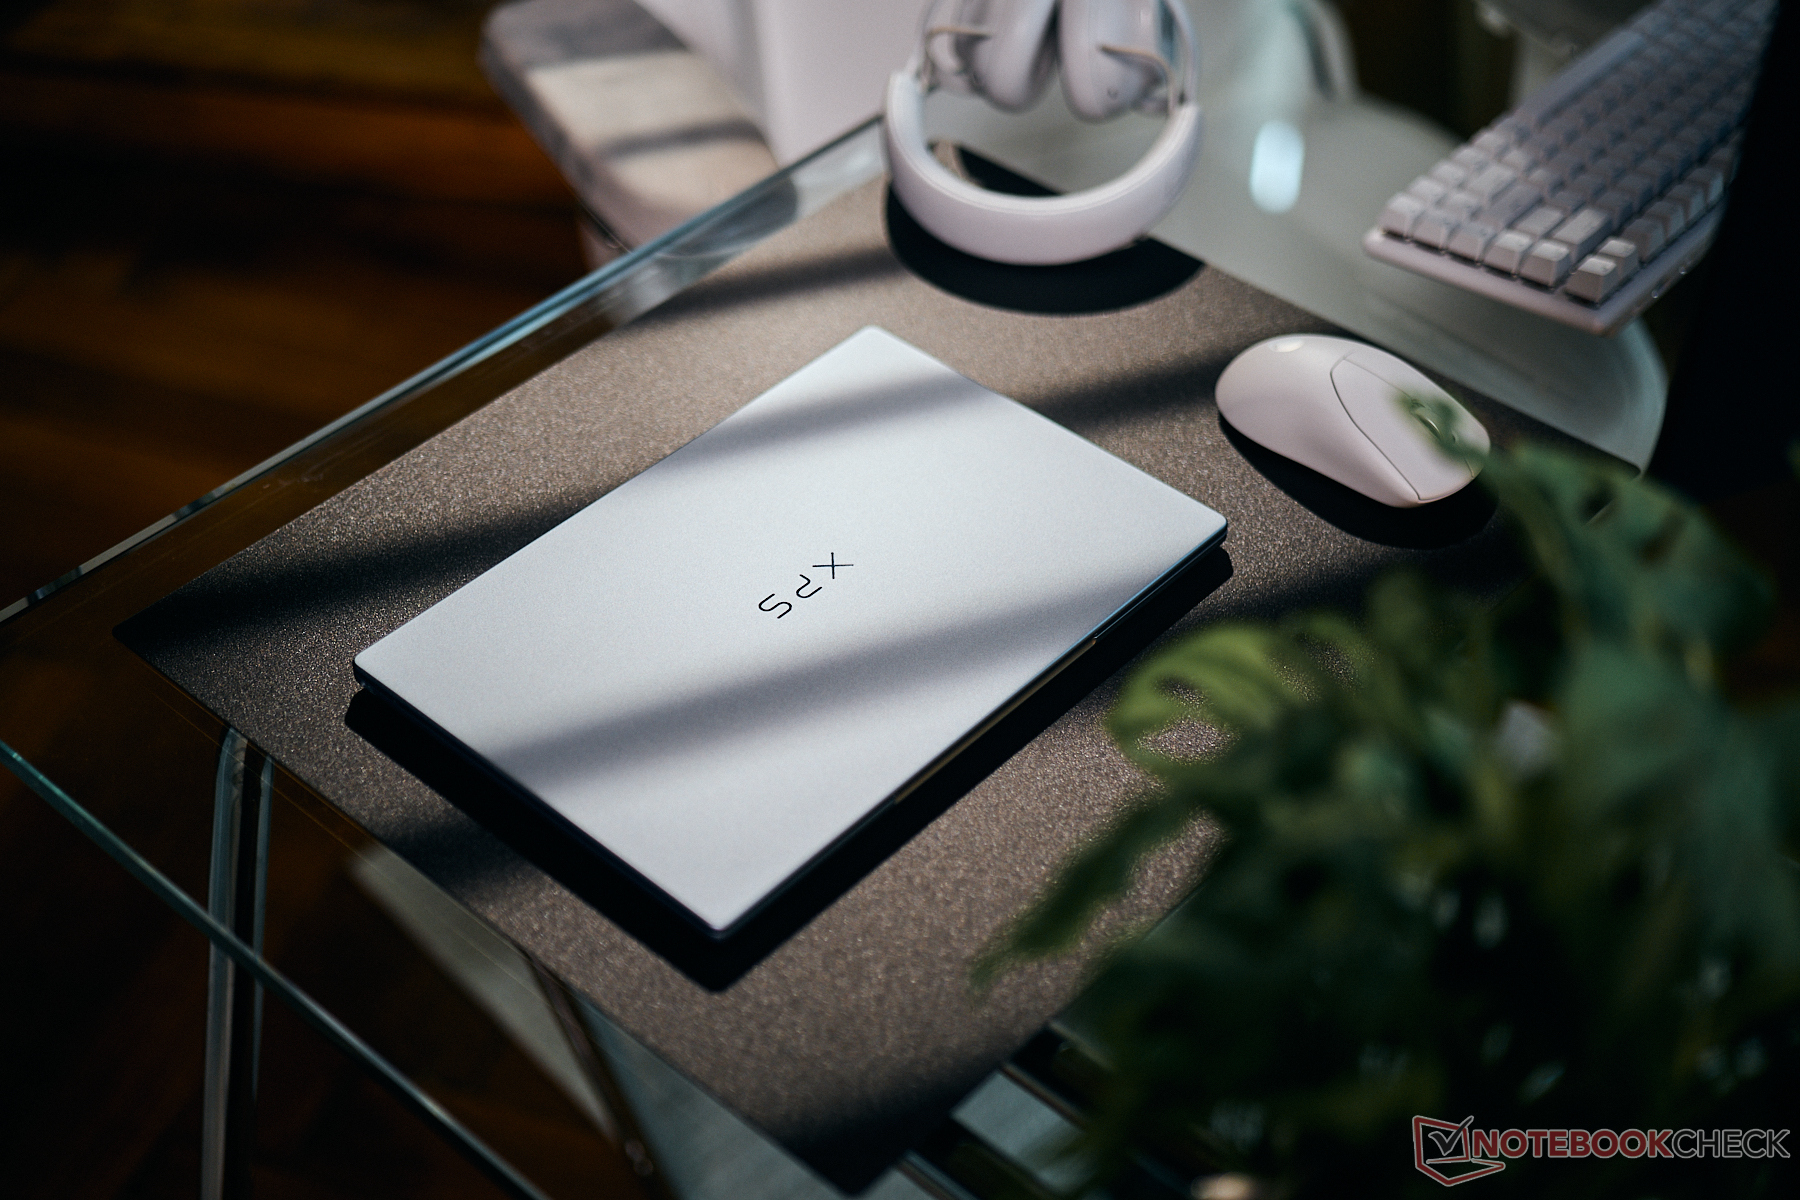
Confronto delle dimensioni

313.5 mm 219.3 mm 16.8 mm 1.1 kg309.52 mm 209.71 mm 14.62 mm 1.4 kg297 mm 211 mm 17.6 mm 1 kg295.3 mm 199.1 mm 15.3 mm 1.2 kg297.5 mm 206.4 mm 12.7 mm 1.2 kg296.9 mm 200.66 mm 12.7 mm 1.1 kg297 mm 210 mm 1 mm 5.7 g

Connettività

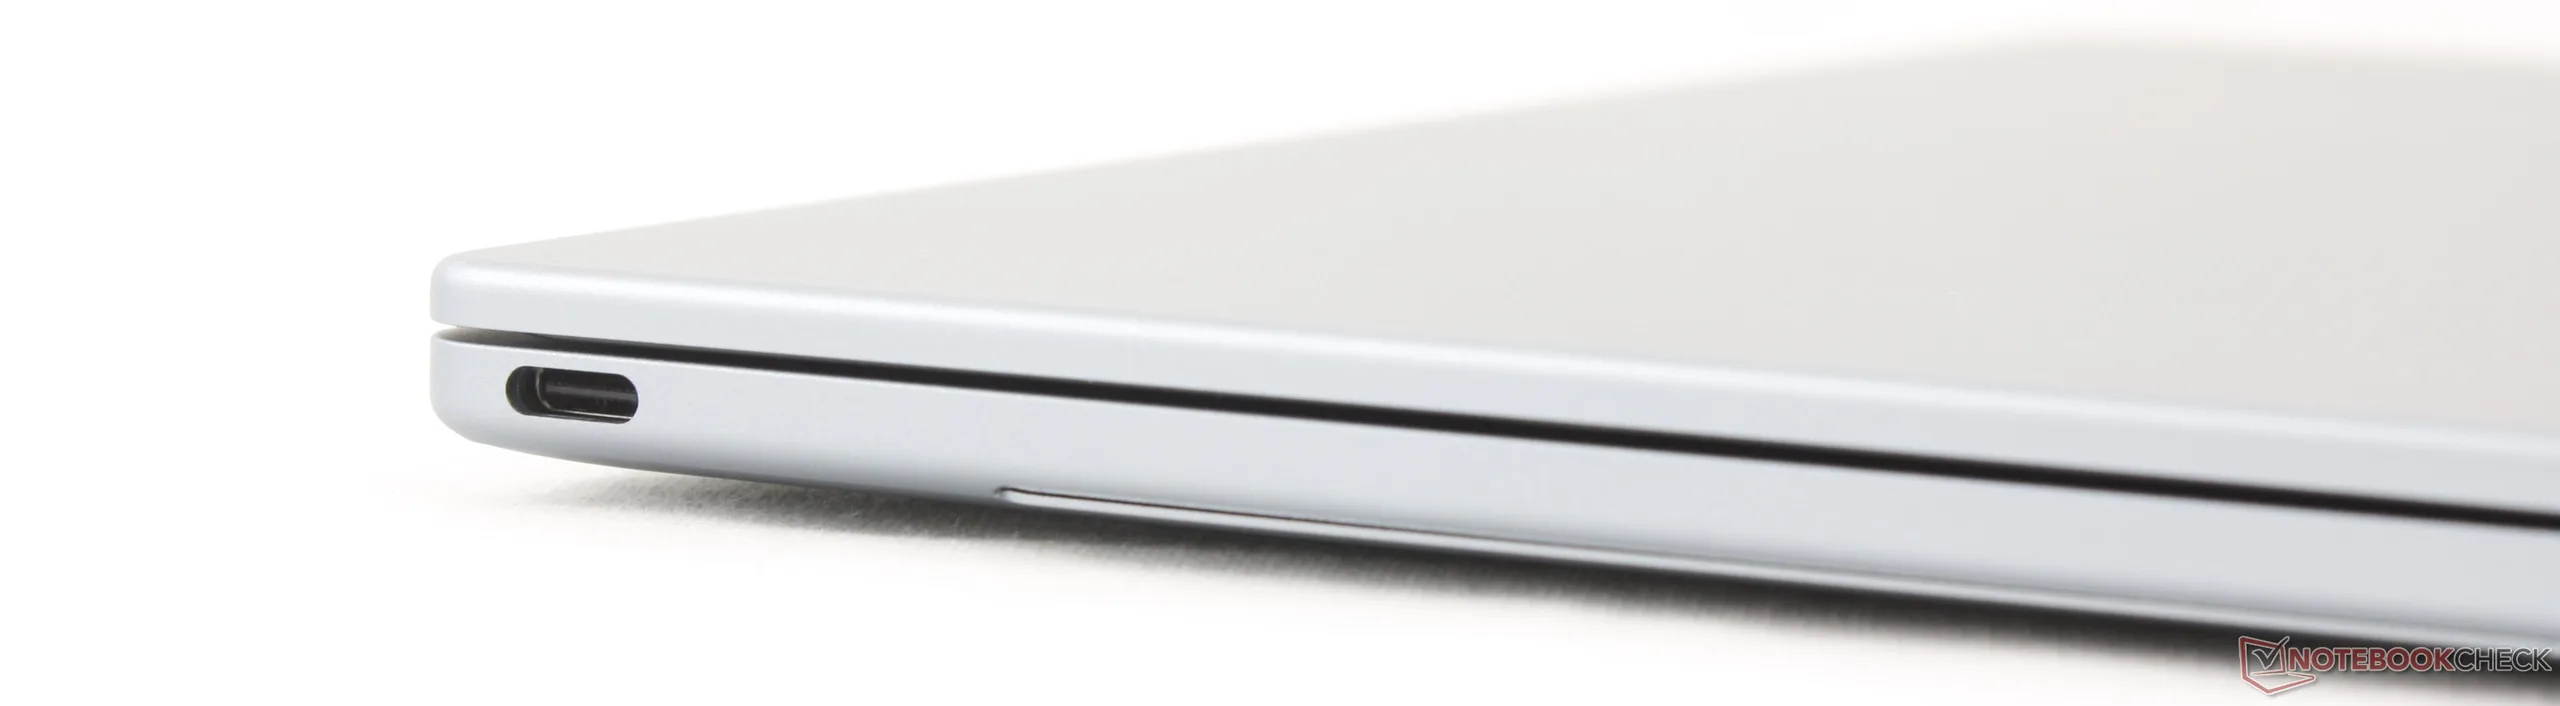
I modelli Core Ultra sono dotati di Thunderbolt 4 a 40 Gbps, mentre i modelli Core non Ultra di fascia inferiore dispongono solo di USB-C 3.2 a 10 Gbps.
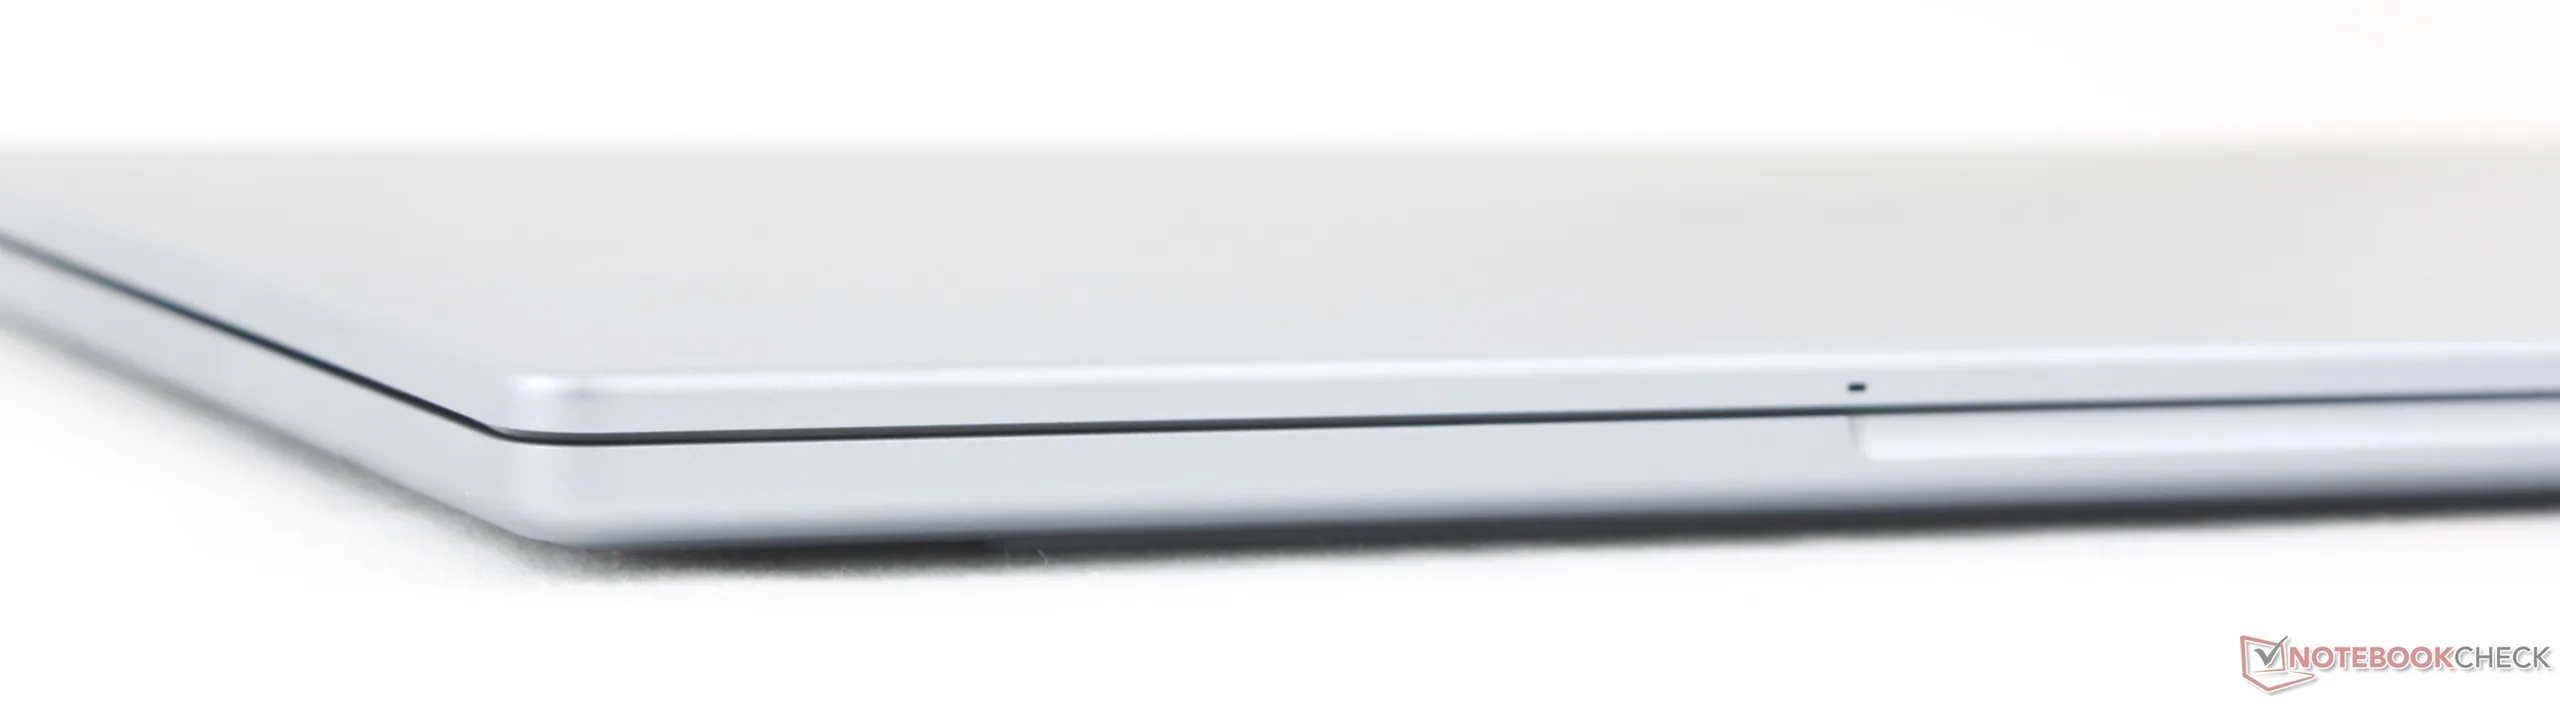
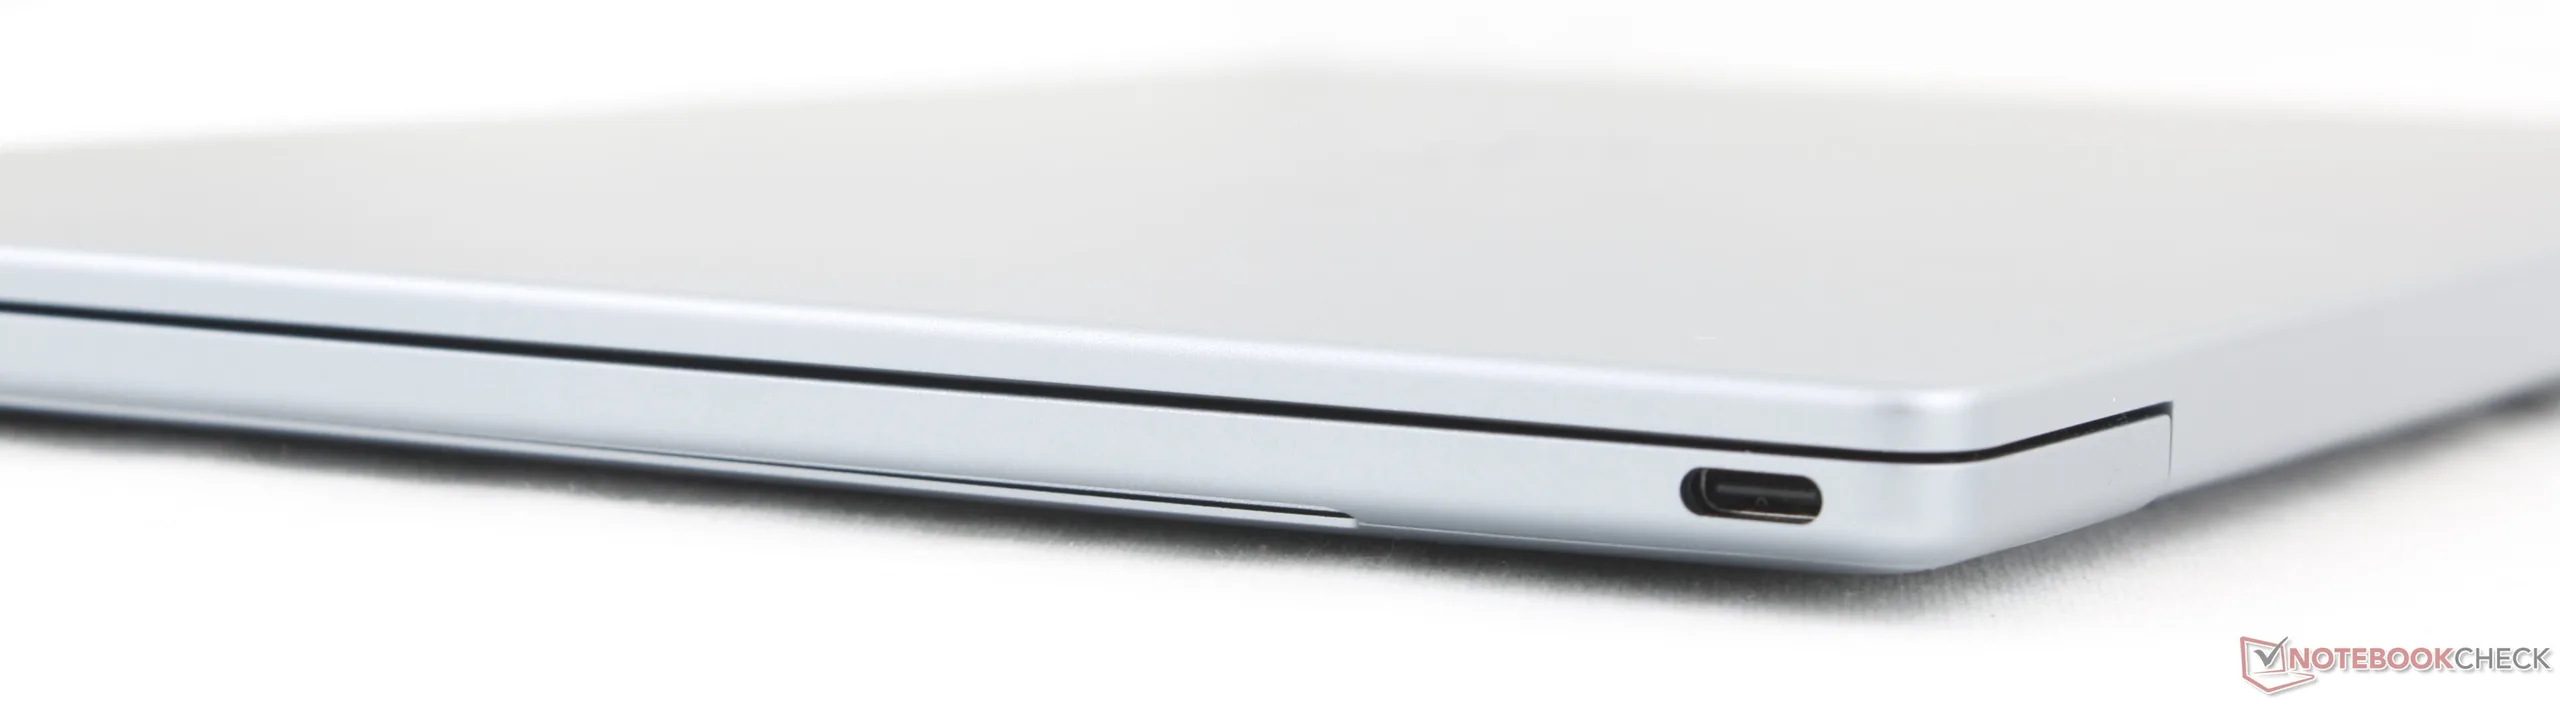
Parte anteriore: Nessuna porta
Esempio corretto: USB-C 3.2 Gen. 2 con DisplayPort 2.1 + Power Delivery
Parte posteriore: Nessuna porta
A sinistra: USB-C 3.2 Gen. 2 con DisplayPort 2.1 + Power Delivery

Comunicazione

Networking
iperf3 transmit Wi-Fi6/7 RT-BE96U
Lenovo ThinkPad X1 Carbon Gen 14 21V70075GE
Intel Wi-Fi 7 BE211 320MHz
4557 (4450min - 4688max) MBit/s
iperf3 receive Wi-Fi6/7 RT-BE96U
Lenovo ThinkPad X1 Carbon Gen 14 21V70075GE
Intel Wi-Fi 7 BE211 320MHz
3244 (3047min - 3285max) MBit/s
iperf3 receive AXE11000 6GHz
Dell XPS 14 Core Ultra X7 358H
Intel Wi-Fi 7 BE211 320MHz
1740 (1711min - 1757max) MBit/s +16%
Dell XPS 13 9350
Intel BE201 320MHz
1620 (1578min - 1652max) MBit/s +8%
Dell XPS 13 DX13260
Intel Wi-Fi 7 BE213 160MHz
1498 (1435min - 1602max) MBit/s
iperf3 transmit AXE11000 6GHz
Dell XPS 13 DX13260
Intel Wi-Fi 7 BE213 160MHz
1500 (1399min - 1613max) MBit/s
Dell XPS 14 Core Ultra X7 358H
Intel Wi-Fi 7 BE211 320MHz
1440 (1053min - 1526max) MBit/s -4%
Dell XPS 13 9350
Intel BE201 320MHz
1127 (1037min - 1292max) MBit/s -25%
01002003004005006007008009001000110012001300140015001600Tooltip
Dell XPS 13 DX13260; iperf3 receive AXE11000 6GHz; iperf 3.1.3: Ø1498 (1435-1602) MBit/s
Dell XPS 13 DX13260; iperf3 transmit AXE11000 6GHz; iperf 3.1.3: Ø1500 (1399-1613) MBit/s

Webcam

 Sebbene la tecnologia IR sia integrata di serie per il supporto di Windows Hello, non è ancora presente alcuna copertura per la privacy, né fisica né di altro tipo.

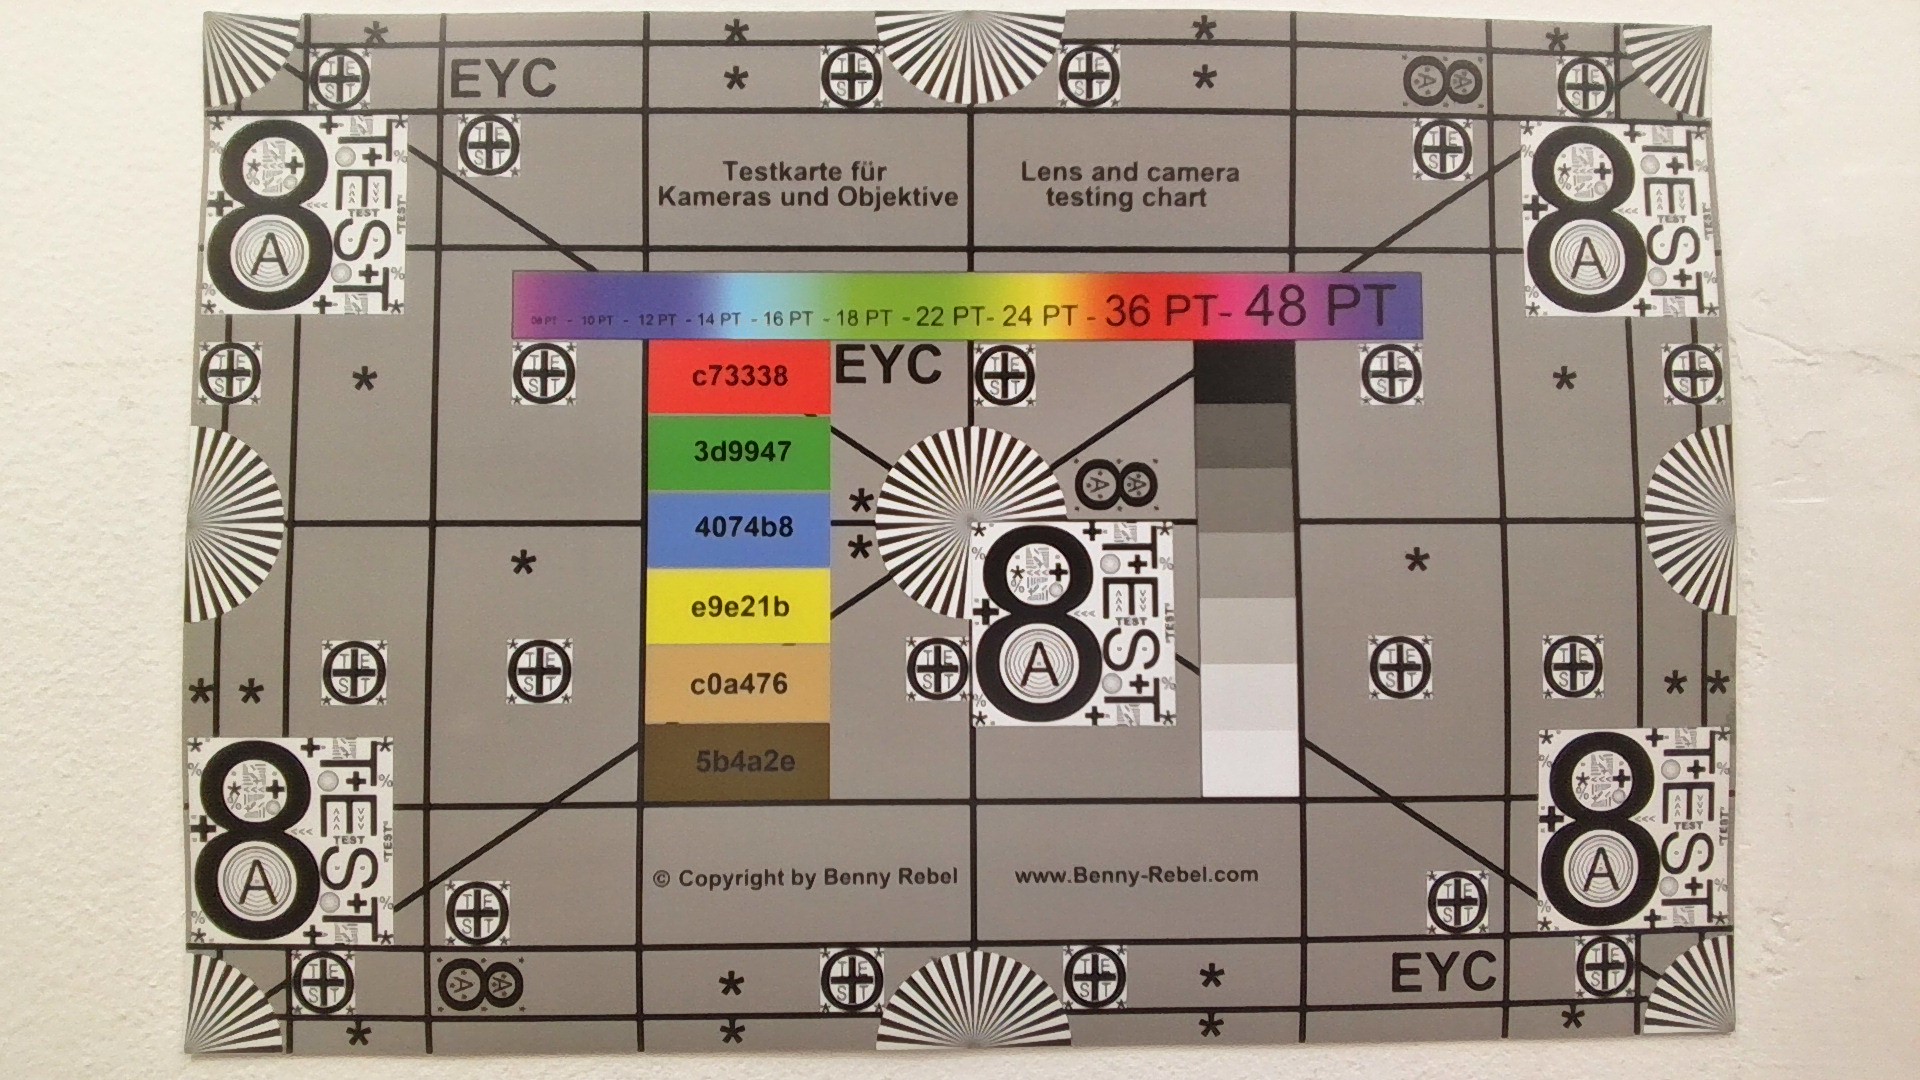
ColorChecker
11 ∆E
13 ∆E
14.1 ∆E
21.3 ∆E
15.8 ∆E
17.9 ∆E
8.1 ∆E
10.2 ∆E
13.9 ∆E
7.6 ∆E
15.3 ∆E
17.7 ∆E
4.6 ∆E
18.5 ∆E
19.8 ∆E
13.1 ∆E
13.8 ∆E
20.3 ∆E
7.8 ∆E
9.9 ∆E
15 ∆E
15 ∆E
12.3 ∆E
3.2 ∆E
ColorChecker Dell XPS 13 DX13260: 13.29 ∆E min: 3.2 - max: 21.3 ∆E

Manutenzione

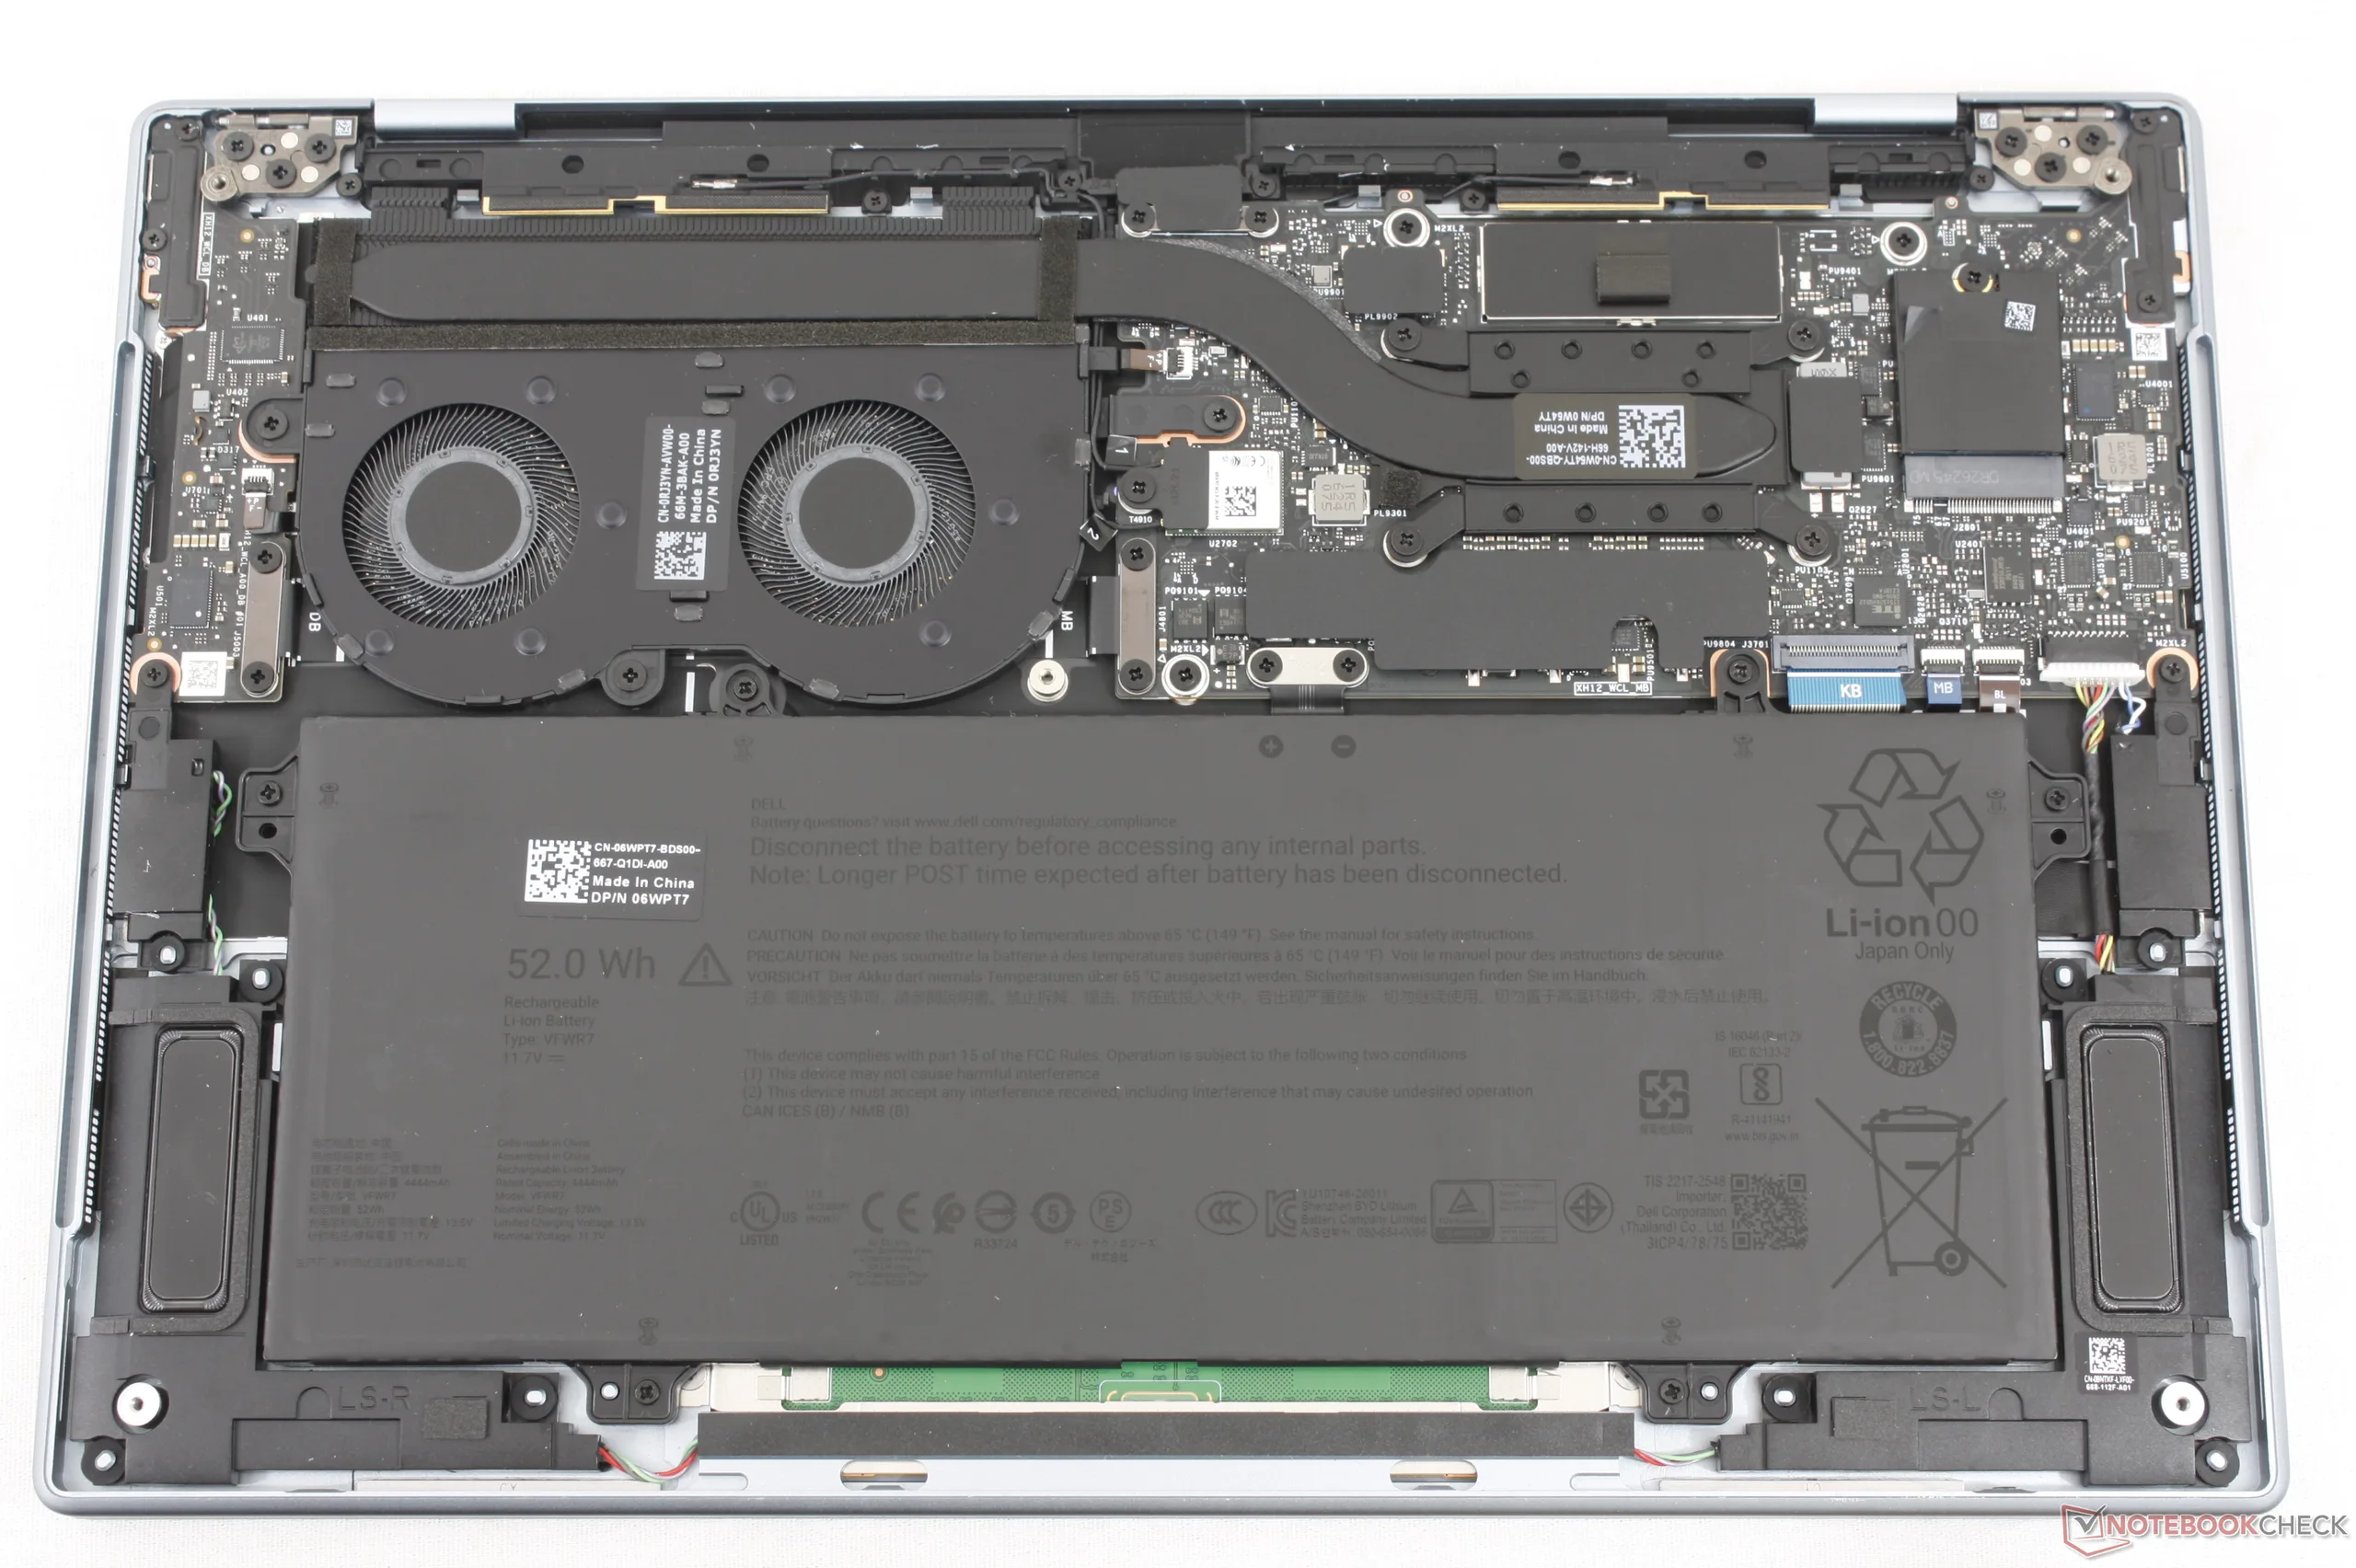
Scheda madre dell’XPS 13 Wildcat. Solo la batteria e l’SSD M.2 2242 sono rimovibili

Sostenibilità

Il telaio è realizzato con fino al 75% di alluminio riciclato per il coperchio superiore e i poggiapolsi, fino al 50% di cobalto riciclato per la batteria e fino al 90% di acciaio riciclato per i tasti. L’imballaggio è interamente riciclabile e privo di plastica.

Dispositivi di input

La tastiera più tradizionale è probabilmente più comoda da utilizzare rispetto alla tastiera zero-lattice del più grande XPS 14. Tuttavia, sebbene il feedback sia netto, la corsa dei tasti è molto ridotta, specialmente per quanto riguarda il tasto Spazio.
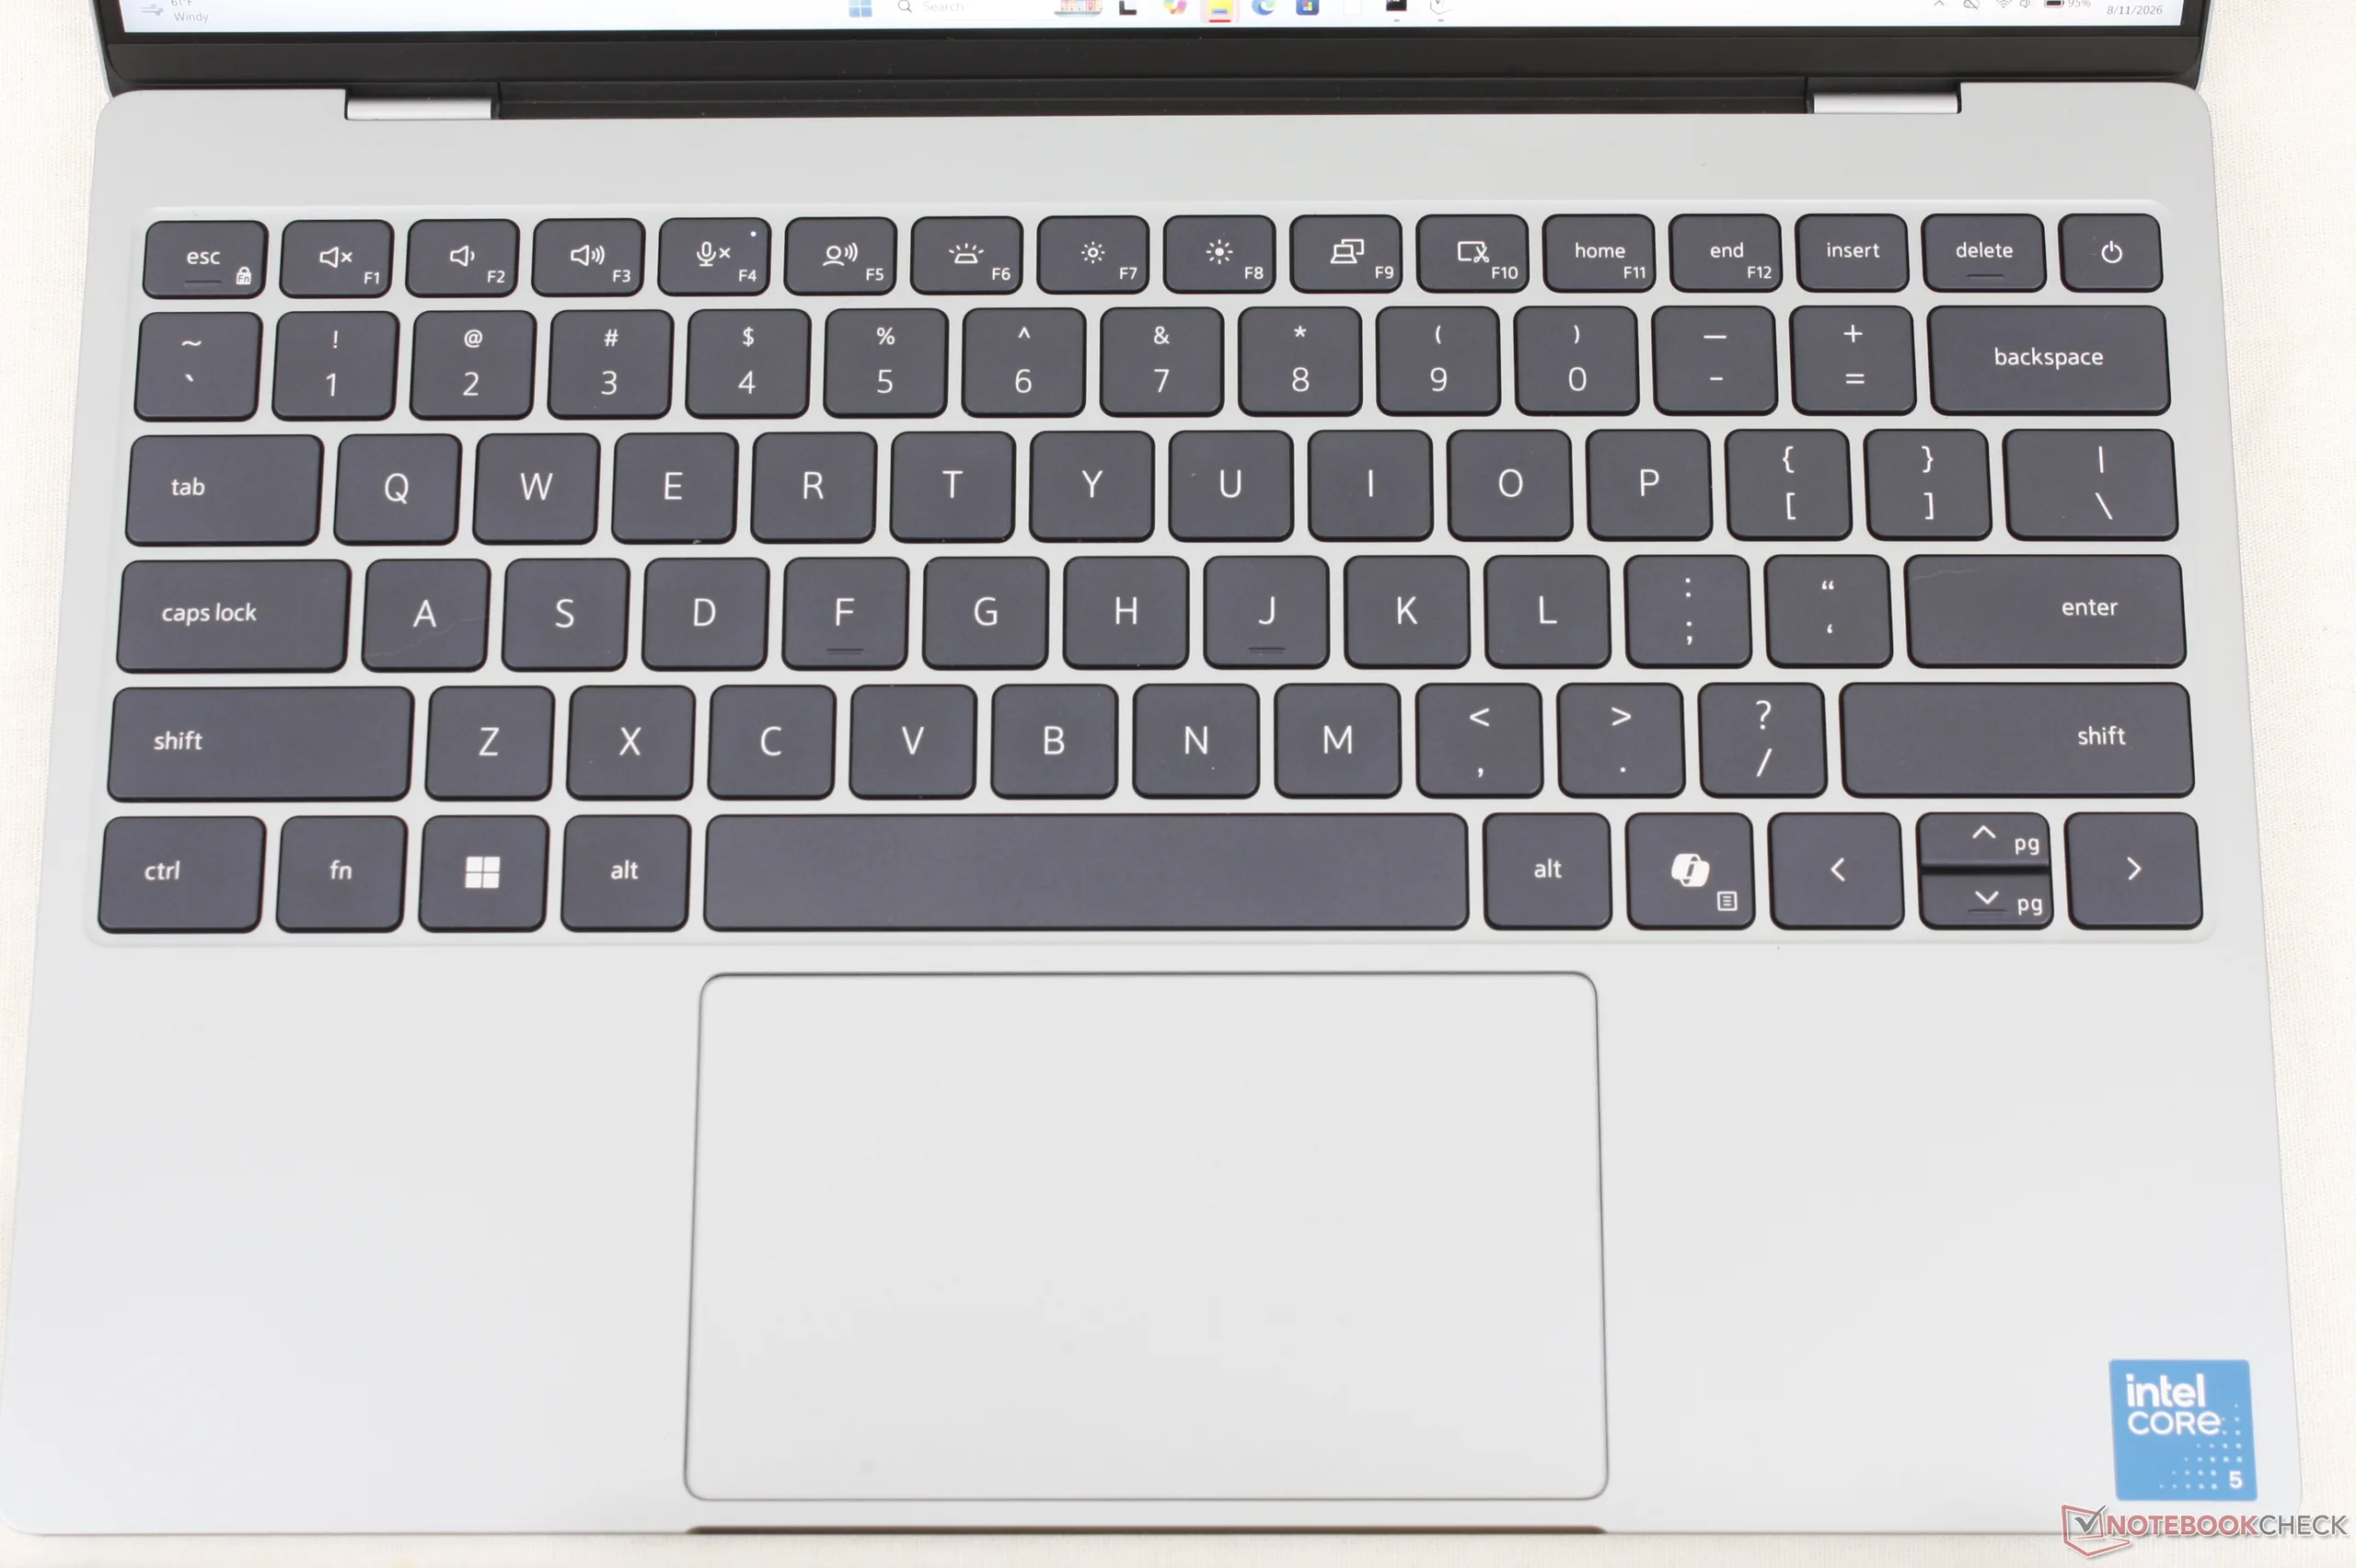
Con dimensioni di circa 12 x 7 cm, il clickpad può risultare un po’ angusto, specialmente quando si sposta il cursore in verticale

Visualizza

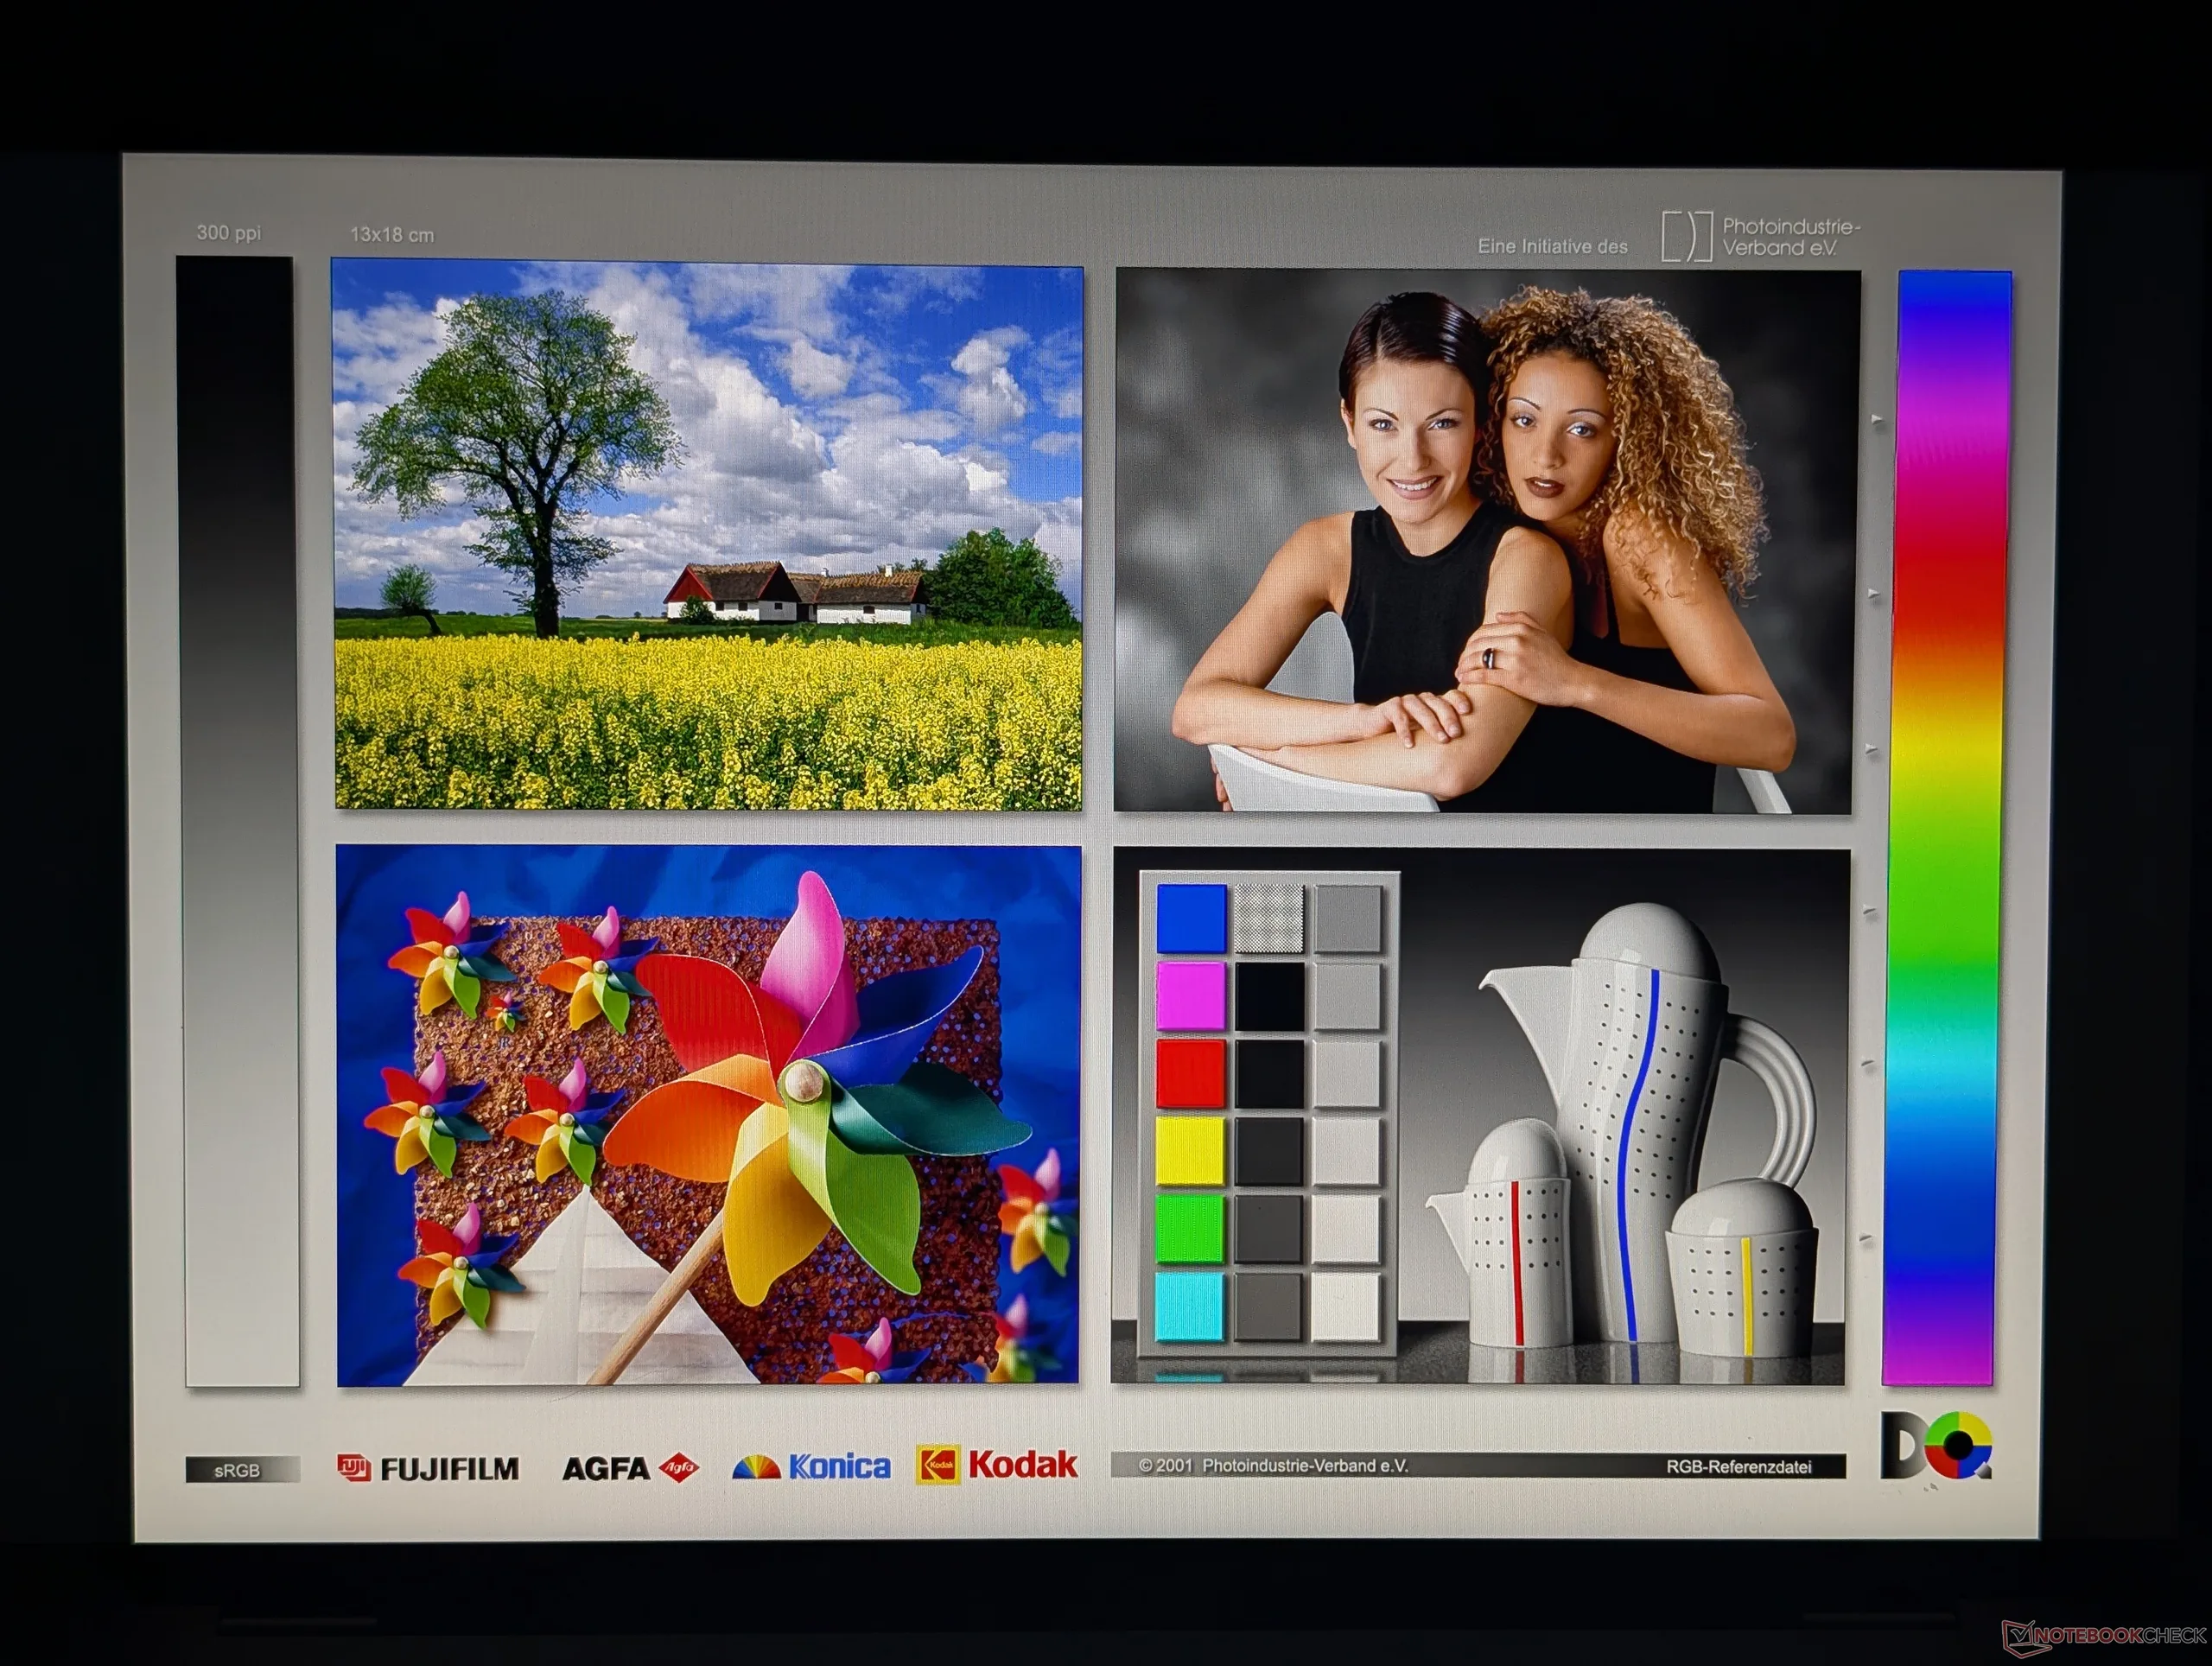
Pannello IPS opaco con granulosità minima
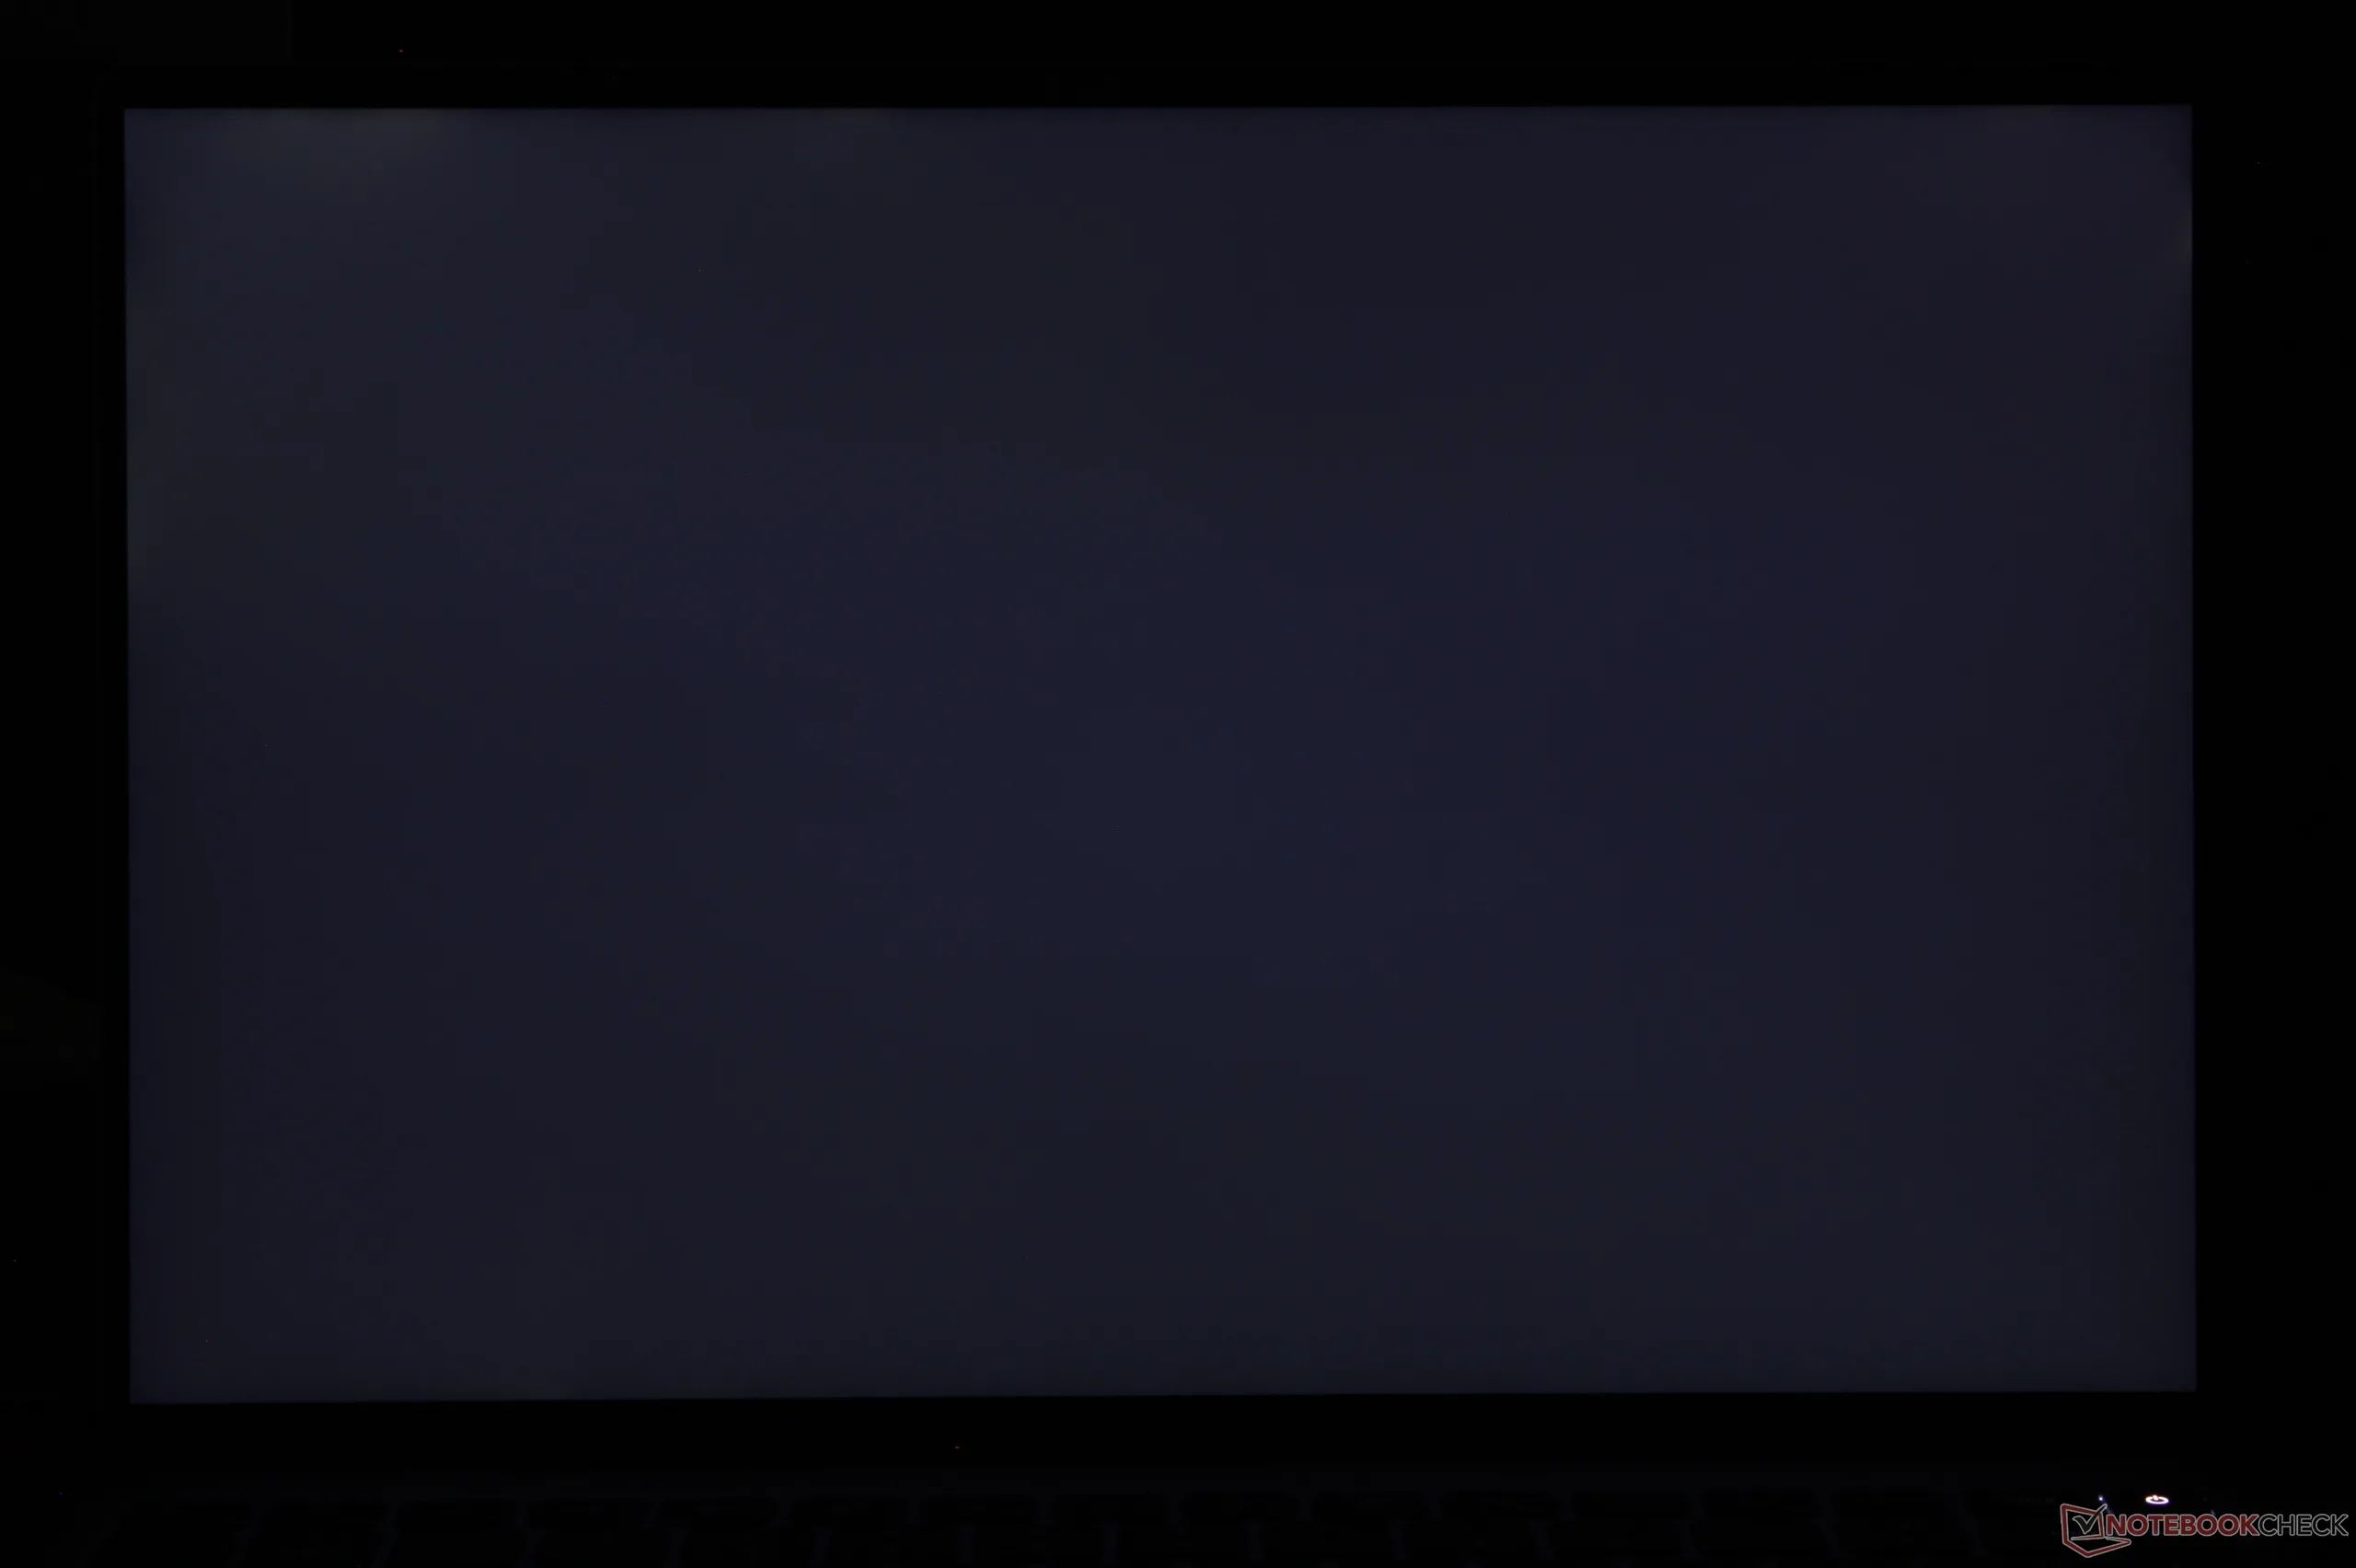
Lieve sbavatura di retroilluminazione lungo l’angolo in alto a sinistra

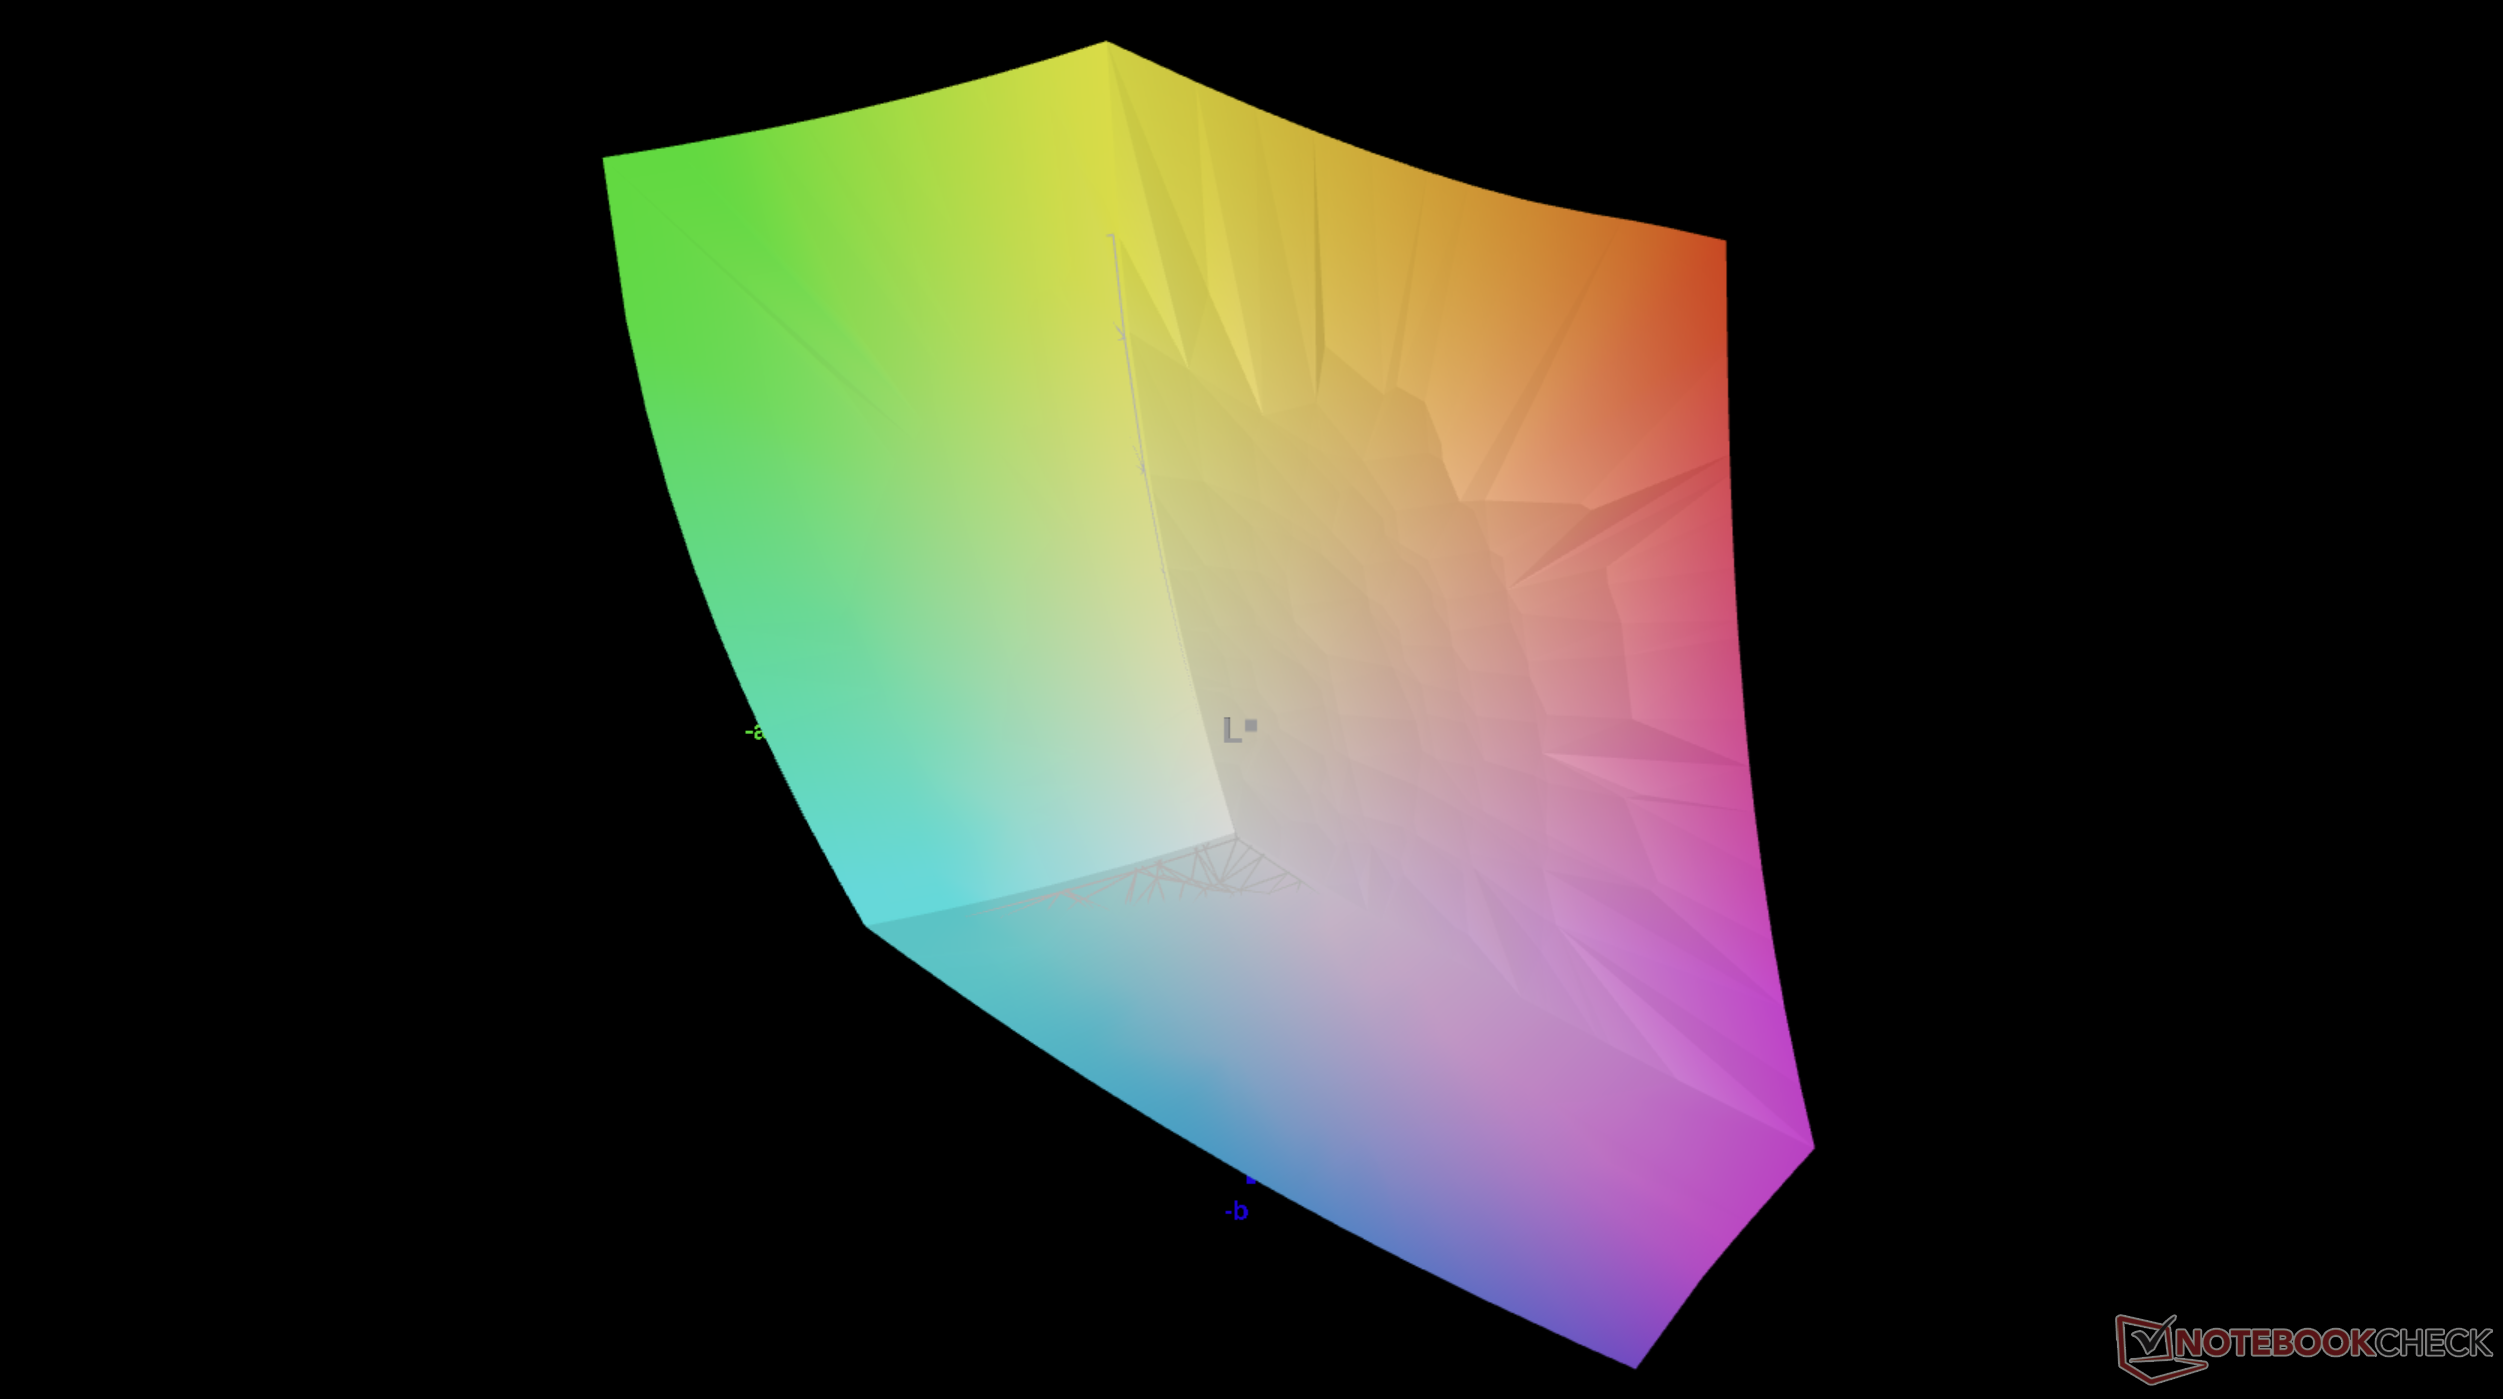
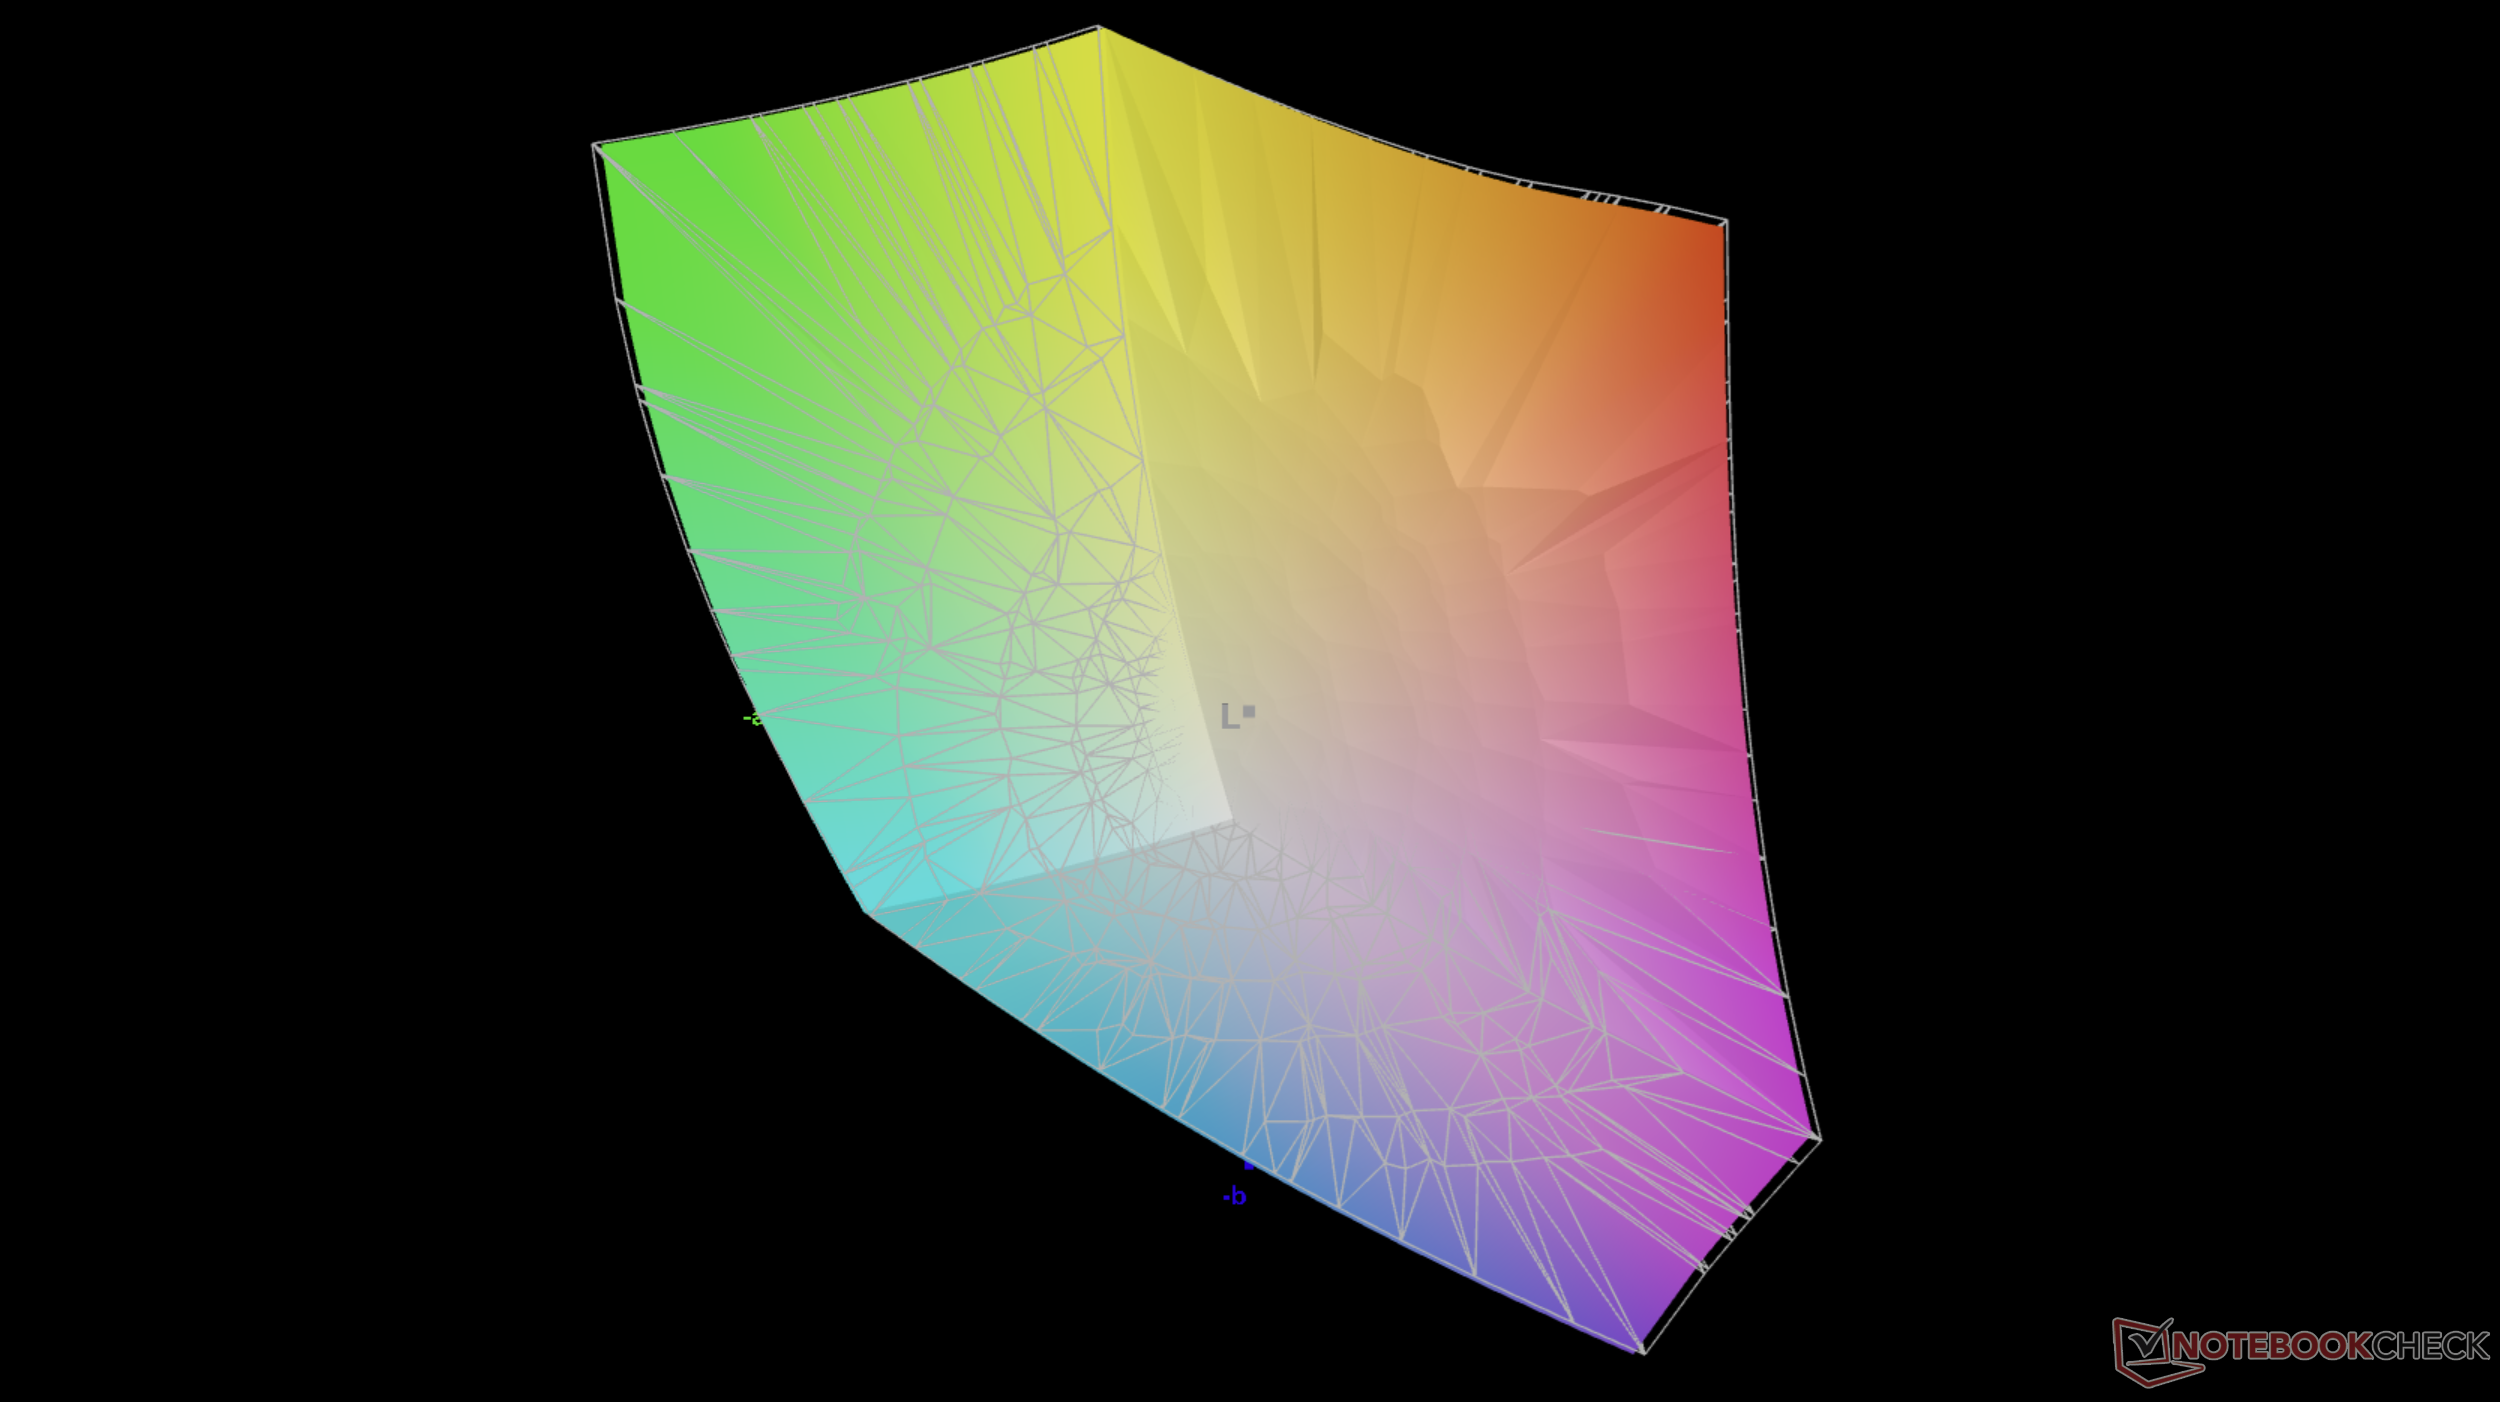
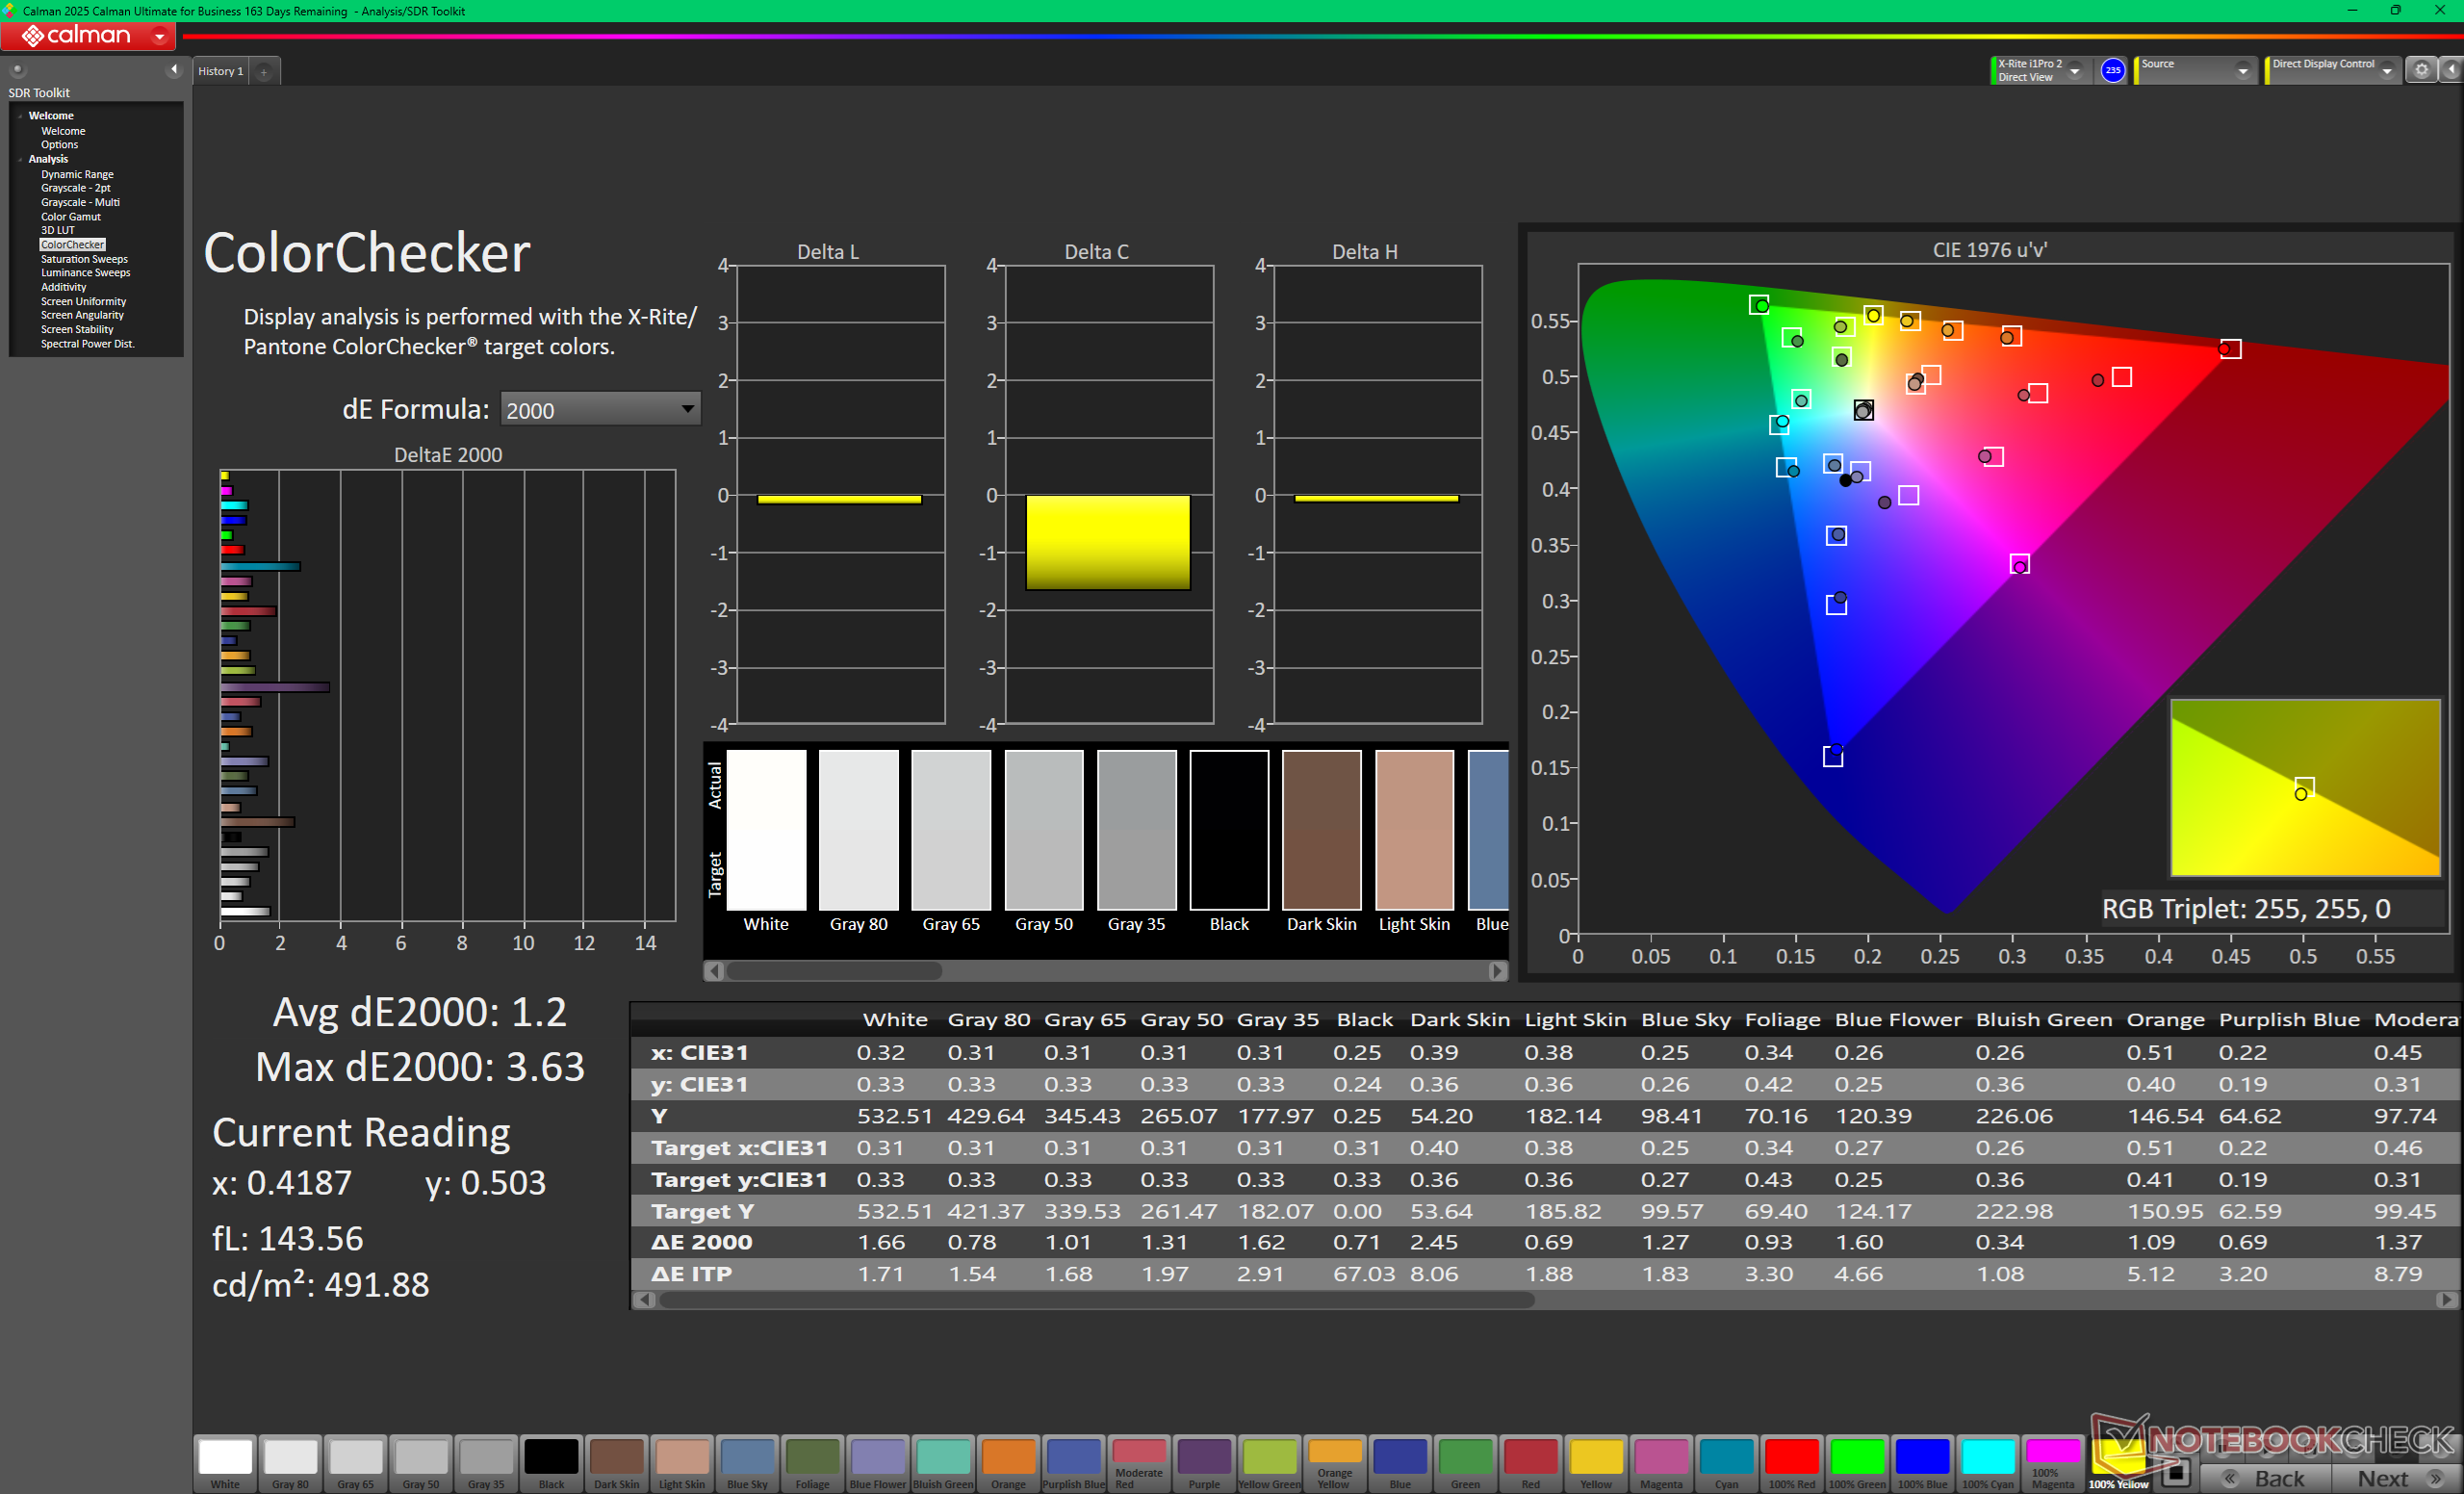
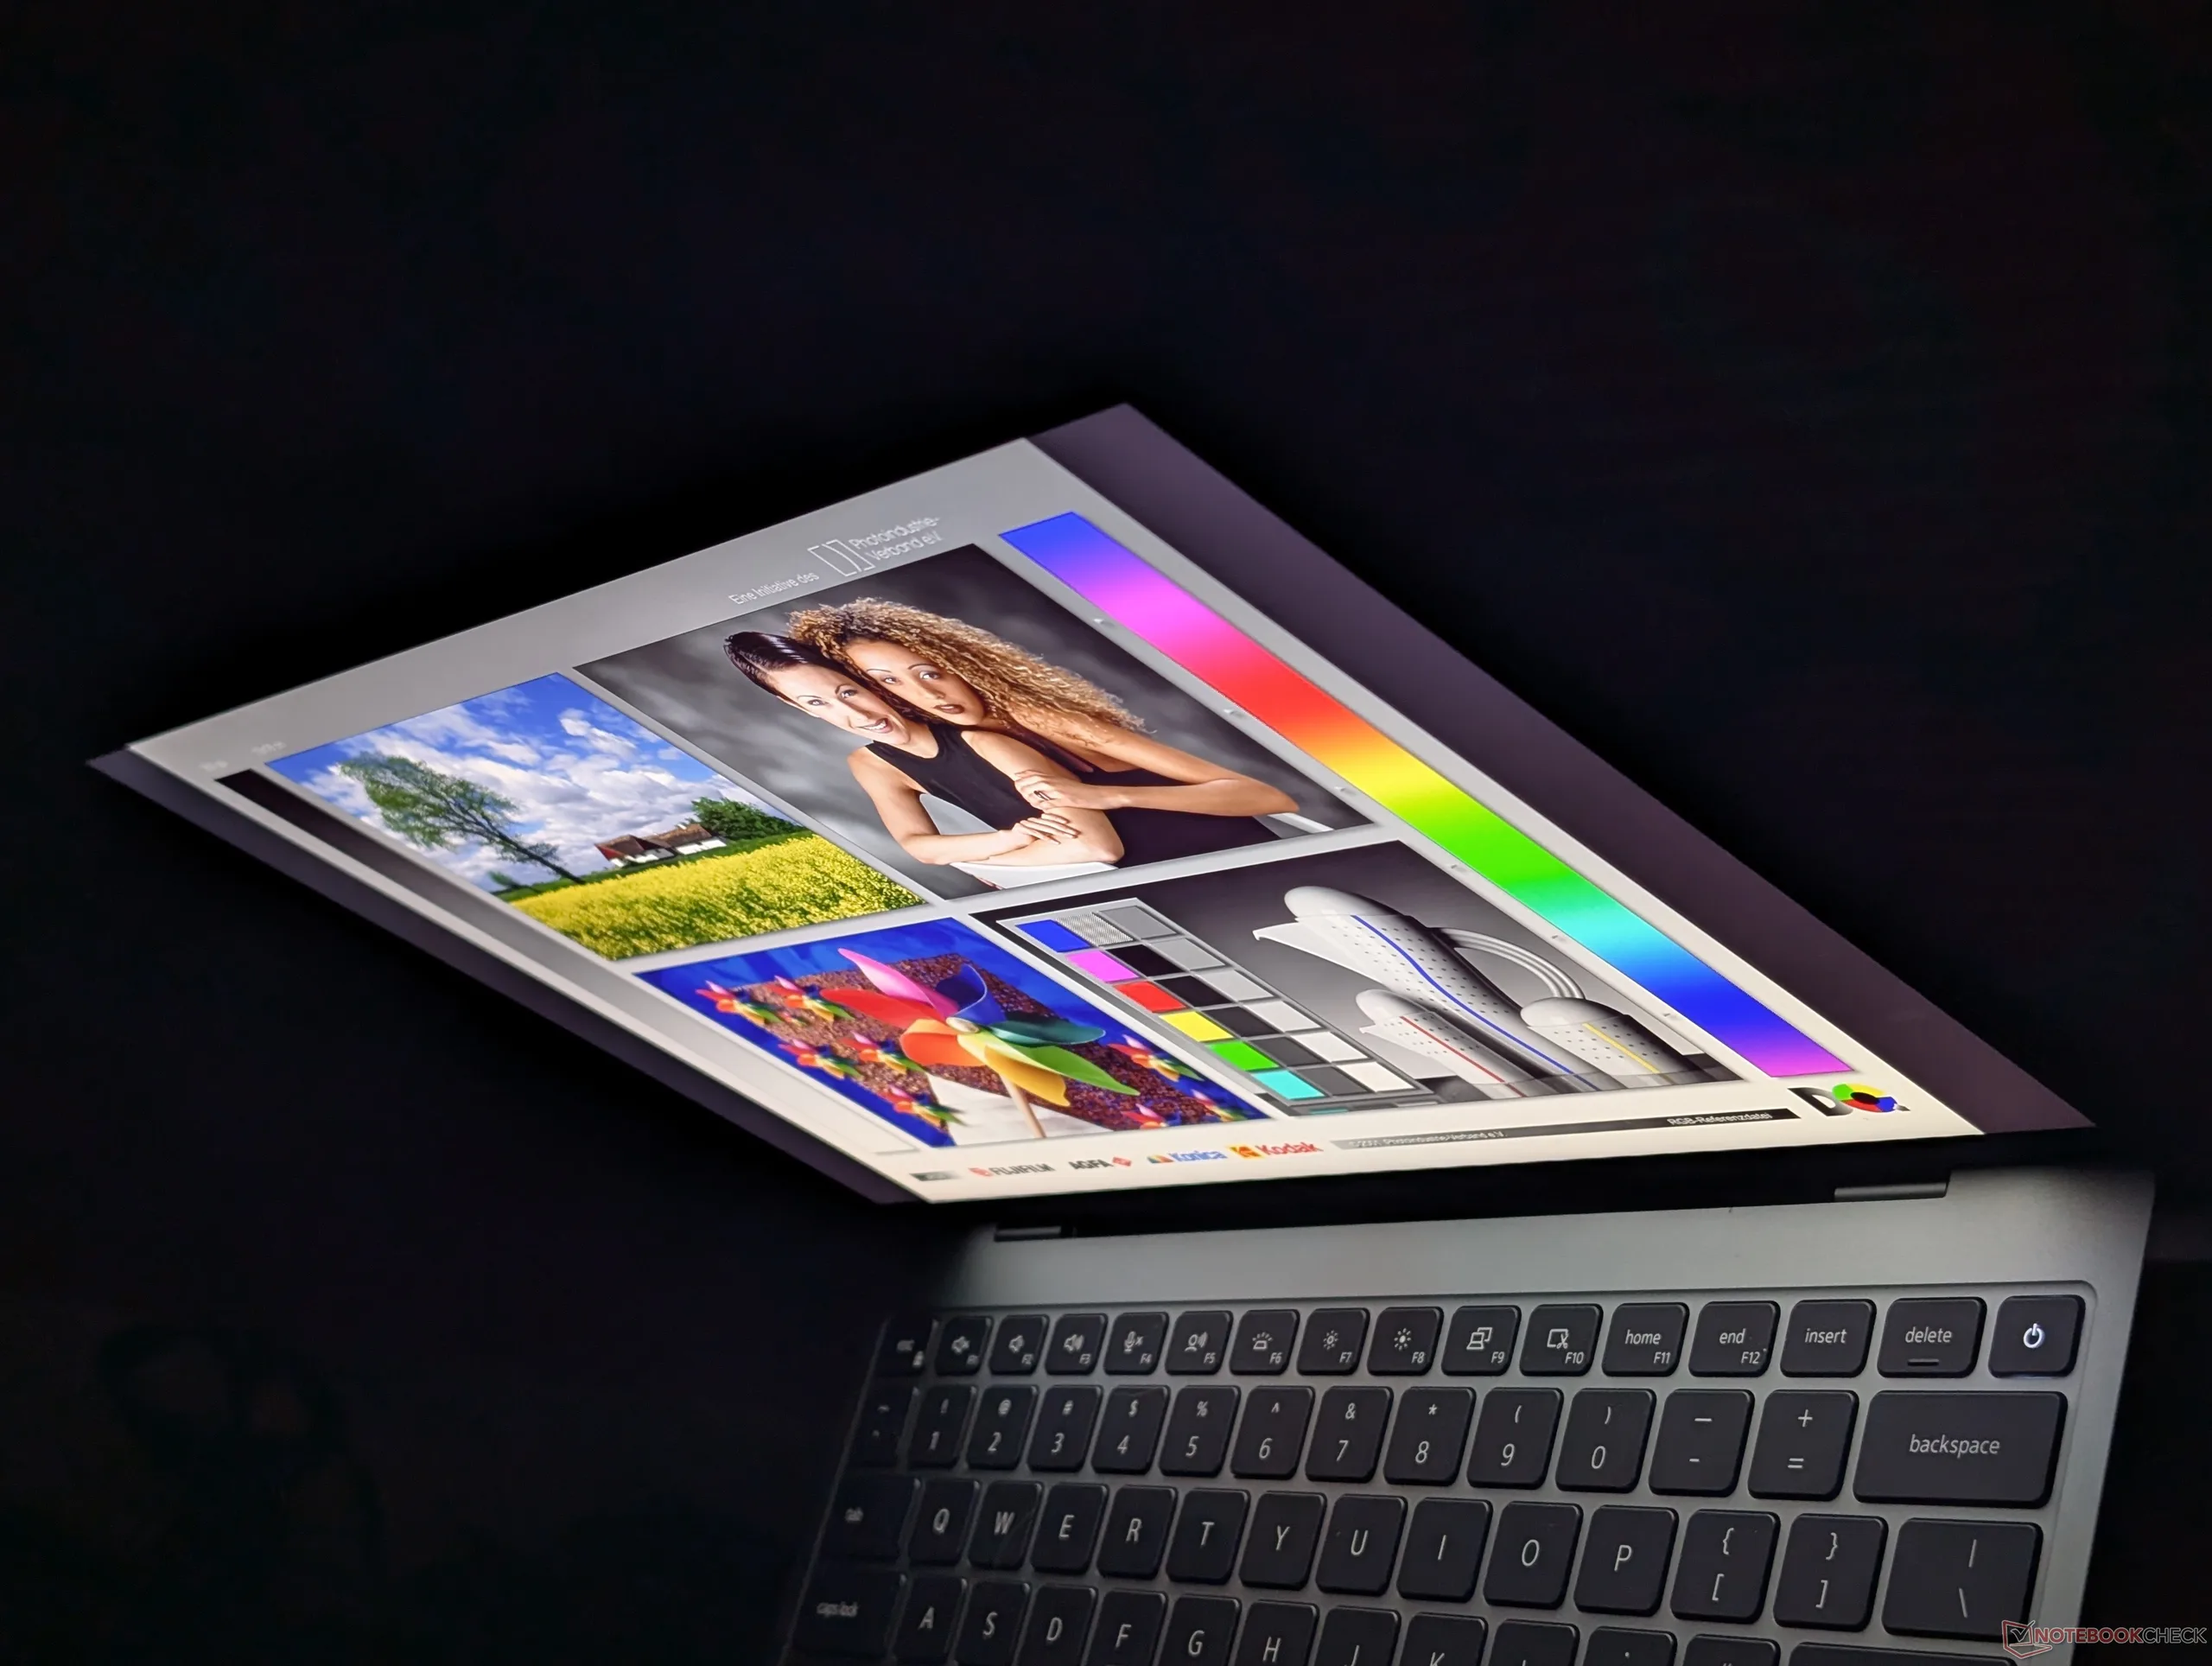
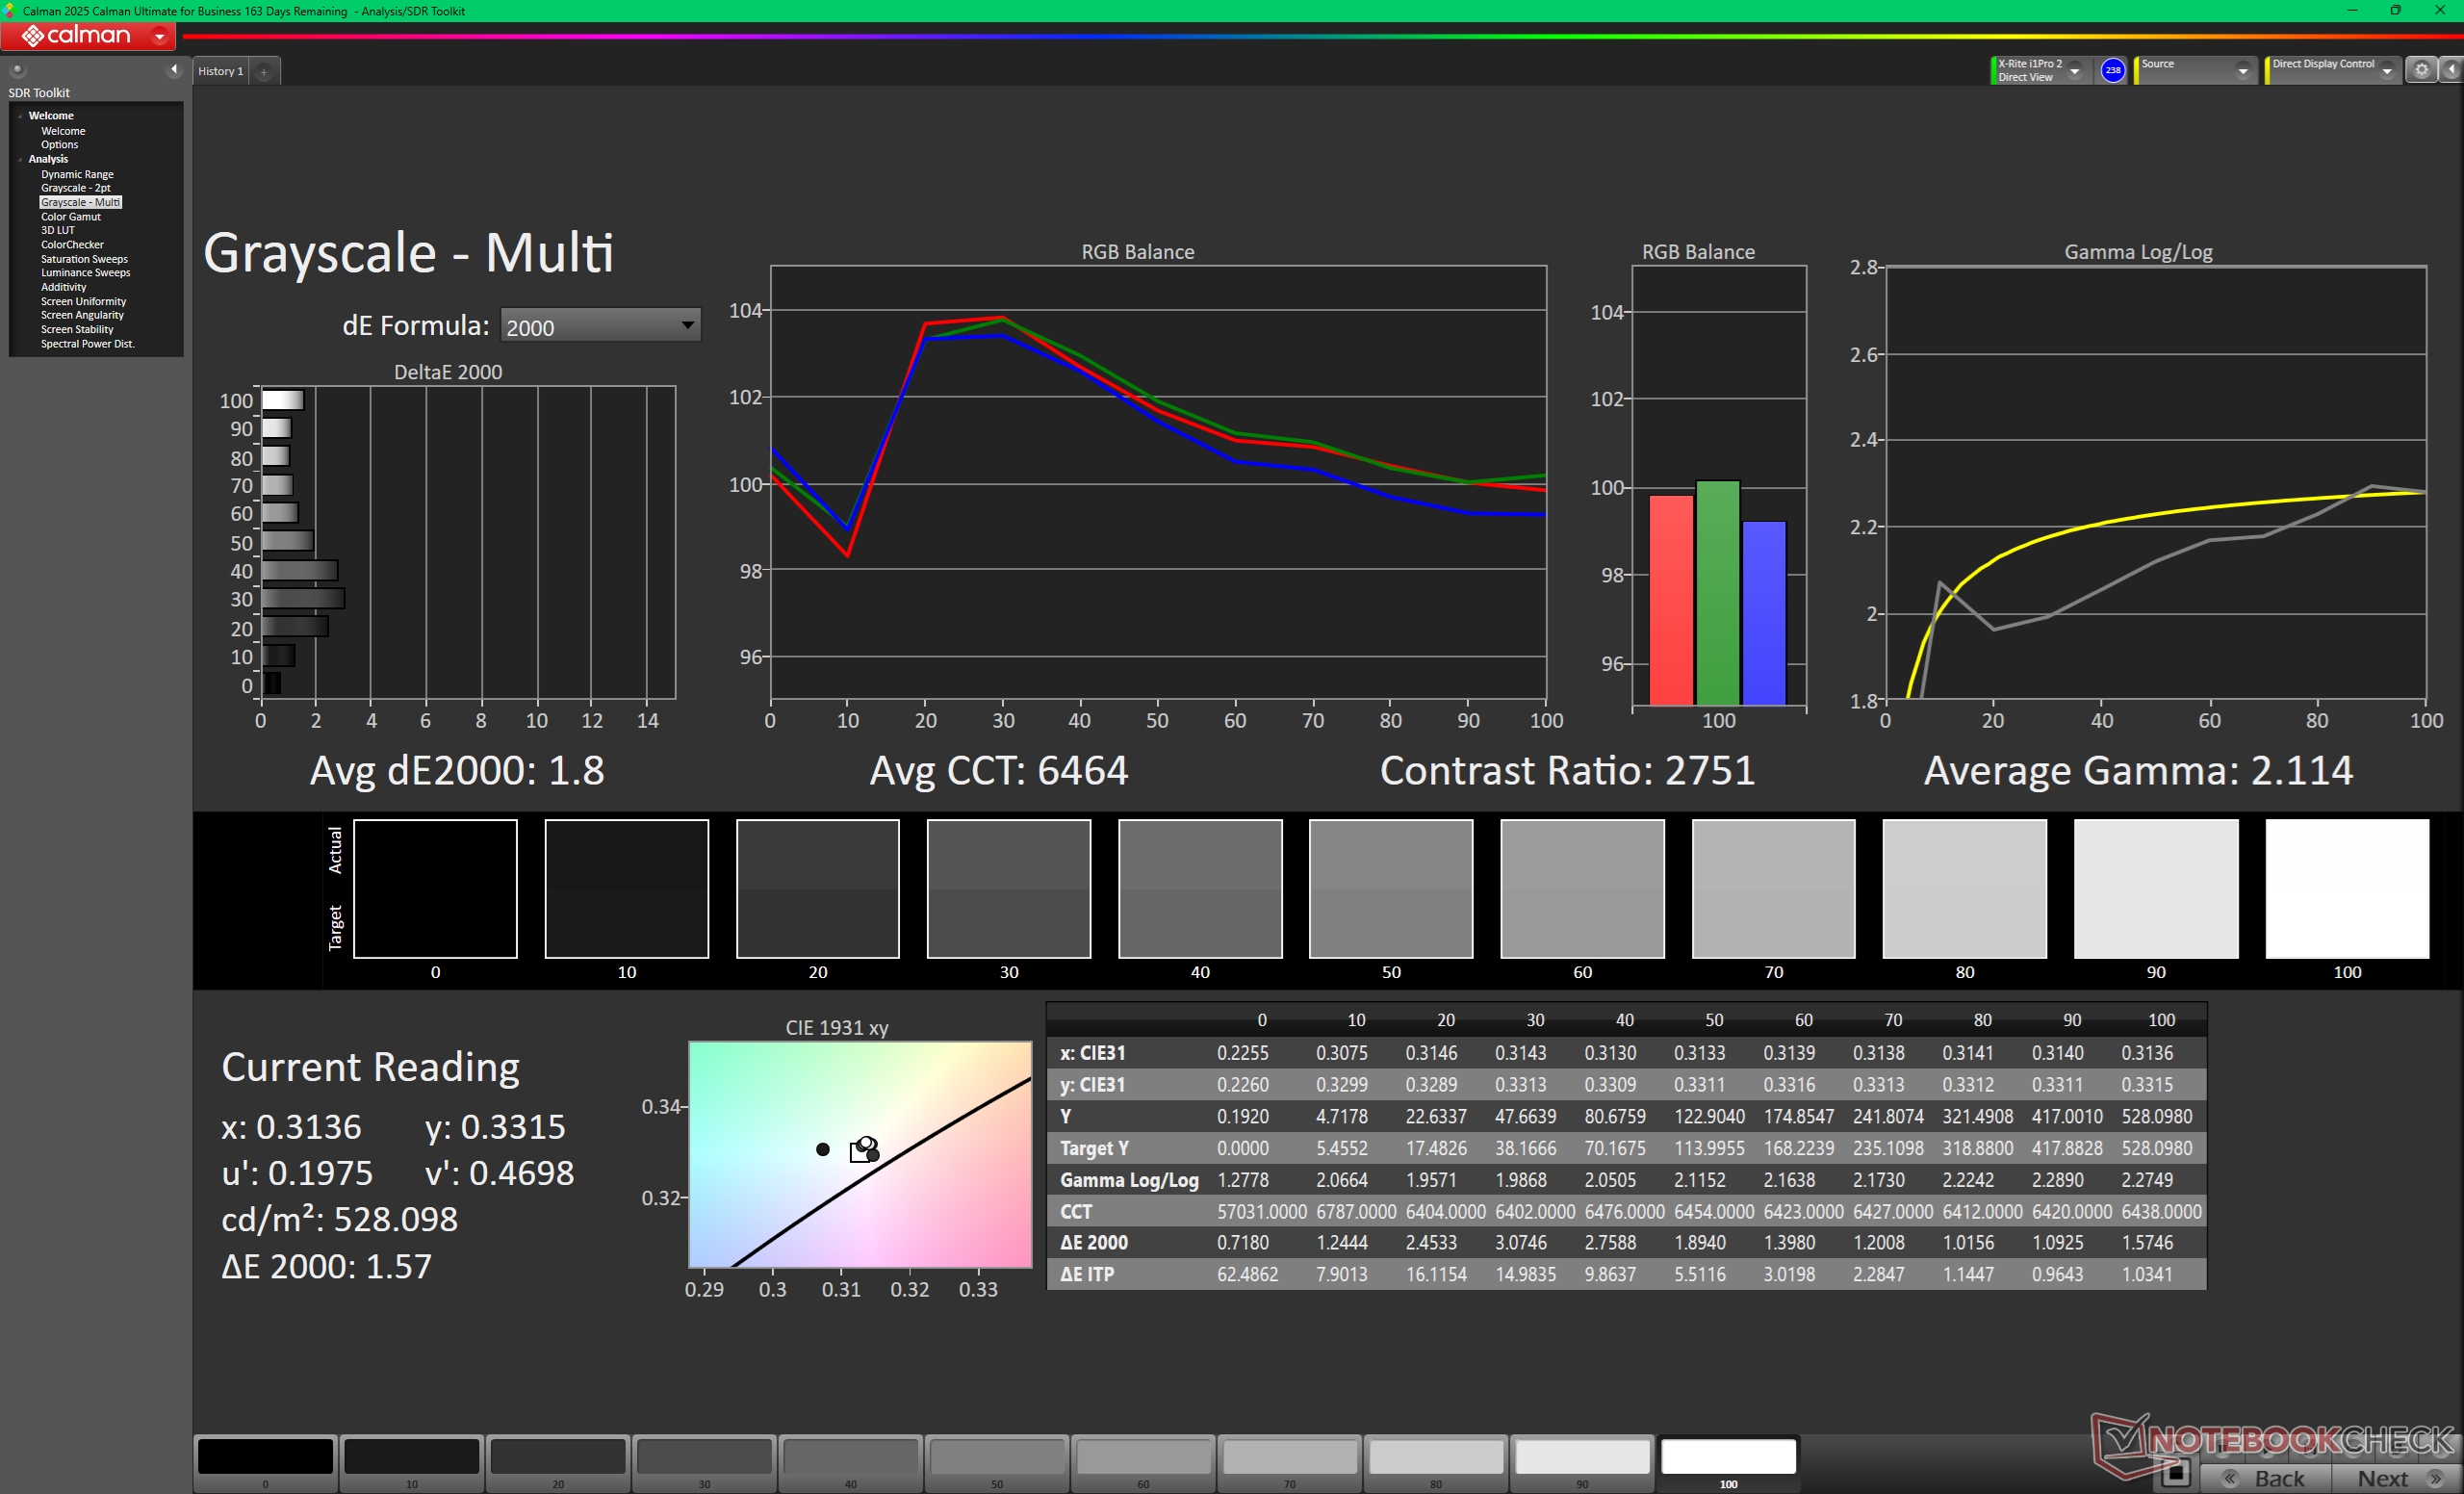
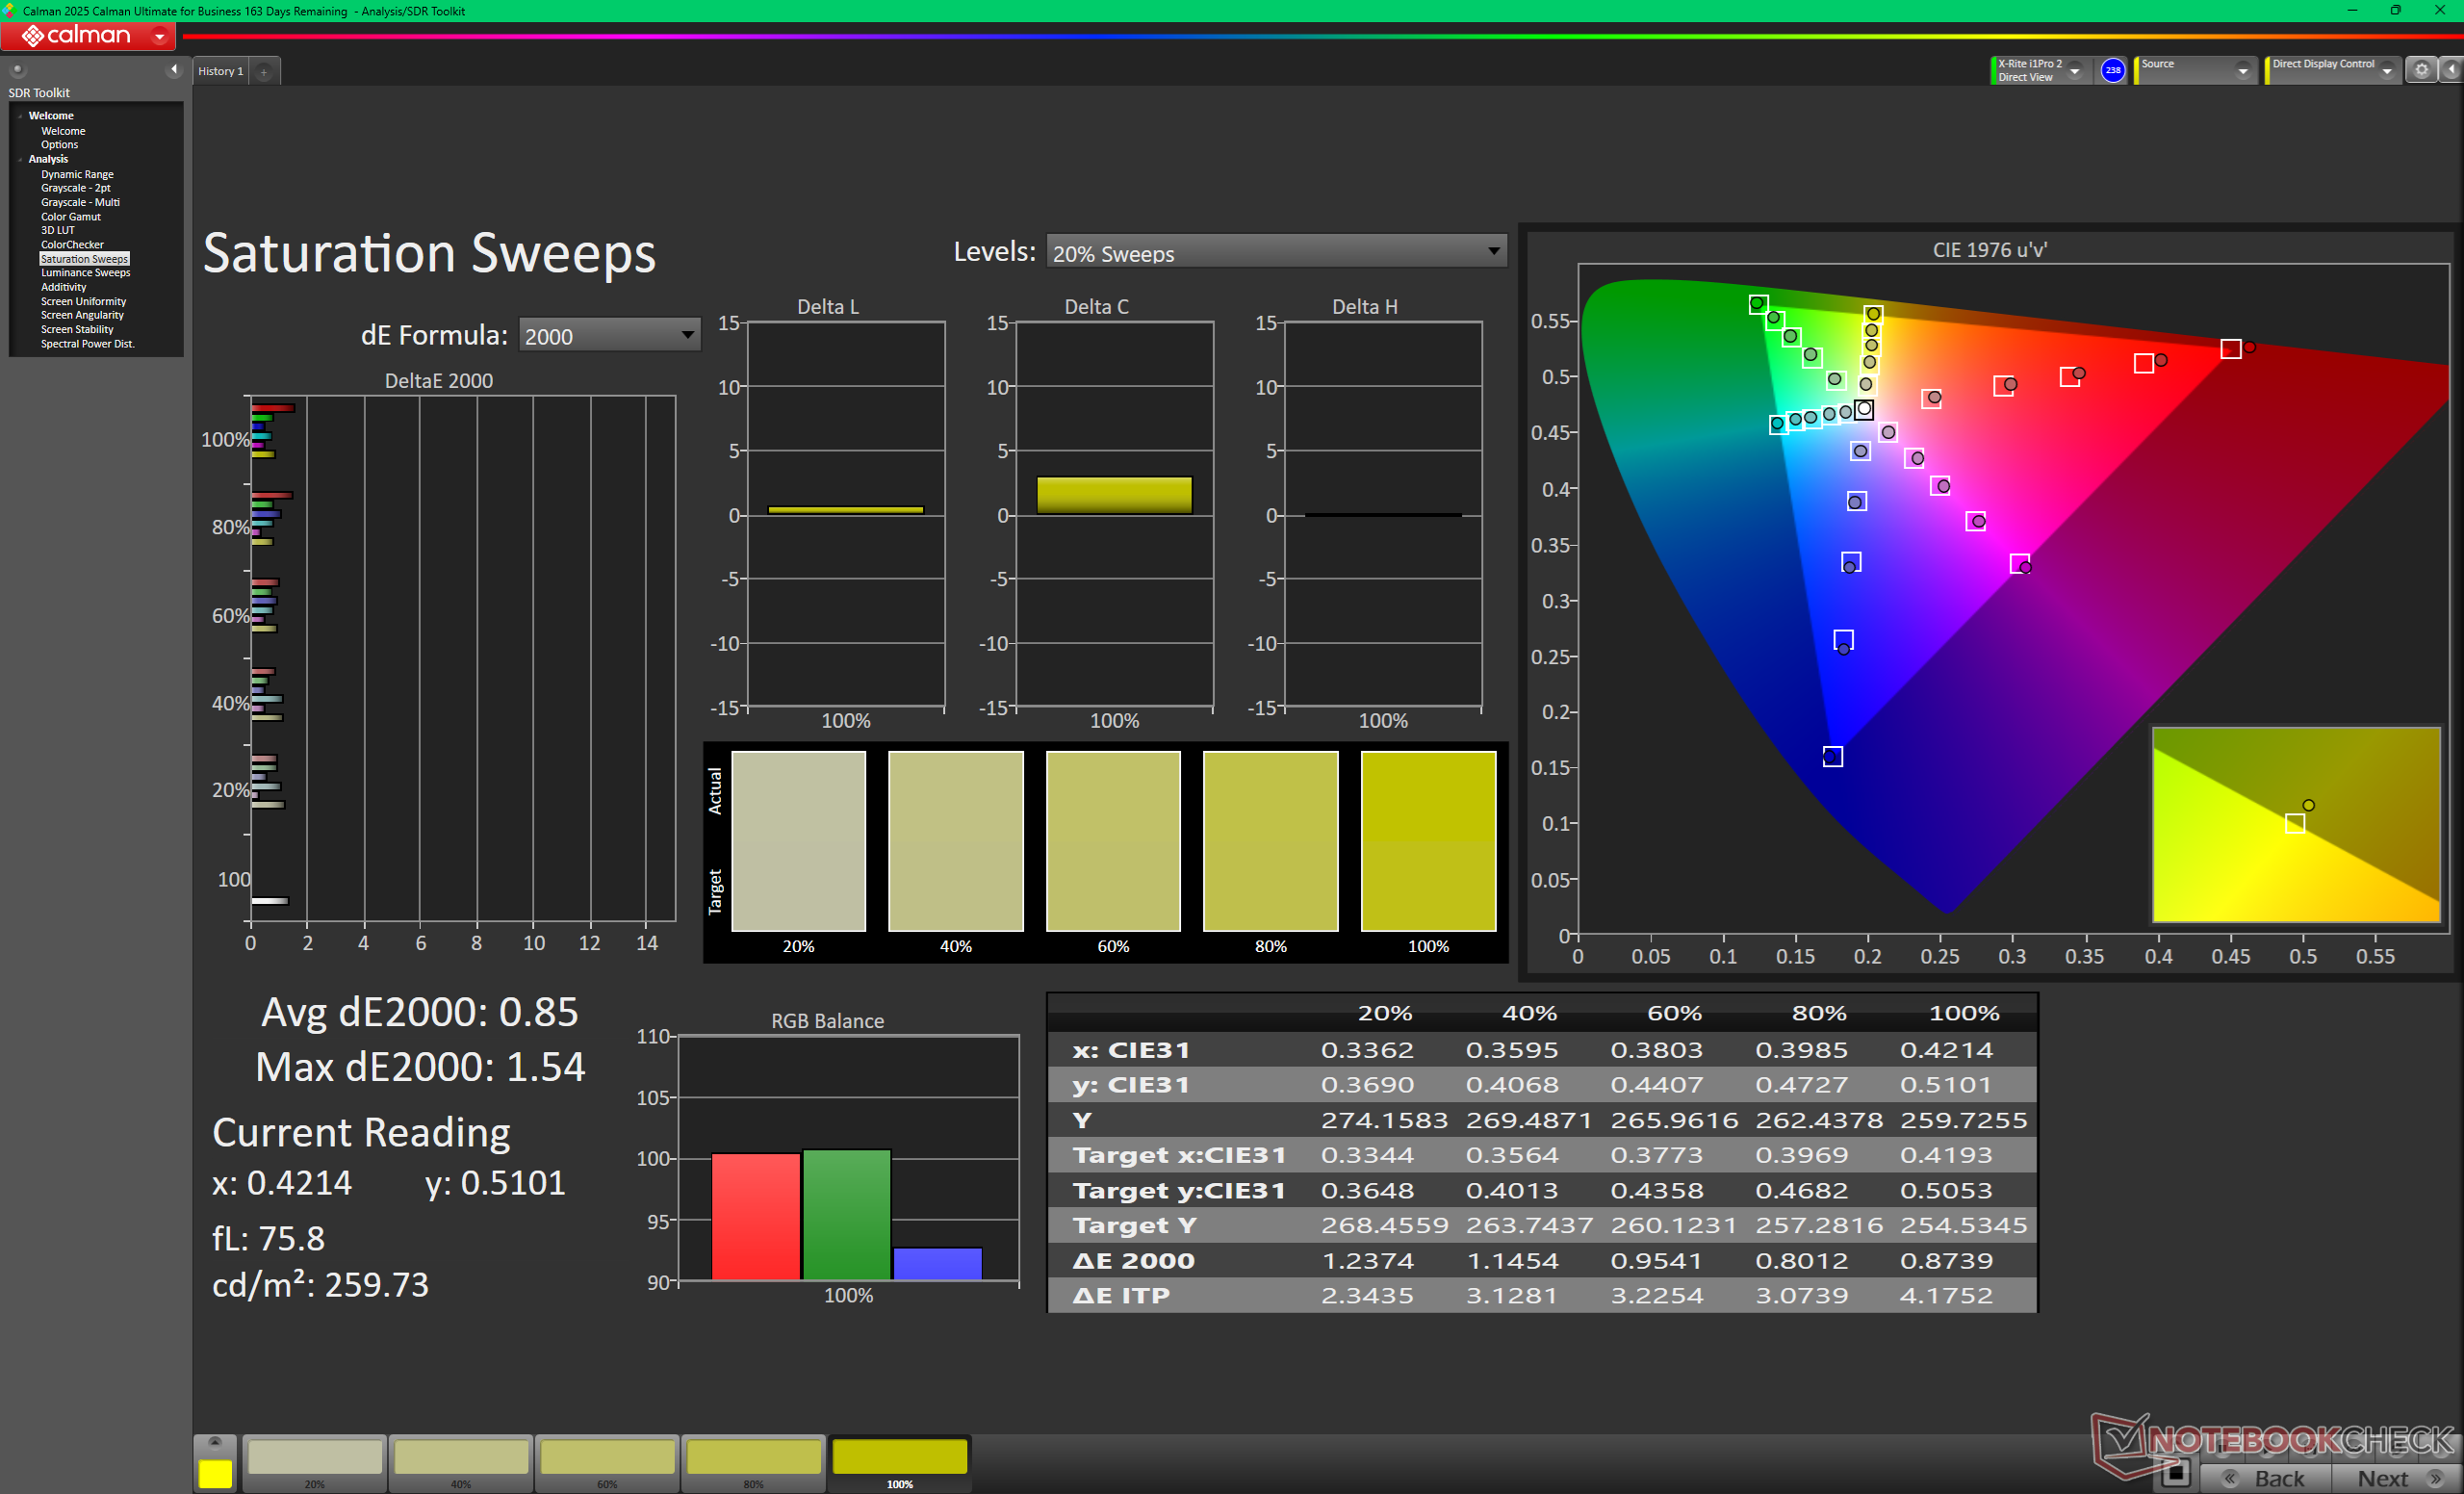
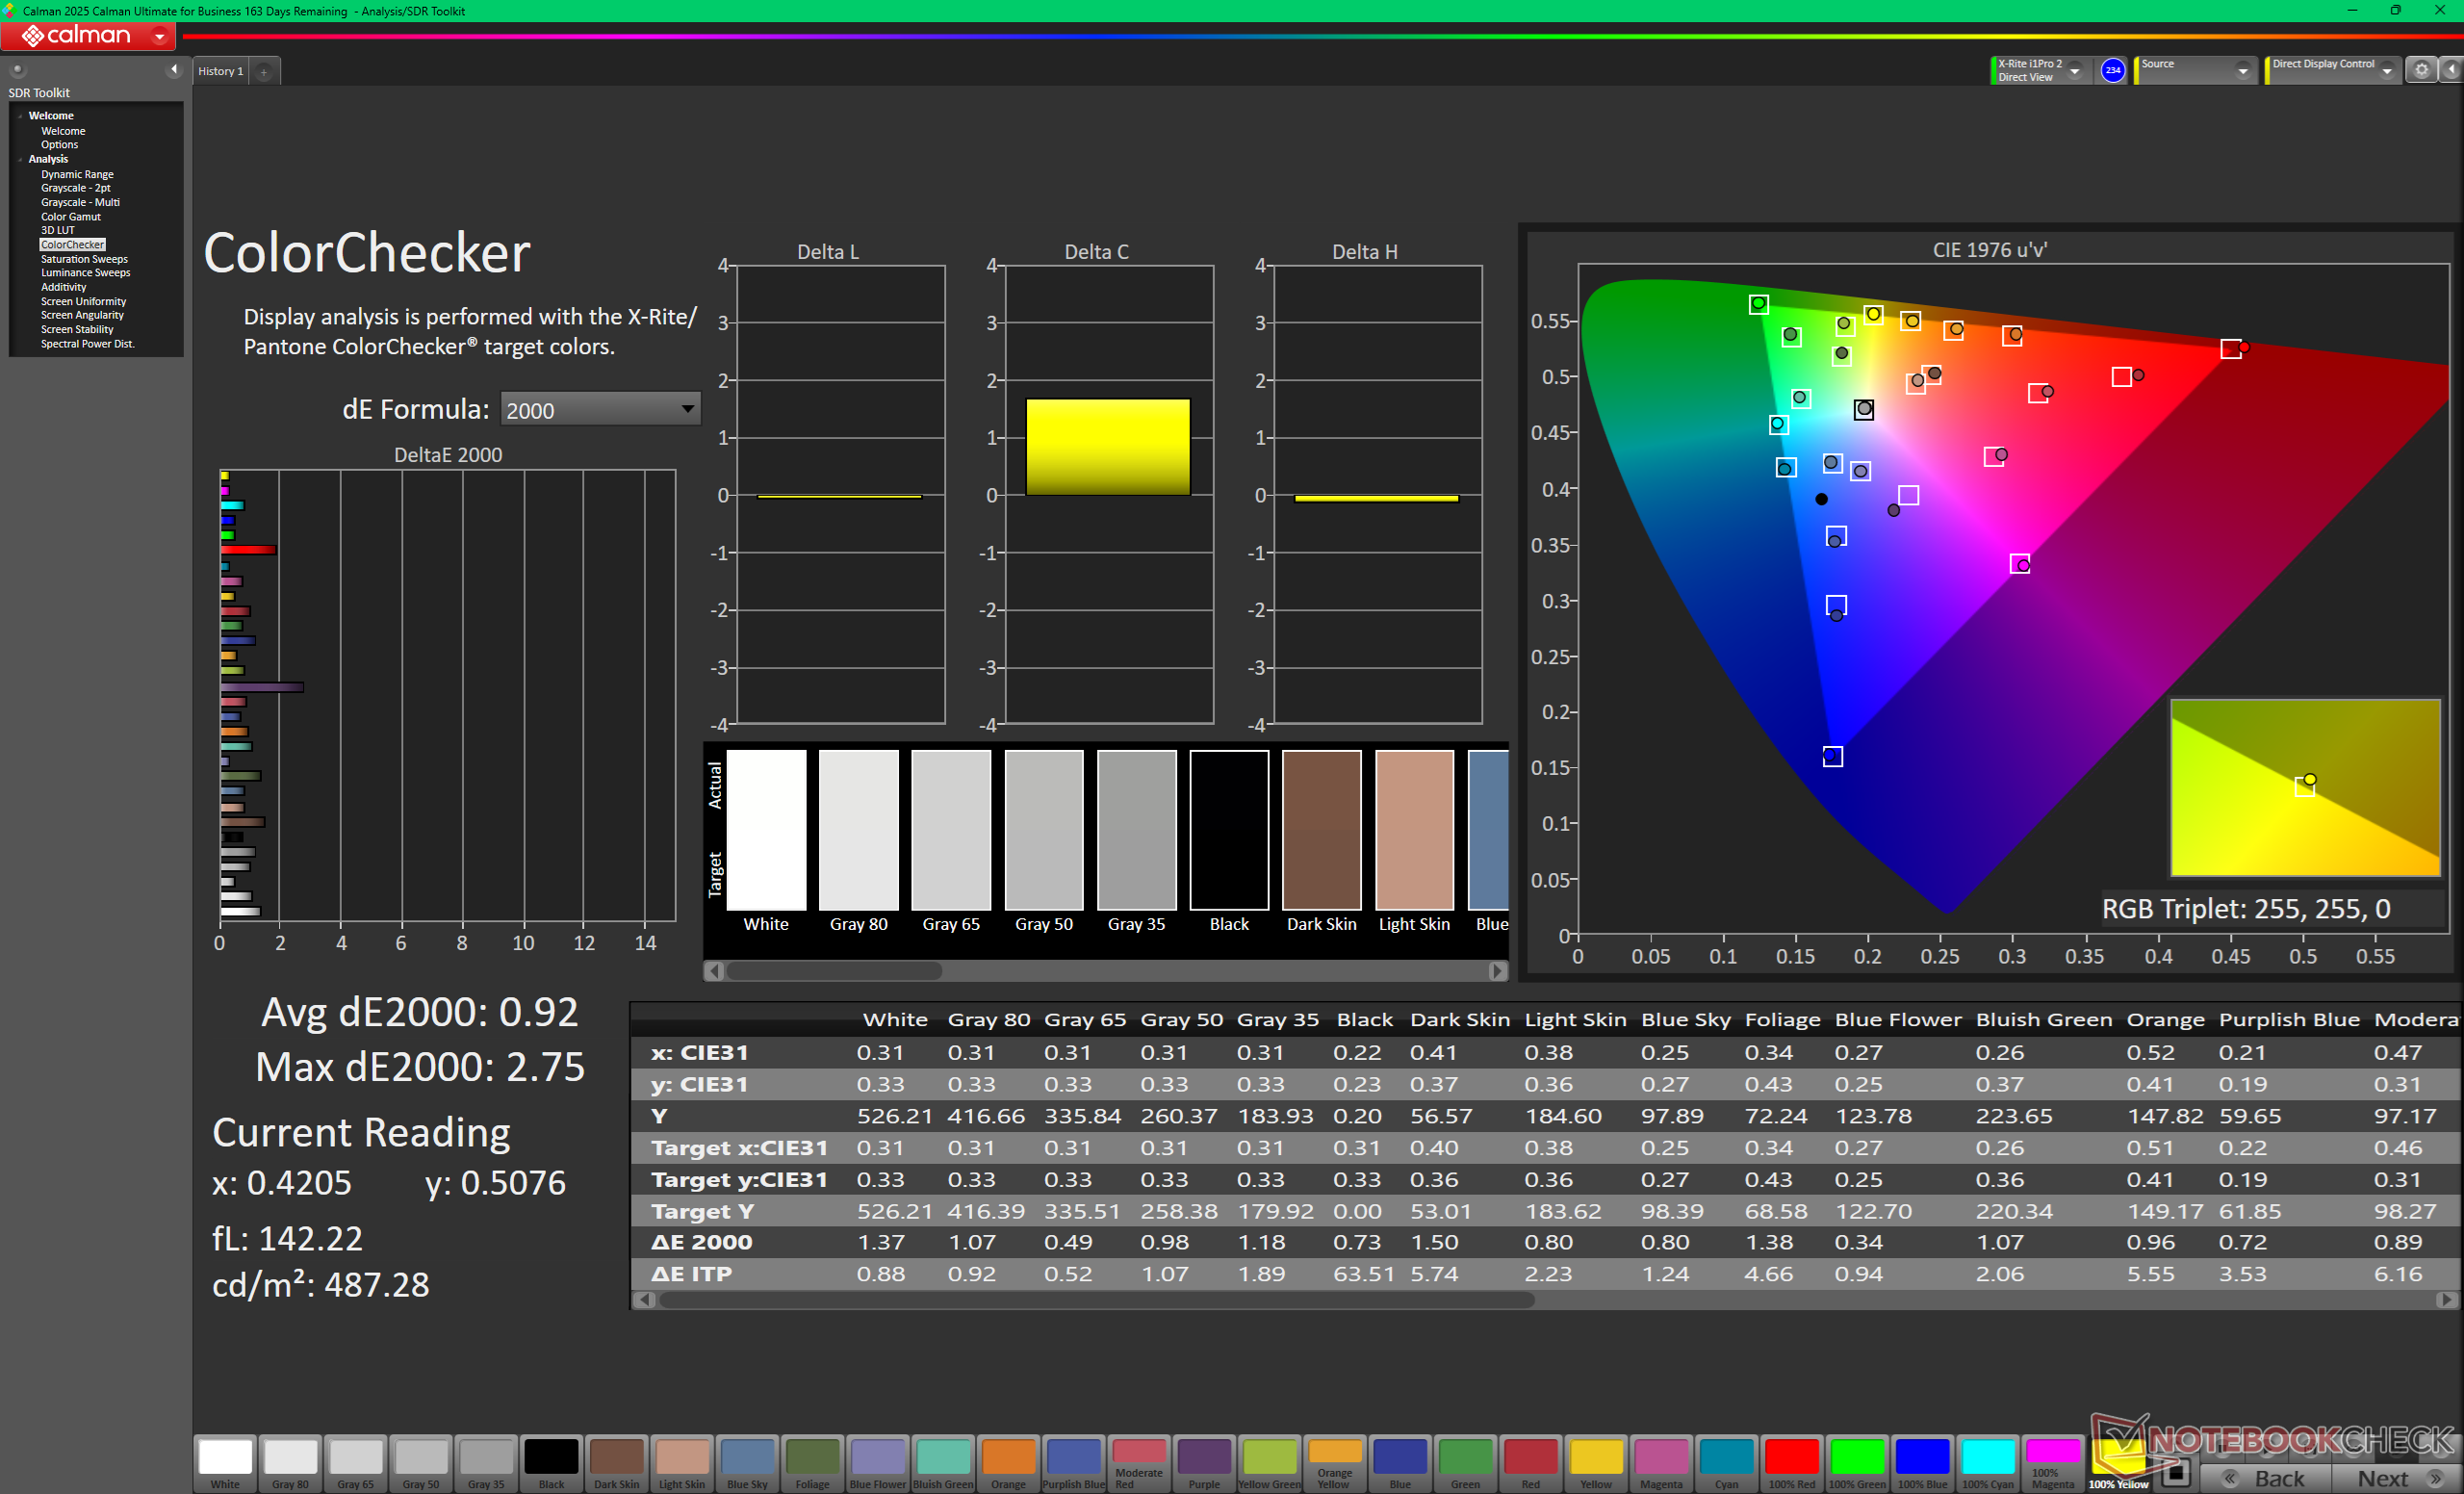
Dell non ha lesinato sul touchscreen nonostante il prezzo complessivo contenuto. Si tratta infatti di uno dei migliori display disponibili su qualsiasi subnotebook da 13 pollici venduto a un prezzo ben inferiore ai 1.000 dollari. I colori sono calibrati e vivaci con una copertura P3 superiore al 95%, il contrasto è elevato per uno schermo IPS (circa 2000:1) e la luminosità è ottima, superiore a 500 nit. Il supporto HDR limitato e i tempi di risposta bianco-nero piuttosto lenti dovrebbero avere poca importanza per il pubblico di riferimento, costituito da utenti d’ufficio e studenti.

512.7
cd/m²
482.1
cd/m²
508.7
cd/m²
496.8
cd/m²
539.3
cd/m²
491.6
cd/m²
495.9
cd/m²
510.1
cd/m²
487.6
cd/m²
Distribuzione della luminosità
LG Philips LP134WQ testato con X-Rite i1Pro 3
Massima: 539.3 cd/m² (Nits) Media: 502.8 cd/m² Minimum: 0.64 cd/m²
Distribuzione della luminosità: 89 %
Al centro con la batteria: 539.3 cd/m²
Contrasto: 2157:1 (Nero: 0.25 cd/m²)
ΔE ColorChecker Calman: 1.2 | ∀{0.5-29.43 Ø4.71}
calibrated: 0.92
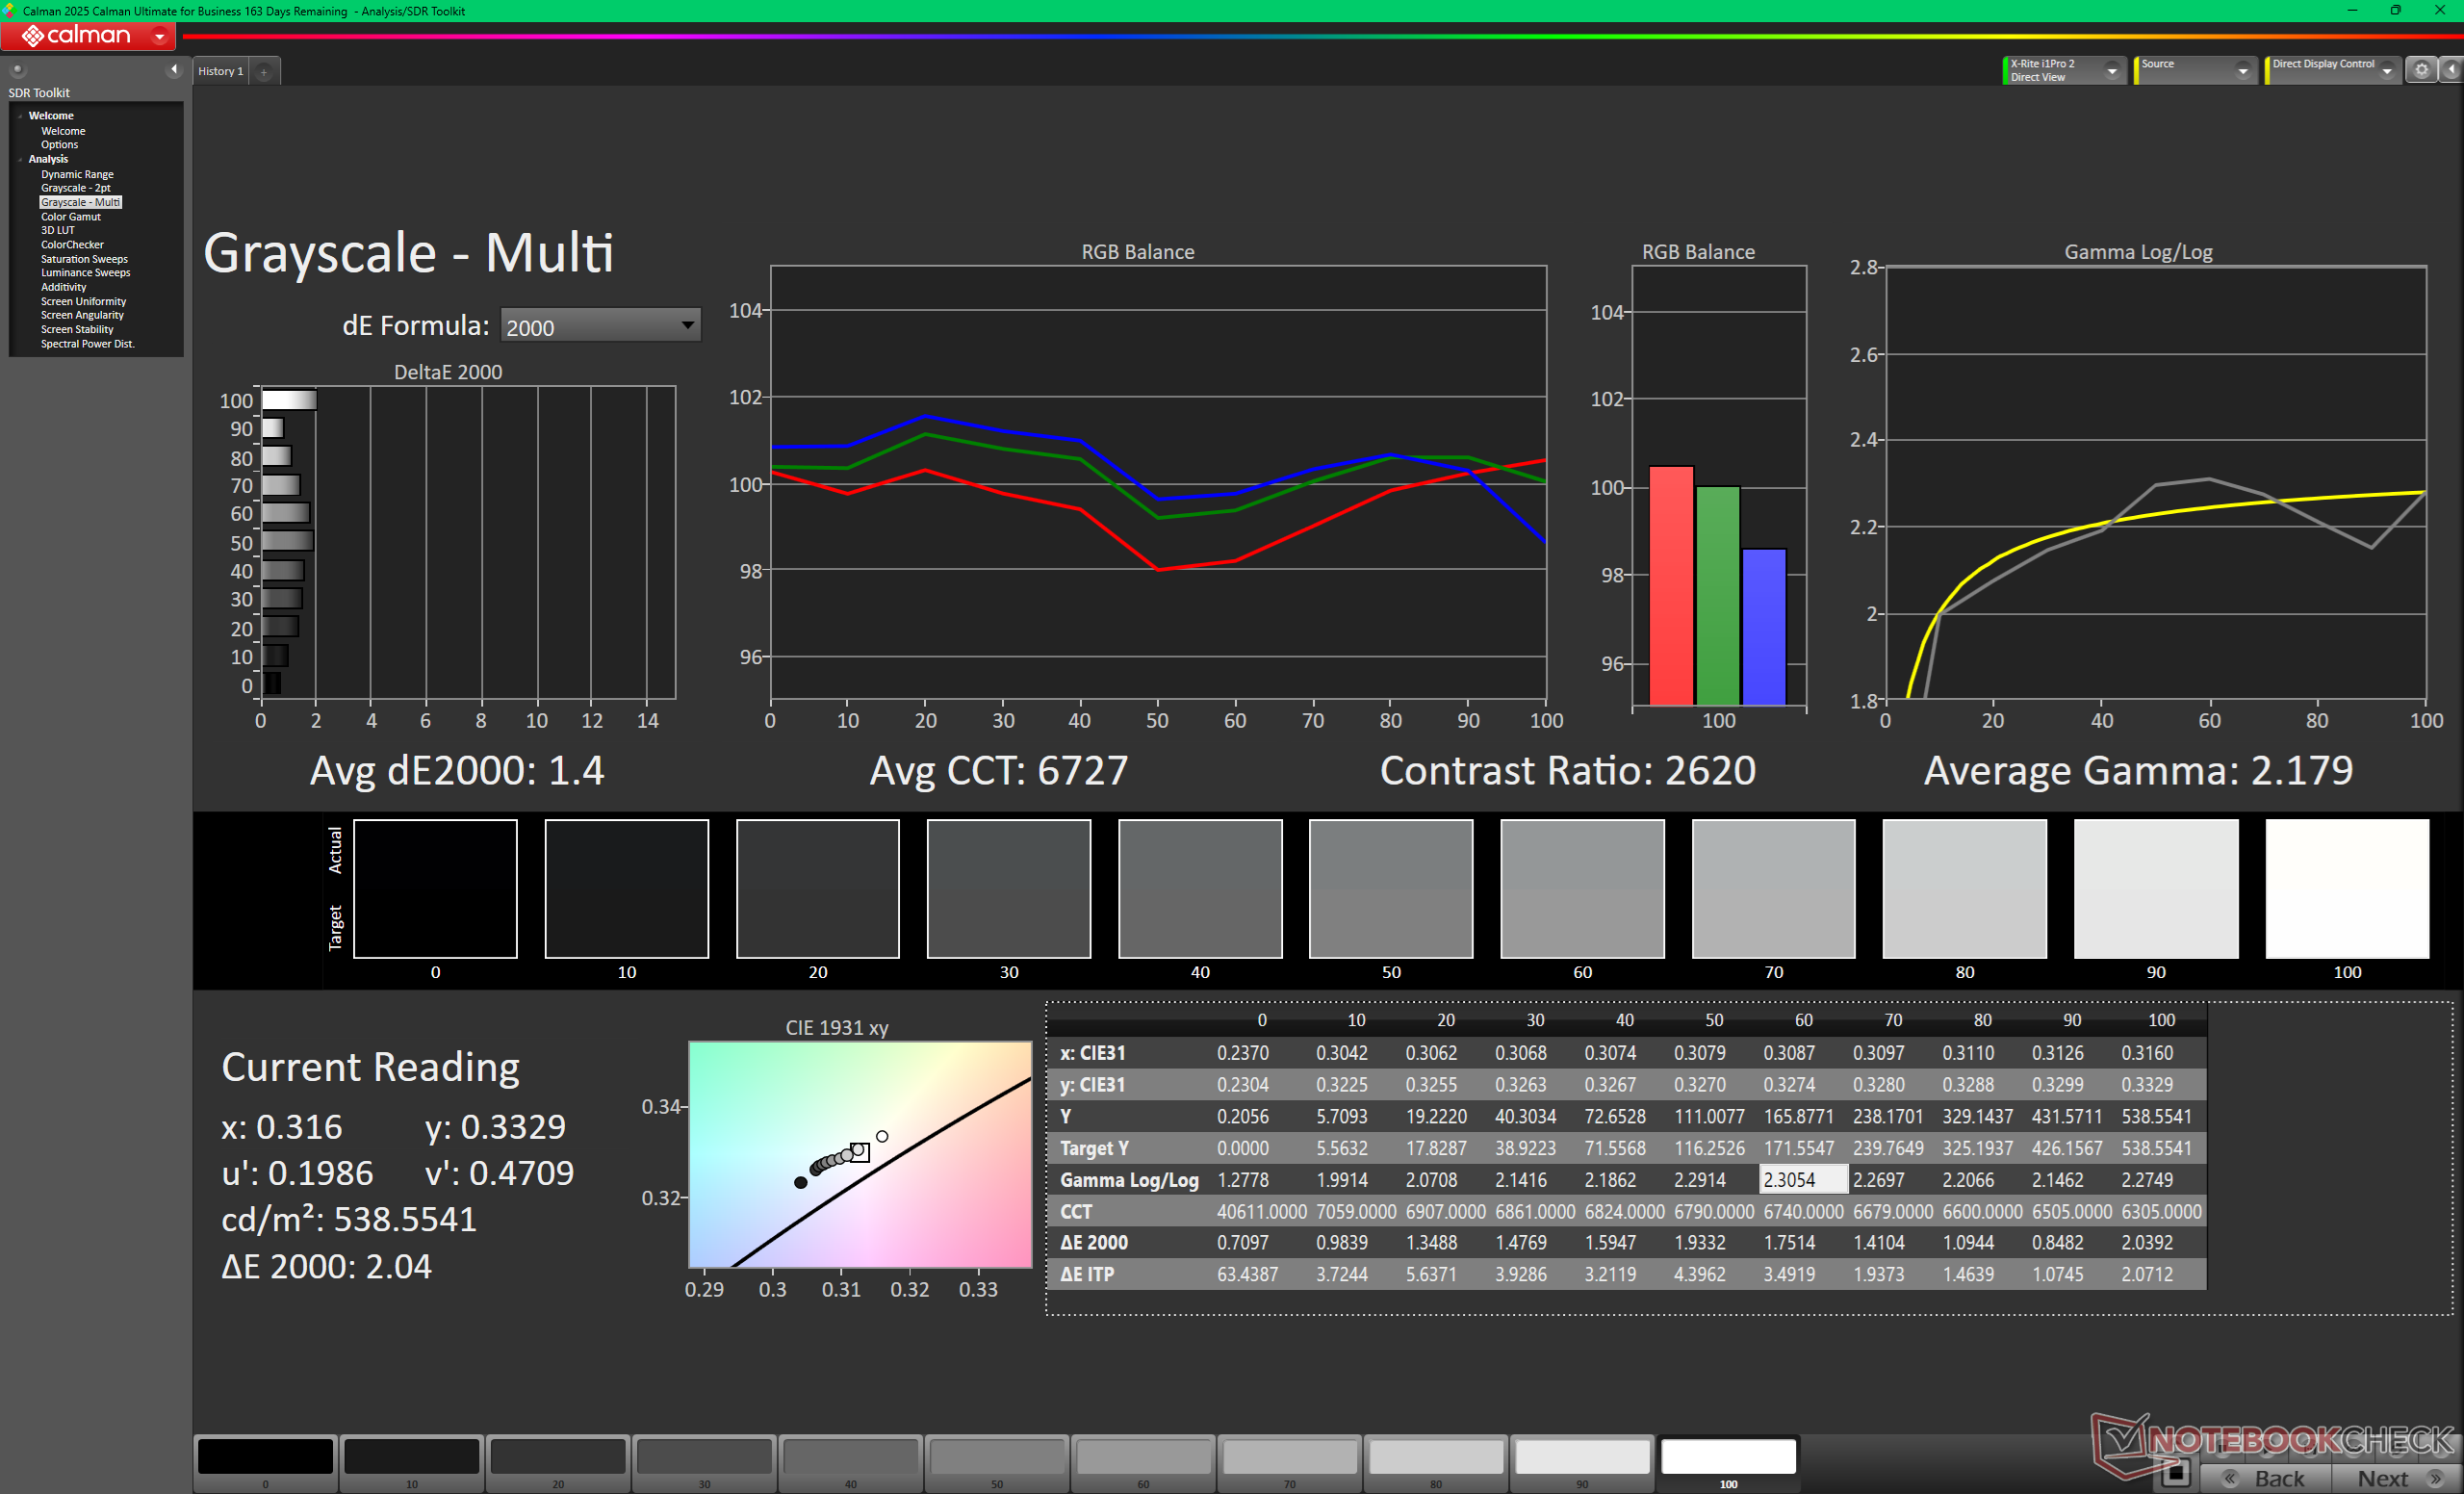
ΔE Greyscale Calman: 1.4 | ∀{0.09-98 Ø4.96}
87.6% AdobeRGB 1998 (Argyll 3D)
99.9% sRGB (Argyll 3D)
98.2% Display P3 (Argyll 3D)
Gamma: 2.2
CCT: 6727 K
Dell XPS 13 DX13260
LG Philips LP134WQ, IPS, 2560x1600, 13.4", 120 Hz
Dell XPS 14 Core Ultra X7 358H
LG Philips 140WT2, OLED, 2880x1800, 14", 120 Hz
Dell XPS 13 9350
LG Philips 134WU2, IPS, 1920x1200, 13.4", 120 Hz
Apple MacBook Neo 256 GB
IPS, 2408x1506, 13", 60 Hz
HP OmniBook 7 Aero 13-bg1077nr
LG Philips LGD0746, IPS, 1920x1200, 13.3", 60 Hz
Lenovo ThinkPad X1 Carbon Gen 14 21V70075GE
B140UAX01.1, IPS, 1920x1200, 14", 60 Hz
Display
5%
-18%
-15%
-19%
-16%
Display P3 Coverage (%)
98.2
99.7
2%
67.3
-31%
72.2
-26%
66.5
-32%
69.8
-29%
sRGB Coverage (%)
99.9
100
0%
99
-1%
97.9
-2%
96.8
-3%
99.1
-1%
AdobeRGB 1998 Coverage (%)
87.6
98.2
12%
68.6
-22%
72.6
-17%
67.3
-23%
72
-18%
Response Times
98%
25%
58%
13%
33%
Response Time Grey 50% / Grey 80% * (ms)
51.2 ?(23.6, 27.6)
0.75 ?(0.43, 0.32)
99%
37.3 ?(17, 20.3)
27%
20.8 ?(9.2, 11.6)
59%
44.7 ?(20.3, 24.4)
13%
42 ?(19.4, 22.6)
18%
Response Time Black / White * (ms)
33.6 ?(14, 19.6)
1.03 ?(0.53, 0.5)
97%
25.9 ?(12.5, 13.4)
23%
14.6 ?(4.3, 10.3)
57%
29.7 ?(14.8, 14.9)
12%
17.7 ?(7.2, 10.5)
47%
PWM Frequency (Hz)
240.62 ?(100)
PWM Amplitude * (%)
29
Screen
-9%
6%
-14%
-94%
-122%
Brightness middle (cd/m²)
539.3
393.8
-27%
462.8
-14%
548
2%
442
-18%
540
0%
Brightness (cd/m²)
503
389
-23%
435
-14%
519
3%
420
-17%
524
4%
Brightness Distribution (%)
89
96
8%
87
-2%
91
2%
88
-1%
93
4%
Black Level * (cd/m²)
0.25
0.19
24%
0.48
-92%
0.3
-20%
0.3
-20%
Contrast (:1)
2157
2436
13%
1142
-47%
1473
-32%
1800
-17%
Colorchecker dE 2000 *
1.2
1.27
-6%
1.92
-60%
1.4
-17%
4.34
-262%
5
-317%
Colorchecker dE 2000 max. *
3.63
3.35
8%
3.45
5%
3.1
15%
9.71
-167%
12.2
-236%
Colorchecker dE 2000 calibrated *
0.92
0.71
23%
0.48
48%
0.4
57%
0.58
37%
1.1
-20%
Greyscale dE 2000 *
1.4
2
-43%
0.6
57%
2.1
-50%
6.5
-364%
8.3
-493%
Gamma
2.2 100%
2.19 100%
2.19 100%
2.24 98%
2.13 103%
2.22 99%
CCT
6727 97%
6379 102%
6539 99%
6870 95%
7466 87%
7068 92%
Media totale (Programma / Settaggio)
31% / 13%
4% / 4%
10% / -4%
-33% / -63%
-35% / -77%

* ... Meglio usare valori piccoli
vs. sRGB
vs. sRGB
vs. P3
vs. P3
Scala di grigi prima della calibrazione
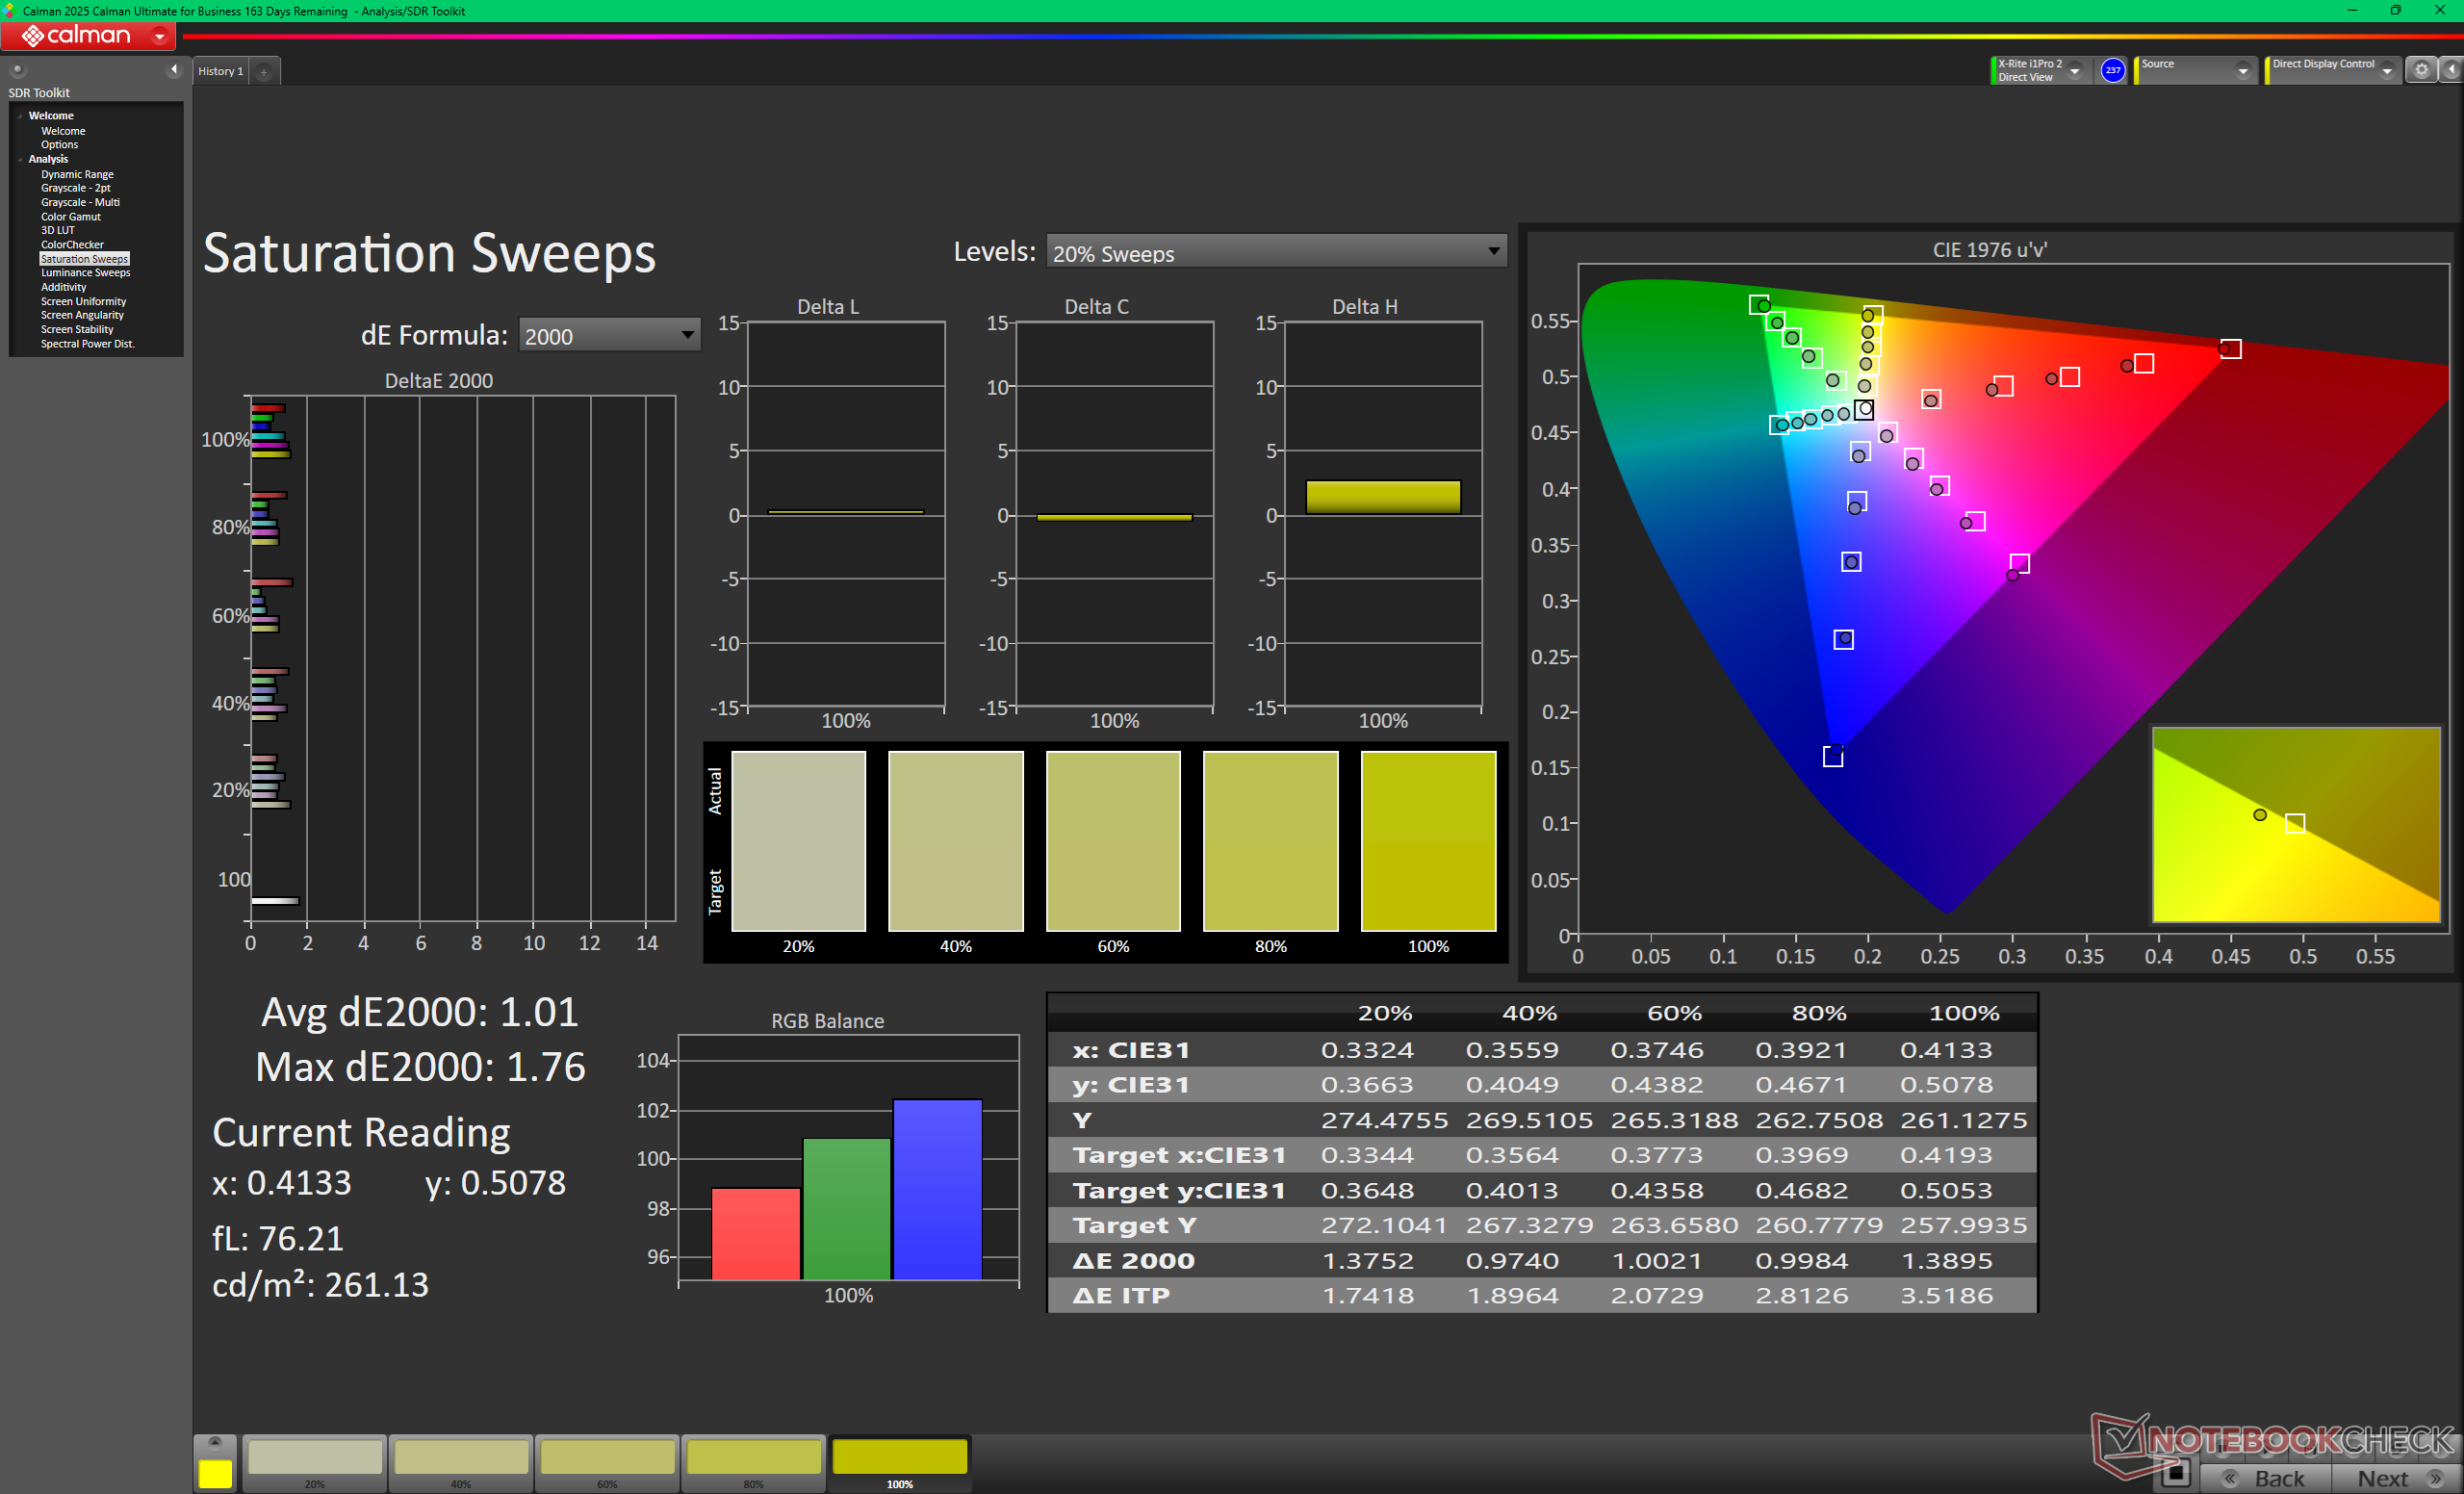
Scansioni di saturazione prima della calibrazione
ColorChecker prima della calibrazione
Scala di grigi dopo la calibrazione
Scansioni di saturazione dopo la calibrazione
ColorChecker dopo la calibrazione

Tempi di risposta del Display

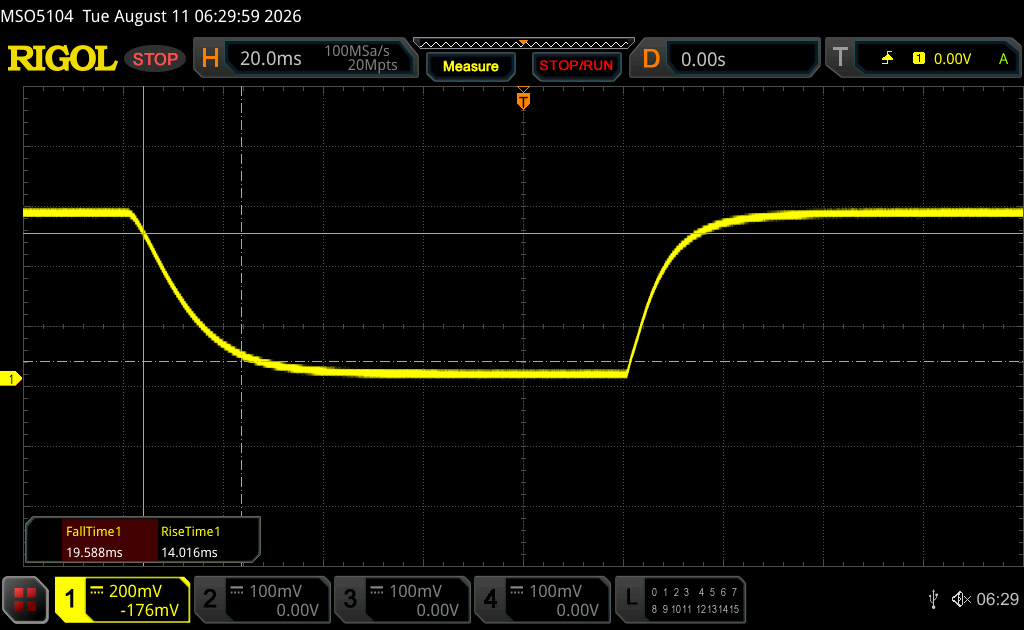
I tempi di risposta del display mostrano quanto sia veloce lo schermo a cambaire da un colore all'altro. Tempi di risposta lenti possono creare sovrapposizioni negloi oggetti in movimento. Specialmente i giocatori patiti del 3D dovrebbero usare uno schermo con tempi di risposta bassi.
       Tempi di risposta dal Nero al Bianco
33.6 ms ... aumenta ↗ e diminuisce ↘ combinato↗ 14 ms Incremento
↘ 19.6 ms Calo
Lo schermo mostra tempi di risposta lenti nei nostri tests e sarà insoddisfacente per i gamers.
In confronto, tutti i dispositivi di test variano da 0.1 (minimo) a 240 (massimo) ms. » 90 % di tutti i dispositivi è migliore.
Questo significa che i tempi di risposta rilevati sono peggiori rispetto alla media di tutti i dispositivi testati (19.8 ms).
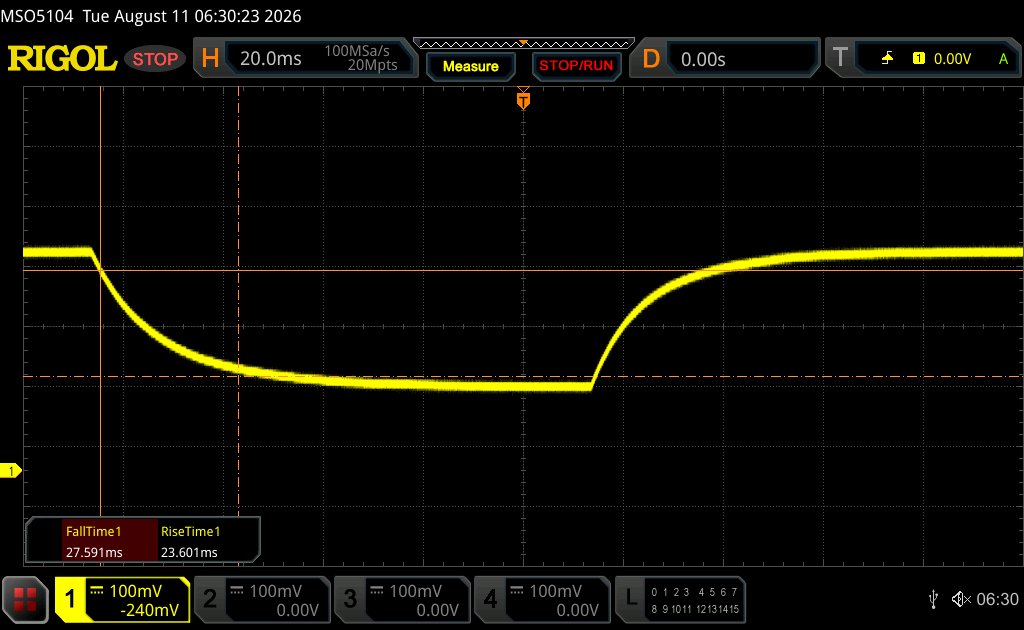
       Tempo di risposta dal 50% Grigio all'80% Grigio
51.2 ms ... aumenta ↗ e diminuisce ↘ combinato↗ 23.6 ms Incremento
↘ 27.6 ms Calo
Lo schermo mostra tempi di risposta lenti nei nostri tests e sarà insoddisfacente per i gamers.
In confronto, tutti i dispositivi di test variano da 0.165 (minimo) a 636 (massimo) ms. » 88 % di tutti i dispositivi è migliore.
Questo significa che i tempi di risposta rilevati sono peggiori rispetto alla media di tutti i dispositivi testati (30.9 ms).

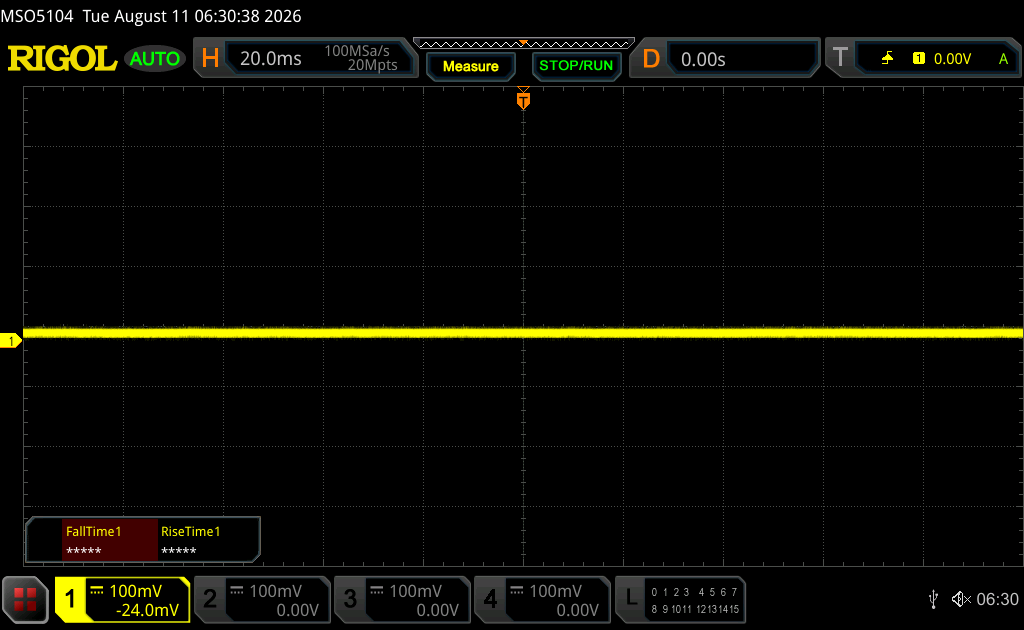
Sfarfallio dello schermo / PWM (Pulse-Width Modulation)

Per ridurre la luminosità dello schermo, alcuni portatili accendono e spengono la retroilluminazione in rapida successione - un metodo chiamato Pulse Width Modulation (PWM). Questa frequenza di ciclo a livello ideale non dovrebbe essere percepibile dall'occhi umano. Se tale frequenza è troppo bassa, gli utenti con occhi sensibili potrebbero stancarsi gli occhi o avere mal di testa o anche notare uno sfarfallio.
flickering dello schermo / PWM non rilevato

In confronto: 52 % di tutti i dispositivi testati non utilizza PWM per ridurre la luminosita' del display. Se è rilevato PWM, una media di 7735 (minimo: 5 - massimo: 343500) Hz è stata rilevata.

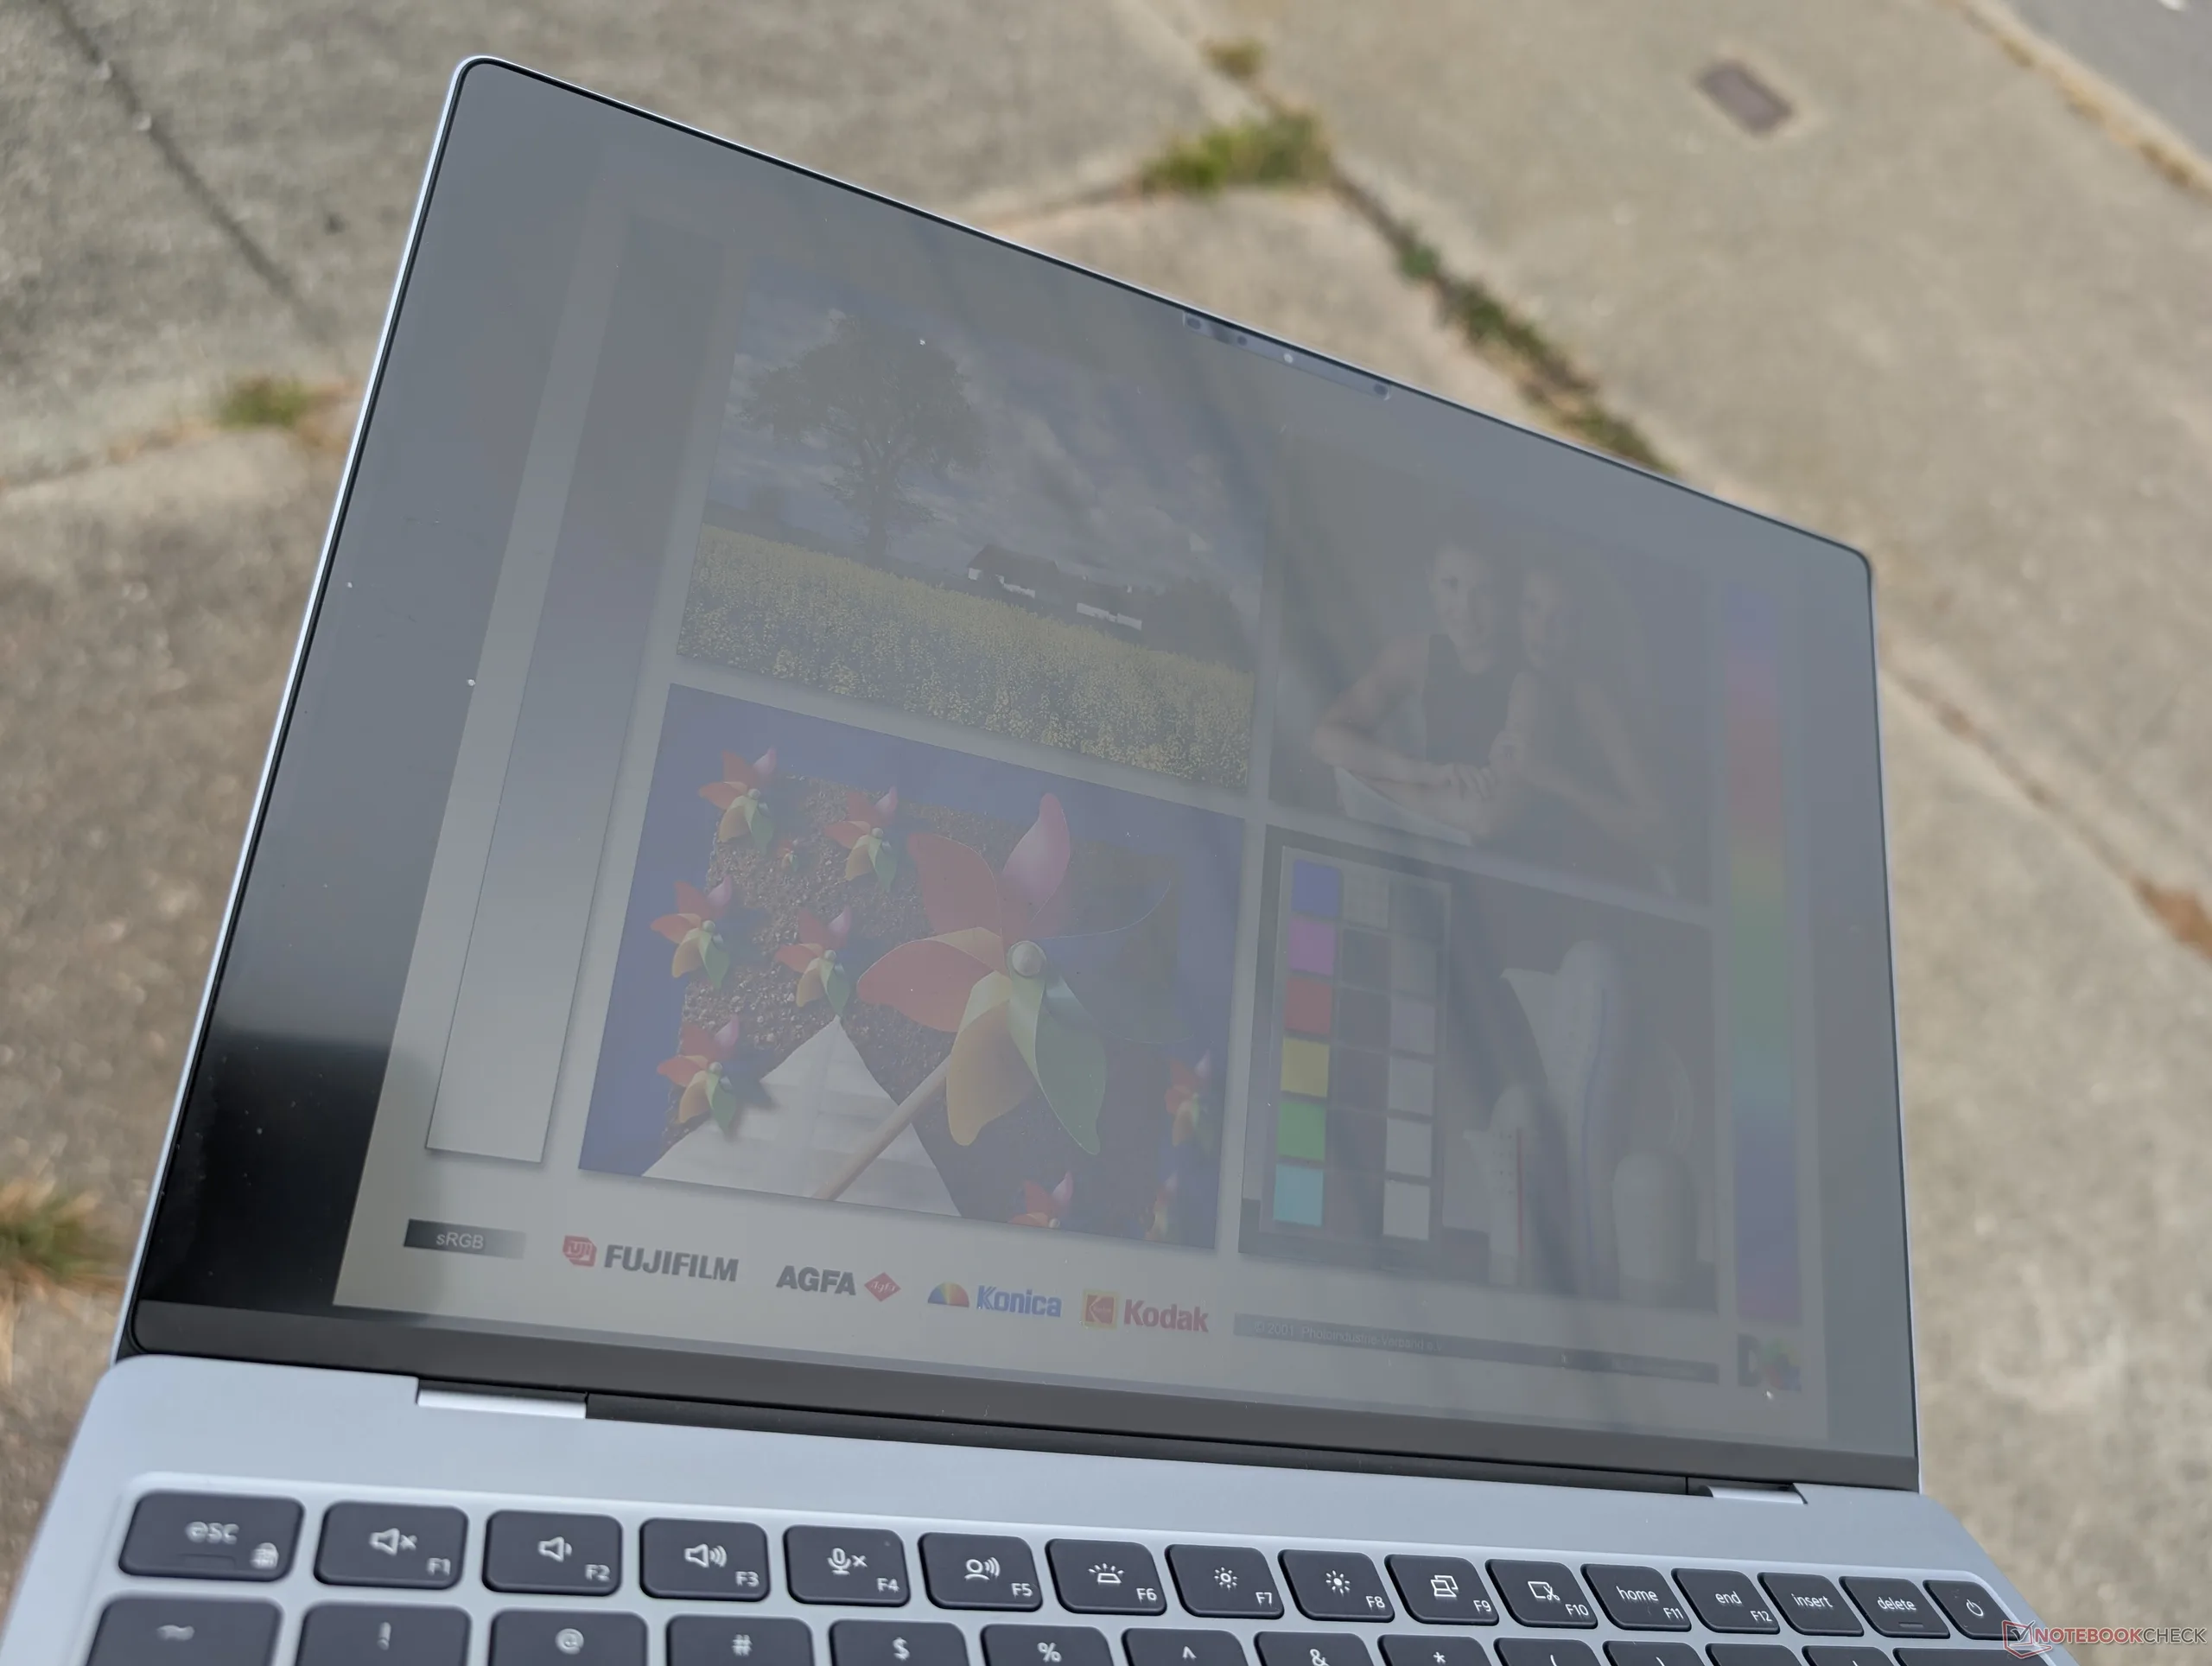
All’aperto, sotto un cielo nuvoloso ma luminoso
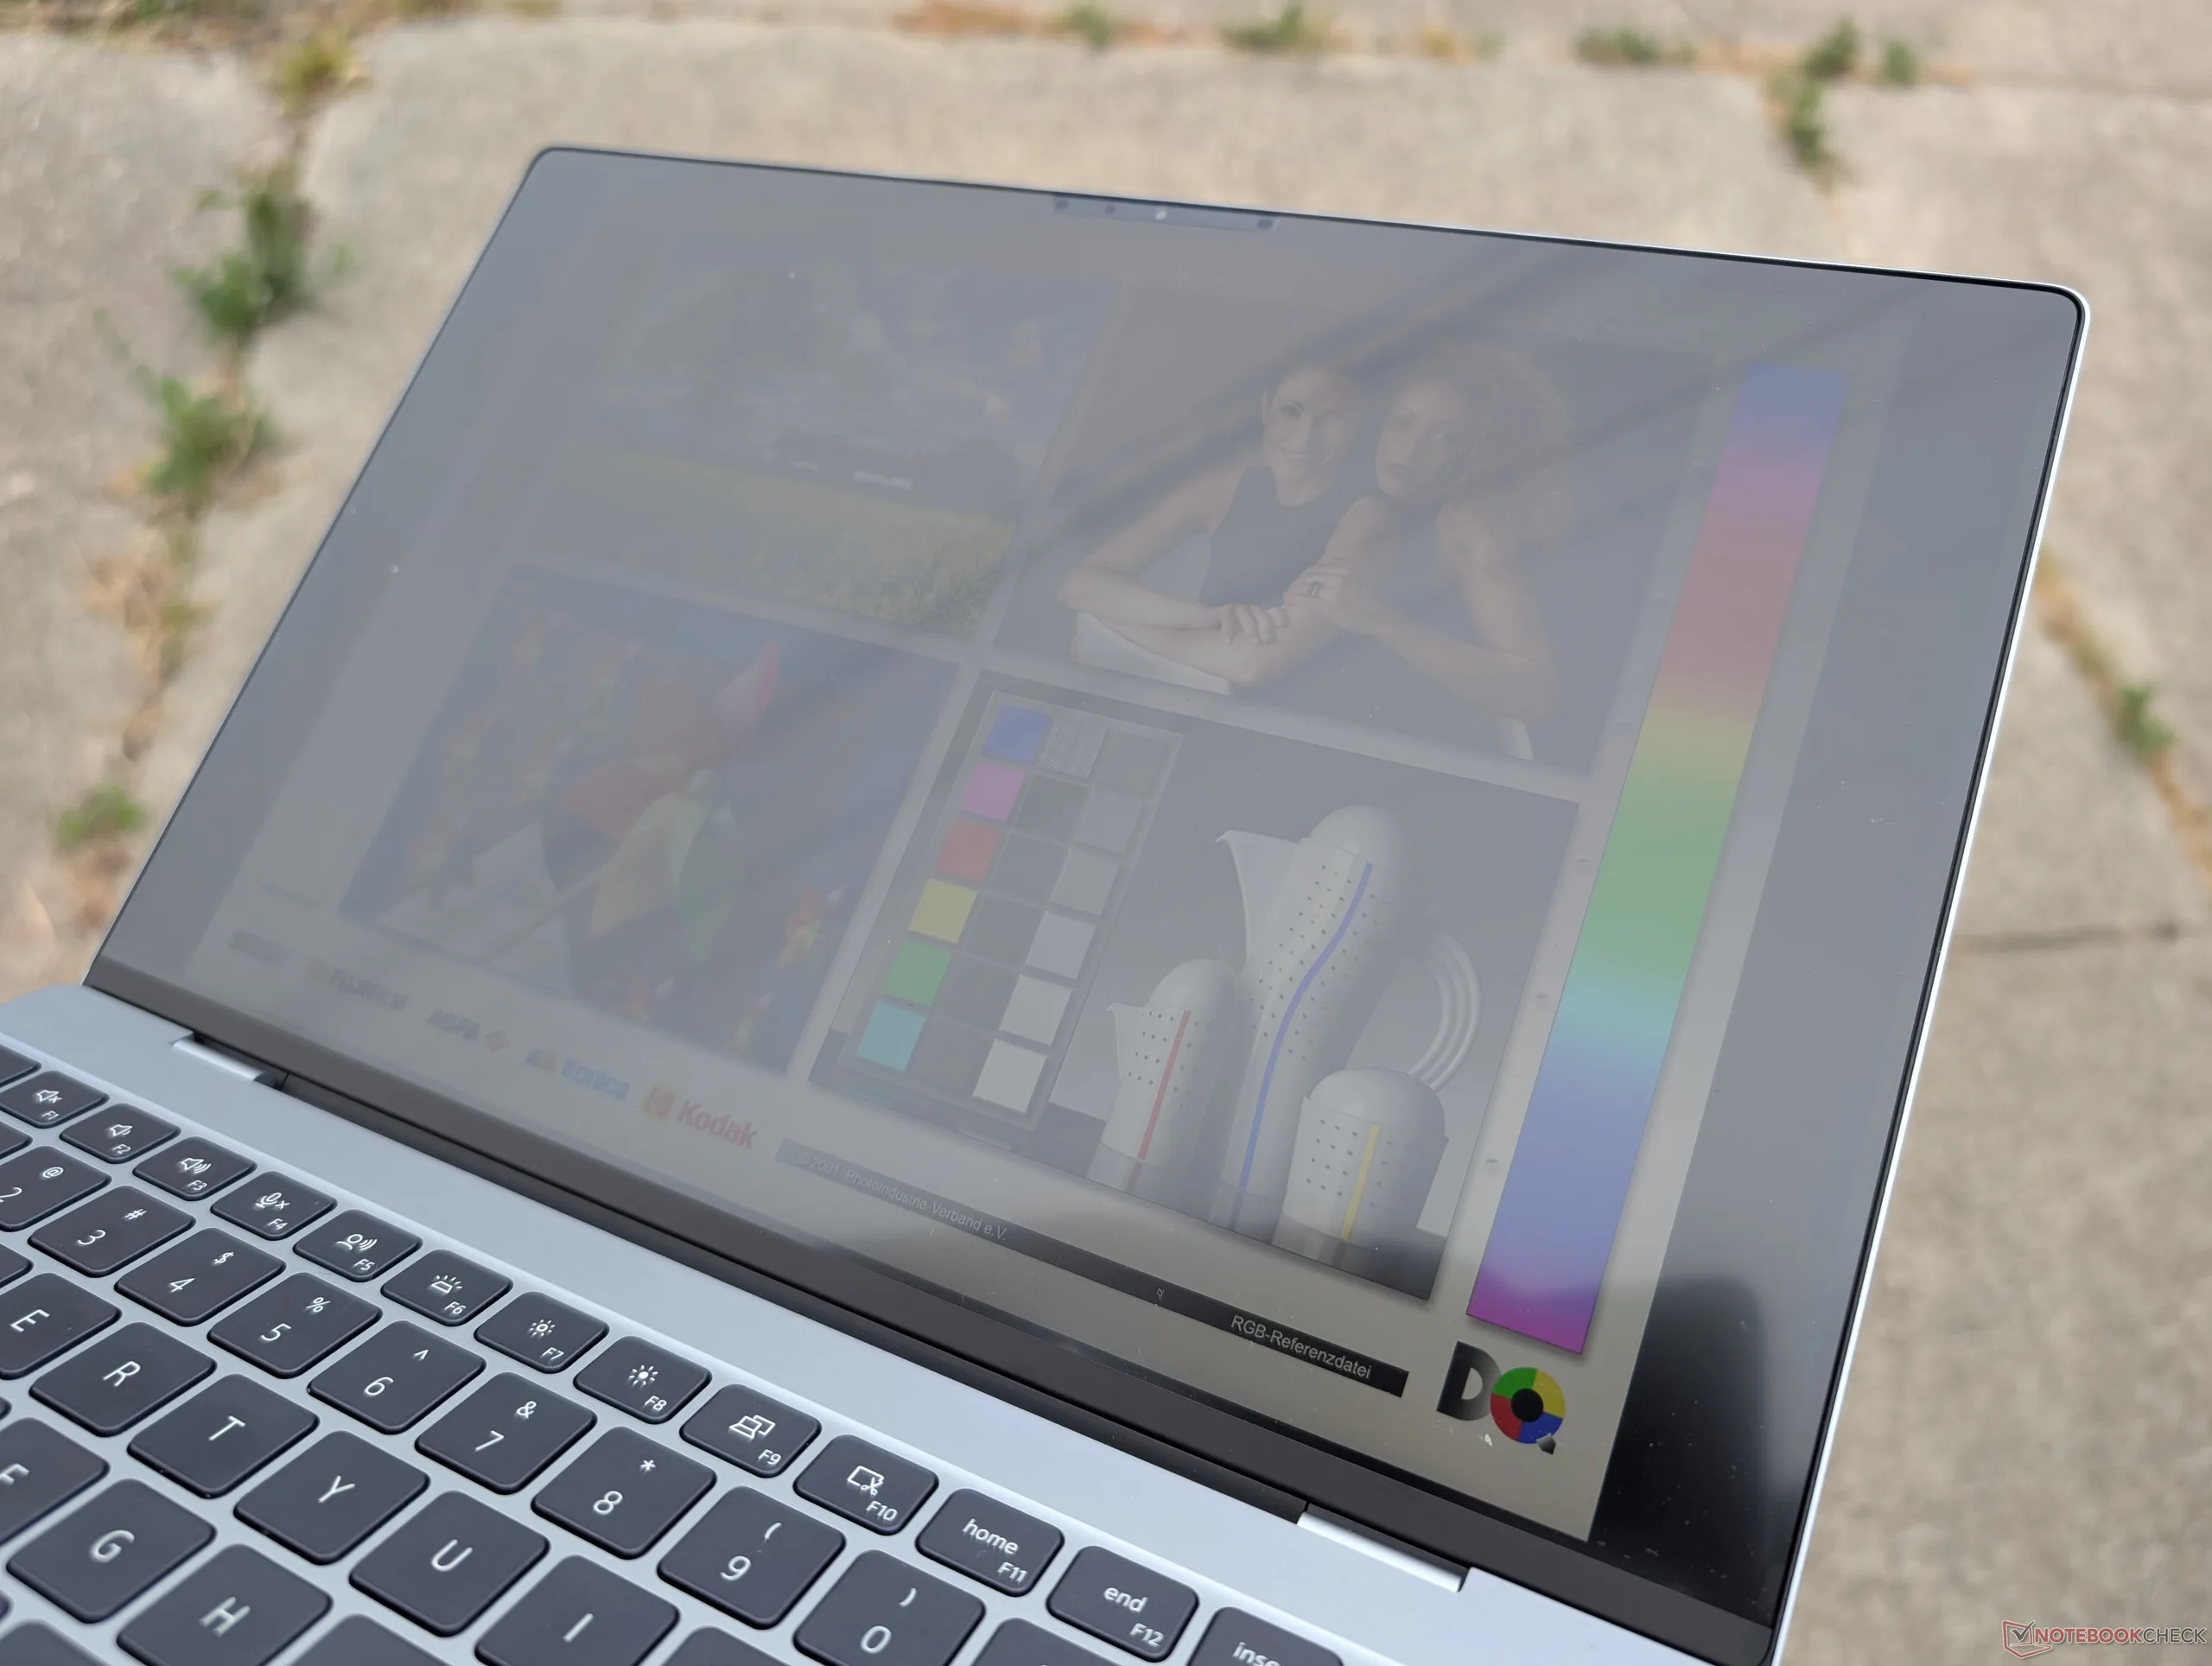
Buona visibilità all’aperto anche in condizioni di ombra
All’aperto, sotto un cielo nuvoloso ma luminoso
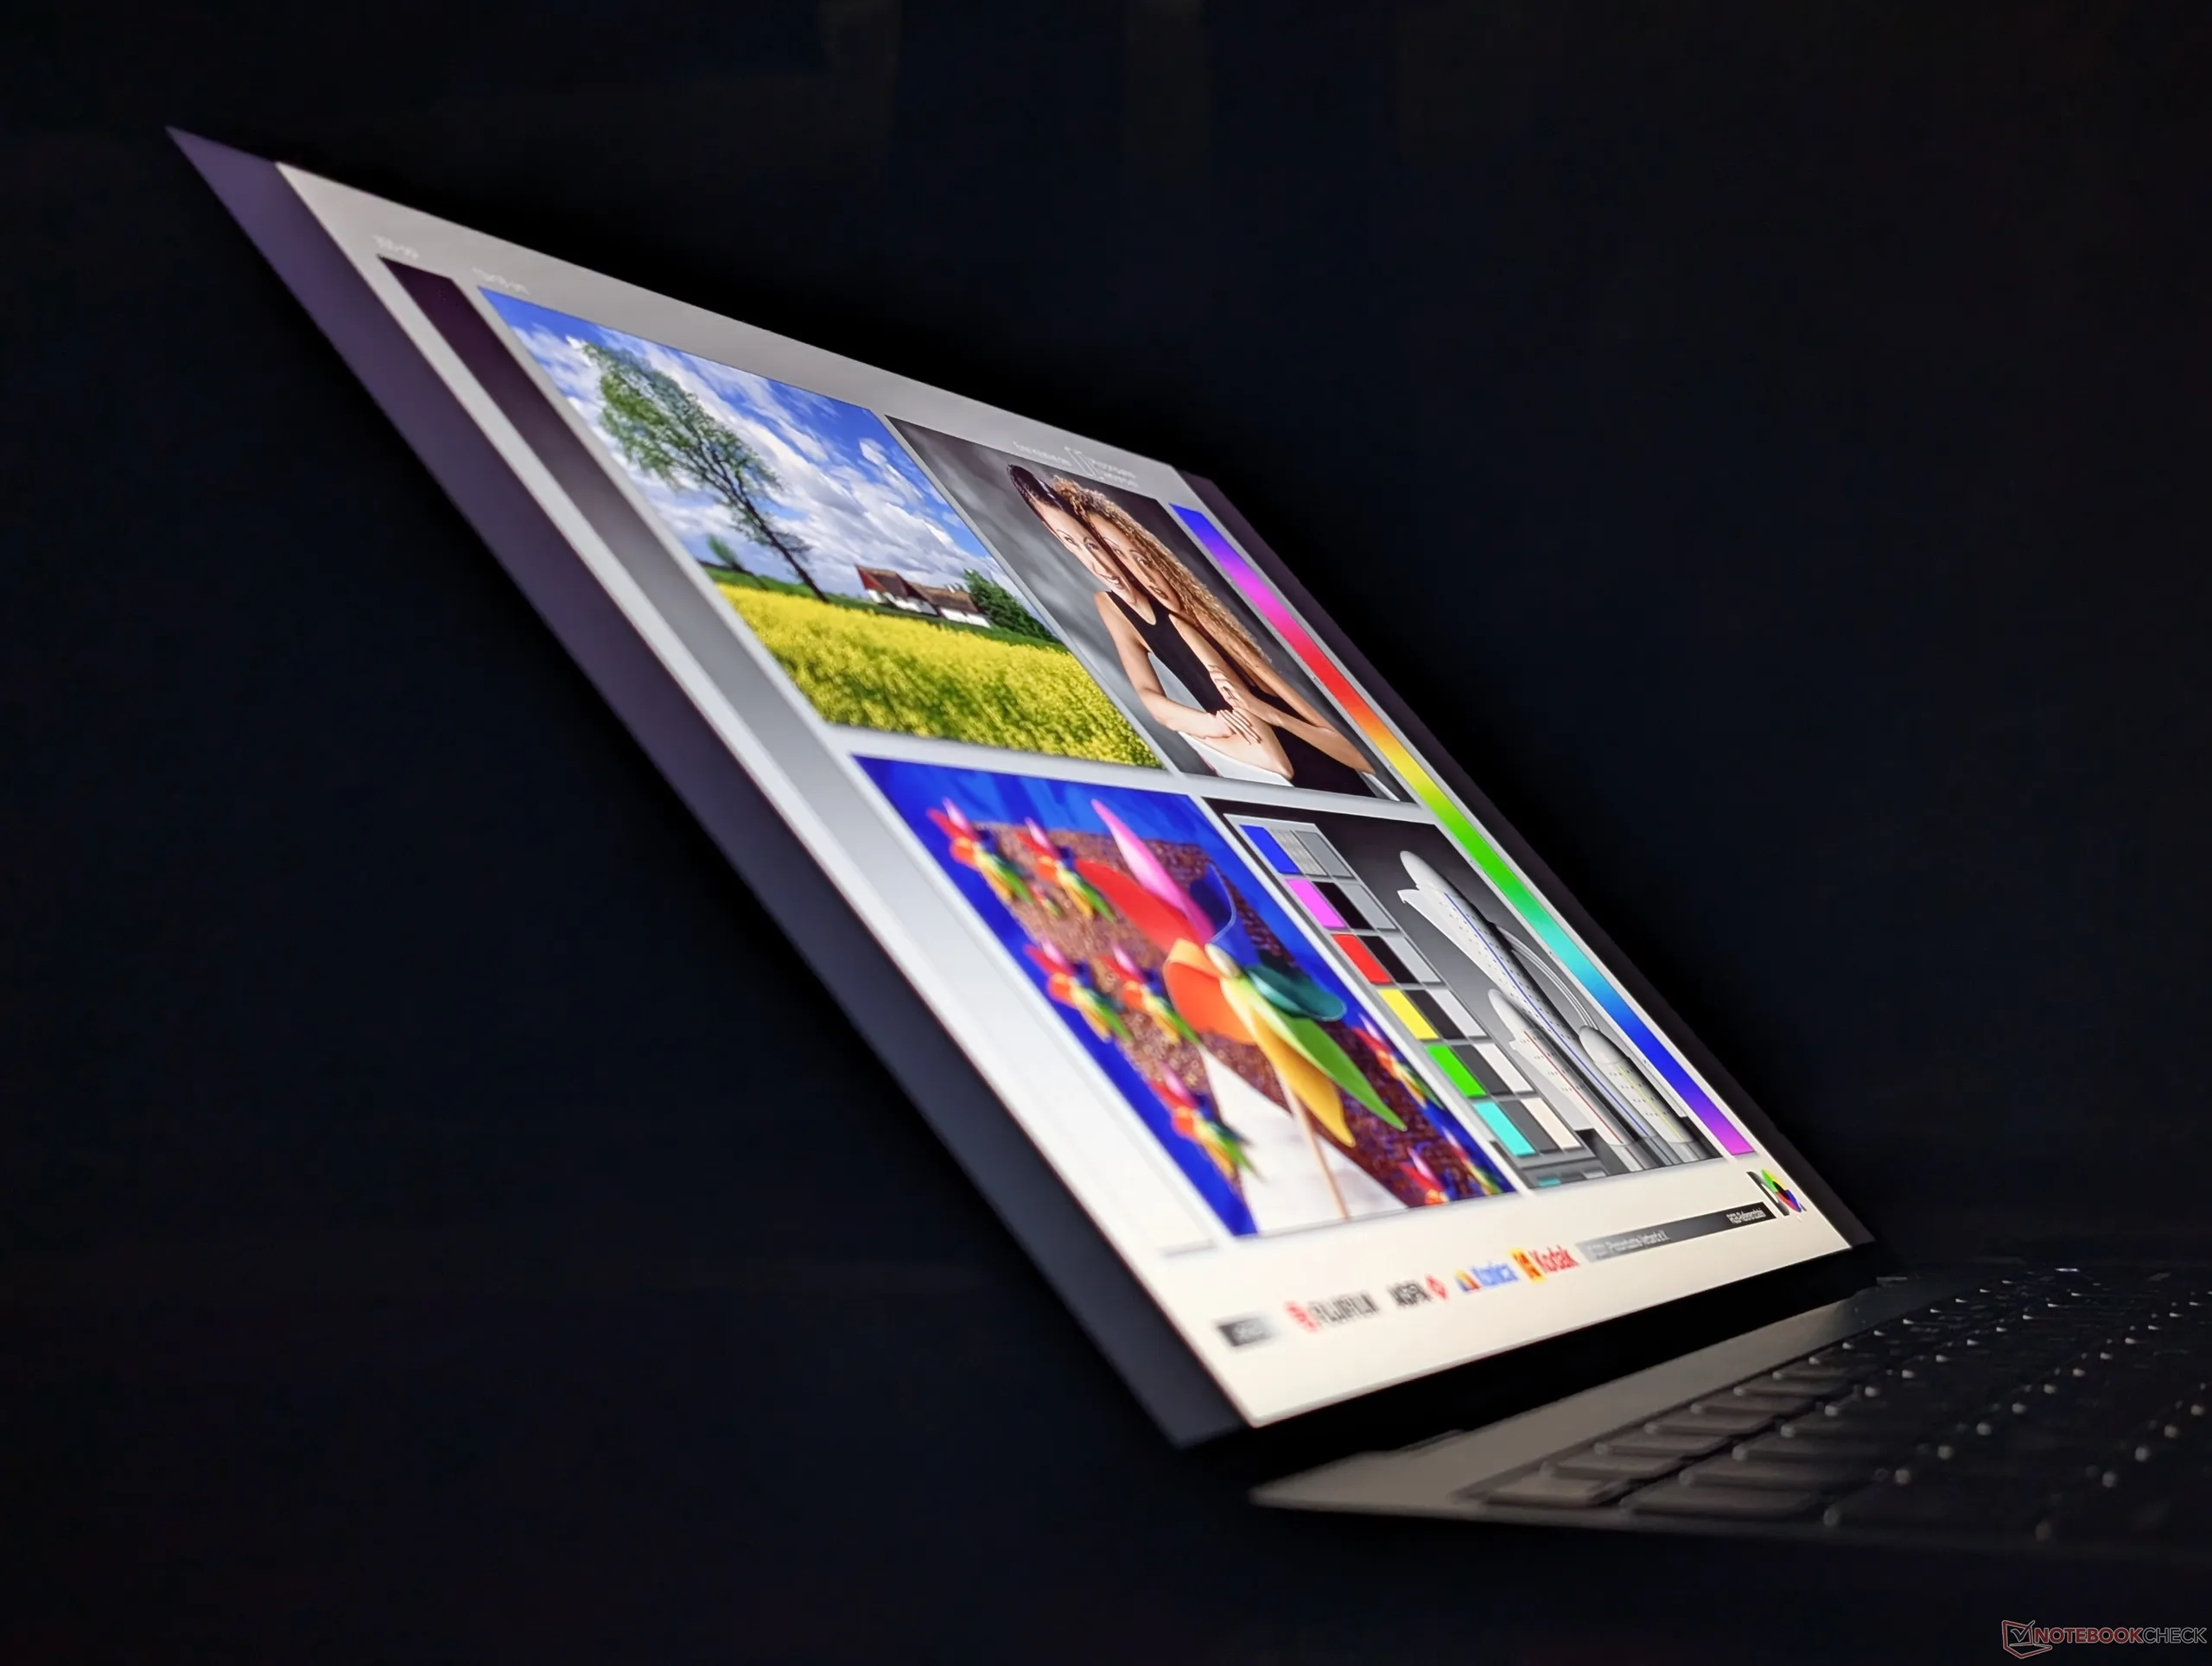
Ampi angoli di visione IPS

Prestazioni

Condizioni di prova

Prima di eseguire i benchmark riportati di seguito, abbiamo impostato Windows in modalità «Bilanciata», come raccomandato dal produttore.

Prestazioni del processore

Le prestazioni multi-thread "grezze" del Core 5 320 sono solo leggermente superiori a quelle del Core i7-1185G7, un modello di cinque anni fa. Il passaggio al Core Ultra 7 355 potrebbe rivelarsi vantaggioso per chi svolge attività multitasking più impegnative, poiché aumenterebbe significativamente le prestazioni multi-thread di oltre l'80%.

Cinebench R15 Multi Loop

065130195260325390455520585650715780845910975104011051170123513001365143014951560162516901755182018851950201520802145221022752340240524702535260026652730279528602925299030553120Tooltip
Dell XPS 13 DX13260 Intel Core 5 320: Ø940 (856.35-1053.52) Points
Dell XPS 14 Core Ultra X7 358H Intel Core Ultra X7 358H: Ø2340 (2099.85-3134.55) Points
Dell XPS 13 9350 Intel Core Ultra 7 256V: Ø1415 (1369.16-1569.86) Points
HP OmniBook 7 Aero 13-bg1077nr AMD Ryzen AI 7 350: Ø1989 (1917.36-2037.7) Points
Lenovo ThinkPad X1 Carbon Gen 14 21V70075GE Intel Core Ultra 5 325: Ø1617 (1603.78-1670.43) Points
CPU Performance rating: Percent
Cinebench R23: Multi Core | Single Core
Cinebench R20: CPU (Multi Core) | CPU (Single Core)
Cinebench R15: CPU Multi 64Bit | CPU Single 64Bit
Blender: v2.79 BMW27 CPU
7-Zip 18.03: 7z b 4 | 7z b 4 -mmt1
Geekbench 6.7: Multi-Core | Single-Core
Geekbench 5.5: Multi-Core | Single-Core
HWBOT x265 Benchmark v2.2: 4k Preset
LibreOffice : 20 Documents To PDF
R Benchmark 2.5: Overall mean
CPU Performance rating
Dell XPS 14 Core Ultra X7 358H
Intel Core Ultra X7 358H
87.7 pt
Apple MacBook Neo 256 GB -14!
Apple A18 Pro
76.7 pt
HP OmniBook 7 Aero 13-bg1077nr
AMD Ryzen AI 7 350
73 pt
Dell XPS 14 Core Ultra 7 355
Intel Core Ultra 7 355
66.3 pt
Lenovo ThinkPad X1 Carbon Gen 14 21V70075GE
Intel Core Ultra 5 325
64.9 pt
Dell XPS 13 9350
Intel Core Ultra 7 256V
62.8 pt
HP EliteBook 8 Flip G1i 13
Intel Core Ultra 7 265U
59 pt
Dell Latitude 13 7330 -2!
Intel Core i7-1265U
53.4 pt
Lenovo ThinkPad L13 2in1 G5 21LNS4AM00
Intel Core Ultra 5 125U
53.3 pt
Media Intel Core 5 320
 
51.5 pt
Dell XPS 13 DX13260
Intel Core 5 320
51.4 pt
Alldocube iWork GT Ultra -1!
Intel Core Ultra 5 125H
49.4 pt
Microsoft Surface Pro 8, i7-1185G7 -2!
Intel Core i7-1185G7
41.6 pt
Cinebench R23 / Multi Core
Dell XPS 14 Core Ultra X7 358H
Intel Core Ultra X7 358H
18932 (14811.1min - 18932.2max) Points +206%
HP OmniBook 7 Aero 13-bg1077nr
AMD Ryzen AI 7 350
14244 (12235.7min - 14243.7max) Points +130%
Dell XPS 14 Core Ultra 7 355
Intel Core Ultra 7 355
11348 (10188.4min - 11347.5max) Points +83%
Lenovo ThinkPad X1 Carbon Gen 14 21V70075GE
Intel Core Ultra 5 325
10980 Points +77%
HP EliteBook 8 Flip G1i 13
Intel Core Ultra 7 265U
10623 (8296.55min - 10623.2max) Points +71%
Dell XPS 13 9350
Intel Core Ultra 7 256V
10391 (9371.44min - 10390.8max) Points +68%
Lenovo ThinkPad L13 2in1 G5 21LNS4AM00
Intel Core Ultra 5 125U
10372 Points +67%
Alldocube iWork GT Ultra
Intel Core Ultra 5 125H
8419 Points +36%
Dell Latitude 13 7330
Intel Core i7-1265U
8108 (6277.1min - 8107.56max) Points +31%
Dell XPS 13 DX13260
Intel Core 5 320
6197 (6096.49min - 6196.88max) Points
Media Intel Core 5 320
  (n=1)
6197 Points 0%
Microsoft Surface Pro 8, i7-1185G7
Intel Core i7-1185G7
5668 Points -9%
Cinebench R23 / Single Core
Dell XPS 14 Core Ultra X7 358H
Intel Core Ultra X7 358H
2086 Points +8%
HP OmniBook 7 Aero 13-bg1077nr
AMD Ryzen AI 7 350
1979 Points +3%
Dell XPS 14 Core Ultra 7 355
Intel Core Ultra 7 355
1940 Points +1%
Dell XPS 13 DX13260
Intel Core 5 320
1926 Points
Media Intel Core 5 320
  (n=1)
1926 Points 0%
Lenovo ThinkPad X1 Carbon Gen 14 21V70075GE
Intel Core Ultra 5 325
1892 Points -2%
Dell XPS 13 9350
Intel Core Ultra 7 256V
1875 Points -3%
HP EliteBook 8 Flip G1i 13
Intel Core Ultra 7 265U
1749 Points -9%
Dell Latitude 13 7330
Intel Core i7-1265U
1738 Points -10%
Lenovo ThinkPad L13 2in1 G5 21LNS4AM00
Intel Core Ultra 5 125U
1586 Points -18%
Alldocube iWork GT Ultra
Intel Core Ultra 5 125H
1539 Points -20%
Microsoft Surface Pro 8, i7-1185G7
Intel Core i7-1185G7
1512 Points -21%
Cinebench R20 / CPU (Multi Core)
Dell XPS 14 Core Ultra X7 358H
Intel Core Ultra X7 358H
7437 Points +214%
HP OmniBook 7 Aero 13-bg1077nr
AMD Ryzen AI 7 350
5404 Points +128%
Dell XPS 14 Core Ultra 7 355
Intel Core Ultra 7 355
4359 Points +84%
Lenovo ThinkPad X1 Carbon Gen 14 21V70075GE
Intel Core Ultra 5 325
4250 Points +79%
HP EliteBook 8 Flip G1i 13
Intel Core Ultra 7 265U
4061 Points +71%
Dell XPS 13 9350
Intel Core Ultra 7 256V
4038 Points +70%
Lenovo ThinkPad L13 2in1 G5 21LNS4AM00
Intel Core Ultra 5 125U
3984 Points +68%
Alldocube iWork GT Ultra
Intel Core Ultra 5 125H
3203 Points +35%
Dell Latitude 13 7330
Intel Core i7-1265U
3195 Points +35%
Dell XPS 13 DX13260
Intel Core 5 320
2371 Points
Media Intel Core 5 320
  (n=1)
2371 Points 0%
Microsoft Surface Pro 8, i7-1185G7
Intel Core i7-1185G7
2097 Points -12%
Cinebench R20 / CPU (Single Core)
Dell XPS 14 Core Ultra X7 358H
Intel Core Ultra X7 358H
792 Points +10%
HP OmniBook 7 Aero 13-bg1077nr
AMD Ryzen AI 7 350
774 Points +8%
Dell XPS 14 Core Ultra 7 355
Intel Core Ultra 7 355
733 Points +2%
Dell XPS 13 9350
Intel Core Ultra 7 256V
720 Points 0%
Dell XPS 13 DX13260
Intel Core 5 320
717 Points
Media Intel Core 5 320
  (n=1)
717 Points 0%
Lenovo ThinkPad X1 Carbon Gen 14 21V70075GE
Intel Core Ultra 5 325
713 Points -1%
HP EliteBook 8 Flip G1i 13
Intel Core Ultra 7 265U
678 Points -5%
Dell Latitude 13 7330
Intel Core i7-1265U
651 Points -9%
Lenovo ThinkPad L13 2in1 G5 21LNS4AM00
Intel Core Ultra 5 125U
609 Points -15%
Alldocube iWork GT Ultra
Intel Core Ultra 5 125H
592 Points -17%
Microsoft Surface Pro 8, i7-1185G7
Intel Core i7-1185G7
578 Points -19%
Cinebench R15 / CPU Multi 64Bit
Dell XPS 14 Core Ultra X7 358H
Intel Core Ultra X7 358H
3135 (2099.85min - 3134.55max) Points +197%
HP OmniBook 7 Aero 13-bg1077nr
AMD Ryzen AI 7 350
2038 (1917.36min - 2037.7max) Points +93%
HP EliteBook 8 Flip G1i 13
Intel Core Ultra 7 265U
1736 (1258.93min - 1735.81max) Points +65%
Lenovo ThinkPad X1 Carbon Gen 14 21V70075GE
Intel Core Ultra 5 325
1670 (1603.78min - 1670.43max) Points +58%
Dell XPS 14 Core Ultra 7 355
Intel Core Ultra 7 355
1654 (1489.92min - 1654.26max) Points +57%
Lenovo ThinkPad L13 2in1 G5 21LNS4AM00
Intel Core Ultra 5 125U
1614 (1027.83min - 1613.94max) Points +53%
Dell XPS 13 9350
Intel Core Ultra 7 256V
1570 (1369.16min - 1569.86max) Points +49%
Dell Latitude 13 7330
Intel Core i7-1265U
1420 (1010.48min - 1420.35max) Points +35%
Alldocube iWork GT Ultra
Intel Core Ultra 5 125H
1225 Points +16%
Dell XPS 13 DX13260
Intel Core 5 320
1054 (856.35min - 1053.52max) Points
Media Intel Core 5 320
  (n=1)
1054 Points 0%
Microsoft Surface Pro 8, i7-1185G7
Intel Core i7-1185G7
995 (789.61min - 994.68max) Points -6%
Cinebench R15 / CPU Single 64Bit
Dell XPS 14 Core Ultra X7 358H
Intel Core Ultra X7 358H
312 Points +13%
HP OmniBook 7 Aero 13-bg1077nr
AMD Ryzen AI 7 350
297 Points +8%
Dell XPS 14 Core Ultra 7 355
Intel Core Ultra 7 355
288 Points +4%
Dell XPS 13 9350
Intel Core Ultra 7 256V
285 Points +3%
Lenovo ThinkPad X1 Carbon Gen 14 21V70075GE
Intel Core Ultra 5 325
282 Points +2%
Dell XPS 13 DX13260
Intel Core 5 320
276 Points
Media Intel Core 5 320
  (n=1)
276 Points 0%
Dell Latitude 13 7330
Intel Core i7-1265U
250 Points -9%
HP EliteBook 8 Flip G1i 13
Intel Core Ultra 7 265U
244 Points -12%
Lenovo ThinkPad L13 2in1 G5 21LNS4AM00
Intel Core Ultra 5 125U
230 Points -17%
Microsoft Surface Pro 8, i7-1185G7
Intel Core i7-1185G7
224 Points -19%
Alldocube iWork GT Ultra
Intel Core Ultra 5 125H
217 Points -21%
Blender / v2.79 BMW27 CPU
Microsoft Surface Pro 8, i7-1185G7
Intel Core i7-1185G7
569 Seconds * -15%
Dell XPS 13 DX13260
Intel Core 5 320
494 Seconds *
Media Intel Core 5 320
  (n=1)
494 Seconds * -0%
Dell Latitude 13 7330
Intel Core i7-1265U
413 Seconds * +16%
Alldocube iWork GT Ultra
Intel Core Ultra 5 125H
389 Seconds * +21%
Lenovo ThinkPad L13 2in1 G5 21LNS4AM00
Intel Core Ultra 5 125U
380 Seconds * +23%
Dell XPS 13 9350
Intel Core Ultra 7 256V
339 Seconds * +31%
HP EliteBook 8 Flip G1i 13
Intel Core Ultra 7 265U
335 Seconds * +32%
Lenovo ThinkPad X1 Carbon Gen 14 21V70075GE
Intel Core Ultra 5 325
310 Seconds * +37%
Dell XPS 14 Core Ultra 7 355
Intel Core Ultra 7 355
307 Seconds * +38%
HP OmniBook 7 Aero 13-bg1077nr
AMD Ryzen AI 7 350
230 Seconds * +53%
Dell XPS 14 Core Ultra X7 358H
Intel Core Ultra X7 358H
196 Seconds * +60%
7-Zip 18.03 / 7z b 4
Dell XPS 14 Core Ultra X7 358H
Intel Core Ultra X7 358H
64255 MIPS +173%
HP OmniBook 7 Aero 13-bg1077nr
AMD Ryzen AI 7 350
55010 MIPS +134%
Lenovo ThinkPad L13 2in1 G5 21LNS4AM00
Intel Core Ultra 5 125U
39072 MIPS +66%
HP EliteBook 8 Flip G1i 13
Intel Core Ultra 7 265U
38771 MIPS +65%
Dell XPS 14 Core Ultra 7 355
Intel Core Ultra 7 355
37123 MIPS +58%
Lenovo ThinkPad X1 Carbon Gen 14 21V70075GE
Intel Core Ultra 5 325
36228 MIPS +54%
Dell XPS 13 9350
Intel Core Ultra 7 256V
35950 MIPS +53%
Dell Latitude 13 7330
Intel Core i7-1265U
31869 MIPS +35%
Microsoft Surface Pro 8, i7-1185G7
Intel Core i7-1185G7
24679 MIPS +5%
Dell XPS 13 DX13260
Intel Core 5 320
23550 MIPS
Media Intel Core 5 320
  (n=1)
23550 MIPS 0%
7-Zip 18.03 / 7z b 4 -mmt1
Dell XPS 14 Core Ultra X7 358H
Intel Core Ultra X7 358H
6526 MIPS +23%
HP OmniBook 7 Aero 13-bg1077nr
AMD Ryzen AI 7 350
6025 MIPS +13%
Dell XPS 14 Core Ultra 7 355
Intel Core Ultra 7 355
5764 MIPS +8%
Lenovo ThinkPad X1 Carbon Gen 14 21V70075GE
Intel Core Ultra 5 325
5741 MIPS +8%
Dell XPS 13 9350
Intel Core Ultra 7 256V
5727 MIPS +8%
Dell Latitude 13 7330
Intel Core i7-1265U
5615 MIPS +6%
Dell XPS 13 DX13260
Intel Core 5 320
5319 MIPS
Media Intel Core 5 320
  (n=1)
5319 MIPS 0%
Microsoft Surface Pro 8, i7-1185G7
Intel Core i7-1185G7
5168 MIPS -3%
HP EliteBook 8 Flip G1i 13
Intel Core Ultra 7 265U
5088 MIPS -4%
Alldocube iWork GT Ultra
Intel Core Ultra 5 125H
4671 MIPS -12%
Lenovo ThinkPad L13 2in1 G5 21LNS4AM00
Intel Core Ultra 5 125U
4489 MIPS -16%
Geekbench 6.7 / Multi-Core
Dell XPS 14 Core Ultra X7 358H
Intel Core Ultra X7 358H
17121 Points +117%
HP OmniBook 7 Aero 13-bg1077nr
AMD Ryzen AI 7 350
13083 Points +66%
Dell XPS 14 Core Ultra 7 355
Intel Core Ultra 7 355
11394 Points +44%
Lenovo ThinkPad X1 Carbon Gen 14 21V70075GE
Intel Core Ultra 5 325
11038 Points +40%
Dell XPS 13 9350
Intel Core Ultra 7 256V
10972 Points +39%
HP EliteBook 8 Flip G1i 13
Intel Core Ultra 7 265U
10707 Points +36%
Alldocube iWork GT Ultra
Intel Core Ultra 5 125H
10527 Points +33%
Lenovo ThinkPad L13 2in1 G5 21LNS4AM00
Intel Core Ultra 5 125U
9351 Points +19%
Apple MacBook Neo 256 GB
Apple A18 Pro
9140 Points +16%
Media Intel Core 5 320
  (7888 - 8122, n=3)
7974 Points +1%
Dell XPS 13 DX13260
Intel Core 5 320
7888 Points
Geekbench 6.7 / Single-Core
Apple MacBook Neo 256 GB
Apple A18 Pro
3589 Points +39%
Dell XPS 14 Core Ultra X7 358H
Intel Core Ultra X7 358H
2927 Points +14%
HP OmniBook 7 Aero 13-bg1077nr
AMD Ryzen AI 7 350
2886 Points +12%
Dell XPS 13 9350
Intel Core Ultra 7 256V
2778 Points +8%
Dell XPS 14 Core Ultra 7 355
Intel Core Ultra 7 355
2701 Points +5%
Lenovo ThinkPad X1 Carbon Gen 14 21V70075GE
Intel Core Ultra 5 325
2620 Points +2%
Media Intel Core 5 320
  (2564 - 2600, n=3)
2580 Points 0%
Dell XPS 13 DX13260
Intel Core 5 320
2575 Points
HP EliteBook 8 Flip G1i 13
Intel Core Ultra 7 265U
2477 Points -4%
Lenovo ThinkPad L13 2in1 G5 21LNS4AM00
Intel Core Ultra 5 125U
2150 Points -17%
Alldocube iWork GT Ultra
Intel Core Ultra 5 125H
2134 Points -17%
Geekbench 5.5 / Multi-Core
Dell XPS 14 Core Ultra X7 358H
Intel Core Ultra X7 358H
17028 Points +168%
HP OmniBook 7 Aero 13-bg1077nr
AMD Ryzen AI 7 350
11254 Points +77%
Dell XPS 14 Core Ultra 7 355
Intel Core Ultra 7 355
10011 Points +58%
Lenovo ThinkPad X1 Carbon Gen 14 21V70075GE
Intel Core Ultra 5 325
9990 Points +57%
HP EliteBook 8 Flip G1i 13
Intel Core Ultra 7 265U
9683 Points +52%
Dell XPS 13 9350
Intel Core Ultra 7 256V
9302 Points +46%
Alldocube iWork GT Ultra
Intel Core Ultra 5 125H
8717 Points +37%
Lenovo ThinkPad L13 2in1 G5 21LNS4AM00
Intel Core Ultra 5 125U
8457 Points +33%
Dell Latitude 13 7330
Intel Core i7-1265U
6937 Points +9%
Dell XPS 13 DX13260
Intel Core 5 320
6351 Points
Media Intel Core 5 320
  (n=1)
6351 Points 0%
Microsoft Surface Pro 8, i7-1185G7
Intel Core i7-1185G7
5759 Points -9%
Geekbench 5.5 / Single-Core
Dell XPS 14 Core Ultra X7 358H
Intel Core Ultra X7 358H
2142 Points +19%
HP OmniBook 7 Aero 13-bg1077nr
AMD Ryzen AI 7 350
2132 Points +18%
Dell XPS 13 9350
Intel Core Ultra 7 256V
2010 Points +11%
Dell XPS 14 Core Ultra 7 355
Intel Core Ultra 7 355
1999 Points +11%
Lenovo ThinkPad X1 Carbon Gen 14 21V70075GE
Intel Core Ultra 5 325
1959 Points +8%
HP EliteBook 8 Flip G1i 13
Intel Core Ultra 7 265U
1815 Points 0%
Dell XPS 13 DX13260
Intel Core 5 320
1807 Points
Media Intel Core 5 320
  (n=1)
1807 Points 0%
Dell Latitude 13 7330
Intel Core i7-1265U
1778 Points -2%
Alldocube iWork GT Ultra
Intel Core Ultra 5 125H
1615 Points -11%
Lenovo ThinkPad L13 2in1 G5 21LNS4AM00
Intel Core Ultra 5 125U
1577 Points -13%
Microsoft Surface Pro 8, i7-1185G7
Intel Core i7-1185G7
1548 Points -14%
HWBOT x265 Benchmark v2.2 / 4k Preset
Dell XPS 14 Core Ultra X7 358H
Intel Core Ultra X7 358H
20.7 fps +146%
Dell XPS 14 Core Ultra 7 355
Intel Core Ultra 7 355
14.6 fps +73%
Lenovo ThinkPad X1 Carbon Gen 14 21V70075GE
Intel Core Ultra 5 325
14.3 fps +70%
HP OmniBook 7 Aero 13-bg1077nr
AMD Ryzen AI 7 350
14 fps +66%
Dell XPS 13 9350
Intel Core Ultra 7 256V
13.1 fps +56%
Lenovo ThinkPad L13 2in1 G5 21LNS4AM00
Intel Core Ultra 5 125U
11.4 fps +35%
HP EliteBook 8 Flip G1i 13
Intel Core Ultra 7 265U
11.4 fps +35%
Dell Latitude 13 7330
Intel Core i7-1265U
9.37 fps +11%
Alldocube iWork GT Ultra
Intel Core Ultra 5 125H
8.52 fps +1%
Dell XPS 13 DX13260
Intel Core 5 320
8.42 fps
Media Intel Core 5 320
  (n=1)
8.42 fps 0%
Microsoft Surface Pro 8, i7-1185G7
Intel Core i7-1185G7
6.49 fps -23%
LibreOffice / 20 Documents To PDF
Alldocube iWork GT Ultra
Intel Core Ultra 5 125H
63.9 s * -34%
Lenovo ThinkPad L13 2in1 G5 21LNS4AM00
Intel Core Ultra 5 125U
58.5 s * -23%
HP EliteBook 8 Flip G1i 13
Intel Core Ultra 7 265U
58.1 s * -22%
Dell XPS 13 9350
Intel Core Ultra 7 256V
53.2 s * -12%
HP OmniBook 7 Aero 13-bg1077nr
AMD Ryzen AI 7 350
51.2 s * -7%
Microsoft Surface Pro 8, i7-1185G7
Intel Core i7-1185G7
51.1 s * -7%
Dell Latitude 13 7330
Intel Core i7-1265U
49.1 s * -3%
Dell XPS 13 DX13260
Intel Core 5 320
47.7 s *
Media Intel Core 5 320
  (n=1)
47.7 s * -0%
Dell XPS 14 Core Ultra X7 358H
Intel Core Ultra X7 358H
45.9 s * +4%
Lenovo ThinkPad X1 Carbon Gen 14 21V70075GE
Intel Core Ultra 5 325
43.6 s * +9%
Dell XPS 14 Core Ultra 7 355
Intel Core Ultra 7 355
43.1 s * +10%
R Benchmark 2.5 / Overall mean
Microsoft Surface Pro 8, i7-1185G7
Intel Core i7-1185G7
0.568 sec * -20%
Lenovo ThinkPad L13 2in1 G5 21LNS4AM00
Intel Core Ultra 5 125U
0.558 sec * -18%
Alldocube iWork GT Ultra
Intel Core Ultra 5 125H
0.546 sec * -15%
HP EliteBook 8 Flip G1i 13
Intel Core Ultra 7 265U
0.492 sec * -4%
Dell Latitude 13 7330
Intel Core i7-1265U
0.4772 sec * -1%
Dell XPS 13 DX13260
Intel Core 5 320
0.4748 sec *
Media Intel Core 5 320
  (n=1)
0.4748 sec * -0%
Dell XPS 13 9350
Intel Core Ultra 7 256V
0.4578 sec * +4%
HP OmniBook 7 Aero 13-bg1077nr
AMD Ryzen AI 7 350
0.4555 sec * +4%
Lenovo ThinkPad X1 Carbon Gen 14 21V70075GE
Intel Core Ultra 5 325
0.4545 sec * +4%
Dell XPS 14 Core Ultra 7 355
Intel Core Ultra 7 355
0.4435 sec * +7%
Dell XPS 14 Core Ultra X7 358H
Intel Core Ultra X7 358H
0.4127 sec * +13%
CPU Performance rating: Percent
Cinebench R23: Multi Core | Single Core
Cinebench R20: CPU (Multi Core) | CPU (Single Core)
Cinebench R15: CPU Multi 64Bit | CPU Single 64Bit
Blender: v2.79 BMW27 CPU
7-Zip 18.03: 7z b 4 | 7z b 4 -mmt1
Geekbench 6.7: Multi-Core | Single-Core
Geekbench 5.5: Multi-Core | Single-Core
HWBOT x265 Benchmark v2.2: 4k Preset
LibreOffice : 20 Documents To PDF
R Benchmark 2.5: Overall mean

* ... Meglio usare valori piccoli
Cinebench R15 CPU Multi 64Bit
1054 Points
Cinebench R15 OpenGL 64Bit
102 fps
Cinebench R15 Ref. Match 64Bit
97.8 %
Cinebench R15 CPU Single 64Bit
276 Points
Cinebench R20 CPU (Multi Core)
2371 Points
Cinebench R20 CPU (Single Core)
717 Points
Cinebench R23 Single Core
1926 Points
Cinebench R23 Multi Core
6197 Points
Aiuto
Performance rating
HP OmniBook 7 Aero 13-bg1077nr -1!
AMD Ryzen AI 7 350, Radeon 860M
90.1 pt
Dell XPS 14 Core Ultra X7 358H
Intel Core Ultra X7 358H, Arc B390 Panther Lake iGPU
85.8 pt
Lenovo ThinkPad X1 Carbon Gen 14 21V70075GE -1!
Intel Core Ultra 5 325, Intel Graphics 4 Xe3 PTL
59.2 pt
Dell XPS 13 9350 -1!
Intel Core Ultra 7 256V, Arc 140V
59 pt
Dell XPS 13 DX13260 -1!
Intel Core 5 320, Intel Graphics 2 Xe3 WCL
12.7 pt
Media Intel Core 5 320 -1!
 
12.7 pt
AIDA64 / FP32 Ray-Trace
HP OmniBook 7 Aero 13-bg1077nr
AMD Ryzen AI 7 350, Radeon 860M (v6.92.6600)
22443 KRay/s +782%
Dell XPS 14 Core Ultra X7 358H
Intel Core Ultra X7 358H, Arc B390 Panther Lake iGPU (v8.20.8100)
14318 KRay/s +463%
Dell XPS 13 9350
Intel Core Ultra 7 256V, Arc 140V (v6.92.6600)
12287 KRay/s +383%
Lenovo ThinkPad X1 Carbon Gen 14 21V70075GE
Intel Core Ultra 5 325, Intel Graphics 4 Xe3 PTL (v8.20.8100)
12020 KRay/s +372%
Dell XPS 13 DX13260
Intel Core 5 320, Intel Graphics 2 Xe3 WCL (v8.20.8100)
2545 KRay/s
Media Intel Core 5 320
  (n=1)
2545 KRay/s 0%
AIDA64 / FPU Julia
HP OmniBook 7 Aero 13-bg1077nr
AMD Ryzen AI 7 350, Radeon 860M (v6.92.6600)
84517 Points +534%
Dell XPS 14 Core Ultra X7 358H
Intel Core Ultra X7 358H, Arc B390 Panther Lake iGPU (v8.20.8100)
77086 Points +479%
Lenovo ThinkPad X1 Carbon Gen 14 21V70075GE
Intel Core Ultra 5 325, Intel Graphics 4 Xe3 PTL (v8.20.8100)
61597 Points +362%
Dell XPS 13 9350
Intel Core Ultra 7 256V, Arc 140V (v6.92.6600)
61131 Points +359%
Dell XPS 13 DX13260
Intel Core 5 320, Intel Graphics 2 Xe3 WCL (v8.20.8100)
13325 Points
Media Intel Core 5 320
  (n=1)
13325 Points 0%
AIDA64 / CPU SHA3
Dell XPS 14 Core Ultra X7 358H
Intel Core Ultra X7 358H, Arc B390 Panther Lake iGPU (v8.20.8100)
4033 MB/s +525%
HP OmniBook 7 Aero 13-bg1077nr
AMD Ryzen AI 7 350, Radeon 860M (v6.92.6600)
3669 MB/s +469%
Dell XPS 13 9350
Intel Core Ultra 7 256V, Arc 140V (v6.92.6600)
2713 MB/s +321%
Lenovo ThinkPad X1 Carbon Gen 14 21V70075GE
Intel Core Ultra 5 325, Intel Graphics 4 Xe3 PTL (v8.20.8100)
2694 MB/s +318%
Dell XPS 13 DX13260
Intel Core 5 320, Intel Graphics 2 Xe3 WCL (v8.20.8100)
645 MB/s
Media Intel Core 5 320
  (n=1)
645 MB/s 0%
AIDA64 / CPU Queen
HP OmniBook 7 Aero 13-bg1077nr
AMD Ryzen AI 7 350, Radeon 860M (v6.92.6600)
72463 Points
Dell XPS 14 Core Ultra X7 358H
Intel Core Ultra X7 358H, Arc B390 Panther Lake iGPU (v6.92.6600)
63827 Points
Dell XPS 13 9350
Intel Core Ultra 7 256V, Arc 140V (v6.92.6600)
49622 Points
AIDA64 / FPU SinJulia
HP OmniBook 7 Aero 13-bg1077nr
AMD Ryzen AI 7 350, Radeon 860M (v6.92.6600)
13051 Points +1334%
Dell XPS 14 Core Ultra X7 358H
Intel Core Ultra X7 358H, Arc B390 Panther Lake iGPU (v8.20.8100)
6919 Points +660%
Dell XPS 13 9350
Intel Core Ultra 7 256V, Arc 140V (v6.92.6600)
4428 Points +387%
Lenovo ThinkPad X1 Carbon Gen 14 21V70075GE
Intel Core Ultra 5 325, Intel Graphics 4 Xe3 PTL (v8.20.8100)
4401 Points +384%
Dell XPS 13 DX13260
Intel Core 5 320, Intel Graphics 2 Xe3 WCL (v8.20.8100)
910 Points
Media Intel Core 5 320
  (n=1)
910 Points 0%
AIDA64 / FPU Mandel
HP OmniBook 7 Aero 13-bg1077nr
AMD Ryzen AI 7 350, Radeon 860M (v6.92.6600)
45043 Points +549%
Dell XPS 14 Core Ultra X7 358H
Intel Core Ultra X7 358H, Arc B390 Panther Lake iGPU (v8.20.8100)
40542 Points +484%
Lenovo ThinkPad X1 Carbon Gen 14 21V70075GE
Intel Core Ultra 5 325, Intel Graphics 4 Xe3 PTL (v8.20.8100)
32568 Points +369%
Dell XPS 13 9350
Intel Core Ultra 7 256V, Arc 140V (v6.92.6600)
32410 Points +367%
Dell XPS 13 DX13260
Intel Core 5 320, Intel Graphics 2 Xe3 WCL (v8.20.8100)
6944 Points
Media Intel Core 5 320
  (n=1)
6944 Points 0%
AIDA64 / CPU AES
HP OmniBook 7 Aero 13-bg1077nr
AMD Ryzen AI 7 350, Radeon 860M (v6.92.6600)
67645 MB/s +716%
Dell XPS 14 Core Ultra X7 358H
Intel Core Ultra X7 358H, Arc B390 Panther Lake iGPU (v8.20.8100)
63775 MB/s +669%
Dell XPS 13 9350
Intel Core Ultra 7 256V, Arc 140V (v6.92.6600)
40828 MB/s +392%
Lenovo ThinkPad X1 Carbon Gen 14 21V70075GE
Intel Core Ultra 5 325, Intel Graphics 4 Xe3 PTL (v8.20.8100)
37722 MB/s +355%
Dell XPS 13 DX13260
Intel Core 5 320, Intel Graphics 2 Xe3 WCL (v8.20.8100)
8293 MB/s
Media Intel Core 5 320
  (n=1)
8293 MB/s 0%
AIDA64 / CPU ZLib
Dell XPS 14 Core Ultra X7 358H
Intel Core Ultra X7 358H, Arc B390 Panther Lake iGPU (v8.20.8100)
1103 MB/s +715%
HP OmniBook 7 Aero 13-bg1077nr
AMD Ryzen AI 7 350, Radeon 860M (v6.92.6600)
663 MB/s +390%
Lenovo ThinkPad X1 Carbon Gen 14 21V70075GE
Intel Core Ultra 5 325, Intel Graphics 4 Xe3 PTL (v8.20.8100)
614 MB/s +354%
Dell XPS 13 9350
Intel Core Ultra 7 256V, Arc 140V (v6.92.6600)
536 MB/s +296%
Dell XPS 13 DX13260
Intel Core 5 320, Intel Graphics 2 Xe3 WCL (v8.20.8100)
135.3 MB/s
Media Intel Core 5 320
  (n=1)
135.3 MB/s 0%
AIDA64 / FP64 Ray-Trace
HP OmniBook 7 Aero 13-bg1077nr
AMD Ryzen AI 7 350, Radeon 860M (v6.92.6600)
12090 KRay/s +832%
Dell XPS 14 Core Ultra X7 358H
Intel Core Ultra X7 358H, Arc B390 Panther Lake iGPU (v8.20.8100)
7603 KRay/s +486%
Dell XPS 13 9350
Intel Core Ultra 7 256V, Arc 140V (v6.92.6600)
6506 KRay/s +402%
Lenovo ThinkPad X1 Carbon Gen 14 21V70075GE
Intel Core Ultra 5 325, Intel Graphics 4 Xe3 PTL (v8.20.8100)
6401 KRay/s +394%
Dell XPS 13 DX13260
Intel Core 5 320, Intel Graphics 2 Xe3 WCL (v8.20.8100)
1297 KRay/s
Media Intel Core 5 320
  (n=1)
1297 KRay/s 0%
AIDA64 / CPU PhotoWorxx
Dell XPS 14 Core Ultra X7 358H
Intel Core Ultra X7 358H, Arc B390 Panther Lake iGPU (v8.20.8100)
88086 MPixel/s +690%
Lenovo ThinkPad X1 Carbon Gen 14 21V70075GE
Intel Core Ultra 5 325, Intel Graphics 4 Xe3 PTL (v8.20.8100)
59824 MPixel/s +437%
Dell XPS 13 9350
Intel Core Ultra 7 256V, Arc 140V (v6.92.6600)
51767 MPixel/s +365%
HP OmniBook 7 Aero 13-bg1077nr
AMD Ryzen AI 7 350, Radeon 860M (v6.92.6600)
43875 MPixel/s +294%
Dell XPS 13 DX13260
Intel Core 5 320, Intel Graphics 2 Xe3 WCL (v8.20.8100)
11144 MPixel/s
Media Intel Core 5 320
  (n=1)
11144 MPixel/s 0%
AIDA64 / CPU CheckMate
Dell XPS 14 Core Ultra X7 358H
Intel Core Ultra X7 358H, Arc B390 Panther Lake iGPU (v8.20.8100)
4475 MP/s +658%
Lenovo ThinkPad X1 Carbon Gen 14 21V70075GE
Intel Core Ultra 5 325, Intel Graphics 4 Xe3 PTL (v8.20.8100)
2716 MP/s +360%
Dell XPS 13 DX13260
Intel Core 5 320, Intel Graphics 2 Xe3 WCL (v8.20.8100)
590 MP/s
Media Intel Core 5 320
  (n=1)
590 MP/s 0%

Prestazioni del sistema

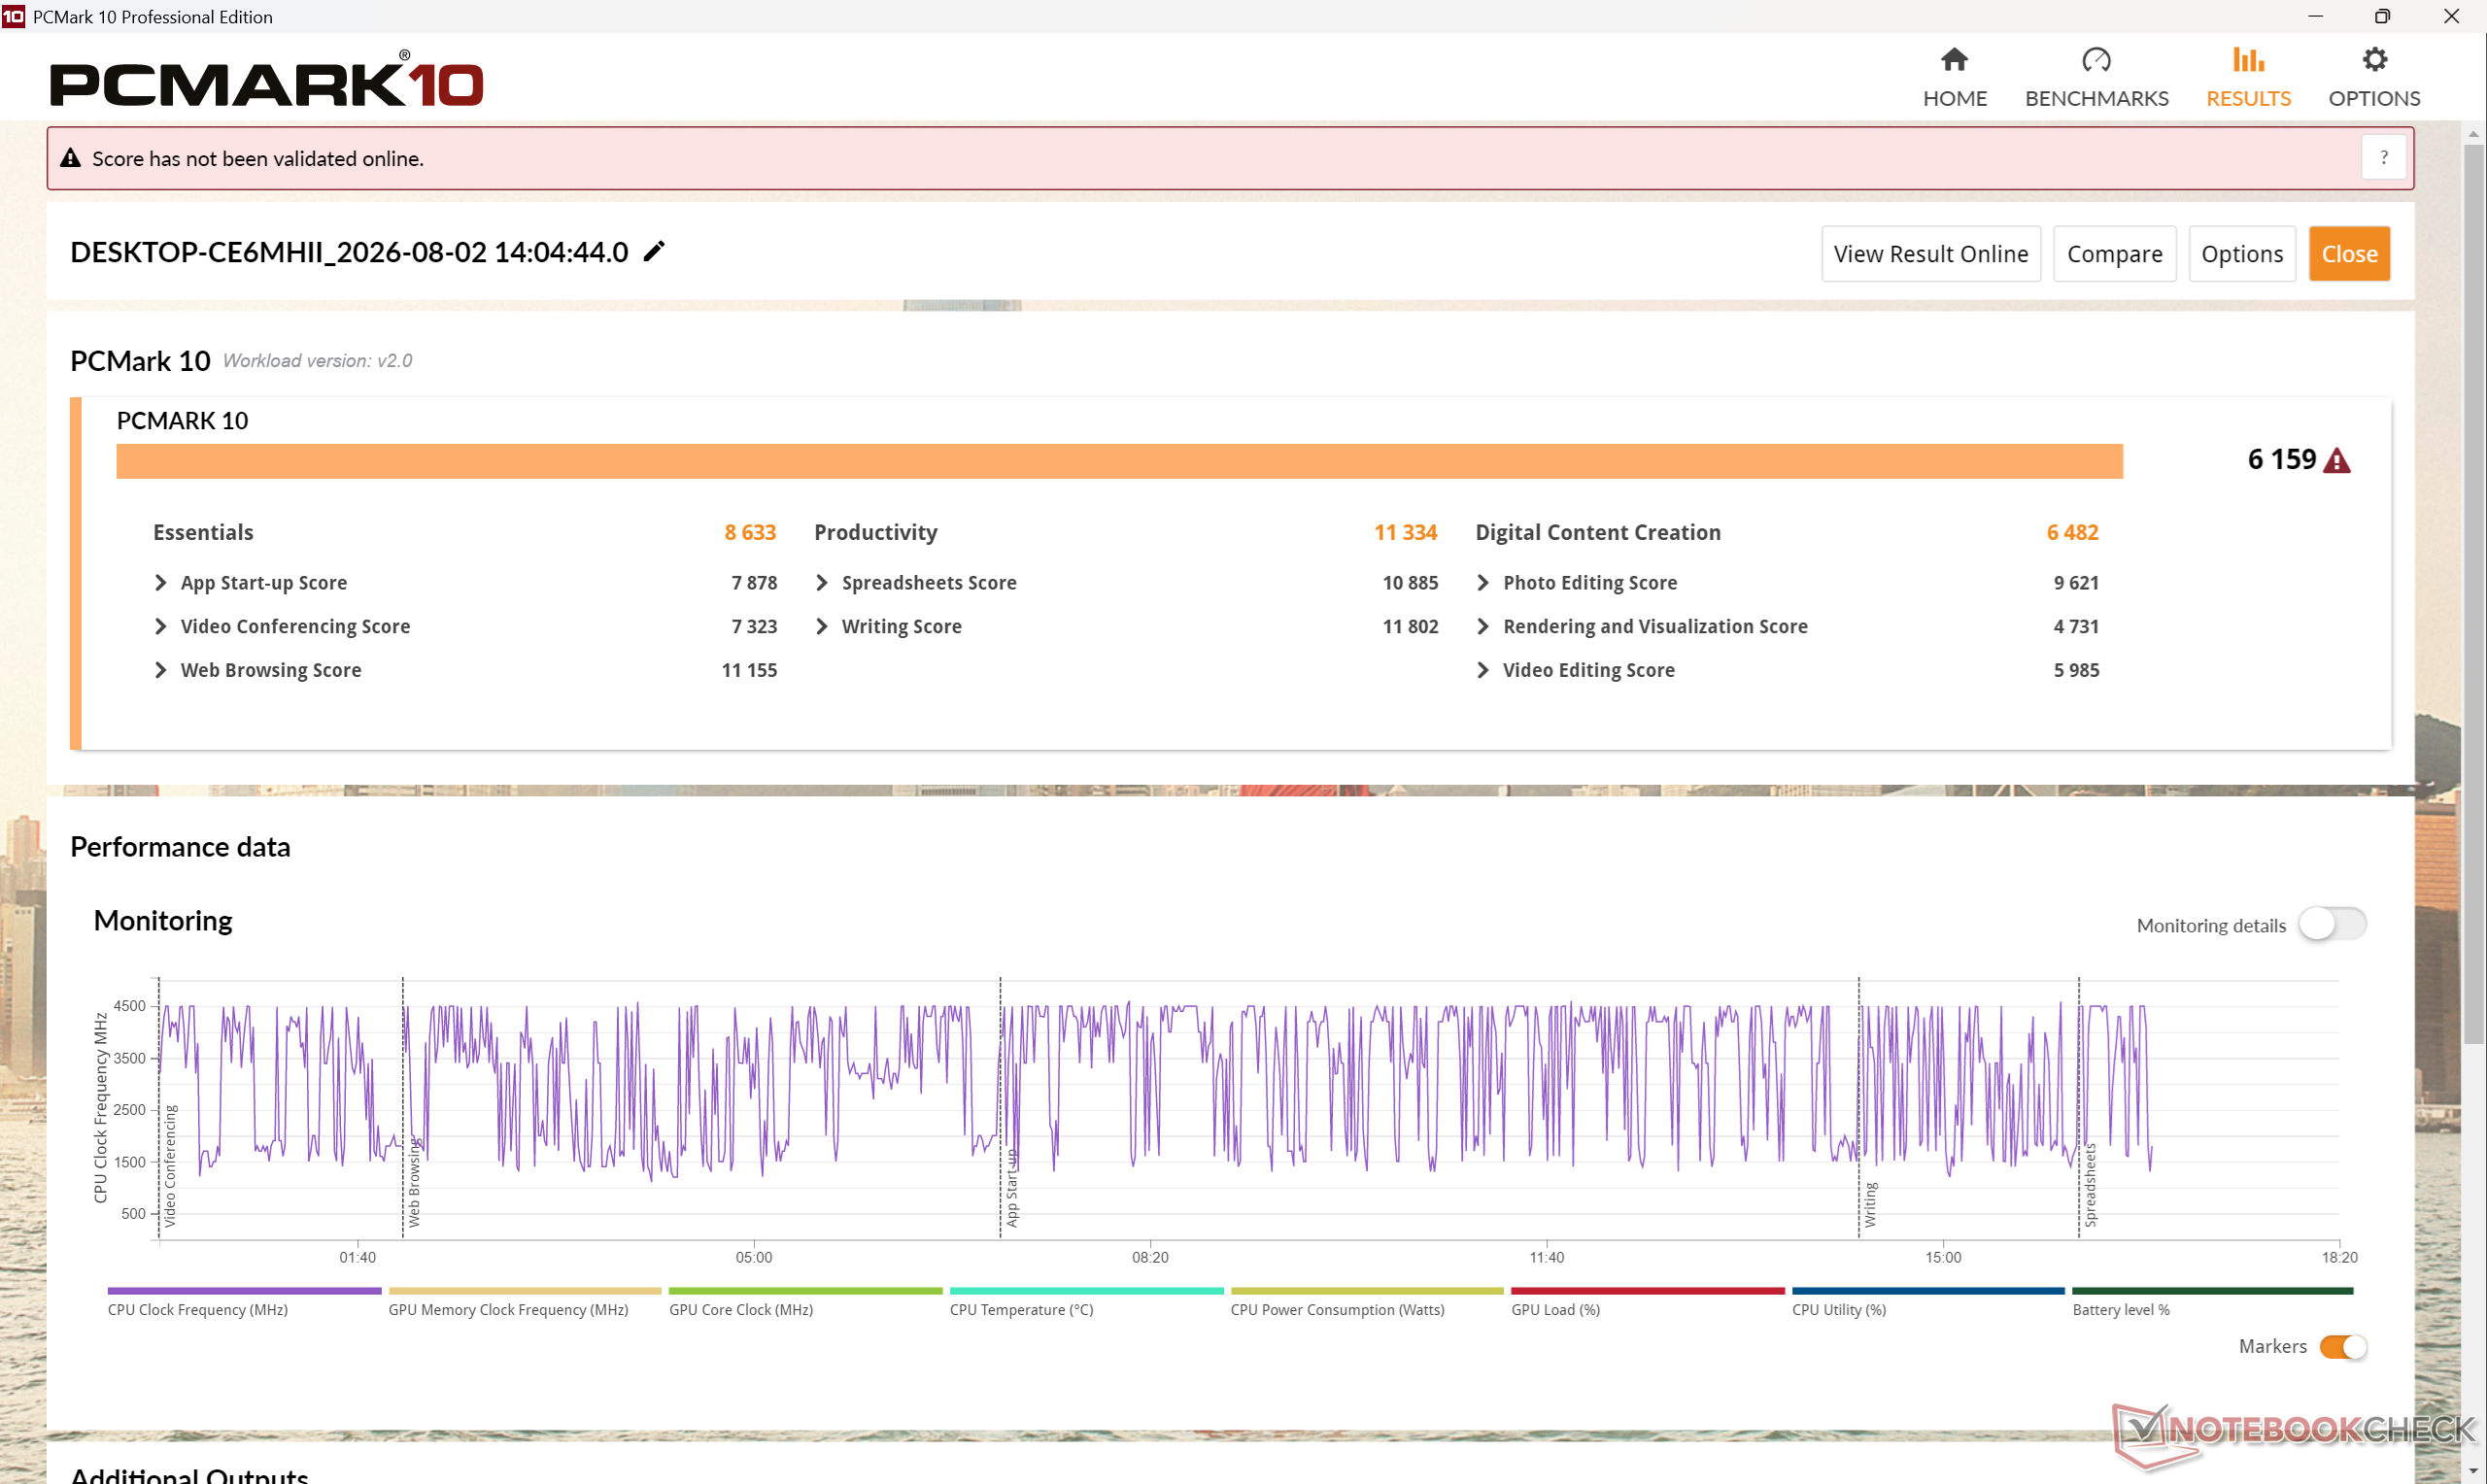
PCMark 10 Standard. Il sistema eccelle nella navigazione web e nell’elaborazione di testi, ma le attività più impegnative, come l’elaborazione delle immagini, risulteranno un po’ lente
Performance rating: Percent
PCMark 10: Score | Essentials | Productivity | Digital Content Creation
CrossMark: Overall | Productivity | Creativity | Responsiveness
WebXPRT 3: Overall
WebXPRT 4: Overall
Mozilla Kraken 1.1: Total
Performance rating
Dell XPS 14 Core Ultra X7 358H
Arc B390 Panther Lake iGPU, Ultra X7 358H, Samsung PM9C1b MZVL81T0HFLB-00BH1
90.9 pt
Apple MacBook Neo 256 GB -4!
A18 GPU, A18 Pro, Apple SSD AP0256Z
86.3 pt
Lenovo ThinkPad X1 Carbon Gen 14 21V70075GE
Intel Graphics 4 Xe3 PTL, Ultra 5 325, Samsung PM9C1b MZVL8512HFLU-00BLL
76 pt
Dell XPS 13 9350
Arc 140V, Core Ultra 7 256V, Micron 2550 512GB
74.9 pt
HP OmniBook 7 Aero 13-bg1077nr
Radeon 860M, Ryzen AI 7 350, SK hynix PC801 HFS001TEJ9X101N
69.6 pt
Dell XPS 13 DX13260
Intel Graphics 2 Xe3 WCL, Core 5 320
66.9 pt
Media Intel Core 5 320, Intel Graphics 2 Xe3 Wildcat Lake iGPU
 
66.9 pt
PCMark 10 / Score
Dell XPS 14 Core Ultra X7 358H
Arc B390 Panther Lake iGPU, Ultra X7 358H, Samsung PM9C1b MZVL81T0HFLB-00BH1
9880 Points +60%
HP OmniBook 7 Aero 13-bg1077nr
Radeon 860M, Ryzen AI 7 350, SK hynix PC801 HFS001TEJ9X101N
8424 Points +37%
Lenovo ThinkPad X1 Carbon Gen 14 21V70075GE
Intel Graphics 4 Xe3 PTL, Ultra 5 325, Samsung PM9C1b MZVL8512HFLU-00BLL
7709 Points +25%
Dell XPS 13 9350
Arc 140V, Core Ultra 7 256V, Micron 2550 512GB
6955 Points +13%
Dell XPS 13 DX13260
Intel Graphics 2 Xe3 WCL, Core 5 320
6159 Points
Media Intel Core 5 320, Intel Graphics 2 Xe3 Wildcat Lake iGPU
  (n=1)
6159 Points 0%
PCMark 10 / Essentials
Dell XPS 14 Core Ultra X7 358H
Arc B390 Panther Lake iGPU, Ultra X7 358H, Samsung PM9C1b MZVL81T0HFLB-00BH1
11263 Points +30%
HP OmniBook 7 Aero 13-bg1077nr
Radeon 860M, Ryzen AI 7 350, SK hynix PC801 HFS001TEJ9X101N
10909 Points +26%
Dell XPS 13 9350
Arc 140V, Core Ultra 7 256V, Micron 2550 512GB
10006 Points +16%
Lenovo ThinkPad X1 Carbon Gen 14 21V70075GE
Intel Graphics 4 Xe3 PTL, Ultra 5 325, Samsung PM9C1b MZVL8512HFLU-00BLL
9939 Points +15%
Dell XPS 13 DX13260
Intel Graphics 2 Xe3 WCL, Core 5 320
8633 Points
Media Intel Core 5 320, Intel Graphics 2 Xe3 Wildcat Lake iGPU
  (n=1)
8633 Points 0%
PCMark 10 / Productivity
Dell XPS 14 Core Ultra X7 358H
Arc B390 Panther Lake iGPU, Ultra X7 358H, Samsung PM9C1b MZVL81T0HFLB-00BH1
16780 Points +48%
HP OmniBook 7 Aero 13-bg1077nr
Radeon 860M, Ryzen AI 7 350, SK hynix PC801 HFS001TEJ9X101N
16132 Points +42%
Lenovo ThinkPad X1 Carbon Gen 14 21V70075GE
Intel Graphics 4 Xe3 PTL, Ultra 5 325, Samsung PM9C1b MZVL8512HFLU-00BLL
13901 Points +23%
Dell XPS 13 DX13260
Intel Graphics 2 Xe3 WCL, Core 5 320
11334 Points
Media Intel Core 5 320, Intel Graphics 2 Xe3 Wildcat Lake iGPU
  (n=1)
11334 Points 0%
Dell XPS 13 9350
Arc 140V, Core Ultra 7 256V, Micron 2550 512GB
9219 Points -19%
PCMark 10 / Digital Content Creation
Dell XPS 14 Core Ultra X7 358H
Arc B390 Panther Lake iGPU, Ultra X7 358H, Samsung PM9C1b MZVL81T0HFLB-00BH1
13847 Points +114%
Dell XPS 13 9350
Arc 140V, Core Ultra 7 256V, Micron 2550 512GB
9898 Points +53%
HP OmniBook 7 Aero 13-bg1077nr
Radeon 860M, Ryzen AI 7 350, SK hynix PC801 HFS001TEJ9X101N
9219 Points +42%
Lenovo ThinkPad X1 Carbon Gen 14 21V70075GE
Intel Graphics 4 Xe3 PTL, Ultra 5 325, Samsung PM9C1b MZVL8512HFLU-00BLL
8998 Points +39%
Dell XPS 13 DX13260
Intel Graphics 2 Xe3 WCL, Core 5 320
6482 Points
Media Intel Core 5 320, Intel Graphics 2 Xe3 Wildcat Lake iGPU
  (n=1)
6482 Points 0%
CrossMark / Overall
Dell XPS 14 Core Ultra X7 358H
Arc B390 Panther Lake iGPU, Ultra X7 358H, Samsung PM9C1b MZVL81T0HFLB-00BH1
1955 Points +29%
Dell XPS 13 9350
Arc 140V, Core Ultra 7 256V, Micron 2550 512GB
1736 Points +15%
Apple MacBook Neo 256 GB
A18 GPU, A18 Pro, Apple SSD AP0256Z
1715 Points +14%
Lenovo ThinkPad X1 Carbon Gen 14 21V70075GE
Intel Graphics 4 Xe3 PTL, Ultra 5 325, Samsung PM9C1b MZVL8512HFLU-00BLL
1675 Points +11%
Dell XPS 13 DX13260
Intel Graphics 2 Xe3 WCL, Core 5 320
1511 Points
Media Intel Core 5 320, Intel Graphics 2 Xe3 Wildcat Lake iGPU
  (n=1)
1511 Points 0%
HP OmniBook 7 Aero 13-bg1077nr
Radeon 860M, Ryzen AI 7 350, SK hynix PC801 HFS001TEJ9X101N
1406 Points -7%
CrossMark / Productivity
Apple MacBook Neo 256 GB
A18 GPU, A18 Pro, Apple SSD AP0256Z
1808 Points +15%
Dell XPS 14 Core Ultra X7 358H
Arc B390 Panther Lake iGPU, Ultra X7 358H, Samsung PM9C1b MZVL81T0HFLB-00BH1
1719 Points +9%
Dell XPS 13 9350
Arc 140V, Core Ultra 7 256V, Micron 2550 512GB
1682 Points +7%
Lenovo ThinkPad X1 Carbon Gen 14 21V70075GE
Intel Graphics 4 Xe3 PTL, Ultra 5 325, Samsung PM9C1b MZVL8512HFLU-00BLL
1652 Points +5%
Dell XPS 13 DX13260
Intel Graphics 2 Xe3 WCL, Core 5 320
1570 Points
Media Intel Core 5 320, Intel Graphics 2 Xe3 Wildcat Lake iGPU
  (n=1)
1570 Points 0%
HP OmniBook 7 Aero 13-bg1077nr
Radeon 860M, Ryzen AI 7 350, SK hynix PC801 HFS001TEJ9X101N
1247 Points -21%
CrossMark / Creativity
Dell XPS 14 Core Ultra X7 358H
Arc B390 Panther Lake iGPU, Ultra X7 358H, Samsung PM9C1b MZVL81T0HFLB-00BH1
2398 Points +59%
Dell XPS 13 9350
Arc 140V, Core Ultra 7 256V, Micron 2550 512GB
1953 Points +30%
Apple MacBook Neo 256 GB
A18 GPU, A18 Pro, Apple SSD AP0256Z
1809 Points +20%
Lenovo ThinkPad X1 Carbon Gen 14 21V70075GE
Intel Graphics 4 Xe3 PTL, Ultra 5 325, Samsung PM9C1b MZVL8512HFLU-00BLL
1756 Points +17%
HP OmniBook 7 Aero 13-bg1077nr
Radeon 860M, Ryzen AI 7 350, SK hynix PC801 HFS001TEJ9X101N
1676 Points +11%
Dell XPS 13 DX13260
Intel Graphics 2 Xe3 WCL, Core 5 320
1505 Points
Media Intel Core 5 320, Intel Graphics 2 Xe3 Wildcat Lake iGPU
  (n=1)
1505 Points 0%
CrossMark / Responsiveness
Dell XPS 14 Core Ultra X7 358H
Arc B390 Panther Lake iGPU, Ultra X7 358H, Samsung PM9C1b MZVL81T0HFLB-00BH1
1560 Points +14%
Lenovo ThinkPad X1 Carbon Gen 14 21V70075GE
Intel Graphics 4 Xe3 PTL, Ultra 5 325, Samsung PM9C1b MZVL8512HFLU-00BLL
1511 Points +11%
Dell XPS 13 DX13260
Intel Graphics 2 Xe3 WCL, Core 5 320
1363 Points
Media Intel Core 5 320, Intel Graphics 2 Xe3 Wildcat Lake iGPU
  (n=1)
1363 Points 0%
Dell XPS 13 9350
Arc 140V, Core Ultra 7 256V, Micron 2550 512GB
1343 Points -1%
Apple MacBook Neo 256 GB
A18 GPU, A18 Pro, Apple SSD AP0256Z
1248 Points -8%
HP OmniBook 7 Aero 13-bg1077nr
Radeon 860M, Ryzen AI 7 350, SK hynix PC801 HFS001TEJ9X101N
1191 Points -13%
WebXPRT 3 / Overall
Apple MacBook Neo 256 GB
A18 GPU, A18 Pro, Apple SSD AP0256Z
450 Points +76%
Dell XPS 14 Core Ultra X7 358H
Arc B390 Panther Lake iGPU, Ultra X7 358H, Samsung PM9C1b MZVL81T0HFLB-00BH1
338 Points +33%
Dell XPS 13 9350
Arc 140V, Core Ultra 7 256V, Micron 2550 512GB
310 Points +22%
Lenovo ThinkPad X1 Carbon Gen 14 21V70075GE
Intel Graphics 4 Xe3 PTL, Ultra 5 325, Samsung PM9C1b MZVL8512HFLU-00BLL
295 Points +16%
HP OmniBook 7 Aero 13-bg1077nr
Radeon 860M, Ryzen AI 7 350, SK hynix PC801 HFS001TEJ9X101N
259 Points +2%
Dell XPS 13 DX13260
Intel Graphics 2 Xe3 WCL, Core 5 320
255 Points
Media Intel Core 5 320, Intel Graphics 2 Xe3 Wildcat Lake iGPU
  (n=1)
255 Points 0%
WebXPRT 4 / Overall
Apple MacBook Neo 256 GB
A18 GPU, A18 Pro, Apple SSD AP0256Z
326 Points +21%
Dell XPS 14 Core Ultra X7 358H
Arc B390 Panther Lake iGPU, Ultra X7 358H, Samsung PM9C1b MZVL81T0HFLB-00BH1
305 Points +13%
Dell XPS 13 9350
Arc 140V, Core Ultra 7 256V, Micron 2550 512GB
286 Points +6%
Lenovo ThinkPad X1 Carbon Gen 14 21V70075GE
Intel Graphics 4 Xe3 PTL, Ultra 5 325, Samsung PM9C1b MZVL8512HFLU-00BLL
269 Points 0%
Dell XPS 13 DX13260
Intel Graphics 2 Xe3 WCL, Core 5 320
269 Points
Media Intel Core 5 320, Intel Graphics 2 Xe3 Wildcat Lake iGPU
  (n=1)
269 Points 0%
HP OmniBook 7 Aero 13-bg1077nr
Radeon 860M, Ryzen AI 7 350, SK hynix PC801 HFS001TEJ9X101N
249 Points -7%
Mozilla Kraken 1.1 / Total
HP OmniBook 7 Aero 13-bg1077nr
Radeon 860M, Ryzen AI 7 350, SK hynix PC801 HFS001TEJ9X101N
702 ms * -41%
Lenovo ThinkPad X1 Carbon Gen 14 21V70075GE
Intel Graphics 4 Xe3 PTL, Ultra 5 325, Samsung PM9C1b MZVL8512HFLU-00BLL
517 ms * -4%
Dell XPS 13 DX13260
Intel Graphics 2 Xe3 WCL, Core 5 320
497 ms *
Media Intel Core 5 320, Intel Graphics 2 Xe3 Wildcat Lake iGPU
  (n=1)
497 ms * -0%
Dell XPS 13 9350
Arc 140V, Core Ultra 7 256V, Micron 2550 512GB
472 ms * +5%
Dell XPS 14 Core Ultra X7 358H
Arc B390 Panther Lake iGPU, Ultra X7 358H, Samsung PM9C1b MZVL81T0HFLB-00BH1
445 ms * +10%
Apple MacBook Neo 256 GB
A18 GPU, A18 Pro, Apple SSD AP0256Z
273.4 ms * +45%

* ... Meglio usare valori piccoli
PCMark 10 Score
6159 punti
Aiuto
AIDA64 / Memory Copy
Dell XPS 14 Core Ultra X7 358H
Intel Core Ultra X7 358H, Arc B390 Panther Lake iGPU
131796 MB/s +709%
Lenovo ThinkPad X1 Carbon Gen 14 21V70075GE
Intel Core Ultra 5 325, Intel Graphics 4 Xe3 PTL
104952 MB/s +544%
Dell XPS 13 9350
Intel Core Ultra 7 256V, Arc 140V
101642 MB/s +524%
HP OmniBook 7 Aero 13-bg1077nr
AMD Ryzen AI 7 350, Radeon 860M
84918 MB/s +421%
Dell XPS 13 DX13260
Intel Core 5 320, Intel Graphics 2 Xe3 WCL
16289 MB/s
Media Intel Core 5 320
  (n=1)
16289 MB/s 0%
AIDA64 / Memory Read
Dell XPS 14 Core Ultra X7 358H
Intel Core Ultra X7 358H, Arc B390 Panther Lake iGPU
114349 MB/s +586%
Dell XPS 13 9350
Intel Core Ultra 7 256V, Arc 140V
88013 MB/s +428%
Lenovo ThinkPad X1 Carbon Gen 14 21V70075GE
Intel Core Ultra 5 325, Intel Graphics 4 Xe3 PTL
83896 MB/s +403%
HP OmniBook 7 Aero 13-bg1077nr
AMD Ryzen AI 7 350, Radeon 860M
63477 MB/s +281%
Dell XPS 13 DX13260
Intel Core 5 320, Intel Graphics 2 Xe3 WCL
16674 MB/s
Media Intel Core 5 320
  (n=1)
16674 MB/s 0%
AIDA64 / Memory Write
Dell XPS 14 Core Ultra X7 358H
Intel Core Ultra X7 358H, Arc B390 Panther Lake iGPU
134916 MB/s +627%
Dell XPS 13 9350
Intel Core Ultra 7 256V, Arc 140V
112340 MB/s +505%
Lenovo ThinkPad X1 Carbon Gen 14 21V70075GE
Intel Core Ultra 5 325, Intel Graphics 4 Xe3 PTL
108023 MB/s +482%
HP OmniBook 7 Aero 13-bg1077nr
AMD Ryzen AI 7 350, Radeon 860M
102762 MB/s +454%
Dell XPS 13 DX13260
Intel Core 5 320, Intel Graphics 2 Xe3 WCL
18564 MB/s
Media Intel Core 5 320
  (n=1)
18564 MB/s 0%
AIDA64 / Memory Latency
Dell XPS 13 DX13260
Intel Core 5 320, Intel Graphics 2 Xe3 WCL
317 ns *
Media Intel Core 5 320
  (n=1)
317 ns * -0%
HP OmniBook 7 Aero 13-bg1077nr
AMD Ryzen AI 7 350, Radeon 860M
104 ns * +67%
Dell XPS 13 9350
Intel Core Ultra 7 256V, Arc 140V
99.6 ns * +69%
Lenovo ThinkPad X1 Carbon Gen 14 21V70075GE
Intel Core Ultra 5 325, Intel Graphics 4 Xe3 PTL
98.5 ns * +69%
Dell XPS 14 Core Ultra X7 358H
Intel Core Ultra X7 358H, Arc B390 Panther Lake iGPU
87.8 ns * +72%

* ... Meglio usare valori piccoli

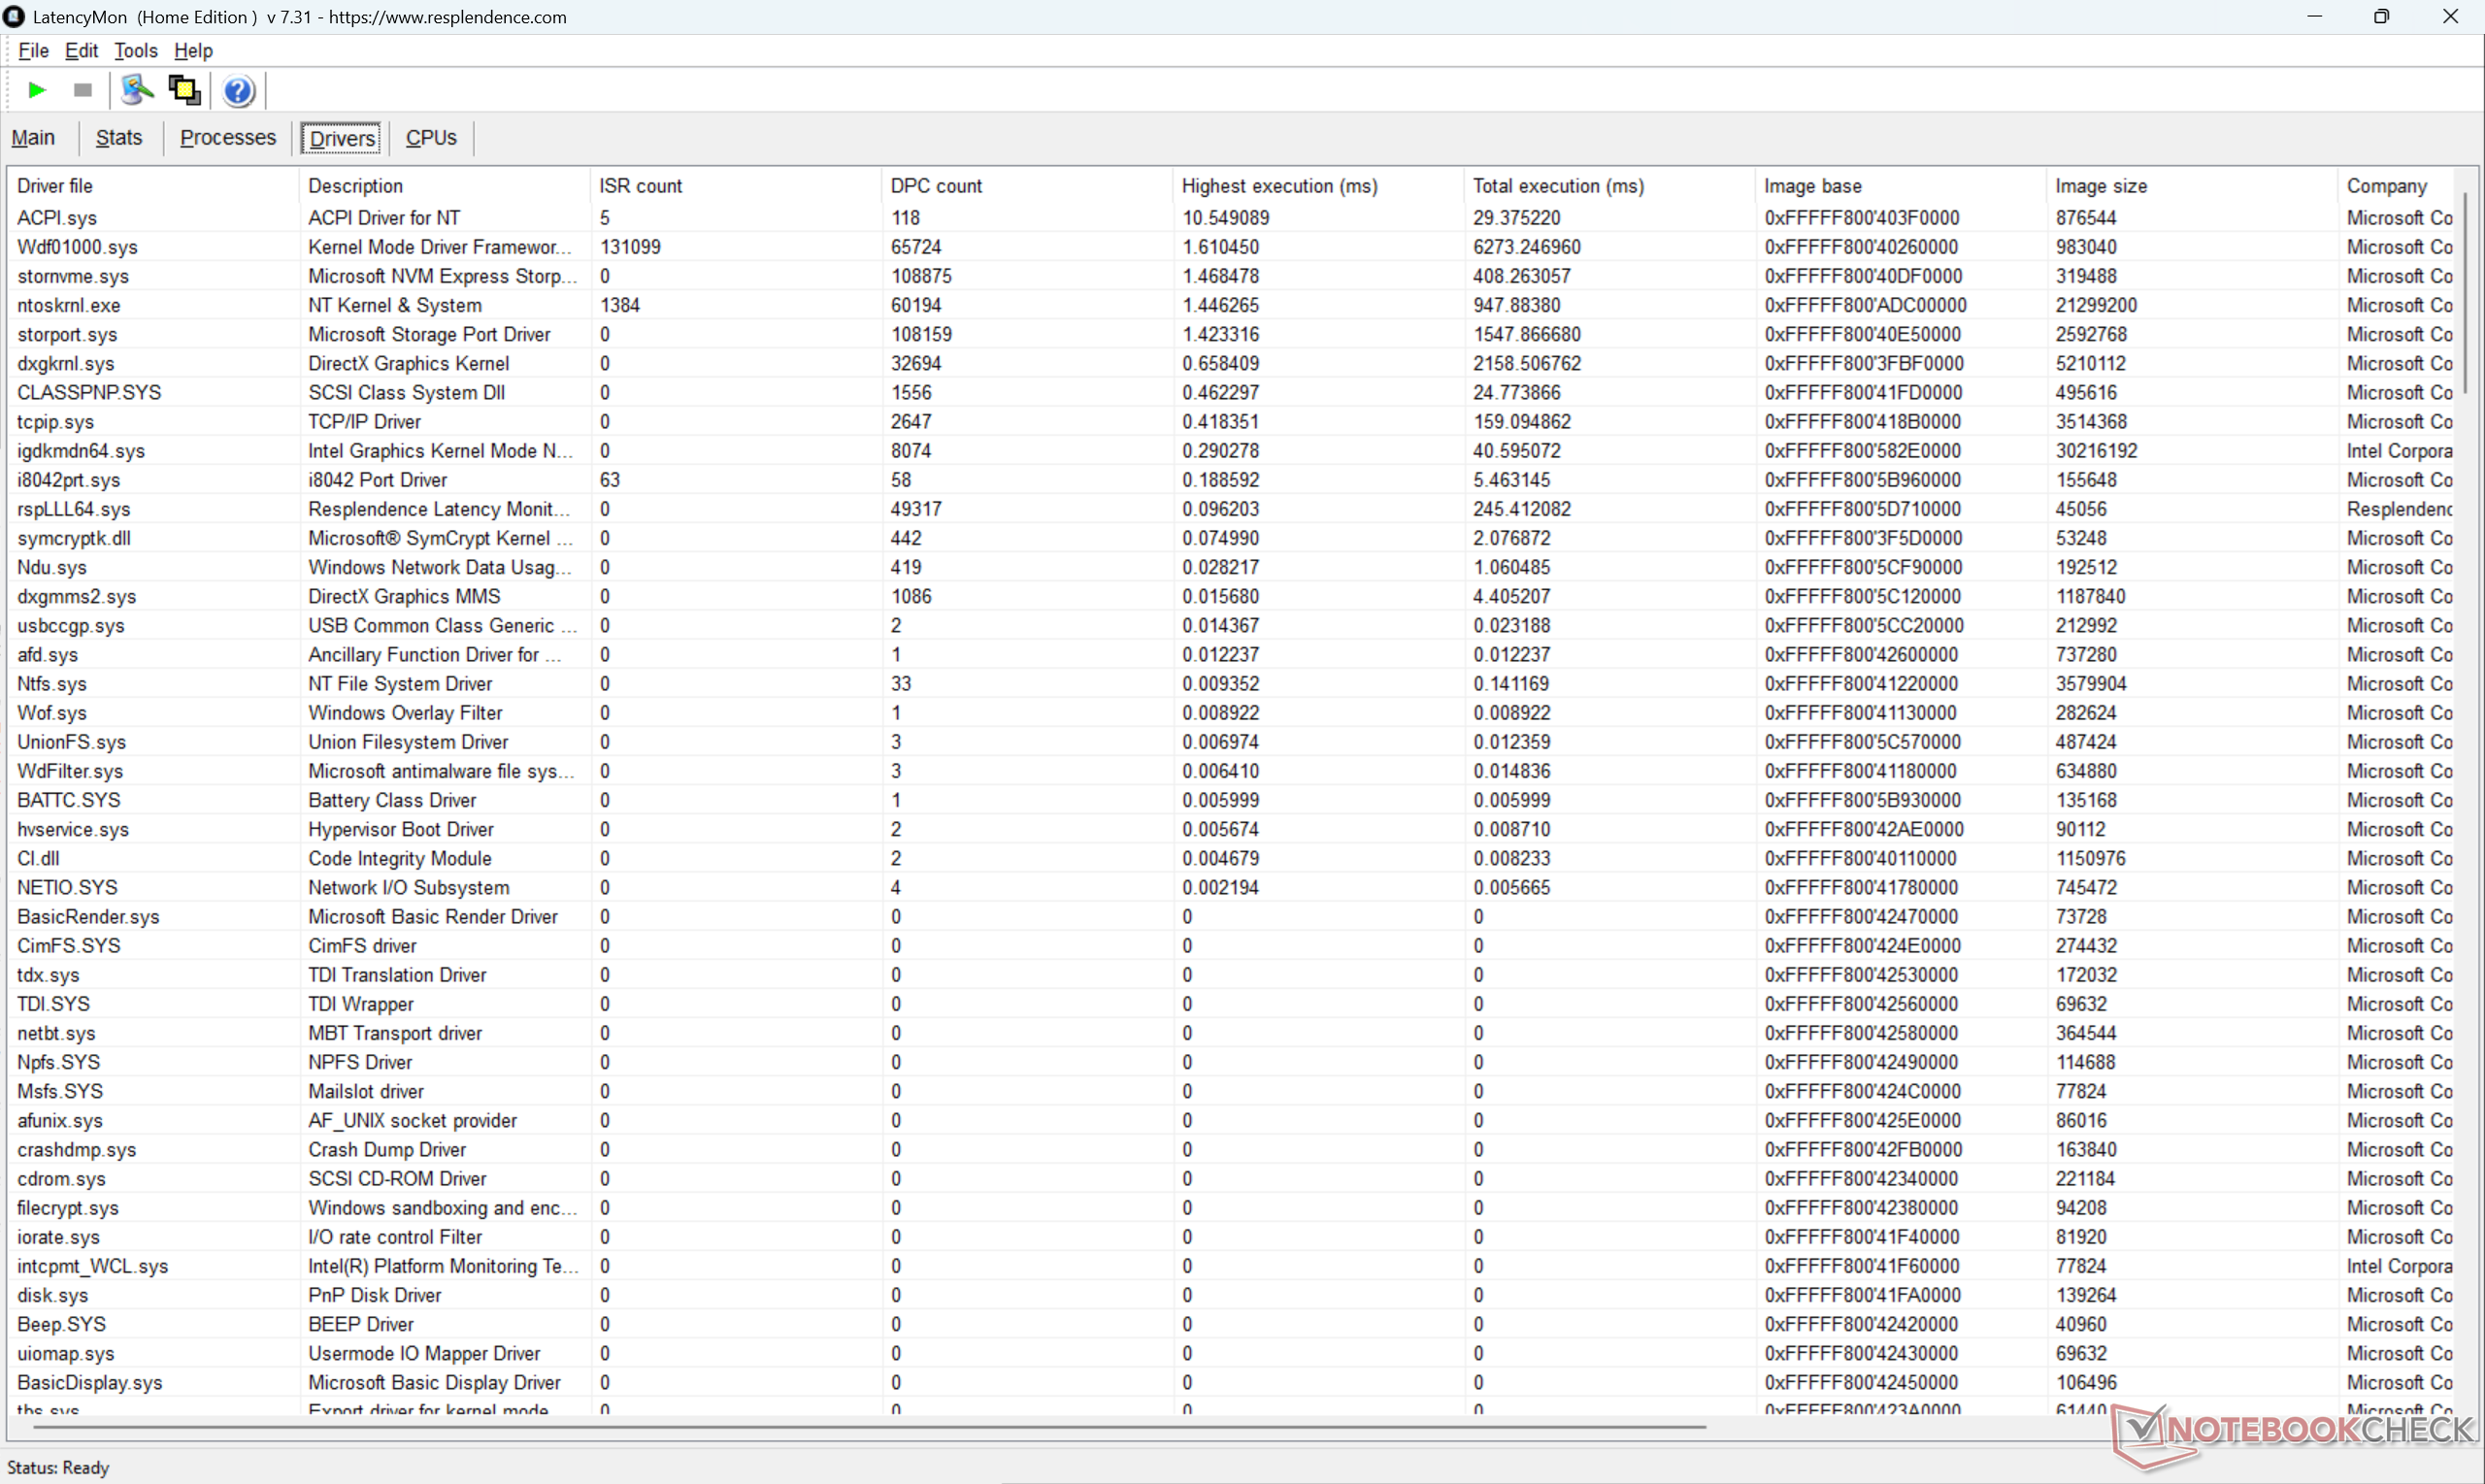
Latenza DPC
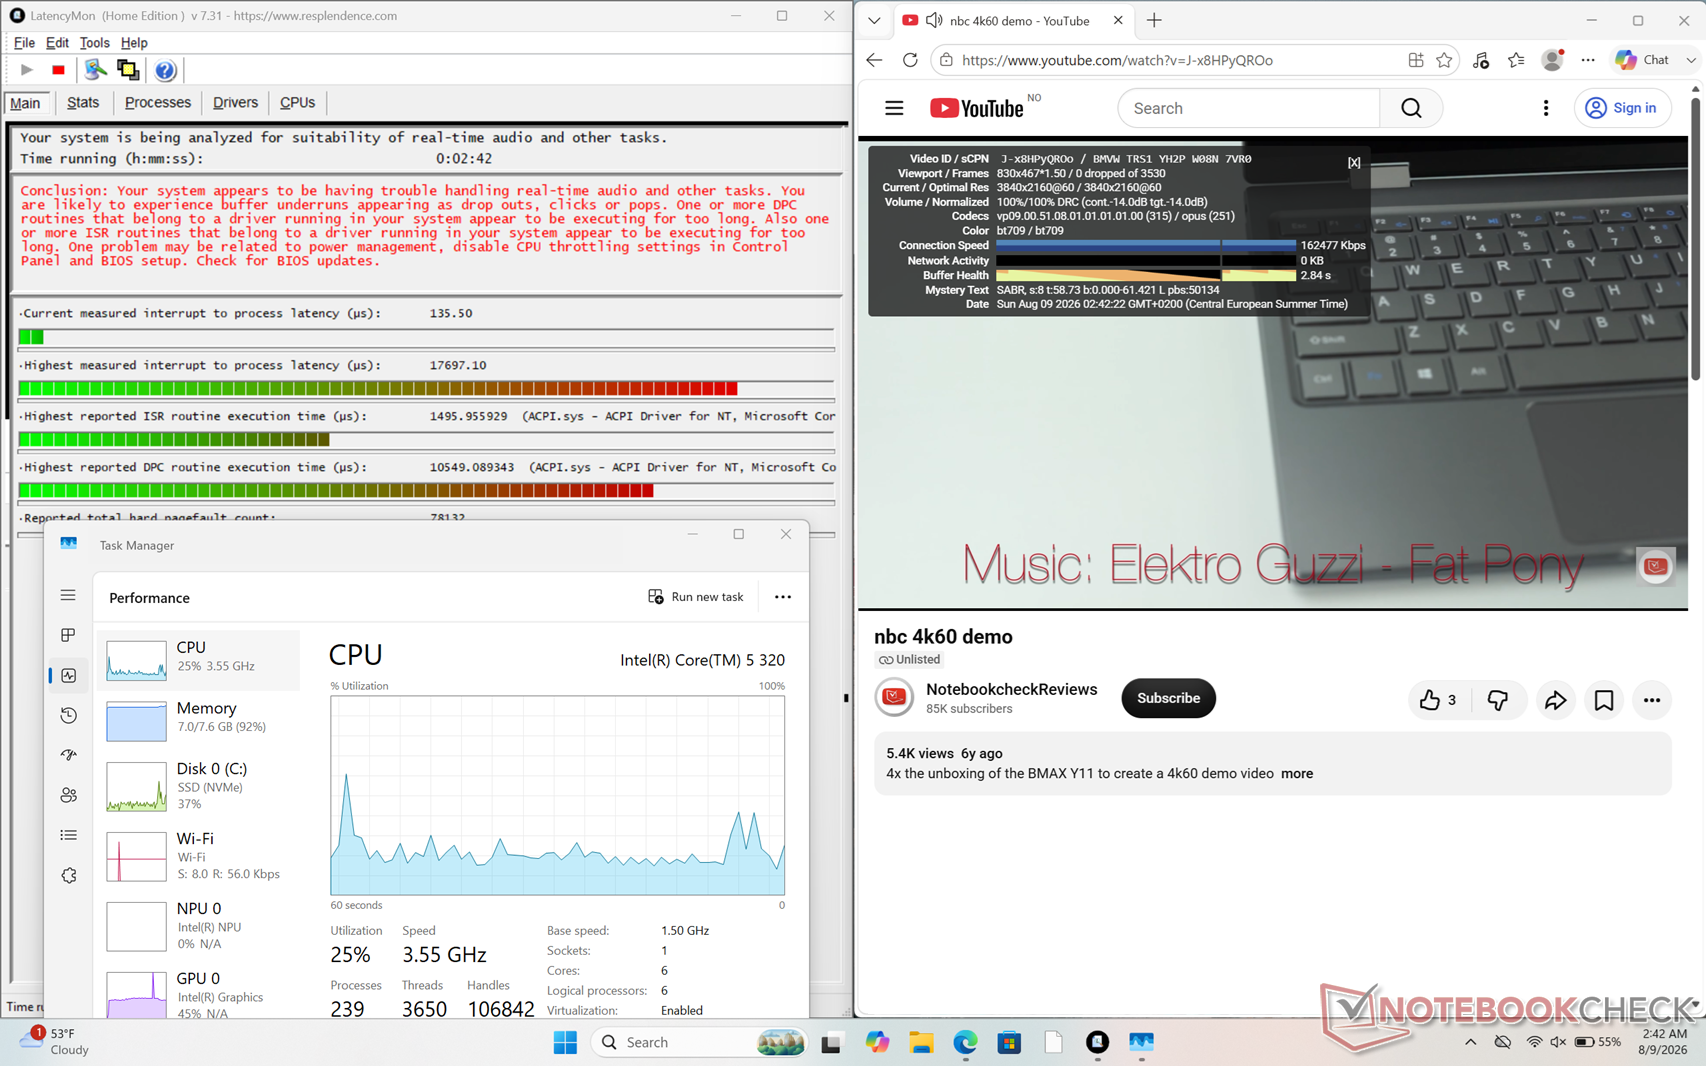
LatencyMon rileva problemi di DPC, ma per il resto non si verificano frame persi durante la riproduzione di video in 4K a 60 fps
Elenco dei driver
Elenco dei driver
DPC Latencies / LatencyMon - interrupt to process latency (max), Web, Youtube, Prime95
Dell XPS 13 DX13260
Intel Graphics 2 Xe3 WCL, Core 5 320
17697.1 μs *
Lenovo ThinkPad X1 Carbon Gen 14 21V70075GE
Intel Graphics 4 Xe3 PTL, Ultra 5 325, Samsung PM9C1b MZVL8512HFLU-00BLL
3000.2 μs * +83%
Dell XPS 14 Core Ultra X7 358H
Arc B390 Panther Lake iGPU, Ultra X7 358H, Samsung PM9C1b MZVL81T0HFLB-00BH1
872.4 μs * +95%
HP OmniBook 7 Aero 13-bg1077nr
Radeon 860M, Ryzen AI 7 350, SK hynix PC801 HFS001TEJ9X101N
719 μs * +96%

* ... Meglio usare valori piccoli

Dispositivi di archiviazione
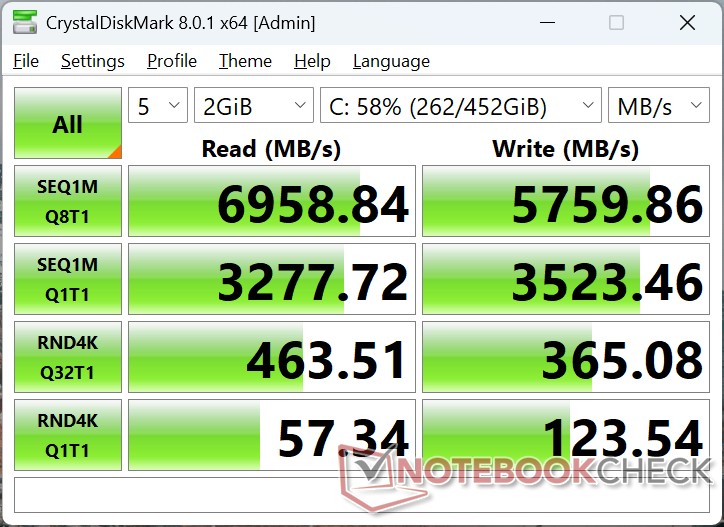
CDM 8
CDM 8
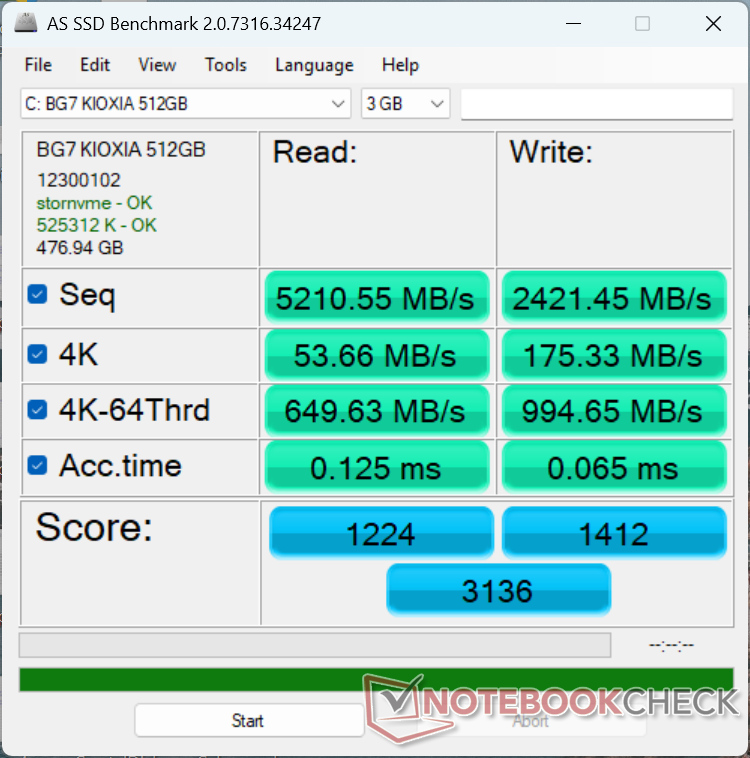
AS SSD
AS SSD
CDM 5/6 Read Seq Q32T1: 7107 MB/s
CDM 5/6 Write Seq Q32T1: 4462 MB/s
CDM 5/6 Read 4K Q32T1: 467.5 MB/s
CDM 5/6 Write 4K Q32T1: 359.6 MB/s
CDM 5 Read Seq: 3262 MB/s
CDM 5 Write Seq: 3536 MB/s
CDM 5/6 Read 4K: 59.62 MB/s
CDM 5/6 Write 4K: 116.7 MB/s
Drive Performance rating - Percent
HP OmniBook 7 Aero 13-bg1077nr
SK hynix PC801 HFS001TEJ9X101N
81.6 pt
Lenovo ThinkPad X1 Carbon Gen 14 21V70075GE
Samsung PM9C1b MZVL8512HFLU-00BLL
79.8 pt
Dell XPS 14 Core Ultra X7 358H
Samsung PM9C1b MZVL81T0HFLB-00BH1
77.7 pt
Dell XPS 13 DX13260
 
66.2 pt
Dell XPS 13 9350
Micron 2550 512GB
60.2 pt
DiskSpd
seq read
HP OmniBook 7 Aero 13-bg1077nr
SK hynix PC801 HFS001TEJ9X101N
4375 (4333.49min - 4375.35max) MB/s +32%
Dell XPS 13 DX13260
 
3317 (3282.04min - 3316.51max) MB/s
Lenovo ThinkPad X1 Carbon Gen 14 21V70075GE
Samsung PM9C1b MZVL8512HFLU-00BLL
3223 (3130.84min - 3223.17max) MB/s -3%
Dell XPS 14 Core Ultra X7 358H
Samsung PM9C1b MZVL81T0HFLB-00BH1
2967 (2659.4min - 2966.9max) MB/s -11%
Dell XPS 13 9350
Micron 2550 512GB
2416 (2299.74min - 2415.91max) MB/s -27%
seq write
HP OmniBook 7 Aero 13-bg1077nr
SK hynix PC801 HFS001TEJ9X101N
3662 (3599.27min - 3661.63max) MB/s +12%
Dell XPS 13 DX13260
 
3272 (3191.03min - 3271.98max) MB/s
Lenovo ThinkPad X1 Carbon Gen 14 21V70075GE
Samsung PM9C1b MZVL8512HFLU-00BLL
3265 (2792.78min - 3265.27max) MB/s 0%
Dell XPS 13 9350
Micron 2550 512GB
2477 (2281.75min - 2476.53max) MB/s -24%
Dell XPS 14 Core Ultra X7 358H
Samsung PM9C1b MZVL81T0HFLB-00BH1
2327 (2217.14min - 2327max) MB/s -29%
seq q8 t1 read
HP OmniBook 7 Aero 13-bg1077nr
SK hynix PC801 HFS001TEJ9X101N
7169 (6417.08min - 7168.69max) MB/s +3%
Dell XPS 14 Core Ultra X7 358H
Samsung PM9C1b MZVL81T0HFLB-00BH1
7037 (5759.83min - 7037.41max) MB/s +1%
Dell XPS 13 DX13260
 
6964 (5869.51min - 6964.43max) MB/s
Lenovo ThinkPad X1 Carbon Gen 14 21V70075GE
Samsung PM9C1b MZVL8512HFLU-00BLL
6949 (5380.03min - 6948.7max) MB/s 0%
Dell XPS 13 9350
Micron 2550 512GB
5057 (4337.25min - 5057.07max) MB/s -27%
seq q8 t1 write
HP OmniBook 7 Aero 13-bg1077nr
SK hynix PC801 HFS001TEJ9X101N
6156 (6136.27min - 6155.83max) MB/s +9%
Lenovo ThinkPad X1 Carbon Gen 14 21V70075GE
Samsung PM9C1b MZVL8512HFLU-00BLL
5863 (5795.9min - 5862.8max) MB/s +4%
Dell XPS 13 DX13260
 
5647 (5306.51min - 5646.79max) MB/s
Dell XPS 14 Core Ultra X7 358H
Samsung PM9C1b MZVL81T0HFLB-00BH1
5595 (5550.94min - 5595.34max) MB/s -1%
Dell XPS 13 9350
Micron 2550 512GB
4062 (3975.8min - 4061.61max) MB/s -28%
4k q1 t1 read
Lenovo ThinkPad X1 Carbon Gen 14 21V70075GE
Samsung PM9C1b MZVL8512HFLU-00BLL
74.6 (69.99min - 74.6max) MB/s +18%
Dell XPS 13 DX13260
 
63.4 (62.65min - 63.44max) MB/s
Dell XPS 14 Core Ultra X7 358H
Samsung PM9C1b MZVL81T0HFLB-00BH1
61.8 (59.95min - 61.82max) MB/s -3%
HP OmniBook 7 Aero 13-bg1077nr
SK hynix PC801 HFS001TEJ9X101N
54.6 (53.89min - 54.55max) MB/s -14%
Dell XPS 13 9350
Micron 2550 512GB
53.2 (50.58min - 53.24max) MB/s -16%
4k q1 t1 write
Lenovo ThinkPad X1 Carbon Gen 14 21V70075GE
Samsung PM9C1b MZVL8512HFLU-00BLL
171.1 (149.61min - 171.12max) MB/s +11%
Dell XPS 13 DX13260
 
154.1 (152.71min - 154.07max) MB/s
Dell XPS 14 Core Ultra X7 358H
Samsung PM9C1b MZVL81T0HFLB-00BH1
139.7 (138.86min - 139.67max) MB/s -9%
Dell XPS 13 9350
Micron 2550 512GB
139.2 (136.33min - 139.15max) MB/s -10%
HP OmniBook 7 Aero 13-bg1077nr
SK hynix PC801 HFS001TEJ9X101N
129.2 (122.07min - 129.16max) MB/s -16%
4k q32 t16 read
HP OmniBook 7 Aero 13-bg1077nr
SK hynix PC801 HFS001TEJ9X101N
970 (862.72min - 969.93max) MB/s +75%
Dell XPS 14 Core Ultra X7 358H
Samsung PM9C1b MZVL81T0HFLB-00BH1
711 (562.02min - 711.38max) MB/s +28%
Lenovo ThinkPad X1 Carbon Gen 14 21V70075GE
Samsung PM9C1b MZVL8512HFLU-00BLL
677 (649.67min - 677.04max) MB/s +22%
Dell XPS 13 9350
Micron 2550 512GB
640 (630.5min - 640.27max) MB/s +16%
Dell XPS 13 DX13260
 
554 (539.77min - 554.36max) MB/s
4k q32 t16 write
HP OmniBook 7 Aero 13-bg1077nr
SK hynix PC801 HFS001TEJ9X101N
545 (535.65min - 545.01max) MB/s +93%
Lenovo ThinkPad X1 Carbon Gen 14 21V70075GE
Samsung PM9C1b MZVL8512HFLU-00BLL
471 (431.88min - 471.05max) MB/s +66%
Dell XPS 14 Core Ultra X7 358H
Samsung PM9C1b MZVL81T0HFLB-00BH1
432 (319.99min - 432.49max) MB/s +53%
Dell XPS 13 9350
Micron 2550 512GB
374 (359.04min - 373.65max) MB/s +32%
Dell XPS 13 DX13260
 
283 (279.07min - 282.59max) MB/s
AS SSD
Score Total
Dell XPS 14 Core Ultra X7 358H
Samsung PM9C1b MZVL81T0HFLB-00BH1
5466 Points +74%
HP OmniBook 7 Aero 13-bg1077nr
SK hynix PC801 HFS001TEJ9X101N
4484 Points +43%
Lenovo ThinkPad X1 Carbon Gen 14 21V70075GE
Samsung PM9C1b MZVL8512HFLU-00BLL
3647 Points +16%
Dell XPS 13 9350
Micron 2550 512GB
3176 Points +1%
Dell XPS 13 DX13260
 
3136 Points
Score Read
HP OmniBook 7 Aero 13-bg1077nr
SK hynix PC801 HFS001TEJ9X101N
1805 Points +47%
Dell XPS 14 Core Ultra X7 358H
Samsung PM9C1b MZVL81T0HFLB-00BH1
1402 Points +15%
Lenovo ThinkPad X1 Carbon Gen 14 21V70075GE
Samsung PM9C1b MZVL8512HFLU-00BLL
1272 Points +4%
Dell XPS 13 DX13260
 
1224 Points
Dell XPS 13 9350
Micron 2550 512GB
1096 Points -10%
Score Write
Dell XPS 14 Core Ultra X7 358H
Samsung PM9C1b MZVL81T0HFLB-00BH1
3375 Points +139%
HP OmniBook 7 Aero 13-bg1077nr
SK hynix PC801 HFS001TEJ9X101N
1856 Points +31%
Lenovo ThinkPad X1 Carbon Gen 14 21V70075GE
Samsung PM9C1b MZVL8512HFLU-00BLL
1798 Points +27%
Dell XPS 13 9350
Micron 2550 512GB
1572 Points +11%
Dell XPS 13 DX13260
 
1412 Points
Seq Read
HP OmniBook 7 Aero 13-bg1077nr
SK hynix PC801 HFS001TEJ9X101N
5217.29 MB/s 0%
Dell XPS 13 DX13260
 
5210.55 MB/s
Lenovo ThinkPad X1 Carbon Gen 14 21V70075GE
Samsung PM9C1b MZVL8512HFLU-00BLL
5129 MB/s -2%
Dell XPS 14 Core Ultra X7 358H
Samsung PM9C1b MZVL81T0HFLB-00BH1
4161.24 MB/s -20%
Dell XPS 13 9350
Micron 2550 512GB
3933.86 MB/s -25%
Seq Write
Dell XPS 14 Core Ultra X7 358H
Samsung PM9C1b MZVL81T0HFLB-00BH1
3356.2 MB/s +39%
Lenovo ThinkPad X1 Carbon Gen 14 21V70075GE
Samsung PM9C1b MZVL8512HFLU-00BLL
3282 MB/s +36%
HP OmniBook 7 Aero 13-bg1077nr
SK hynix PC801 HFS001TEJ9X101N
3126.39 MB/s +29%
Dell XPS 13 9350
Micron 2550 512GB
2608.98 MB/s +8%
Dell XPS 13 DX13260
 
2421.45 MB/s
4K Read
Lenovo ThinkPad X1 Carbon Gen 14 21V70075GE
Samsung PM9C1b MZVL8512HFLU-00BLL
67.7 MB/s +26%
Dell XPS 14 Core Ultra X7 358H
Samsung PM9C1b MZVL81T0HFLB-00BH1
57.94 MB/s +8%
Dell XPS 13 DX13260
 
53.66 MB/s
HP OmniBook 7 Aero 13-bg1077nr
SK hynix PC801 HFS001TEJ9X101N
52.5 MB/s -2%
Dell XPS 13 9350
Micron 2550 512GB
51.9 MB/s -3%
4K Write
Dell XPS 14 Core Ultra X7 358H
Samsung PM9C1b MZVL81T0HFLB-00BH1
183.04 MB/s +4%
Dell XPS 13 DX13260
 
175.33 MB/s
Lenovo ThinkPad X1 Carbon Gen 14 21V70075GE
Samsung PM9C1b MZVL8512HFLU-00BLL
173.8 MB/s -1%
HP OmniBook 7 Aero 13-bg1077nr
SK hynix PC801 HFS001TEJ9X101N
144.39 MB/s -18%
Dell XPS 13 9350
Micron 2550 512GB
138.37 MB/s -21%
4K-64 Read
HP OmniBook 7 Aero 13-bg1077nr
SK hynix PC801 HFS001TEJ9X101N
1230.46 MB/s +89%
Dell XPS 14 Core Ultra X7 358H
Samsung PM9C1b MZVL81T0HFLB-00BH1
927.71 MB/s +43%
Lenovo ThinkPad X1 Carbon Gen 14 21V70075GE
Samsung PM9C1b MZVL8512HFLU-00BLL
691 MB/s +6%
Dell XPS 13 9350
Micron 2550 512GB
650.78 MB/s 0%
Dell XPS 13 DX13260
 
649.63 MB/s
4K-64 Write
Dell XPS 14 Core Ultra X7 358H
Samsung PM9C1b MZVL81T0HFLB-00BH1
2856.06 MB/s +187%
HP OmniBook 7 Aero 13-bg1077nr
SK hynix PC801 HFS001TEJ9X101N
1398.51 MB/s +41%
Lenovo ThinkPad X1 Carbon Gen 14 21V70075GE
Samsung PM9C1b MZVL8512HFLU-00BLL
1295 MB/s +30%
Dell XPS 13 9350
Micron 2550 512GB
1172.49 MB/s +18%
Dell XPS 13 DX13260
 
994.65 MB/s
Access Time Read
Dell XPS 13 DX13260
 
0.125 ms *
Dell XPS 14 Core Ultra X7 358H
Samsung PM9C1b MZVL81T0HFLB-00BH1
0.103 ms * +18%
Dell XPS 13 9350
Micron 2550 512GB
0.091 ms * +27%
Lenovo ThinkPad X1 Carbon Gen 14 21V70075GE
Samsung PM9C1b MZVL8512HFLU-00BLL
0.058 ms * +54%
HP OmniBook 7 Aero 13-bg1077nr
SK hynix PC801 HFS001TEJ9X101N
0.043 ms * +66%
Access Time Write
HP OmniBook 7 Aero 13-bg1077nr
SK hynix PC801 HFS001TEJ9X101N
0.08 ms * -23%
Dell XPS 14 Core Ultra X7 358H
Samsung PM9C1b MZVL81T0HFLB-00BH1
0.077 ms * -18%
Dell XPS 13 9350
Micron 2550 512GB
0.076 ms * -17%
Dell XPS 13 DX13260
 
0.065 ms *
Lenovo ThinkPad X1 Carbon Gen 14 21V70075GE
Samsung PM9C1b MZVL8512HFLU-00BLL
0.026 ms * +60%

* ... Meglio usare valori piccoli

Limitazione della velocità del disco: ciclo di lettura DiskSpd, profondità della coda 8

0145290435580725870101511601305145015951740188520302175232024652610275529003045319033353480362537703915406042054350449546404785493050755220536555105655580059456090623563806525667068156960Tooltip
Dell XPS 13 DX13260  ; diskspd 2.0.17 f: Ø6973 (5927.07-7011.62) MB/s
Dell XPS 14 Core Ultra X7 358H Samsung PM9C1b MZVL81T0HFLB-00BH1; diskspd 2.0.17 f: Ø7012 (6080.06-7044.75) MB/s

Prestazioni della GPU

La scheda grafica integrata Graphics 2 Xe3 è leggermente più lenta rispetto alla Iris Xe 96 EU, che era diffusa sulla maggior parte degli Ultrabook all’inizio del 2020. Inutile dire che è progettata più per la riproduzione di video in 4K che per il gaming vero e proprio o l’accelerazione grafica.

Alcuni titoli non si avviavano, tra cui F1 24, Strange Brigade e Cyberpunk 2077 con determinate impostazioni, probabilmente a causa delle rigide limitazioni di RAM. Pertanto, questi dati non sono inclusi di seguito.

Profilo di alimentazionePunteggio graficoPunteggio di fisicaPunteggio combinato
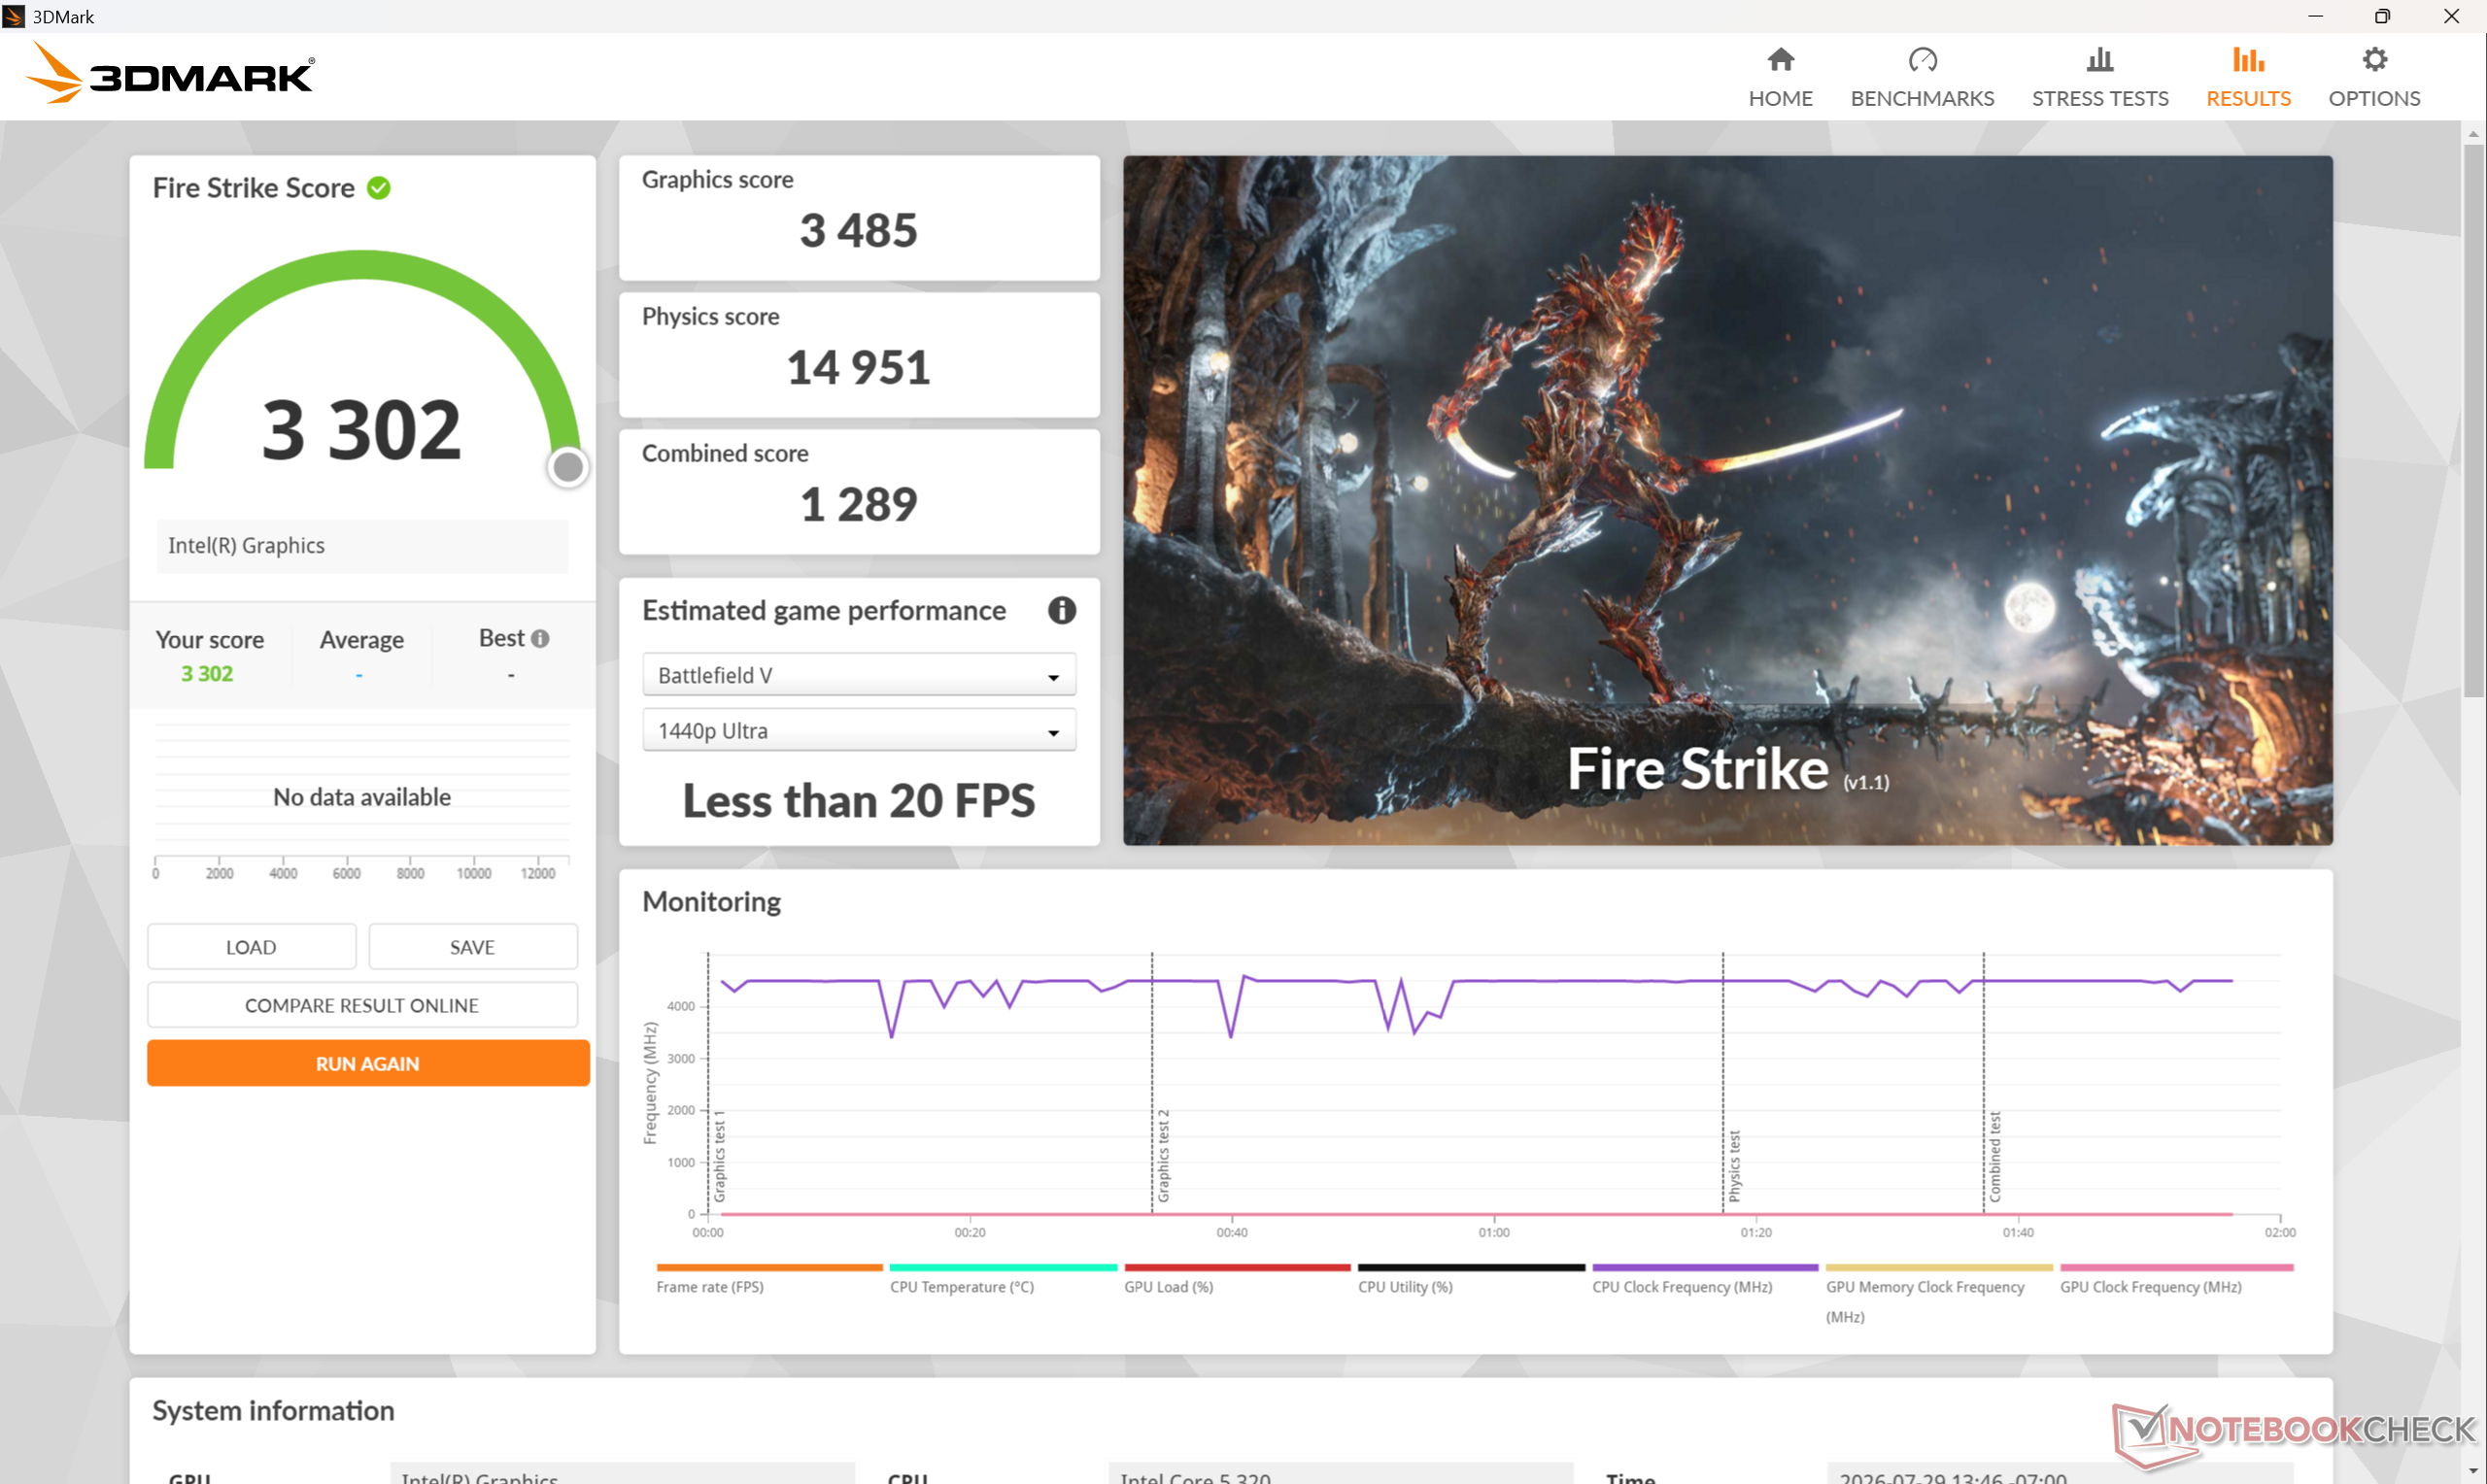
Modalità Prestazioni348514.9511289
Modalità bilanciata3410152261283
Alimentazione a batteria3384151161270
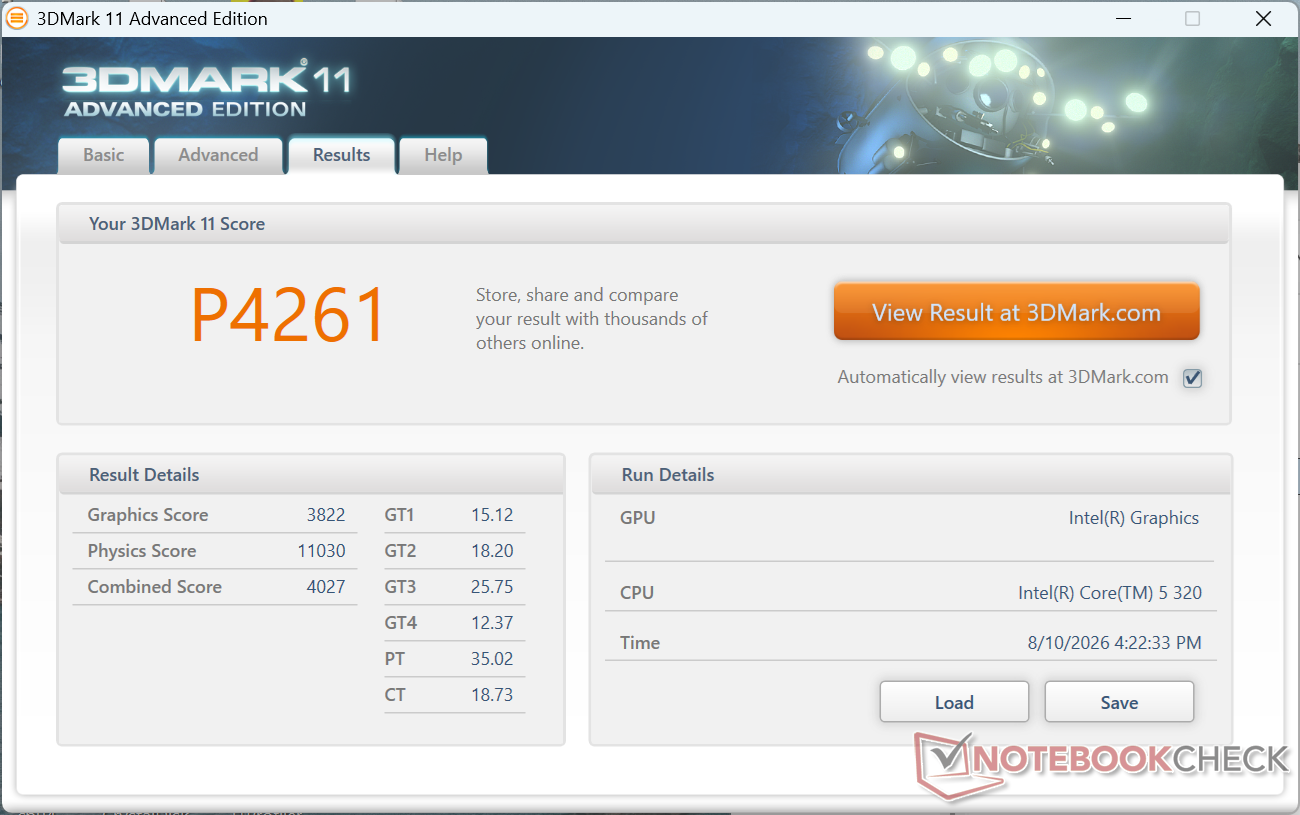
3DMark 11
3DMark 11
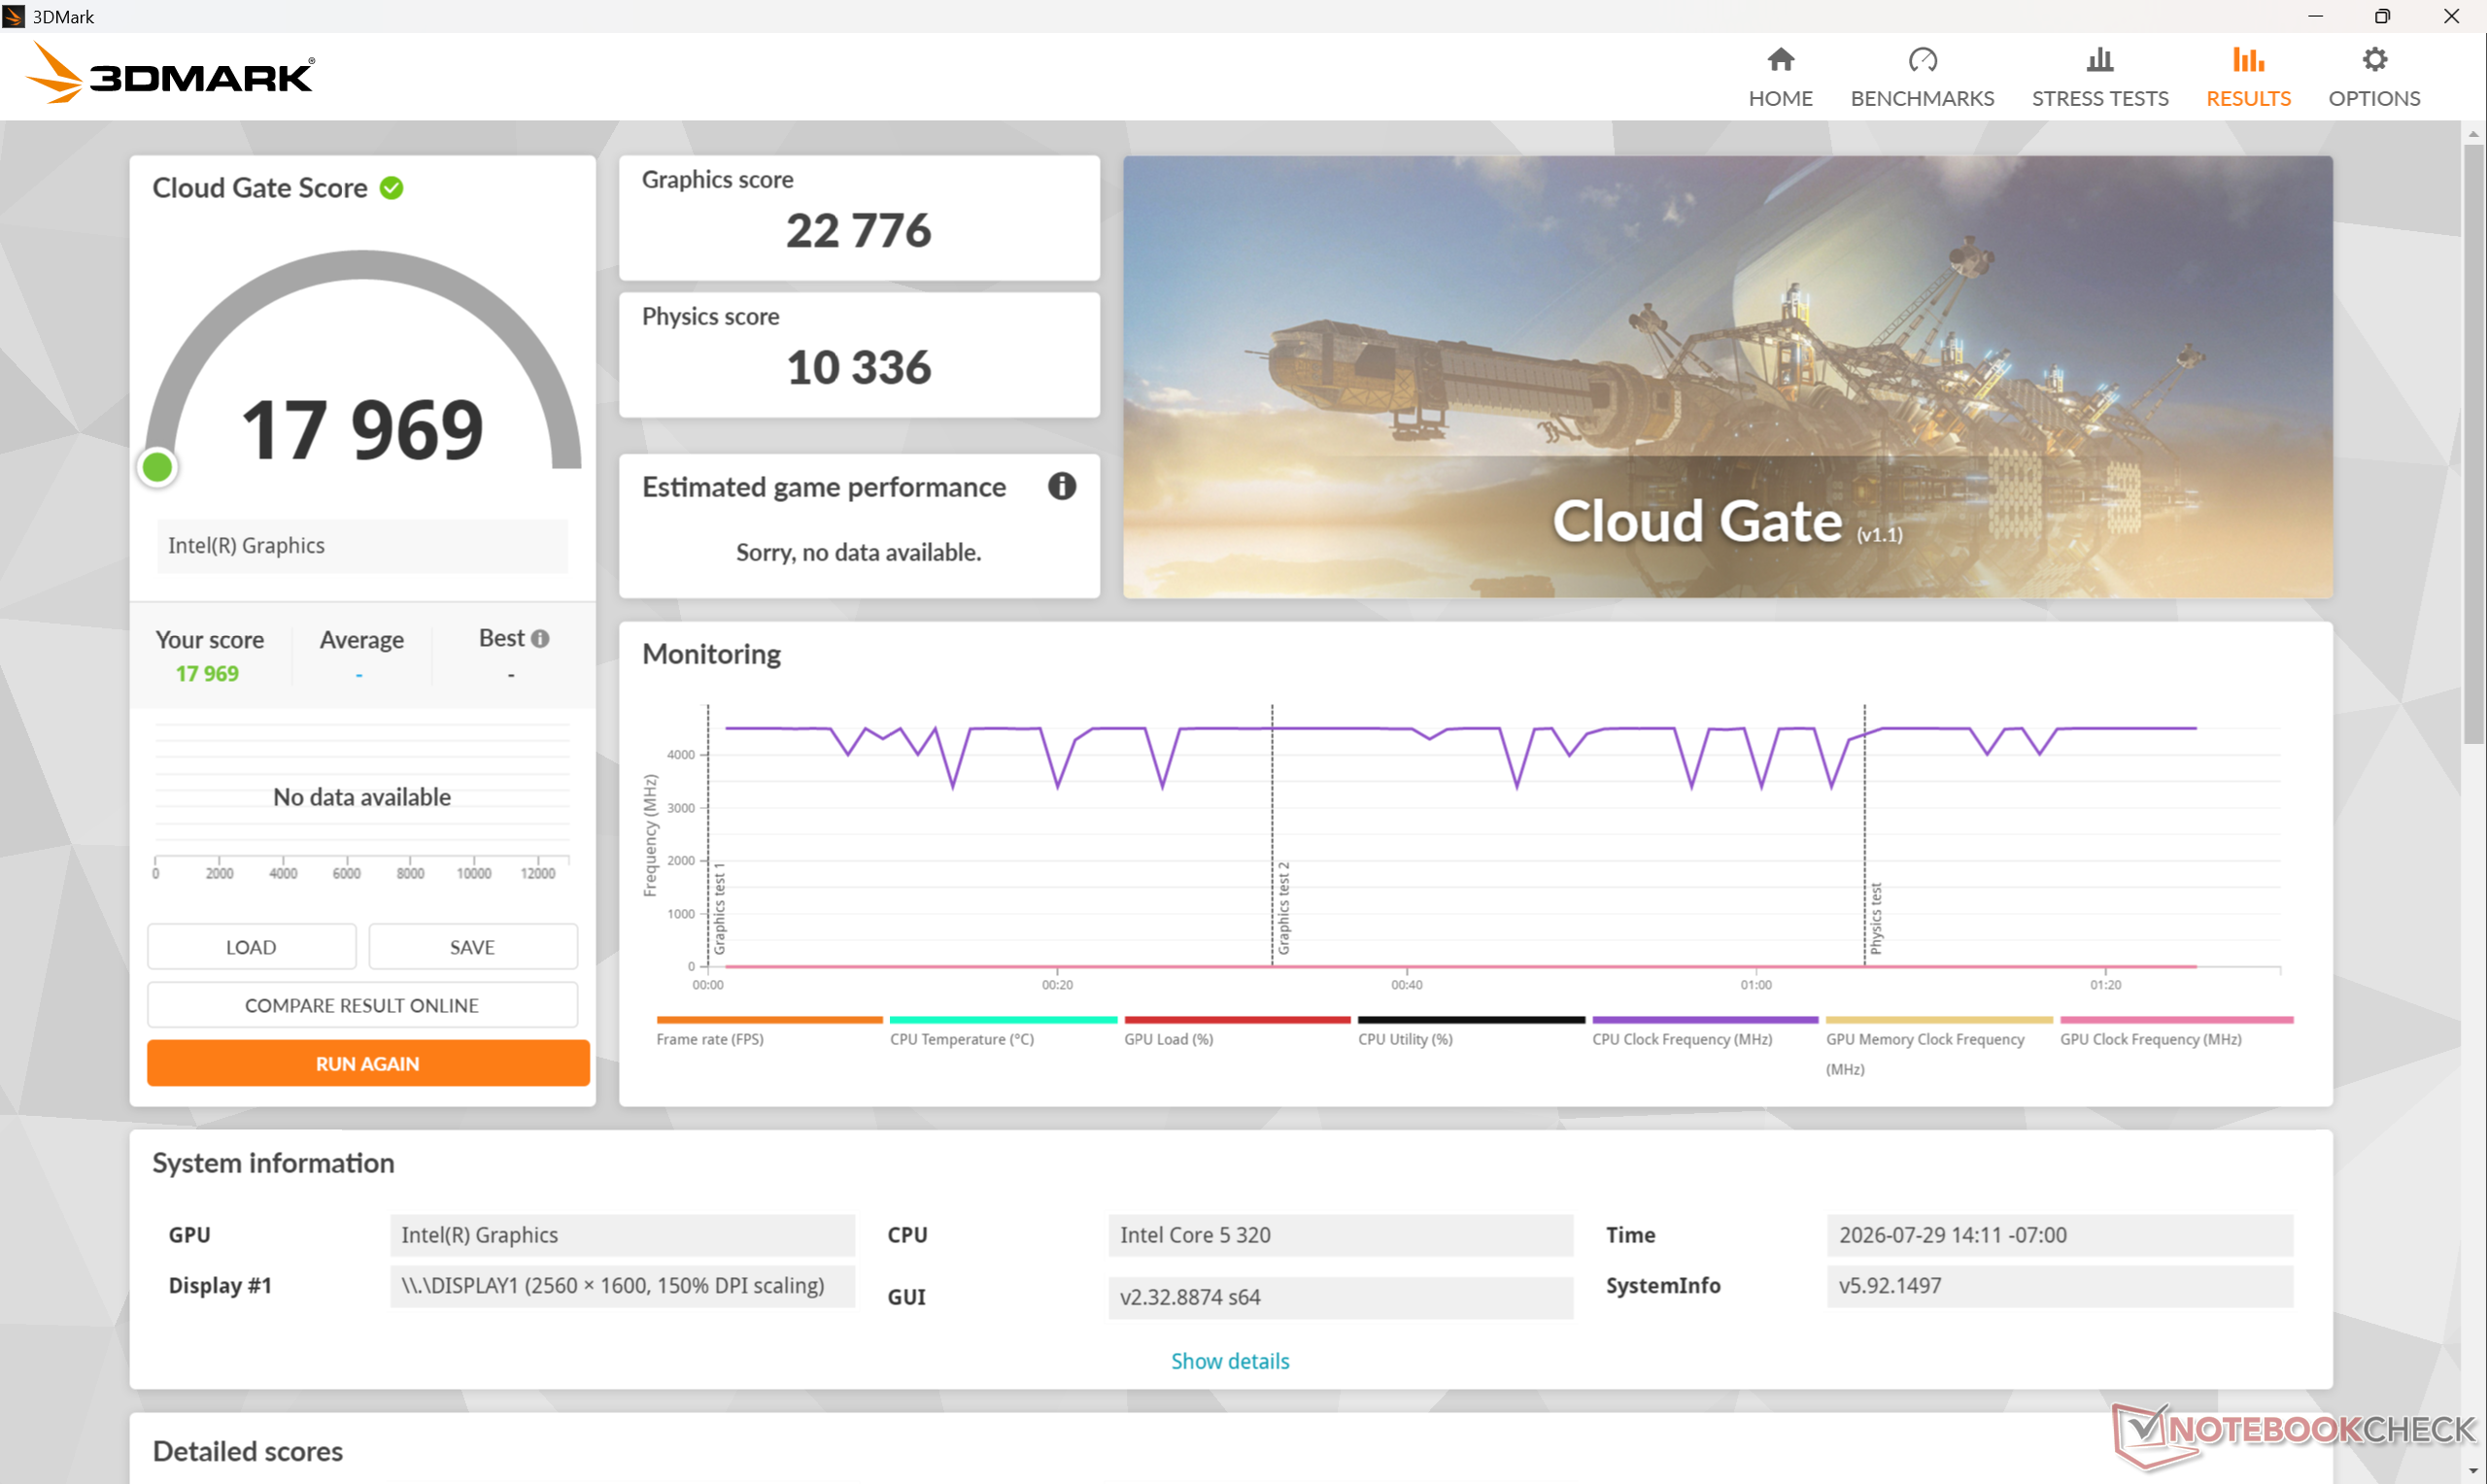
Cloud Gate
Cloud Gate
Fire Strike
Fire Strike
Time Spy
Time Spy
3DMark Performance rating - Percent
Dell XPS 14 Core Ultra X7 358H
Intel Arc B390 12 Xe3 Panther Lake iGPU, Intel Core Ultra X7 358H
100 pt
Dell XPS 13 9350
Intel Arc Graphics 140V, Intel Core Ultra 7 256V
59 pt
Dell XPS 14 Core Ultra 7 355
Intel Graphics 4 Xe3 Panther Lake iGPU, Intel Core Ultra 7 355
42.9 pt
HP OmniBook 7 Aero 13-bg1077nr
AMD Radeon 860M, AMD Ryzen AI 7 350
42.5 pt
Alldocube iWork GT Ultra
Intel Arc 7-Core iGPU, Intel Core Ultra 5 125H
41.7 pt
Lenovo ThinkPad X1 Carbon Gen 14 21V70075GE -1!
Intel Graphics 4 Xe3 Panther Lake iGPU, Intel Core Ultra 5 325
40.4 pt
Microsoft Surface Pro 8, i7-1185G7
Intel Iris Xe Graphics G7 96EUs, Intel Core i7-1185G7
32.2 pt
HP EliteBook 8 Flip G1i 13
Intel Graphics 4-Core iGPU (Meteor / Arrow Lake), Intel Core Ultra 7 265U
31.8 pt
Lenovo ThinkPad L13 2in1 G5 21LNS4AM00 -1!
Intel Graphics 4-Core iGPU (Meteor / Arrow Lake), Intel Core Ultra 5 125U
27.5 pt
Dell Latitude 13 7330
Intel Iris Xe Graphics G7 96EUs, Intel Core i7-1265U
26 pt
Media Intel Graphics 2 Xe3 Wildcat Lake iGPU
 
21.9 pt
Dell XPS 13 DX13260
Intel Graphics 2 Xe3 Wildcat Lake iGPU, Intel Core 5 320
21.8 pt
3DMark 11 - 1280x720 Performance GPU
Dell XPS 14 Core Ultra X7 358H
Intel Arc B390 12 Xe3 Panther Lake iGPU, Intel Core Ultra X7 358H
18743 Points +390%
HP OmniBook 7 Aero 13-bg1077nr
AMD Radeon 860M, AMD Ryzen AI 7 350
11064 Points +189%
Dell XPS 13 9350
Intel Arc Graphics 140V, Intel Core Ultra 7 256V
10651 Points +179%
Alldocube iWork GT Ultra
Intel Arc 7-Core iGPU, Intel Core Ultra 5 125H
7794 Points +104%
Dell XPS 14 Core Ultra 7 355
Intel Graphics 4 Xe3 Panther Lake iGPU, Intel Core Ultra 7 355
7317 Points +91%
Lenovo ThinkPad X1 Carbon Gen 14 21V70075GE
Intel Graphics 4 Xe3 Panther Lake iGPU, Intel Core Ultra 5 325
7301 Points +91%
Microsoft Surface Pro 8, i7-1185G7
Intel Iris Xe Graphics G7 96EUs, Intel Core i7-1185G7
6825 Points +79%
HP EliteBook 8 Flip G1i 13
Intel Graphics 4-Core iGPU (Meteor / Arrow Lake), Intel Core Ultra 7 265U
6090 Points +59%
Dell Latitude 13 7330
Intel Iris Xe Graphics G7 96EUs, Intel Core i7-1265U
5840 Points +53%
Lenovo ThinkPad L13 2in1 G5 21LNS4AM00
Intel Graphics 4-Core iGPU (Meteor / Arrow Lake), Intel Core Ultra 5 125U
5240 Points +37%
Dell XPS 13 DX13260
Intel Graphics 2 Xe3 Wildcat Lake iGPU, Intel Core 5 320
3822 Points
Media Intel Graphics 2 Xe3 Wildcat Lake iGPU
  (3749 - 3822, n=2)
3786 Points -1%
3DMark
1280x720 Cloud Gate Standard Graphics
Dell XPS 14 Core Ultra X7 358H
Intel Arc B390 12 Xe3 Panther Lake iGPU, Intel Core Ultra X7 358H
82808 Points +264%
Dell XPS 13 9350
Intel Arc Graphics 140V, Intel Core Ultra 7 256V
54751 Points +140%
Alldocube iWork GT Ultra
Intel Arc 7-Core iGPU, Intel Core Ultra 5 125H
42086 Points +85%
Dell XPS 14 Core Ultra 7 355
Intel Graphics 4 Xe3 Panther Lake iGPU, Intel Core Ultra 7 355
41422 Points +82%
HP OmniBook 7 Aero 13-bg1077nr
AMD Radeon 860M, AMD Ryzen AI 7 350
34432 Points +51%
HP EliteBook 8 Flip G1i 13
Intel Graphics 4-Core iGPU (Meteor / Arrow Lake), Intel Core Ultra 7 265U
32463 Points +43%
Microsoft Surface Pro 8, i7-1185G7
Intel Iris Xe Graphics G7 96EUs, Intel Core i7-1185G7
30384 Points +33%
Dell Latitude 13 7330
Intel Iris Xe Graphics G7 96EUs, Intel Core i7-1265U
25358 Points +11%
Dell XPS 13 DX13260
Intel Graphics 2 Xe3 Wildcat Lake iGPU, Intel Core 5 320
22776 Points
Media Intel Graphics 2 Xe3 Wildcat Lake iGPU
  (22468 - 22776, n=2)
22622 Points -1%
1920x1080 Fire Strike Graphics
Dell XPS 14 Core Ultra X7 358H
Intel Arc B390 12 Xe3 Panther Lake iGPU, Intel Core Ultra X7 358H
17324 Points +397%
Dell XPS 13 9350
Intel Arc Graphics 140V, Intel Core Ultra 7 256V
9492 Points +172%
Lenovo ThinkPad X1 Carbon Gen 14 21V70075GE
Intel Graphics 4 Xe3 Panther Lake iGPU, Intel Core Ultra 5 325
7090 Points +103%
Dell XPS 14 Core Ultra 7 355
Intel Graphics 4 Xe3 Panther Lake iGPU, Intel Core Ultra 7 355
7025 Points +102%
Alldocube iWork GT Ultra
Intel Arc 7-Core iGPU, Intel Core Ultra 5 125H
6691 Points +92%
HP OmniBook 7 Aero 13-bg1077nr
AMD Radeon 860M, AMD Ryzen AI 7 350
6462 Points +85%
Microsoft Surface Pro 8, i7-1185G7
Intel Iris Xe Graphics G7 96EUs, Intel Core i7-1185G7
5570 Points +60%
HP EliteBook 8 Flip G1i 13
Intel Graphics 4-Core iGPU (Meteor / Arrow Lake), Intel Core Ultra 7 265U
5143 Points +48%
Lenovo ThinkPad L13 2in1 G5 21LNS4AM00
Intel Graphics 4-Core iGPU (Meteor / Arrow Lake), Intel Core Ultra 5 125U
4604 Points +32%
Dell Latitude 13 7330
Intel Iris Xe Graphics G7 96EUs, Intel Core i7-1265U
3978 Points +14%
Media Intel Graphics 2 Xe3 Wildcat Lake iGPU
  (3485 - 3642, n=2)
3564 Points +2%
Dell XPS 13 DX13260
Intel Graphics 2 Xe3 Wildcat Lake iGPU, Intel Core 5 320
3485 Points
2560x1440 Time Spy Graphics
Dell XPS 14 Core Ultra X7 358H
Intel Arc B390 12 Xe3 Panther Lake iGPU, Intel Core Ultra X7 358H
7043 Points +424%
Dell XPS 13 9350
Intel Arc Graphics 140V, Intel Core Ultra 7 256V
4115 Points +206%
Dell XPS 14 Core Ultra 7 355
Intel Graphics 4 Xe3 Panther Lake iGPU, Intel Core Ultra 7 355
2951 Points +120%
Lenovo ThinkPad X1 Carbon Gen 14 21V70075GE
Intel Graphics 4 Xe3 Panther Lake iGPU, Intel Core Ultra 5 325
2905 Points +116%
Alldocube iWork GT Ultra
Intel Arc 7-Core iGPU, Intel Core Ultra 5 125H
2509 Points +87%
HP OmniBook 7 Aero 13-bg1077nr
AMD Radeon 860M, AMD Ryzen AI 7 350
2271 Points +69%
Lenovo ThinkPad L13 2in1 G5 21LNS4AM00
Intel Graphics 4-Core iGPU (Meteor / Arrow Lake), Intel Core Ultra 5 125U
1978 Points +47%
HP EliteBook 8 Flip G1i 13
Intel Graphics 4-Core iGPU (Meteor / Arrow Lake), Intel Core Ultra 7 265U
1808 Points +35%
Microsoft Surface Pro 8, i7-1185G7
Intel Iris Xe Graphics G7 96EUs, Intel Core i7-1185G7
1666 Points +24%
Media Intel Graphics 2 Xe3 Wildcat Lake iGPU
  (1343 - 1401, n=2)
1372 Points +2%
Dell Latitude 13 7330
Intel Iris Xe Graphics G7 96EUs, Intel Core i7-1265U
1355 Points +1%
Dell XPS 13 DX13260
Intel Graphics 2 Xe3 Wildcat Lake iGPU, Intel Core 5 320
1343 Points
3DMark 11 Performance
4261 punti
3DMark Cloud Gate Standard Score
17969 punti
3DMark Fire Strike Score
3302 punti
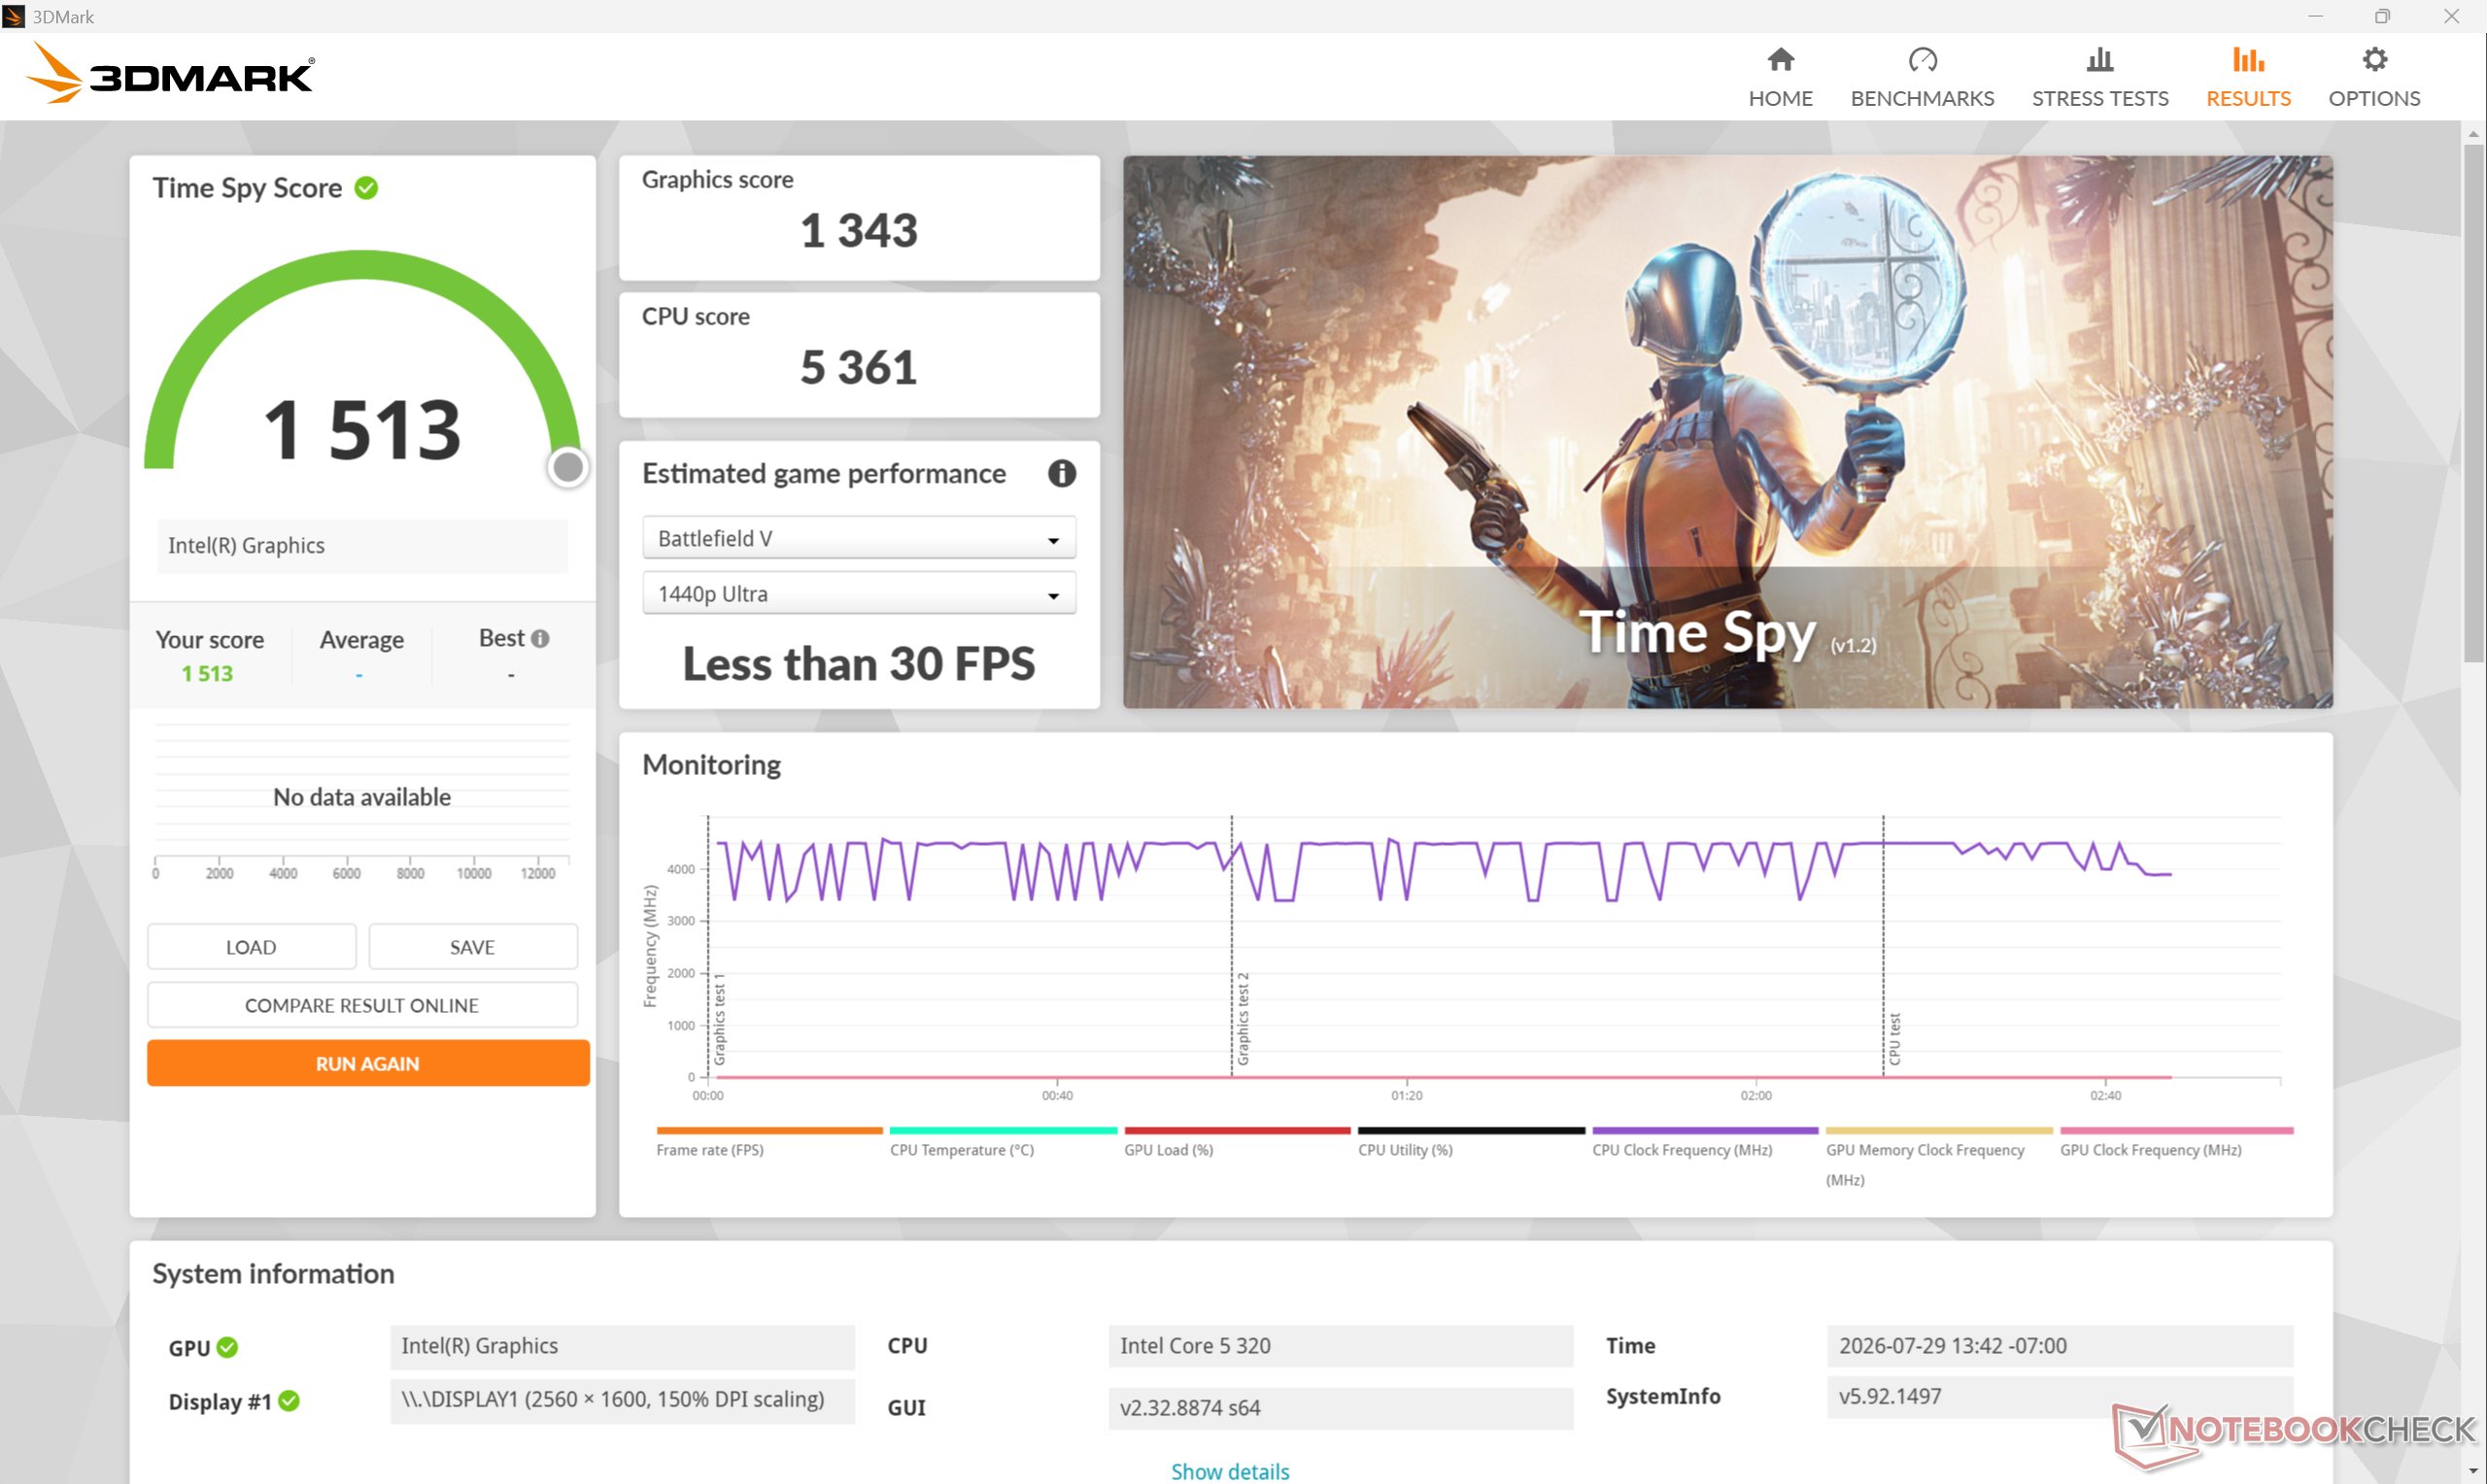
3DMark Time Spy Score
1513 punti
Aiuto
Blender
v3.3 Classroom METAL
Apple MacBook Neo 256 GB
Apple A18 GPU, Apple A18 Pro
227 Seconds *
v3.3 Classroom CPU
Dell Latitude 13 7330
Intel Iris Xe Graphics G7 96EUs, Intel Core i7-1265U
848 Seconds * -6%
Apple MacBook Neo 256 GB
Apple A18 GPU, Apple A18 Pro
813 Seconds * -2%
Dell XPS 13 DX13260
Intel Graphics 2 Xe3 Wildcat Lake iGPU, Intel Core 5 320
799 Seconds *
Media Intel Graphics 2 Xe3 Wildcat Lake iGPU
  (n=1)
799 Seconds * -0%
Lenovo ThinkPad L13 2in1 G5 21LNS4AM00
Intel Graphics 4-Core iGPU (Meteor / Arrow Lake), Intel Core Ultra 5 125U
719 Seconds * +10%
Alldocube iWork GT Ultra
Intel Arc 7-Core iGPU, Intel Core Ultra 5 125H
705 Seconds * +12%
HP EliteBook 8 Flip G1i 13
Intel Graphics 4-Core iGPU (Meteor / Arrow Lake), Intel Core Ultra 7 265U
667 Seconds * +17%
Dell XPS 13 9350
Intel Arc Graphics 140V, Intel Core Ultra 7 256V
580 Seconds * +27%
Lenovo ThinkPad X1 Carbon Gen 14 21V70075GE
Intel Graphics 4 Xe3 Panther Lake iGPU, Intel Core Ultra 5 325
499 Seconds * +38%
HP OmniBook 7 Aero 13-bg1077nr
AMD Radeon 860M, AMD Ryzen AI 7 350
365 Seconds * +54%
Dell XPS 14 Core Ultra X7 358H
Intel Arc B390 12 Xe3 Panther Lake iGPU, Intel Core Ultra X7 358H
335 Seconds * +58%
v3.3 Classroom oneAPI/Intel
Media Intel Graphics 2 Xe3 Wildcat Lake iGPU
  (n=1)
492 Seconds *
HP EliteBook 8 Flip G1i 13
Intel Graphics 4-Core iGPU (Meteor / Arrow Lake), Intel Core Ultra 7 265U
313 Seconds *
Dell XPS 13 9350
Intel Arc Graphics 140V, Intel Core Ultra 7 256V
211 Seconds *
Dell XPS 14 Core Ultra X7 358H
Intel Arc B390 12 Xe3 Panther Lake iGPU, Intel Core Ultra X7 358H
106 Seconds *
v4.3 Barbershop CPU
Dell XPS 13 DX13260
Intel Graphics 2 Xe3 Wildcat Lake iGPU, Intel Core 5 320
4408 Seconds *
Media Intel Graphics 2 Xe3 Wildcat Lake iGPU
  (3828 - 4408, n=2)
4118 Seconds * +7%
Alldocube iWork GT Ultra
Intel Arc 7-Core iGPU, Intel Core Ultra 5 125H
3693 Seconds * +16%
HP EliteBook 8 Flip G1i 13
Intel Graphics 4-Core iGPU (Meteor / Arrow Lake), Intel Core Ultra 7 265U
3358 Seconds * +24%
HP OmniBook 7 Aero 13-bg1077nr
AMD Radeon 860M, AMD Ryzen AI 7 350
2075 Seconds * +53%
Dell XPS 14 Core Ultra X7 358H
Intel Arc B390 12 Xe3 Panther Lake iGPU, Intel Core Ultra X7 358H
1711 Seconds * +61%
v4.3 Barbershop oneAPI
Media Intel Graphics 2 Xe3 Wildcat Lake iGPU
  (n=1)
2337 Seconds *
HP EliteBook 8 Flip G1i 13
Intel Graphics 4-Core iGPU (Meteor / Arrow Lake), Intel Core Ultra 7 265U
1308 Seconds *
Dell XPS 14 Core Ultra X7 358H
Intel Arc B390 12 Xe3 Panther Lake iGPU, Intel Core Ultra X7 358H
369 Seconds *

* ... Meglio usare valori piccoli

Performance rating - Percent
Dell XPS 14 Core Ultra X7 358H
Intel Core Ultra X7 358H, Intel Arc B390 12 Xe3 Panther Lake iGPU
100 pt
Dell XPS 13 9350
Intel Core Ultra 7 256V, Intel Arc Graphics 140V
64.5 pt
HP OmniBook 7 Aero 13-bg1077nr
AMD Ryzen AI 7 350, AMD Radeon 860M
63.1 pt
Lenovo ThinkPad X1 Carbon Gen 14 21V70075GE
Intel Core Ultra 5 325, Intel Graphics 4 Xe3 Panther Lake iGPU
57.9 pt
Dell XPS 13 DX13260
Intel Core 5 320, Intel Graphics 2 Xe3 Wildcat Lake iGPU
33.9 pt
Apple MacBook Neo 256 GB -4!
Apple A18 Pro, Apple A18 GPU
27.9 pt
Baldur's Gate 3 - 1920x1080 Ultra Preset AA:T
Dell XPS 14 Core Ultra X7 358H
Intel Core Ultra X7 358H, Intel Arc B390 12 Xe3 Panther Lake iGPU
48.7 (43.1min, 44.3P0.1, 45.5P1) fps +347%
Dell XPS 13 9350
Intel Core Ultra 7 256V, Intel Arc Graphics 140V
25.7 fps +136%
Lenovo ThinkPad X1 Carbon Gen 14 21V70075GE
Intel Core Ultra 5 325, Intel Graphics 4 Xe3 Panther Lake iGPU
22.4 (20.3min, 20.4P0.1, 20.6P1) fps +106%
HP OmniBook 7 Aero 13-bg1077nr
AMD Ryzen AI 7 350, AMD Radeon 860M
20.6 (17.1min, 17.1P0.1, 18.4P1) fps +89%
Apple MacBook Neo 256 GB
Apple A18 Pro, Apple A18 GPU
13.6 fps +25%
Dell XPS 13 DX13260
Intel Core 5 320, Intel Graphics 2 Xe3 Wildcat Lake iGPU
10.9 (9.5min, 9.53P0.1, 9.91P1) fps
GTA V - 1920x1080 Highest AA:4xMSAA + FX AF:16x
Dell XPS 14 Core Ultra X7 358H
Intel Core Ultra X7 358H, Intel Arc B390 12 Xe3 Panther Lake iGPU
43.3 (6.46min, 33.3P1) fps +462%
HP OmniBook 7 Aero 13-bg1077nr
AMD Ryzen AI 7 350, AMD Radeon 860M
25.7 (2.43min, 16.9P1) fps +233%
Dell XPS 13 9350
Intel Core Ultra 7 256V, Intel Arc Graphics 140V
25.6 (2.46min, 19.6P1) fps +232%
Lenovo ThinkPad X1 Carbon Gen 14 21V70075GE
Intel Core Ultra 5 325, Intel Graphics 4 Xe3 Panther Lake iGPU
21.9 (6.72min, 17.2P1) fps +184%
Dell XPS 13 DX13260
Intel Core 5 320, Intel Graphics 2 Xe3 Wildcat Lake iGPU
7.71 (1.599min, 5.99P1) fps
Final Fantasy XV Benchmark - 1920x1080 High Quality
Dell XPS 14 Core Ultra X7 358H
Intel Core Ultra X7 358H, Intel Arc B390 12 Xe3 Panther Lake iGPU
52.8 fps +182%
Dell XPS 13 9350
Intel Core Ultra 7 256V, Intel Arc Graphics 140V
31.5 fps +68%
Lenovo ThinkPad X1 Carbon Gen 14 21V70075GE
Intel Core Ultra 5 325, Intel Graphics 4 Xe3 Panther Lake iGPU
26.8 fps +43%
HP OmniBook 7 Aero 13-bg1077nr
AMD Ryzen AI 7 350, AMD Radeon 860M
23.3 fps +25%
Dell XPS 13 DX13260
Intel Core 5 320, Intel Graphics 2 Xe3 Wildcat Lake iGPU
18.7 fps
Dota 2 Reborn - 1920x1080 ultra (3/3) best looking
Dell XPS 14 Core Ultra X7 358H
Intel Core Ultra X7 358H, Intel Arc B390 12 Xe3 Panther Lake iGPU
105.4 (70.1min) fps +131%
Lenovo ThinkPad X1 Carbon Gen 14 21V70075GE
Intel Core Ultra 5 325, Intel Graphics 4 Xe3 Panther Lake iGPU
83.3 (54.4min) fps +82%
Dell XPS 13 9350
Intel Core Ultra 7 256V, Intel Arc Graphics 140V
80.7 (52.1min) fps +77%
HP OmniBook 7 Aero 13-bg1077nr
AMD Ryzen AI 7 350, AMD Radeon 860M
73.3 (66min) fps +60%
Dell XPS 13 DX13260
Intel Core 5 320, Intel Graphics 2 Xe3 Wildcat Lake iGPU
45.7 (22.3min) fps
X-Plane 11.11 - 1920x1080 high (fps_test=3)
HP OmniBook 7 Aero 13-bg1077nr
AMD Ryzen AI 7 350, AMD Radeon 860M
40.4 fps +98%
Dell XPS 14 Core Ultra X7 358H
Intel Core Ultra X7 358H, Intel Arc B390 12 Xe3 Panther Lake iGPU
40.3 fps +98%
Dell XPS 13 9350
Intel Core Ultra 7 256V, Intel Arc Graphics 140V
30.1 fps +48%
Lenovo ThinkPad X1 Carbon Gen 14 21V70075GE
Intel Core Ultra 5 325, Intel Graphics 4 Xe3 Panther Lake iGPU
25.5 fps +25%
Dell XPS 13 DX13260
Intel Core 5 320, Intel Graphics 2 Xe3 Wildcat Lake iGPU
20.4 fps
GTA V
1920x1080 Normal/Off AF:4x
Dell XPS 14 Core Ultra X7 358H
Intel Core Ultra X7 358H, Intel Arc B390 12 Xe3 Panther Lake iGPU
168.2 (4.85min, 111.1P1) fps +116%
Dell XPS 14 Core Ultra 7 355
Intel Core Ultra 7 355, Intel Graphics 4 Xe3 Panther Lake iGPU
145.8 (4.16min, 90.9P1) fps +87%
Dell XPS 13 9350
Intel Core Ultra 7 256V, Intel Arc Graphics 140V
134.2 (5.63min, 83.3P1) fps +72%
HP OmniBook 7 Aero 13-bg1077nr
AMD Ryzen AI 7 350, AMD Radeon 860M
120.3 (16.7min, 83.3P1) fps +55%
Alldocube iWork GT Ultra
Intel Core Ultra 5 125H, Intel Arc 7-Core iGPU
84.5 (27.2min, 55.6P1) fps +9%
Media Intel Graphics 2 Xe3 Wildcat Lake iGPU
  (77.8 - 78.7, n=2)
78.3 fps +1%
Dell XPS 13 DX13260
Intel Core 5 320, Intel Graphics 2 Xe3 Wildcat Lake iGPU
77.8 (7.47min, 47.6P1) fps
HP EliteBook 8 Flip G1i 13
Intel Core Ultra 7 265U, Intel Graphics 4-Core iGPU (Meteor / Arrow Lake)
74.9 (21.5min, 37P1) fps -4%
Dell Latitude 13 7330
Intel Core i7-1265U, Intel Iris Xe Graphics G7 96EUs
46.7 (18.1min, 32.3P1) fps -40%
1920x1080 High/On (Advanced Graphics Off) AA:2xMSAA + FX AF:8x
Dell XPS 14 Core Ultra X7 358H
Intel Core Ultra X7 358H, Intel Arc B390 12 Xe3 Panther Lake iGPU
98.2 (6.53min, 66.7P1) fps +357%
Dell XPS 13 9350
Intel Core Ultra 7 256V, Intel Arc Graphics 140V
60.8 (2.26min, 43.5P1) fps +183%
HP OmniBook 7 Aero 13-bg1077nr
AMD Ryzen AI 7 350, AMD Radeon 860M
60.8 (3.38min, 41.7P1) fps +183%
Dell XPS 14 Core Ultra 7 355
Intel Core Ultra 7 355, Intel Graphics 4 Xe3 Panther Lake iGPU
52.9 (9.17min, 41.7P1) fps +146%
Lenovo ThinkPad X1 Carbon Gen 14 21V70075GE
Intel Core Ultra 5 325, Intel Graphics 4 Xe3 Panther Lake iGPU
52.8 (6.47min, 40P1) fps +146%
Microsoft Surface Pro 8, i7-1185G7
Intel Core i7-1185G7, Intel Iris Xe Graphics G7 96EUs
33.2 (8.69min, 22.7P1) fps +54%
Alldocube iWork GT Ultra
Intel Core Ultra 5 125H, Intel Arc 7-Core iGPU
30.4 (6.49min, 20.8P1) fps +41%
HP EliteBook 8 Flip G1i 13
Intel Core Ultra 7 265U, Intel Graphics 4-Core iGPU (Meteor / Arrow Lake)
24.4 (7.21min, 18.5P1) fps +13%
Media Intel Graphics 2 Xe3 Wildcat Lake iGPU
  (21.5 - 27.2, n=2)
24.4 fps +13%
Lenovo ThinkPad L13 2in1 G5 21LNS4AM00
Intel Core Ultra 5 125U, Intel Graphics 4-Core iGPU (Meteor / Arrow Lake)
23.6 (5.71min, 17.9P1) fps +10%
Dell XPS 13 DX13260
Intel Core 5 320, Intel Graphics 2 Xe3 Wildcat Lake iGPU
21.5 (1.962min, 12.3P1) fps
Dell Latitude 13 7330
Intel Core i7-1265U, Intel Iris Xe Graphics G7 96EUs
13.9 (6.35min, 9.26P1) fps -35%
1920x1080 Highest AA:4xMSAA + FX AF:16x
Dell XPS 14 Core Ultra X7 358H
Intel Core Ultra X7 358H, Intel Arc B390 12 Xe3 Panther Lake iGPU
43.3 (6.46min, 33.3P1) fps +462%
HP OmniBook 7 Aero 13-bg1077nr
AMD Ryzen AI 7 350, AMD Radeon 860M
25.7 (2.43min, 16.9P1) fps +233%
Dell XPS 13 9350
Intel Core Ultra 7 256V, Intel Arc Graphics 140V
25.6 (2.46min, 19.6P1) fps +232%
Lenovo ThinkPad X1 Carbon Gen 14 21V70075GE
Intel Core Ultra 5 325, Intel Graphics 4 Xe3 Panther Lake iGPU
21.9 (6.72min, 17.2P1) fps +184%
Dell XPS 14 Core Ultra 7 355
Intel Core Ultra 7 355, Intel Graphics 4 Xe3 Panther Lake iGPU
20.9 (5.74min, 15.9P1) fps +171%
Alldocube iWork GT Ultra
Intel Core Ultra 5 125H, Intel Arc 7-Core iGPU
13.1 (5.76min, 10.4P1) fps +70%
Microsoft Surface Pro 8, i7-1185G7
Intel Core i7-1185G7, Intel Iris Xe Graphics G7 96EUs
12.8 (4.32min, 9.62P1) fps +66%
HP EliteBook 8 Flip G1i 13
Intel Core Ultra 7 265U, Intel Graphics 4-Core iGPU (Meteor / Arrow Lake)
9.99 (2.84min, 7.46P1) fps +30%
Lenovo ThinkPad L13 2in1 G5 21LNS4AM00
Intel Core Ultra 5 125U, Intel Graphics 4-Core iGPU (Meteor / Arrow Lake)
9.61 (4.73min, 7.41P1) fps +25%
Media Intel Graphics 2 Xe3 Wildcat Lake iGPU
  (7.71 - 10.5, n=2)
9.11 fps +18%
Dell XPS 13 DX13260
Intel Core 5 320, Intel Graphics 2 Xe3 Wildcat Lake iGPU
7.71 (1.599min, 5.99P1) fps
Dell Latitude 13 7330
Intel Core i7-1265U, Intel Iris Xe Graphics G7 96EUs
6.15 (2.67min, 3.83P1) fps -20%
Dota 2 Reborn
1920x1080 high (2/3)
Dell XPS 14 Core Ultra X7 358H
Intel Core Ultra X7 358H, Intel Arc B390 12 Xe3 Panther Lake iGPU
107.6 (68.3min) fps +138%
Dell XPS 13 9350
Intel Core Ultra 7 256V, Intel Arc Graphics 140V
83 (35.8min) fps +83%
HP OmniBook 7 Aero 13-bg1077nr
AMD Ryzen AI 7 350, AMD Radeon 860M
82.7 (74.6min) fps +83%
Lenovo ThinkPad X1 Carbon Gen 14 21V70075GE
Intel Core Ultra 5 325, Intel Graphics 4 Xe3 Panther Lake iGPU
82.1 (35.4min) fps +81%
Alldocube iWork GT Ultra
Intel Core Ultra 5 125H, Intel Arc 7-Core iGPU
74.6 (51min) fps +65%
Dell XPS 14 Core Ultra 7 355
Intel Core Ultra 7 355, Intel Graphics 4 Xe3 Panther Lake iGPU
73.7 (23.2min) fps +63%
Microsoft Surface Pro 8, i7-1185G7
Intel Core i7-1185G7, Intel Iris Xe Graphics G7 96EUs
63.4 (35.7min) fps +40%
Lenovo ThinkPad L13 2in1 G5 21LNS4AM00
Intel Core Ultra 5 125U, Intel Graphics 4-Core iGPU (Meteor / Arrow Lake)
59.9 (30.2min) fps +32%
Dell Latitude 13 7330
Intel Core i7-1265U, Intel Iris Xe Graphics G7 96EUs
50.6 (44.7min) fps +12%
Dell XPS 13 DX13260
Intel Core 5 320, Intel Graphics 2 Xe3 Wildcat Lake iGPU
45.3 (4.2min) fps
HP EliteBook 8 Flip G1i 13
Intel Core Ultra 7 265U, Intel Graphics 4-Core iGPU (Meteor / Arrow Lake)
44.6 (23.8min) fps -2%
Media Intel Graphics 2 Xe3 Wildcat Lake iGPU
  (34.9 - 45.3, n=2)
40.1 fps -11%
1920x1080 ultra (3/3) best looking
Dell XPS 14 Core Ultra X7 358H
Intel Core Ultra X7 358H, Intel Arc B390 12 Xe3 Panther Lake iGPU
105.4 (70.1min) fps +131%
Lenovo ThinkPad X1 Carbon Gen 14 21V70075GE
Intel Core Ultra 5 325, Intel Graphics 4 Xe3 Panther Lake iGPU
83.3 (54.4min) fps +82%
Dell XPS 13 9350
Intel Core Ultra 7 256V, Intel Arc Graphics 140V
80.7 (52.1min) fps +77%
HP OmniBook 7 Aero 13-bg1077nr
AMD Ryzen AI 7 350, AMD Radeon 860M
73.3 (66min) fps +60%
Alldocube iWork GT Ultra
Intel Core Ultra 5 125H, Intel Arc 7-Core iGPU
70.1 (49.9min) fps +53%
Dell XPS 14 Core Ultra 7 355
Intel Core Ultra 7 355, Intel Graphics 4 Xe3 Panther Lake iGPU
69.4 (33.2min) fps +52%
Microsoft Surface Pro 8, i7-1185G7
Intel Core i7-1185G7, Intel Iris Xe Graphics G7 96EUs
56.7 (32.8min) fps +24%
HP EliteBook 8 Flip G1i 13
Intel Core Ultra 7 265U, Intel Graphics 4-Core iGPU (Meteor / Arrow Lake)
52.4 (32.2min) fps +15%
Lenovo ThinkPad L13 2in1 G5 21LNS4AM00
Intel Core Ultra 5 125U, Intel Graphics 4-Core iGPU (Meteor / Arrow Lake)
50.7 (29.1min) fps +11%
Dell XPS 13 DX13260
Intel Core 5 320, Intel Graphics 2 Xe3 Wildcat Lake iGPU
45.7 (22.3min) fps
Dell Latitude 13 7330
Intel Core i7-1265U, Intel Iris Xe Graphics G7 96EUs
44.9 (40.1min) fps -2%
Media Intel Graphics 2 Xe3 Wildcat Lake iGPU
  (32.8 - 45.7, n=2)
39.3 fps -14%
Final Fantasy XV Benchmark
1280x720 Lite Quality
Dell XPS 14 Core Ultra X7 358H
Intel Core Ultra X7 358H, Intel Arc B390 12 Xe3 Panther Lake iGPU
123.5 fps +232%
Dell XPS 13 9350
Intel Core Ultra 7 256V, Intel Arc Graphics 140V
79.4 fps +113%
Lenovo ThinkPad X1 Carbon Gen 14 21V70075GE
Intel Core Ultra 5 325, Intel Graphics 4 Xe3 Panther Lake iGPU
73 fps +96%
Dell XPS 14 Core Ultra 7 355
Intel Core Ultra 7 355, Intel Graphics 4 Xe3 Panther Lake iGPU
67.3 fps +81%
HP OmniBook 7 Aero 13-bg1077nr
AMD Ryzen AI 7 350, AMD Radeon 860M
63.4 fps +70%
Alldocube iWork GT Ultra
Intel Core Ultra 5 125H, Intel Arc 7-Core iGPU
58 fps +56%
Microsoft Surface Pro 8, i7-1185G7
Intel Core i7-1185G7, Intel Iris Xe Graphics G7 96EUs
48.5 fps +30%
Lenovo ThinkPad L13 2in1 G5 21LNS4AM00
Intel Core Ultra 5 125U, Intel Graphics 4-Core iGPU (Meteor / Arrow Lake)
44.9 fps +21%
HP EliteBook 8 Flip G1i 13
Intel Core Ultra 7 265U, Intel Graphics 4-Core iGPU (Meteor / Arrow Lake)
42.6 fps +15%
Media Intel Graphics 2 Xe3 Wildcat Lake iGPU
  (37.2 - 39.4, n=2)
38.3 fps +3%
Dell XPS 13 DX13260
Intel Core 5 320, Intel Graphics 2 Xe3 Wildcat Lake iGPU
37.2 fps
Dell Latitude 13 7330
Intel Core i7-1265U, Intel Iris Xe Graphics G7 96EUs
32.9 fps -12%
1920x1080 Standard Quality
Dell XPS 14 Core Ultra X7 358H
Intel Core Ultra X7 358H, Intel Arc B390 12 Xe3 Panther Lake iGPU
73.7 fps +294%
Dell XPS 13 9350
Intel Core Ultra 7 256V, Intel Arc Graphics 140V
46.1 fps +147%
Lenovo ThinkPad X1 Carbon Gen 14 21V70075GE
Intel Core Ultra 5 325, Intel Graphics 4 Xe3 Panther Lake iGPU
37.5 fps +101%
Dell XPS 14 Core Ultra 7 355
Intel Core Ultra 7 355, Intel Graphics 4 Xe3 Panther Lake iGPU
34.9 fps +87%
Alldocube iWork GT Ultra
Intel Core Ultra 5 125H, Intel Arc 7-Core iGPU
33.2 fps +78%
HP OmniBook 7 Aero 13-bg1077nr
AMD Ryzen AI 7 350, AMD Radeon 860M
32.7 fps +75%
Microsoft Surface Pro 8, i7-1185G7
Intel Core i7-1185G7, Intel Iris Xe Graphics G7 96EUs
26.9 fps +44%
HP EliteBook 8 Flip G1i 13
Intel Core Ultra 7 265U, Intel Graphics 4-Core iGPU (Meteor / Arrow Lake)
24.9 fps +33%
Lenovo ThinkPad L13 2in1 G5 21LNS4AM00
Intel Core Ultra 5 125U, Intel Graphics 4-Core iGPU (Meteor / Arrow Lake)
24.2 fps +29%
Media Intel Graphics 2 Xe3 Wildcat Lake iGPU
  (18.7 - 20.3, n=2)
19.5 fps +4%
Dell XPS 13 DX13260
Intel Core 5 320, Intel Graphics 2 Xe3 Wildcat Lake iGPU
18.7 fps
Dell Latitude 13 7330
Intel Core i7-1265U, Intel Iris Xe Graphics G7 96EUs
17.5 fps -6%
1920x1080 High Quality
Dell XPS 14 Core Ultra X7 358H
Intel Core Ultra X7 358H, Intel Arc B390 12 Xe3 Panther Lake iGPU
52.8 fps +182%
Dell XPS 13 9350
Intel Core Ultra 7 256V, Intel Arc Graphics 140V
31.5 fps +68%
Microsoft Surface Pro 8, i7-1185G7
Intel Core i7-1185G7, Intel Iris Xe Graphics G7 96EUs
26.9 fps +44%
Lenovo ThinkPad X1 Carbon Gen 14 21V70075GE
Intel Core Ultra 5 325, Intel Graphics 4 Xe3 Panther Lake iGPU
26.8 fps +43%
Dell XPS 14 Core Ultra 7 355
Intel Core Ultra 7 355, Intel Graphics 4 Xe3 Panther Lake iGPU
25.4 fps +36%
HP OmniBook 7 Aero 13-bg1077nr
AMD Ryzen AI 7 350, AMD Radeon 860M
23.3 fps +25%
Alldocube iWork GT Ultra
Intel Core Ultra 5 125H, Intel Arc 7-Core iGPU
23.1 fps +24%
Dell XPS 13 DX13260
Intel Core 5 320, Intel Graphics 2 Xe3 Wildcat Lake iGPU
18.7 fps
HP EliteBook 8 Flip G1i 13
Intel Core Ultra 7 265U, Intel Graphics 4-Core iGPU (Meteor / Arrow Lake)
18.2 fps -3%
Media Intel Graphics 2 Xe3 Wildcat Lake iGPU
  (15.2 - 18.7, n=2)
17 fps -9%
Lenovo ThinkPad L13 2in1 G5 21LNS4AM00
Intel Core Ultra 5 125U, Intel Graphics 4-Core iGPU (Meteor / Arrow Lake)
16.9 fps -10%
Dell Latitude 13 7330
Intel Core i7-1265U, Intel Iris Xe Graphics G7 96EUs
12.9 fps -31%
X-Plane 11.11
1280x720 low (fps_test=1)
HP OmniBook 7 Aero 13-bg1077nr
AMD Ryzen AI 7 350, AMD Radeon 860M
60.3 fps +157%
Dell XPS 14 Core Ultra X7 358H
Intel Core Ultra X7 358H, Intel Arc B390 12 Xe3 Panther Lake iGPU
59.7 fps +154%
Dell Latitude 13 7330
Intel Core i7-1265U, Intel Iris Xe Graphics G7 96EUs
47.3 fps +101%
Dell XPS 13 9350
Intel Core Ultra 7 256V, Intel Arc Graphics 140V
47.1 fps +100%
Dell XPS 14 Core Ultra 7 355
Intel Core Ultra 7 355, Intel Graphics 4 Xe3 Panther Lake iGPU
43.6 fps +86%
Alldocube iWork GT Ultra
Intel Core Ultra 5 125H, Intel Arc 7-Core iGPU
42.6 fps +81%
Lenovo ThinkPad X1 Carbon Gen 14 21V70075GE
Intel Core Ultra 5 325, Intel Graphics 4 Xe3 Panther Lake iGPU
36.2 fps +54%
Lenovo ThinkPad L13 2in1 G5 21LNS4AM00
Intel Core Ultra 5 125U, Intel Graphics 4-Core iGPU (Meteor / Arrow Lake)
35.5 fps +51%
HP EliteBook 8 Flip G1i 13
Intel Core Ultra 7 265U, Intel Graphics 4-Core iGPU (Meteor / Arrow Lake)
35.3 fps +50%
Microsoft Surface Pro 8, i7-1185G7
Intel Core i7-1185G7, Intel Iris Xe Graphics G7 96EUs
33.6 fps +43%
Media Intel Graphics 2 Xe3 Wildcat Lake iGPU
  (23.5 - 32.6, n=2)
28.1 fps +20%
Dell XPS 13 DX13260
Intel Core 5 320, Intel Graphics 2 Xe3 Wildcat Lake iGPU
23.5 fps
1920x1080 med (fps_test=2)
HP OmniBook 7 Aero 13-bg1077nr
AMD Ryzen AI 7 350, AMD Radeon 860M
48.9 fps +107%
Dell XPS 14 Core Ultra X7 358H
Intel Core Ultra X7 358H, Intel Arc B390 12 Xe3 Panther Lake iGPU
47.1 fps +100%
Dell XPS 13 9350
Intel Core Ultra 7 256V, Intel Arc Graphics 140V
36.1 fps +53%
Dell Latitude 13 7330
Intel Core i7-1265U, Intel Iris Xe Graphics G7 96EUs
33.8 fps +43%
Alldocube iWork GT Ultra
Intel Core Ultra 5 125H, Intel Arc 7-Core iGPU
32.4 fps +37%
Dell XPS 14 Core Ultra 7 355
Intel Core Ultra 7 355, Intel Graphics 4 Xe3 Panther Lake iGPU
30.9 fps +31%
Lenovo ThinkPad X1 Carbon Gen 14 21V70075GE
Intel Core Ultra 5 325, Intel Graphics 4 Xe3 Panther Lake iGPU
29.4 fps +25%
Microsoft Surface Pro 8, i7-1185G7
Intel Core i7-1185G7, Intel Iris Xe Graphics G7 96EUs
28.8 fps +22%
HP EliteBook 8 Flip G1i 13
Intel Core Ultra 7 265U, Intel Graphics 4-Core iGPU (Meteor / Arrow Lake)
28.1 fps +19%
Lenovo ThinkPad L13 2in1 G5 21LNS4AM00
Intel Core Ultra 5 125U, Intel Graphics 4-Core iGPU (Meteor / Arrow Lake)
28 fps +19%
Media Intel Graphics 2 Xe3 Wildcat Lake iGPU
  (23.6 - 26.2, n=2)
24.9 fps +6%
Dell XPS 13 DX13260
Intel Core 5 320, Intel Graphics 2 Xe3 Wildcat Lake iGPU
23.6 fps
1920x1080 high (fps_test=3)
HP OmniBook 7 Aero 13-bg1077nr
AMD Ryzen AI 7 350, AMD Radeon 860M
40.4 fps +98%
Dell XPS 14 Core Ultra X7 358H
Intel Core Ultra X7 358H, Intel Arc B390 12 Xe3 Panther Lake iGPU
40.3 fps +98%
Dell XPS 14 Core Ultra 7 355
Intel Core Ultra 7 355, Intel Graphics 4 Xe3 Panther Lake iGPU
30.5 fps +50%
Dell Latitude 13 7330
Intel Core i7-1265U, Intel Iris Xe Graphics G7 96EUs
30.3 fps +49%
Microsoft Surface Pro 8, i7-1185G7
Intel Core i7-1185G7, Intel Iris Xe Graphics G7 96EUs
30.2 fps +48%
Dell XPS 13 9350
Intel Core Ultra 7 256V, Intel Arc Graphics 140V
30.1 fps +48%
Alldocube iWork GT Ultra
Intel Core Ultra 5 125H, Intel Arc 7-Core iGPU
29.9 fps +47%
Lenovo ThinkPad X1 Carbon Gen 14 21V70075GE
Intel Core Ultra 5 325, Intel Graphics 4 Xe3 Panther Lake iGPU
25.5 fps +25%
Lenovo ThinkPad L13 2in1 G5 21LNS4AM00
Intel Core Ultra 5 125U, Intel Graphics 4-Core iGPU (Meteor / Arrow Lake)
24.1 fps +18%
HP EliteBook 8 Flip G1i 13
Intel Core Ultra 7 265U, Intel Graphics 4-Core iGPU (Meteor / Arrow Lake)
23.7 fps +16%
Dell XPS 13 DX13260
Intel Core 5 320, Intel Graphics 2 Xe3 Wildcat Lake iGPU
20.4 fps
Media Intel Graphics 2 Xe3 Wildcat Lake iGPU
  (17.8 - 20.4, n=2)
19.1 fps -6%
Baldur's Gate 3
1280x720 Low Preset AA:SM
Dell XPS 14 Core Ultra X7 358H
Intel Core Ultra X7 358H, Intel Arc B390 12 Xe3 Panther Lake iGPU
87 (74.7min, 76P0.1, 78.7P1) fps +254%
Dell XPS 13 9350
Intel Core Ultra 7 256V, Intel Arc Graphics 140V
51.7 fps +110%
HP OmniBook 7 Aero 13-bg1077nr
AMD Ryzen AI 7 350, AMD Radeon 860M
48.9 (32.2min, 36.1P0.1, 45P1) fps +99%
Dell XPS 14 Core Ultra 7 355
Intel Core Ultra 7 355, Intel Graphics 4 Xe3 Panther Lake iGPU
40.6 (34.8min, 34.9P0.1, 37.6P1) fps +65%
Alldocube iWork GT Ultra
Intel Core Ultra 5 125H, Intel Arc 7-Core iGPU
35.5 (20min, 20P0.1, 29.9P1) fps +44%
HP EliteBook 8 Flip G1i 13
Intel Core Ultra 7 265U, Intel Graphics 4-Core iGPU (Meteor / Arrow Lake)
26.3 fps +7%
Media Intel Graphics 2 Xe3 Wildcat Lake iGPU
  (24.6 - 26.9, n=2)
25.8 fps +5%
Dell XPS 13 DX13260
Intel Core 5 320, Intel Graphics 2 Xe3 Wildcat Lake iGPU
24.6 (21.6min, 21.7P0.1, 22P1) fps
1920x1080 Low Preset AA:SM
Dell XPS 14 Core Ultra X7 358H
Intel Core Ultra X7 358H, Intel Arc B390 12 Xe3 Panther Lake iGPU
64.3 (56.2min, 57.5P0.1, 60.1P1) fps +318%
Dell XPS 13 9350
Intel Core Ultra 7 256V, Intel Arc Graphics 140V
36.6 fps +138%
Lenovo ThinkPad X1 Carbon Gen 14 21V70075GE
Intel Core Ultra 5 325, Intel Graphics 4 Xe3 Panther Lake iGPU
34.8 (30.4min, 30.4P0.1, 31P1) fps +126%
HP OmniBook 7 Aero 13-bg1077nr
AMD Ryzen AI 7 350, AMD Radeon 860M
31.8 (23.7min, 23.7P0.1, 27.7P1) fps +106%
Dell XPS 14 Core Ultra 7 355
Intel Core Ultra 7 355, Intel Graphics 4 Xe3 Panther Lake iGPU
28.4 (25.5min, 25.8P0.1, 26.5P1) fps +84%
Alldocube iWork GT Ultra
Intel Core Ultra 5 125H, Intel Arc 7-Core iGPU
25.3 (19.9min, 19.9P0.1, 20P1) fps +64%
Lenovo ThinkPad L13 2in1 G5 21LNS4AM00
Intel Core Ultra 5 125U, Intel Graphics 4-Core iGPU (Meteor / Arrow Lake)
19.4 fps +26%
Apple MacBook Neo 256 GB
Apple A18 Pro, Apple A18 GPU
19.1 fps +24%
HP EliteBook 8 Flip G1i 13
Intel Core Ultra 7 265U, Intel Graphics 4-Core iGPU (Meteor / Arrow Lake)
18.1 fps +18%
Media Intel Graphics 2 Xe3 Wildcat Lake iGPU
  (15.4 - 17.1, n=2)
16.3 fps +6%
Dell XPS 13 DX13260
Intel Core 5 320, Intel Graphics 2 Xe3 Wildcat Lake iGPU
15.4 (7.68min, 9.28P0.1, 13.8P1) fps
1920x1080 Medium Preset AA:T
Dell XPS 14 Core Ultra X7 358H
Intel Core Ultra X7 358H, Intel Arc B390 12 Xe3 Panther Lake iGPU
55.4 (49.6min, 49.9P0.1, 51P1) fps +340%
Dell XPS 13 9350
Intel Core Ultra 7 256V, Intel Arc Graphics 140V
30.5 fps +142%
HP OmniBook 7 Aero 13-bg1077nr
AMD Ryzen AI 7 350, AMD Radeon 860M
26.4 (15.9min, 16.5P0.1, 20.8P1) fps +110%
Lenovo ThinkPad X1 Carbon Gen 14 21V70075GE
Intel Core Ultra 5 325, Intel Graphics 4 Xe3 Panther Lake iGPU
26 (23.5min, 23.6P0.1, 23.9P1) fps +106%
Dell XPS 14 Core Ultra 7 355
Intel Core Ultra 7 355, Intel Graphics 4 Xe3 Panther Lake iGPU
23 (20.8min, 20.8P0.1, 21.1P1) fps +83%
Alldocube iWork GT Ultra
Intel Core Ultra 5 125H, Intel Arc 7-Core iGPU
19.7 (15min, 15P0.1, 15P1) fps +56%
Apple MacBook Neo 256 GB
Apple A18 Pro, Apple A18 GPU
15.5 fps +23%
Lenovo ThinkPad L13 2in1 G5 21LNS4AM00
Intel Core Ultra 5 125U, Intel Graphics 4-Core iGPU (Meteor / Arrow Lake)
15.3 fps +21%
HP EliteBook 8 Flip G1i 13
Intel Core Ultra 7 265U, Intel Graphics 4-Core iGPU (Meteor / Arrow Lake)
14.9 fps +18%
Media Intel Graphics 2 Xe3 Wildcat Lake iGPU
  (12.6 - 13.9, n=2)
13.3 fps +6%
Dell XPS 13 DX13260
Intel Core 5 320, Intel Graphics 2 Xe3 Wildcat Lake iGPU
12.6 (11.6min, 11.6P0.1, 11.8P1) fps
1920x1080 High Preset AA:T
Dell XPS 14 Core Ultra X7 358H
Intel Core Ultra X7 358H, Intel Arc B390 12 Xe3 Panther Lake iGPU
49 (44.2min, 44.5P0.1, 46.3P1) fps +350%
Dell XPS 13 9350
Intel Core Ultra 7 256V, Intel Arc Graphics 140V
25.8 fps +137%
Lenovo ThinkPad X1 Carbon Gen 14 21V70075GE
Intel Core Ultra 5 325, Intel Graphics 4 Xe3 Panther Lake iGPU
22.9 (20.7min, 20.7P0.1, 21P1) fps +110%
HP OmniBook 7 Aero 13-bg1077nr
AMD Ryzen AI 7 350, AMD Radeon 860M
21.1 (16.7min, 17.1P0.1, 18.9P1) fps +94%
Dell XPS 14 Core Ultra 7 355
Intel Core Ultra 7 355, Intel Graphics 4 Xe3 Panther Lake iGPU
19.6 (18.3min, 18.3P0.1, 18.4P1) fps +80%
Alldocube iWork GT Ultra
Intel Core Ultra 5 125H, Intel Arc 7-Core iGPU
17.3 (14.9min, 14.9P0.1, 15P1) fps +59%
Apple MacBook Neo 256 GB
Apple A18 Pro, Apple A18 GPU
13.9 fps +28%
Lenovo ThinkPad L13 2in1 G5 21LNS4AM00
Intel Core Ultra 5 125U, Intel Graphics 4-Core iGPU (Meteor / Arrow Lake)
13.1 fps +20%
HP EliteBook 8 Flip G1i 13
Intel Core Ultra 7 265U, Intel Graphics 4-Core iGPU (Meteor / Arrow Lake)
12.8 fps +17%
Media Intel Graphics 2 Xe3 Wildcat Lake iGPU
  (10.9 - 12, n=2)
11.5 fps +6%
Dell XPS 13 DX13260
Intel Core 5 320, Intel Graphics 2 Xe3 Wildcat Lake iGPU
10.9 (9.83min, 9.85P0.1, 9.97P1) fps
1920x1080 Ultra Preset AA:T
Dell XPS 14 Core Ultra X7 358H
Intel Core Ultra X7 358H, Intel Arc B390 12 Xe3 Panther Lake iGPU
48.7 (43.1min, 44.3P0.1, 45.5P1) fps +347%
Dell XPS 13 9350
Intel Core Ultra 7 256V, Intel Arc Graphics 140V
25.7 fps +136%
Lenovo ThinkPad X1 Carbon Gen 14 21V70075GE
Intel Core Ultra 5 325, Intel Graphics 4 Xe3 Panther Lake iGPU
22.4 (20.3min, 20.4P0.1, 20.6P1) fps +106%
HP OmniBook 7 Aero 13-bg1077nr
AMD Ryzen AI 7 350, AMD Radeon 860M
20.6 (17.1min, 17.1P0.1, 18.4P1) fps +89%
Dell XPS 14 Core Ultra 7 355
Intel Core Ultra 7 355, Intel Graphics 4 Xe3 Panther Lake iGPU
19.5 (18.1min, 18.1P0.1, 18.3P1) fps +79%
Alldocube iWork GT Ultra
Intel Core Ultra 5 125H, Intel Arc 7-Core iGPU
17 (14.9min, 14.9P0.1, 15P1) fps +56%
Apple MacBook Neo 256 GB
Apple A18 Pro, Apple A18 GPU
13.6 fps +25%
Lenovo ThinkPad L13 2in1 G5 21LNS4AM00
Intel Core Ultra 5 125U, Intel Graphics 4-Core iGPU (Meteor / Arrow Lake)
12.8 fps +17%
HP EliteBook 8 Flip G1i 13
Intel Core Ultra 7 265U, Intel Graphics 4-Core iGPU (Meteor / Arrow Lake)
12.7 fps +17%
Media Intel Graphics 2 Xe3 Wildcat Lake iGPU
  (10.9 - 11.8, n=2)
11.4 fps +5%
Dell XPS 13 DX13260
Intel Core 5 320, Intel Graphics 2 Xe3 Wildcat Lake iGPU
10.9 (9.5min, 9.53P0.1, 9.91P1) fps
Cyberpunk 2077
1280x720 Low Preset (FSR off)
Dell XPS 14 Core Ultra X7 358H
Intel Core Ultra X7 358H, Intel Arc B390 12 Xe3 Panther Lake iGPU
94.4 (78.1min, 71P1) fps +178%
Dell XPS 13 9350
Intel Core Ultra 7 256V, Intel Arc Graphics 140V
66.6 (50.2min) fps +96%
Dell XPS 14 Core Ultra 7 355
Intel Core Ultra 7 355, Intel Graphics 4 Xe3 Panther Lake iGPU
59.3 (48.7min, 45.4P1) fps +75%
HP OmniBook 7 Aero 13-bg1077nr
AMD Ryzen AI 7 350, AMD Radeon 860M
49 (39min, 12.1P1) fps +45%
Alldocube iWork GT Ultra
Intel Core Ultra 5 125H, Intel Arc 7-Core iGPU
34.7 (28.8min) fps +2%
Media Intel Graphics 2 Xe3 Wildcat Lake iGPU
  (33.9 - 34.7, n=2)
34.3 fps +1%
Dell XPS 13 DX13260
Intel Core 5 320, Intel Graphics 2 Xe3 Wildcat Lake iGPU
33.9 (28.7min, 26.9P1) fps
HP EliteBook 8 Flip G1i 13
Intel Core Ultra 7 265U, Intel Graphics 4-Core iGPU (Meteor / Arrow Lake)
32.7 (26.5min, 25.4P1) fps -4%
1920x1080 Low Preset (FSR off)
Dell XPS 14 Core Ultra X7 358H
Intel Core Ultra X7 358H, Intel Arc B390 12 Xe3 Panther Lake iGPU
68.6 (57.3min, 52.9P1) fps +267%
Dell XPS 13 9350
Intel Core Ultra 7 256V, Intel Arc Graphics 140V
45.7 (36.4min) fps +144%
Lenovo ThinkPad X1 Carbon Gen 14 21V70075GE
Intel Core Ultra 5 325, Intel Graphics 4 Xe3 Panther Lake iGPU
38.6 (32.4min) fps +106%
Dell XPS 14 Core Ultra 7 355
Intel Core Ultra 7 355, Intel Graphics 4 Xe3 Panther Lake iGPU
32.7 (28.3min, 27P1) fps +75%
HP OmniBook 7 Aero 13-bg1077nr
AMD Ryzen AI 7 350, AMD Radeon 860M
32.5 (27min, 25.2P1) fps +74%
Alldocube iWork GT Ultra
Intel Core Ultra 5 125H, Intel Arc 7-Core iGPU
26.8 (23.2min) fps +43%
HP EliteBook 8 Flip G1i 13
Intel Core Ultra 7 265U, Intel Graphics 4-Core iGPU (Meteor / Arrow Lake)
21.1 (17.8min, 16.2P1) fps +13%
Media Intel Graphics 2 Xe3 Wildcat Lake iGPU
  (18.7 - 20.6, n=2)
19.7 fps +5%
Lenovo ThinkPad L13 2in1 G5 21LNS4AM00
Intel Core Ultra 5 125U, Intel Graphics 4-Core iGPU (Meteor / Arrow Lake)
19.5 (16.5min) fps +4%
Dell XPS 13 DX13260
Intel Core 5 320, Intel Graphics 2 Xe3 Wildcat Lake iGPU
18.7 (15.9min, 13.1P1) fps
Apple MacBook Neo 256 GB
Apple A18 Pro, Apple A18 GPU
12.4 fps -34%
1920x1080 Medium Preset (FSR off)
Dell XPS 14 Core Ultra X7 358H
Intel Core Ultra X7 358H, Intel Arc B390 12 Xe3 Panther Lake iGPU
56.2 (48.2min, 44.5P1) fps +293%
Dell XPS 13 9350
Intel Core Ultra 7 256V, Intel Arc Graphics 140V
37 (30.1min) fps +159%
Lenovo ThinkPad X1 Carbon Gen 14 21V70075GE
Intel Core Ultra 5 325, Intel Graphics 4 Xe3 Panther Lake iGPU
29.1 (25.1min) fps +103%
Dell XPS 14 Core Ultra 7 355
Intel Core Ultra 7 355, Intel Graphics 4 Xe3 Panther Lake iGPU
27.7 (24.2min, 23.3P1) fps +94%
HP OmniBook 7 Aero 13-bg1077nr
AMD Ryzen AI 7 350, AMD Radeon 860M
24.9 (21.2min, 18.5P1) fps +74%
Alldocube iWork GT Ultra
Intel Core Ultra 5 125H, Intel Arc 7-Core iGPU
21.6 (18.7min) fps +51%
HP EliteBook 8 Flip G1i 13
Intel Core Ultra 7 265U, Intel Graphics 4-Core iGPU (Meteor / Arrow Lake)
17.1 (14.8min, 14.3P1) fps +20%
Lenovo ThinkPad L13 2in1 G5 21LNS4AM00
Intel Core Ultra 5 125U, Intel Graphics 4-Core iGPU (Meteor / Arrow Lake)
15.9 (13.9min) fps +11%
Media Intel Graphics 2 Xe3 Wildcat Lake iGPU
  (14.3 - 15.3, n=2)
14.8 fps +3%
Dell XPS 13 DX13260
Intel Core 5 320, Intel Graphics 2 Xe3 Wildcat Lake iGPU
14.3 (12.6min, 12.1P1) fps
Apple MacBook Neo 256 GB
Apple A18 Pro, Apple A18 GPU
9.2 fps -36%
bassomedioaltoultra
GTA V (2015) 116.8 101 21.5 7.71
Dota 2 Reborn (2015) 79.2 43.7 45.3 45.7
Final Fantasy XV Benchmark (2018) 37.2 18.7 18.7
X-Plane 11.11 (2018) 23.5 23.6 20.4
Strange Brigade (2018) 95.1 38.6 30.5
Baldur's Gate 3 (2023) 15.4 12.6 10.9 10.9
Cyberpunk 2077 (2023) 18.7 14.3

Emissioni

Rumore di sistema

Il sistema è più silenzioso rispetto ai modelli XPS 13 della generazione precedente, in linea con le prestazioni complessive più ridotte della CPU Wildcat. Il rumore della ventola diventa percepibile solo quando si eseguono operazioni più impegnative rispetto alla semplice navigazione sul web o allo streaming video.
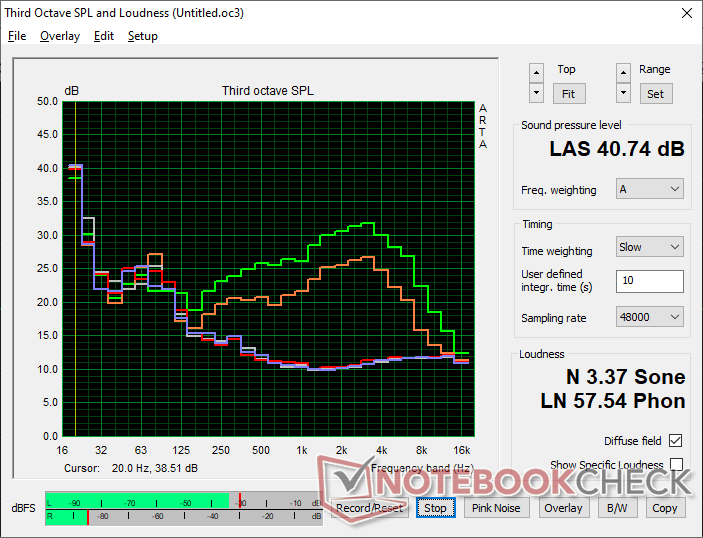
Profilo di rumorosità della ventola (Bianco: rumore di fondo, Rosso: sistema inattivo, Blu: 3DMark 11, Arancione: Cyberpunk 2077, Verde: stress test Prime95)

Rumorosità

Idle
23.3 / 23.3 / 23.3 dB(A)
Sotto carico
27.7 / 40.7 dB(A)
  red to green bar
 
 
30 dB
silenzioso
40 dB(A)
udibile
50 dB(A)
rumoroso
 
min: dark, med: mid, max: light   Earthworks M23R, Arta (15 cm di distanza)   Rumorosità ambientale: 23.3 dB(A)
dB(A) 0102030405060708090Deep BassMiddle BassHigh BassLower RangeMidsHigher MidsLower HighsMid HighsUpper HighsSuper Highs2040.439.840.240.138.22528.62932.628.529.83121.924.224.421.924.64021.721.423.119.921.65024.625.1222223.76325.423.522.725.224.48022.424.725.427.121.91002223232221.812517.718.918.217.221.816015.415.414.916.118.520015.414.414.518.221.525013.913.614.119.823.13151514.41520.624.140012.512.113.220.32550012.111.311.520.825.863010.911.210.919.625.680010.611.110.32126.3100010.410.910.621.726.1125010.1109.923.428.516009.910.31025.229.9200010.210.310.125.530.6250010.410.610.326.331.4315010.811.310.726.731.7400011.311.311.124.730500011.411.711.622.328.2630011.711.711.720.426.8800011.711.711.715.822.41000011.711.811.713.518.51250011.91211.912.415.71600010.911.111.111.312.4SPL23.323.523.335.640.7N0.50.50.52.13.4median 11.7median 11.7median 11.6median 20.6median 25.6Delta1.61.81.73.44.2hearing rangehide median Fan NoiseDell XPS 13 DX13260
Dell XPS 13 DX13260
Core 5 320, Intel Graphics 2 Xe3 WCL
Dell XPS 14 Core Ultra X7 358H
Ultra X7 358H, Arc B390 Panther Lake iGPU
Dell XPS 13 9350
Core Ultra 7 256V, Arc 140V
Apple MacBook Neo 256 GB
A18 Pro, A18 GPU
HP OmniBook 7 Aero 13-bg1077nr
Ryzen AI 7 350, Radeon 860M
Lenovo ThinkPad X1 Carbon Gen 14 21V70075GE
Ultra 5 325, Intel Graphics 4 Xe3 PTL
Noise
-8%
-3%
6%
-10%
off /ambiente * (dB)
23.3
22.9
2%
24.1
-3%
23.2
-0%
24.8
-6%
Idle Minimum * (dB)
23.3
23.3
-0%
24.4
-5%
23.3
-0%
24.8
-6%
Idle Average * (dB)
23.3
23.3
-0%
24.4
-5%
23.3
-0%
24.8
-6%
Idle Maximum * (dB)
23.3
23.3
-0%
24.4
-5%
23.3
-0%
24.8
-6%
Load Average * (dB)
27.7
34
-23%
26.2
5%
24.7
11%
38.9
-40%
Cyberpunk 2077 ultra * (dB)
35.6
43.5
-22%
34.2
4%
23.5
34%
38.9
-9%
Load Maximum * (dB)
40.7
45.7
-12%
45.2
-11%
42
-3%
38.9
4%

* ... Meglio usare valori piccoli

Temperatura
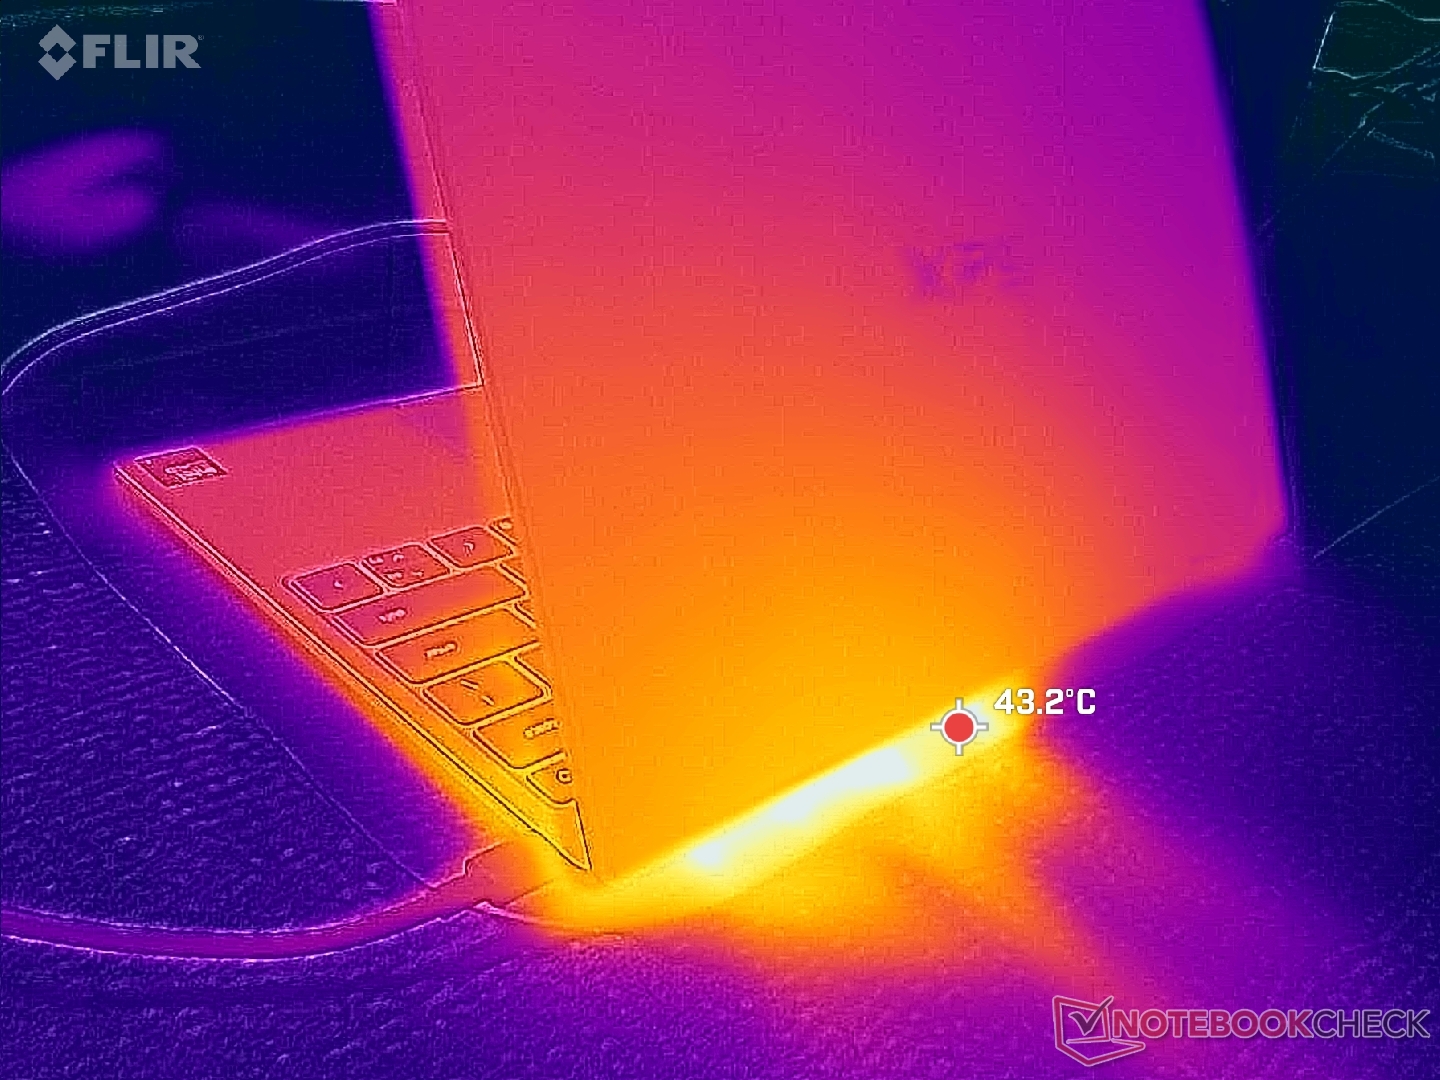
Scarico posteriore
Scarico posteriore
L'adattatore di corrente raggiunge una temperatura superiore a 38 °C quando è sottoposto a carichi elevati
Carico massimo
 37.6 °C39 °C38.2 °C 
 34 °C37.6 °C33.4 °C 
 30 °C28.8 °C28.4 °C 
Massima: 39 °C
Media: 34.1 °C
35.8 °C38.2 °C36.6 °C
31.4 °C36.6 °C34.8 °C
29.4 °C30.8 °C30.6 °C
Massima: 38.2 °C
Media: 33.8 °C
Alimentazione (max)  35.6 °C | Temperatura della stanza 20 °C | Fluke 62 Mini IR Thermometer
(±) La temperatura media del lato superiore sotto carico massimo e' di 34.1 °C / 93 F, rispetto alla media di 30.8 °C / 87 F per i dispositivi di questa classe Subnotebook.
(+) La temperatura massima sul lato superiore è di 39 °C / 102 F, rispetto alla media di 35.9 °C / 97 F, che varia da 21.4 a 59 °C per questa classe Subnotebook.
(+) Il lato inferiore si riscalda fino ad un massimo di 38.2 °C / 101 F, rispetto alla media di 39.2 °C / 103 F
(+) In idle, la temperatura media del lato superiore è di 25.1 °C / 77 F, rispetto alla media deld ispositivo di 30.8 °C / 87 F.
(+) I poggiapolsi e il touchpad sono piu' freddi della temperatura della pelle con un massimo di 30 °C / 86 F e sono quindi freddi al tatto.
(±) La temperatura media della zona del palmo della mano di dispositivi simili e'stata di 28.2 °C / 82.8 F (-1.8 °C / -3.2 F).
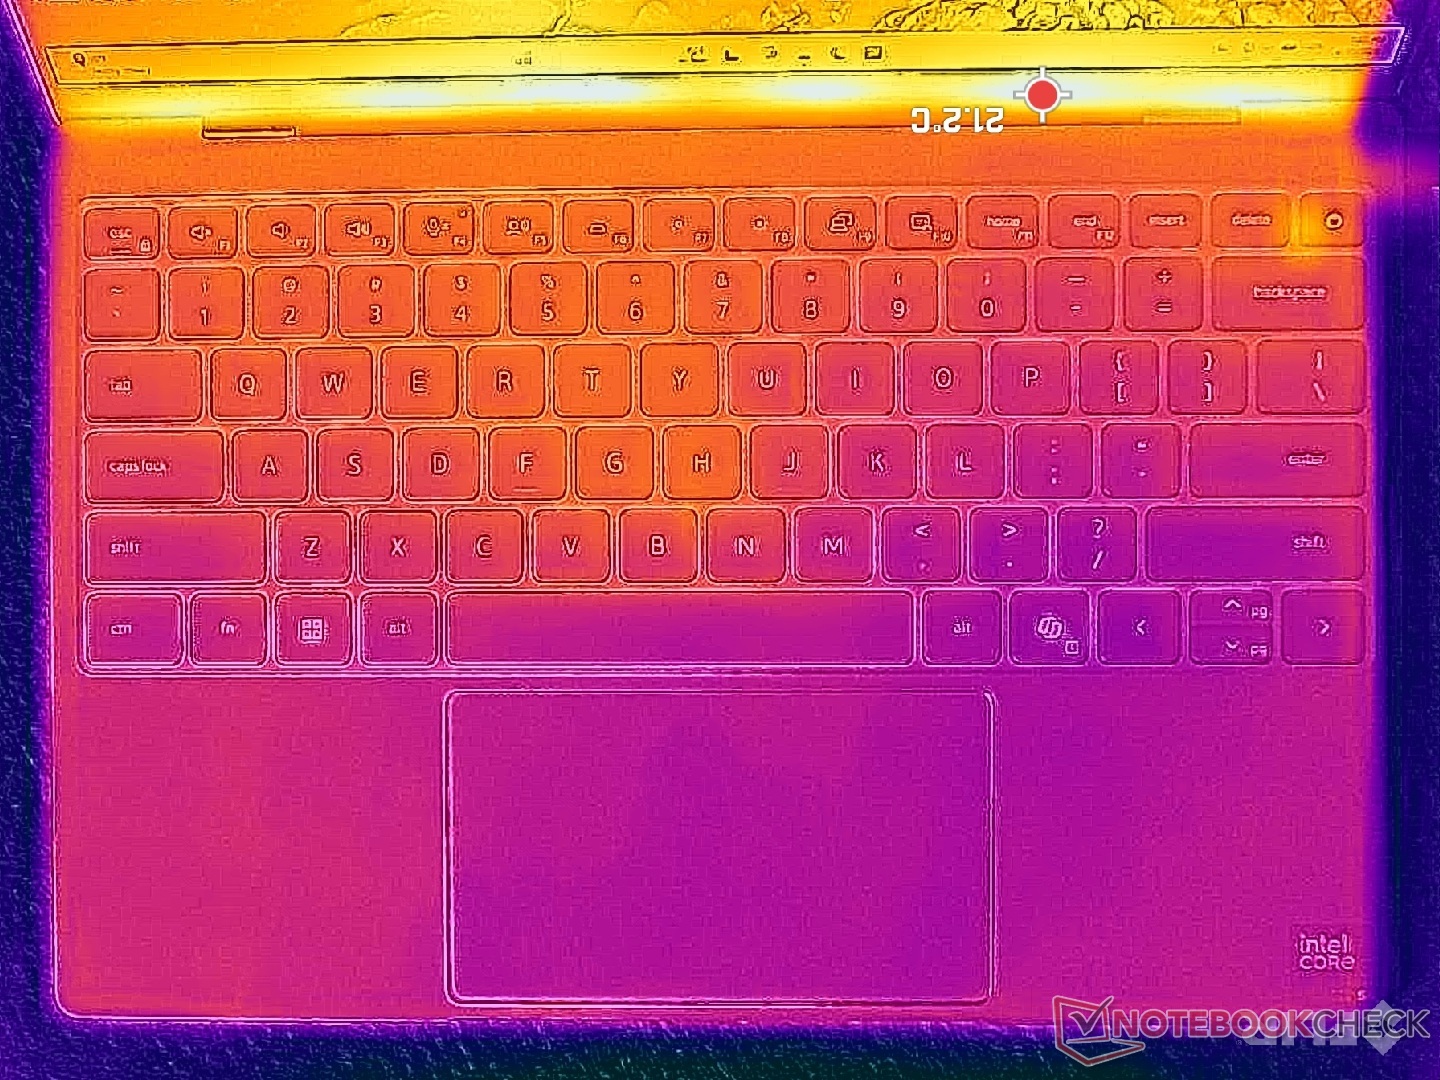
Sistema inattivo (copertina C)
Sistema inattivo (copertina D)
Test di stress con Prime95+FurMark (C cover)
Test di stress con Prime95+FurMark (livello D)
Dell XPS 13 DX13260
Core 5 320, Intel Graphics 2 Xe3 WCL
Dell XPS 14 Core Ultra X7 358H
Ultra X7 358H, Arc B390 Panther Lake iGPU
Dell XPS 13 9350
Core Ultra 7 256V, Arc 140V
Apple MacBook Neo 256 GB
A18 Pro, A18 GPU
HP OmniBook 7 Aero 13-bg1077nr
Ryzen AI 7 350, Radeon 860M
Lenovo ThinkPad X1 Carbon Gen 14 21V70075GE
Ultra 5 325, Intel Graphics 4 Xe3 PTL
Heat
5%
4%
4%
6%
-2%
Maximum Upper Side * (°C)
39
34
13%
34.8
11%
40.8
-5%
35.8
8%
40.7
-4%
Maximum Bottom * (°C)
38.2
35.8
6%
37.4
2%
38
1%
37.6
2%
42.8
-12%
Idle Upper Side * (°C)
26
25.6
2%
25.4
2%
23.8
8%
24.2
7%
24.9
4%
Idle Bottom * (°C)
26.2
26.4
-1%
26.2
-0%
22.8
13%
24
8%
25
5%

* ... Meglio usare valori piccoli

Stress test

La CPU raggiungeva i 3,6 GHz e i 35 W all’avvio dello stress test Prime95, per poi raggiungere rapidamente il picco di 100 °C. Le prestazioni scendevano quindi rapidamente a 2,6 GHz e 18 W, al fine di mantenere una temperatura del core più gestibile di 89 °C. La temperatura del core può diventare piuttosto elevata, determinando temperature superficiali sensibilmente elevate durante l’esecuzione di carichi impegnativi.
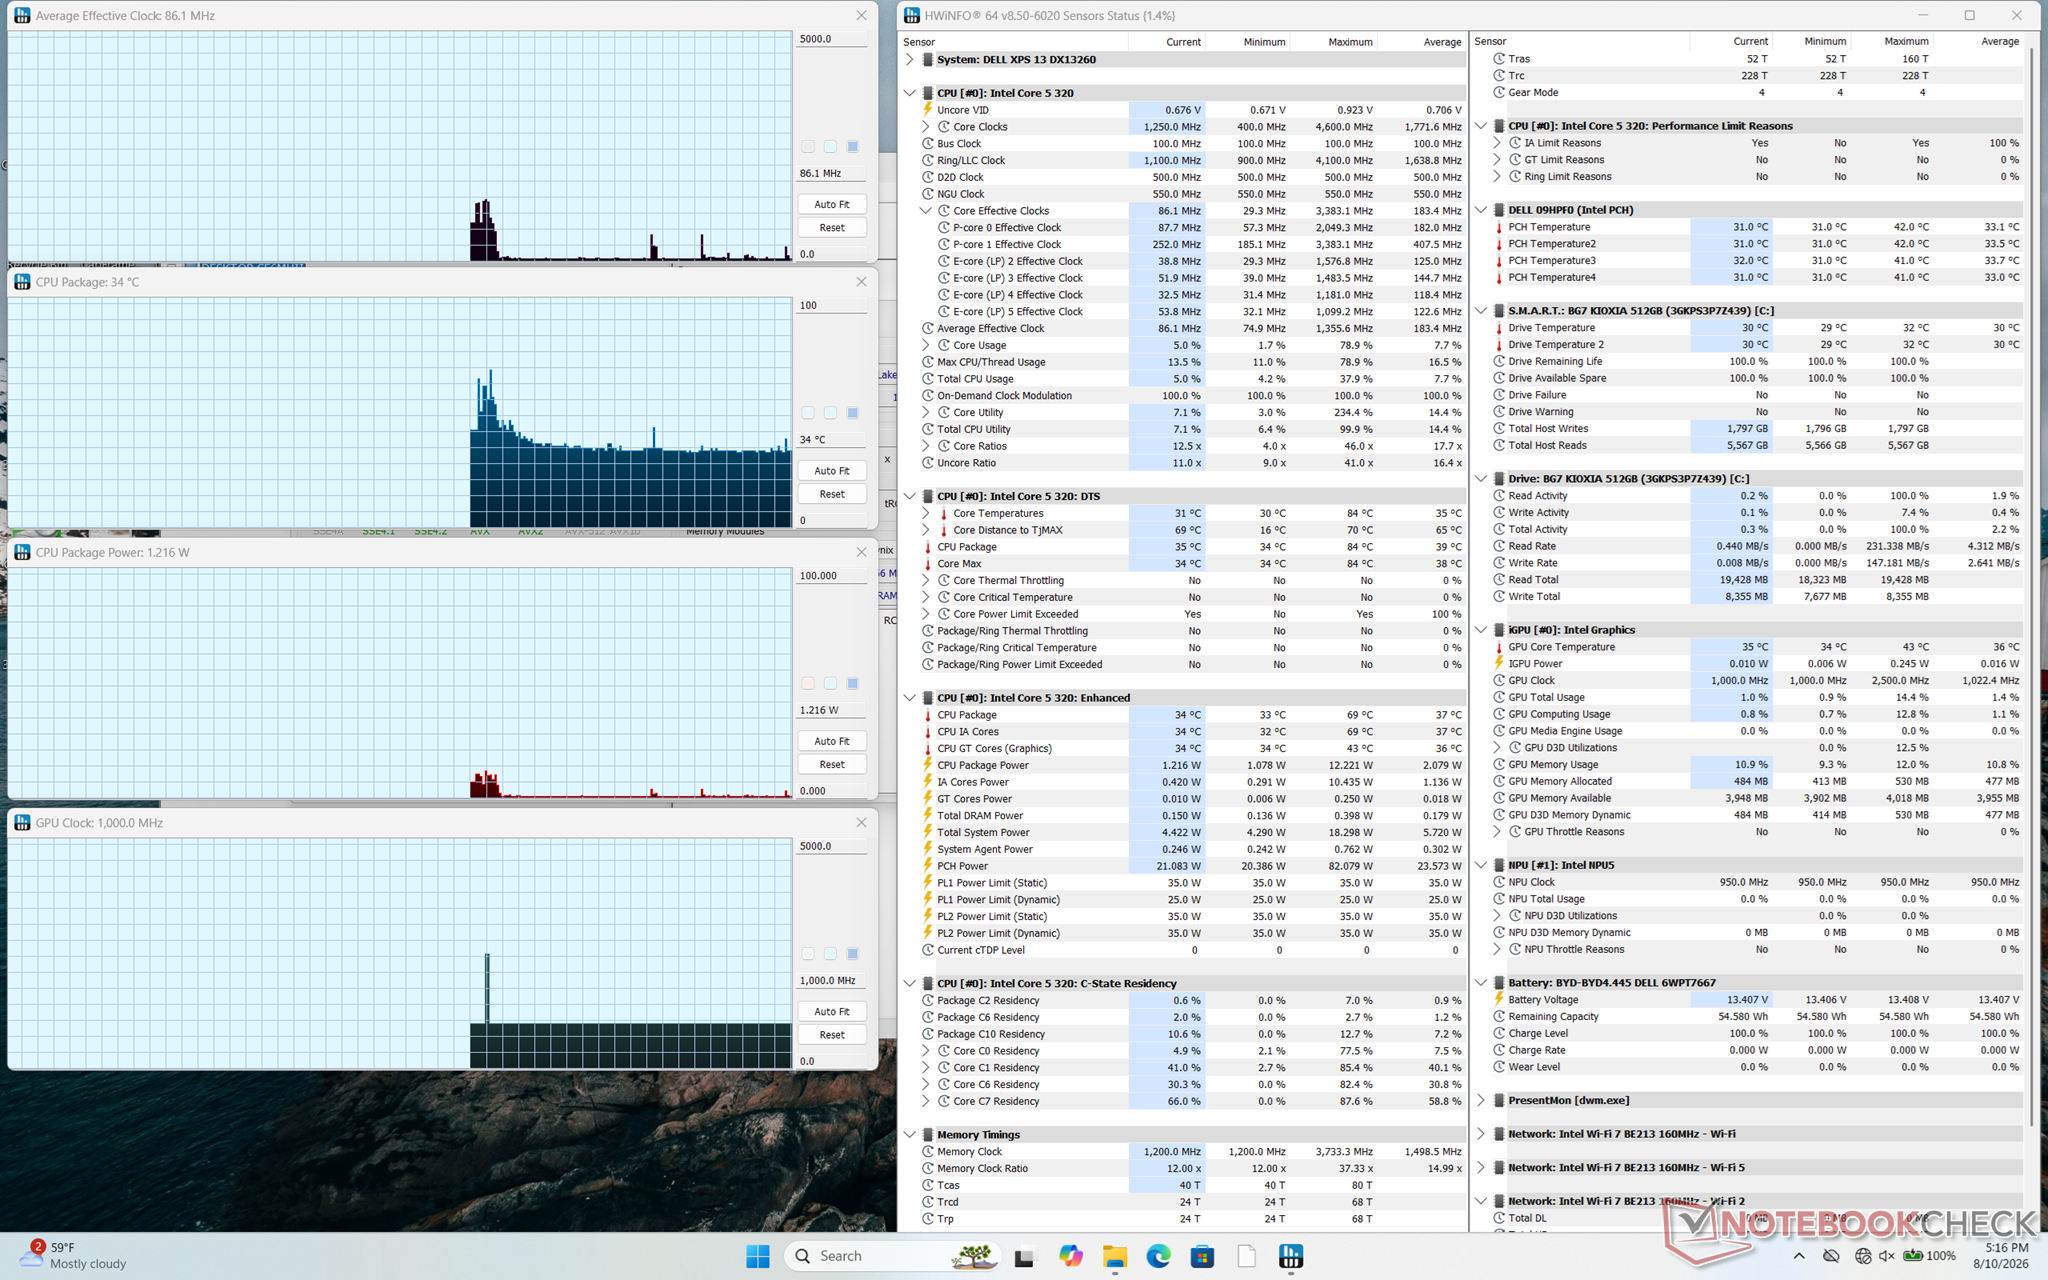
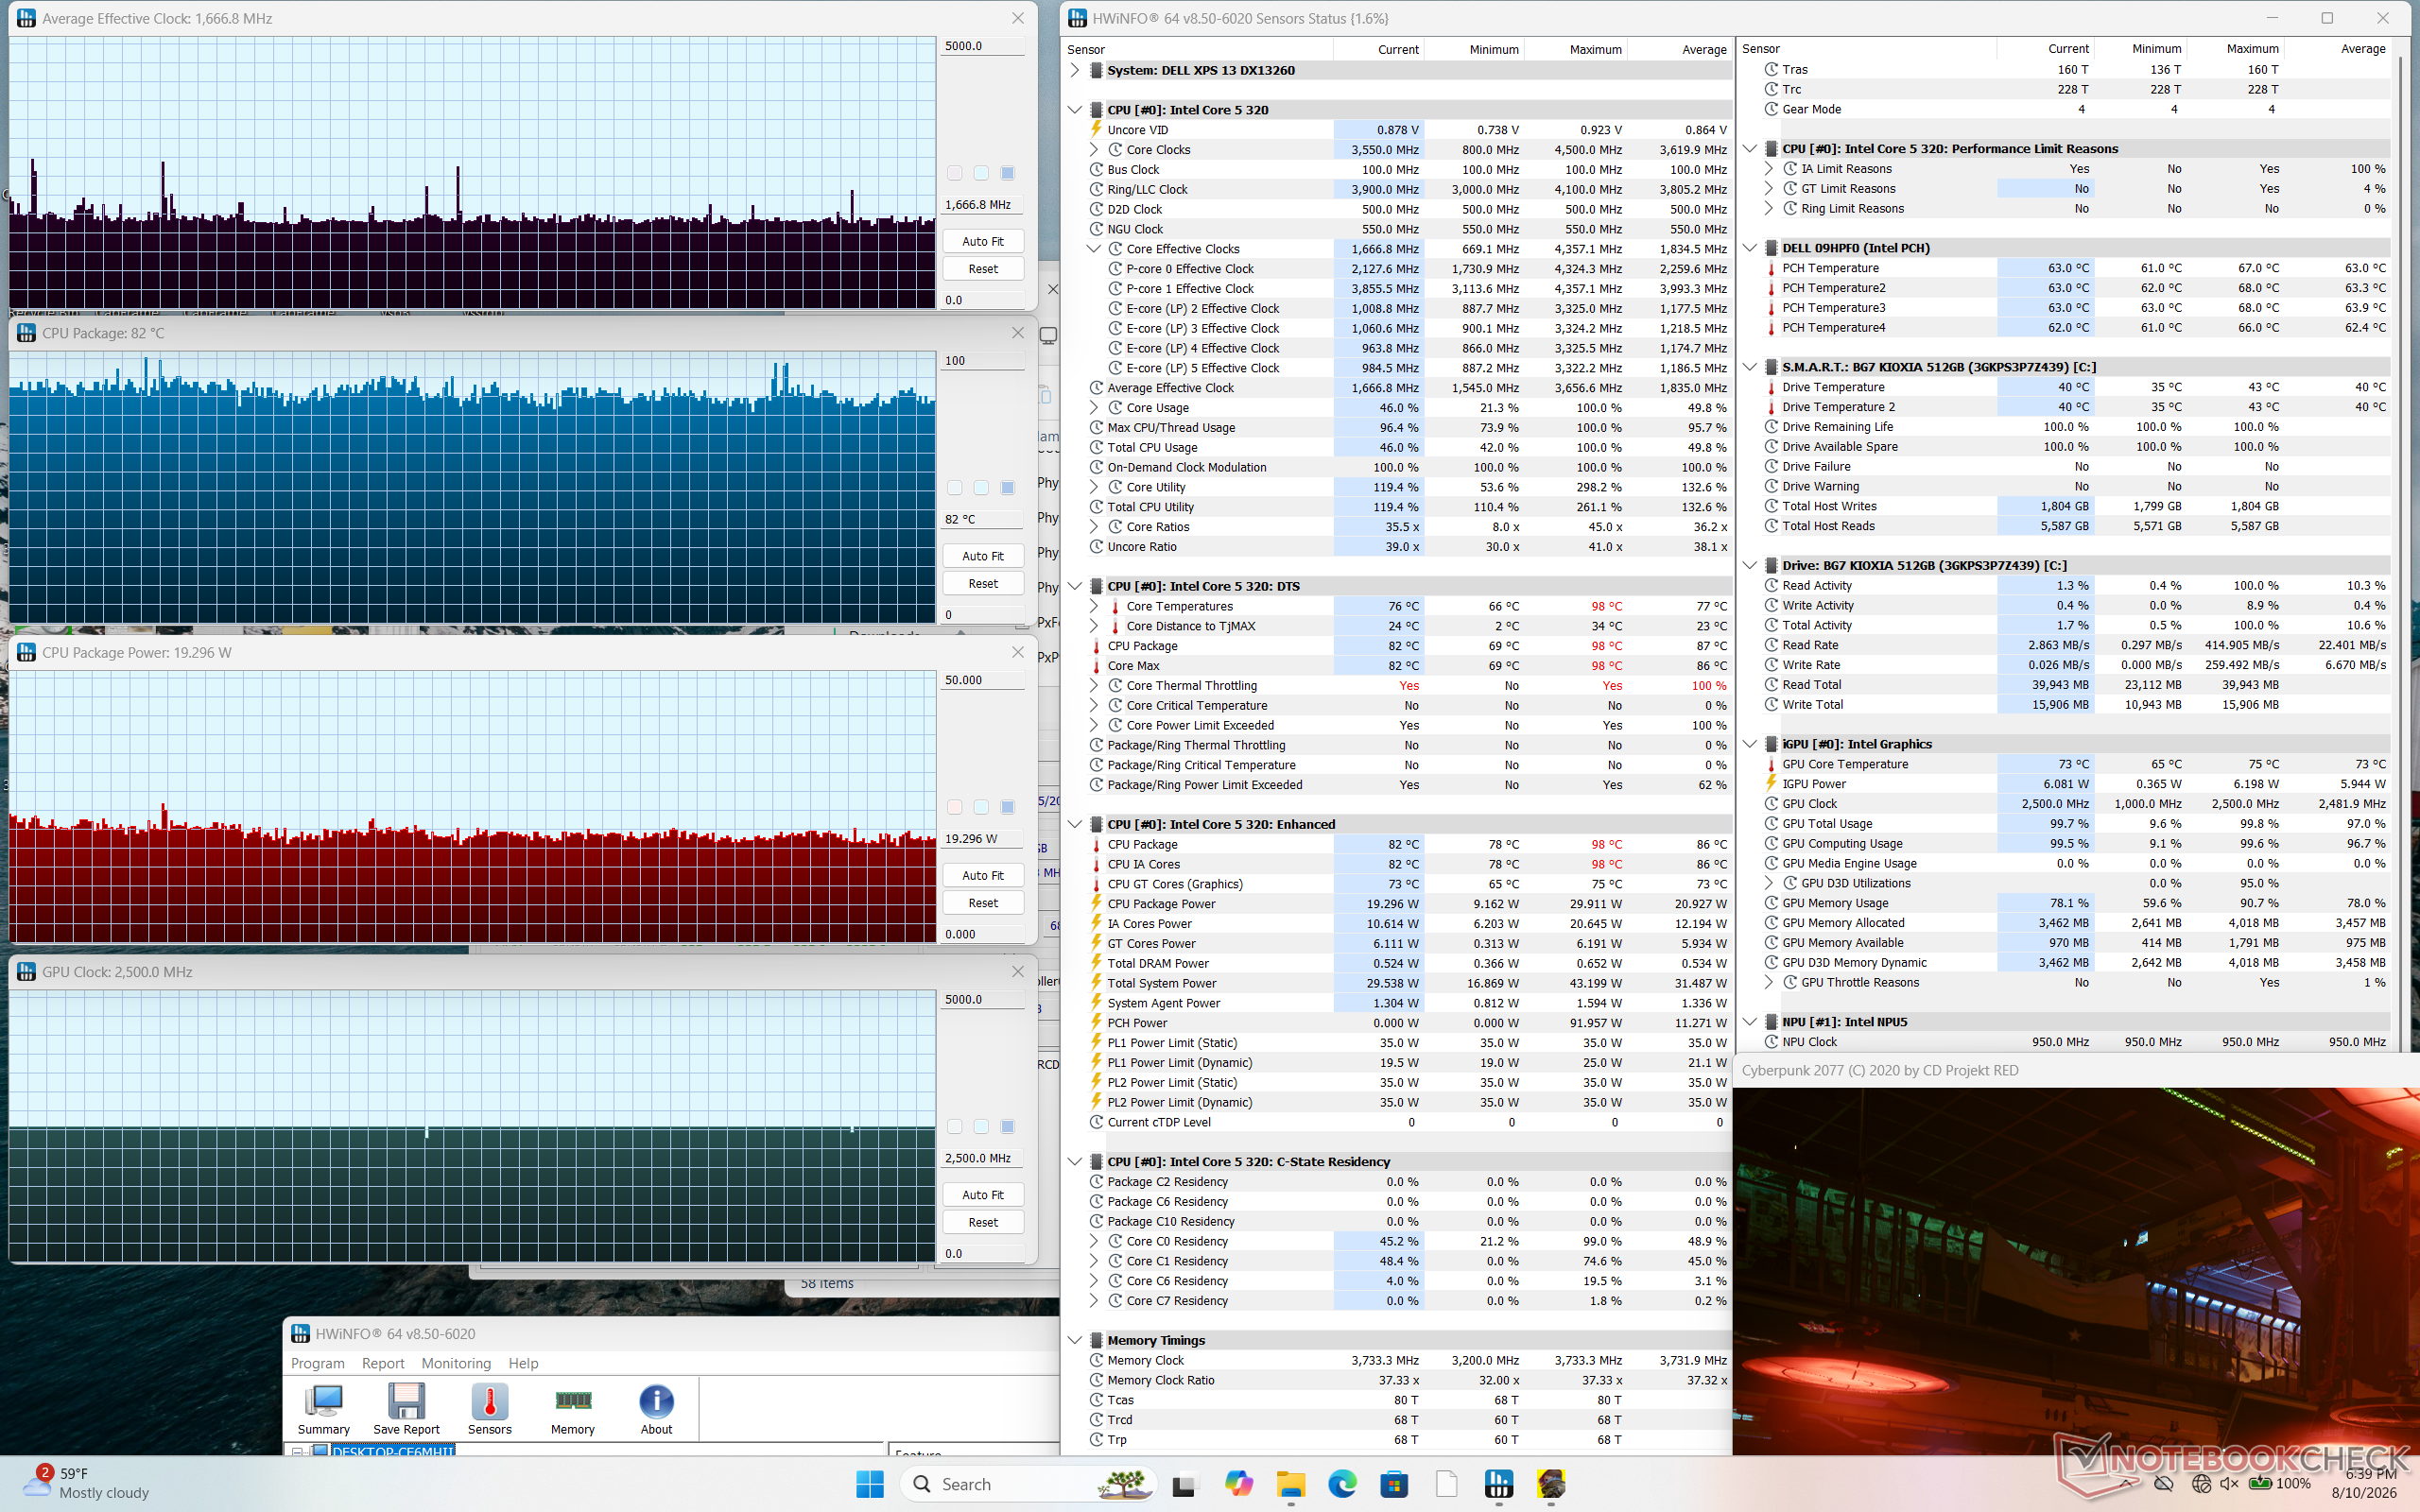
Sistema inattivo
Sistema inattivo
Lo stress di Cyberpunk 2077
Stress test con Prime95
Test di stress con Prime95+FurMark
Frequenza media della CPU (GHz) Frequenza della GPU (MHz) Temperatura media della CPU (°C) Sistema inattivo
--
1000
34
Stress con Prime95
2,6
--
89
Stress
test Prime95 + FurMark
2,4
1800 - 2500
79
Stress test Cyberpunk 2077
~1,7
2500
82

Relatori

Il rumore rosa raggiunge un volume massimo elevato con una gamma migliore di quanto ci si aspetterebbe considerando il prezzo
dB(A) 0102030405060708090Deep BassMiddle BassHigh BassLower RangeMidsHigher MidsLower HighsMid HighsUpper HighsSuper Highs2039.839.2252929.93124.222.74021.424.15025.131.76323.529.78024.749.61002354.912518.955.116015.458.320014.462.525013.666.231514.470.740012.177.650011.380.463011.276.580011.175100010.979.712501076.9160010.373.7200010.368.8250010.673.1315011.370.3400011.367.3500011.767.4630011.765.8800011.766.11000011.866.5125001265.21600011.157.7SPL23.585.9N0.568.4median 11.7median 68.4Delta1.84.726.325.821.422.12624.925.127.622.532.523.448.72655.818.860.922.167.2267019.372.317.674.217.774.319.575.31571.711.871.311.27410.574.21072.710.17210.67210.97511.374.811.671.71269.71269.612.371.112.669.61270.111.269.824.784.70.666.6median 12median 71.73.42.2hearing rangehide median Pink NoiseDell XPS 13 DX13260Apple MacBook Pro 16 2021 M1 Pro
Diagramma frequenza (le caselle possono essere selezionate/deselezionate per confrontare i dispositivi)
Dell XPS 13 DX13260 analisi audio

(+) | gli altoparlanti sono relativamente potenti (85.9 dB)
Bassi 100 - 315 Hz
(±) | bassi ridotti - in media 7.9% inferiori alla media
(+) | bassi in lineaa (6.2% delta rispetto alla precedente frequenza)
Medi 400 - 2000 Hz
(±) | medi elevati - circa 7.6% superiore alla media
(+) | medi lineari (6.8% delta rispetto alla precedente frequenza)
Alti 2 - 16 kHz
(+) | Alti bilanciati - appena 2.2% dalla media
(+) | alti lineari (3.1% delta rispetto alla precedente frequenza)
Nel complesso 100 - 16.000 Hz
(+) | suono nel complesso lineare (11% differenza dalla media)
Rispetto alla stessa classe
» 10% di tutti i dispositivi testati in questa classe è stato migliore, 4% simile, 86% peggiore
» Il migliore ha avuto un delta di 5%, medio di 18%, peggiore di 53%
Rispetto a tutti i dispositivi testati
» 6% di tutti i dispositivi testati in questa classe è stato migliore, 2% similare, 92% peggiore
» Il migliore ha avuto un delta di 4%, medio di 23%, peggiore di 134%

Apple MacBook Pro 16 2021 M1 Pro analisi audio

(+) | gli altoparlanti sono relativamente potenti (84.7 dB)
Bassi 100 - 315 Hz
(+) | bassi buoni - solo 3.8% dalla media
(+) | bassi in lineaa (5.2% delta rispetto alla precedente frequenza)
Medi 400 - 2000 Hz
(+) | medi bilanciati - solo only 1.3% rispetto alla media
(+) | medi lineari (2.1% delta rispetto alla precedente frequenza)
Alti 2 - 16 kHz
(+) | Alti bilanciati - appena 1.9% dalla media
(+) | alti lineari (2.7% delta rispetto alla precedente frequenza)
Nel complesso 100 - 16.000 Hz
(+) | suono nel complesso lineare (4.6% differenza dalla media)
Rispetto alla stessa classe
» 0% di tutti i dispositivi testati in questa classe è stato migliore, 0% simile, 100% peggiore
» Il migliore ha avuto un delta di 5%, medio di 17%, peggiore di 45%
Rispetto a tutti i dispositivi testati
» 0% di tutti i dispositivi testati in questa classe è stato migliore, 0% similare, 100% peggiore
» Il migliore ha avuto un delta di 4%, medio di 23%, peggiore di 134%

Gestione energetica

Consumo energetico

Il consumo energetico può arrivare a soli 2 W e 5 W rispettivamente alle impostazioni di luminosità minima e massima, garantendo un livello estremamente elevato di efficienza energetica. Di conseguenza, l’autonomia risulta molto elevata, con oltre 18 ore di navigazione web in condizioni reali, nonostante le dimensioni medie della batteria.
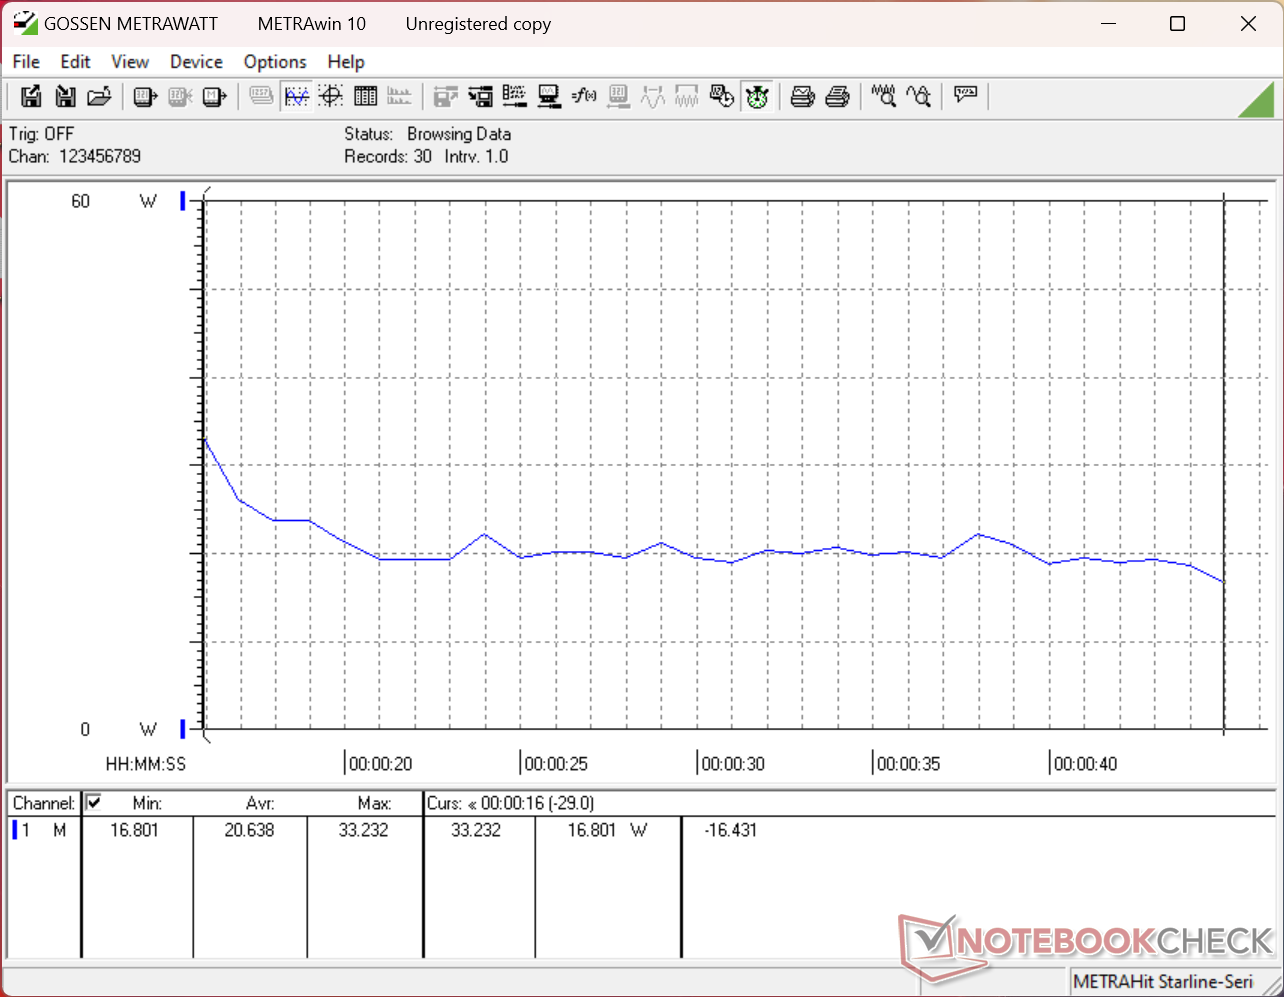
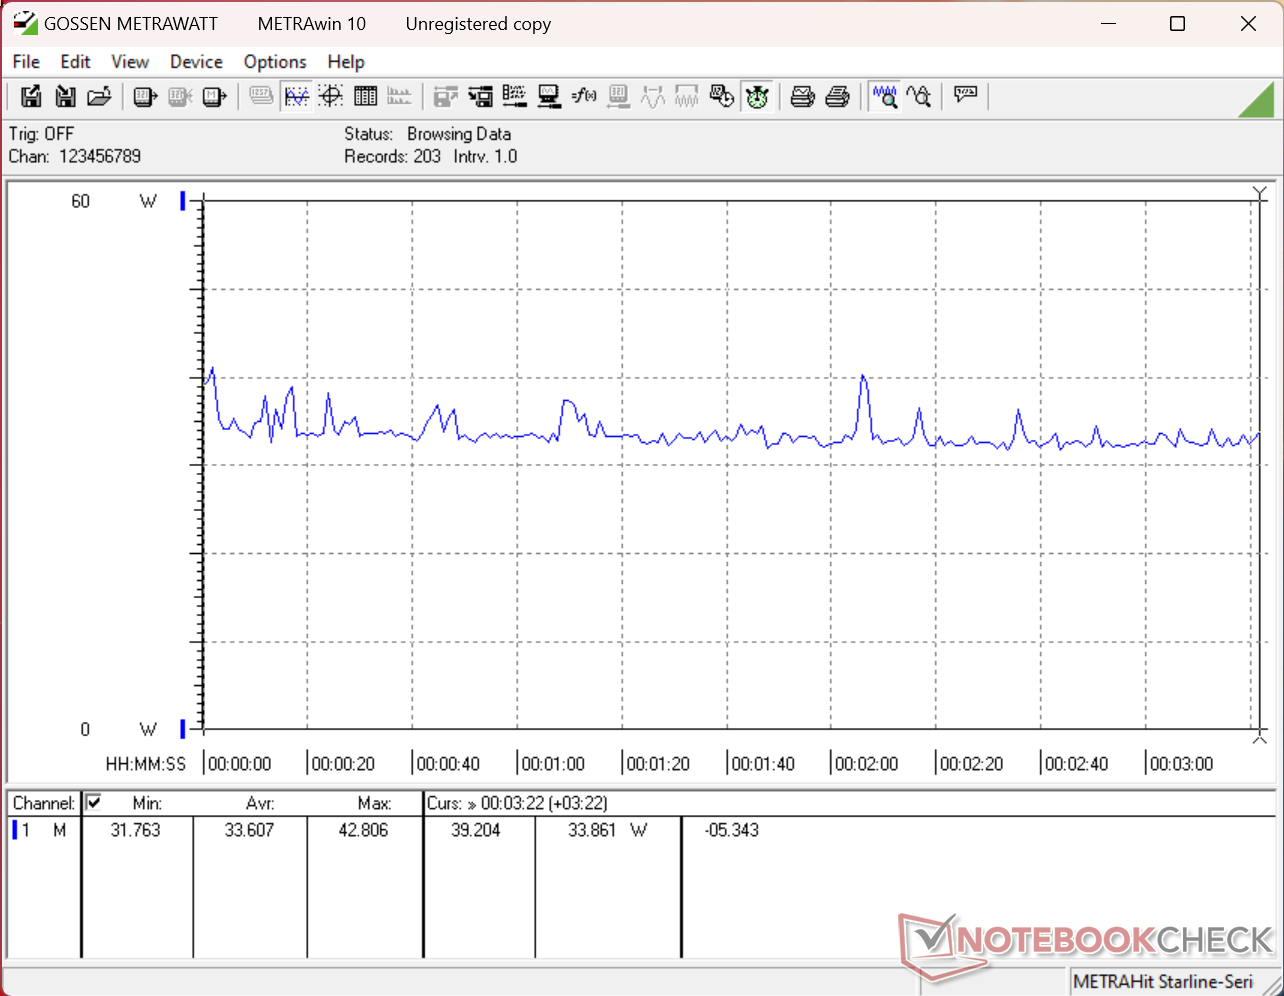
Consumo di 3DMark 11
Cyberpunk 2077 a 1080p con impostazioni di consumo medio
Il consumo raggiungerebbe un picco di 53 W all’avvio dello stress test Prime95, per poi scendere a 36 W circa 30 secondi dopo, il che suggerisce una sostenibilità limitata della funzione Turbo Boost
Lo stress test con Prime95+FurMark è stato avviato al decimo secondo
Consumo di corrente
Off / Standbydarklight 0.03 / 0.56 Watt
Idledarkmidlight 1.9 / 5.4 / 5.8 Watt
Sotto carico midlight 20.6 / 52 Watt
 color bar
Leggenda: min: dark, med: mid, max: light        Metrahit Energy
Dell XPS 13 DX13260
Core 5 320, Intel Graphics 2 Xe3 WCL, , IPS, 2560x1600, 13.4"
Dell XPS 14 Core Ultra X7 358H
Ultra X7 358H, Arc B390 Panther Lake iGPU, Samsung PM9C1b MZVL81T0HFLB-00BH1, OLED, 2880x1800, 14"
Dell XPS 13 9350
Core Ultra 7 256V, Arc 140V, Micron 2550 512GB, IPS, 1920x1200, 13.4"
Apple MacBook Neo 256 GB
A18 Pro, A18 GPU, Apple SSD AP0256Z, IPS, 2408x1506, 13"
HP OmniBook 7 Aero 13-bg1077nr
Ryzen AI 7 350, Radeon 860M, SK hynix PC801 HFS001TEJ9X101N, IPS, 1920x1200, 13.3"
Lenovo ThinkPad X1 Carbon Gen 14 21V70075GE
Ultra 5 325, Intel Graphics 4 Xe3 PTL, Samsung PM9C1b MZVL8512HFLU-00BLL, IPS, 1920x1200, 14"
Power Consumption
-59%
-10%
13%
-53%
-22%
Idle Minimum * (Watt)
1.9
3.1
-63%
1.3
32%
1.5
21%
3.2
-68%
1.6
16%
Idle Average * (Watt)
5.4
3.6
33%
2.5
54%
8.9
-65%
6.8
-26%
4.6
15%
Idle Maximum * (Watt)
5.8
10
-72%
4.1
29%
9
-55%
7
-21%
4.9
16%
Load Average * (Watt)
20.6
39.2
-90%
40.1
-95%
18.9
8%
50.3
-144%
39.7
-93%
Cyberpunk 2077 ultra * (Watt)
33.6
51.4
-53%
46.1
-37%
11.5
66%
52.8
-57%
45.2
-35%
Cyberpunk 2077 ultra external monitor * (Watt)
30.1
51.2
-70%
43.1
-43%
10.3
66%
41.6
-38%
46.1
-53%
Load Maximum * (Watt)
52
101.4
-95%
57.3
-10%
26.3
49%
59.9
-15%
64.2
-23%

* ... Meglio usare valori piccoli

Consumo energetico Cyberpunk / Stress test

05101520253035404550556065707580859095100Tooltip
Dell XPS 13 DX13260 Core 5 320, Intel Graphics 2 Xe3 WCL; 1280x720 Prime95 28.10 and Furmark 1.25: Ø41.5 (36.3-52.6) Watt
Dell XPS 14 Core Ultra X7 358H Ultra X7 358H, Arc B390 Panther Lake iGPU; 1280x720 Prime95 28.10 and Furmark 1.25: Ø57.8 (46.6-101.4) Watt
Dell XPS 13 DX13260 Core 5 320, Intel Graphics 2 Xe3 WCL; Idle 150cd/m2: Ø2.49 (2.36-3.57) Watt
Dell XPS 14 Core Ultra X7 358H Ultra X7 358H, Arc B390 Panther Lake iGPU; Idle 150cd/m2: Ø3.26 (2.28-5.65) Watt
Dell XPS 13 DX13260 Core 5 320, Intel Graphics 2 Xe3 WCL; Cyberpunk 2077 FHD ultra no FSR 150cd: Ø33.6 (31.8-41.2) Watt
Dell XPS 14 Core Ultra X7 358H Ultra X7 358H, Arc B390 Panther Lake iGPU; Cyberpunk 2077 FHD ultra no FSR 150cd: Ø51.4 (48.7-57.4) Watt

Consumo energetico del monitor esterno

05101520253035404550556065707580859095Tooltip
Dell XPS 13 DX13260 Core 5 320, Intel Graphics 2 Xe3 WCL; Prime95 V2810 Stress (external Monitor): Ø38.6 (33.5-48.1) Watt
Dell XPS 14 Core Ultra X7 358H Ultra X7 358H, Arc B390 Panther Lake iGPU; Prime95 V2810 Stress (external Monitor): Ø56.8 (46.6-99.1) Watt
Dell XPS 13 DX13260 Core 5 320, Intel Graphics 2 Xe3 WCL; Cinebench R15 Multi (external Monitor): Ø40 (38.8-42.3) Watt
Dell XPS 14 Core Ultra X7 358H Ultra X7 358H, Arc B390 Panther Lake iGPU; Cinebench R15 Multi (external Monitor): Ø93.9 (89.5-96.9) Watt
Dell XPS 13 DX13260 Core 5 320, Intel Graphics 2 Xe3 WCL; Cinebench R23 Multi (external Monitor): Ø36.8 (34.1-46.4) Watt
Dell XPS 14 Core Ultra X7 358H Ultra X7 358H, Arc B390 Panther Lake iGPU; Cinebench R23 Multi (external Monitor): Ø71 (41.1-94.8) Watt
Dell XPS 13 DX13260 Core 5 320, Intel Graphics 2 Xe3 WCL; 1280x720 FurMark 1.19 GPU Stress Test (external Monitor): Ø16.8 (15.9-17.6) Watt
Dell XPS 14 Core Ultra X7 358H Ultra X7 358H, Arc B390 Panther Lake iGPU; 1280x720 FurMark 1.19 GPU Stress Test (external Monitor): Ø58.2 (42.2-74.1) Watt
Dell XPS 13 DX13260 Core 5 320, Intel Graphics 2 Xe3 WCL; Idle 1min (external Monitor): Ø2.08 (1.816-5.48) Watt
Dell XPS 14 Core Ultra X7 358H Ultra X7 358H, Arc B390 Panther Lake iGPU; Idle 1min (external Monitor): Ø3.43 (1.646-5.16) Watt
Dell XPS 13 DX13260 Core 5 320, Intel Graphics 2 Xe3 WCL; Cyberpunk 2077 FHD ultra no FSR (external Monitor): Ø30.1 (28.8-41.9) Watt
Dell XPS 14 Core Ultra X7 358H Ultra X7 358H, Arc B390 Panther Lake iGPU; Cyberpunk 2077 FHD ultra no FSR (external Monitor): Ø51.2 (30.8-56.9) Watt

Durata della batteria

Autonomia della batteria
WiFi Websurfing
18ore 26minuti
Dell XPS 13 DX13260
Core 5 320, Intel Graphics 2 Xe3 WCL, 52 Wh
Dell XPS 14 Core Ultra X7 358H
Ultra X7 358H, Arc B390 Panther Lake iGPU, 70 Wh
Dell XPS 13 9350
Core Ultra 7 256V, Arc 140V, 55 Wh
Apple MacBook Neo 256 GB
A18 Pro, A18 GPU, 36.5 Wh
HP OmniBook 7 Aero 13-bg1077nr
Ryzen AI 7 350, Radeon 860M, 43 Wh
Lenovo ThinkPad X1 Carbon Gen 14 21V70075GE
Ultra 5 325, Intel Graphics 4 Xe3 PTL, 58 Wh
Autonomia della batteria
-9%
12%
-30%
-43%
26%
WiFi v1.3 (h)
18.4
16.8
-9%
20.6
12%
12.9
-30%
10.4
-43%
23.2
26%
Reader / Idle (h)
56.8
Load (h)
2.4
2.8
H.264 (h)
13.6

Valutazione di Notebookcheck

L’XPS 13 con Intel Wildcat ridefinisce gli standard di ciò che gli utenti possono aspettarsi dai portatili Windows economici.

Dell XPS 13 DX13260 - 08/12/2026 v8
Allen Ngo

Chassis
82 / 98 → 84%
Tastiera
83%
Dispositivo di puntamento
85%
Connettività
57 / 74 → 77%
Peso
74 / 20-77 → 95%
Batteria
91%
Display
90%
Prestazioni di gioco
23 / 75 → 31%
Prestazioni Applicazioni
79 / 92 → 86%
AI Performance
81%
Temperatura
93%
Rumorosità
90%
Audio
82 / 91 → 90%
Fotocamera
35 / 75 → 47%
Media
67%
86%
Subnotebook - Media ponderata
CO2 Emissions
No Data
Materials
50%
Packaging
100%
Power Use
93.1%
Repairability
50%
Software Updates
22.3%
Recycle Logo Total Sustainability Score: 52.6%

Confronto con i potenziali concorrenti

Immagine
Modello
Prezzo
Peso
Altezza
Schermo
1.
85.7%
Dell XPS 13 DX13260
Dell XPS 13 DX13260
Intel Core 5 320 ⎘
Intel Graphics 2 Xe3 Wildcat Lake iGPU ⎘
8 GB Memoria
Amazon: Prezzo di listino: 700 USD1.1 kg12.7 mm13.40"
2560x1600
225 PPI
IPS
2.
87.4%
Dell XPS 14 Core Ultra X7 358H
Intel Core Ultra X7 358H ⎘
Intel Arc B390 12 Xe3 Panther Lake iGPU ⎘
32 GB Memoria, 1000 GB SSD
Amazon:
1. $1,399.99
Dell XPS 14 Premium Laptop D...
2. $2,049.00
Dell XPS 14 9440 14.5" Noteb...
3. $1,955.00
Dell Pro 14 Plus Business La...
Prezzo di listino: 2200 USD
1.4 kg14.62 mm14.00"
2880x1800
243 PPI
OLED
3.
85.3%
Dell XPS 13 9350
Dell XPS 13 9350
Intel Core Ultra 7 256V ⎘
Intel Arc Graphics 140V ⎘
16 GB Memoria, 512 GB SSD
Amazon: Prezzo di listino: 1400 USD1.2 kg15.3 mm13.40"
1920x1200
169 PPI
IPS
4.
86%
Apple MacBook Neo 256 GB
Apple A18 Pro ⎘
Apple A18 GPU ⎘
8 GB Memoria, 256 GB SSD
Amazon: Prezzo di listino: 699€1.2 kg12.7 mm13.00"
2408x1506
218 PPI
IPS
5.
86.9%
HP OmniBook 7 Aero 13-bg1077nr
AMD Ryzen AI 7 350 ⎘
AMD Radeon 860M ⎘
32 GB Memoria, 1024 GB SSD
Amazon: Prezzo di listino: 1250 USD1 kg17.6 mm13.30"
1920x1200
170 PPI
IPS
6.
89.9%
Lenovo ThinkPad X1 Carbon Gen 14 21V70075GE
Intel Core Ultra 5 325 ⎘
Intel Graphics 4 Xe3 Panther Lake iGPU ⎘
32 GB Memoria, 512 GB SSD
Amazon:
1. $1,899.00
Lenovo ThinkPad X1 Carbon Ge...
2. $2,199.99
Lenovo ThinkPad X1 Carbon Bu...
3. $1,929.74
Lenovo ThinkPad X1 Carbon Ge...
Prezzo di listino: 2469€
1.1 kg16.8 mm14.00"
1920x1200
162 PPI
IPS

Transparency

La selezione dei dispositivi da recensire viene effettuata dalla nostra redazione. Il campione di prova è stato fornito all'autore come prestito dal produttore o dal rivenditore ai fini di questa recensione. L'istituto di credito non ha avuto alcuna influenza su questa recensione, né il produttore ne ha ricevuto una copia prima della pubblicazione. Non vi era alcun obbligo di pubblicare questa recensione. In quanto società mediatica indipendente, Notebookcheck non è soggetta all'autorità di produttori, rivenditori o editori.

Ecco come Notebookcheck esegue i test

Ogni anno, Notebookcheck esamina in modo indipendente centinaia di laptop e smartphone utilizzando procedure standardizzate per garantire che tutti i risultati siano comparabili. Da circa 20 anni sviluppiamo continuamente i nostri metodi di prova e nel frattempo stabiliamo gli standard di settore. Nei nostri laboratori di prova, tecnici ed editori esperti utilizzano apparecchiature di misurazione di alta qualità. Questi test comportano un processo di validazione in più fasi. Il nostro complesso sistema di valutazione si basa su centinaia di misurazioni e parametri di riferimento ben fondati, che mantengono l'obiettività.
Google LogoAdd as a preferred source on Google
Mail Logo
> Recensioni e prove di notebook, tablets e smartphones > Recensioni e prove > Recensioni e prove > Recensione del Dell XPS 13 Wildcat Lake: ridefinire la categoria dei PC Windows economici
Allen Ngo, 2026-08-13 (Update: 2026-08-13)