

Notebookcheck Logo
Teaser

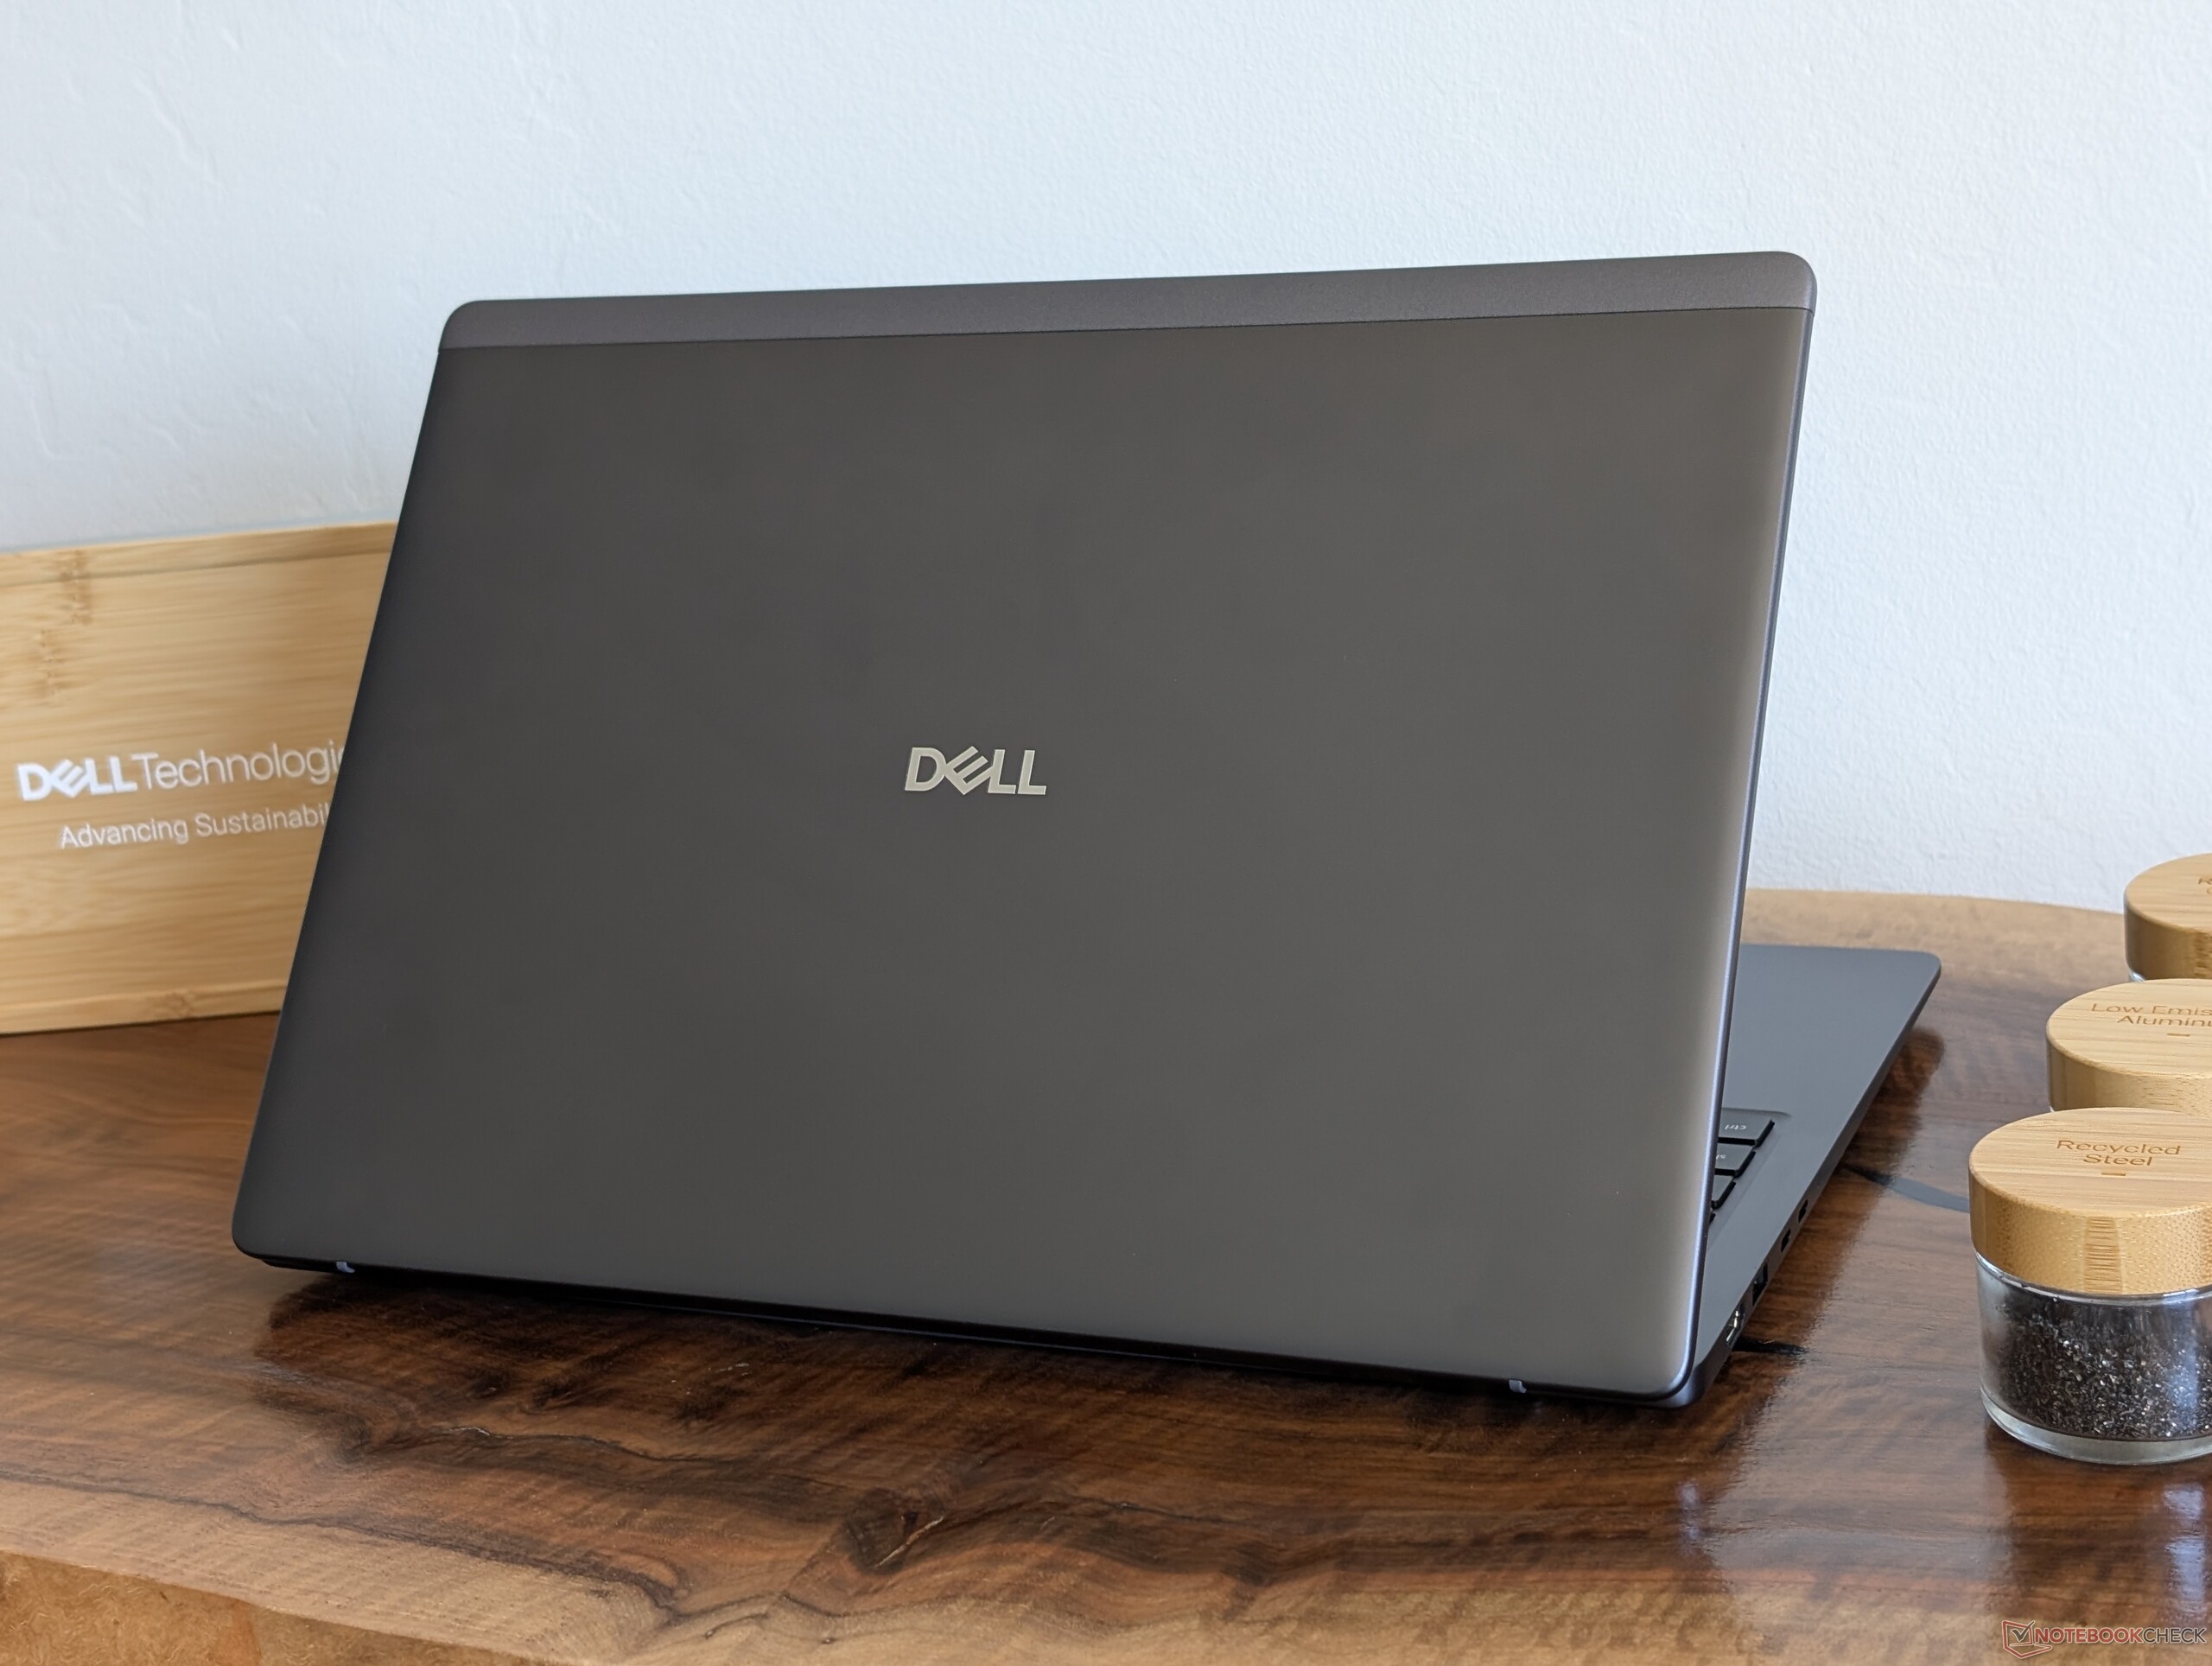
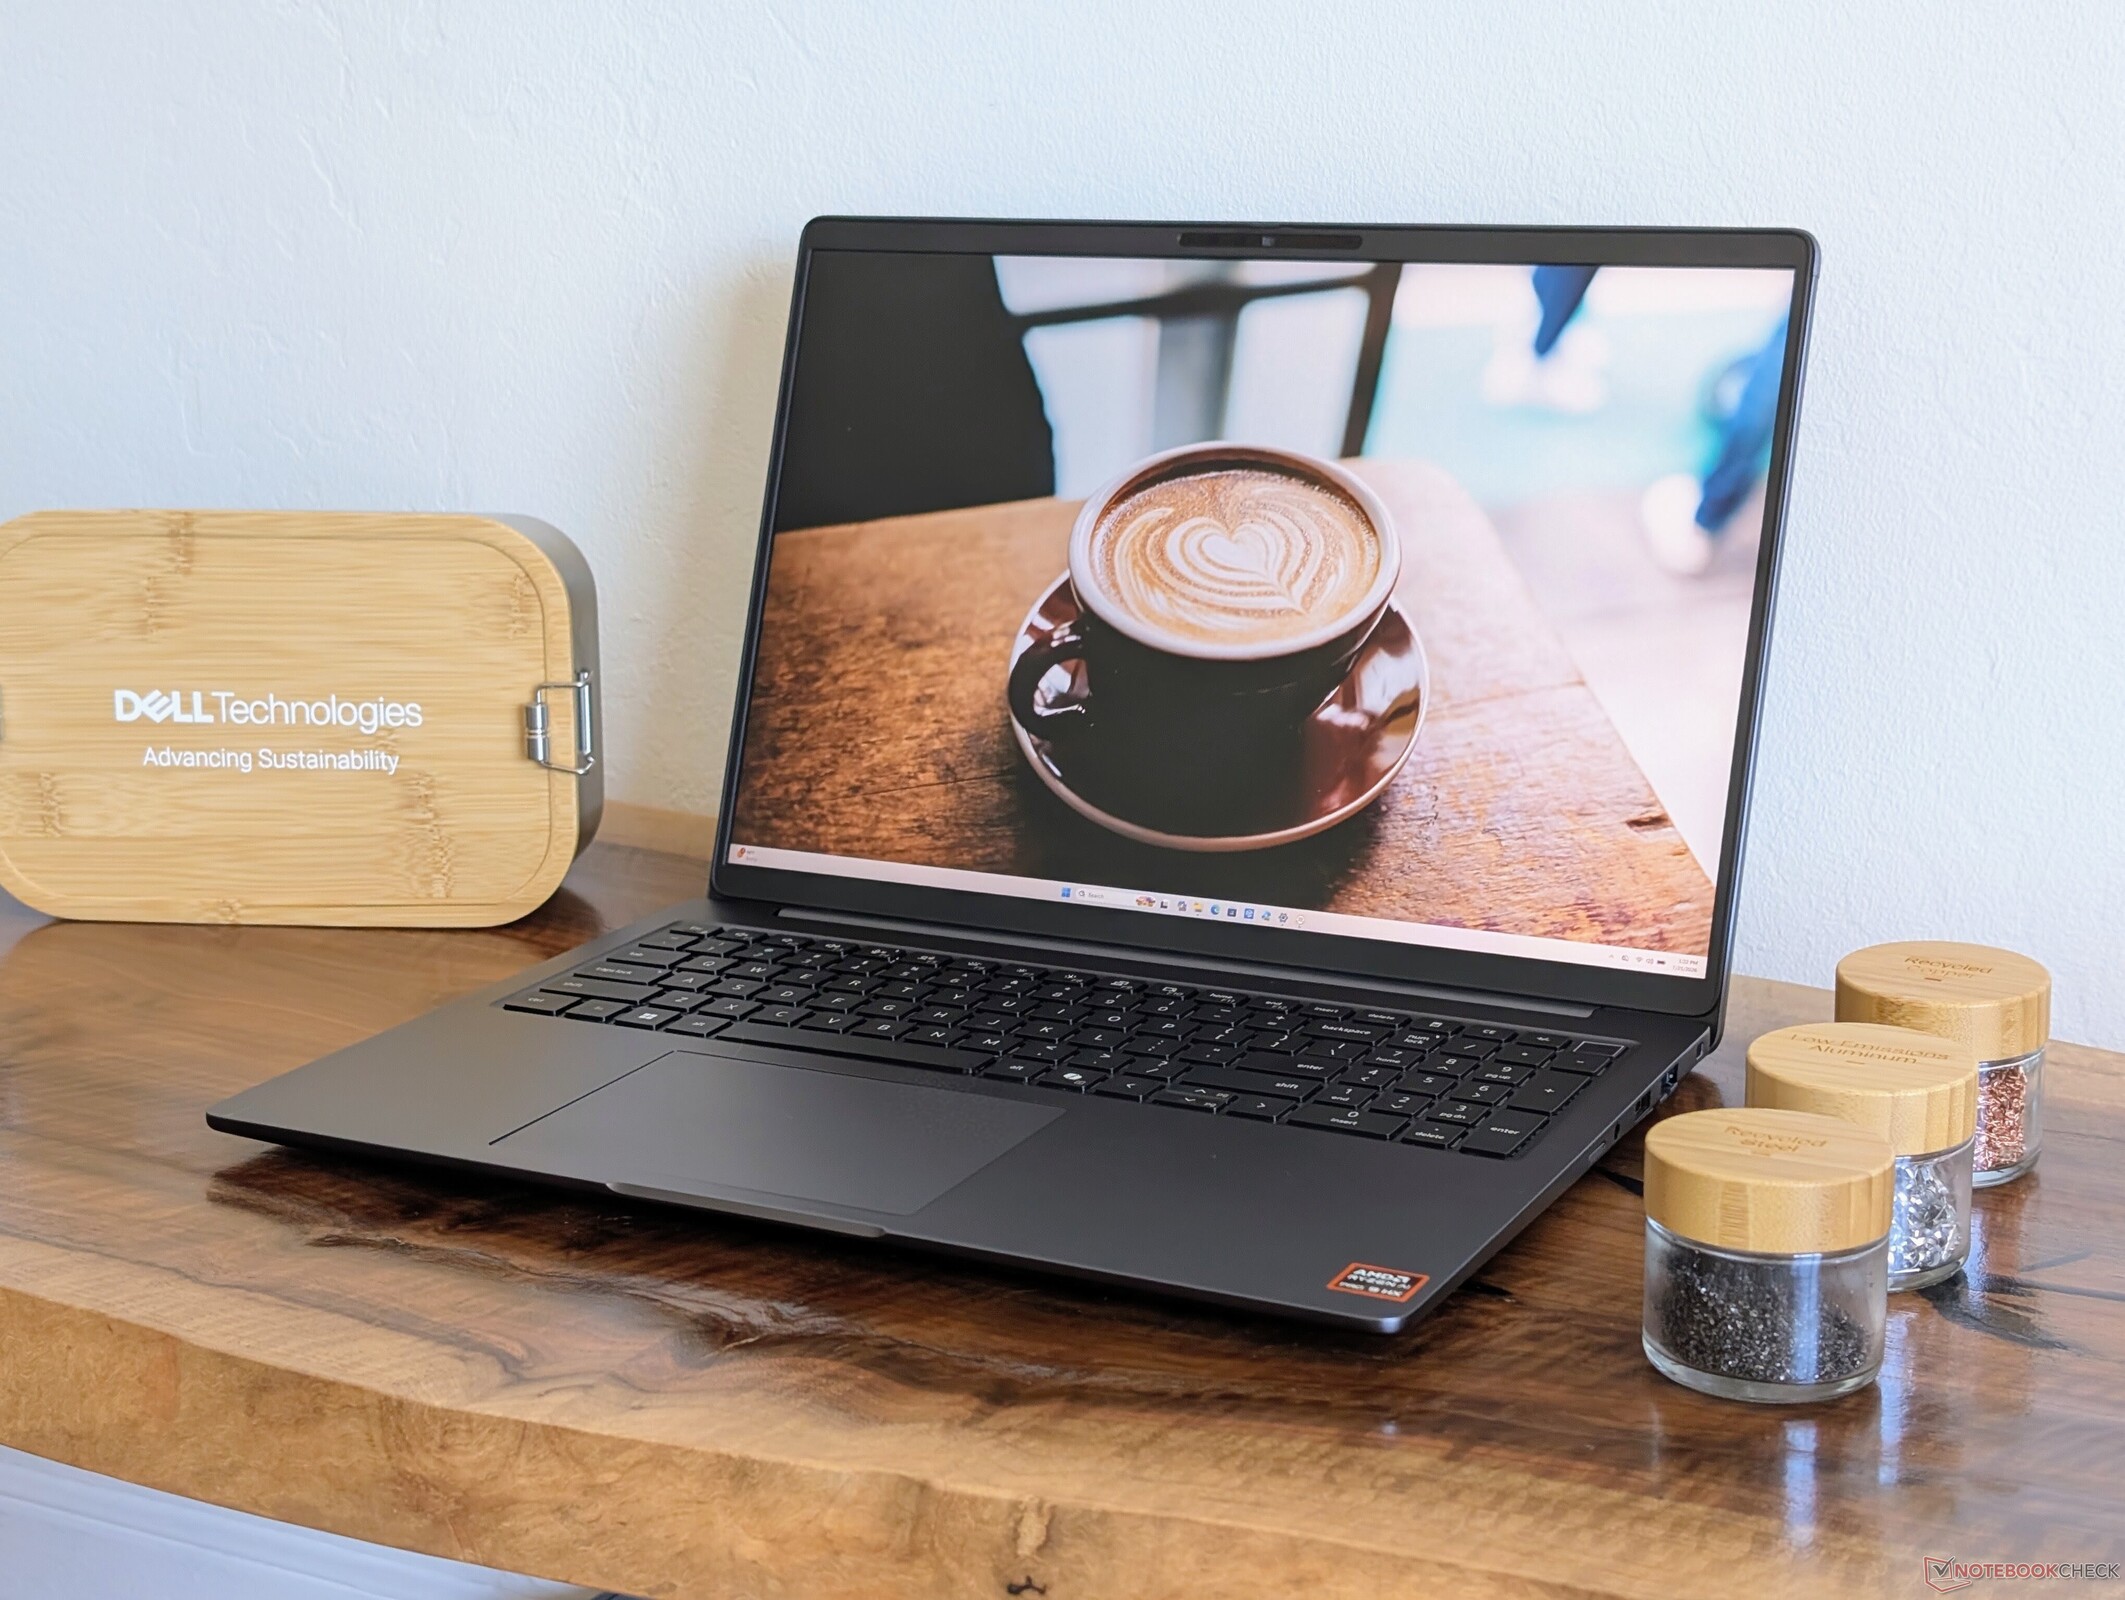
Recensione del Dell Pro 5 16 P516265: tradizionale e affidabile

Un grande schermo con numerose opzioni.

Il Dell Pro 5 16 mantiene l’accessibilità economica tipica della serie Latitude 5000, offrendo al contempo funzionalità aggiuntive comuni quali la connessione WAN e il touchscreen come optional. Le aziende o gli uffici che non cercano nulla di particolarmente sofisticato troveranno nel Dell Pro 5 16 la soluzione ideale per la maggior parte dei casi d’uso.
Allen Ngo, 👁 Allen Ngo (traduzione a cura di DeepL / Ninh Duy) Pubblicato 🇺🇸 🇳🇱 ...
Laptop / Notebook Zen 5 AMD Business

Verdetto — Un semplice case a conchiglia per l’ufficio realizzato a regola d’arte

Il Dell Pro 5 16 offre uno schermo di grandi dimensioni senza la scheda grafica dedicata o le opzioni 4K, di cui molti utenti possono tranquillamente fare a meno. I prezzi partono quindi da livelli più ragionevoli, rendendolo una soluzione aziendale essenziale e convincente, in particolare per coloro che apprezzano gli ambienti AMD Pro o Intel vPro. Inoltre, merita una menzione specifica la RAM rimovibile, poiché la memoria saldata sta diventando la norma sulla maggior parte degli altri modelli.

Le prestazioni pure, se configurato con il Ryzen AI 9 HX Pro 470, sono impressionanti per un notebook aziendale di fascia media. Si tenga presente che, sebbene gli SKU Intel presentino prestazioni del processore leggermente inferiori rispetto ad AMD, la velocità della RAM può risultare superiore, poiché al momento la tecnologia CAMM è configurabile solo con Intel.

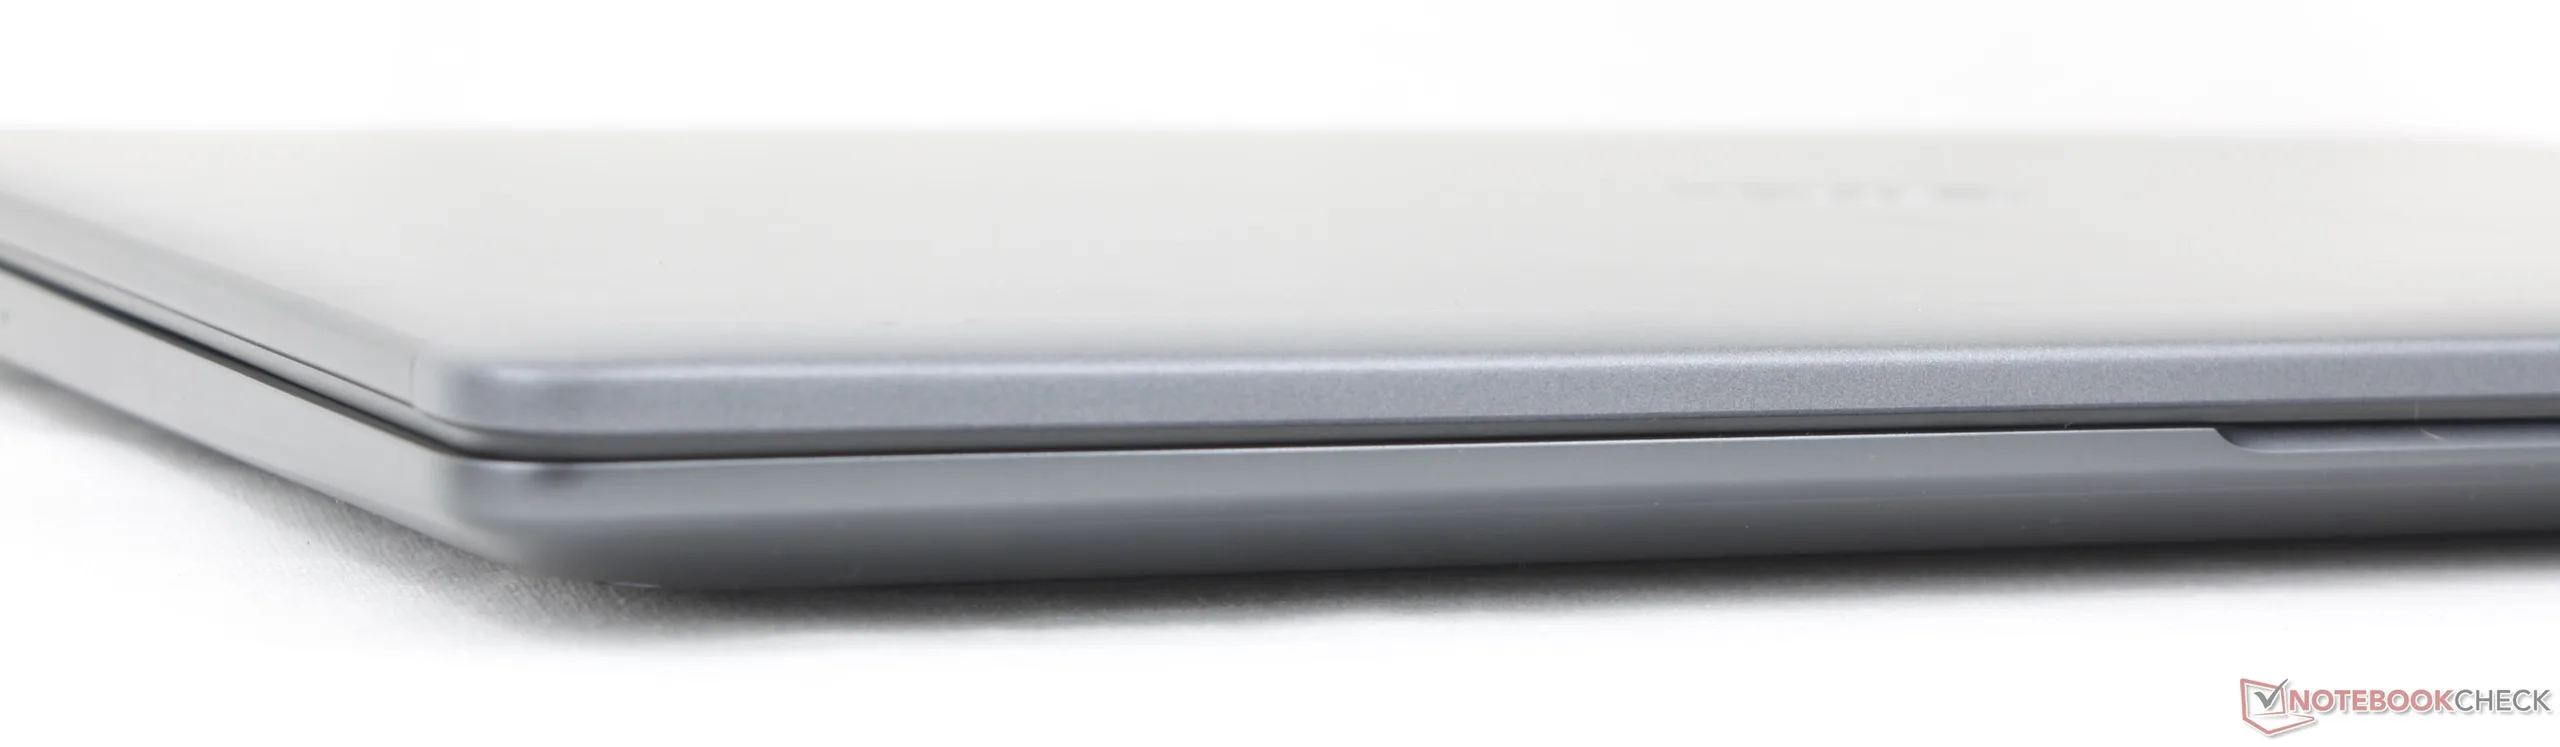
Vi sono alcuni piccoli inconvenienti degni di nota, la maggior parte dei quali è probabilmente intenzionale al fine di ridurre i costi. La ricarica tramite USB-C, ad esempio, è disponibile solo sul lato sinistro del dispositivo, a differenza del Dell Pro 7 14. Il supporto per gli SSD è limitato esclusivamente a un'unità M.2 2242 di piccole dimensioni, senza opzioni secondarie. Il composito di magnesio leggero, presente sul Dell Pro 7, manca invece sul Dell Pro 5. Si raccomanda inoltre di evitare le opzioni di display di fascia bassa a causa della loro riproduzione dei colori notevolmente inferiore. Ciononostante, l’ampia varietà di porte integrate, la connessione WAN opzionale e la webcam da 8 MP dovrebbero soddisfare la maggior parte delle esigenze d’uso in ufficio.

Pro

+ buone prestazioni del processore per la categoria
+ moduli SODIMM DDR5 rimovibili
+ WAN e OLED sono opzionali
+ altoparlanti interni potenti
+ buona durata della batteria

Contro

- non supporta SSD M.2 2280 a lunghezza intera
- colori dello schermo scadenti con le opzioni di visualizzazione di base
- opzioni CAMM disponibili solo per gli SKU Intel
- nessun supporto per SSD secondari
- nessuna opzione 4K o Arc B390

Prezzo e disponibilità

Il Dell Pro 5 16 è attualmente disponibile sia nella versione con processore AMD che in quella con processore Intel, con prezzi che partono da circa 2.000 dollari fino a superare i 4.500 dollari nella configurazione completa.

Amazon Logo
$1,499.95
Dell Pro 16(Next-gen Latitude 3550) 16” FHD+ Display Business Laptop, Intel 10 Core i5-120U, 32GB DDR5 RAM, 1TB SSD, WiFi 6E + BT, Backlit Keyboard, HD Webcam, RJ-45, Win 11 Pro

Proprio come la serie Dell Pro 7 succede alla precedente serie Latitude 7000, la serie Dell Pro 5 succede alla precedente serie Latitude 5000. Il Dell Pro 5 16 è un notebook aziendale di fascia media, ma dotato di molte delle stesse opzioni di processore presenti nella più costosa serie Dell Pro 7.

Il nostro modello di prova Dell Pro 5 16 è una configurazione AMD di fascia alta con CPU Ryzen AI 9 HX Pro 470 Zen 5 e display IPS da 1600p a 120 Hz, al prezzo di circa 4.500 dollari. I modelli di fascia inferiore partono dal processore Ryzen AI 5 Pro 435, con display da 1200p a 60 Hz e una quantità di RAM notevolmente inferiore, a un prezzo significativamente più contenuto. Questo modello è disponibile anche con opzioni basate sulla serie Intel Core di terza generazione.

Tra le alternative al Dell Pro 5 16 figurano altri portatili di fascia media pensati per il mondo aziendale, come la serie HP EliteBook 8, l’MSI Venture 16 AI o la serie Lenovo ThinkPad E.

Altre recensioni sui prodotti Dell:

Specifiche

Dell Pro 5 16 P516265
Processore
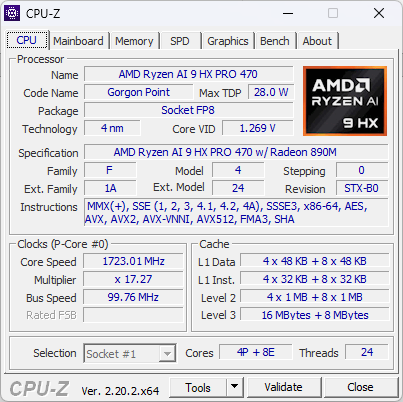
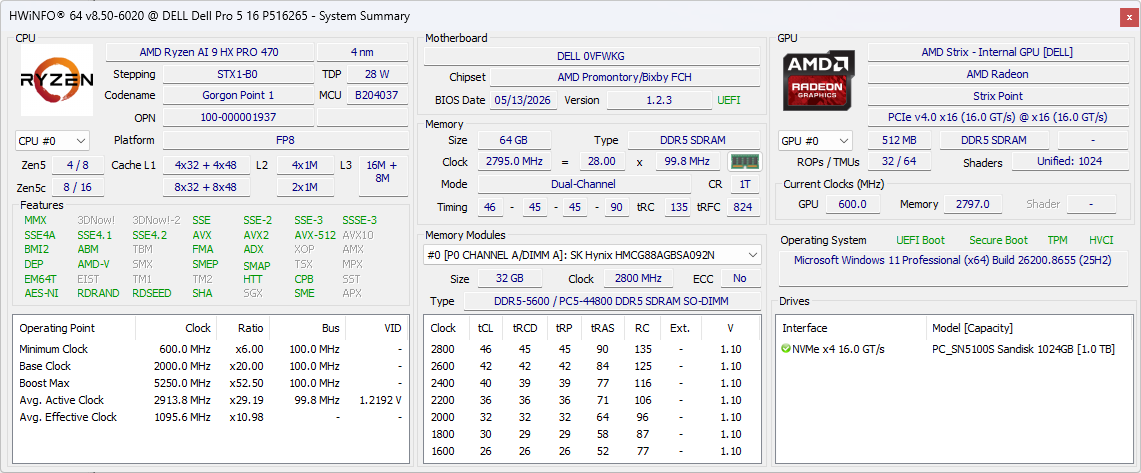
AMD Ryzen AI 9 HX PRO 470 12c/24t, 4 x 5.2 GHz AMD Zen 5, 8 x 3.3 GHz AMD Zen 5c, 43 W PL2 / Short Burst, 33 W PL1 / Sustained, Gorgon Point
Scheda grafica
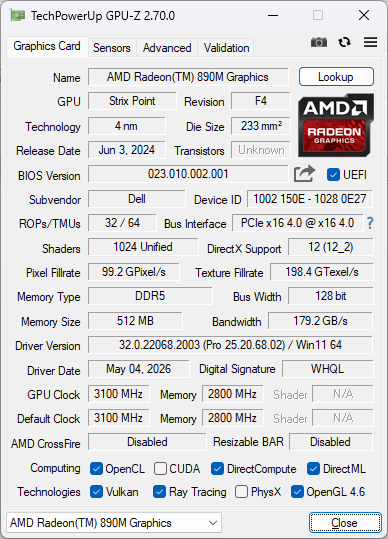
AMD Radeon 890M, Core: 2590 MHz, RAM: 2800 MHz, DDR5, 32.0.22068.2003
Memoria
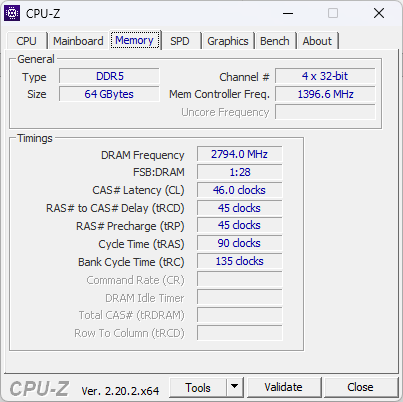
64 GB 
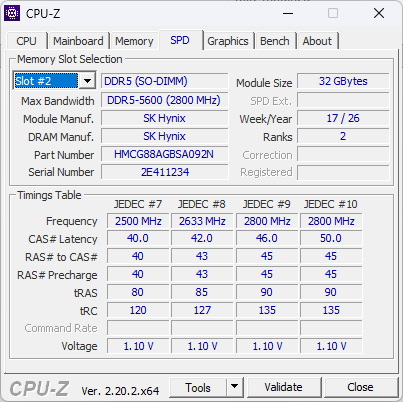
, DDR5-5600, SK Hynix, 46-45-45-90, Dual-Channel
Schermo
16.00 pollici 16:10, 2560 x 1600 pixel 189 PPI, BOE NS16M30, IPS, Dell P/N: 270R4, lucido: no, 120 Hz
Scheda madre
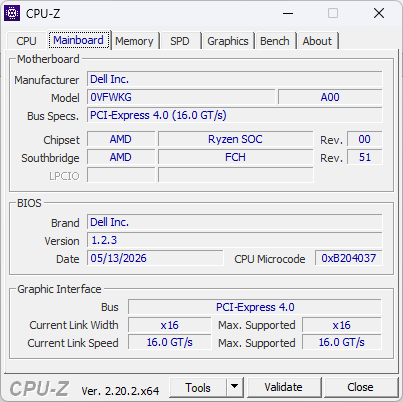
AMD Promontory/Bixby FCH
Harddisk
SanDisk PC SN5100S, 1024 GB 
Scheda audio
AMD Zen - Audio Processor - HD Audio Controller
Porte di connessione
2 USB 3.0 / 3.1, 2 Thunderbolt 4, USB-C Power Delivery (PD), 1 HDMI, 2 DisplayPort, 1 Kensington Lock, Connessioni Audio: 3.5 mm combo, 1 Lettore impronte digitali
Rete
Realtek RTL8168/8111 Gigabit-LAN (10/100/1000MBit/s), Mediatek Wi-Fi 7 MT7925 Wireless LAN Card (a/b/g/ac = Wi-Fi 5/ax = Wi-Fi 6/ Wi-Fi 6E 6 GHz be = Wi-Fi 7), Bluetooth 5.4
Dimensioni
altezza x larghezza x profondità (in mm): 18.95 x 358.6 x 253.4
Batteria
70 Wh, 3-cell
Sistema Operativo
Microsoft Windows 11 Pro
Camera
Webcam: 1440p30
Fotocamera Principale: 8.3 MPix
Altre caratteristiche
Casse: 2x 2 W, Tastiera: Chiclet, Illuminazione Tastiera: si, Dell Command, Update, Optimizer, SupportAssist, Trusted Device, 36 Mesi Garanzia
Peso
2.034 kg, Alimentazione: 327 gr
Prezzo
4500 USD
Amazon
Nota: il produttore potrebbe usare componenti di fornitori diversi pannelli dei diplay, drive o banchi di memoria con specifiche simili.


Caso

Confronto delle dimensioni

359.3 mm 245.25 mm 23.15 mm 2.1 kg358.6 mm 253.4 mm 18.95 mm 2 kg357.9 mm 247.9 mm 18.2 mm 1.9 kg358 mm 254 mm 18 mm 1.7 kg359 mm 250 mm 15.5 mm 1.9 kg352.58 mm 237.47 mm 14.62 mm 1.7 kg297 mm 210 mm 1 mm 5.7 g

Connettività

Parte anteriore: Nessuna porta
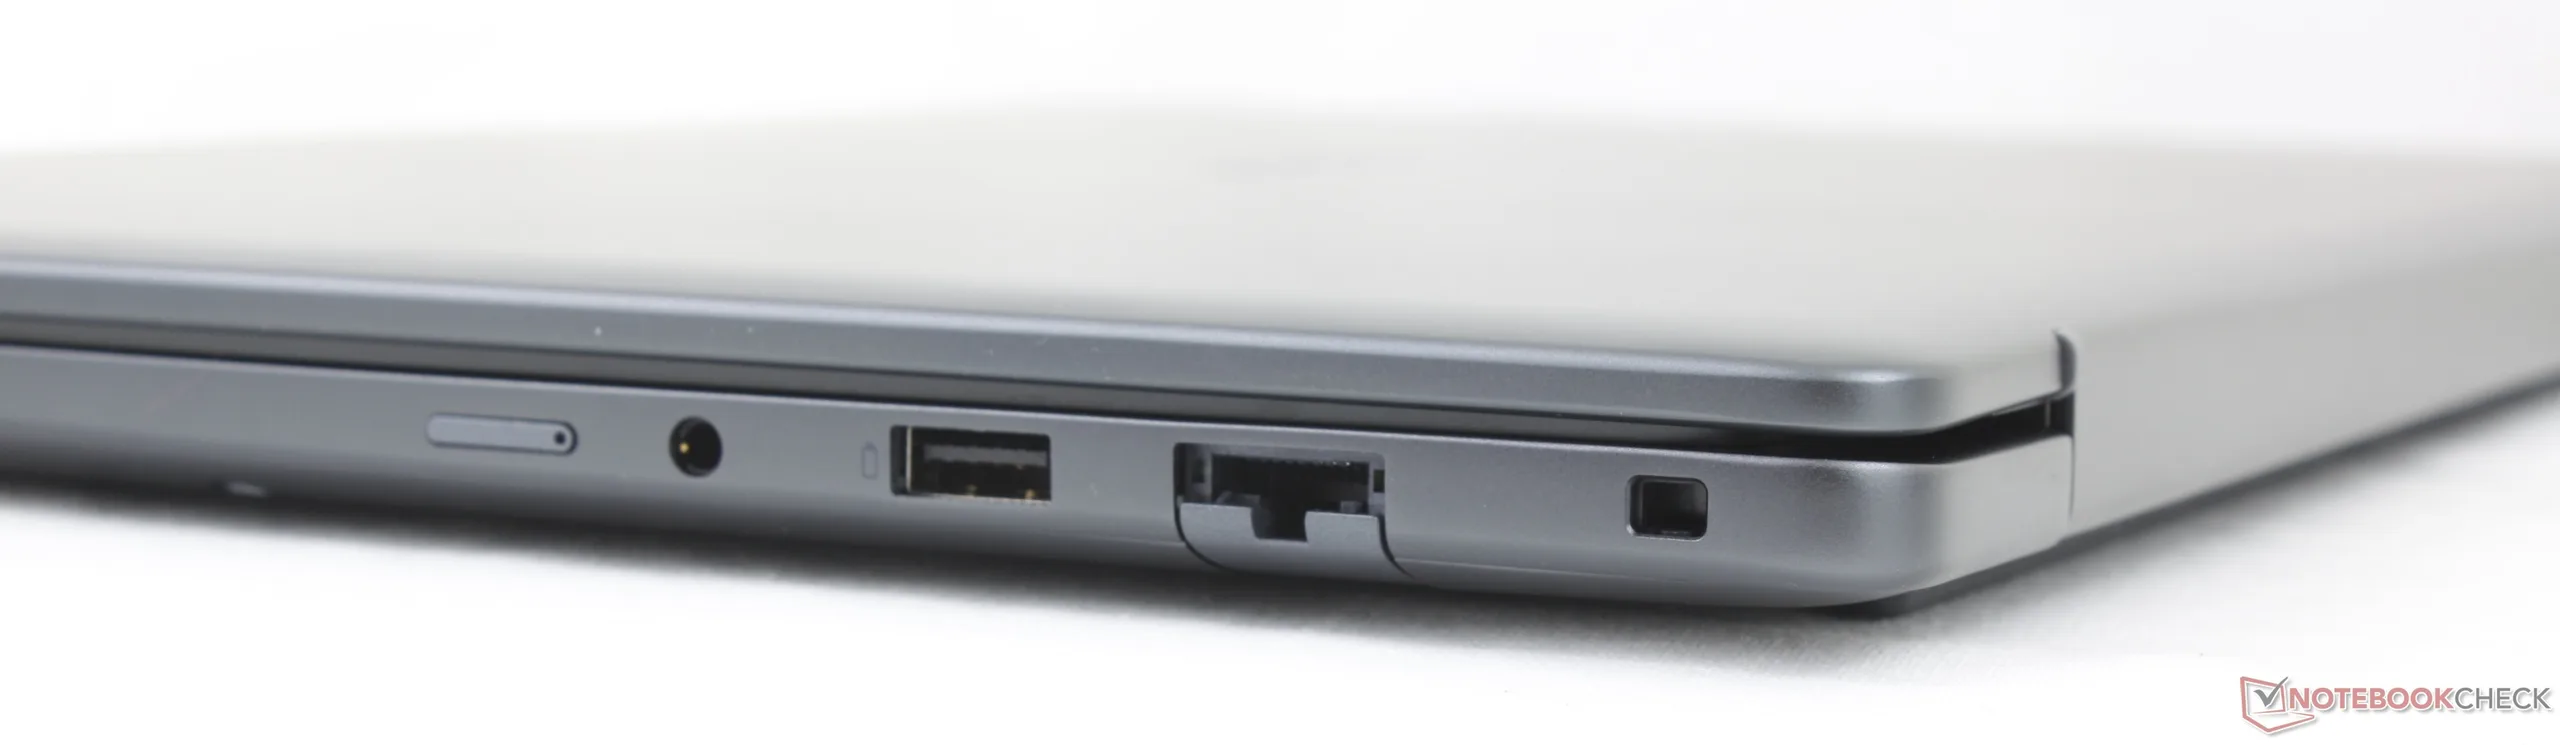
Corretto: Slot per Nano-SIM (opzionale), jack per cuffie da 3,5 mm, USB-A 3.2 Gen. 1, RJ-45 (1 Gbps), Noble lock
Parte posteriore: Nessuna porta
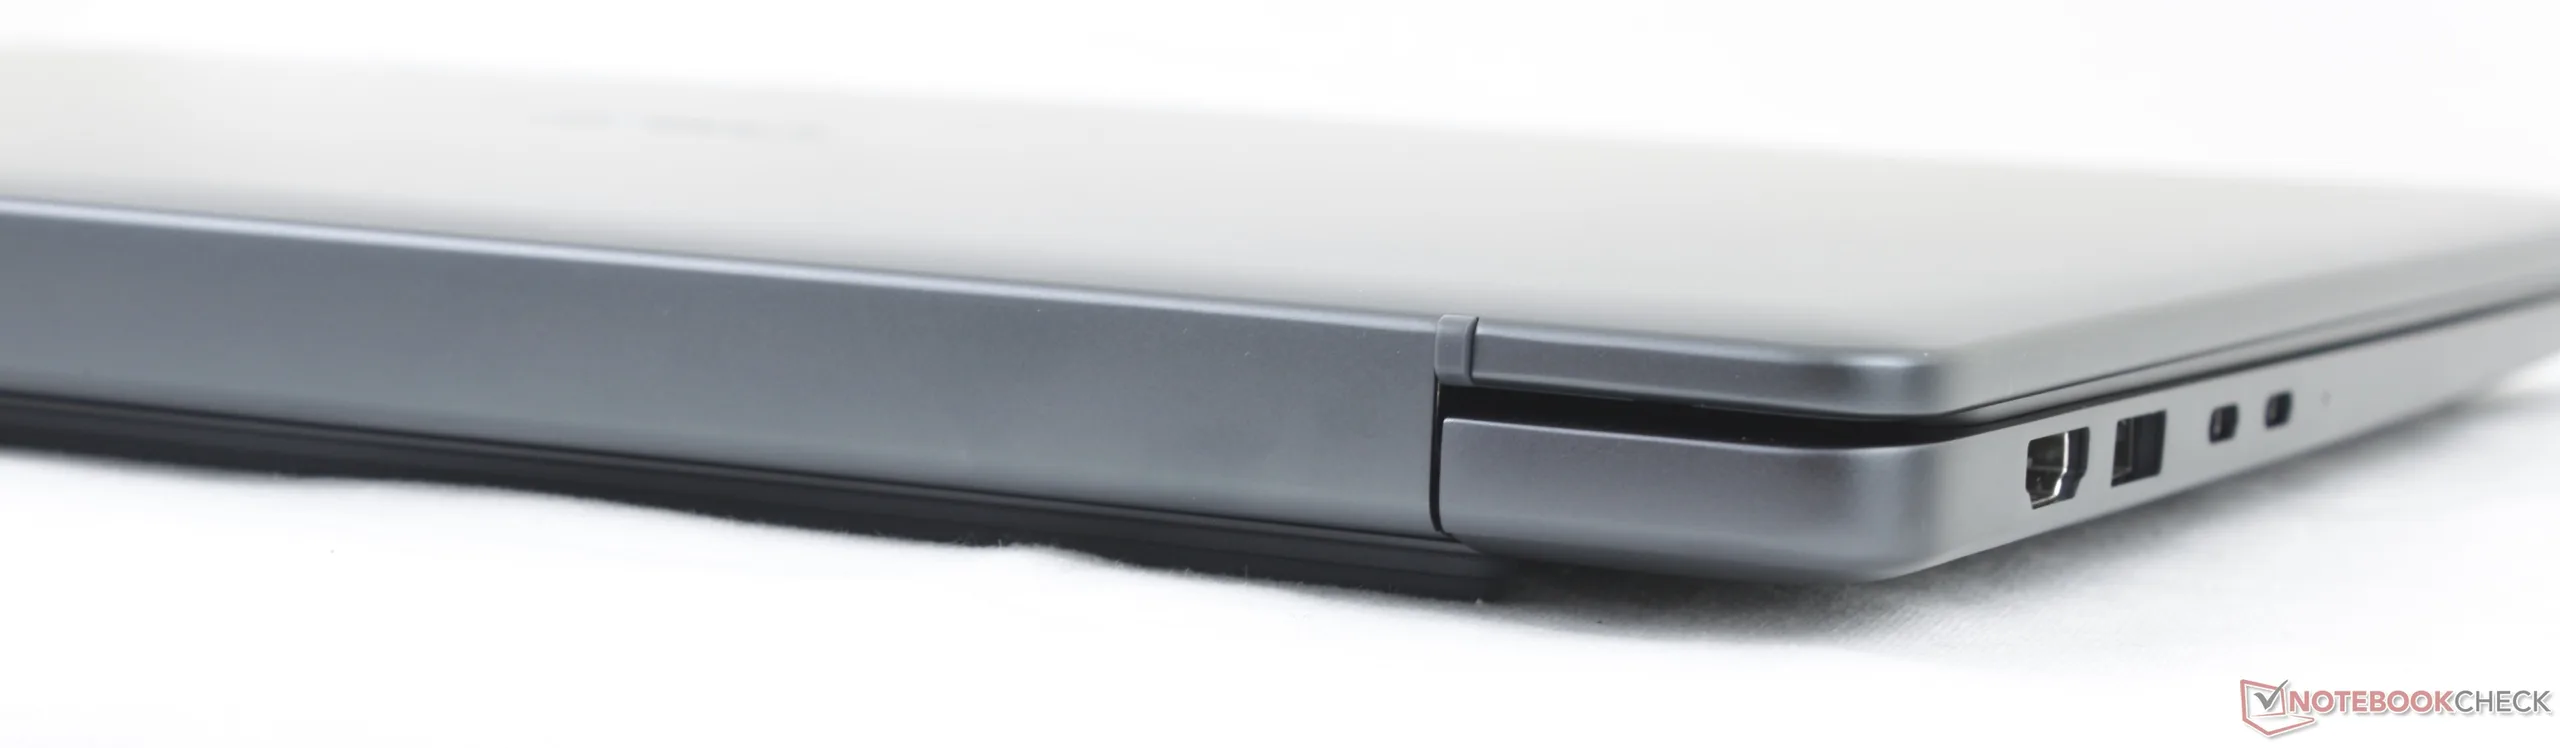
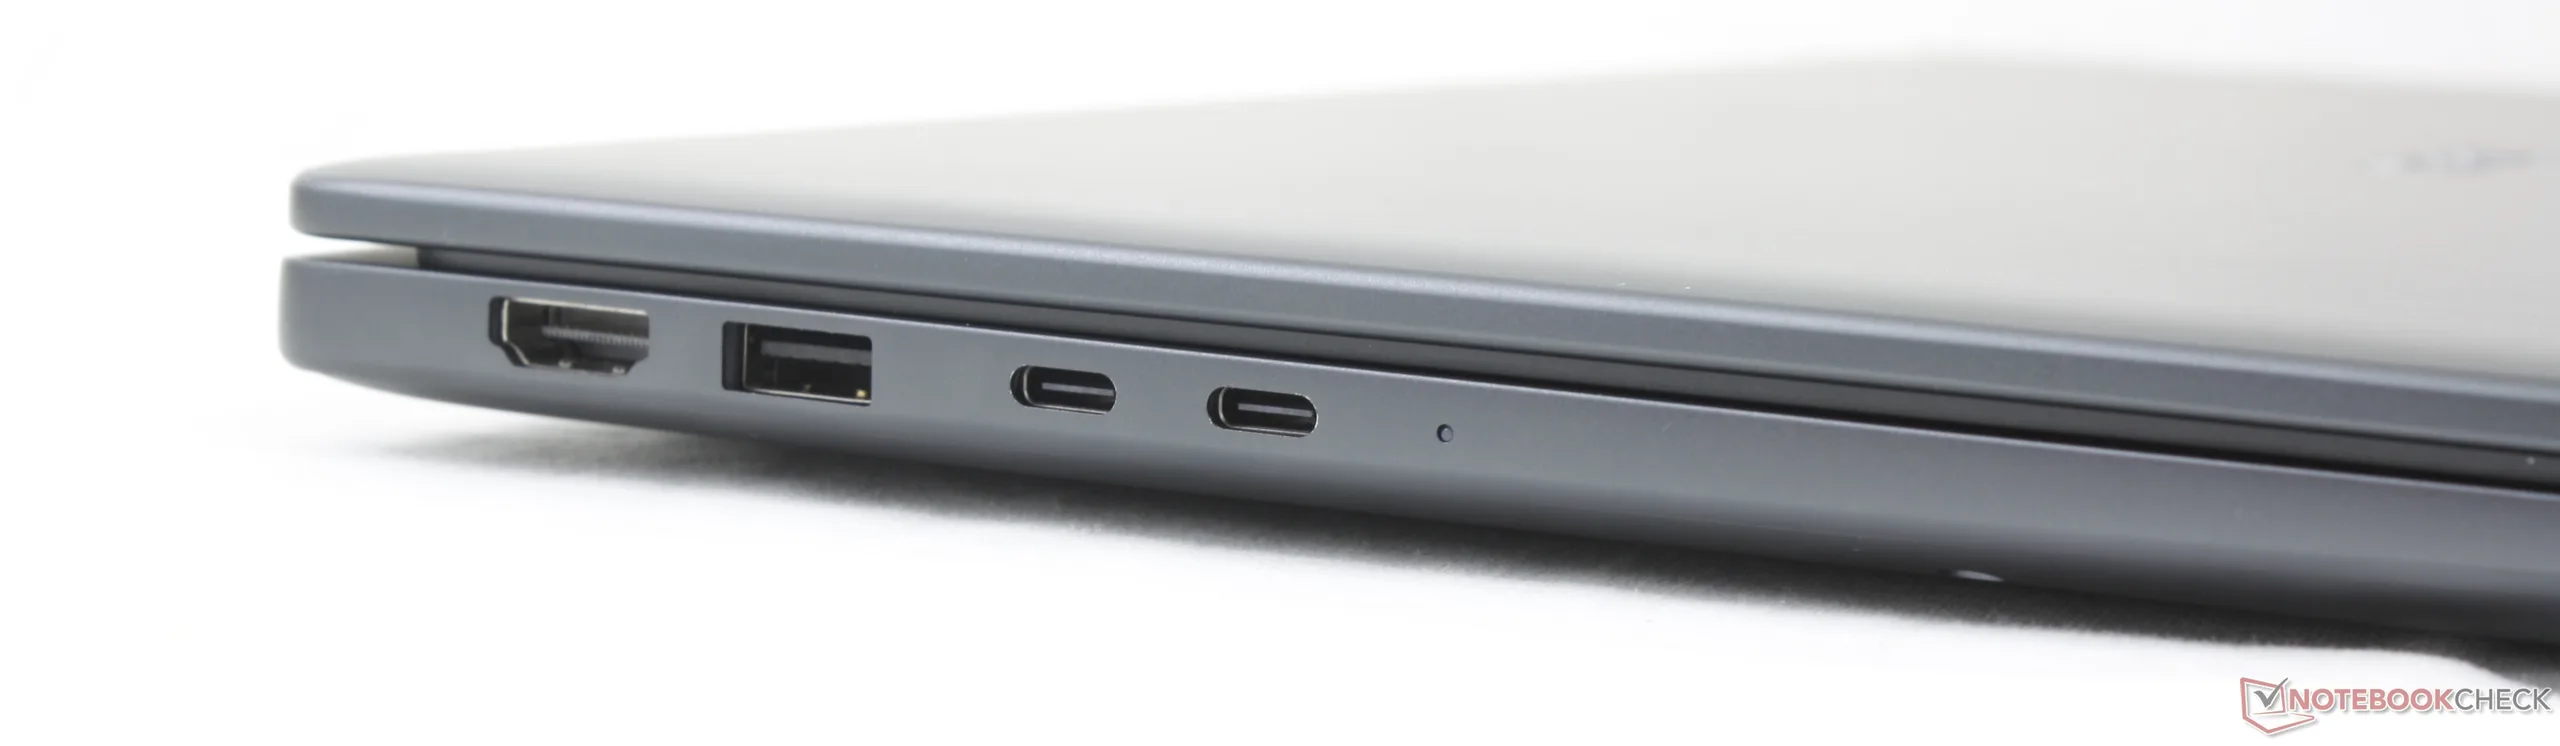
A sinistra: HDMI 2.1, USB-A 3.2 Gen. 1, 2 porte Thunderbolt 4 con DisplayPort 2.1 + Power Delivery

Comunicazione

Networking
iperf3 receive AXE11000 6GHz
Dell XPS 16 Core Ultra X7 358H
Intel Wi-Fi 7 BE211 320MHz
1735 (1715min - 1747max) MBit/s +17%
HP EliteBook 8 G1a 16 AI
Mediatek Wi-Fi 7 MT7925 Wireless LAN Card
1730 (1703min - 1750max) MBit/s +16%
Dell Pro 5 16 P516265
Mediatek Wi-Fi 7 MT7925 Wireless LAN Card
1486 (1449min - 1514max) MBit/s
MSI Venture 16 AI A2HMTG
Intel Wi-Fi 6E AX211
1459 (1378min - 1503max) MBit/s -2%
iperf3 transmit AXE11000 6GHz
Dell XPS 16 Core Ultra X7 358H
Intel Wi-Fi 7 BE211 320MHz
1619 (1525min - 1692max) MBit/s +8%
Dell Pro 5 16 P516265
Mediatek Wi-Fi 7 MT7925 Wireless LAN Card
1495 (1437min - 1564max) MBit/s
HP EliteBook 8 G1a 16 AI
Mediatek Wi-Fi 7 MT7925 Wireless LAN Card
1430 (1401min - 1478max) MBit/s -4%
MSI Venture 16 AI A2HMTG
Intel Wi-Fi 6E AX211
1202 (1138min - 1257max) MBit/s -20%
0100200300400500600700800900100011001200130014001500Tooltip
Dell Pro 5 16 P516265; iperf3 receive AXE11000 6GHz; iperf 3.1.3: Ø1486 (1449-1514) MBit/s
Dell Pro 5 16 P516265; iperf3 transmit AXE11000 6GHz; iperf 3.1.3: Ø1495 (1437-1564) MBit/s

Webcam

ColorChecker
13.6 ∆E
11.4 ∆E
17.7 ∆E
23.6 ∆E
16.6 ∆E
18.4 ∆E
7.7 ∆E
18.1 ∆E
12.1 ∆E
16.5 ∆E
16.9 ∆E
18.8 ∆E
8.6 ∆E
20.8 ∆E
17.2 ∆E
13.1 ∆E
13.6 ∆E
22.4 ∆E
2.3 ∆E
11.8 ∆E
17.6 ∆E
18 ∆E
19.3 ∆E
6 ∆E
ColorChecker Dell Pro 5 16 P516265: 15.1 ∆E min: 2.33 - max: 23.63 ∆E

Manutenzione

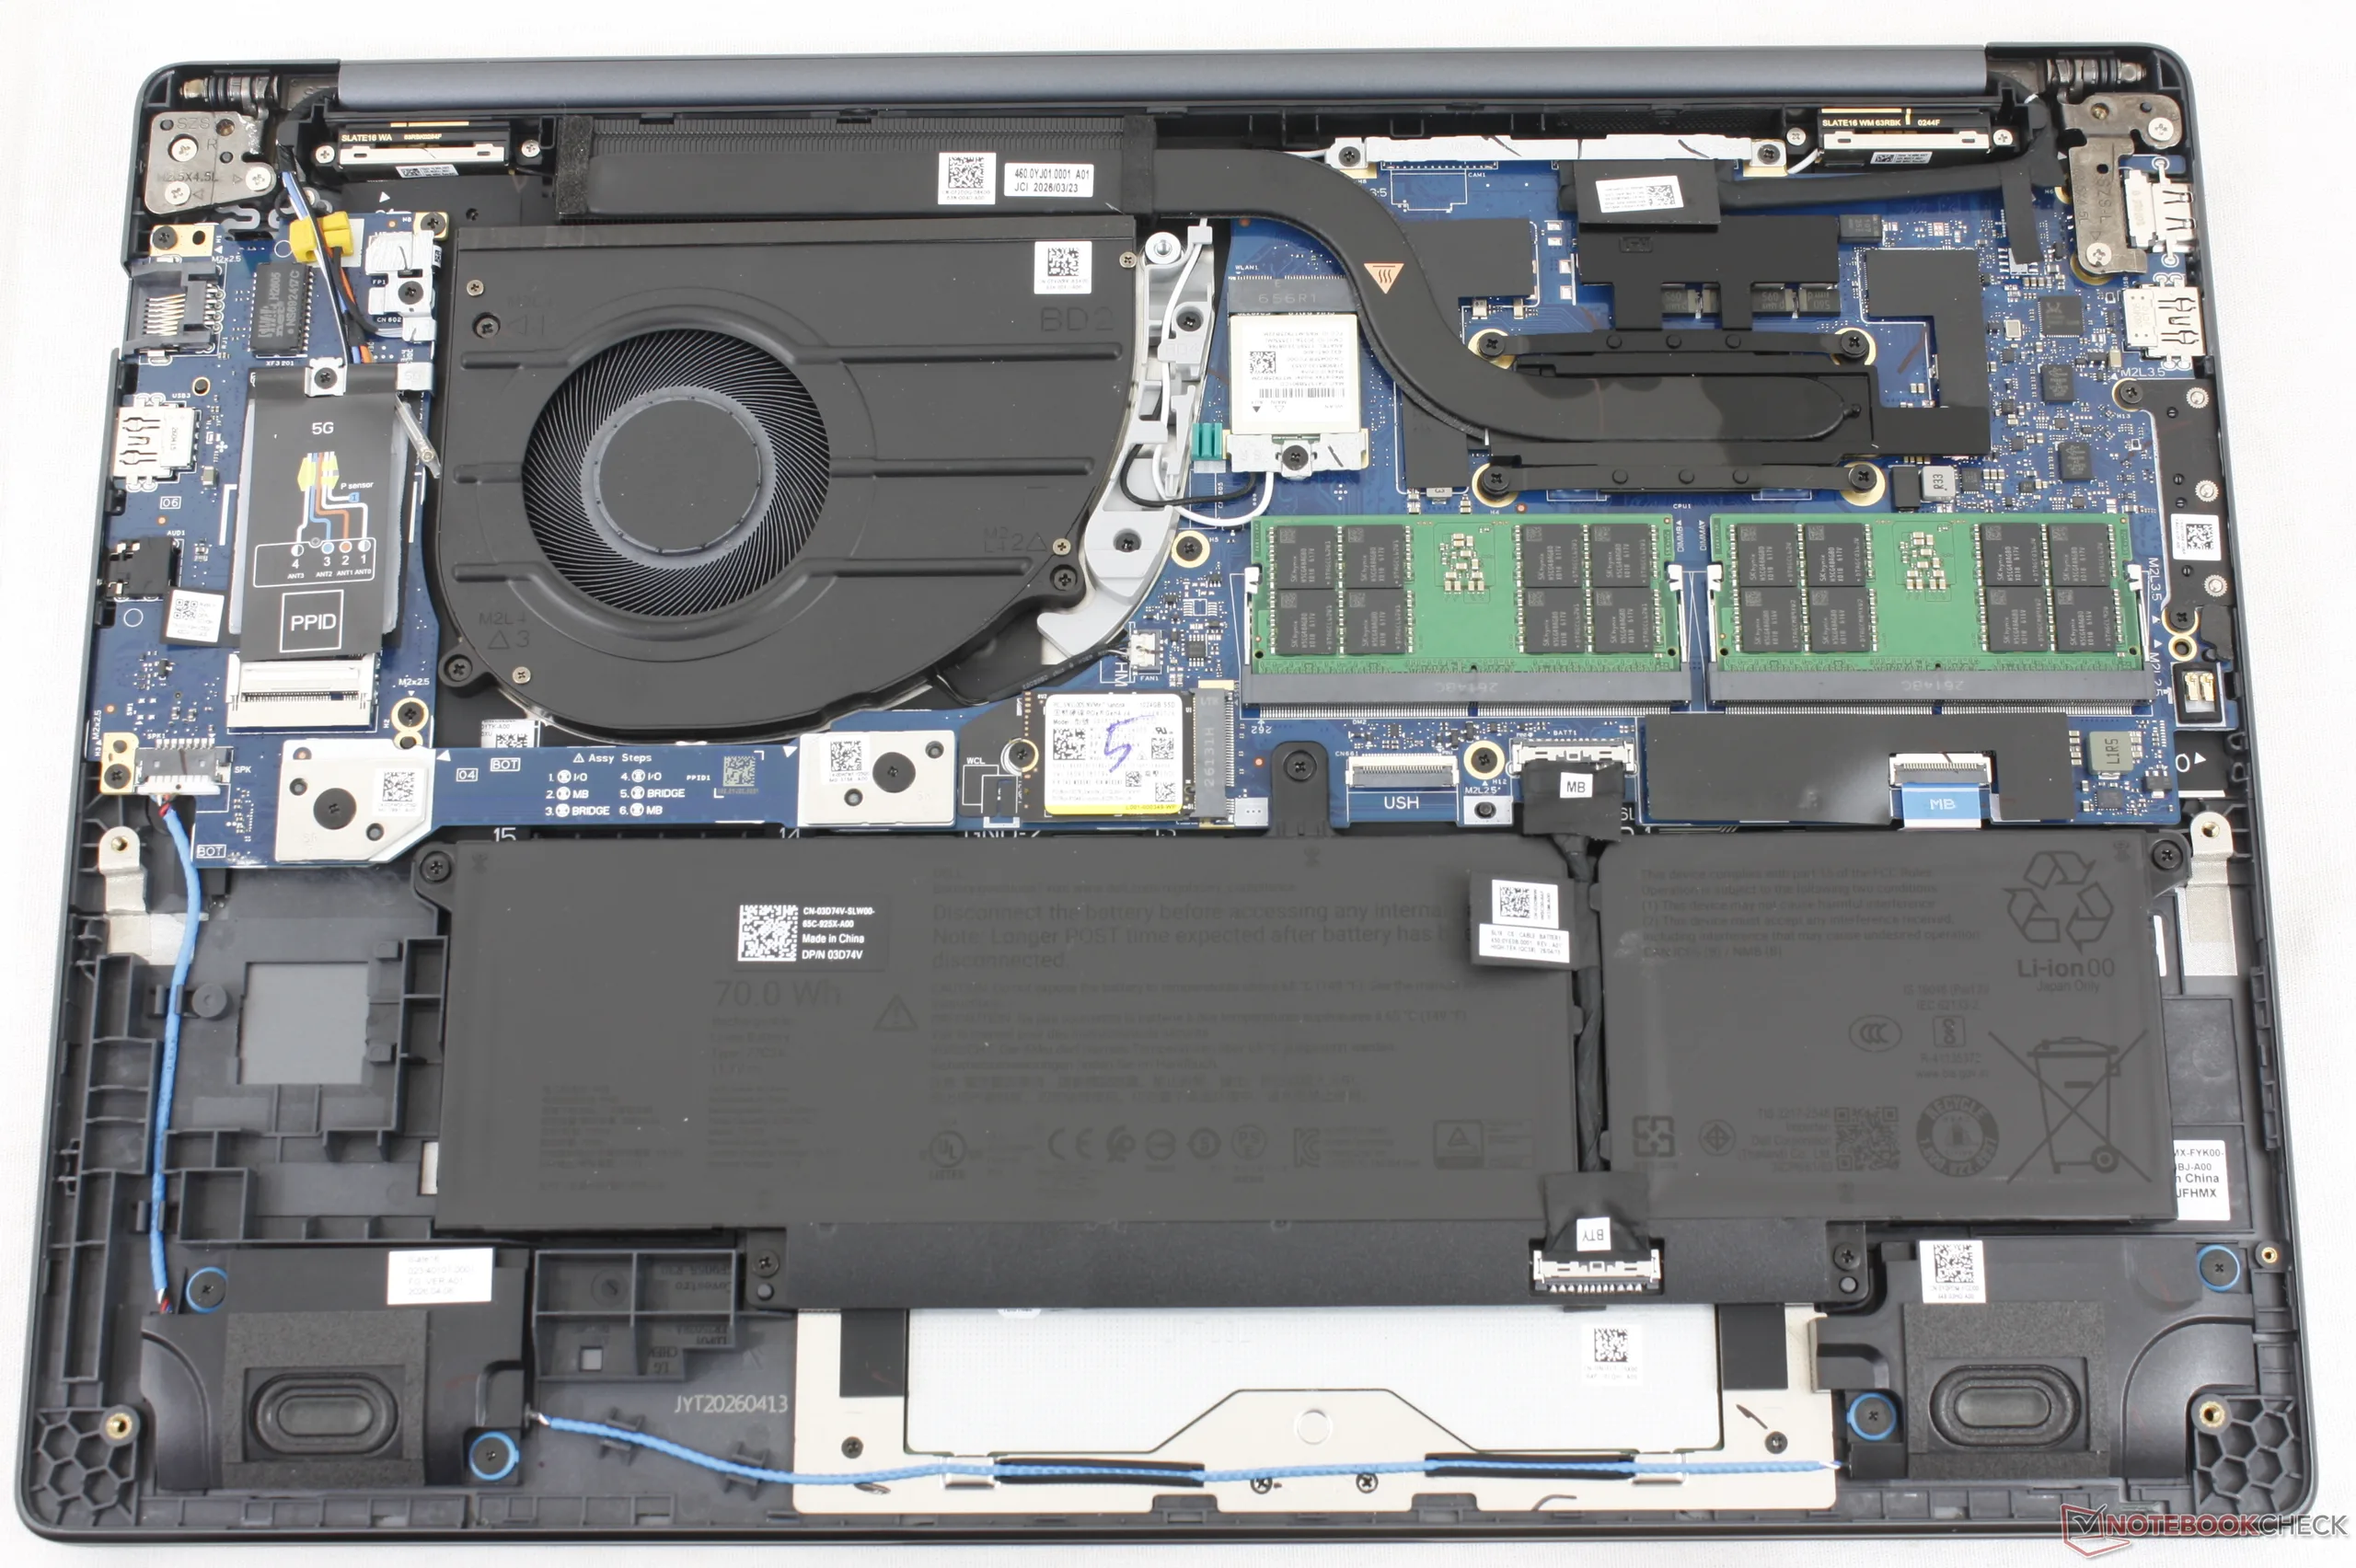
Scheda madre Dell Pro 5 16

Sostenibilità

Parti significative del modello sono costituite da materiali riciclati, tra cui fino al 50% di plastica per l’alloggiamento della ventola, i piedini in gomma e i coperchi A, C e D, fino al 50% di alluminio riciclato per il coperchio A e fino al 100% di cobalto riciclato per determinate configurazioni della batteria. Anche l’adattatore CA e l’imballaggio sono costituiti, rispettivamente, da metalli e carta riciclati.

Accessori e garanzia

Sebbene nella confezione non siano presenti accessori aggiuntivi, apprezziamo il fatto che, in caso di acquisto negli Stati Uniti, sia inclusa di serie una garanzia triennale.

Dispositivi di input
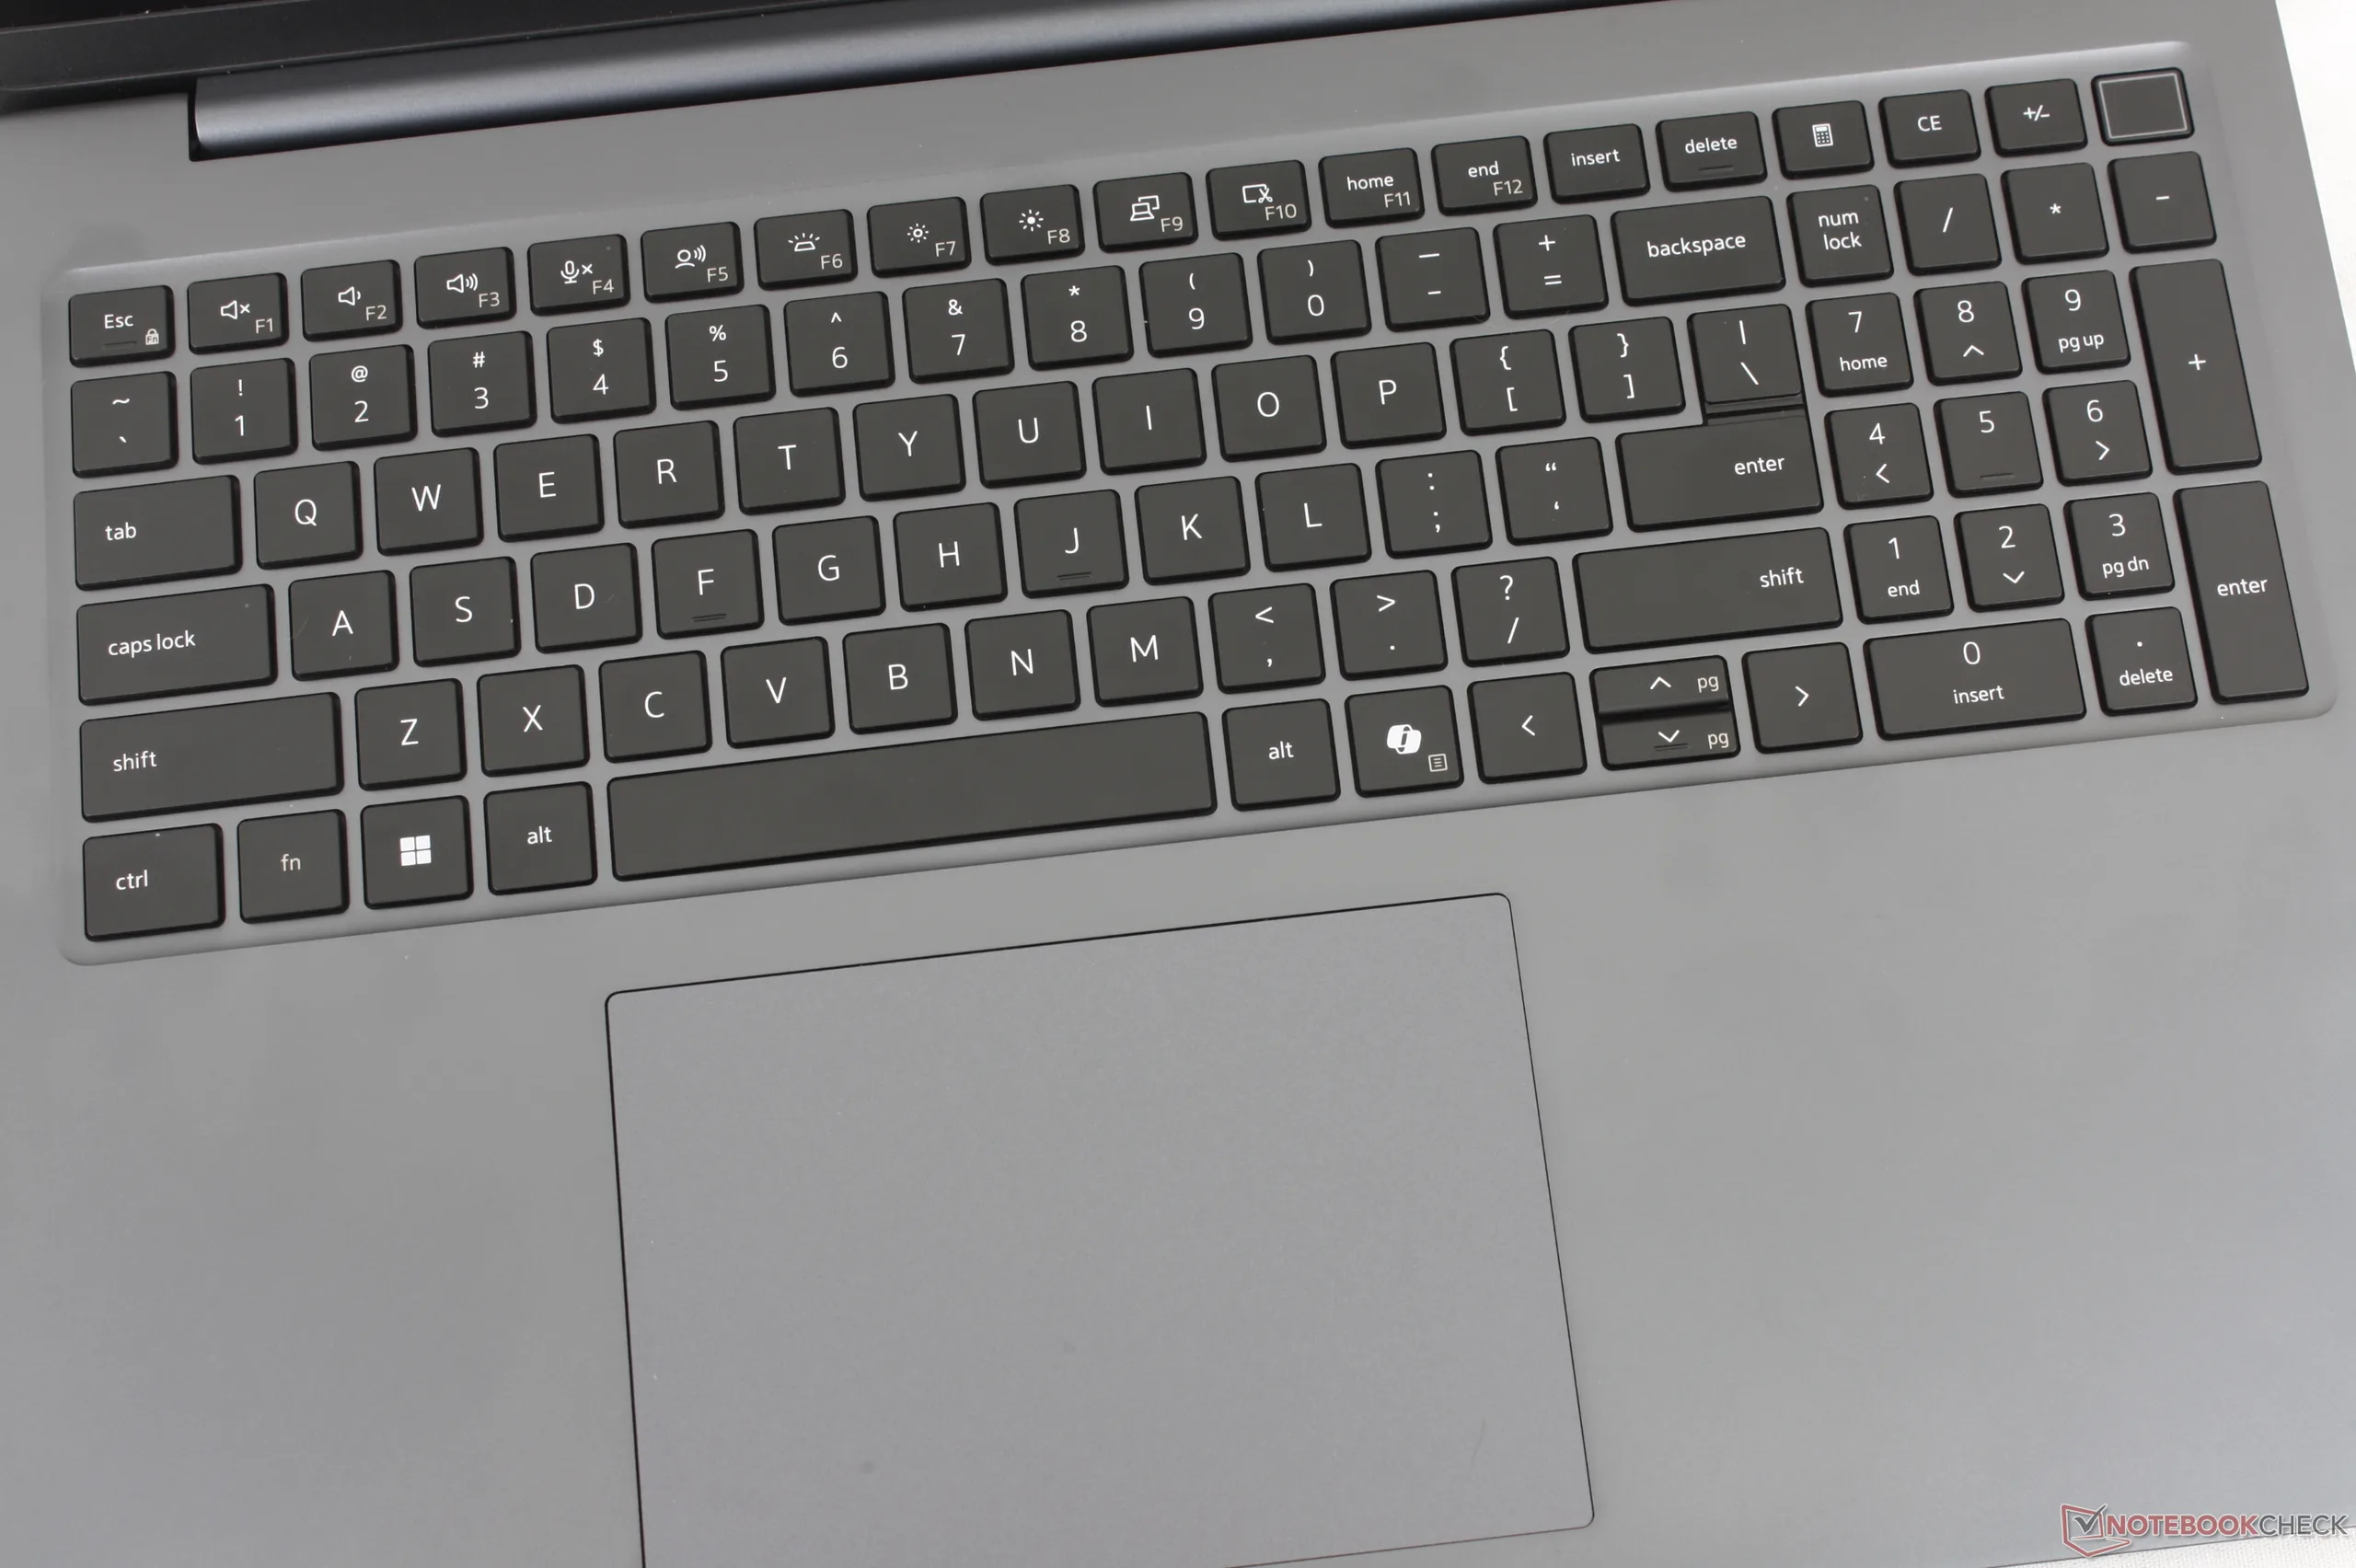
Tastiera e risposta al tocco simili a quelle del Dell Pro 7 14, ma con un clickpad più ampio (13 x 9 cm) e un tastierino numerico integrato

Visualizza

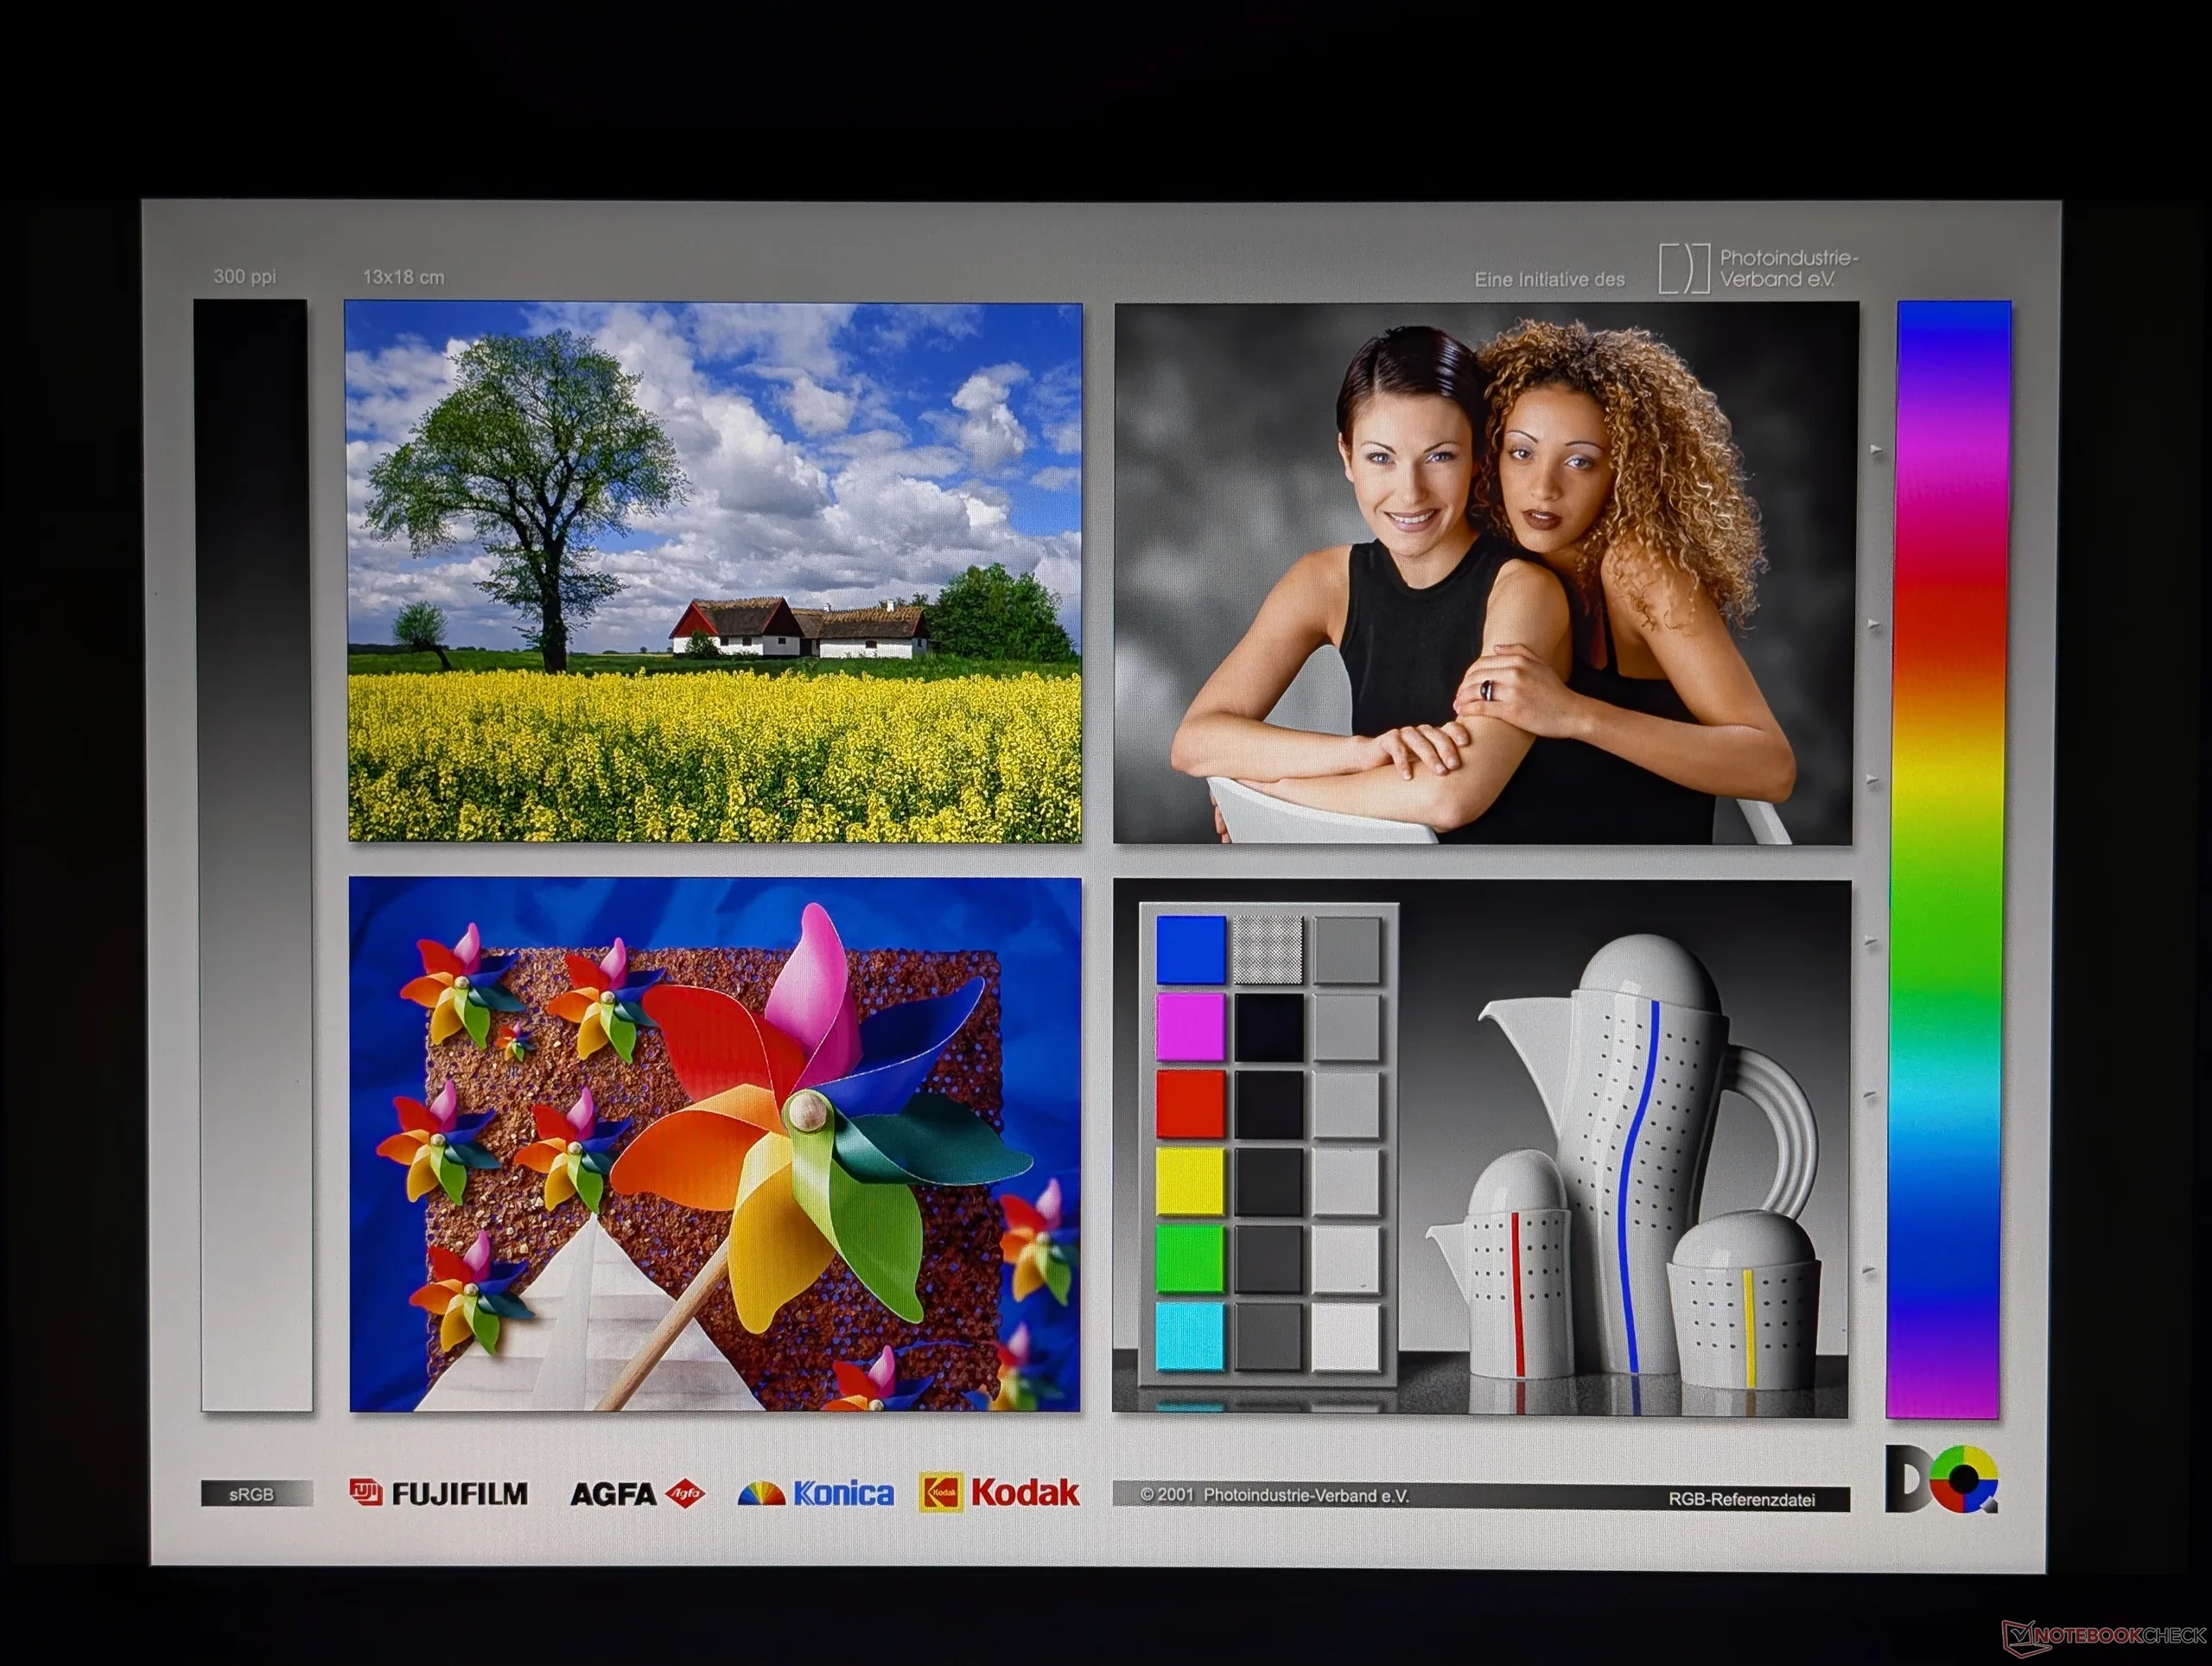
Se osservato da vicino, il pannello opaco risulta leggermente più granuloso rispetto alla versione lucida
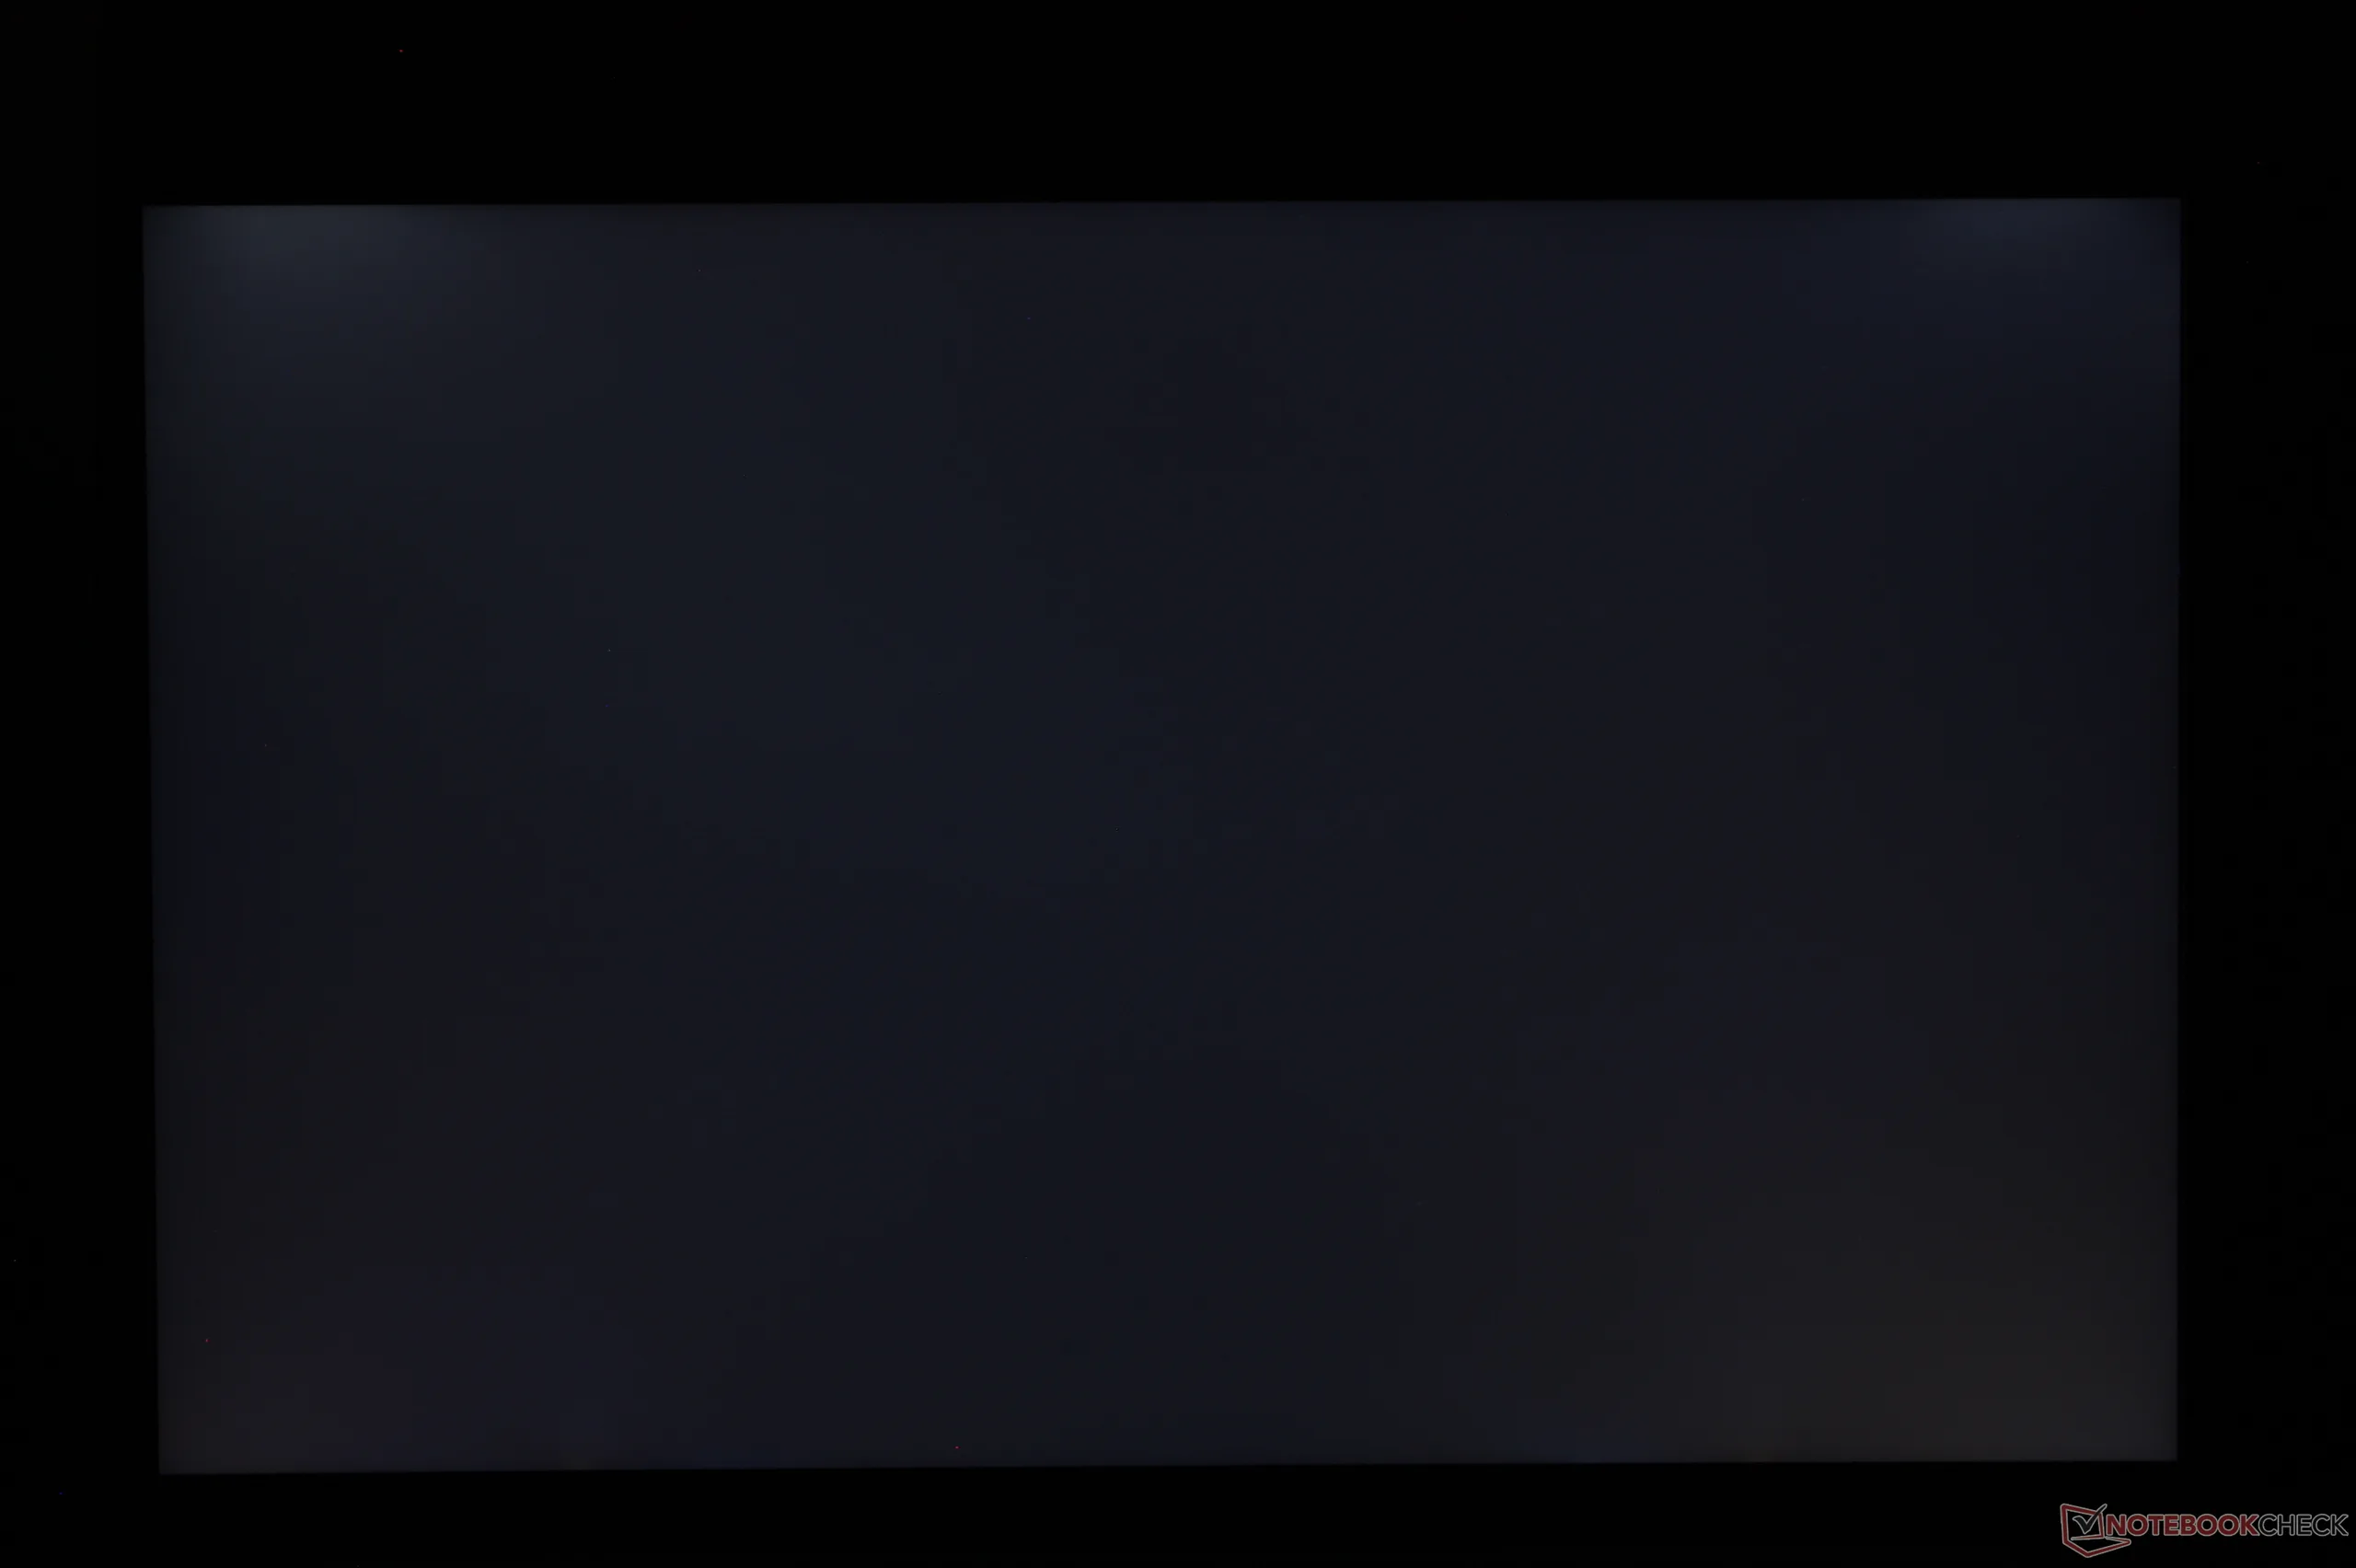
Lieve sbavatura di retroilluminazione irregolare lungo gli angoli superiori
473.4
cd/m²
458.6
cd/m²
477.3
cd/m²
451.5
cd/m²
470.3
cd/m²
467.3
cd/m²
465.5
cd/m²
446.8
cd/m²
467.5
cd/m²
Distribuzione della luminosità
BOE NS16M30 testato con X-Rite i1Pro 3
Massima: 477.3 cd/m² (Nits) Media: 464.2 cd/m² Minimum: 24.5 cd/m²
Distribuzione della luminosità: 94 %
Al centro con la batteria: 470.3 cd/m²
Contrasto: 2766:1 (Nero: 0.17 cd/m²)
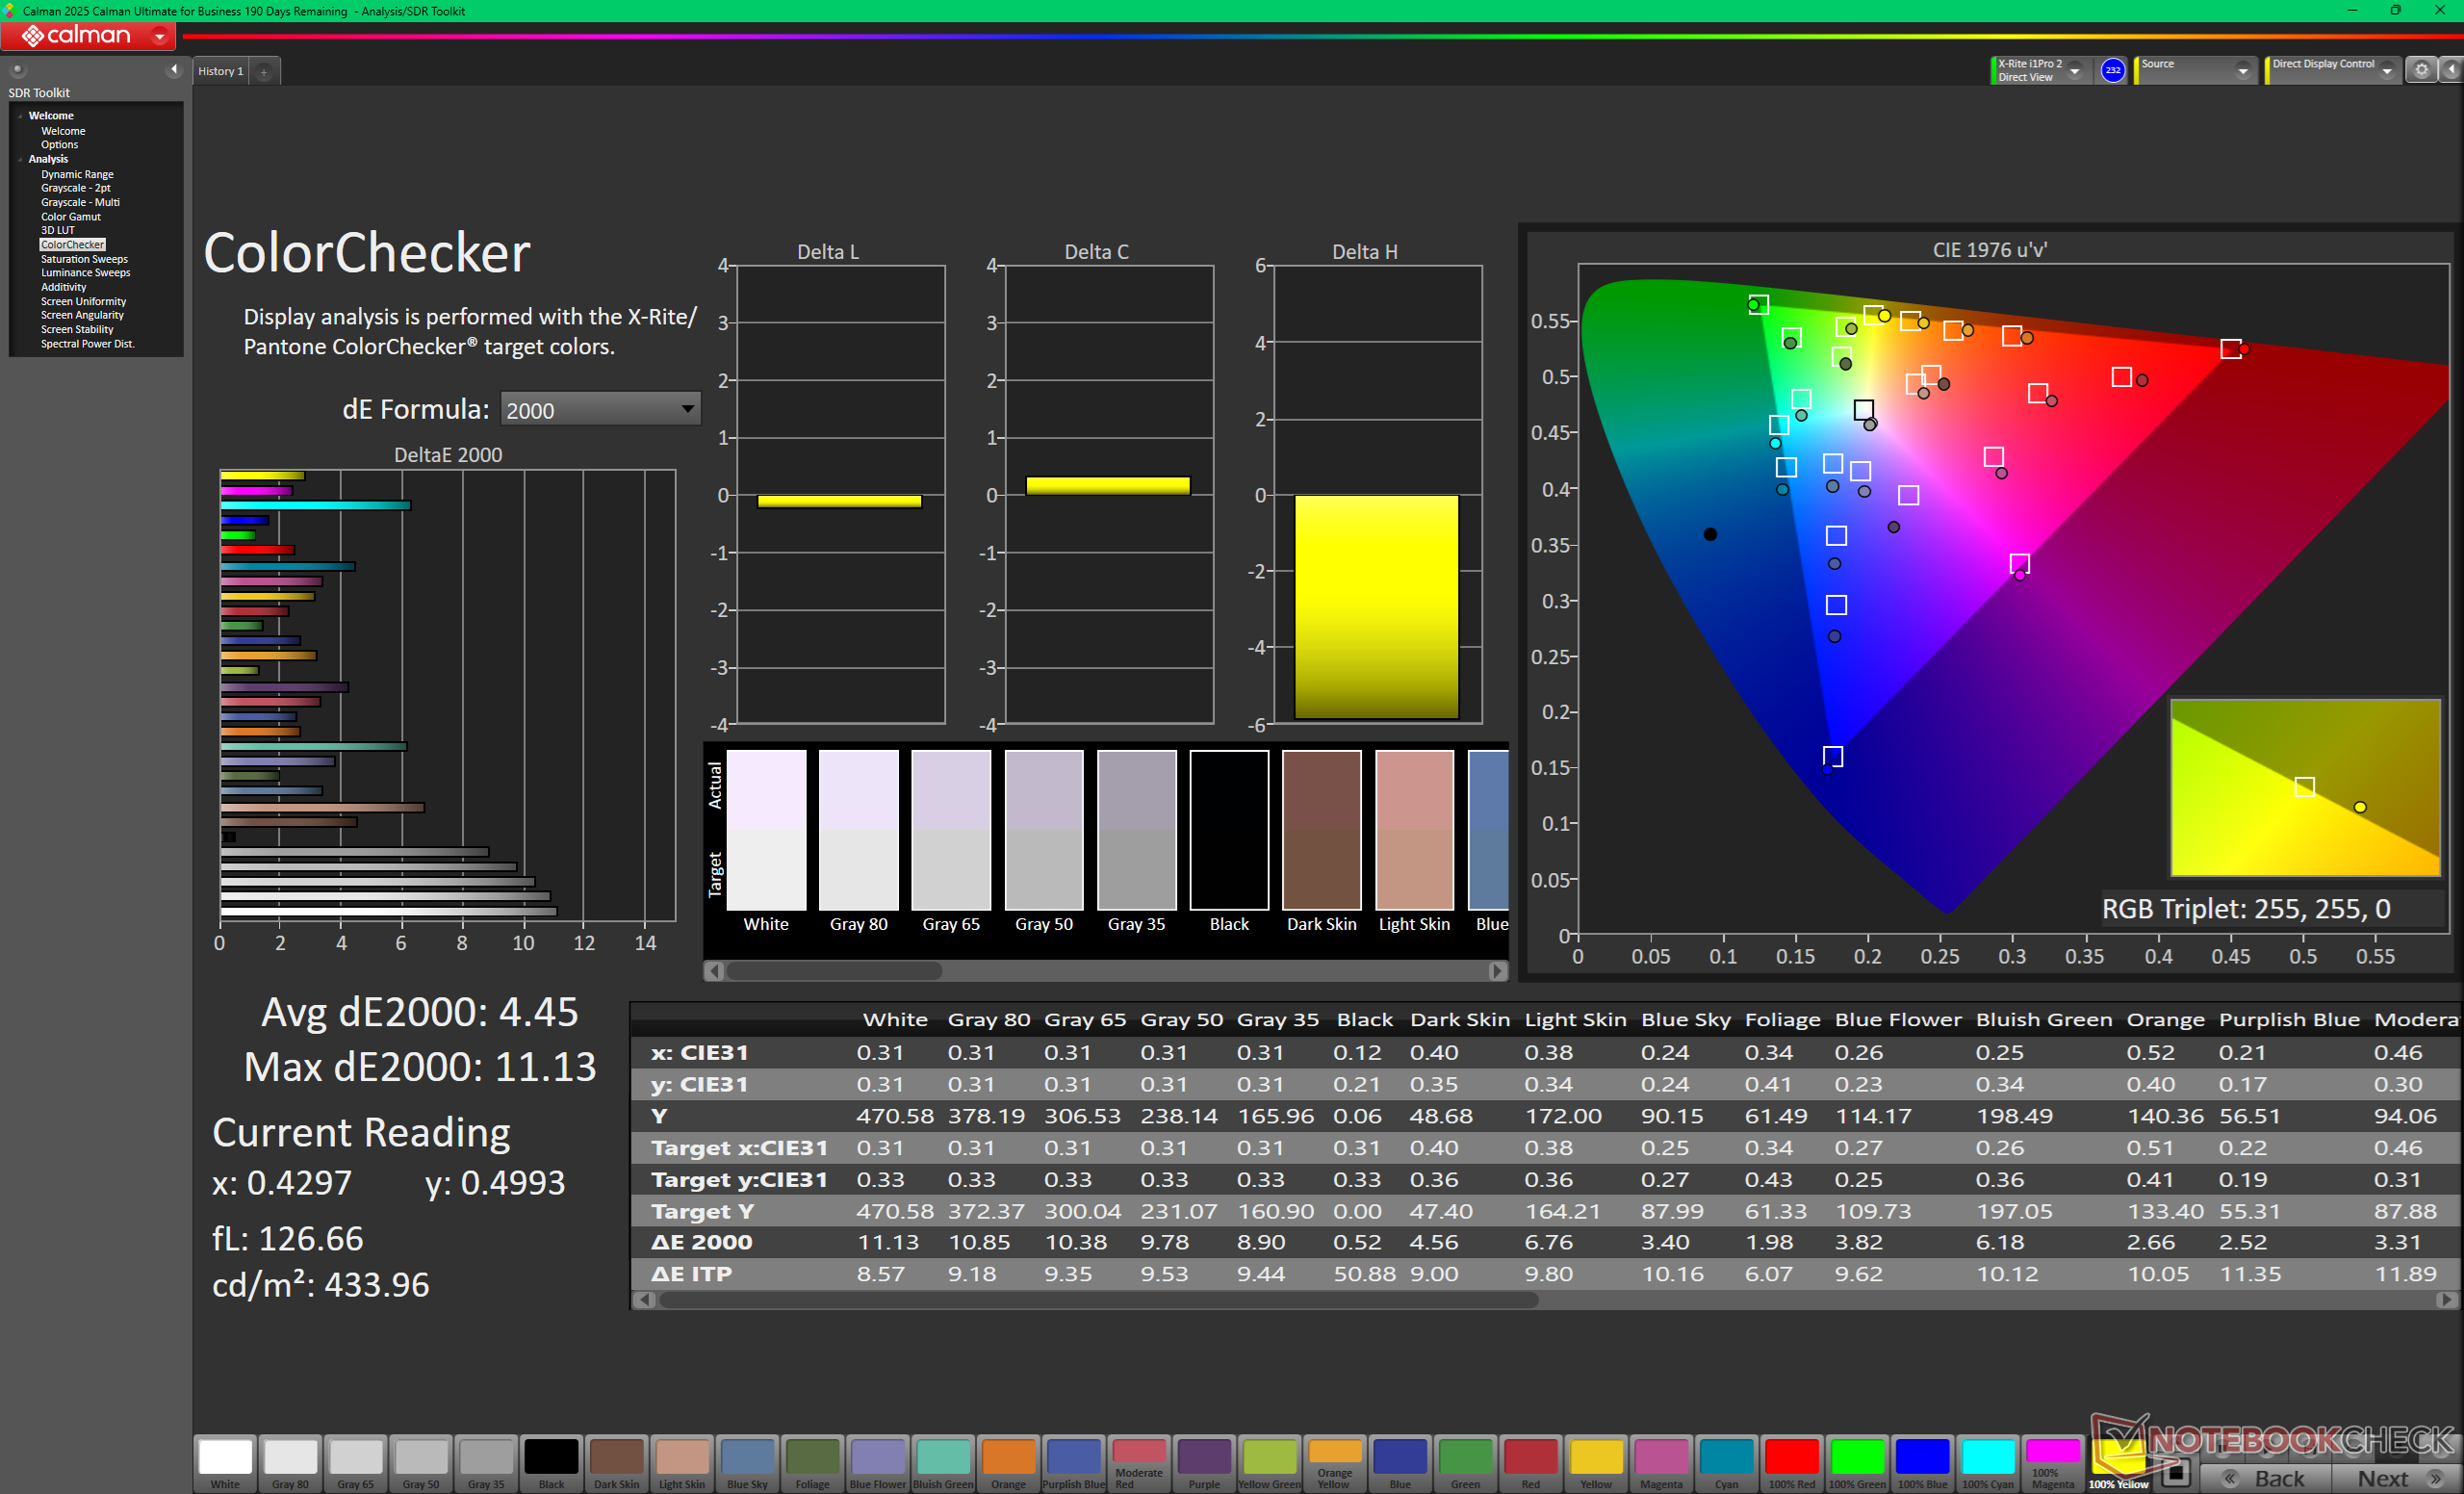
ΔE ColorChecker Calman: 4.45 | ∀{0.5-29.43 Ø4.71}
calibrated: 0.6
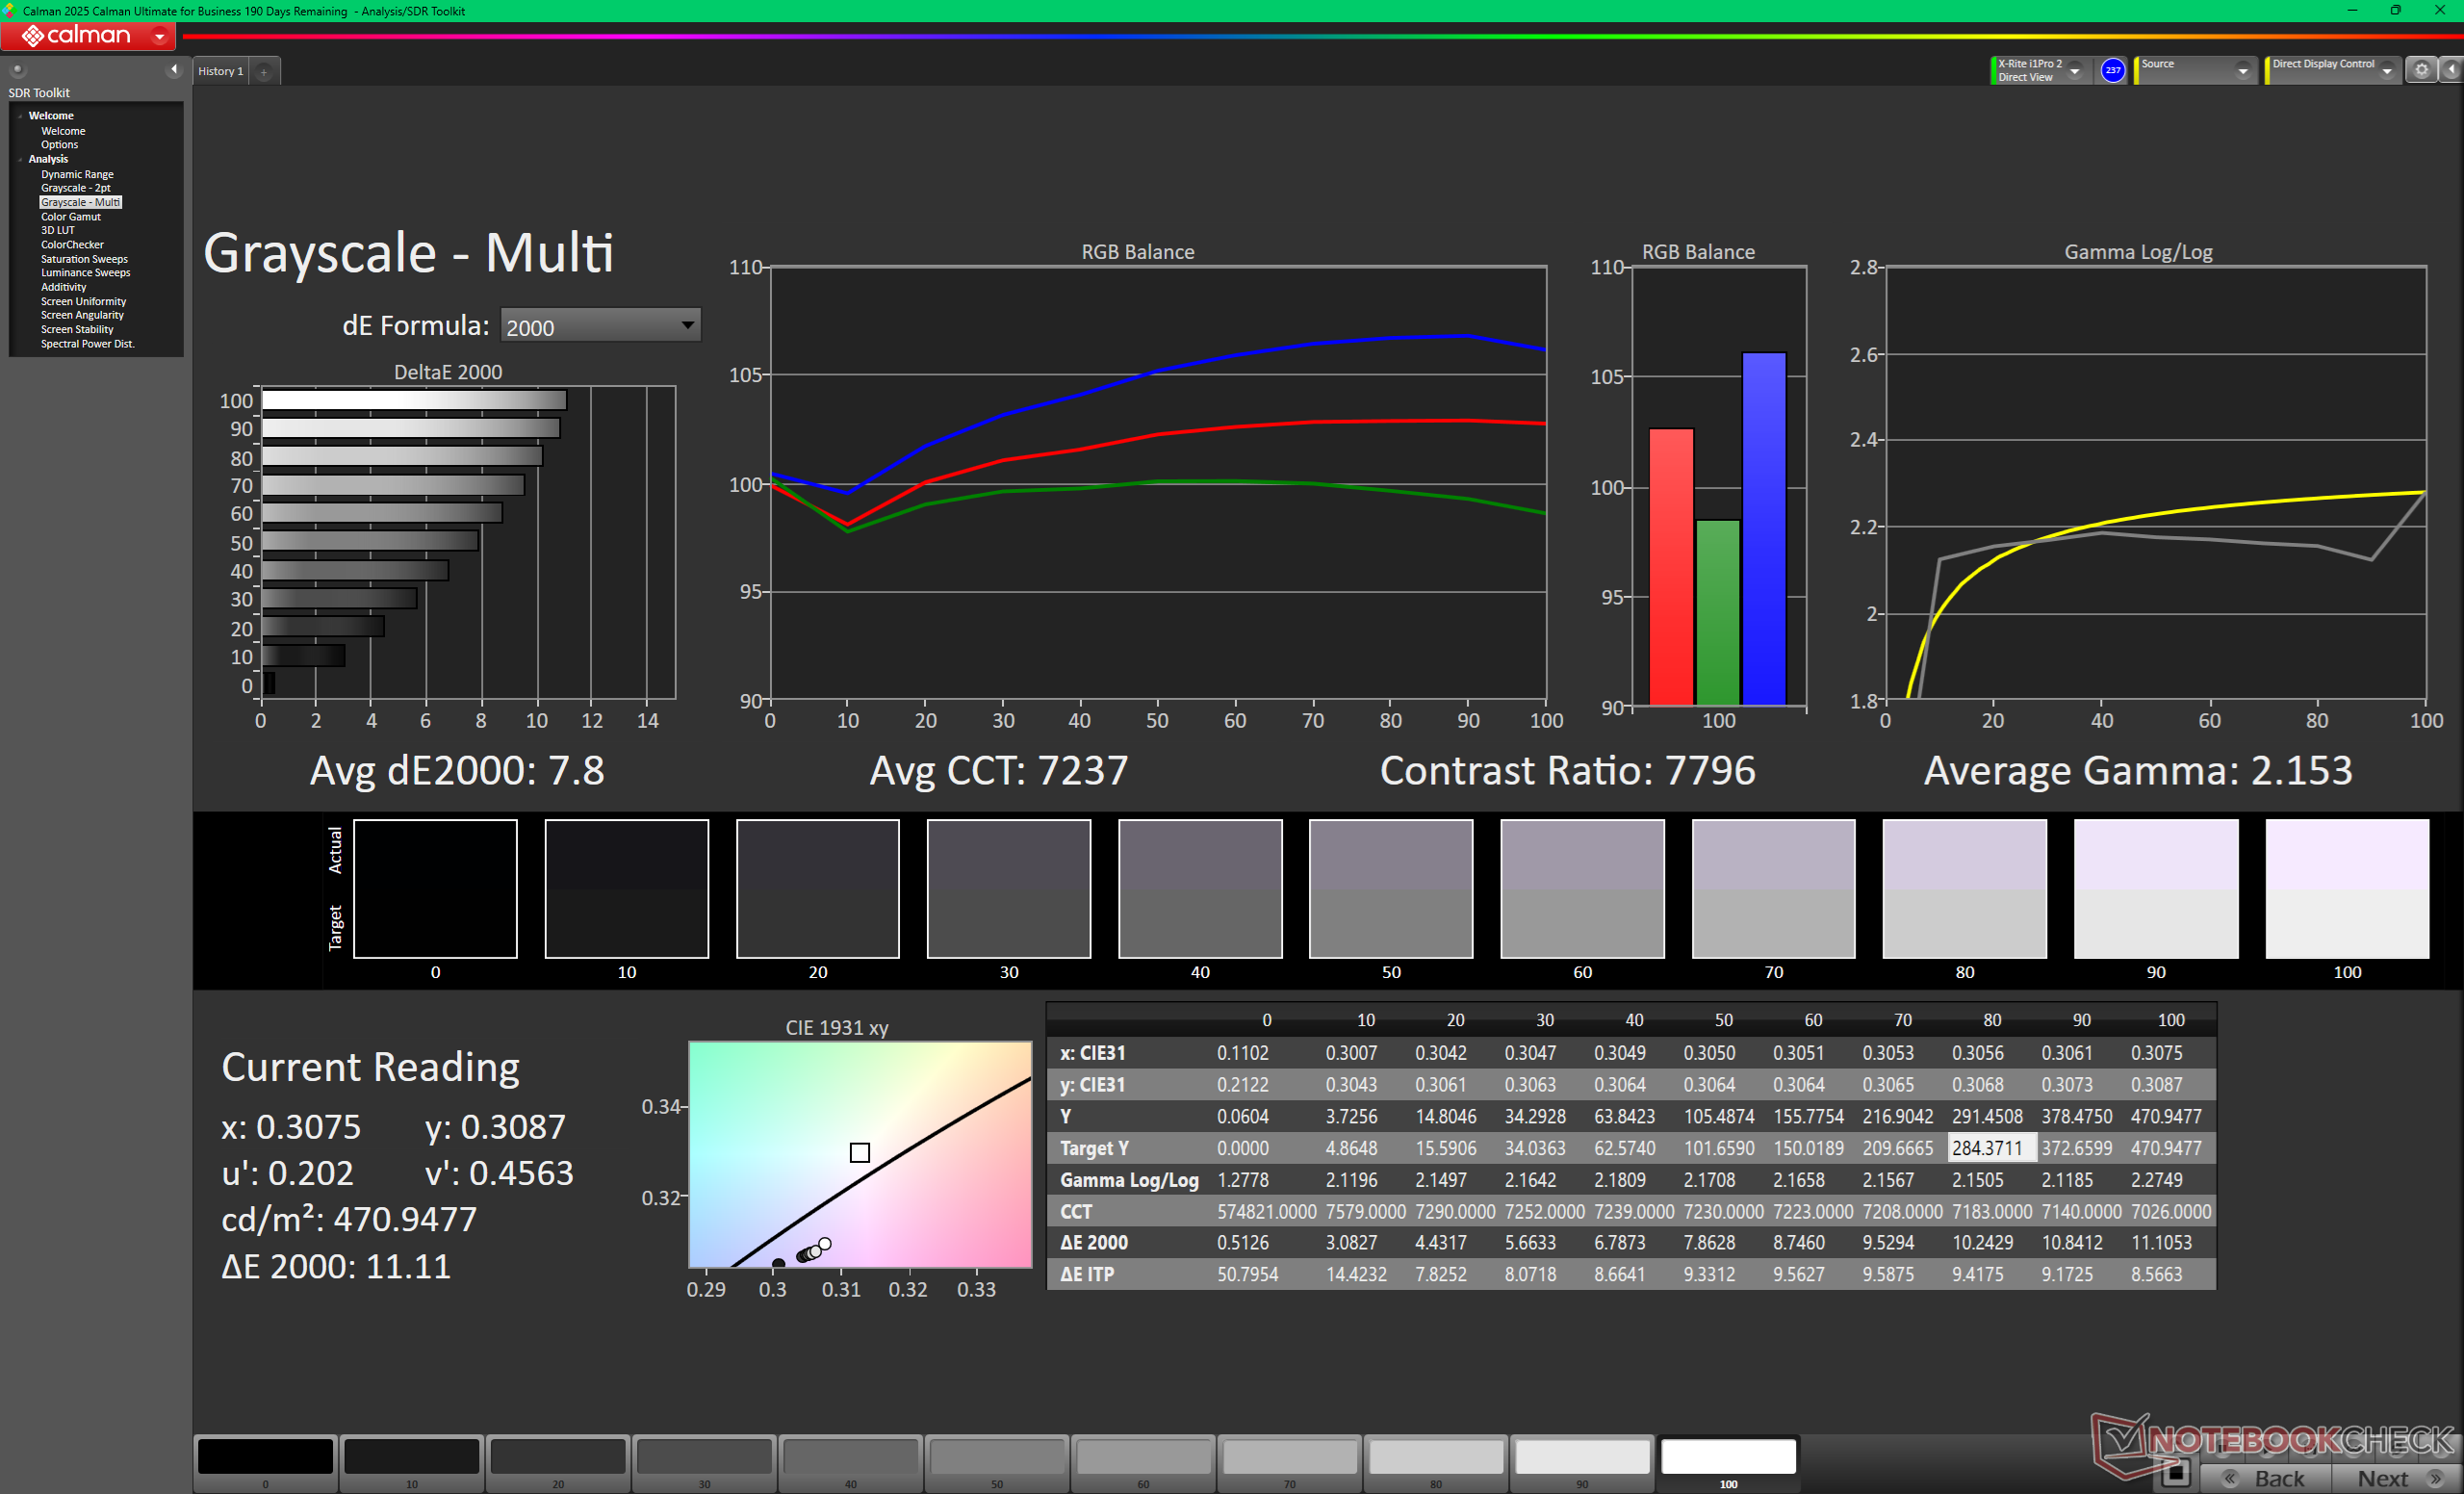
ΔE Greyscale Calman: 7.8 | ∀{0.09-98 Ø4.96}
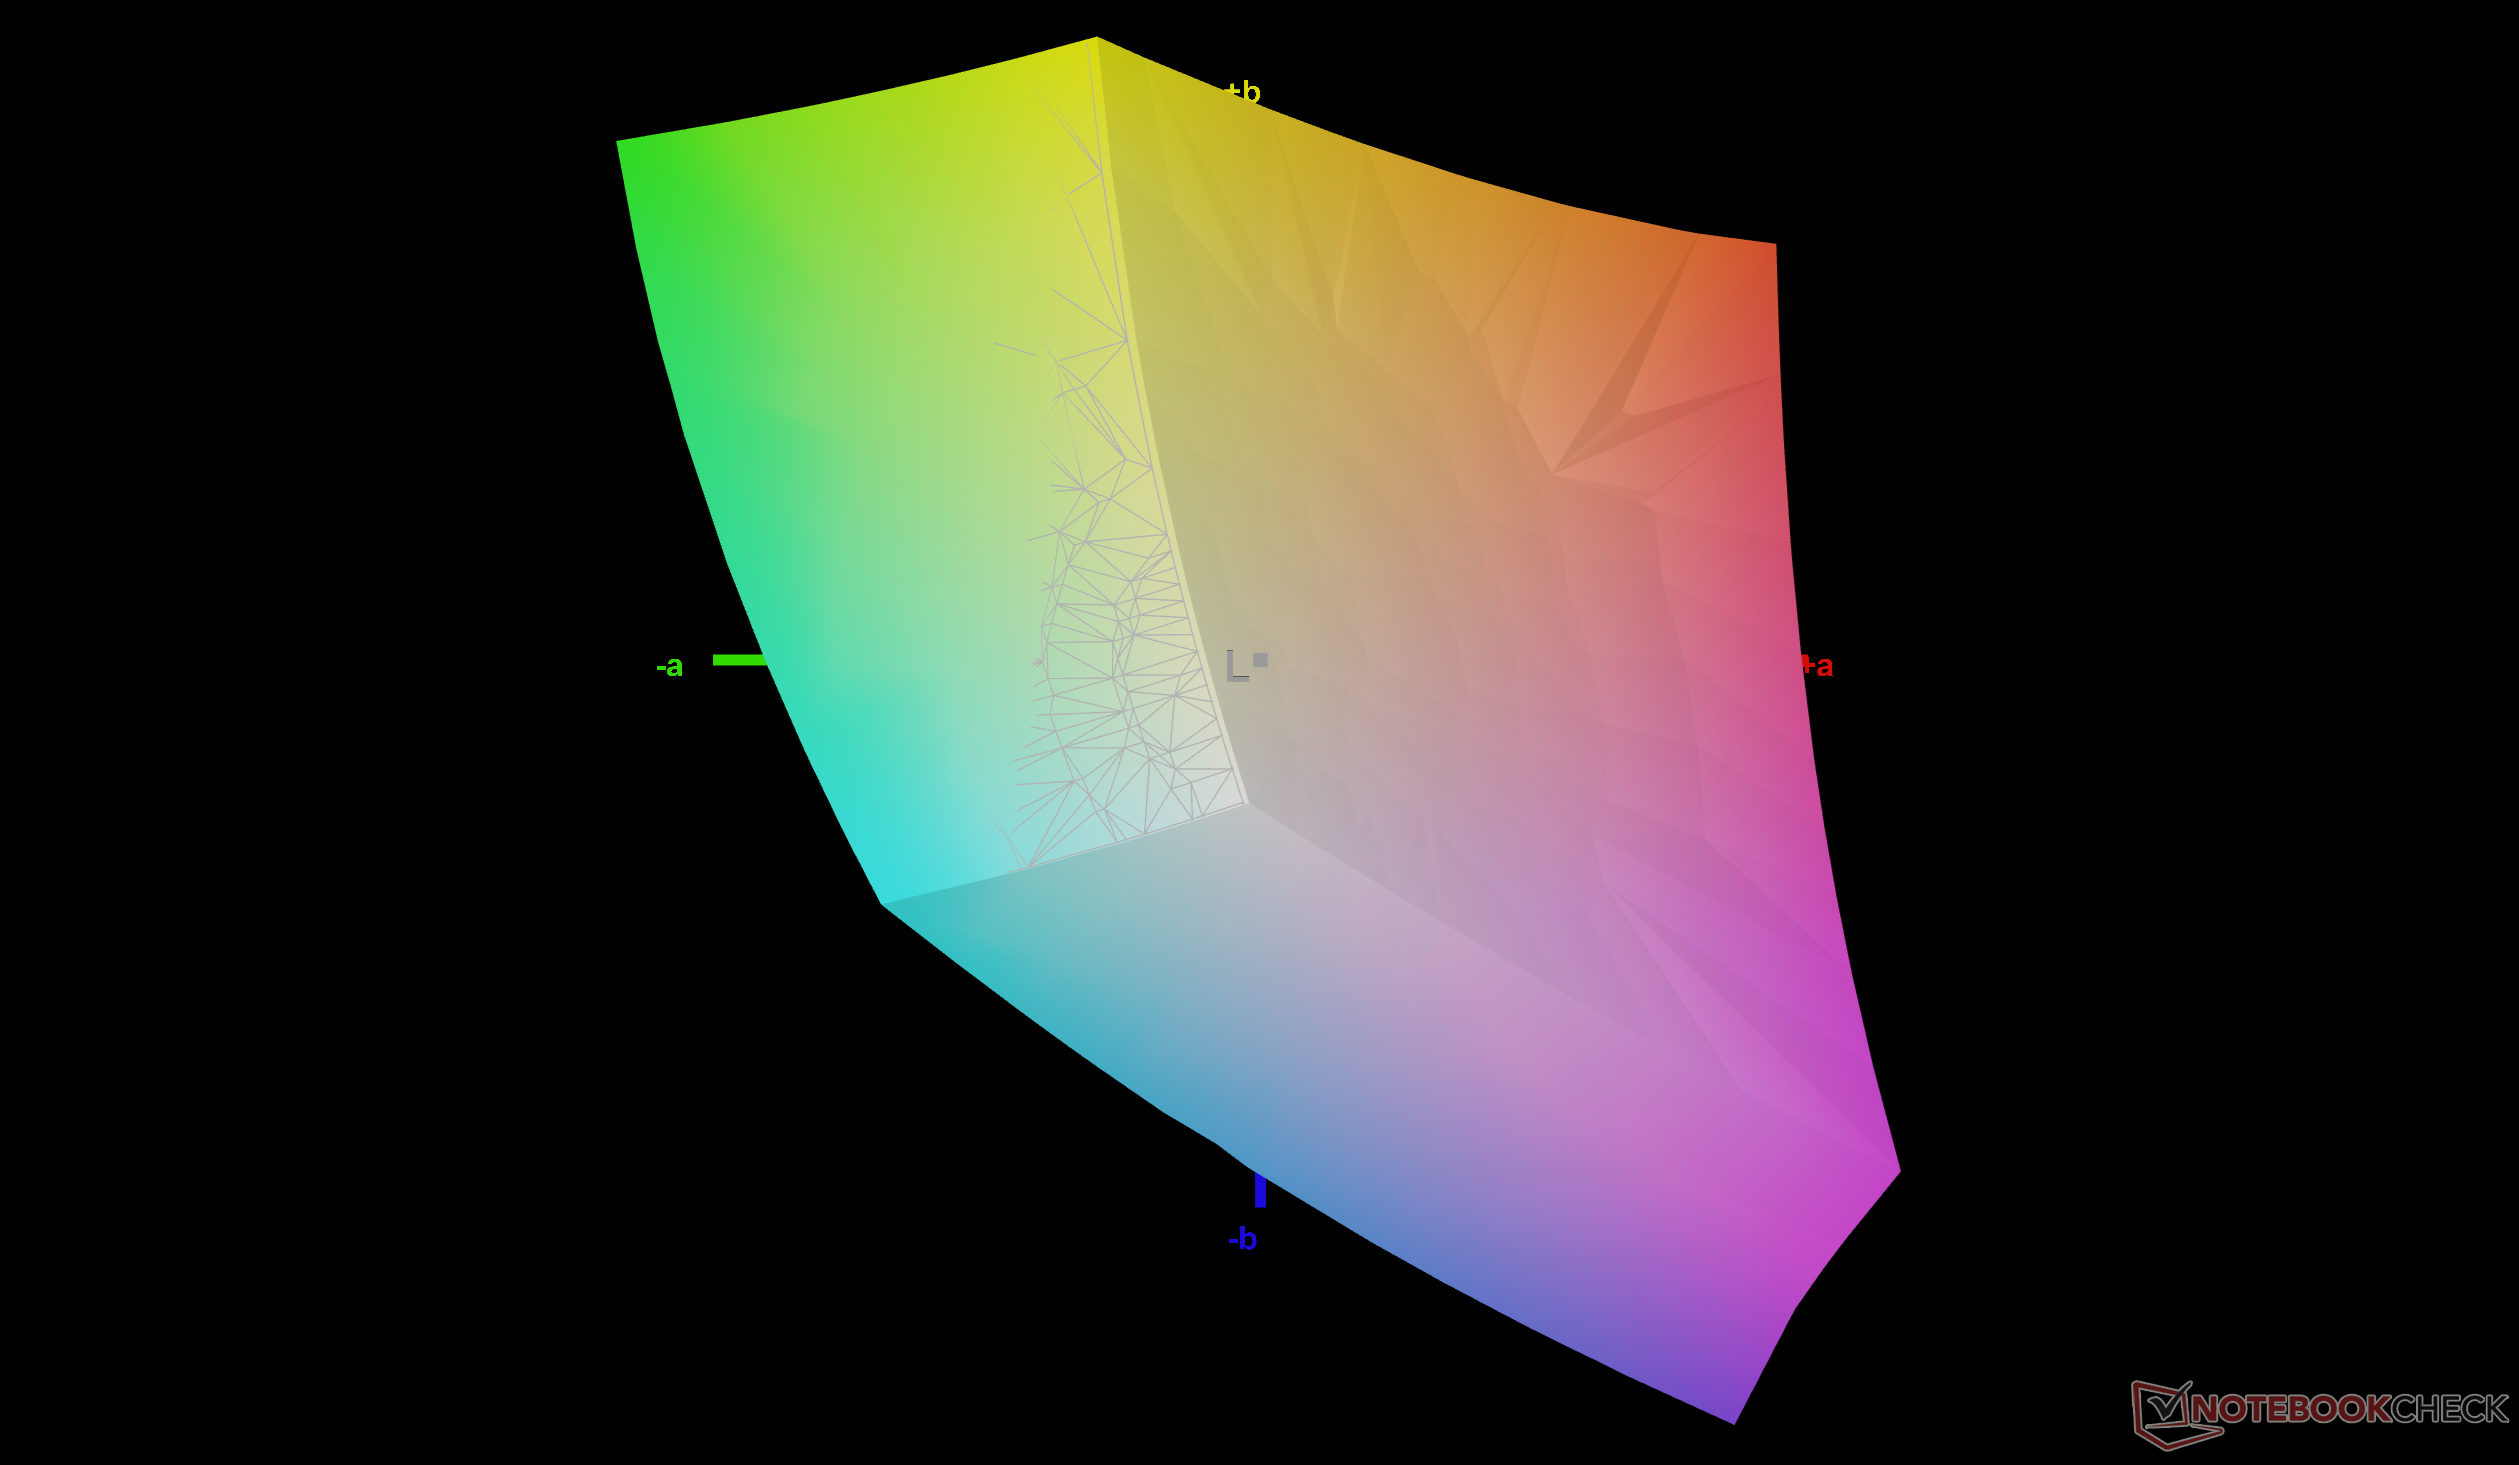
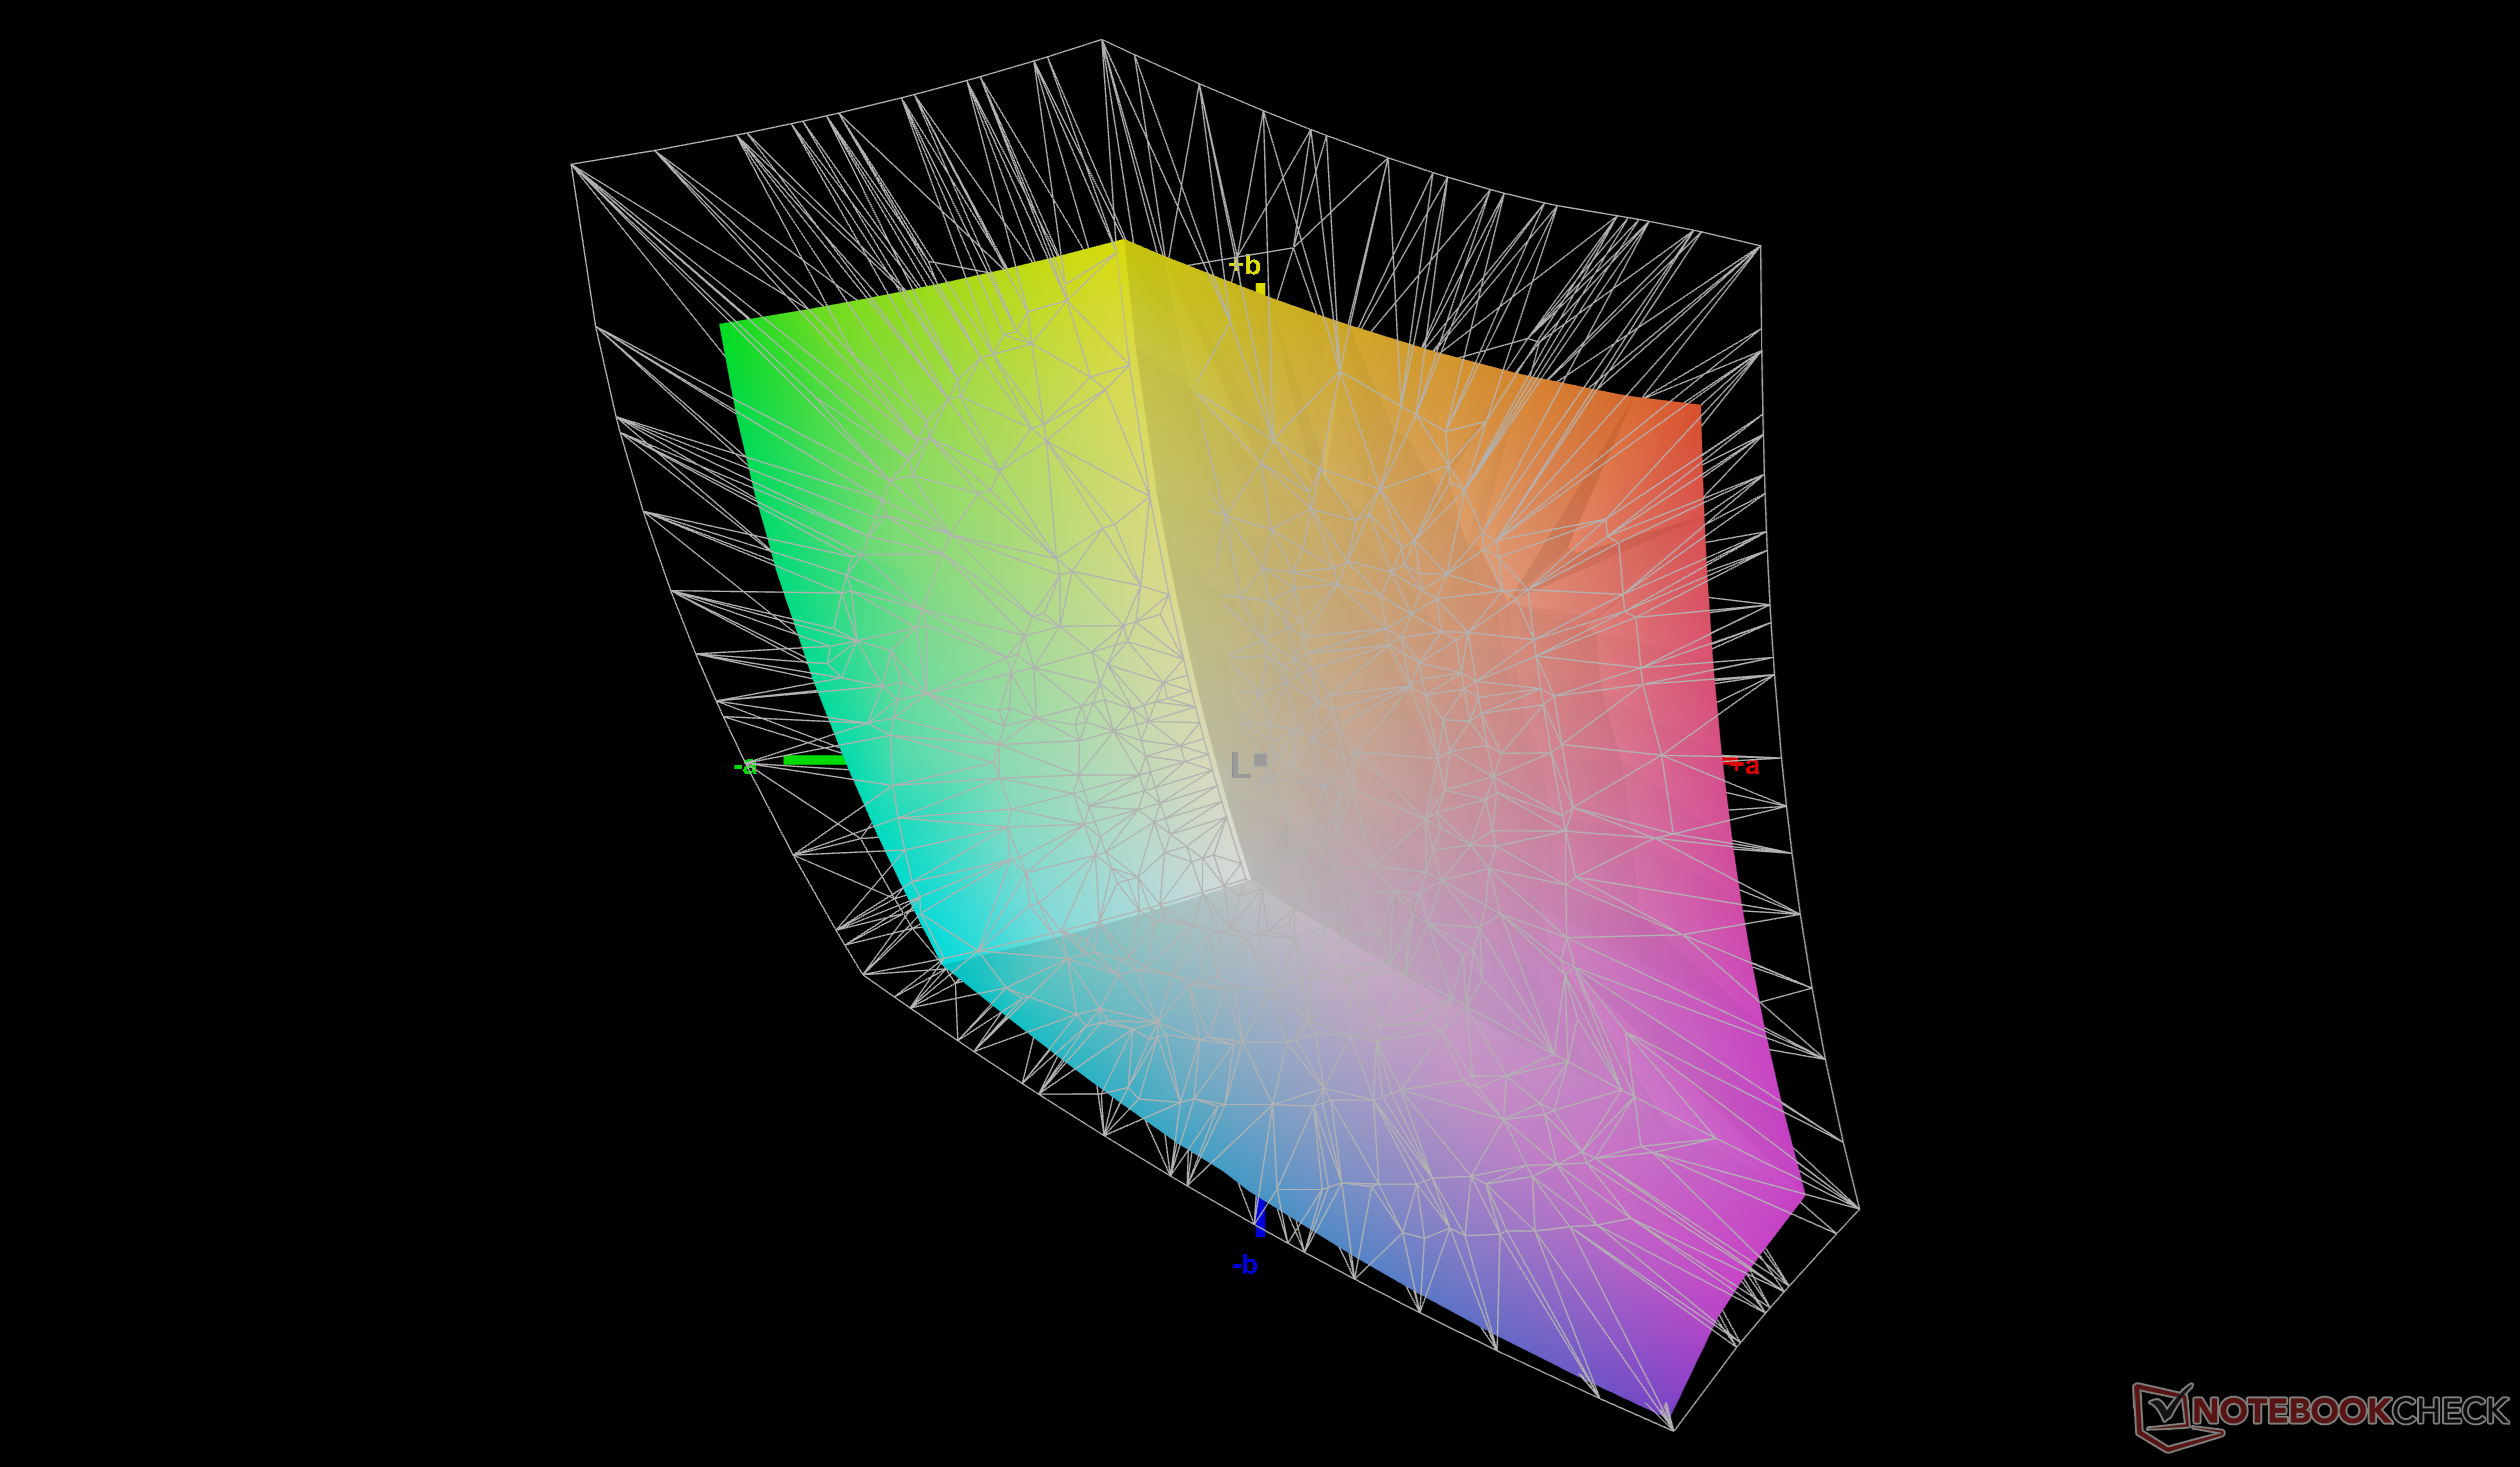
72.4% AdobeRGB 1998 (Argyll 3D)
100% sRGB (Argyll 3D)
71% Display P3 (Argyll 3D)
Gamma: 2.15
CCT: 7237 K
Dell Pro 5 16 P516265
BOE NS16M30, IPS, 2560x1600, 16", 120 Hz
Dell XPS 16 Core Ultra X7 358H
LG Philips 160WV1, OLED, 3200x2000, 16", 120 Hz
Lenovo ThinkPad T16 Gen 5 22AN001WGE
N160JCA-ELN, IPS, 1920x1200, 16", 60 Hz
MSI Venture 16 AI A2HMTG
BOE0D3E, IPS, 1920x1200, 16", 60 Hz
Asus ExpertBook B5 B5605CCA
NE160QDM-NX4, IPS, 2560x1600, 16", 144 Hz
HP EliteBook 8 G1a 16 AI
IPS, 1920x1200, 16", 60 Hz
Display
24%
-41%
-44%
-3%
-3%
Display P3 Coverage (%)
71
99.5
40%
40.7
-43%
39.4
-45%
68.5
-4%
68.5
-4%
sRGB Coverage (%)
100
100
0%
61.1
-39%
57.4
-43%
98.3
-2%
98.6
-1%
AdobeRGB 1998 Coverage (%)
72.4
96.5
33%
42
-42%
40.7
-44%
69.4
-4%
70.4
-3%
Response Times
97%
27%
26%
16%
-31%
Response Time Grey 50% / Grey 80% * (ms)
38.3 ?(17, 21.3)
0.65 ?(0.36, 0.29)
98%
32.6 ?(16, 16.6)
15%
26.7 ?(12.9, 13.8)
30%
35.6 ?(16.7, 18.9)
7%
50.2 ?(22.8, 27.4)
-31%
Response Time Black / White * (ms)
23.4 ?(10.8, 12.6)
0.87 ?(0.43, 0.44)
96%
14.2 ?(5.7, 8.5)
39%
18.4 ?(9.9, 8.5)
21%
17.5 ?(6.6, 10.9)
25%
30.7 ?(15.7, 15)
-31%
PWM Frequency (Hz)
240.2 ?(100)
PWM Amplitude * (%)
31
Screen
11%
-86%
-66%
-13%
4%
Brightness middle (cd/m²)
470.3
395.4
-16%
479
2%
321.7
-32%
413
-12%
439.2
-7%
Brightness (cd/m²)
464
392
-16%
452
-3%
306
-34%
408
-12%
405
-13%
Brightness Distribution (%)
94
95
1%
89
-5%
91
-3%
94
0%
88
-6%
Black Level * (cd/m²)
0.17
0.51
-200%
0.18
-6%
0.2
-18%
0.31
-82%
Contrast (:1)
2766
939
-66%
1787
-35%
2065
-25%
1417
-49%
Colorchecker dE 2000 *
4.45
3.69
17%
4.1
8%
6.11
-37%
3.6
19%
2.2
51%
Colorchecker dE 2000 max. *
11.13
7.94
29%
16.8
-51%
19.43
-75%
7.1
36%
4.31
61%
Colorchecker dE 2000 calibrated *
0.6
0.68
-13%
3.8
-533%
3.13
-422%
1.5
-150%
0.49
18%
Greyscale dE 2000 *
7.8
1.9
76%
1.7
78%
3.9
50%
4.6
41%
3.2
59%
Gamma
2.15 102%
2.28 96%
2.25 98%
2.22 99%
2.25 98%
2.3 96%
CCT
7237 90%
6274 104%
6777 96%
6250 104%
7461 87%
6438 101%
Media totale (Programma / Settaggio)
44% / 29%
-33% / -60%
-28% / -48%
0% / -7%
-10% / -3%

* ... Meglio usare valori piccoli
vs. sRGB
vs. sRGB
vs. P3
vs. P3
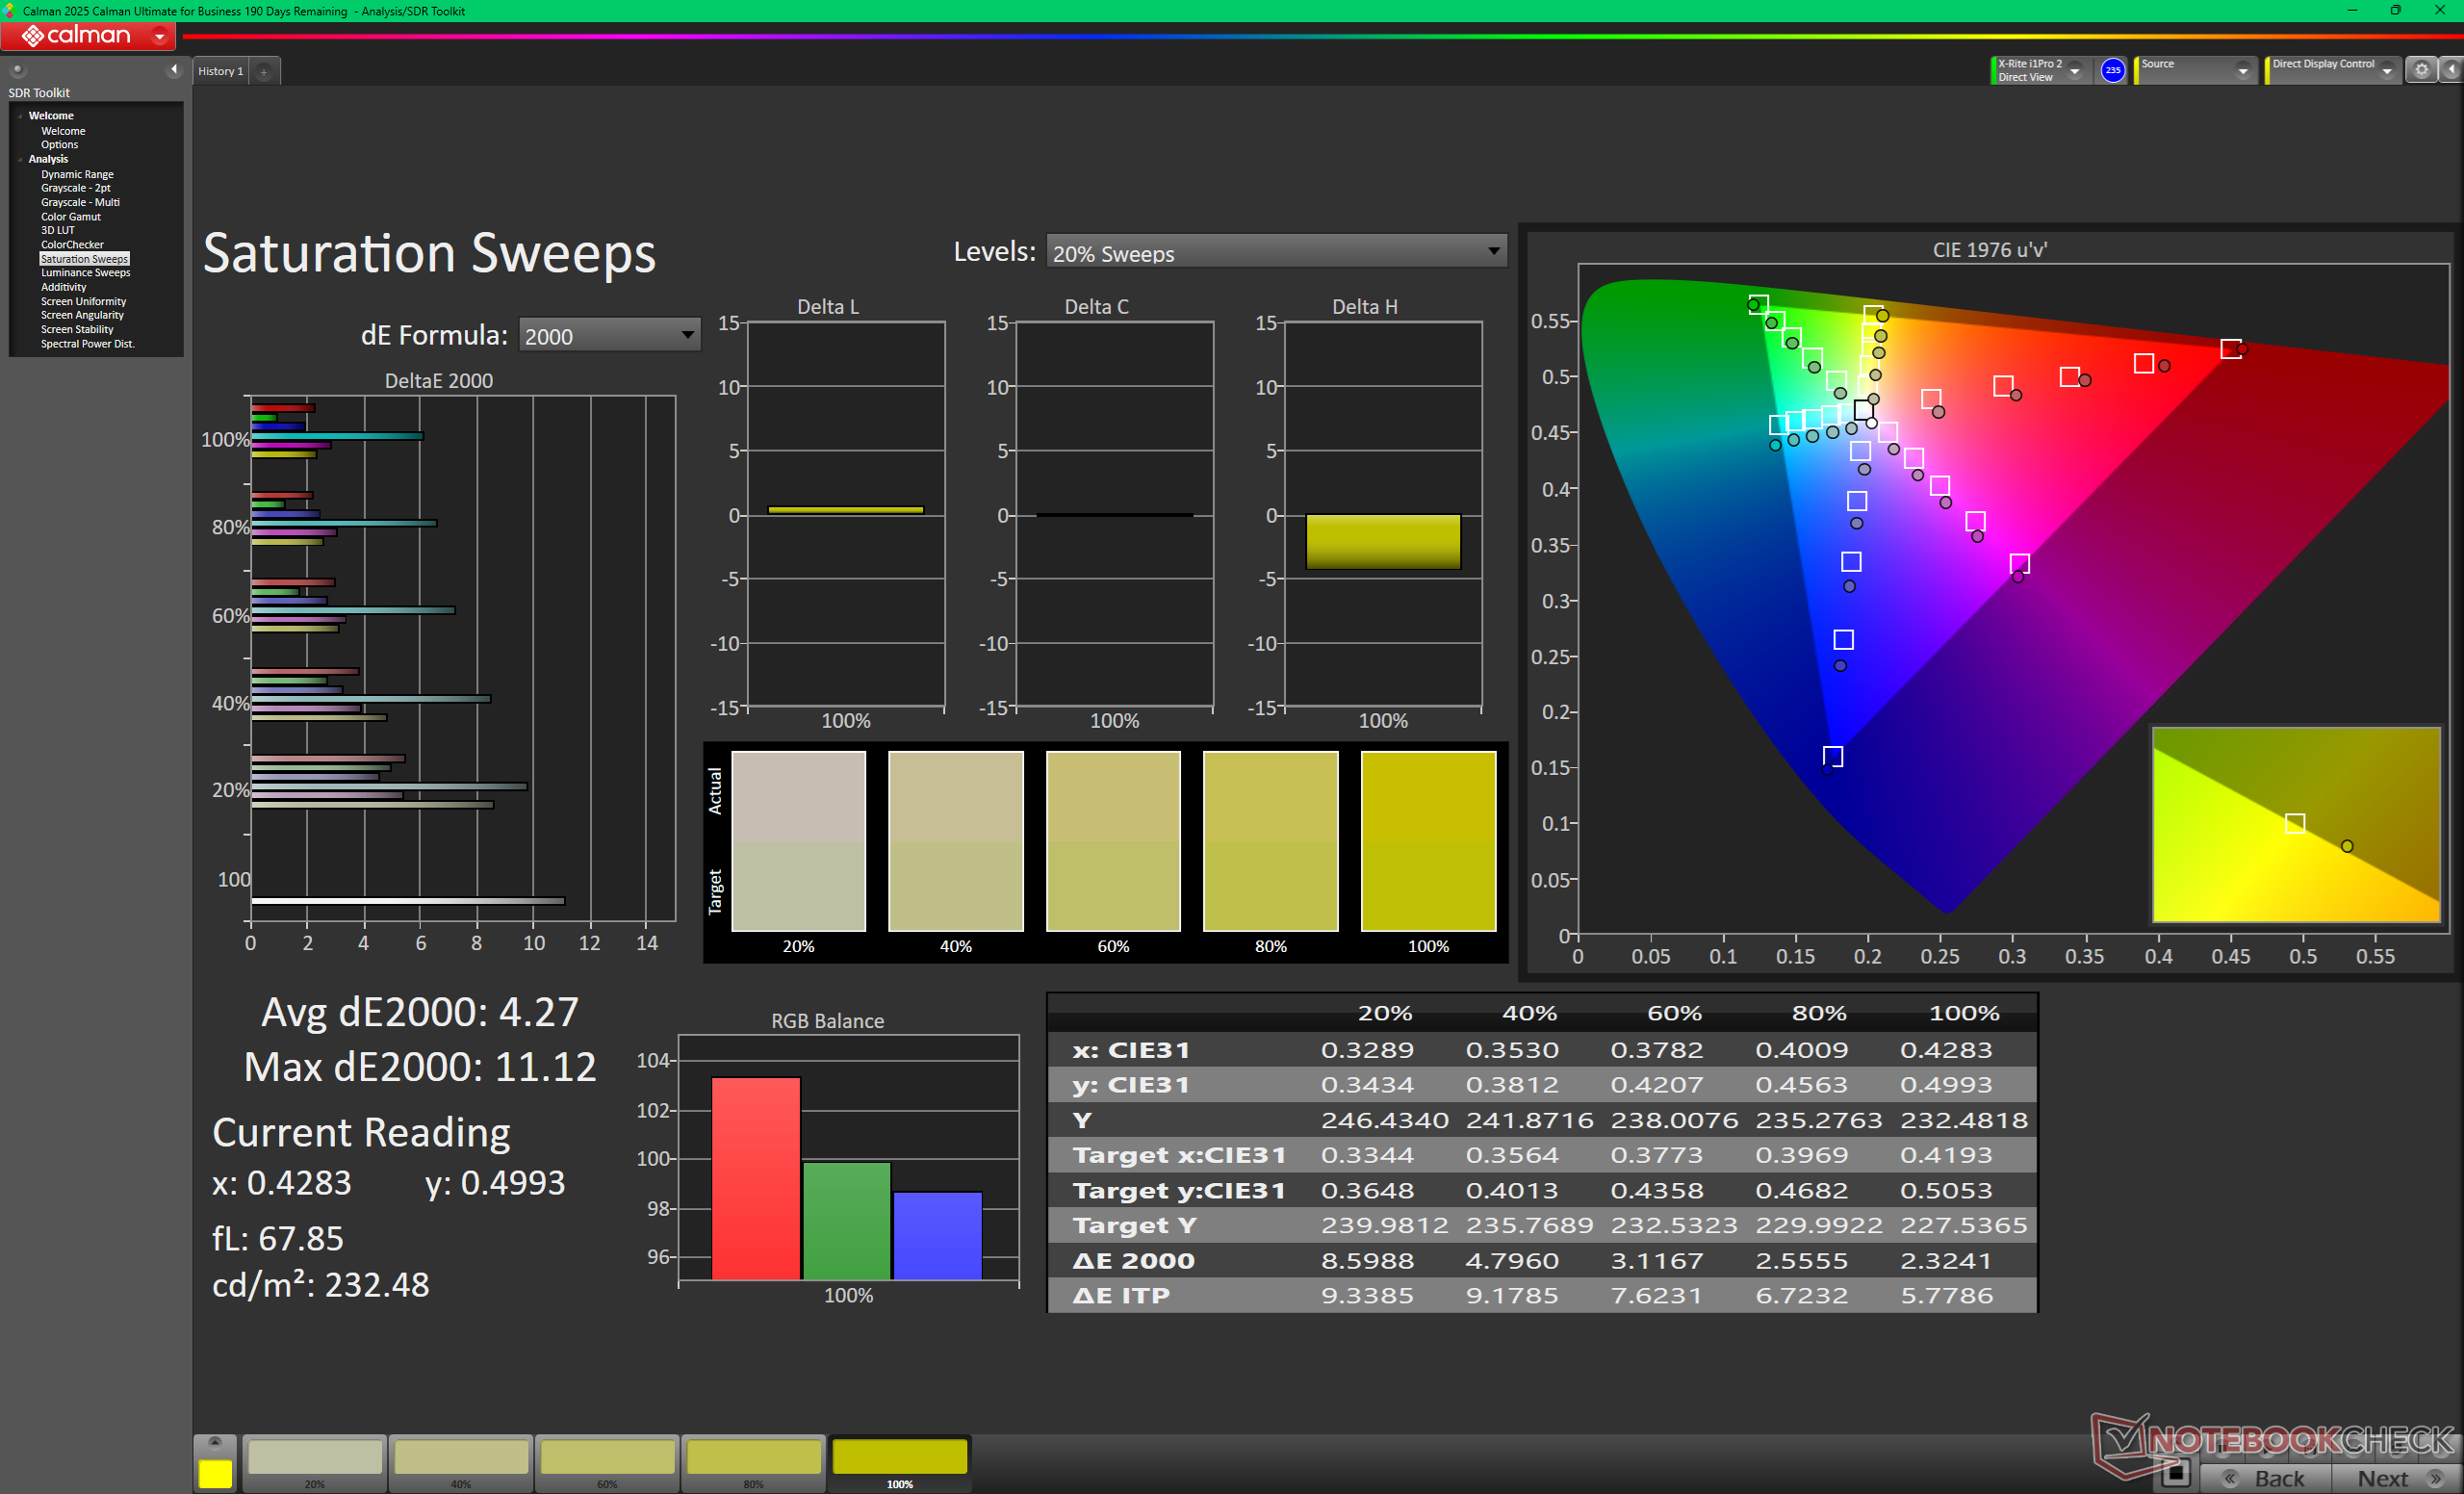
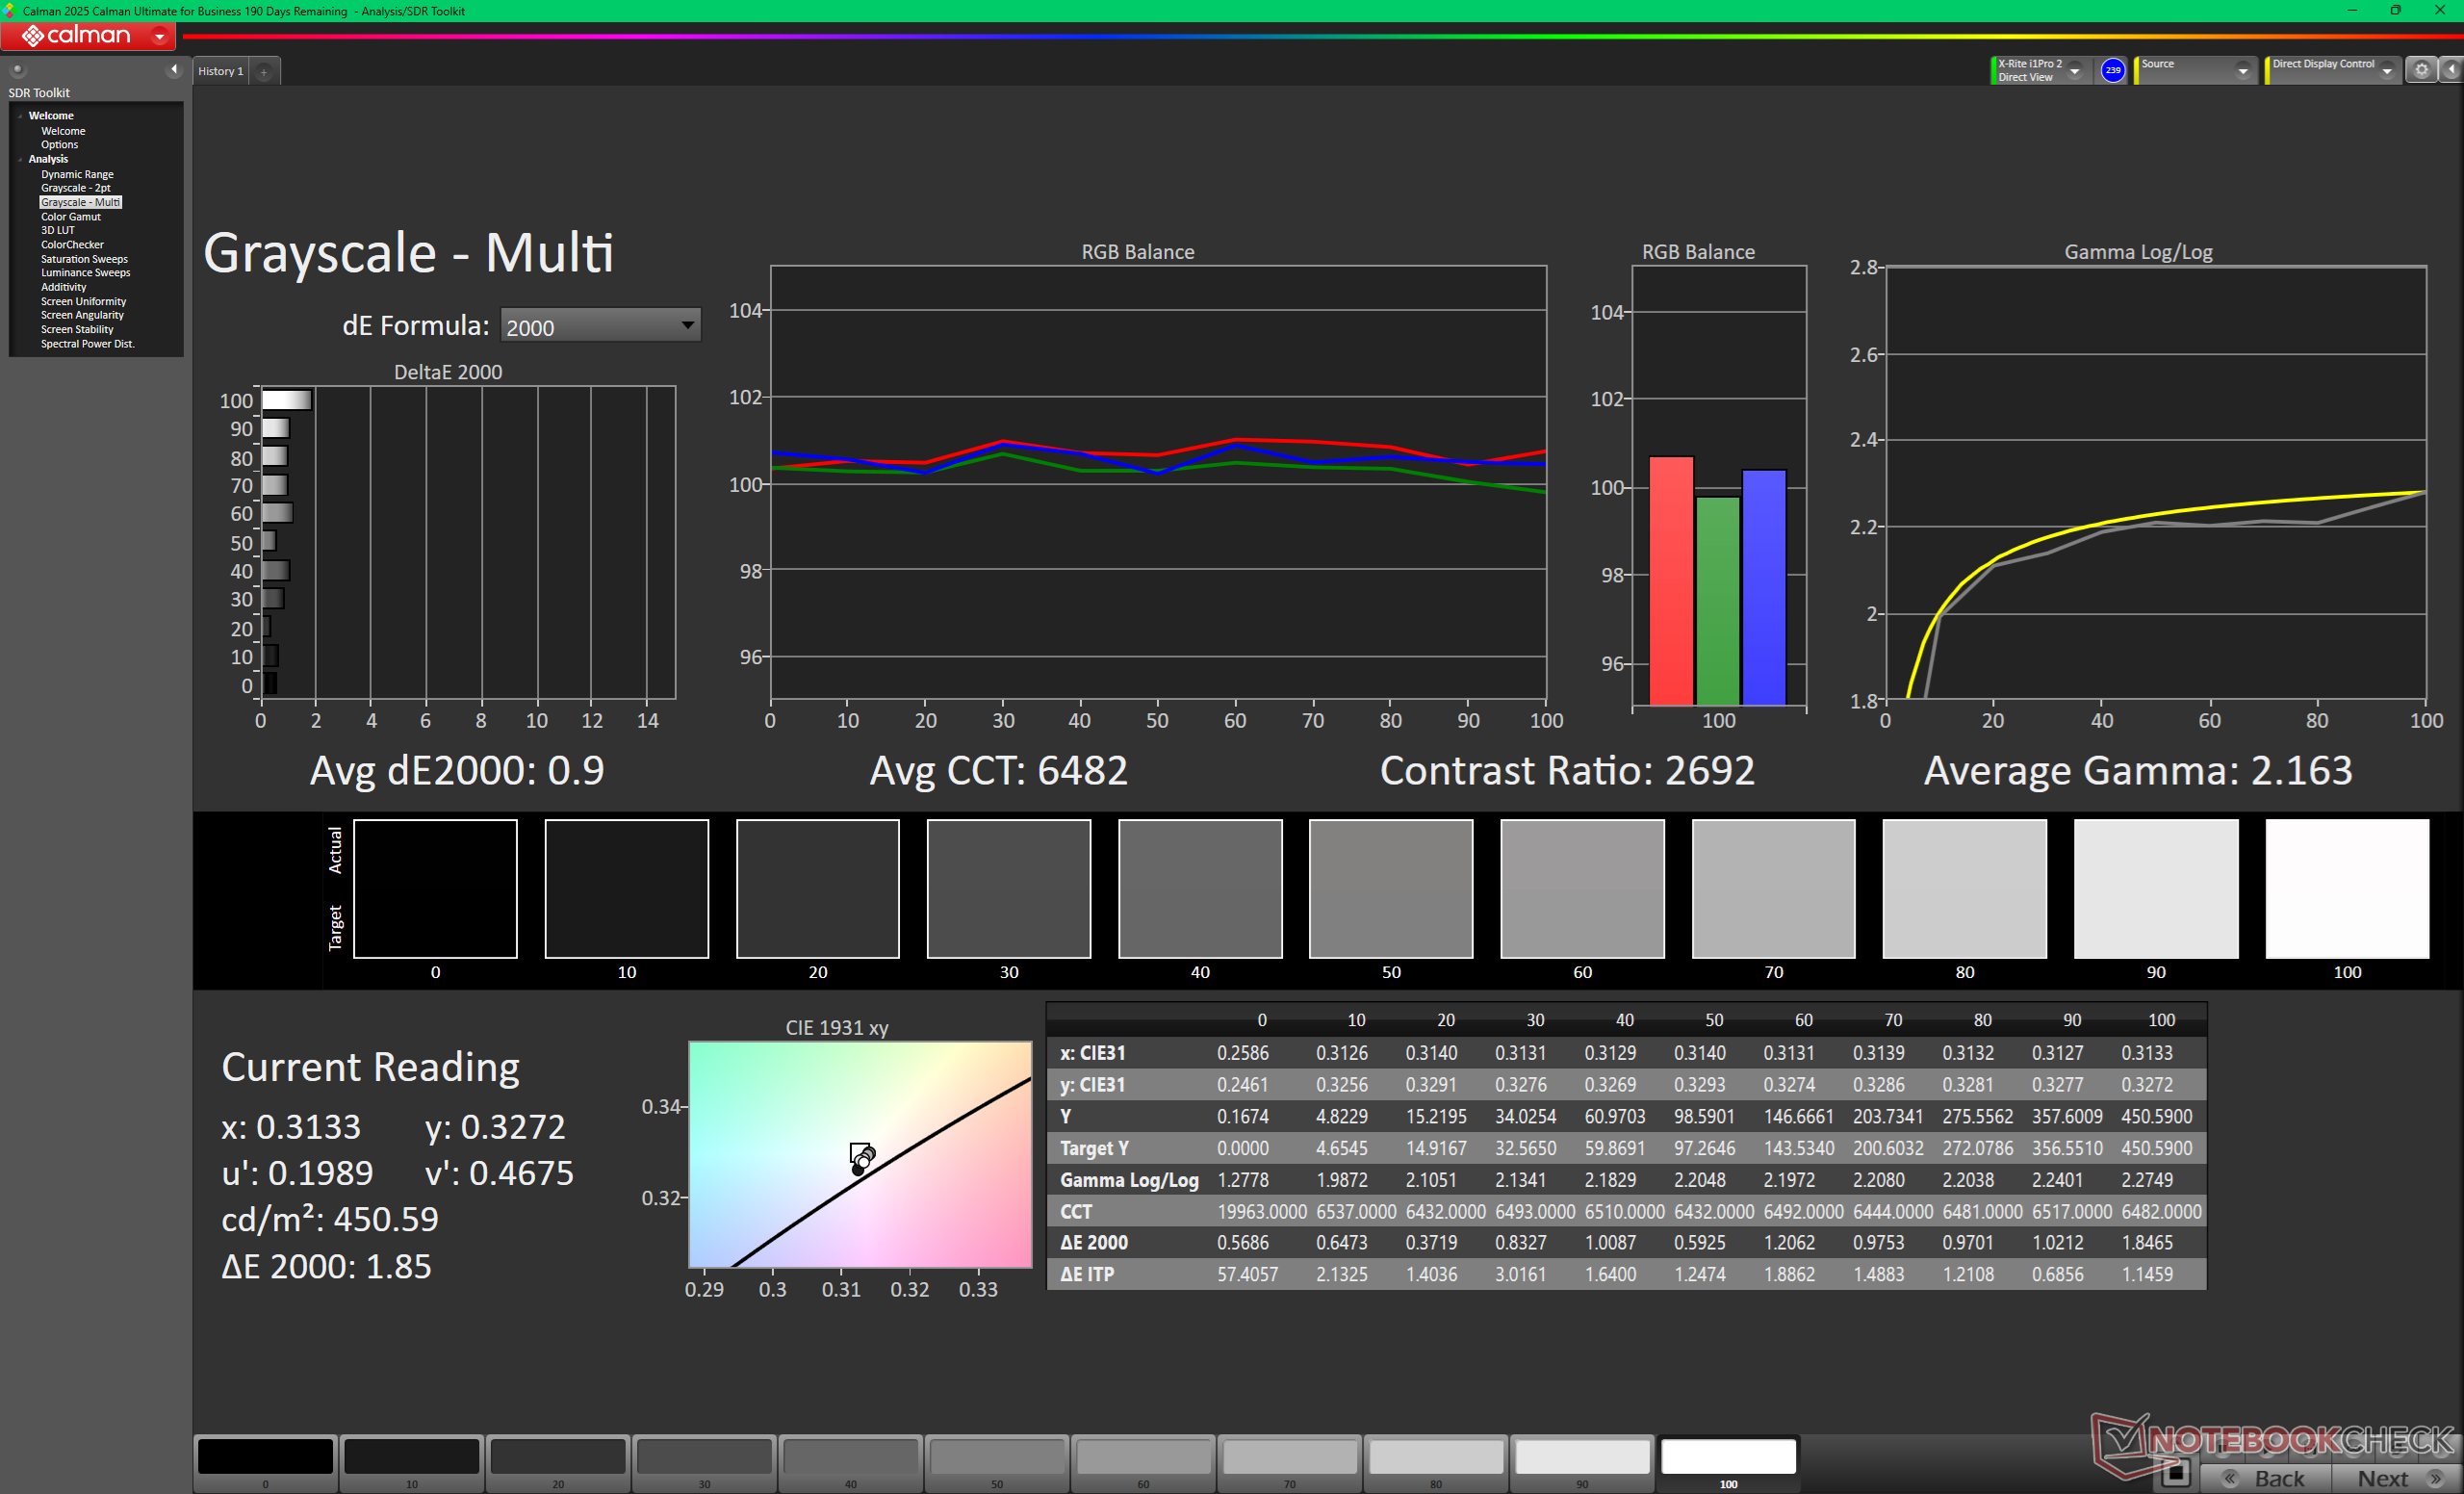
Scala di grigi prima della calibrazione (rispetto a sRGB)
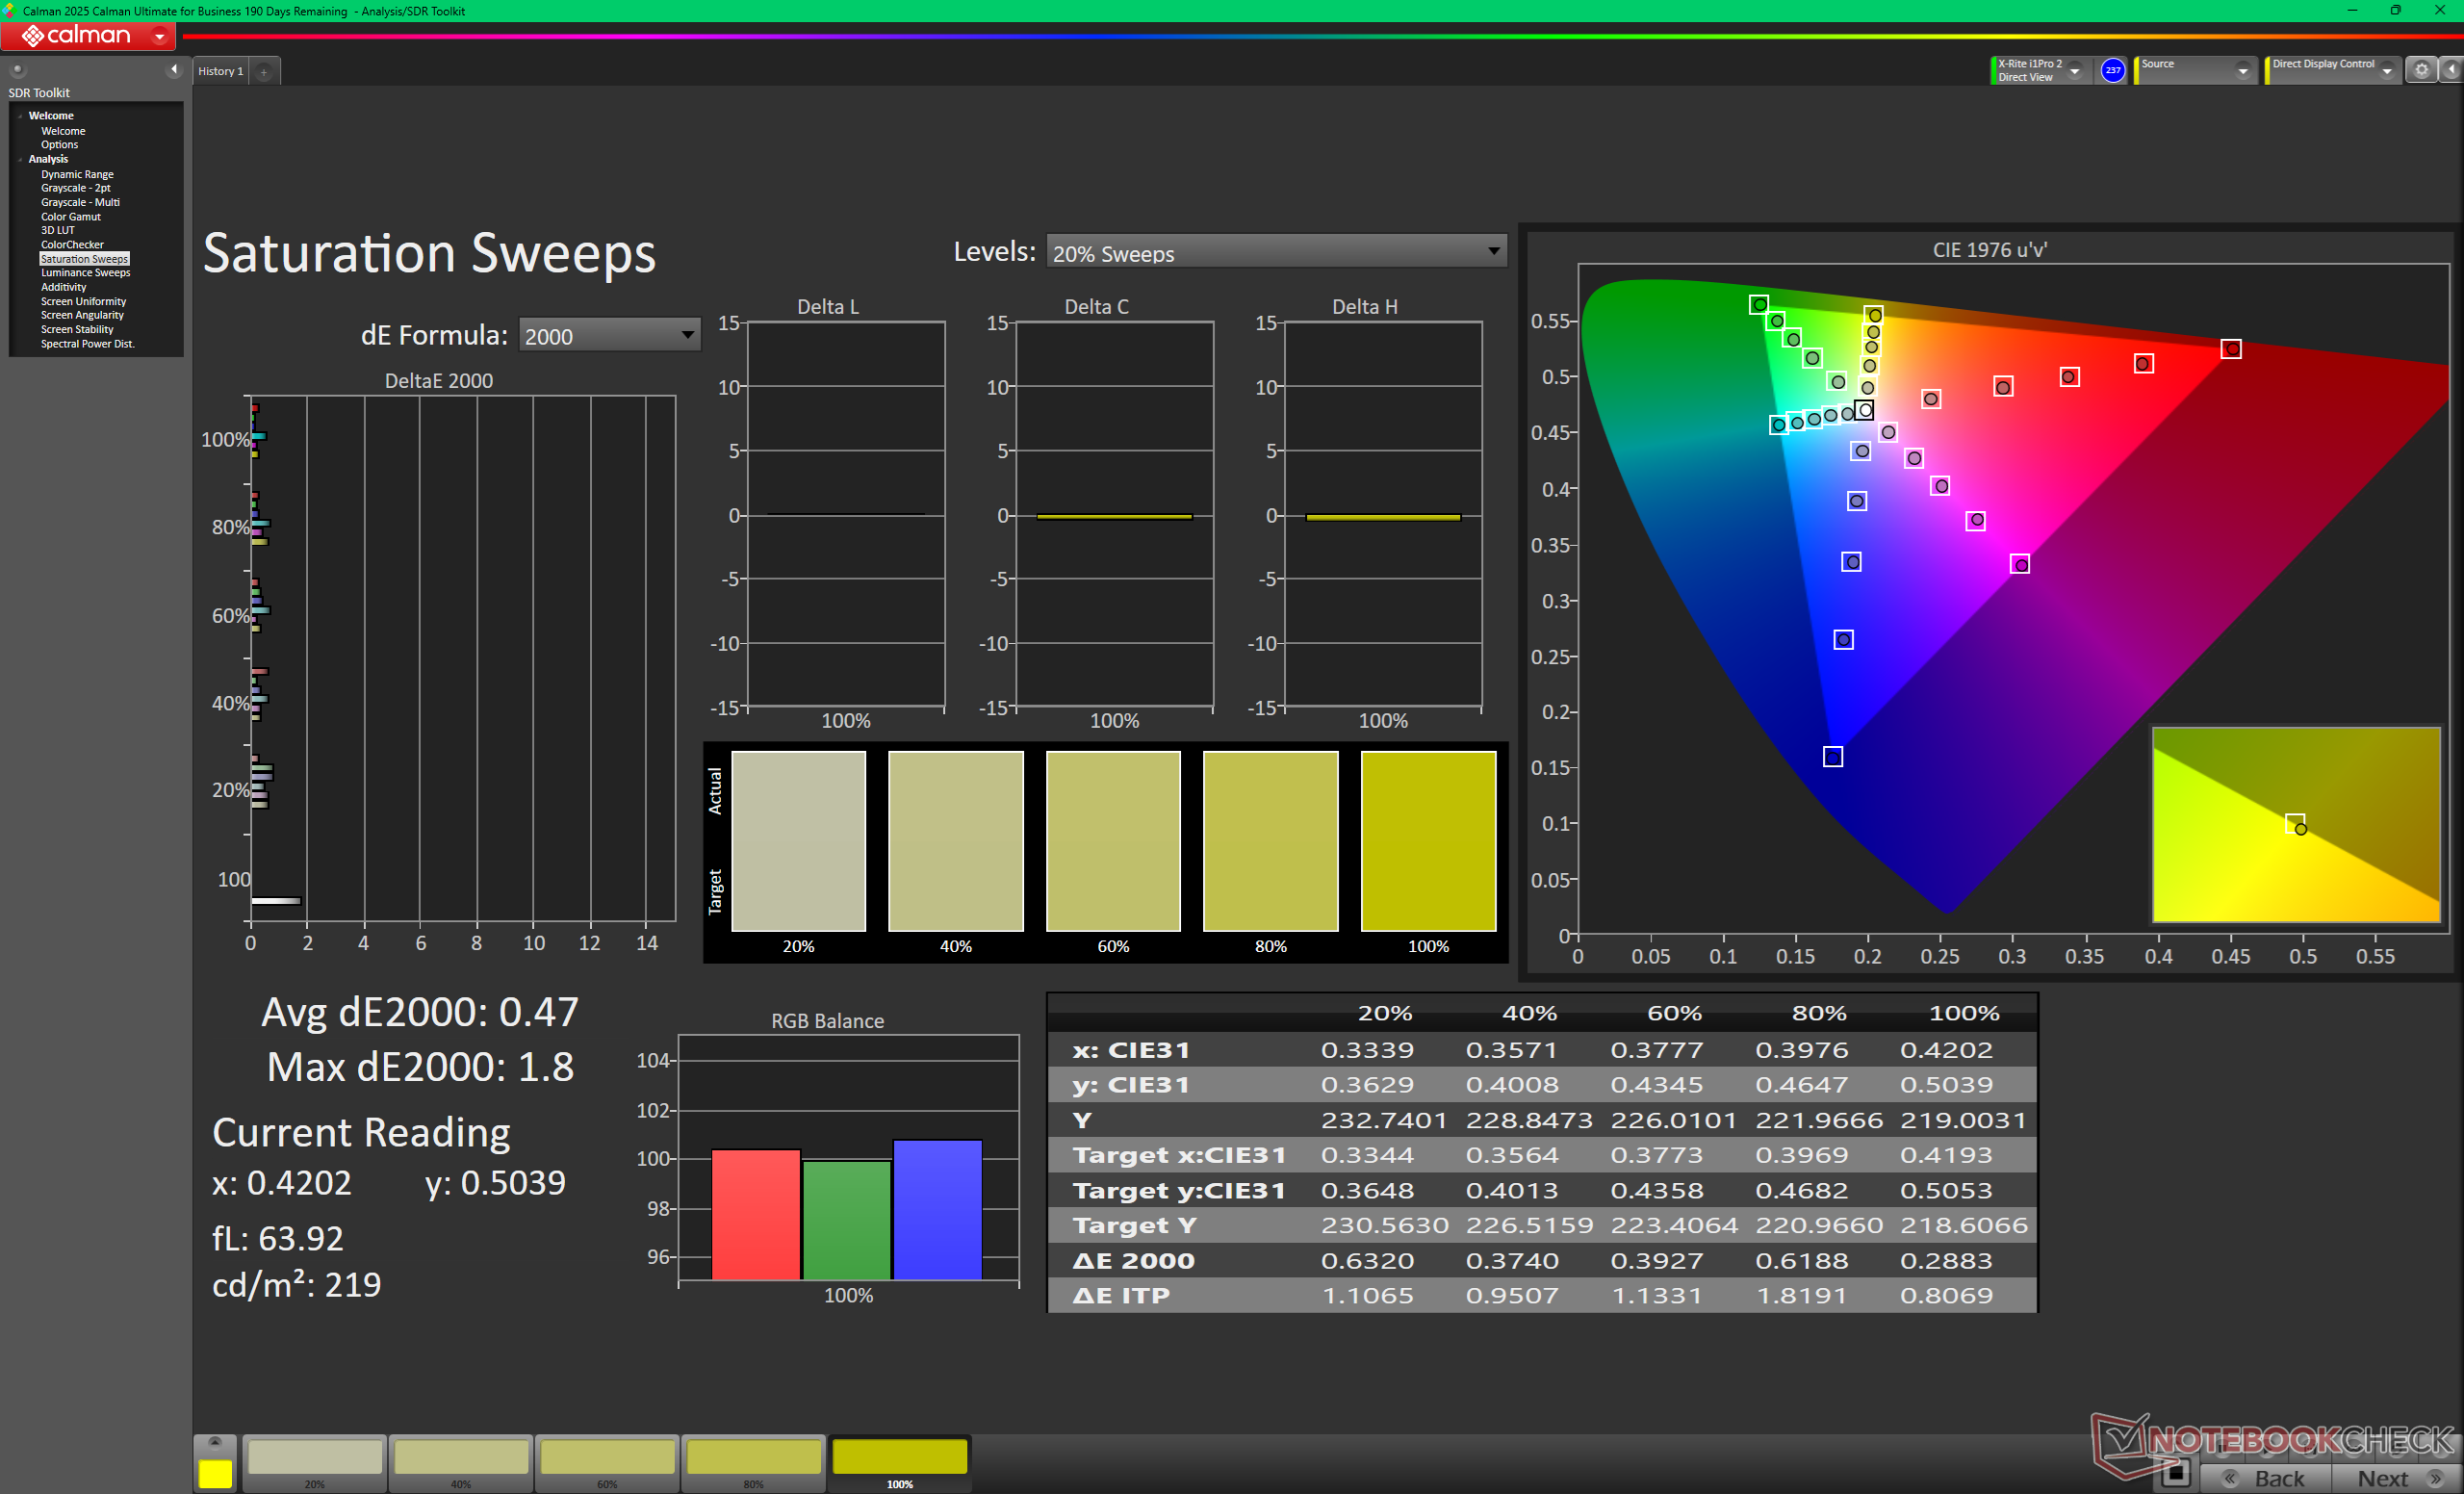
Scansioni di saturazione prima della calibrazione (rispetto allo sRGB)
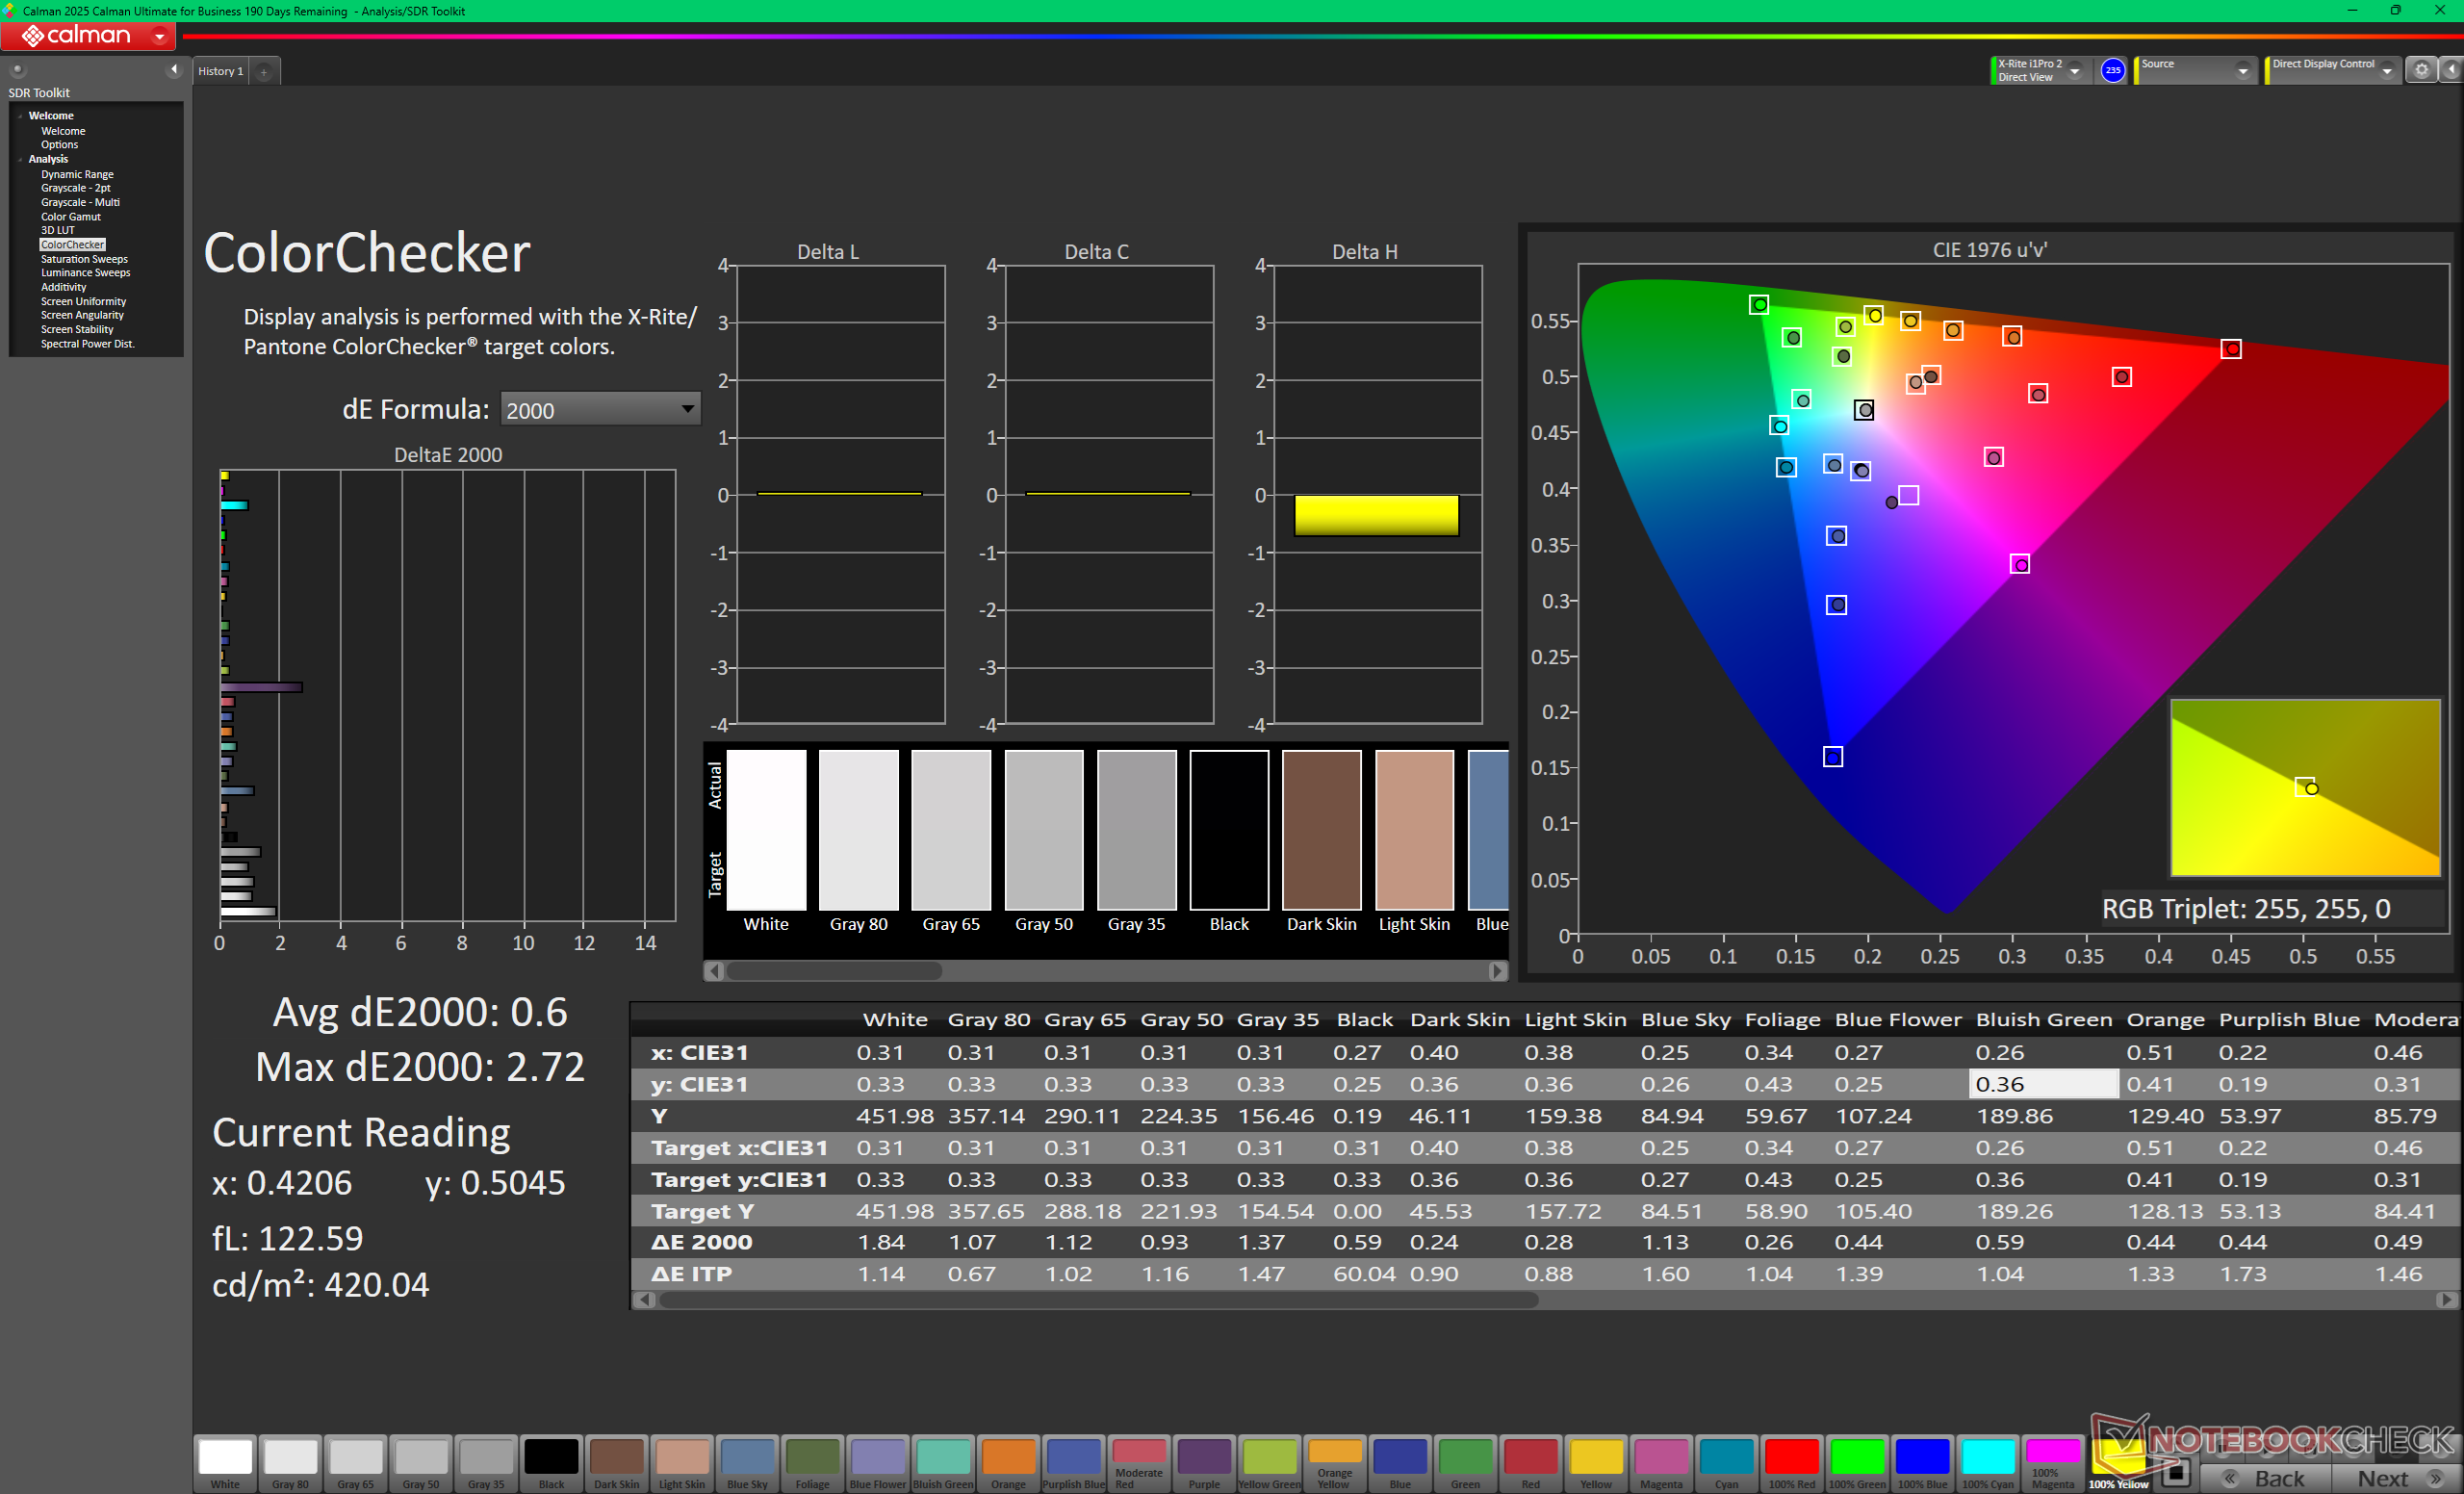
ColorChecker prima della calibrazione (rispetto a sRGB)
Scala di grigi dopo la calibrazione
Scansioni di saturazione dopo la calibrazione
ColorChecker dopo la calibrazione

Tempi di risposta del Display

I tempi di risposta del display mostrano quanto sia veloce lo schermo a cambaire da un colore all'altro. Tempi di risposta lenti possono creare sovrapposizioni negloi oggetti in movimento. Specialmente i giocatori patiti del 3D dovrebbero usare uno schermo con tempi di risposta bassi.
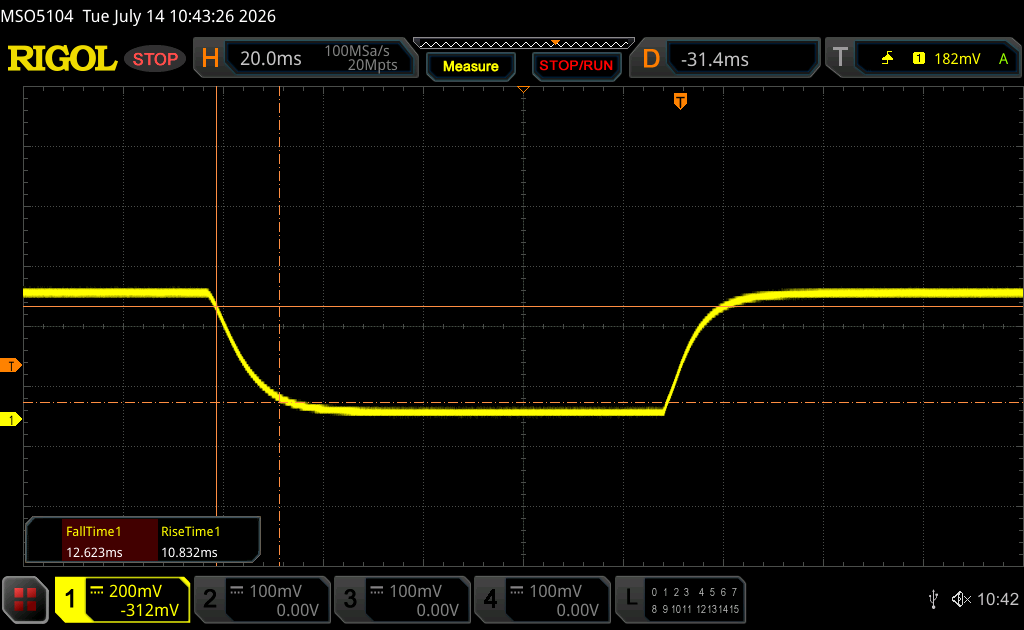
       Tempi di risposta dal Nero al Bianco
23.4 ms ... aumenta ↗ e diminuisce ↘ combinato↗ 10.8 ms Incremento
↘ 12.6 ms Calo
Lo schermo mostra buoni tempi di risposta durante i nostri tests, ma potrebbe essere troppo lento per i gamers competitivi.
In confronto, tutti i dispositivi di test variano da 0.1 (minimo) a 240 (massimo) ms. » 54 % di tutti i dispositivi è migliore.
Questo significa che i tempi di risposta rilevati sono peggiori rispetto alla media di tutti i dispositivi testati (19.8 ms).
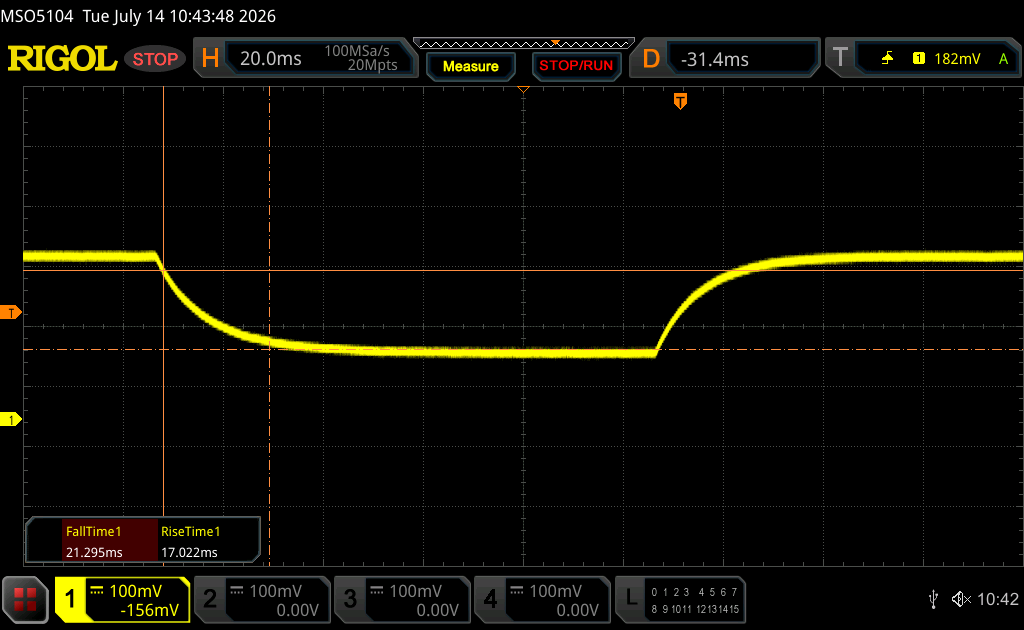
       Tempo di risposta dal 50% Grigio all'80% Grigio
38.3 ms ... aumenta ↗ e diminuisce ↘ combinato↗ 17 ms Incremento
↘ 21.3 ms Calo
Lo schermo mostra tempi di risposta lenti nei nostri tests e sarà insoddisfacente per i gamers.
In confronto, tutti i dispositivi di test variano da 0.165 (minimo) a 636 (massimo) ms. » 57 % di tutti i dispositivi è migliore.
Questo significa che i tempi di risposta rilevati sono peggiori rispetto alla media di tutti i dispositivi testati (31 ms).

Sfarfallio dello schermo / PWM (Pulse-Width Modulation)

Per ridurre la luminosità dello schermo, alcuni portatili accendono e spengono la retroilluminazione in rapida successione - un metodo chiamato Pulse Width Modulation (PWM). Questa frequenza di ciclo a livello ideale non dovrebbe essere percepibile dall'occhi umano. Se tale frequenza è troppo bassa, gli utenti con occhi sensibili potrebbero stancarsi gli occhi o avere mal di testa o anche notare uno sfarfallio.
flickering dello schermo / PWM non rilevato

In confronto: 52 % di tutti i dispositivi testati non utilizza PWM per ridurre la luminosita' del display. Se è rilevato PWM, una media di 7757 (minimo: 5 - massimo: 343500) Hz è stata rilevata.

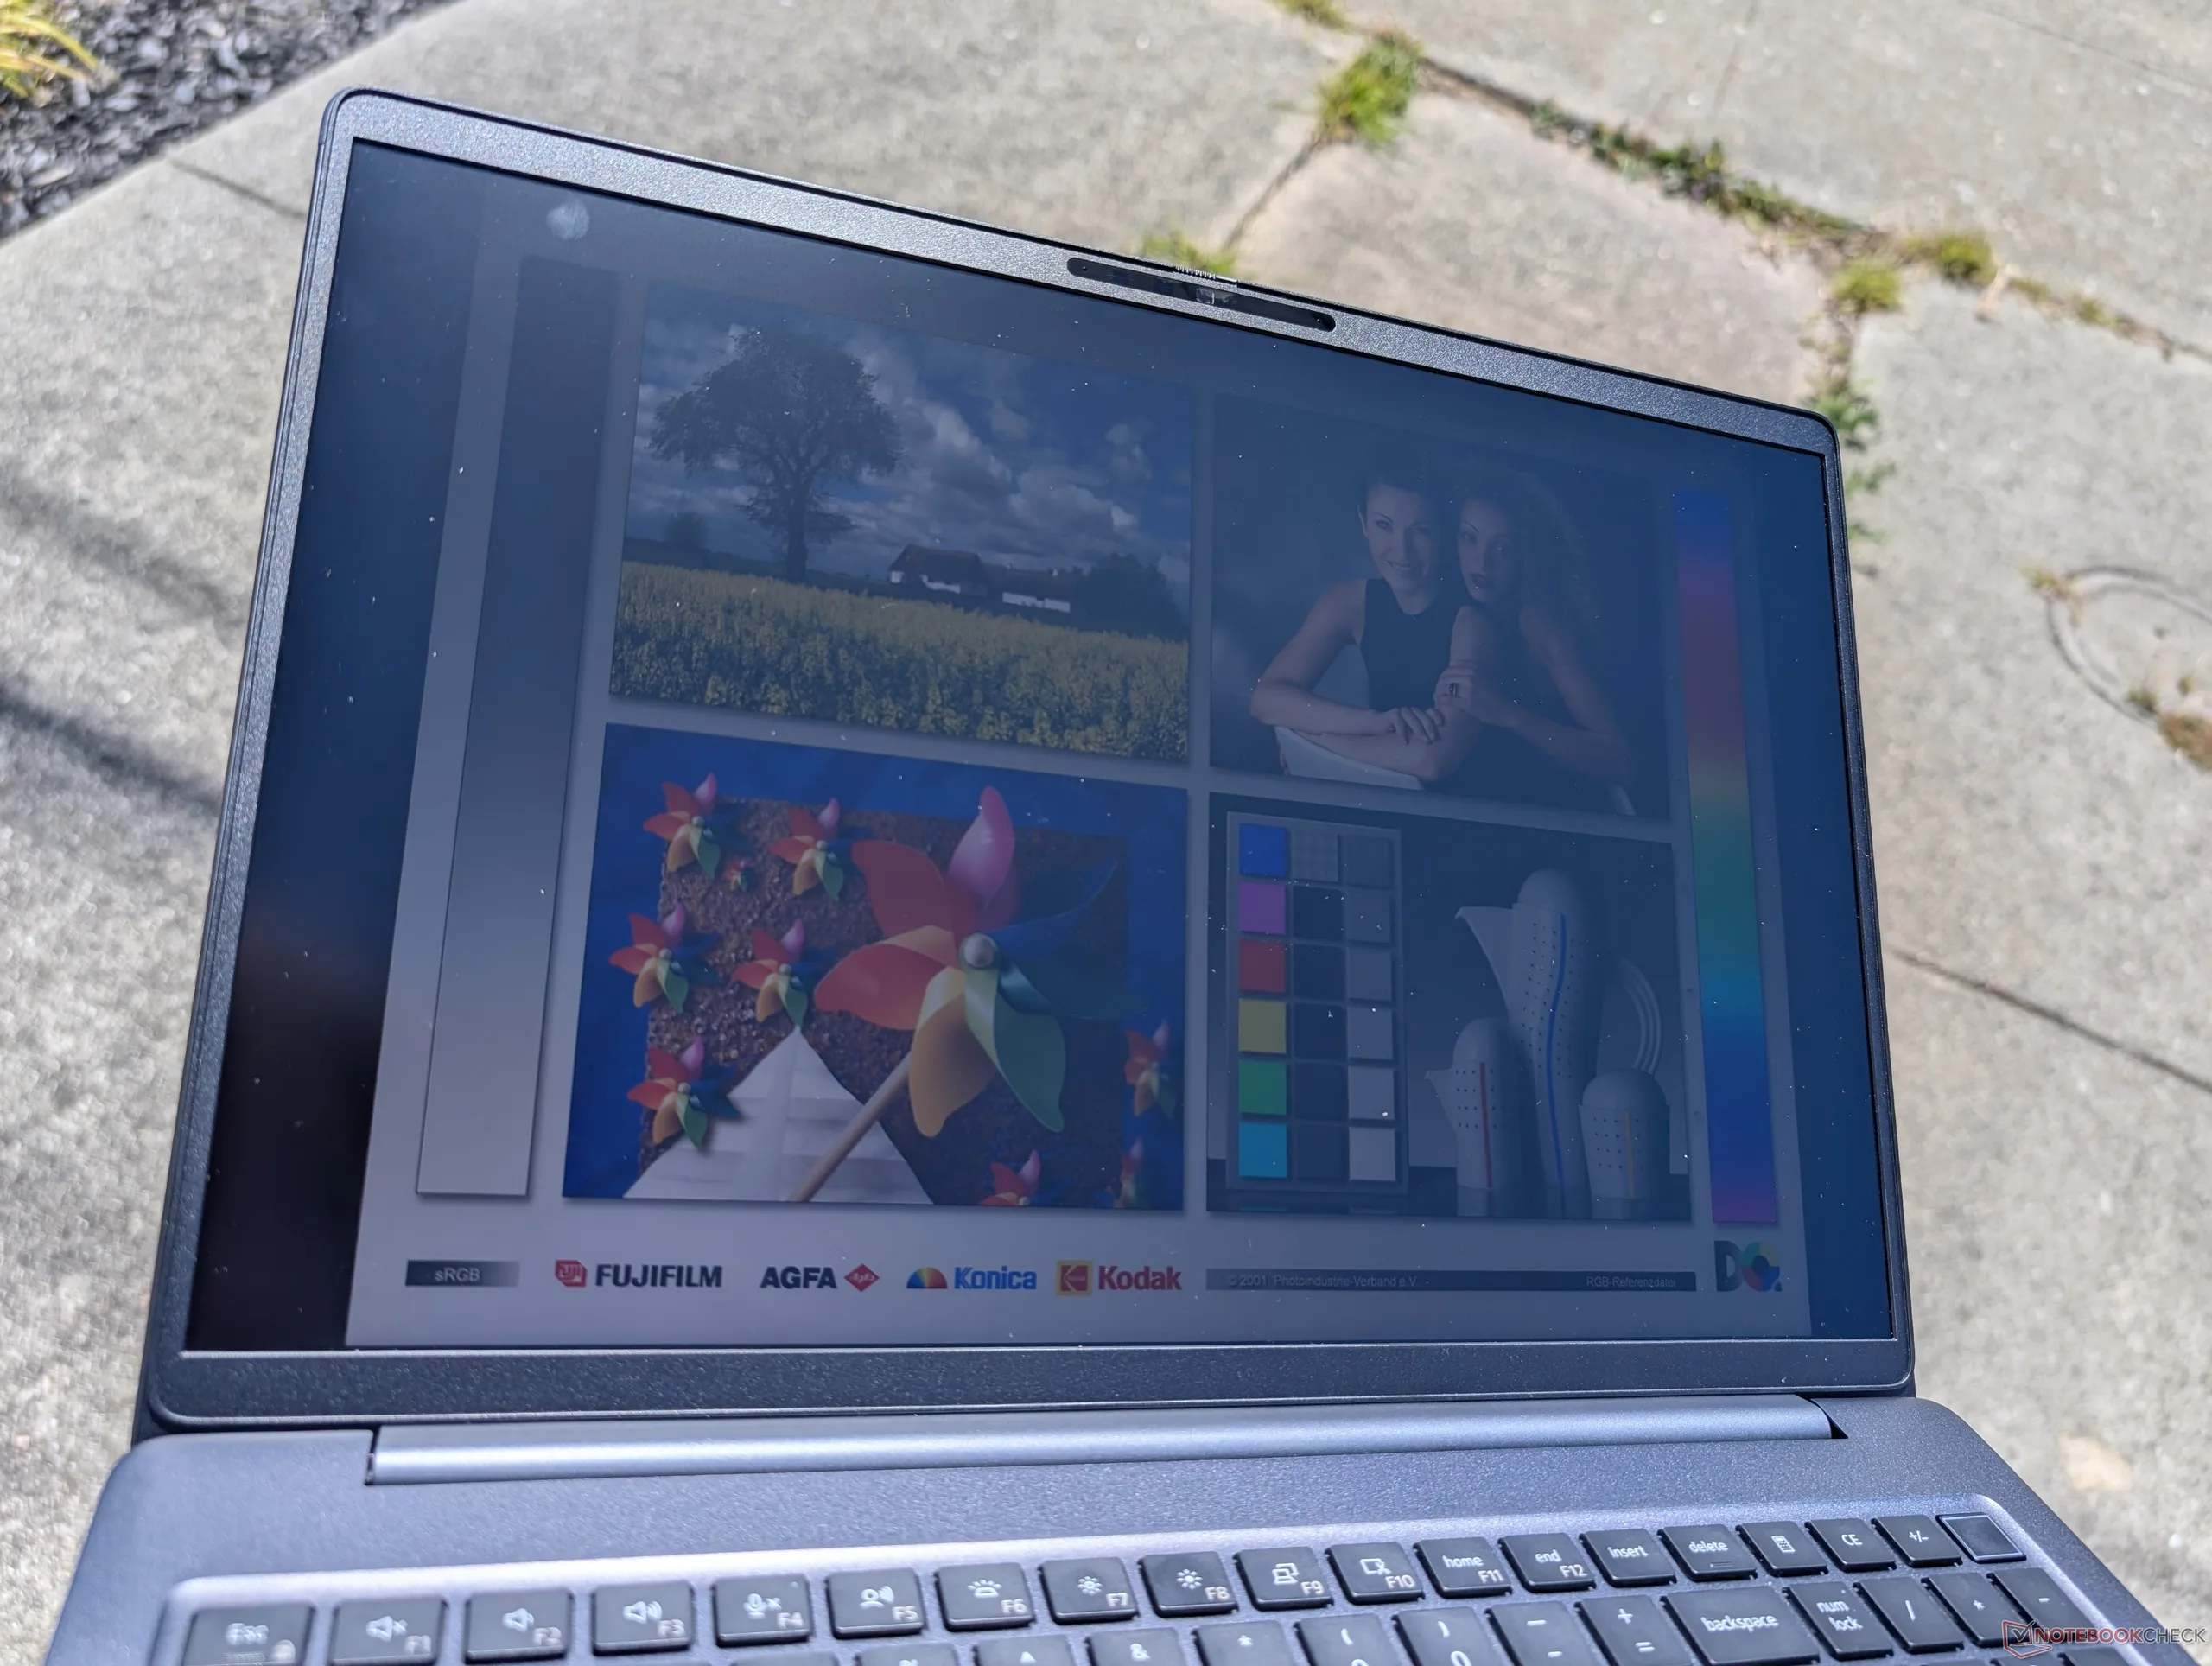
All’aperto, alla luce del sole
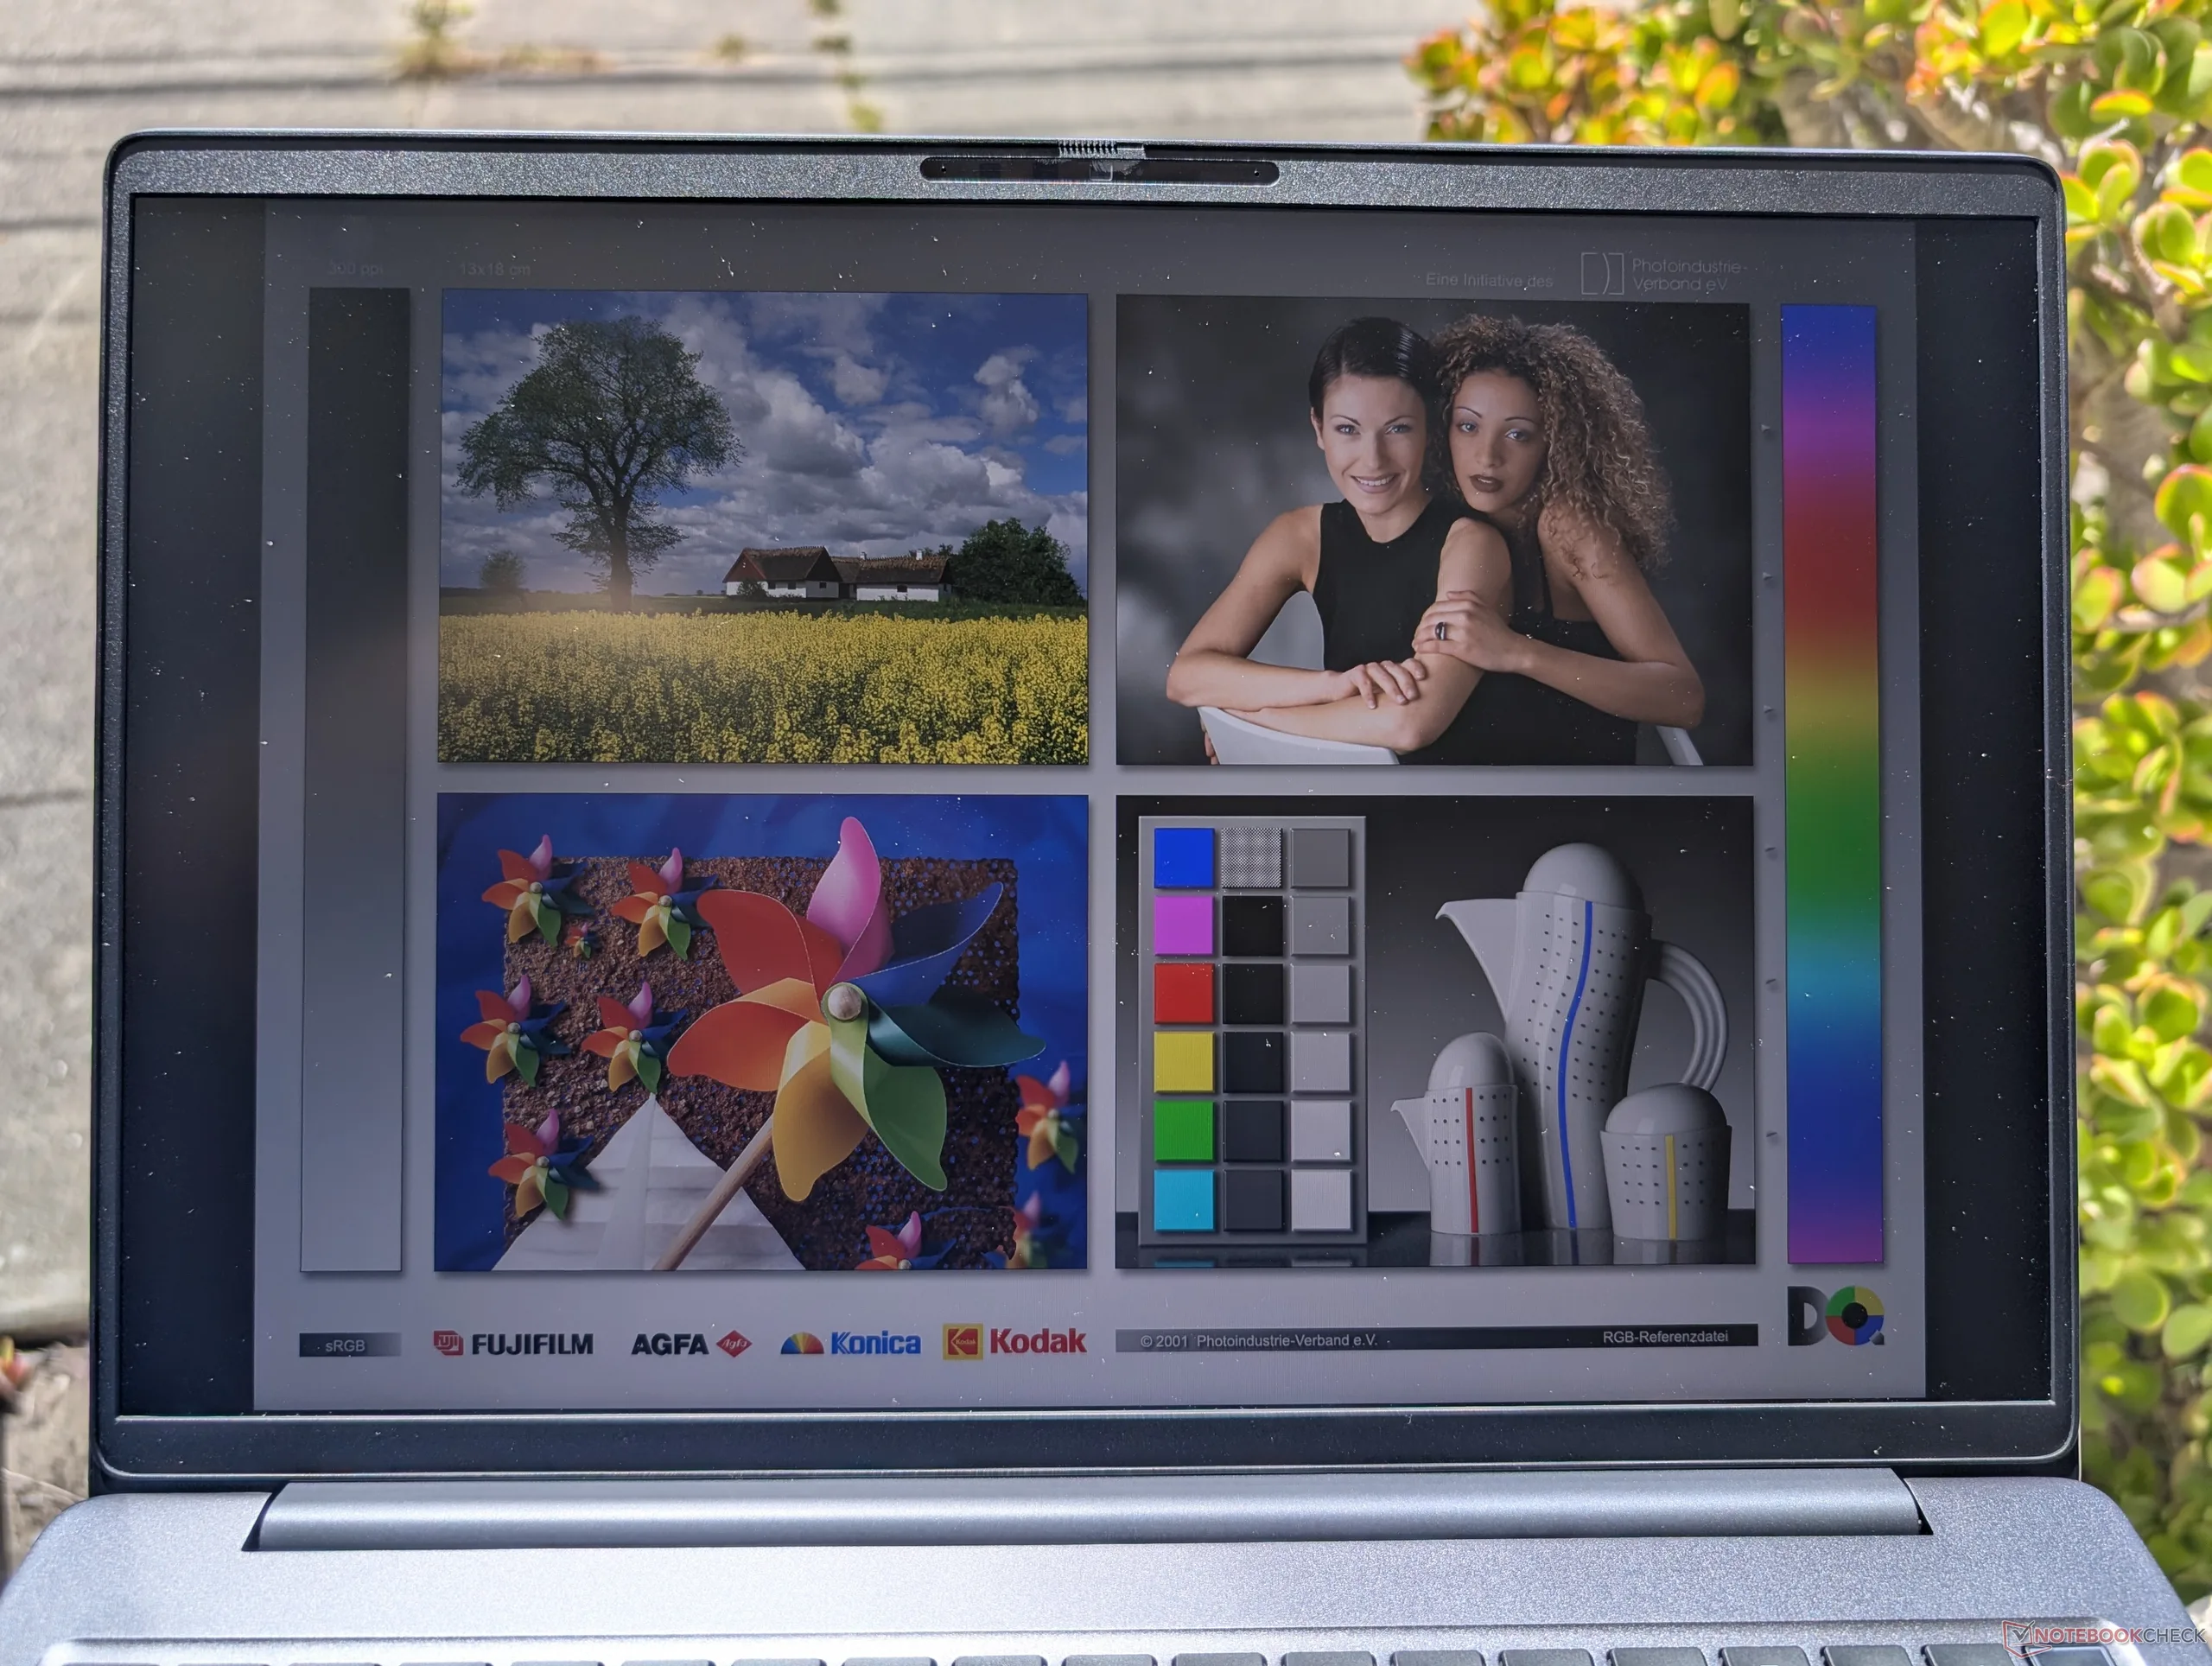
All’aperto all’ombra
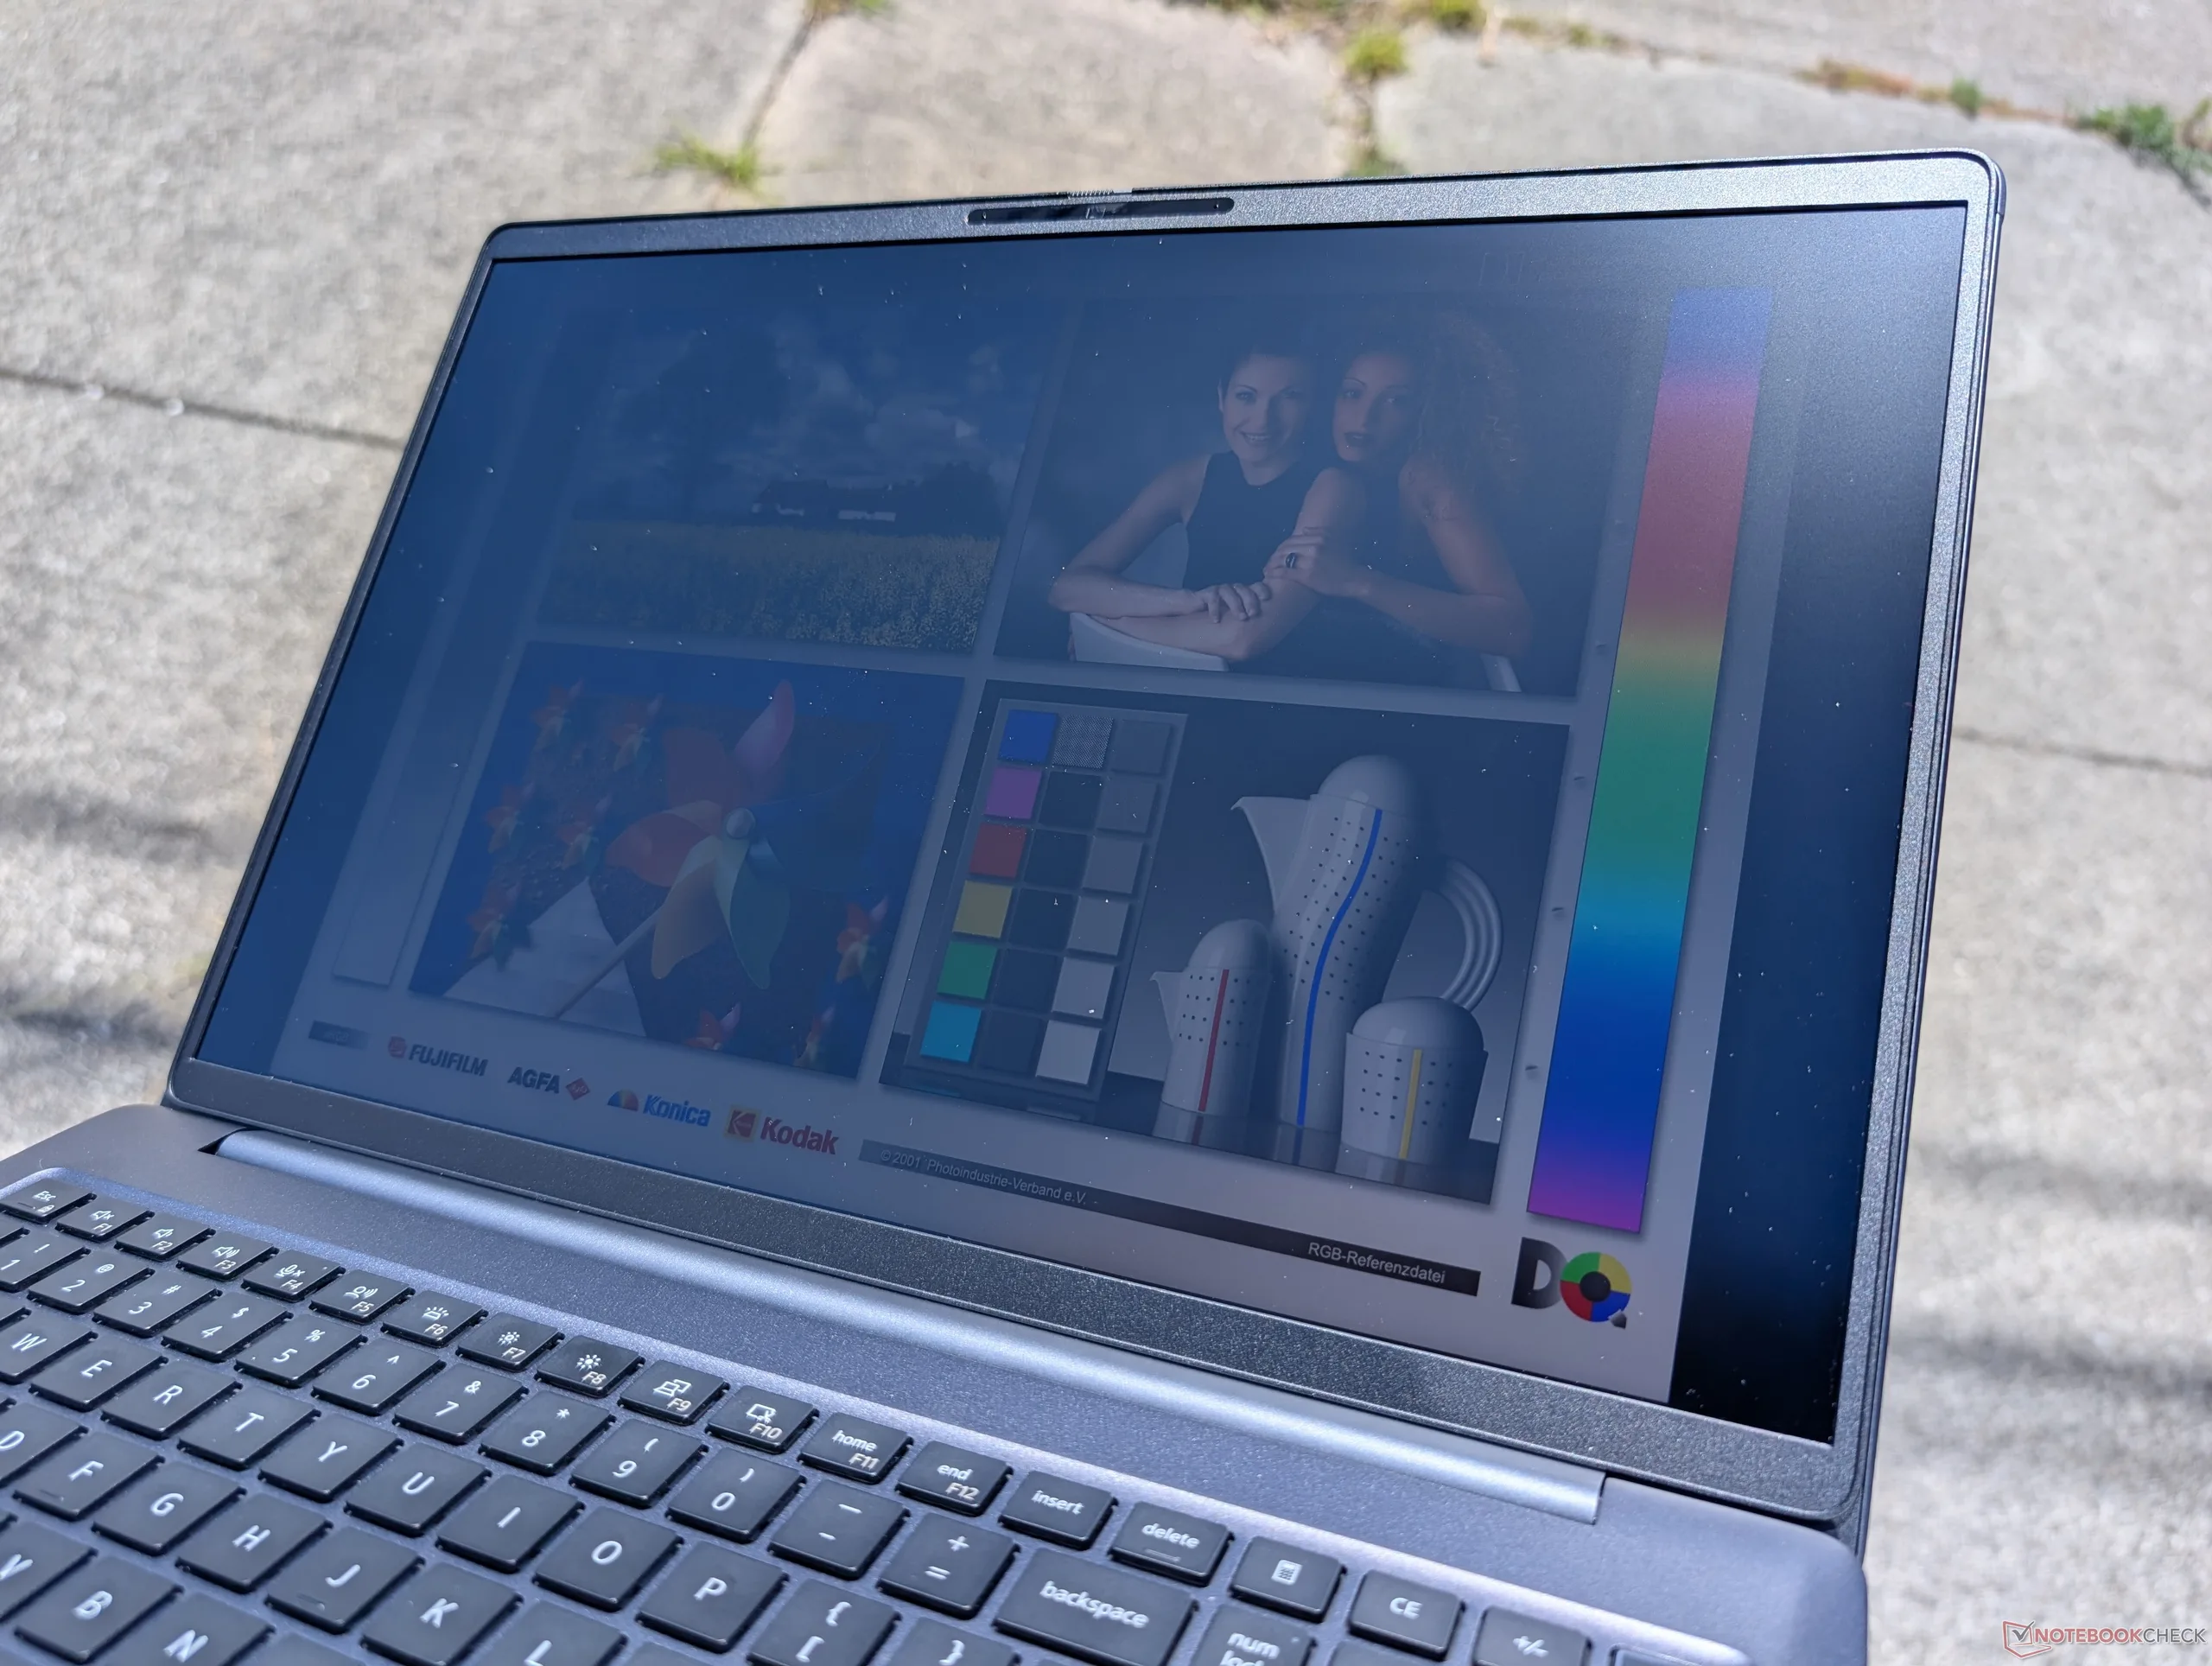
All’aperto, alla luce del sole
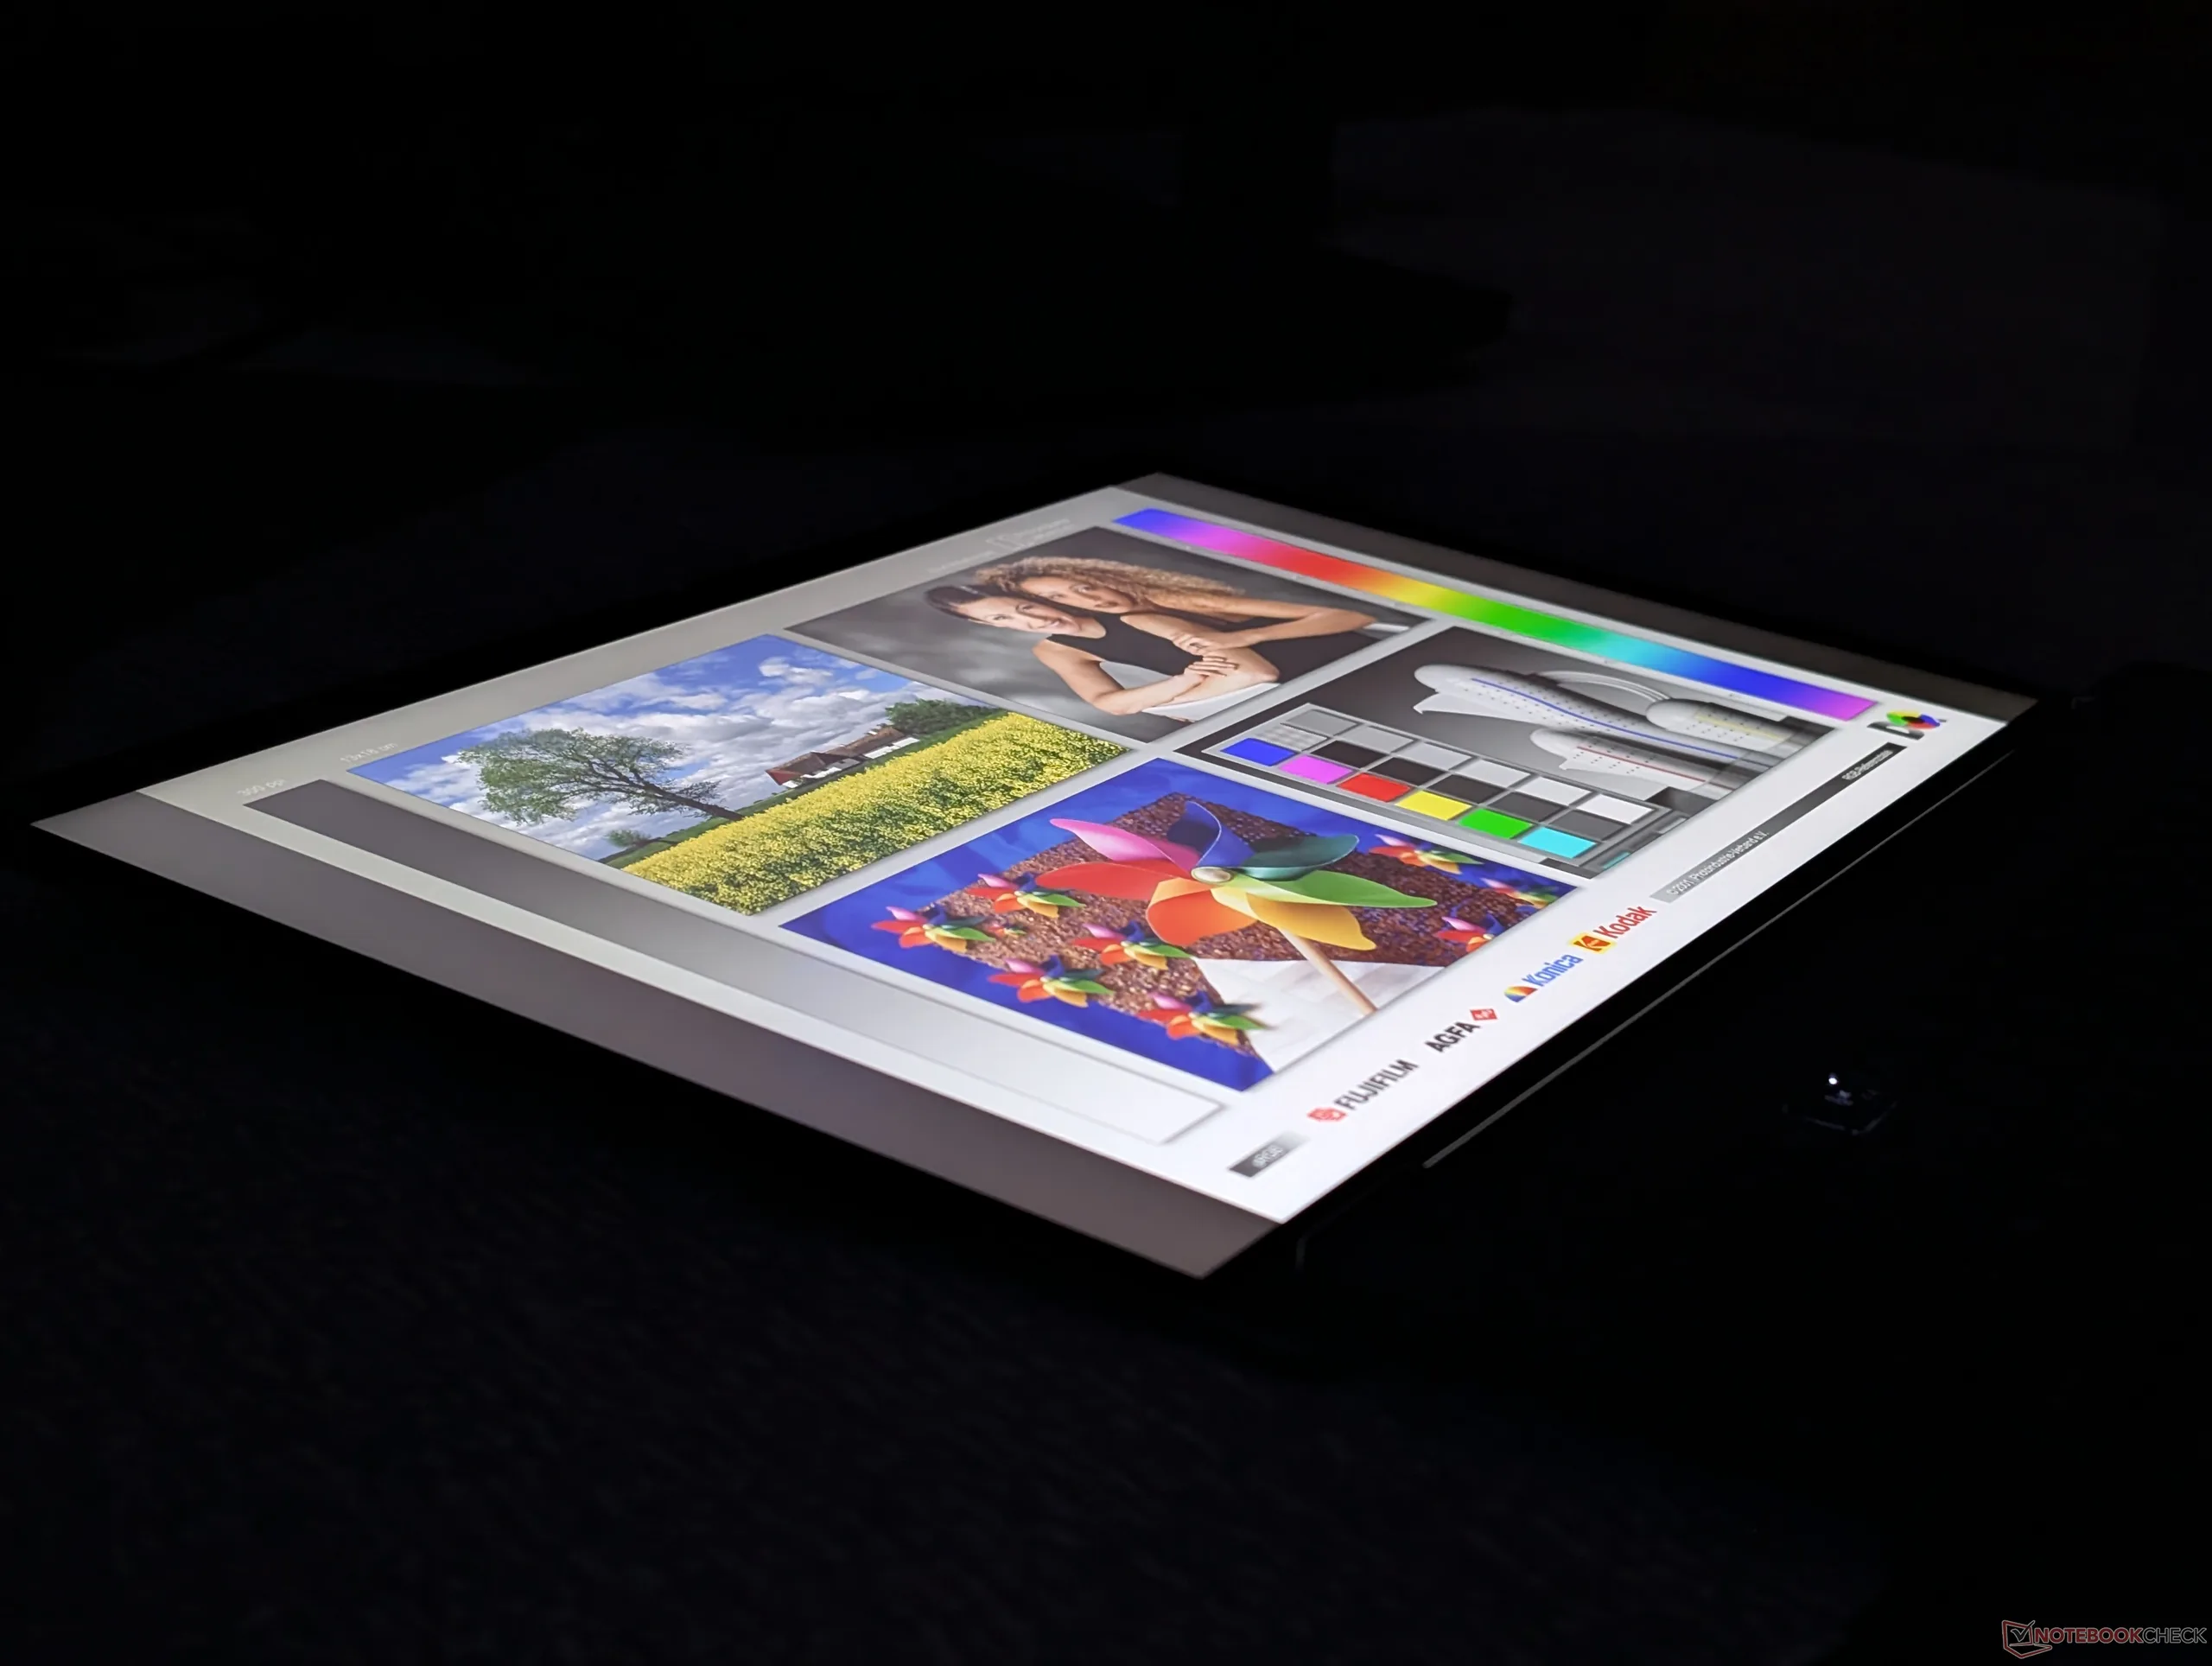
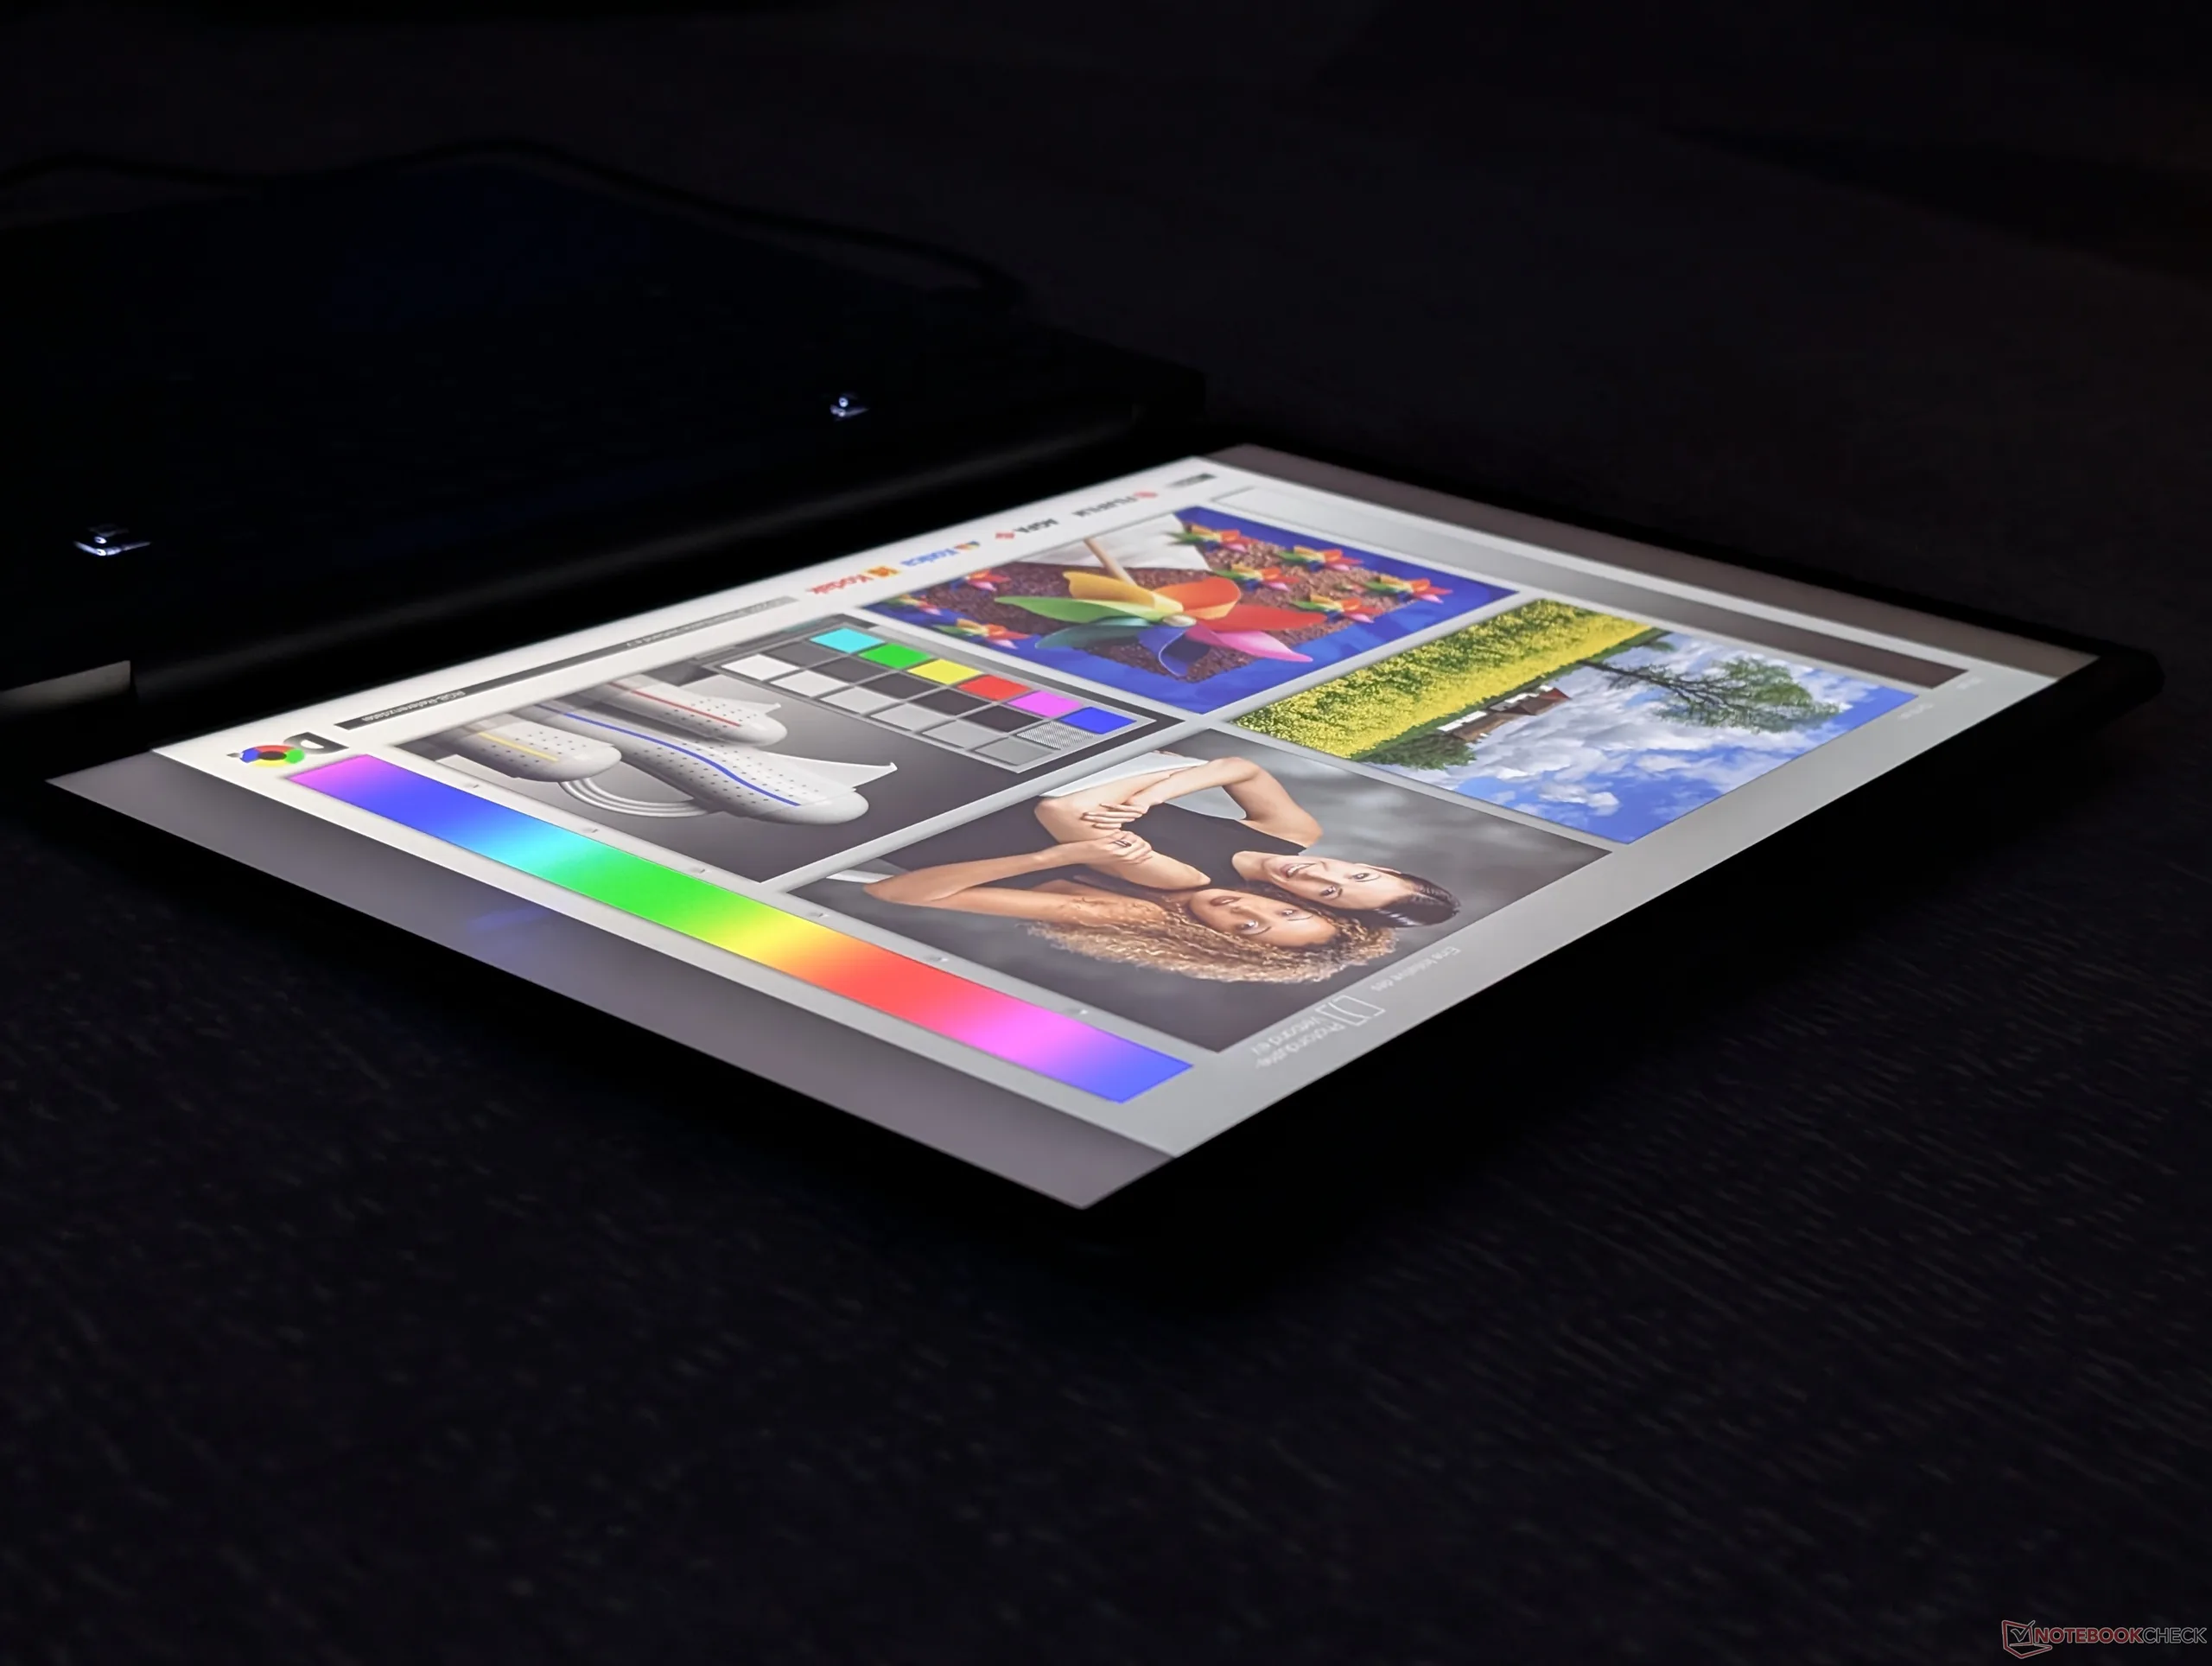
Ampi angoli di visione IPS

Prestazioni

Condizioni di prova

Prima di eseguire i benchmark riportati di seguito, abbiamo impostato Dell Optimizer in modalità Prestazioni.

Prestazioni del processore

Cinebench R15 Multi Loop

060120180240300360420480540600660720780840900960102010801140120012601320138014401500156016201680174018001860192019802040210021602220228023402400246025202580264027002760282028802940Tooltip
Dell Pro 5 16 P516265 AMD Ryzen AI 9 HX PRO 470: Ø2898 (2832.46-2983.29) Points
Dell XPS 16 Core Ultra X7 358H Intel Core Ultra X7 358H: Ø2543 (2491.75-2985.52) Points
Lenovo ThinkPad T16 Gen 5 22AN001WGE AMD Ryzen 5 PRO 215: Ø1584 (1576.79-1603.85) Points
MSI Venture 16 AI A2HMTG Intel Core Ultra 7 255H: Ø2596 (2544.21-2610.8) Points
Asus ExpertBook B5 B5605CCA Intel Core Ultra 5 225H: Ø2342 (2293.31-2626.4) Points
HP EliteBook 8 G1a 16 AI AMD Ryzen AI 7 PRO 350: Ø2376 (2309.87-2407.9) Points
CPU Performance rating: Percent
Cinebench R23: Multi Core | Single Core
Cinebench R20: CPU (Multi Core) | CPU (Single Core)
Cinebench R15: CPU Multi 64Bit | CPU Single 64Bit
Blender: v2.79 BMW27 CPU
7-Zip 18.03: 7z b 4 | 7z b 4 -mmt1
Geekbench 6.7: Multi-Core | Single-Core
Geekbench 5.5: Multi-Core | Single-Core
HWBOT x265 Benchmark v2.2: 4k Preset
LibreOffice : 20 Documents To PDF
R Benchmark 2.5: Overall mean
CPU Performance rating
Lenovo ThinkPad P16 Gen 3
Intel Core Ultra 9 285HX
89.6 pt
Lenovo Yoga Pro 9 16IAH10 RTX 5050
Intel Core Ultra 9 285H
74.2 pt
Lenovo Pro 9 16IPH11
Intel Core Ultra 9 386H
74 pt
Lenovo ThinkPad P1 Gen 8
Intel Core Ultra 7 255H
71.9 pt
Dell Pro 5 16 P516265
AMD Ryzen AI 9 HX PRO 470
71.3 pt
Media AMD Ryzen AI 9 HX PRO 470
 
71.3 pt
Dell XPS 16 Core Ultra X7 358H
Intel Core Ultra X7 358H
70.3 pt
MSI Venture 16 AI A2HMTG
Intel Core Ultra 7 255H
66.4 pt
Asus ExpertBook B5 B5605CCA
Intel Core Ultra 5 225H
62.3 pt
HP EliteBook 8 G1a 16 AI
AMD Ryzen AI 7 PRO 350
60.7 pt
Lenovo ThinkPad L16 Gen 2 21SC0029GE
AMD Ryzen 5 PRO 215
50.8 pt
Lenovo ThinkPad T16 Gen 5 22AN001WGE
AMD Ryzen 5 PRO 215
49 pt
Cinebench R23 / Multi Core
Lenovo ThinkPad P16 Gen 3
Intel Core Ultra 9 285HX
34998 Points +83%
Lenovo ThinkPad P1 Gen 8
Intel Core Ultra 7 255H
22191 (21038.4min - 22190.6max) Points +16%
Lenovo Yoga Pro 9 16IAH10 RTX 5050
Intel Core Ultra 9 285H
21343 (17440.8min - 21342.7max) Points +12%
Lenovo Pro 9 16IPH11
Intel Core Ultra 9 386H
20841 (20017min - 20841.2max) Points +9%
Media AMD Ryzen AI 9 HX PRO 470
  (18834 - 21244, n=3)
19724 Points +3%
Dell Pro 5 16 P516265
AMD Ryzen AI 9 HX PRO 470
19095 (17945.6min - 19094.8max) Points
Dell XPS 16 Core Ultra X7 358H
Intel Core Ultra X7 358H
17884 (15984.6min - 17883.7max) Points -6%
MSI Venture 16 AI A2HMTG
Intel Core Ultra 7 255H
17569 (17404.9min - 17569max) Points -8%
Asus ExpertBook B5 B5605CCA
Intel Core Ultra 5 225H
16466 Points -14%
HP EliteBook 8 G1a 16 AI
AMD Ryzen AI 7 PRO 350
15543 (15453.3min - 15543.2max) Points -19%
Lenovo ThinkPad L16 Gen 2 21SC0029GE
AMD Ryzen 5 PRO 215
10048 Points -47%
Lenovo ThinkPad T16 Gen 5 22AN001WGE
AMD Ryzen 5 PRO 215
10024 Points -48%
Cinebench R23 / Single Core
Lenovo ThinkPad P16 Gen 3
Intel Core Ultra 9 285HX
2228 Points +8%
Lenovo Yoga Pro 9 16IAH10 RTX 5050
Intel Core Ultra 9 285H
2122 Points +3%
Dell XPS 16 Core Ultra X7 358H
Intel Core Ultra X7 358H
2087 Points +1%
Dell Pro 5 16 P516265
AMD Ryzen AI 9 HX PRO 470
2063 Points
Lenovo Pro 9 16IPH11
Intel Core Ultra 9 386H
2057 Points 0%
Media AMD Ryzen AI 9 HX PRO 470
  (2042 - 2063, n=3)
2053 Points 0%
Lenovo ThinkPad P1 Gen 8
Intel Core Ultra 7 255H
1999 Points -3%
Asus ExpertBook B5 B5605CCA
Intel Core Ultra 5 225H
1992 Points -3%
HP EliteBook 8 G1a 16 AI
AMD Ryzen AI 7 PRO 350
1954 Points -5%
MSI Venture 16 AI A2HMTG
Intel Core Ultra 7 255H
1954 Points -5%
Lenovo ThinkPad T16 Gen 5 22AN001WGE
AMD Ryzen 5 PRO 215
1721 Points -17%
Lenovo ThinkPad L16 Gen 2 21SC0029GE
AMD Ryzen 5 PRO 215
1705 Points -17%
Cinebench R20 / CPU (Multi Core)
Lenovo ThinkPad P16 Gen 3
Intel Core Ultra 9 285HX
13152 Points +77%
Lenovo ThinkPad P1 Gen 8
Intel Core Ultra 7 255H
8651 Points +16%
Lenovo Yoga Pro 9 16IAH10 RTX 5050
Intel Core Ultra 9 285H
8342 Points +12%
Lenovo Pro 9 16IPH11
Intel Core Ultra 9 386H
8299 Points +12%
Media AMD Ryzen AI 9 HX PRO 470
  (7355 - 8157, n=3)
7648 Points +3%
Dell Pro 5 16 P516265
AMD Ryzen AI 9 HX PRO 470
7433 Points
Dell XPS 16 Core Ultra X7 358H
Intel Core Ultra X7 358H
7195 Points -3%
MSI Venture 16 AI A2HMTG
Intel Core Ultra 7 255H
6862 Points -8%
Asus ExpertBook B5 B5605CCA
Intel Core Ultra 5 225H
6399 Points -14%
HP EliteBook 8 G1a 16 AI
AMD Ryzen AI 7 PRO 350
6071 Points -18%
Lenovo ThinkPad L16 Gen 2 21SC0029GE
AMD Ryzen 5 PRO 215
3937 Points -47%
Lenovo ThinkPad T16 Gen 5 22AN001WGE
AMD Ryzen 5 PRO 215
3903 Points -47%
Cinebench R20 / CPU (Single Core)
Lenovo ThinkPad P16 Gen 3
Intel Core Ultra 9 285HX
857 Points +6%
Lenovo Yoga Pro 9 16IAH10 RTX 5050
Intel Core Ultra 9 285H
812 Points 0%
Dell Pro 5 16 P516265
AMD Ryzen AI 9 HX PRO 470
810 Points
Media AMD Ryzen AI 9 HX PRO 470
  (804 - 810, n=3)
807 Points 0%
Lenovo Pro 9 16IPH11
Intel Core Ultra 9 386H
787 Points -3%
Dell XPS 16 Core Ultra X7 358H
Intel Core Ultra X7 358H
780 Points -4%
HP EliteBook 8 G1a 16 AI
AMD Ryzen AI 7 PRO 350
773 Points -5%
Asus ExpertBook B5 B5605CCA
Intel Core Ultra 5 225H
763 Points -6%
Lenovo ThinkPad P1 Gen 8
Intel Core Ultra 7 255H
760 Points -6%
MSI Venture 16 AI A2HMTG
Intel Core Ultra 7 255H
743 Points -8%
Lenovo ThinkPad L16 Gen 2 21SC0029GE
AMD Ryzen 5 PRO 215
668 Points -18%
Lenovo ThinkPad T16 Gen 5 22AN001WGE
AMD Ryzen 5 PRO 215
664 Points -18%
Cinebench R15 / CPU Multi 64Bit
Lenovo ThinkPad P16 Gen 3
Intel Core Ultra 9 285HX
5627 (4290min - 5626.67max) Points +89%
Lenovo ThinkPad P1 Gen 8
Intel Core Ultra 7 255H
3388 (2958.36min - 3387.53max) Points +14%
Lenovo Pro 9 16IPH11
Intel Core Ultra 9 386H
3277 (3189.03min - 3276.54max) Points +10%
Lenovo Yoga Pro 9 16IAH10 RTX 5050
Intel Core Ultra 9 285H
3204 (2732.05min - 3203.59max) Points +7%
Media AMD Ryzen AI 9 HX PRO 470
  (2983 - 3274, n=3)
3164 Points +6%
Dell XPS 16 Core Ultra X7 358H
Intel Core Ultra X7 358H
2986 (2491.75min - 2985.52max) Points 0%
Dell Pro 5 16 P516265
AMD Ryzen AI 9 HX PRO 470
2983 (2832.46min - 2983.29max) Points
Asus ExpertBook B5 B5605CCA
Intel Core Ultra 5 225H
2626 (2293.31min - 2626.4max) Points -12%
MSI Venture 16 AI A2HMTG
Intel Core Ultra 7 255H
2611 (2544.21min - 2610.8max) Points -12%
HP EliteBook 8 G1a 16 AI
AMD Ryzen AI 7 PRO 350
2408 (2309.87min - 2407.9max) Points -19%
Lenovo ThinkPad L16 Gen 2 21SC0029GE
AMD Ryzen 5 PRO 215
1617 (1402.28min - 1617.27max) Points -46%
Lenovo ThinkPad T16 Gen 5 22AN001WGE
AMD Ryzen 5 PRO 215
1604 (1576.79min - 1603.85max) Points -46%
Cinebench R15 / CPU Single 64Bit
Lenovo ThinkPad P16 Gen 3
Intel Core Ultra 9 285HX
323 Points +2%
Dell Pro 5 16 P516265
AMD Ryzen AI 9 HX PRO 470
316 Points
Lenovo Pro 9 16IPH11
Intel Core Ultra 9 386H
314 Points -1%
Lenovo Yoga Pro 9 16IAH10 RTX 5050
Intel Core Ultra 9 285H
313 Points -1%
Media AMD Ryzen AI 9 HX PRO 470
  (311 - 316, n=3)
313 Points -1%
Dell XPS 16 Core Ultra X7 358H
Intel Core Ultra X7 358H
304 Points -4%
Lenovo ThinkPad P1 Gen 8
Intel Core Ultra 7 255H
302 Points -4%
HP EliteBook 8 G1a 16 AI
AMD Ryzen AI 7 PRO 350
299 Points -5%
MSI Venture 16 AI A2HMTG
Intel Core Ultra 7 255H
297 Points -6%
Asus ExpertBook B5 B5605CCA
Intel Core Ultra 5 225H
296 Points -6%
Lenovo ThinkPad L16 Gen 2 21SC0029GE
AMD Ryzen 5 PRO 215
269 Points -15%
Lenovo ThinkPad T16 Gen 5 22AN001WGE
AMD Ryzen 5 PRO 215
262 Points -17%
Blender / v2.79 BMW27 CPU
Lenovo ThinkPad L16 Gen 2 21SC0029GE
AMD Ryzen 5 PRO 215
333 Seconds * -98%
Lenovo ThinkPad T16 Gen 5 22AN001WGE
AMD Ryzen 5 PRO 215
314 Seconds * -87%
Asus ExpertBook B5 B5605CCA
Intel Core Ultra 5 225H
216 Seconds * -29%
HP EliteBook 8 G1a 16 AI
AMD Ryzen AI 7 PRO 350
206 Seconds * -23%
Dell XPS 16 Core Ultra X7 358H
Intel Core Ultra X7 358H
196 Seconds * -17%
MSI Venture 16 AI A2HMTG
Intel Core Ultra 7 255H
189 Seconds * -13%
Dell Pro 5 16 P516265
AMD Ryzen AI 9 HX PRO 470
168 Seconds *
Lenovo ThinkPad P1 Gen 8
Intel Core Ultra 7 255H
166 Seconds * +1%
Media AMD Ryzen AI 9 HX PRO 470
  (152 - 178, n=3)
166 Seconds * +1%
Lenovo Pro 9 16IPH11
Intel Core Ultra 9 386H
160 Seconds * +5%
Lenovo Yoga Pro 9 16IAH10 RTX 5050
Intel Core Ultra 9 285H
158 Seconds * +6%
Lenovo ThinkPad P16 Gen 3
Intel Core Ultra 9 285HX
103 Seconds * +39%
7-Zip 18.03 / 7z b 4
Lenovo ThinkPad P16 Gen 3
Intel Core Ultra 9 285HX
99260 MIPS +33%
Media AMD Ryzen AI 9 HX PRO 470
  (71554 - 79243, n=3)
75107 MIPS +1%
Dell Pro 5 16 P516265
AMD Ryzen AI 9 HX PRO 470
74523 MIPS
Lenovo Pro 9 16IPH11
Intel Core Ultra 9 386H
71479 MIPS -4%
Lenovo Yoga Pro 9 16IAH10 RTX 5050
Intel Core Ultra 9 285H
69778 MIPS -6%
Lenovo ThinkPad P1 Gen 8
Intel Core Ultra 7 255H
64912 MIPS -13%
Dell XPS 16 Core Ultra X7 358H
Intel Core Ultra X7 358H
64852 MIPS -13%
MSI Venture 16 AI A2HMTG
Intel Core Ultra 7 255H
60579 MIPS -19%
HP EliteBook 8 G1a 16 AI
AMD Ryzen AI 7 PRO 350
57736 MIPS -23%
Asus ExpertBook B5 B5605CCA
Intel Core Ultra 5 225H
51720 MIPS -31%
Lenovo ThinkPad L16 Gen 2 21SC0029GE
AMD Ryzen 5 PRO 215
43292 MIPS -42%
Lenovo ThinkPad T16 Gen 5 22AN001WGE
AMD Ryzen 5 PRO 215
41255 MIPS -45%
7-Zip 18.03 / 7z b 4 -mmt1
Dell XPS 16 Core Ultra X7 358H
Intel Core Ultra X7 358H
6441 MIPS +1%
Lenovo ThinkPad P16 Gen 3
Intel Core Ultra 9 285HX
6422 MIPS +1%
Dell Pro 5 16 P516265
AMD Ryzen AI 9 HX PRO 470
6353 MIPS
Media AMD Ryzen AI 9 HX PRO 470
  (6041 - 6353, n=3)
6244 MIPS -2%
Lenovo ThinkPad L16 Gen 2 21SC0029GE
AMD Ryzen 5 PRO 215
6220 MIPS -2%
Lenovo Pro 9 16IPH11
Intel Core Ultra 9 386H
6118 MIPS -4%
Lenovo ThinkPad T16 Gen 5 22AN001WGE
AMD Ryzen 5 PRO 215
6118 MIPS -4%
HP EliteBook 8 G1a 16 AI
AMD Ryzen AI 7 PRO 350
6052 MIPS -5%
Lenovo Yoga Pro 9 16IAH10 RTX 5050
Intel Core Ultra 9 285H
6044 MIPS -5%
MSI Venture 16 AI A2HMTG
Intel Core Ultra 7 255H
5937 MIPS -7%
Asus ExpertBook B5 B5605CCA
Intel Core Ultra 5 225H
5695 MIPS -10%
Lenovo ThinkPad P1 Gen 8
Intel Core Ultra 7 255H
5126 MIPS -19%
Geekbench 6.7 / Multi-Core
Lenovo ThinkPad P16 Gen 3
Intel Core Ultra 9 285HX
18212 Points +21%
Lenovo Yoga Pro 9 16IAH10 RTX 5050
Intel Core Ultra 9 285H
17172 Points +14%
Dell XPS 16 Core Ultra X7 358H
Intel Core Ultra X7 358H
16943 Points +12%
Lenovo ThinkPad P1 Gen 8
Intel Core Ultra 7 255H
16940 Points +12%
Lenovo Pro 9 16IPH11
Intel Core Ultra 9 386H
16816 Points +12%
Dell Pro 5 16 P516265
AMD Ryzen AI 9 HX PRO 470
15079 Points
MSI Venture 16 AI A2HMTG
Intel Core Ultra 7 255H
14801 Points -2%
Media AMD Ryzen AI 9 HX PRO 470
  (13878 - 15079, n=3)
14645 Points -3%
HP EliteBook 8 G1a 16 AI
AMD Ryzen AI 7 PRO 350
13539 Points -10%
Asus ExpertBook B5 B5605CCA
Intel Core Ultra 5 225H
12099 Points -20%
Lenovo ThinkPad L16 Gen 2 21SC0029GE
AMD Ryzen 5 PRO 215
9960 Points -34%
Lenovo ThinkPad T16 Gen 5 22AN001WGE
AMD Ryzen 5 PRO 215
8056 Points -47%
Geekbench 6.7 / Single-Core
Lenovo ThinkPad P16 Gen 3
Intel Core Ultra 9 285HX
2989 Points 0%
Dell Pro 5 16 P516265
AMD Ryzen AI 9 HX PRO 470
2988 Points
Media AMD Ryzen AI 9 HX PRO 470
  (2918 - 2988, n=3)
2950 Points -1%
Lenovo Yoga Pro 9 16IAH10 RTX 5050
Intel Core Ultra 9 285H
2909 Points -3%
Dell XPS 16 Core Ultra X7 358H
Intel Core Ultra X7 358H
2903 Points -3%
Lenovo Pro 9 16IPH11
Intel Core Ultra 9 386H
2895 Points -3%
HP EliteBook 8 G1a 16 AI
AMD Ryzen AI 7 PRO 350
2855 Points -4%
Lenovo ThinkPad P1 Gen 8
Intel Core Ultra 7 255H
2811 Points -6%
MSI Venture 16 AI A2HMTG
Intel Core Ultra 7 255H
2776 Points -7%
Asus ExpertBook B5 B5605CCA
Intel Core Ultra 5 225H
2770 Points -7%
Lenovo ThinkPad L16 Gen 2 21SC0029GE
AMD Ryzen 5 PRO 215
2580 Points -14%
Lenovo ThinkPad T16 Gen 5 22AN001WGE
AMD Ryzen 5 PRO 215
2459 Points -18%
Geekbench 5.5 / Multi-Core
Lenovo ThinkPad P16 Gen 3
Intel Core Ultra 9 285HX
21565 Points +48%
Lenovo Pro 9 16IPH11
Intel Core Ultra 9 386H
17246 Points +18%
Dell XPS 16 Core Ultra X7 358H
Intel Core Ultra X7 358H
16763 Points +15%
Lenovo ThinkPad P1 Gen 8
Intel Core Ultra 7 255H
16483 Points +13%
Lenovo Yoga Pro 9 16IAH10 RTX 5050
Intel Core Ultra 9 285H
16257 Points +12%
Dell Pro 5 16 P516265
AMD Ryzen AI 9 HX PRO 470
14571 Points
Media AMD Ryzen AI 9 HX PRO 470
  (14029 - 15013, n=3)
14538 Points 0%
MSI Venture 16 AI A2HMTG
Intel Core Ultra 7 255H
13705 Points -6%
HP EliteBook 8 G1a 16 AI
AMD Ryzen AI 7 PRO 350
11701 Points -20%
Asus ExpertBook B5 B5605CCA
Intel Core Ultra 5 225H
11570 Points -21%
Lenovo ThinkPad L16 Gen 2 21SC0029GE
AMD Ryzen 5 PRO 215
8181 Points -44%
Lenovo ThinkPad T16 Gen 5 22AN001WGE
AMD Ryzen 5 PRO 215
7113 Points -51%
Geekbench 5.5 / Single-Core
Dell Pro 5 16 P516265
AMD Ryzen AI 9 HX PRO 470
2175 Points
Media AMD Ryzen AI 9 HX PRO 470
  (2129 - 2182, n=3)
2162 Points -1%
Lenovo ThinkPad P16 Gen 3
Intel Core Ultra 9 285HX
2143 Points -1%
Lenovo Pro 9 16IPH11
Intel Core Ultra 9 386H
2134 Points -2%
HP EliteBook 8 G1a 16 AI
AMD Ryzen AI 7 PRO 350
2128 Points -2%
Dell XPS 16 Core Ultra X7 358H
Intel Core Ultra X7 358H
2119 Points -3%
Lenovo Yoga Pro 9 16IAH10 RTX 5050
Intel Core Ultra 9 285H
2083 Points -4%
MSI Venture 16 AI A2HMTG
Intel Core Ultra 7 255H
2047 Points -6%
Lenovo ThinkPad P1 Gen 8
Intel Core Ultra 7 255H
1998 Points -8%
Asus ExpertBook B5 B5605CCA
Intel Core Ultra 5 225H
1987 Points -9%
Lenovo ThinkPad L16 Gen 2 21SC0029GE
AMD Ryzen 5 PRO 215
1906 Points -12%
Lenovo ThinkPad T16 Gen 5 22AN001WGE
AMD Ryzen 5 PRO 215
1829 Points -16%
HWBOT x265 Benchmark v2.2 / 4k Preset
Lenovo ThinkPad P16 Gen 3
Intel Core Ultra 9 285HX
35.4 fps +53%
Lenovo ThinkPad P1 Gen 8
Intel Core Ultra 7 255H
26.5 fps +14%
Lenovo Yoga Pro 9 16IAH10 RTX 5050
Intel Core Ultra 9 285H
25.1 fps +8%
Lenovo Pro 9 16IPH11
Intel Core Ultra 9 386H
24.8 fps +7%
Media AMD Ryzen AI 9 HX PRO 470
  (21.9 - 25.8, n=3)
23.6 fps +2%
Dell Pro 5 16 P516265
AMD Ryzen AI 9 HX PRO 470
23.2 fps
MSI Venture 16 AI A2HMTG
Intel Core Ultra 7 255H
21.4 fps -8%
Dell XPS 16 Core Ultra X7 358H
Intel Core Ultra X7 358H
21 fps -9%
HP EliteBook 8 G1a 16 AI
AMD Ryzen AI 7 PRO 350
19.7 fps -15%
Asus ExpertBook B5 B5605CCA
Intel Core Ultra 5 225H
18.5 fps -20%
Lenovo ThinkPad L16 Gen 2 21SC0029GE
AMD Ryzen 5 PRO 215
13.3 fps -43%
Lenovo ThinkPad T16 Gen 5 22AN001WGE
AMD Ryzen 5 PRO 215
12.6 fps -46%
LibreOffice / 20 Documents To PDF
HP EliteBook 8 G1a 16 AI
AMD Ryzen AI 7 PRO 350
69.3 s * -27%
Lenovo ThinkPad T16 Gen 5 22AN001WGE
AMD Ryzen 5 PRO 215
55.9 s * -2%
Media AMD Ryzen AI 9 HX PRO 470
  (54.7 - 56.1, n=3)
55.4 s * -1%
Dell Pro 5 16 P516265
AMD Ryzen AI 9 HX PRO 470
54.7 s *
Lenovo ThinkPad L16 Gen 2 21SC0029GE
AMD Ryzen 5 PRO 215
53.7 s * +2%
Dell XPS 16 Core Ultra X7 358H
Intel Core Ultra X7 358H
49.5 s * +10%
Asus ExpertBook B5 B5605CCA
Intel Core Ultra 5 225H
48.5 s * +11%
MSI Venture 16 AI A2HMTG
Intel Core Ultra 7 255H
44.4 s * +19%
Lenovo ThinkPad P16 Gen 3
Intel Core Ultra 9 285HX
42.6 s * +22%
Lenovo ThinkPad P1 Gen 8
Intel Core Ultra 7 255H
41.8 s * +24%
Lenovo Pro 9 16IPH11
Intel Core Ultra 9 386H
41.6 s * +24%
Lenovo Yoga Pro 9 16IAH10 RTX 5050
Intel Core Ultra 9 285H
39.4 s * +28%
R Benchmark 2.5 / Overall mean
HP EliteBook 8 G1a 16 AI
AMD Ryzen AI 7 PRO 350
0.577 sec * -47%
Lenovo ThinkPad L16 Gen 2 21SC0029GE
AMD Ryzen 5 PRO 215
0.4599 sec * -17%
Lenovo ThinkPad T16 Gen 5 22AN001WGE
AMD Ryzen 5 PRO 215
0.4599 sec * -17%
Asus ExpertBook B5 B5605CCA
Intel Core Ultra 5 225H
0.4507 sec * -15%
MSI Venture 16 AI A2HMTG
Intel Core Ultra 7 255H
0.4498 sec * -14%
Lenovo ThinkPad P1 Gen 8
Intel Core Ultra 7 255H
0.4382 sec * -12%
Lenovo Pro 9 16IPH11
Intel Core Ultra 9 386H
0.4321 sec * -10%
Lenovo Yoga Pro 9 16IAH10 RTX 5050
Intel Core Ultra 9 285H
0.4275 sec * -9%
Dell XPS 16 Core Ultra X7 358H
Intel Core Ultra X7 358H
0.4216 sec * -7%
Lenovo ThinkPad P16 Gen 3
Intel Core Ultra 9 285HX
0.4202 sec * -7%
Media AMD Ryzen AI 9 HX PRO 470
  (0.393 - 0.4047, n=3)
0.3984 sec * -1%
Dell Pro 5 16 P516265
AMD Ryzen AI 9 HX PRO 470
0.393 sec *

* ... Meglio usare valori piccoli
Cinebench R15 CPU Multi 64Bit
2983 Points
Cinebench R15 OpenGL 64Bit
106.2 fps
Cinebench R15 Ref. Match 64Bit
97.9 %
Cinebench R15 CPU Single 64Bit
316 Points
Cinebench R20 CPU (Single Core)
810 Points
Cinebench R20 CPU (Multi Core)
7433 Points
Cinebench R23 Single Core
2063 Points
Cinebench R23 Multi Core
19095 Points
Cinebench 2024 CPU Multi Core
1070 Points
Cinebench 2024 CPU Single Core
120.2 Points
Cinebench 2026 CPU Multi
4448 Points
Cinebench 2026 CPU Single Thread
488 Points
Aiuto
Performance rating
Media AMD Ryzen AI 9 HX PRO 470 -1!
 
95.7 pt
Dell Pro 5 16 P516265 -1!
AMD Ryzen AI 9 HX PRO 470, Radeon 890M
94.7 pt
HP EliteBook 8 G1a 16 AI -1!
AMD Ryzen AI 7 PRO 350, Radeon 860M
77.9 pt
MSI Venture 16 AI A2HMTG -1!
Intel Core Ultra 7 255H, Arc 140T
66 pt
Dell XPS 16 Core Ultra X7 358H -1!
Intel Core Ultra X7 358H, Arc B390 Panther Lake iGPU
65.2 pt
Asus ExpertBook B5 B5605CCA -1!
Intel Core Ultra 5 225H, Arc 130T
60.9 pt
Lenovo ThinkPad T16 Gen 5 22AN001WGE -1!
AMD Ryzen 5 PRO 215, Radeon 740M
50.4 pt
AIDA64 / FP32 Ray-Trace
Media AMD Ryzen AI 9 HX PRO 470
  (28416 - 33700, n=3)
30865 KRay/s +1%
Dell Pro 5 16 P516265
AMD Ryzen AI 9 HX PRO 470, Radeon 890M (v8.20.8100)
30478 KRay/s
HP EliteBook 8 G1a 16 AI
AMD Ryzen AI 7 PRO 350, Radeon 860M (v6.92.6600)
24795 KRay/s -19%
Asus ExpertBook B5 B5605CCA
Intel Core Ultra 5 225H, Arc 130T (v6.92.6600)
18754 KRay/s -38%
MSI Venture 16 AI A2HMTG
Intel Core Ultra 7 255H, Arc 140T (v8.20.8100)
18493 KRay/s -39%
Lenovo ThinkPad T16 Gen 5 22AN001WGE
AMD Ryzen 5 PRO 215, Radeon 740M (v8.20.8100)
16708 KRay/s -45%
Dell XPS 16 Core Ultra X7 358H
Intel Core Ultra X7 358H, Arc B390 Panther Lake iGPU (v8.20.8100)
15681 KRay/s -49%
AIDA64 / FPU Julia
Media AMD Ryzen AI 9 HX PRO 470
  (117109 - 138581, n=3)
126778 Points +2%
Dell Pro 5 16 P516265
AMD Ryzen AI 9 HX PRO 470, Radeon 890M (v8.20.8100)
124643 Points
HP EliteBook 8 G1a 16 AI
AMD Ryzen AI 7 PRO 350, Radeon 860M (v6.92.6600)
94532 Points -24%
MSI Venture 16 AI A2HMTG
Intel Core Ultra 7 255H, Arc 140T (v8.20.8100)
94357 Points -24%
Asus ExpertBook B5 B5605CCA
Intel Core Ultra 5 225H, Arc 130T (v6.92.6600)
84588 Points -32%
Dell XPS 16 Core Ultra X7 358H
Intel Core Ultra X7 358H, Arc B390 Panther Lake iGPU (v8.20.8100)
83114 Points -33%
Lenovo ThinkPad T16 Gen 5 22AN001WGE
AMD Ryzen 5 PRO 215, Radeon 740M (v8.20.8100)
67527 Points -46%
AIDA64 / CPU SHA3
Media AMD Ryzen AI 9 HX PRO 470
  (4824 - 5450, n=3)
5113 MB/s +1%
Dell Pro 5 16 P516265
AMD Ryzen AI 9 HX PRO 470, Radeon 890M (v8.20.8100)
5065 MB/s
MSI Venture 16 AI A2HMTG
Intel Core Ultra 7 255H, Arc 140T (v8.20.8100)
4321 MB/s -15%
Dell XPS 16 Core Ultra X7 358H
Intel Core Ultra X7 358H, Arc B390 Panther Lake iGPU (v8.20.8100)
4200 MB/s -17%
HP EliteBook 8 G1a 16 AI
AMD Ryzen AI 7 PRO 350, Radeon 860M (v6.92.6600)
4091 MB/s -19%
Asus ExpertBook B5 B5605CCA
Intel Core Ultra 5 225H, Arc 130T (v6.92.6600)
4034 MB/s -20%
Lenovo ThinkPad T16 Gen 5 22AN001WGE
AMD Ryzen 5 PRO 215, Radeon 740M (v8.20.8100)
2903 MB/s -43%
AIDA64 / CPU Queen
HP EliteBook 8 G1a 16 AI
AMD Ryzen AI 7 PRO 350, Radeon 860M (v6.92.6600)
76742 Points
Asus ExpertBook B5 B5605CCA
Intel Core Ultra 5 225H, Arc 130T (v6.92.6600)
53437 Points
AIDA64 / FPU SinJulia
Media AMD Ryzen AI 9 HX PRO 470
  (17621 - 18605, n=3)
18101 Points 0%
Dell Pro 5 16 P516265
AMD Ryzen AI 9 HX PRO 470, Radeon 890M (v8.20.8100)
18076 Points
HP EliteBook 8 G1a 16 AI
AMD Ryzen AI 7 PRO 350, Radeon 860M (v6.92.6600)
13653 Points -24%
Lenovo ThinkPad T16 Gen 5 22AN001WGE
AMD Ryzen 5 PRO 215, Radeon 740M (v8.20.8100)
8966 Points -50%
MSI Venture 16 AI A2HMTG
Intel Core Ultra 7 255H, Arc 140T (v8.20.8100)
7871 Points -56%
Dell XPS 16 Core Ultra X7 358H
Intel Core Ultra X7 358H, Arc B390 Panther Lake iGPU (v8.20.8100)
6892 Points -62%
Asus ExpertBook B5 B5605CCA
Intel Core Ultra 5 225H, Arc 130T (v6.92.6600)
6881 Points -62%
AIDA64 / FPU Mandel
Media AMD Ryzen AI 9 HX PRO 470
  (62125 - 71733, n=3)
66549 Points +1%
Dell Pro 5 16 P516265
AMD Ryzen AI 9 HX PRO 470, Radeon 890M (v8.20.8100)
65789 Points
HP EliteBook 8 G1a 16 AI
AMD Ryzen AI 7 PRO 350, Radeon 860M (v6.92.6600)
50597 Points -23%
MSI Venture 16 AI A2HMTG
Intel Core Ultra 7 255H, Arc 140T (v8.20.8100)
49437 Points -25%
Dell XPS 16 Core Ultra X7 358H
Intel Core Ultra X7 358H, Arc B390 Panther Lake iGPU (v8.20.8100)
44733 Points -32%
Asus ExpertBook B5 B5605CCA
Intel Core Ultra 5 225H, Arc 130T (v6.92.6600)
44411 Points -32%
Lenovo ThinkPad T16 Gen 5 22AN001WGE
AMD Ryzen 5 PRO 215, Radeon 740M (v8.20.8100)
36315 Points -45%
AIDA64 / CPU AES
Media AMD Ryzen AI 9 HX PRO 470
  (98035 - 110544, n=3)
103919 MB/s +1%
Dell Pro 5 16 P516265
AMD Ryzen AI 9 HX PRO 470, Radeon 890M (v8.20.8100)
103177 MB/s
HP EliteBook 8 G1a 16 AI
AMD Ryzen AI 7 PRO 350, Radeon 860M (v6.92.6600)
82843 MB/s -20%
MSI Venture 16 AI A2HMTG
Intel Core Ultra 7 255H, Arc 140T (v8.20.8100)
70611 MB/s -32%
Asus ExpertBook B5 B5605CCA
Intel Core Ultra 5 225H, Arc 130T (v6.92.6600)
65057 MB/s -37%
Dell XPS 16 Core Ultra X7 358H
Intel Core Ultra X7 358H, Arc B390 Panther Lake iGPU (v8.20.8100)
61102 MB/s -41%
Lenovo ThinkPad T16 Gen 5 22AN001WGE
AMD Ryzen 5 PRO 215, Radeon 740M (v8.20.8100)
53125 MB/s -49%
AIDA64 / CPU ZLib
Media AMD Ryzen AI 9 HX PRO 470
  (1174 - 1397, n=3)
1278 MB/s +1%
Dell Pro 5 16 P516265
AMD Ryzen AI 9 HX PRO 470, Radeon 890M (v8.20.8100)
1262 MB/s
Asus ExpertBook B5 B5605CCA
Intel Core Ultra 5 225H, Arc 130T (v6.92.6600)
1032 MB/s -18%
HP EliteBook 8 G1a 16 AI
AMD Ryzen AI 7 PRO 350, Radeon 860M (v6.92.6600)
1029 MB/s -18%
MSI Venture 16 AI A2HMTG
Intel Core Ultra 7 255H, Arc 140T (v8.20.8100)
1016 MB/s -19%
Dell XPS 16 Core Ultra X7 358H
Intel Core Ultra X7 358H, Arc B390 Panther Lake iGPU (v8.20.8100)
991 MB/s -21%
Lenovo ThinkPad T16 Gen 5 22AN001WGE
AMD Ryzen 5 PRO 215, Radeon 740M (v8.20.8100)
658 MB/s -48%
AIDA64 / FP64 Ray-Trace
Media AMD Ryzen AI 9 HX PRO 470
  (14799 - 17629, n=3)
16095 KRay/s +2%
Dell Pro 5 16 P516265
AMD Ryzen AI 9 HX PRO 470, Radeon 890M (v8.20.8100)
15857 KRay/s
HP EliteBook 8 G1a 16 AI
AMD Ryzen AI 7 PRO 350, Radeon 860M (v6.92.6600)
13384 KRay/s -16%
MSI Venture 16 AI A2HMTG
Intel Core Ultra 7 255H, Arc 140T (v8.20.8100)
10023 KRay/s -37%
Asus ExpertBook B5 B5605CCA
Intel Core Ultra 5 225H, Arc 130T (v6.92.6600)
9024 KRay/s -43%
Lenovo ThinkPad T16 Gen 5 22AN001WGE
AMD Ryzen 5 PRO 215, Radeon 740M (v8.20.8100)
8875 KRay/s -44%
Dell XPS 16 Core Ultra X7 358H
Intel Core Ultra X7 358H, Arc B390 Panther Lake iGPU (v8.20.8100)
8285 KRay/s -48%
AIDA64 / CPU PhotoWorxx
Dell XPS 16 Core Ultra X7 358H
Intel Core Ultra X7 358H, Arc B390 Panther Lake iGPU (v8.20.8100)
88154 MPixel/s +68%
MSI Venture 16 AI A2HMTG
Intel Core Ultra 7 255H, Arc 140T (v8.20.8100)
52561 MPixel/s 0%
Dell Pro 5 16 P516265
AMD Ryzen AI 9 HX PRO 470, Radeon 890M (v8.20.8100)
52444 MPixel/s
Media AMD Ryzen AI 9 HX PRO 470
  (48728 - 52444, n=3)
50489 MPixel/s -4%
HP EliteBook 8 G1a 16 AI
AMD Ryzen AI 7 PRO 350, Radeon 860M (v6.92.6600)
43805 MPixel/s -16%
Asus ExpertBook B5 B5605CCA
Intel Core Ultra 5 225H, Arc 130T (v6.92.6600)
25809 MPixel/s -51%
Lenovo ThinkPad T16 Gen 5 22AN001WGE
AMD Ryzen 5 PRO 215, Radeon 740M (v8.20.8100)
22912 MPixel/s -56%
AIDA64 / CPU CheckMate
Media AMD Ryzen AI 9 HX PRO 470
  (6848 - 7502, n=3)
7122 MP/s +4%
Dell Pro 5 16 P516265
AMD Ryzen AI 9 HX PRO 470, Radeon 890M (v8.20.8100)
6848 MP/s
Dell XPS 16 Core Ultra X7 358H
Intel Core Ultra X7 358H, Arc B390 Panther Lake iGPU (v8.20.8100)
4269 MP/s -38%
MSI Venture 16 AI A2HMTG
Intel Core Ultra 7 255H, Arc 140T (v8.20.8100)
3862 MP/s -44%
Lenovo ThinkPad T16 Gen 5 22AN001WGE
AMD Ryzen 5 PRO 215, Radeon 740M (v8.20.8100)
3679 MP/s -46%

Prestazioni del sistema

PCMark 10 Standard
PCMark 10 Standard
Performance rating
Dell XPS 16 Core Ultra X7 358H
Arc B390 Panther Lake iGPU, Ultra X7 358H
94.5 pt
Dell Pro 5 16 P516265
Radeon 890M, Ryzen AI 9 HX PRO 470, SanDisk PC SN5100S
81.1 pt
MSI Venture 16 AI A2HMTG
Arc 140T, Ultra 7 255H
79.3 pt
Media AMD Ryzen AI 9 HX PRO 470, AMD Radeon 890M
 
79 pt
Asus ExpertBook B5 B5605CCA -3!
Arc 130T, Ultra 5 225H, Micron 2500 MTFDKBA512QGN
77.4 pt
HP EliteBook 8 G1a 16 AI
Radeon 860M, Ryzen AI 7 PRO 350, Micron 3500 MTFDKBA512TGD
66.9 pt
Lenovo ThinkPad T16 Gen 5 22AN001WGE -3!
Radeon 740M, R5 PRO 215, Samsung PM9C1b MZVL8512HFLU-00BLL
66.3 pt
PCMark 10 / Score
Dell XPS 16 Core Ultra X7 358H
Arc B390 Panther Lake iGPU, Ultra X7 358H
9717 Points +12%
MSI Venture 16 AI A2HMTG
Arc 140T, Ultra 7 255H
8903 Points +3%
Dell Pro 5 16 P516265
Radeon 890M, Ryzen AI 9 HX PRO 470, SanDisk PC SN5100S
8665 Points
Media AMD Ryzen AI 9 HX PRO 470, AMD Radeon 890M
  (8465 - 8665, n=2)
8565 Points -1%
HP EliteBook 8 G1a 16 AI
Radeon 860M, Ryzen AI 7 PRO 350, Micron 3500 MTFDKBA512TGD
7626 Points -12%
Asus ExpertBook B5 B5605CCA
Arc 130T, Ultra 5 225H, Micron 2500 MTFDKBA512QGN
7069 Points -18%
Lenovo ThinkPad T16 Gen 5 22AN001WGE
Radeon 740M, R5 PRO 215, Samsung PM9C1b MZVL8512HFLU-00BLL
6092 Points -30%
PCMark 10 / Essentials
HP EliteBook 8 G1a 16 AI
Radeon 860M, Ryzen AI 7 PRO 350, Micron 3500 MTFDKBA512TGD
11594 Points +5%
Dell XPS 16 Core Ultra X7 358H
Arc B390 Panther Lake iGPU, Ultra X7 358H
11122 Points +1%
Dell Pro 5 16 P516265
Radeon 890M, Ryzen AI 9 HX PRO 470, SanDisk PC SN5100S
11009 Points
Media AMD Ryzen AI 9 HX PRO 470, AMD Radeon 890M
  (10475 - 11009, n=2)
10742 Points -2%
MSI Venture 16 AI A2HMTG
Arc 140T, Ultra 7 255H
10716 Points -3%
Asus ExpertBook B5 B5605CCA
Arc 130T, Ultra 5 225H, Micron 2500 MTFDKBA512QGN
10245 Points -7%
Lenovo ThinkPad T16 Gen 5 22AN001WGE
Radeon 740M, R5 PRO 215, Samsung PM9C1b MZVL8512HFLU-00BLL
9146 Points -17%
PCMark 10 / Productivity
Dell Pro 5 16 P516265
Radeon 890M, Ryzen AI 9 HX PRO 470, SanDisk PC SN5100S
16430 Points
Dell XPS 16 Core Ultra X7 358H
Arc B390 Panther Lake iGPU, Ultra X7 358H
16422 Points 0%
Media AMD Ryzen AI 9 HX PRO 470, AMD Radeon 890M
  (15768 - 16430, n=2)
16099 Points -2%
MSI Venture 16 AI A2HMTG
Arc 140T, Ultra 7 255H
15694 Points -4%
Lenovo ThinkPad T16 Gen 5 22AN001WGE
Radeon 740M, R5 PRO 215, Samsung PM9C1b MZVL8512HFLU-00BLL
10938 Points -33%
HP EliteBook 8 G1a 16 AI
Radeon 860M, Ryzen AI 7 PRO 350, Micron 3500 MTFDKBA512TGD
10925 Points -34%
Asus ExpertBook B5 B5605CCA
Arc 130T, Ultra 5 225H, Micron 2500 MTFDKBA512QGN
8873 Points -46%
PCMark 10 / Digital Content Creation
Dell XPS 16 Core Ultra X7 358H
Arc B390 Panther Lake iGPU, Ultra X7 358H
13633 Points +40%
MSI Venture 16 AI A2HMTG
Arc 140T, Ultra 7 255H
11387 Points +17%
Asus ExpertBook B5 B5605CCA
Arc 130T, Ultra 5 225H, Micron 2500 MTFDKBA512QGN
10548 Points +8%
Media AMD Ryzen AI 9 HX PRO 470, AMD Radeon 890M
  (9762 - 9967, n=2)
9865 Points +1%
Dell Pro 5 16 P516265
Radeon 890M, Ryzen AI 9 HX PRO 470, SanDisk PC SN5100S
9762 Points
HP EliteBook 8 G1a 16 AI
Radeon 860M, Ryzen AI 7 PRO 350, Micron 3500 MTFDKBA512TGD
9503 Points -3%
Lenovo ThinkPad T16 Gen 5 22AN001WGE
Radeon 740M, R5 PRO 215, Samsung PM9C1b MZVL8512HFLU-00BLL
6134 Points -37%
CrossMark / Overall
Dell XPS 16 Core Ultra X7 358H
Arc B390 Panther Lake iGPU, Ultra X7 358H
2114 Points +11%
Dell Pro 5 16 P516265
Radeon 890M, Ryzen AI 9 HX PRO 470, SanDisk PC SN5100S
1903 Points
MSI Venture 16 AI A2HMTG
Arc 140T, Ultra 7 255H
1901 Points 0%
Media AMD Ryzen AI 9 HX PRO 470, AMD Radeon 890M
  (1739 - 1903, n=3)
1808 Points -5%
Asus ExpertBook B5 B5605CCA
Arc 130T, Ultra 5 225H, Micron 2500 MTFDKBA512QGN
1754 Points -8%
HP EliteBook 8 G1a 16 AI
Radeon 860M, Ryzen AI 7 PRO 350, Micron 3500 MTFDKBA512TGD
1703 Points -11%
Lenovo ThinkPad T16 Gen 5 22AN001WGE
Radeon 740M, R5 PRO 215, Samsung PM9C1b MZVL8512HFLU-00BLL
1472 Points -23%
CrossMark / Productivity
Dell XPS 16 Core Ultra X7 358H
Arc B390 Panther Lake iGPU, Ultra X7 358H
1898 Points +10%
MSI Venture 16 AI A2HMTG
Arc 140T, Ultra 7 255H
1814 Points +5%
Asus ExpertBook B5 B5605CCA
Arc 130T, Ultra 5 225H, Micron 2500 MTFDKBA512QGN
1740 Points +1%
Dell Pro 5 16 P516265
Radeon 890M, Ryzen AI 9 HX PRO 470, SanDisk PC SN5100S
1729 Points
Media AMD Ryzen AI 9 HX PRO 470, AMD Radeon 890M
  (1620 - 1729, n=3)
1667 Points -4%
HP EliteBook 8 G1a 16 AI
Radeon 860M, Ryzen AI 7 PRO 350, Micron 3500 MTFDKBA512TGD
1612 Points -7%
Lenovo ThinkPad T16 Gen 5 22AN001WGE
Radeon 740M, R5 PRO 215, Samsung PM9C1b MZVL8512HFLU-00BLL
1501 Points -13%
CrossMark / Creativity
Dell XPS 16 Core Ultra X7 358H
Arc B390 Panther Lake iGPU, Ultra X7 358H
2529 Points +12%
Dell Pro 5 16 P516265
Radeon 890M, Ryzen AI 9 HX PRO 470, SanDisk PC SN5100S
2254 Points
MSI Venture 16 AI A2HMTG
Arc 140T, Ultra 7 255H
2151 Points -5%
Media AMD Ryzen AI 9 HX PRO 470, AMD Radeon 890M
  (2024 - 2254, n=3)
2104 Points -7%
HP EliteBook 8 G1a 16 AI
Radeon 860M, Ryzen AI 7 PRO 350, Micron 3500 MTFDKBA512TGD
1907 Points -15%
Asus ExpertBook B5 B5605CCA
Arc 130T, Ultra 5 225H, Micron 2500 MTFDKBA512QGN
1893 Points -16%
Lenovo ThinkPad T16 Gen 5 22AN001WGE
Radeon 740M, R5 PRO 215, Samsung PM9C1b MZVL8512HFLU-00BLL
1541 Points -32%
CrossMark / Responsiveness
Dell XPS 16 Core Ultra X7 358H
Arc B390 Panther Lake iGPU, Ultra X7 358H
1706 Points +12%
Dell Pro 5 16 P516265
Radeon 890M, Ryzen AI 9 HX PRO 470, SanDisk PC SN5100S
1526 Points
MSI Venture 16 AI A2HMTG
Arc 140T, Ultra 7 255H
1511 Points -1%
Media AMD Ryzen AI 9 HX PRO 470, AMD Radeon 890M
  (1366 - 1526, n=3)
1467 Points -4%
HP EliteBook 8 G1a 16 AI
Radeon 860M, Ryzen AI 7 PRO 350, Micron 3500 MTFDKBA512TGD
1433 Points -6%
Asus ExpertBook B5 B5605CCA
Arc 130T, Ultra 5 225H, Micron 2500 MTFDKBA512QGN
1426 Points -7%
Lenovo ThinkPad T16 Gen 5 22AN001WGE
Radeon 740M, R5 PRO 215, Samsung PM9C1b MZVL8512HFLU-00BLL
1212 Points -21%
WebXPRT 3 / Overall
Dell Pro 5 16 P516265
Radeon 890M, Ryzen AI 9 HX PRO 470, SanDisk PC SN5100S
349 Points
Media AMD Ryzen AI 9 HX PRO 470, AMD Radeon 890M
  (298 - 349, n=3)
330 Points -5%
MSI Venture 16 AI A2HMTG
Arc 140T, Ultra 7 255H
323 Points -7%
Asus ExpertBook B5 B5605CCA
Arc 130T, Ultra 5 225H, Micron 2500 MTFDKBA512QGN
309 Points -11%
Dell XPS 16 Core Ultra X7 358H
Arc B390 Panther Lake iGPU, Ultra X7 358H
304 Points -13%
Lenovo ThinkPad T16 Gen 5 22AN001WGE
Radeon 740M, R5 PRO 215, Samsung PM9C1b MZVL8512HFLU-00BLL
292 Points -16%
HP EliteBook 8 G1a 16 AI
Radeon 860M, Ryzen AI 7 PRO 350, Micron 3500 MTFDKBA512TGD
250 Points -28%
WebXPRT 4 / Overall
Dell XPS 16 Core Ultra X7 358H
Arc B390 Panther Lake iGPU, Ultra X7 358H
300 Points +6%
MSI Venture 16 AI A2HMTG
Arc 140T, Ultra 7 255H
297 Points +5%
Asus ExpertBook B5 B5605CCA
Arc 130T, Ultra 5 225H, Micron 2500 MTFDKBA512QGN
294 Points +4%
Dell Pro 5 16 P516265
Radeon 890M, Ryzen AI 9 HX PRO 470, SanDisk PC SN5100S
284 Points
Media AMD Ryzen AI 9 HX PRO 470, AMD Radeon 890M
  (237 - 284, n=3)
266 Points -6%
Lenovo ThinkPad T16 Gen 5 22AN001WGE
Radeon 740M, R5 PRO 215, Samsung PM9C1b MZVL8512HFLU-00BLL
250 Points -12%
HP EliteBook 8 G1a 16 AI
Radeon 860M, Ryzen AI 7 PRO 350, Micron 3500 MTFDKBA512TGD
200 Points -30%
Mozilla Kraken 1.1 / Total
HP EliteBook 8 G1a 16 AI
Radeon 860M, Ryzen AI 7 PRO 350, Micron 3500 MTFDKBA512TGD
749 ms * -76%
Lenovo ThinkPad T16 Gen 5 22AN001WGE
Radeon 740M, R5 PRO 215, Samsung PM9C1b MZVL8512HFLU-00BLL
538 ms * -26%
Asus ExpertBook B5 B5605CCA
Arc 130T, Ultra 5 225H, Micron 2500 MTFDKBA512QGN
458 ms * -8%
MSI Venture 16 AI A2HMTG
Arc 140T, Ultra 7 255H
454 ms * -7%
Dell XPS 16 Core Ultra X7 358H
Arc B390 Panther Lake iGPU, Ultra X7 358H
450 ms * -6%
Media AMD Ryzen AI 9 HX PRO 470, AMD Radeon 890M
  (426 - 431, n=3)
428 ms * -0%
Dell Pro 5 16 P516265
Radeon 890M, Ryzen AI 9 HX PRO 470, SanDisk PC SN5100S
426 ms *
Geekbench AI / Quantized GPU 1.7
Dell XPS 16 Core Ultra X7 358H
Arc B390 Panther Lake iGPU, Ultra X7 358H
7990 Points +51%
Media AMD Ryzen AI 9 HX PRO 470, AMD Radeon 890M
  (5297 - 5656, n=2)
5477 Points +3%
Dell Pro 5 16 P516265
Radeon 890M, Ryzen AI 9 HX PRO 470, SanDisk PC SN5100S
5297 Points
MSI Venture 16 AI A2HMTG
Arc 140T, Ultra 7 255H
4705 Points -11%
HP EliteBook 8 G1a 16 AI
Radeon 860M, Ryzen AI 7 PRO 350, Micron 3500 MTFDKBA512TGD
4564 Points -14%
Geekbench AI / Half Precision GPU 1.7
Dell XPS 16 Core Ultra X7 358H
Arc B390 Panther Lake iGPU, Ultra X7 358H
20773 Points +79%
Media AMD Ryzen AI 9 HX PRO 470, AMD Radeon 890M
  (11589 - 11832, n=2)
11711 Points +1%
Dell Pro 5 16 P516265
Radeon 890M, Ryzen AI 9 HX PRO 470, SanDisk PC SN5100S
11589 Points
HP EliteBook 8 G1a 16 AI
Radeon 860M, Ryzen AI 7 PRO 350, Micron 3500 MTFDKBA512TGD
9607 Points -17%
MSI Venture 16 AI A2HMTG
Arc 140T, Ultra 7 255H
8108 Points -30%
Geekbench AI / Single Precision GPU 1.7
Dell XPS 16 Core Ultra X7 358H
Arc B390 Panther Lake iGPU, Ultra X7 358H
11471 Points +66%
Media AMD Ryzen AI 9 HX PRO 470, AMD Radeon 890M
  (6931 - 7225, n=2)
7078 Points +2%
Dell Pro 5 16 P516265
Radeon 890M, Ryzen AI 9 HX PRO 470, SanDisk PC SN5100S
6931 Points
MSI Venture 16 AI A2HMTG
Arc 140T, Ultra 7 255H
6840 Points -1%
HP EliteBook 8 G1a 16 AI
Radeon 860M, Ryzen AI 7 PRO 350, Micron 3500 MTFDKBA512TGD
6301 Points -9%

* ... Meglio usare valori piccoli
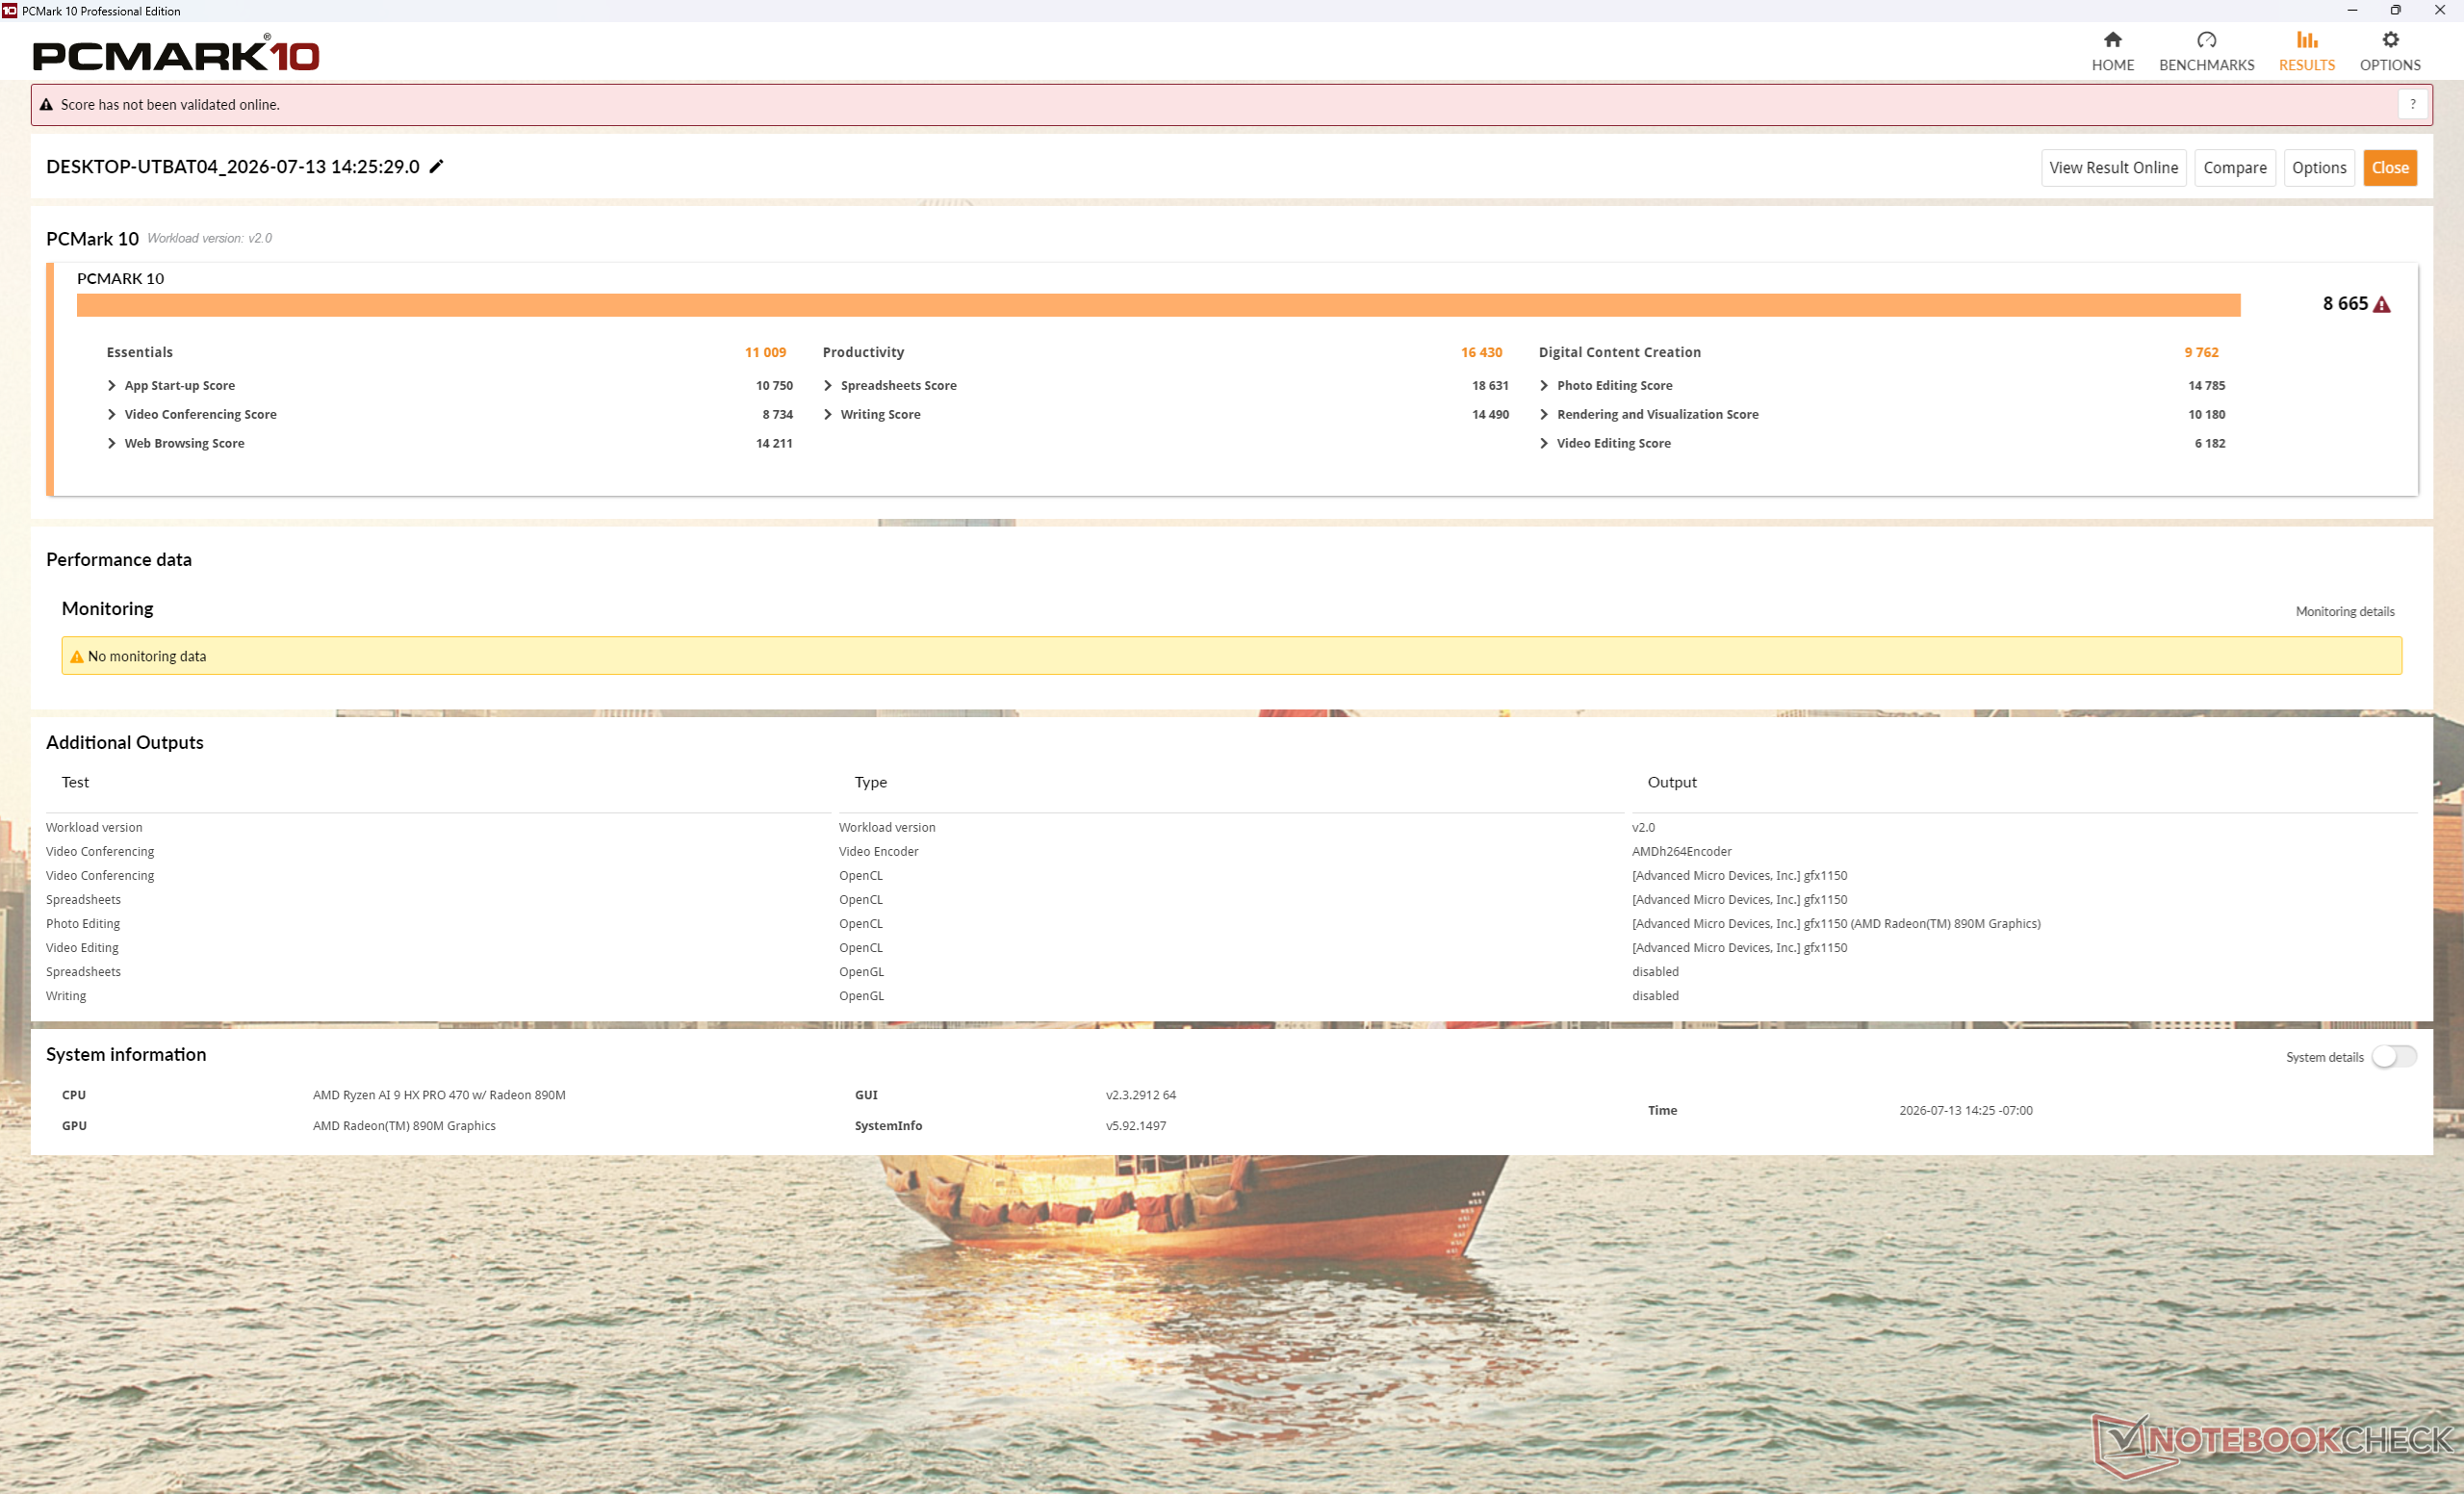
PCMark 10 Score
8665 punti
Aiuto
AIDA64 / Memory Copy
Dell XPS 16 Core Ultra X7 358H
Intel Core Ultra X7 358H, Arc B390 Panther Lake iGPU
132135 MB/s +71%
Dell Pro 5 16 P516265
AMD Ryzen AI 9 HX PRO 470, Radeon 890M
77066 MB/s
Media AMD Ryzen AI 9 HX PRO 470
  (70163 - 82931, n=3)
76720 MB/s 0%
HP EliteBook 8 G1a 16 AI
AMD Ryzen AI 7 PRO 350, Radeon 860M
73363 MB/s -5%
MSI Venture 16 AI A2HMTG
Intel Core Ultra 7 255H, Arc 140T
67747 MB/s -12%
Asus ExpertBook B5 B5605CCA
Intel Core Ultra 5 225H, Arc 130T
47920 MB/s -38%
Lenovo ThinkPad T16 Gen 5 22AN001WGE
AMD Ryzen 5 PRO 215, Radeon 740M
35500 MB/s -54%
AIDA64 / Memory Read
Dell XPS 16 Core Ultra X7 358H
Intel Core Ultra X7 358H, Arc B390 Panther Lake iGPU
118888 MB/s +47%
Media AMD Ryzen AI 9 HX PRO 470
  (80270 - 86838, n=3)
82703 MB/s +2%
MSI Venture 16 AI A2HMTG
Intel Core Ultra 7 255H, Arc 140T
81958 MB/s +1%
Dell Pro 5 16 P516265
AMD Ryzen AI 9 HX PRO 470, Radeon 890M
81001 MB/s
HP EliteBook 8 G1a 16 AI
AMD Ryzen AI 7 PRO 350, Radeon 860M
62435 MB/s -23%
Asus ExpertBook B5 B5605CCA
Intel Core Ultra 5 225H, Arc 130T
44496 MB/s -45%
Lenovo ThinkPad T16 Gen 5 22AN001WGE
AMD Ryzen 5 PRO 215, Radeon 740M
30310 MB/s -63%
AIDA64 / Memory Write
Dell XPS 16 Core Ultra X7 358H
Intel Core Ultra X7 358H, Arc B390 Panther Lake iGPU
134998 MB/s +58%
Media AMD Ryzen AI 9 HX PRO 470
  (85093 - 109384, n=3)
93224 MB/s +9%
HP EliteBook 8 G1a 16 AI
AMD Ryzen AI 7 PRO 350, Radeon 860M
86184 MB/s +1%
Dell Pro 5 16 P516265
AMD Ryzen AI 9 HX PRO 470, Radeon 890M
85194 MB/s
MSI Venture 16 AI A2HMTG
Intel Core Ultra 7 255H, Arc 140T
77727 MB/s -9%
Lenovo ThinkPad T16 Gen 5 22AN001WGE
AMD Ryzen 5 PRO 215, Radeon 740M
42605 MB/s -50%
Asus ExpertBook B5 B5605CCA
Intel Core Ultra 5 225H, Arc 130T
39188 MB/s -54%
AIDA64 / Memory Latency
Asus ExpertBook B5 B5605CCA
Intel Core Ultra 5 225H, Arc 130T
115.7 ns * -16%
MSI Venture 16 AI A2HMTG
Intel Core Ultra 7 255H, Arc 140T
109 ns * -9%
Media AMD Ryzen AI 9 HX PRO 470
  (100.1 - 118.5, n=3)
106.7 ns * -7%
Lenovo ThinkPad T16 Gen 5 22AN001WGE
AMD Ryzen 5 PRO 215, Radeon 740M
105.8 ns * -6%
HP EliteBook 8 G1a 16 AI
AMD Ryzen AI 7 PRO 350, Radeon 860M
105.3 ns * -5%
Dell Pro 5 16 P516265
AMD Ryzen AI 9 HX PRO 470, Radeon 890M
100.1 ns *
Dell XPS 16 Core Ultra X7 358H
Intel Core Ultra X7 358H, Arc B390 Panther Lake iGPU
84.6 ns * +15%

* ... Meglio usare valori piccoli

Latenza DPC
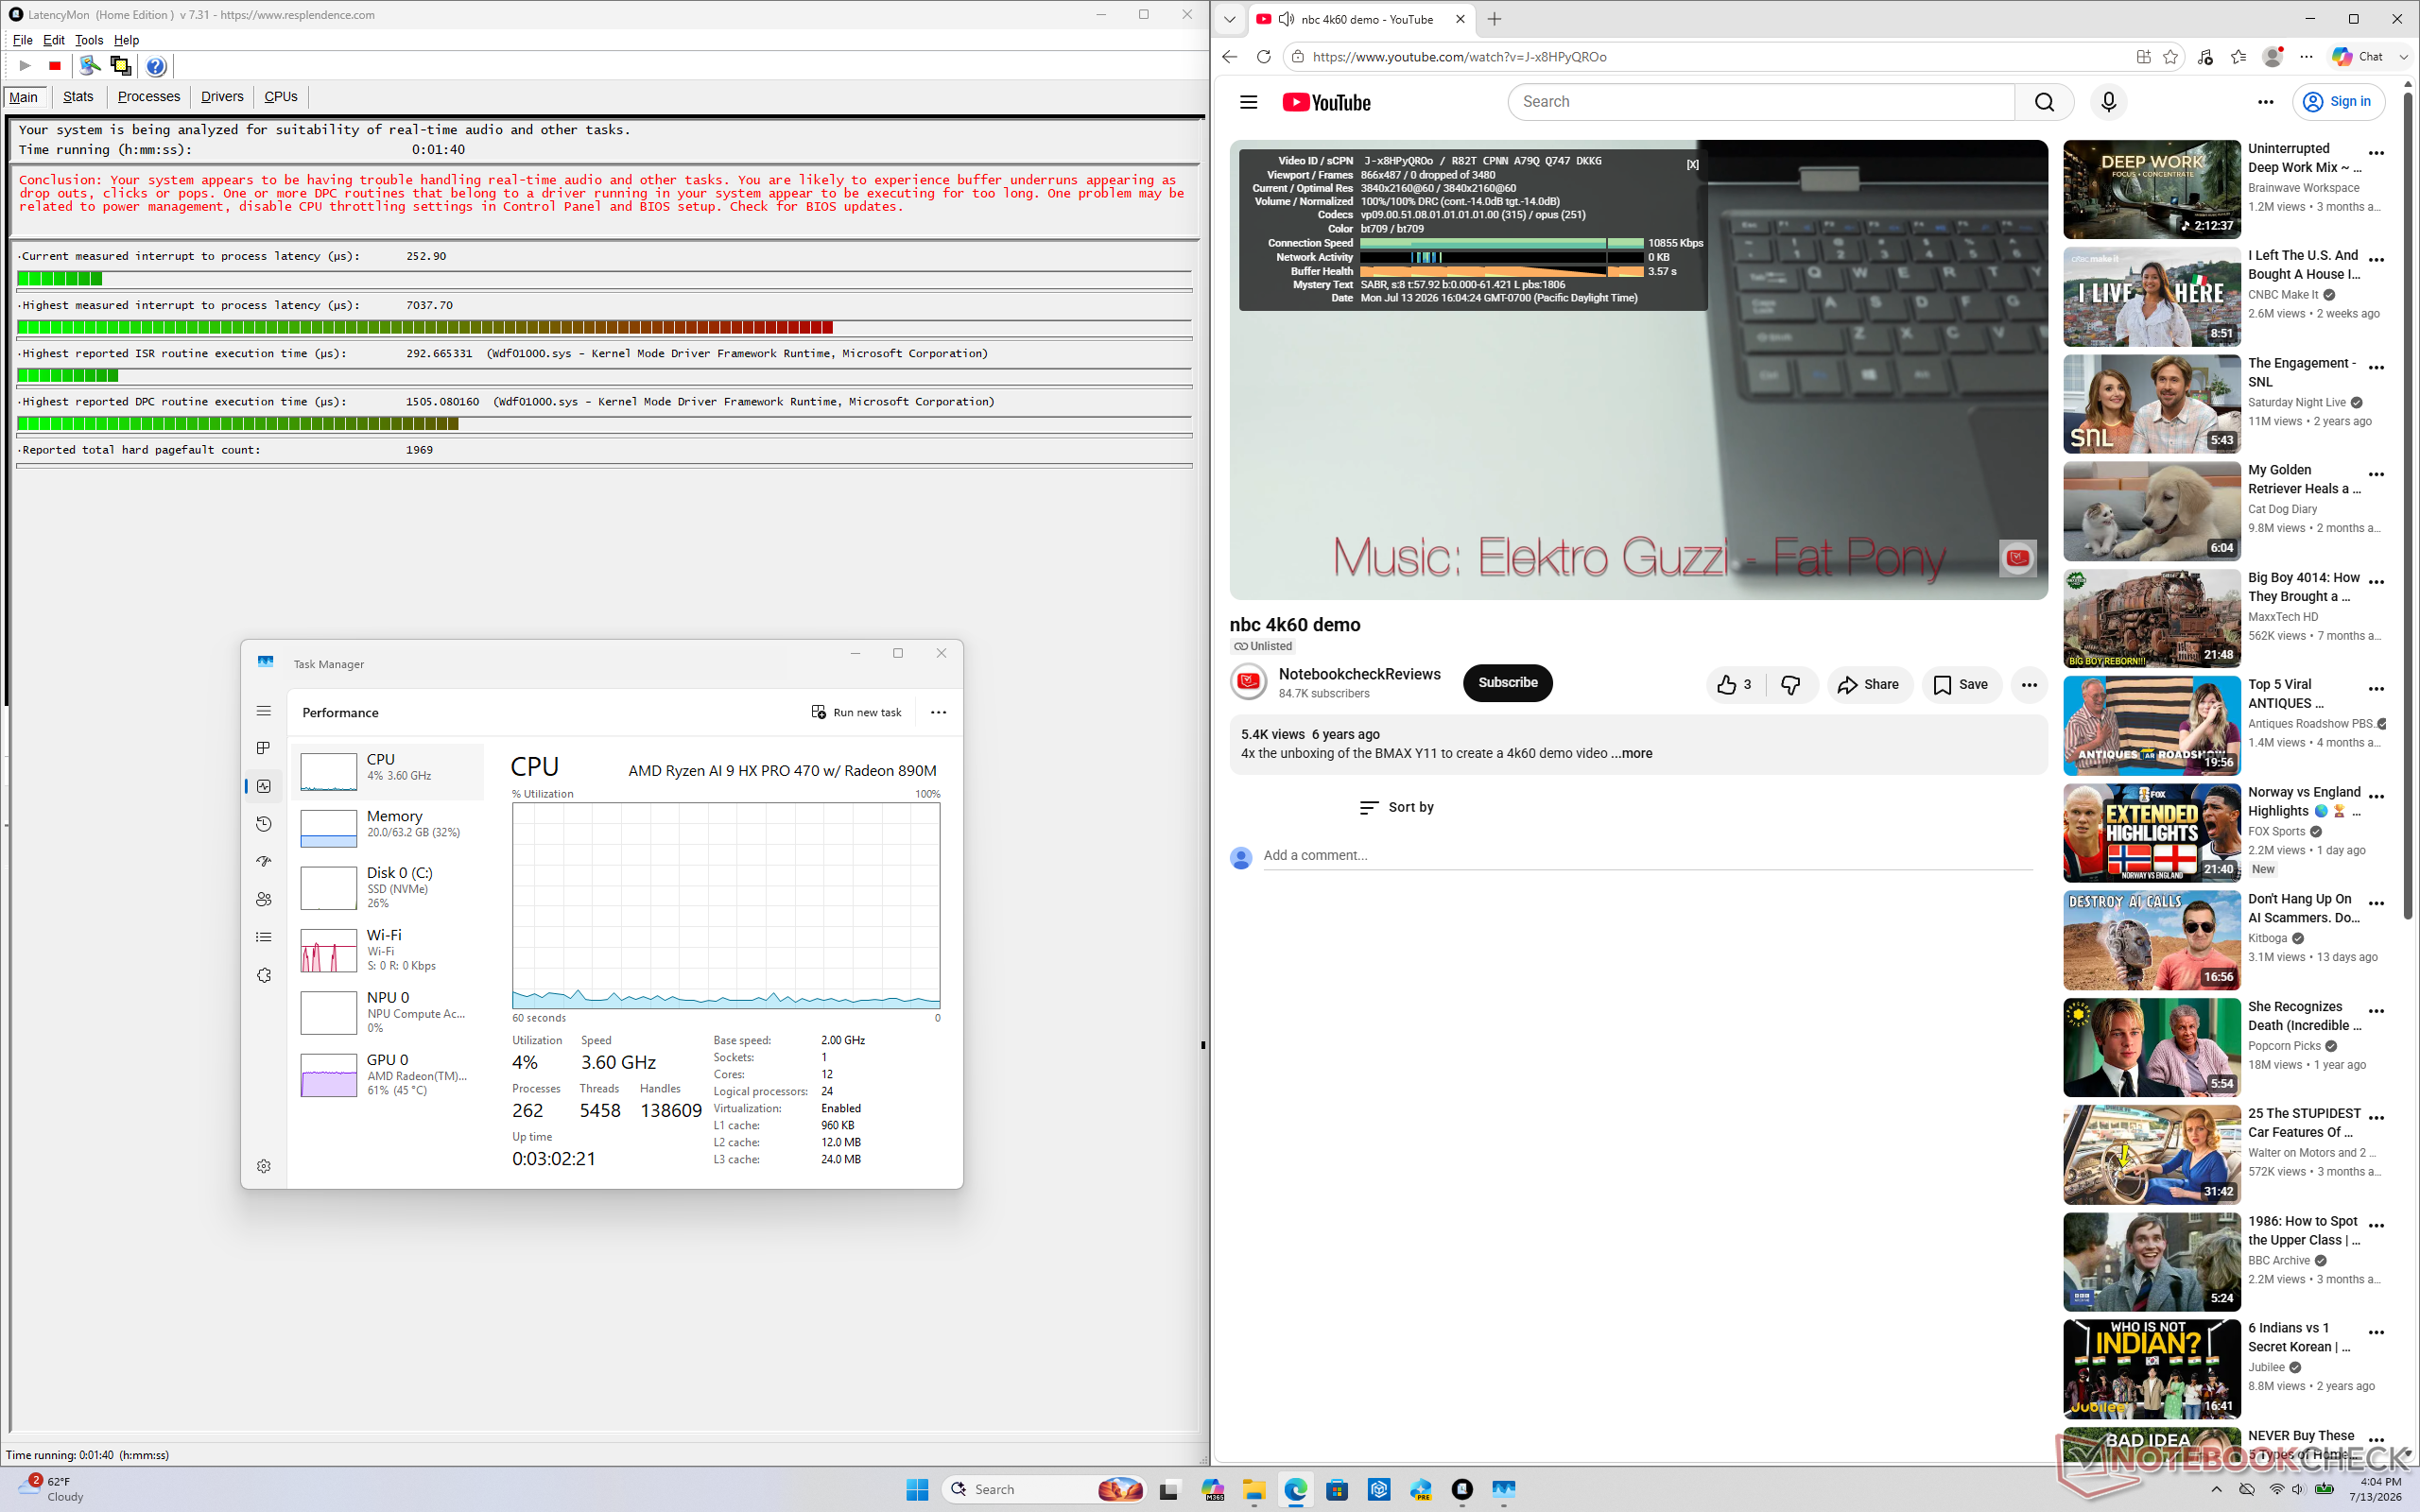
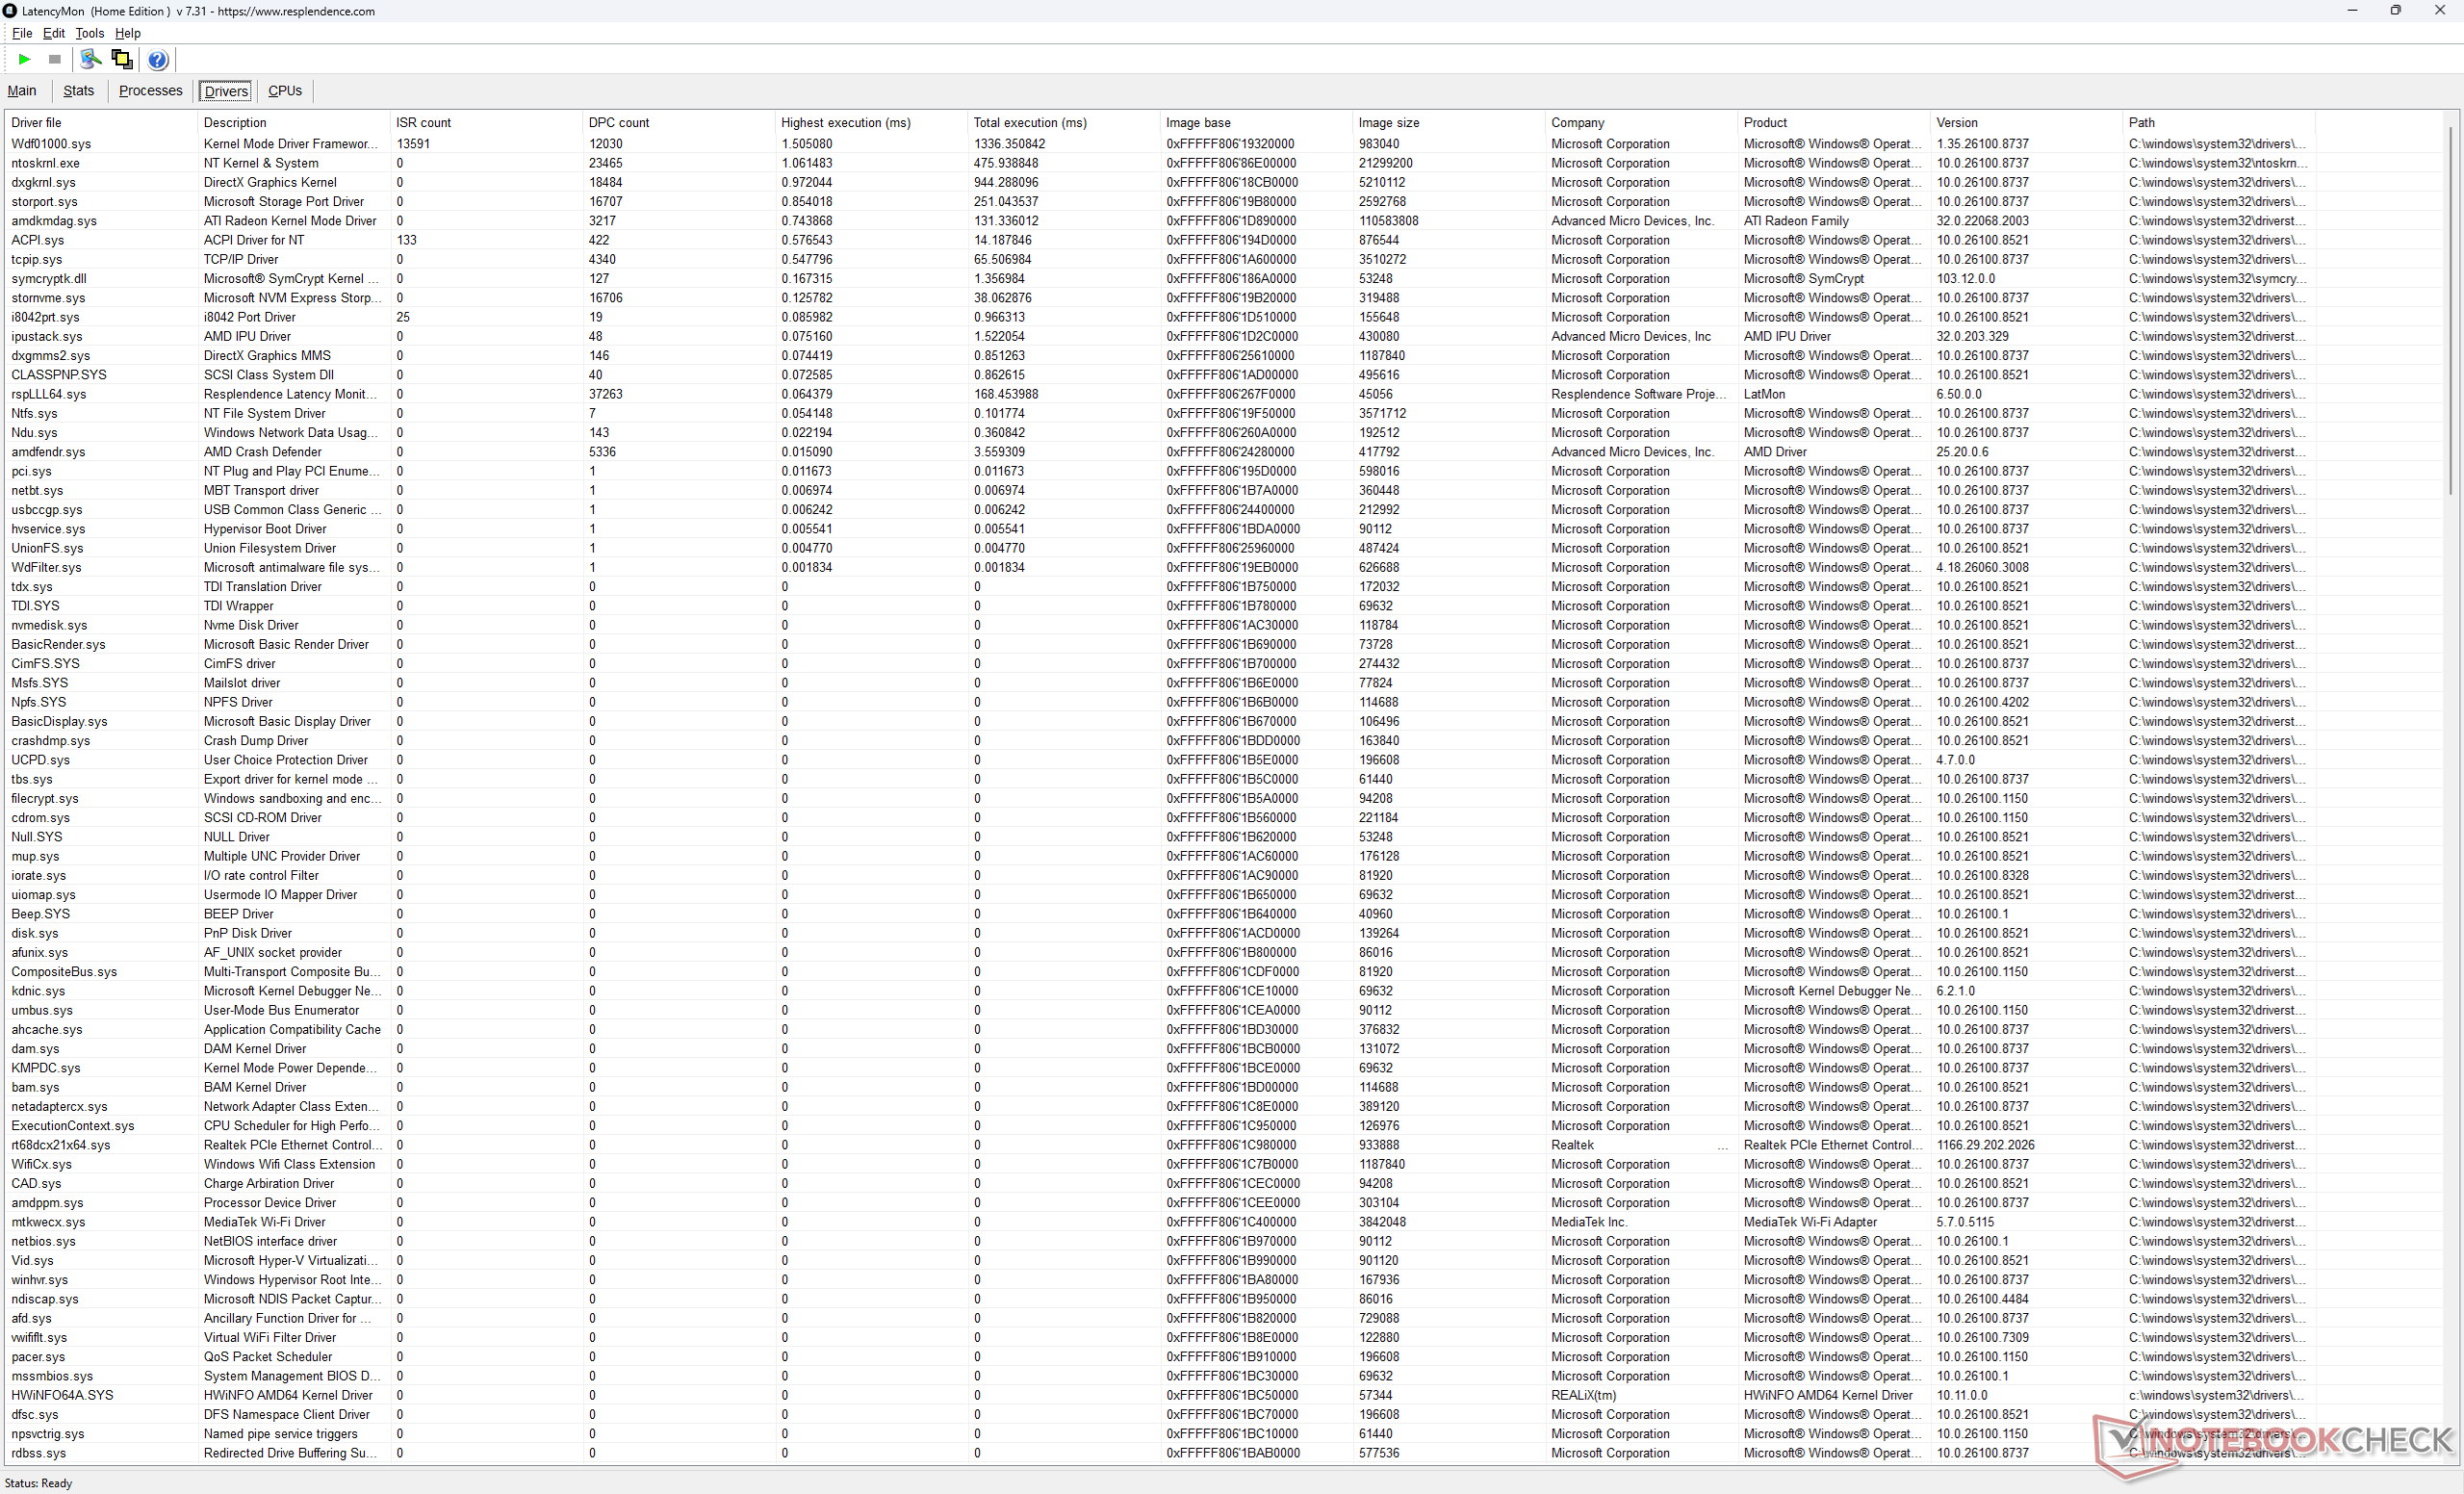
LatencyMon rileva problemi di DPC, ma per il resto non si verificano frame persi durante la riproduzione di video in 4K a 60 fps
Elenco dei driver
Elenco dei driver
DPC Latencies / LatencyMon - interrupt to process latency (max), Web, Youtube, Prime95
Dell Pro 5 16 P516265
Radeon 890M, Ryzen AI 9 HX PRO 470, SanDisk PC SN5100S
7037.7 μs *
HP EliteBook 8 G1a 16 AI
Radeon 860M, Ryzen AI 7 PRO 350, Micron 3500 MTFDKBA512TGD
5628.9 μs * +20%
MSI Venture 16 AI A2HMTG
Arc 140T, Ultra 7 255H
2467.2 μs * +65%
Asus ExpertBook B5 B5605CCA
Arc 130T, Ultra 5 225H, Micron 2500 MTFDKBA512QGN
2421.1 μs * +66%
Lenovo ThinkPad T16 Gen 5 22AN001WGE
Radeon 740M, R5 PRO 215, Samsung PM9C1b MZVL8512HFLU-00BLL
1316.2 μs * +81%
Dell XPS 16 Core Ultra X7 358H
Arc B390 Panther Lake iGPU, Ultra X7 358H
513.7 μs * +93%

* ... Meglio usare valori piccoli

Dispositivi di archiviazione
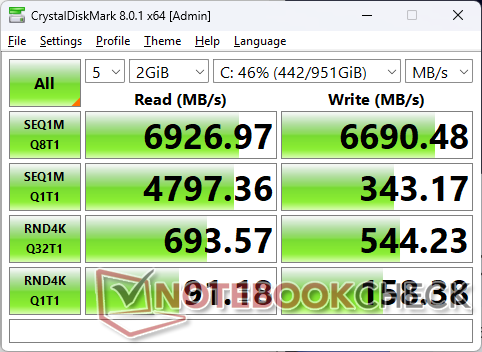
CDM 8
CDM 8
AS SSD
AS SSD
SanDisk PC SN5100S
CDM 5/6 Read Seq Q32T1: 6749 MB/s
CDM 5/6 Write Seq Q32T1: 6683 MB/s
CDM 5/6 Read 4K Q32T1: 693.2 MB/s
CDM 5/6 Write 4K Q32T1: 549.6 MB/s
CDM 5 Read Seq: 4745 MB/s
CDM 5 Write Seq: 4311 MB/s
CDM 5/6 Read 4K: 82.39 MB/s
CDM 5/6 Write 4K: 156.7 MB/s
Drive Performance rating - Percent
HP EliteBook 8 G1a 16 AI
Micron 3500 MTFDKBA512TGD
87 pt
Dell Pro 5 16 P516265
SanDisk PC SN5100S
82.1 pt
Asus ExpertBook B5 B5605CCA
Micron 2500 MTFDKBA512QGN
80.5 pt
Dell XPS 16 Core Ultra X7 358H
 
76.8 pt
Lenovo ThinkPad T16 Gen 5 22AN001WGE
Samsung PM9C1b MZVL8512HFLU-00BLL
70.9 pt
MSI Venture 16 AI A2HMTG
 
70 pt
DiskSpd
seq read
Dell Pro 5 16 P516265
SanDisk PC SN5100S
3788 (3754.74min - 3787.88max) MB/s
Dell XPS 16 Core Ultra X7 358H
 
3600 (3100.64min - 3600.18max) MB/s -5%
MSI Venture 16 AI A2HMTG
 
3459 (3115.95min - 3458.62max) MB/s -9%
HP EliteBook 8 G1a 16 AI
Micron 3500 MTFDKBA512TGD
3451 (3407.77min - 3451.07max) MB/s -9%
Asus ExpertBook B5 B5605CCA
Micron 2500 MTFDKBA512QGN
3130 (3044.44min - 3129.58max) MB/s -17%
Lenovo ThinkPad T16 Gen 5 22AN001WGE
Samsung PM9C1b MZVL8512HFLU-00BLL
2923 (2630.44min - 2922.8max) MB/s -23%
seq write
Dell Pro 5 16 P516265
SanDisk PC SN5100S
4280 (3249.96min - 4279.66max) MB/s
HP EliteBook 8 G1a 16 AI
Micron 3500 MTFDKBA512TGD
3810 (3218.56min - 3810.11max) MB/s -11%
MSI Venture 16 AI A2HMTG
 
3716 (3581.27min - 3716.36max) MB/s -13%
Asus ExpertBook B5 B5605CCA
Micron 2500 MTFDKBA512QGN
3518 (3278.21min - 3518.28max) MB/s -18%
Lenovo ThinkPad T16 Gen 5 22AN001WGE
Samsung PM9C1b MZVL8512HFLU-00BLL
2953 (2837.02min - 2953.21max) MB/s -31%
Dell XPS 16 Core Ultra X7 358H
 
2599 (796.92min - 2599.25max) MB/s -39%
seq q8 t1 read
Dell Pro 5 16 P516265
SanDisk PC SN5100S
7061 (6371.99min - 7061.46max) MB/s
Dell XPS 16 Core Ultra X7 358H
 
7039 (5536.1min - 7039.48max) MB/s 0%
HP EliteBook 8 G1a 16 AI
Micron 3500 MTFDKBA512TGD
7034 (5797.22min - 7033.83max) MB/s 0%
MSI Venture 16 AI A2HMTG
 
7030 (5829.87min - 7029.85max) MB/s 0%
Asus ExpertBook B5 B5605CCA
Micron 2500 MTFDKBA512QGN
6759 (5352.77min - 6758.7max) MB/s -4%
Lenovo ThinkPad T16 Gen 5 22AN001WGE
Samsung PM9C1b MZVL8512HFLU-00BLL
5920 (4743.97min - 5919.84max) MB/s -16%
seq q8 t1 write
Dell Pro 5 16 P516265
SanDisk PC SN5100S
6699 (5478.39min - 6698.96max) MB/s
Dell XPS 16 Core Ultra X7 358H
 
6101 (5938.22min - 6101.03max) MB/s -9%
MSI Venture 16 AI A2HMTG
 
5781 (5725.31min - 5780.8max) MB/s -14%
HP EliteBook 8 G1a 16 AI
Micron 3500 MTFDKBA512TGD
5580 (5219.39min - 5579.64max) MB/s -17%
Lenovo ThinkPad T16 Gen 5 22AN001WGE
Samsung PM9C1b MZVL8512HFLU-00BLL
4178 (3970.78min - 4178.16max) MB/s -38%
Asus ExpertBook B5 B5605CCA
Micron 2500 MTFDKBA512QGN
3686 (3662.27min - 3685.95max) MB/s -45%
4k q1 t1 read
Dell Pro 5 16 P516265
SanDisk PC SN5100S
87.6 (82.04min - 87.6max) MB/s
MSI Venture 16 AI A2HMTG
 
70.6 (70.28min - 70.62max) MB/s -19%
Asus ExpertBook B5 B5605CCA
Micron 2500 MTFDKBA512QGN
67.7 (16.42min - 67.69max) MB/s -23%
HP EliteBook 8 G1a 16 AI
Micron 3500 MTFDKBA512TGD
64.7 (63.97min - 64.71max) MB/s -26%
Lenovo ThinkPad T16 Gen 5 22AN001WGE
Samsung PM9C1b MZVL8512HFLU-00BLL
62.9 (60.4min - 62.86max) MB/s -28%
Dell XPS 16 Core Ultra X7 358H
 
59.1 (53.74min - 59.08max) MB/s -33%
4k q1 t1 write
Asus ExpertBook B5 B5605CCA
Micron 2500 MTFDKBA512QGN
167.2 (160.9min - 167.23max) MB/s +13%
MSI Venture 16 AI A2HMTG
 
156 (154.1min - 156.01max) MB/s +5%
Dell Pro 5 16 P516265
SanDisk PC SN5100S
148.4 (143.87min - 148.36max) MB/s
Dell XPS 16 Core Ultra X7 358H
 
145.5 (139.46min - 145.49max) MB/s -2%
HP EliteBook 8 G1a 16 AI
Micron 3500 MTFDKBA512TGD
145.3 (139.41min - 145.3max) MB/s -2%
Lenovo ThinkPad T16 Gen 5 22AN001WGE
Samsung PM9C1b MZVL8512HFLU-00BLL
135.8 (121.93min - 135.79max) MB/s -8%
4k q32 t16 read
HP EliteBook 8 G1a 16 AI
Micron 3500 MTFDKBA512TGD
902 (889.61min - 901.61max) MB/s +5%
Dell Pro 5 16 P516265
SanDisk PC SN5100S
857 (811.21min - 857.27max) MB/s
Lenovo ThinkPad T16 Gen 5 22AN001WGE
Samsung PM9C1b MZVL8512HFLU-00BLL
800 (779.99min - 799.67max) MB/s -7%
MSI Venture 16 AI A2HMTG
 
749 (725.2min - 748.69max) MB/s -13%
Dell XPS 16 Core Ultra X7 358H
 
652 (602.16min - 651.54max) MB/s -24%
Asus ExpertBook B5 B5605CCA
Micron 2500 MTFDKBA512QGN
619 (612.02min - 618.83max) MB/s -28%
4k q32 t16 write
HP EliteBook 8 G1a 16 AI
Micron 3500 MTFDKBA512TGD
555 (533.25min - 554.9max) MB/s +12%
MSI Venture 16 AI A2HMTG
 
522 (486.21min - 522.14max) MB/s +5%
Dell Pro 5 16 P516265
SanDisk PC SN5100S
496 (451.35min - 496.31max) MB/s
Asus ExpertBook B5 B5605CCA
Micron 2500 MTFDKBA512QGN
488 (481.29min - 487.52max) MB/s -2%
Dell XPS 16 Core Ultra X7 358H
 
447 (308.53min - 447.08max) MB/s -10%
Lenovo ThinkPad T16 Gen 5 22AN001WGE
Samsung PM9C1b MZVL8512HFLU-00BLL
375 (350.6min - 374.64max) MB/s -24%
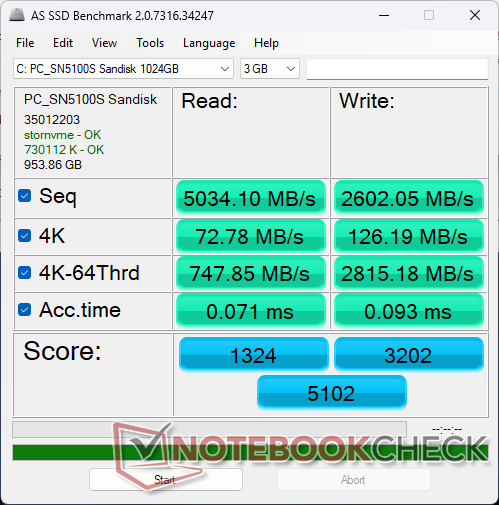
AS SSD
Score Total
HP EliteBook 8 G1a 16 AI
Micron 3500 MTFDKBA512TGD
5911 Points +16%
Dell XPS 16 Core Ultra X7 358H
 
5309 Points +4%
Dell Pro 5 16 P516265
SanDisk PC SN5100S
5102 Points
Asus ExpertBook B5 B5605CCA
Micron 2500 MTFDKBA512QGN
5080 Points 0%
Lenovo ThinkPad T16 Gen 5 22AN001WGE
Samsung PM9C1b MZVL8512HFLU-00BLL
3867 Points -24%
MSI Venture 16 AI A2HMTG
 
3190 Points -37%
Score Read
HP EliteBook 8 G1a 16 AI
Micron 3500 MTFDKBA512TGD
1584 Points +20%
Asus ExpertBook B5 B5605CCA
Micron 2500 MTFDKBA512QGN
1499 Points +13%
Dell XPS 16 Core Ultra X7 358H
 
1423 Points +7%
Dell Pro 5 16 P516265
SanDisk PC SN5100S
1324 Points
MSI Venture 16 AI A2HMTG
 
1262 Points -5%
Lenovo ThinkPad T16 Gen 5 22AN001WGE
Samsung PM9C1b MZVL8512HFLU-00BLL
1125 Points -15%
Score Write
HP EliteBook 8 G1a 16 AI
Micron 3500 MTFDKBA512TGD
3587 Points +12%
Dell XPS 16 Core Ultra X7 358H
 
3277 Points +2%
Dell Pro 5 16 P516265
SanDisk PC SN5100S
3202 Points
Asus ExpertBook B5 B5605CCA
Micron 2500 MTFDKBA512QGN
2964 Points -7%
Lenovo ThinkPad T16 Gen 5 22AN001WGE
Samsung PM9C1b MZVL8512HFLU-00BLL
2232 Points -30%
MSI Venture 16 AI A2HMTG
 
1354 Points -58%
Seq Read
HP EliteBook 8 G1a 16 AI
Micron 3500 MTFDKBA512TGD
5376.02 MB/s +7%
Dell XPS 16 Core Ultra X7 358H
 
5083.41 MB/s +1%
Dell Pro 5 16 P516265
SanDisk PC SN5100S
5034.1 MB/s
Asus ExpertBook B5 B5605CCA
Micron 2500 MTFDKBA512QGN
4886 MB/s -3%
Lenovo ThinkPad T16 Gen 5 22AN001WGE
Samsung PM9C1b MZVL8512HFLU-00BLL
3746 MB/s -26%
MSI Venture 16 AI A2HMTG
 
3129.37 MB/s -38%
Seq Write
HP EliteBook 8 G1a 16 AI
Micron 3500 MTFDKBA512TGD
3708.7 MB/s +43%
Dell Pro 5 16 P516265
SanDisk PC SN5100S
2602.05 MB/s
Dell XPS 16 Core Ultra X7 358H
 
2509.02 MB/s -4%
Lenovo ThinkPad T16 Gen 5 22AN001WGE
Samsung PM9C1b MZVL8512HFLU-00BLL
2097 MB/s -19%
Asus ExpertBook B5 B5605CCA
Micron 2500 MTFDKBA512QGN
1608 MB/s -38%
MSI Venture 16 AI A2HMTG
 
1302.17 MB/s -50%
4K Read
Dell Pro 5 16 P516265
SanDisk PC SN5100S
72.78 MB/s
MSI Venture 16 AI A2HMTG
 
68.7 MB/s -6%
Asus ExpertBook B5 B5605CCA
Micron 2500 MTFDKBA512QGN
63.3 MB/s -13%
HP EliteBook 8 G1a 16 AI
Micron 3500 MTFDKBA512TGD
61.16 MB/s -16%
Lenovo ThinkPad T16 Gen 5 22AN001WGE
Samsung PM9C1b MZVL8512HFLU-00BLL
58.7 MB/s -19%
Dell XPS 16 Core Ultra X7 358H
 
52.53 MB/s -28%
4K Write
Asus ExpertBook B5 B5605CCA
Micron 2500 MTFDKBA512QGN
245 MB/s +94%
MSI Venture 16 AI A2HMTG
 
210.64 MB/s +67%
HP EliteBook 8 G1a 16 AI
Micron 3500 MTFDKBA512TGD
194.49 MB/s +54%
Lenovo ThinkPad T16 Gen 5 22AN001WGE
Samsung PM9C1b MZVL8512HFLU-00BLL
156.9 MB/s +24%
Dell Pro 5 16 P516265
SanDisk PC SN5100S
126.19 MB/s
Dell XPS 16 Core Ultra X7 358H
 
125.58 MB/s 0%
4K-64 Read
HP EliteBook 8 G1a 16 AI
Micron 3500 MTFDKBA512TGD
985.17 MB/s +32%
Asus ExpertBook B5 B5605CCA
Micron 2500 MTFDKBA512QGN
947 MB/s +27%
MSI Venture 16 AI A2HMTG
 
880.27 MB/s +18%
Dell XPS 16 Core Ultra X7 358H
 
862.49 MB/s +15%
Dell Pro 5 16 P516265
SanDisk PC SN5100S
747.85 MB/s
Lenovo ThinkPad T16 Gen 5 22AN001WGE
Samsung PM9C1b MZVL8512HFLU-00BLL
692 MB/s -7%
4K-64 Write
HP EliteBook 8 G1a 16 AI
Micron 3500 MTFDKBA512TGD
3022.06 MB/s +7%
Dell XPS 16 Core Ultra X7 358H
 
2900.39 MB/s +3%
Dell Pro 5 16 P516265
SanDisk PC SN5100S
2815.18 MB/s
Asus ExpertBook B5 B5605CCA
Micron 2500 MTFDKBA512QGN
2559 MB/s -9%
Lenovo ThinkPad T16 Gen 5 22AN001WGE
Samsung PM9C1b MZVL8512HFLU-00BLL
1865 MB/s -34%
MSI Venture 16 AI A2HMTG
 
1013.6 MB/s -64%
Access Time Read
MSI Venture 16 AI A2HMTG
 
0.125 ms * -76%
Asus ExpertBook B5 B5605CCA
Micron 2500 MTFDKBA512QGN
0.084 ms * -18%
HP EliteBook 8 G1a 16 AI
Micron 3500 MTFDKBA512TGD
0.078 ms * -10%
Dell Pro 5 16 P516265
SanDisk PC SN5100S
0.071 ms *
Dell XPS 16 Core Ultra X7 358H
 
0.059 ms * +17%
Lenovo ThinkPad T16 Gen 5 22AN001WGE
Samsung PM9C1b MZVL8512HFLU-00BLL
0.038 ms * +46%
Access Time Write
Dell Pro 5 16 P516265
SanDisk PC SN5100S
0.093 ms *
Dell XPS 16 Core Ultra X7 358H
 
0.082 ms * +12%
HP EliteBook 8 G1a 16 AI
Micron 3500 MTFDKBA512TGD
0.066 ms * +29%
MSI Venture 16 AI A2HMTG
 
0.05 ms * +46%
Lenovo ThinkPad T16 Gen 5 22AN001WGE
Samsung PM9C1b MZVL8512HFLU-00BLL
0.024 ms * +74%
Asus ExpertBook B5 B5605CCA
Micron 2500 MTFDKBA512QGN
0.016 ms * +83%

* ... Meglio usare valori piccoli

Limitazione della velocità del disco: ciclo di lettura DiskSpd, profondità della coda 8

0145290435580725870101511601305145015951740188520302175232024652610275529003045319033353480362537703915406042054350449546404785493050755220536555105655580059456090623563806525667068156960Tooltip
Dell Pro 5 16 P516265 SanDisk PC SN5100S; diskspd 2.0.17 f: Ø7051 (6192.26-7076.84) MB/s
Lenovo ThinkPad T16 Gen 5 22AN001WGE Samsung PM9C1b MZVL8512HFLU-00BLL; diskspd 2.0.17 f: Ø4669 (4117.49-4849.24) MB/s

Prestazioni della GPU

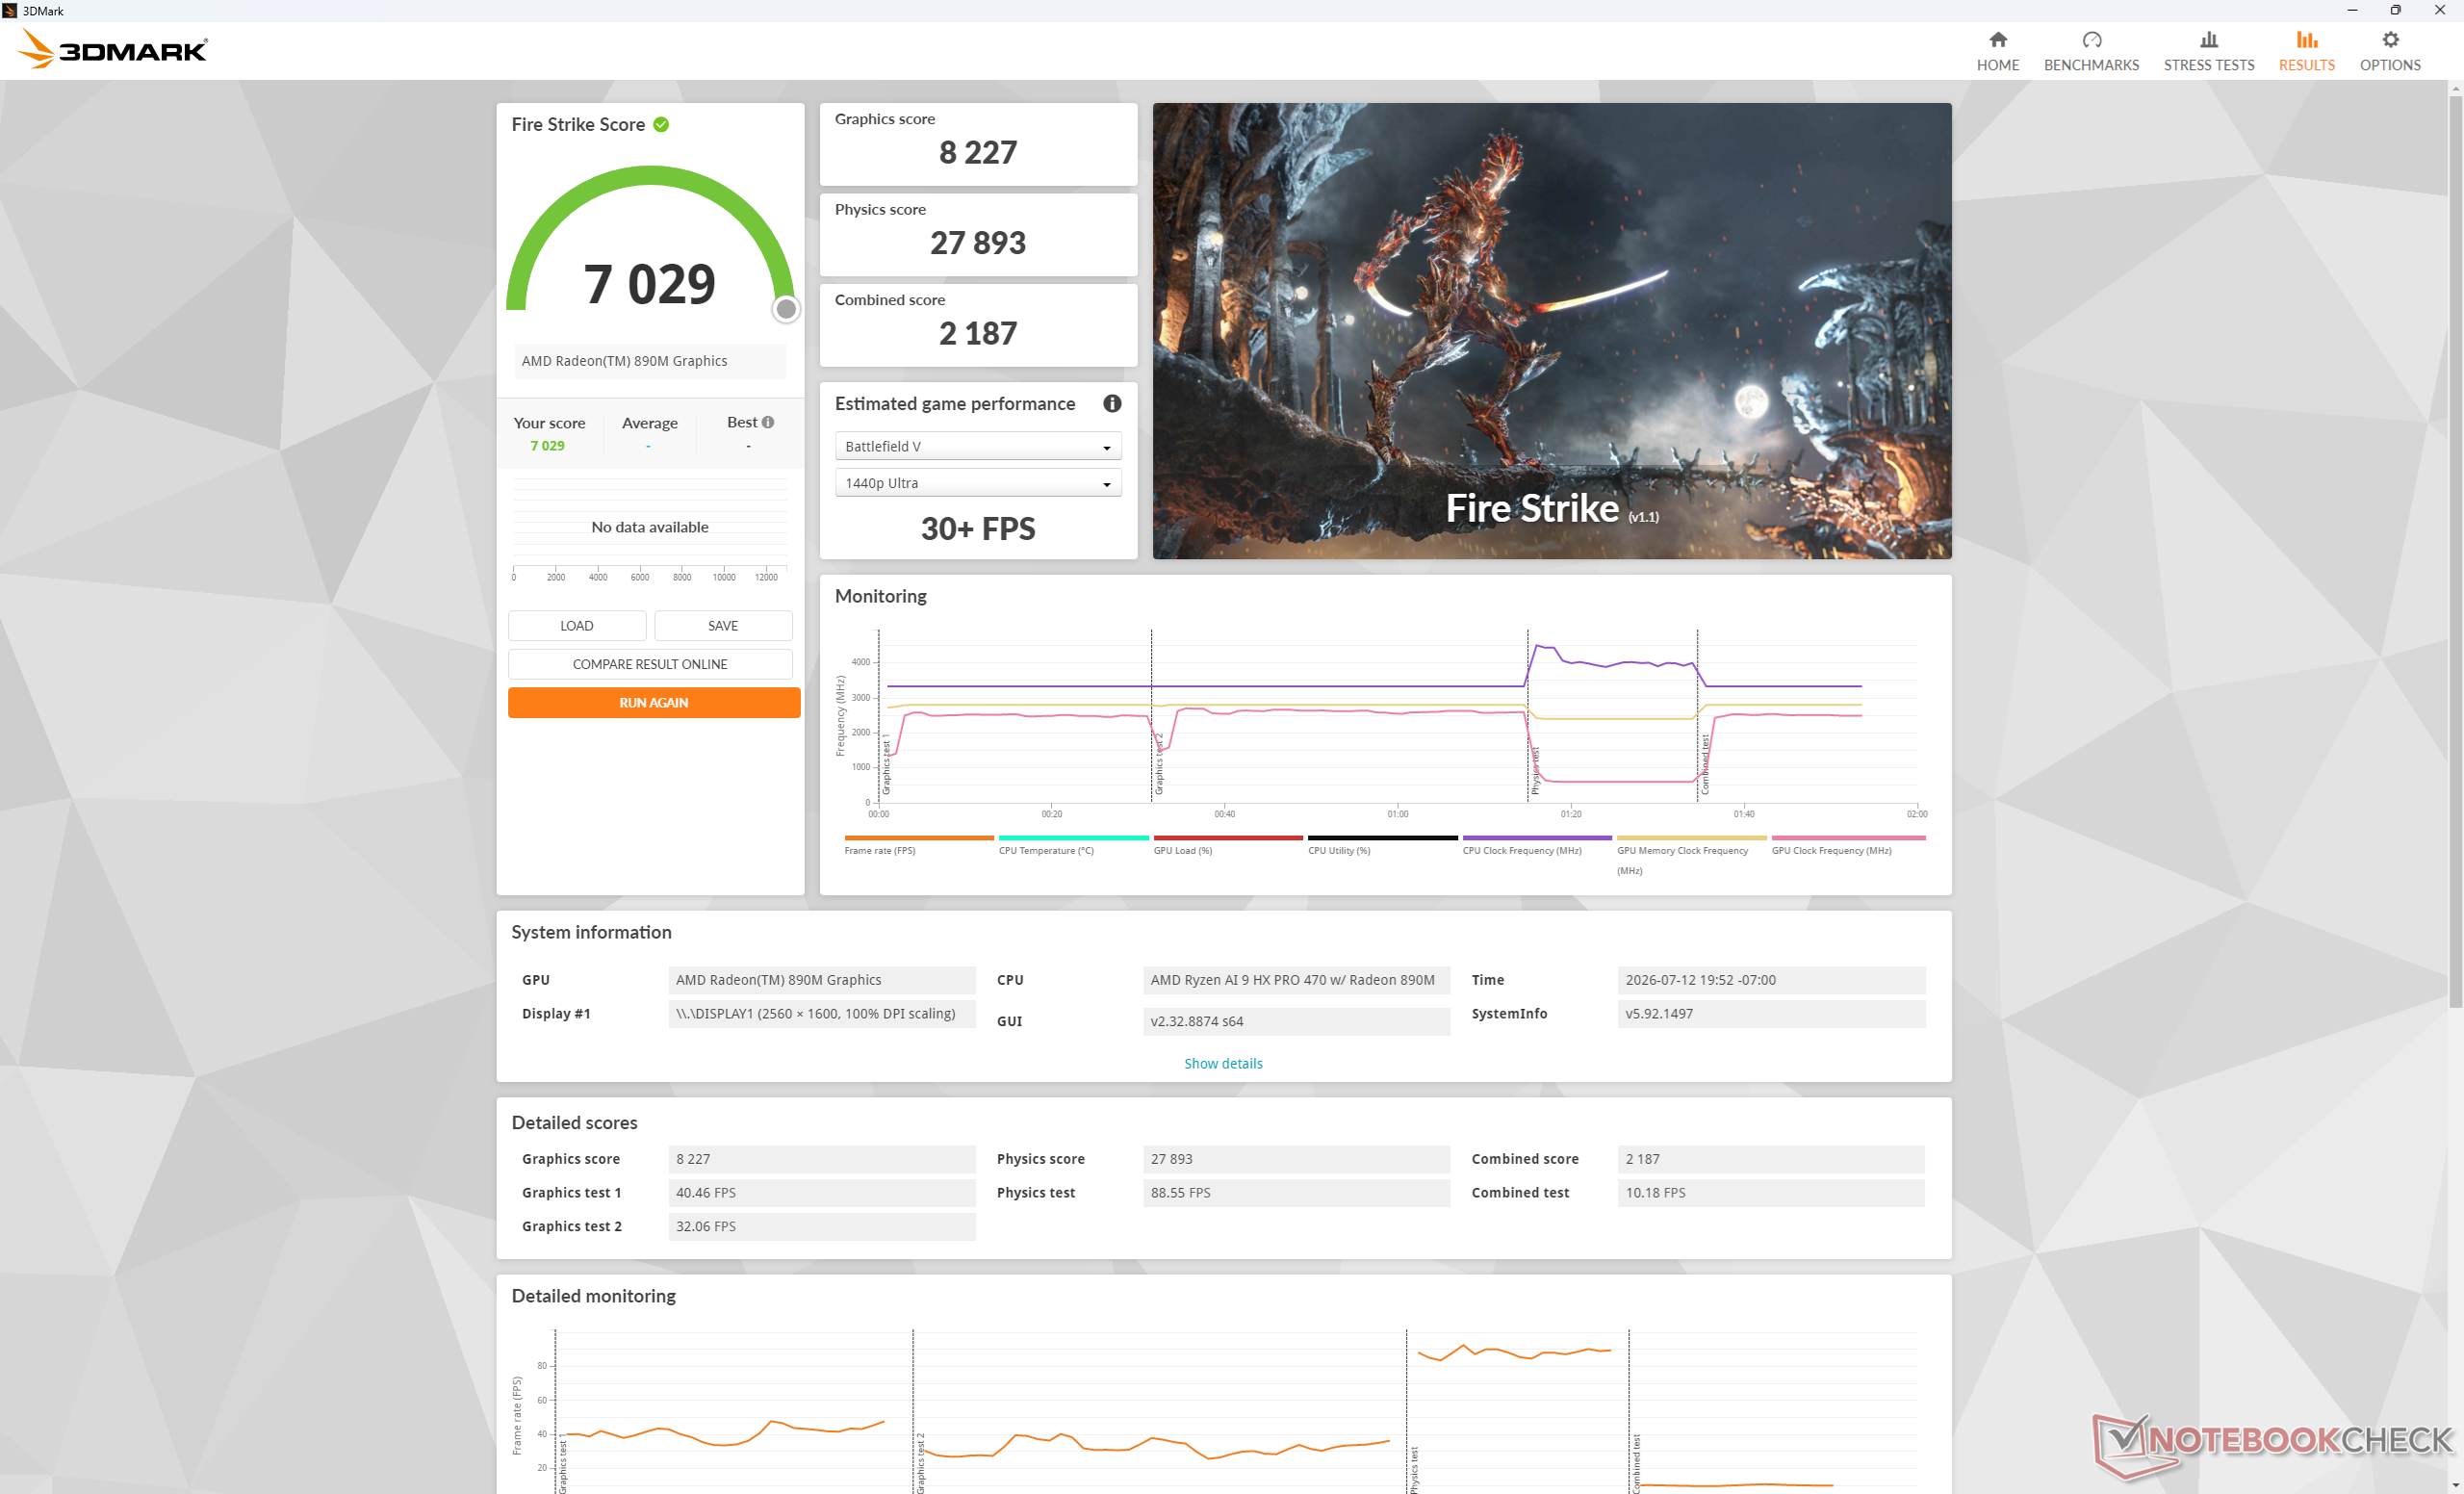
Profilo di potenzaPunteggio GraficaPunteggio di fisicaPunteggio combinato
Modalità Prestazioni822727.8932187
Modalità bilanciata6746 (-18%)27923 (-0%)2120 (-0%)
Alimentazione a batteria6.666 (-19 %)27.029 (-3%)2159 (-0%)
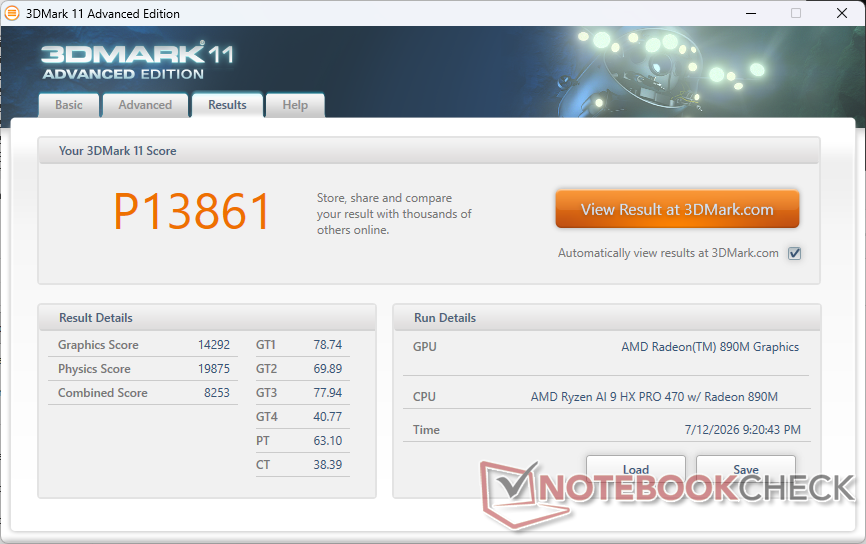
3DMark 11
3DMark 11
Fire Strike
Fire Strike
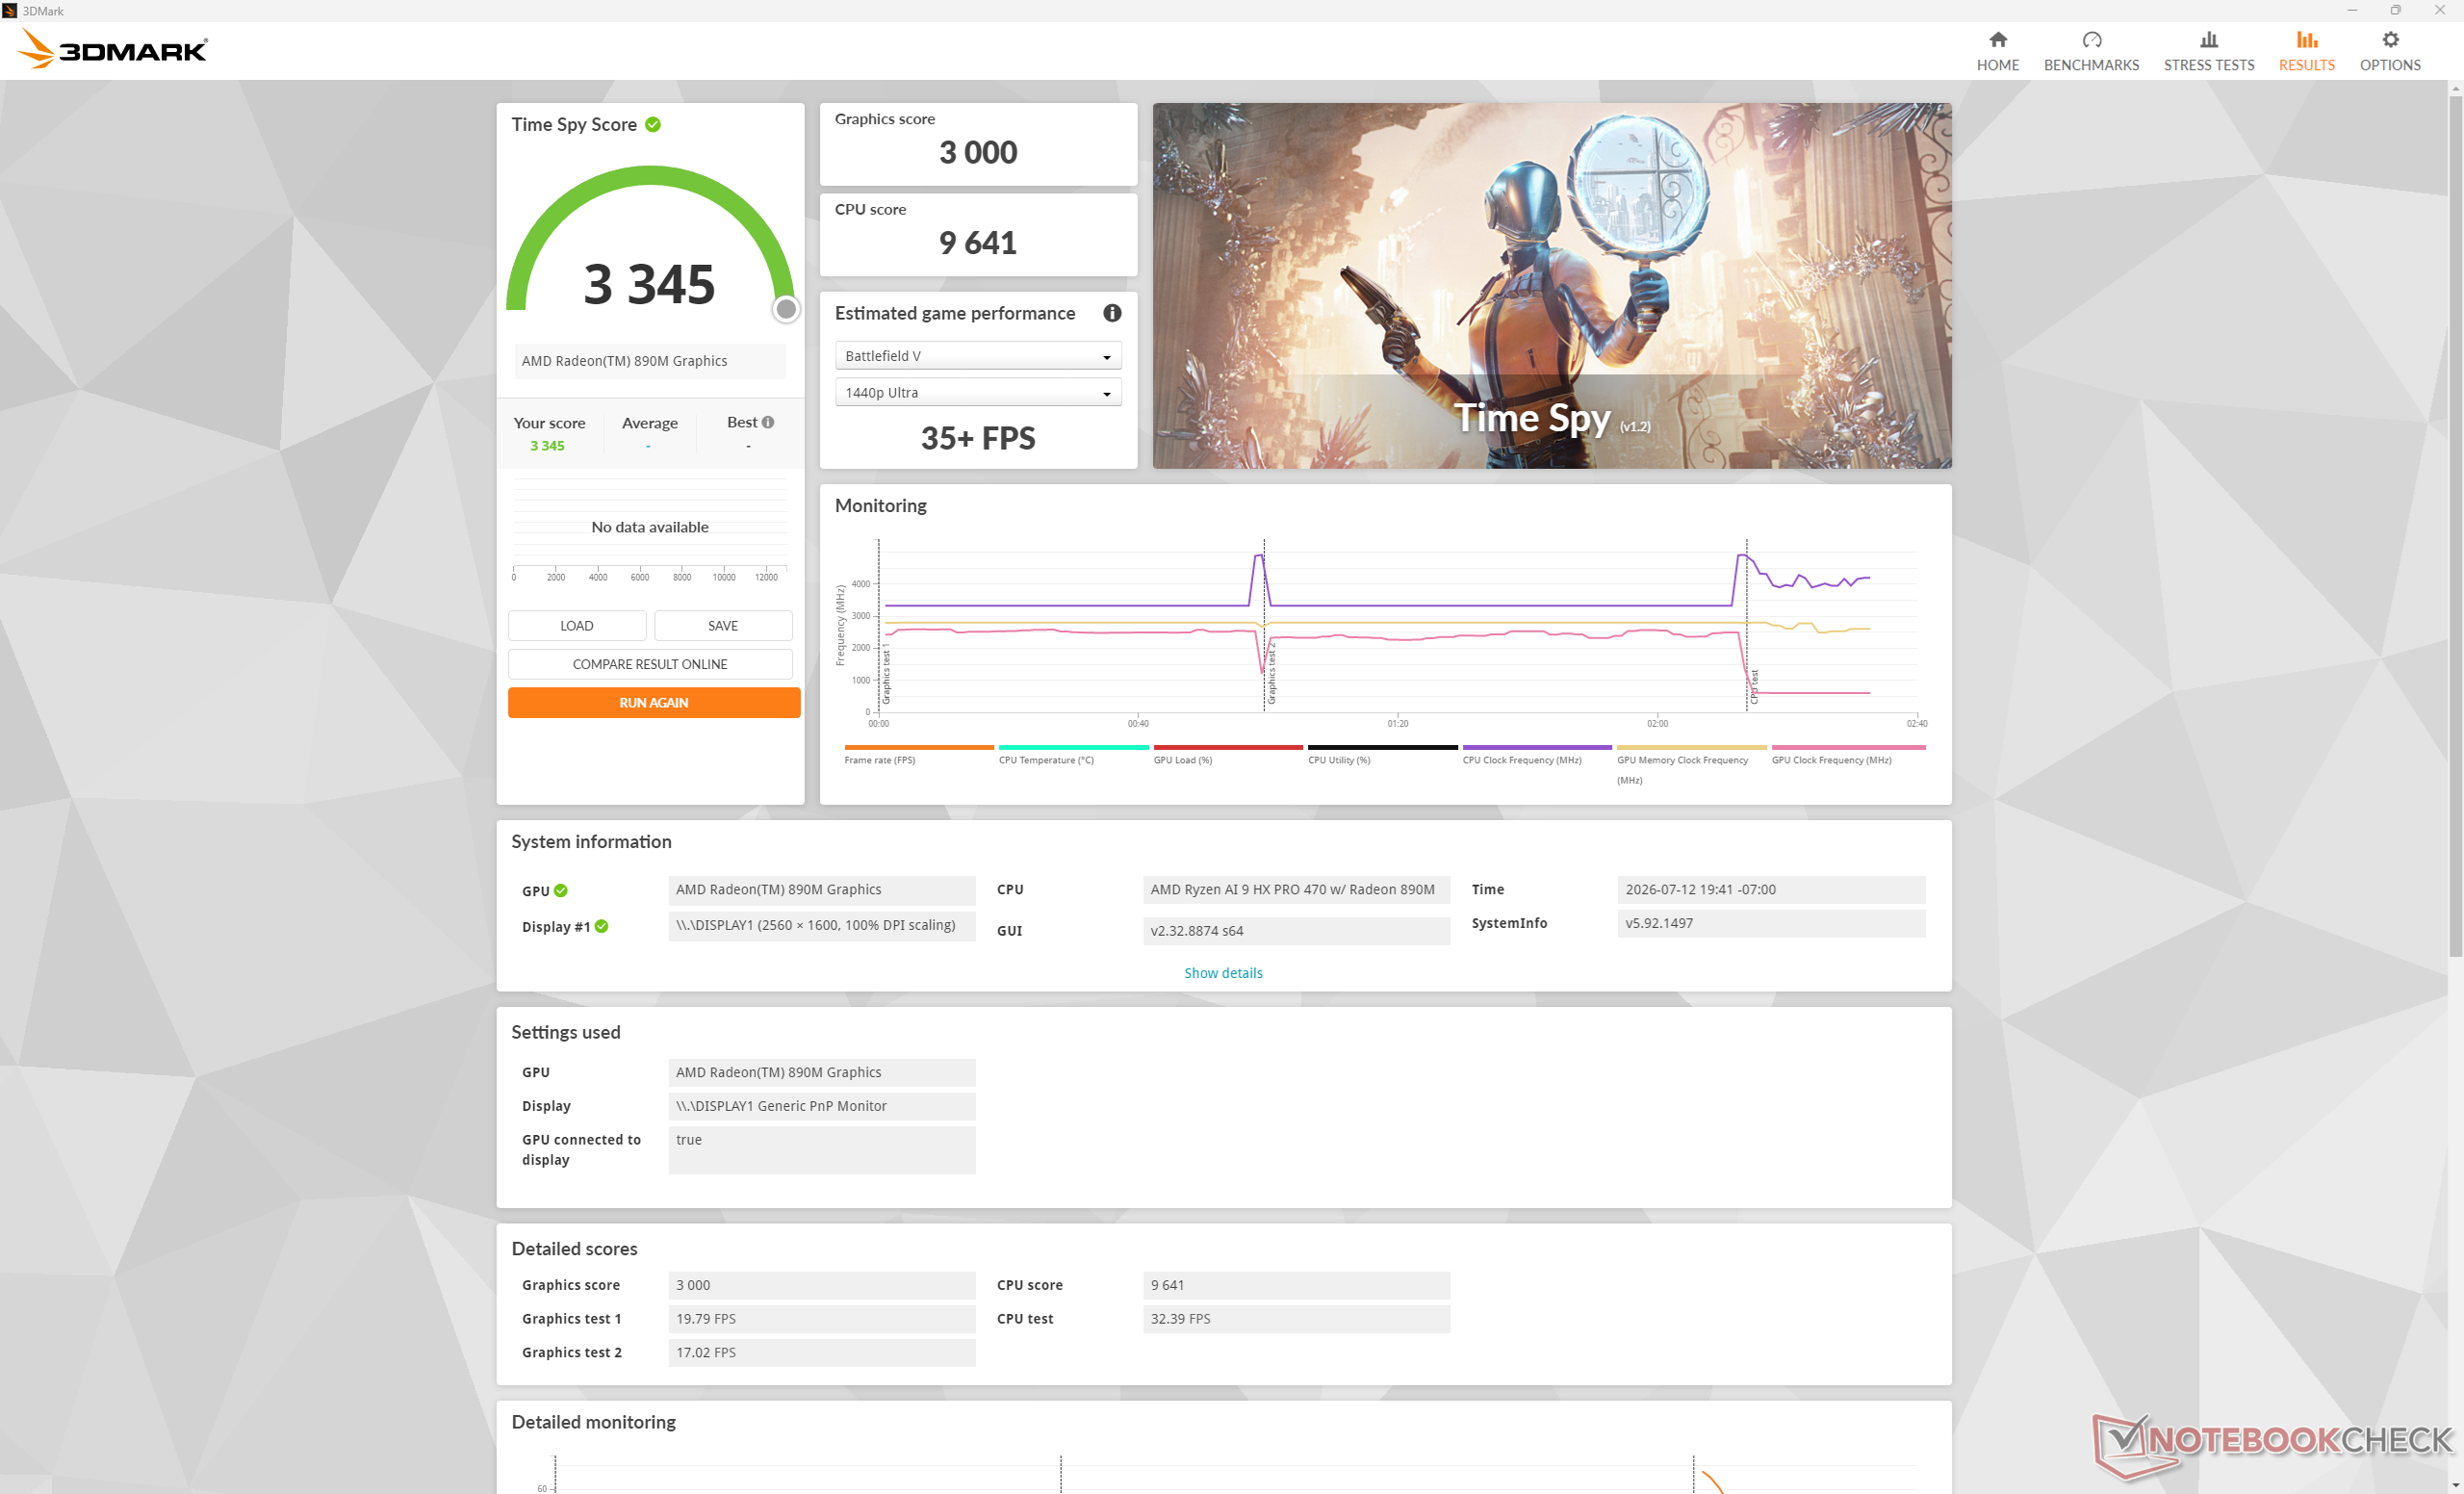
Time Spy
Time Spy
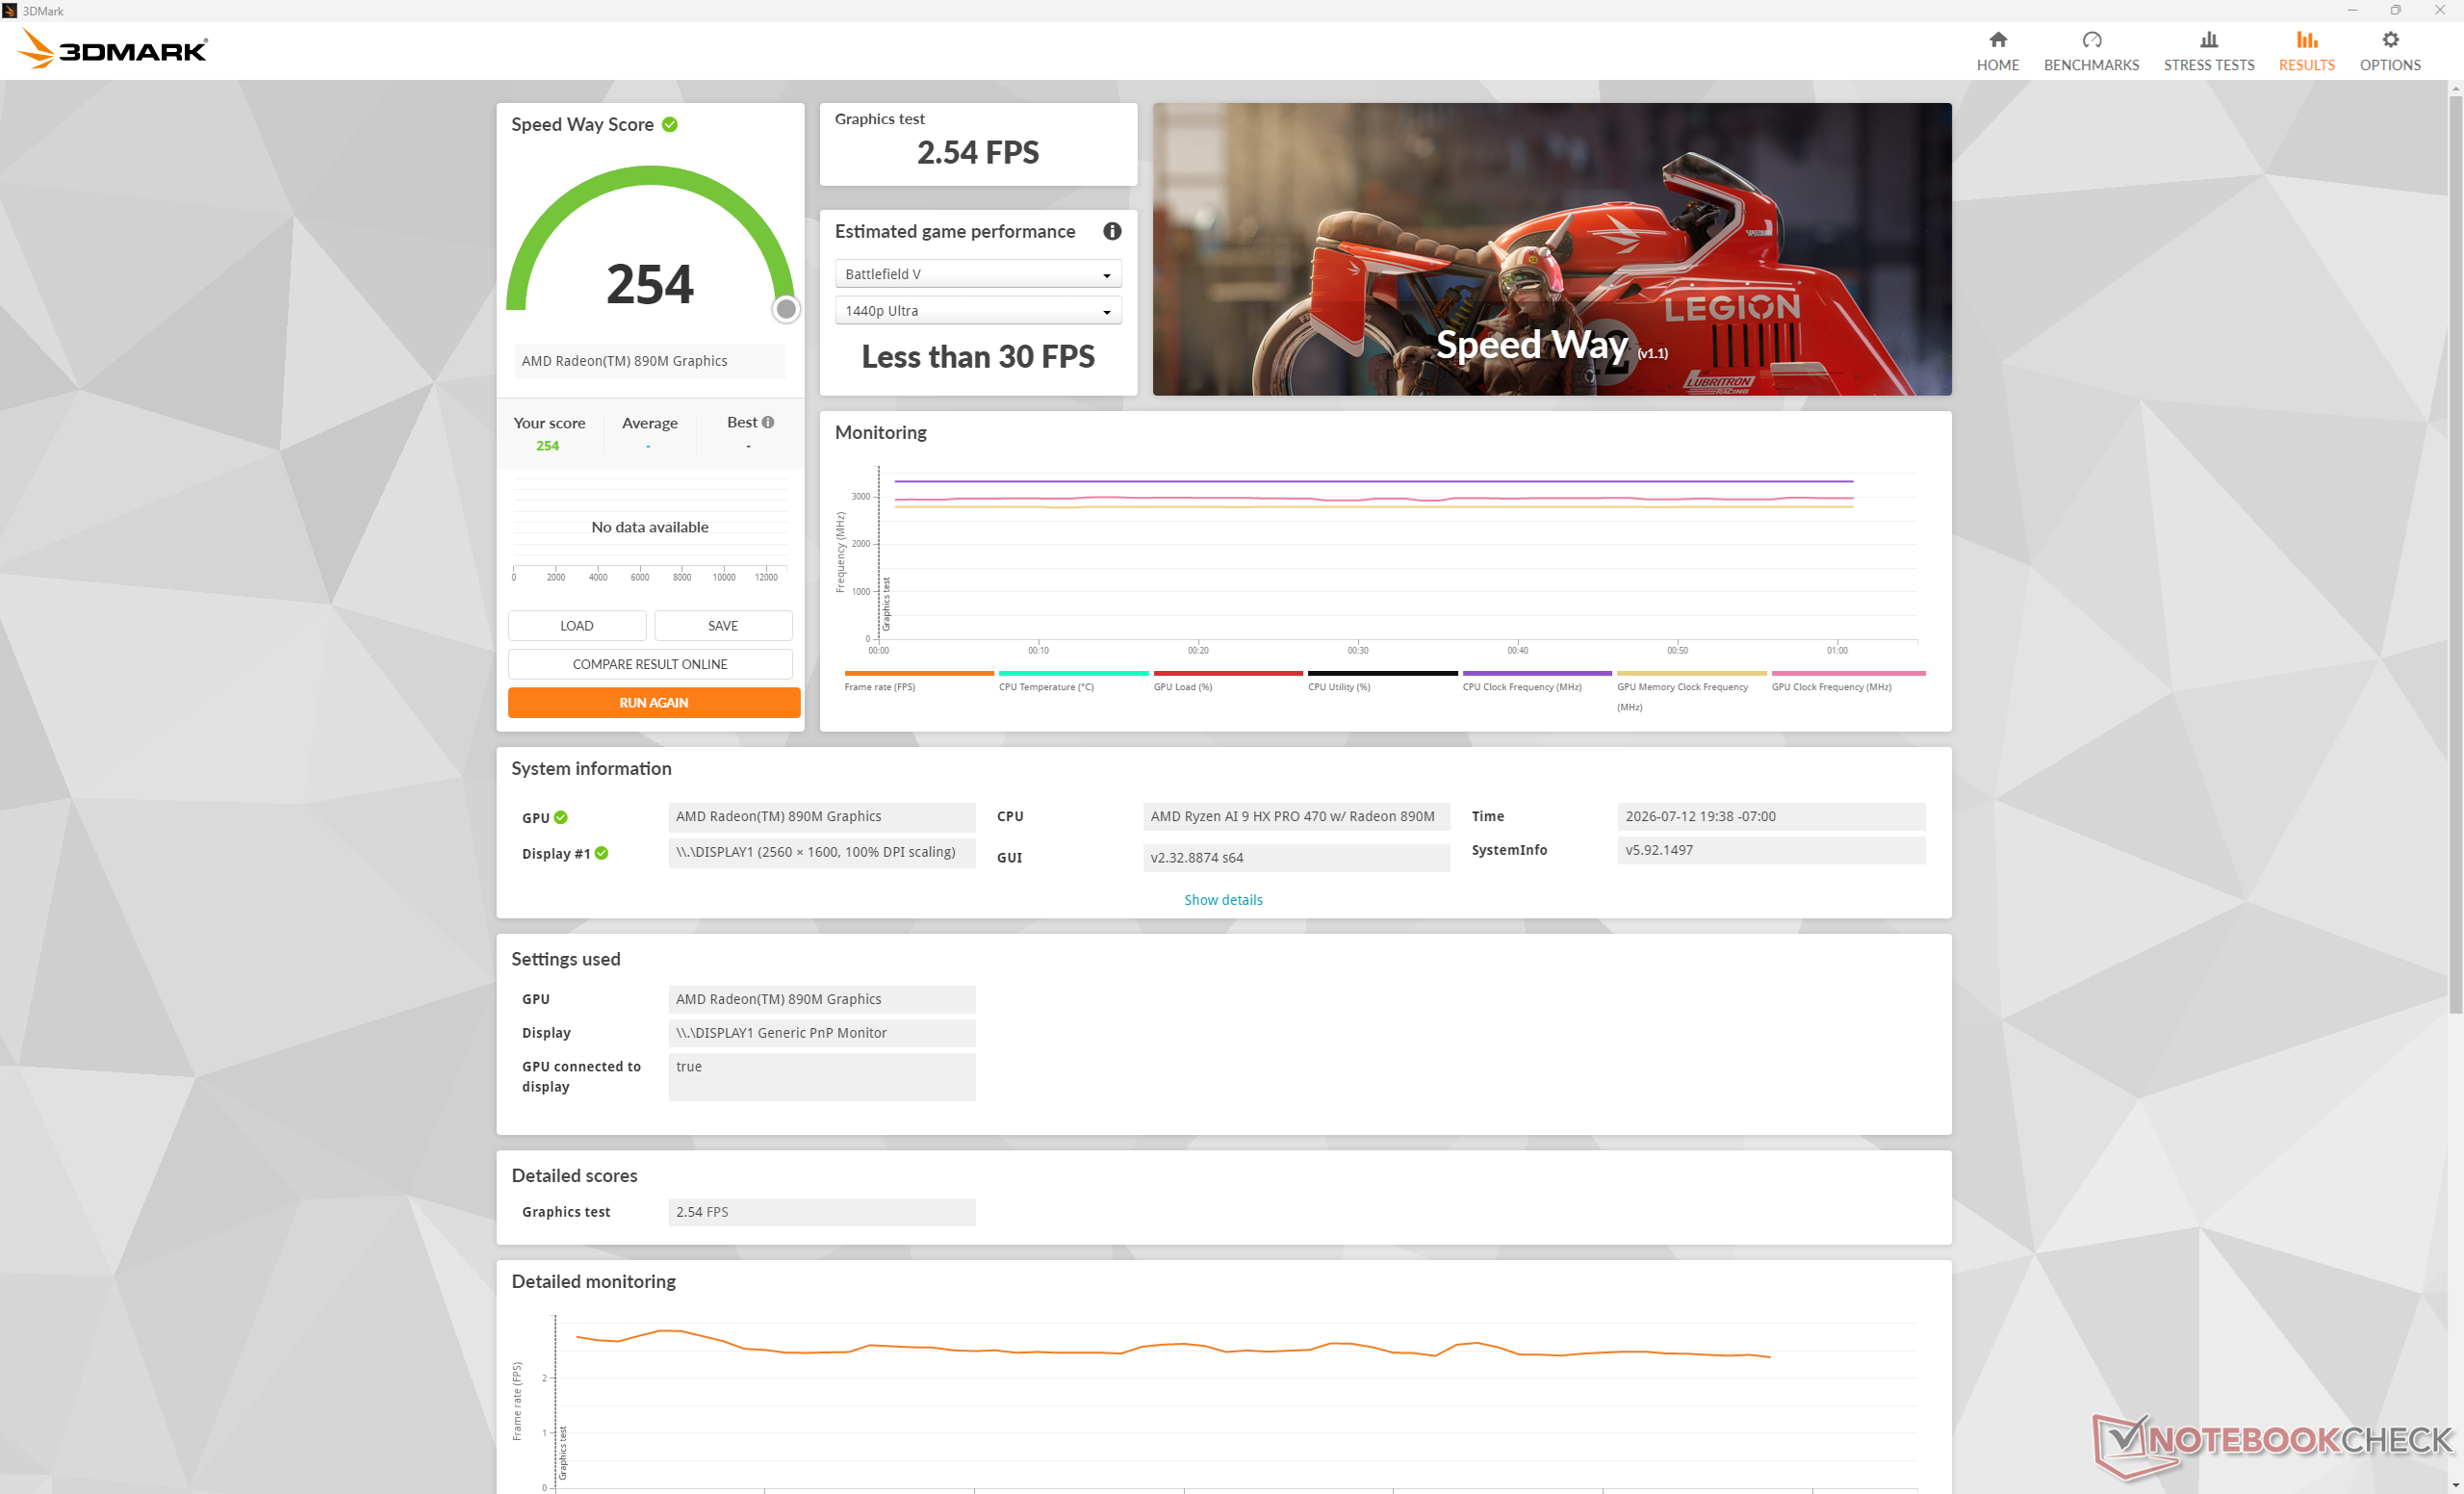
Speed Way
Speed Way
3DMark Performance rating - Percent
Lenovo ThinkPad P16 Gen 3
NVIDIA RTX PRO 3000 Blackwell Generation Laptop, Intel Core Ultra 9 285HX
100 pt
Lenovo Pro 9 16IPH11
NVIDIA GeForce RTX 5060 Laptop, Intel Core Ultra 9 386H
81.7 pt
Lenovo ThinkPad P1 Gen 8
NVIDIA RTX PRO 2000 Blackwell Generation Laptop, Intel Core Ultra 7 255H
71.9 pt
Lenovo Yoga Pro 9 16IAH10 RTX 5050
NVIDIA GeForce RTX 5050 Laptop, Intel Core Ultra 9 285H
64.6 pt
Dell XPS 16 Core Ultra X7 358H
Intel Arc B390 12 Xe3 Panther Lake iGPU, Intel Core Ultra X7 358H
45.3 pt
Media AMD Radeon 890M
 
25 pt
Dell Pro 5 16 P516265
AMD Radeon 890M, AMD Ryzen AI 9 HX PRO 470
23.6 pt
MSI Venture 16 AI A2HMTG
Intel Arc Graphics 140T, Intel Core Ultra 7 255H
22.9 pt
HP EliteBook 8 G1a 16 AI
AMD Radeon 860M, AMD Ryzen AI 7 PRO 350
19.9 pt
Asus ExpertBook B5 B5605CCA
Intel Arc Graphics 130T, Intel Core Ultra 5 225H
16.8 pt
Lenovo ThinkPad L16 Gen 2 21SC0029GE
AMD Radeon 740M, AMD Ryzen 5 PRO 215
12.2 pt
Lenovo ThinkPad T16 Gen 5 22AN001WGE
AMD Radeon 740M, AMD Ryzen 5 PRO 215
9.5 pt
3DMark 11 - 1280x720 Performance GPU
Lenovo ThinkPad P16 Gen 3
NVIDIA RTX PRO 3000 Blackwell Generation Laptop, Intel Core Ultra 9 285HX
49410 Points +246%
Lenovo Pro 9 16IPH11
NVIDIA GeForce RTX 5060 Laptop, Intel Core Ultra 9 386H
39324 Points +175%
Lenovo ThinkPad P1 Gen 8
NVIDIA RTX PRO 2000 Blackwell Generation Laptop, Intel Core Ultra 7 255H
35003 Points +145%
Lenovo Yoga Pro 9 16IAH10 RTX 5050
NVIDIA GeForce RTX 5050 Laptop, Intel Core Ultra 9 285H
31191 Points +118%
Dell XPS 16 Core Ultra X7 358H
Intel Arc B390 12 Xe3 Panther Lake iGPU, Intel Core Ultra X7 358H
18308 Points +28%
Media AMD Radeon 890M
  (8947 - 17483, n=29)
14692 Points +3%
Dell Pro 5 16 P516265
AMD Radeon 890M, AMD Ryzen AI 9 HX PRO 470
14292 Points
MSI Venture 16 AI A2HMTG
Intel Arc Graphics 140T, Intel Core Ultra 7 255H
11396 Points -20%
HP EliteBook 8 G1a 16 AI
AMD Radeon 860M, AMD Ryzen AI 7 PRO 350
10802 Points -24%
Asus ExpertBook B5 B5605CCA
Intel Arc Graphics 130T, Intel Core Ultra 5 225H
9106 Points -36%
Lenovo ThinkPad L16 Gen 2 21SC0029GE
AMD Radeon 740M, AMD Ryzen 5 PRO 215
6929 Points -52%
Lenovo ThinkPad T16 Gen 5 22AN001WGE
AMD Radeon 740M, AMD Ryzen 5 PRO 215
5519 Points -61%
3DMark
1920x1080 Fire Strike Graphics
Lenovo ThinkPad P16 Gen 3
NVIDIA RTX PRO 3000 Blackwell Generation Laptop, Intel Core Ultra 9 285HX
36897 Points +348%
Lenovo Pro 9 16IPH11
NVIDIA GeForce RTX 5060 Laptop, Intel Core Ultra 9 386H
31366 Points +281%
Lenovo ThinkPad P1 Gen 8
NVIDIA RTX PRO 2000 Blackwell Generation Laptop, Intel Core Ultra 7 255H
27781 Points +238%
Lenovo Yoga Pro 9 16IAH10 RTX 5050
NVIDIA GeForce RTX 5050 Laptop, Intel Core Ultra 9 285H
25400 Points +209%
Dell XPS 16 Core Ultra X7 358H
Intel Arc B390 12 Xe3 Panther Lake iGPU, Intel Core Ultra X7 358H
17018 Points +107%
Media AMD Radeon 890M
  (5173 - 10037, n=29)
8744 Points +6%
Dell Pro 5 16 P516265
AMD Radeon 890M, AMD Ryzen AI 9 HX PRO 470
8227 Points
MSI Venture 16 AI A2HMTG
Intel Arc Graphics 140T, Intel Core Ultra 7 255H
7691 Points -7%
HP EliteBook 8 G1a 16 AI
AMD Radeon 860M, AMD Ryzen AI 7 PRO 350
7131 Points -13%
Asus ExpertBook B5 B5605CCA
Intel Arc Graphics 130T, Intel Core Ultra 5 225H
5173 Points -37%
Lenovo ThinkPad L16 Gen 2 21SC0029GE
AMD Radeon 740M, AMD Ryzen 5 PRO 215
4625 Points -44%
Lenovo ThinkPad T16 Gen 5 22AN001WGE
AMD Radeon 740M, AMD Ryzen 5 PRO 215
3560 Points -57%
2560x1440 Time Spy Graphics
Lenovo ThinkPad P16 Gen 3
NVIDIA RTX PRO 3000 Blackwell Generation Laptop, Intel Core Ultra 9 285HX
14875 Points +396%
Lenovo Pro 9 16IPH11
NVIDIA GeForce RTX 5060 Laptop, Intel Core Ultra 9 386H
11755 Points +292%
Lenovo ThinkPad P1 Gen 8
NVIDIA RTX PRO 2000 Blackwell Generation Laptop, Intel Core Ultra 7 255H
10230 Points +241%
Lenovo Yoga Pro 9 16IAH10 RTX 5050
NVIDIA GeForce RTX 5050 Laptop, Intel Core Ultra 9 285H
9122 Points +204%
Dell XPS 16 Core Ultra X7 358H
Intel Arc B390 12 Xe3 Panther Lake iGPU, Intel Core Ultra X7 358H
6972 Points +132%
MSI Venture 16 AI A2HMTG
Intel Arc Graphics 140T, Intel Core Ultra 7 255H
3318 Points +11%
Media AMD Radeon 890M
  (1918 - 3750, n=30)
3255 Points +9%
Dell Pro 5 16 P516265
AMD Radeon 890M, AMD Ryzen AI 9 HX PRO 470
3000 Points
HP EliteBook 8 G1a 16 AI
AMD Radeon 860M, AMD Ryzen AI 7 PRO 350
2674 Points -11%
Asus ExpertBook B5 B5605CCA
Intel Arc Graphics 130T, Intel Core Ultra 5 225H
2402 Points -20%
Lenovo ThinkPad L16 Gen 2 21SC0029GE
AMD Radeon 740M, AMD Ryzen 5 PRO 215
1527 Points -49%
Lenovo ThinkPad T16 Gen 5 22AN001WGE
AMD Radeon 740M, AMD Ryzen 5 PRO 215
1190 Points -60%
2560x1440 Time Spy Score
Lenovo ThinkPad P16 Gen 3
NVIDIA RTX PRO 3000 Blackwell Generation Laptop, Intel Core Ultra 9 285HX
14579 Points +336%
Lenovo Pro 9 16IPH11
NVIDIA GeForce RTX 5060 Laptop, Intel Core Ultra 9 386H
12142 Points +263%
Lenovo ThinkPad P1 Gen 8
NVIDIA RTX PRO 2000 Blackwell Generation Laptop, Intel Core Ultra 7 255H
10595 Points +217%
Lenovo Yoga Pro 9 16IAH10 RTX 5050
NVIDIA GeForce RTX 5050 Laptop, Intel Core Ultra 9 285H
9519 Points +185%
Dell XPS 16 Core Ultra X7 358H
Intel Arc B390 12 Xe3 Panther Lake iGPU, Intel Core Ultra X7 358H
7436 Points +122%
MSI Venture 16 AI A2HMTG
Intel Arc Graphics 140T, Intel Core Ultra 7 255H
3688 Points +10%
Media AMD Radeon 890M
  (2168 - 4163, n=29)
3605 Points +8%
Dell Pro 5 16 P516265
AMD Radeon 890M, AMD Ryzen AI 9 HX PRO 470
3345 Points
HP EliteBook 8 G1a 16 AI
AMD Radeon 860M, AMD Ryzen AI 7 PRO 350
2996 Points -10%
Asus ExpertBook B5 B5605CCA
Intel Arc Graphics 130T, Intel Core Ultra 5 225H
2697 Points -19%
Lenovo ThinkPad L16 Gen 2 21SC0029GE
AMD Radeon 740M, AMD Ryzen 5 PRO 215
1722 Points -49%
Lenovo ThinkPad T16 Gen 5 22AN001WGE
AMD Radeon 740M, AMD Ryzen 5 PRO 215
1354 Points -60%
3DMark 11 Performance
13861 punti
3DMark Cloud Gate Standard Score
35749 punti
3DMark Fire Strike Score
7029 punti
3DMark Time Spy Score
3345 punti
Aiuto
Blender
v3.3 Classroom OPTIX/RTX
Lenovo Yoga Pro 9 16IAH10 RTX 5050
NVIDIA GeForce RTX 5050 Laptop, Intel Core Ultra 9 285H
24 Seconds *
Lenovo ThinkPad P1 Gen 8
NVIDIA RTX PRO 2000 Blackwell Generation Laptop, Intel Core Ultra 7 255H
22 Seconds *
Lenovo Pro 9 16IPH11
NVIDIA GeForce RTX 5060 Laptop, Intel Core Ultra 9 386H
20 Seconds *
Lenovo ThinkPad P16 Gen 3
NVIDIA RTX PRO 3000 Blackwell Generation Laptop, Intel Core Ultra 9 285HX
16 Seconds *
v3.3 Classroom CUDA
Lenovo Yoga Pro 9 16IAH10 RTX 5050
NVIDIA GeForce RTX 5050 Laptop, Intel Core Ultra 9 285H
49 Seconds *
Lenovo ThinkPad P1 Gen 8
NVIDIA RTX PRO 2000 Blackwell Generation Laptop, Intel Core Ultra 7 255H
42 Seconds *
Lenovo Pro 9 16IPH11
NVIDIA GeForce RTX 5060 Laptop, Intel Core Ultra 9 386H
40 Seconds *
Lenovo ThinkPad P16 Gen 3
NVIDIA RTX PRO 3000 Blackwell Generation Laptop, Intel Core Ultra 9 285HX
28 Seconds *
v3.3 Classroom CPU
Lenovo ThinkPad L16 Gen 2 21SC0029GE
AMD Radeon 740M, AMD Ryzen 5 PRO 215
555 Seconds * -113%
Lenovo ThinkPad T16 Gen 5 22AN001WGE
AMD Radeon 740M, AMD Ryzen 5 PRO 215
510 Seconds * -95%
Asus ExpertBook B5 B5605CCA
Intel Arc Graphics 130T, Intel Core Ultra 5 225H
358 Seconds * -37%
Dell XPS 16 Core Ultra X7 358H
Intel Arc B390 12 Xe3 Panther Lake iGPU, Intel Core Ultra X7 358H
328 Seconds * -26%
HP EliteBook 8 G1a 16 AI
AMD Radeon 860M, AMD Ryzen AI 7 PRO 350
322 Seconds * -23%
MSI Venture 16 AI A2HMTG
Intel Arc Graphics 140T, Intel Core Ultra 7 255H
307 Seconds * -18%
Lenovo ThinkPad P1 Gen 8
NVIDIA RTX PRO 2000 Blackwell Generation Laptop, Intel Core Ultra 7 255H
273 Seconds * -5%
Media AMD Radeon 890M
  (211 - 475, n=29)
266 Seconds * -2%
Dell Pro 5 16 P516265
AMD Radeon 890M, AMD Ryzen AI 9 HX PRO 470
261 Seconds *
Lenovo Pro 9 16IPH11
NVIDIA GeForce RTX 5060 Laptop, Intel Core Ultra 9 386H
260 Seconds * -0%
Lenovo Yoga Pro 9 16IAH10 RTX 5050
NVIDIA GeForce RTX 5050 Laptop, Intel Core Ultra 9 285H
255 Seconds * +2%
Lenovo ThinkPad P16 Gen 3
NVIDIA RTX PRO 3000 Blackwell Generation Laptop, Intel Core Ultra 9 285HX
189 Seconds * +28%
v3.3 Classroom oneAPI/Intel
MSI Venture 16 AI A2HMTG
Intel Arc Graphics 140T, Intel Core Ultra 7 255H
157 Seconds *
Dell XPS 16 Core Ultra X7 358H
Intel Arc B390 12 Xe3 Panther Lake iGPU, Intel Core Ultra X7 358H
105 Seconds *
v4.3 Barbershop CPU
Dell XPS 16 Core Ultra X7 358H
Intel Arc B390 12 Xe3 Panther Lake iGPU, Intel Core Ultra X7 358H
1662 Seconds * -24%
HP EliteBook 8 G1a 16 AI
AMD Radeon 860M, AMD Ryzen AI 7 PRO 350
1651 Seconds * -24%
MSI Venture 16 AI A2HMTG
Intel Arc Graphics 140T, Intel Core Ultra 7 255H
1510 Seconds * -13%
Lenovo ThinkPad P1 Gen 8
NVIDIA RTX PRO 2000 Blackwell Generation Laptop, Intel Core Ultra 7 255H
1425 Seconds * -7%
Lenovo Yoga Pro 9 16IAH10 RTX 5050
NVIDIA GeForce RTX 5050 Laptop, Intel Core Ultra 9 285H
1355 Seconds * -1%
Dell Pro 5 16 P516265
AMD Radeon 890M, AMD Ryzen AI 9 HX PRO 470
1336 Seconds *
Lenovo Pro 9 16IPH11
NVIDIA GeForce RTX 5060 Laptop, Intel Core Ultra 9 386H
1294 Seconds * +3%
Media AMD Radeon 890M
  (1101 - 1532, n=15)
1258 Seconds * +6%

* ... Meglio usare valori piccoli

Performance rating - Percent
Dell XPS 16 Core Ultra X7 358H
Intel Core Ultra X7 358H, Intel Arc B390 12 Xe3 Panther Lake iGPU
98.5 pt
Dell Pro 5 16 P516265
AMD Ryzen AI 9 HX PRO 470, AMD Radeon 890M
66.2 pt
MSI Venture 16 AI A2HMTG
Intel Core Ultra 7 255H, Intel Arc Graphics 140T
57.6 pt
HP EliteBook 8 G1a 16 AI
AMD Ryzen AI 7 PRO 350, AMD Radeon 860M
55.6 pt
Asus ExpertBook B5 B5605CCA
Intel Core Ultra 5 225H, Intel Arc Graphics 130T
42.4 pt
Lenovo ThinkPad T16 Gen 5 22AN001WGE
AMD Ryzen 5 PRO 215, AMD Radeon 740M
29.9 pt
Cyberpunk 2077 - 1920x1080 Ultra Preset (FSR off)
Dell XPS 16 Core Ultra X7 358H
Intel Core Ultra X7 358H, Intel Arc B390 12 Xe3 Panther Lake iGPU
48.7 (40min, 37.6P1) fps +92%
Dell Pro 5 16 P516265
AMD Ryzen AI 9 HX PRO 470, AMD Radeon 890M
25.3 (20.9min, 18.5P1) fps
MSI Venture 16 AI A2HMTG
Intel Core Ultra 7 255H, Intel Arc Graphics 140T
23 (20min, 18.7P1) fps -9%
HP EliteBook 8 G1a 16 AI
AMD Ryzen AI 7 PRO 350, AMD Radeon 860M
17.9 (14.5min, 10.6P1) fps -29%
Asus ExpertBook B5 B5605CCA
Intel Core Ultra 5 225H, Intel Arc Graphics 130T
15.6 (13.6min) fps -38%
Lenovo ThinkPad T16 Gen 5 22AN001WGE
AMD Ryzen 5 PRO 215, AMD Radeon 740M
9.53 (7.88min) fps -62%
Baldur's Gate 3 - 1920x1080 Ultra Preset AA:T
Dell XPS 16 Core Ultra X7 358H
Intel Core Ultra X7 358H, Intel Arc B390 12 Xe3 Panther Lake iGPU
54.3 (48.6min, 49.6P0.1, 51P1) fps +75%
Dell Pro 5 16 P516265
AMD Ryzen AI 9 HX PRO 470, AMD Radeon 890M
31.1 (24.4min, 24.7P0.1, 28.8P1) fps
Asus ExpertBook B5 B5605CCA
Intel Core Ultra 5 225H, Intel Arc Graphics 130T
27.2 fps -13%
MSI Venture 16 AI A2HMTG
Intel Core Ultra 7 255H, Intel Arc Graphics 140T
26.1 (23.5min, 23.5P0.1, 24.2P1) fps -16%
HP EliteBook 8 G1a 16 AI
AMD Ryzen AI 7 PRO 350, AMD Radeon 860M
22.5 fps -28%
Lenovo ThinkPad T16 Gen 5 22AN001WGE
AMD Ryzen 5 PRO 215, AMD Radeon 740M
10.6 (9.46min, 9.46P0.1, 9.64P1) fps -66%
GTA V - 1920x1080 Highest AA:4xMSAA + FX AF:16x
Dell XPS 16 Core Ultra X7 358H
Intel Core Ultra X7 358H, Intel Arc B390 12 Xe3 Panther Lake iGPU
45.2 (6.18min, 34.5P1) fps +50%
Dell Pro 5 16 P516265
AMD Ryzen AI 9 HX PRO 470, AMD Radeon 890M
30.1 (3.99min, 20.8P1) fps
HP EliteBook 8 G1a 16 AI
AMD Ryzen AI 7 PRO 350, AMD Radeon 860M
25.1 (4.65min, 17.5P1) fps -17%
MSI Venture 16 AI A2HMTG
Intel Core Ultra 7 255H, Intel Arc Graphics 140T
16.7 (7.28min, 12.8P1) fps -45%
Lenovo ThinkPad T16 Gen 5 22AN001WGE
AMD Ryzen 5 PRO 215, AMD Radeon 740M
11.7 (4.5min, 8.06P1) fps -61%
Asus ExpertBook B5 B5605CCA
Intel Core Ultra 5 225H, Intel Arc Graphics 130T
9.75 (6.37min, 7.46P1) fps -68%
Final Fantasy XV Benchmark - 1920x1080 High Quality
Dell XPS 16 Core Ultra X7 358H
Intel Core Ultra X7 358H, Intel Arc B390 12 Xe3 Panther Lake iGPU
56.2 fps +91%
Dell Pro 5 16 P516265
AMD Ryzen AI 9 HX PRO 470, AMD Radeon 890M
29.4 fps
MSI Venture 16 AI A2HMTG
Intel Core Ultra 7 255H, Intel Arc Graphics 140T
26 fps -12%
HP EliteBook 8 G1a 16 AI
AMD Ryzen AI 7 PRO 350, AMD Radeon 860M
23.9 fps -19%
Asus ExpertBook B5 B5605CCA
Intel Core Ultra 5 225H, Intel Arc Graphics 130T
18.8 fps -36%
Lenovo ThinkPad T16 Gen 5 22AN001WGE
AMD Ryzen 5 PRO 215, AMD Radeon 740M
12.9 fps -56%
Strange Brigade - 1920x1080 ultra AA:ultra AF:16
Dell XPS 16 Core Ultra X7 358H
Intel Core Ultra X7 358H, Intel Arc B390 12 Xe3 Panther Lake iGPU
90.6 (24.7min, 39.3P1) fps +89%
MSI Venture 16 AI A2HMTG
Intel Core Ultra 7 255H, Intel Arc Graphics 140T
50.1 (34.9min, 40.2P1) fps +5%
Dell Pro 5 16 P516265
AMD Ryzen AI 9 HX PRO 470, AMD Radeon 890M
47.9 (31.9min, 36.9P1) fps
HP EliteBook 8 G1a 16 AI
AMD Ryzen AI 7 PRO 350, AMD Radeon 860M
40 (19.2min, 25.6P1) fps -16%
Asus ExpertBook B5 B5605CCA
Intel Core Ultra 5 225H, Intel Arc Graphics 130T
29.9 (12.8min, 20P1) fps -38%
Lenovo ThinkPad T16 Gen 5 22AN001WGE
AMD Ryzen 5 PRO 215, AMD Radeon 740M
21 (13.8min, 15.3P1) fps -56%
Dota 2 Reborn - 1920x1080 ultra (3/3) best looking
Dell XPS 16 Core Ultra X7 358H
Intel Core Ultra X7 358H, Intel Arc B390 12 Xe3 Panther Lake iGPU
96.9 (57min) fps +22%
Dell Pro 5 16 P516265
AMD Ryzen AI 9 HX PRO 470, AMD Radeon 890M
79.6 (70min) fps
MSI Venture 16 AI A2HMTG
Intel Core Ultra 7 255H, Intel Arc Graphics 140T
75.8 (49.2min) fps -5%
HP EliteBook 8 G1a 16 AI
AMD Ryzen AI 7 PRO 350, AMD Radeon 860M
72.2 (61.8min) fps -9%
Asus ExpertBook B5 B5605CCA
Intel Core Ultra 5 225H, Intel Arc Graphics 130T
52.5 (26.2min) fps -34%
Lenovo ThinkPad T16 Gen 5 22AN001WGE
AMD Ryzen 5 PRO 215, AMD Radeon 740M
47.6 (43.7min) fps -40%
X-Plane 11.11 - 1920x1080 high (fps_test=3)
Dell Pro 5 16 P516265
AMD Ryzen AI 9 HX PRO 470, AMD Radeon 890M
43.5 fps
HP EliteBook 8 G1a 16 AI
AMD Ryzen AI 7 PRO 350, AMD Radeon 860M
41.1 fps -6%
MSI Venture 16 AI A2HMTG
Intel Core Ultra 7 255H, Intel Arc Graphics 140T
39.7 fps -9%
Dell XPS 16 Core Ultra X7 358H
Intel Core Ultra X7 358H, Intel Arc B390 12 Xe3 Panther Lake iGPU
38.8 fps -11%
Asus ExpertBook B5 B5605CCA
Intel Core Ultra 5 225H, Intel Arc Graphics 130T
31.5 fps -28%
Lenovo ThinkPad T16 Gen 5 22AN001WGE
AMD Ryzen 5 PRO 215, AMD Radeon 740M
21.4 fps -51%
Baldur's Gate 3
1920x1080 Medium Preset AA:T
Dell XPS 16 Core Ultra X7 358H
Intel Core Ultra X7 358H, Intel Arc B390 12 Xe3 Panther Lake iGPU
62.3 (55.9min, 56.3P0.1, 57.4P1) fps +62%
Dell Pro 5 16 P516265
AMD Ryzen AI 9 HX PRO 470, AMD Radeon 890M
38.5 (30.4min, 31.1P0.1, 34.3P1) fps
Media AMD Radeon 890M
  (20.4 - 40.2, n=34)
34.5 fps -10%
MSI Venture 16 AI A2HMTG
Intel Core Ultra 7 255H, Intel Arc Graphics 140T
31 (28.2min, 28.4P0.1, 28.9P1) fps -19%
HP EliteBook 8 G1a 16 AI
AMD Ryzen AI 7 PRO 350, AMD Radeon 860M
30.4 fps -21%
Asus ExpertBook B5 B5605CCA
Intel Core Ultra 5 225H, Intel Arc Graphics 130T
20.5 fps -47%
Lenovo ThinkPad L16 Gen 2 21SC0029GE
AMD Ryzen 5 PRO 215, AMD Radeon 740M
15.7 (5.98min, 7.88P0.1, 11.7P1) fps -59%
Lenovo ThinkPad T16 Gen 5 22AN001WGE
AMD Ryzen 5 PRO 215, AMD Radeon 740M
13.5 (11.9min, 11.9P0.1, 12.3P1) fps -65%
1920x1080 High Preset AA:T
Dell XPS 16 Core Ultra X7 358H
Intel Core Ultra X7 358H, Intel Arc B390 12 Xe3 Panther Lake iGPU
55.6 (49.5min, 50.1P0.1, 52.1P1) fps +76%
Dell Pro 5 16 P516265
AMD Ryzen AI 9 HX PRO 470, AMD Radeon 890M
31.6 (24.6min, 25.1P0.1, 28.8P1) fps
Media AMD Radeon 890M
  (16.9 - 33.2, n=34)
28.6 fps -9%
Asus ExpertBook B5 B5605CCA
Intel Core Ultra 5 225H, Intel Arc Graphics 130T
27.5 fps -13%
MSI Venture 16 AI A2HMTG
Intel Core Ultra 7 255H, Intel Arc Graphics 140T
26.5 (23.9min, 24.2P0.1, 24.6P1) fps -16%
HP EliteBook 8 G1a 16 AI
AMD Ryzen AI 7 PRO 350, AMD Radeon 860M
23.5 fps -26%
Lenovo ThinkPad T16 Gen 5 22AN001WGE
AMD Ryzen 5 PRO 215, AMD Radeon 740M
11 (9.63min, 9.67P0.1, 9.76P1) fps -65%
1920x1080 Ultra Preset AA:T
Dell XPS 16 Core Ultra X7 358H
Intel Core Ultra X7 358H, Intel Arc B390 12 Xe3 Panther Lake iGPU
54.3 (48.6min, 49.6P0.1, 51P1) fps +75%
Dell Pro 5 16 P516265
AMD Ryzen AI 9 HX PRO 470, AMD Radeon 890M
31.1 (24.4min, 24.7P0.1, 28.8P1) fps
Media AMD Radeon 890M
  (16.8 - 32.7, n=33)
27.8 fps -11%
Asus ExpertBook B5 B5605CCA
Intel Core Ultra 5 225H, Intel Arc Graphics 130T
27.2 fps -13%
MSI Venture 16 AI A2HMTG
Intel Core Ultra 7 255H, Intel Arc Graphics 140T
26.1 (23.5min, 23.5P0.1, 24.2P1) fps -16%
HP EliteBook 8 G1a 16 AI
AMD Ryzen AI 7 PRO 350, AMD Radeon 860M
22.5 fps -28%
Lenovo ThinkPad L16 Gen 2 21SC0029GE
AMD Ryzen 5 PRO 215, AMD Radeon 740M
13.2 (9.19min, 9.39P0.1, 10.1P1) fps -58%
Lenovo ThinkPad T16 Gen 5 22AN001WGE
AMD Ryzen 5 PRO 215, AMD Radeon 740M
10.6 (9.46min, 9.46P0.1, 9.64P1) fps -66%
GTA V
1024x768 Lowest Settings possible
Dell XPS 16 Core Ultra X7 358H
Intel Core Ultra X7 358H, Intel Arc B390 12 Xe3 Panther Lake iGPU
182 (2.05min, 142.9P1) fps +9%
MSI Venture 16 AI A2HMTG
Intel Core Ultra 7 255H, Intel Arc Graphics 140T
167.9 (3.35min, 100P1) fps 0%
Dell Pro 5 16 P516265
AMD Ryzen AI 9 HX PRO 470, AMD Radeon 890M
167.5 (4.63min, 111.1P1) fps
HP EliteBook 8 G1a 16 AI
AMD Ryzen AI 7 PRO 350, AMD Radeon 860M
165.9 (5min, 111.1P1) fps -1%
Media AMD Radeon 890M
  (126.4 - 175.8, n=29)
163.3 fps -3%
Lenovo ThinkPad L16 Gen 2 21SC0029GE
AMD Ryzen 5 PRO 215, AMD Radeon 740M
148.3 (5.08min, 100P1) fps -11%
Asus ExpertBook B5 B5605CCA
Intel Core Ultra 5 225H, Intel Arc Graphics 130T
125.9 (6.09min, 83.3P1) fps -25%
Lenovo ThinkPad T16 Gen 5 22AN001WGE
AMD Ryzen 5 PRO 215, AMD Radeon 740M
100.6 (18.2min, 66.7P1) fps -40%
1920x1080 Lowest Settings possible
Dell XPS 16 Core Ultra X7 358H
Intel Core Ultra X7 358H, Intel Arc B390 12 Xe3 Panther Lake iGPU
180 (2.44min, 125P1) fps +32%
Media AMD Radeon 890M
  (76.1 - 156.5, n=23)
137.5 fps +1%
HP EliteBook 8 G1a 16 AI
AMD Ryzen AI 7 PRO 350, AMD Radeon 860M
137.3 (5.26min, 90.9P1) fps +1%
Dell Pro 5 16 P516265
AMD Ryzen AI 9 HX PRO 470, AMD Radeon 890M
136.6 (4.73min, 90.9P1) fps
MSI Venture 16 AI A2HMTG
Intel Core Ultra 7 255H, Intel Arc Graphics 140T
132.6 (38.4min, 90.9P1) fps -3%
Lenovo ThinkPad L16 Gen 2 21SC0029GE
AMD Ryzen 5 PRO 215, AMD Radeon 740M
97.5 (13.5min, 62.5P1) fps -29%
1920x1080 Normal/Off AF:4x
Dell XPS 16 Core Ultra X7 358H
Intel Core Ultra X7 358H, Intel Arc B390 12 Xe3 Panther Lake iGPU
172.7 (3.42min, 111.1P1) fps +29%
HP EliteBook 8 G1a 16 AI
AMD Ryzen AI 7 PRO 350, AMD Radeon 860M
139.4 (4.41min, 90.9P1) fps +4%
Media AMD Radeon 890M
  (81.6 - 153.1, n=23)
136.6 fps +2%
Dell Pro 5 16 P516265
AMD Ryzen AI 9 HX PRO 470, AMD Radeon 890M
134.2 (4.28min, 83.3P1) fps
MSI Venture 16 AI A2HMTG
Intel Core Ultra 7 255H, Intel Arc Graphics 140T
120 (36.6min, 83.3P1) fps -11%
Lenovo ThinkPad L16 Gen 2 21SC0029GE
AMD Ryzen 5 PRO 215, AMD Radeon 740M
99.1 (13.4min, 66.7P1) fps -26%
1920x1080 High/On (Advanced Graphics Off) AA:2xMSAA + FX AF:8x
Dell XPS 16 Core Ultra X7 358H
Intel Core Ultra X7 358H, Intel Arc B390 12 Xe3 Panther Lake iGPU
103.3 (9.42min, 76.9P1) fps +45%
Media AMD Radeon 890M
  (36.6 - 81.5, n=30)
72.6 fps +2%
Dell Pro 5 16 P516265
AMD Ryzen AI 9 HX PRO 470, AMD Radeon 890M
71.3 (6.59min, 47.6P1) fps
HP EliteBook 8 G1a 16 AI
AMD Ryzen AI 7 PRO 350, AMD Radeon 860M
58.7 (2.47min, 41.7P1) fps -18%
Lenovo ThinkPad L16 Gen 2 21SC0029GE
AMD Ryzen 5 PRO 215, AMD Radeon 740M
42.4 (4.83min, 27.8P1) fps -41%
MSI Venture 16 AI A2HMTG
Intel Core Ultra 7 255H, Intel Arc Graphics 140T
41.1 (11.7min, 32.3P1) fps -42%
Lenovo ThinkPad T16 Gen 5 22AN001WGE
AMD Ryzen 5 PRO 215, AMD Radeon 740M
29.3 (6.7min, 20P1) fps -59%
Asus ExpertBook B5 B5605CCA
Intel Core Ultra 5 225H, Intel Arc Graphics 130T
24.4 (7.52min, 19.2P1) fps -66%
1920x1080 Highest AA:4xMSAA + FX AF:16x
Dell XPS 16 Core Ultra X7 358H
Intel Core Ultra X7 358H, Intel Arc B390 12 Xe3 Panther Lake iGPU
45.2 (6.18min, 34.5P1) fps +50%
Media AMD Radeon 890M
  (14.9 - 33.3, n=30)
30.4 fps +1%
Dell Pro 5 16 P516265
AMD Ryzen AI 9 HX PRO 470, AMD Radeon 890M
30.1 (3.99min, 20.8P1) fps
HP EliteBook 8 G1a 16 AI
AMD Ryzen AI 7 PRO 350, AMD Radeon 860M
25.1 (4.65min, 17.5P1) fps -17%
Lenovo ThinkPad L16 Gen 2 21SC0029GE
AMD Ryzen 5 PRO 215, AMD Radeon 740M
17.7 (5.27min, 11.6P1) fps -41%
MSI Venture 16 AI A2HMTG
Intel Core Ultra 7 255H, Intel Arc Graphics 140T
16.7 (7.28min, 12.8P1) fps -45%
Lenovo ThinkPad T16 Gen 5 22AN001WGE
AMD Ryzen 5 PRO 215, AMD Radeon 740M
11.7 (4.5min, 8.06P1) fps -61%
Asus ExpertBook B5 B5605CCA
Intel Core Ultra 5 225H, Intel Arc Graphics 130T
9.75 (6.37min, 7.46P1) fps -68%
Dota 2 Reborn
1920x1080 high (2/3)
Dell XPS 16 Core Ultra X7 358H
Intel Core Ultra X7 358H, Intel Arc B390 12 Xe3 Panther Lake iGPU
100.2 (51.7min) fps +12%
Dell Pro 5 16 P516265
AMD Ryzen AI 9 HX PRO 470, AMD Radeon 890M
89.3 (79.5min) fps
MSI Venture 16 AI A2HMTG
Intel Core Ultra 7 255H, Intel Arc Graphics 140T
79.4 (50.5min) fps -11%
HP EliteBook 8 G1a 16 AI
AMD Ryzen AI 7 PRO 350, AMD Radeon 860M
78.4 (65.2min) fps -12%
Media AMD Radeon 890M
  (34.8 - 103, n=35)
75.9 fps -15%
Lenovo ThinkPad L16 Gen 2 21SC0029GE
AMD Ryzen 5 PRO 215, AMD Radeon 740M
66.5 (55.5min) fps -26%
Asus ExpertBook B5 B5605CCA
Intel Core Ultra 5 225H, Intel Arc Graphics 130T
53.7 (26.2min) fps -40%
Lenovo ThinkPad T16 Gen 5 22AN001WGE
AMD Ryzen 5 PRO 215, AMD Radeon 740M
53.5 (49min) fps -40%
1920x1080 ultra (3/3) best looking
Dell XPS 16 Core Ultra X7 358H
Intel Core Ultra X7 358H, Intel Arc B390 12 Xe3 Panther Lake iGPU
96.9 (57min) fps +22%
Dell Pro 5 16 P516265
AMD Ryzen AI 9 HX PRO 470, AMD Radeon 890M
79.6 (70min) fps
MSI Venture 16 AI A2HMTG
Intel Core Ultra 7 255H, Intel Arc Graphics 140T
75.8 (49.2min) fps -5%
HP EliteBook 8 G1a 16 AI
AMD Ryzen AI 7 PRO 350, AMD Radeon 860M
72.2 (61.8min) fps -9%
Media AMD Radeon 890M
  (32.4 - 93, n=35)
68.5 fps -14%
Lenovo ThinkPad L16 Gen 2 21SC0029GE
AMD Ryzen 5 PRO 215, AMD Radeon 740M
57.6 (51.5min) fps -28%
Asus ExpertBook B5 B5605CCA
Intel Core Ultra 5 225H, Intel Arc Graphics 130T
52.5 (26.2min) fps -34%
Lenovo ThinkPad T16 Gen 5 22AN001WGE
AMD Ryzen 5 PRO 215, AMD Radeon 740M
47.6 (43.7min) fps -40%
Final Fantasy XV Benchmark
1280x720 Lite Quality
Dell XPS 16 Core Ultra X7 358H
Intel Core Ultra X7 358H, Intel Arc B390 12 Xe3 Panther Lake iGPU
131.1 fps +64%
Media AMD Radeon 890M
  (40.9 - 94.6, n=31)
80.2 fps 0%
Dell Pro 5 16 P516265
AMD Ryzen AI 9 HX PRO 470, AMD Radeon 890M
80 fps
MSI Venture 16 AI A2HMTG
Intel Core Ultra 7 255H, Intel Arc Graphics 140T
68 fps -15%
HP EliteBook 8 G1a 16 AI
AMD Ryzen AI 7 PRO 350, AMD Radeon 860M
66.9 fps -16%
Lenovo ThinkPad L16 Gen 2 21SC0029GE
AMD Ryzen 5 PRO 215, AMD Radeon 740M
51.2 fps -36%
Asus ExpertBook B5 B5605CCA
Intel Core Ultra 5 225H, Intel Arc Graphics 130T
45.1 fps -44%
Lenovo ThinkPad T16 Gen 5 22AN001WGE
AMD Ryzen 5 PRO 215, AMD Radeon 740M
35.9 fps -55%
1920x1080 Standard Quality
Dell XPS 16 Core Ultra X7 358H
Intel Core Ultra X7 358H, Intel Arc B390 12 Xe3 Panther Lake iGPU
79.7 fps +95%
Media AMD Radeon 890M
  (23.7 - 48.4, n=31)
41.6 fps +2%
Dell Pro 5 16 P516265
AMD Ryzen AI 9 HX PRO 470, AMD Radeon 890M
40.9 fps
MSI Venture 16 AI A2HMTG
Intel Core Ultra 7 255H, Intel Arc Graphics 140T
39.2 fps -4%
HP EliteBook 8 G1a 16 AI
AMD Ryzen AI 7 PRO 350, AMD Radeon 860M
34 fps -17%
Lenovo ThinkPad L16 Gen 2 21SC0029GE
AMD Ryzen 5 PRO 215, AMD Radeon 740M
24.1 fps -41%
Asus ExpertBook B5 B5605CCA
Intel Core Ultra 5 225H, Intel Arc Graphics 130T
24 fps -41%
Lenovo ThinkPad T16 Gen 5 22AN001WGE
AMD Ryzen 5 PRO 215, AMD Radeon 740M
17.7 fps -57%
1920x1080 High Quality
Dell XPS 16 Core Ultra X7 358H
Intel Core Ultra X7 358H, Intel Arc B390 12 Xe3 Panther Lake iGPU
56.2 fps +91%
Media AMD Radeon 890M
  (17.7 - 34.8, n=31)
29.9 fps +2%
Dell Pro 5 16 P516265
AMD Ryzen AI 9 HX PRO 470, AMD Radeon 890M
29.4 fps
MSI Venture 16 AI A2HMTG
Intel Core Ultra 7 255H, Intel Arc Graphics 140T
26 fps -12%
HP EliteBook 8 G1a 16 AI
AMD Ryzen AI 7 PRO 350, AMD Radeon 860M
23.9 fps -19%
Asus ExpertBook B5 B5605CCA
Intel Core Ultra 5 225H, Intel Arc Graphics 130T
18.8 fps -36%
Lenovo ThinkPad L16 Gen 2 21SC0029GE
AMD Ryzen 5 PRO 215, AMD Radeon 740M
17.9 fps -39%
Lenovo ThinkPad T16 Gen 5 22AN001WGE
AMD Ryzen 5 PRO 215, AMD Radeon 740M
12.9 fps -56%
X-Plane 11.11 - 1920x1080 high (fps_test=3)
Media AMD Radeon 890M
  (33.7 - 58.3, n=32)
46.2 fps +6%
Dell Pro 5 16 P516265
AMD Ryzen AI 9 HX PRO 470, AMD Radeon 890M
43.5 fps
HP EliteBook 8 G1a 16 AI
AMD Ryzen AI 7 PRO 350, AMD Radeon 860M
41.1 fps -6%
MSI Venture 16 AI A2HMTG
Intel Core Ultra 7 255H, Intel Arc Graphics 140T
39.7 fps -9%
Dell XPS 16 Core Ultra X7 358H
Intel Core Ultra X7 358H, Intel Arc B390 12 Xe3 Panther Lake iGPU
38.8 fps -11%
Asus ExpertBook B5 B5605CCA
Intel Core Ultra 5 225H, Intel Arc Graphics 130T
31.5 fps -28%
Lenovo ThinkPad L16 Gen 2 21SC0029GE
AMD Ryzen 5 PRO 215, AMD Radeon 740M
23.4 fps -46%
Lenovo ThinkPad T16 Gen 5 22AN001WGE
AMD Ryzen 5 PRO 215, AMD Radeon 740M
21.4 fps -51%
Strange Brigade
1920x1080 high AA:high AF:8
Dell XPS 16 Core Ultra X7 358H
Intel Core Ultra X7 358H, Intel Arc B390 12 Xe3 Panther Lake iGPU
104 (12.8min, 75.8P1) fps +93%
Media AMD Radeon 890M
  (51 - 69.8, n=26)
63.2 fps +17%
MSI Venture 16 AI A2HMTG
Intel Core Ultra 7 255H, Intel Arc Graphics 140T
60.2 (21.6min, 48.7P1) fps +11%
Dell Pro 5 16 P516265
AMD Ryzen AI 9 HX PRO 470, AMD Radeon 890M
54 (35.9min, 42.8P1) fps
HP EliteBook 8 G1a 16 AI
AMD Ryzen AI 7 PRO 350, AMD Radeon 860M
47.4 (21.2min, 35.4P1) fps -12%
Asus ExpertBook B5 B5605CCA
Intel Core Ultra 5 225H, Intel Arc Graphics 130T
30.3 (23.4min, 25.3P1) fps -44%
Lenovo ThinkPad T16 Gen 5 22AN001WGE
AMD Ryzen 5 PRO 215, AMD Radeon 740M
24.3 (19.9min, 20.5P1) fps -55%
1920x1080 ultra AA:ultra AF:16
Dell XPS 16 Core Ultra X7 358H
Intel Core Ultra X7 358H, Intel Arc B390 12 Xe3 Panther Lake iGPU
90.6 (24.7min, 39.3P1) fps +89%
Media AMD Radeon 890M
  (44.8 - 59.7, n=26)
53.8 fps +12%
MSI Venture 16 AI A2HMTG
Intel Core Ultra 7 255H, Intel Arc Graphics 140T
50.1 (34.9min, 40.2P1) fps +5%
Dell Pro 5 16 P516265
AMD Ryzen AI 9 HX PRO 470, AMD Radeon 890M
47.9 (31.9min, 36.9P1) fps
HP EliteBook 8 G1a 16 AI
AMD Ryzen AI 7 PRO 350, AMD Radeon 860M
40 (19.2min, 25.6P1) fps -16%
Asus ExpertBook B5 B5605CCA
Intel Core Ultra 5 225H, Intel Arc Graphics 130T
29.9 (12.8min, 20P1) fps -38%
Lenovo ThinkPad T16 Gen 5 22AN001WGE
AMD Ryzen 5 PRO 215, AMD Radeon 740M
21 (13.8min, 15.3P1) fps -56%
Cyberpunk 2077
1920x1080 Medium Preset (FSR off)
Dell XPS 16 Core Ultra X7 358H
Intel Core Ultra X7 358H, Intel Arc B390 12 Xe3 Panther Lake iGPU
65.4 (55.8min, 52P1) fps +73%
Dell Pro 5 16 P516265
AMD Ryzen AI 9 HX PRO 470, AMD Radeon 890M
37.7 (32.6min, 30.2P1) fps
Media AMD Radeon 890M
  (16.9 - 41.9, n=34)
36 fps -5%
MSI Venture 16 AI A2HMTG
Intel Core Ultra 7 255H, Intel Arc Graphics 140T
29.6 (26.3min, 25.2P1) fps -21%
HP EliteBook 8 G1a 16 AI
AMD Ryzen AI 7 PRO 350, AMD Radeon 860M
27.7 (23.7min, 22.6P1) fps -27%
Asus ExpertBook B5 B5605CCA
Intel Core Ultra 5 225H, Intel Arc Graphics 130T
21.8 (19.5min) fps -42%
Lenovo ThinkPad L16 Gen 2 21SC0029GE
AMD Ryzen 5 PRO 215, AMD Radeon 740M
18.7 (16.3min, 15.7P1) fps -50%
Lenovo ThinkPad T16 Gen 5 22AN001WGE
AMD Ryzen 5 PRO 215, AMD Radeon 740M
14.9 (12.7min) fps -60%
1920x1080 High Preset (FSR off)
Dell XPS 16 Core Ultra X7 358H
Intel Core Ultra X7 358H, Intel Arc B390 12 Xe3 Panther Lake iGPU
56 (47.2min, 45.4P1) fps +93%
Dell Pro 5 16 P516265
AMD Ryzen AI 9 HX PRO 470, AMD Radeon 890M
29 (24.4min, 22.7P1) fps
Media AMD Radeon 890M
  (13 - 32.3, n=34)
28 fps -3%
MSI Venture 16 AI A2HMTG
Intel Core Ultra 7 255H, Intel Arc Graphics 140T
25.5 (22.3min, 21.5P1) fps -12%
HP EliteBook 8 G1a 16 AI
AMD Ryzen AI 7 PRO 350, AMD Radeon 860M
21.7 (17.5min, 16.3P1) fps -25%
Asus ExpertBook B5 B5605CCA
Intel Core Ultra 5 225H, Intel Arc Graphics 130T
17.6 (15.3min) fps -39%
Lenovo ThinkPad T16 Gen 5 22AN001WGE
AMD Ryzen 5 PRO 215, AMD Radeon 740M
11.1 (8.91min) fps -62%
1920x1080 Ultra Preset (FSR off)
Dell XPS 16 Core Ultra X7 358H
Intel Core Ultra X7 358H, Intel Arc B390 12 Xe3 Panther Lake iGPU
48.7 (40min, 37.6P1) fps +92%
Dell Pro 5 16 P516265
AMD Ryzen AI 9 HX PRO 470, AMD Radeon 890M
25.3 (20.9min, 18.5P1) fps
Media AMD Radeon 890M
  (15.5 - 28.4, n=35)
24.7 fps -2%
MSI Venture 16 AI A2HMTG
Intel Core Ultra 7 255H, Intel Arc Graphics 140T
23 (20min, 18.7P1) fps -9%
HP EliteBook 8 G1a 16 AI
AMD Ryzen AI 7 PRO 350, AMD Radeon 860M
17.9 (14.5min, 10.6P1) fps -29%
Asus ExpertBook B5 B5605CCA
Intel Core Ultra 5 225H, Intel Arc Graphics 130T
15.6 (13.6min) fps -38%
Lenovo ThinkPad T16 Gen 5 22AN001WGE
AMD Ryzen 5 PRO 215, AMD Radeon 740M
9.53 (7.88min) fps -62%
F1 24
1920x1080 Medium Preset AA:T AF:16x
Dell XPS 16 Core Ultra X7 358H
Intel Core Ultra X7 358H, Intel Arc B390 12 Xe3 Panther Lake iGPU
135.3 (105min, 88P1) fps +78%
Dell Pro 5 16 P516265
AMD Ryzen AI 9 HX PRO 470, AMD Radeon 890M
75.9 (64min, 48P1) fps
Media AMD Radeon 890M
  (43.9 - 94, n=23)
75.3 fps -1%
MSI Venture 16 AI A2HMTG
Intel Core Ultra 7 255H, Intel Arc Graphics 140T
69.9 (59min, 54P1) fps -8%
HP EliteBook 8 G1a 16 AI
AMD Ryzen AI 7 PRO 350, AMD Radeon 860M
56.2 (31min, 30P1) fps -26%
Asus ExpertBook B5 B5605CCA
Intel Core Ultra 5 225H, Intel Arc Graphics 130T
48.3 (30min, 36P1) fps -36%
Lenovo ThinkPad T16 Gen 5 22AN001WGE
AMD Ryzen 5 PRO 215, AMD Radeon 740M
31.9 (22min, 23P1) fps -58%
1920x1080 High Preset AA:T AF:16x
Dell XPS 16 Core Ultra X7 358H
Intel Core Ultra X7 358H, Intel Arc B390 12 Xe3 Panther Lake iGPU
103.4 (68min, 69P1) fps +82%
Dell Pro 5 16 P516265
AMD Ryzen AI 9 HX PRO 470, AMD Radeon 890M
56.7 (45min, 38P1) fps
Media AMD Radeon 890M
  (31.1 - 67, n=23)
54.9 fps -3%
MSI Venture 16 AI A2HMTG
Intel Core Ultra 7 255H, Intel Arc Graphics 140T
48 (41min, 39P1) fps -15%
HP EliteBook 8 G1a 16 AI
AMD Ryzen AI 7 PRO 350, AMD Radeon 860M
44.3 (35min, 28P1) fps -22%
Asus ExpertBook B5 B5605CCA
Intel Core Ultra 5 225H, Intel Arc Graphics 130T
37.2 (18min, 28P1) fps -34%
Lenovo ThinkPad T16 Gen 5 22AN001WGE
AMD Ryzen 5 PRO 215, AMD Radeon 740M
23.7 (16min, 17P1) fps -58%
1920x1080 Ultra High Preset AA:T AF:16x
Dell XPS 16 Core Ultra X7 358H
Intel Core Ultra X7 358H, Intel Arc B390 12 Xe3 Panther Lake iGPU
36.8 (20min, 28P1) fps +144%
MSI Venture 16 AI A2HMTG
Intel Core Ultra 7 255H, Intel Arc Graphics 140T
15.7 (10min, 12P1) fps +4%
Dell Pro 5 16 P516265
AMD Ryzen AI 9 HX PRO 470, AMD Radeon 890M
15.1 (9min, 8P1) fps
Media AMD Radeon 890M
  (8.41 - 18.4, n=19)
14.1 fps -7%
HP EliteBook 8 G1a 16 AI
AMD Ryzen AI 7 PRO 350, AMD Radeon 860M
9.84 (7min, 6P1) fps -35%
Lenovo ThinkPad T16 Gen 5 22AN001WGE
AMD Ryzen 5 PRO 215, AMD Radeon 740M
5.51 (4min, 4P1) fps -64%

Grafico dei FPS in modalità Ultra di Cyberpunk 2077

0510152025Tooltip
Dell Pro 5 16 P516265 Ryzen AI 9 HX PRO 470, Radeon 890M: Ø26.9 (25-27.4) fps
Lenovo ThinkPad T16 Gen 5 22AN001WGE R5 PRO 215, Radeon 740M: Ø9.12 (8.14-9.29) fps
bassomedioaltoultra
GTA V (2015) 167.5 71.3 30.1
Dota 2 Reborn (2015) 174.1 129.5 89.3 79.6
Final Fantasy XV Benchmark (2018) 80 40.9 29.4
X-Plane 11.11 (2018) 72.6 59.3 43.5
Strange Brigade (2018) 168.2 63.8 54 47.9
Baldur's Gate 3 (2023) 47.3 38.5 31.6 31.1
Cyberpunk 2077 (2023) 46.9 37.7 29 25.3
F1 24 (2024) 84.2 75.9 56.7 15.1

Emissioni

Rumore di sistema

Profilo di rumorosità della ventola (Bianco: Rumore di fondo, Rosso: Sistema inattivo, Blu: 3DMark 06, Arancione: Cyberpunk 2077, Verde: Stress test Prime95)

Rumorosità

Idle
23.2 / 23.2 / 27 dB(A)
Sotto carico
34.1 / 46.7 dB(A)
  red to green bar
 
 
30 dB
silenzioso
40 dB(A)
udibile
50 dB(A)
rumoroso
 
min: dark, med: mid, max: light   Earthworks M23R, Arta (15 cm di distanza)   Rumorosità ambientale: 23 dB(A)
dB(A) 0102030405060708090Deep BassMiddle BassHigh BassLower RangeMidsHigher MidsLower HighsMid HighsUpper HighsSuper Highs2031.332.932.831.733.62522.821.822.523.727.73122.922.22119.527.24020.118.218.118.824.95022.420.919.423.525.56322.621.921.323.928.48023.522.522.222.928.110024.820.121.420.726.312521.117.317.317.122.81602418.513.713.125.520025.925.11413.226.725029.119.318.712.828.231529.52017.214.429.140031.521.715.811.831.450030.221.314.39.930.363032.924.915.710.133.680034.226.11610.234.3100037.428.917.69.838125036.728.416.59.436.7160035.826.5169.836.5200036.927.416.69.937.2250036.826.315.110.336.931503523.613.410.735.2400033.622.81211.233.6500030.420.211.711.430.363003116.31211.530.7800027.614.611.811.827.61000022.113.612.112.122.11250019.613.61211.919.61600015.3131110.815.4SPL46.537272346.7N5.42.30.80.45.5median 30.4median 21.3median 15.1median 11.4median 30.3Delta5.24.72.31.84.5hearing rangehide median Fan NoiseDell Pro 5 16 P516265
Dell Pro 5 16 P516265
Ryzen AI 9 HX PRO 470, Radeon 890M
Dell XPS 16 Core Ultra X7 358H
Ultra X7 358H, Arc B390 Panther Lake iGPU
Lenovo ThinkPad T16 Gen 5 22AN001WGE
R5 PRO 215, Radeon 740M
MSI Venture 16 AI A2HMTG
Ultra 7 255H, Arc 140T
Asus ExpertBook B5 B5605CCA
Ultra 5 225H, Arc 130T
HP EliteBook 8 G1a 16 AI
Ryzen AI 7 PRO 350, Radeon 860M
Noise
1%
7%
-0%
11%
-5%
off /ambiente * (dB)
23
23.3
-1%
24.6
-7%
22.9
-0%
23.2
-1%
22.7
1%
Idle Minimum * (dB)
23.2
23.4
-1%
24.6
-6%
23.1
-0%
23.2
-0%
22.8
2%
Idle Average * (dB)
23.2
23.4
-1%
24.6
-6%
23.1
-0%
23.2
-0%
22.8
2%
Idle Maximum * (dB)
27
25.8
4%
26.4
2%
24.1
11%
23.2
14%
24.7
9%
Load Average * (dB)
34.1
38
-11%
28.6
16%
45.2
-33%
26.3
23%
46
-35%
Cyberpunk 2077 ultra * (dB)
46.5
38.1
18%
34.2
26%
39.4
15%
35.4
24%
48.7
-5%
Load Maximum * (dB)
46.7
48.6
-4%
34.2
27%
44.7
4%
38.8
17%
49.5
-6%

* ... Meglio usare valori piccoli

Temperatura
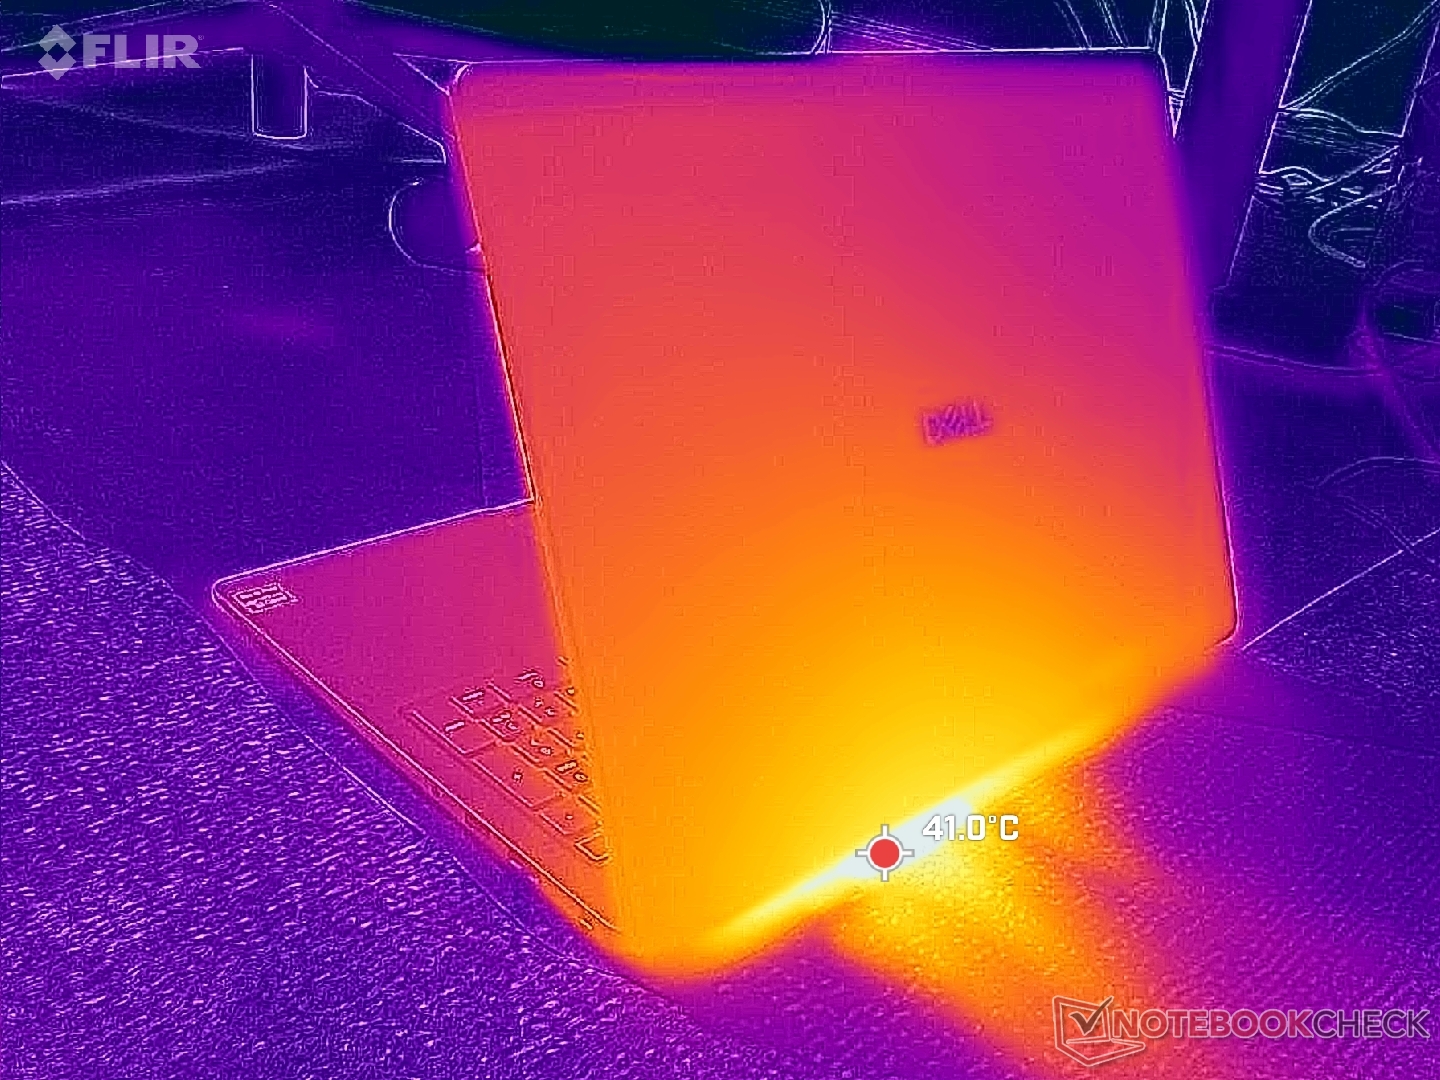
Scarico posteriore
Scarico posteriore
L'adattatore di corrente raggiunge una temperatura superiore a 48 °C quando è sottoposto a carichi elevati
Carico massimo
 41 °C40 °C36.2 °C 
 39.6 °C38.6 °C28.8 °C 
 31.6 °C28.2 °C26.8 °C 
Massima: 41 °C
Media: 34.5 °C
28.8 °C36.2 °C39.2 °C
28.4 °C36.2 °C38.8 °C
28.4 °C31.4 °C33.2 °C
Massima: 39.2 °C
Media: 33.4 °C
Alimentazione (max)  50 °C | Temperatura della stanza 20 °C | Fluke 62 Mini IR Thermometer
(±) La temperatura media del lato superiore sotto carico massimo e' di 34.5 °C / 94 F, rispetto alla media di 29.5 °C / 85 F per i dispositivi di questa classe Office.
(±) La temperatura massima sul lato superiore è di 41 °C / 106 F, rispetto alla media di 34.3 °C / 94 F, che varia da 21.2 a 62.5 °C per questa classe Office.
(+) Il lato inferiore si riscalda fino ad un massimo di 39.2 °C / 103 F, rispetto alla media di 36.8 °C / 98 F
(+) In idle, la temperatura media del lato superiore è di 26.6 °C / 80 F, rispetto alla media deld ispositivo di 29.5 °C / 85 F.
(+) I poggiapolsi e il touchpad sono piu' freddi della temperatura della pelle con un massimo di 31.6 °C / 88.9 F e sono quindi freddi al tatto.
(-) La temperatura media della zona del palmo della mano di dispositivi simili e'stata di 27.5 °C / 81.5 F (-4.1 °C / -7.4 F).
Sistema inattivo (copertina C)
Sistema inattivo (copertina D)
Test di stress con Prime95+FurMark (C cover)
Test di stress con Prime95+FurMark (livello D)
Dell Pro 5 16 P516265
Ryzen AI 9 HX PRO 470, Radeon 890M
Dell XPS 16 Core Ultra X7 358H
Ultra X7 358H, Arc B390 Panther Lake iGPU
Lenovo ThinkPad T16 Gen 5 22AN001WGE
R5 PRO 215, Radeon 740M
MSI Venture 16 AI A2HMTG
Ultra 7 255H, Arc 140T
Asus ExpertBook B5 B5605CCA
Ultra 5 225H, Arc 130T
HP EliteBook 8 G1a 16 AI
Ryzen AI 7 PRO 350, Radeon 860M
Heat
9%
7%
-0%
-2%
6%
Maximum Upper Side * (°C)
41
40.6
1%
37
10%
35
15%
40.7
1%
38
7%
Maximum Bottom * (°C)
39.2
39.8
-2%
40.9
-4%
37.4
5%
47.8
-22%
33.4
15%
Idle Upper Side * (°C)
28.4
23.2
18%
24.9
12%
30.2
-6%
26
8%
28
1%
Idle Bottom * (°C)
28.6
23.8
17%
26.4
8%
33
-15%
27
6%
28.2
1%

* ... Meglio usare valori piccoli

Stress test

La CPU raggiungeva i 3 GHz e i 43 W all’avvio dello stress test Prime95, per poi scendere e stabilizzarsi a 2,8 GHz, 33 W e 62 °C solo pochi secondi dopo.
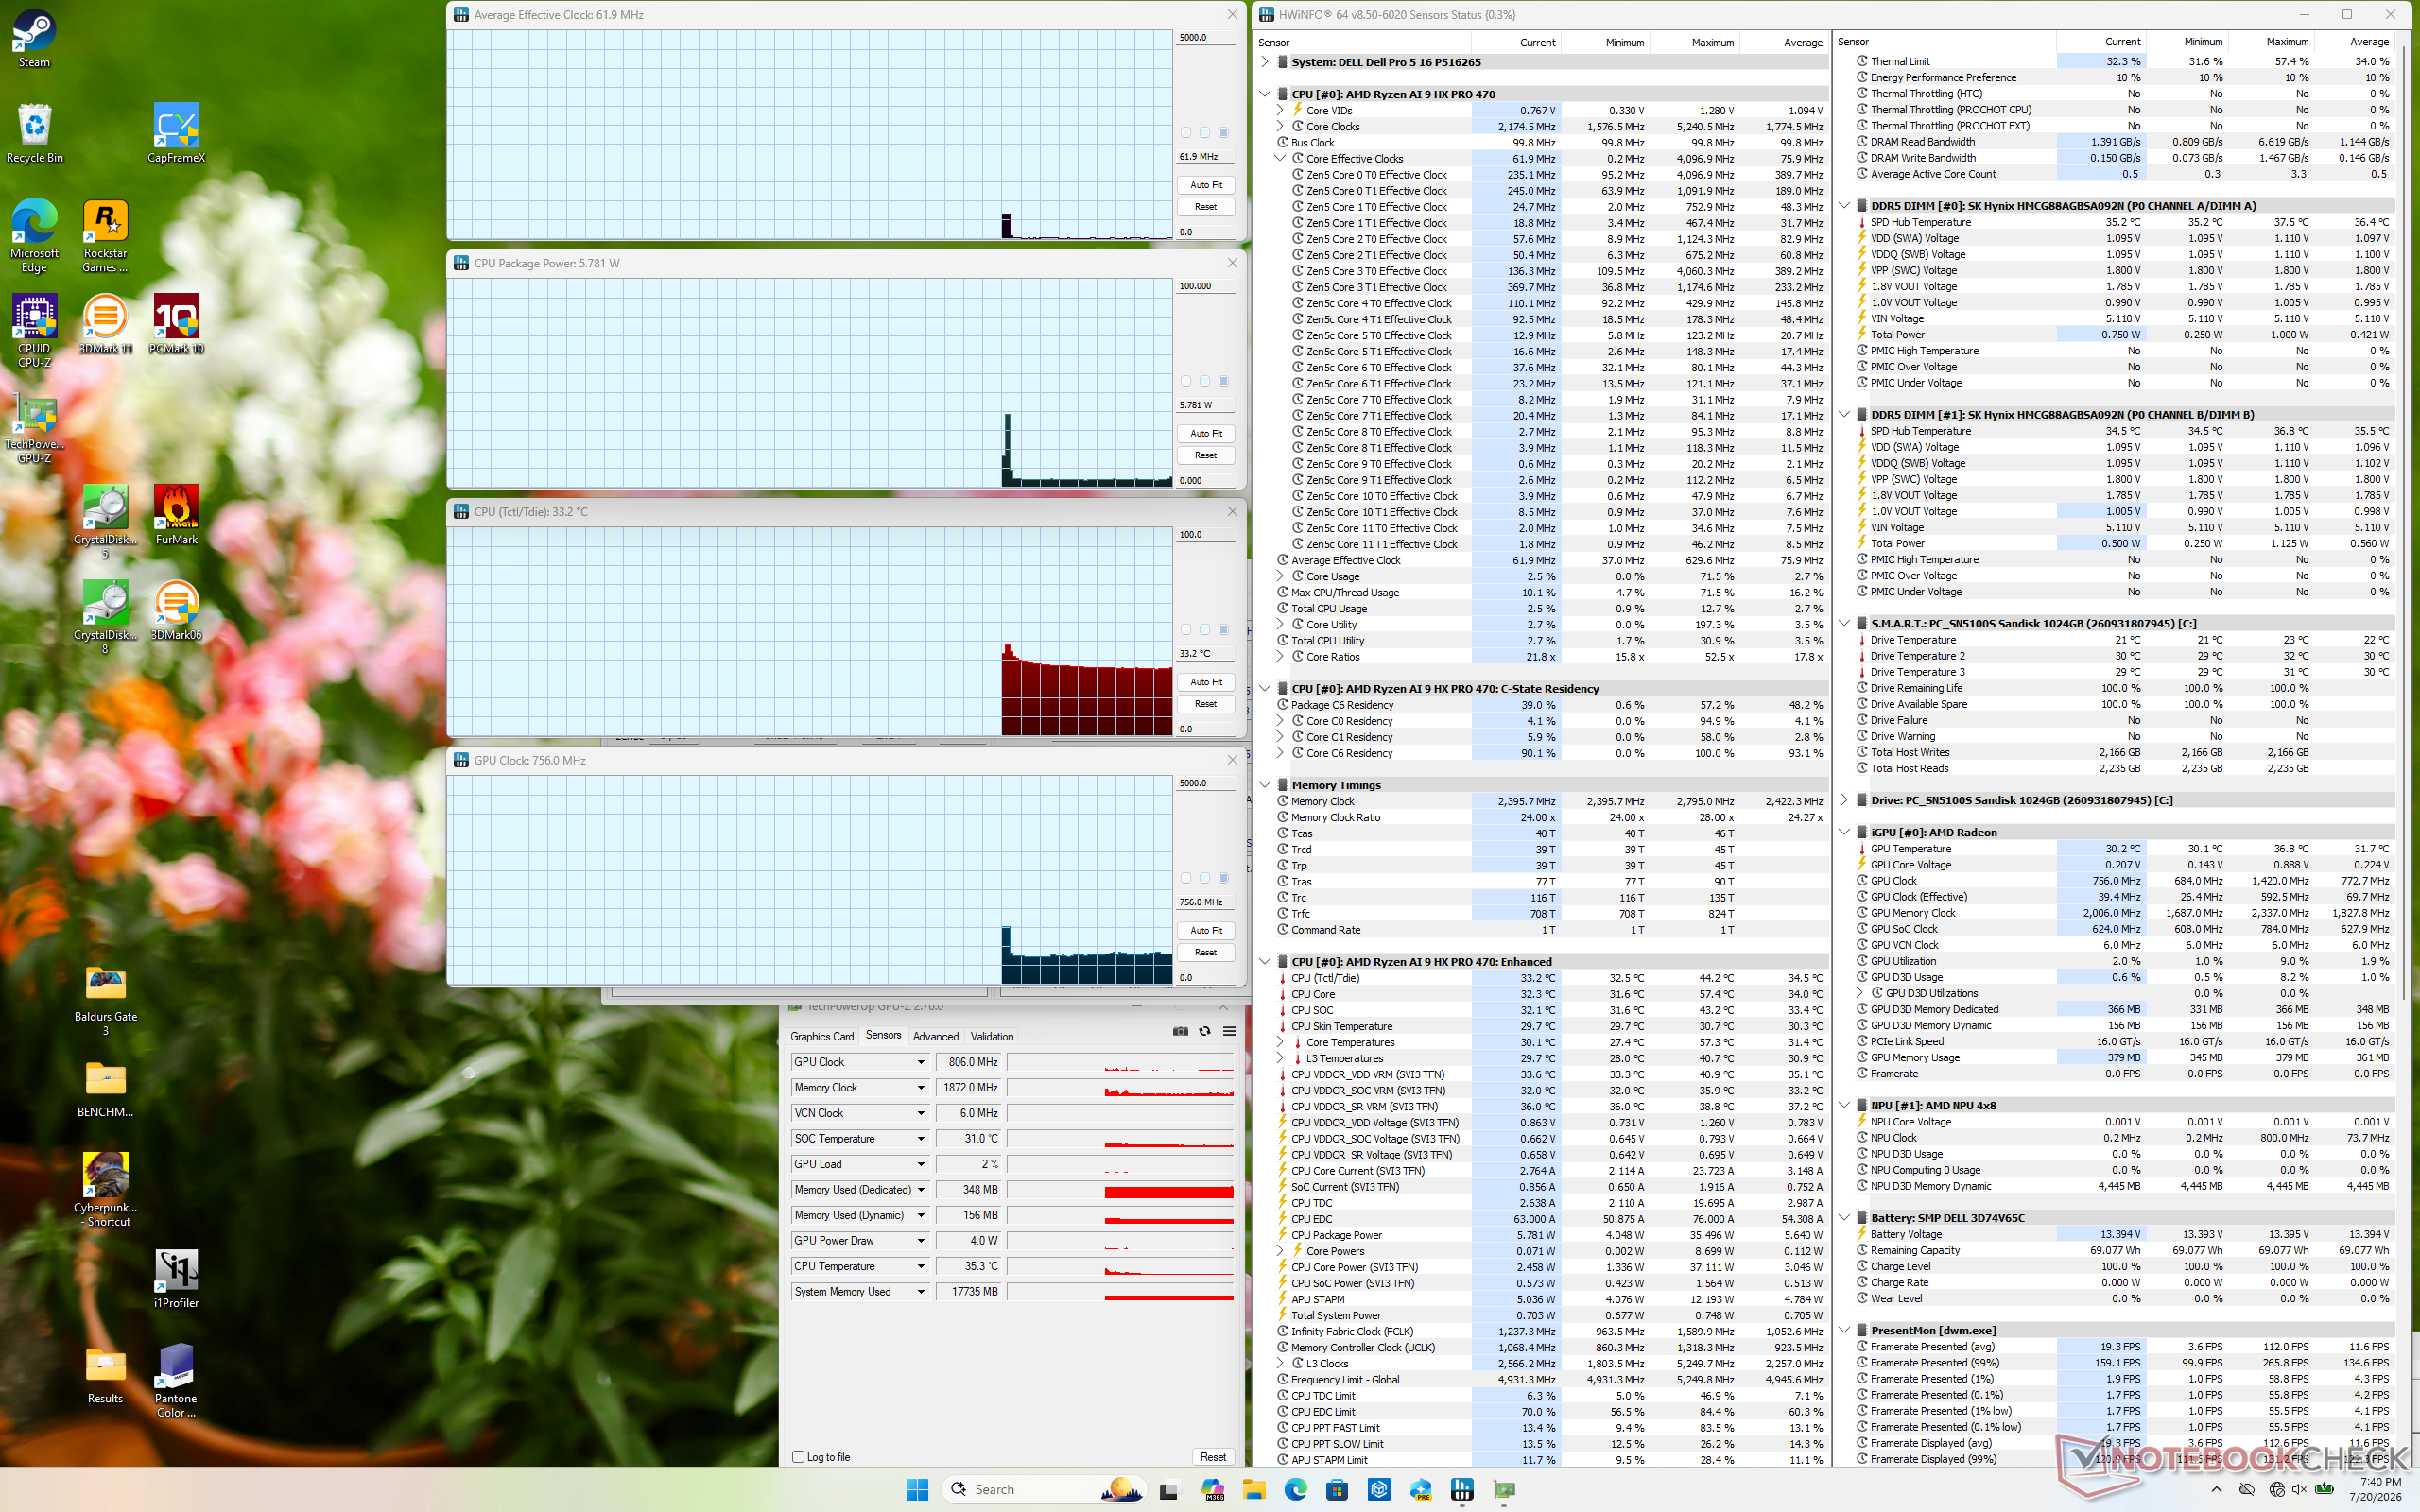
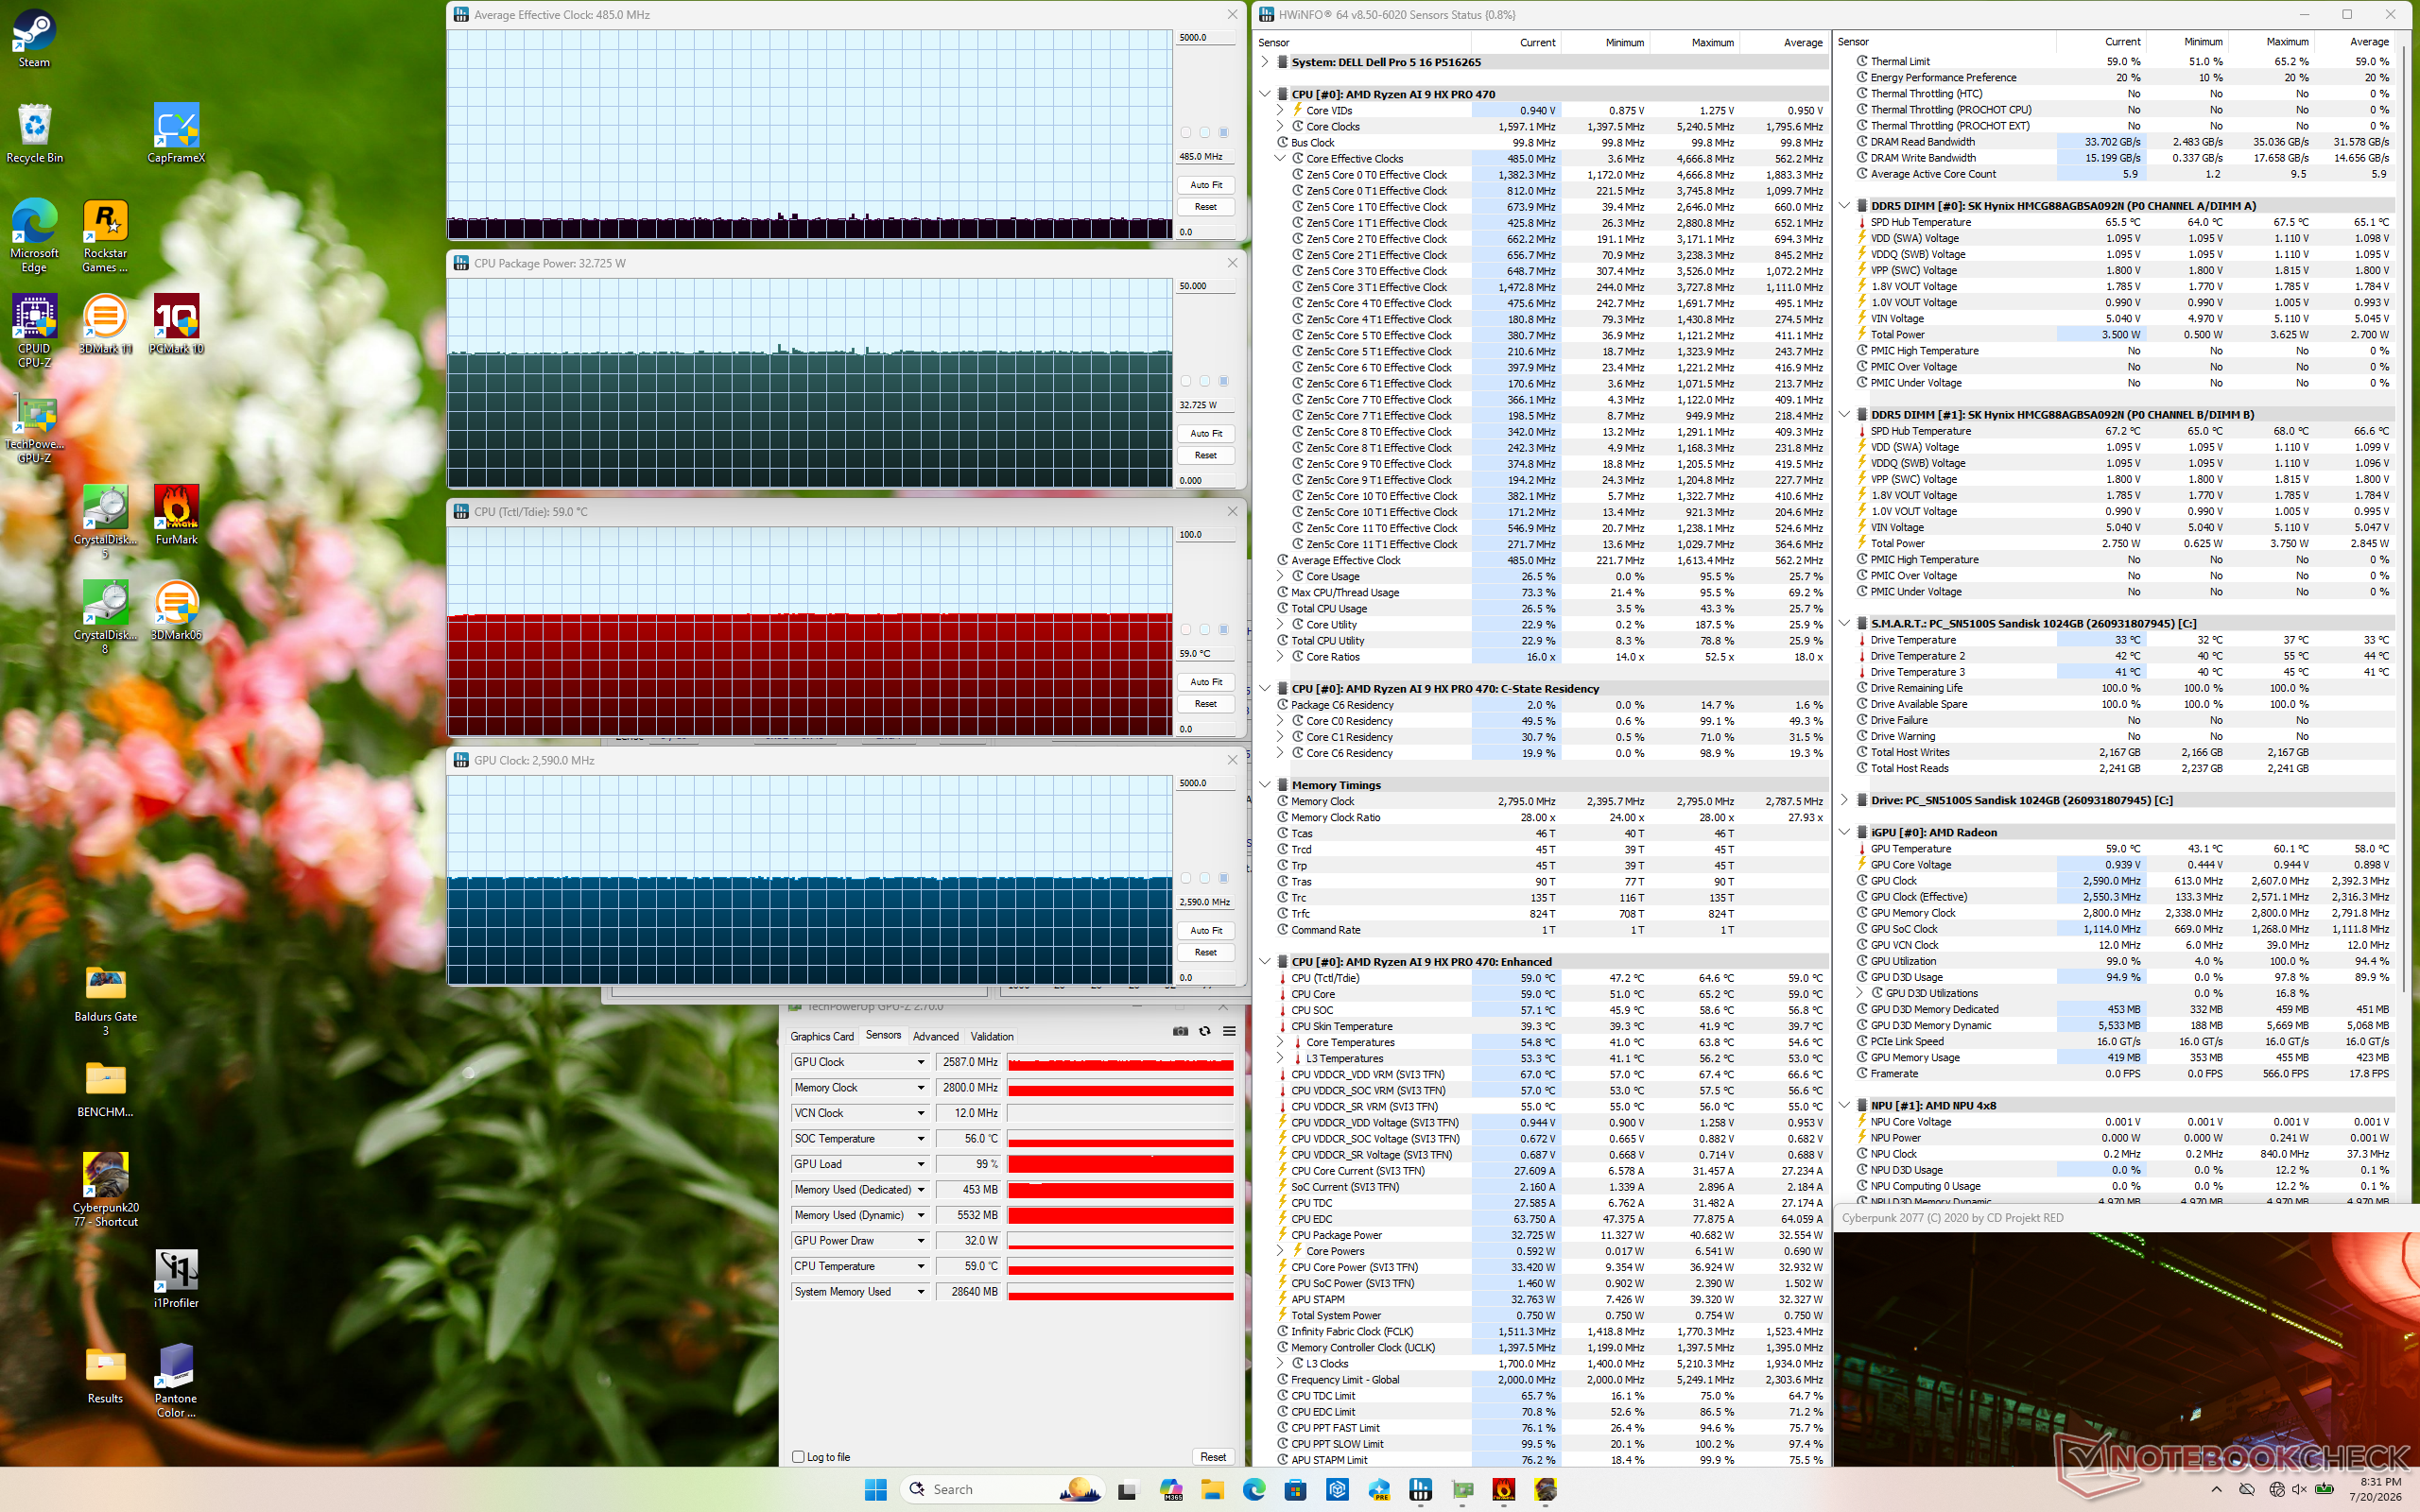
Sistema inattivo
Sistema inattivo
Lo stress di Cyberpunk 2077
Stress test con Prime95
Test di stress con Prime95+FurMark
Frequenza media della CPU (GHz) Frequenza della GPU (MHz) Temperatura media della CPU (°C)
Sistema inattivo -- 756 33
Stress con Prime95 2,8 -- 62
Stress con Prime95 + FurMark 3,0 1153 62
Stresscon Cyberpunk 2077 0,5 2590 59

Relatori

Il rumore rosa presenta un volume massimo elevato e un'ampia gamma
dB(A) 0102030405060708090Deep BassMiddle BassHigh BassLower RangeMidsHigher MidsLower HighsMid HighsUpper HighsSuper Highs2032.8342522.523.4312123.34018.121.75019.423.76321.325.58022.230.710021.439.512517.346.216013.757.72001462.525018.764.431517.265.440015.86750014.370.163015.778.48001677.5100017.672125016.570.916001671.8200016.670.1250015.172.9315013.473.940001273.6500011.775.263001271.7800011.869.31000012.162.3125001259.8160001158.5SPL2785.1N0.866.5median 15.1median 70.1Delta2.3526.325.821.422.12624.925.127.622.532.523.448.72655.818.860.922.167.2267019.372.317.674.217.774.319.575.31571.711.871.311.27410.574.21072.710.17210.67210.97511.374.811.671.71269.71269.612.371.112.669.61270.111.269.824.784.70.666.6median 12median 71.73.42.2hearing rangehide median Pink NoiseDell Pro 5 16 P516265Apple MacBook Pro 16 2021 M1 Pro
Diagramma frequenza (le caselle possono essere selezionate/deselezionate per confrontare i dispositivi)
Dell Pro 5 16 P516265 analisi audio

(+) | gli altoparlanti sono relativamente potenti (85.1 dB)
Bassi 100 - 315 Hz
(±) | bassi ridotti - in media 14.1% inferiori alla media
(±) | la linearità dei bassi è media (10.5% delta rispetto alla precedente frequenza)
Medi 400 - 2000 Hz
(+) | medi bilanciati - solo only 2.9% rispetto alla media
(+) | medi lineari (5.3% delta rispetto alla precedente frequenza)
Alti 2 - 16 kHz
(+) | Alti bilanciati - appena 3.6% dalla media
(+) | alti lineari (4.8% delta rispetto alla precedente frequenza)
Nel complesso 100 - 16.000 Hz
(+) | suono nel complesso lineare (12.7% differenza dalla media)
Rispetto alla stessa classe
» 6% di tutti i dispositivi testati in questa classe è stato migliore, 2% simile, 92% peggiore
» Il migliore ha avuto un delta di 7%, medio di 21%, peggiore di 53%
Rispetto a tutti i dispositivi testati
» 12% di tutti i dispositivi testati in questa classe è stato migliore, 3% similare, 86% peggiore
» Il migliore ha avuto un delta di 4%, medio di 23%, peggiore di 134%

Apple MacBook Pro 16 2021 M1 Pro analisi audio

(+) | gli altoparlanti sono relativamente potenti (84.7 dB)
Bassi 100 - 315 Hz
(+) | bassi buoni - solo 3.8% dalla media
(+) | bassi in lineaa (5.2% delta rispetto alla precedente frequenza)
Medi 400 - 2000 Hz
(+) | medi bilanciati - solo only 1.3% rispetto alla media
(+) | medi lineari (2.1% delta rispetto alla precedente frequenza)
Alti 2 - 16 kHz
(+) | Alti bilanciati - appena 1.9% dalla media
(+) | alti lineari (2.7% delta rispetto alla precedente frequenza)
Nel complesso 100 - 16.000 Hz
(+) | suono nel complesso lineare (4.6% differenza dalla media)
Rispetto alla stessa classe
» 0% di tutti i dispositivi testati in questa classe è stato migliore, 0% simile, 100% peggiore
» Il migliore ha avuto un delta di 5%, medio di 17%, peggiore di 45%
Rispetto a tutti i dispositivi testati
» 0% di tutti i dispositivi testati in questa classe è stato migliore, 0% similare, 100% peggiore
» Il migliore ha avuto un delta di 4%, medio di 23%, peggiore di 134%

Gestione energetica

Consumo energetico
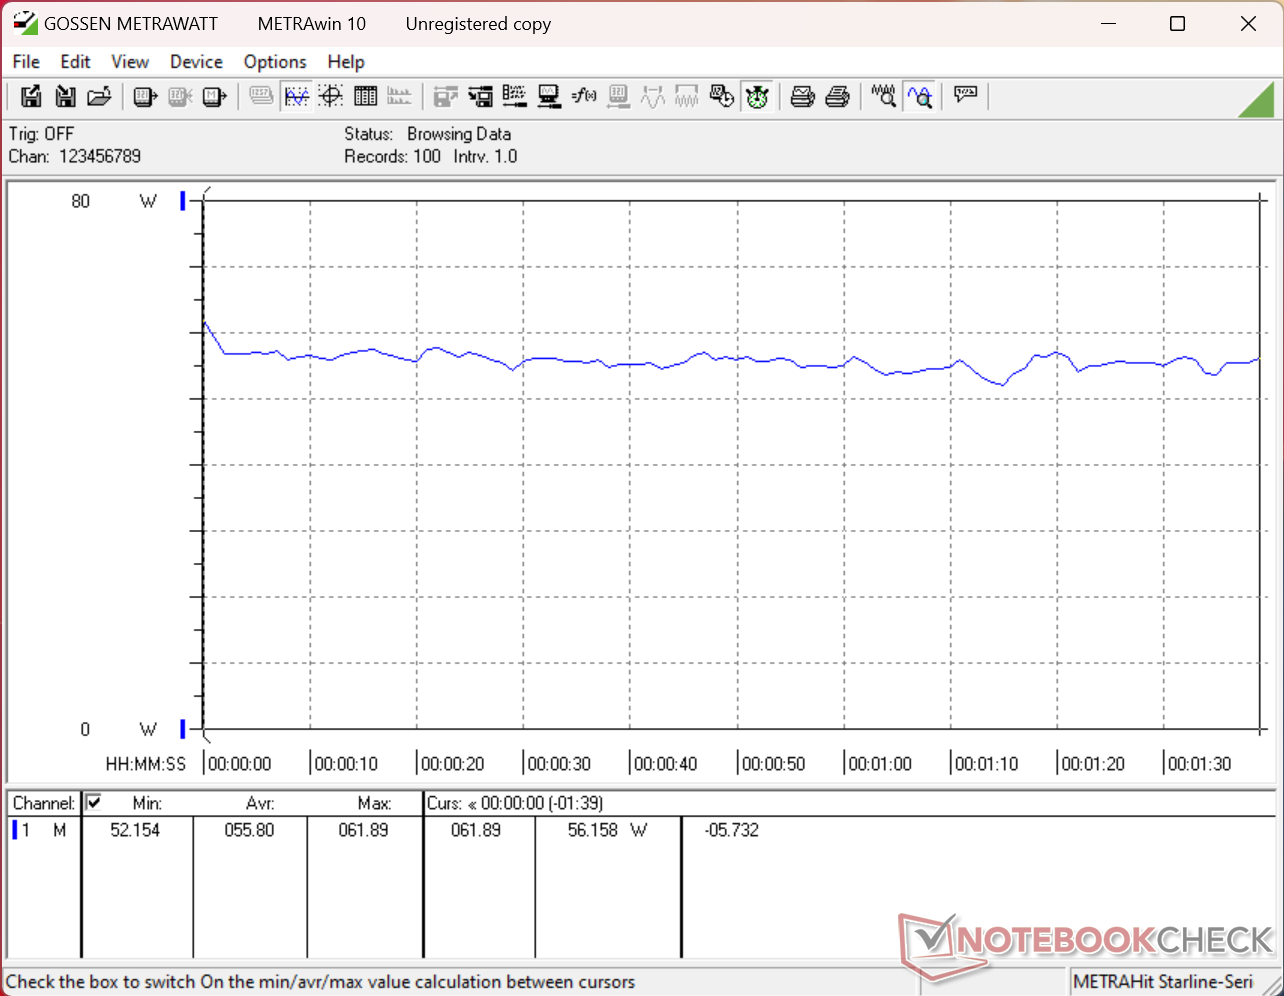
Consumo di 3DMark 06
Cyberpunk 2077: consumo a 1080p in modalità Ultra
Il consumo raggiungerebbe un picco di 69 W all’avvio dello stress test Prime95, per poi diminuire e stabilizzarsi a 60 W pochi secondi dopo
Lo stress test con Prime95+FurMark è stato avviato al decimo secondo
Consumo di corrente
Off / Standbydarklight 0.26 / 2.7 Watt
Idledarkmidlight 5.4 / 10.1 / 10.3 Watt
Sotto carico midlight 55.8 / 69.2 Watt
 color bar
Leggenda: min: dark, med: mid, max: light        Metrahit Energy
Dell Pro 5 16 P516265
Ryzen AI 9 HX PRO 470, Radeon 890M, SanDisk PC SN5100S, IPS, 2560x1600, 16"
Dell XPS 16 Core Ultra X7 358H
Ultra X7 358H, Arc B390 Panther Lake iGPU, , OLED, 3200x2000, 16"
Lenovo ThinkPad T16 Gen 5 22AN001WGE
R5 PRO 215, Radeon 740M, Samsung PM9C1b MZVL8512HFLU-00BLL, IPS, 1920x1200, 16"
MSI Venture 16 AI A2HMTG
Ultra 7 255H, Arc 140T, , IPS, 1920x1200, 16"
Asus ExpertBook B5 B5605CCA
Ultra 5 225H, Arc 130T, Micron 2500 MTFDKBA512QGN, IPS, 2560x1600, 16"
HP EliteBook 8 G1a 16 AI
Ryzen AI 7 PRO 350, Radeon 860M, Micron 3500 MTFDKBA512TGD, IPS, 1920x1200, 16"
Power Consumption
8%
21%
3%
10%
10%
Idle Minimum * (Watt)
5.4
4
26%
3.7
31%
5.9
-9%
4.7
13%
2.9
46%
Idle Average * (Watt)
10.1
4.4
56%
7.4
27%
9
11%
9.7
4%
6.5
36%
Idle Maximum * (Watt)
10.3
10.2
1%
8.1
21%
9.7
6%
10.1
2%
6.7
35%
Load Average * (Watt)
55.8
44.2
21%
40.8
27%
54.9
2%
44.2
21%
65.6
-18%
Cyberpunk 2077 ultra * (Watt)
61.6
62.6
-2%
45.1
27%
57.3
7%
50.3
18%
65.8
-7%
Cyberpunk 2077 ultra external monitor * (Watt)
58.6
62.4
-6%
43.7
25%
54.2
8%
50.9
13%
62.8
-7%
Load Maximum * (Watt)
69.2
94.6
-37%
78.9
-14%
72.3
-4%
69.6
-1%
80.6
-16%

* ... Meglio usare valori piccoli

Consumo energetico Cyberpunk / Stress test

0510152025303540455055606570Tooltip
Dell Pro 5 16 P516265 Ryzen AI 9 HX PRO 470, Radeon 890M; 1280x720 Prime95 28.10 and Furmark 1.25: Ø65.1 (63-69.2) Watt
Samsung Galaxy Book6 Pro Ultra 7 356H, Intel Graphics 4 Xe3 PTL; 1280x720 Prime95 28.10 and Furmark 1.25: Ø57.8 (52.8-70.8) Watt
Dell Pro 5 16 P516265 Ryzen AI 9 HX PRO 470, Radeon 890M; Idle 150cd/m2: Ø6.29 (5.99-7.75) Watt
Samsung Galaxy Book6 Pro Ultra 7 356H, Intel Graphics 4 Xe3 PTL; Idle 150cd/m2: Ø3.37 (3.19-4.12) Watt
Dell Pro 5 16 P516265 Ryzen AI 9 HX PRO 470, Radeon 890M; Cyberpunk 2077 FHD ultra no FSR 150cd: Ø61.6 (60.4-64.1) Watt
Samsung Galaxy Book6 Pro Ultra 7 356H, Intel Graphics 4 Xe3 PTL; Cyberpunk 2077 FHD ultra no FSR 150cd: Ø52.7 (51.7-58) Watt

Consumo energetico del monitor esterno

0510152025303540455055606570Tooltip
Dell Pro 5 16 P516265 Ryzen AI 9 HX PRO 470, Radeon 890M; Prime95 V2810 Stress (external Monitor): Ø58.8 (56.3-69.3) Watt
Samsung Galaxy Book6 Pro Ultra 7 356H, Intel Graphics 4 Xe3 PTL; Prime95 V2810 Stress (external Monitor): Ø58.1 (52.5-70.8) Watt
Dell Pro 5 16 P516265 Ryzen AI 9 HX PRO 470, Radeon 890M; Cinebench R15 Multi (external Monitor): Ø55.7 (51-60) Watt
Samsung Galaxy Book6 Pro Ultra 7 356H, Intel Graphics 4 Xe3 PTL; Cinebench R15 Multi (external Monitor): Ø70.8 (70.6-70.8) Watt
Dell Pro 5 16 P516265 Ryzen AI 9 HX PRO 470, Radeon 890M; Cinebench R23 Multi (external Monitor): Ø52 (42.7-60.2) Watt
Samsung Galaxy Book6 Pro Ultra 7 356H, Intel Graphics 4 Xe3 PTL; Cinebench R23 Multi (external Monitor): Ø68.1 (65-70.8) Watt
Dell Pro 5 16 P516265 Ryzen AI 9 HX PRO 470, Radeon 890M; 1280x720 FurMark 1.19 GPU Stress Test (external Monitor): Ø58.4 (56.1-66.7) Watt
Samsung Galaxy Book6 Pro Ultra 7 356H, Intel Graphics 4 Xe3 PTL; 1280x720 FurMark 1.19 GPU Stress Test (external Monitor): Ø48 (44.3-49.8) Watt
Dell Pro 5 16 P516265 Ryzen AI 9 HX PRO 470, Radeon 890M; Idle 1min (external Monitor): Ø5.47 (5.17-6.32) Watt
Samsung Galaxy Book6 Pro Ultra 7 356H, Intel Graphics 4 Xe3 PTL; Idle 1min (external Monitor): Ø3.72 (3.53-4.46) Watt
Dell Pro 5 16 P516265 Ryzen AI 9 HX PRO 470, Radeon 890M; Cyberpunk 2077 FHD ultra no FSR (external Monitor): Ø58.6 (57.4-61.2) Watt
Samsung Galaxy Book6 Pro Ultra 7 356H, Intel Graphics 4 Xe3 PTL; Cyberpunk 2077 FHD ultra no FSR (external Monitor): Ø40.6 (35.7-44.8) Watt

Durata della batteria

Autonomia della batteria
WiFi Websurfing
12ore 28minuti
Dell Pro 5 16 P516265
Ryzen AI 9 HX PRO 470, Radeon 890M, 70 Wh
Dell XPS 16 Core Ultra X7 358H
Ultra X7 358H, Arc B390 Panther Lake iGPU, 70 Wh
Lenovo ThinkPad T16 Gen 5 22AN001WGE
R5 PRO 215, Radeon 740M, 75 Wh
MSI Venture 16 AI A2HMTG
Ultra 7 255H, Arc 140T, 55.2 Wh
Asus ExpertBook B5 B5605CCA
Ultra 5 225H, Arc 130T, 50 Wh
HP EliteBook 8 G1a 16 AI
Ryzen AI 7 PRO 350, Radeon 860M, 77 Wh
Autonomia della batteria
WiFi v1.3 (h)
12.5
10.3
-18%
15.8
26%
7
-44%
8.9
-29%
13.3
6%

Valutazione di Notebookcheck

Un computer portatile aziendale tradizionale, se non addirittura sobrio, dotato di RAM rimovibile, WAN opzionale e numerose porte integrate.

Dell Pro 5 16 P516265 - 07/24/2026 v8
Allen Ngo

Chassis
84 / 98 → 86%
Tastiera
80%
Dispositivo di puntamento
77%
Connettività
70 / 80 → 88%
Peso
63 / 20-75 → 78%
Batteria
89%
Display
82%
Prestazioni di gioco
56 / 75 → 74%
Prestazioni Applicazioni
89 / 92 → 96%
AI Performance
90%
Temperatura
92%
Rumorosità
80%
Audio
83%
Fotocamera
42 / 75 → 55%
Media
67%
83%
Office - Media ponderata
CO2 Emissions
No Data
Materials
50%
Packaging
100%
Power Use
76.7%
Repairability
Software Updates
39%
Recycle Logo Total Sustainability Score: 0%

Confronto con i potenziali concorrenti

Immagine
Modello
Prezzo
Peso
Altezza
Schermo
1.
83.4%
Dell Pro 5 16 P516265
AMD Ryzen AI 9 HX PRO 470 ⎘
AMD Radeon 890M ⎘
64 GB Memoria, 1024 GB SSD
Amazon: Prezzo di listino: 4500 USD2 kg18.95 mm16.00"
2560x1600
189 PPI
IPS
2.
87.2%
Dell XPS 16 Core Ultra X7 358H
Intel Core Ultra X7 358H ⎘
Intel Arc B390 12 Xe3 Panther Lake iGPU ⎘
32 GB Memoria
Amazon:
1. $1,977.99
Dell Premium 16 (Previously ...
2. $2,399.99
Dell Premium 16 (Previously ...
3. $2,595.99
Dell Premium 16 (XPS 16 2025...
Prezzo di listino: 2350 USD
1.7 kg14.62 mm16.00"
3200x2000
236 PPI
OLED
3.
86.9%
Lenovo ThinkPad T16 Gen 5 22AN001WGE
AMD Ryzen 5 PRO 215 ⎘
AMD Radeon 740M ⎘
16 GB Memoria, 512 GB SSD
Amazon:
1. $1,249.99
Lenovo ThinkPad T16 Gen 4 La...
2. $1,299.95
Lenovo ThinkPad T16 Gen 4 Bu...
3. $1,789.99
Lenovo ThinkPad T16 Gen 4 Co...
Prezzo di listino: 1640€
1.9 kg18.2 mm16.00"
1920x1200
142 PPI
IPS
4.
80.7%
MSI Venture 16 AI A2HMTG
Intel Core Ultra 7 255H ⎘
Intel Arc Graphics 140T ⎘
32 GB Memoria
Amazon: Prezzo di listino: 1000 USD2.1 kg23.15 mm16.00"
1920x1200
142 PPI
IPS
5.
84.4%
Asus ExpertBook B5 B5605CCA
Intel Core Ultra 5 225H ⎘
Intel Arc Graphics 130T ⎘
16 GB Memoria, 512 GB SSD
Amazon: Prezzo di listino: 1300€1.7 kg18 mm16.00"
2560x1600
189 PPI
IPS
6.
87%
HP EliteBook 8 G1a 16 AI
AMD Ryzen AI 7 PRO 350 ⎘
AMD Radeon 860M ⎘
32 GB Memoria, 512 GB SSD
Amazon: Prezzo di listino: 4400 USD1.9 kg15.5 mm16.00"
1920x1200
142 PPI
IPS

Transparency

La selezione dei dispositivi da recensire viene effettuata dalla nostra redazione. Il campione di prova è stato fornito all'autore come prestito dal produttore o dal rivenditore ai fini di questa recensione. L'istituto di credito non ha avuto alcuna influenza su questa recensione, né il produttore ne ha ricevuto una copia prima della pubblicazione. Non vi era alcun obbligo di pubblicare questa recensione. In quanto società mediatica indipendente, Notebookcheck non è soggetta all'autorità di produttori, rivenditori o editori.

Ecco come Notebookcheck esegue i test

Ogni anno, Notebookcheck esamina in modo indipendente centinaia di laptop e smartphone utilizzando procedure standardizzate per garantire che tutti i risultati siano comparabili. Da circa 20 anni sviluppiamo continuamente i nostri metodi di prova e nel frattempo stabiliamo gli standard di settore. Nei nostri laboratori di prova, tecnici ed editori esperti utilizzano apparecchiature di misurazione di alta qualità. Questi test comportano un processo di validazione in più fasi. Il nostro complesso sistema di valutazione si basa su centinaia di misurazioni e parametri di riferimento ben fondati, che mantengono l'obiettività.
Google LogoAdd as a preferred source on Google
Mail Logo
> Recensioni e prove di notebook, tablets e smartphones > Recensioni e prove > Recensioni e prove > Recensione del Dell Pro 5 16 P516265: tradizionale e affidabile
Allen Ngo, 2026-07-25 (Update: 2026-07-25)