Verdetto - Aggiornamenti per lo più minori
Il Dell 16 Premium è essenzialmente un modello con prestazioni migliorate XPS 16 9640. Viene fornito con processori Intel e Nvidia più nuovi, più veloci e più efficienti, che gli utenti esperti potrebbero apprezzare. Tuttavia, se i suoi carichi di lavoro quotidiani non richiedono una potenza di elaborazione significativa, il meno costoso XPS 16 9640 può offrirle un'esperienza d'uso identica.
Il sistema conserva la maggior parte, se non tutti, gli inconvenienti associati alla riprogettazione dell'XPS 16 9640, tra cui le controverse modifiche alla tastiera e al clickpad. Il Dell 16 Premium presenta anche una strozzatura delle prestazioni della CPU leggermente più accentuata rispetto al passato. I potenziali acquirenti dovranno tenere presente che il sistema rinuncia a un po' di prestazioni grafiche in cambio di dimensioni ridotte e di un adattatore CA molto compatto. Gli utenti che non si preoccupano di un sistema leggermente più grande potrebbero trovare il concorrente Lenovo Yoga Pro 9i 16 un'alternativa più veloce, anche se configurato con specifiche CPU e GPU simili.
Pro
Contro
Prezzo e disponibilità
Dell distribuisce ora Dell 16 Premium a partire da 2.200 dollari per la configurazione base Core Ultra 7 RTX 5050 fino a 3.400 dollari per la configurazione Core Ultra 9 RTX 5070.
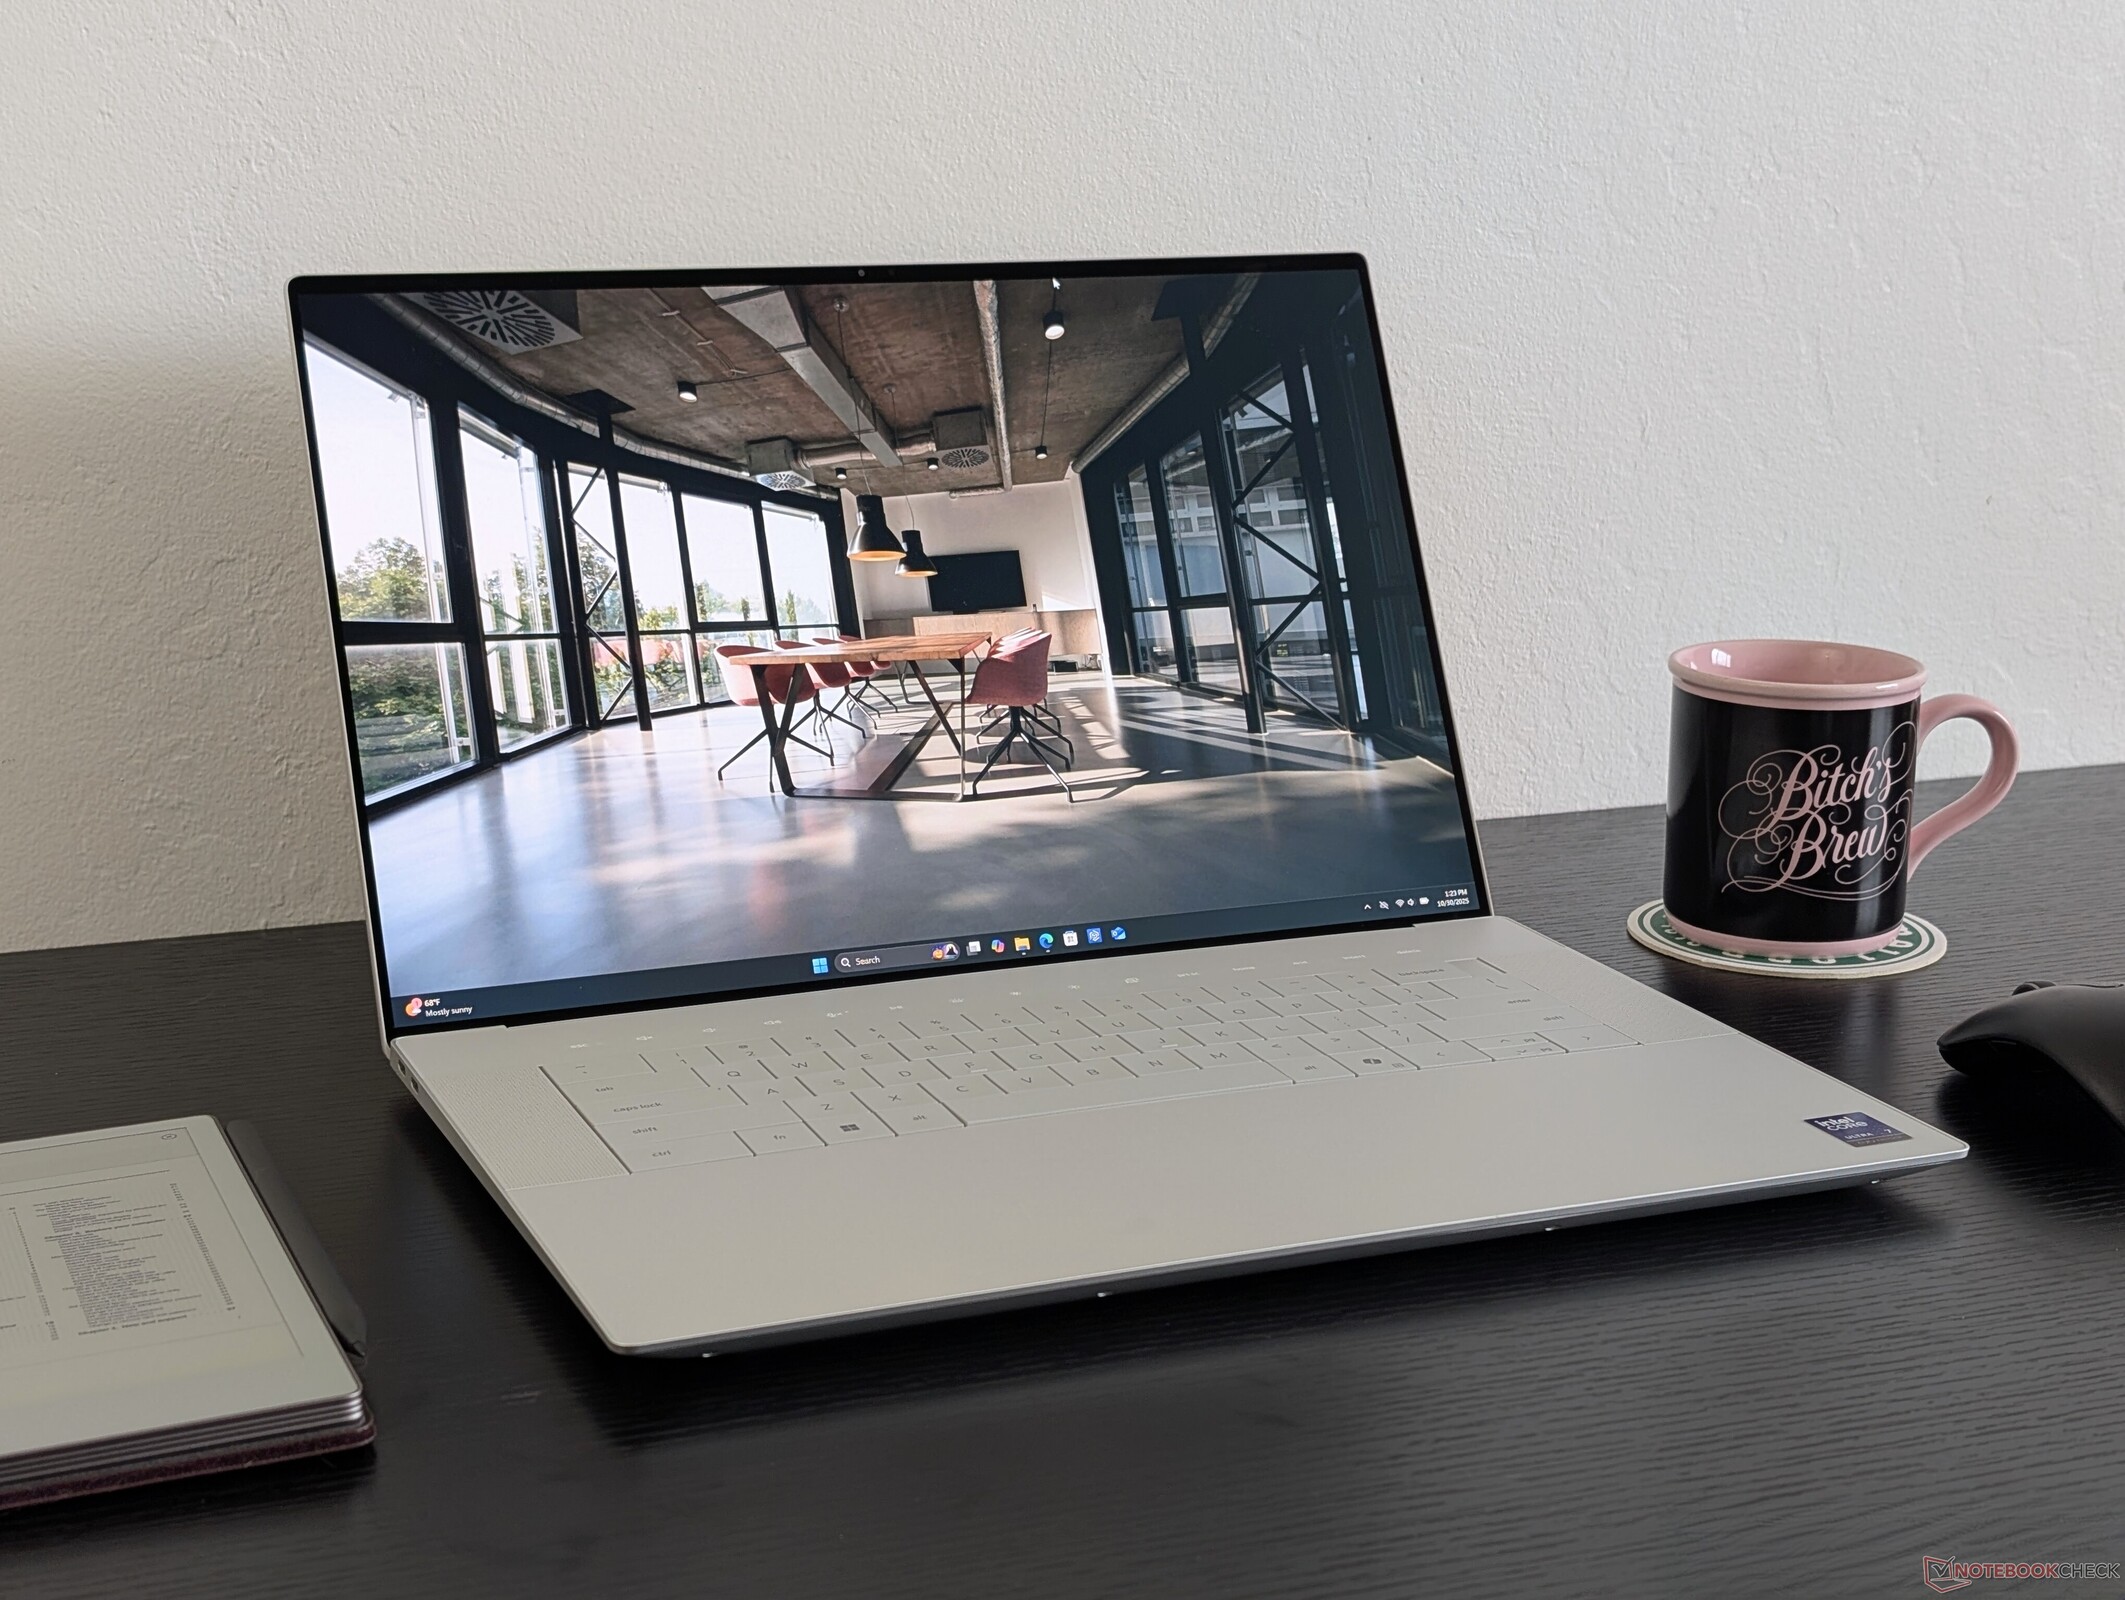
Il modello Dell 16 Premium è il successore della serie XPS 16. Sebbene il nome sia cambiato, il design familiare continua a vivere per un'esperienza utente sostanzialmente identica a quella della versione 2024. Molti dei nostri commenti sull'XPS 16 9640 valgono anche per il Dell 16 Premium, in quanto il modello più recente introduce solo cambiamenti interni, senza aggiornamenti esterni di rilievo.
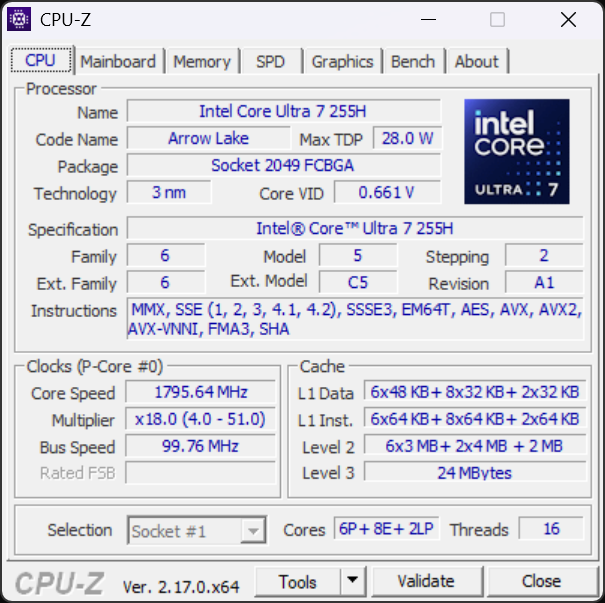
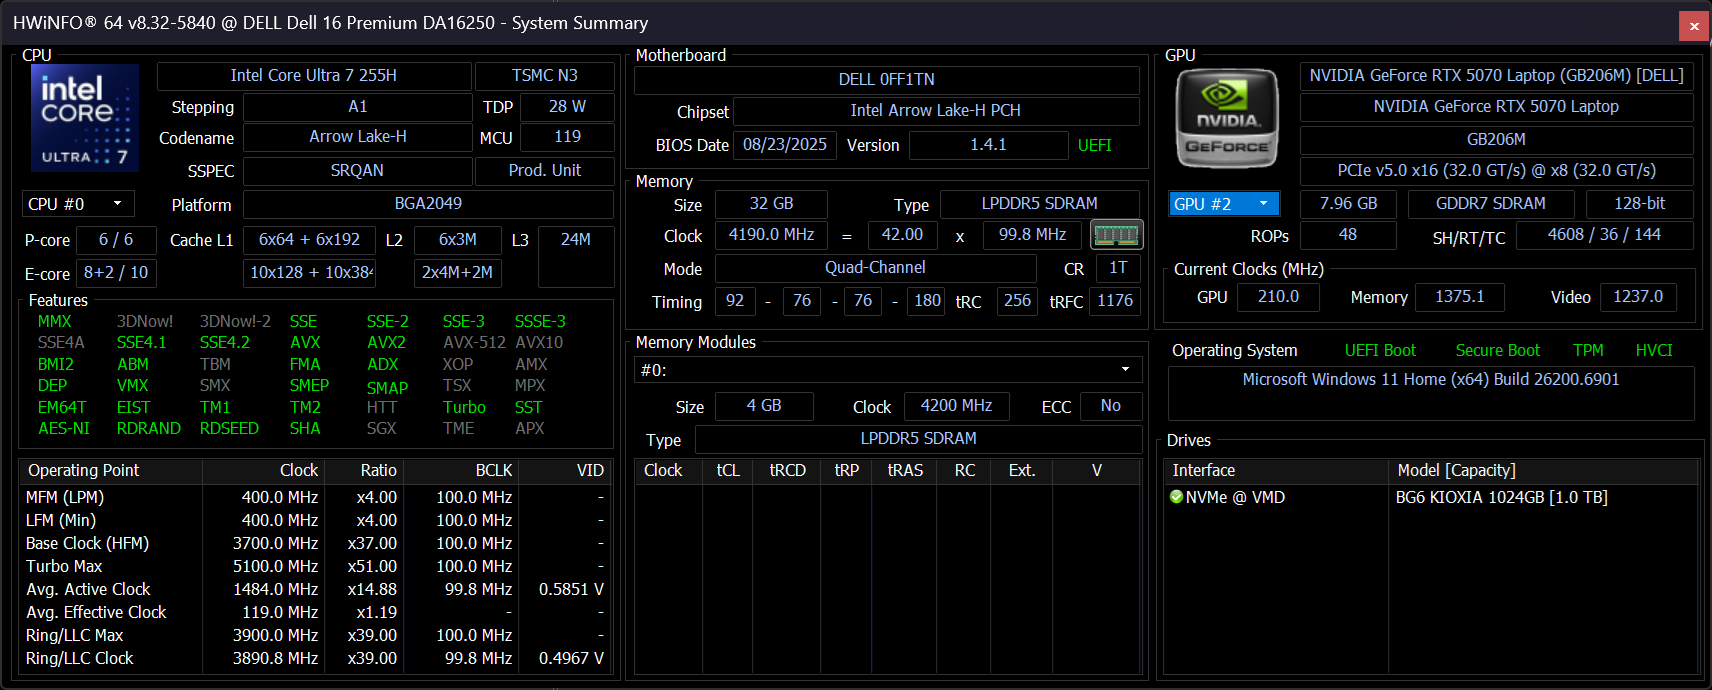
La nostra unità di prova è una configurazione di fascia alta con CPU Arrow Lake-H Core Ultra 7 255H, GPU Nvidia Blackwell GeForce RTX 5070 da 60 W e schermo touchscreen OLED da 16,3 pollici 4K 2400p 120 Hz, al prezzo di circa 3300 dollari, per sostituire le opzioni di processore Meteor Lake-H e Ada Lovelace dello scorso anno. Le SKU di fascia bassa possono essere fornite solo con grafica integrata, RTX 5050 o un display 2K 1200p non touch, mentre la configurazione di fascia più alta viene fornita con la CPU Core Ultra 9 285H.
Le alternative al Dell 16 Premium includono altri computer portatili multimediali di fascia alta come il Lenovo Yoga Pro 9i 16, HP Spectre x360 16o Apple MacBook Pro 16. Il Dell 16 Premium non deve essere confuso con il Dell Pro 16 Premium.
Altre recensioni Dell:
Specifiche
Caso
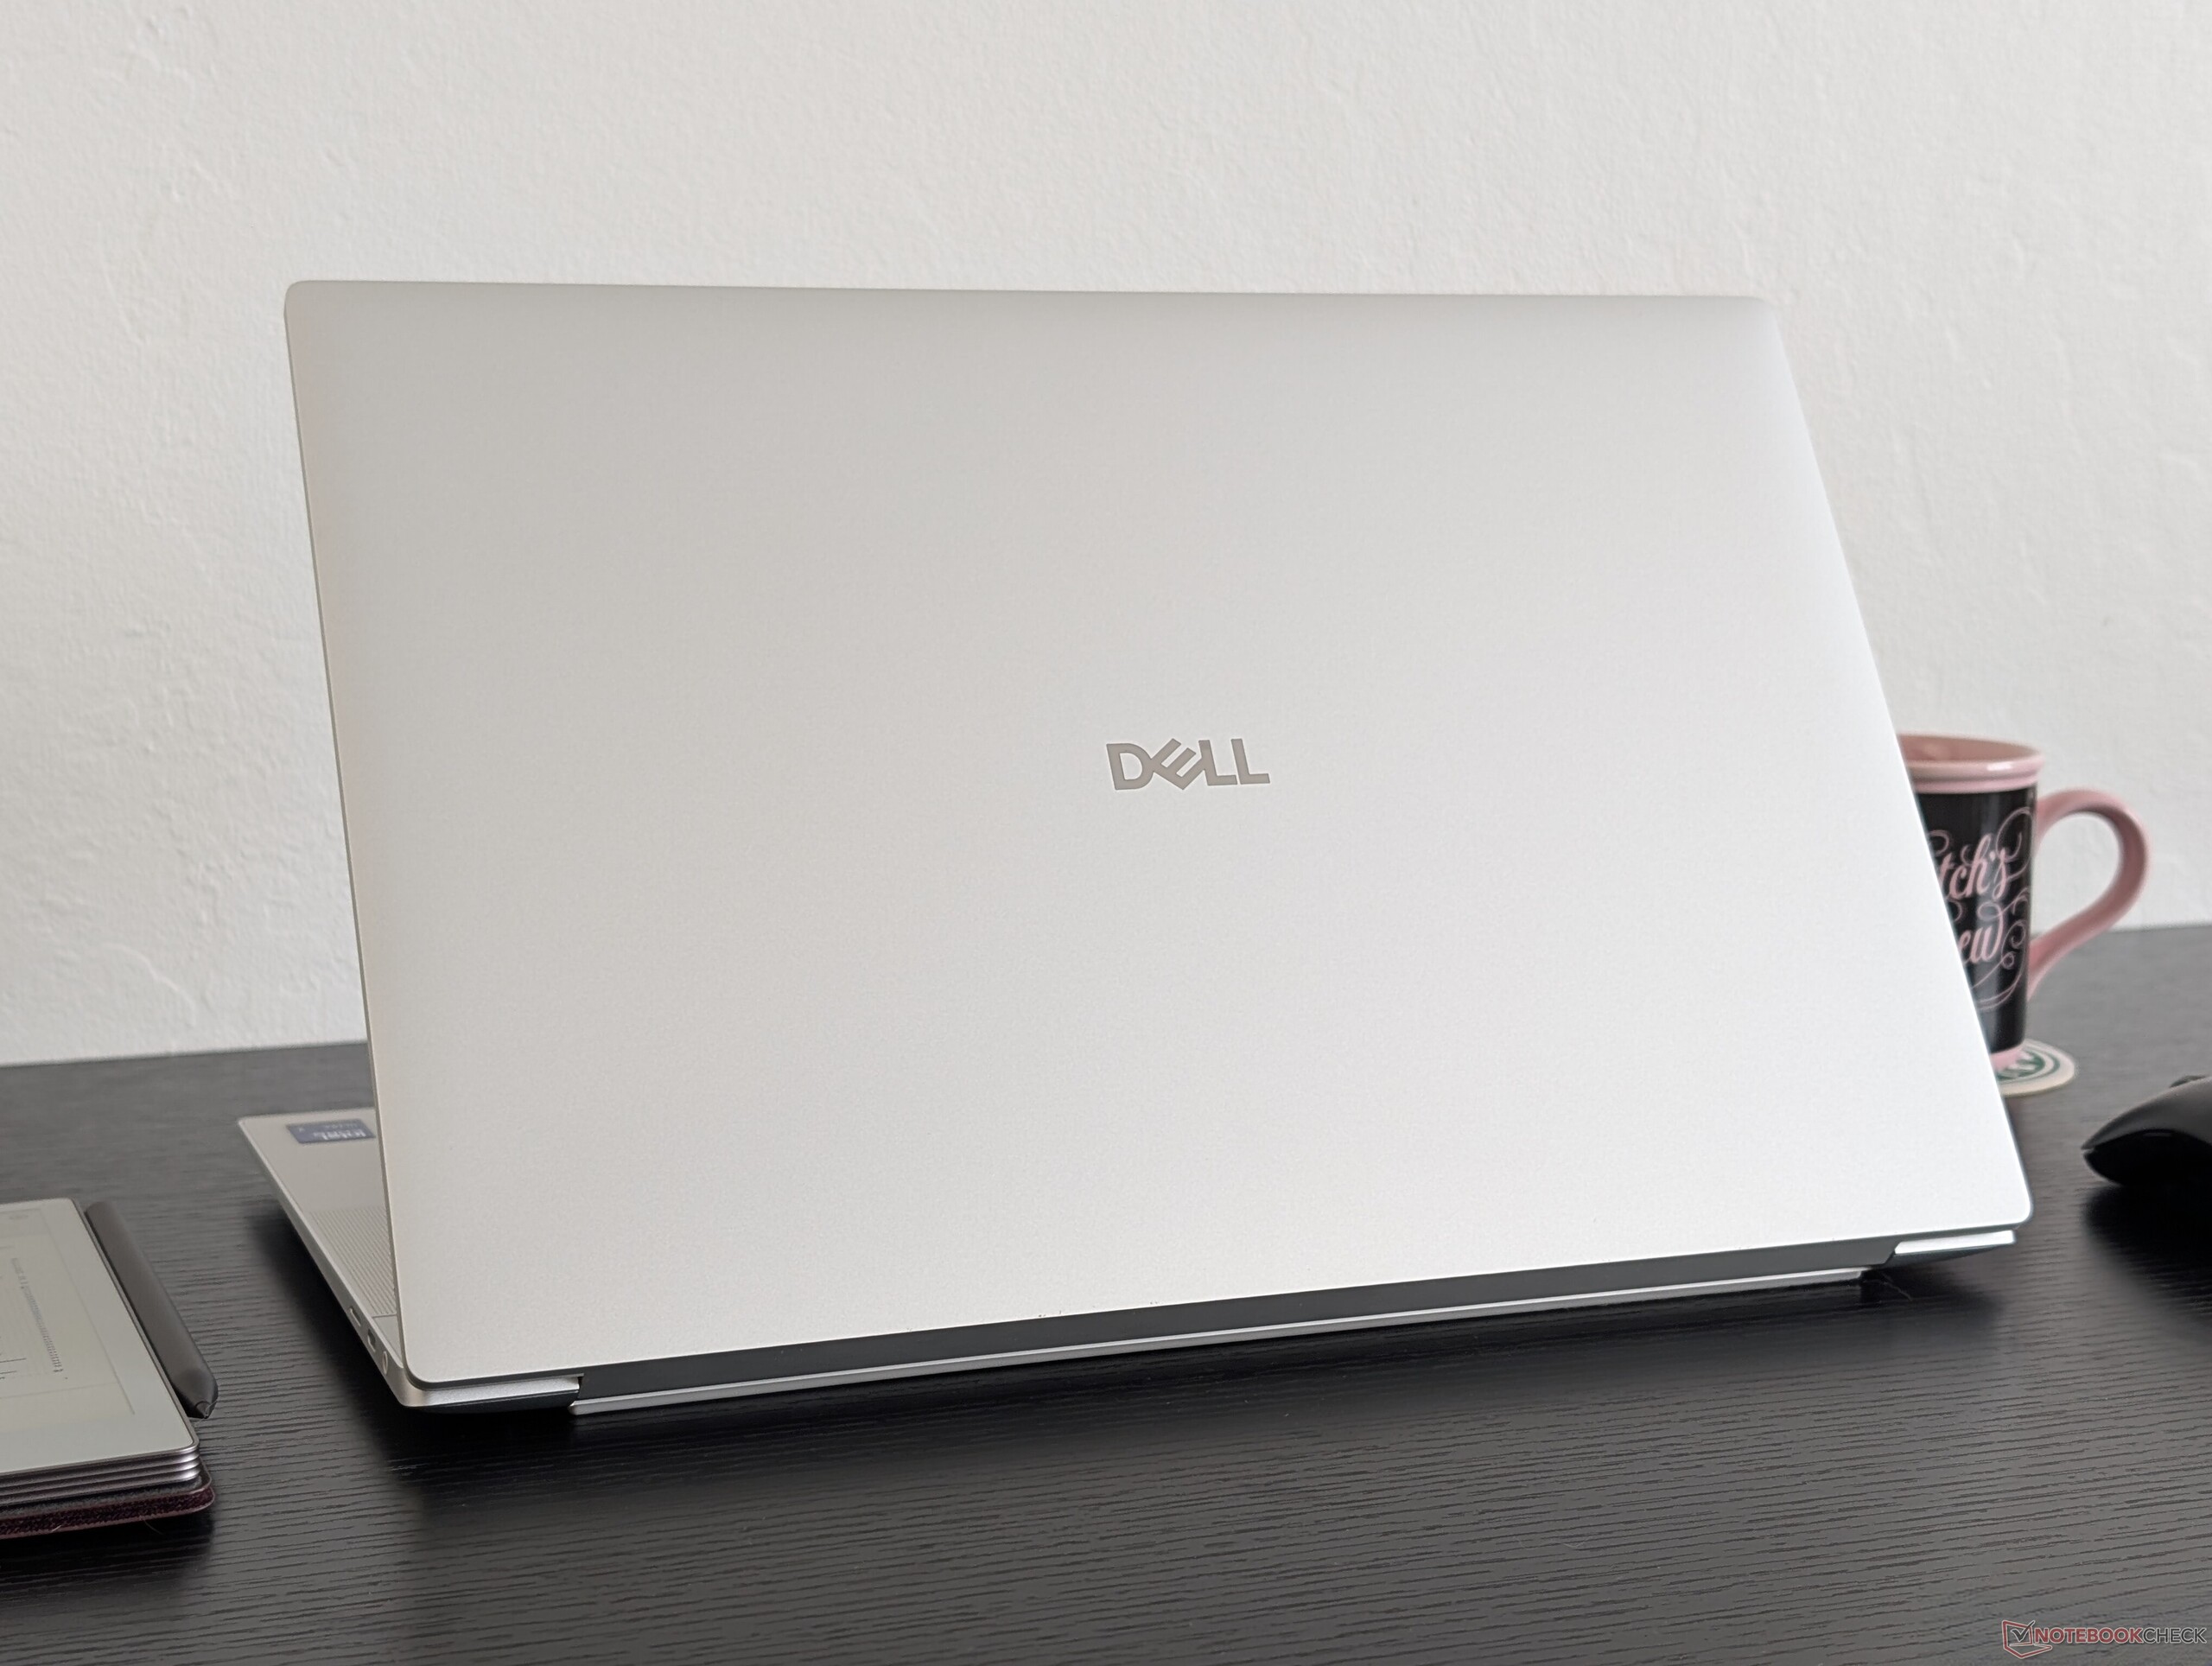
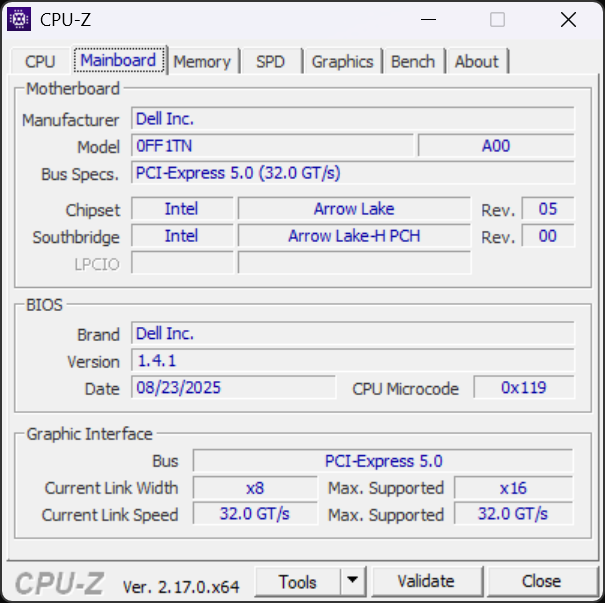
Sebbene Dell 16 Premium utilizzi lo stesso design del telaio dell'uscente XPS 16 9640, il logo sul coperchio esterno è stato modificato per apparire senza il cerchio. Questo è anche uno dei modi più semplici per distinguere visivamente il Dell 16 Premium dai vecchi modelli XPS.
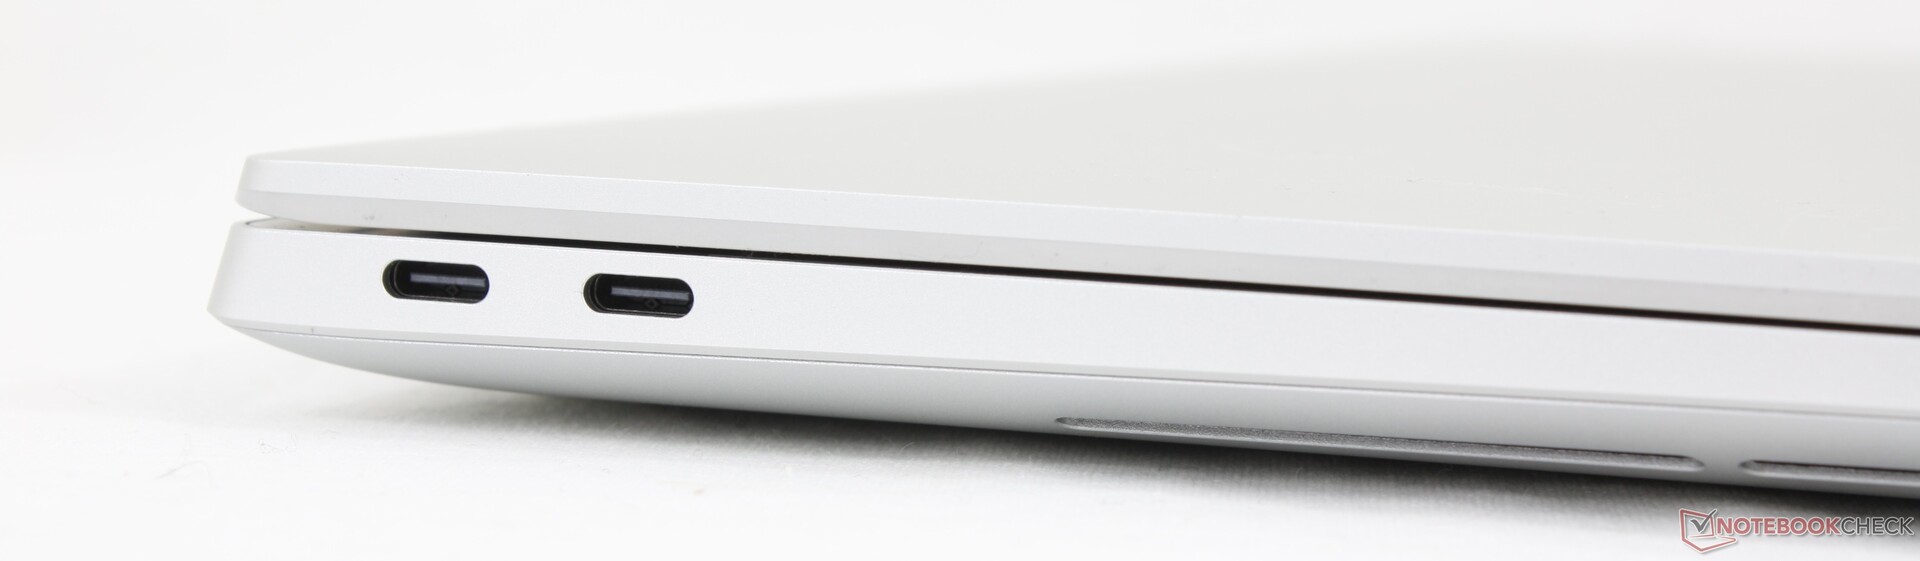
Connettività
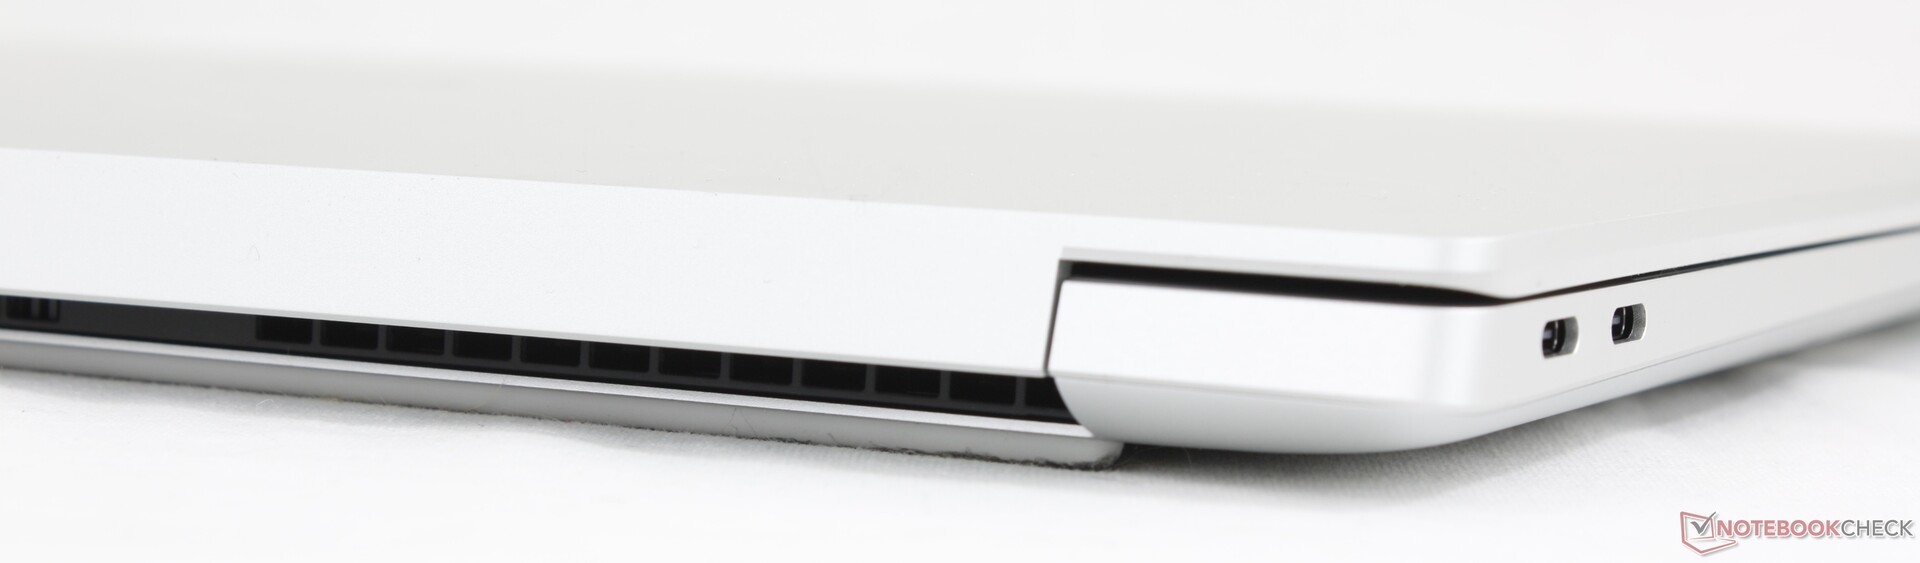
Tutte le porte USB-C sono ora Thunderbolt 4 a 40 Gbps, mentre questo non era vero su XPS 16 9640.

Comunicazione
| Networking | |
| iperf3 transmit AXE11000 | |
| LG Gram Pro 16Z90TS-G.AU89G | |
| Asus Zenbook S 16 UM5606-RK333W | |
| Lenovo Yoga Pro 9i 16 RTX 5070 | |
| Dell XPS 16 9640 | |
| HP Spectre x360 16 RTX 4050 | |
| Dell 16 Premium DA16250 | |
| iperf3 receive AXE11000 | |
| Asus Zenbook S 16 UM5606-RK333W | |
| Lenovo Yoga Pro 9i 16 RTX 5070 | |
| LG Gram Pro 16Z90TS-G.AU89G | |
| Dell XPS 16 9640 | |
| HP Spectre x360 16 RTX 4050 | |
| Dell 16 Premium DA16250 | |
| iperf3 transmit AXE11000 6GHz | |
| LG Gram Pro 16Z90TS-G.AU89G | |
| Dell 16 Premium DA16250 | |
| HP Spectre x360 16 RTX 4050 | |
| iperf3 receive AXE11000 6GHz | |
| LG Gram Pro 16Z90TS-G.AU89G | |
| Dell 16 Premium DA16250 | |
| HP Spectre x360 16 RTX 4050 | |
Webcam


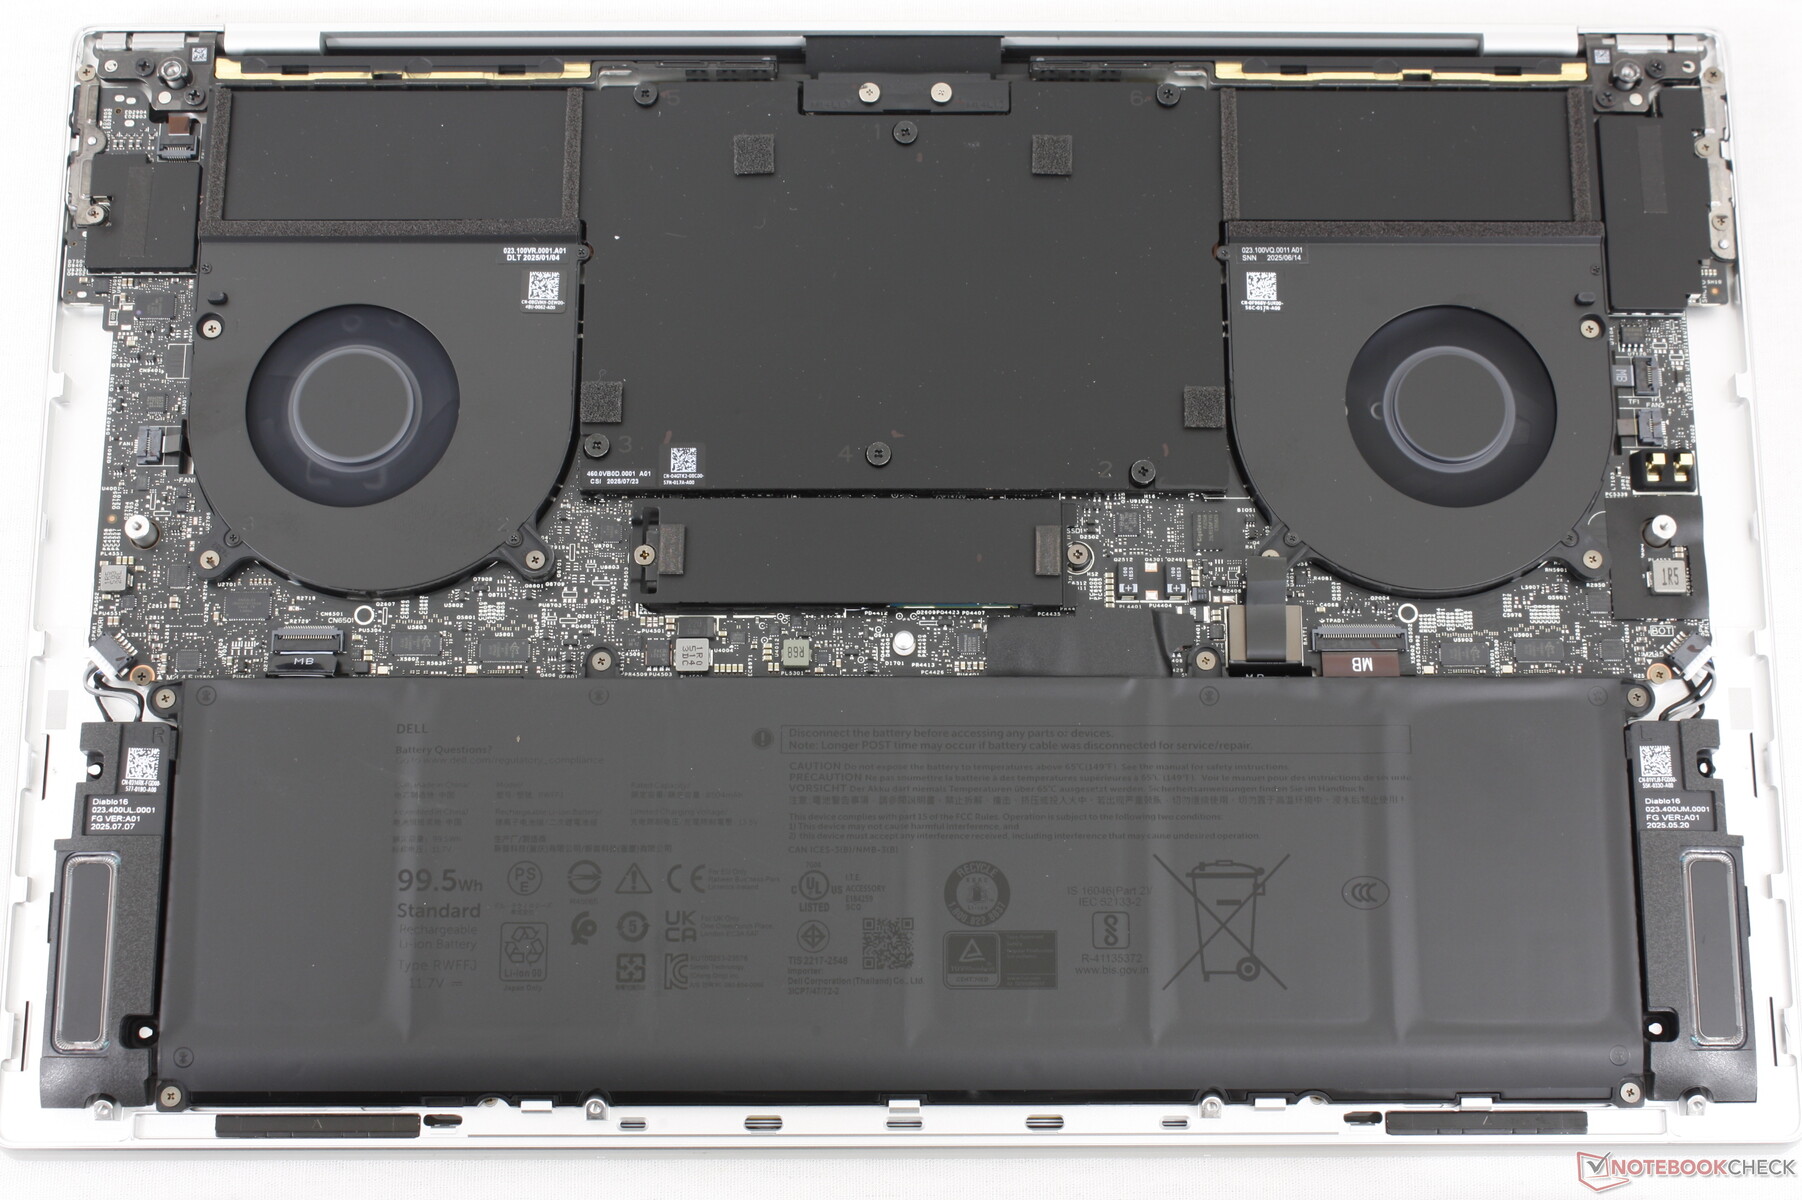
Manutenzione
Sostenibilità
Il telaio o scheletro è composto dal 75 percento di alluminio riciclato per il coperchio superiore, fino al 22 percento di vetro riciclato per lo schermo, il 25 percento di alluminio a basse emissioni per il poggiapolsi, il 18,5 di plastica riciclata nel complesso e un imballaggio riciclabile al 100 percento.
Garanzia
La garanzia limitata di un anno del produttore è standard se acquistata negli Stati Uniti.
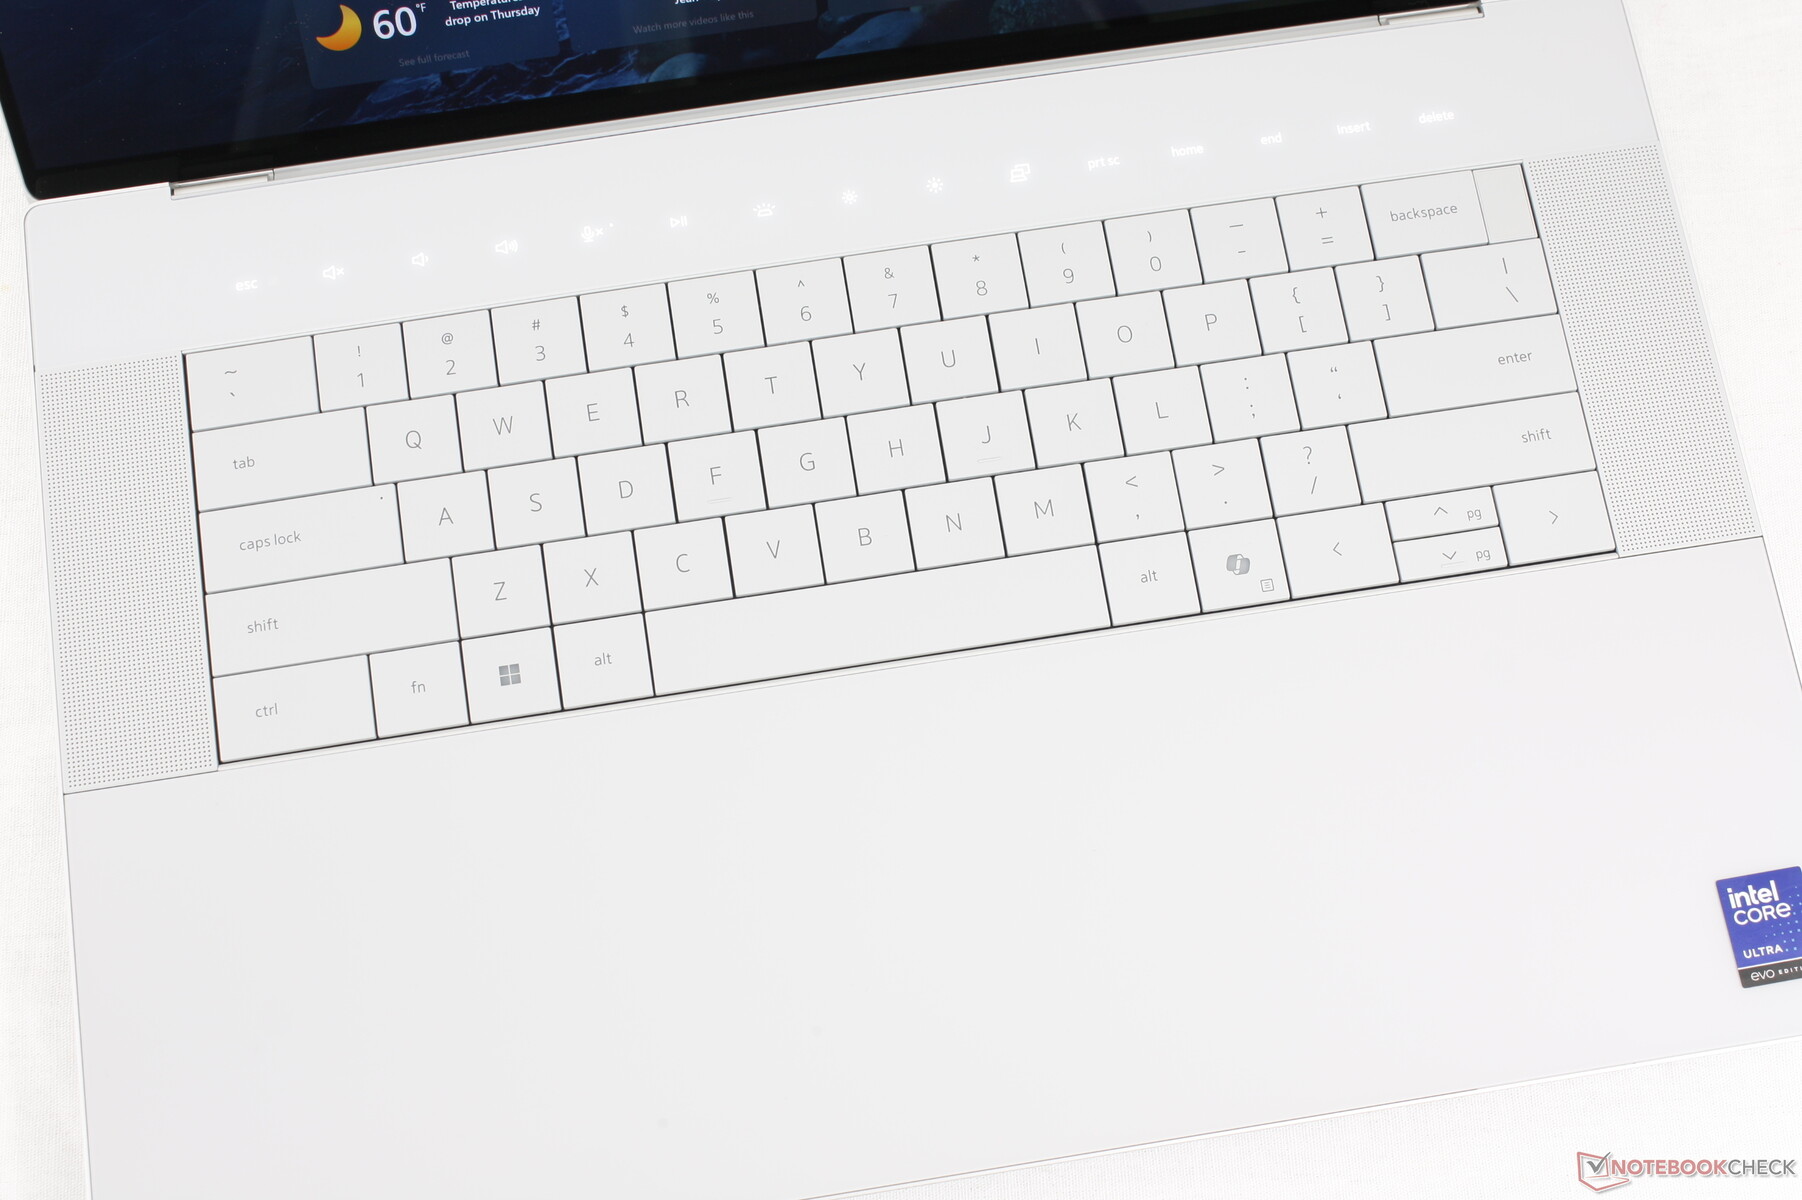
Dispositivi di ingresso
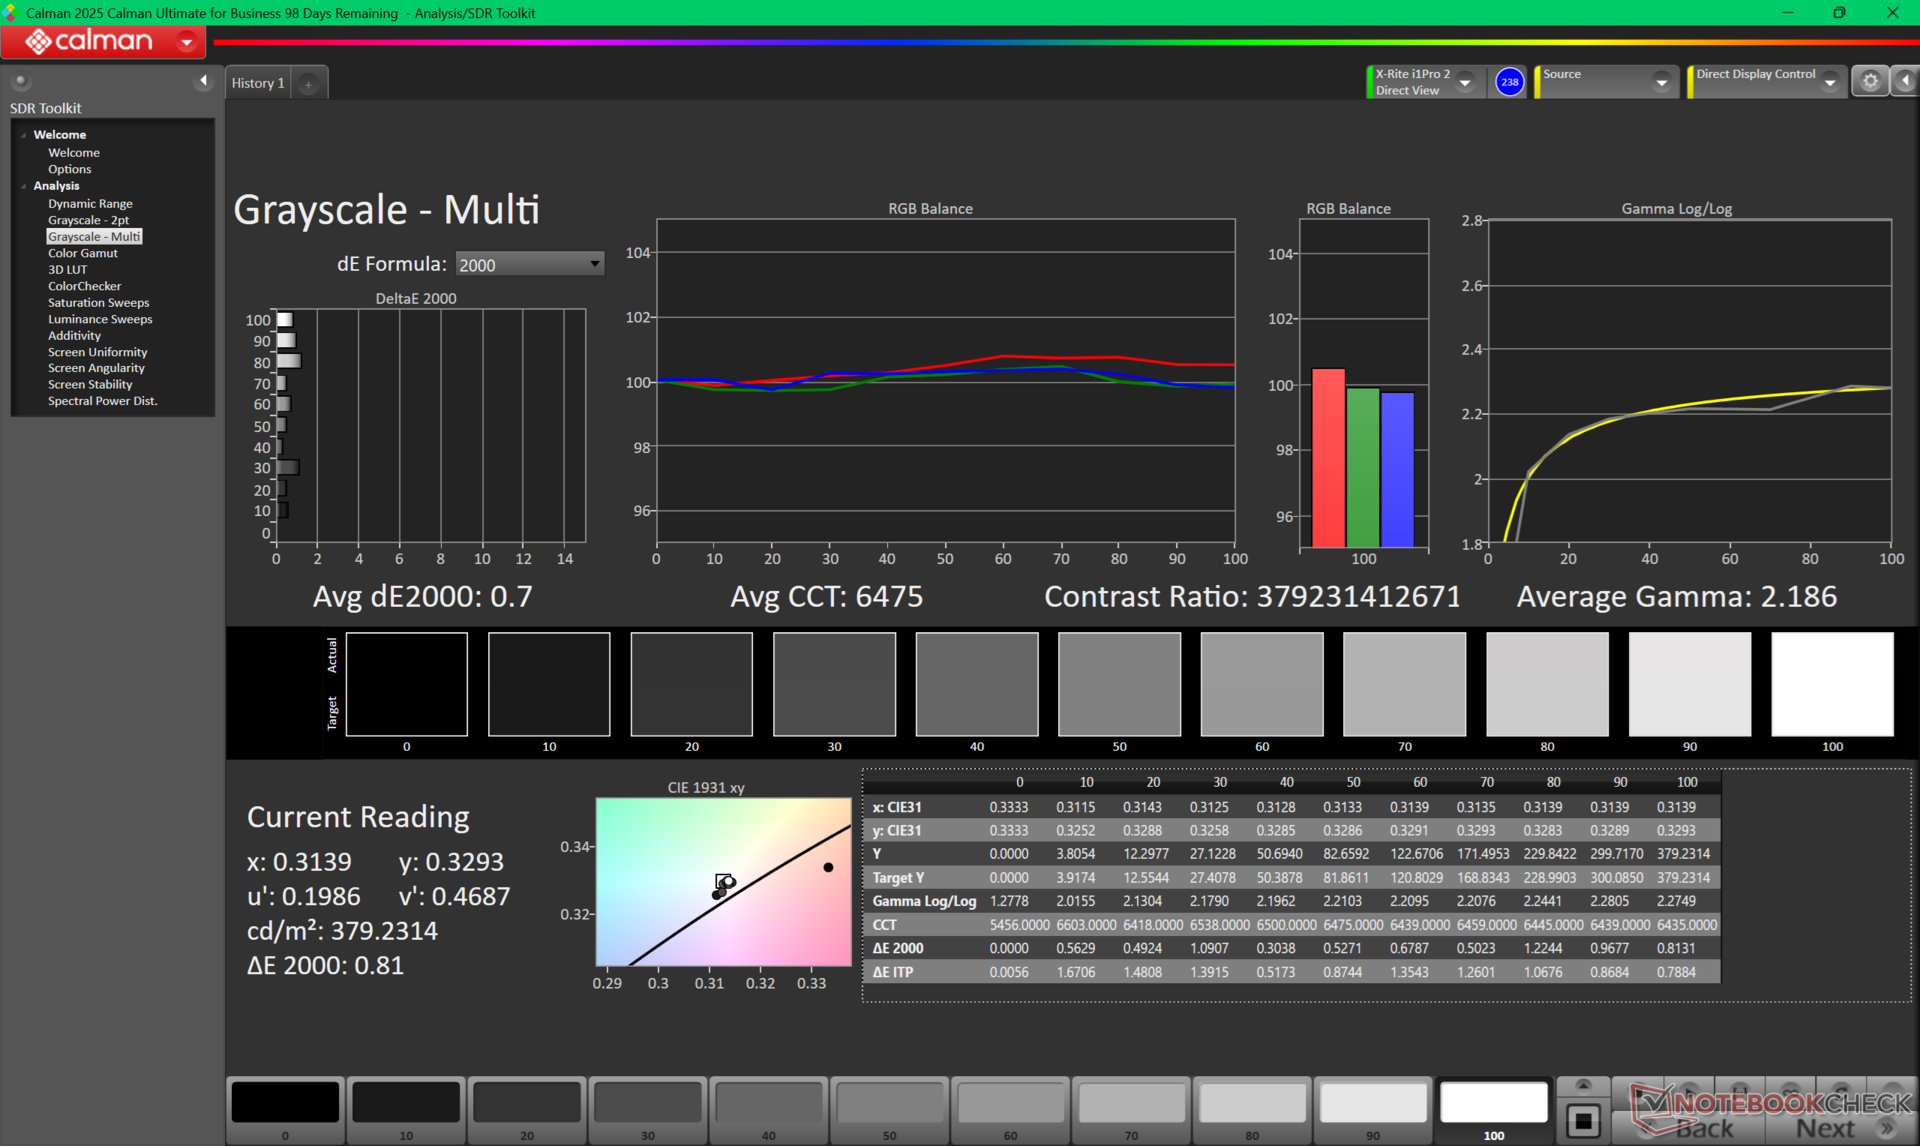
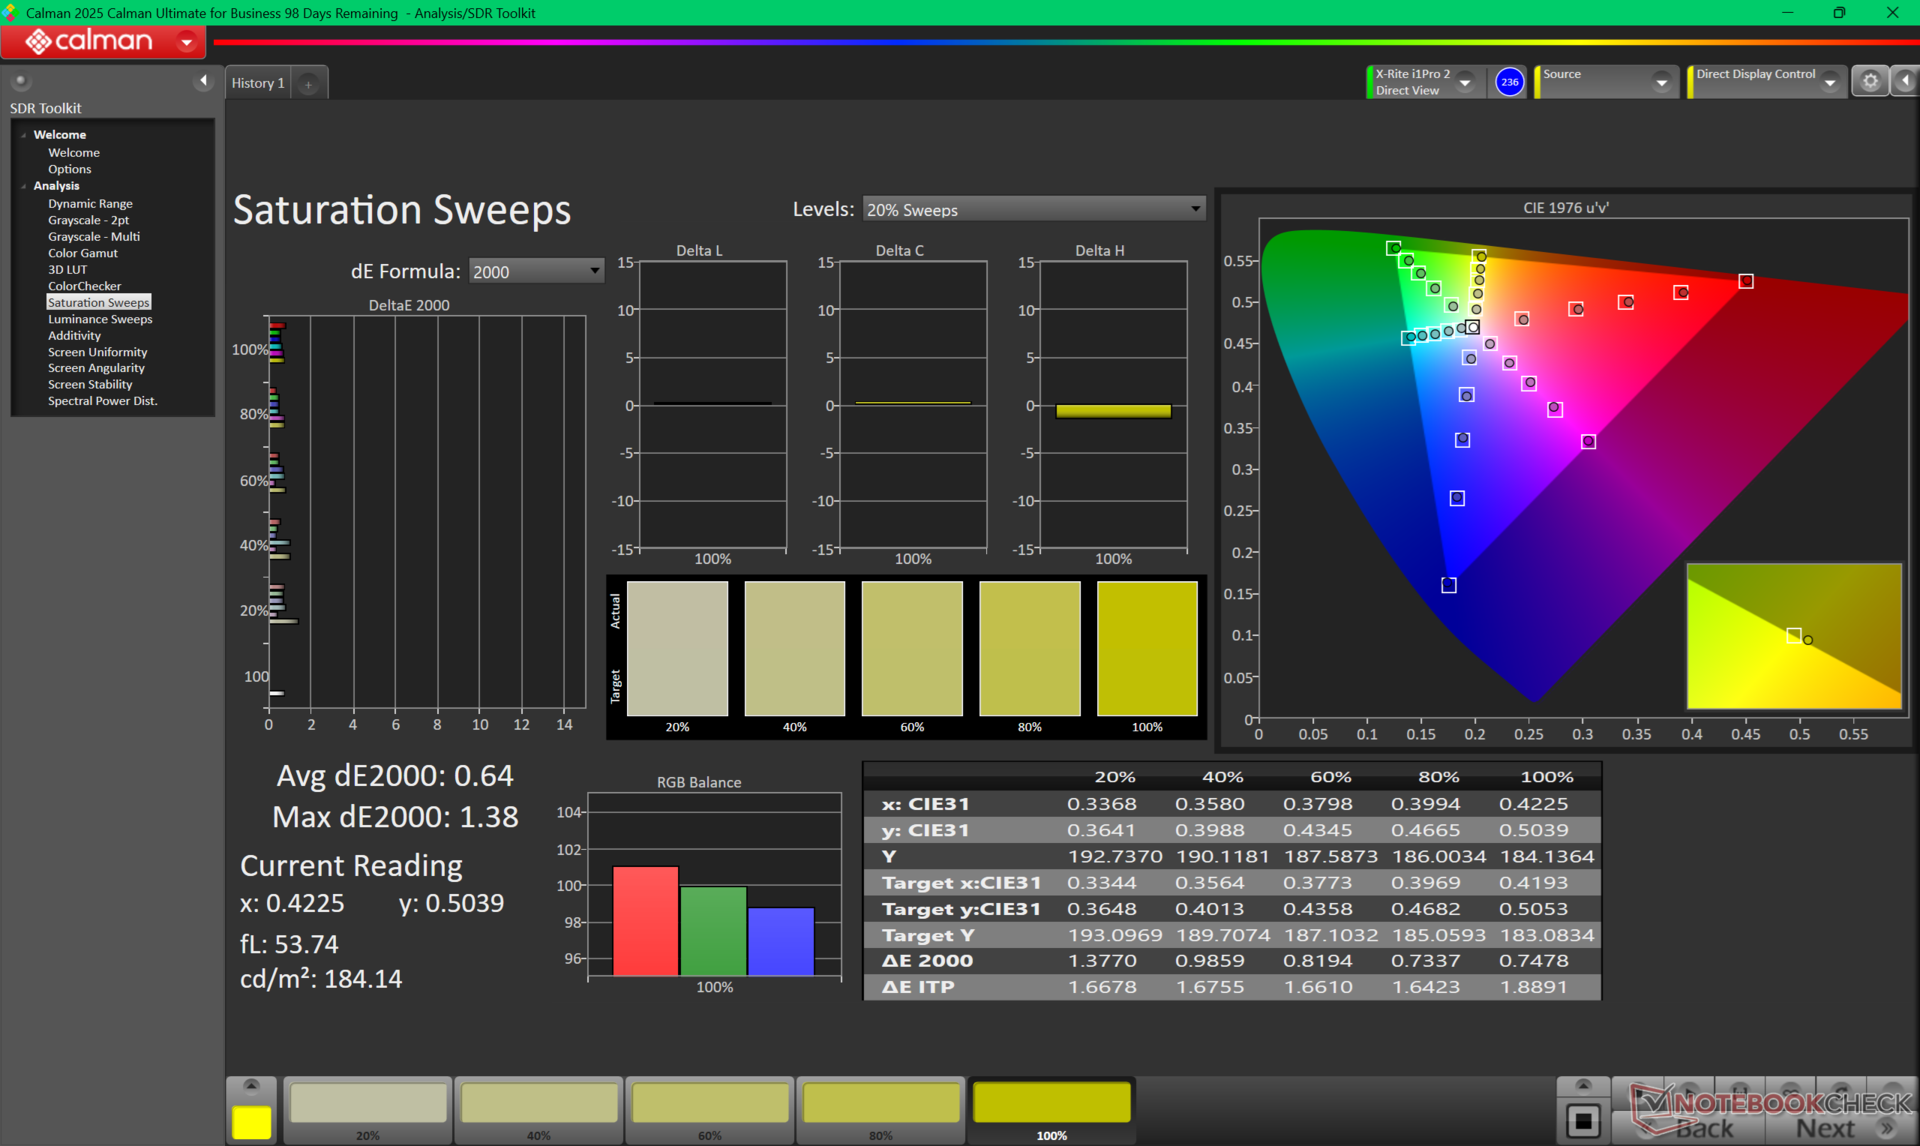
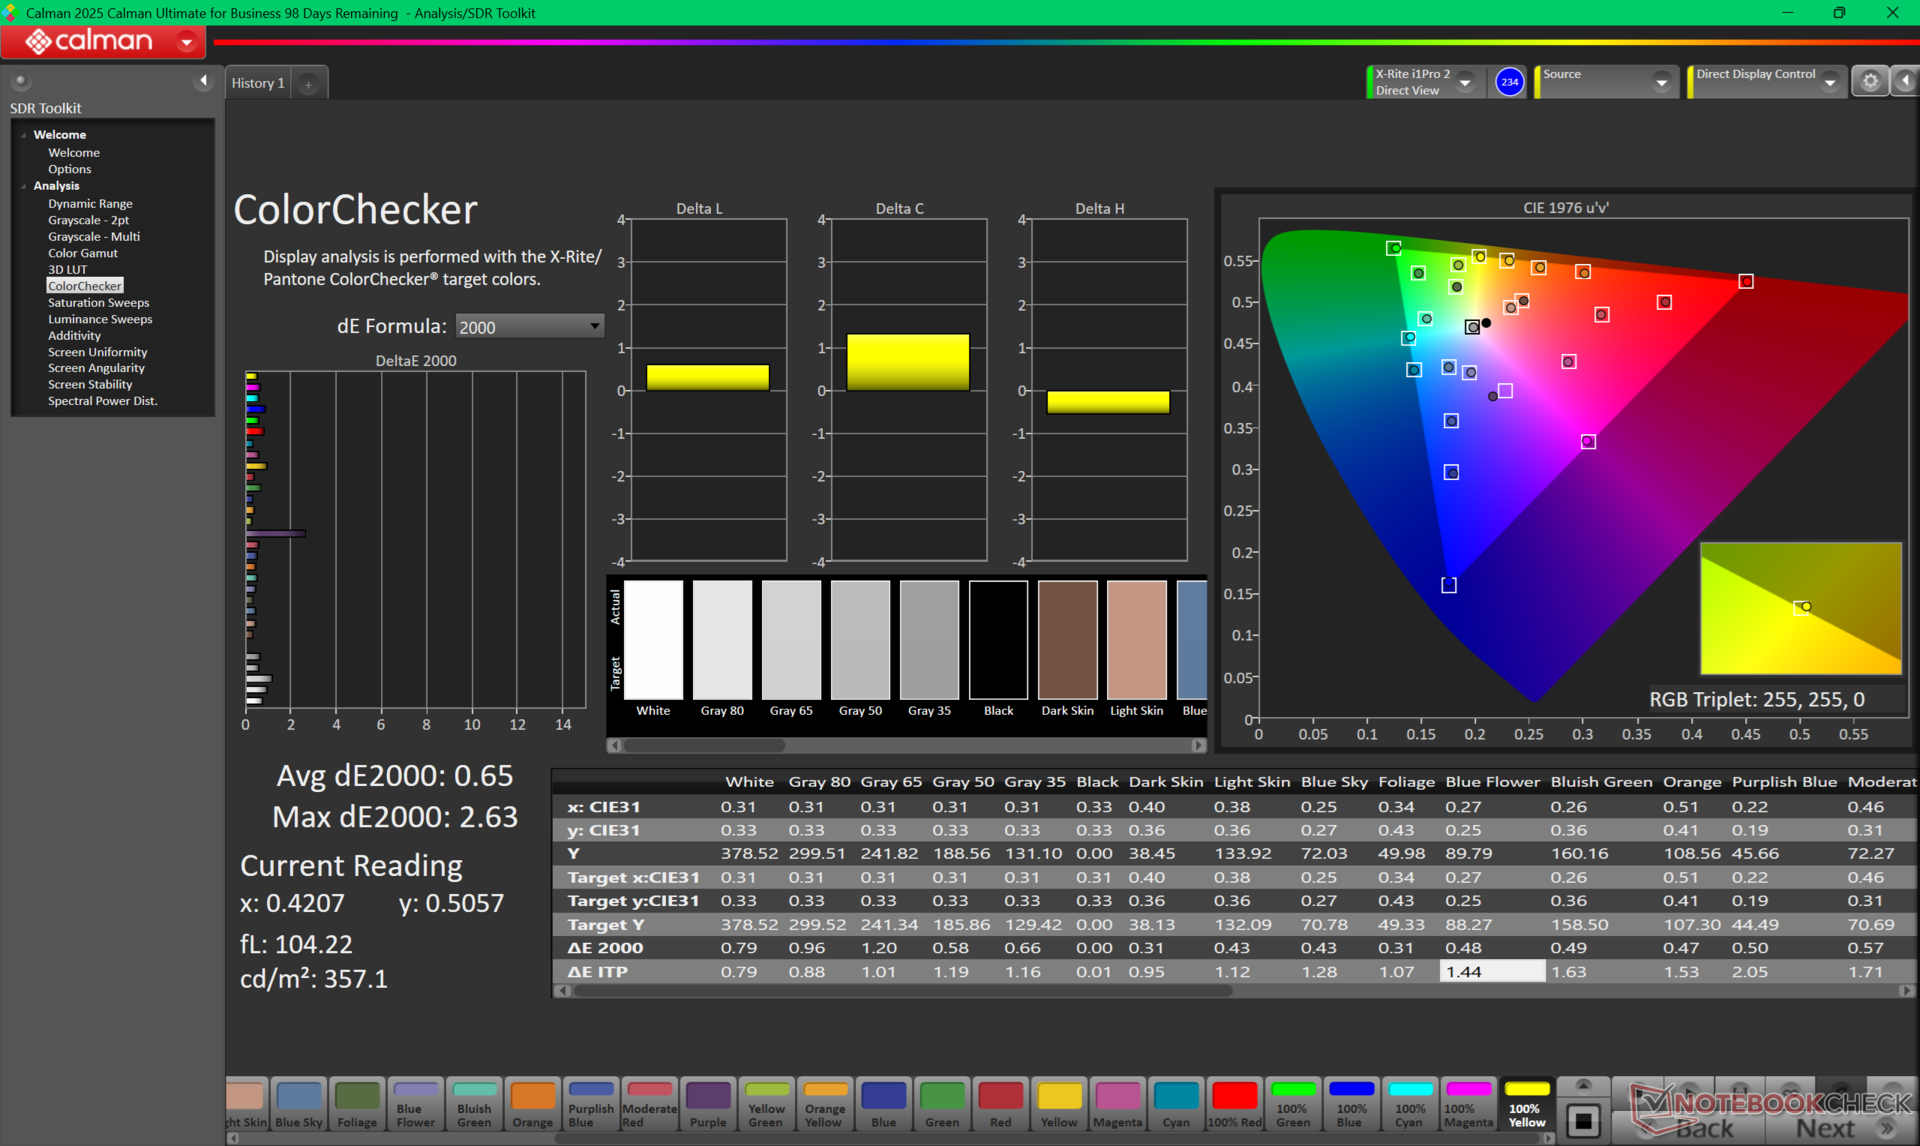
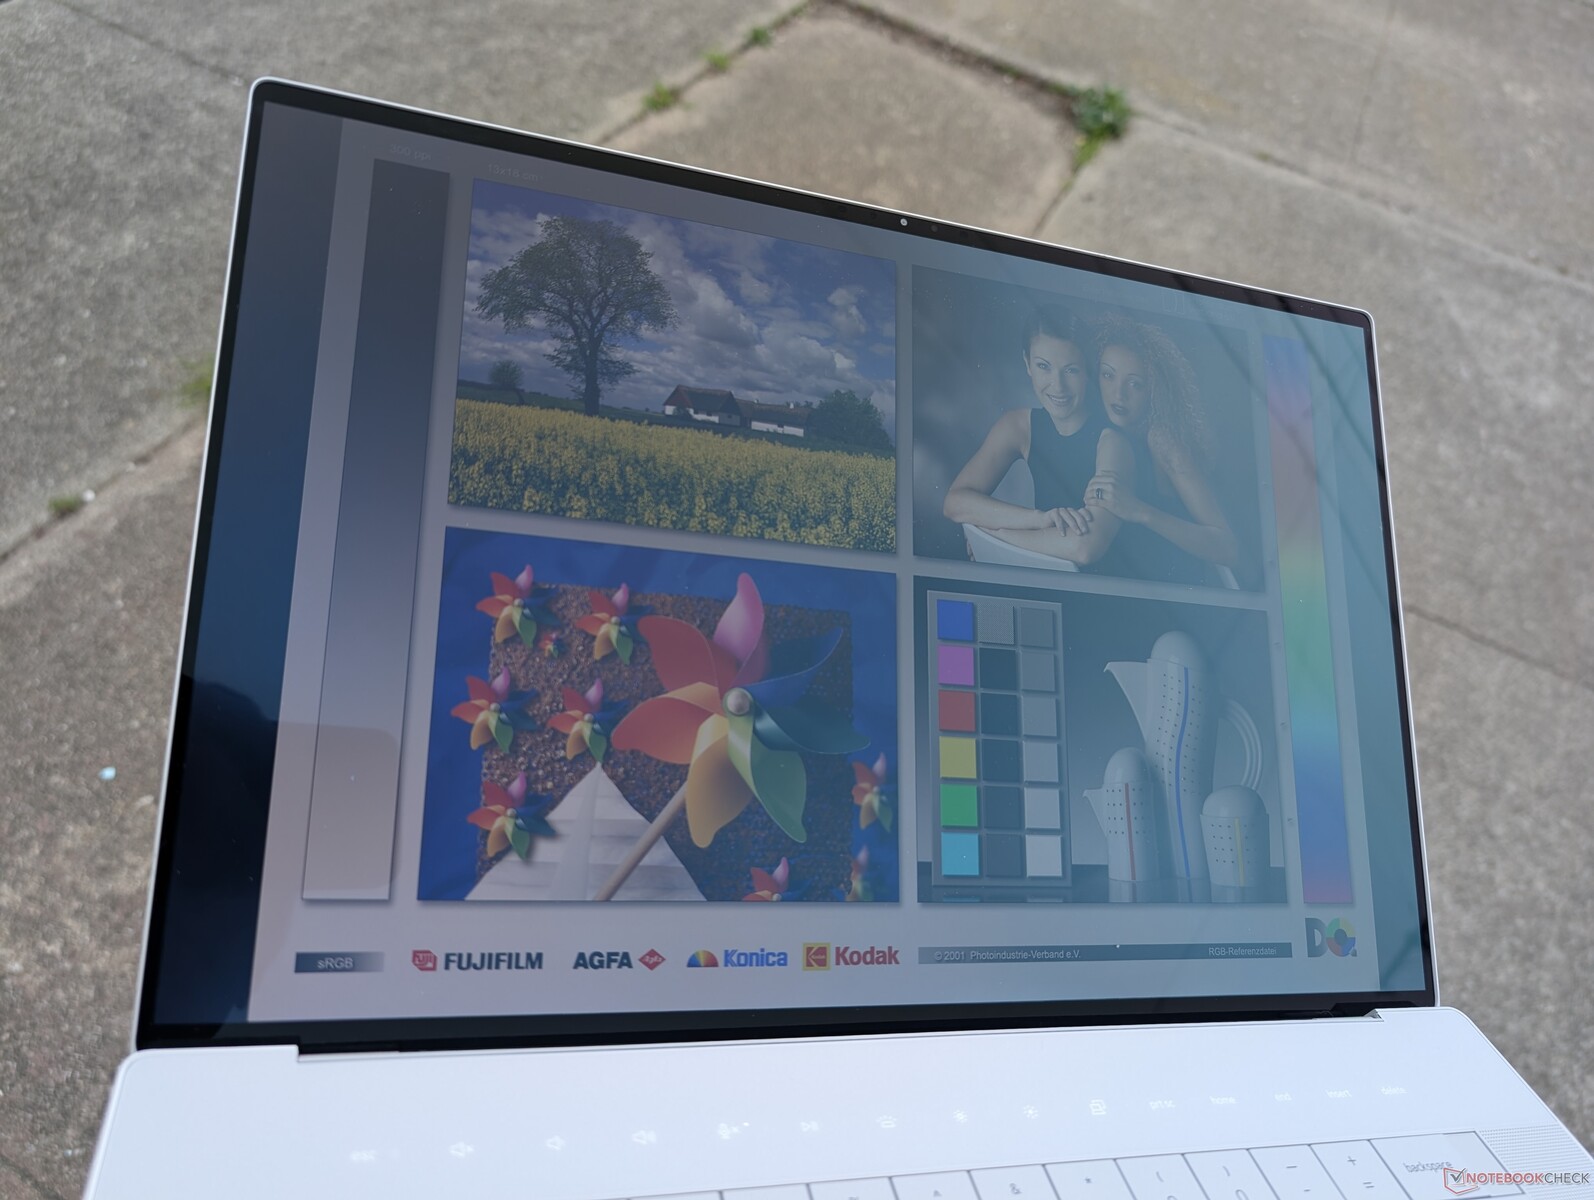
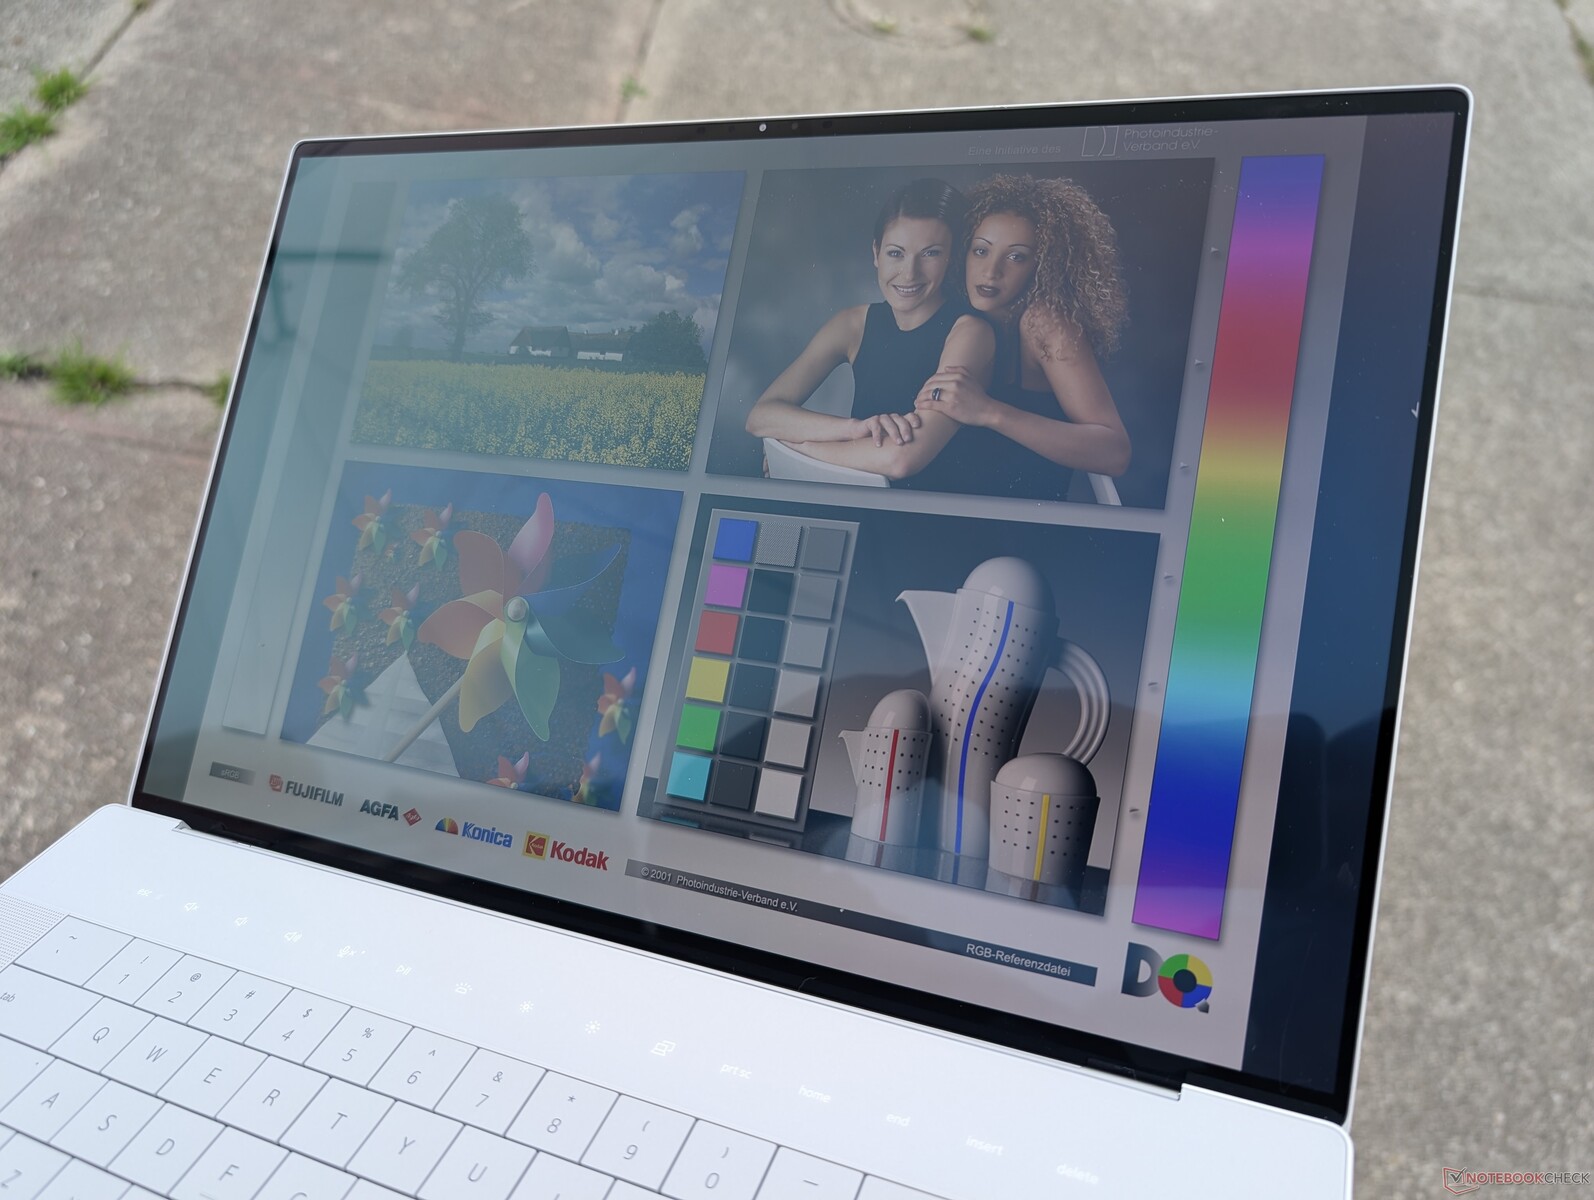
Display

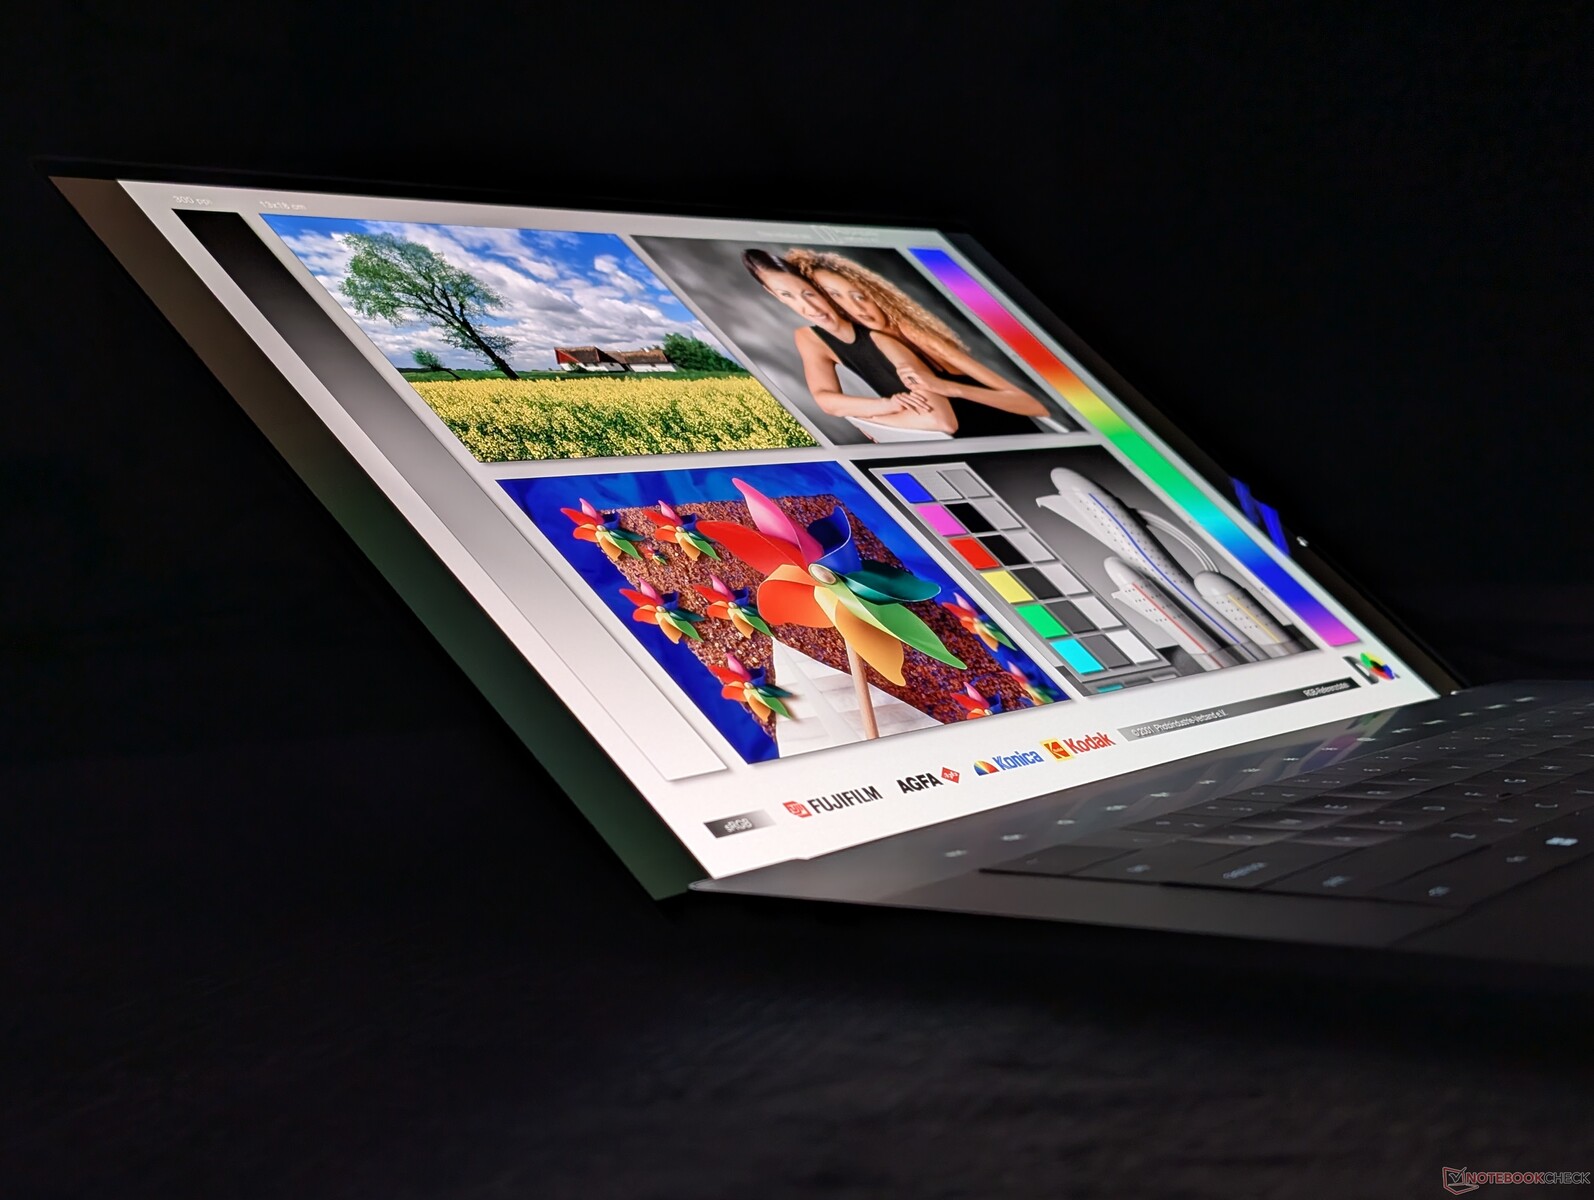
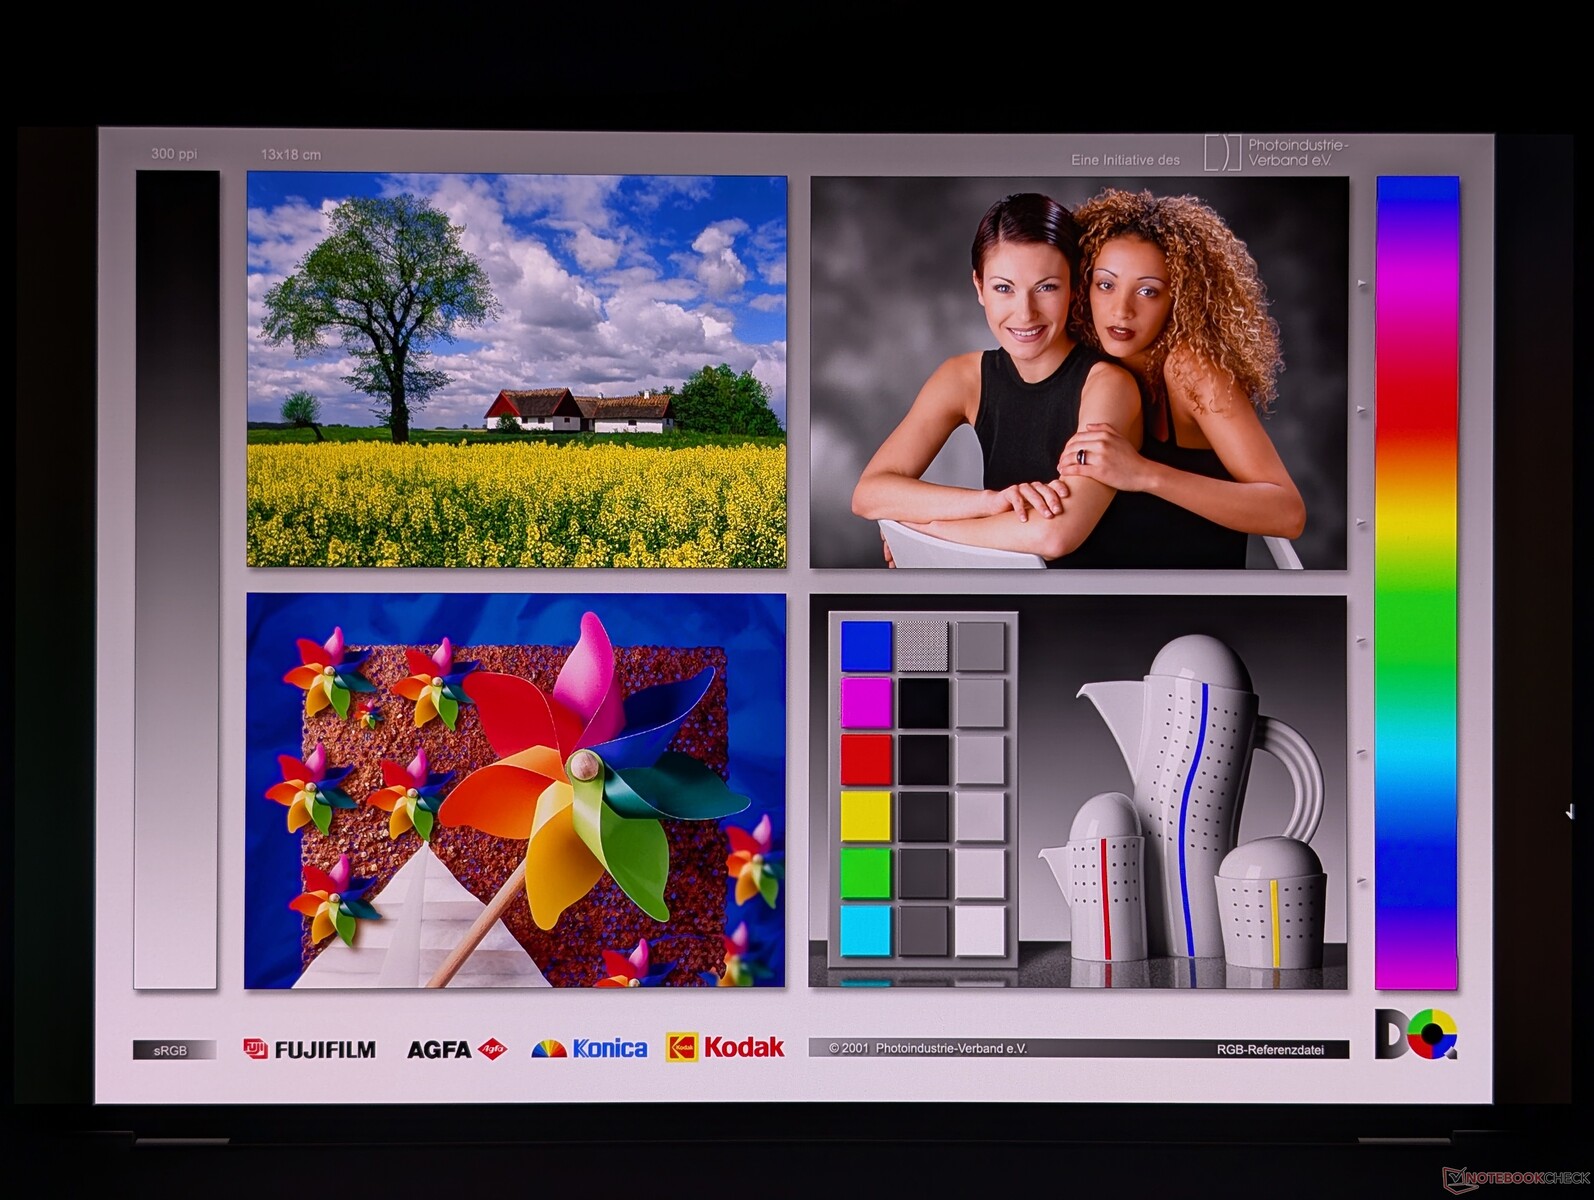
Dell ha aggiornato il pannello OLED dell'XPS 16 9640 dello scorso anno da 90 Hz a 120 Hz, mentre la luminosità massima rimane invariata a ~400 nits. Windows VRR è supportato fino a 48 Hz per risparmiare la batteria. Le modifiche sono relativamente minori, ma comunque degne di nota, in quanto i display 4K 2400p 120 Hz sono relativamente rari nei computer portatili da 16 pollici.
| |||||||||||||||||||||||||
Distribuzione della luminosità: 98 %
Al centro con la batteria: 385.7 cd/m²
Contrasto: ∞:1 (Nero: 0 cd/m²)
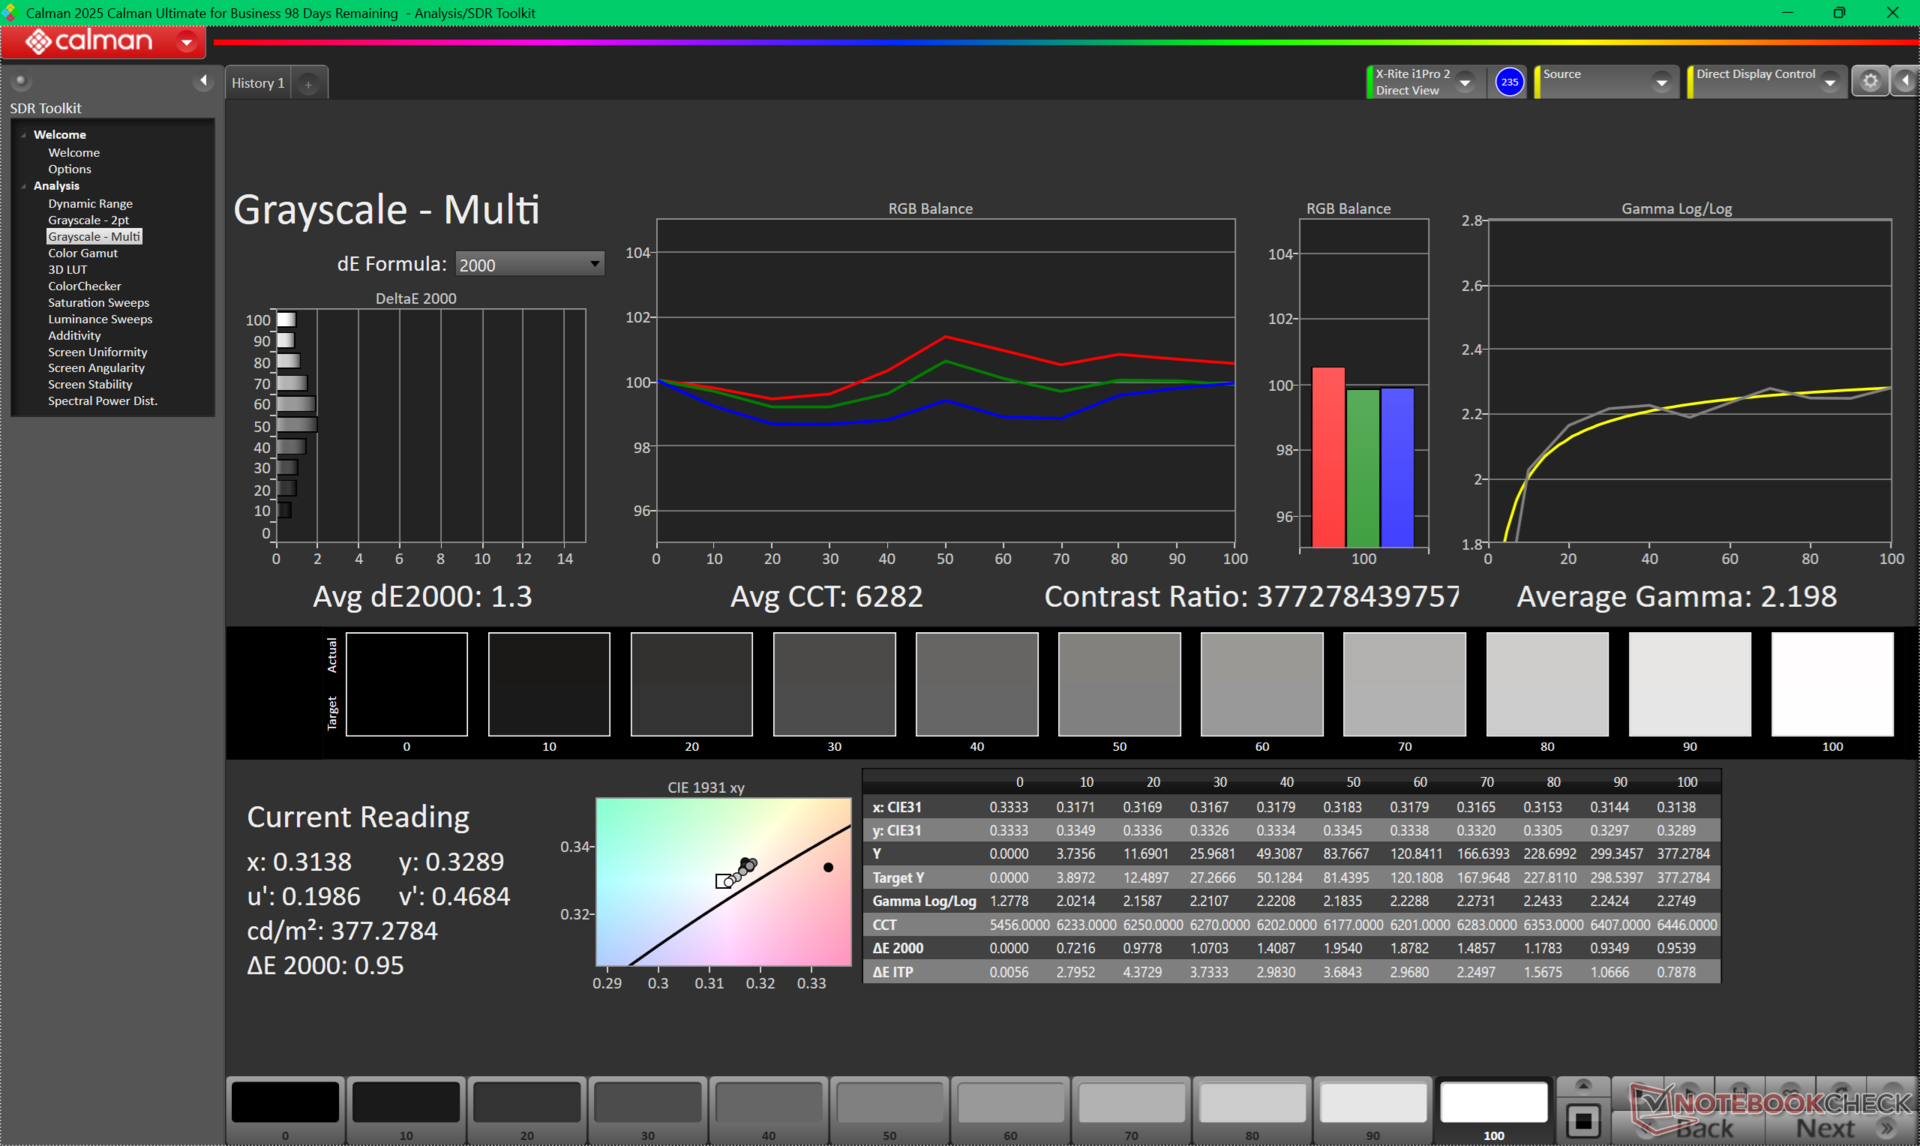
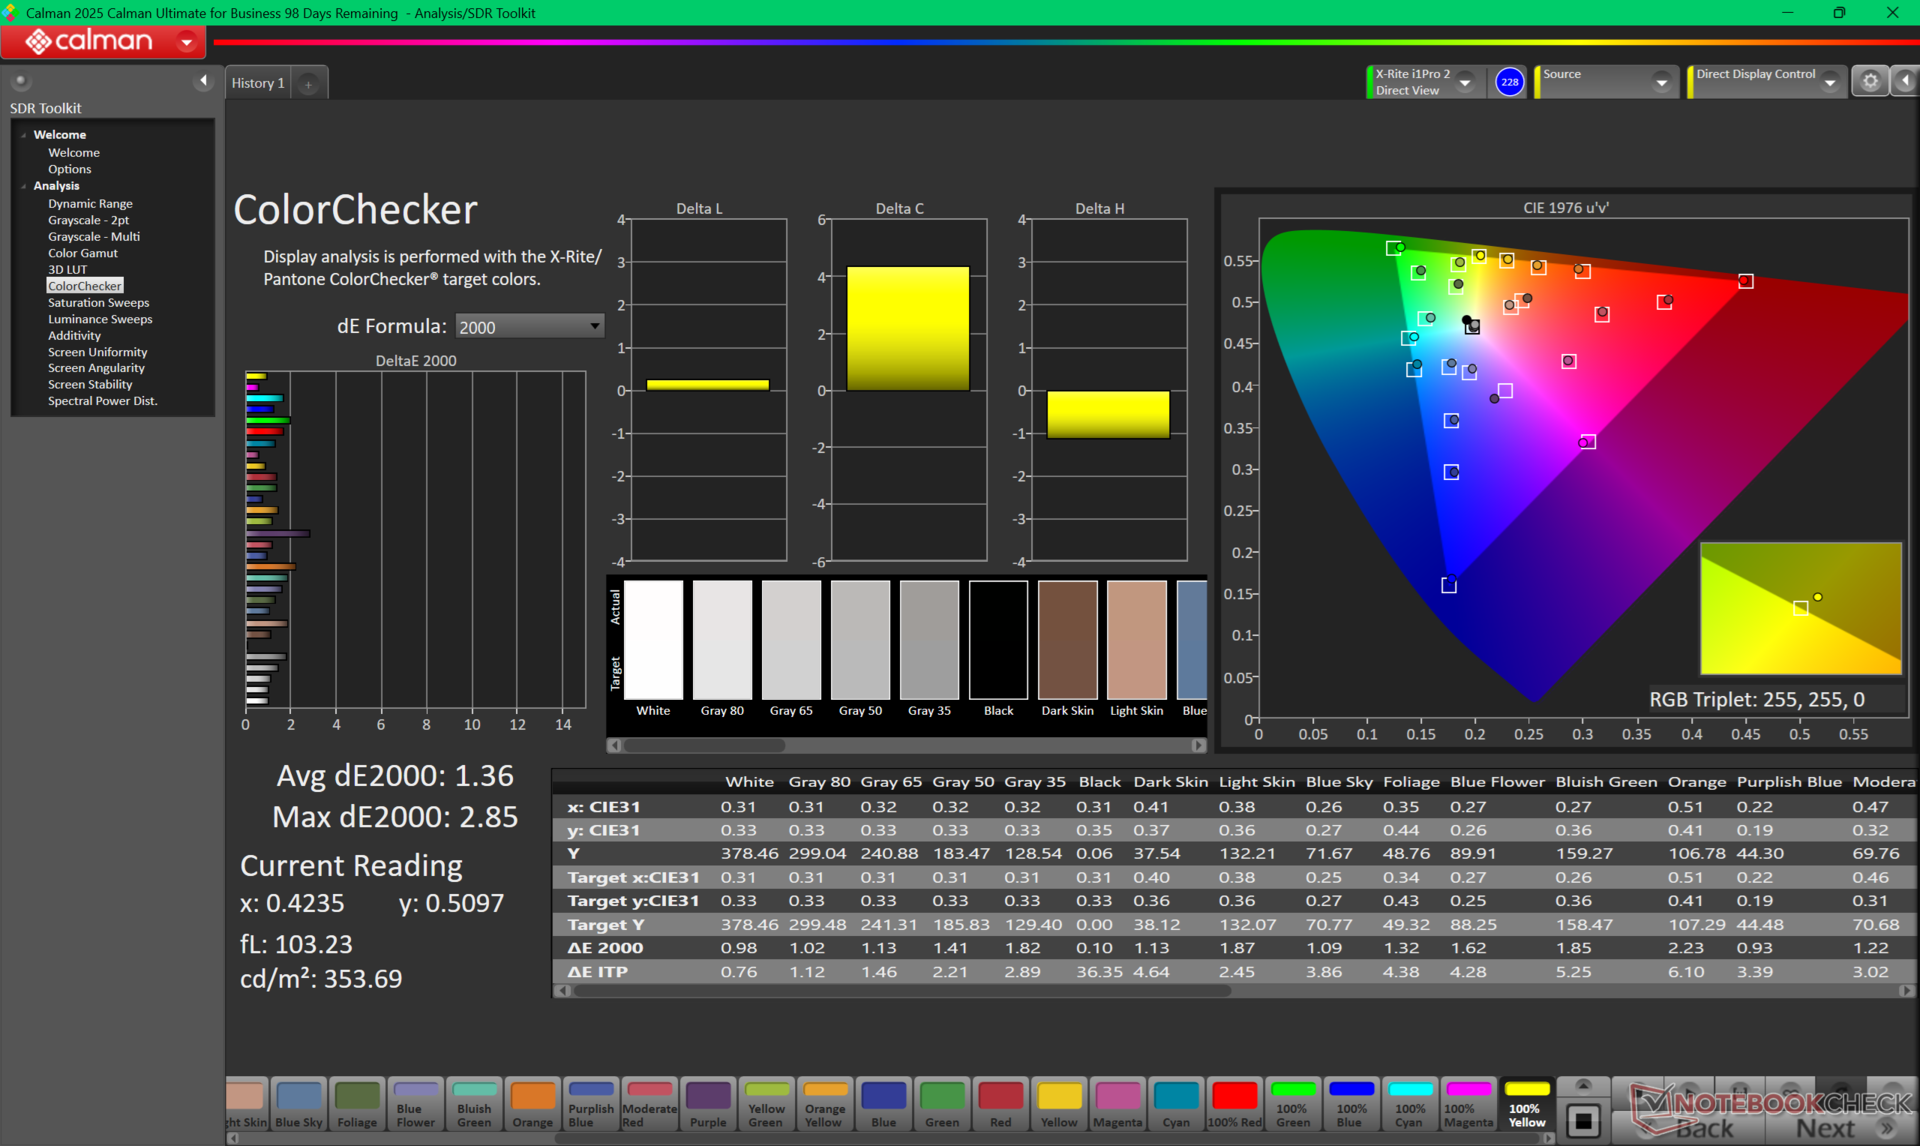
ΔE ColorChecker Calman: 1.36 | ∀{0.5-29.43 Ø4.71}
calibrated: 0.65
ΔE Greyscale Calman: 1.3 | ∀{0.09-98 Ø4.96}
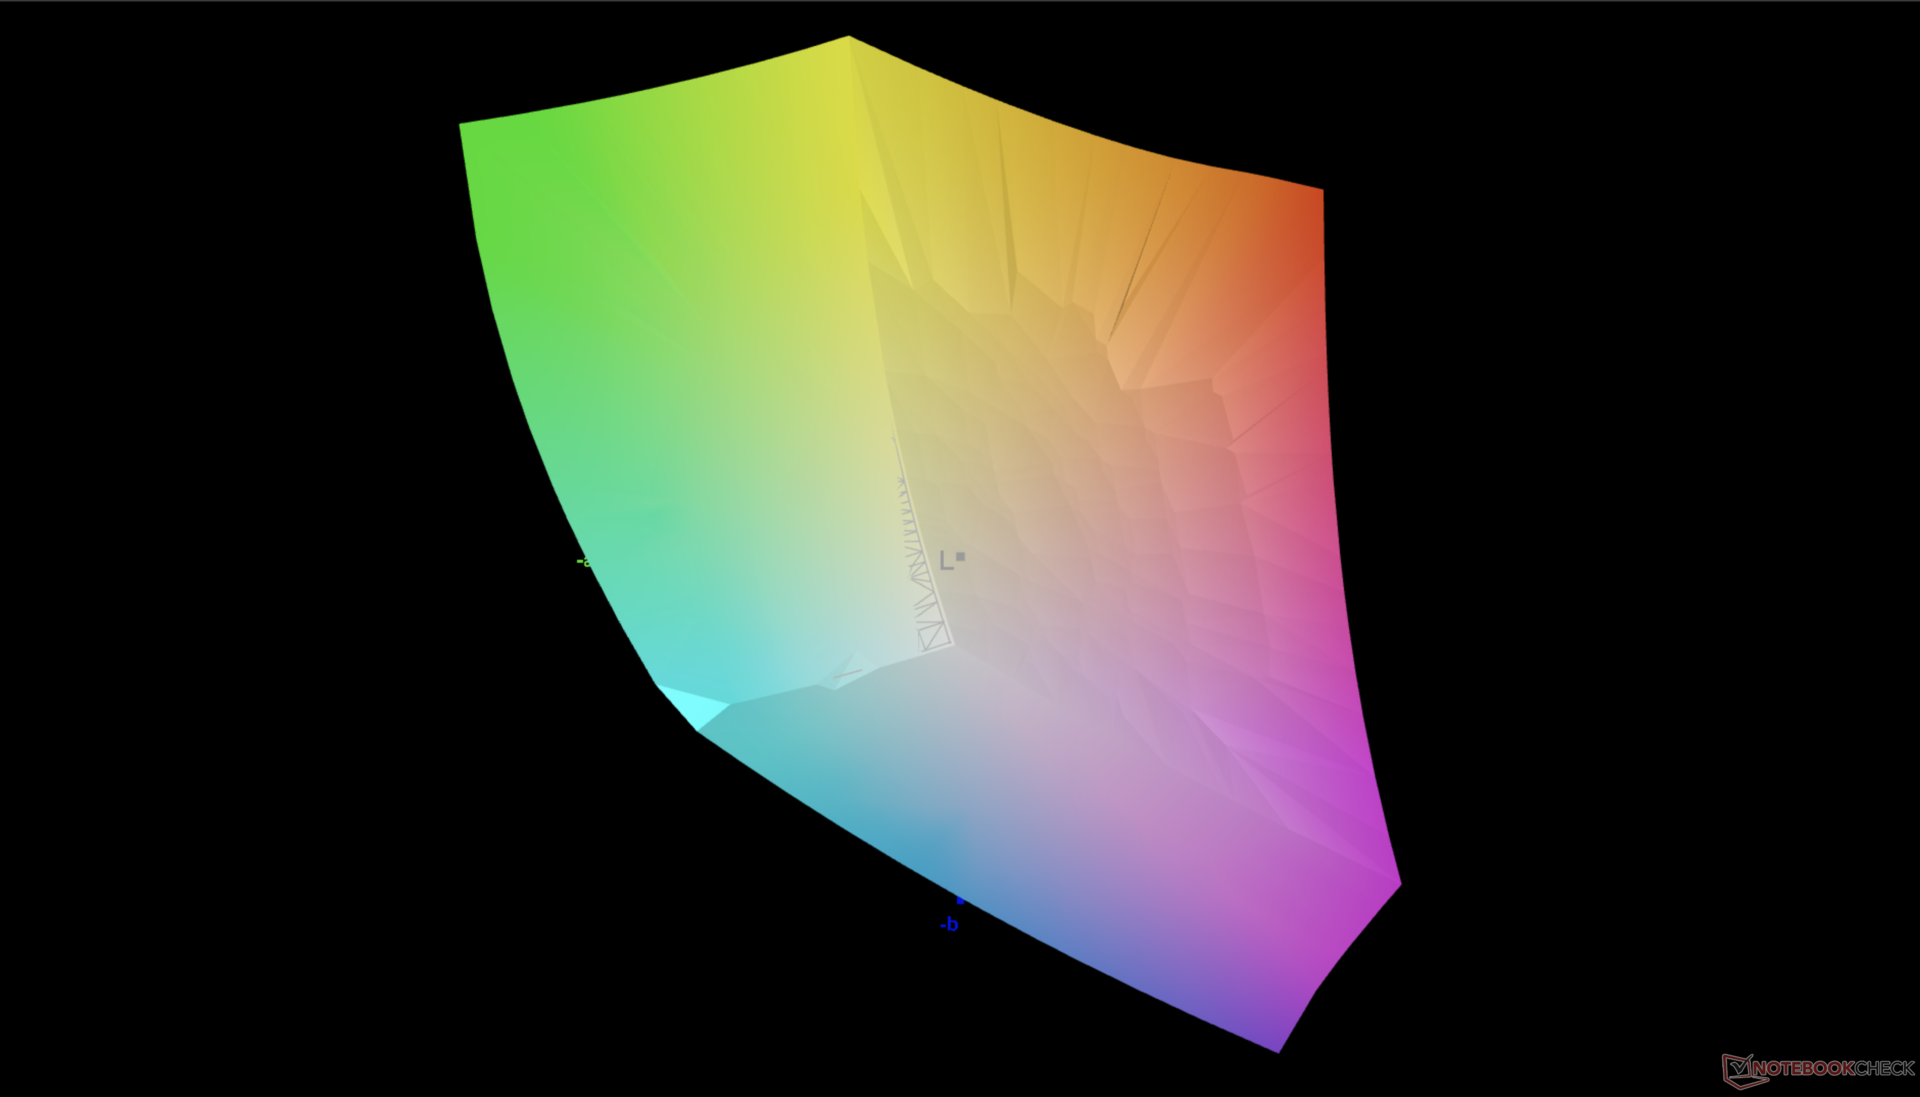
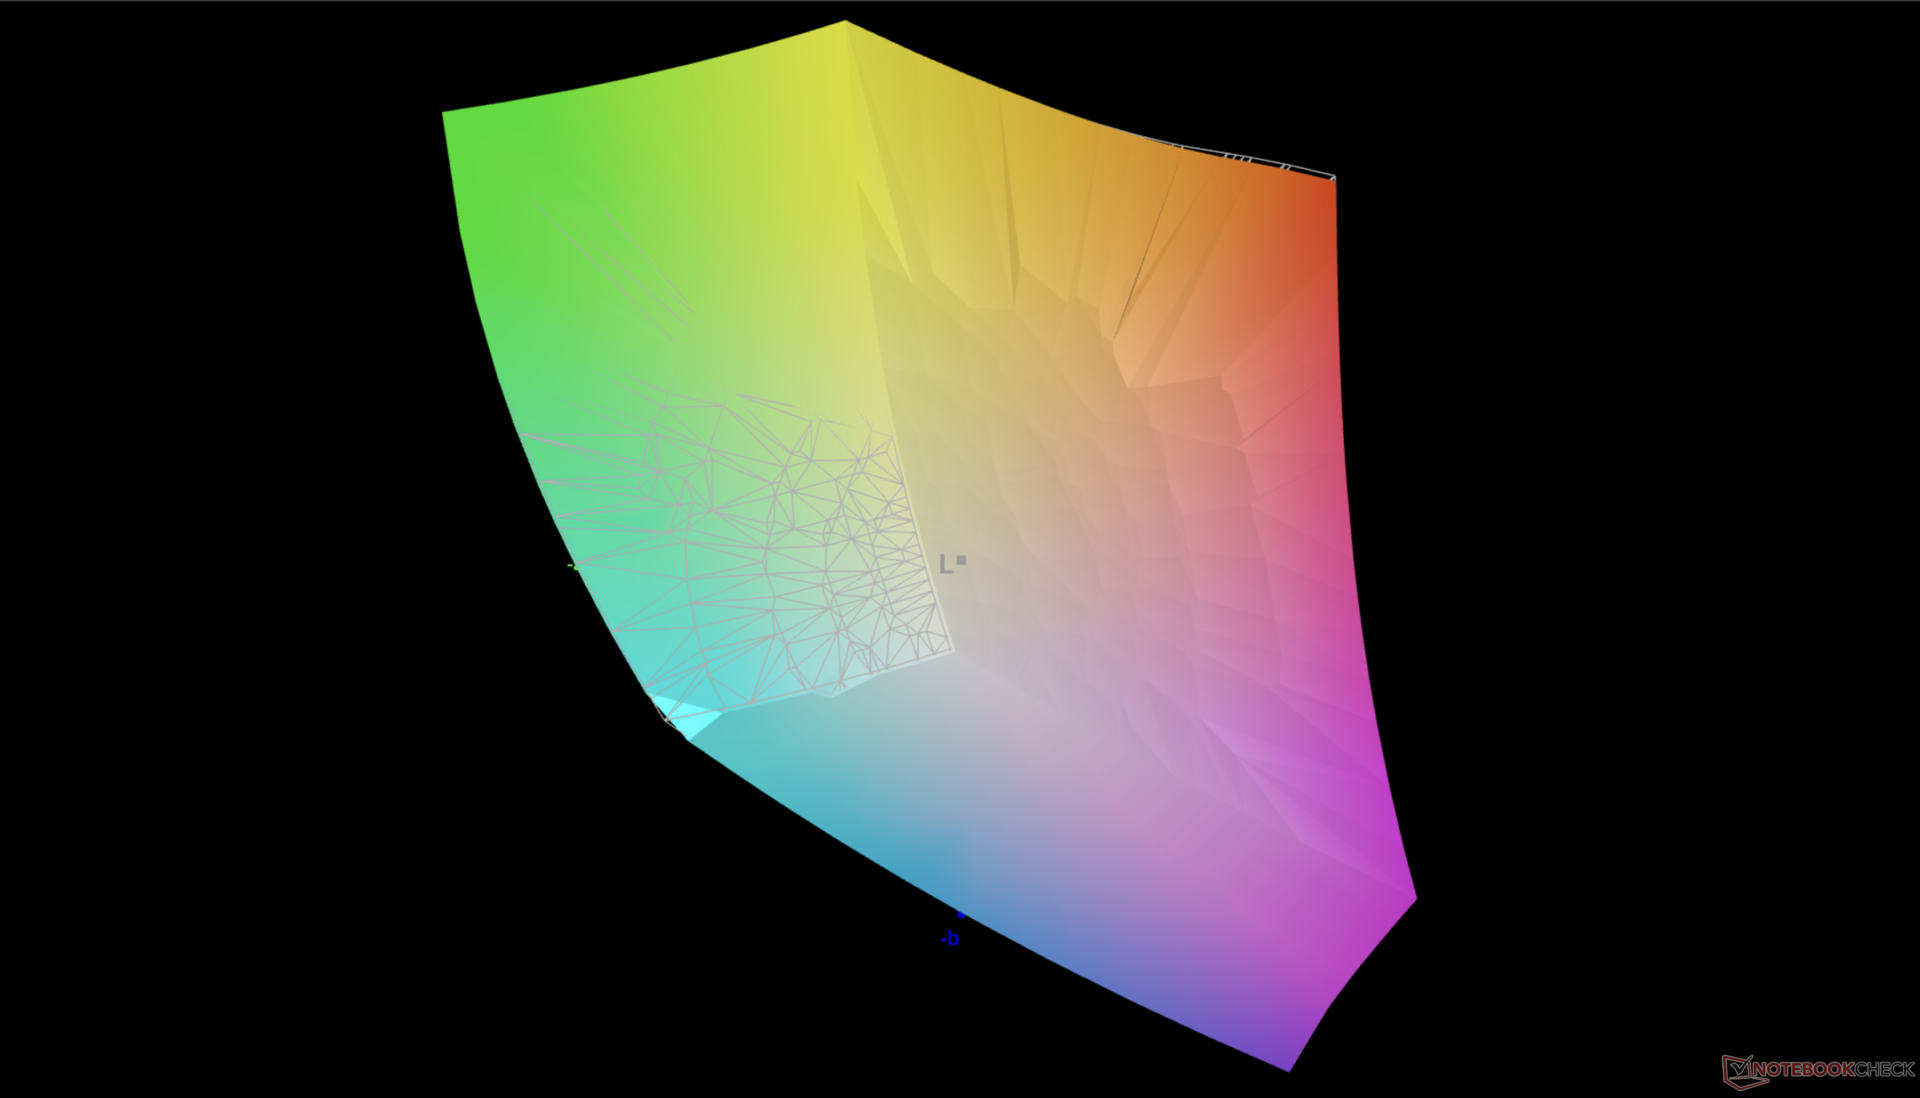
88.1% AdobeRGB 1998 (Argyll 3D)
100% sRGB (Argyll 3D)
99.7% Display P3 (Argyll 3D)
Gamma: 2.2
CCT: 6282 K
| Dell 16 Premium DA16250 Samsung 163DU02, OLED, 3840x2400, 16.3", 120 Hz | Dell XPS 16 9640 SDC4196, OLED, 3840x2400, 16.3", 90 Hz | HP Spectre x360 16 RTX 4050 Samsung SDC41A6, OLED, 2880x1800, 16", 120 Hz | Lenovo Yoga Pro 9i 16 RTX 5070 ATNA60KA01-0, OLED, 3200x2000, 16", 120 Hz | Asus Zenbook S 16 UM5606-RK333W ATNA60CL10-0, OLED, 2880x1800, 16", 120 Hz | LG Gram Pro 16Z90TS-G.AU89G LG DISPLAY LP160WQ2-SPF1, IPS, 2560x1600, 16", 144 Hz | |
|---|---|---|---|---|---|---|
| Display | -0% | 3% | 3% | 3% | -1% | |
| Display P3 Coverage (%) | 99.7 | 98.3 -1% | 99.6 0% | 97.4 -2% | 99.9 0% | 97.96 -2% |
| sRGB Coverage (%) | 100 | 100 0% | 100 0% | 100 0% | 100 0% | 100 0% |
| AdobeRGB 1998 Coverage (%) | 88.1 | 87.8 0% | 96.7 10% | 96.8 10% | 95.6 9% | 86.65 -2% |
| Response Times | -16% | -13% | 50% | 16% | -5457% | |
| Response Time Grey 50% / Grey 80% * (ms) | 0.61 ? | 0.82 ? -34% | 0.78 ? -28% | 0.27 ? 56% | 0.56 ? 8% | 47 ? -7605% |
| Response Time Black / White * (ms) | 0.88 ? | 0.85 ? 3% | 0.86 ? 2% | 0.37 ? 58% | 0.65 ? 26% | 30 ? -3309% |
| PWM Frequency (Hz) | 490.8 ? | 360 ? | 480 ? | 1200 | 480 | |
| PWM Amplitude * (%) | 35 | 22 37% | 30 14% | |||
| Screen | -22% | -28% | 63% | 31% | 5% | |
| Brightness middle (cd/m²) | 385.7 | 366 -5% | 385.2 0% | 974 153% | 407 6% | 442 15% |
| Brightness (cd/m²) | 387 | 367 -5% | 387 0% | 979 153% | 405 5% | 406 5% |
| Brightness Distribution (%) | 98 | 96 -2% | 99 1% | 98 0% | 97 -1% | 86 -12% |
| Black Level * (cd/m²) | 0.02 | 0.17 | ||||
| Colorchecker dE 2000 * | 1.36 | 1.3 4% | 1.73 -27% | 0.9 34% | 0.6 56% | 0.84 38% |
| Colorchecker dE 2000 max. * | 2.85 | 3.6 -26% | 3.95 -39% | 1.7 40% | 1.2 58% | 1.62 43% |
| Colorchecker dE 2000 calibrated * | 0.65 | 1 -54% | 0.88 -35% | |||
| Greyscale dE 2000 * | 1.3 | 2.2 -69% | 2.6 -100% | 1.3 -0% | 0.5 62% | 1.53 -18% |
| Gamma | 2.2 100% | 2.14 103% | 2.17 101% | 2.21 100% | 2.2 100% | 2.173 101% |
| CCT | 6282 103% | 6680 97% | 6133 106% | 6751 96% | 6453 101% | 6496 100% |
| Contrast (:1) | 20350 | 2600 | ||||
| Media totale (Programma / Settaggio) | -13% /
-16% | -13% /
-16% | 39% /
45% | 17% /
20% | -1818% /
-907% |
* ... Meglio usare valori piccoli
Tempi di risposta del Display
| ↔ Tempi di risposta dal Nero al Bianco | ||
|---|---|---|
| 0.88 ms ... aumenta ↗ e diminuisce ↘ combinato | ↗ 0.41 ms Incremento | 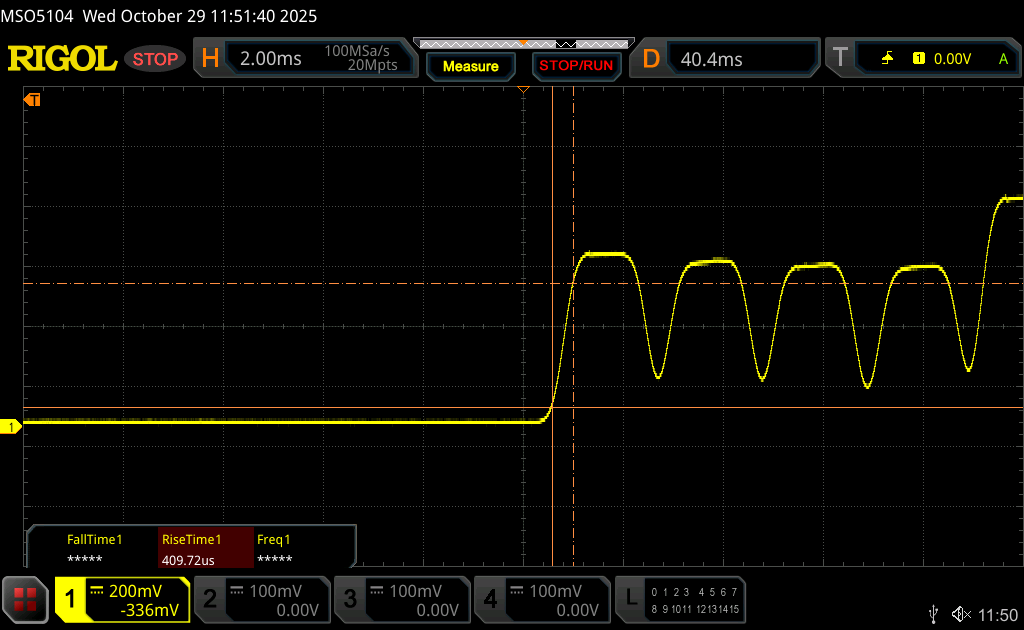 |
| ↘ 0.47 ms Calo | ||
| Lo schermo ha mostrato valori di risposta molto veloci nei nostri tests ed è molto adatto per i gaming veloce. In confronto, tutti i dispositivi di test variano da 0.1 (minimo) a 240 (massimo) ms. » 3 % di tutti i dispositivi è migliore. Questo significa che i tempi di risposta rilevati sono migliori rispettto alla media di tutti i dispositivi testati (19.8 ms). | ||
| ↔ Tempo di risposta dal 50% Grigio all'80% Grigio | ||
| 0.61 ms ... aumenta ↗ e diminuisce ↘ combinato | ↗ 0.31 ms Incremento | 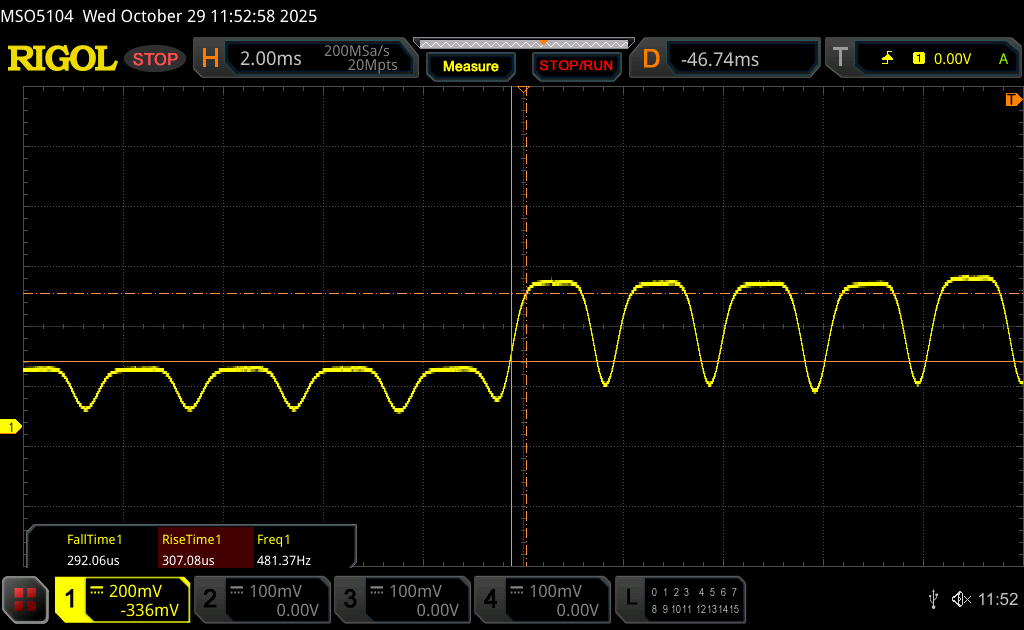 |
| ↘ 0.3 ms Calo | ||
| Lo schermo ha mostrato valori di risposta molto veloci nei nostri tests ed è molto adatto per i gaming veloce. In confronto, tutti i dispositivi di test variano da 0.165 (minimo) a 636 (massimo) ms. » 2 % di tutti i dispositivi è migliore. Questo significa che i tempi di risposta rilevati sono migliori rispettto alla media di tutti i dispositivi testati (31 ms). | ||
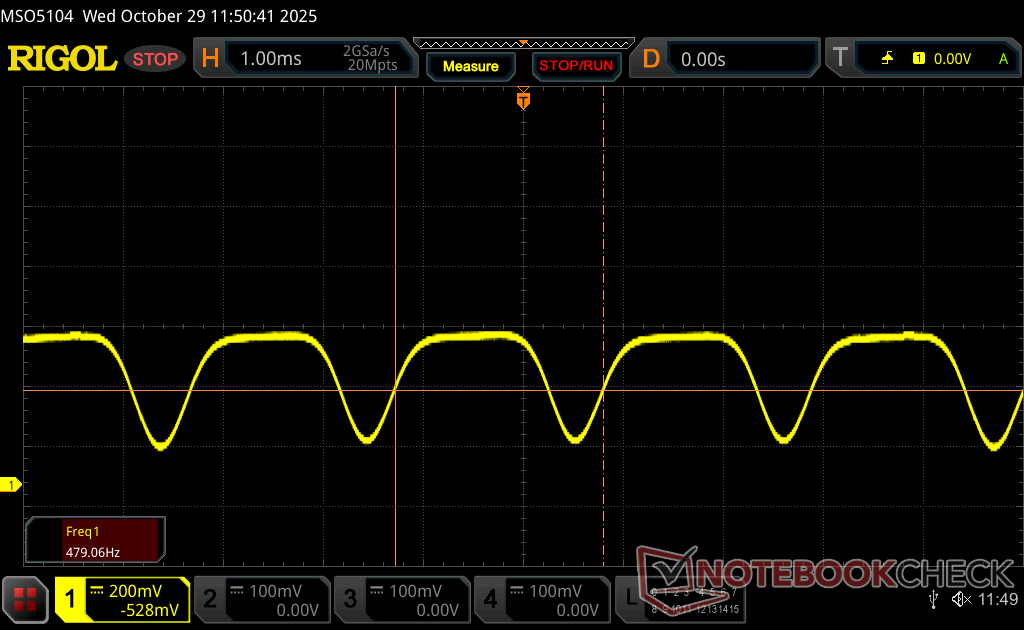
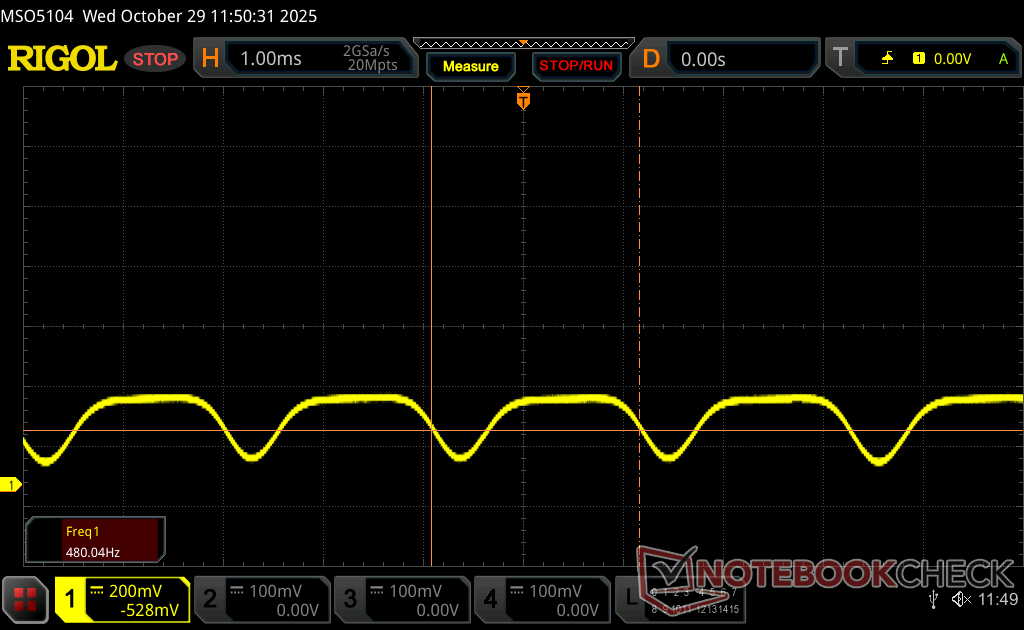
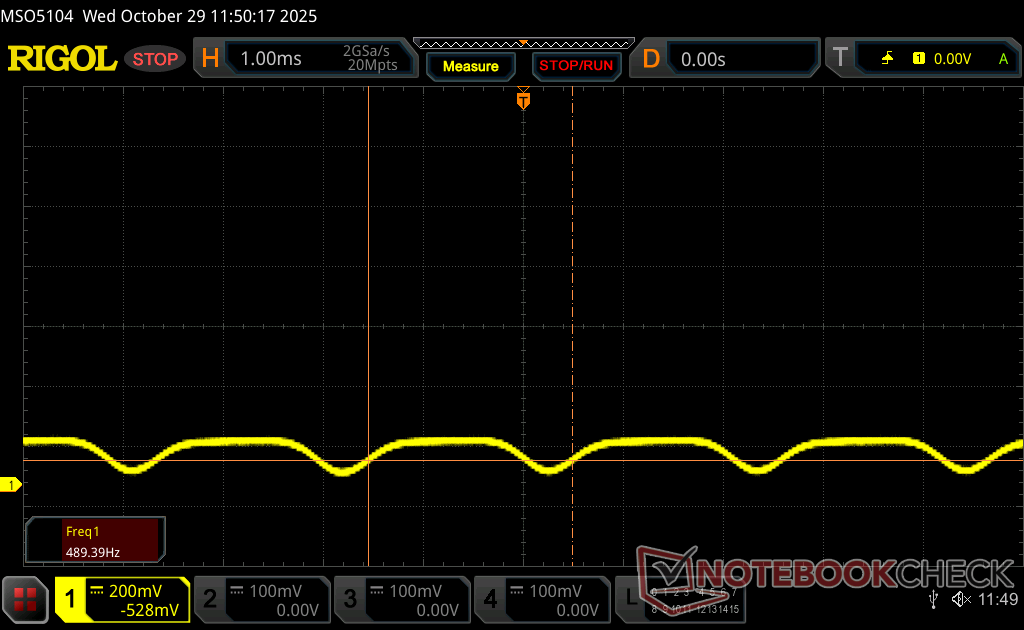
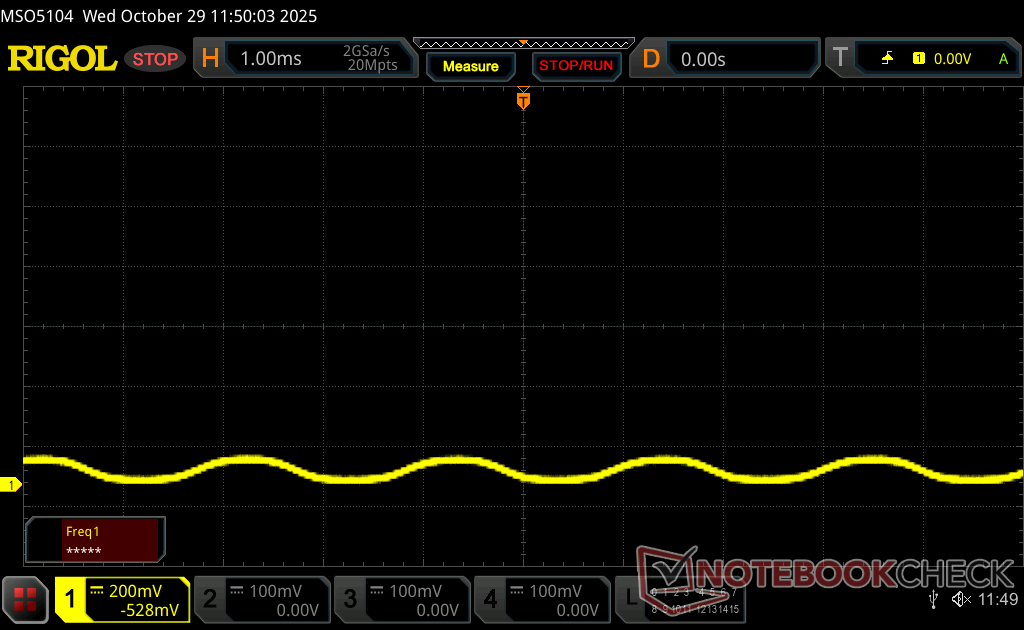
Sfarfallio dello schermo / PWM (Pulse-Width Modulation)
| flickering dello schermo / PWM rilevato | 490.8 Hz Amplitude: 35 % | ≤ 100 % settaggio luminosita' | 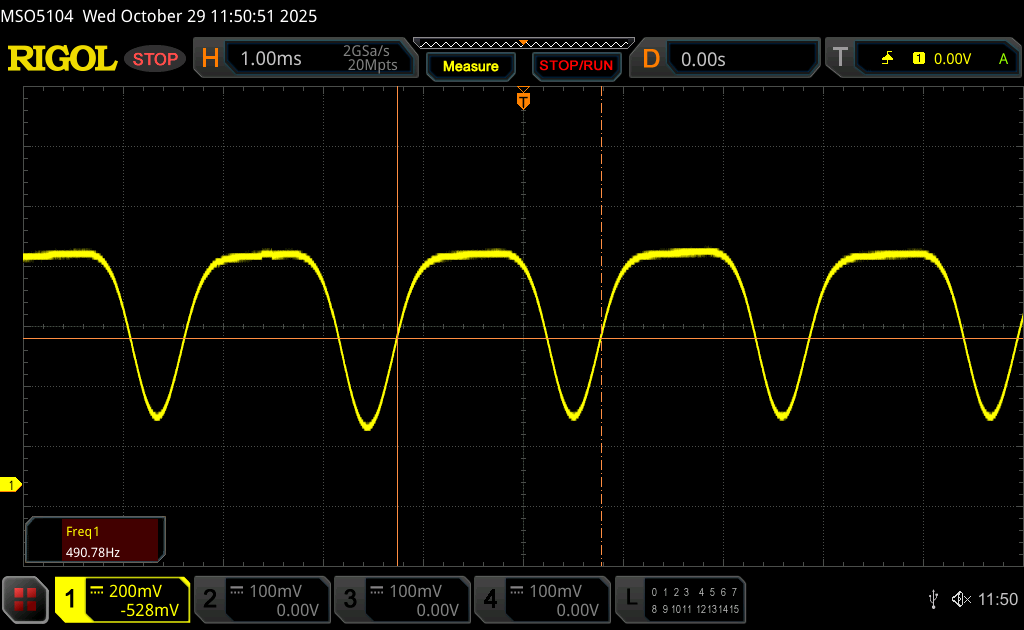 |
Il display sfarfalla a 490.8 Hz (Probabilmente a causa dell'uso di PWM) Flickering rilevato ad una luminosita' di 100 % o inferiore. Non dovrebbe verificarsi flickering o PWM sopra questo valore di luminosita'. La frequenza di 490.8 Hz è relativamente elevata, quindi la maggioranza degli utenti sensibili al PWM non dovrebbe notare alcun flickering. Tuttavia, è stato segnalato che alcuni utenti sono sensibili al PWM a 500 Hz ed oltre, quindi prestate attenzione. In confronto: 52 % di tutti i dispositivi testati non utilizza PWM per ridurre la luminosita' del display. Se è rilevato PWM, una media di 7754 (minimo: 5 - massimo: 343500) Hz è stata rilevata. | |||


Prestazioni
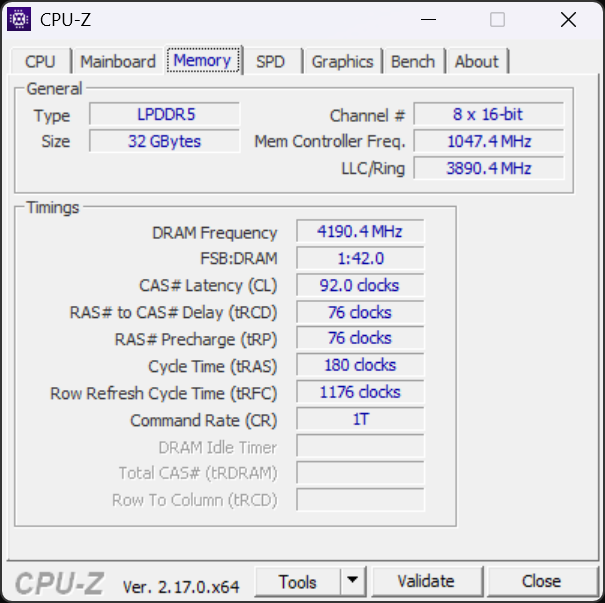
Condizioni del test
Abbiamo impostato Dell Optimizer sulla modalità Performance e Nvidia Control Panel sulla modalità grafica discreta prima di eseguire i benchmark qui sotto.
Processore
Il Core Ultra 7 255H funziona fino al 20 percento più velocemente del Core Ultra 7 155H dell'XPS 16 dello scorso anno. L'aggiornamento al più costoso Core Ultra 9 285H dovrebbe aumentare le prestazioni solo di qualche punto percentuale.
La sostenibilità del Turbo Boost potrebbe essere migliore. Quando si esegue CineBench R15 xT in loop, i punteggi si riducono di quasi il 15% nel tempo, come mostra il grafico sottostante. Il divario di prestazioni tra il Core Ultra 7 255H e il Core Ultra 7 155H del modello dello scorso anno si riduce quando i sistemi vengono sottoposti a stress.
Cinebench R15 Multi Loop
Cinebench R23: Multi Core | Single Core
Cinebench R20: CPU (Multi Core) | CPU (Single Core)
Cinebench R15: CPU Multi 64Bit | CPU Single 64Bit
Blender: v2.79 BMW27 CPU
7-Zip 18.03: 7z b 4 | 7z b 4 -mmt1
Geekbench 6.7: Multi-Core | Single-Core
Geekbench 5.5: Multi-Core | Single-Core
HWBOT x265 Benchmark v2.2: 4k Preset
LibreOffice : 20 Documents To PDF
R Benchmark 2.5: Overall mean
* ... Meglio usare valori piccoli
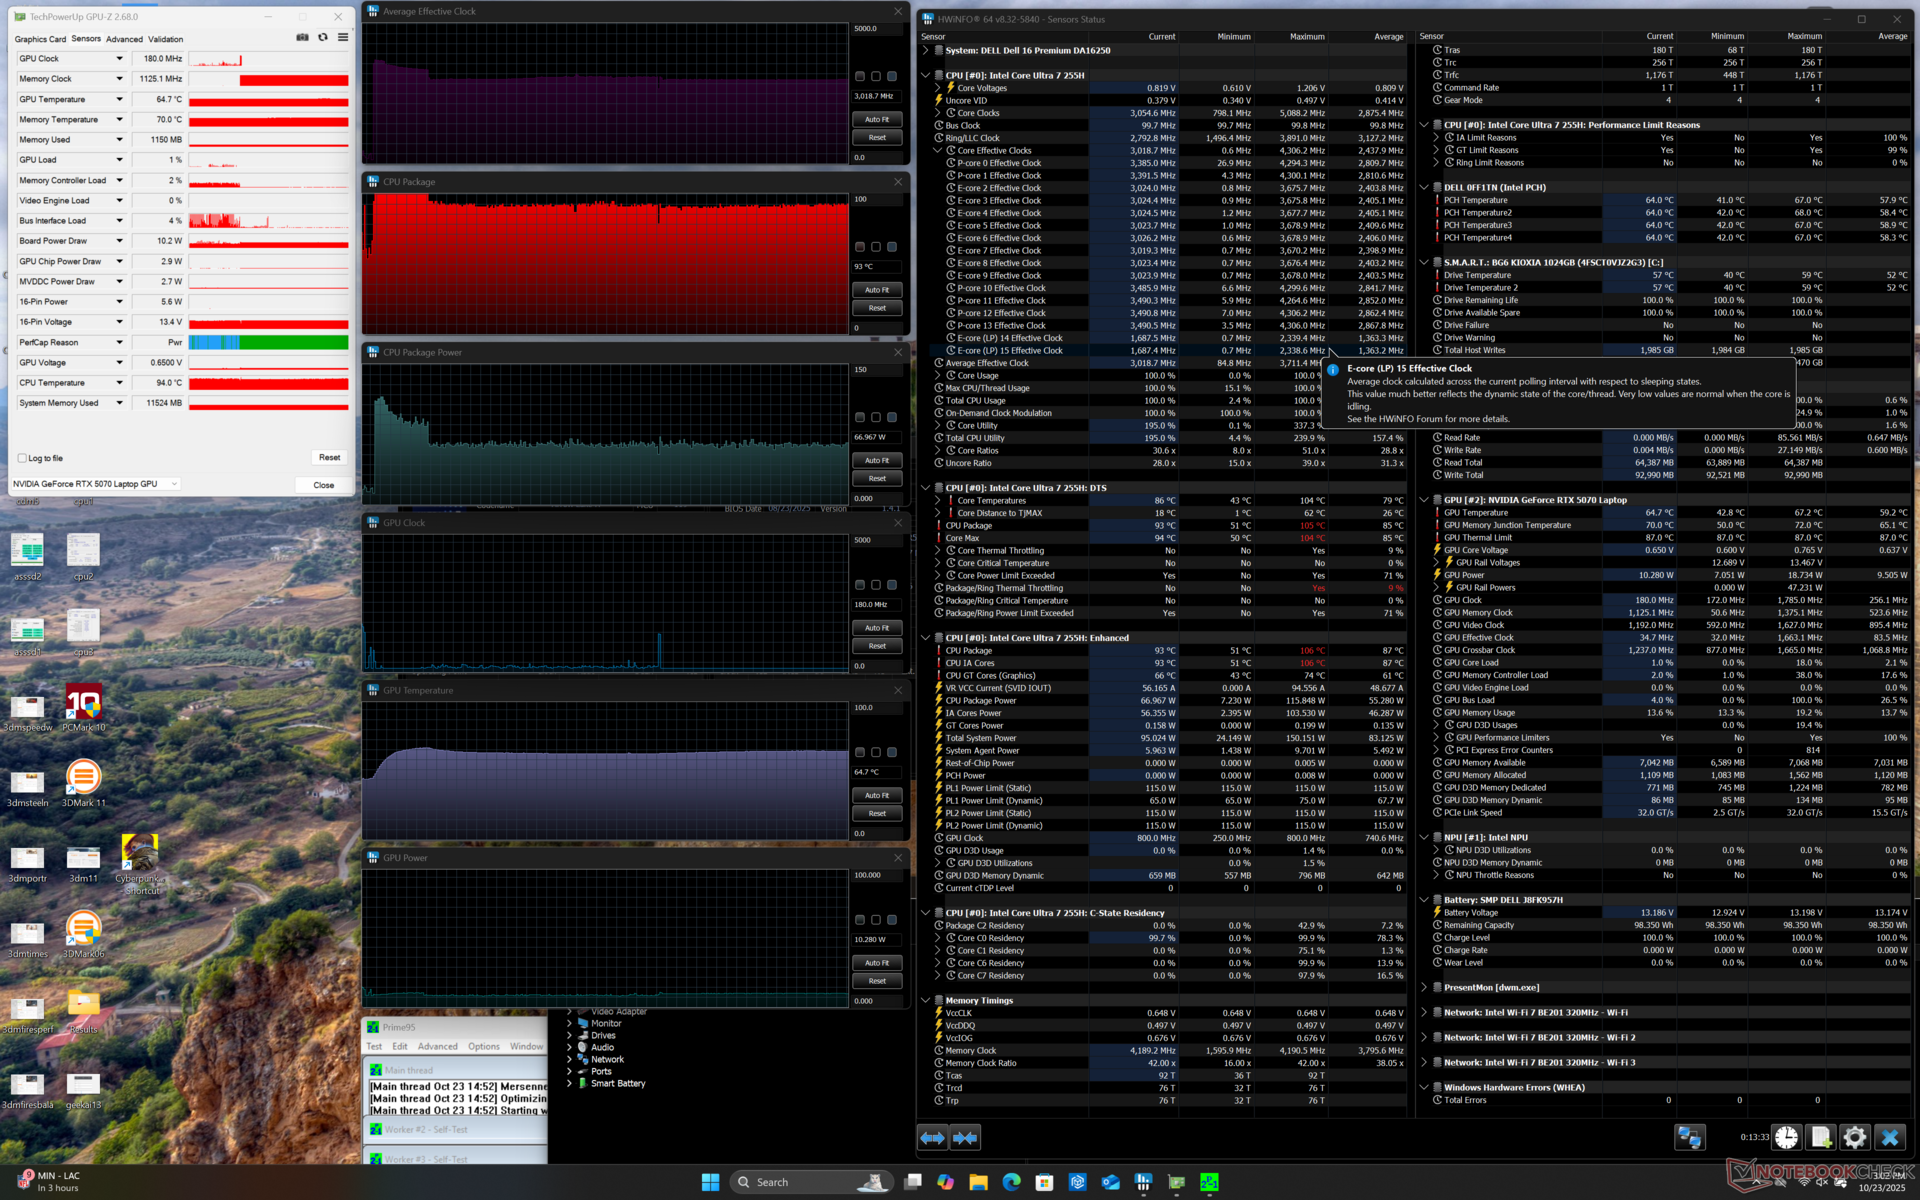
Test da sforzo
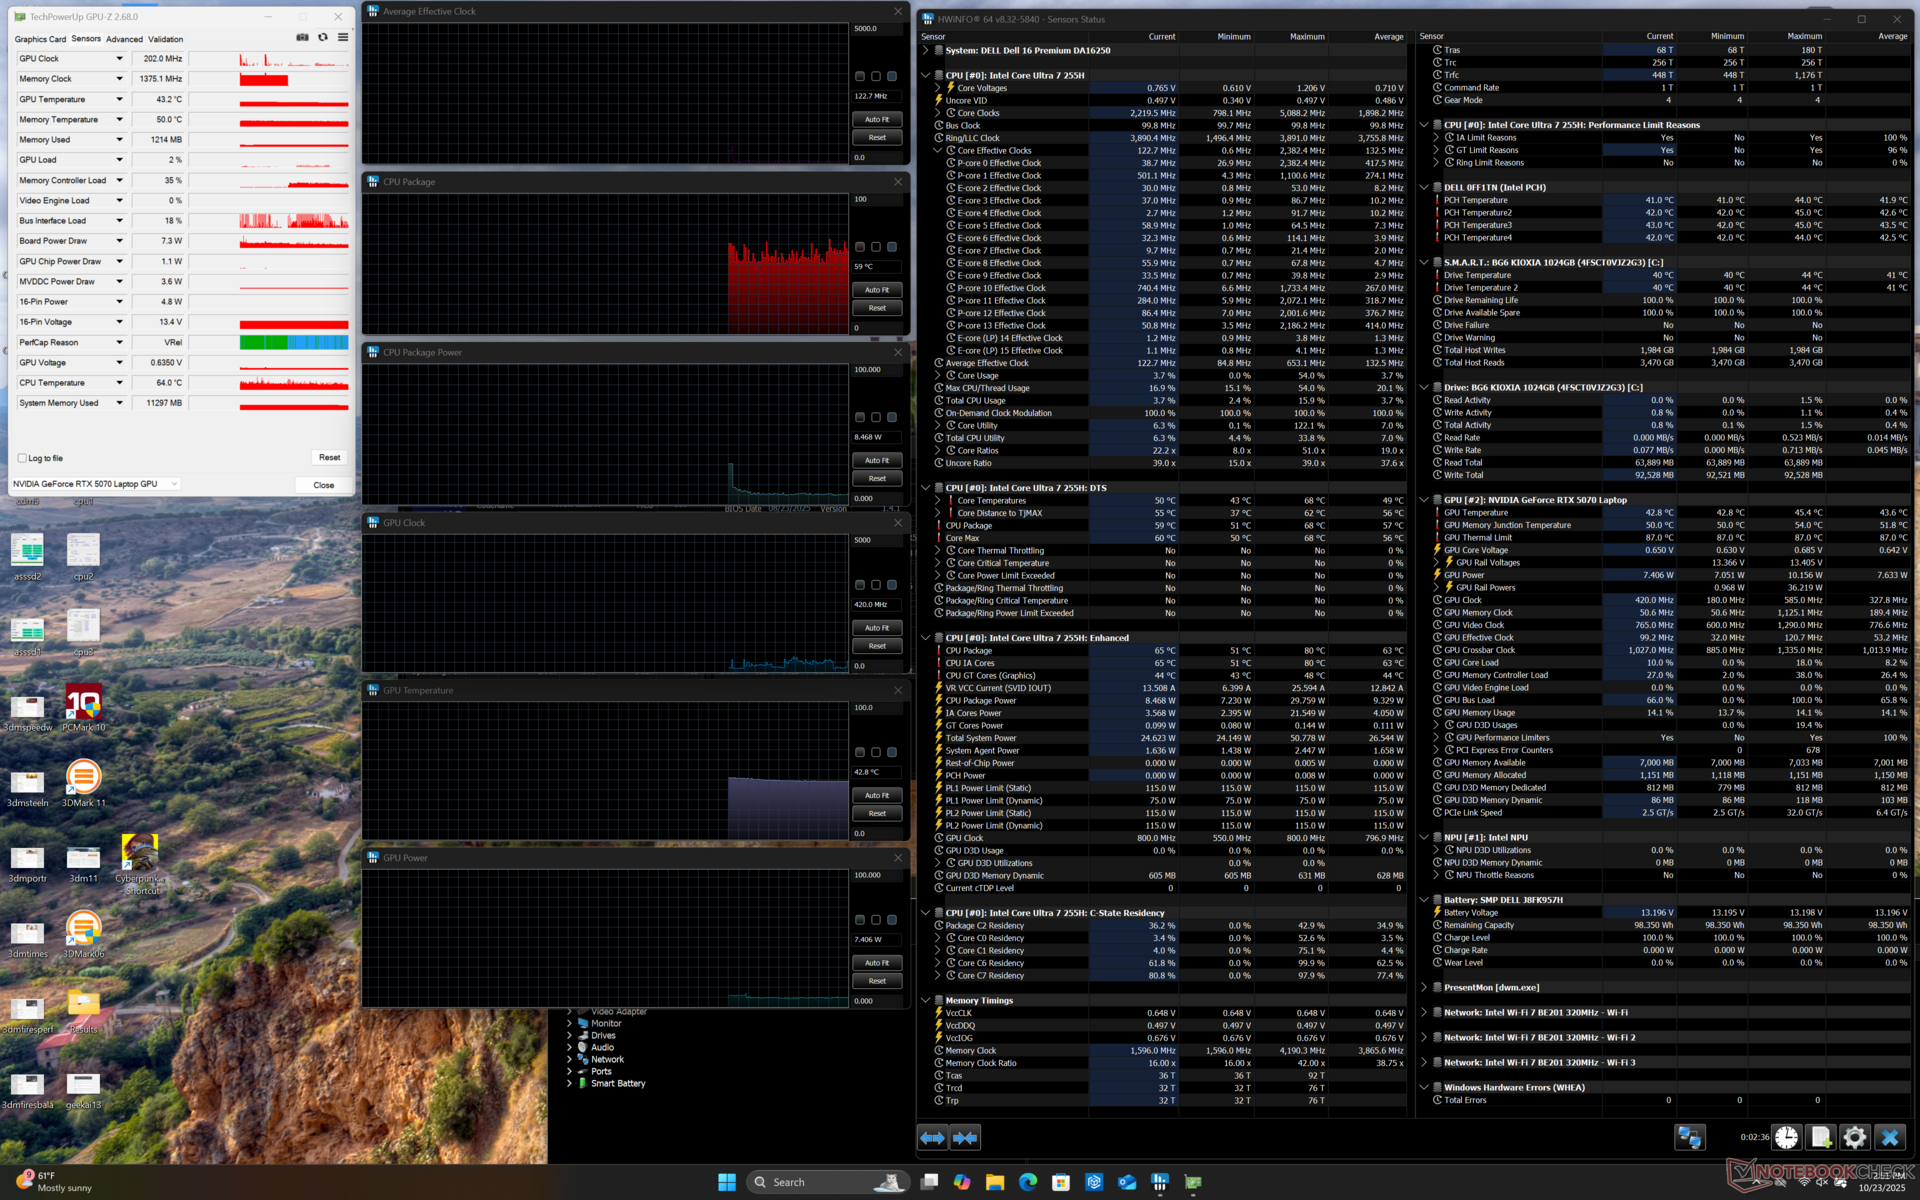
Le temperature dei core possono ancora raggiungere livelli relativamente alti, in particolare per la CPU. Durante l'esecuzione dello stress Prime95, ad esempio, la CPU ha raggiunto 3,7 GHz, 105 C e 115 W, prima di scendere a 3 GHz, 93 C e 67 W poco dopo. La sostenibilità massima del Turbo Boost è quindi limitata, come esemplificato sopra nella sezione Prestazioni della CPU.
L'assorbimento di potenza della scheda GPU durante l'esecuzione di Cyberpunk 2077 si aggira in media tra i 55 W e i 65 W, rispetto ai 115 W di un portatile da gioco come l' Alienware 16X Aurora con la stessa GPU RTX 5070.
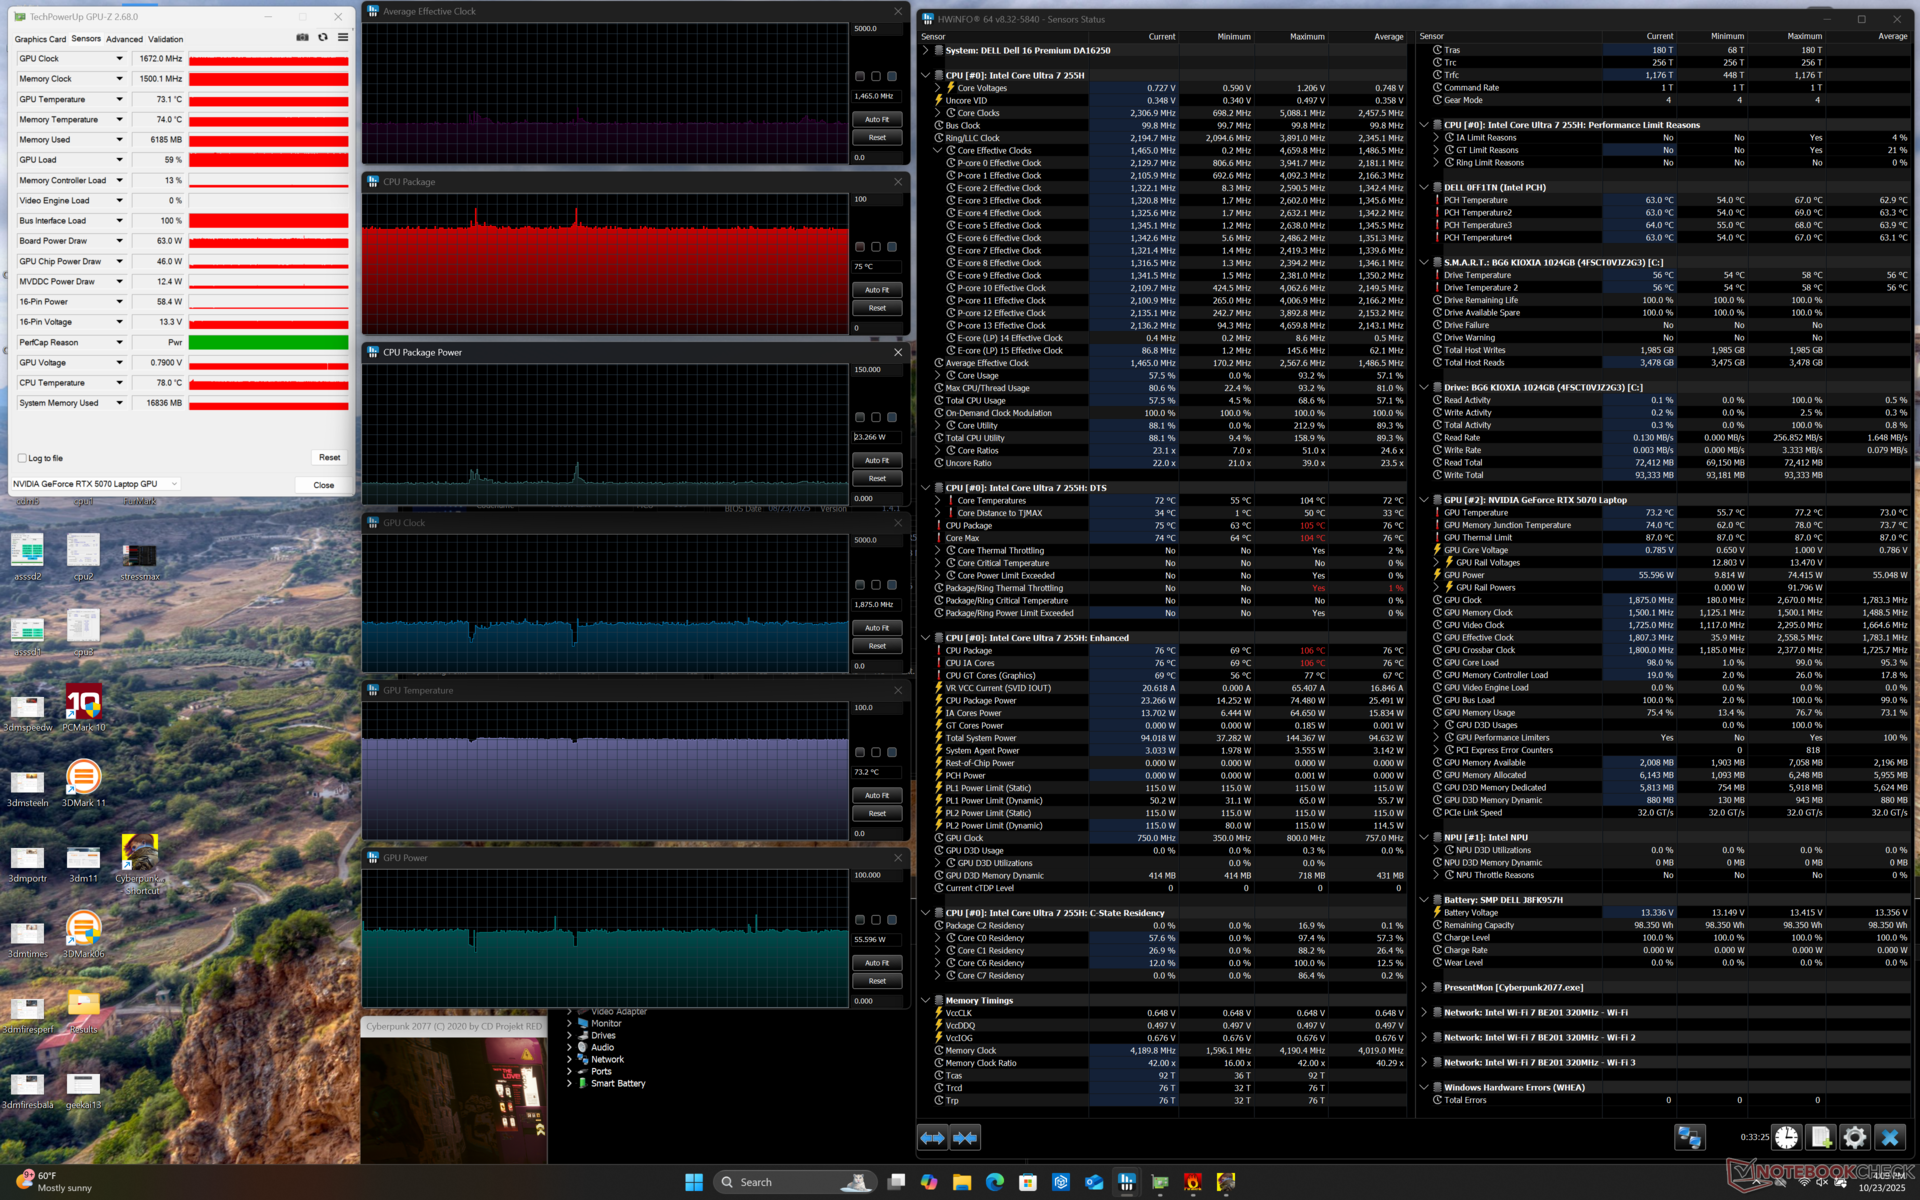

| Clock medio della CPU (GHz) | Clock della GPU (MHz) | Temperatura media della CPU (°C) | Temperatura media della GPU (°C) | |
| Sistema inattivo | -- | -- | 59 | 43 |
| Stress Prime95 | 3.0 | -- | 93 | 65 |
| Cyberpunk 2077 Stress (modalità bilanciata) | 1,5 | 1672 | 75 | 73 |
| Cyberpunk 2077 Stress (modalità Performance) | 1,5 | 1687 | 76 | 73 |
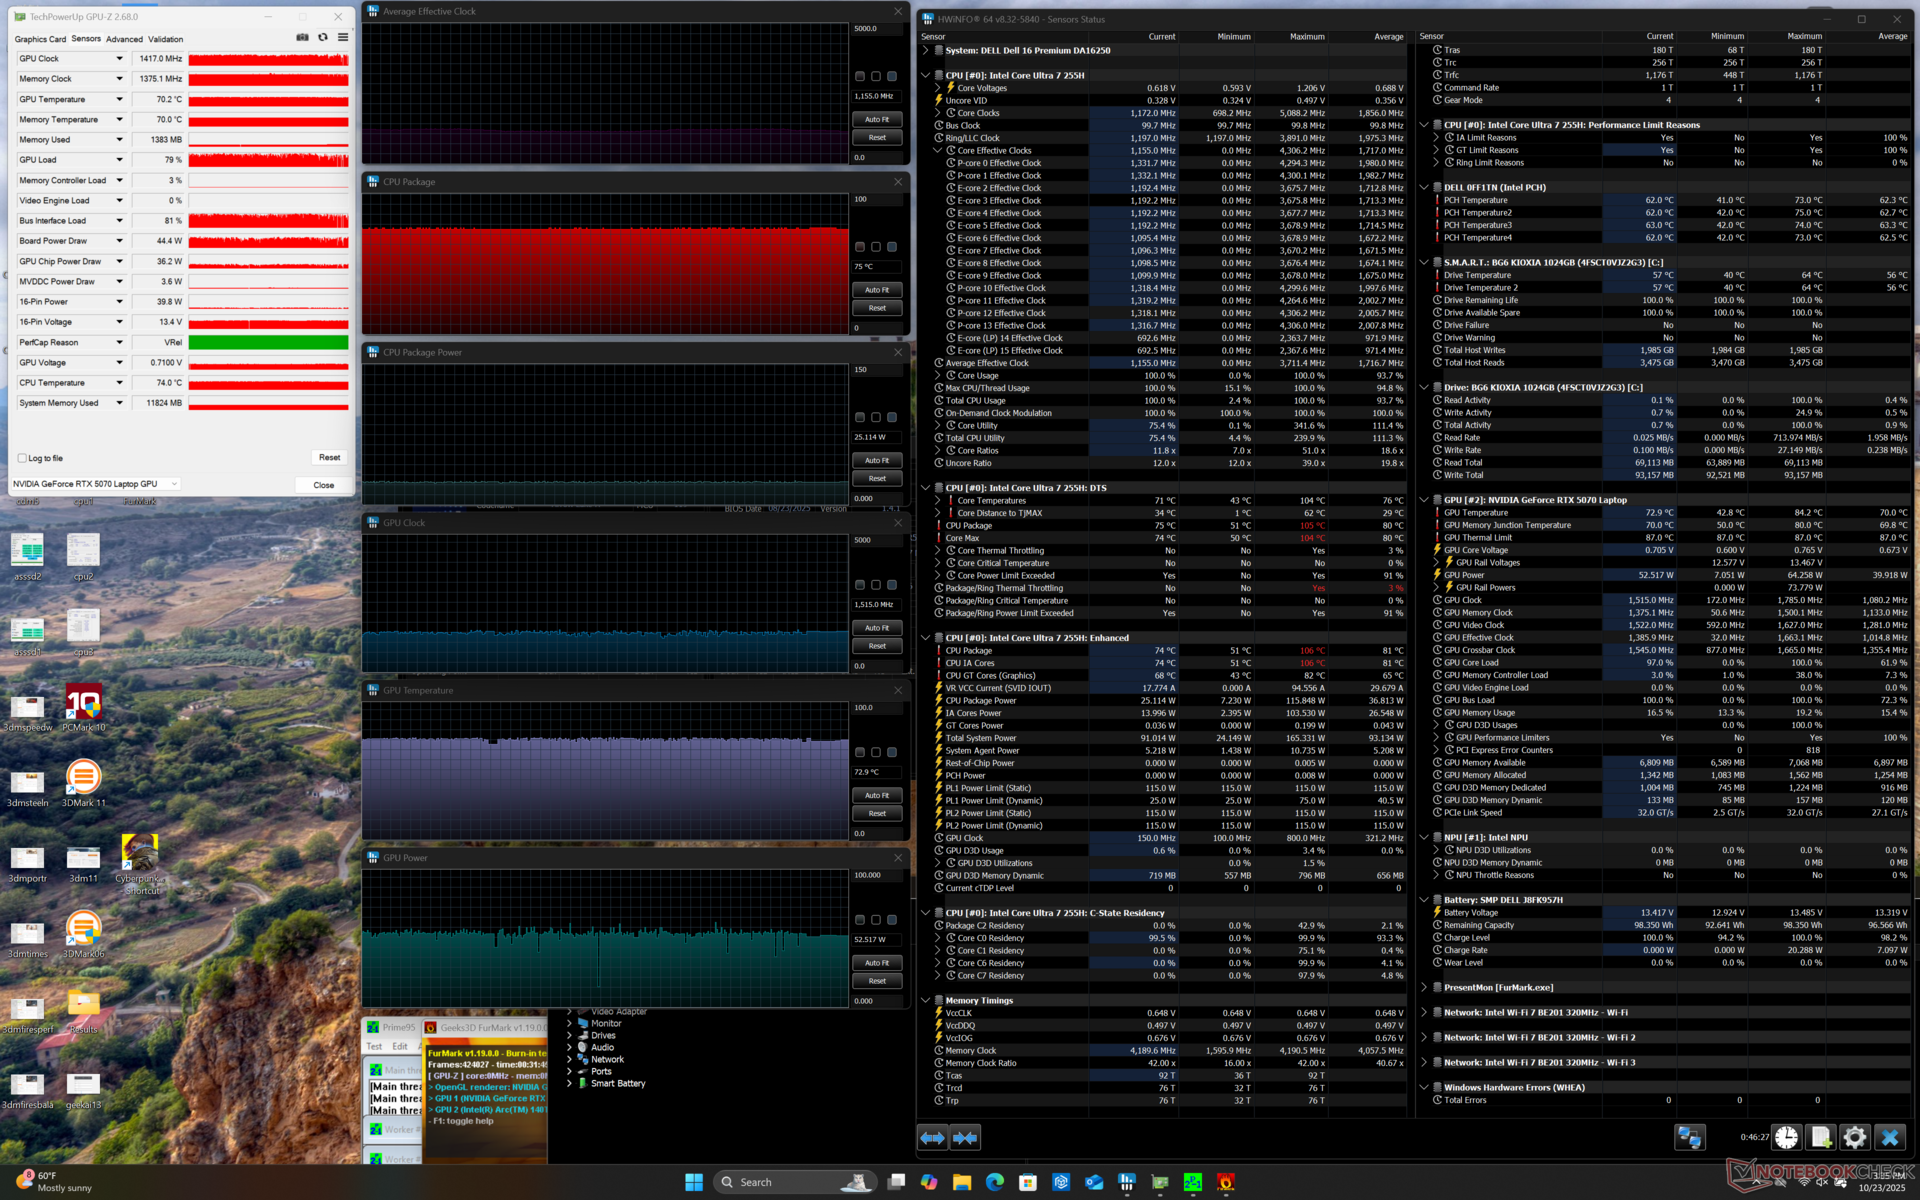
| Prime95 + FurMark Stress | 1.2 | 1417 | 75 | 73 |
Prestazioni del sistema
Sia AIDA64 che PCMark 10 non sono stati eseguiti sulla nostra unità e quindi i punteggi sono stati omessi di seguito.
CrossMark: Overall | Productivity | Creativity | Responsiveness
WebXPRT 3: Overall
WebXPRT 4: Overall
Mozilla Kraken 1.1: Total
| Performance rating | |
| Lenovo Yoga Pro 9i 16 RTX 5070 | |
| Dell XPS 16 9640 -1! | |
| Dell 16 Premium DA16250 | |
| Media Intel Core Ultra 7 255H, NVIDIA GeForce RTX 5070 Laptop | |
| Asus Zenbook S 16 UM5606-RK333W | |
| LG Gram Pro 16Z90TS-G.AU89G | |
| HP Spectre x360 16 RTX 4050 | |
| CrossMark / Overall | |
| Lenovo Yoga Pro 9i 16 RTX 5070 | |
| Dell 16 Premium DA16250 | |
| Media Intel Core Ultra 7 255H, NVIDIA GeForce RTX 5070 Laptop (n=1) | |
| Dell XPS 16 9640 | |
| Asus Zenbook S 16 UM5606-RK333W | |
| LG Gram Pro 16Z90TS-G.AU89G | |
| HP Spectre x360 16 RTX 4050 | |
| CrossMark / Productivity | |
| Lenovo Yoga Pro 9i 16 RTX 5070 | |
| Dell 16 Premium DA16250 | |
| Media Intel Core Ultra 7 255H, NVIDIA GeForce RTX 5070 Laptop (n=1) | |
| Dell XPS 16 9640 | |
| Asus Zenbook S 16 UM5606-RK333W | |
| LG Gram Pro 16Z90TS-G.AU89G | |
| HP Spectre x360 16 RTX 4050 | |
| CrossMark / Creativity | |
| Lenovo Yoga Pro 9i 16 RTX 5070 | |
| Dell 16 Premium DA16250 | |
| Media Intel Core Ultra 7 255H, NVIDIA GeForce RTX 5070 Laptop (n=1) | |
| Asus Zenbook S 16 UM5606-RK333W | |
| Dell XPS 16 9640 | |
| LG Gram Pro 16Z90TS-G.AU89G | |
| HP Spectre x360 16 RTX 4050 | |
| CrossMark / Responsiveness | |
| Dell 16 Premium DA16250 | |
| Media Intel Core Ultra 7 255H, NVIDIA GeForce RTX 5070 Laptop (n=1) | |
| Dell XPS 16 9640 | |
| Lenovo Yoga Pro 9i 16 RTX 5070 | |
| Asus Zenbook S 16 UM5606-RK333W | |
| LG Gram Pro 16Z90TS-G.AU89G | |
| HP Spectre x360 16 RTX 4050 | |
| WebXPRT 3 / Overall | |
| Lenovo Yoga Pro 9i 16 RTX 5070 | |
| Dell 16 Premium DA16250 | |
| Media Intel Core Ultra 7 255H, NVIDIA GeForce RTX 5070 Laptop (n=1) | |
| Asus Zenbook S 16 UM5606-RK333W | |
| Dell XPS 16 9640 | |
| HP Spectre x360 16 RTX 4050 | |
| LG Gram Pro 16Z90TS-G.AU89G | |
| WebXPRT 4 / Overall | |
| Lenovo Yoga Pro 9i 16 RTX 5070 | |
| Dell 16 Premium DA16250 | |
| Media Intel Core Ultra 7 255H, NVIDIA GeForce RTX 5070 Laptop (n=1) | |
| LG Gram Pro 16Z90TS-G.AU89G | |
| Asus Zenbook S 16 UM5606-RK333W | |
| HP Spectre x360 16 RTX 4050 | |
| Dell XPS 16 9640 | |
| Mozilla Kraken 1.1 / Total | |
| HP Spectre x360 16 RTX 4050 | |
| LG Gram Pro 16Z90TS-G.AU89G | |
| Dell 16 Premium DA16250 | |
| Media Intel Core Ultra 7 255H, NVIDIA GeForce RTX 5070 Laptop (n=1) | |
| Asus Zenbook S 16 UM5606-RK333W | |
| Lenovo Yoga Pro 9i 16 RTX 5070 | |
* ... Meglio usare valori piccoli
Latenza DPC
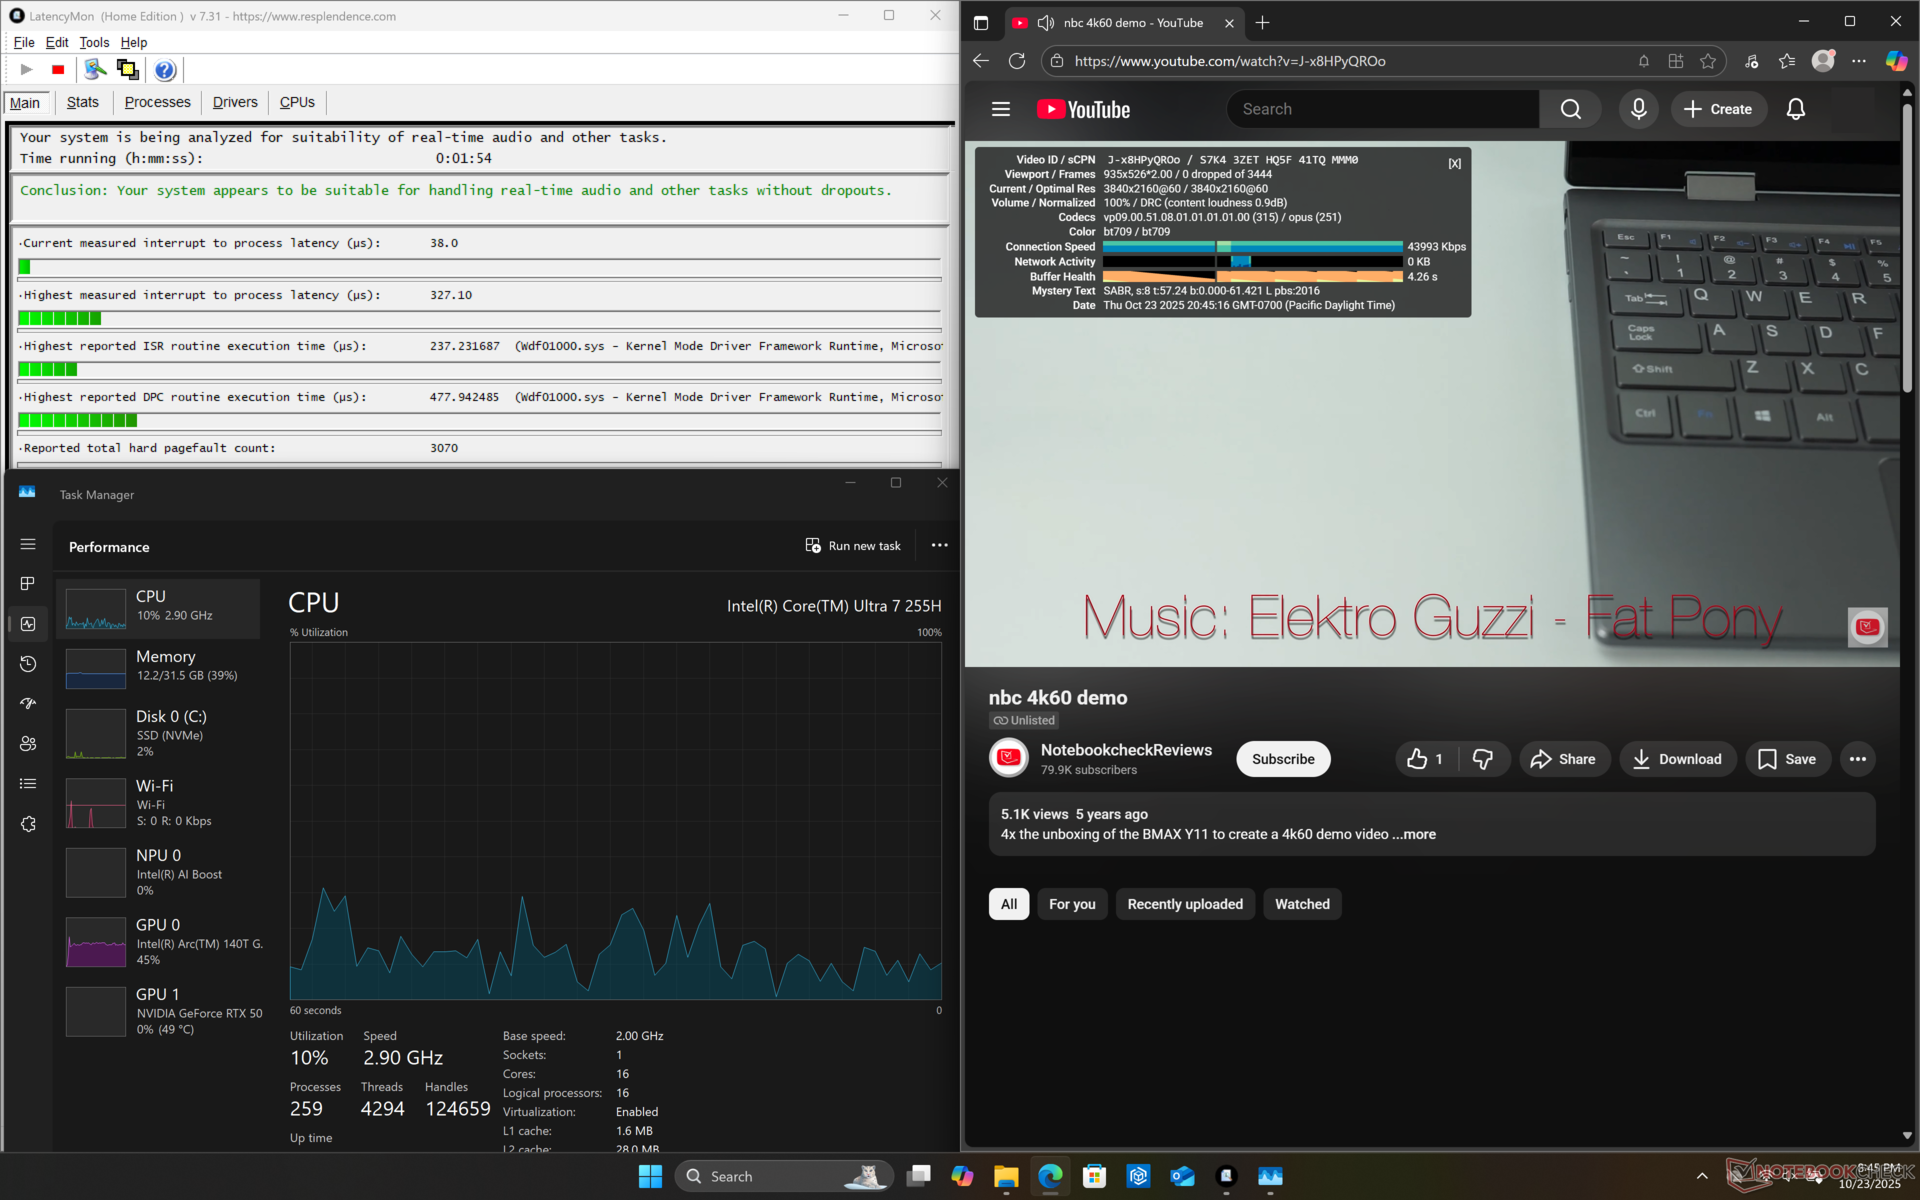

| DPC Latencies / LatencyMon - interrupt to process latency (max), Web, Youtube, Prime95 | |
| HP Spectre x360 16 RTX 4050 | |
| Lenovo Yoga Pro 9i 16 RTX 5070 | |
| Dell XPS 16 9640 | |
| Dell 16 Premium DA16250 | |
* ... Meglio usare valori piccoli
Dispositivi di archiviazione
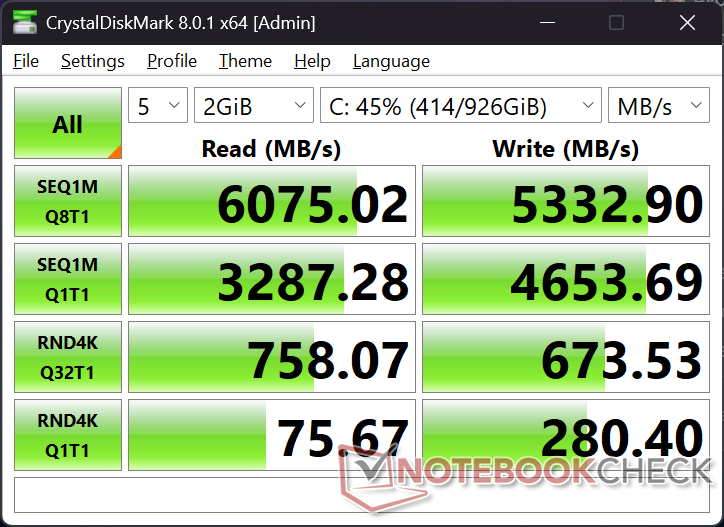
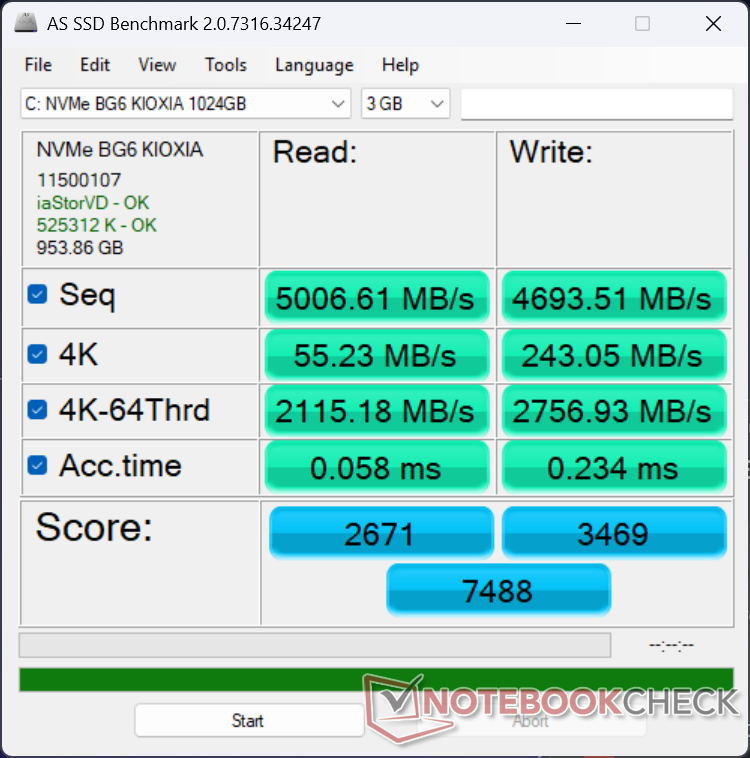

| Drive Performance rating - Percent | |
| Dell XPS 16 9640 | |
| Dell 16 Premium DA16250 | |
| Lenovo Yoga Pro 9i 16 RTX 5070 | |
| HP Spectre x360 16 RTX 4050 | |
| LG Gram Pro 16Z90TS-G.AU89G -11! | |
| Asus Zenbook S 16 UM5606-RK333W | |
* ... Meglio usare valori piccoli
Strozzatura del disco: DiskSpd Lettura in loop, Profondità coda 8
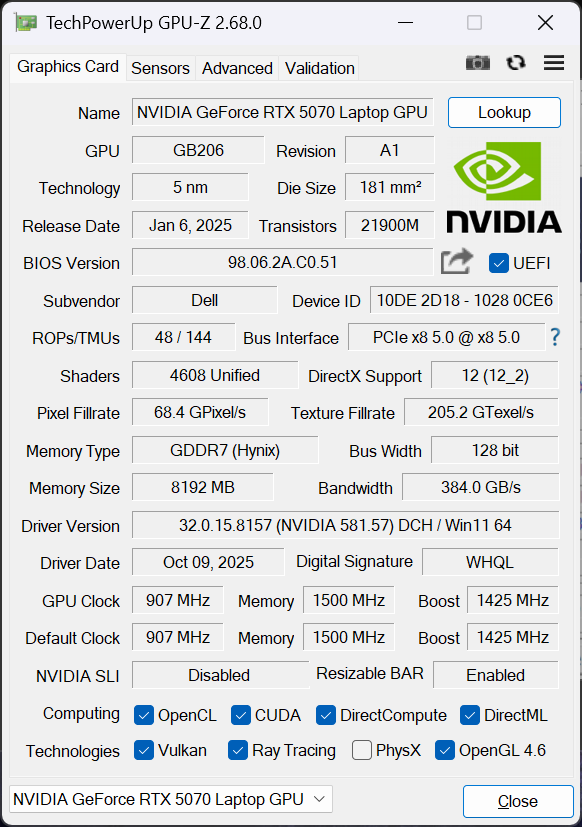
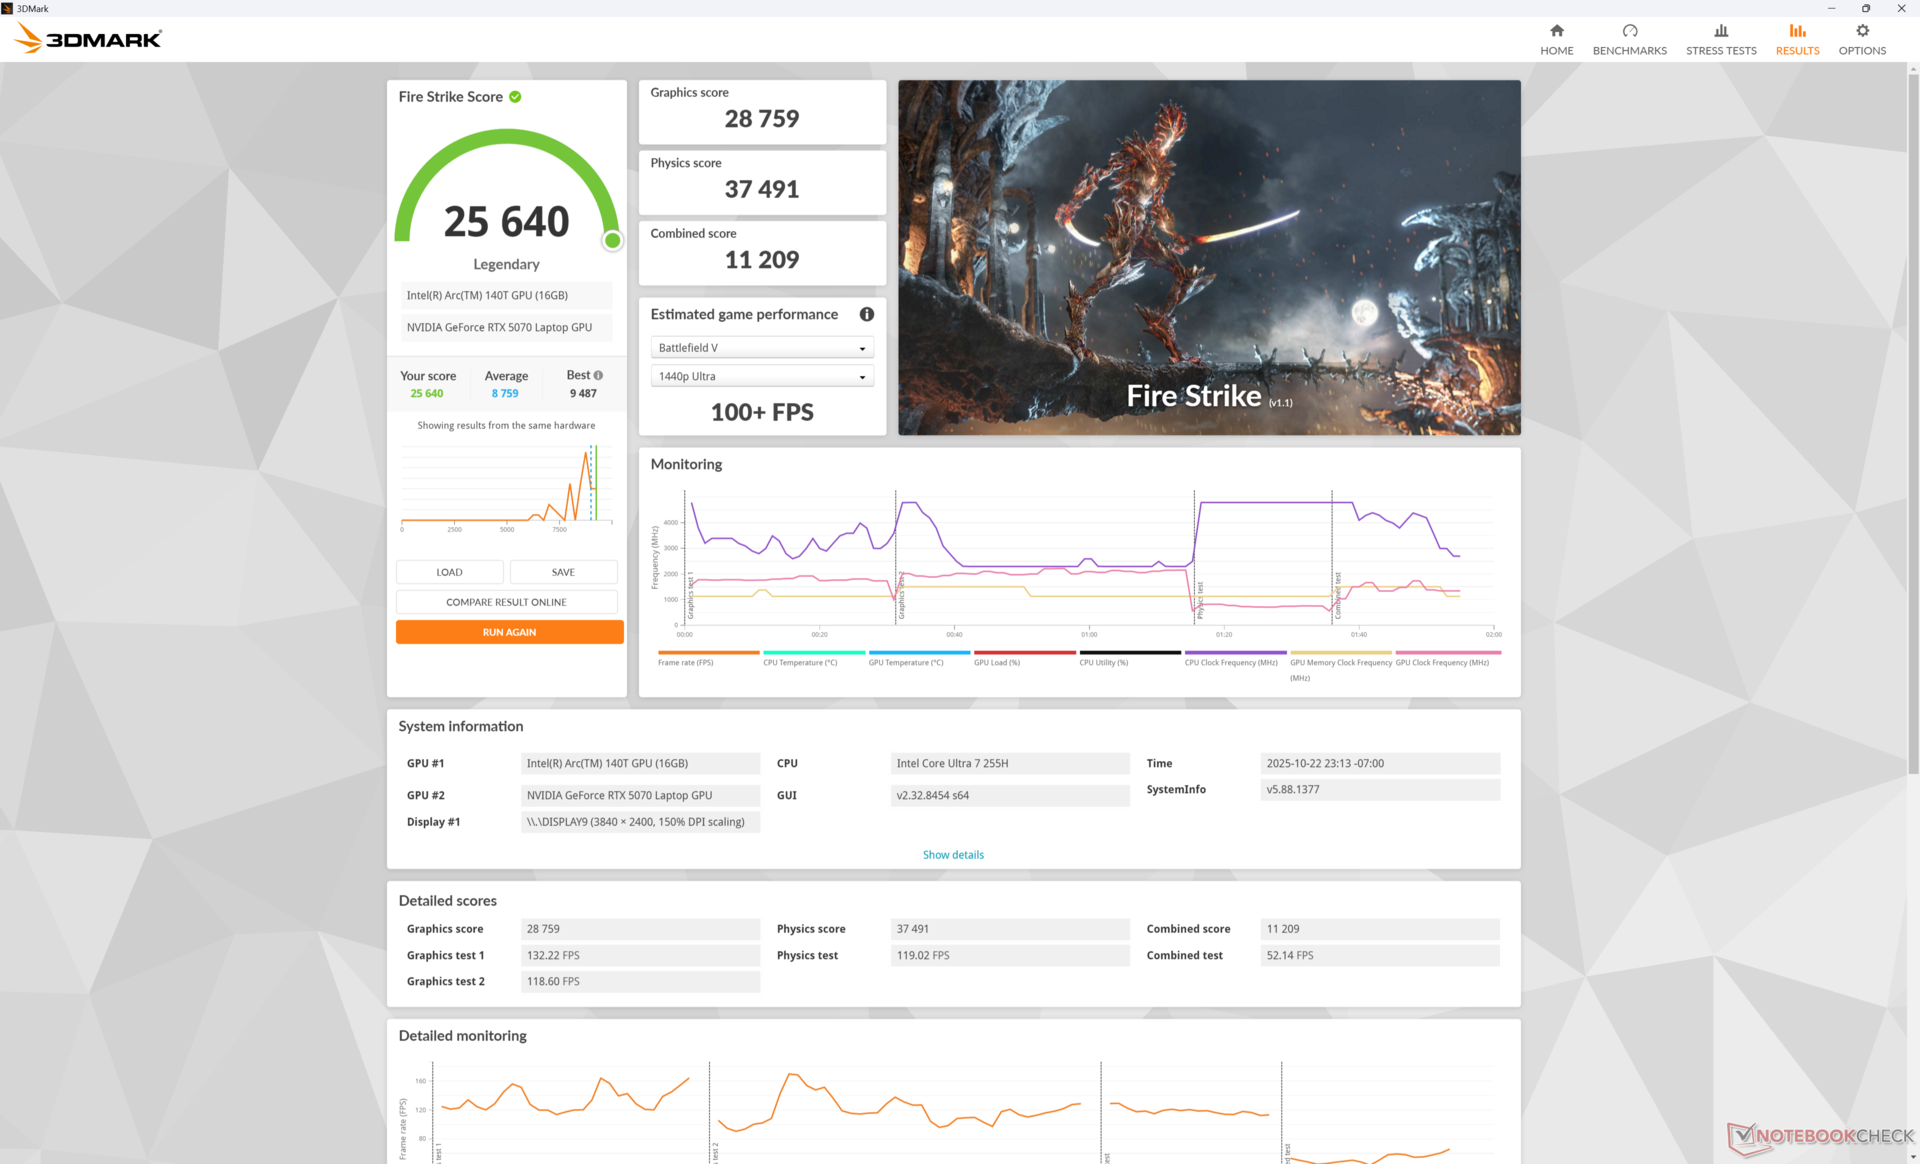
Prestazioni della GPU
La GPU mobile GeForce RTX 5070 di Dell 16 Premium funziona quasi il 20% più lentamente rispetto alla media dei laptop del nostro database con la stessa GPU RTX 5070 stessa GPU RTX 5070 perché la maggior parte dei laptop con questa stessa GPU tendono ad essere laptop da gioco con obiettivi TGP più elevati. Le prestazioni di rasterizzazione tradizionale sono quindi più vicine a quelle dei laptop con la GPU RTX 5060.
Per le attività professionali come Blender, la discrepanza di prestazioni rispetto ad altri laptop RTX 5070 è più ridotta di circa il 10% in media. Il Dell 16 Premium è prima di tutto un PC professionale e poi un portatile da gioco.
| Profilo di potenza | Punteggio grafico | Punteggio Fisica | Punteggio combinato |
| Modalità Prestazioni | 28759 | 37491 | 11209 |
| Modalità equilibrata | 27915 (-3%) | 35948 (-4%) | 9874 (-12%) |
| Alimentazione a batteria | 25880 (-10%) | 32601 (-13%) | 11046 (-1%) |
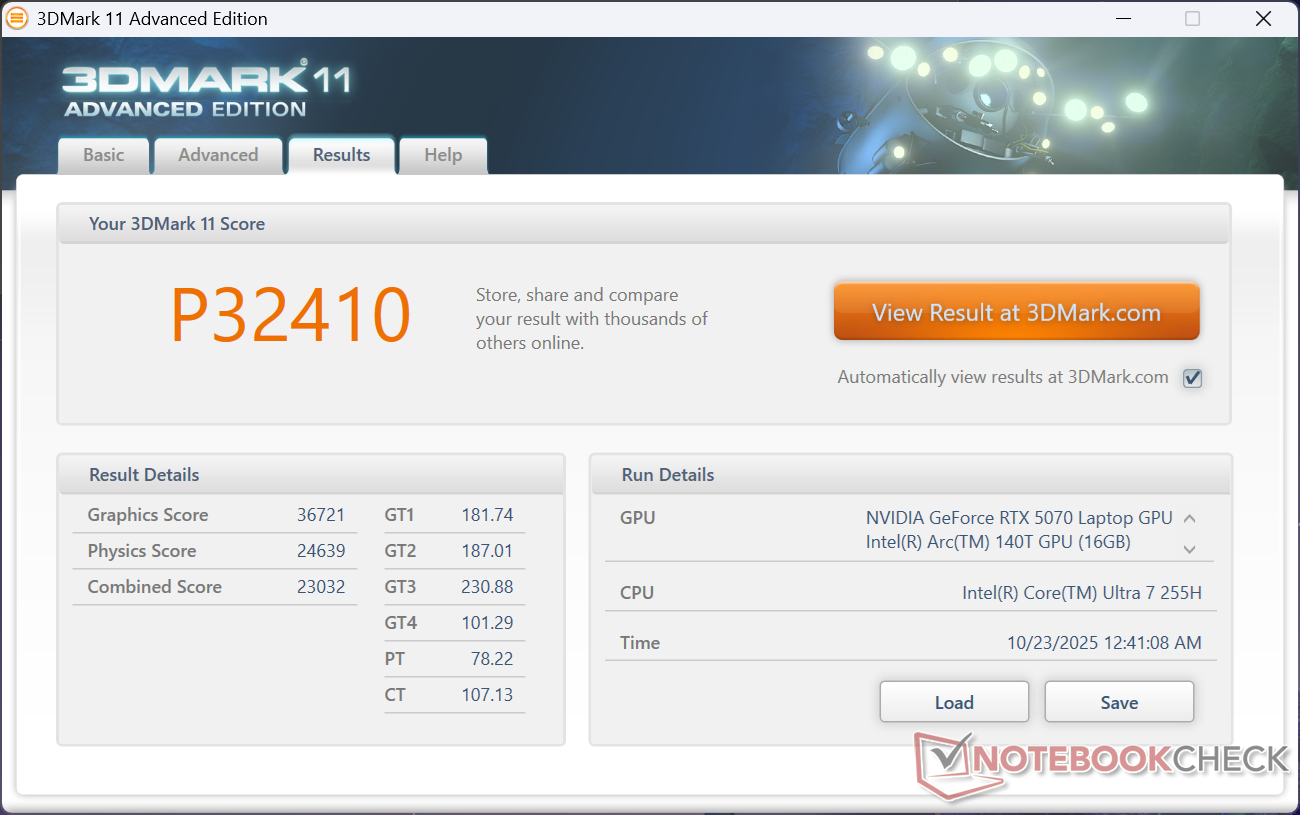
| 3DMark 11 Performance | 32410 punti | |
| 3DMark Cloud Gate Standard Score | 65334 punti | |
| 3DMark Fire Strike Score | 25640 punti | |
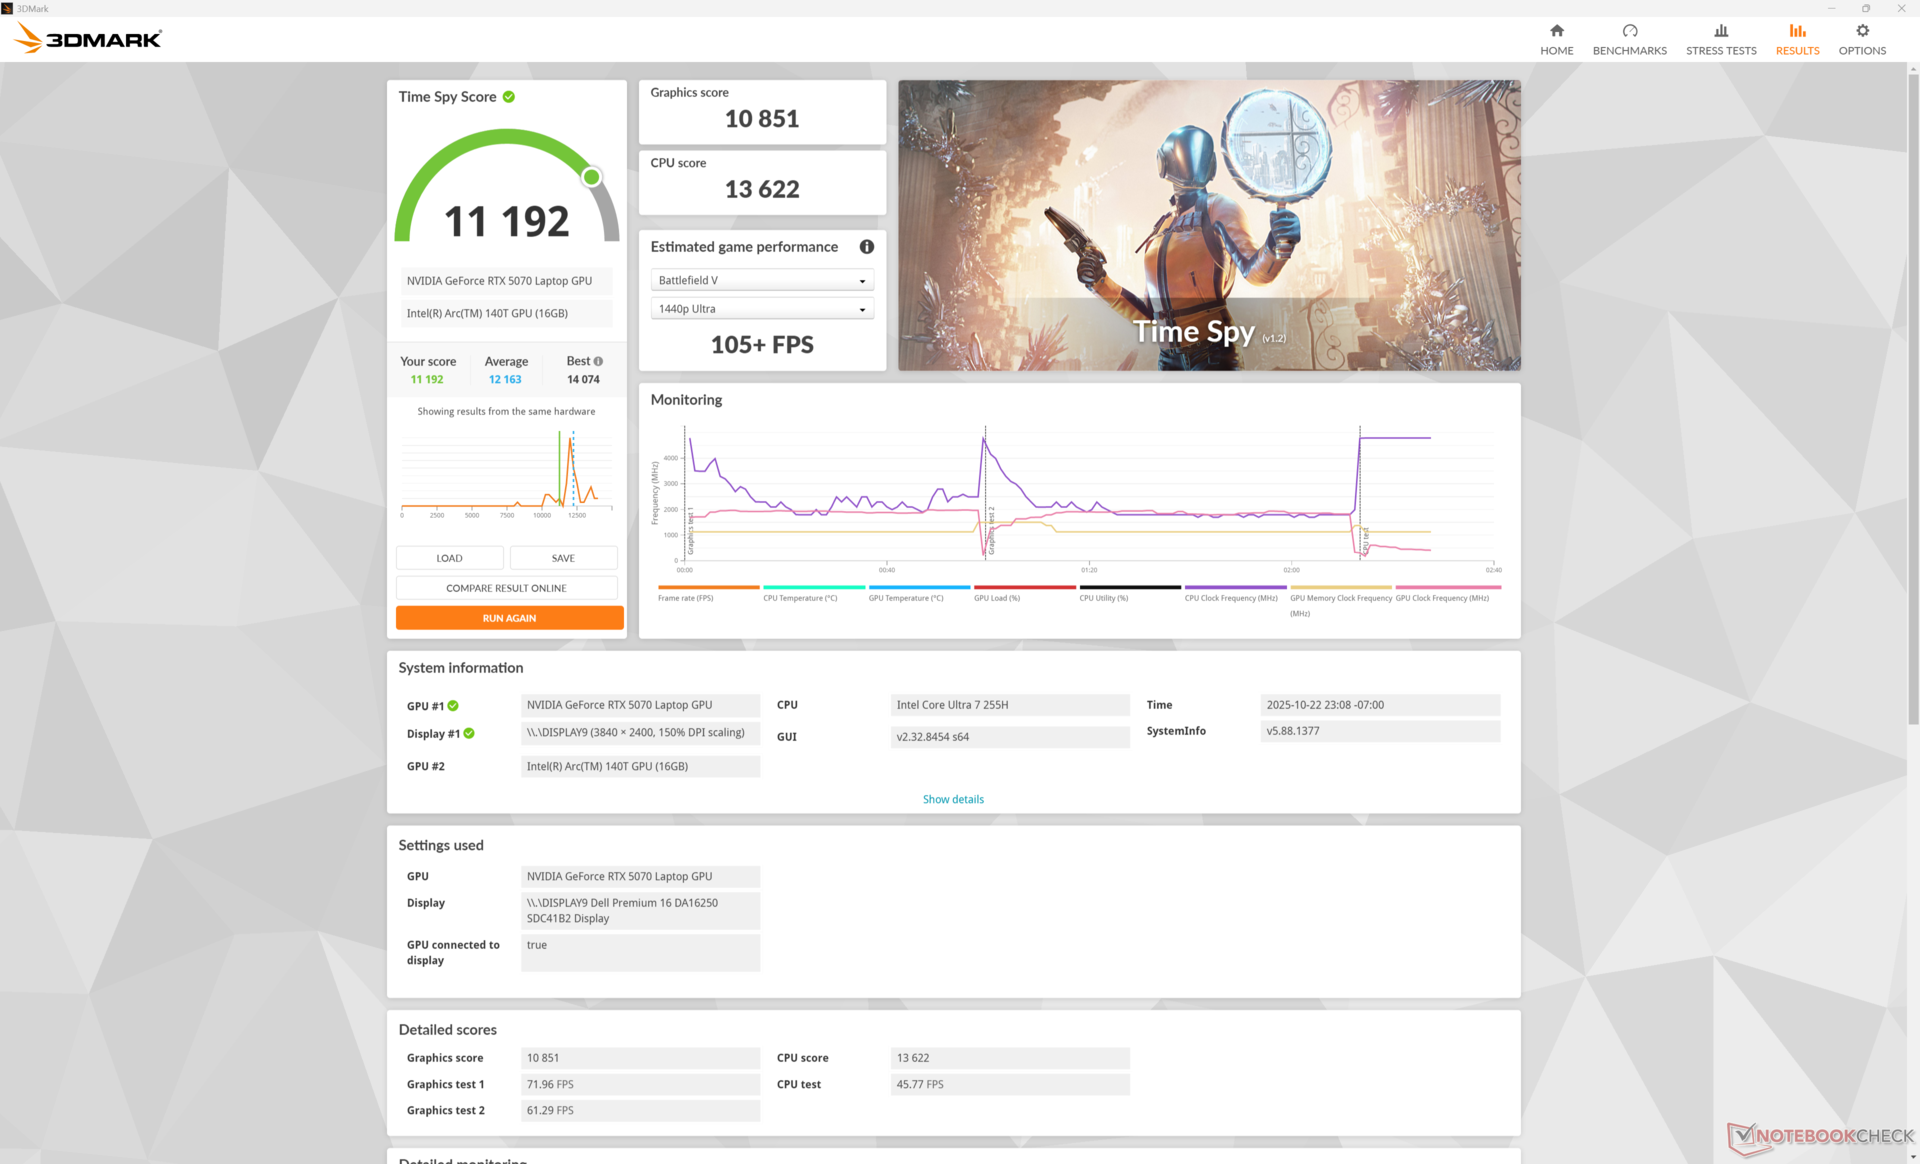
| 3DMark Time Spy Score | 11192 punti | |
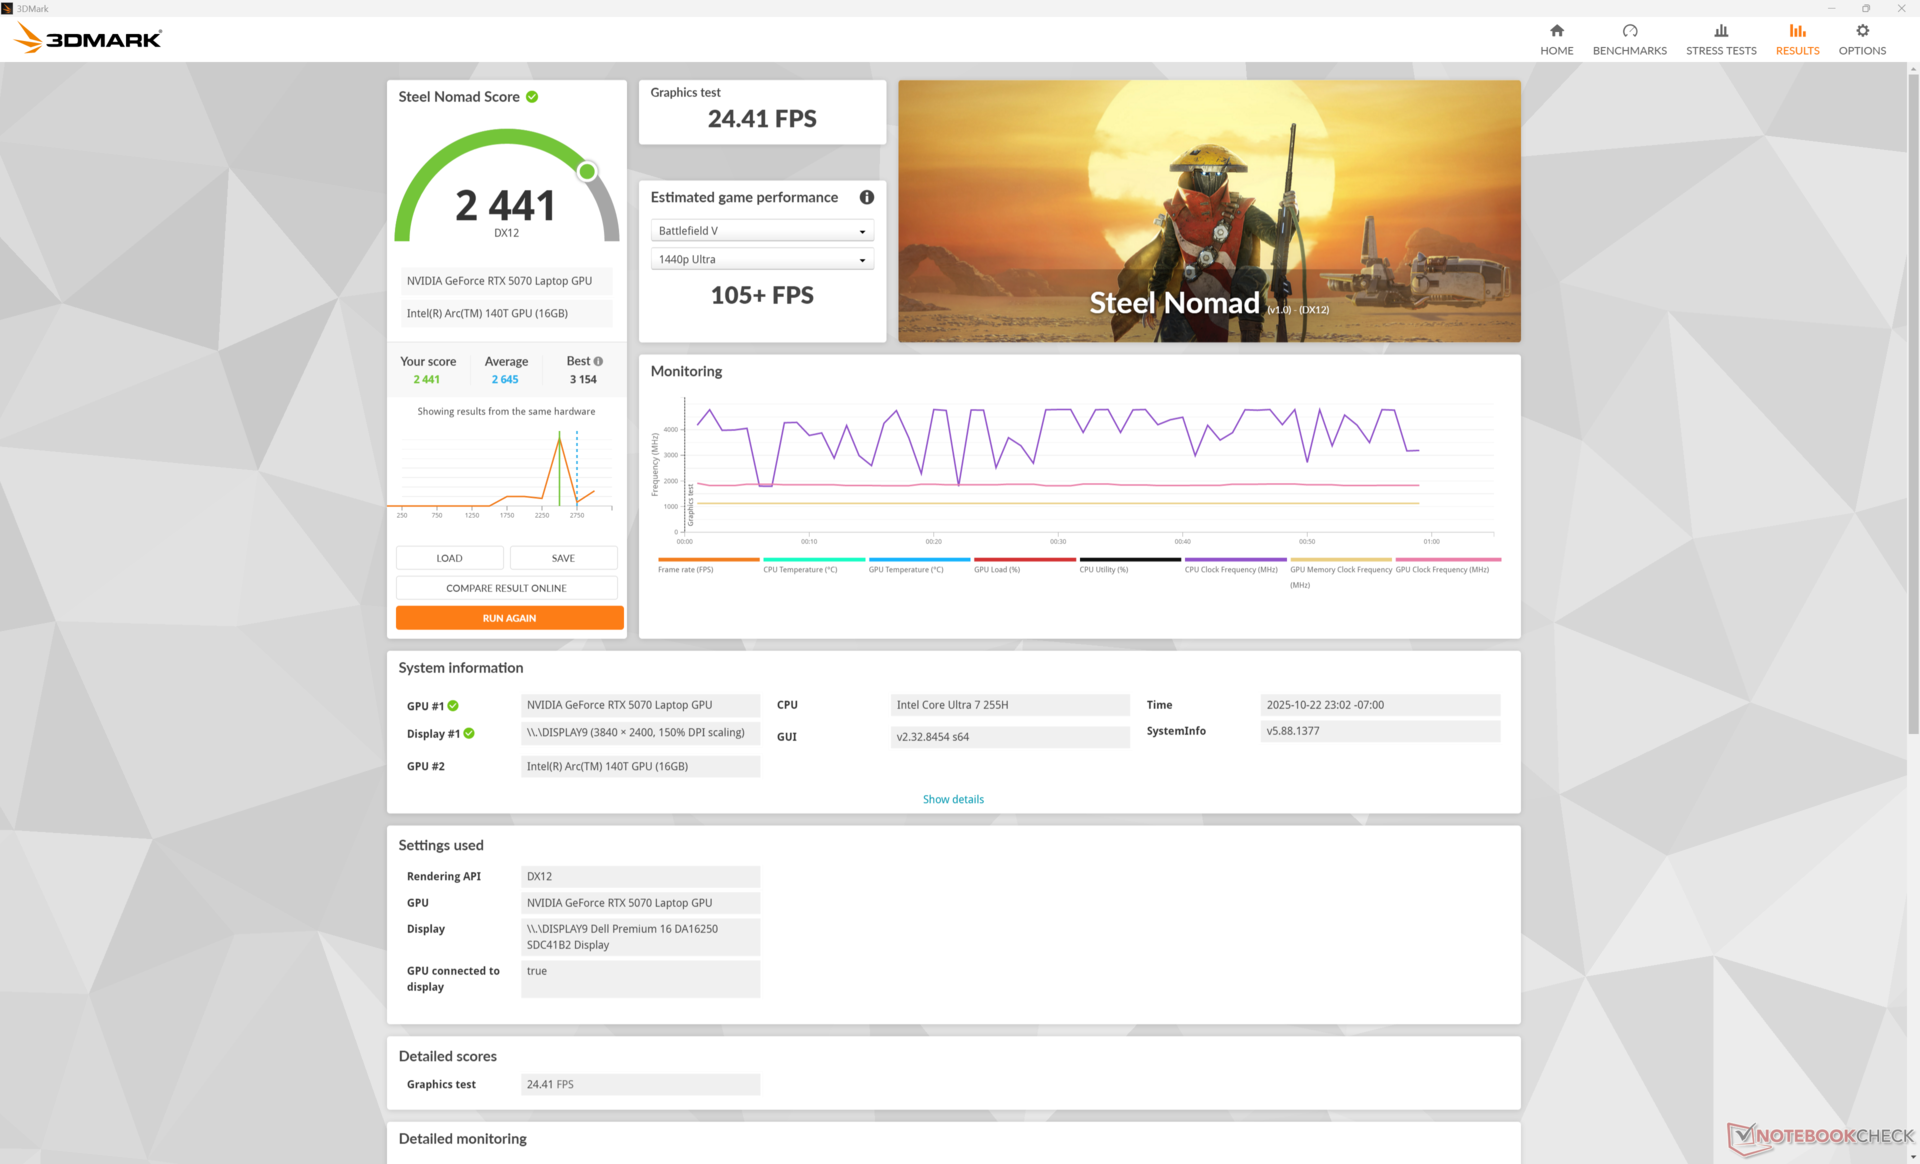
| 3DMark Steel Nomad Score | 2441 punti | |
Aiuto | ||
* ... Meglio usare valori piccoli
Prestazioni di gioco
I giochi possono essere eseguiti fino al 20% più lentamente rispetto alla maggior parte degli altri laptop con la stessa GPU. Assassin's Creed Shadows, ad esempio, viene eseguito costantemente più velocemente sul Lenovo Yoga Pro 9i 16 in tutte le impostazioni testate.
| Performance rating - Percent | |
| Lenovo Yoga Pro 9i 16 RTX 5070 | |
| Dell 16 Premium DA16250 | |
| Dell XPS 16 9640 | |
| HP Spectre x360 16 RTX 4050 | |
| Asus Zenbook S 16 UM5606-RK333W | |
| LG Gram Pro 16Z90TS-G.AU89G | |
| Cyberpunk 2077 - 1920x1080 Ultra Preset (FSR off) | |
| Lenovo Yoga Pro 9i 16 RTX 5070 | |
| Dell 16 Premium DA16250 | |
| Dell XPS 16 9640 | |
| HP Spectre x360 16 RTX 4050 | |
| Asus Zenbook S 16 UM5606-RK333W | |
| LG Gram Pro 16Z90TS-G.AU89G | |
| Baldur's Gate 3 - 1920x1080 Ultra Preset AA:T | |
| Dell 16 Premium DA16250 | |
| Dell XPS 16 9640 | |
| Lenovo Yoga Pro 9i 16 RTX 5070 | |
| HP Spectre x360 16 RTX 4050 | |
| Asus Zenbook S 16 UM5606-RK333W | |
| LG Gram Pro 16Z90TS-G.AU89G | |
| GTA V - 1920x1080 Highest AA:4xMSAA + FX AF:16x | |
| Lenovo Yoga Pro 9i 16 RTX 5070 | |
| Dell 16 Premium DA16250 | |
| Dell XPS 16 9640 | |
| HP Spectre x360 16 RTX 4050 | |
| Asus Zenbook S 16 UM5606-RK333W | |
| LG Gram Pro 16Z90TS-G.AU89G | |
| Final Fantasy XV Benchmark - 1920x1080 High Quality | |
| Lenovo Yoga Pro 9i 16 RTX 5070 | |
| Dell 16 Premium DA16250 | |
| Dell XPS 16 9640 | |
| HP Spectre x360 16 RTX 4050 | |
| LG Gram Pro 16Z90TS-G.AU89G | |
| Asus Zenbook S 16 UM5606-RK333W | |
| Strange Brigade - 1920x1080 ultra AA:ultra AF:16 | |
| Lenovo Yoga Pro 9i 16 RTX 5070 | |
| Dell 16 Premium DA16250 | |
| Dell XPS 16 9640 | |
| HP Spectre x360 16 RTX 4050 | |
| LG Gram Pro 16Z90TS-G.AU89G | |
| Asus Zenbook S 16 UM5606-RK333W | |
| Dota 2 Reborn - 1920x1080 ultra (3/3) best looking | |
| Lenovo Yoga Pro 9i 16 RTX 5070 | |
| Dell 16 Premium DA16250 | |
| HP Spectre x360 16 RTX 4050 | |
| Dell XPS 16 9640 | |
| LG Gram Pro 16Z90TS-G.AU89G | |
| Asus Zenbook S 16 UM5606-RK333W | |
| X-Plane 11.11 - 1920x1080 high (fps_test=3) | |
| Lenovo Yoga Pro 9i 16 RTX 5070 | |
| Dell 16 Premium DA16250 | |
| Dell XPS 16 9640 | |
| Dell XPS 16 9640 | |
| HP Spectre x360 16 RTX 4050 | |
| Asus Zenbook S 16 UM5606-RK333W | |
| LG Gram Pro 16Z90TS-G.AU89G | |
| Assassin's Creed Shadows | |
| 1920x1080 Low | |
| Media NVIDIA GeForce RTX 5070 Laptop (39 - 100, n=9) | |
| Lenovo Yoga Pro 9i 16 RTX 5070 | |
| Dell 16 Premium DA16250 | |
| 1920x1080 Medium | |
| Media NVIDIA GeForce RTX 5070 Laptop (36 - 93, n=10) | |
| Lenovo Yoga Pro 9i 16 RTX 5070 | |
| Dell 16 Premium DA16250 | |
| 1920x1080 High | |
| Media NVIDIA GeForce RTX 5070 Laptop (32 - 77, n=11) | |
| Lenovo Yoga Pro 9i 16 RTX 5070 | |
| Dell 16 Premium DA16250 | |
| 1920x1080 Ultra High | |
| Lenovo Yoga Pro 9i 16 RTX 5070 | |
| Media NVIDIA GeForce RTX 5070 Laptop (25 - 53, n=12) | |
| Dell 16 Premium DA16250 | |
| 2560x1440 Ultra High | |
| Media NVIDIA GeForce RTX 5070 Laptop (22 - 40, n=12) | |
| Lenovo Yoga Pro 9i 16 RTX 5070 | |
| Dell 16 Premium DA16250 | |
| 2560x1440 Ultra High + DLSS Quality | |
| Media NVIDIA GeForce RTX 5070 Laptop (25 - 45, n=6) | |
| Dell 16 Premium DA16250 | |
| 2560x1440 Ultra High + GI + DLSS Quality + FG | |
| Media NVIDIA GeForce RTX 5070 Laptop (33 - 57, n=4) | |
| Dell 16 Premium DA16250 | |
| Monster Hunter Wilds | |
| 1920x1080 lowest, no upscaling | |
| Media NVIDIA GeForce RTX 5070 Laptop (69.1 - 86.5, n=3) | |
| Dell 16 Premium DA16250 | |
| 1920x1080 medium, no upscaling | |
| Media NVIDIA GeForce RTX 5070 Laptop (61.6 - 78.2, n=4) | |
| Dell 16 Premium DA16250 | |
| Black Myth: Wukong | |
| 1280x720 low TSR 100 | |
| Media NVIDIA GeForce RTX 5070 Laptop (127 - 206, n=2) | |
| Dell 16 Premium DA16250 | |
| 1920x1080 low TSR 100 | |
| Media NVIDIA GeForce RTX 5070 Laptop (83 - 197, n=4) | |
| Dell 16 Premium DA16250 | |
| 1920x1080 medium TSR 100 | |
| Media NVIDIA GeForce RTX 5070 Laptop (63 - 112, n=4) | |
| Dell 16 Premium DA16250 | |
| 1920x1080 high TSR 100 | |
| Media NVIDIA GeForce RTX 5070 Laptop (49 - 86, n=5) | |
| Dell 16 Premium DA16250 | |
| 1920x1080 cinematic TSR 100 | |
| Media NVIDIA GeForce RTX 5070 Laptop (28 - 44, n=5) | |
| Dell 16 Premium DA16250 | |
| 2560x1440 cinematic TSR 100 | |
| Media NVIDIA GeForce RTX 5070 Laptop (20 - 27, n=5) | |
| Dell 16 Premium DA16250 | |
| 2560x1440 cinematic DLSS 68 | |
| Media NVIDIA GeForce RTX 5070 Laptop (31 - 41, n=5) | |
| Dell 16 Premium DA16250 | |
| 2560x1440 cinematic RT: Very High DLSS 68 FG | |
| Media NVIDIA GeForce RTX 5070 Laptop (18 - 45, n=4) | |
| Dell 16 Premium DA16250 | |
| Alan Wake 2 | |
| 1280x720 Low Preset | |
| Dell 16 Premium DA16250 | |
| Media NVIDIA GeForce RTX 5070 Laptop (106.8 - 115.2, n=2) | |
| 1920x1080 Low Preset | |
| Media NVIDIA GeForce RTX 5070 Laptop (68.8 - 86.1, n=4) | |
| Dell 16 Premium DA16250 | |
| 1920x1080 Medium Preset | |
| Media NVIDIA GeForce RTX 5070 Laptop (68.4 - 82.4, n=4) | |
| Dell 16 Premium DA16250 | |
| 1920x1080 High Preset | |
| Media NVIDIA GeForce RTX 5070 Laptop (60 - 72.5, n=6) | |
| Dell 16 Premium DA16250 | |
| 2560x1440 High Preset | |
| Media NVIDIA GeForce RTX 5070 Laptop (35.8 - 45.1, n=6) | |
| Dell 16 Premium DA16250 | |
Grafico Cyberpunk 2077 ultra FPS
| basso | medio | alto | ultra | QHD DLSS | QHD | 4K | |
|---|---|---|---|---|---|---|---|
| GTA V (2015) | 185.6 | 180.9 | 175.7 | 123.7 | 96.9 | ||
| Dota 2 Reborn (2015) | 168.4 | 152.9 | 147.8 | 140.4 | 106.4 | ||
| Final Fantasy XV Benchmark (2018) | 218 | 148.7 | 113.1 | 82.5 | |||
| X-Plane 11.11 (2018) | 114.3 | 110 | 91.9 | 65.7 | |||
| Strange Brigade (2018) | 507 | 282 | 232 | 204 | 140.2 | ||
| Baldur's Gate 3 (2023) | 149.5 | 125.5 | 109.8 | 109 | 107.3 | 73.8 | |
| Cyberpunk 2077 (2023) | 134.9 | 107.8 | 91 | 81.5 | 61.4 | 51.9 | |
| Alan Wake 2 (2023) | 68.8 | 68.4 | 60 | 35.8 | |||
| F1 24 (2024) | 242 | 241 | 186 | 63.8 | 62.9 | 40.3 | |
| Black Myth: Wukong (2024) | 83 | 63 | 49 | 28 | 31 | 20 | |
| Monster Hunter Wilds (2025) | 69.1 | 61.6 | |||||
| Assassin's Creed Shadows (2025) | 61 | 57 | 49 | 33 | 35 | 28 |
Emissioni
Rumore del sistema
Il comportamento acustico della ventola e il soffitto sono essenzialmente identici al modello dello scorso anno, poiché la soluzione di raffreddamento e l'involucro di potenza rimangono invariati.
Rumorosità
| Idle |
| 23.2 / 23.2 / 26.6 dB(A) |
| Sotto carico |
| 39.4 / 48.9 dB(A) |
 | ||
30 dB silenzioso 40 dB(A) udibile 50 dB(A) rumoroso |
||
min: | ||
| Dell 16 Premium DA16250 Ultra 7 255H, GeForce RTX 5070 Laptop | Dell XPS 16 9640 Ultra 7 155H, GeForce RTX 4070 Laptop GPU | HP Spectre x360 16 RTX 4050 Ultra 7 155H, GeForce RTX 4050 Laptop GPU | Lenovo Yoga Pro 9i 16 RTX 5070 Ultra 9 285H, GeForce RTX 5070 Laptop | Asus Zenbook S 16 UM5606-RK333W Ryzen AI 9 HX 370, Radeon 890M | LG Gram Pro 16Z90TS-G.AU89G Core Ultra 7 256V, Arc 140V | |
|---|---|---|---|---|---|---|
| Noise | -4% | 11% | -5% | 6% | -1% | |
| off /ambiente * (dB) | 23.2 | 24.5 -6% | 23.3 -0% | 24.1 -4% | 24.7 -6% | 25.2 -9% |
| Idle Minimum * (dB) | 23.2 | 24.5 -6% | 23.6 -2% | 24.1 -4% | 24.7 -6% | 25.2 -9% |
| Idle Average * (dB) | 23.2 | 24.5 -6% | 23.6 -2% | 24.1 -4% | 24.7 -6% | 25.2 -9% |
| Idle Maximum * (dB) | 26.6 | 27.5 -3% | 23.6 11% | 25.1 6% | 26.4 1% | 27.7 -4% |
| Load Average * (dB) | 39.4 | 39.6 -1% | 29.2 26% | 44.2 -12% | 35.7 9% | |
| Cyberpunk 2077 ultra * (dB) | 47.3 | 52.7 -11% | 36.8 22% | 42.6 10% | ||
| Load Maximum * (dB) | 48.9 | 49.7 -2% | 32.1 34% | 52.7 -8% | 36.8 25% | 42.7 13% |
| Witcher 3 ultra * (dB) | 49.7 | 32.1 |
* ... Meglio usare valori piccoli
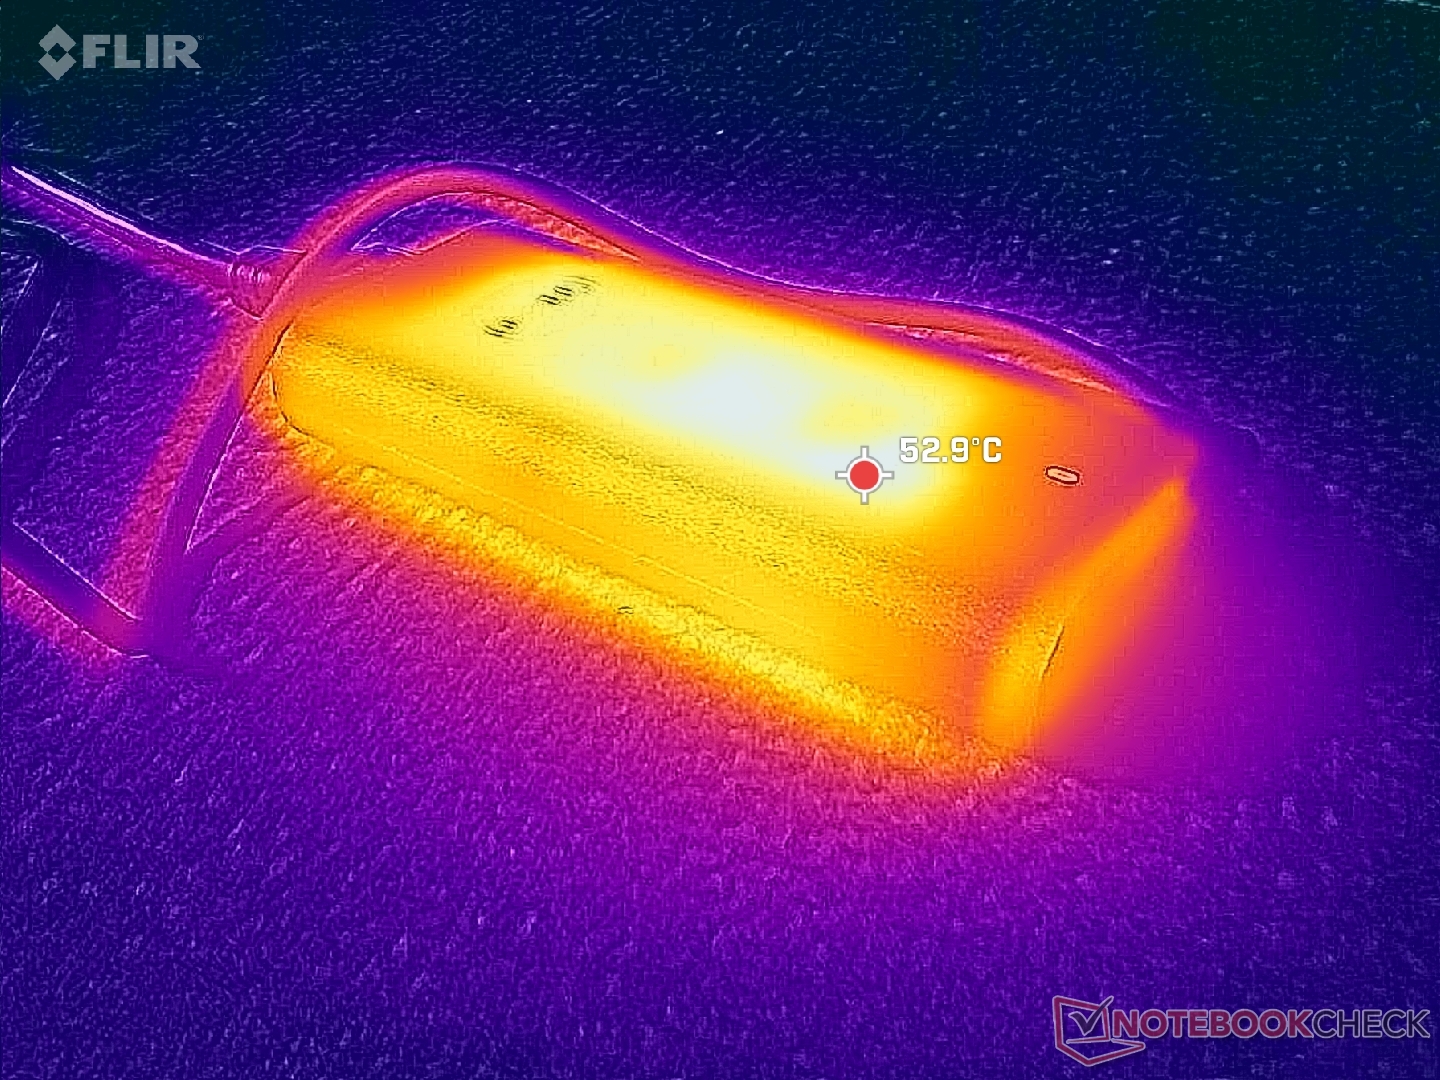
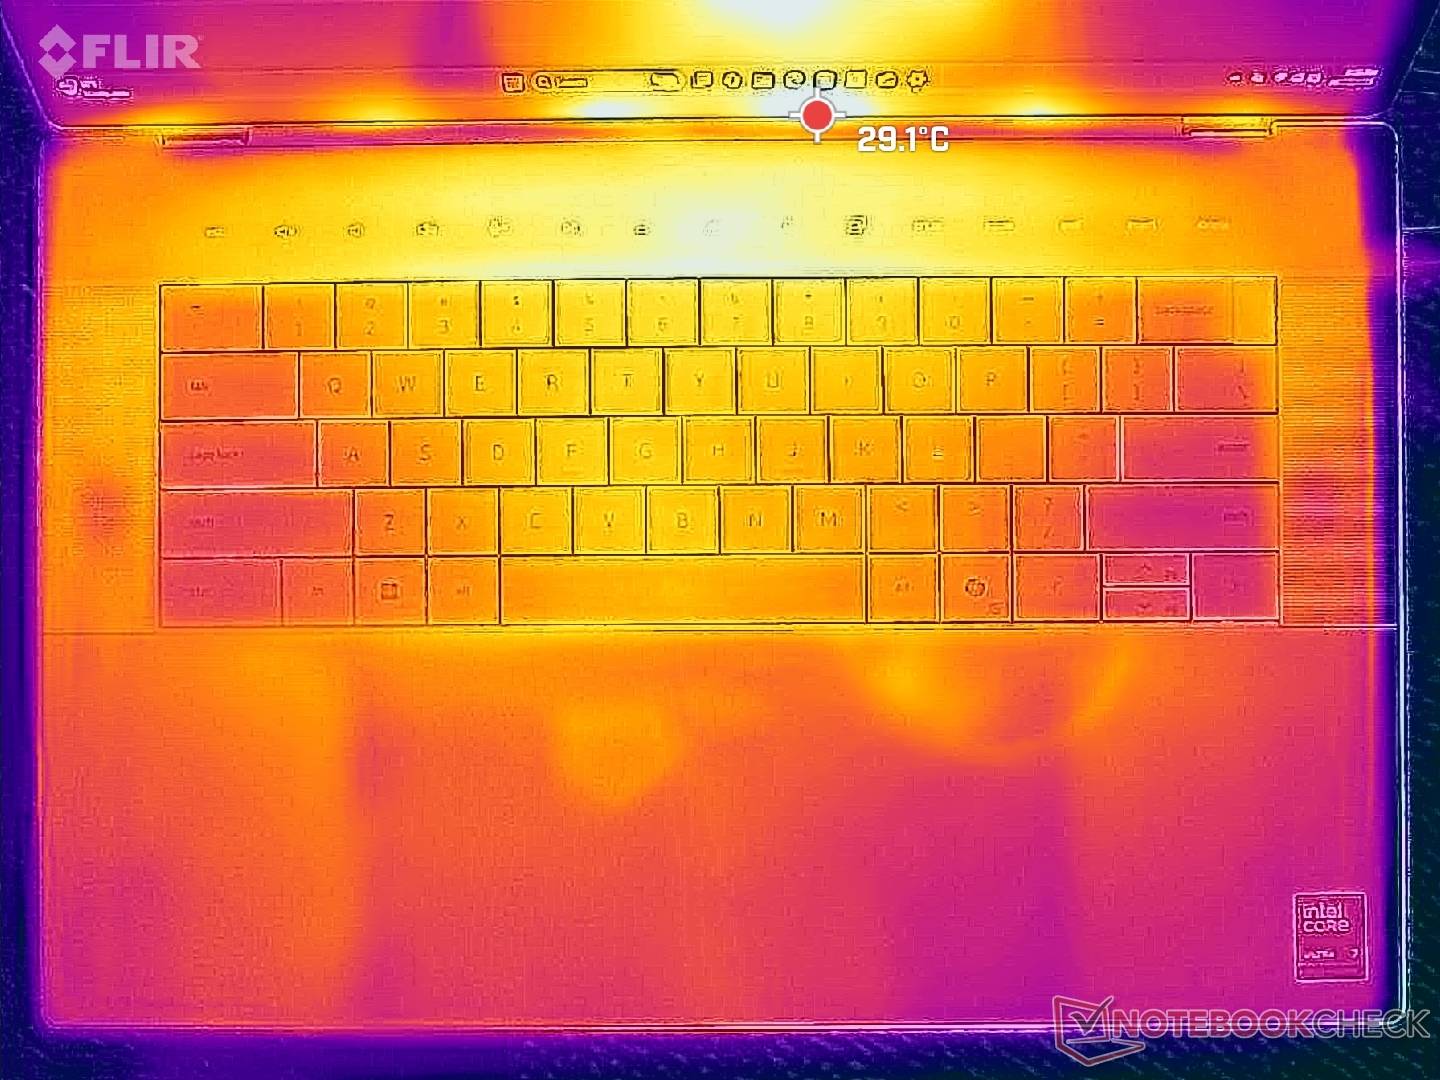
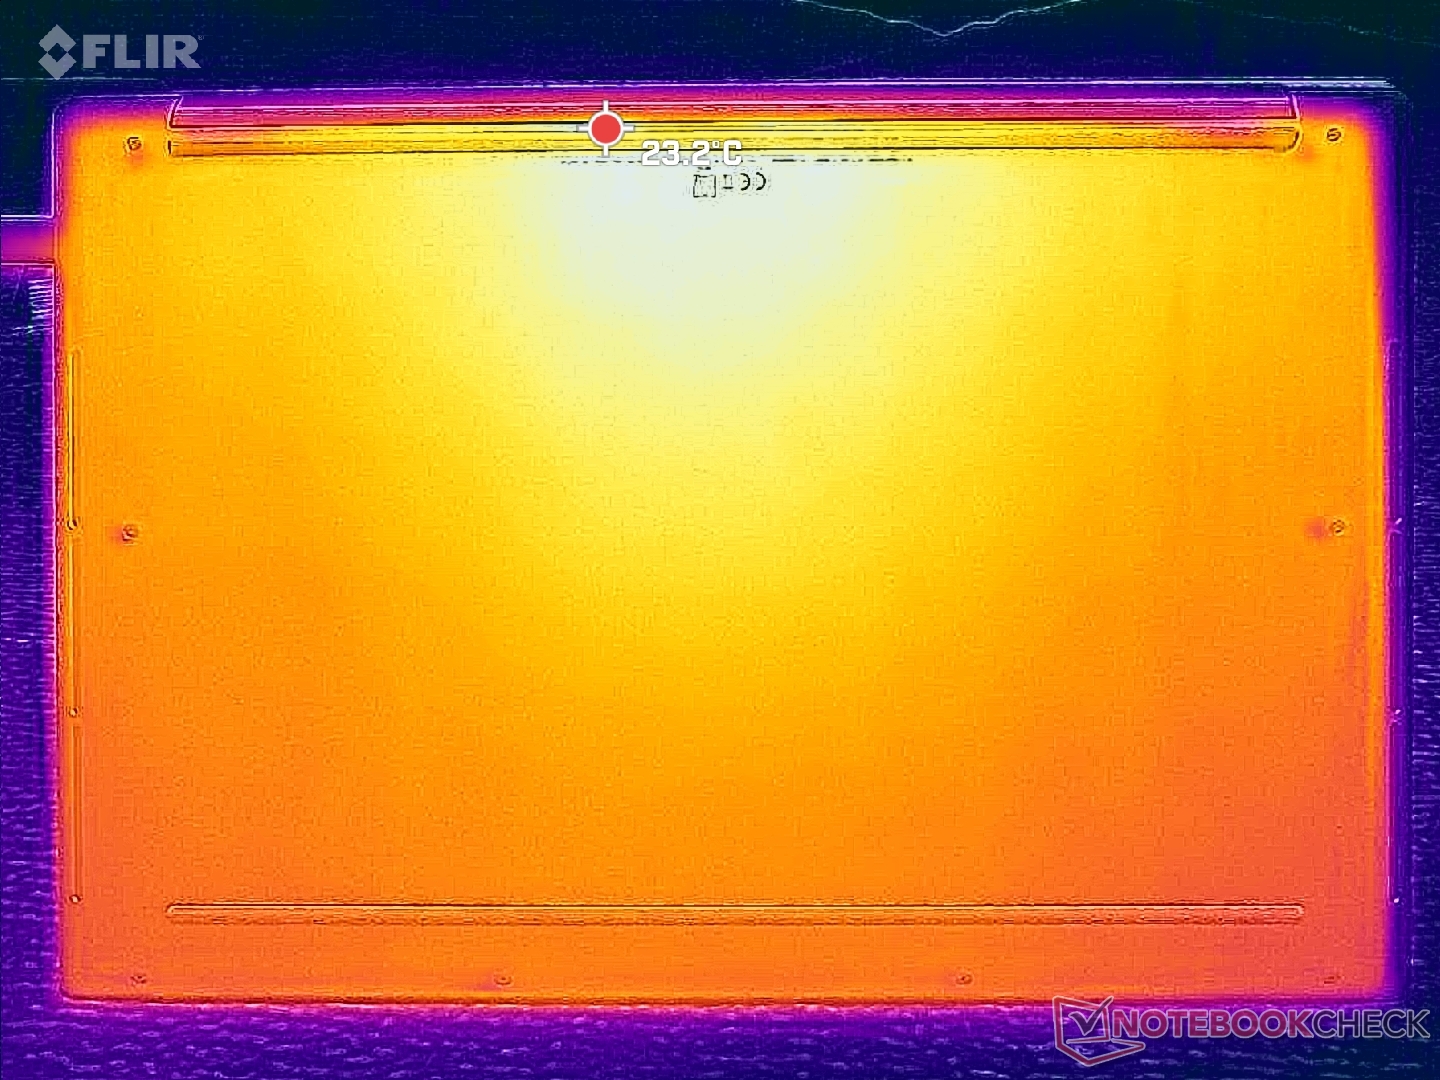
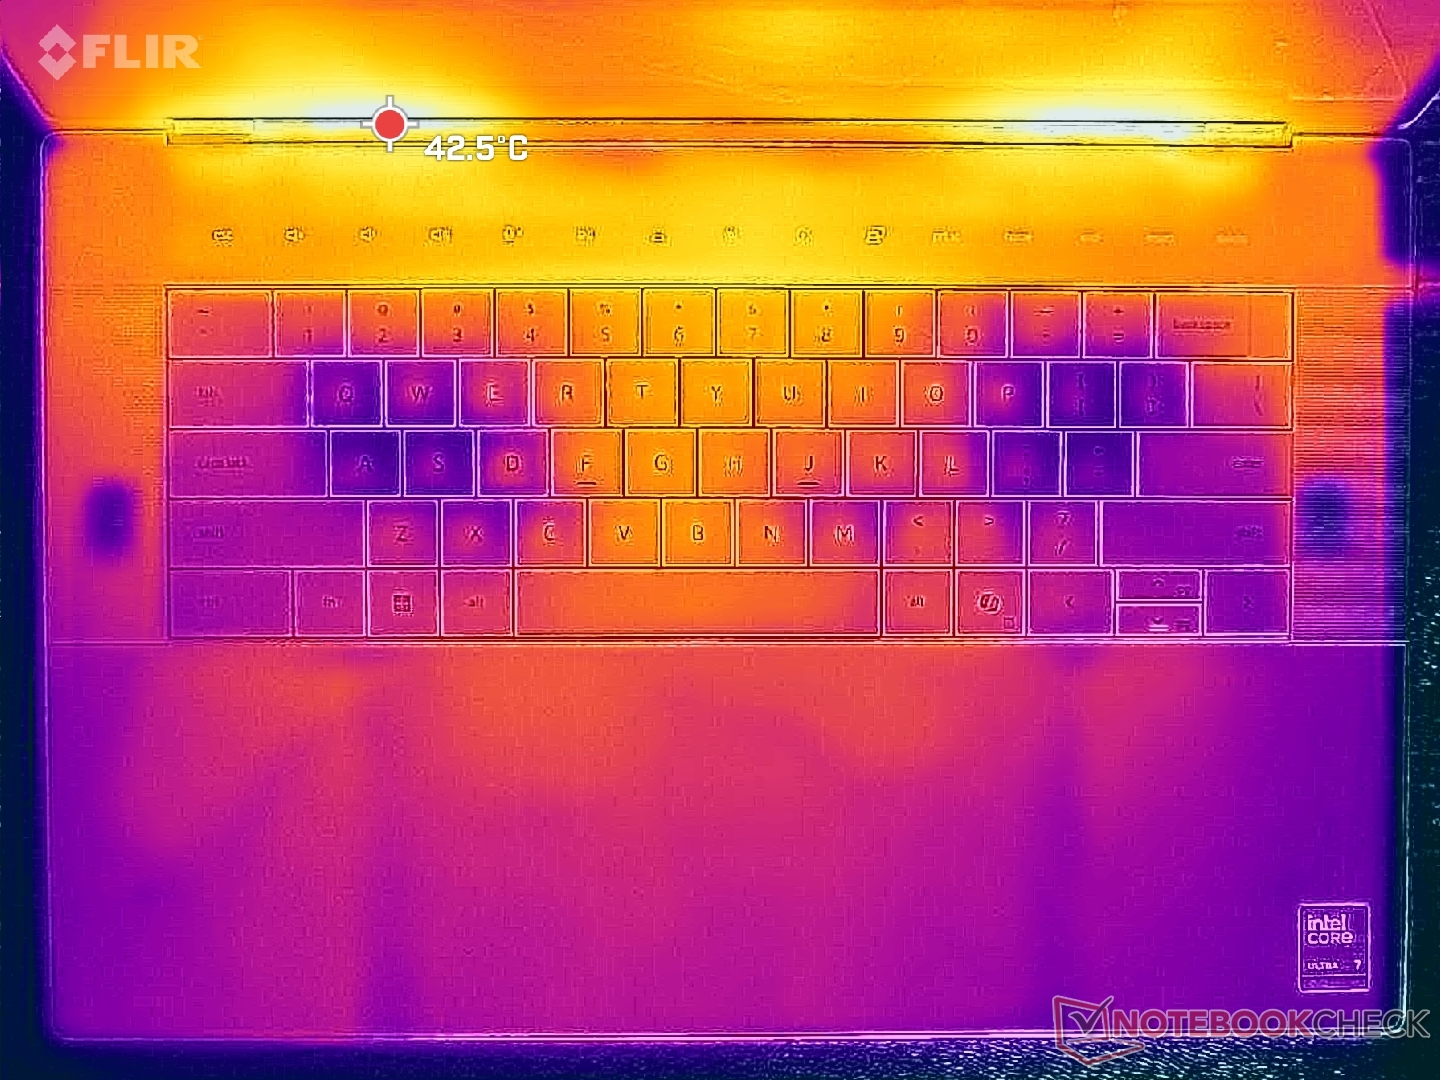
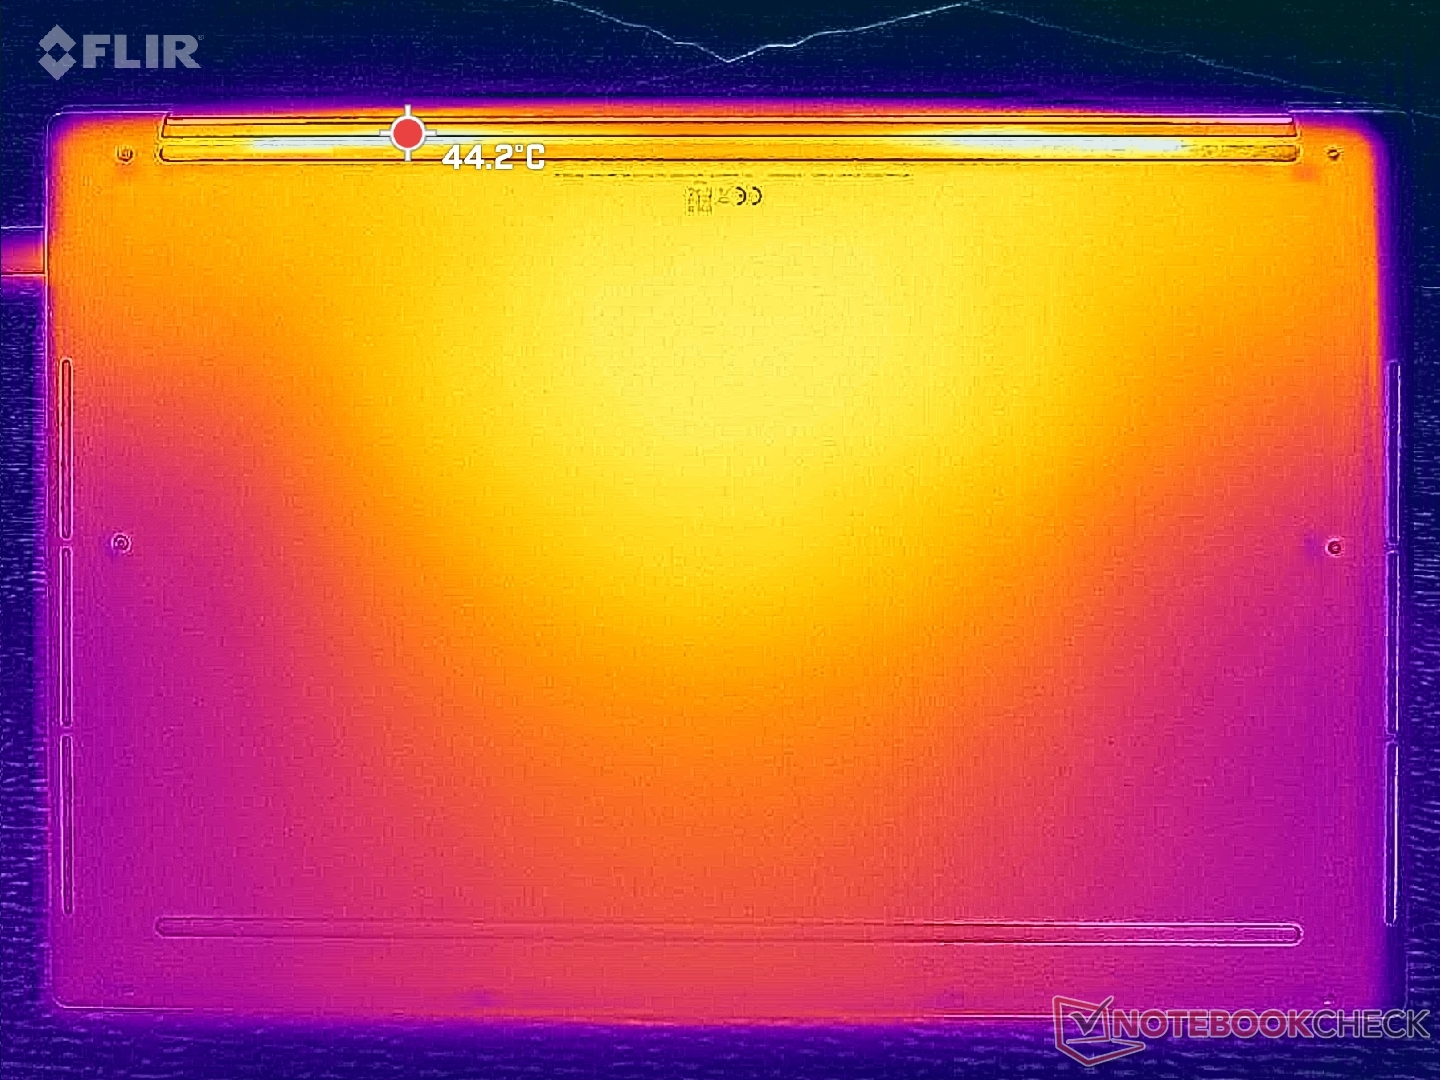
Temperatura
I punti caldi sul coperchio inferiore, vicino alle bocchette, possono raggiungere quasi 45 C quando si eseguono carichi impegnativi. Non possiamo fare a meno di chiederci se ulteriori fori di ventilazione avrebbero migliorato le temperature complessive, ma Dell sta chiaramente privilegiando un design visivo più pulito e privo di prese d'aria, come la serie MacBook.
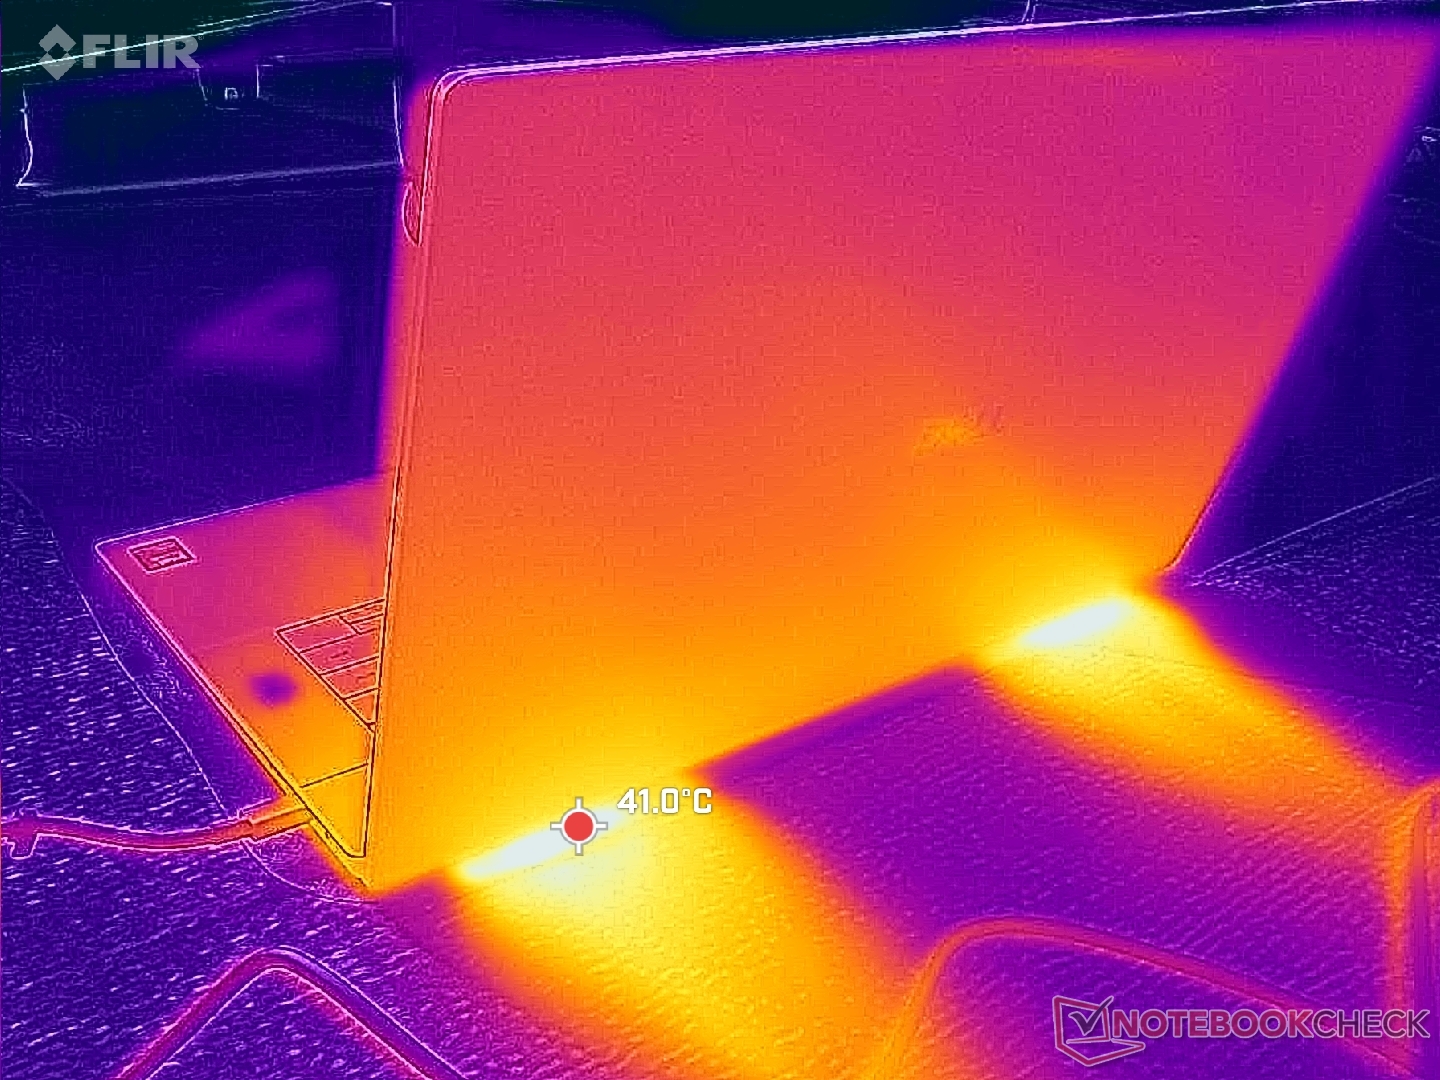
(+) La temperatura massima sul lato superiore è di 36.8 °C / 98 F, rispetto alla media di 36.8 °C / 98 F, che varia da 21 a 71 °C per questa classe Multimedia.
(+) Il lato inferiore si riscalda fino ad un massimo di 34.8 °C / 95 F, rispetto alla media di 39.1 °C / 102 F
(+) In idle, la temperatura media del lato superiore è di 28.7 °C / 84 F, rispetto alla media deld ispositivo di 31.3 °C / 88 F.
(+) I poggiapolsi e il touchpad sono piu' freddi della temperatura della pelle con un massimo di 28.6 °C / 83.5 F e sono quindi freddi al tatto.
(±) La temperatura media della zona del palmo della mano di dispositivi simili e'stata di 28.7 °C / 83.7 F (+0.1 °C / 0.2 F).
| Dell 16 Premium DA16250 Ultra 7 255H, GeForce RTX 5070 Laptop | Dell XPS 16 9640 Ultra 7 155H, GeForce RTX 4070 Laptop GPU | HP Spectre x360 16 RTX 4050 Ultra 7 155H, GeForce RTX 4050 Laptop GPU | Lenovo Yoga Pro 9i 16 RTX 5070 Ultra 9 285H, GeForce RTX 5070 Laptop | Asus Zenbook S 16 UM5606-RK333W Ryzen AI 9 HX 370, Radeon 890M | LG Gram Pro 16Z90TS-G.AU89G Core Ultra 7 256V, Arc 140V | |
|---|---|---|---|---|---|---|
| Heat | 2% | -4% | -7% | -19% | -5% | |
| Maximum Upper Side * (°C) | 36.8 | 39.4 -7% | 39.6 -8% | 41.8 -14% | 46.9 -27% | 40.5 -10% |
| Maximum Bottom * (°C) | 34.8 | 36.9 -6% | 39.2 -13% | 47.9 -38% | 53.5 -54% | 45 -29% |
| Idle Upper Side * (°C) | 31.2 | 28.2 10% | 29 7% | 26.3 16% | 29.5 5% | 27.1 13% |
| Idle Bottom * (°C) | 30.8 | 27.4 11% | 31.6 -3% | 27.6 10% | 30.2 2% | 28.8 6% |
* ... Meglio usare valori piccoli
Altoparlanti
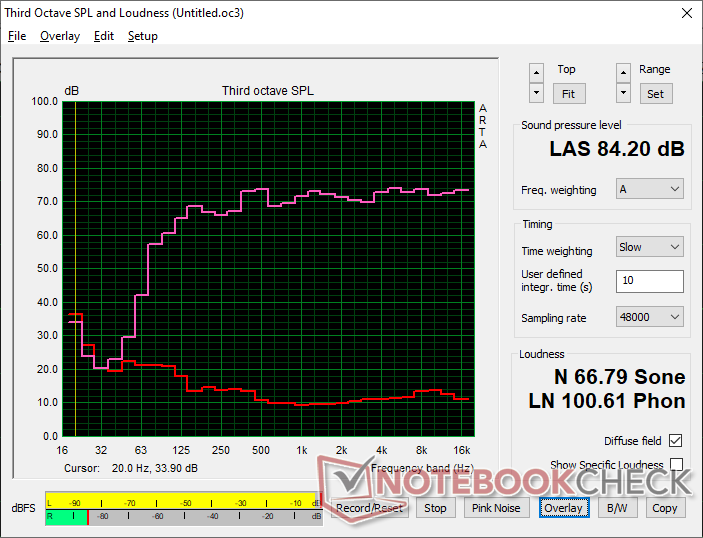
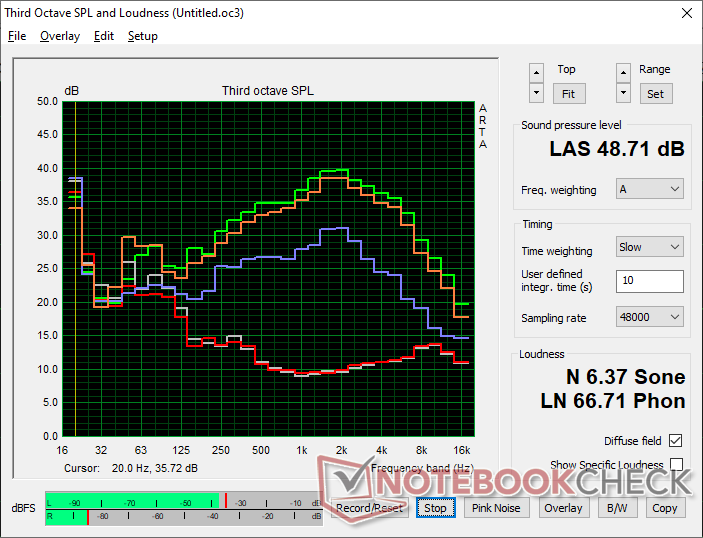
Dell 16 Premium DA16250 analisi audio
(+) | gli altoparlanti sono relativamente potenti (84.2 dB)
Bassi 100 - 315 Hz
(±) | bassi ridotti - in media 6.1% inferiori alla media
(+) | bassi in lineaa (4.2% delta rispetto alla precedente frequenza)
Medi 400 - 2000 Hz
(+) | medi bilanciati - solo only 1.4% rispetto alla media
(+) | medi lineari (3.6% delta rispetto alla precedente frequenza)
Alti 2 - 16 kHz
(+) | Alti bilanciati - appena 1.5% dalla media
(+) | alti lineari (2.2% delta rispetto alla precedente frequenza)
Nel complesso 100 - 16.000 Hz
(+) | suono nel complesso lineare (5.1% differenza dalla media)
Rispetto alla stessa classe
» 1% di tutti i dispositivi testati in questa classe è stato migliore, 0% simile, 99% peggiore
» Il migliore ha avuto un delta di 5%, medio di 17%, peggiore di 45%
Rispetto a tutti i dispositivi testati
» 0% di tutti i dispositivi testati in questa classe è stato migliore, 0% similare, 100% peggiore
» Il migliore ha avuto un delta di 4%, medio di 23%, peggiore di 134%
Apple MacBook Pro 16 2021 M1 Pro analisi audio
(+) | gli altoparlanti sono relativamente potenti (84.7 dB)
Bassi 100 - 315 Hz
(+) | bassi buoni - solo 3.8% dalla media
(+) | bassi in lineaa (5.2% delta rispetto alla precedente frequenza)
Medi 400 - 2000 Hz
(+) | medi bilanciati - solo only 1.3% rispetto alla media
(+) | medi lineari (2.1% delta rispetto alla precedente frequenza)
Alti 2 - 16 kHz
(+) | Alti bilanciati - appena 1.9% dalla media
(+) | alti lineari (2.7% delta rispetto alla precedente frequenza)
Nel complesso 100 - 16.000 Hz
(+) | suono nel complesso lineare (4.6% differenza dalla media)
Rispetto alla stessa classe
» 0% di tutti i dispositivi testati in questa classe è stato migliore, 0% simile, 100% peggiore
» Il migliore ha avuto un delta di 5%, medio di 17%, peggiore di 45%
Rispetto a tutti i dispositivi testati
» 0% di tutti i dispositivi testati in questa classe è stato migliore, 0% similare, 100% peggiore
» Il migliore ha avuto un delta di 4%, medio di 23%, peggiore di 134%
Gestione dell'energia
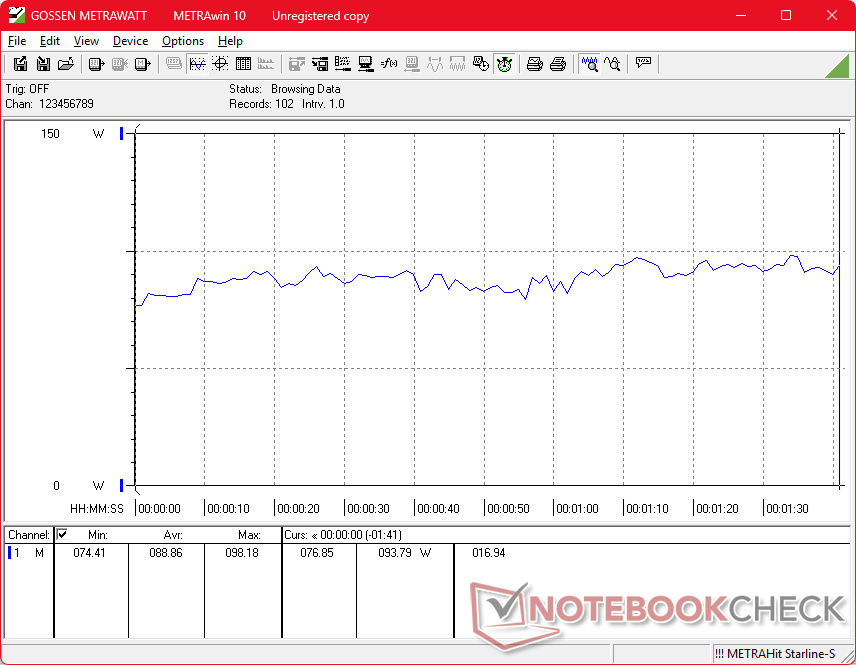
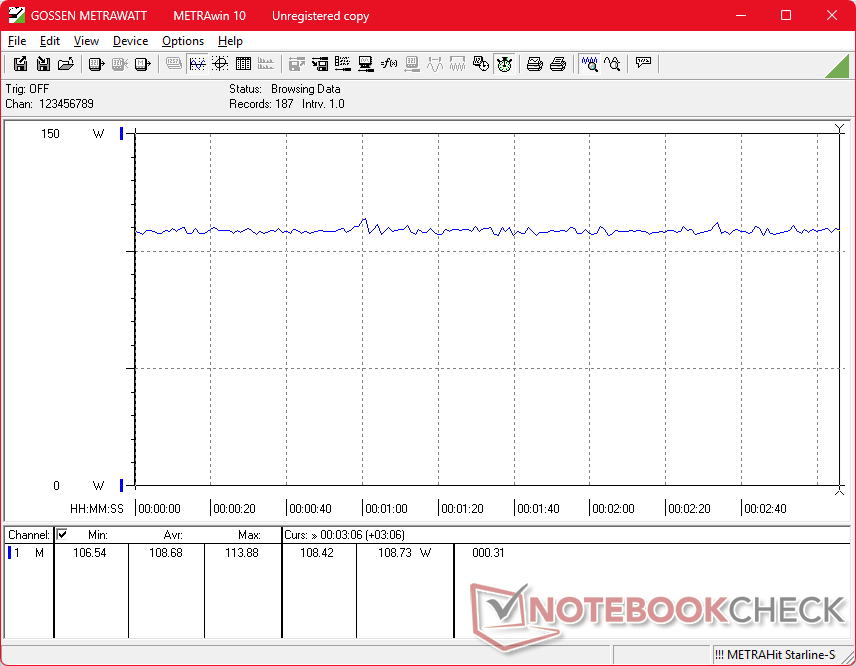
Consumo di energia
Il funzionamento al minimo sul desktop può assorbire fino a 6 W in modalità Risparmio energetico con l'iGPU attiva o fino a 33 W in modalità Prestazioni con la dGPU attiva e lo schermo OLED che visualizza prevalentemente colori bianchi (ad esempio durante la navigazione). Il consumo quando si eseguono carichi più impegnativi è altrimenti simile al modello dello scorso anno, se non leggermente inferiore per una migliore prestazione per watt, soprattutto perché Dell 16 Premium viene fornito con lo stesso adattatore CA USB-C da 130 W (~12,8 x 5,5 x 2,3 cm) di prima.
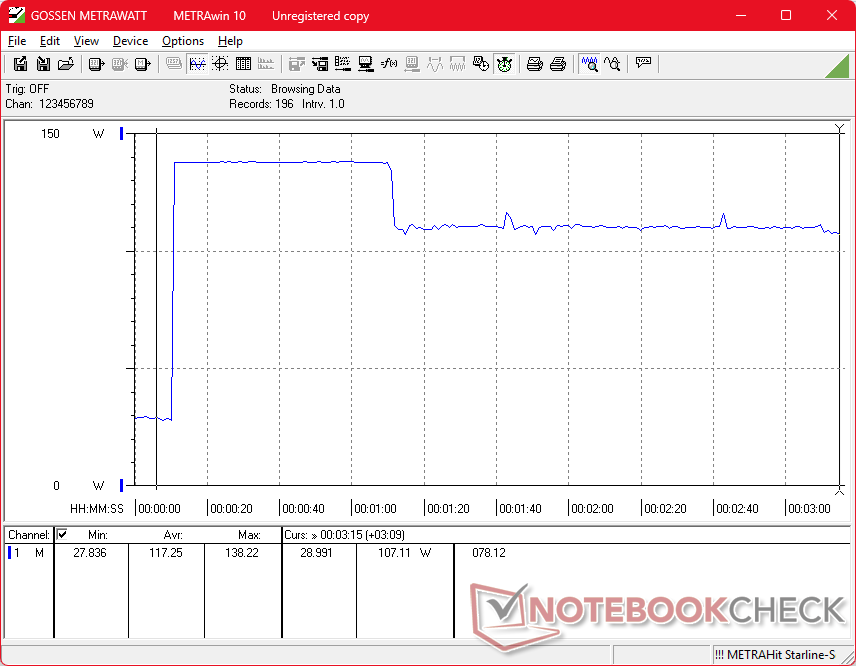
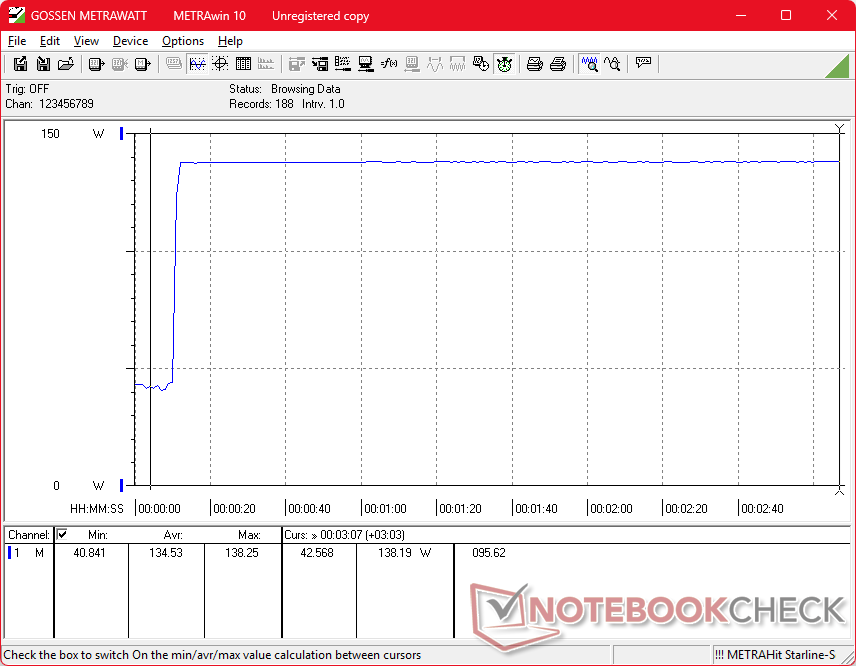
Si noti che il consumo energetico è più elevato all'inizio del test di stress Prime95, quando il potenziale Turbo Boost è massimo.
| Off / Standby | |
| Idle | |
| Sotto carico |
|
Leggenda:
min: | |
| Dell 16 Premium DA16250 Ultra 7 255H, GeForce RTX 5070 Laptop, Kioxia BG6 KBG6AZNV1T02, OLED, 3840x2400, 16.3" | Dell XPS 16 9640 Ultra 7 155H, GeForce RTX 4070 Laptop GPU, Kioxia XG8 KXG80ZNV1T02, OLED, 3840x2400, 16.3" | HP Spectre x360 16 RTX 4050 Ultra 7 155H, GeForce RTX 4050 Laptop GPU, SK hynix PC801 HFS001TEJ9X101N, OLED, 2880x1800, 16" | Lenovo Yoga Pro 9i 16 RTX 5070 Ultra 9 285H, GeForce RTX 5070 Laptop, WD PC SN7100S SDFPMSL-1T00-1101, OLED, 3200x2000, 16" | Asus Zenbook S 16 UM5606-RK333W Ryzen AI 9 HX 370, Radeon 890M, Micron 2400 MTFDKBA1T0QFM, OLED, 2880x1800, 16" | LG Gram Pro 16Z90TS-G.AU89G Core Ultra 7 256V, Arc 140V, Samsung PM9A1a MZVL21T0HDLU, IPS, 2560x1600, 16" | |
|---|---|---|---|---|---|---|
| Power Consumption | 7% | -5% | -29% | 39% | 50% | |
| Idle Minimum * (Watt) | 6.5 | 7.7 -18% | 5.8 11% | 8.8 -35% | 5.4 17% | 4.15 36% |
| Idle Average * (Watt) | 8.1 | 10.3 -27% | 12.3 -52% | 16.1 -99% | 10.5 -30% | 5.4 33% |
| Idle Maximum * (Watt) | 33 | 10.6 68% | 33.9 -3% | 16.5 50% | 10.9 67% | 12.4 62% |
| Load Average * (Watt) | 88.9 | 76.5 14% | 83.3 6% | 89.3 -0% | 47.8 46% | |
| Cyberpunk 2077 ultra external monitor * (Watt) | 108.9 | 157.9 -45% | 46.7 57% | 48.1 56% | ||
| Cyberpunk 2077 ultra * (Watt) | 108.7 | 160.6 -48% | 49.2 55% | 48.2 56% | ||
| Load Maximum * (Watt) | 138.3 | 138.5 -0% | 120.8 13% | 177.4 -28% | 58.6 58% | 60.049 57% |
| Witcher 3 ultra * (Watt) | 126.4 | 89.1 |
* ... Meglio usare valori piccoli
Consumo di energia Cyberpunk / Stress Test
Consumo di energia del monitor esterno
Durata della batteria
I tempi di esecuzione sono più o meno gli stessi di prima, nonostante gli aggiornamenti del processore e la frequenza di aggiornamento più veloce a 120 Hz.
| Dell 16 Premium DA16250 Ultra 7 255H, GeForce RTX 5070 Laptop, 99.5 Wh | Dell XPS 16 9640 Ultra 7 155H, GeForce RTX 4070 Laptop GPU, 99.5 Wh | HP Spectre x360 16 RTX 4050 Ultra 7 155H, GeForce RTX 4050 Laptop GPU, 83 Wh | Lenovo Yoga Pro 9i 16 RTX 5070 Ultra 9 285H, GeForce RTX 5070 Laptop, 84 Wh | Asus Zenbook S 16 UM5606-RK333W Ryzen AI 9 HX 370, Radeon 890M, 78 Wh | LG Gram Pro 16Z90TS-G.AU89G Core Ultra 7 256V, Arc 140V, 77 Wh | |
|---|---|---|---|---|---|---|
| Autonomia della batteria | -5% | 0% | 1% | -3% | 78% | |
| WiFi v1.3 (h) | 11 | 10.5 -5% | 11 0% | 11.1 1% | 10.7 -3% | 19.6 78% |
| H.264 (h) | 16.5 | 14.4 | 20.1 | |||
| Load (h) | 1.5 | 1.8 |
Valutazione Notebookcheck
Dell 16 Premium offre la stessa esperienza d'uso di XPS 16 9640, ma con processori più veloci ed efficienti e un display OLED a 120 Hz.
Dell 16 Premium DA16250
- 10/31/2025 v8
Allen Ngo
 Total Sustainability Score:
 Potenziali concorrenti a confronto
Immagine | Modello | Prezzo | Peso | Altezza | Schermo |
|---|---|---|---|---|---|
1. 87.9%  | Dell 16 Premium DA16250 Intel Core Ultra 7 255H ⎘ NVIDIA GeForce RTX 5070 Laptop ⎘ 32 GB Memoria, 1024 GB SSD | Amazon: Prezzo di listino: 3300 USD | 2.3 kg | 18.7 mm | 16.30" 3840x2400 278 PPI OLED |
2. 88.6% v7 (old)  | Dell XPS 16 9640 Intel Core Ultra 7 155H ⎘ NVIDIA GeForce RTX 4070 Laptop GPU ⎘ 32 GB Memoria, 1024 GB SSD | Amazon: 1. $2,199.00 New XPS 16 9640 Business Lap... 2. $2,499.00 Dell XPS 16 9640 16.3" Touch... 3. $2,199.00 New XPS 16 9640 Powerful AI ... | 2.3 kg | 18.7 mm | 16.30" 3840x2400 139 PPI OLED |
3. 91.1% v7 (old) 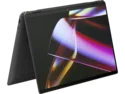 | HP Spectre x360 16 RTX 4050 Intel Core Ultra 7 155H ⎘ NVIDIA GeForce RTX 4050 Laptop GPU ⎘ 16 GB Memoria, 1024 GB SSD | Amazon: Prezzo di listino: 1600 USD | 2 kg | 19.8 mm | 16.00" 2880x1800 212 PPI OLED |
4. 90.4%  | Lenovo Yoga Pro 9i 16 RTX 5070 Intel Core Ultra 9 285H ⎘ NVIDIA GeForce RTX 5070 Laptop ⎘ 64 GB Memoria, 1024 GB SSD | Amazon: Prezzo di listino: 2800€ | 1.9 kg | 17.9 mm | 16.00" 3200x2000 236 PPI OLED |
5. 84.7%  | Asus Zenbook S 16 UM5606-RK333W AMD Ryzen AI 9 HX 370 ⎘ AMD Radeon 890M ⎘ 32 GB Memoria, 1024 GB SSD | Amazon: Prezzo di listino: 2100€ | 1.5 kg | 12.9 mm | 16.00" 2880x1800 212 PPI OLED |
6. 83.9%  | LG Gram Pro 16Z90TS-G.AU89G Intel Core Ultra 7 256V ⎘ Intel Arc Graphics 140V ⎘ 16 GB Memoria, 1024 GB SSD | Amazon: Prezzo di listino: 2050€ | 1.2 kg | 13 mm | 16.00" 2560x1600 189 PPI IPS |
Transparency
La selezione dei dispositivi da recensire viene effettuata dalla nostra redazione. Il campione di prova è stato fornito all'autore come prestito dal produttore o dal rivenditore ai fini di questa recensione. L'istituto di credito non ha avuto alcuna influenza su questa recensione, né il produttore ne ha ricevuto una copia prima della pubblicazione. Non vi era alcun obbligo di pubblicare questa recensione. In quanto società mediatica indipendente, Notebookcheck non è soggetta all'autorità di produttori, rivenditori o editori.
Ecco come Notebookcheck esegue i test
Ogni anno, Notebookcheck esamina in modo indipendente centinaia di laptop e smartphone utilizzando procedure standardizzate per garantire che tutti i risultati siano comparabili. Da circa 20 anni sviluppiamo continuamente i nostri metodi di prova e nel frattempo stabiliamo gli standard di settore. Nei nostri laboratori di prova, tecnici ed editori esperti utilizzano apparecchiature di misurazione di alta qualità. Questi test comportano un processo di validazione in più fasi. Il nostro complesso sistema di valutazione si basa su centinaia di misurazioni e parametri di riferimento ben fondati, che mantengono l'obiettività.
