Verdetto - Uno dei migliori convertibili da 16 pollici a 1.000 dollari
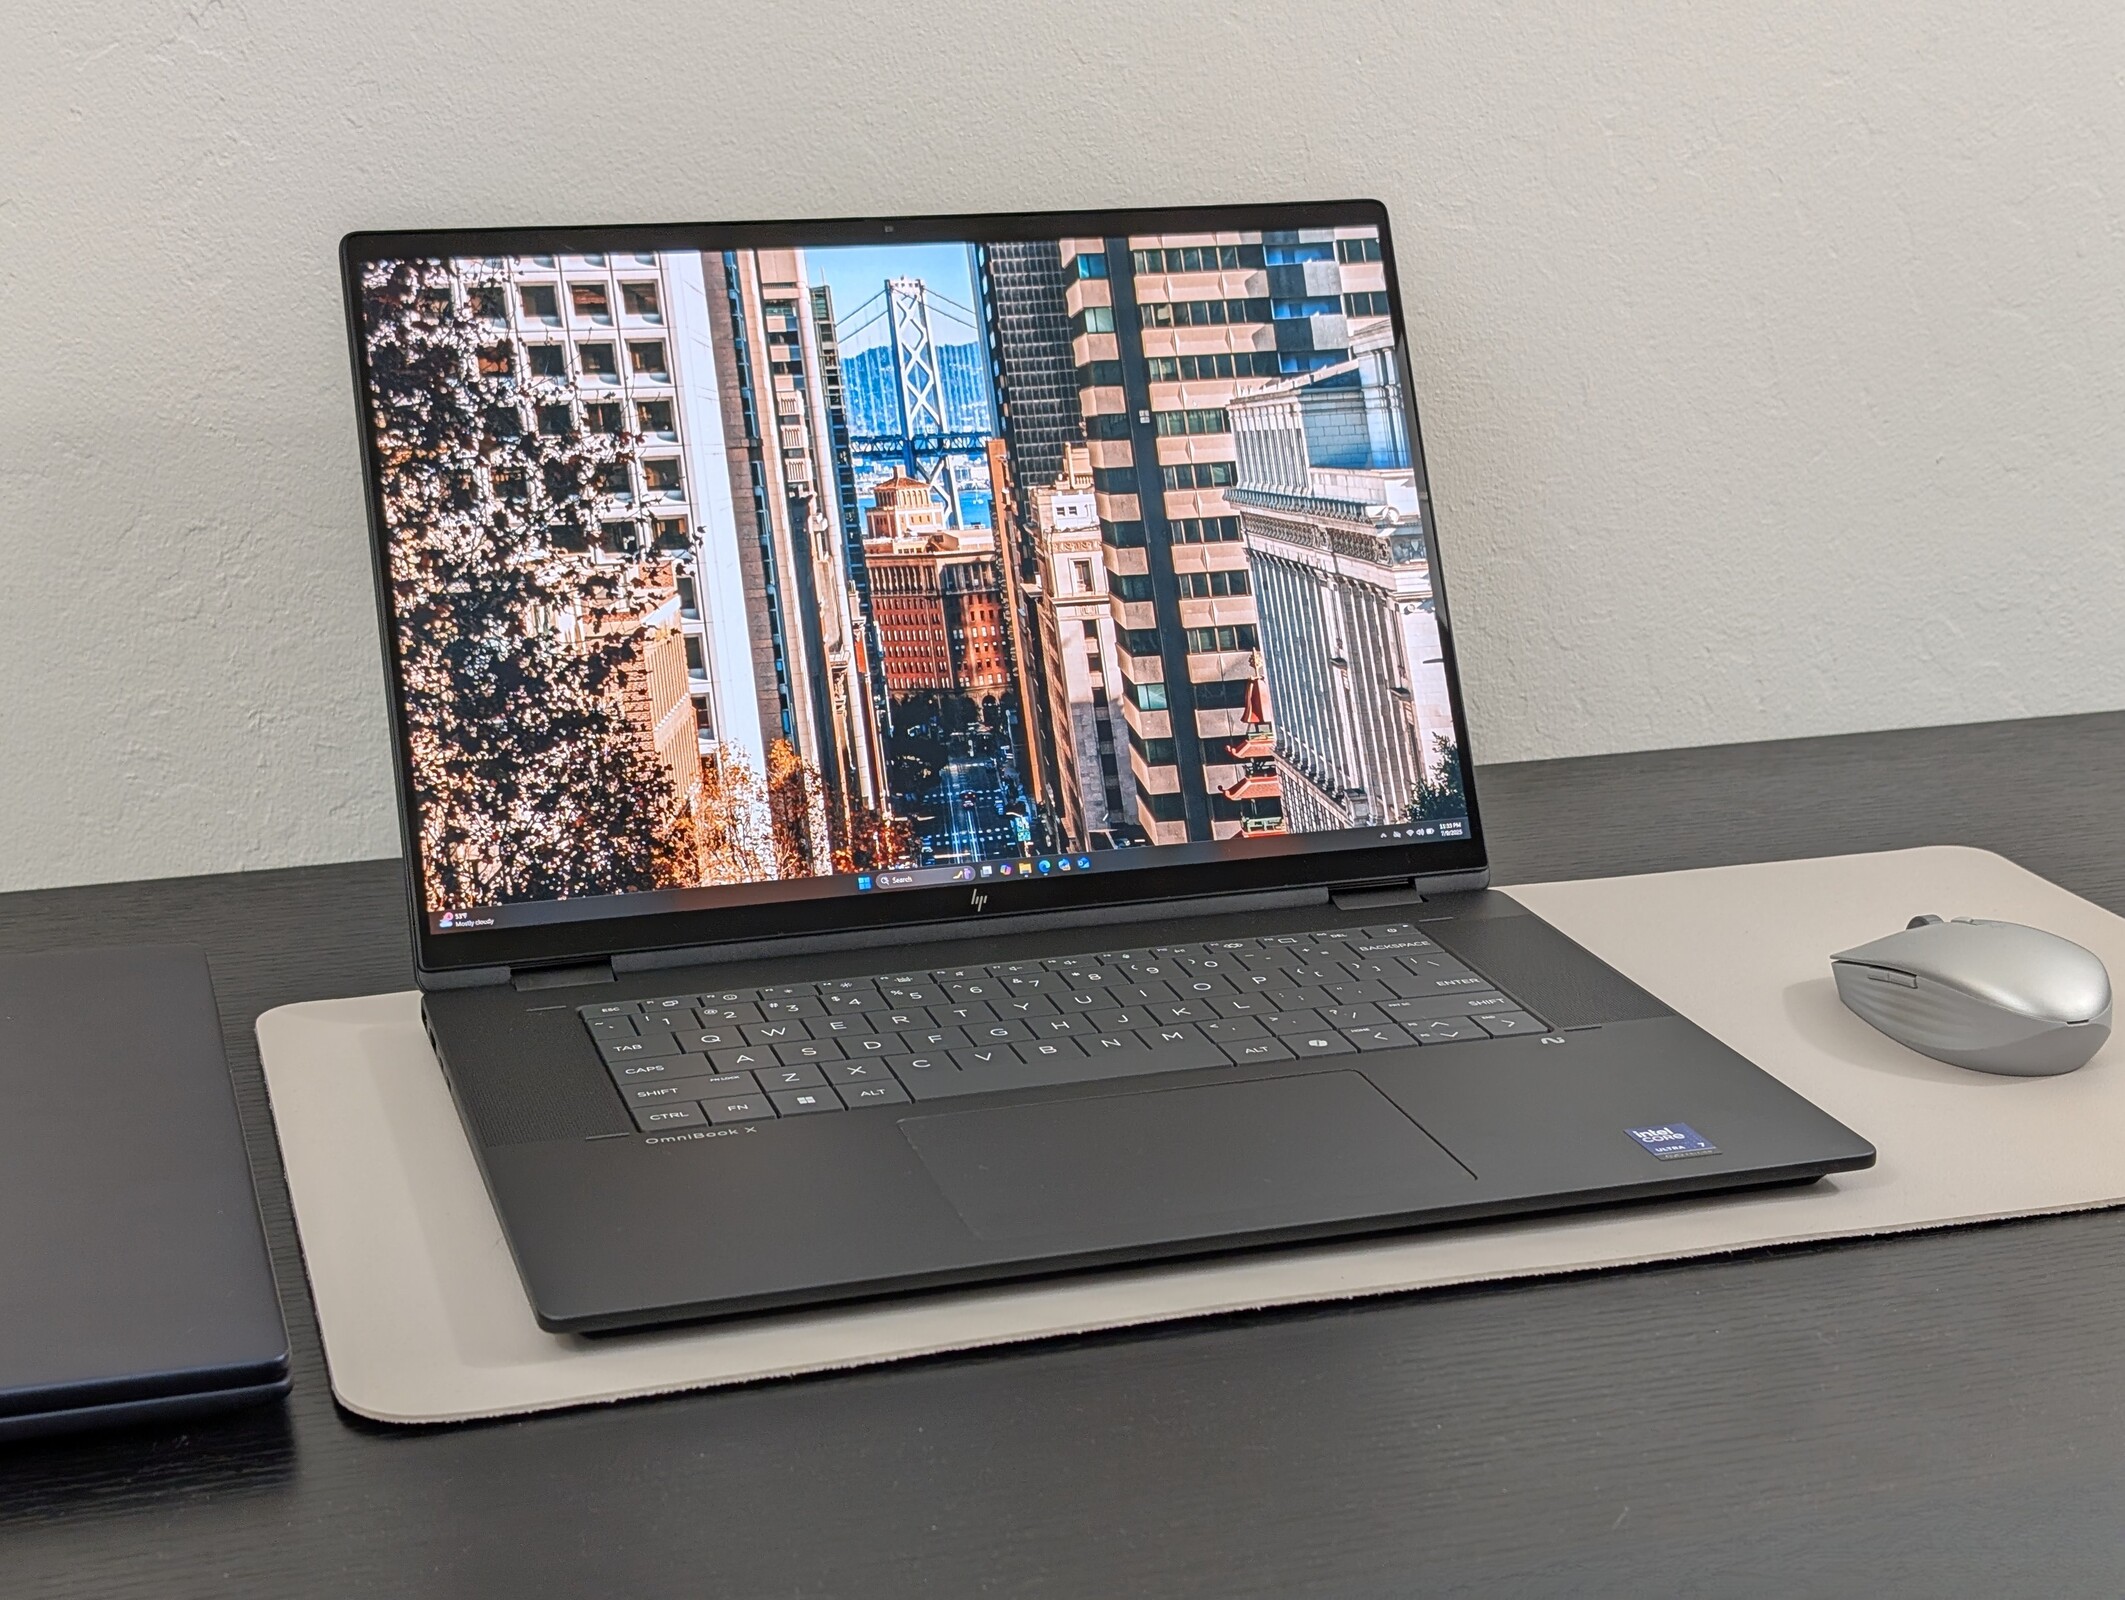
OmniBook X Flip 16 ha più punti in comune con la serie ammiraglia Spectre che con la serie meno costosa Pavilion. Il suo design in metallo liscio, il touchscreen OLED e il moderno processore Lunar Lake bilanciano molto bene la portabilità e la praticità, soprattutto se confrontato con il concorrente Dell 16 Plus 2-in-1 che sembra più economico in confronto. Il suo fattore di forma e i suoi colori OLED sono adatti a tutti i tipi di ambienti, dalla multimedialità domestica all'editing in movimento - in linea con il moniker "omni".
Alcuni utenti potrebbero non apprezzare la diversa sensazione della tastiera rispetto alla maggior parte degli altri computer portatili HP e quindi l'esperienza di digitazione potrebbe richiedere un po' di tempo per abituarsi. Inoltre, le prestazioni grezze saranno più lente rispetto a molti clamshell da 16 pollici, come l'Envy 16 di HP, che di solito sono dotati di processori serie H e grafica discreta. Gli utenti più esigenti potrebbero prendere in considerazione il modello Spectre x360 serie 16 per avere una maggiore potenza di editing e di gioco. Per tutti gli altri, OmniBook X Flip 16 è uno dei migliori e più versatili convertibili da 16 pollici nella fascia bassa dei 1000 dollari.
Pro
Contro
Prezzo e disponibilità
Amazon sta attualmente spedendo l'OmniBook X Flip 16 al prezzo di 1300 dollari, come configurato sulla nostra unità di recensione Core Ultra 7 258V. In alternativa, gli utenti possono acquistare direttamente da HP a soli 950 dollari quando è in offerta.
Sommario
- Verdetto - Uno dei migliori convertibili da 16 pollici a 1.000 dollari
- Specifiche
- Custodia - Più elegante di un Dell
- Connettività
- Dispositivi di ingresso
- Display - OLED 3K 120 Hz
- Prestazioni - Efficienza del Lago Lunare
- Emissioni
- Gestione dell'energia
- Valutazione Notebookcheck
- Potential Competitors in Comparison
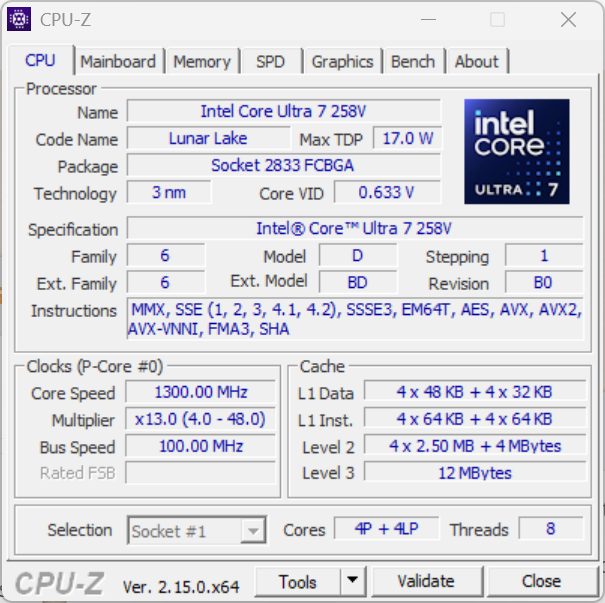
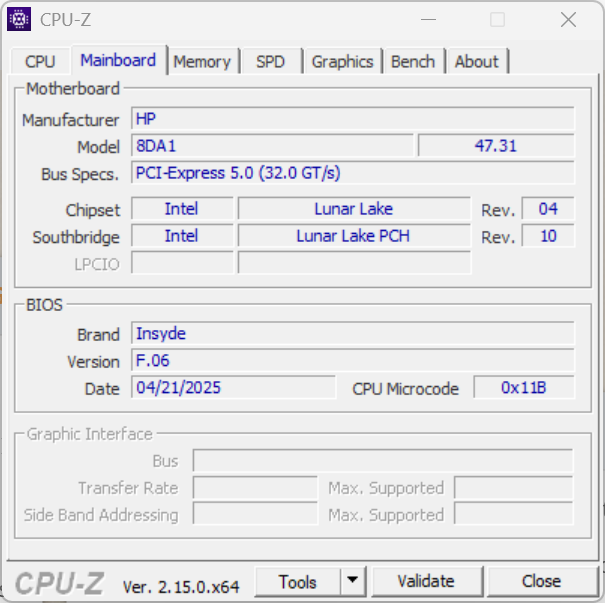
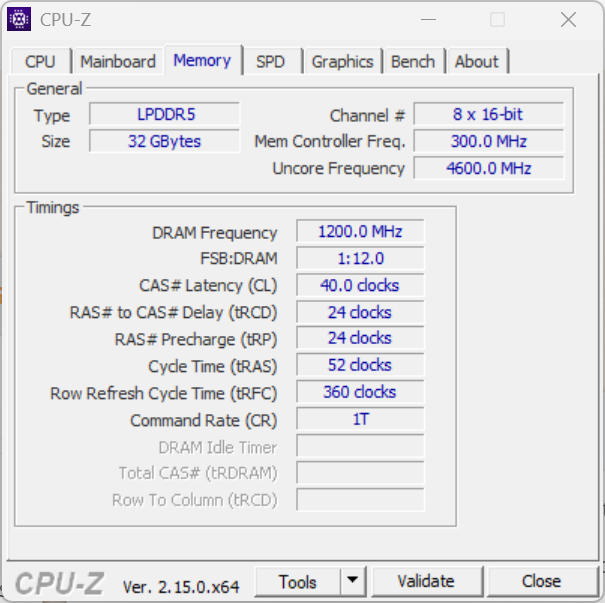
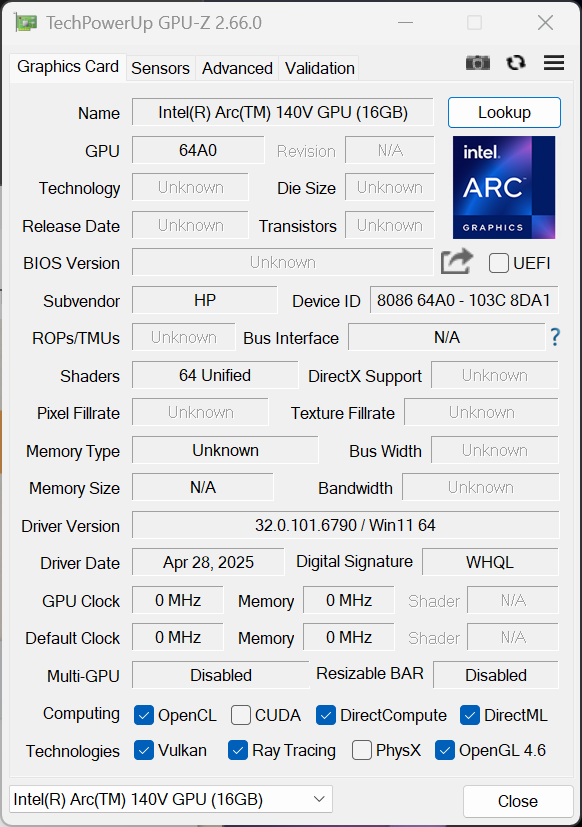
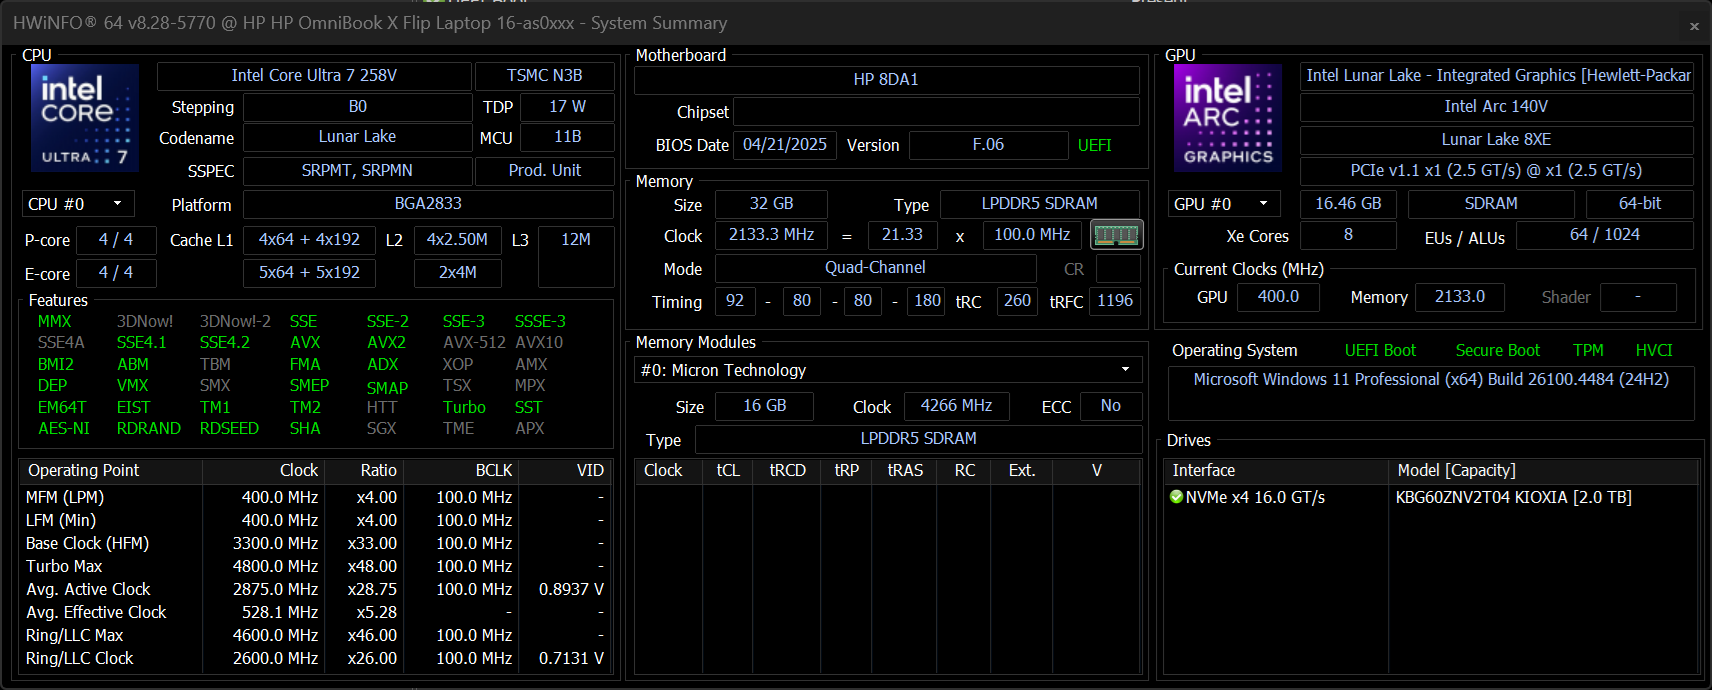
L'HP OmniBook X Flip 16 è un convertibile prosumer da 16 pollici che si colloca appena sotto la serie Spectre x360 16 Serie Spectre x360 16 in termini di prezzo e caratteristiche. La nostra unità di prova è una configurazione di fascia alta con CPU Intel Core Ultra 7 258V Lunar Lake e schermo touchscreen OLED 3K 120 Hz, al prezzo di circa 1300 dollari o poco meno di 1000 dollari quando è in vendita.
È disponibile anche una variante AMD del modello con Ryzen AI 5 340 e schermo touchscreen a 1200p a risoluzione inferiore per circa 700 dollari. Tuttavia, tutte le configurazioni Intel al momento sono dotate di touchscreen OLED da 1800p 120 Hz.
I concorrenti in questo spazio includono altri convertibili prosumer da 16 pollici, come il modello Lenovo Yoga 7 2-in-1 16, Samsung Galaxy Book5 Pro 360o Dell 16 Plus 2-in-1.
Altre recensioni di HP:
Specifiche
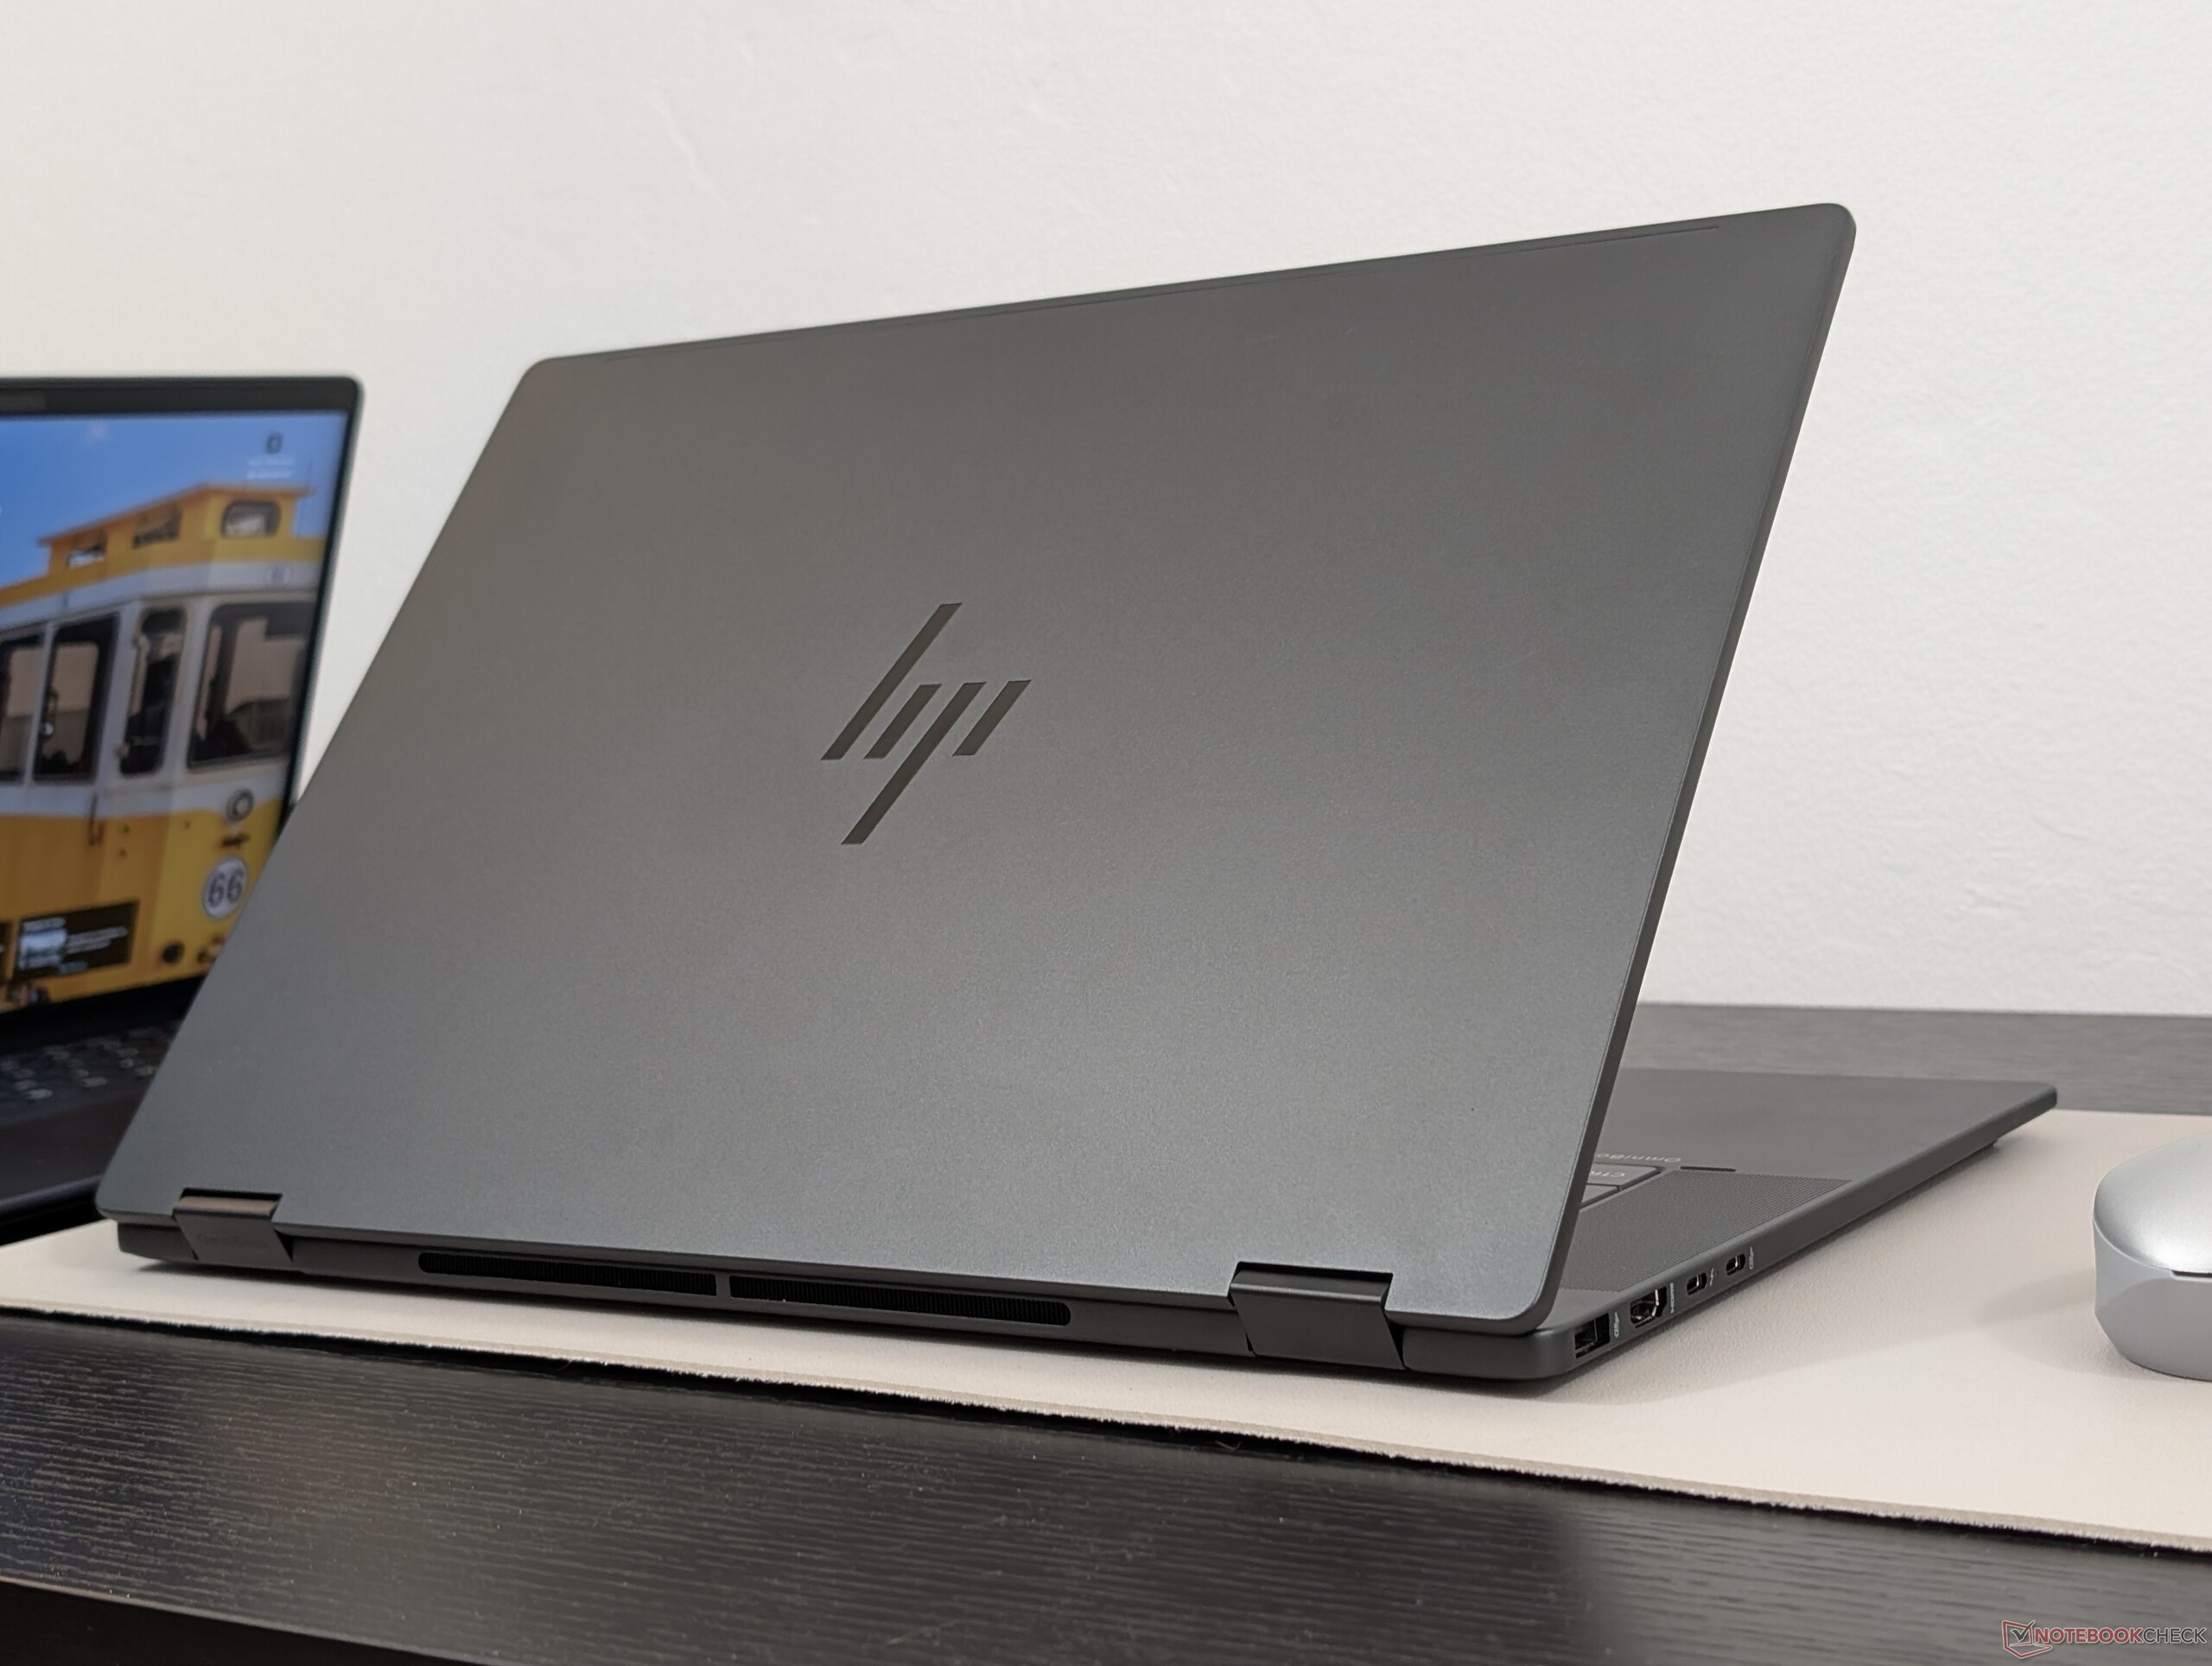
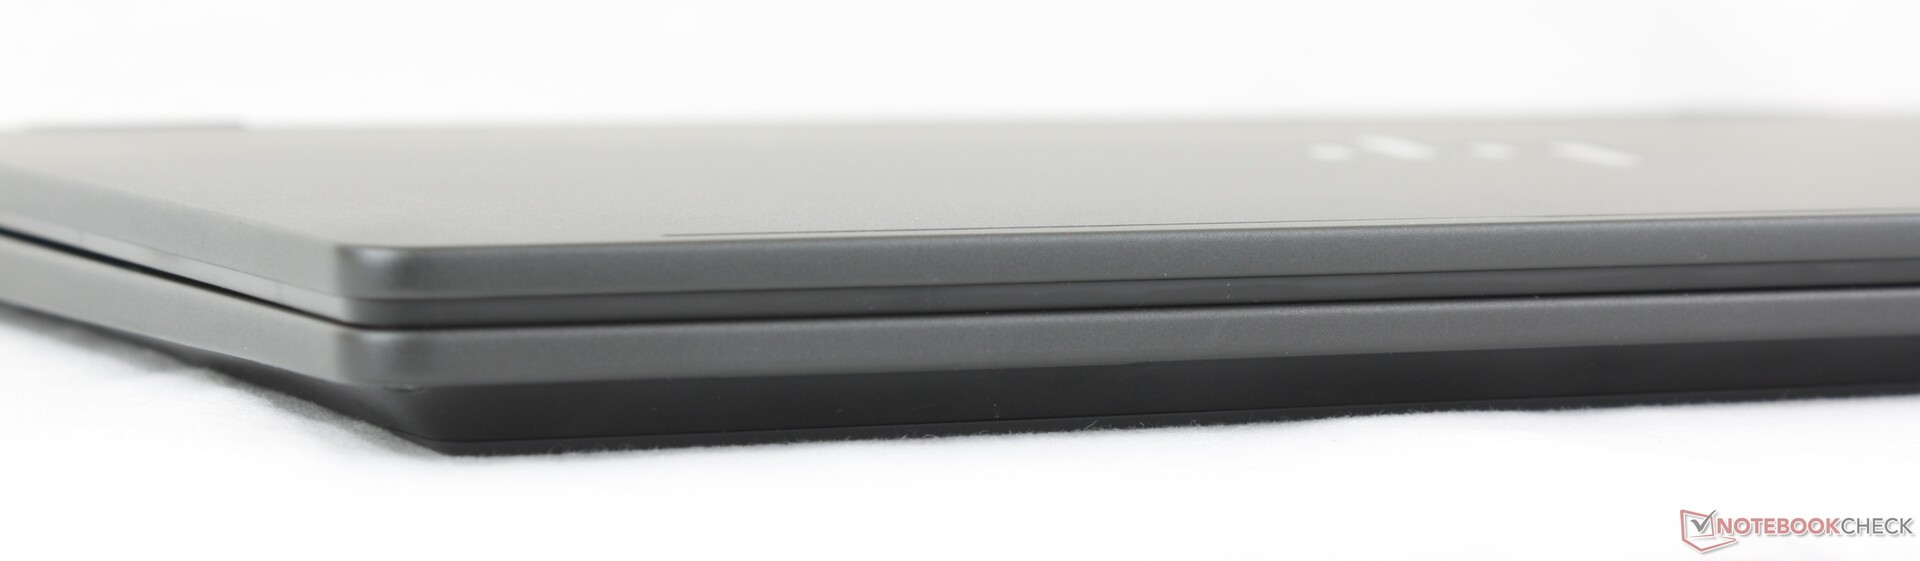
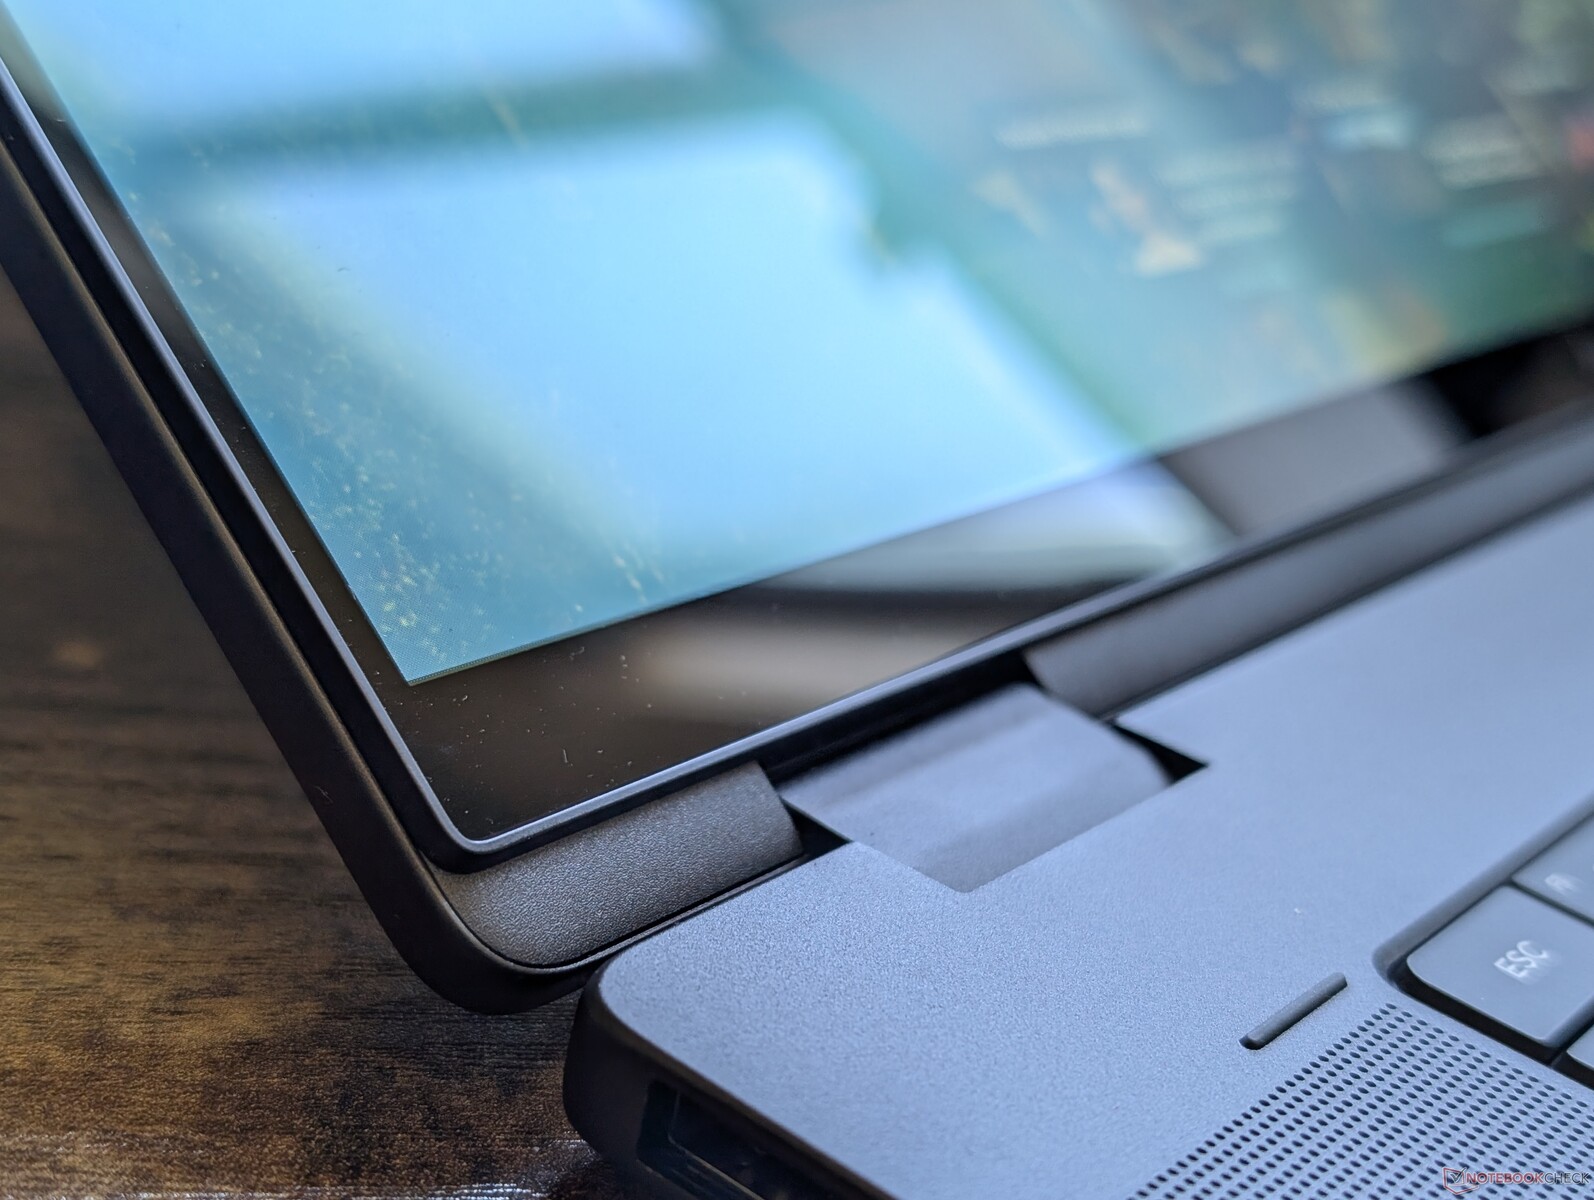
Custodia - Più elegante di un Dell
Il design in metallo opaco unicolore sembra più solido e lussuoso rispetto al Dell 16 Plus 2-in-1 dal prezzo simile. Si flette ancora un po' di più rispetto al più costoso Spectre x360 16, mentre gli utenti che sono disposti a spendere centinaia di dollari in più troveranno il modello Samsung Galaxy Book5 Pro 360 un'alternativa notevolmente più leggera.
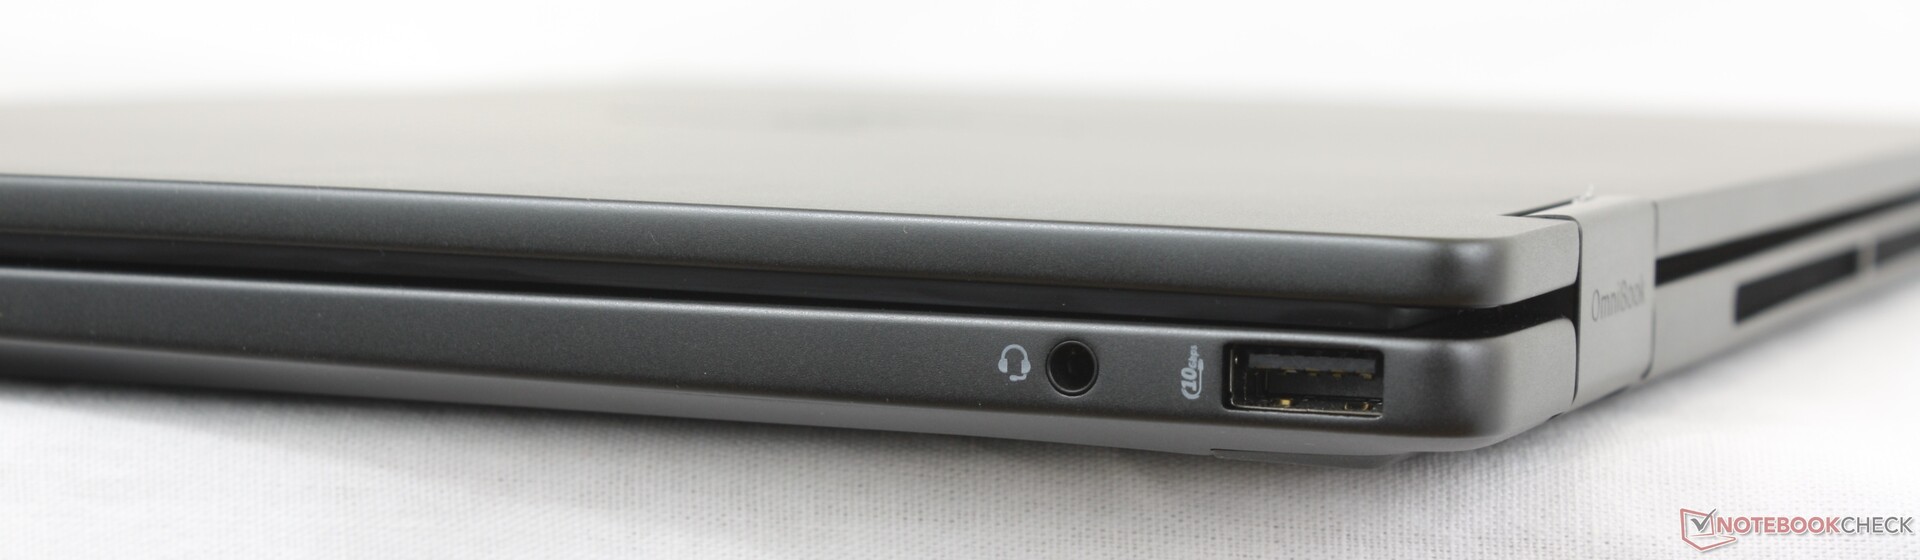
Connettività
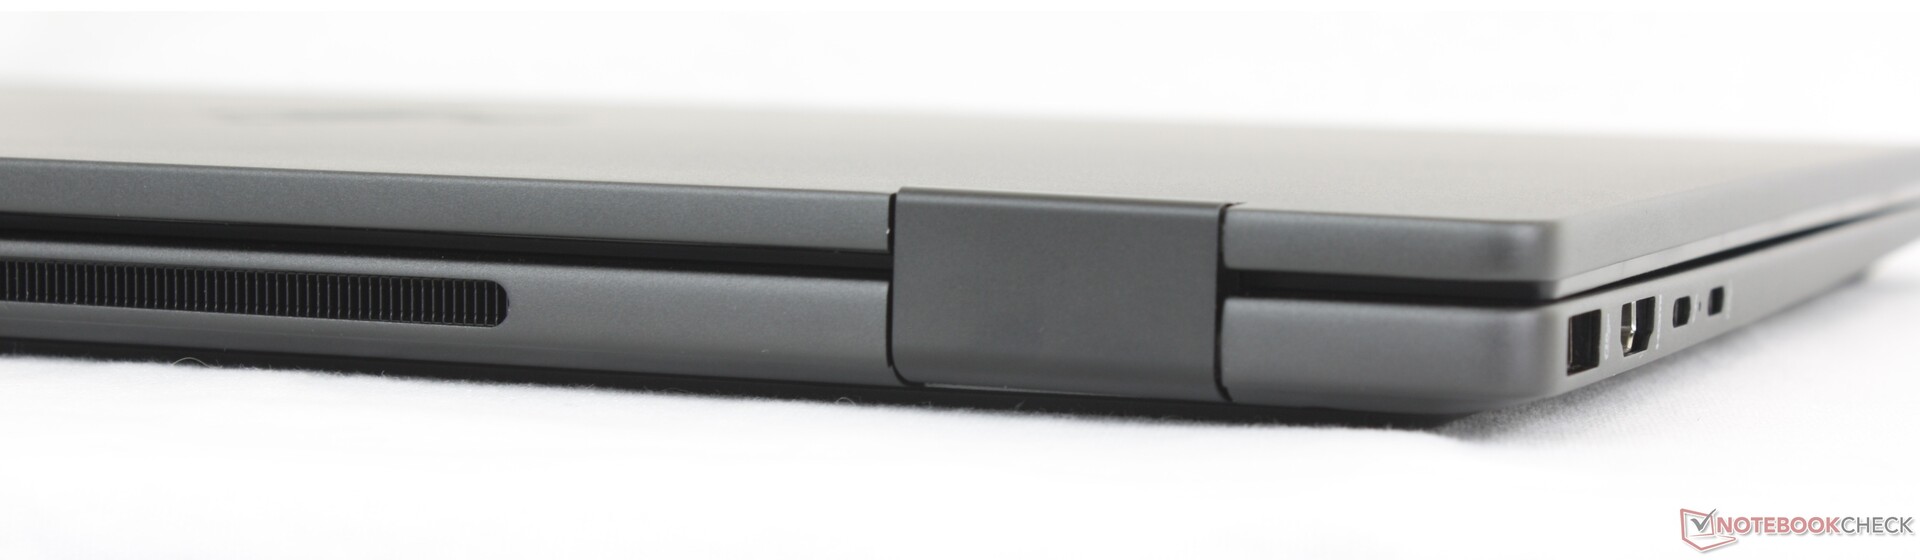
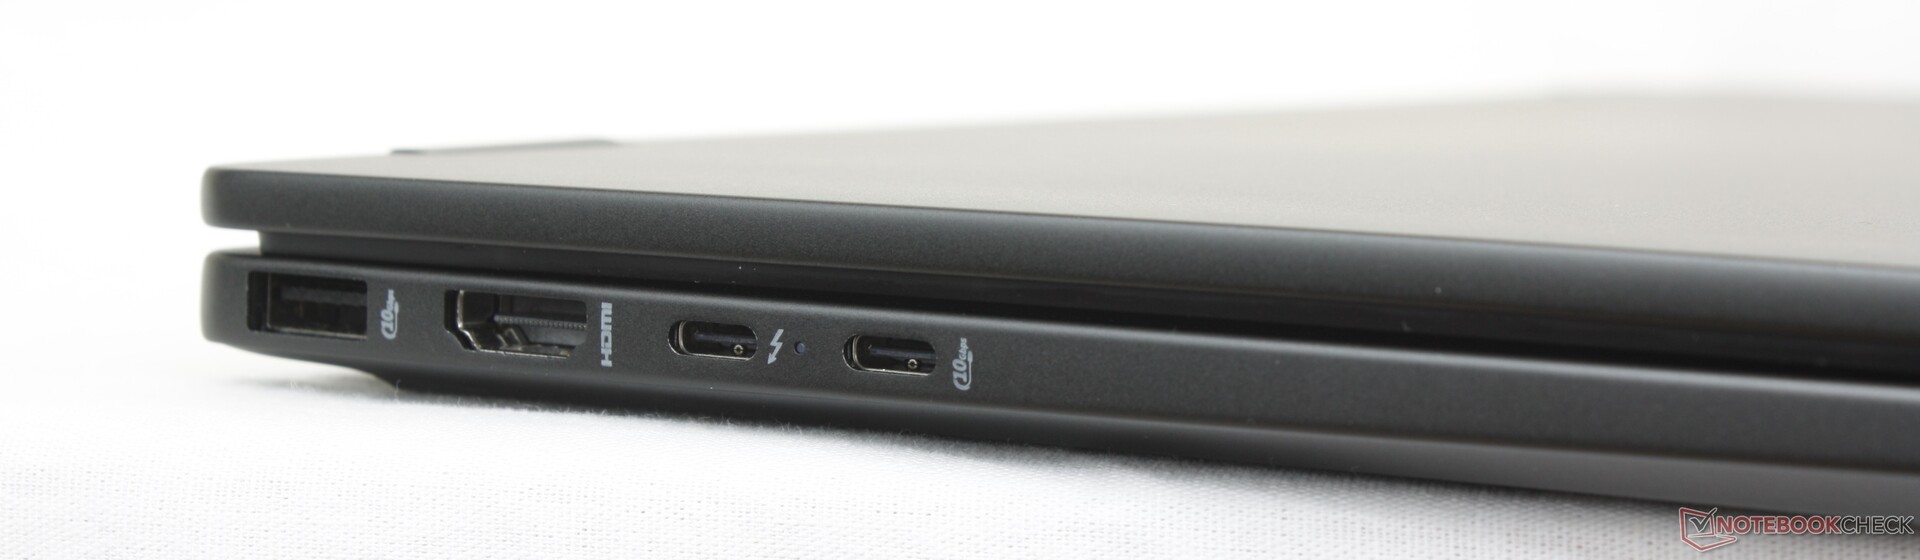
HP include tutte le porte presenti sul Dell Plus 16 2-in-1 più una porta USB-A aggiuntiva lungo il bordo sinistro. Si noti che solo una delle due porte USB-C supporta Thunderbolt 4 e DisplayPort 2.1 mentre l'altra porta USB-C è solo 10 Gbps con DisplayPort 1.4.
Comunicazione
Webcam
La webcam da 5 MP è dotata di IR e di un otturatore fisico.


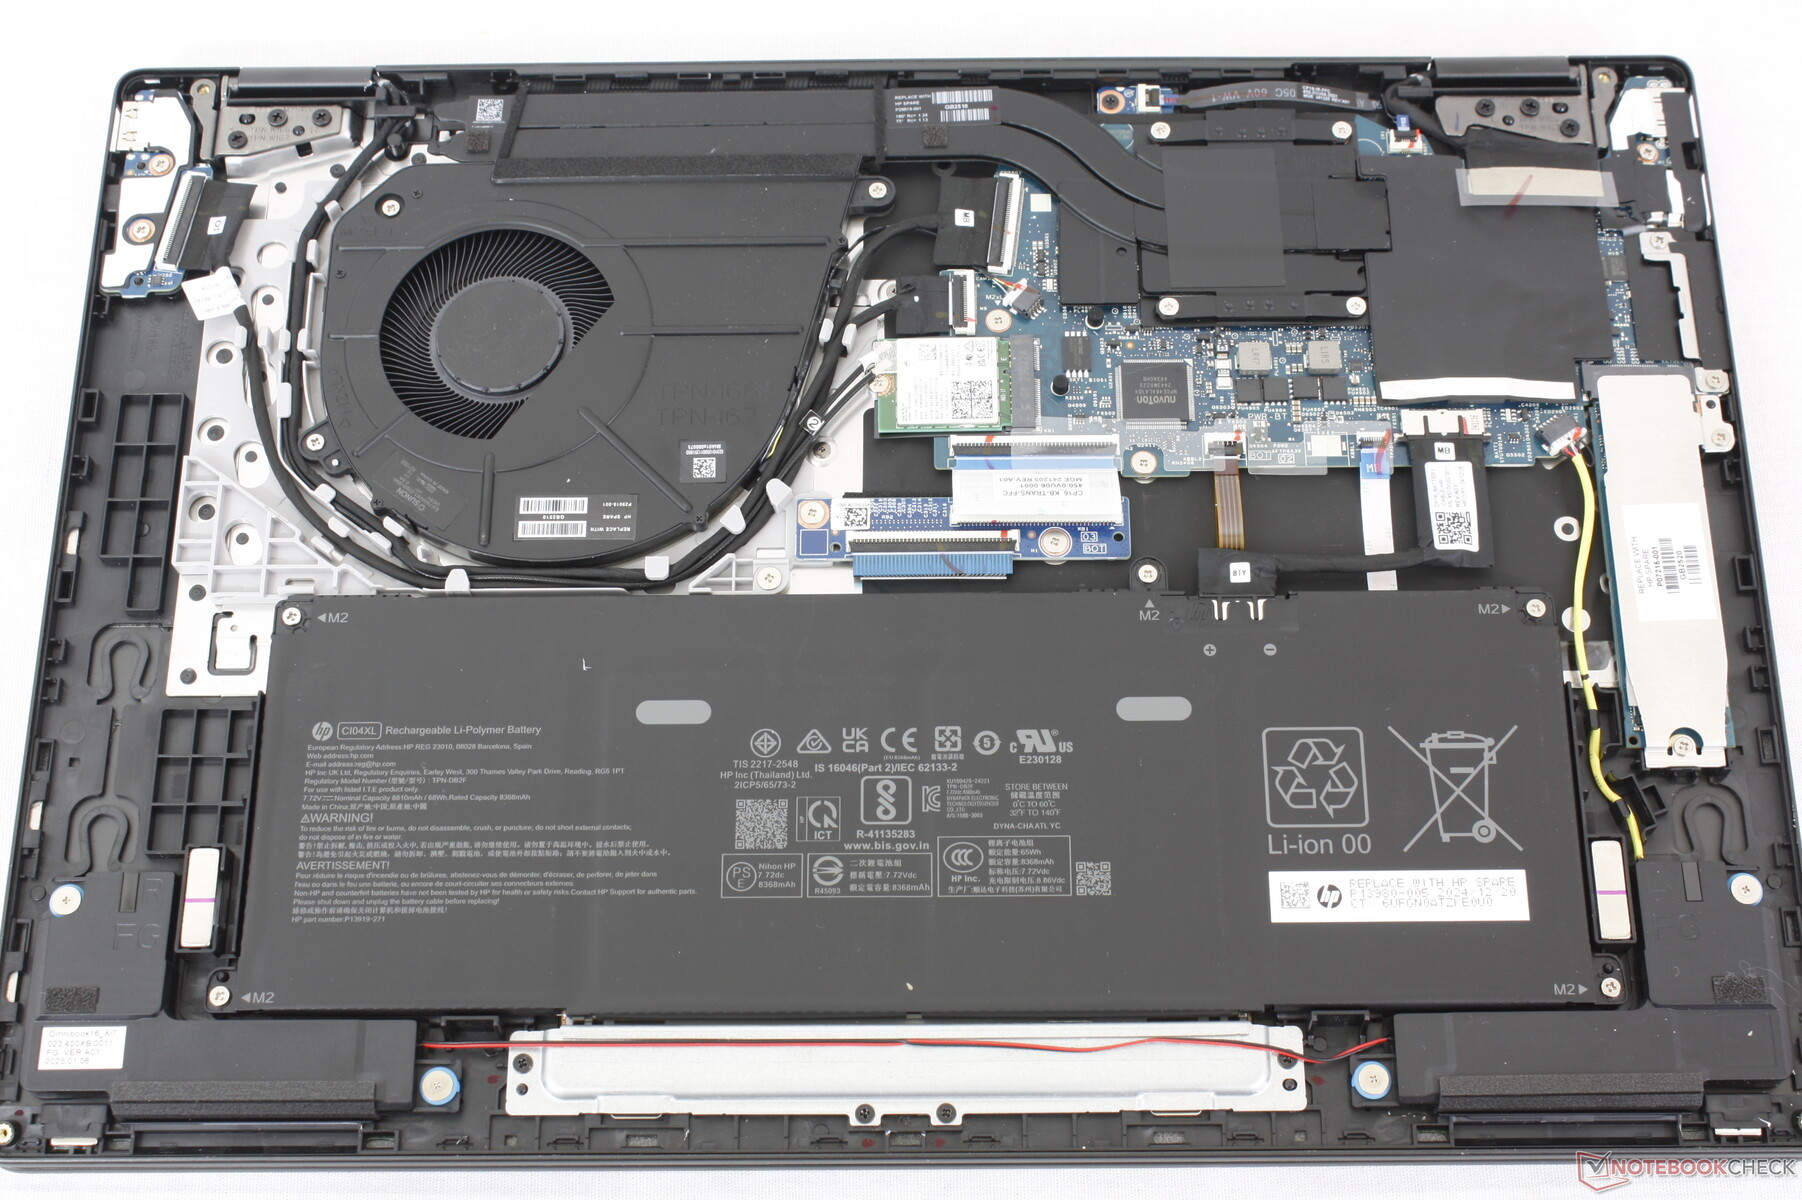
Manutenzione
Sostenibilità
HP incorpora varie quantità di metalli e plastiche riciclati e rinnovabili nella produzione di OmniBook X Flip 16.
Accessori e garanzia
La confezione di vendita al dettaglio include una penna stilo attiva (TPA-M005P) oltre alla consueta documentazione cartacea e all'adattatore AC USB-C. Se acquistato negli Stati Uniti, si applica la garanzia limitata standard di un anno del produttore.
Dispositivi di ingresso
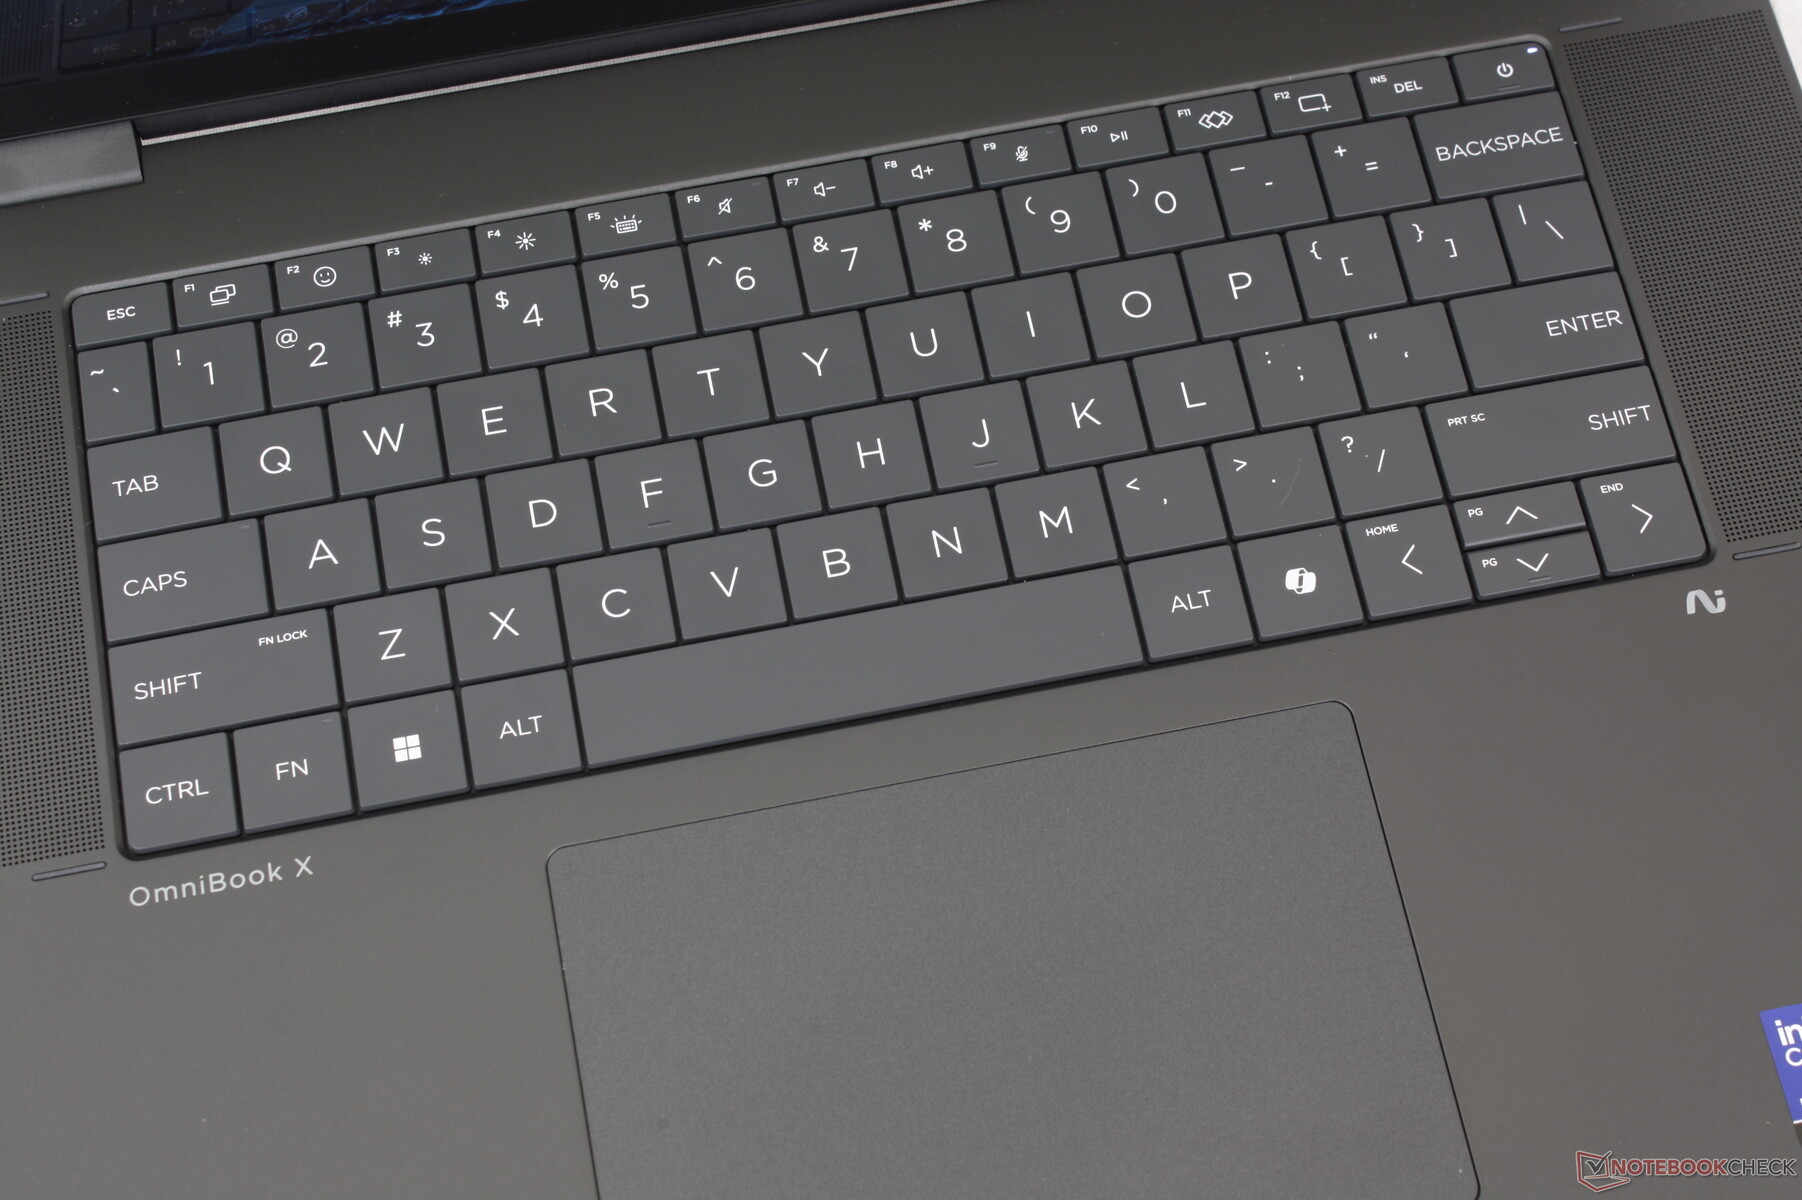
Tastiera
La tastiera zero-lattice è un cambiamento rispetto all'attuale serie Spectre, alla serie EliteBook e alla precedente generazione della serie Envy. Sebbene i copritasti siano più grandi, il feedback è purtroppo più leggero e meno profondo rispetto alle tastiere più tradizionali della maggior parte degli altri computer portatili HP.
Touchpad
Il clickpad ha all'incirca le stesse dimensioni di quello del modello Dell 16 Plus 2-in-1 (13,5 x 8,7 cm contro 13,3 x 9 cm). Il clic è più facile in quanto richiede meno forza rispetto al convertibile Dell, ma il feedback è spugnoso.
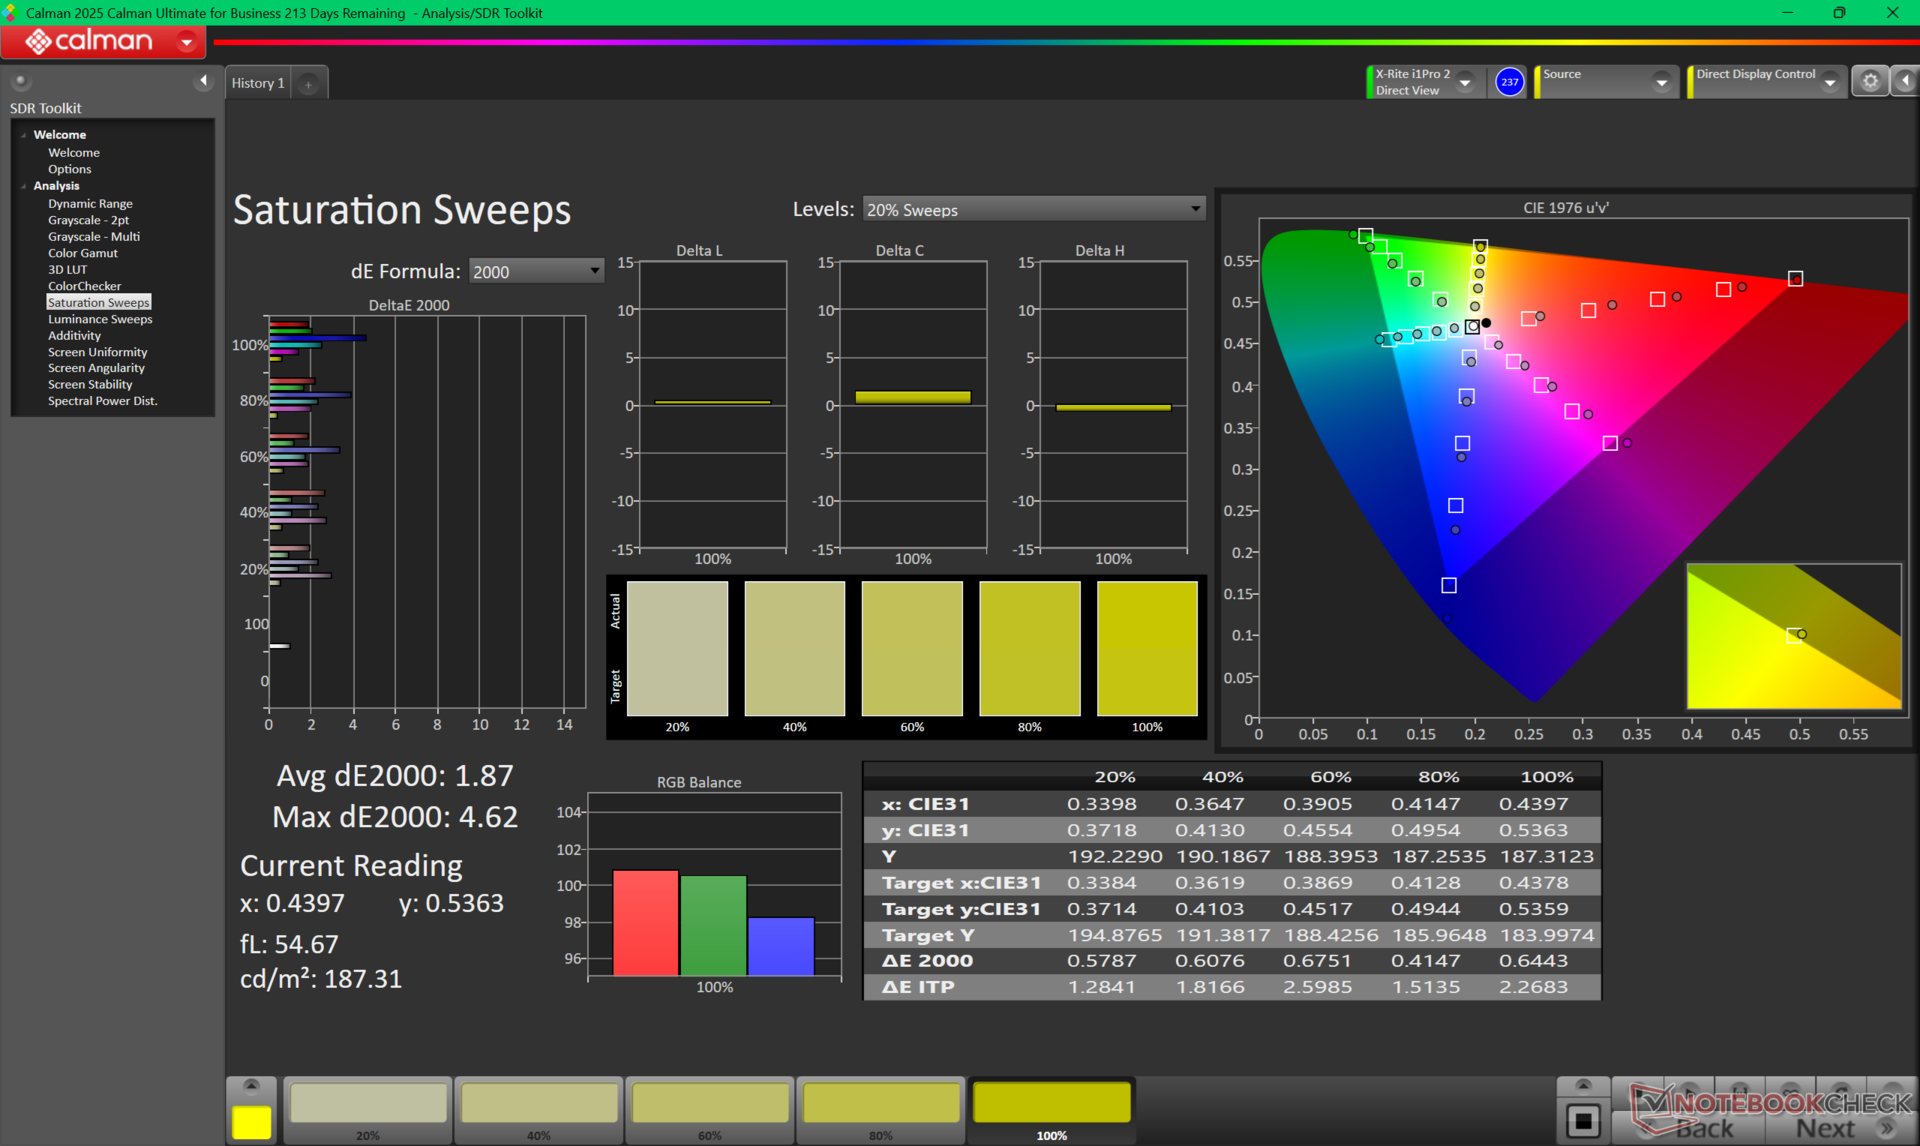
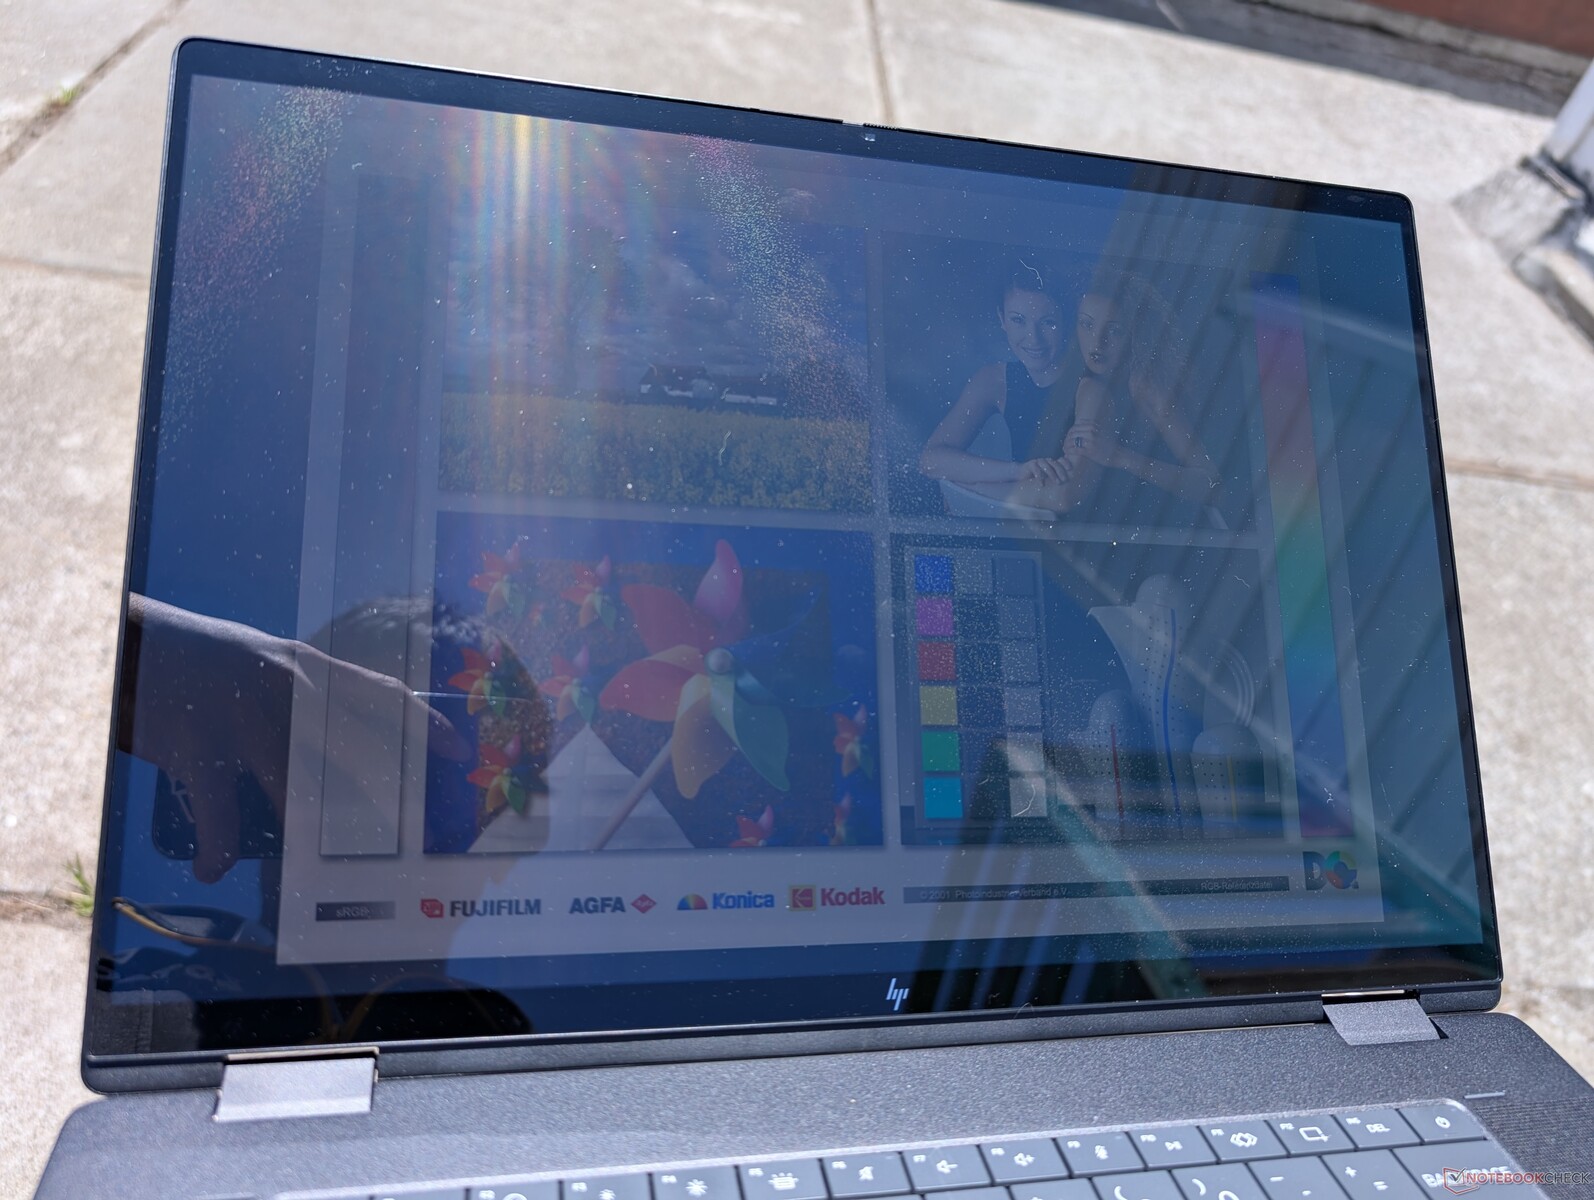
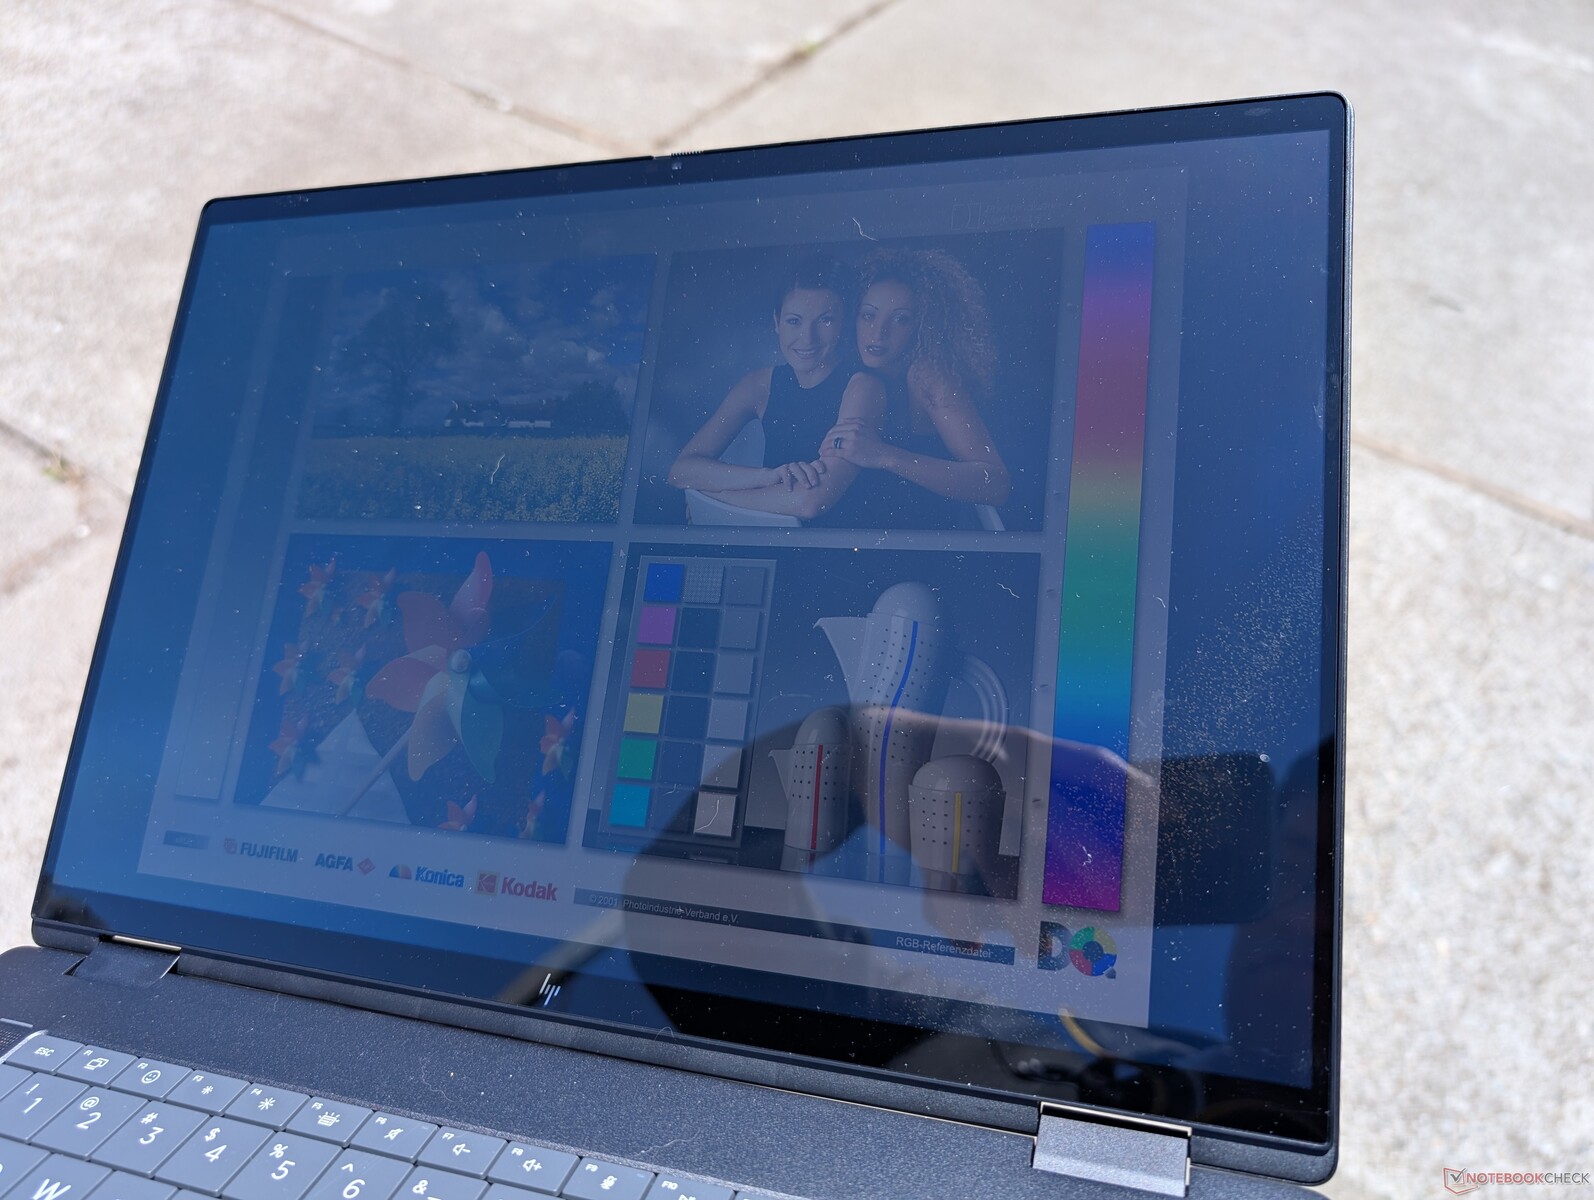
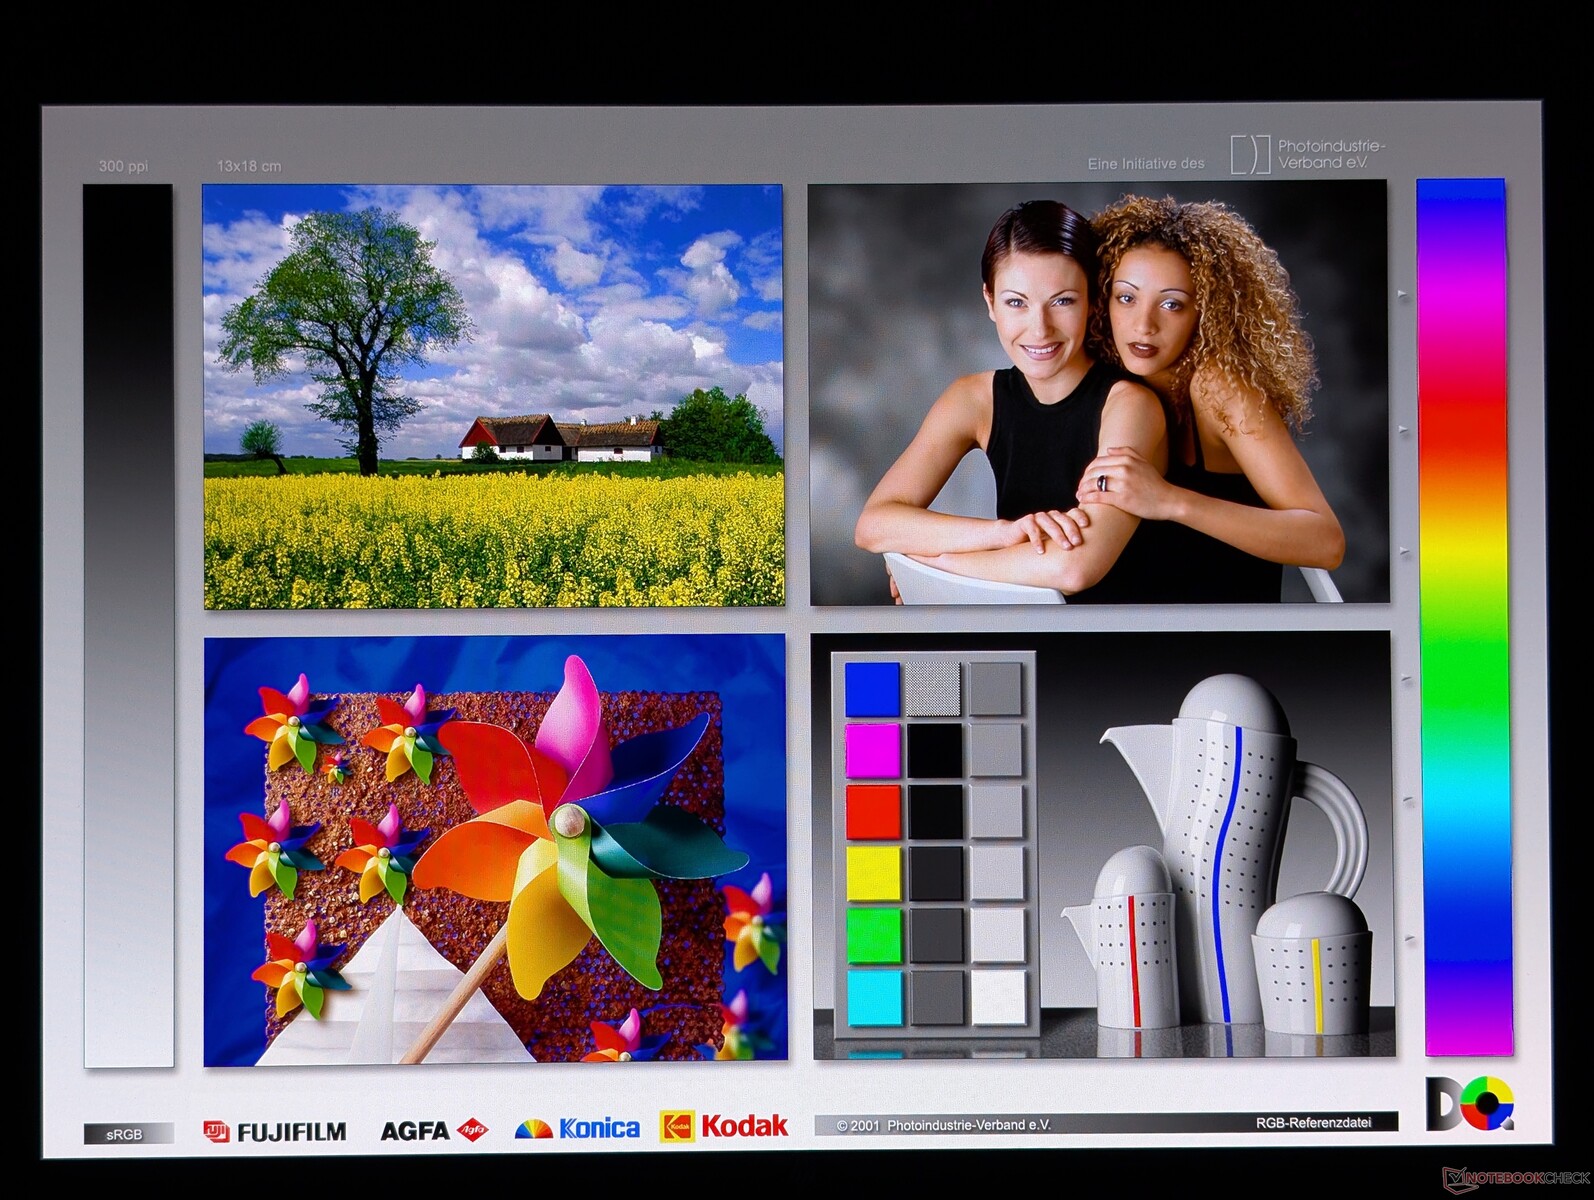
Display - OLED 3K 120 Hz
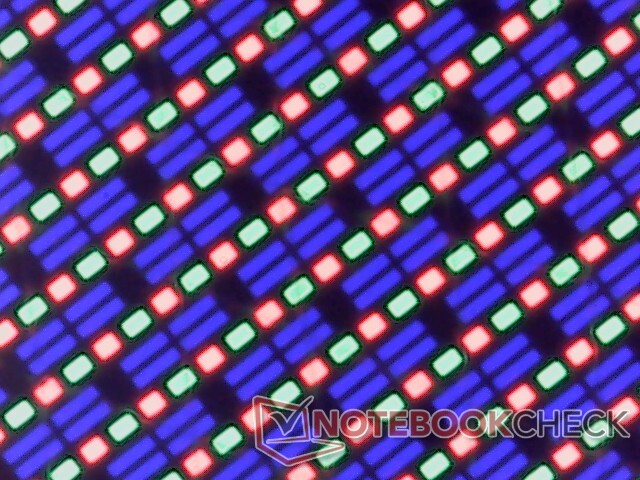
L'OmniBook X Flip 16 utilizza uno schermo touchscreen OLED Samsung da 1800p 120 Hz simile a quello presente sul Galaxy Book5 Pro 360 o HP Spectre x360 16. Offre una risoluzione nativa più elevata rispetto ai pannelli Mini-LED o IPS del Dell Plus 16 2-in-1 o di MSI Summit A16 AI Plus. La luminosità massima raggiunge 561 nit se si attiva la modalità HDR per supportare HDR500, ma è altrimenti limitata a 381 nit se si attiva la modalità SDR.

| |||||||||||||||||||||||||
Distribuzione della luminosità: 98 %
Al centro con la batteria: 381.1 cd/m²
Contrasto: ∞:1 (Nero: 0 cd/m²)
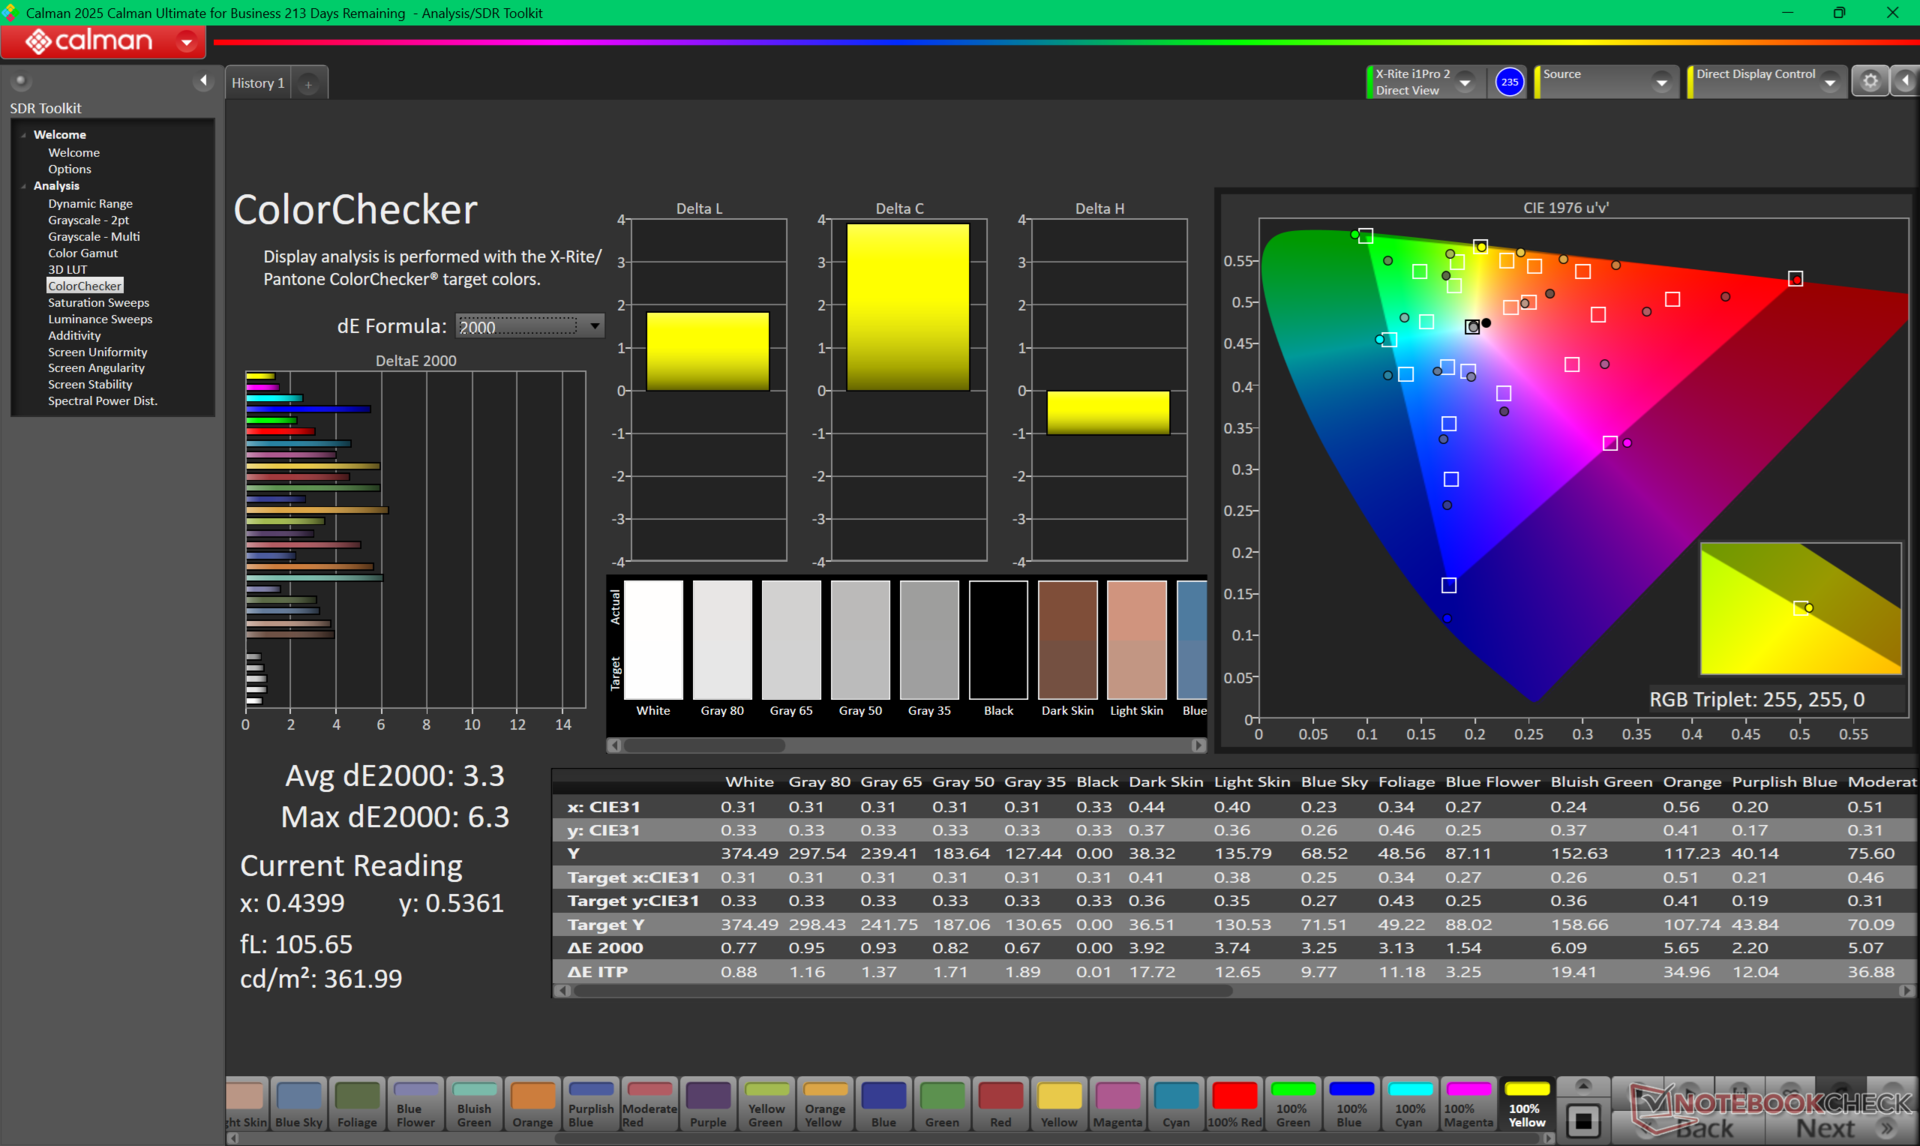
ΔE ColorChecker Calman: 3.3 | ∀{0.5-29.43 Ø4.72}
ΔE Greyscale Calman: 0.9 | ∀{0.09-98 Ø4.96}
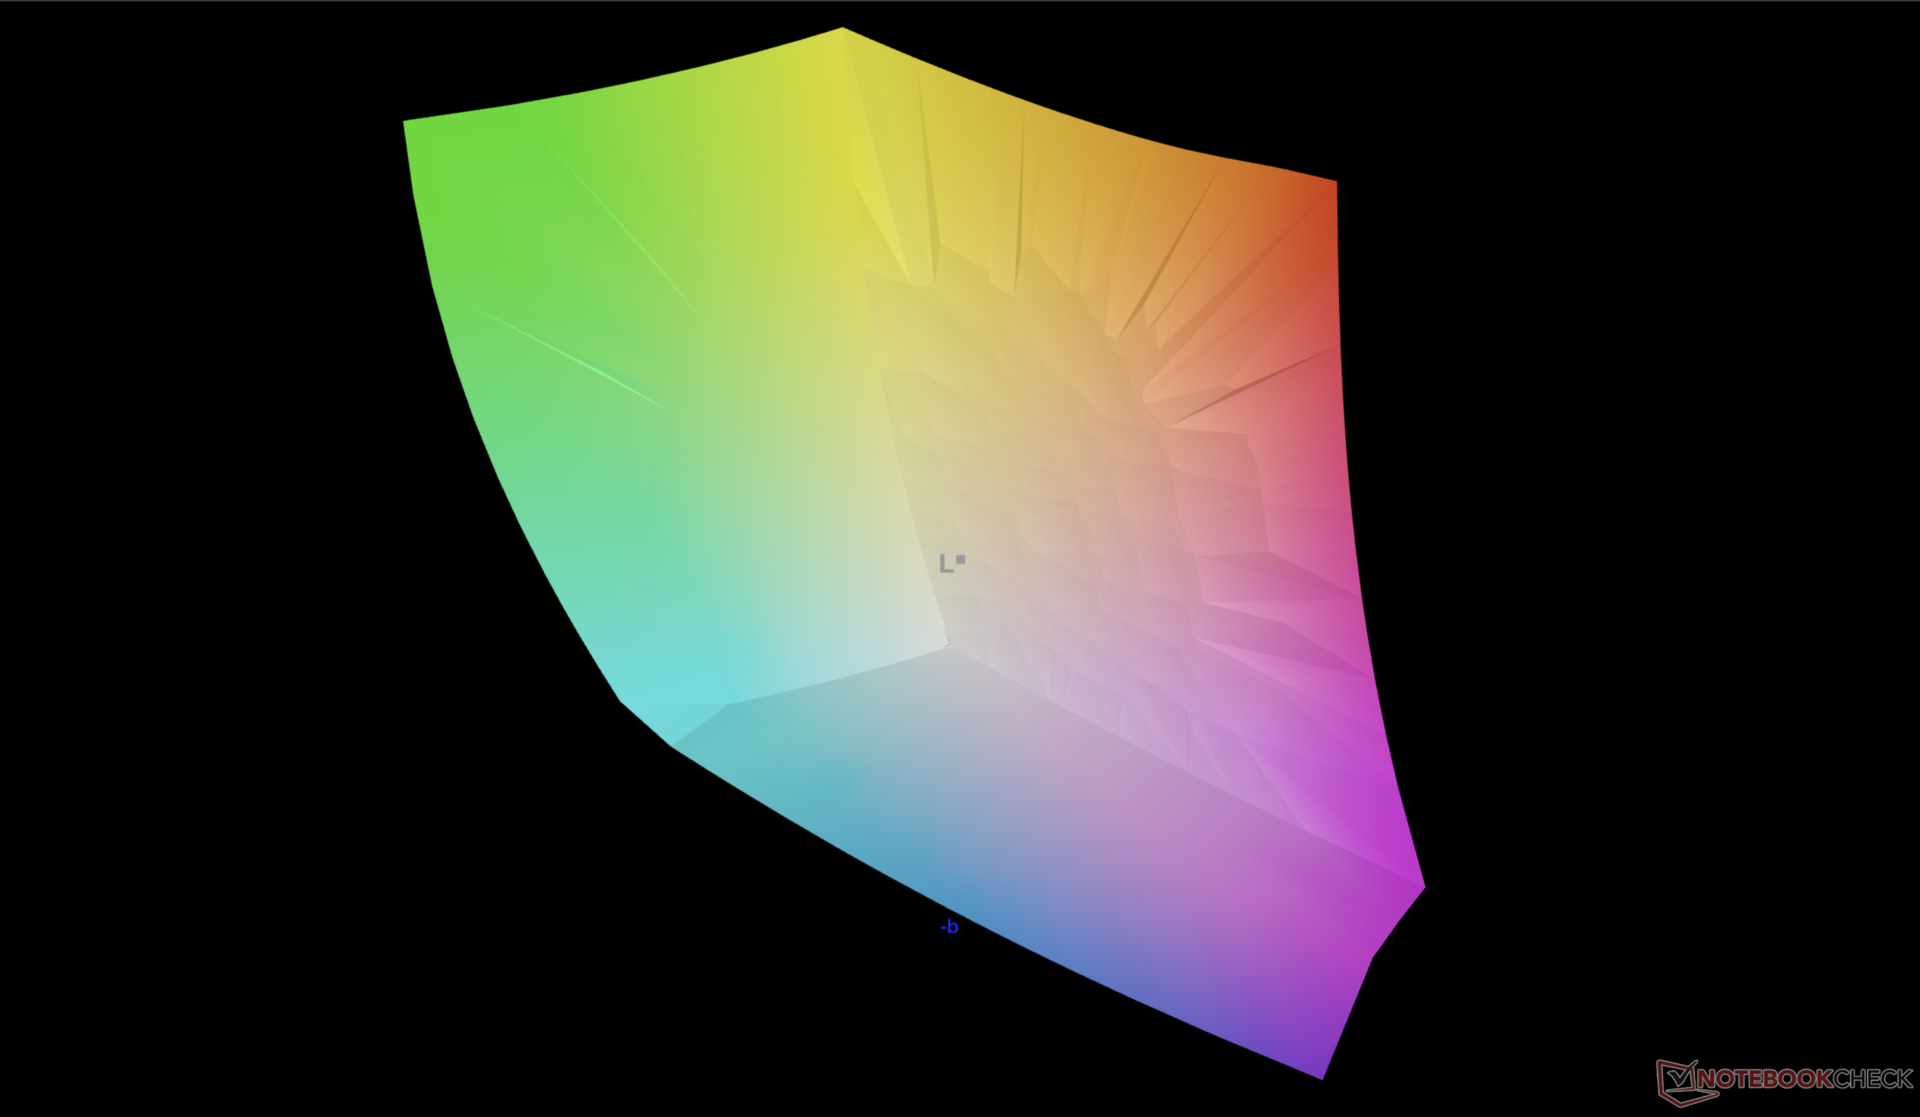
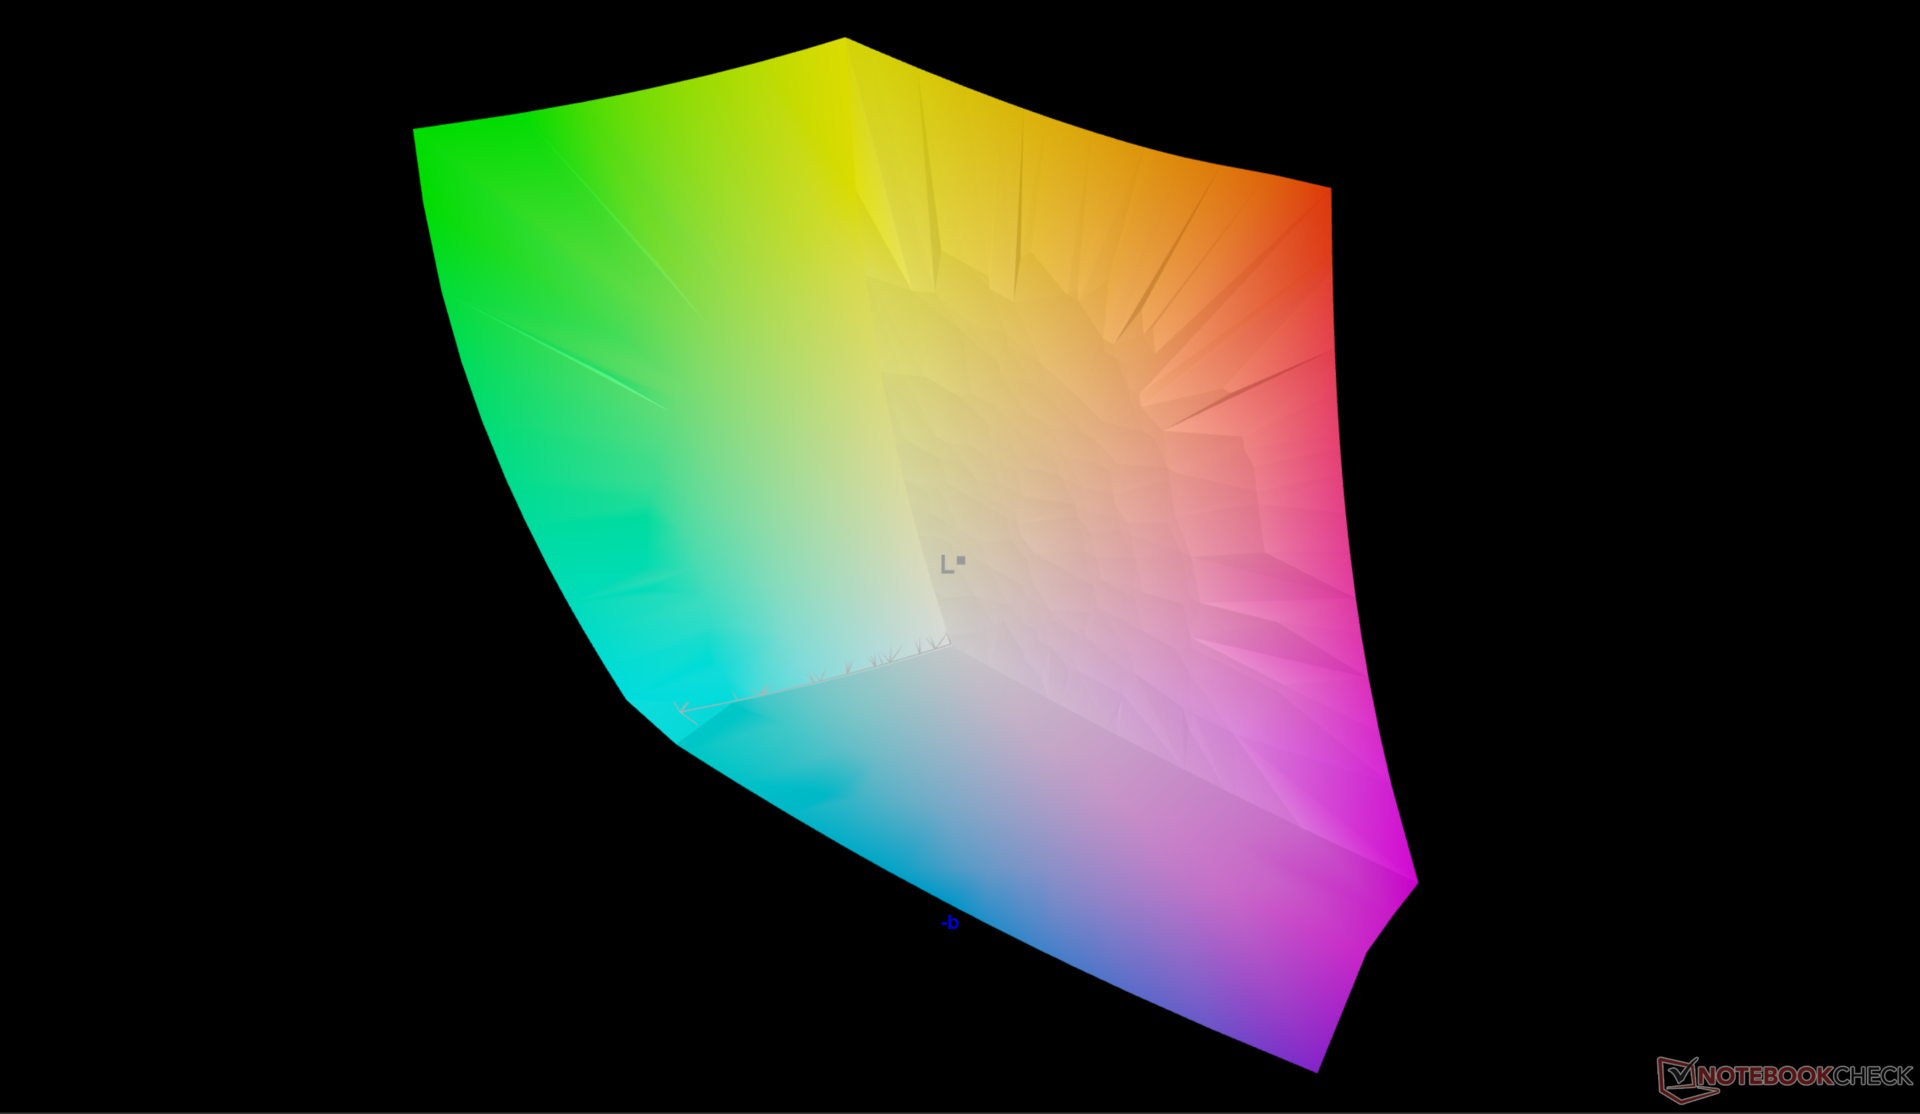
95.2% AdobeRGB 1998 (Argyll 3D)
100% sRGB (Argyll 3D)
99.9% Display P3 (Argyll 3D)
Gamma: 2.23
CCT: 6369 K
| HP OmniBook X Flip 16 Samsung SDC41BA, OLED, 2880x1800, 16", 120 Hz | Dell 16 Plus 2-in-1 AU Optronics B160QAT, Mini-LED, 2560x1600, 16", 90 Hz | Lenovo Yoga 7 2-in-1 16ILL10 LEN160WUM, IPS, 1920x1200, 16", 60 Hz | Samsung Galaxy Book5 Pro 360 ATNA60CL09-0, OLED, 2880x1800, 16", 120 Hz | MSI Summit A16 AI Plus A3HMTG AU Optronics B16QAN02.N, IPS, 2560x1600, 16", 165 Hz | HP Spectre x360 16 RTX 4050 Samsung SDC41A6, OLED, 2880x1800, 16", 120 Hz | |
|---|---|---|---|---|---|---|
| Display | -0% | -53% | 0% | -5% | 1% | |
| Display P3 Coverage (%) | 99.9 | 99.5 0% | 39.7 -60% | 99.9 0% | 96.8 -3% | 99.6 0% |
| sRGB Coverage (%) | 100 | 100 0% | 57.9 -42% | 100 0% | 99.8 0% | 100 0% |
| AdobeRGB 1998 Coverage (%) | 95.2 | 94.2 -1% | 41 -57% | 96.6 1% | 84.7 -11% | 96.7 2% |
| Response Times | -4178% | -3025% | -33% | -1201% | 3% | |
| Response Time Grey 50% / Grey 80% * (ms) | 0.8 ? | 48.8 ? -6000% | 30 ? -3650% | 0.48 ? 40% | 12.9 ? -1513% | 0.78 ? 2% |
| Response Time Black / White * (ms) | 0.9 ? | 57.6 ? -6300% | 22.5 ? -2400% | 0.64 ? 29% | 8.9 ? -889% | 0.86 ? 4% |
| PWM Frequency (Hz) | 473.8 ? | 2807 ? | 240 ? | 480 ? | ||
| PWM Amplitude * (%) | 15 | 50 -233% | 40 -167% | |||
| Screen | -3% | -172% | 9% | -34% | -17% | |
| Brightness middle (cd/m²) | 381.1 | 432.1 13% | 317.9 -17% | 387 2% | 475.4 25% | 385.2 1% |
| Brightness (cd/m²) | 381 | 426 12% | 304 -20% | 392 3% | 440 15% | 387 2% |
| Brightness Distribution (%) | 98 | 97 -1% | 90 -8% | 98 0% | 89 -9% | 99 1% |
| Black Level * (cd/m²) | 0.25 | 0.36 | ||||
| Colorchecker dE 2000 * | 3.3 | 1.95 41% | 7.39 -124% | 1 70% | 2.99 9% | 1.73 48% |
| Colorchecker dE 2000 max. * | 6.3 | 3.87 39% | 21.43 -240% | 1.9 70% | 7.64 -21% | 3.95 37% |
| Greyscale dE 2000 * | 0.9 | 2 -122% | 6.5 -622% | 1.7 -89% | 2.9 -222% | 2.6 -189% |
| Gamma | 2.23 99% | 2.3 96% | 2.22 99% | 2.25 98% | 2.31 95% | 2.17 101% |
| CCT | 6369 102% | 6222 104% | 6140 106% | 6325 103% | 6472 100% | 6133 106% |
| Colorchecker dE 2000 calibrated * | 1.16 | 3.06 | 0.74 | |||
| Contrast (:1) | 1272 | 1321 | ||||
| Media totale (Programma / Settaggio) | -1394% /
-1046% | -1083% /
-658% | -8% /
-3% | -413% /
-238% | -4% /
-8% |
* ... Meglio usare valori piccoli

Tempi di risposta del Display
| ↔ Tempi di risposta dal Nero al Bianco | ||
|---|---|---|
| 0.9 ms ... aumenta ↗ e diminuisce ↘ combinato | ↗ 0.4 ms Incremento | 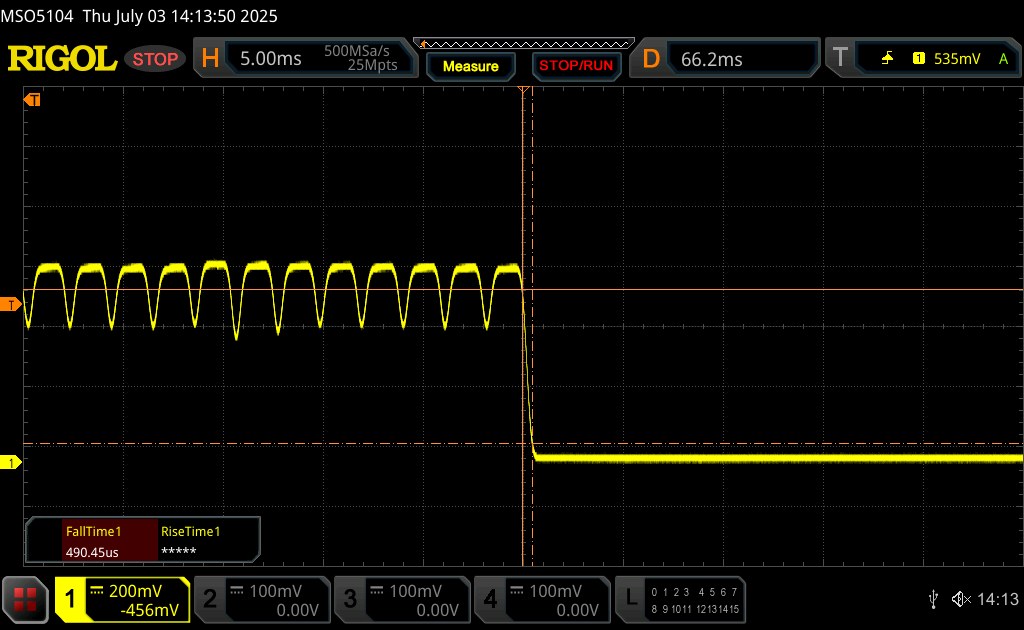 |
| ↘ 0.5 ms Calo | ||
| Lo schermo ha mostrato valori di risposta molto veloci nei nostri tests ed è molto adatto per i gaming veloce. In confronto, tutti i dispositivi di test variano da 0.1 (minimo) a 240 (massimo) ms. » 3 % di tutti i dispositivi è migliore. Questo significa che i tempi di risposta rilevati sono migliori rispettto alla media di tutti i dispositivi testati (19.8 ms). | ||
| ↔ Tempo di risposta dal 50% Grigio all'80% Grigio | ||
| 0.8 ms ... aumenta ↗ e diminuisce ↘ combinato | ↗ 0.4 ms Incremento | 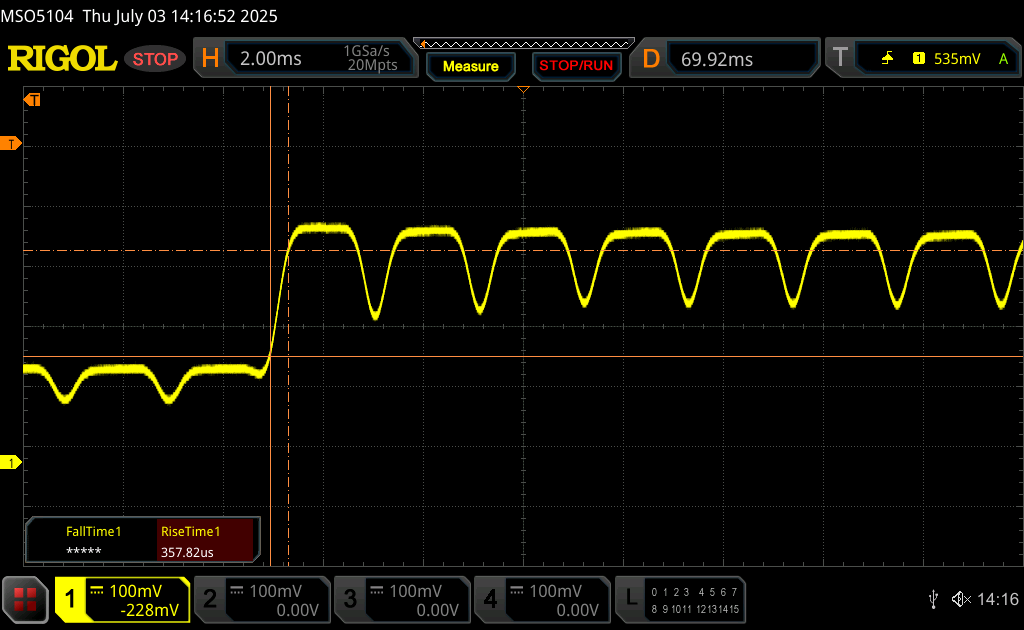 |
| ↘ 0.4 ms Calo | ||
| Lo schermo ha mostrato valori di risposta molto veloci nei nostri tests ed è molto adatto per i gaming veloce. In confronto, tutti i dispositivi di test variano da 0.165 (minimo) a 636 (massimo) ms. » 3 % di tutti i dispositivi è migliore. Questo significa che i tempi di risposta rilevati sono migliori rispettto alla media di tutti i dispositivi testati (31 ms). | ||
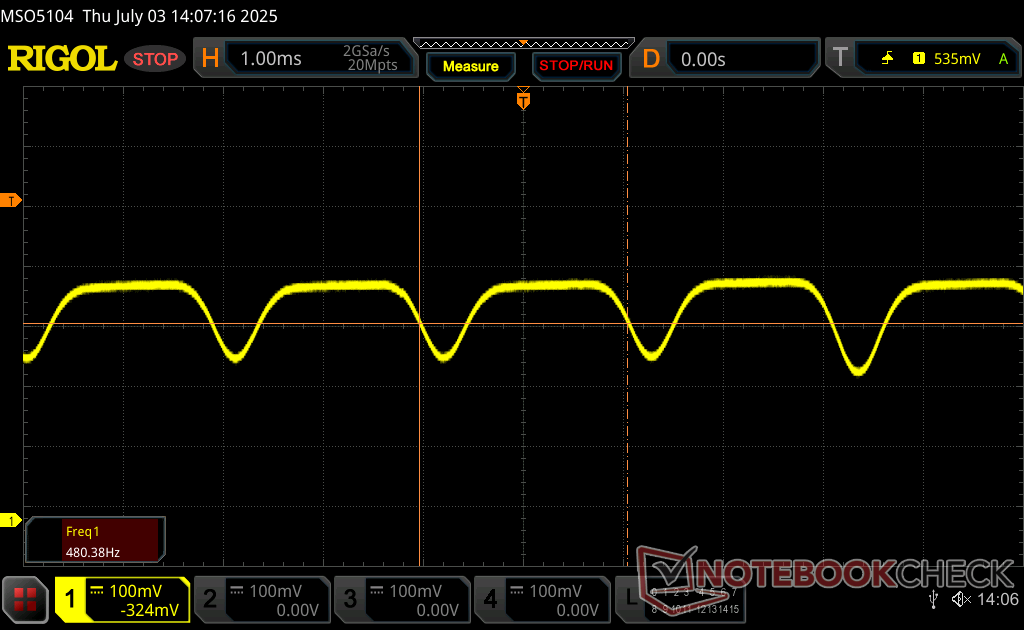
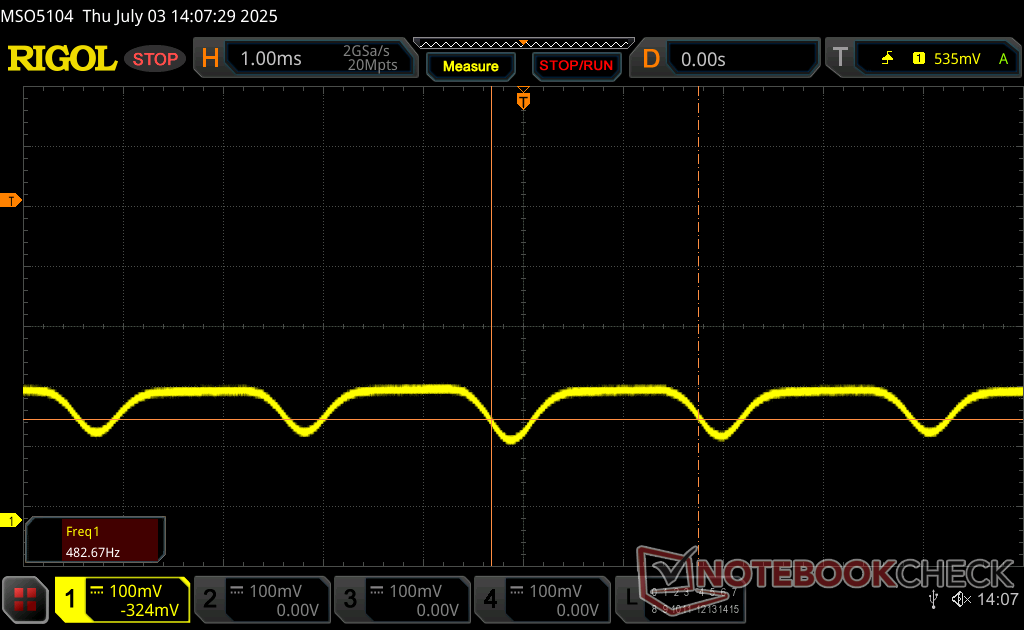
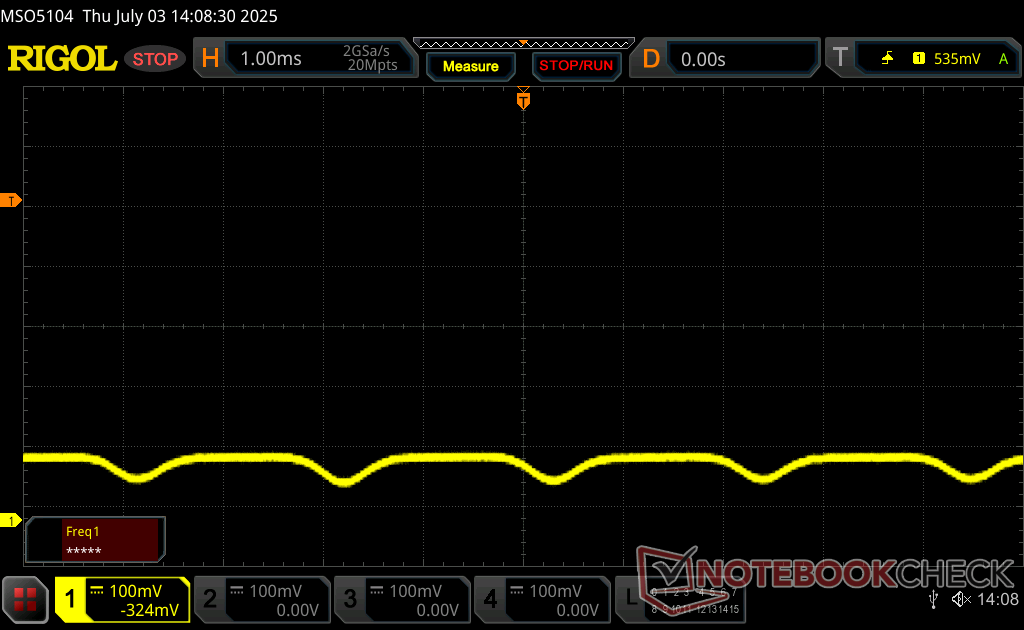
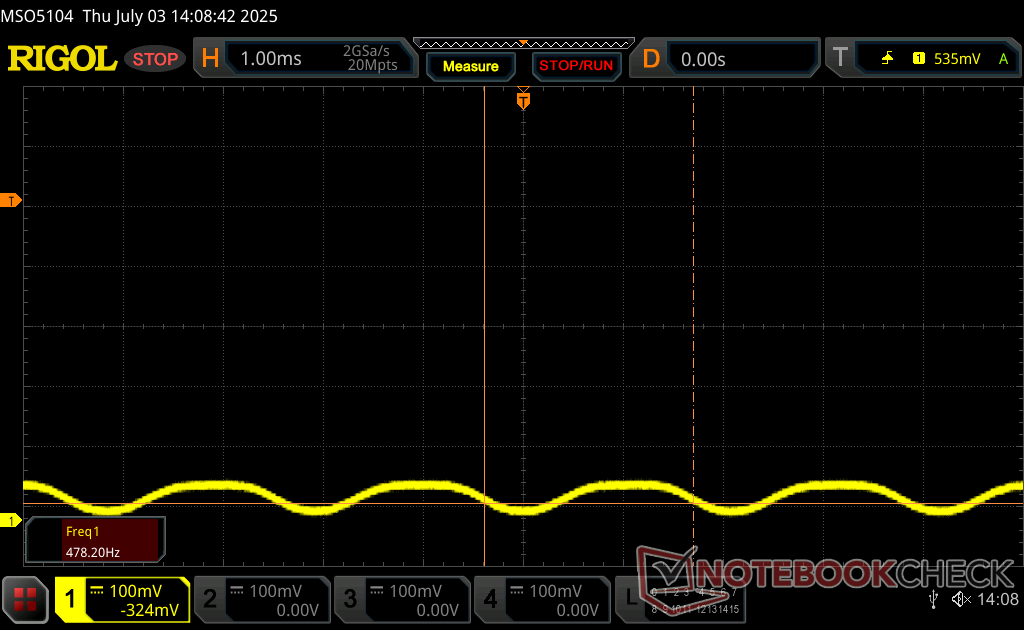
Sfarfallio dello schermo / PWM (Pulse-Width Modulation)
| flickering dello schermo / PWM rilevato | 473.8 Hz Amplitude: 15 % | ≤ 100 % settaggio luminosita' | 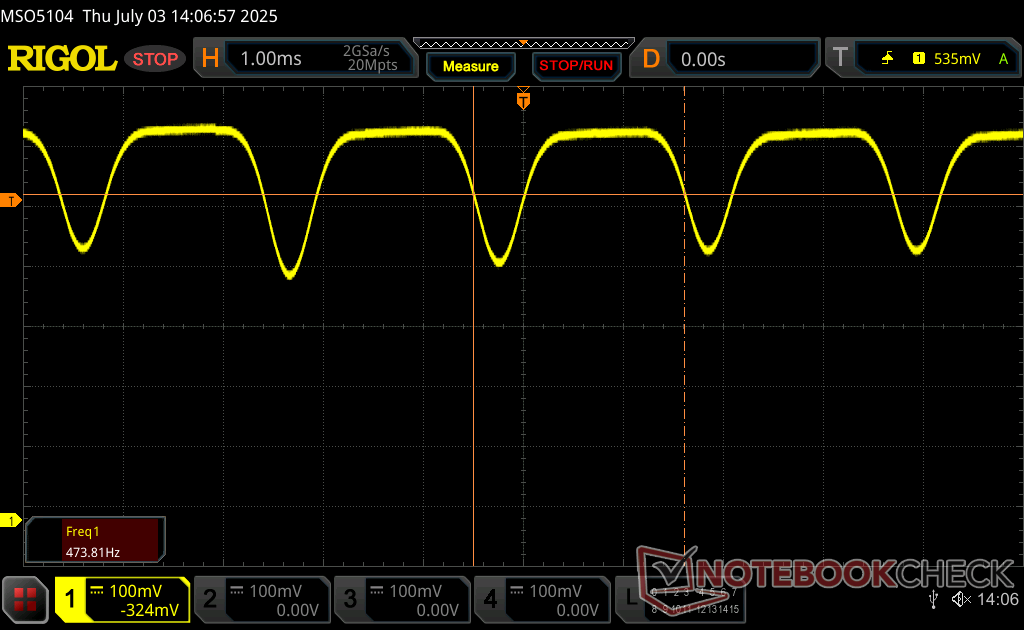 |
Il display sfarfalla a 473.8 Hz (Probabilmente a causa dell'uso di PWM) Flickering rilevato ad una luminosita' di 100 % o inferiore. Non dovrebbe verificarsi flickering o PWM sopra questo valore di luminosita'. La frequenza di 473.8 Hz è relativamente elevata, quindi la maggioranza degli utenti sensibili al PWM non dovrebbe notare alcun flickering. Tuttavia, è stato segnalato che alcuni utenti sono sensibili al PWM a 500 Hz ed oltre, quindi prestate attenzione. In confronto: 52 % di tutti i dispositivi testati non utilizza PWM per ridurre la luminosita' del display. Se è rilevato PWM, una media di 7747 (minimo: 5 - massimo: 343500) Hz è stata rilevata. | |||


Prestazioni - Efficienza del Lago Lunare
Condizioni del test
Abbiamo impostato Windows in modalità Prestazioni prima di eseguire i benchmark qui sotto.
Processore
Il Core Ultra 7 258V offre prestazioni multi-thread simili a quelle del meno costoso Core Ultra 5 125U. Anche la sostenibilità delle prestazioni è decente, con un deficit di circa il 10 percento quando si esegue CineBench R15 xT in un ciclo.
Cinebench R15 Multi Loop
Cinebench R23: Multi Core | Single Core
Cinebench R20: CPU (Multi Core) | CPU (Single Core)
Cinebench R15: CPU Multi 64Bit | CPU Single 64Bit
Blender: v2.79 BMW27 CPU
7-Zip 18.03: 7z b 4 | 7z b 4 -mmt1
Geekbench 6.7: Multi-Core | Single-Core
Geekbench 5.5: Multi-Core | Single-Core
HWBOT x265 Benchmark v2.2: 4k Preset
LibreOffice : 20 Documents To PDF
R Benchmark 2.5: Overall mean
* ... Meglio usare valori piccoli
AIDA64: FP32 Ray-Trace | FPU Julia | CPU SHA3 | CPU Queen | FPU SinJulia | FPU Mandel | CPU AES | CPU ZLib | FP64 Ray-Trace | CPU PhotoWorxx
| Performance rating | |
| MSI Summit A16 AI Plus A3HMTG | |
| HP Spectre x360 16 RTX 4050 | |
| Dell 16 Plus 2-in-1 | |
| HP OmniBook X Flip 16 | |
| Lenovo Yoga 7 2-in-1 16ILL10 | |
| Media Intel Core Ultra 7 258V | |
| Samsung Galaxy Book5 Pro 360 | |
| AIDA64 / FP32 Ray-Trace | |
| MSI Summit A16 AI Plus A3HMTG | |
| HP Spectre x360 16 RTX 4050 | |
| Dell 16 Plus 2-in-1 | |
| Samsung Galaxy Book5 Pro 360 | |
| Lenovo Yoga 7 2-in-1 16ILL10 | |
| Media Intel Core Ultra 7 258V (8454 - 12781, n=26) | |
| HP OmniBook X Flip 16 | |
| AIDA64 / FPU Julia | |
| MSI Summit A16 AI Plus A3HMTG | |
| HP Spectre x360 16 RTX 4050 | |
| Samsung Galaxy Book5 Pro 360 | |
| HP OmniBook X Flip 16 | |
| Lenovo Yoga 7 2-in-1 16ILL10 | |
| Dell 16 Plus 2-in-1 | |
| Media Intel Core Ultra 7 258V (40875 - 63401, n=26) | |
| AIDA64 / CPU SHA3 | |
| MSI Summit A16 AI Plus A3HMTG | |
| HP Spectre x360 16 RTX 4050 | |
| Lenovo Yoga 7 2-in-1 16ILL10 | |
| HP OmniBook X Flip 16 | |
| Media Intel Core Ultra 7 258V (1930 - 2817, n=26) | |
| Samsung Galaxy Book5 Pro 360 | |
| Dell 16 Plus 2-in-1 | |
| AIDA64 / CPU Queen | |
| MSI Summit A16 AI Plus A3HMTG | |
| HP Spectre x360 16 RTX 4050 | |
| Dell 16 Plus 2-in-1 | |
| HP OmniBook X Flip 16 | |
| Lenovo Yoga 7 2-in-1 16ILL10 | |
| Media Intel Core Ultra 7 258V (48816 - 49818, n=24) | |
| Samsung Galaxy Book5 Pro 360 | |
| AIDA64 / FPU SinJulia | |
| MSI Summit A16 AI Plus A3HMTG | |
| HP Spectre x360 16 RTX 4050 | |
| Lenovo Yoga 7 2-in-1 16ILL10 | |
| HP OmniBook X Flip 16 | |
| Dell 16 Plus 2-in-1 | |
| Media Intel Core Ultra 7 258V (3817 - 4440, n=26) | |
| Samsung Galaxy Book5 Pro 360 | |
| AIDA64 / FPU Mandel | |
| MSI Summit A16 AI Plus A3HMTG | |
| HP Spectre x360 16 RTX 4050 | |
| Samsung Galaxy Book5 Pro 360 | |
| Lenovo Yoga 7 2-in-1 16ILL10 | |
| HP OmniBook X Flip 16 | |
| Dell 16 Plus 2-in-1 | |
| Media Intel Core Ultra 7 258V (21670 - 33565, n=26) | |
| AIDA64 / CPU AES | |
| MSI Summit A16 AI Plus A3HMTG | |
| HP Spectre x360 16 RTX 4050 | |
| HP OmniBook X Flip 16 | |
| Dell 16 Plus 2-in-1 | |
| Lenovo Yoga 7 2-in-1 16ILL10 | |
| Media Intel Core Ultra 7 258V (30957 - 40753, n=26) | |
| Samsung Galaxy Book5 Pro 360 | |
| AIDA64 / CPU ZLib | |
| MSI Summit A16 AI Plus A3HMTG | |
| HP Spectre x360 16 RTX 4050 | |
| Lenovo Yoga 7 2-in-1 16ILL10 | |
| Dell 16 Plus 2-in-1 | |
| HP OmniBook X Flip 16 | |
| Media Intel Core Ultra 7 258V (422 - 632, n=26) | |
| Samsung Galaxy Book5 Pro 360 | |
| AIDA64 / FP64 Ray-Trace | |
| MSI Summit A16 AI Plus A3HMTG | |
| HP Spectre x360 16 RTX 4050 | |
| Samsung Galaxy Book5 Pro 360 | |
| Dell 16 Plus 2-in-1 | |
| Lenovo Yoga 7 2-in-1 16ILL10 | |
| Media Intel Core Ultra 7 258V (4258 - 6930, n=26) | |
| HP OmniBook X Flip 16 | |
| AIDA64 / CPU PhotoWorxx | |
| Dell 16 Plus 2-in-1 | |
| HP OmniBook X Flip 16 | |
| Media Intel Core Ultra 7 258V (44223 - 59245, n=26) | |
| Lenovo Yoga 7 2-in-1 16ILL10 | |
| MSI Summit A16 AI Plus A3HMTG | |
| Samsung Galaxy Book5 Pro 360 | |
| HP Spectre x360 16 RTX 4050 | |
Test da sforzo
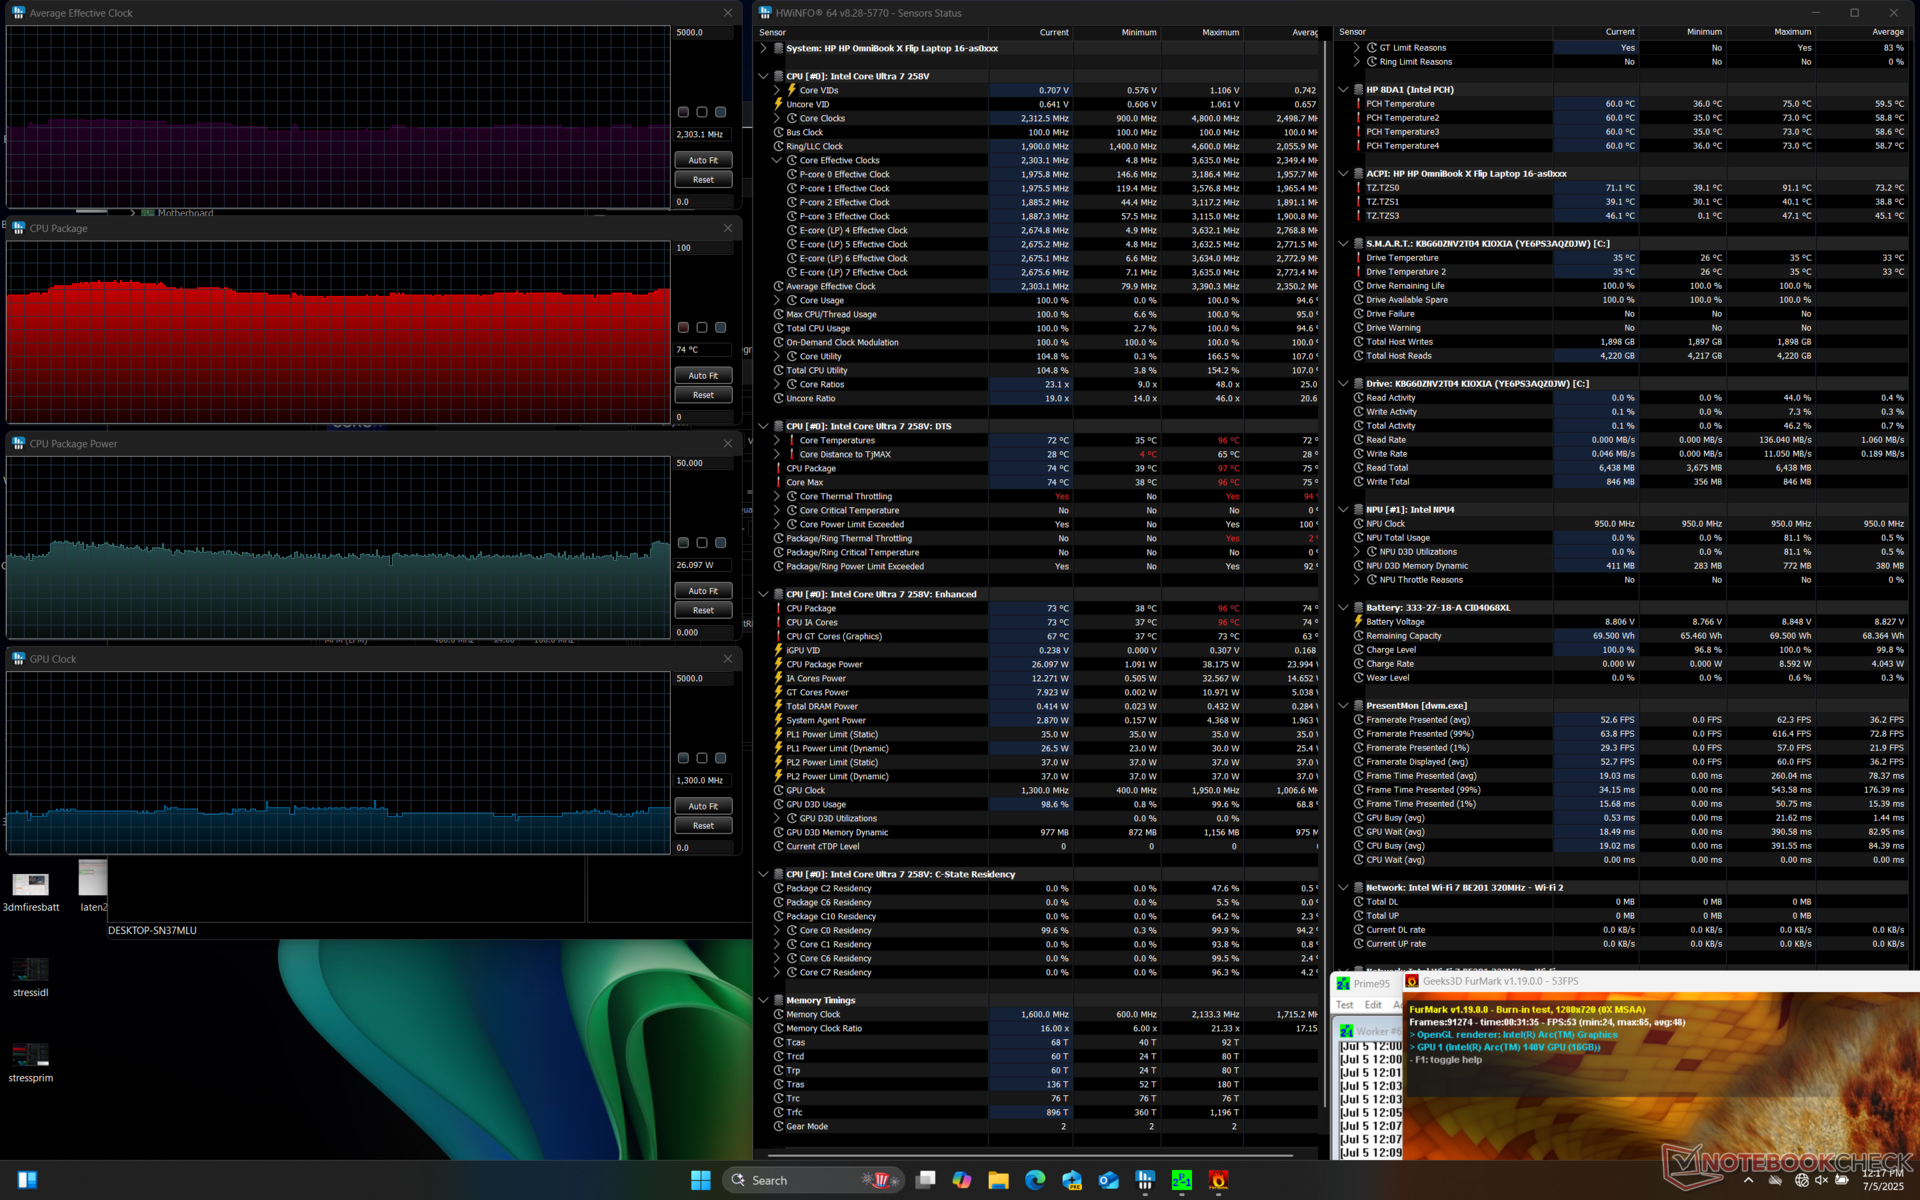
La CPU si stabilizza a 2,9 GHz, 82 C e 26 W durante lo stress Prime95, rispetto ai 2,5 GHz, 72 C e 22 W del Dell Plus 16 2-in-1 con lo stesso processore Core Ultra 7 258V.
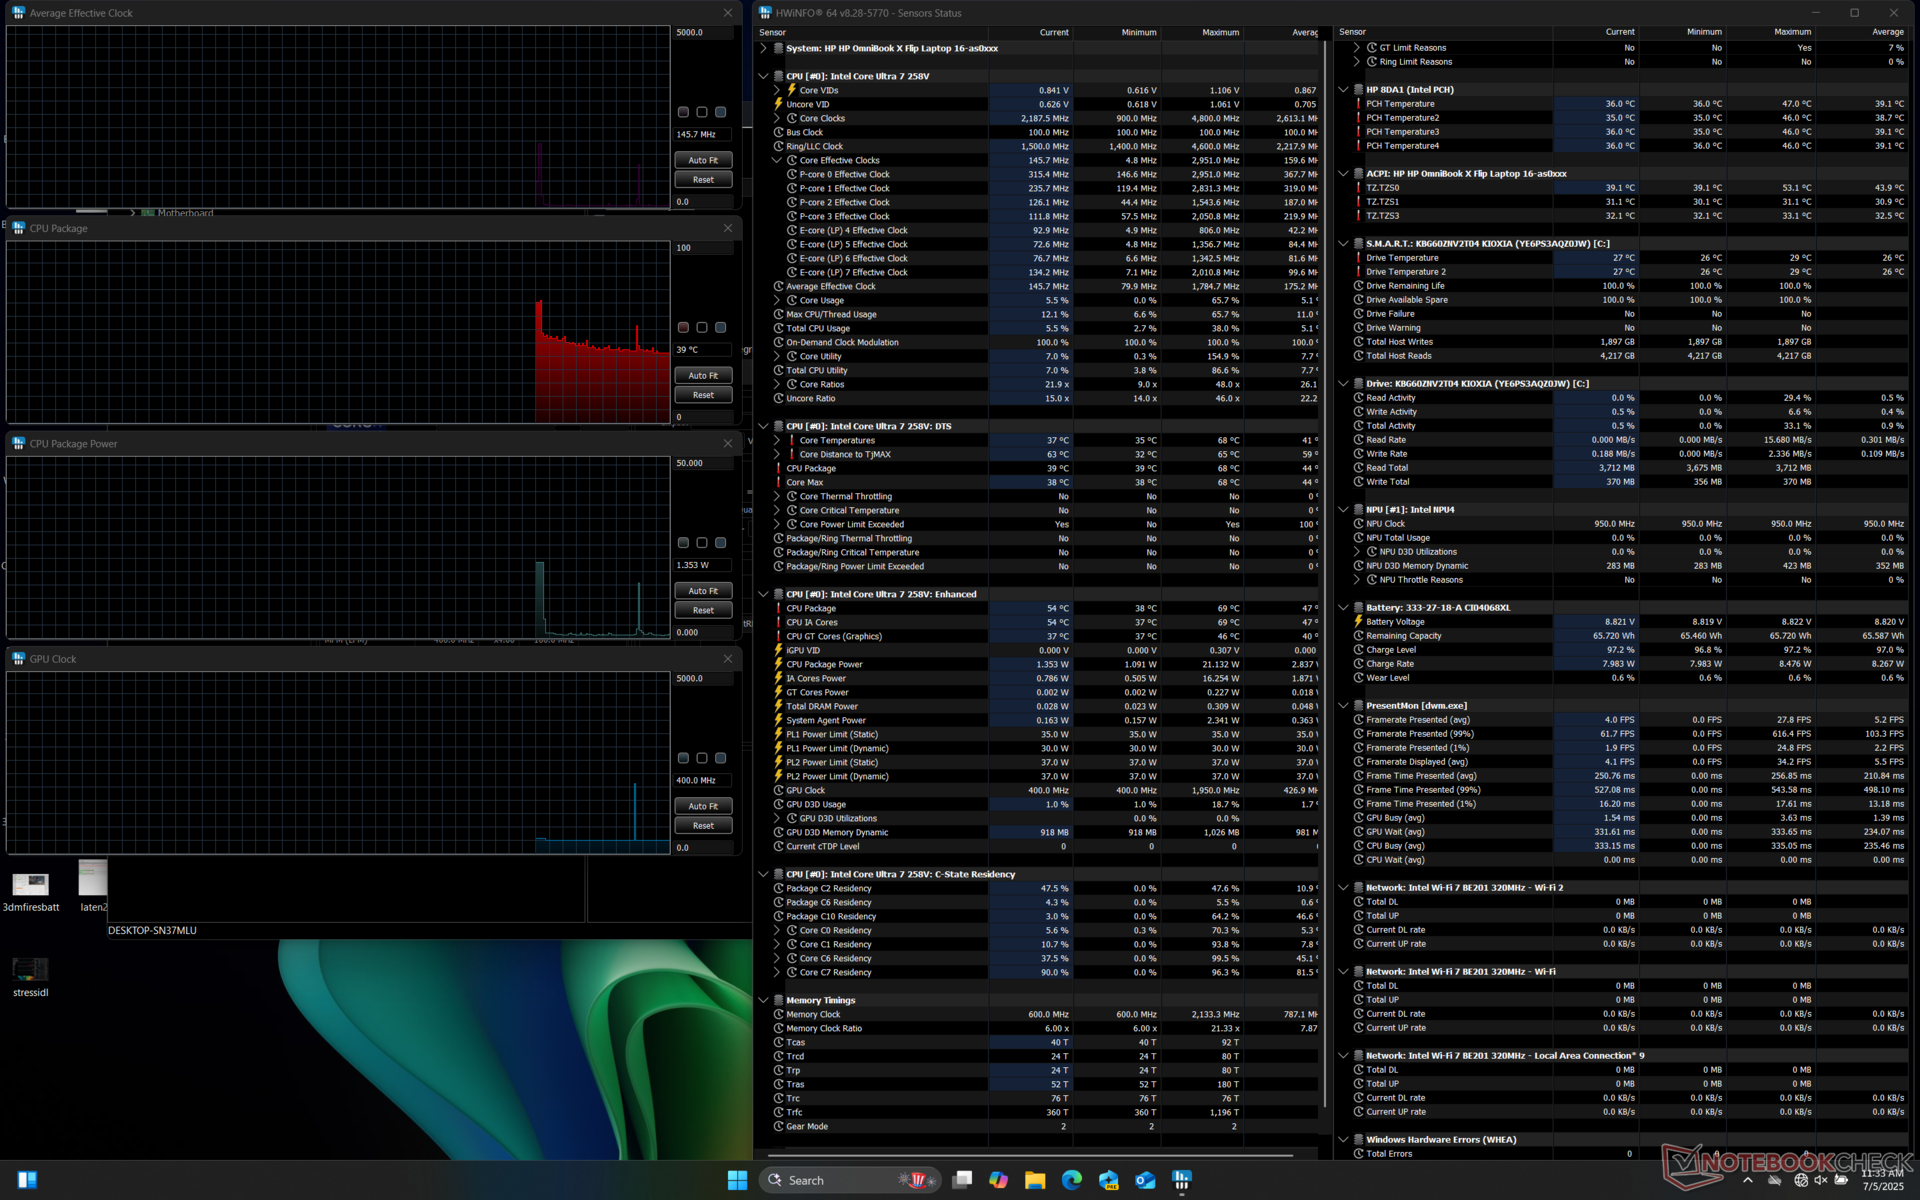

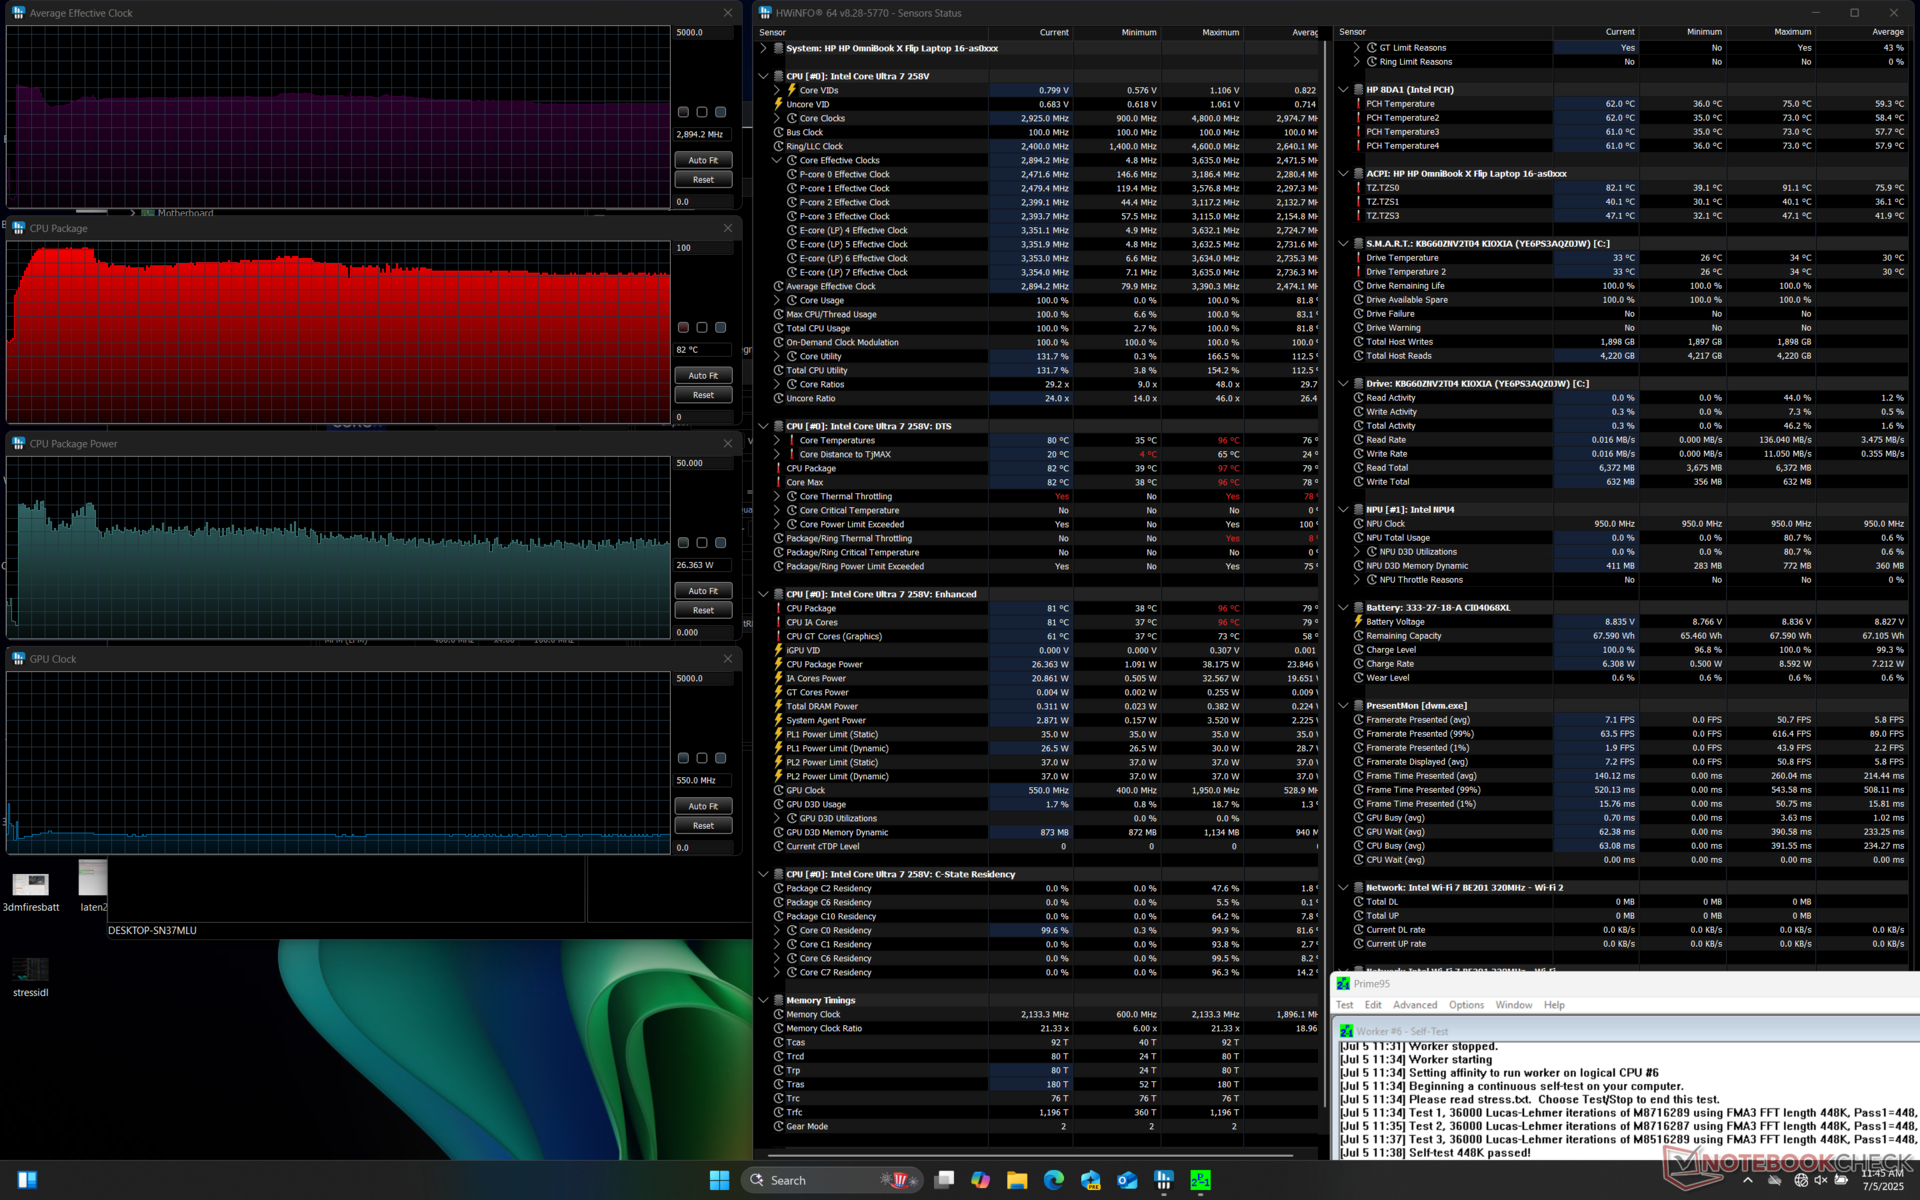
| Clock medio della CPU (GHz) | Clock della GPU (MHz) | Temperatura media della CPU (°C) | |
| Sistema inattivo | -- | -- | 39 |
| Stress Prime95 | 2,9 | -- | 82 |
| Prime95 + FurMark Stress | 2,3 | 1300 | 74 |
| Cyberpunk 2077 Stress | 1,3 | 1750 | 68 |
Prestazioni del sistema

PCMark 10: Score | Essentials | Productivity | Digital Content Creation
CrossMark: Overall | Productivity | Creativity | Responsiveness
WebXPRT 3: Overall
WebXPRT 4: Overall
Mozilla Kraken 1.1: Total
| Performance rating | |
| MSI Summit A16 AI Plus A3HMTG | |
| Lenovo Yoga 7 2-in-1 16ILL10 | |
| HP OmniBook X Flip 16 | |
| Dell 16 Plus 2-in-1 | |
| Media Intel Core Ultra 7 258V, Intel Arc Graphics 140V | |
| Samsung Galaxy Book5 Pro 360 | |
| HP Spectre x360 16 RTX 4050 | |
| PCMark 10 / Score | |
| MSI Summit A16 AI Plus A3HMTG | |
| Lenovo Yoga 7 2-in-1 16ILL10 | |
| HP OmniBook X Flip 16 | |
| Media Intel Core Ultra 7 258V, Intel Arc Graphics 140V (6265 - 7420, n=23) | |
| Dell 16 Plus 2-in-1 | |
| HP Spectre x360 16 RTX 4050 | |
| Samsung Galaxy Book5 Pro 360 | |
| PCMark 10 / Essentials | |
| Lenovo Yoga 7 2-in-1 16ILL10 | |
| MSI Summit A16 AI Plus A3HMTG | |
| HP OmniBook X Flip 16 | |
| Media Intel Core Ultra 7 258V, Intel Arc Graphics 140V (9295 - 11467, n=23) | |
| HP Spectre x360 16 RTX 4050 | |
| Dell 16 Plus 2-in-1 | |
| Samsung Galaxy Book5 Pro 360 | |
| PCMark 10 / Productivity | |
| MSI Summit A16 AI Plus A3HMTG | |
| Lenovo Yoga 7 2-in-1 16ILL10 | |
| HP OmniBook X Flip 16 | |
| HP Spectre x360 16 RTX 4050 | |
| Media Intel Core Ultra 7 258V, Intel Arc Graphics 140V (7357 - 13600, n=23) | |
| Samsung Galaxy Book5 Pro 360 | |
| Dell 16 Plus 2-in-1 | |
| PCMark 10 / Digital Content Creation | |
| MSI Summit A16 AI Plus A3HMTG | |
| Lenovo Yoga 7 2-in-1 16ILL10 | |
| HP OmniBook X Flip 16 | |
| Media Intel Core Ultra 7 258V, Intel Arc Graphics 140V (8160 - 10308, n=23) | |
| Dell 16 Plus 2-in-1 | |
| Samsung Galaxy Book5 Pro 360 | |
| HP Spectre x360 16 RTX 4050 | |
| CrossMark / Overall | |
| MSI Summit A16 AI Plus A3HMTG | |
| HP OmniBook X Flip 16 | |
| Lenovo Yoga 7 2-in-1 16ILL10 | |
| Dell 16 Plus 2-in-1 | |
| Media Intel Core Ultra 7 258V, Intel Arc Graphics 140V (1275 - 1742, n=22) | |
| Samsung Galaxy Book5 Pro 360 | |
| HP Spectre x360 16 RTX 4050 | |
| CrossMark / Productivity | |
| HP OmniBook X Flip 16 | |
| Lenovo Yoga 7 2-in-1 16ILL10 | |
| Dell 16 Plus 2-in-1 | |
| Media Intel Core Ultra 7 258V, Intel Arc Graphics 140V (1267 - 1684, n=22) | |
| MSI Summit A16 AI Plus A3HMTG | |
| Samsung Galaxy Book5 Pro 360 | |
| HP Spectre x360 16 RTX 4050 | |
| CrossMark / Creativity | |
| MSI Summit A16 AI Plus A3HMTG | |
| Lenovo Yoga 7 2-in-1 16ILL10 | |
| HP OmniBook X Flip 16 | |
| Dell 16 Plus 2-in-1 | |
| Media Intel Core Ultra 7 258V, Intel Arc Graphics 140V (1393 - 1977, n=22) | |
| HP Spectre x360 16 RTX 4050 | |
| Samsung Galaxy Book5 Pro 360 | |
| CrossMark / Responsiveness | |
| MSI Summit A16 AI Plus A3HMTG | |
| HP OmniBook X Flip 16 | |
| Lenovo Yoga 7 2-in-1 16ILL10 | |
| Samsung Galaxy Book5 Pro 360 | |
| Media Intel Core Ultra 7 258V, Intel Arc Graphics 140V (999 - 1411, n=22) | |
| Dell 16 Plus 2-in-1 | |
| HP Spectre x360 16 RTX 4050 | |
| WebXPRT 3 / Overall | |
| MSI Summit A16 AI Plus A3HMTG | |
| HP OmniBook X Flip 16 | |
| Lenovo Yoga 7 2-in-1 16ILL10 | |
| Dell 16 Plus 2-in-1 | |
| Media Intel Core Ultra 7 258V, Intel Arc Graphics 140V (219 - 317, n=22) | |
| HP Spectre x360 16 RTX 4050 | |
| Samsung Galaxy Book5 Pro 360 | |
| WebXPRT 4 / Overall | |
| Lenovo Yoga 7 2-in-1 16ILL10 | |
| Dell 16 Plus 2-in-1 | |
| HP OmniBook X Flip 16 | |
| Media Intel Core Ultra 7 258V, Intel Arc Graphics 140V (199.5 - 291, n=22) | |
| MSI Summit A16 AI Plus A3HMTG | |
| Samsung Galaxy Book5 Pro 360 | |
| HP Spectre x360 16 RTX 4050 | |
| Mozilla Kraken 1.1 / Total | |
| HP Spectre x360 16 RTX 4050 | |
| Samsung Galaxy Book5 Pro 360 | |
| HP OmniBook X Flip 16 | |
| Media Intel Core Ultra 7 258V, Intel Arc Graphics 140V (468 - 559, n=24) | |
| Dell 16 Plus 2-in-1 | |
| Lenovo Yoga 7 2-in-1 16ILL10 | |
| MSI Summit A16 AI Plus A3HMTG | |
* ... Meglio usare valori piccoli
| PCMark 10 Score | 7131 punti | |
Aiuto | ||
| AIDA64 / Memory Copy | |
| Media Intel Core Ultra 7 258V (104408 - 114336, n=24) | |
| HP OmniBook X Flip 16 | |
| Dell 16 Plus 2-in-1 | |
| Samsung Galaxy Book5 Pro 360 | |
| Lenovo Yoga 7 2-in-1 16ILL10 | |
| MSI Summit A16 AI Plus A3HMTG | |
| HP Spectre x360 16 RTX 4050 | |
| AIDA64 / Memory Read | |
| MSI Summit A16 AI Plus A3HMTG | |
| Lenovo Yoga 7 2-in-1 16ILL10 | |
| Dell 16 Plus 2-in-1 | |
| Media Intel Core Ultra 7 258V (82846 - 89417, n=24) | |
| HP Spectre x360 16 RTX 4050 | |
| HP OmniBook X Flip 16 | |
| Samsung Galaxy Book5 Pro 360 | |
| AIDA64 / Memory Write | |
| Lenovo Yoga 7 2-in-1 16ILL10 | |
| HP OmniBook X Flip 16 | |
| Dell 16 Plus 2-in-1 | |
| Media Intel Core Ultra 7 258V (108824 - 117989, n=24) | |
| Samsung Galaxy Book5 Pro 360 | |
| MSI Summit A16 AI Plus A3HMTG | |
| HP Spectre x360 16 RTX 4050 | |
| AIDA64 / Memory Latency | |
| HP Spectre x360 16 RTX 4050 | |
| MSI Summit A16 AI Plus A3HMTG | |
| Dell 16 Plus 2-in-1 | |
| Lenovo Yoga 7 2-in-1 16ILL10 | |
| HP OmniBook X Flip 16 | |
| Media Intel Core Ultra 7 258V (95 - 101.7, n=24) | |
| Samsung Galaxy Book5 Pro 360 | |
* ... Meglio usare valori piccoli
Latenza DPC
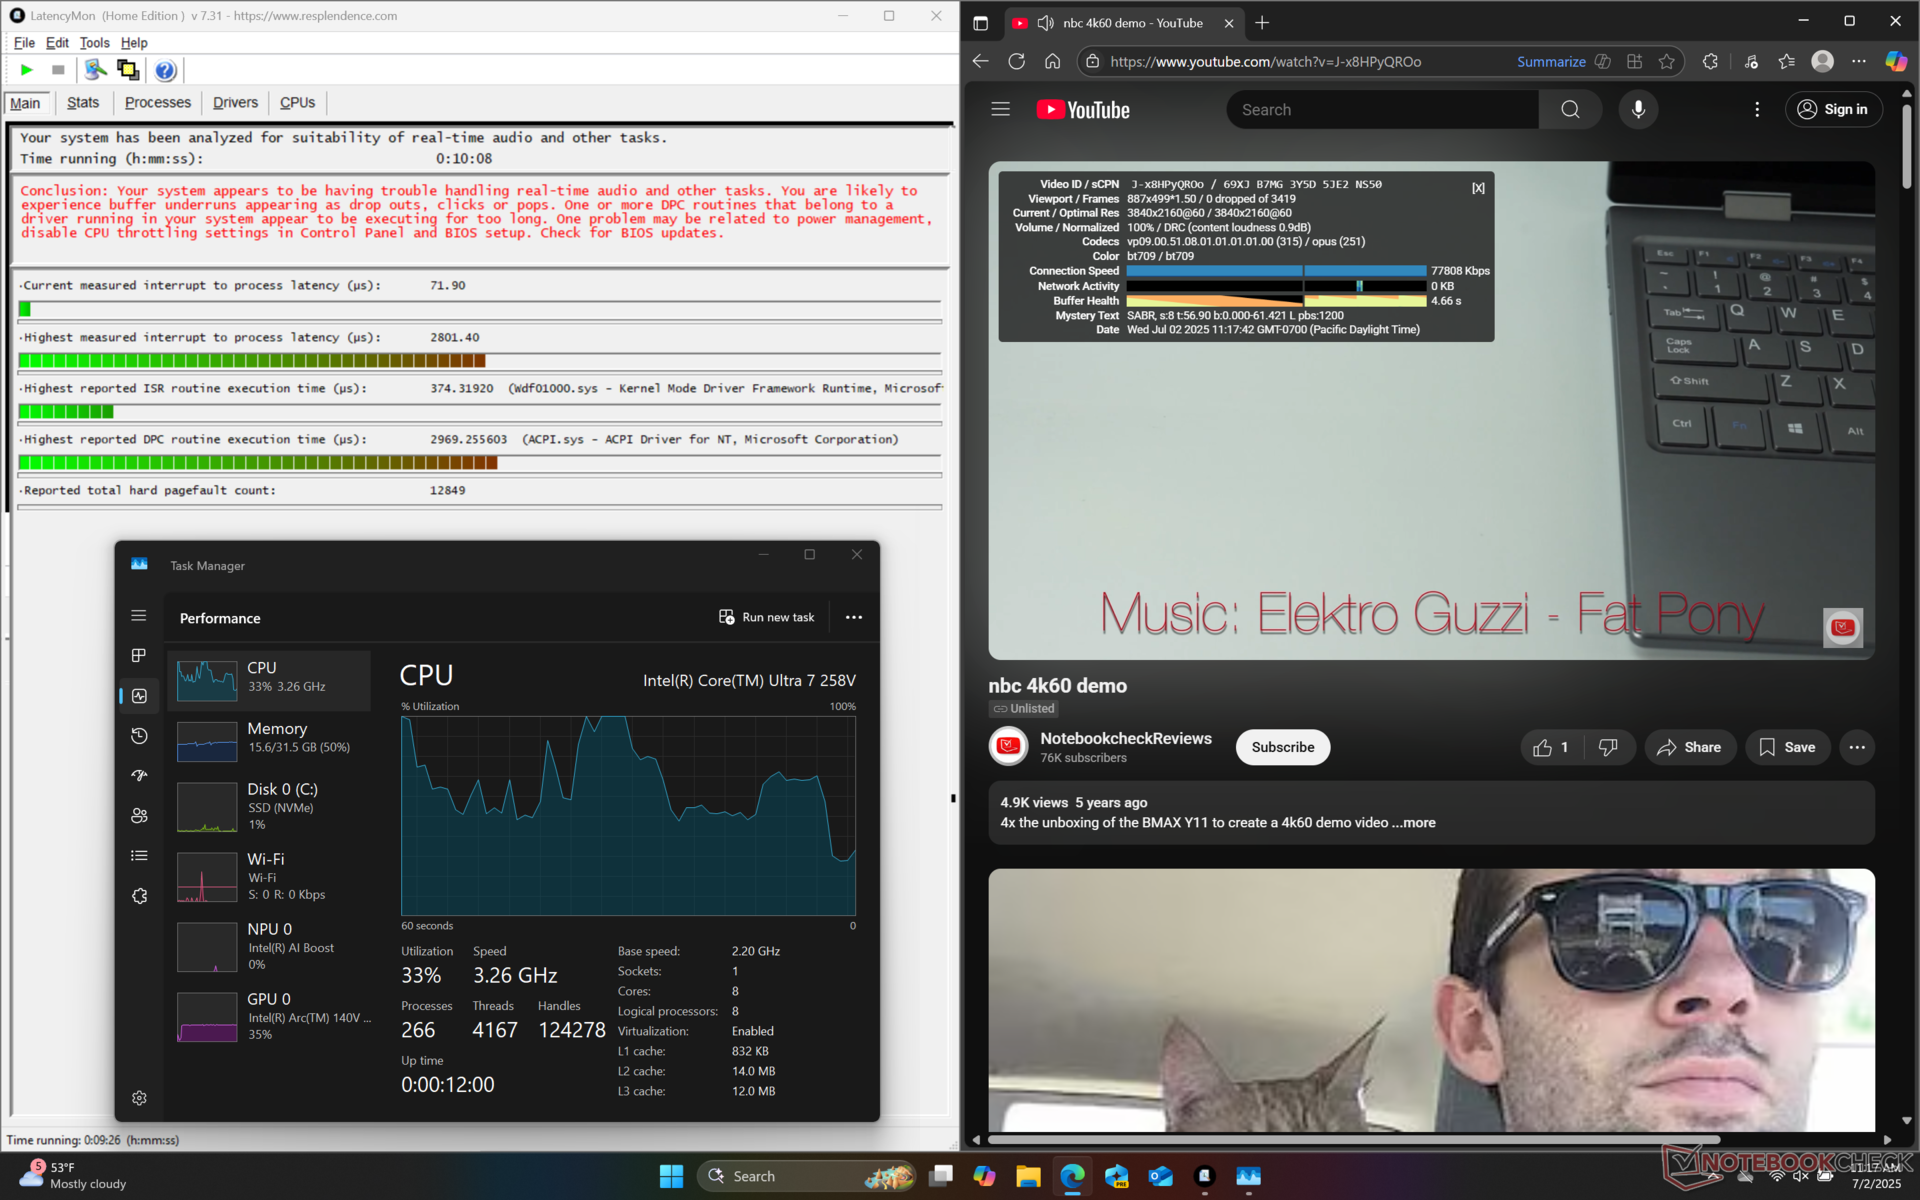
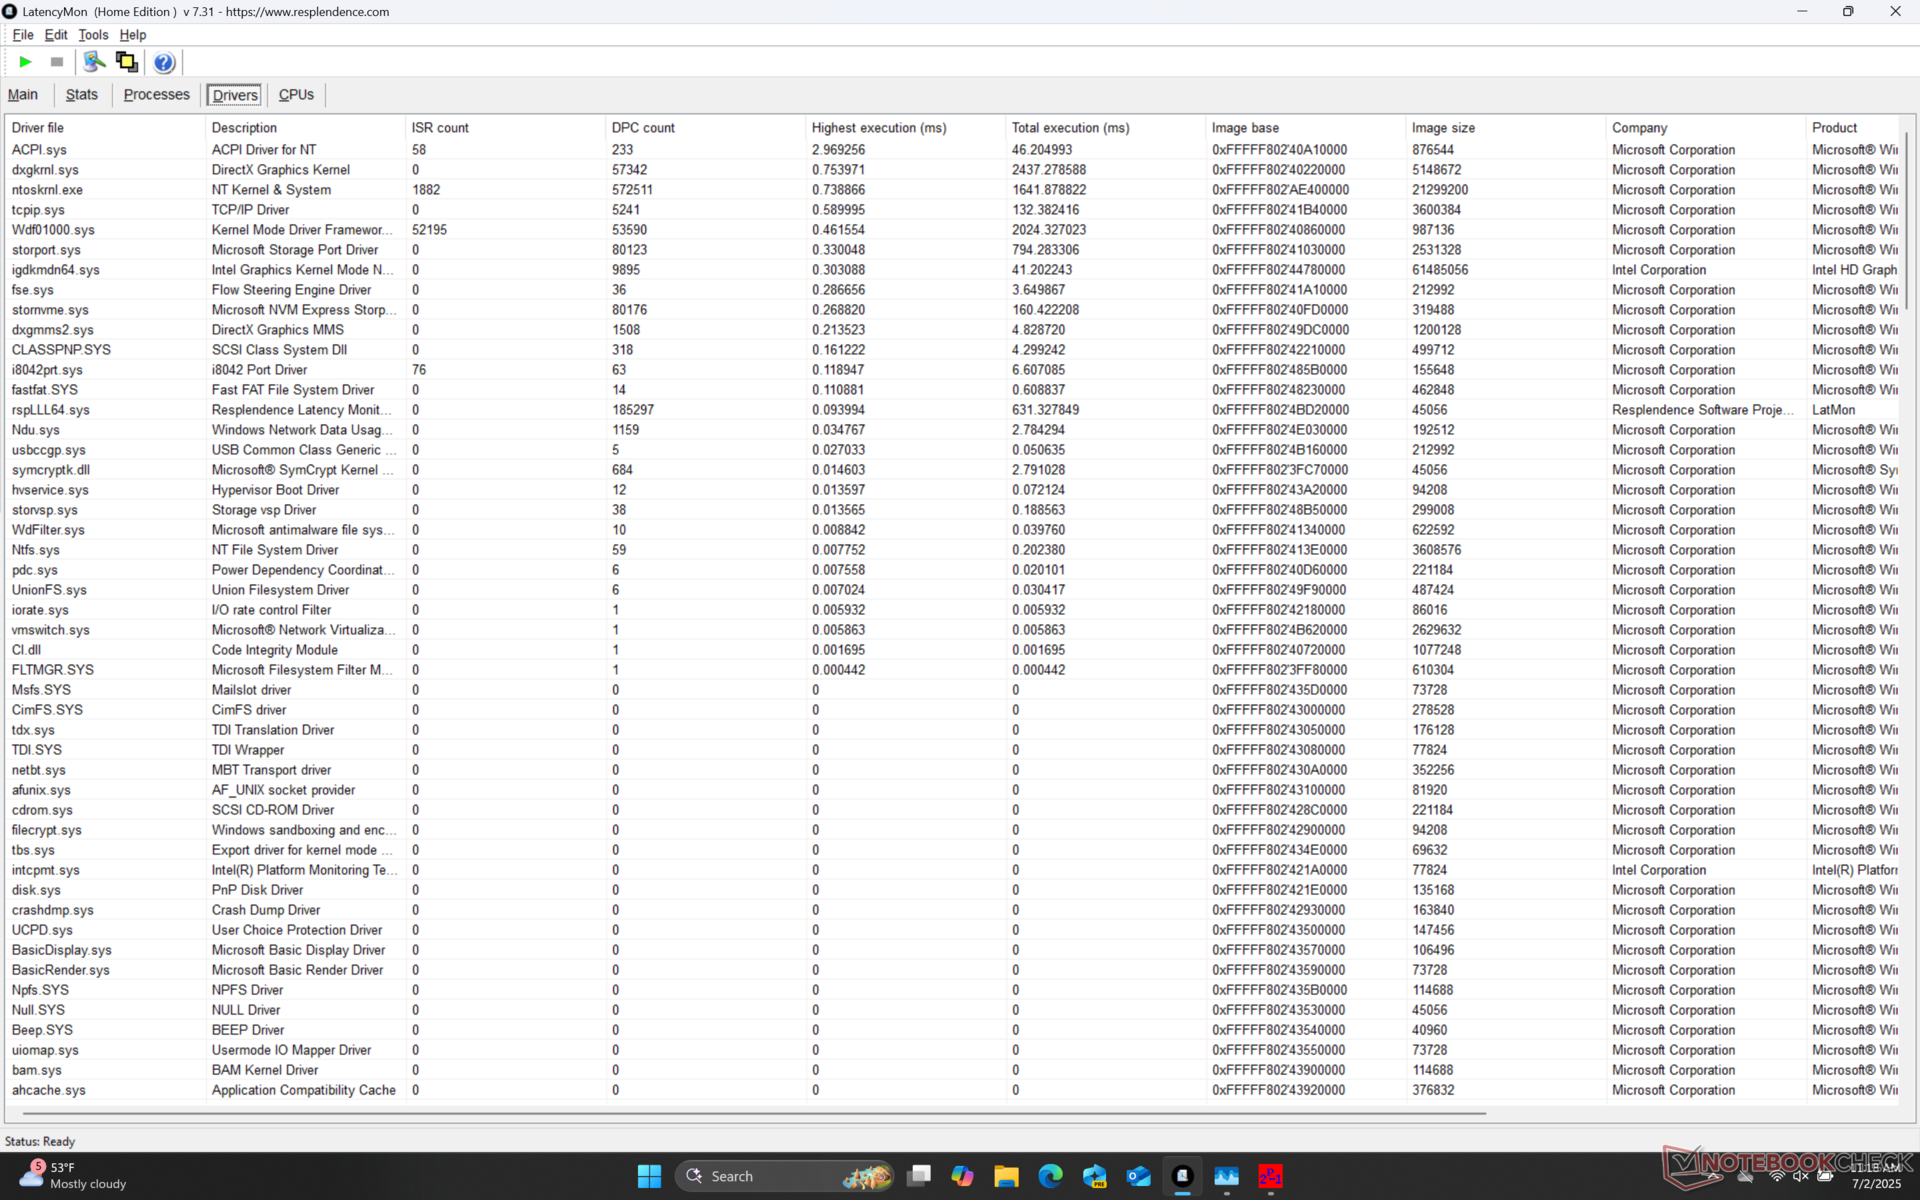
| DPC Latencies / LatencyMon - interrupt to process latency (max), Web, Youtube, Prime95 | |
| HP Spectre x360 16 RTX 4050 | |
| MSI Summit A16 AI Plus A3HMTG | |
| HP OmniBook X Flip 16 | |
| Dell 16 Plus 2-in-1 | |
| Samsung Galaxy Book5 Pro 360 | |
| Lenovo Yoga 7 2-in-1 16ILL10 | |
* ... Meglio usare valori piccoli
Dispositivi di archiviazione
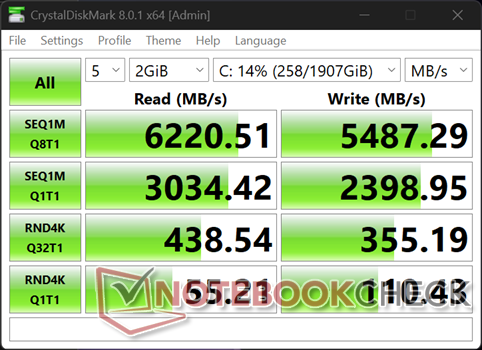
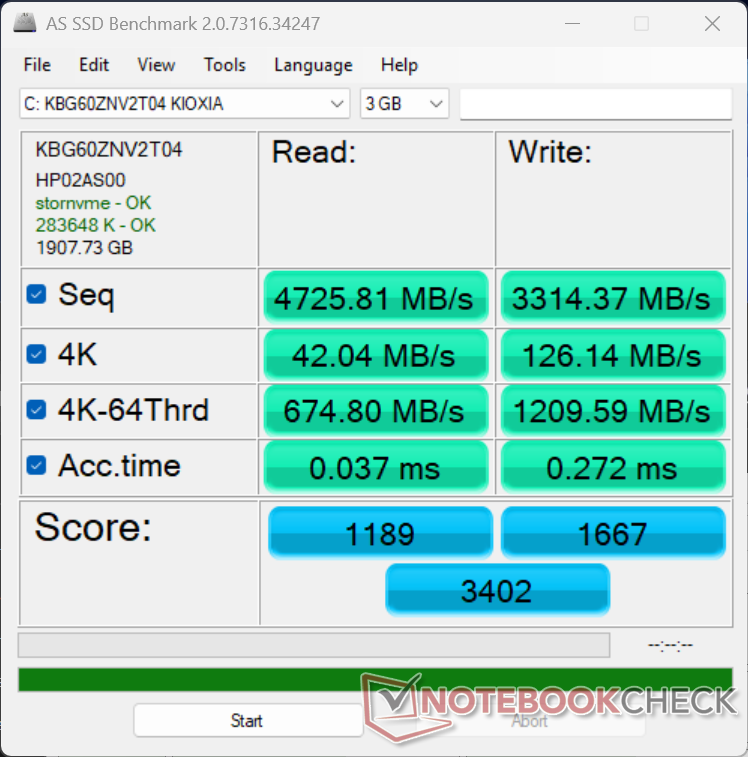

| Drive Performance rating - Percent | |
| Samsung Galaxy Book5 Pro 360 | |
| HP Spectre x360 16 RTX 4050 | |
| Lenovo Yoga 7 2-in-1 16ILL10 | |
| MSI Summit A16 AI Plus A3HMTG | |
| HP OmniBook X Flip 16 | |
| Dell 16 Plus 2-in-1 | |
* ... Meglio usare valori piccoli
Disk Throttling: DiskSpd Read Loop, Queue Depth 8
Prestazioni della GPU
Il Arc Graphics 140V è un notevole miglioramento rispetto all'ultima generazione Serie Iris Xe e circa il 15 percento più veloce rispetto al modello minore Arc 130V della configurazione Arc 130V. Non è ancora all'altezza della GPU discreta di Nvidia nel modello HP Spectre x360 16tuttavia.
Il funzionamento a batteria riduce le prestazioni fino al 20 percento.
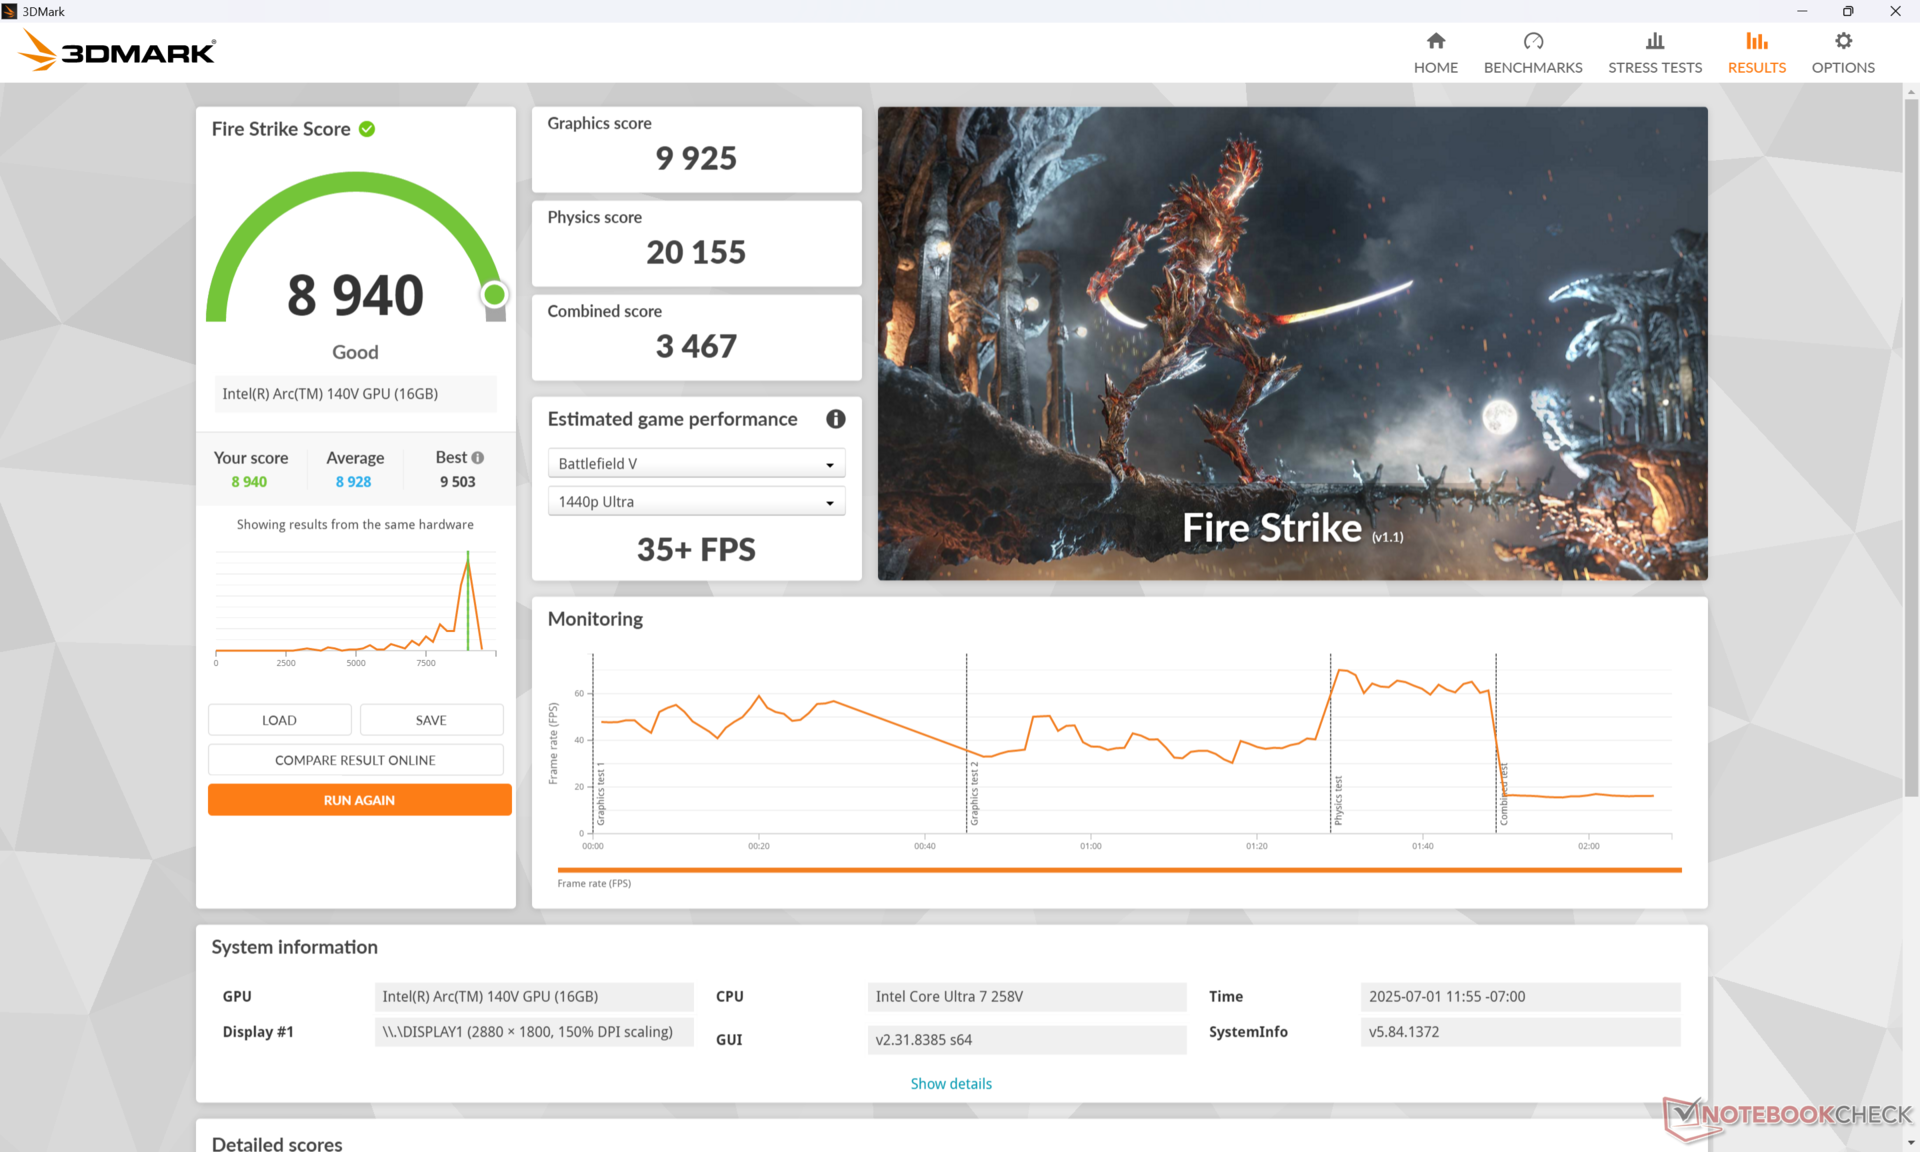
| Profilo energetico | Punteggio grafico | Punteggio Fisica | Punteggio combinato |
| Modalità Prestazioni | 9925 | 20155 | 3467 |
| Modalità equilibrata | 9910 (-0%) | 20635 (-0%) | 3466 (-0%) |
| Potenza della batteria | 8048 (-19%) | 16246 (-19%) | 2499 (-28%) |
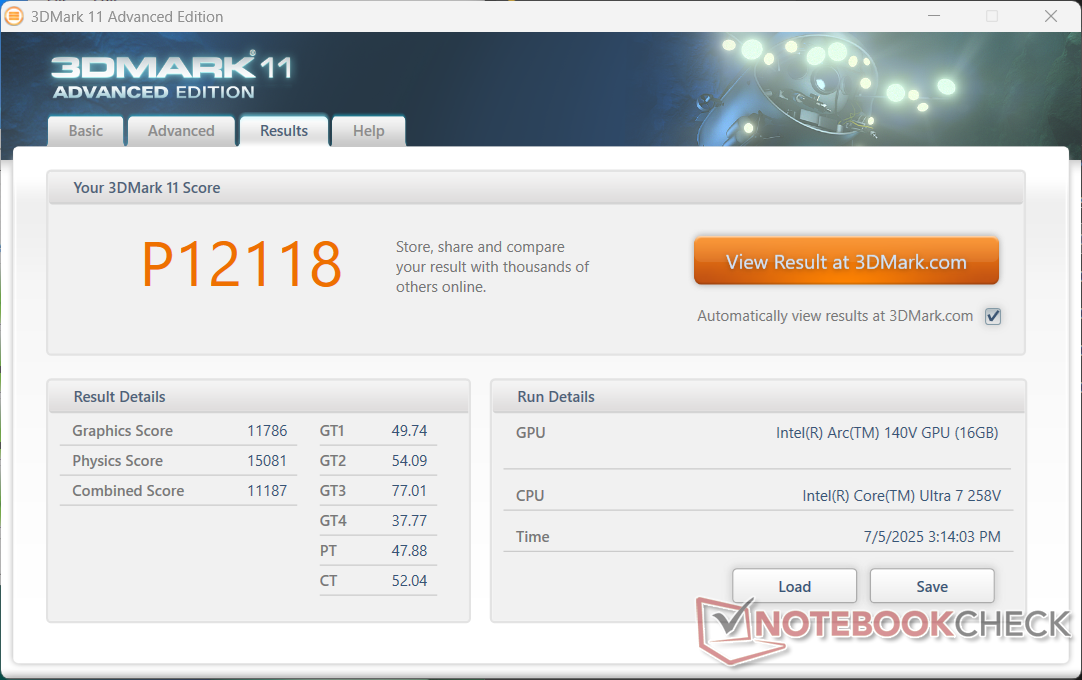
| 3DMark 11 Performance | 12118 punti | |
| 3DMark Cloud Gate Standard Score | 32872 punti | |
| 3DMark Fire Strike Score | 8940 punti | |
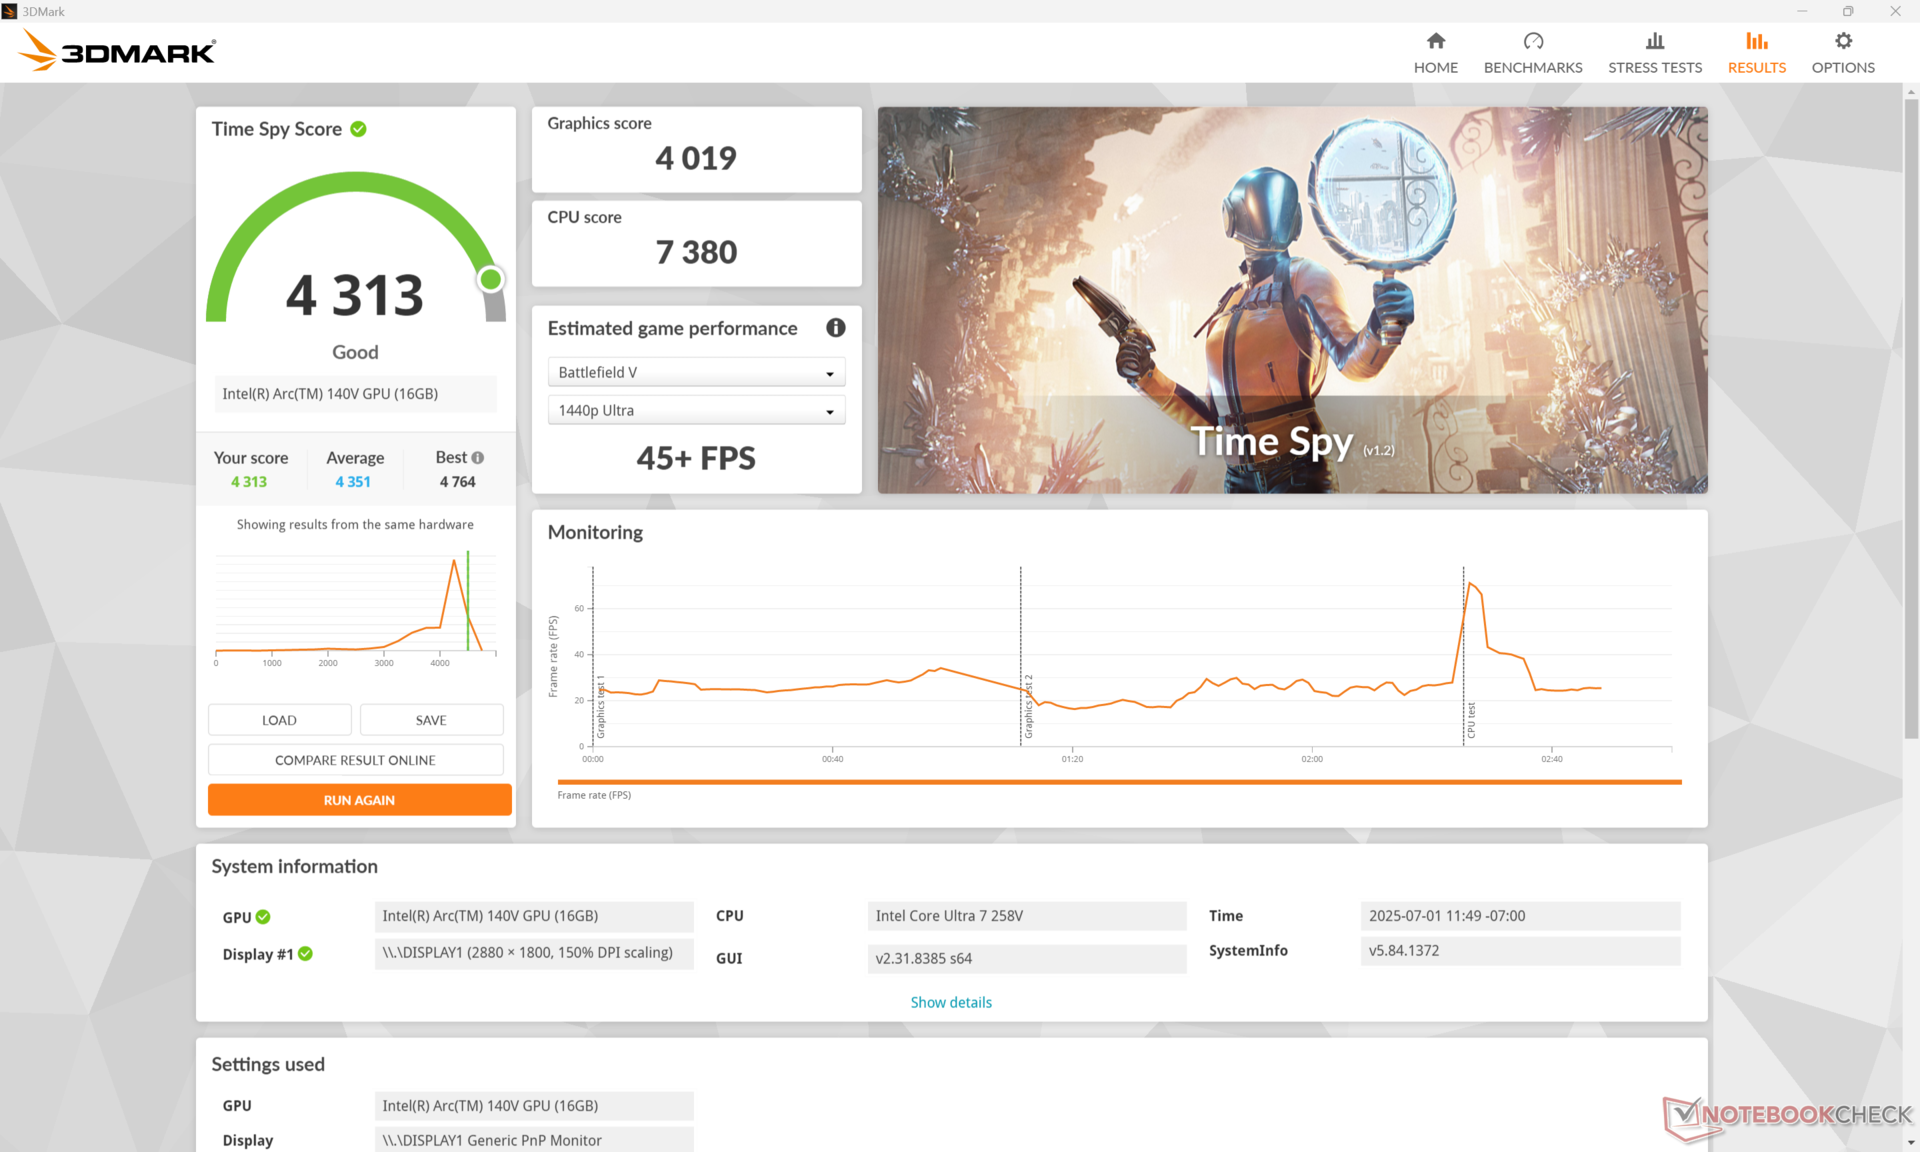
| 3DMark Time Spy Score | 4313 punti | |
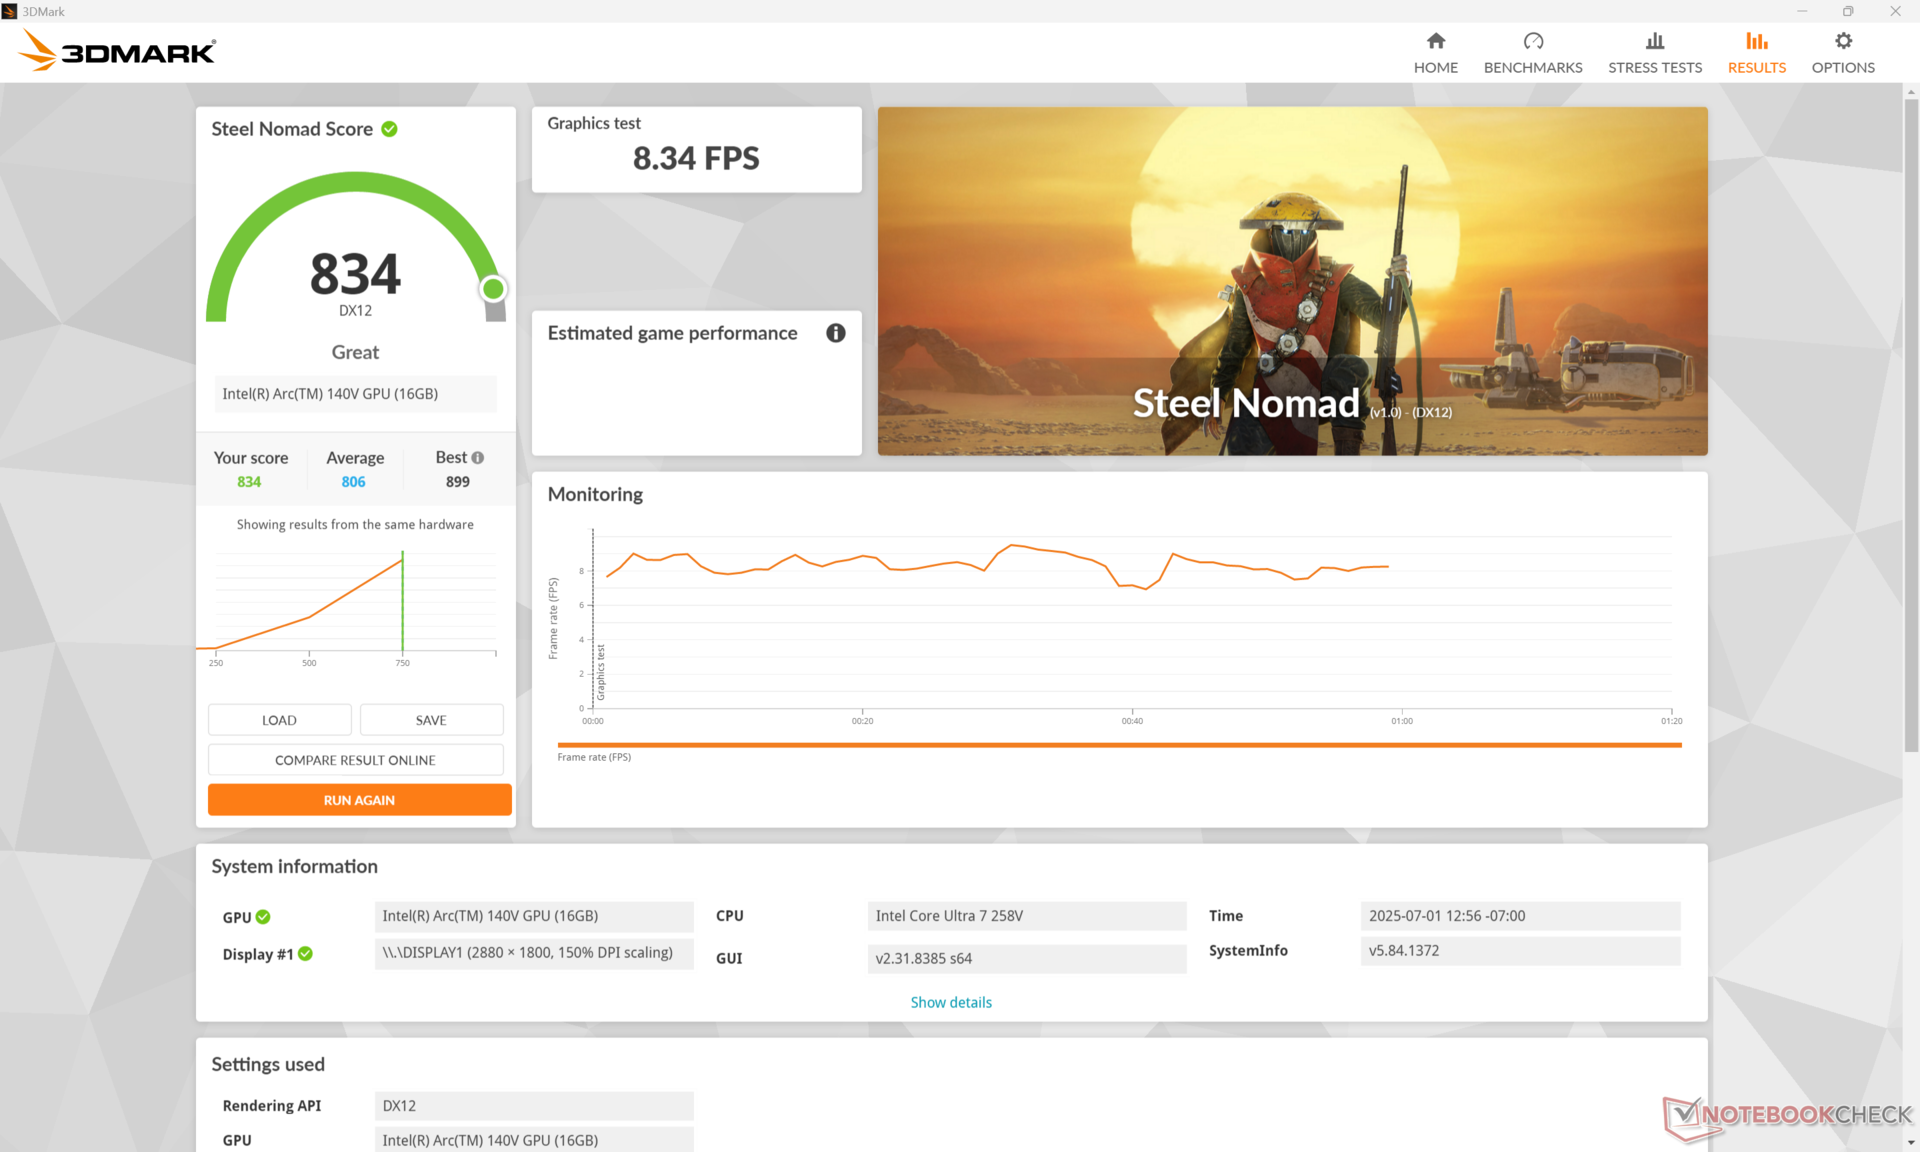
| 3DMark Steel Nomad Score | 834 punti | |
Aiuto | ||
* ... Meglio usare valori piccoli
| F1 24 | |
| 1920x1080 Low Preset AA:T AF:16x | |
| HP OmniBook X Flip 16 | |
| Lenovo Yoga 7 2-in-1 16ILL10 | |
| Dell 16 Plus 2-in-1 | |
| Media Intel Arc Graphics 140V (54 - 99, n=25) | |
| Asus Zenbook S 16 UM5606WA-RK052W | |
| 1920x1080 Medium Preset AA:T AF:16x | |
| HP OmniBook X Flip 16 | |
| Lenovo Yoga 7 2-in-1 16ILL10 | |
| Dell 16 Plus 2-in-1 | |
| Media Intel Arc Graphics 140V (49.2 - 88.2, n=24) | |
| Asus Zenbook S 16 UM5606WA-RK052W | |
| 1920x1080 High Preset AA:T AF:16x | |
| HP OmniBook X Flip 16 | |
| Dell 16 Plus 2-in-1 | |
| Lenovo Yoga 7 2-in-1 16ILL10 | |
| Media Intel Arc Graphics 140V (34.4 - 66.4, n=27) | |
| Asus Zenbook S 16 UM5606WA-RK052W | |
| 1920x1080 Ultra High Preset AA:T AF:16x | |
| HP OmniBook X Flip 16 | |
| Lenovo Yoga 7 2-in-1 16ILL10 | |
| Dell 16 Plus 2-in-1 | |
| Media Intel Arc Graphics 140V (14.6 - 22, n=25) | |
| Asus Zenbook S 16 UM5606WA-RK052W | |
Cyberpunk 2077 ultra FPS Chart
| basso | medio | alto | ultra | |
|---|---|---|---|---|
| Dota 2 Reborn (2015) | 97.2 | 88.4 | 63.5 | 84.9 |
| Final Fantasy XV Benchmark (2018) | 92.9 | 48.8 | 35.5 | |
| X-Plane 11.11 (2018) | 41.8 | 37.9 | 31.9 | |
| Strange Brigade (2018) | 246 | 79.6 | 67.7 | 58.7 |
| Baldur's Gate 3 (2023) | 43 | 36.1 | 29.7 | 29.1 |
| Cyberpunk 2077 (2023) | 46.4 | 37.5 | 32.9 | 23.3 |
| F1 24 (2024) | 91.9 | 83.9 | 64.6 | 20.9 |
Emissioni
Rumore del sistema
Il rumore della ventola si aggira generalmente intorno ai 28,6 dB(A) contro uno sfondo silenzioso di 27,5 dB(A) durante la navigazione sul web o lo streaming di video. Raggiunge il suo massimo di poco meno di 38 dB(A) piuttosto rapidamente quando vengono introdotti carichi più elevati come i giochi.
Rumorosità
| Idle |
| 28 / 28.3 / 28.3 dB(A) |
| Sotto carico |
| 37.7 / 37.6 dB(A) |
 | ||
30 dB silenzioso 40 dB(A) udibile 50 dB(A) rumoroso |
||
min: | ||
| HP OmniBook X Flip 16 Arc 140V, Core Ultra 7 258V | Dell 16 Plus 2-in-1 Arc 140V, Core Ultra 7 258V, Samsung BM9C1 1024GB | Lenovo Yoga 7 2-in-1 16ILL10 Arc 140V, Core Ultra 7 256V, WD PC SN7100S SDFPMSL-512G-1101 | Samsung Galaxy Book5 Pro 360 Arc 130V, Core Ultra 5 226V, Samsung PM9B1 512GB MZVL4512HBLU | MSI Summit A16 AI Plus A3HMTG Radeon 880M, Ryzen AI 9 365, Samsung PM9C1 MZVL81T0HELB-00BTW | HP Spectre x360 16 RTX 4050 GeForce RTX 4050 Laptop GPU, Ultra 7 155H, SK hynix PC801 HFS001TEJ9X101N | |
|---|---|---|---|---|---|---|
| Noise | 6% | 4% | 9% | -6% | 17% | |
| off /ambiente * (dB) | 27.5 | 23.2 16% | 23.3 15% | 23.6 14% | 23.8 13% | 23.3 15% |
| Idle Minimum * (dB) | 28 | 23 18% | 23.3 17% | 23.6 16% | 25 11% | 23.6 16% |
| Idle Average * (dB) | 28.3 | 23 19% | 23.3 18% | 23.6 17% | 25 12% | 23.6 17% |
| Idle Maximum * (dB) | 28.3 | 24.7 13% | 25.7 9% | 23.6 17% | 29.5 -4% | 23.6 17% |
| Load Average * (dB) | 37.7 | 32.5 14% | 40.2 -7% | 29.4 22% | 37.5 1% | 29.2 23% |
| Cyberpunk 2077 ultra * (dB) | 36.2 | 42.6 -18% | 41.6 -15% | 40.6 -12% | 46.5 -28% | |
| Load Maximum * (dB) | 37.6 | 45.6 -21% | 41.6 -11% | 40.6 -8% | 56.1 -49% | 32.1 15% |
| Witcher 3 ultra * (dB) | 32.1 |
* ... Meglio usare valori piccoli
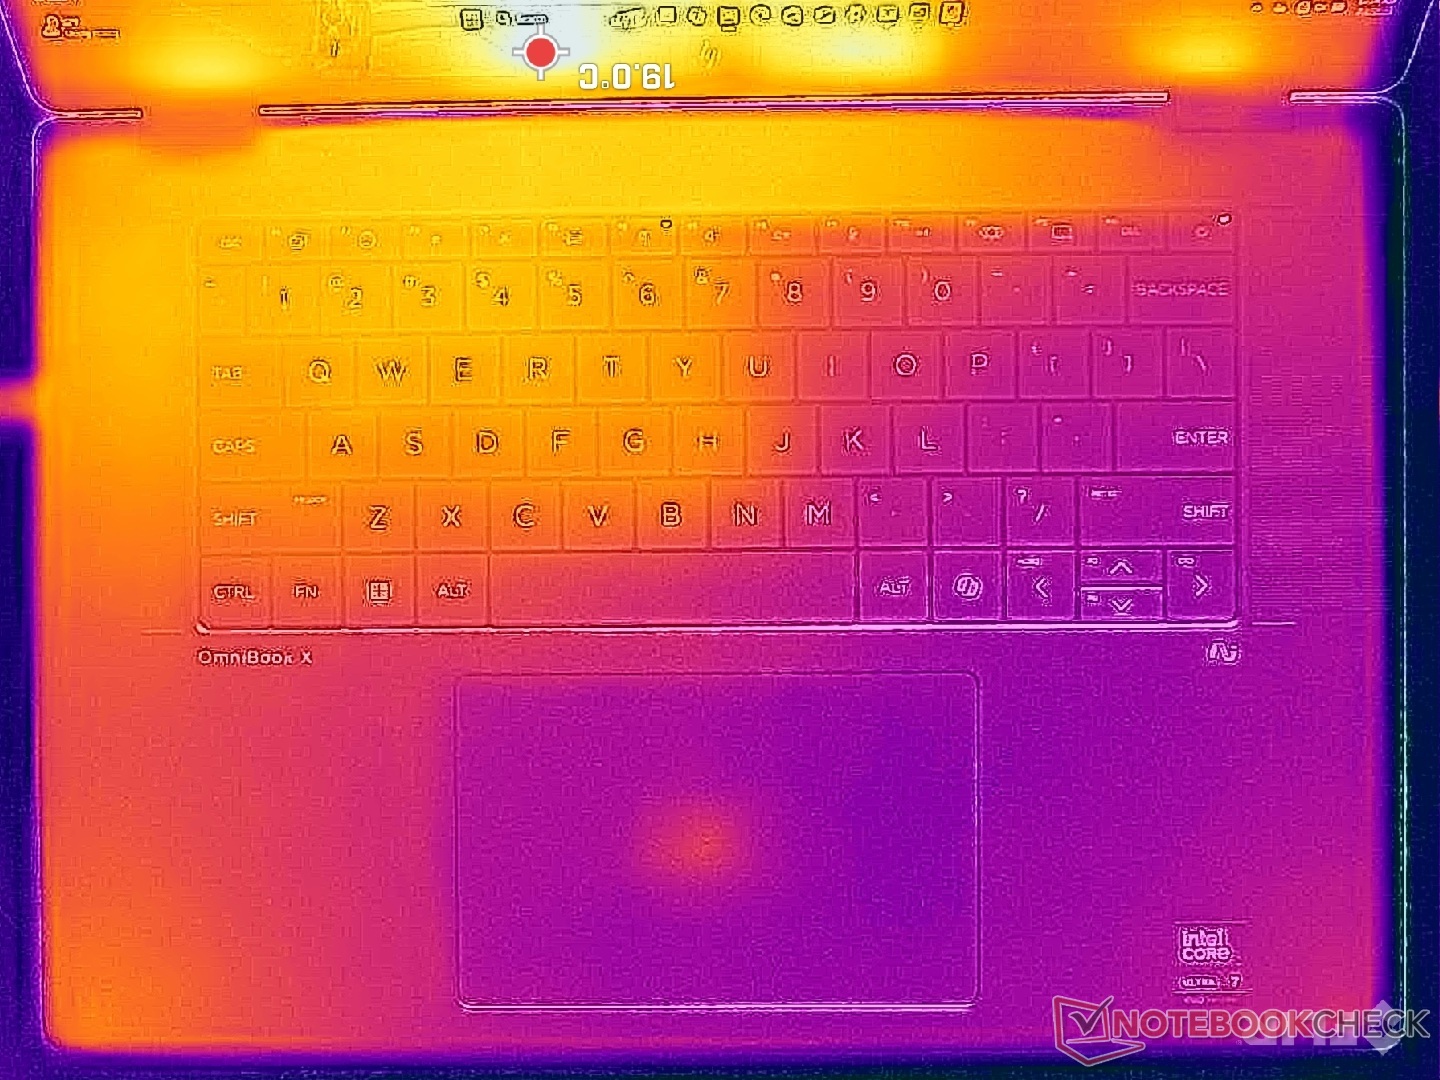
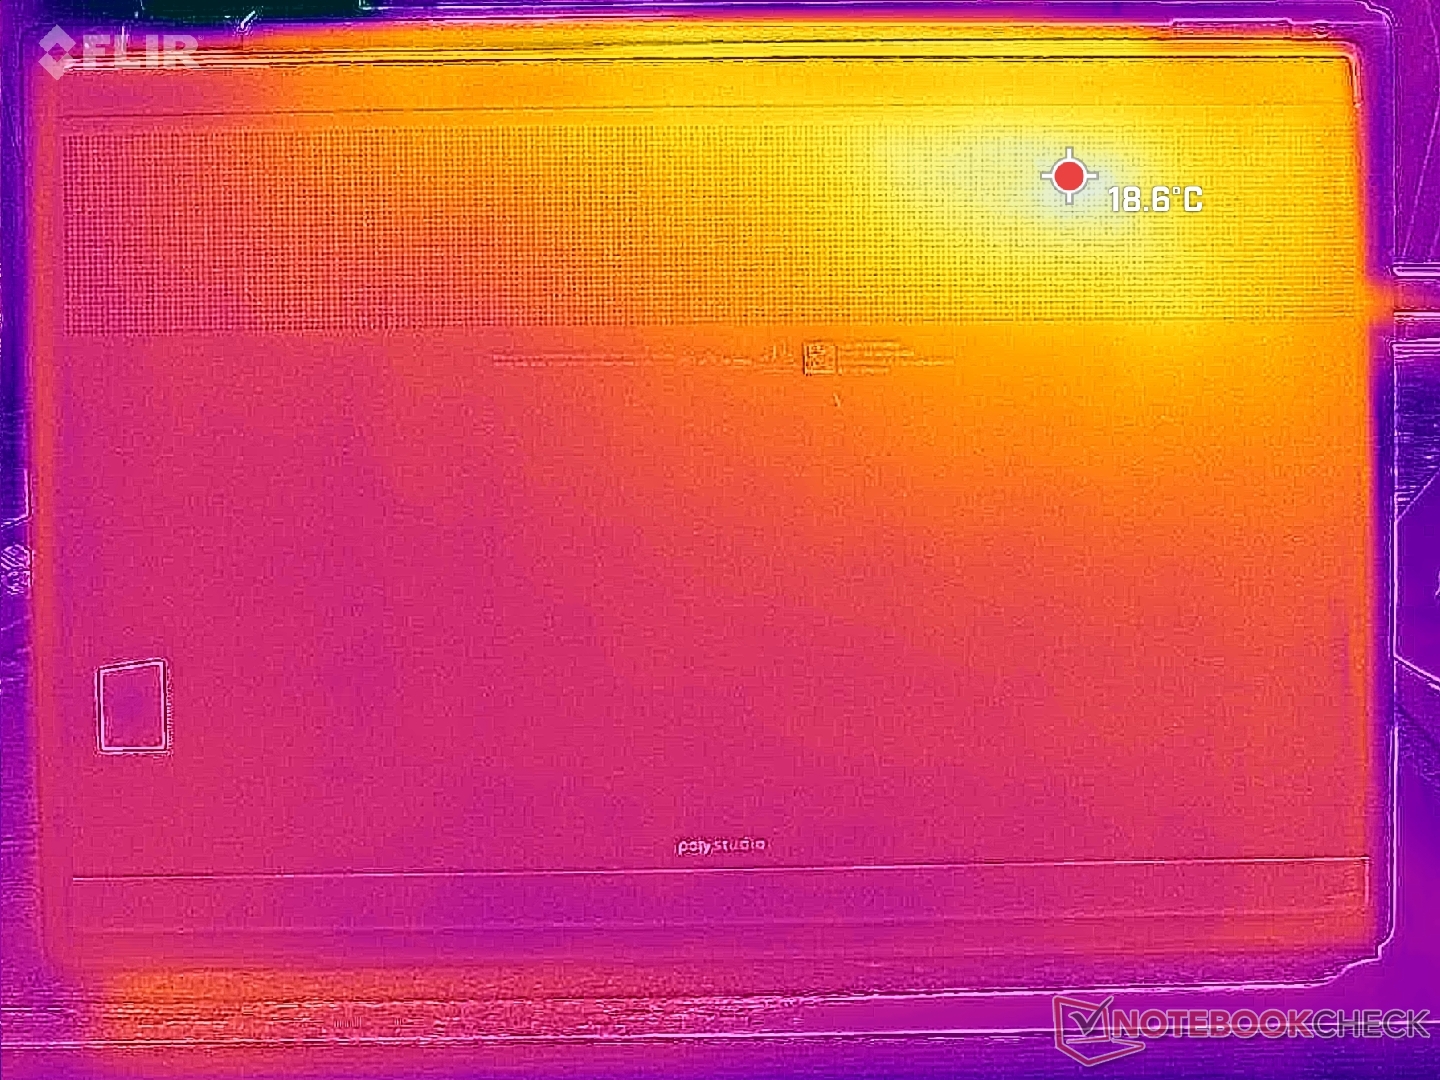
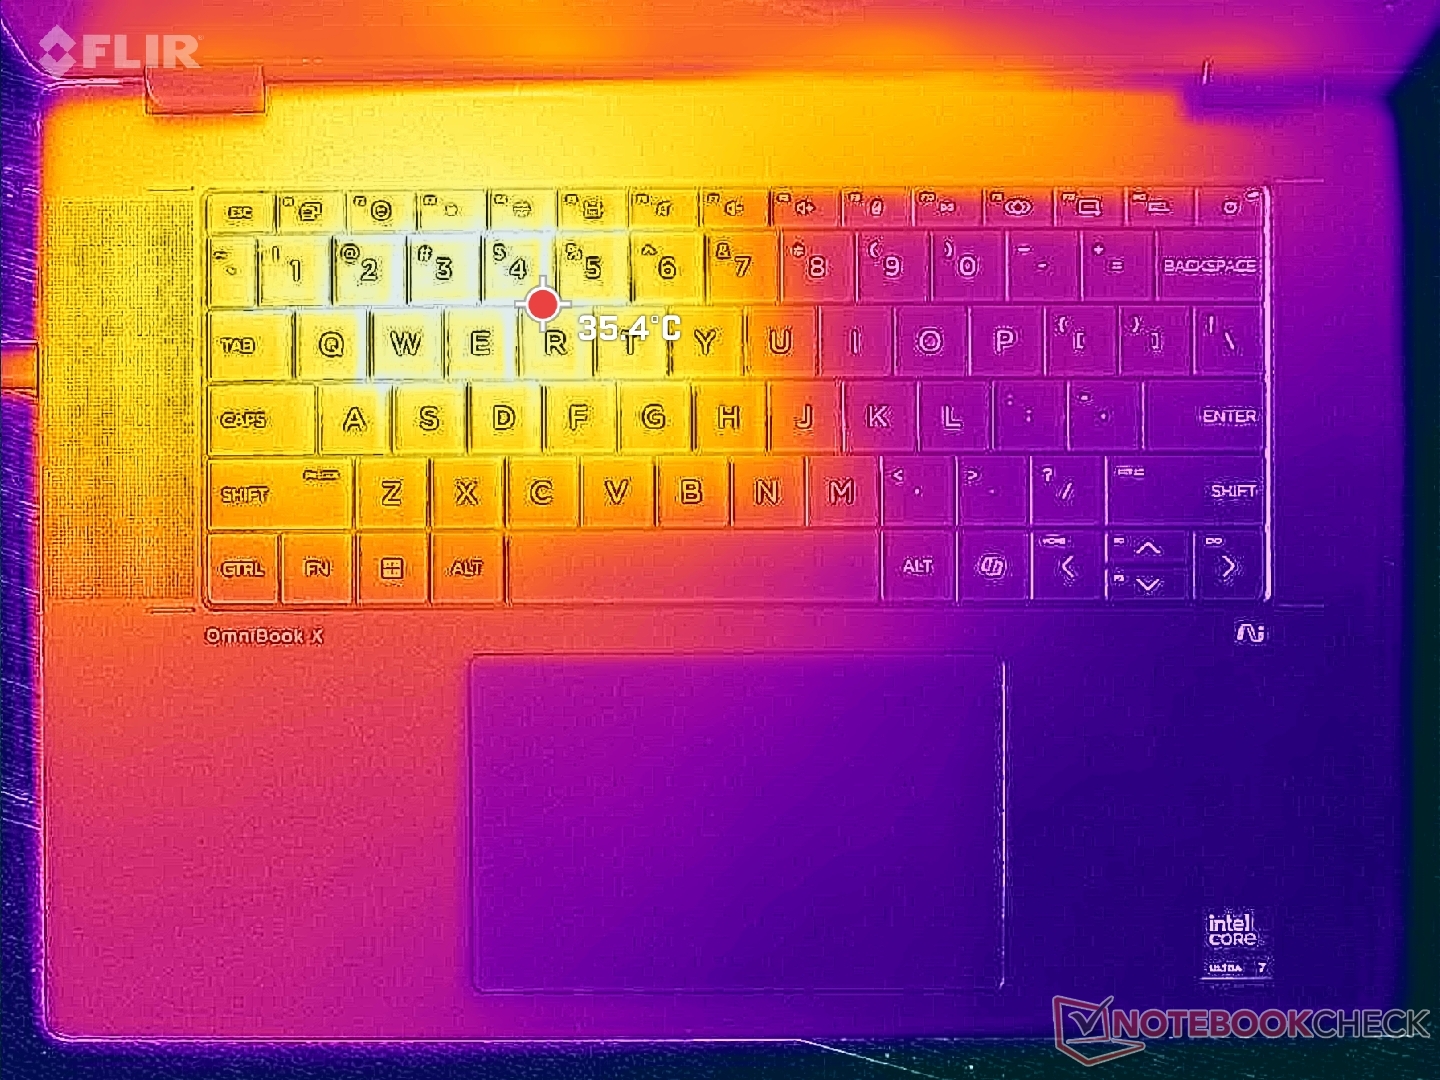
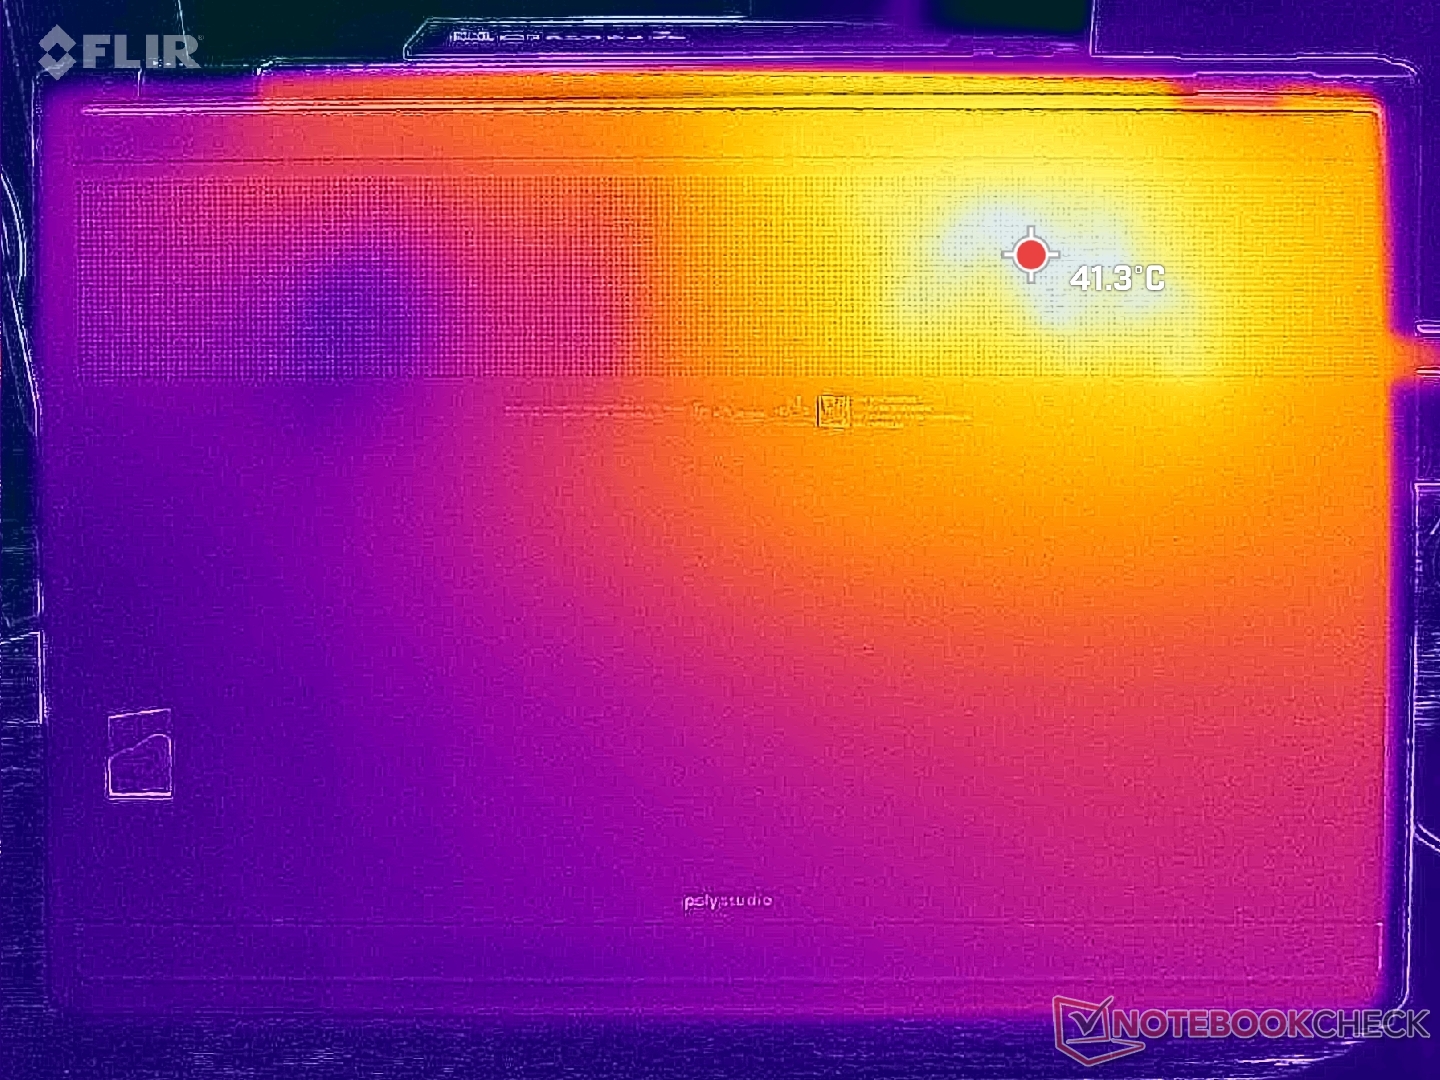
Temperatura
I punti caldi della superficie sono simili a quelli che abbiamo osservato sul concorrente Dell Plus 16 2-in-1. Su HP, tuttavia, i punti caldi sono sensibilmente più freddi, di diversi gradi C.
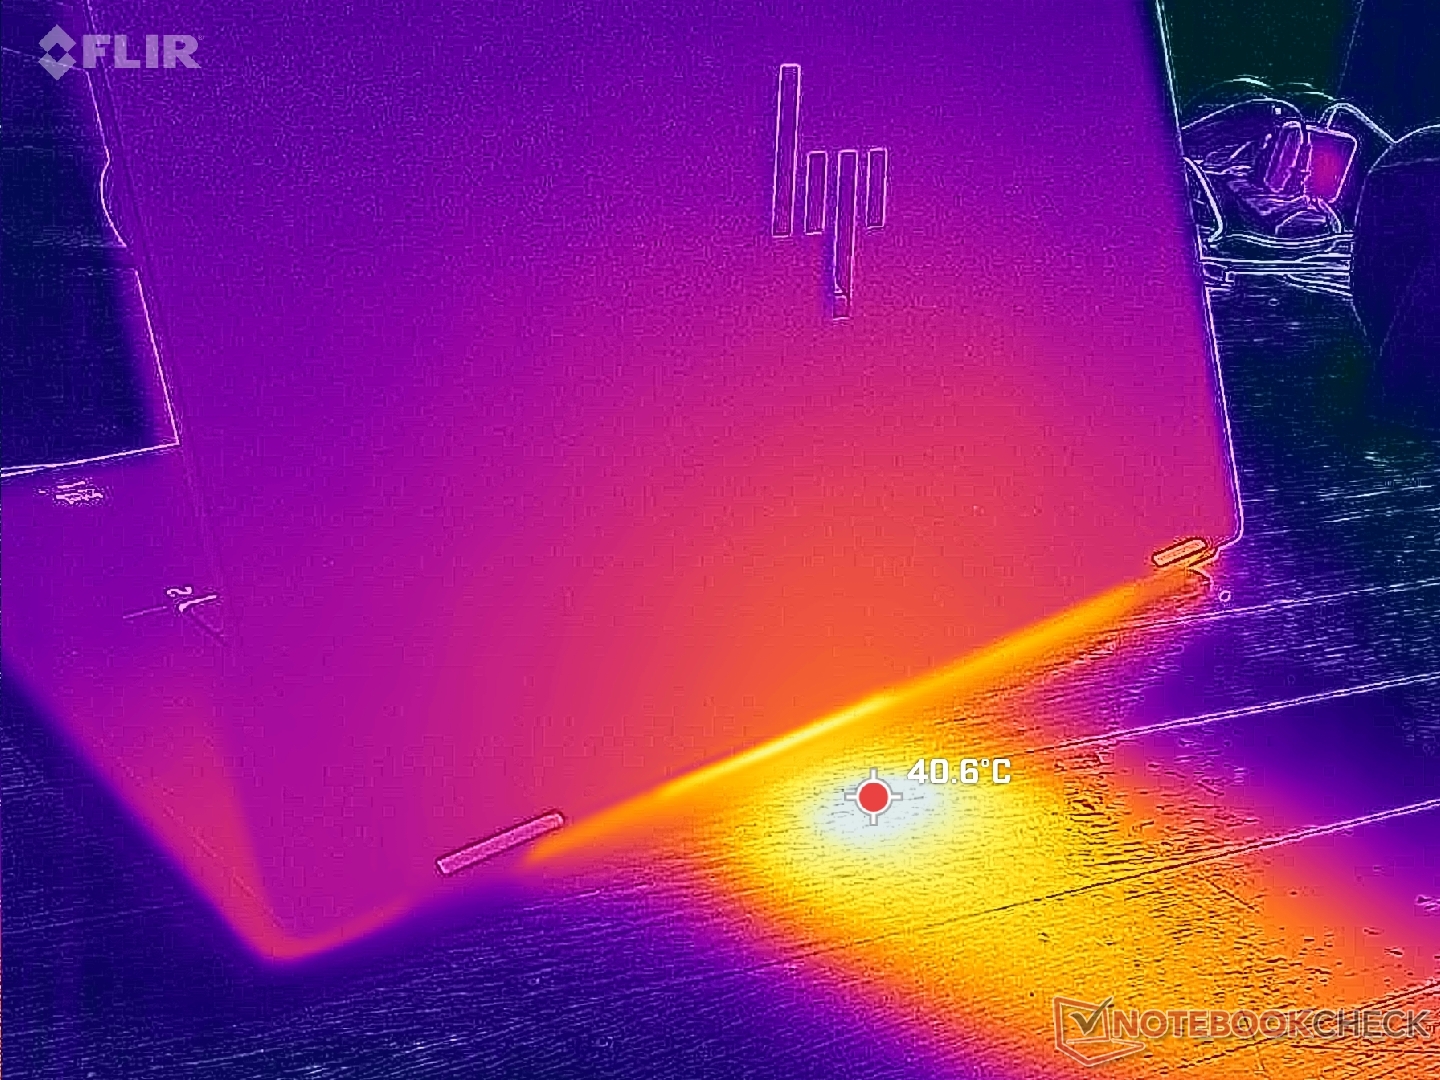
(+) La temperatura massima sul lato superiore è di 38 °C / 100 F, rispetto alla media di 35.4 °C / 96 F, che varia da 19.6 a 60 °C per questa classe Convertible.
(+) Il lato inferiore si riscalda fino ad un massimo di 39.4 °C / 103 F, rispetto alla media di 36.9 °C / 98 F
(+) In idle, la temperatura media del lato superiore è di 23 °C / 73 F, rispetto alla media deld ispositivo di 30.3 °C / 87 F.
(+) I poggiapolsi e il touchpad sono piu' freddi della temperatura della pelle con un massimo di 27.2 °C / 81 F e sono quindi freddi al tatto.
(±) La temperatura media della zona del palmo della mano di dispositivi simili e'stata di 28 °C / 82.4 F (+0.8 °C / 1.4 F).
| HP OmniBook X Flip 16 Intel Core Ultra 7 258V, Intel Arc Graphics 140V | Dell 16 Plus 2-in-1 Intel Core Ultra 7 258V, Intel Arc Graphics 140V | Lenovo Yoga 7 2-in-1 16ILL10 Intel Core Ultra 7 256V, Intel Arc Graphics 140V | Samsung Galaxy Book5 Pro 360 Intel Core Ultra 5 226V, Intel Arc Graphics 130V | MSI Summit A16 AI Plus A3HMTG AMD Ryzen AI 9 365, AMD Radeon 880M | HP Spectre x360 16 RTX 4050 Intel Core Ultra 7 155H, NVIDIA GeForce RTX 4050 Laptop GPU | |
|---|---|---|---|---|---|---|
| Heat | -20% | -4% | -3% | -22% | -11% | |
| Maximum Upper Side * (°C) | 38 | 44 -16% | 42.6 -12% | 40.9 -8% | 52.8 -39% | 39.6 -4% |
| Maximum Bottom * (°C) | 39.4 | 39.4 -0% | 36.8 7% | 45.1 -14% | 42 -7% | 39.2 1% |
| Idle Upper Side * (°C) | 25 | 31.8 -27% | 26.4 -6% | 23.8 5% | 30.6 -22% | 29 -16% |
| Idle Bottom * (°C) | 25 | 34.2 -37% | 26.6 -6% | 23.5 6% | 29.6 -18% | 31.6 -26% |
* ... Meglio usare valori piccoli
Altoparlanti
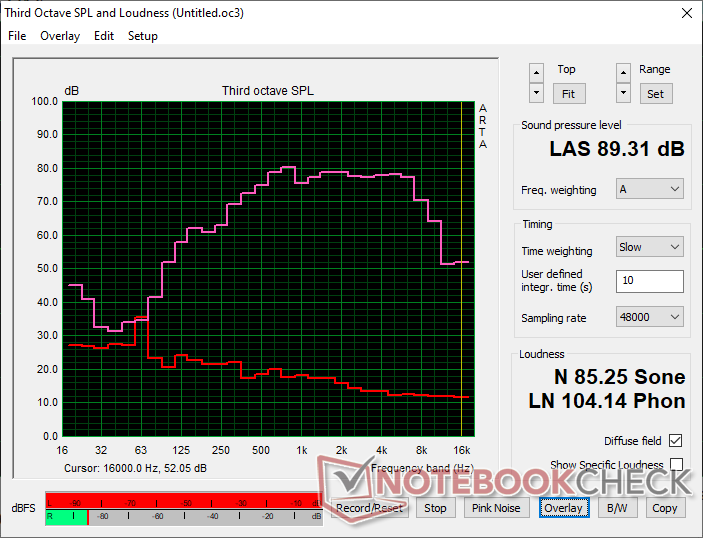
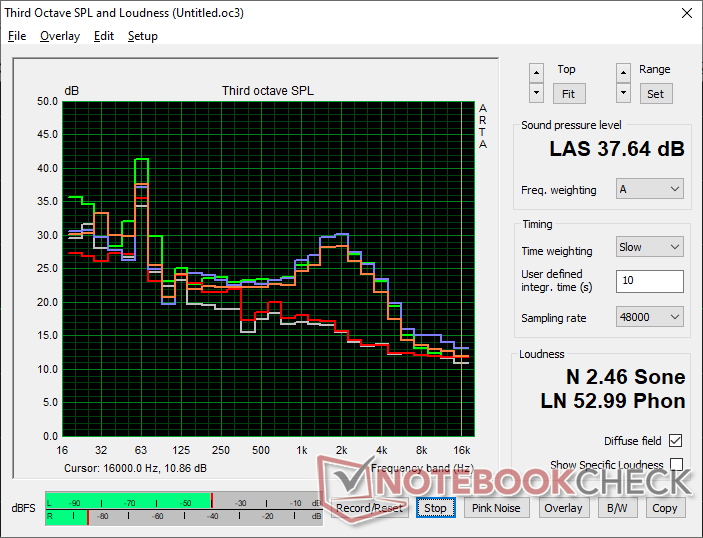
HP OmniBook X Flip 16 analisi audio
(+) | gli altoparlanti sono relativamente potenti (89.3 dB)
Bassi 100 - 315 Hz
(±) | bassi ridotti - in media 14.6% inferiori alla media
(±) | la linearità dei bassi è media (8.6% delta rispetto alla precedente frequenza)
Medi 400 - 2000 Hz
(+) | medi bilanciati - solo only 2.5% rispetto alla media
(+) | medi lineari (4.1% delta rispetto alla precedente frequenza)
Alti 2 - 16 kHz
(+) | Alti bilanciati - appena 3.9% dalla media
(+) | alti lineari (4% delta rispetto alla precedente frequenza)
Nel complesso 100 - 16.000 Hz
(+) | suono nel complesso lineare (14.2% differenza dalla media)
Rispetto alla stessa classe
» 21% di tutti i dispositivi testati in questa classe è stato migliore, 3% simile, 76% peggiore
» Il migliore ha avuto un delta di 6%, medio di 20%, peggiore di 57%
Rispetto a tutti i dispositivi testati
» 17% di tutti i dispositivi testati in questa classe è stato migliore, 4% similare, 79% peggiore
» Il migliore ha avuto un delta di 4%, medio di 23%, peggiore di 134%
Apple MacBook Pro 16 2021 M1 Pro analisi audio
(+) | gli altoparlanti sono relativamente potenti (84.7 dB)
Bassi 100 - 315 Hz
(+) | bassi buoni - solo 3.8% dalla media
(+) | bassi in lineaa (5.2% delta rispetto alla precedente frequenza)
Medi 400 - 2000 Hz
(+) | medi bilanciati - solo only 1.3% rispetto alla media
(+) | medi lineari (2.1% delta rispetto alla precedente frequenza)
Alti 2 - 16 kHz
(+) | Alti bilanciati - appena 1.9% dalla media
(+) | alti lineari (2.7% delta rispetto alla precedente frequenza)
Nel complesso 100 - 16.000 Hz
(+) | suono nel complesso lineare (4.6% differenza dalla media)
Rispetto alla stessa classe
» 0% di tutti i dispositivi testati in questa classe è stato migliore, 0% simile, 100% peggiore
» Il migliore ha avuto un delta di 5%, medio di 17%, peggiore di 45%
Rispetto a tutti i dispositivi testati
» 0% di tutti i dispositivi testati in questa classe è stato migliore, 0% similare, 100% peggiore
» Il migliore ha avuto un delta di 4%, medio di 23%, peggiore di 134%
Gestione dell'energia
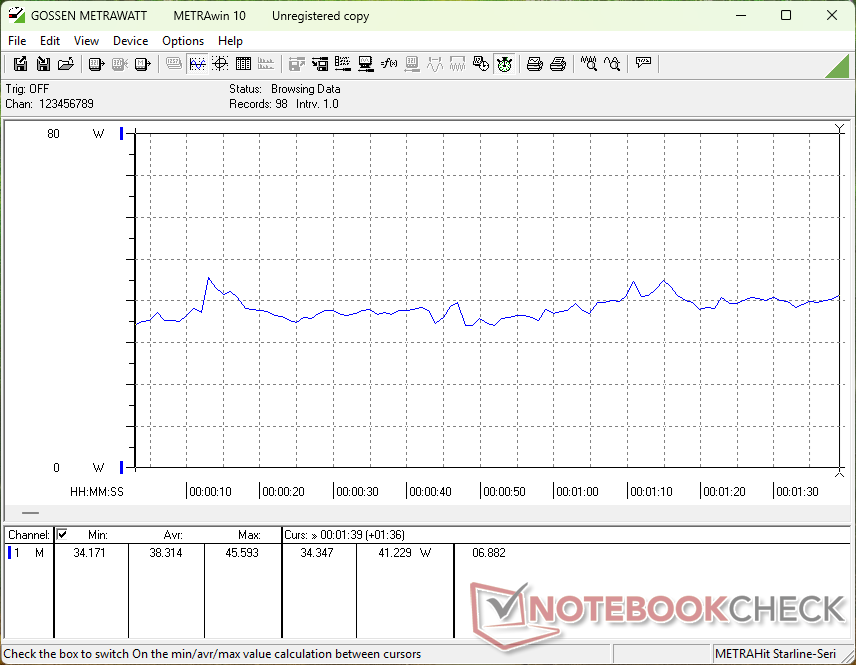
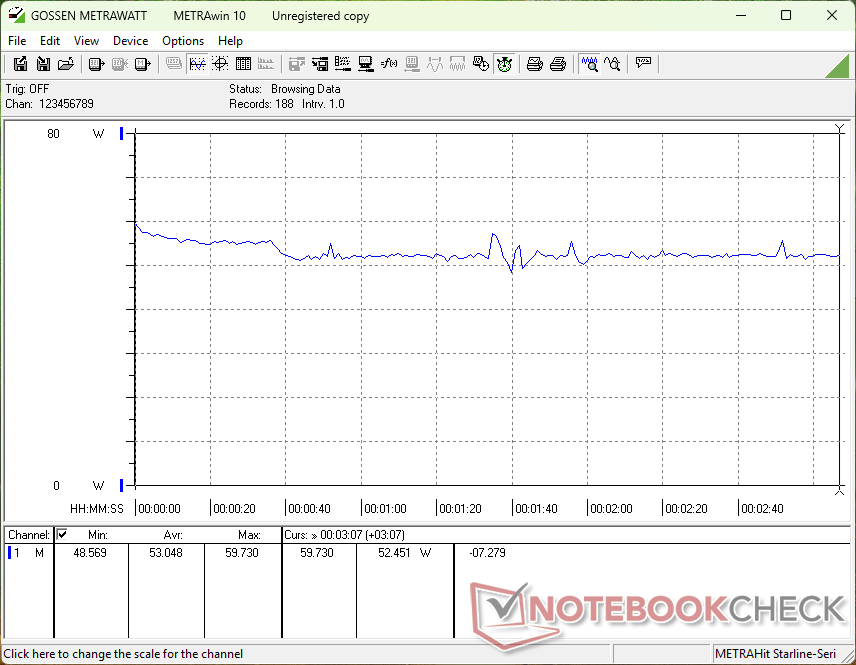
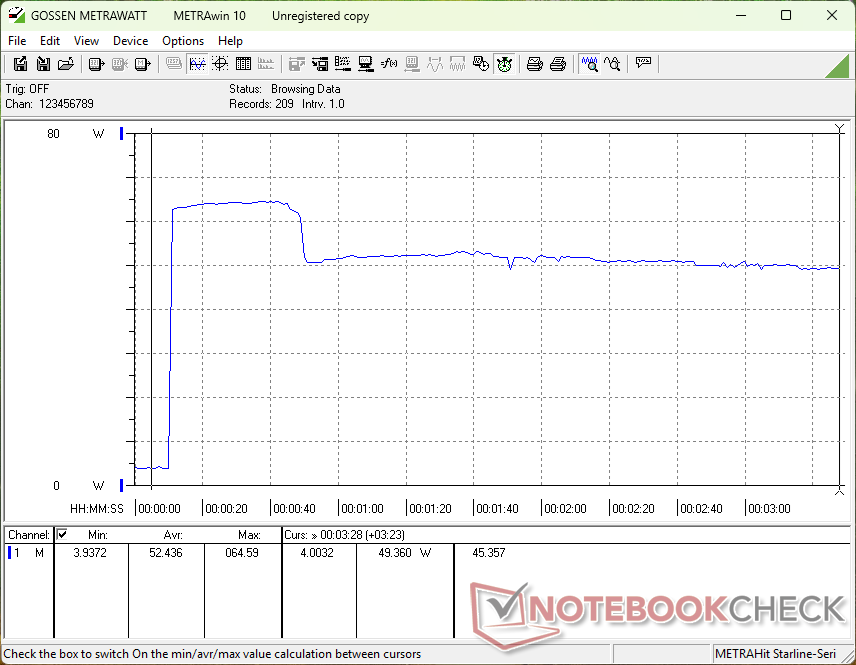
Consumo di energia
Intel Lunar Lake è estremamente efficiente e questo rimane vero su HP. Quando si esegue Cyberpunk 2077, ad esempio, l'OmniBook X Flip 16 richiede meno energia rispetto all'AMD-powered MSI Summit A16 AI Plus pur offrendo tassi di frame rate sempre più elevati. Tuttavia, le prestazioni del processore grezzo non sono ancora all'altezza di Ryzen AI 9 365.
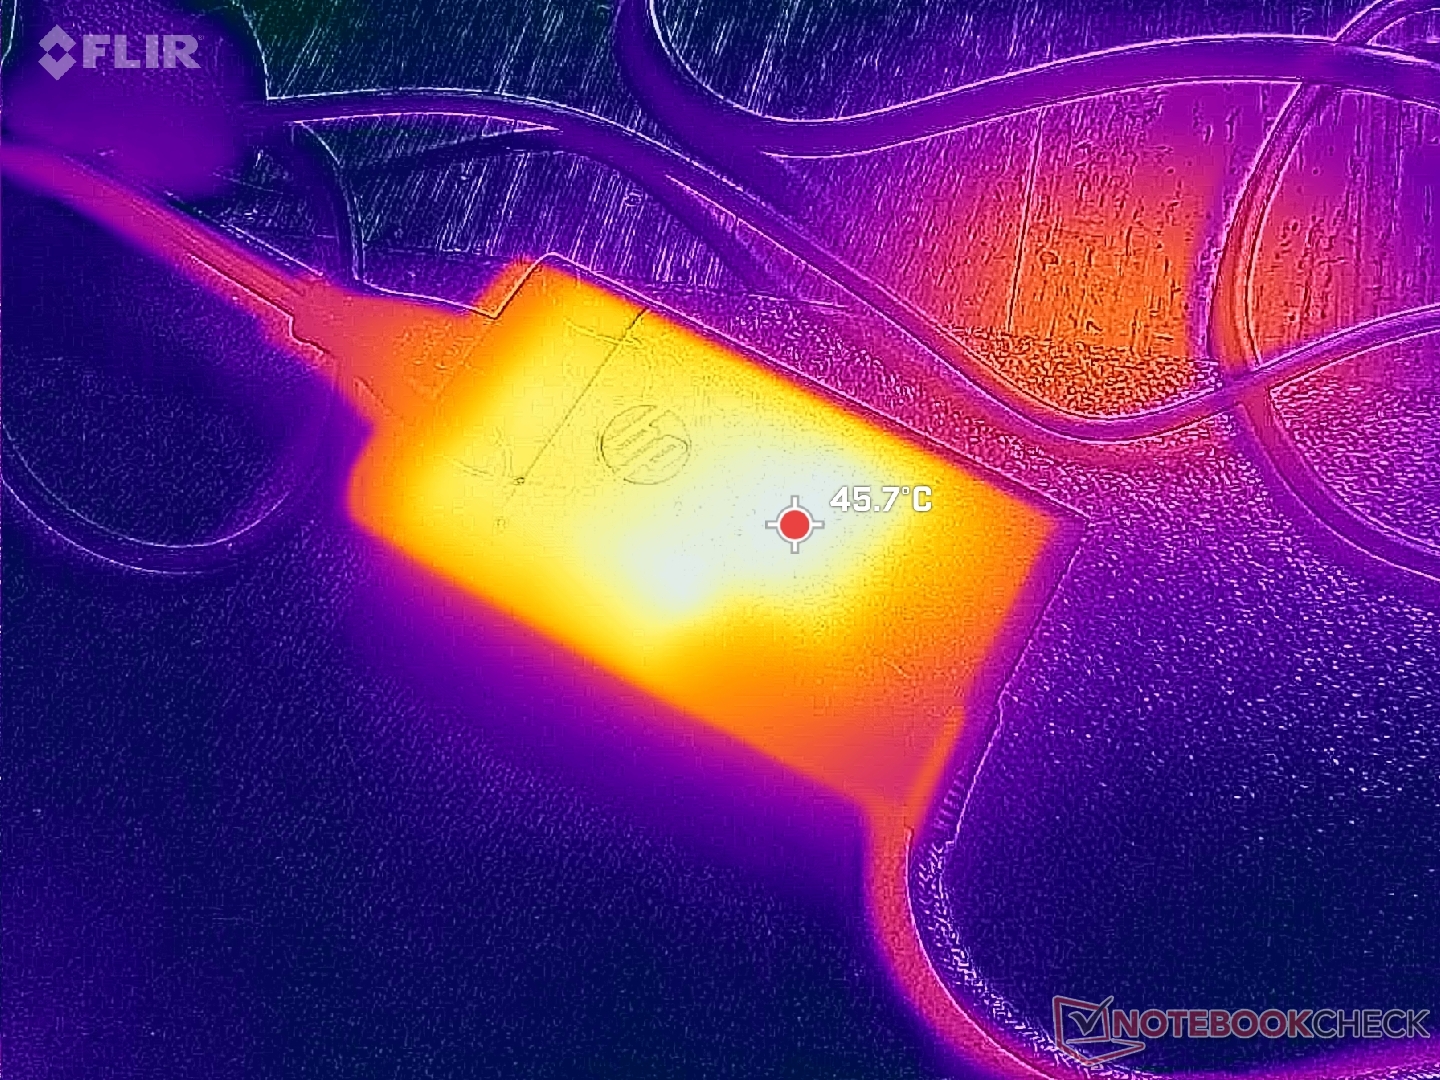
Siamo riusciti a registrare un consumo massimo temporaneo di 65 W dal piccolo (~6,8 x 2,2 x 5,4 cm) adattatore CA USB-C da 65 W, quando la CPU è al 100% di utilizzo.

| Off / Standby | |
| Idle | |
| Sotto carico |
|
Leggenda:
min: | |
| HP OmniBook X Flip 16 Core Ultra 7 258V, Arc 140V, , OLED, 2880x1800, 16" | Dell 16 Plus 2-in-1 Core Ultra 7 258V, Arc 140V, Samsung BM9C1 1024GB, Mini-LED, 2560x1600, 16" | Lenovo Yoga 7 2-in-1 16ILL10 Core Ultra 7 256V, Arc 140V, WD PC SN7100S SDFPMSL-512G-1101, IPS, 1920x1200, 16" | Samsung Galaxy Book5 Pro 360 Core Ultra 5 226V, Arc 130V, Samsung PM9B1 512GB MZVL4512HBLU, OLED, 2880x1800, 16" | MSI Summit A16 AI Plus A3HMTG Ryzen AI 9 365, Radeon 880M, Samsung PM9C1 MZVL81T0HELB-00BTW, IPS, 2560x1600, 16" | HP Spectre x360 16 RTX 4050 Ultra 7 155H, GeForce RTX 4050 Laptop GPU, SK hynix PC801 HFS001TEJ9X101N, OLED, 2880x1800, 16" | |
|---|---|---|---|---|---|---|
| Power Consumption | -47% | -11% | -8% | -54% | -133% | |
| Idle Minimum * (Watt) | 3.1 | 7 -126% | 4.2 -35% | 5.3 -71% | 5.4 -74% | 5.8 -87% |
| Idle Average * (Watt) | 4.4 | 13.2 -200% | 8.3 -89% | 6.7 -52% | 11 -150% | 12.3 -180% |
| Idle Maximum * (Watt) | 11.4 | 13.4 -18% | 9.5 17% | 7.3 36% | 11.2 2% | 33.9 -197% |
| Load Average * (Watt) | 38.3 | 43.9 -15% | 40.3 -5% | 37.6 2% | 76.6 -100% | 83.3 -117% |
| Cyberpunk 2077 ultra external monitor * (Watt) | 48.7 | 40.7 16% | 40.8 16% | 42.8 12% | 49.2 -1% | |
| Cyberpunk 2077 ultra * (Watt) | 53.1 | 44.9 15% | 47.4 11% | 44.6 16% | 61.1 -15% | |
| Load Maximum * (Watt) | 64.9 | 67.8 -4% | 59 9% | 64.1 1% | 91.8 -41% | 120.8 -86% |
| Witcher 3 ultra * (Watt) | 89.1 |
* ... Meglio usare valori piccoli
Power Consumption Cyberpunk / Stress Test
Power Consumption external Monitor
Durata della batteria
| HP OmniBook X Flip 16 Core Ultra 7 258V, Arc 140V, 68 Wh | Dell 16 Plus 2-in-1 Core Ultra 7 258V, Arc 140V, 64 Wh | Lenovo Yoga 7 2-in-1 16ILL10 Core Ultra 7 256V, Arc 140V, 70 Wh | Samsung Galaxy Book5 Pro 360 Core Ultra 5 226V, Arc 130V, 76 Wh | MSI Summit A16 AI Plus A3HMTG Ryzen AI 9 365, Radeon 880M, 82 Wh | HP Spectre x360 16 RTX 4050 Ultra 7 155H, GeForce RTX 4050 Laptop GPU, 83 Wh | |
|---|---|---|---|---|---|---|
| Autonomia della batteria | -30% | 56% | -16% | -29% | -14% | |
| WiFi v1.3 (h) | 12.8 | 8.9 -30% | 20 56% | 10.8 -16% | 9.1 -29% | 11 -14% |
| H.264 (h) | 19.7 | |||||
| Load (h) | 2.1 |
Valutazione Notebookcheck
HP OmniBook X Flip 16
- 07/10/2025 v8
Allen Ngo
 Total Sustainability Score:
 Potential Competitors in Comparison
Immagine | Modello | Prezzo | Peso | Altezza | Schermo |
|---|---|---|---|---|---|
1. 86.9%  | HP OmniBook X Flip 16 Intel Core Ultra 7 258V ⎘ Intel Arc Graphics 140V ⎘ 16 GB Memoria | Amazon: Prezzo di listino: 950 USD | 1.9 kg | 15.5 mm | 16.00" 2880x1800 212 PPI OLED |
2. 83.5%  | Dell 16 Plus 2-in-1 Intel Core Ultra 7 258V ⎘ Intel Arc Graphics 140V ⎘ 32 GB Memoria, 1024 GB SSD | Amazon: $1,149.99 Prezzo di listino: 1500 USD | 2 kg | 16.99 mm | 16.00" 2560x1600 189 PPI Mini-LED |
3. 84.3%  | Lenovo Yoga 7 2-in-1 16ILL10 Intel Core Ultra 7 256V ⎘ Intel Arc Graphics 140V ⎘ 16 GB Memoria, 512 GB SSD | Amazon: Prezzo di listino: 1000 USD | 1.9 kg | 15.85 mm | 16.00" 1920x1200 142 PPI IPS |
4. 85.9%  | Samsung Galaxy Book5 Pro 360 Intel Core Ultra 5 226V ⎘ Intel Arc Graphics 130V ⎘ 16 GB Memoria, 512 GB SSD | Amazon: Prezzo di listino: 1799€ | 1.7 kg | 12.8 mm | 16.00" 2880x1800 212 PPI OLED |
5. 81.9%  | MSI Summit A16 AI Plus A3HMTG AMD Ryzen AI 9 365 ⎘ AMD Radeon 880M ⎘ 32 GB Memoria, 1024 GB SSD | Amazon: Prezzo di listino: 1600 USD | 2.1 kg | 16.85 mm | 16.00" 2560x1600 189 PPI IPS |
6. 91.1% v7 (old) 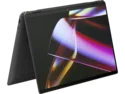 | HP Spectre x360 16 RTX 4050 Intel Core Ultra 7 155H ⎘ NVIDIA GeForce RTX 4050 Laptop GPU ⎘ 16 GB Memoria, 1024 GB SSD | Amazon: Prezzo di listino: 1600 USD | 2 kg | 19.8 mm | 16.00" 2880x1800 212 PPI OLED |
Transparency
La selezione dei dispositivi da recensire viene effettuata dalla nostra redazione. Il campione di prova è stato fornito all'autore come prestito dal produttore o dal rivenditore ai fini di questa recensione. L'istituto di credito non ha avuto alcuna influenza su questa recensione, né il produttore ne ha ricevuto una copia prima della pubblicazione. Non vi era alcun obbligo di pubblicare questa recensione. In quanto società mediatica indipendente, Notebookcheck non è soggetta all'autorità di produttori, rivenditori o editori.
Ecco come Notebookcheck esegue i test
Ogni anno, Notebookcheck esamina in modo indipendente centinaia di laptop e smartphone utilizzando procedure standardizzate per garantire che tutti i risultati siano comparabili. Da circa 20 anni sviluppiamo continuamente i nostri metodi di prova e nel frattempo stabiliamo gli standard di settore. Nei nostri laboratori di prova, tecnici ed editori esperti utilizzano apparecchiature di misurazione di alta qualità. Questi test comportano un processo di validazione in più fasi. Il nostro complesso sistema di valutazione si basa su centinaia di misurazioni e parametri di riferimento ben fondati, che mantengono l'obiettività.
