Verdetto - Più snello e leggero con alcuni compromessi
Il Dell 16 Plus 2-in-1 è sia un aggiornamento che un downgrade rispetto all'Inspiron 16 7640 2-in-1 dello scorso anno Inspiron 16 7640 2-in-1. È leggermente più leggero e più sottile, con prestazioni grafiche molto più veloci rispetto a prima, a vantaggio di chi viaggia, dei giocatori occasionali o delle attività accelerate dalla GPU.
Alcuni dei cambiamenti rispetto all'anno precedente potrebbero non essere adatti a tutti. In particolare, il passaggio dai processori Core Ultra-H a Core Ultra-V ha ridotto la potenza di elaborazione grezza di un bel po'. Nel frattempo, le porte riorganizzate sono probabilmente peggiorate, in quanto entrambe le porte USB-C sono ora strettamente collegate tra loro, il che influisce sull'ergonomia dell'aggancio. Anche la capacità della batteria è stata ridotta in modo significativo, al punto che la durata della batteria è inferiore a quella dell'Inspiron 16 7640 2-in-1, anche se il sistema più vecchio è dotato della CPU Core Ultra-H più veloce.
Gli utenti equilibrati che possono apprezzare il tastierino numerico integrato e l'iGPU relativamente veloce potrebbero preferire il più recente Dell 16 Plus 2-in-1. Altrimenti, gli utenti potenti che si affidano alla potenza della CPU potrebbero preferire il più vecchio Inspiron 16 7640 2-in-1, soprattutto perché entrambi i modelli condividono gli stessi pannelli per un'esperienza visiva identica.
Pro
Contro
Prezzo e disponibilità
Dell distribuisce ora il Dell 16 Plus 2-in-1 a partire da 950 dollari con pannello IPS o 1500 dollari con mini-LED.
- $999.99Dell 16 Plus 2-in-1 Business Laptop, 16" FHD+ Touchscreen, Intel Core Ultra 7 256V(8 Cores, up to 4.8 GHz) Intel Arc Graphics, 16GB DDR5, 512GB SSD, Backlit, Windows 11 Home, with SVT Stylus Pen Hub
- $1,079.99Dell 16 Plus LDB06250 AI Business 2-in-1 Laptop 16'' Touch WQXGA Display
- $1,199.00Dell Plus 16" FHD 2-in-1 Touchscreen Laptop, Intel Core Ultra 7 256V, 16GB RAM, 2TB Storage(1TB SSD+1TB Docking Station Set), Backlit Keyboard, Webcam, Wi-Fi 7, Copilot, Win 11 Pro, Ice Blue
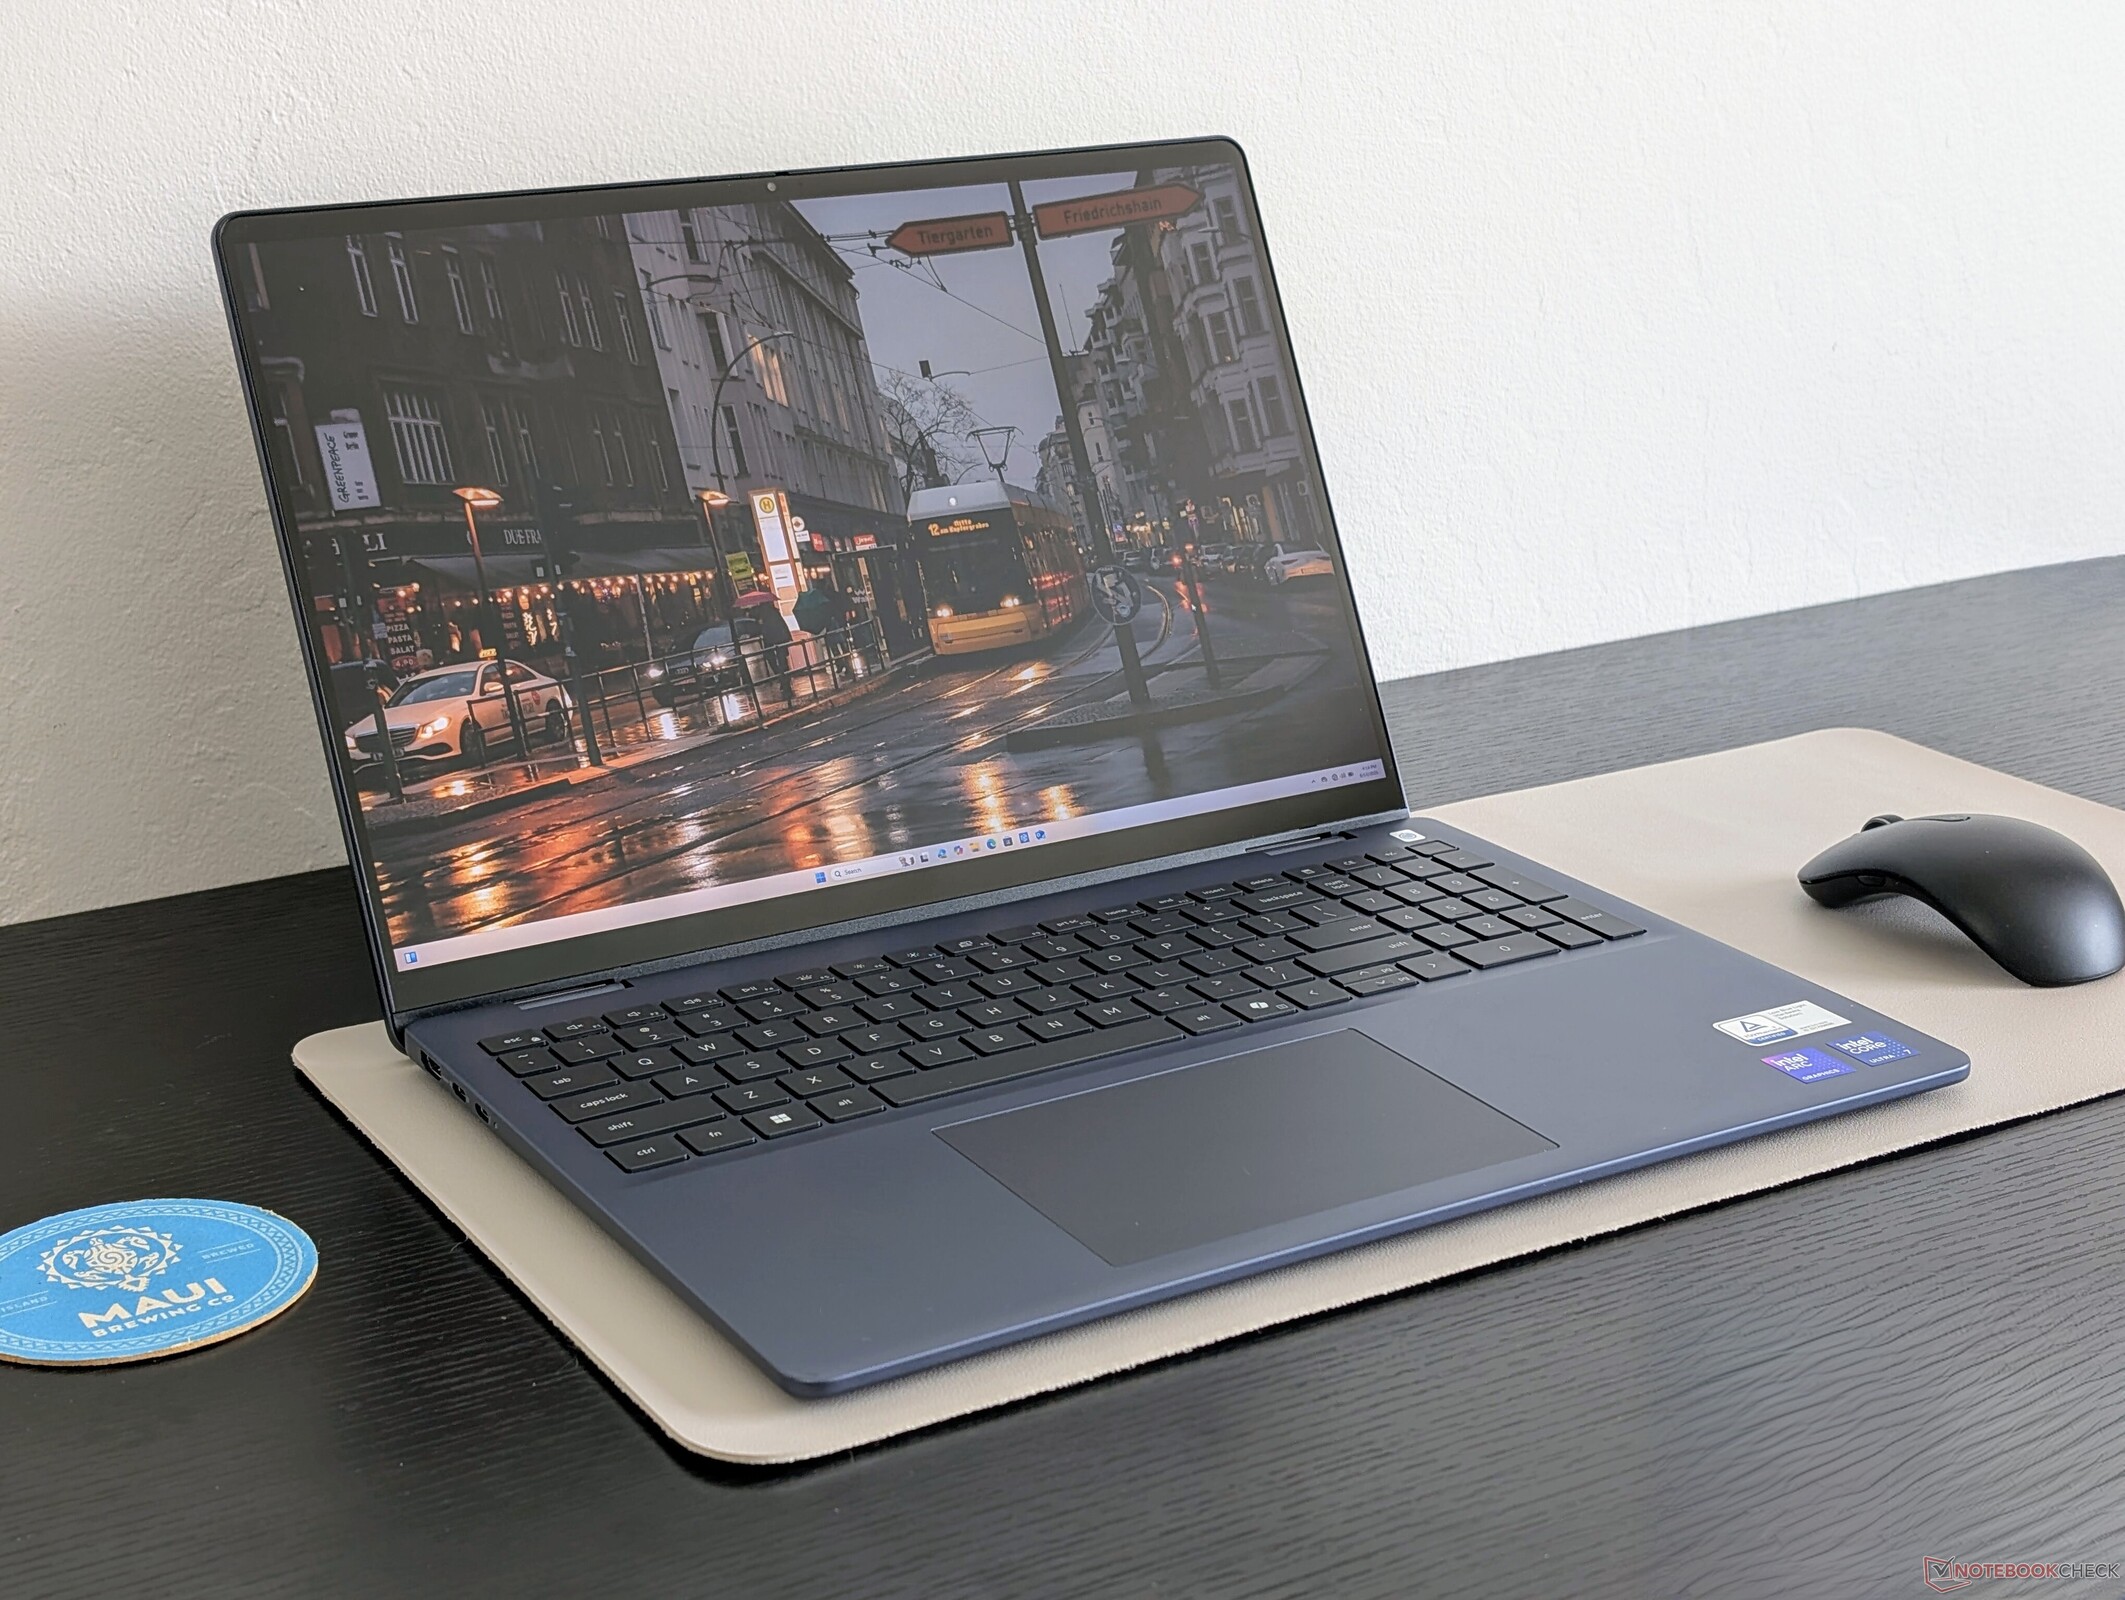
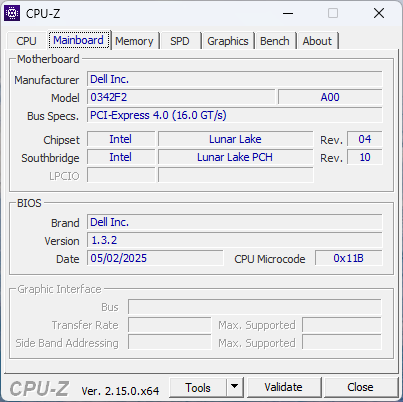
Dell 16 Plus 2-in-1 è la versione convertibile del modello a conchiglia Dell 16 Plus a conchiglia e il diretto successore del modello 2024 Inspiron 16 7640 2-in-1. Rappresenta l'inizio di una nuova generazione di computer portatili mainstream progettati per sostituire la vecchia convenzione di denominazione Inspiron.
La nostra unità di prova è una configurazione intermedia con CPU Core Ultra 7 256V e schermo touchscreen Mini-LED da 2,5K 90 Hz per circa 1400 dollari. Le SKU di fascia bassa possono essere dotate di un touchscreen FHD IPS più tradizionale, mentre le SKU di fascia più alta vengono fornite con il Core Ultra 9 288V.
Tra i concorrenti di Dell 16 Plus 2-in-1 ci sono altri convertibili multimediali da 16 pollici come HP Envy x360 2-in-1 16, Lenovo Yoga 7 2-in-1 16ILL10o Samsung Galaxy Book5 Pro 360.
Altre recensioni di Dell:
Specifiche
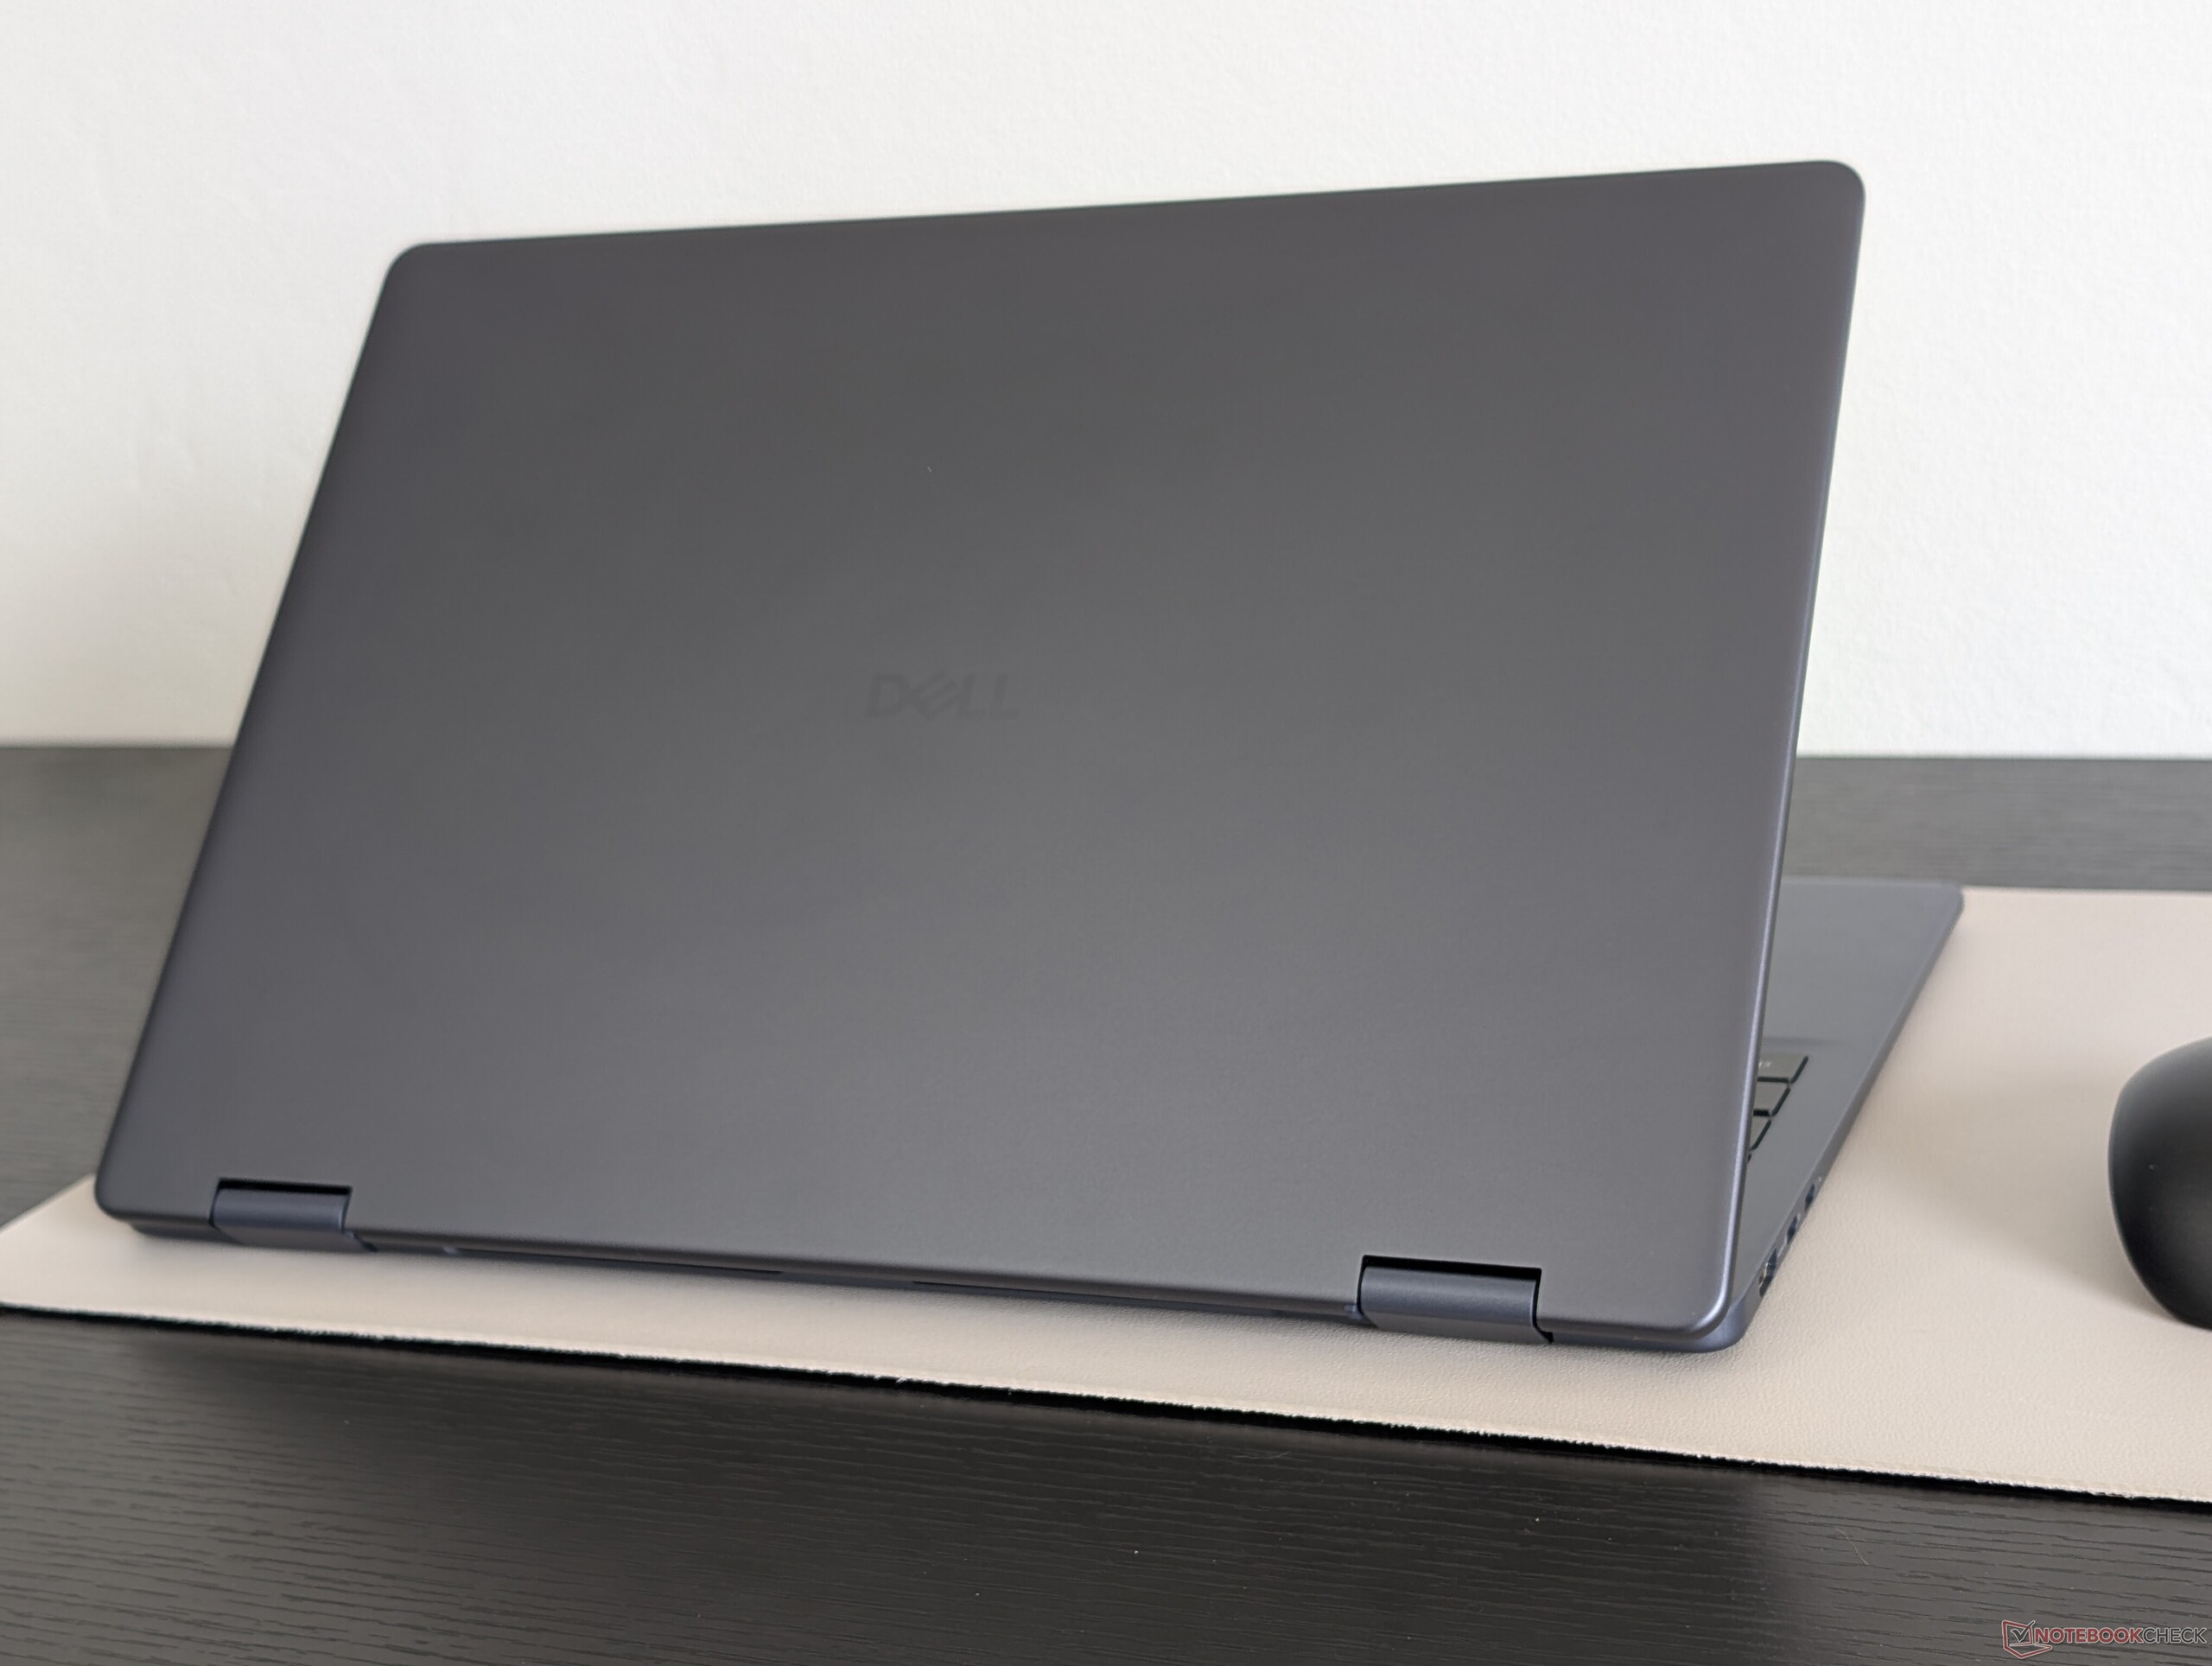
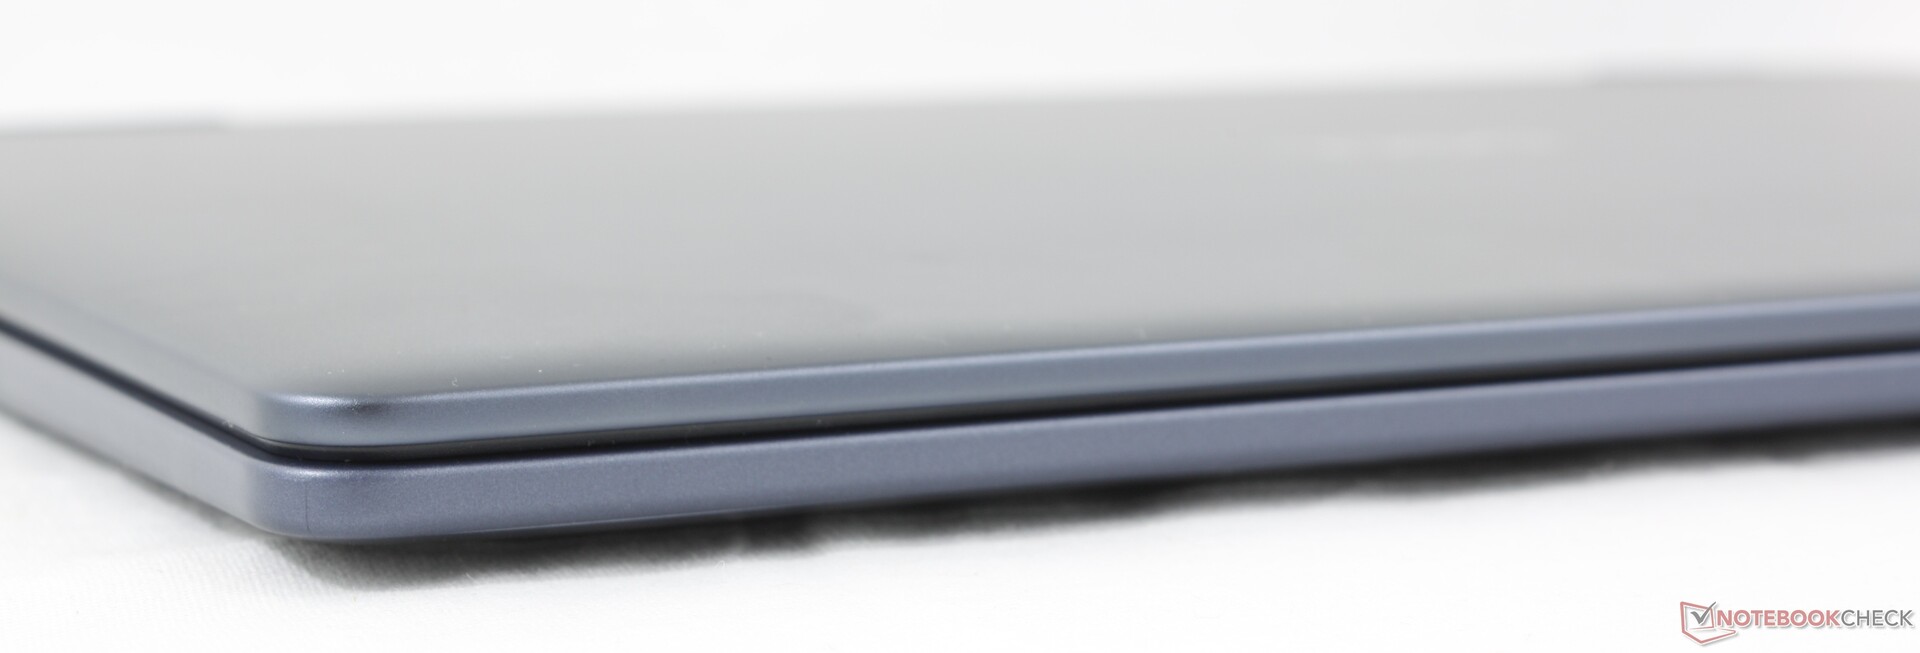
Caso
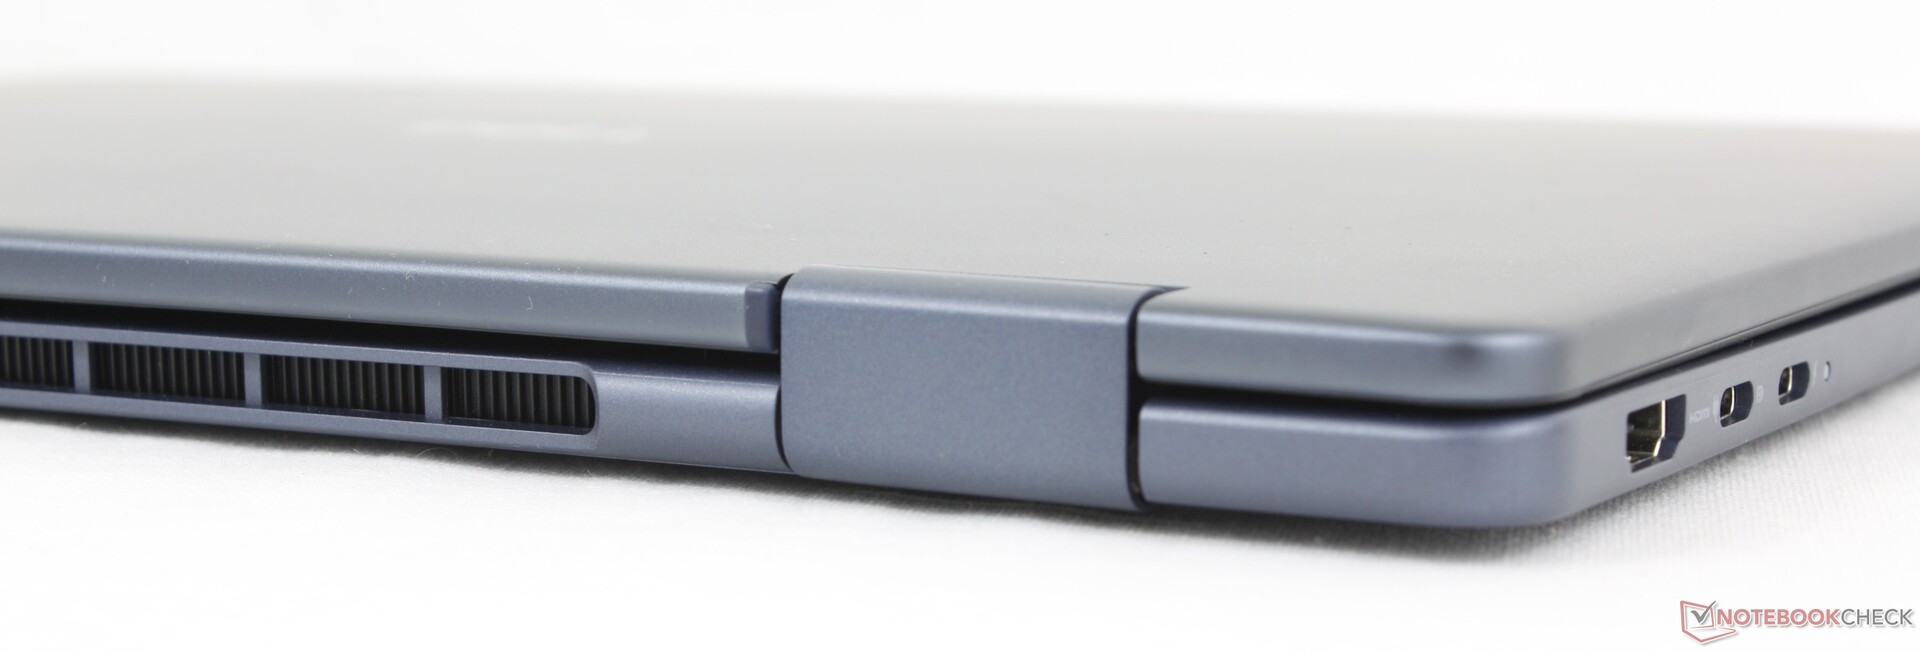
Il case si rifà al modello Inspiron 16 7640 2-in-1, utilizzando materiali simili in alluminio e plastica per una sensazione di familiarità e qualità "Inspiron". Le dimensioni e il peso sono quindi quasi identici tra i due modelli, a parte il profilo leggermente più sottile del modello più recente.
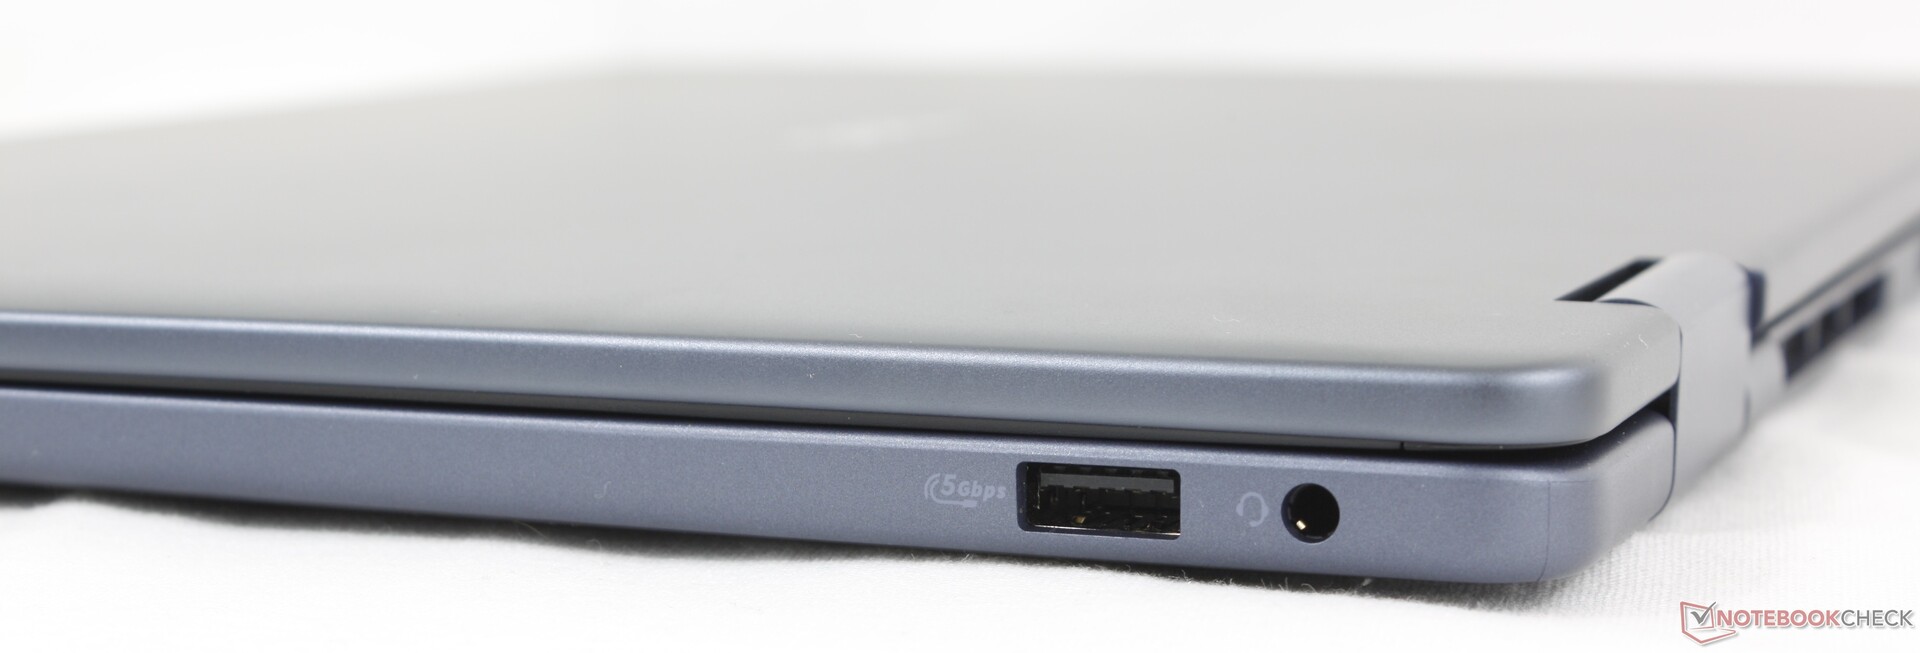
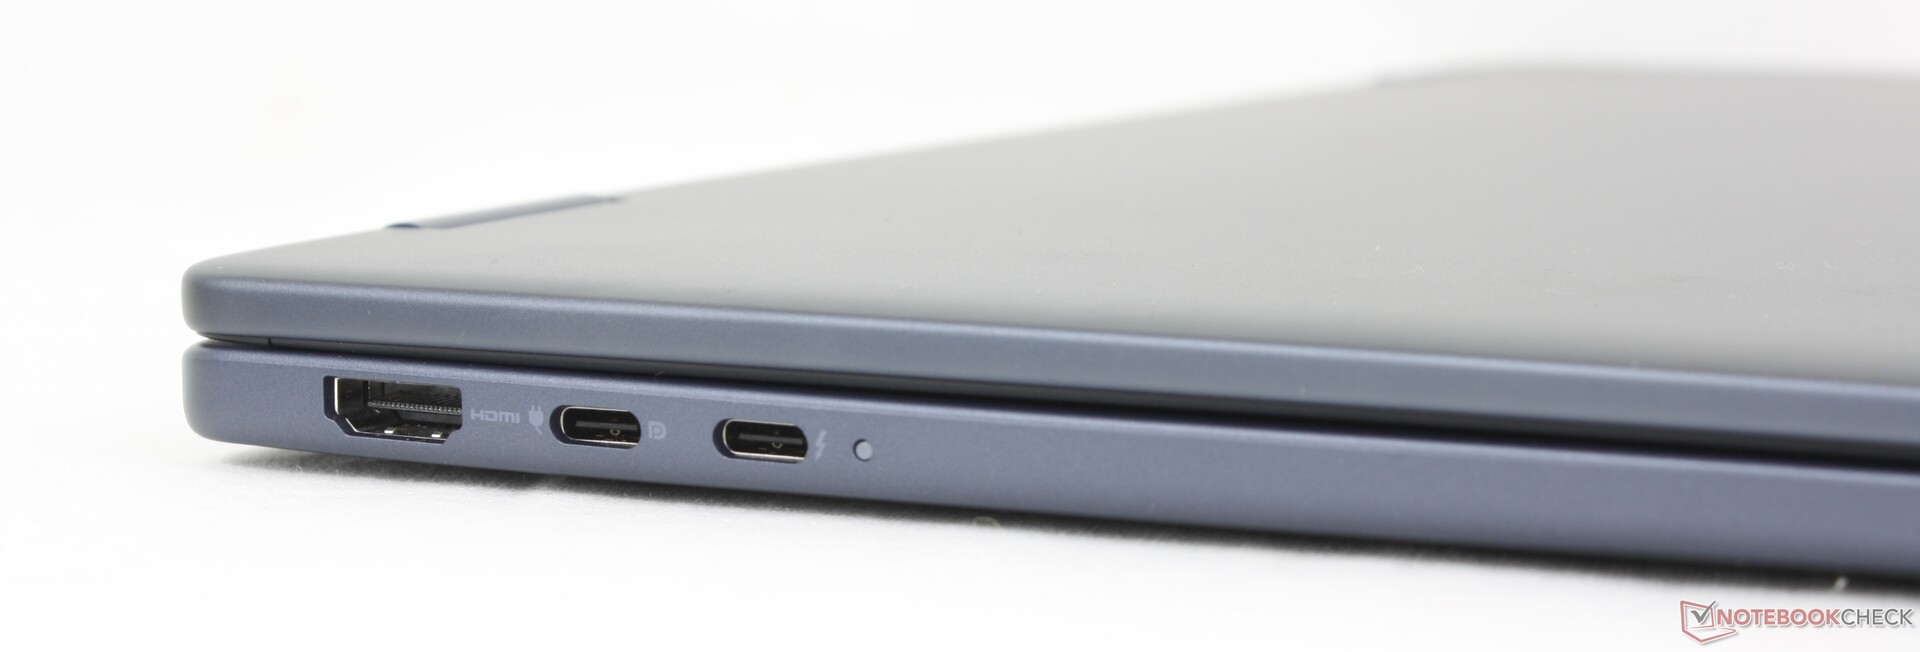
Connettività
Le opzioni delle porte sono identiche a quelle dell'Inspiron dello scorso anno, anche se con una differenza importante: l'omissione di un lettore di schede SD integrato. Anche le due porte USB-C sono state riorganizzate, probabilmente in peggio, in quanto non è più possibile caricare il sistema lungo il bordo destro.
Comunicazione
Webcam
La webcam da 2 MP è di serie, con otturatore fisico e senza IR.


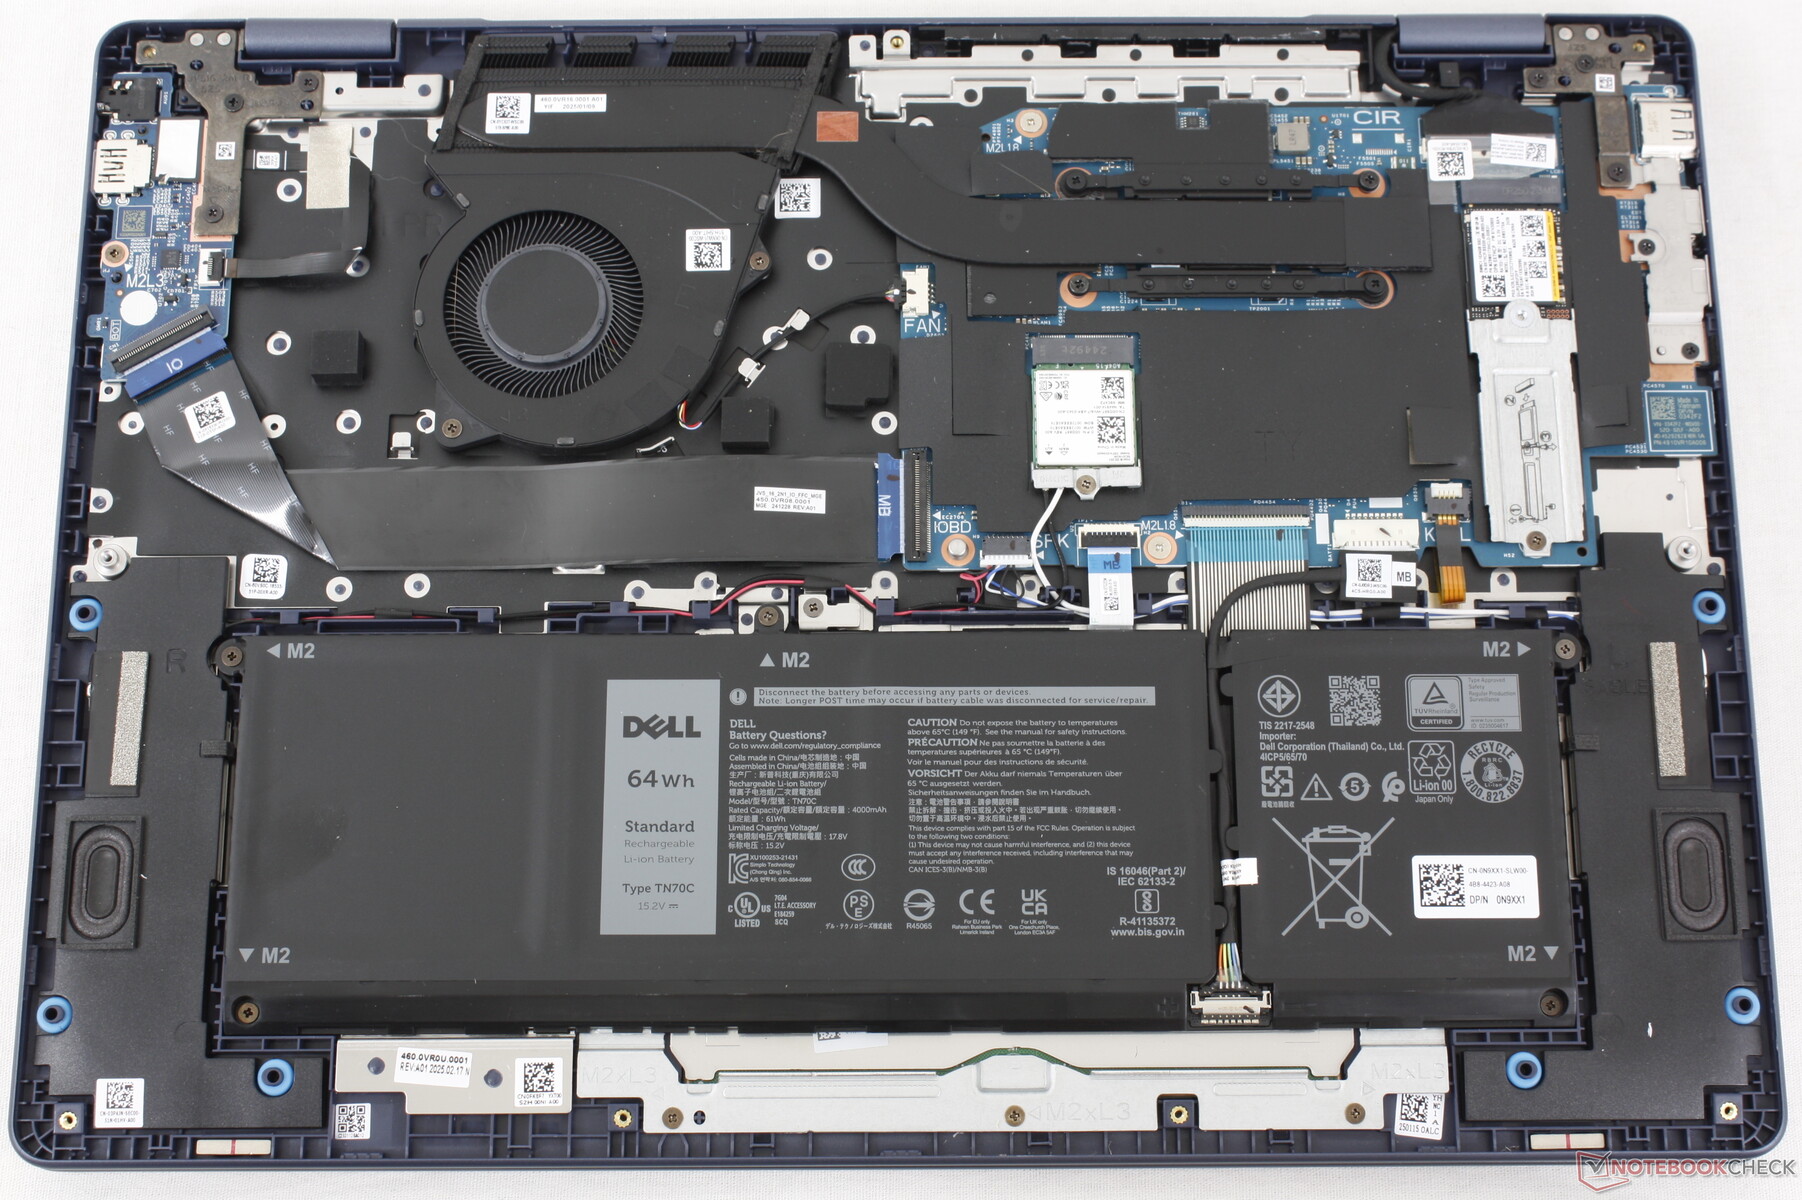
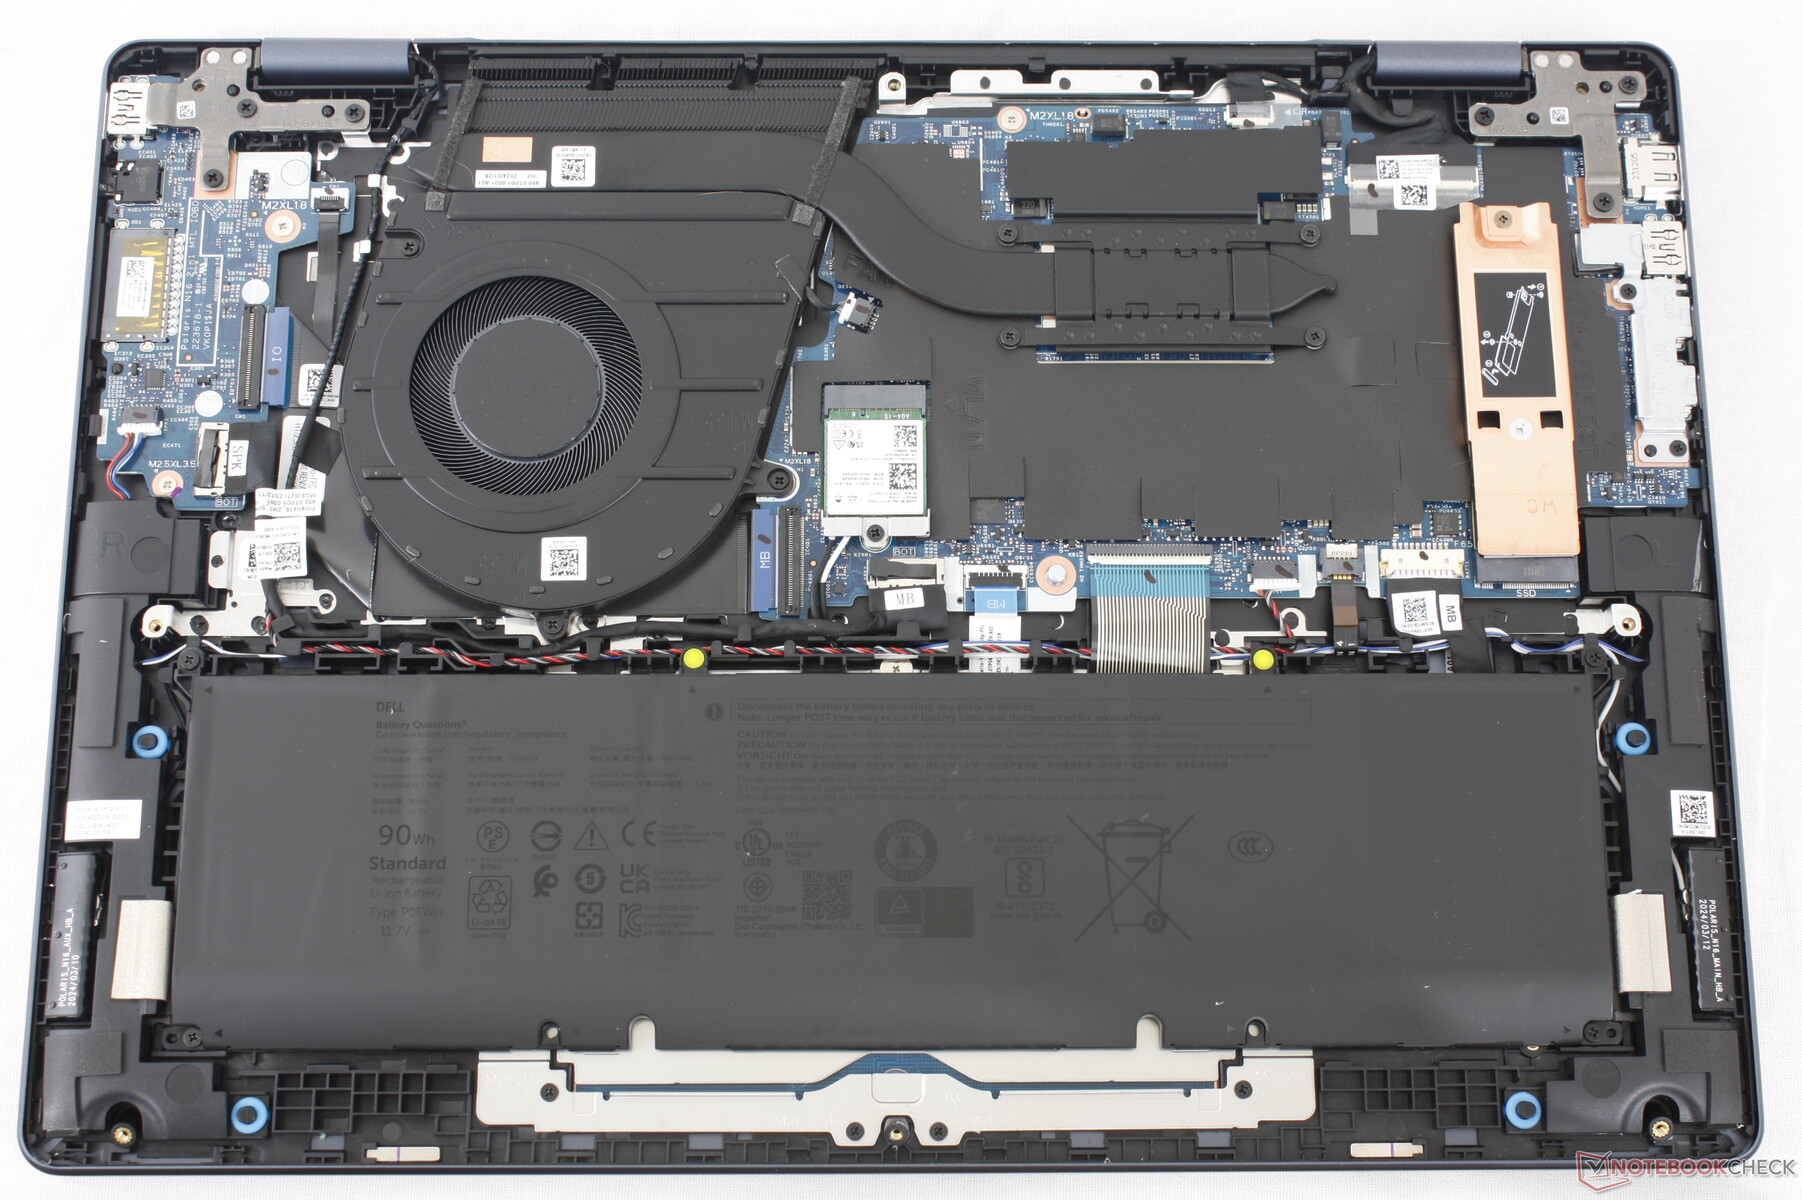
Manutenzione
Sostenibilità
Dell non indica esplicitamente i materiali riciclati utilizzati durante la produzione di Dell 16 Plus 2-in-1. La confezione non utilizza plastica per facilitare il riciclaggio.
Accessori e garanzia
La confezione al dettaglio include l'adattatore CA e la documentazione. Se acquistato negli Stati Uniti, si applica la consueta garanzia di un anno del produttore.
Dispositivi di ingresso
Tastiera e touchpad
La tastiera e il clickpad sono 1:1 con il modello a conchiglia Dell 16 Plus a conchiglia per un'esperienza identica. Si tratta di un aggiornamento in termini di produttività rispetto all'Inspiron 16 7640 2-in-1 dello scorso anno, che privilegiava le griglie degli altoparlanti di grandi dimensioni rispetto al tastierino numerico integrato.
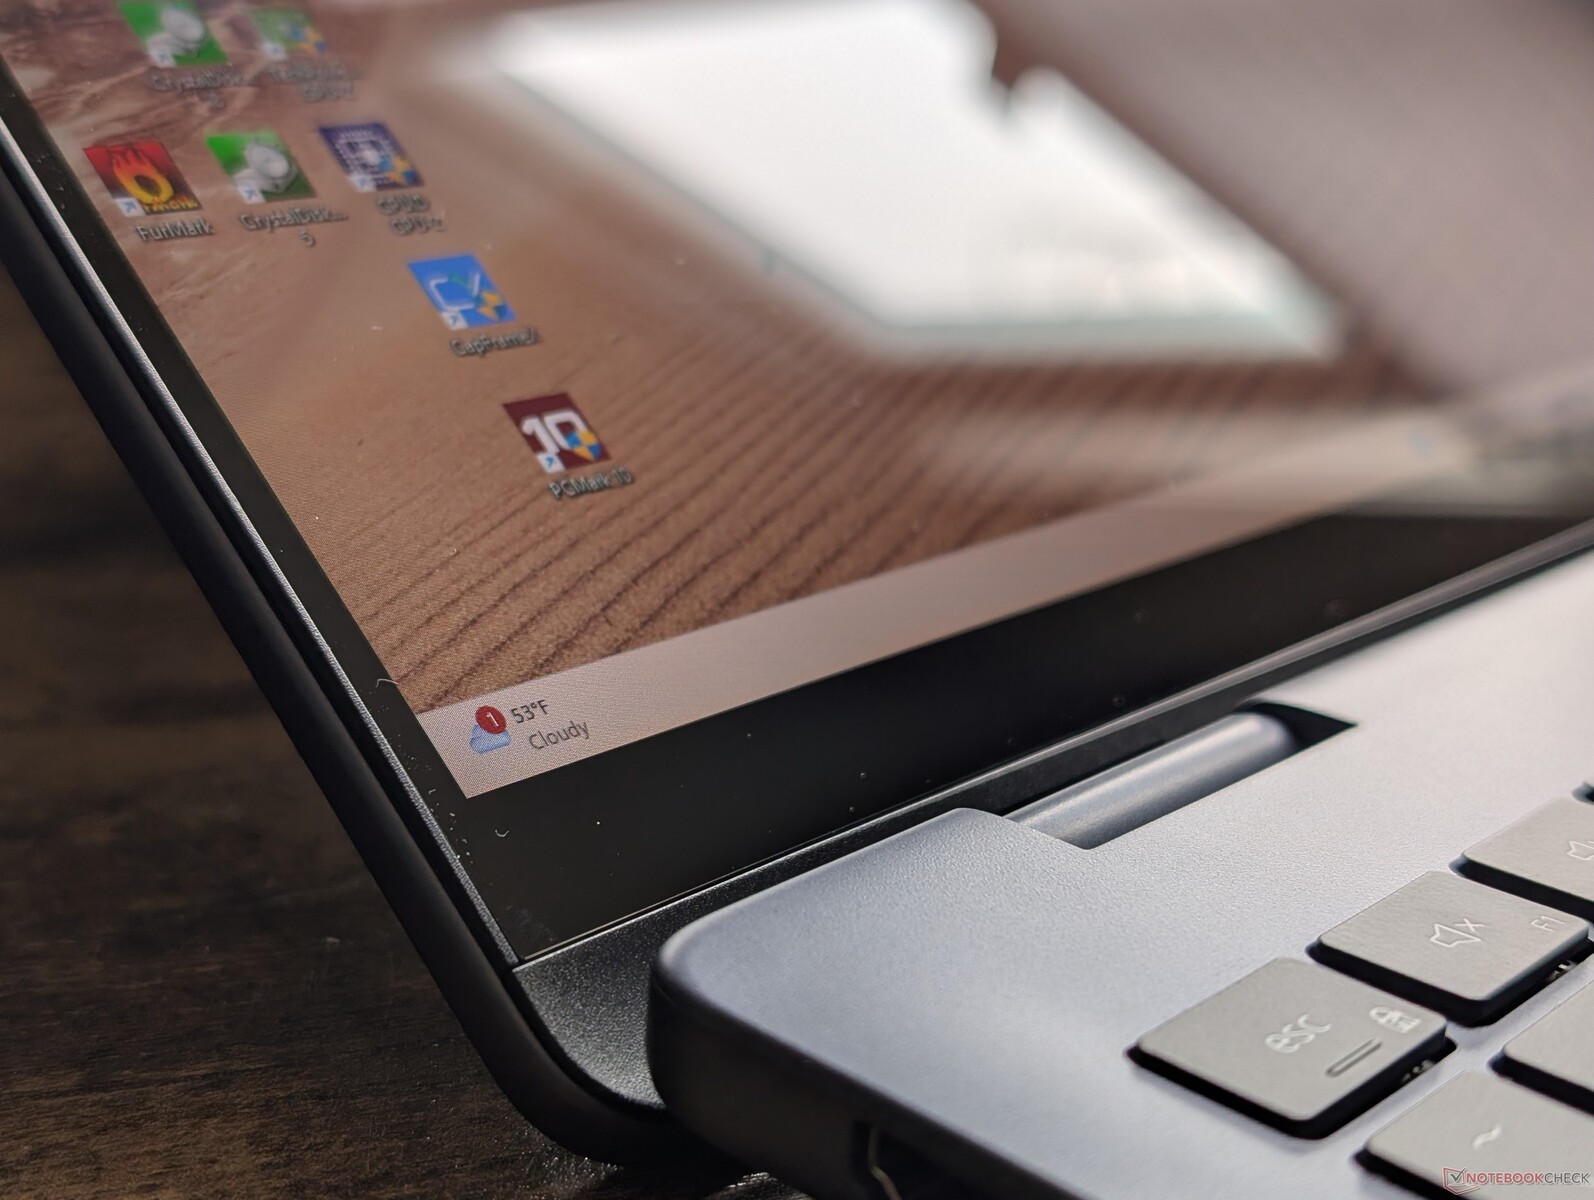
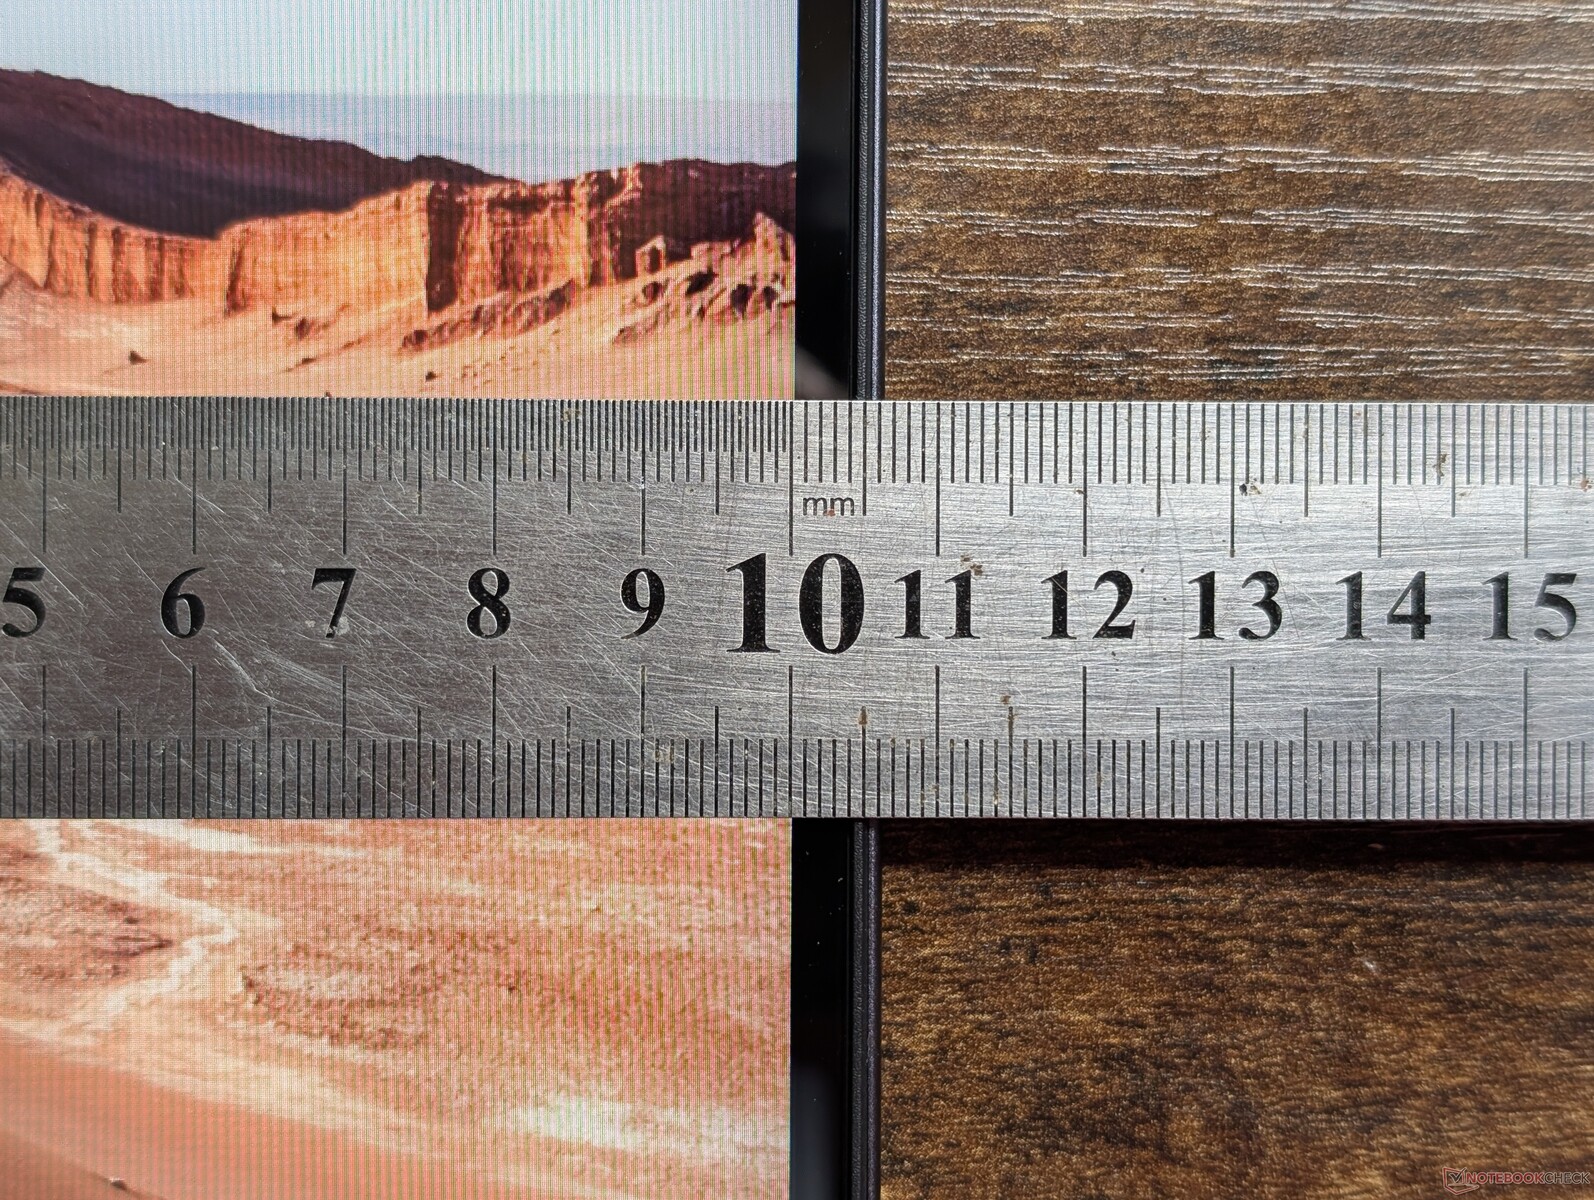
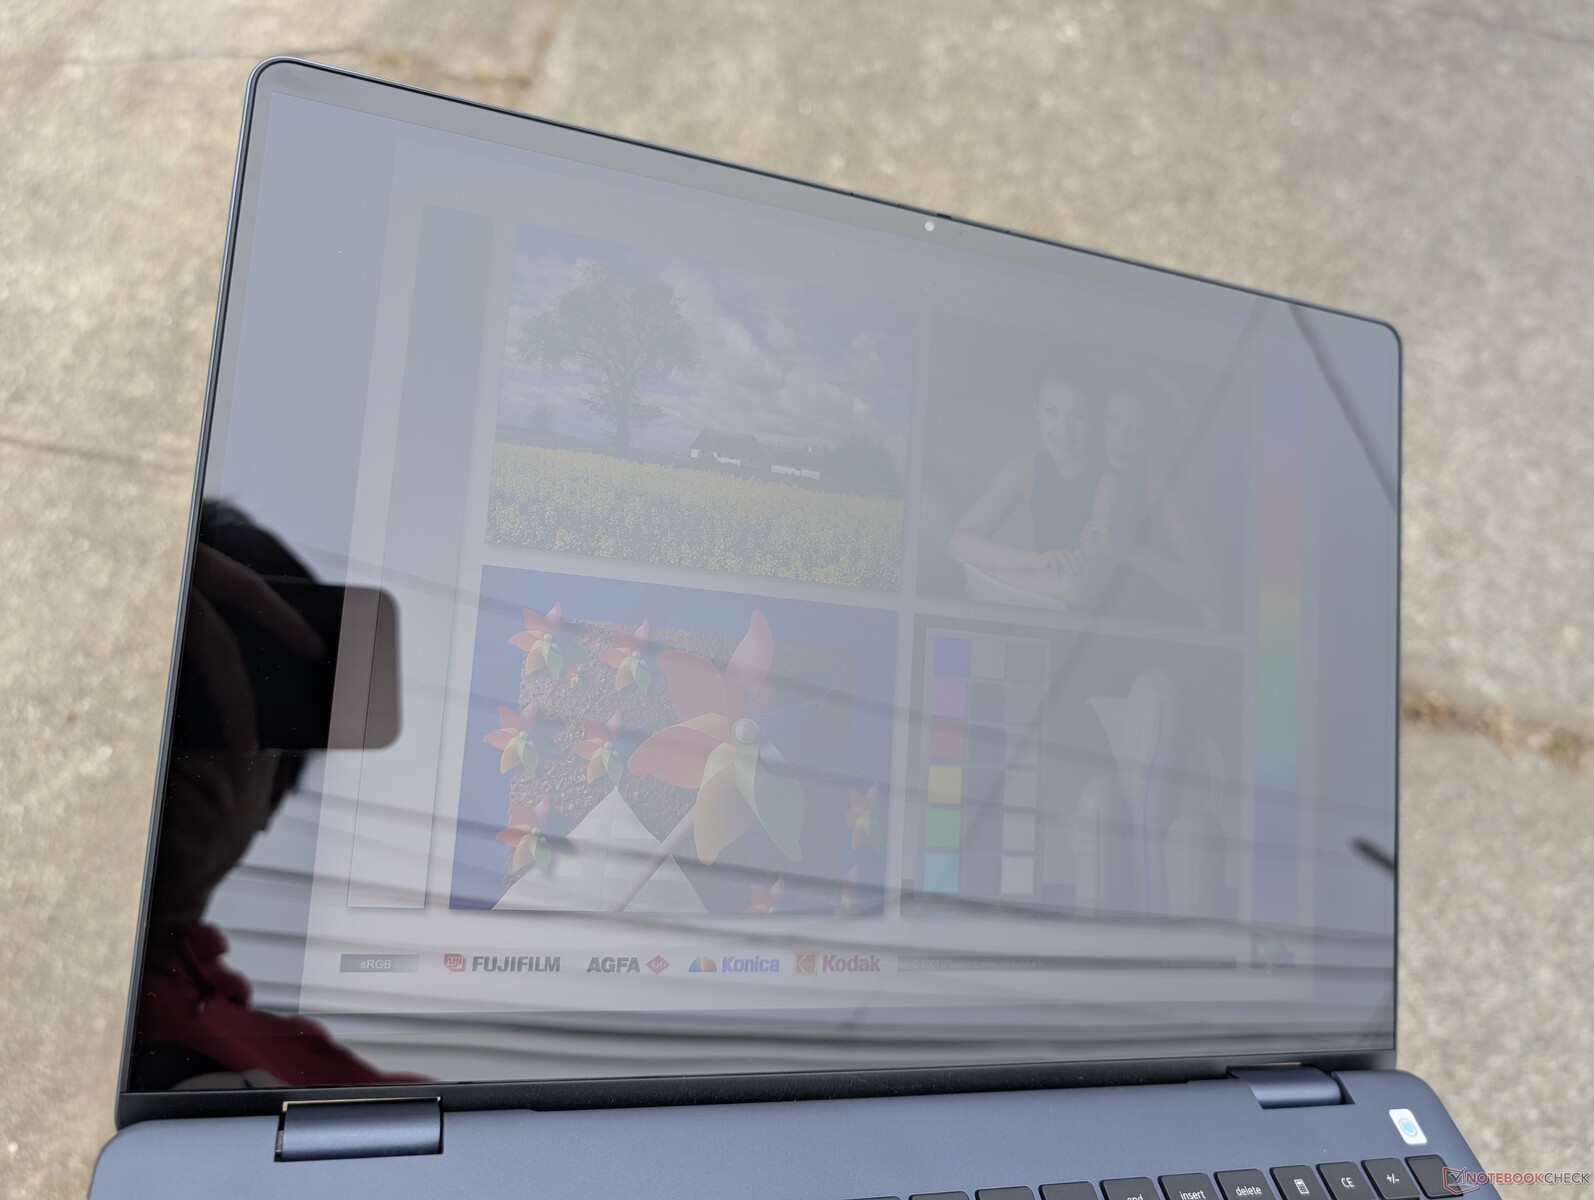
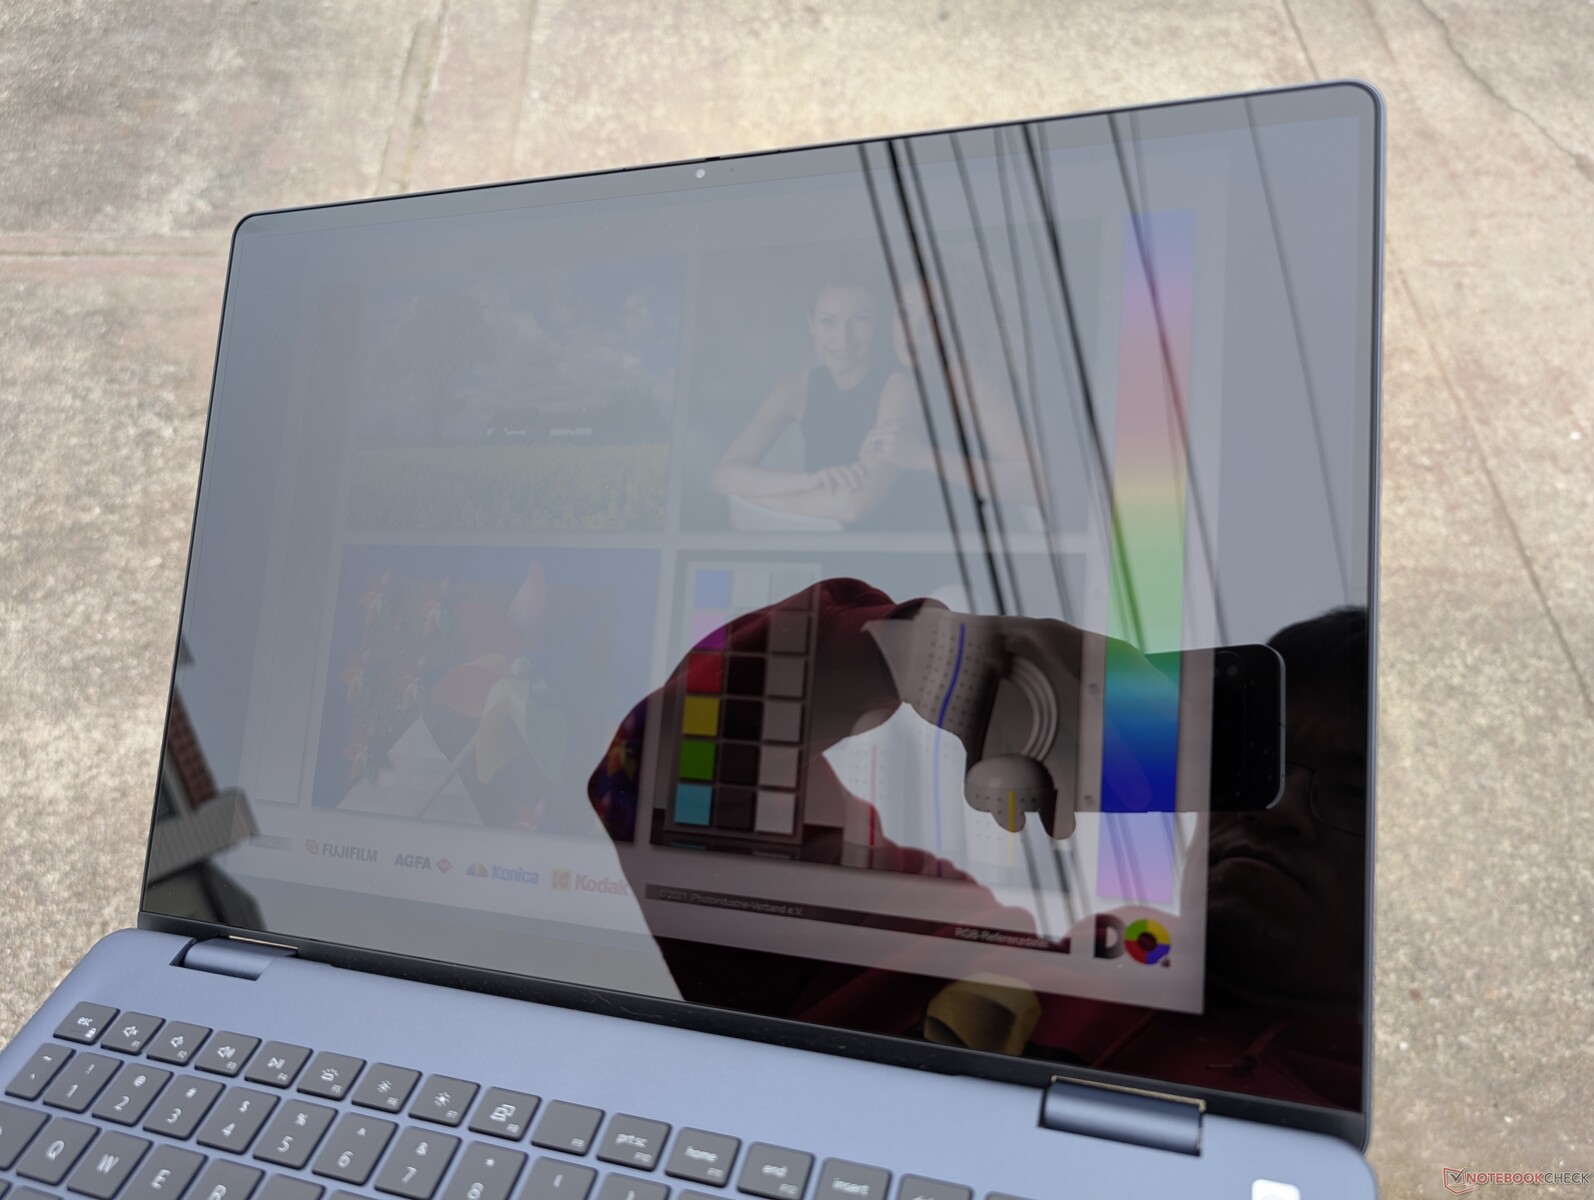
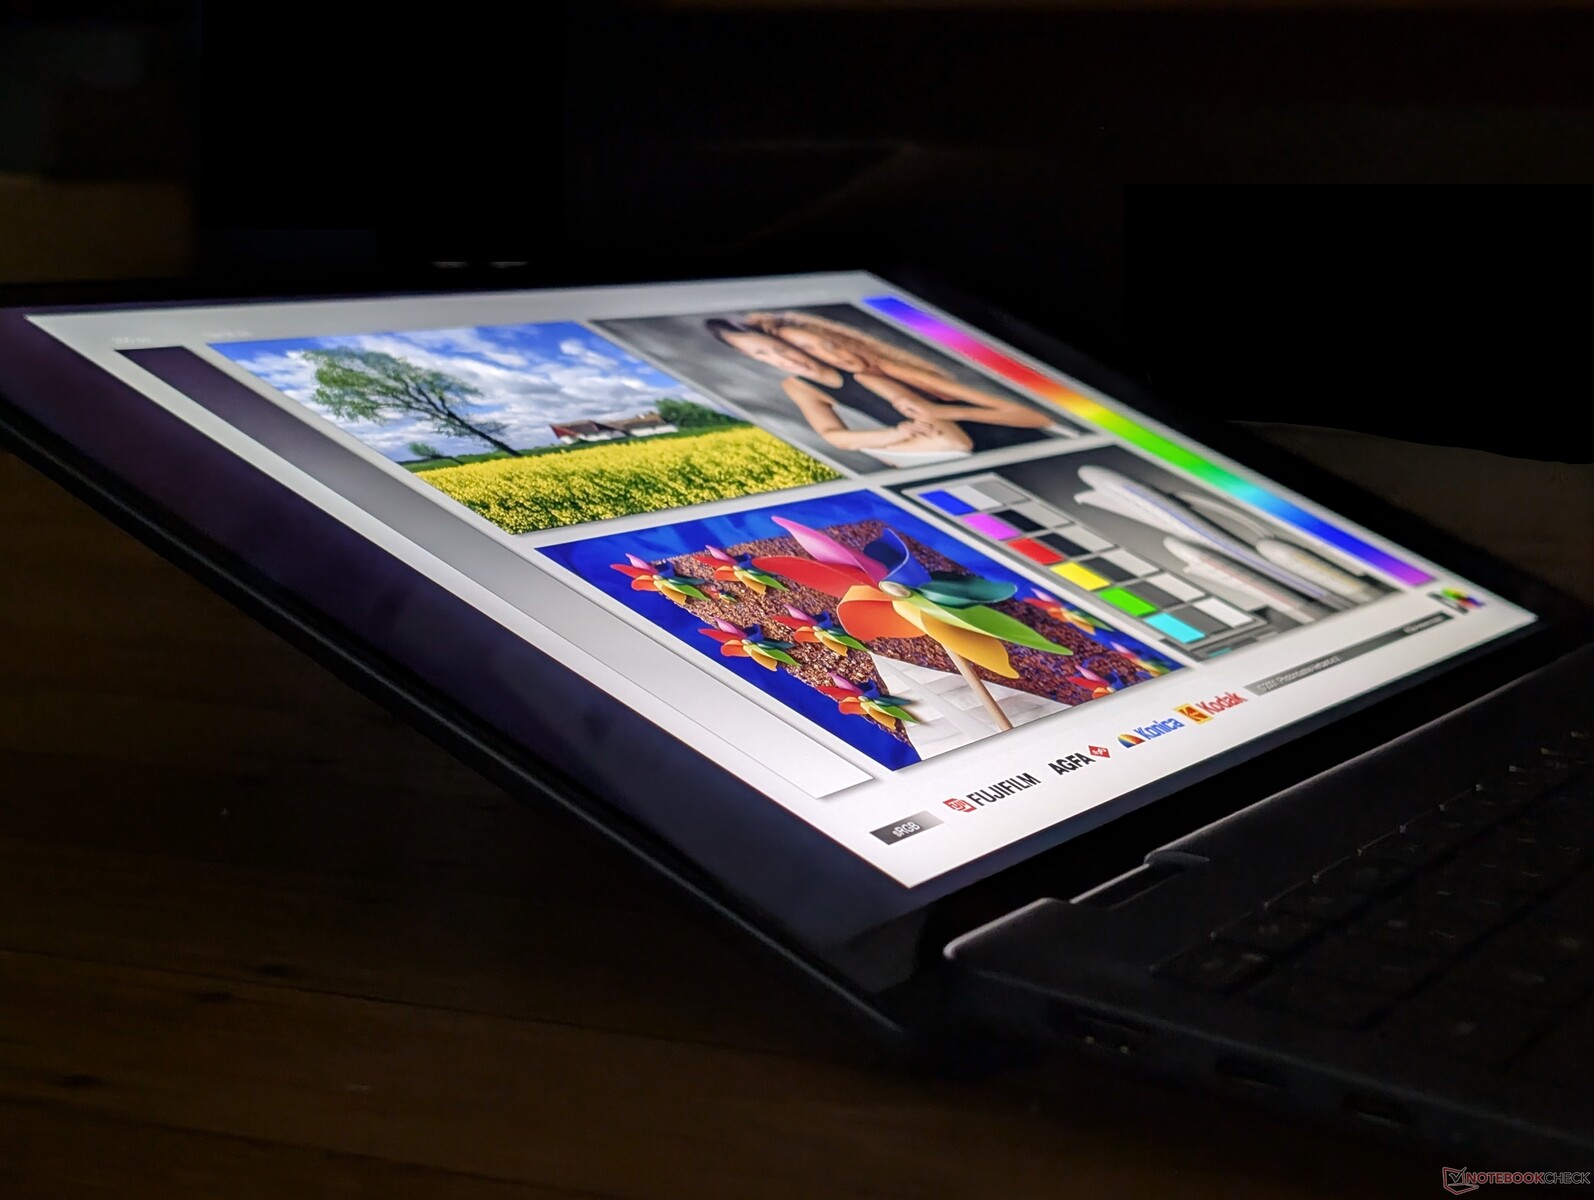
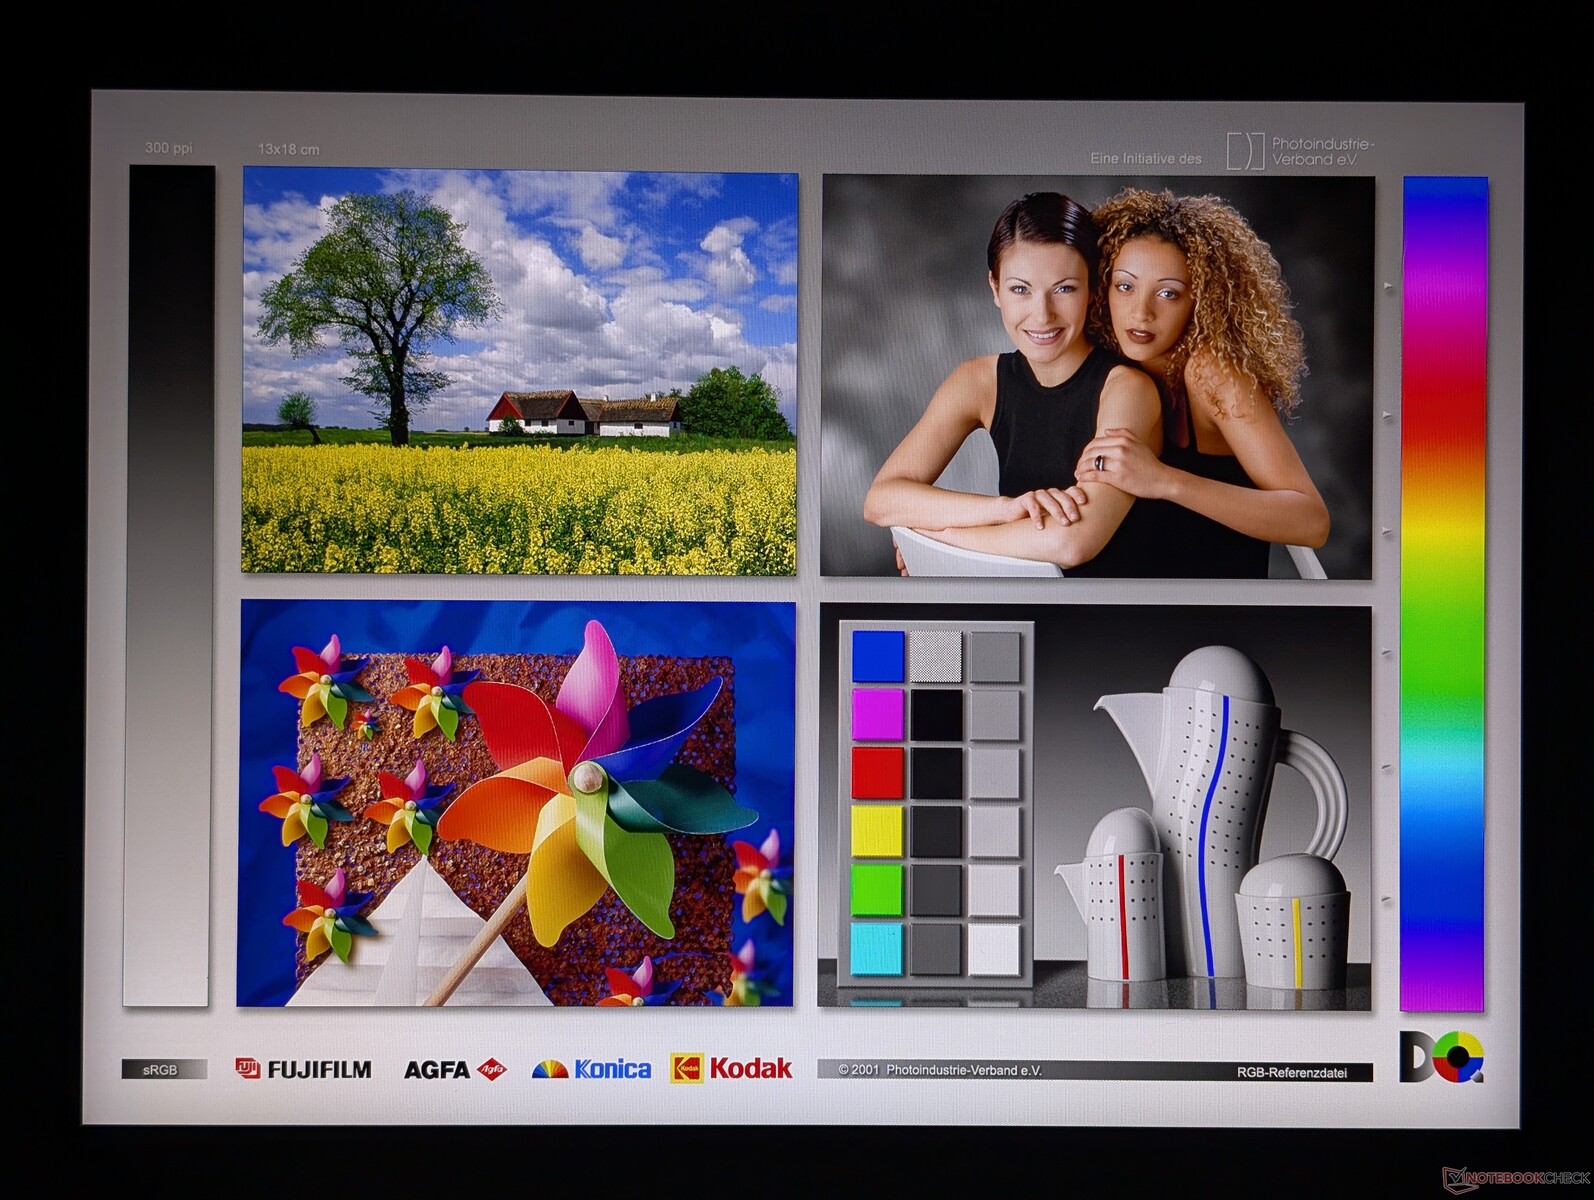
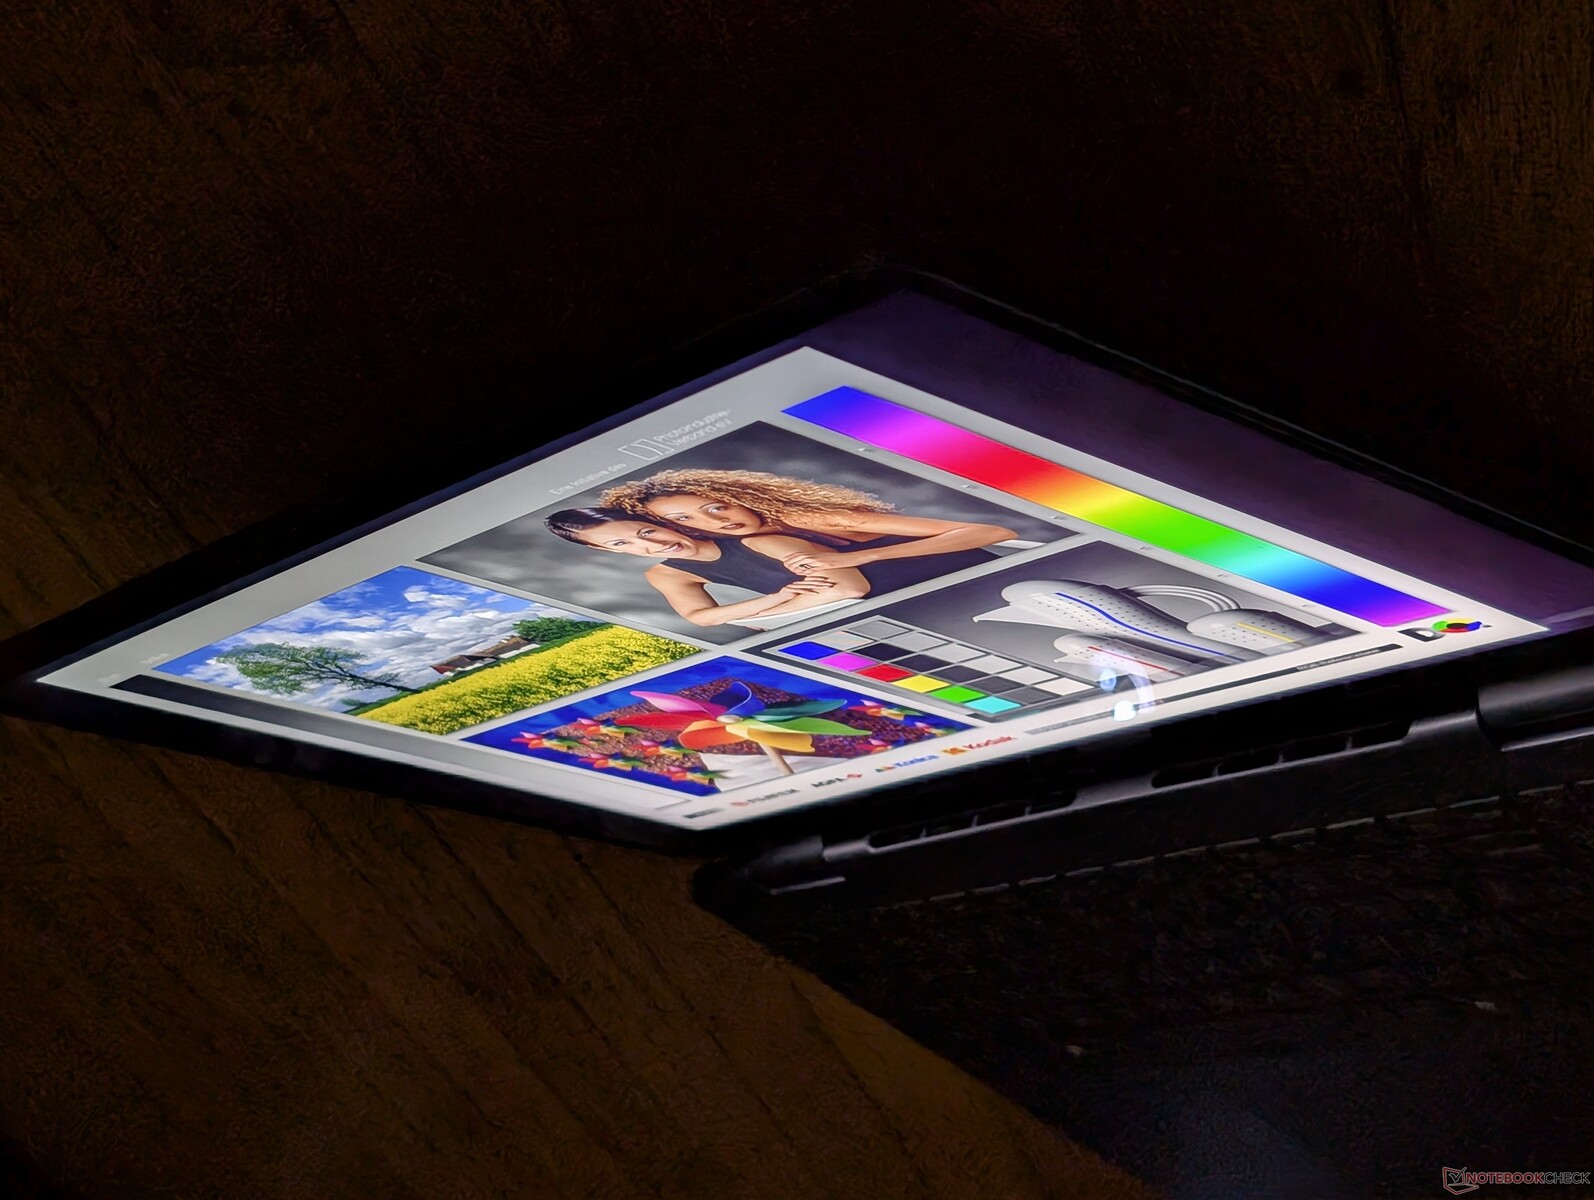
Display
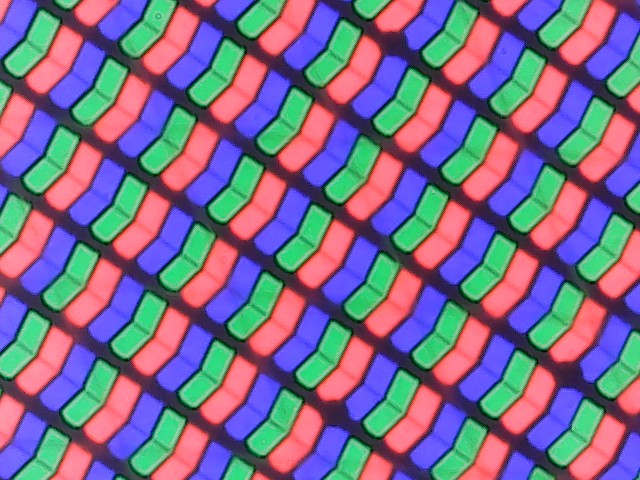
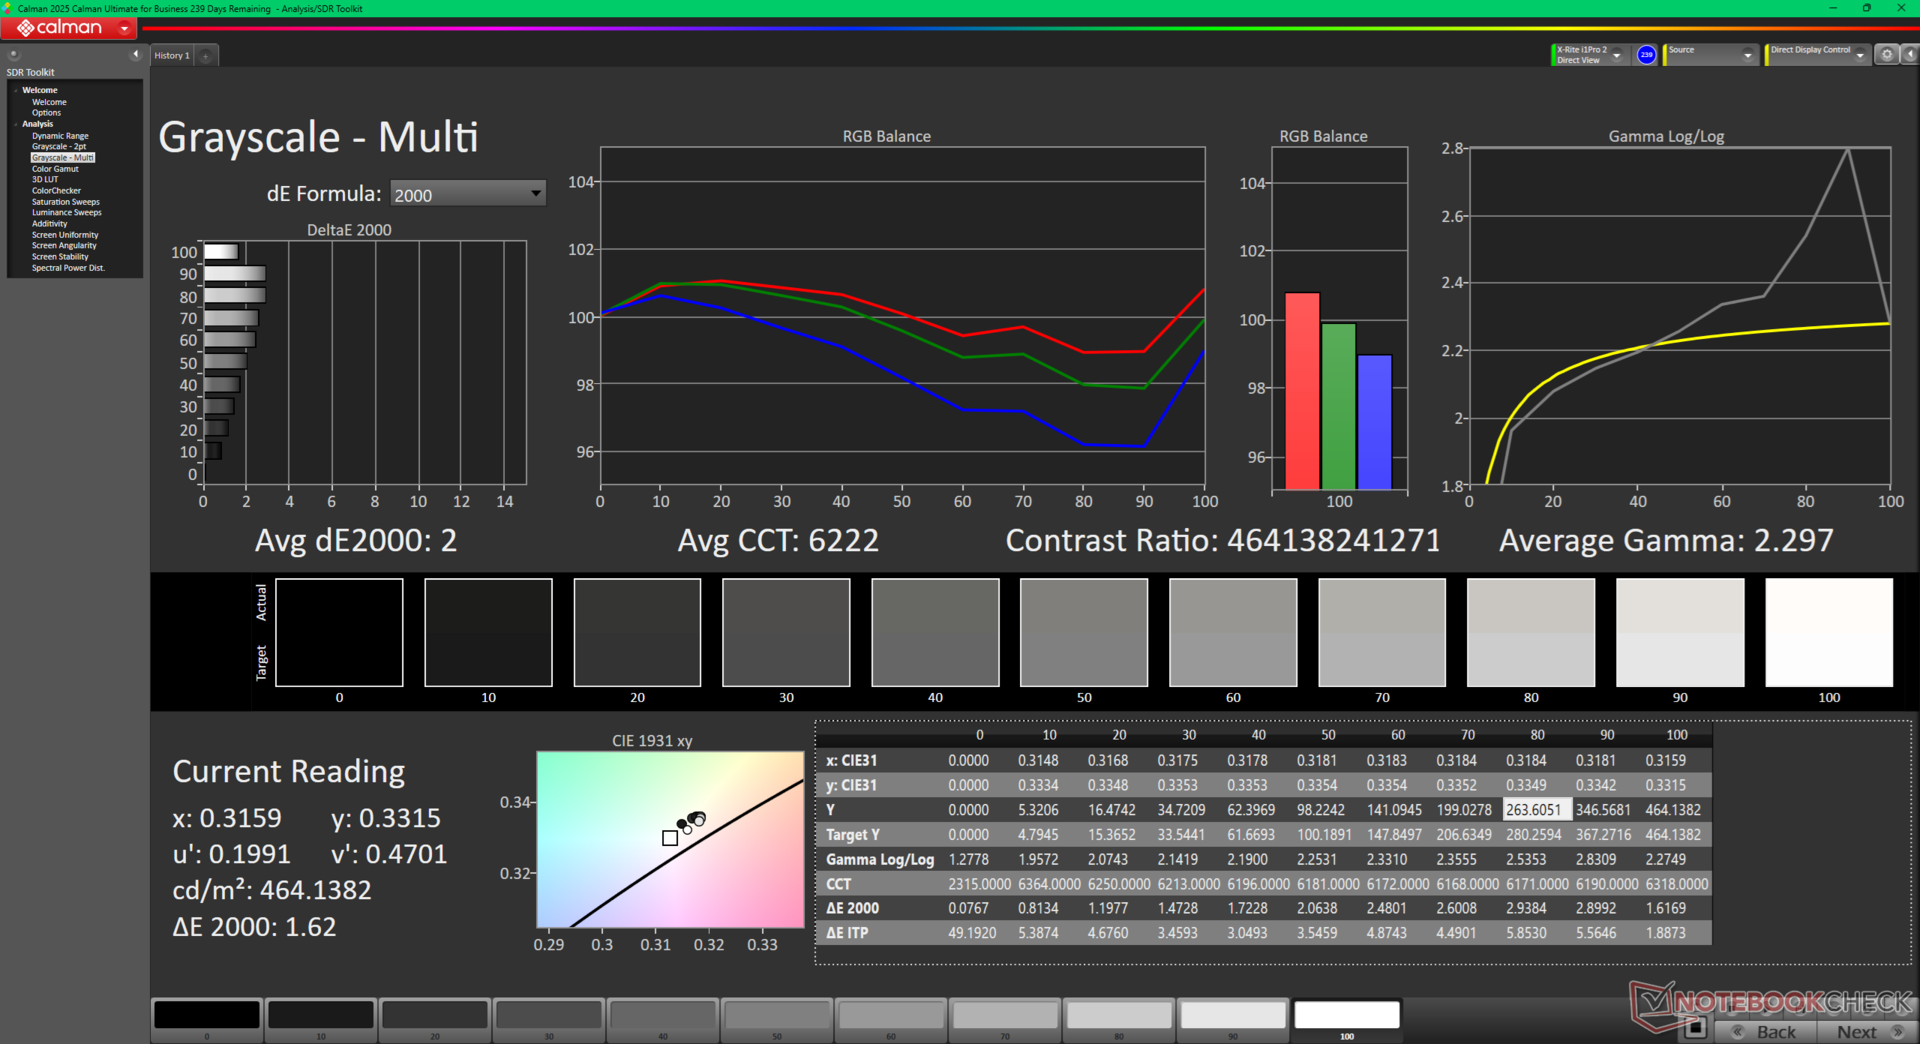
Il sistema utilizza lo stesso pannello mini-LED AU Optronics B160QAT presente sul modello Inspiron 16 7640 2-in-1 dello scorso anno, per un'esperienza visiva identica tra i due modelli. I pannelli mini-LED sono solitamente più luminosi e con colori più profondi rispetto alla maggior parte dei pannelli IPS per un migliore supporto HDR, ma possono presentare effetti di alone e livelli di nero più deboli che non sono altrimenti presenti sui pannelli OLED.
La luminosità massima può raggiungere i 642 nits quando è abilitato l'HDR o i 432 nits quando è attiva la modalità SDR predefinita.
| |||||||||||||||||||||||||
Distribuzione della luminosità: 97 %
Al centro con la batteria: 432.1 cd/m²
Contrasto: ∞:1 (Nero: 0 cd/m²)
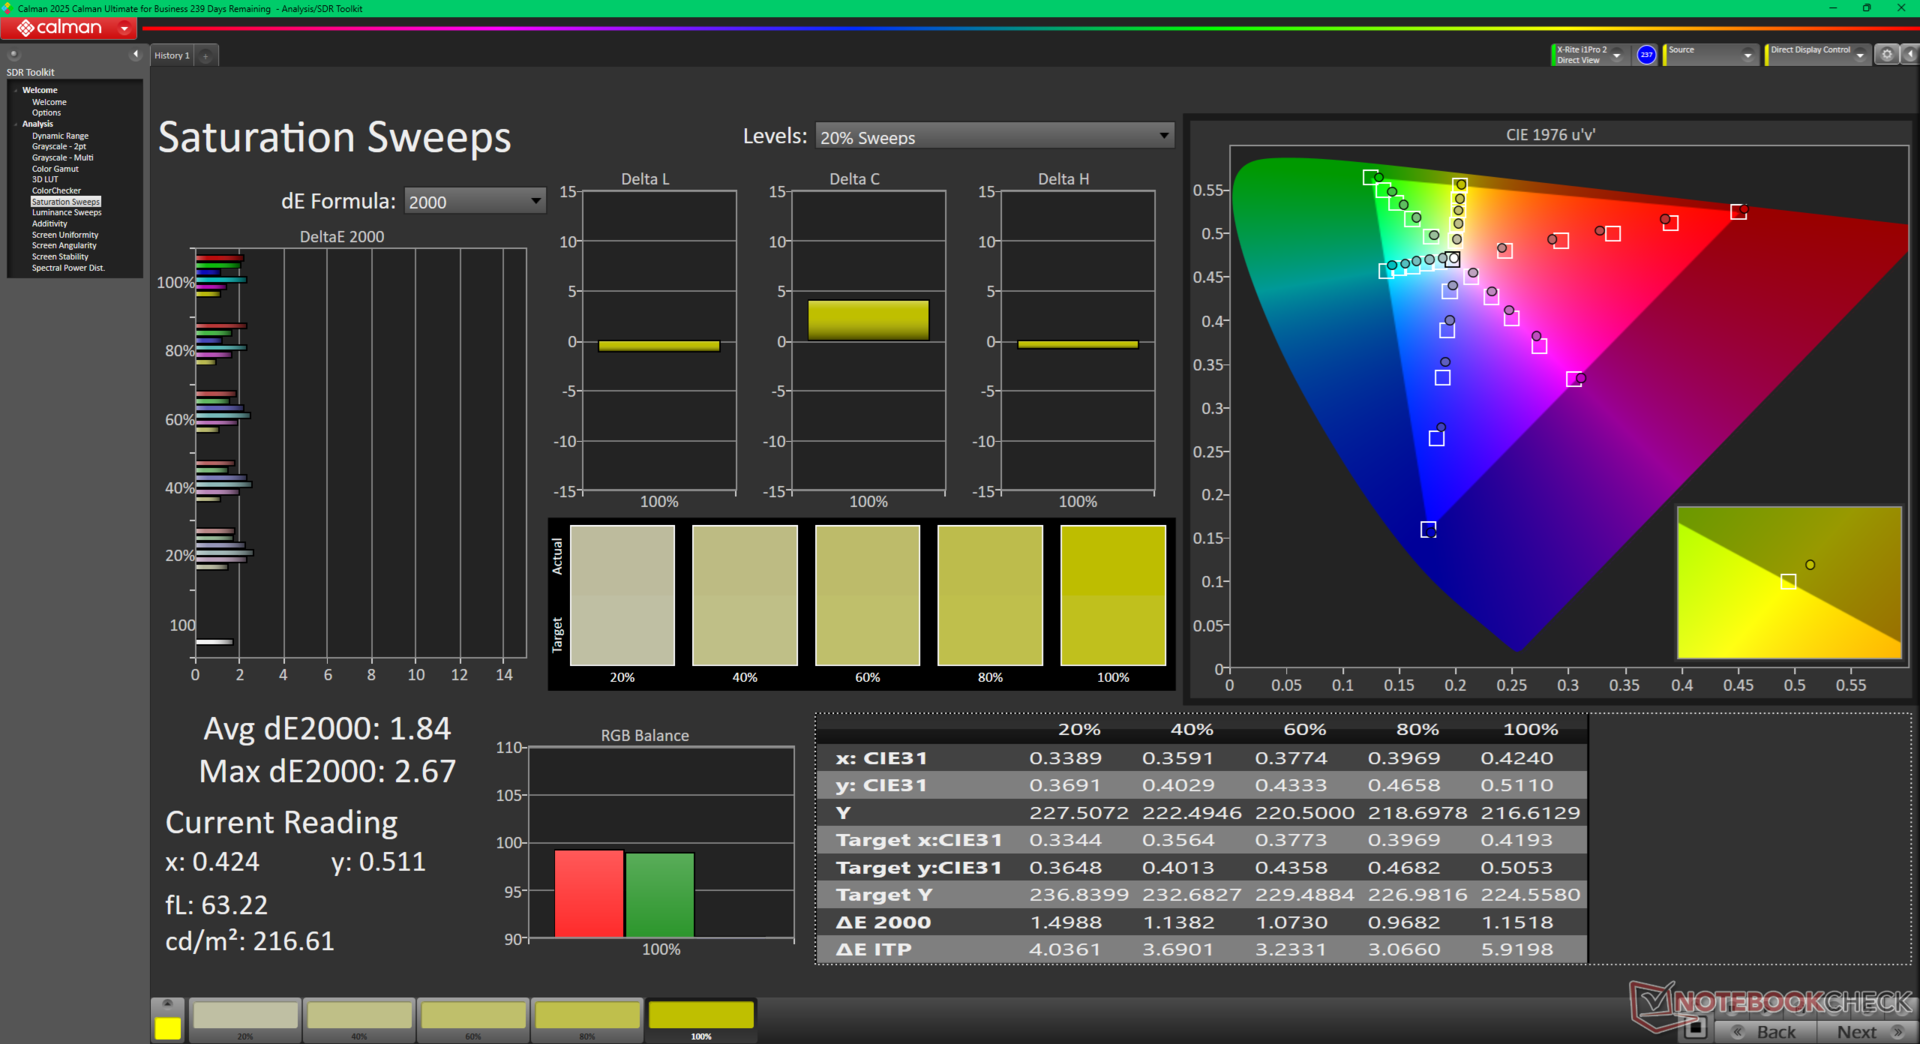
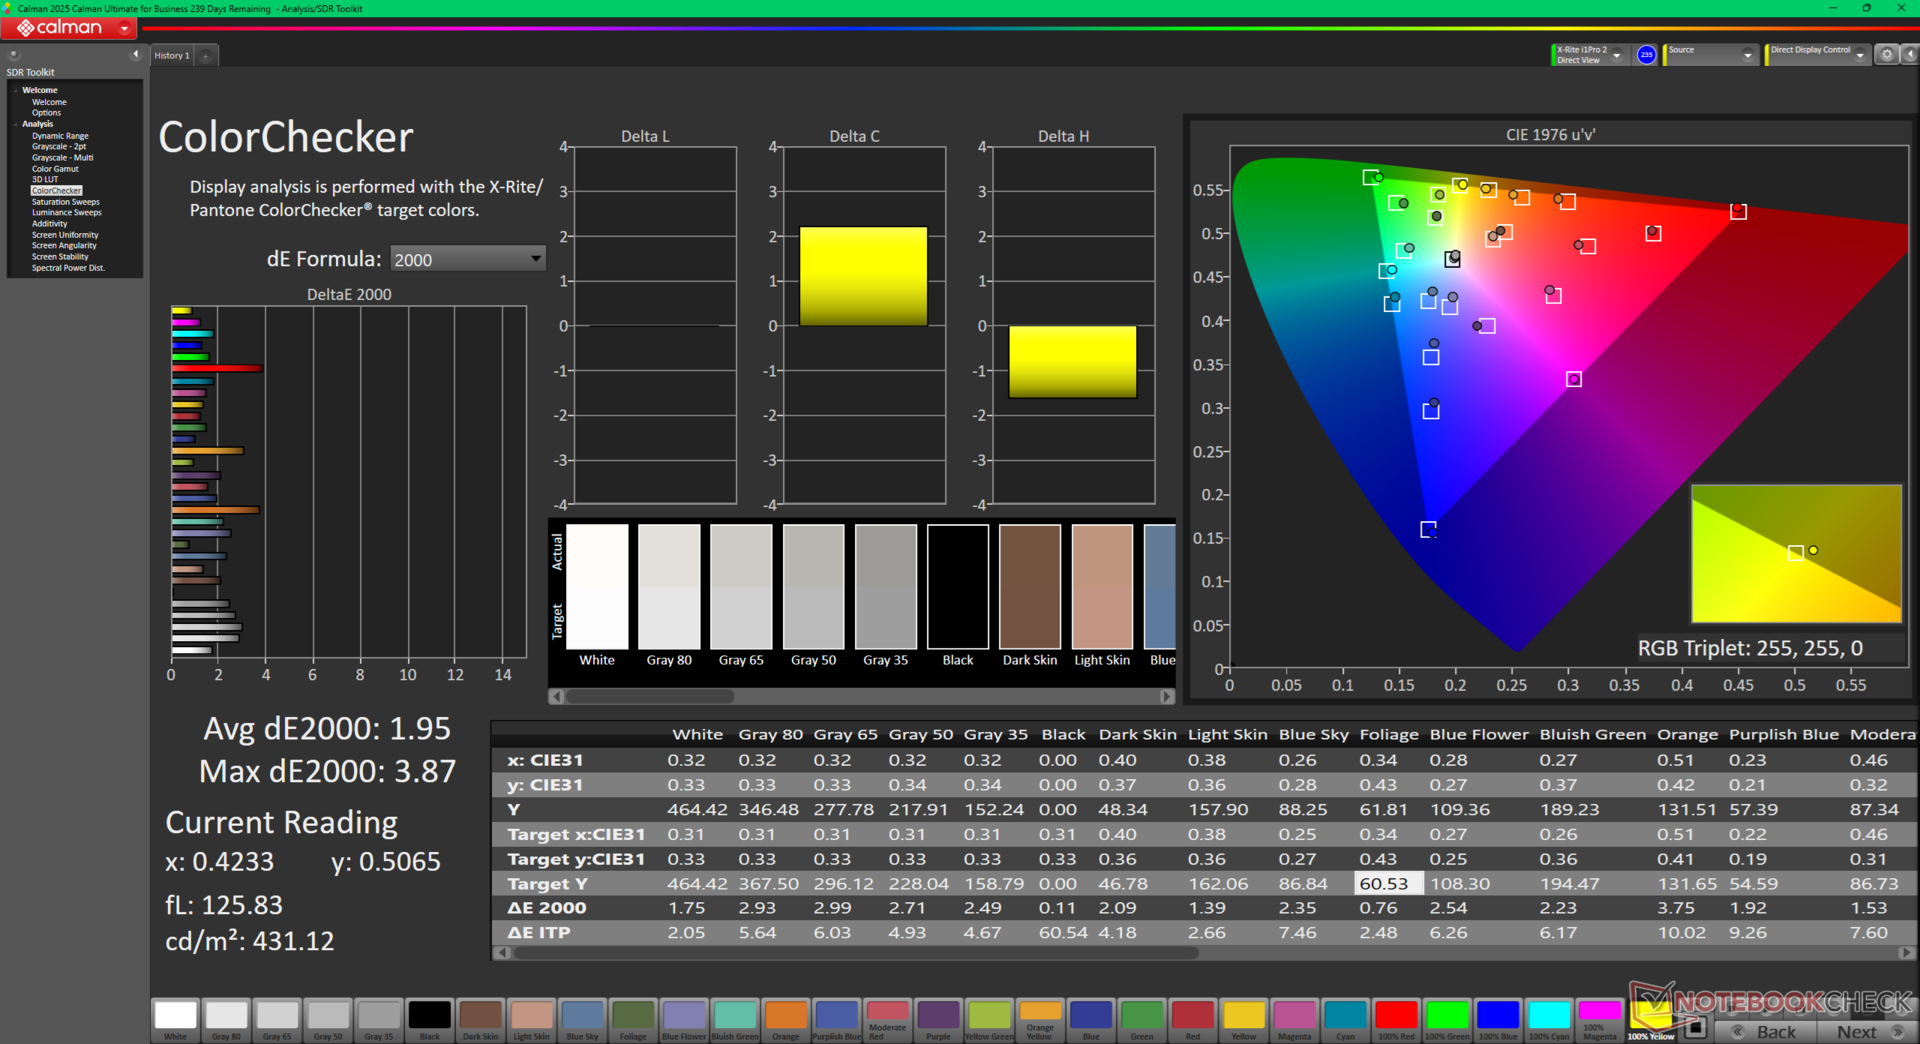
ΔE ColorChecker Calman: 1.95 | ∀{0.5-29.43 Ø4.71}
calibrated: 1.16
ΔE Greyscale Calman: 2 | ∀{0.09-98 Ø4.96}
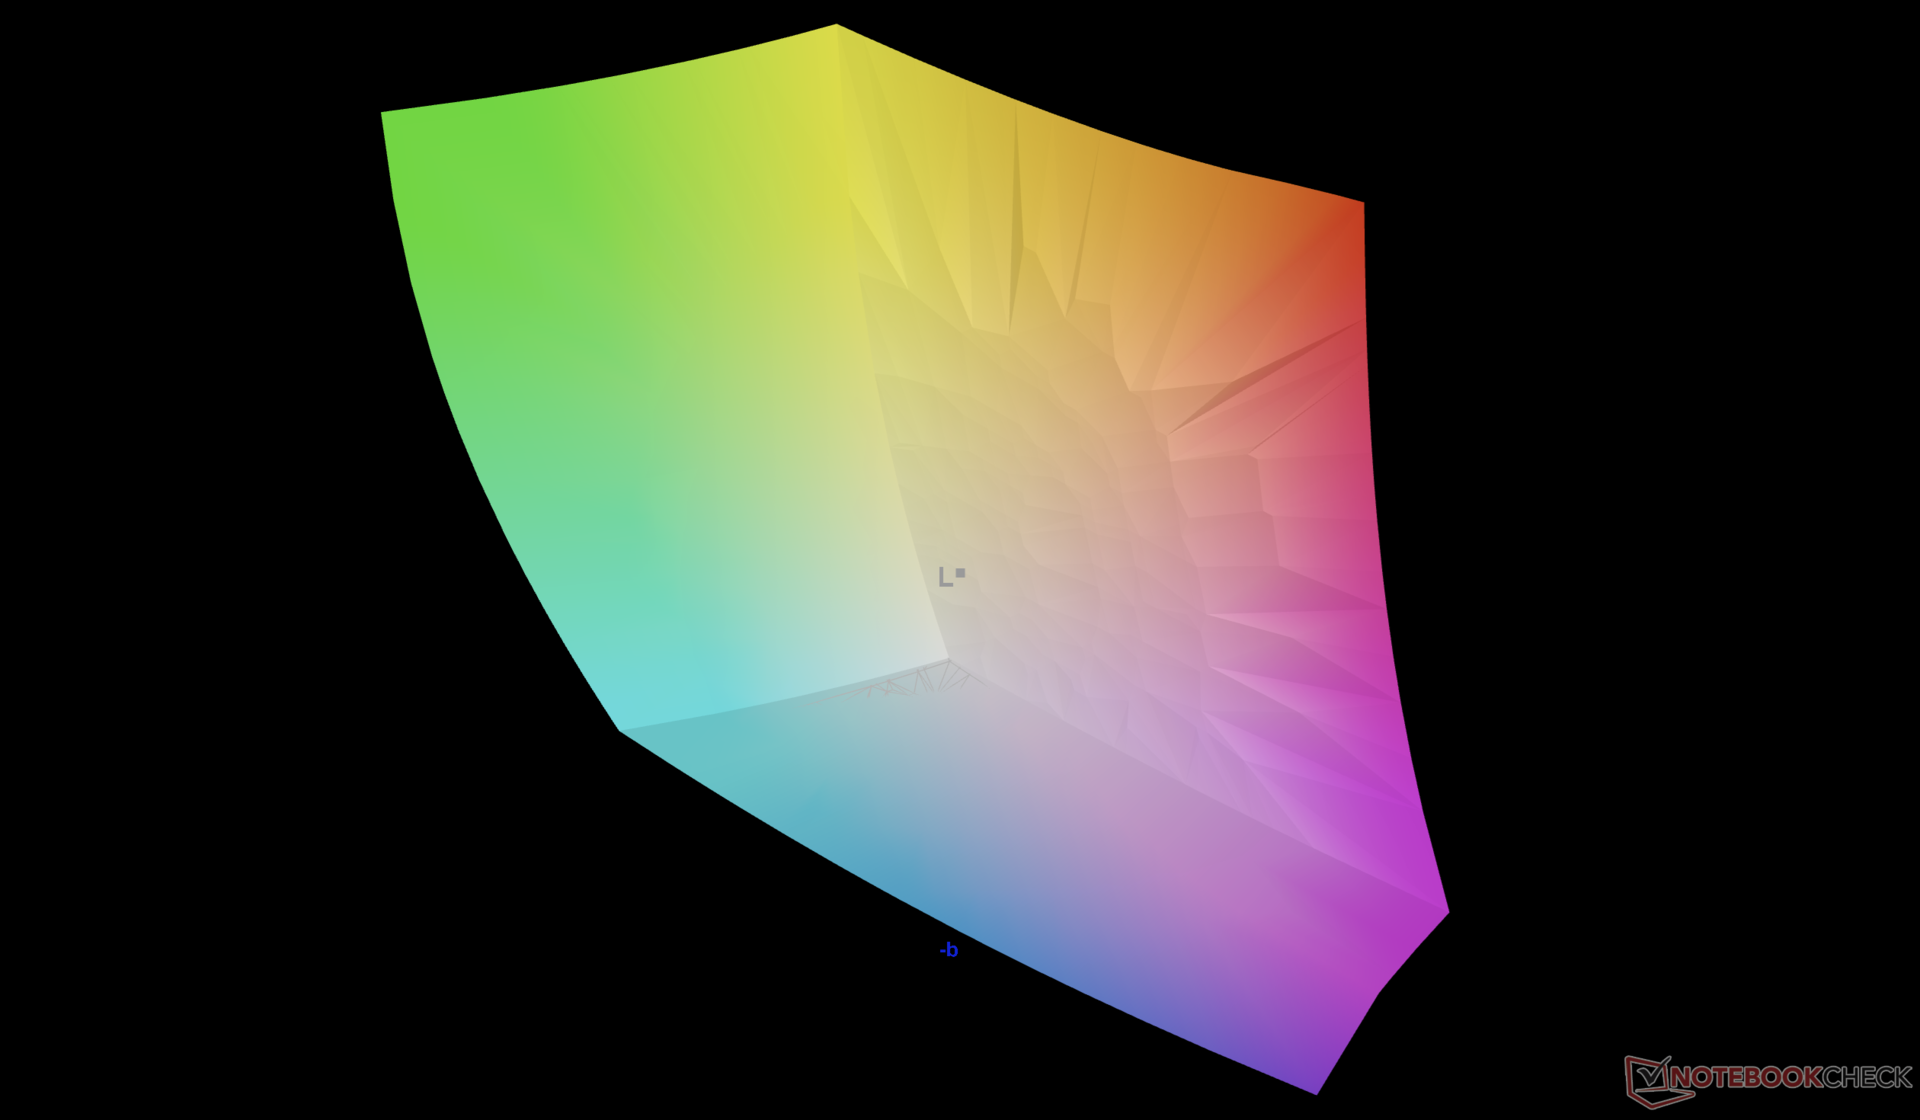
94.2% AdobeRGB 1998 (Argyll 3D)
100% sRGB (Argyll 3D)
99.5% Display P3 (Argyll 3D)
Gamma: 2.3
CCT: 6222 K
| Dell 16 Plus 2-in-1 AU Optronics B160QAT, Mini-LED, 2560x1600, 16", 90 Hz | Dell Inspiron 16 7640 2-in-1 AU Optronics B160QAT, Mini-LED, 2560x1600, 16", 90 Hz | Lenovo Yoga 7 2-in-1 16ILL10 LEN160WUM, IPS, 1920x1200, 16", 60 Hz | Samsung Galaxy Book5 Pro 360 ATNA60CL09-0, OLED, 2880x1800, 16", 120 Hz | MSI Summit A16 AI Plus A3HMTG AU Optronics B16QAN02.N, IPS, 2560x1600, 16", 165 Hz | HP Envy x360 2-in-1 16-ad0097nr Samsung SDC41A6, OLED, 2880x1800, 16", 120 Hz | |
|---|---|---|---|---|---|---|
| Display | -1% | -53% | 1% | -4% | 1% | |
| Display P3 Coverage (%) | 99.5 | 99.4 0% | 39.7 -60% | 99.9 0% | 96.8 -3% | 99.6 0% |
| sRGB Coverage (%) | 100 | 100 0% | 57.9 -42% | 100 0% | 99.8 0% | 100 0% |
| AdobeRGB 1998 Coverage (%) | 94.2 | 92.5 -2% | 41 -56% | 96.6 3% | 84.7 -10% | 96.5 2% |
| Response Times | 32% | 50% | 73% | 80% | 98% | |
| Response Time Grey 50% / Grey 80% * (ms) | 48.8 ? | 15.4 ? 68% | 30 ? 39% | 0.48 ? 99% | 12.9 ? 74% | 0.8 ? 98% |
| Response Time Black / White * (ms) | 57.6 ? | 60.6 ? -5% | 22.5 ? 61% | 0.64 ? 99% | 8.9 ? 85% | 0.89 ? 98% |
| PWM Frequency (Hz) | 2807 ? | 2753.7 ? | 240 ? | 491.8 ? | ||
| PWM Amplitude * (%) | 50 | 40 20% | ||||
| Screen | -49% | -169% | 16% | -22% | -19% | |
| Brightness middle (cd/m²) | 432.1 | 413 -4% | 317.9 -26% | 387 -10% | 475.4 10% | 399.4 -8% |
| Brightness (cd/m²) | 426 | 409 -4% | 304 -29% | 392 -8% | 440 3% | 405 -5% |
| Brightness Distribution (%) | 97 | 97 0% | 90 -7% | 98 1% | 89 -8% | 98 1% |
| Black Level * (cd/m²) | 0.14 | 0.25 | 0.36 | |||
| Colorchecker dE 2000 * | 1.95 | 3.48 -78% | 7.39 -279% | 1 49% | 2.99 -53% | 4.05 -108% |
| Colorchecker dE 2000 max. * | 3.87 | 6.97 -80% | 21.43 -454% | 1.9 51% | 7.64 -97% | 6.69 -73% |
| Colorchecker dE 2000 calibrated * | 1.16 | 3.06 -164% | 0.74 36% | 1.02 12% | ||
| Greyscale dE 2000 * | 2 | 4.5 -125% | 6.5 -225% | 1.7 15% | 2.9 -45% | 1.1 45% |
| Gamma | 2.3 96% | 2.15 102% | 2.22 99% | 2.25 98% | 2.31 95% | 2.27 97% |
| CCT | 6222 104% | 6446 101% | 6140 106% | 6325 103% | 6472 100% | 6419 101% |
| Contrast (:1) | 2950 | 1272 | 1321 | |||
| Media totale (Programma / Settaggio) | -6% /
-21% | -57% /
-104% | 30% /
27% | 18% /
-1% | 27% /
5% |
* ... Meglio usare valori piccoli

Tempi di risposta del Display
| ↔ Tempi di risposta dal Nero al Bianco | ||
|---|---|---|
| 57.6 ms ... aumenta ↗ e diminuisce ↘ combinato | ↗ 50.4 ms Incremento | 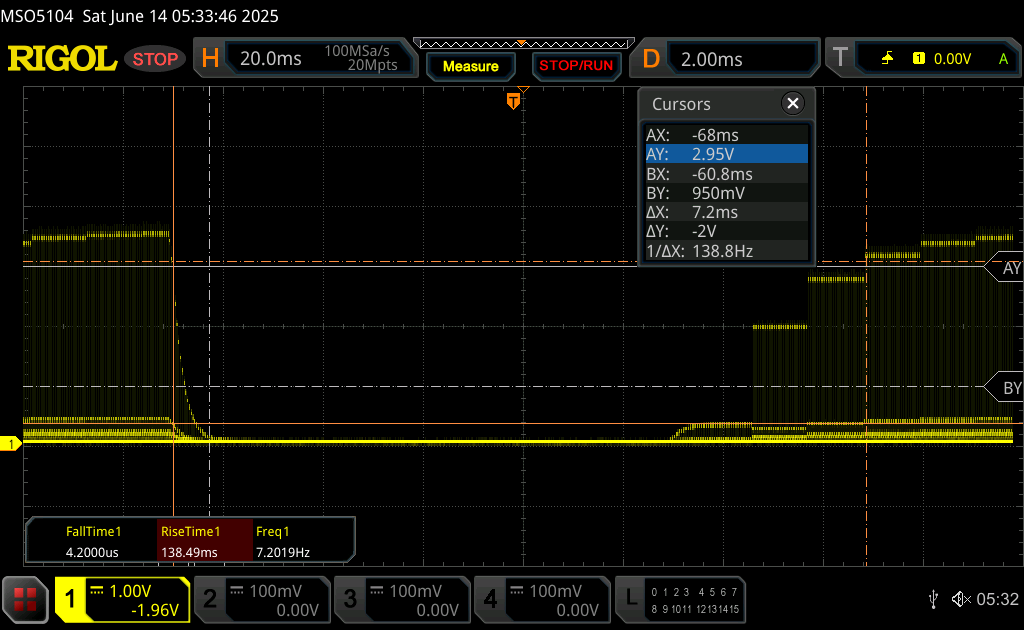 |
| ↘ 7.2 ms Calo | ||
| Lo schermo mostra tempi di risposta lenti nei nostri tests e sarà insoddisfacente per i gamers. In confronto, tutti i dispositivi di test variano da 0.1 (minimo) a 240 (massimo) ms. » 99 % di tutti i dispositivi è migliore. Questo significa che i tempi di risposta rilevati sono peggiori rispetto alla media di tutti i dispositivi testati (19.8 ms). | ||
| ↔ Tempo di risposta dal 50% Grigio all'80% Grigio | ||
| 48.8 ms ... aumenta ↗ e diminuisce ↘ combinato | ↗ 33.6 ms Incremento | 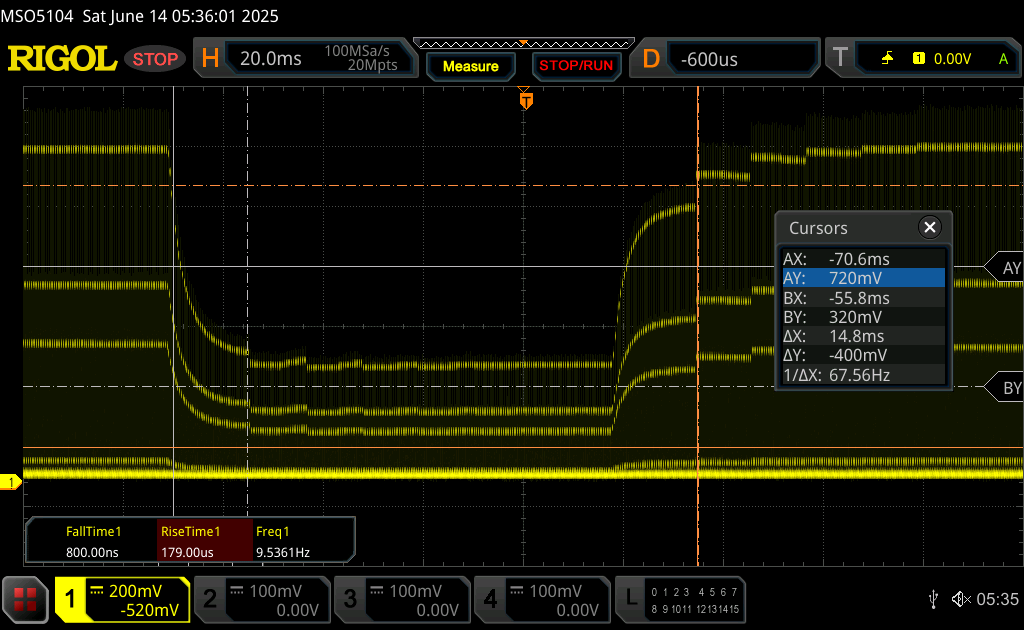 |
| ↘ 15.2 ms Calo | ||
| Lo schermo mostra tempi di risposta lenti nei nostri tests e sarà insoddisfacente per i gamers. In confronto, tutti i dispositivi di test variano da 0.165 (minimo) a 636 (massimo) ms. » 84 % di tutti i dispositivi è migliore. Questo significa che i tempi di risposta rilevati sono peggiori rispetto alla media di tutti i dispositivi testati (30.9 ms). | ||
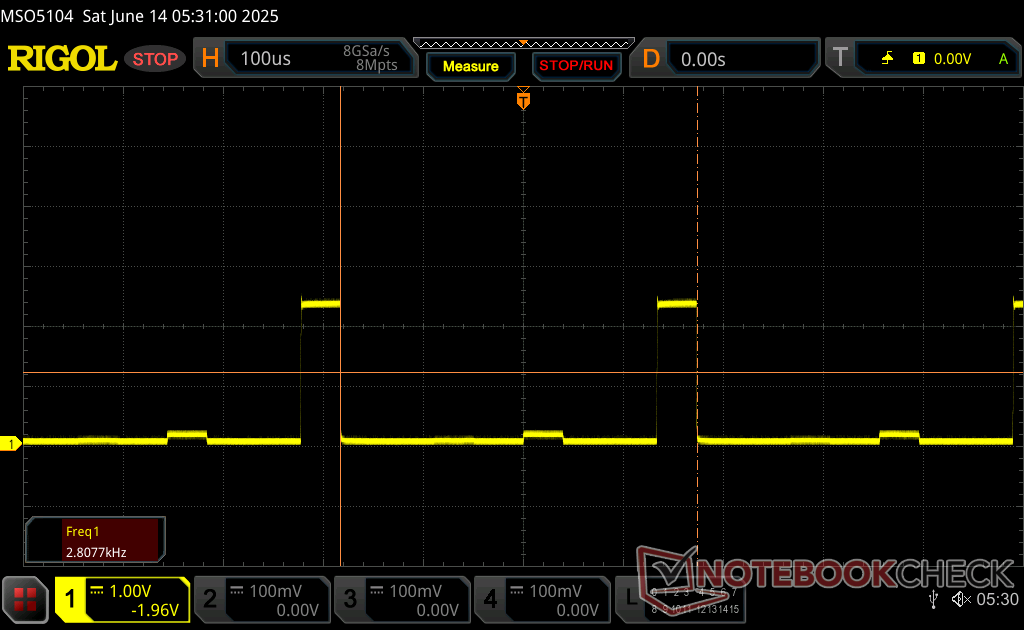
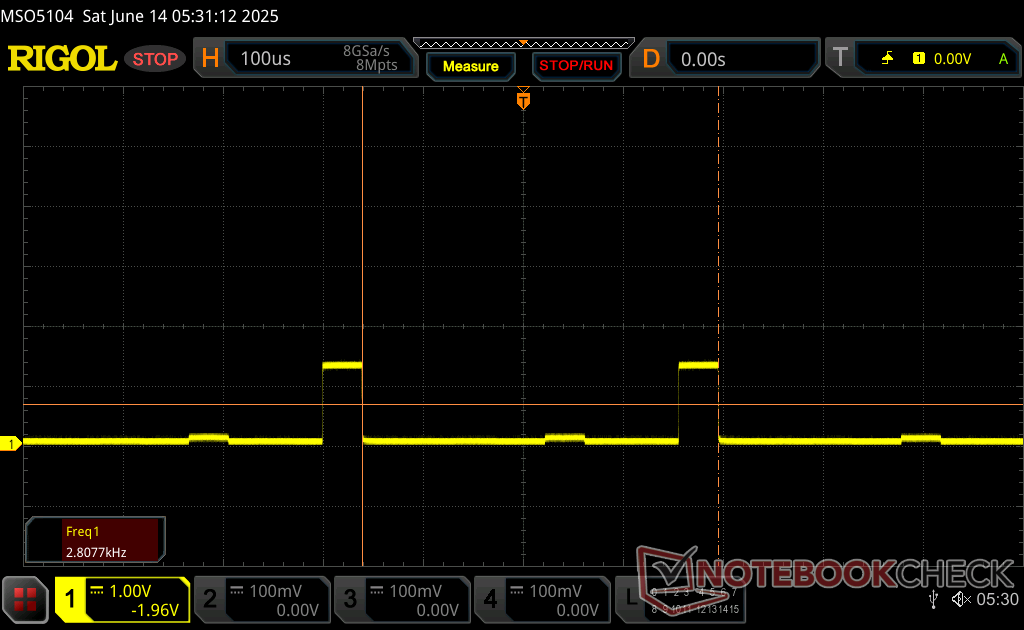
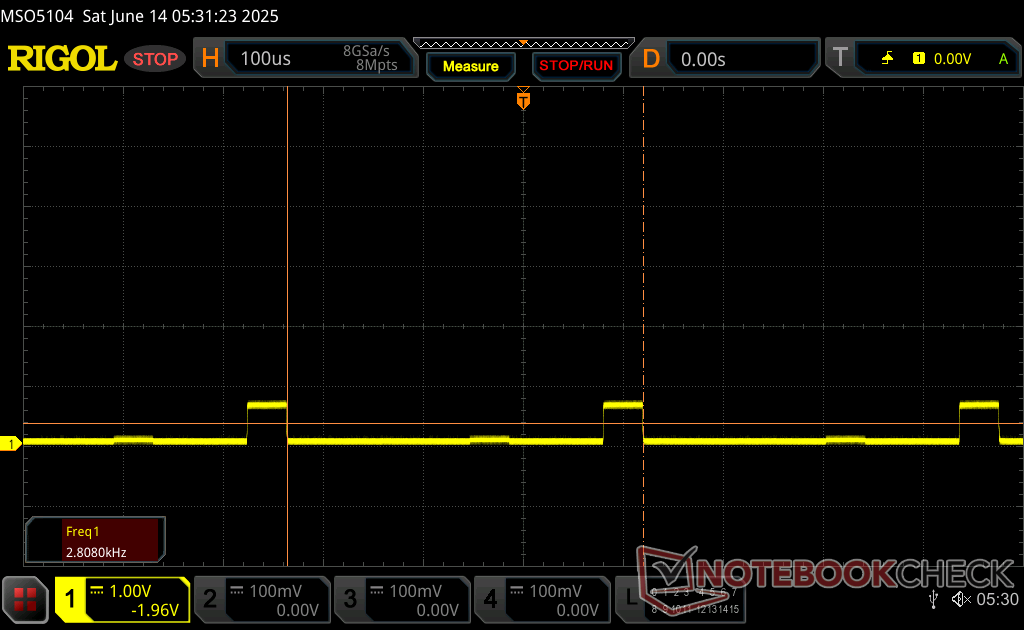
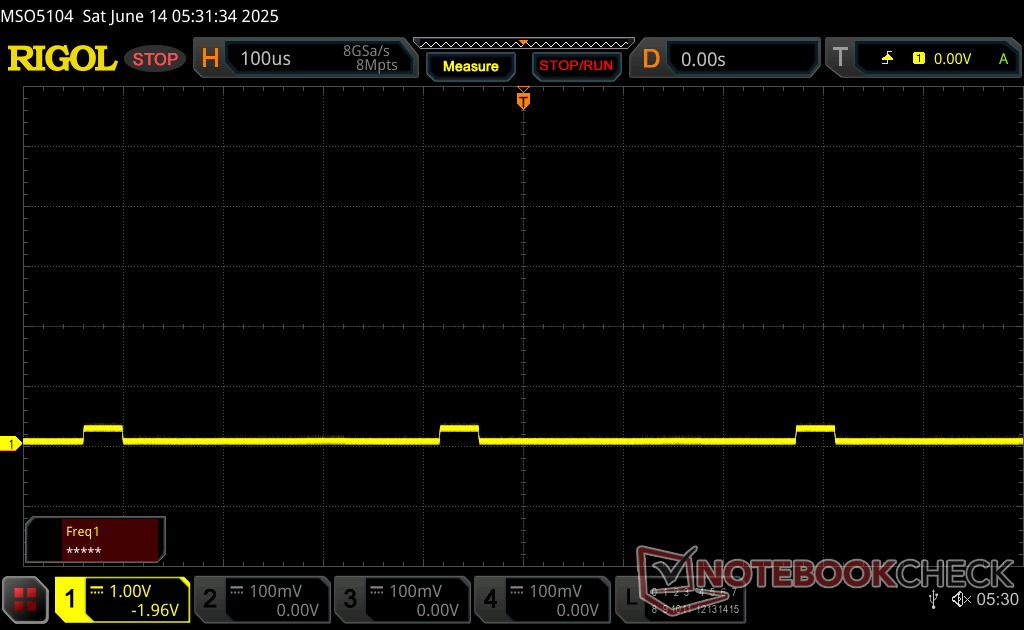
Sfarfallio dello schermo / PWM (Pulse-Width Modulation)
| flickering dello schermo / PWM rilevato | 2807 Hz Amplitude: 50 % | ≤ 100 % settaggio luminosita' | 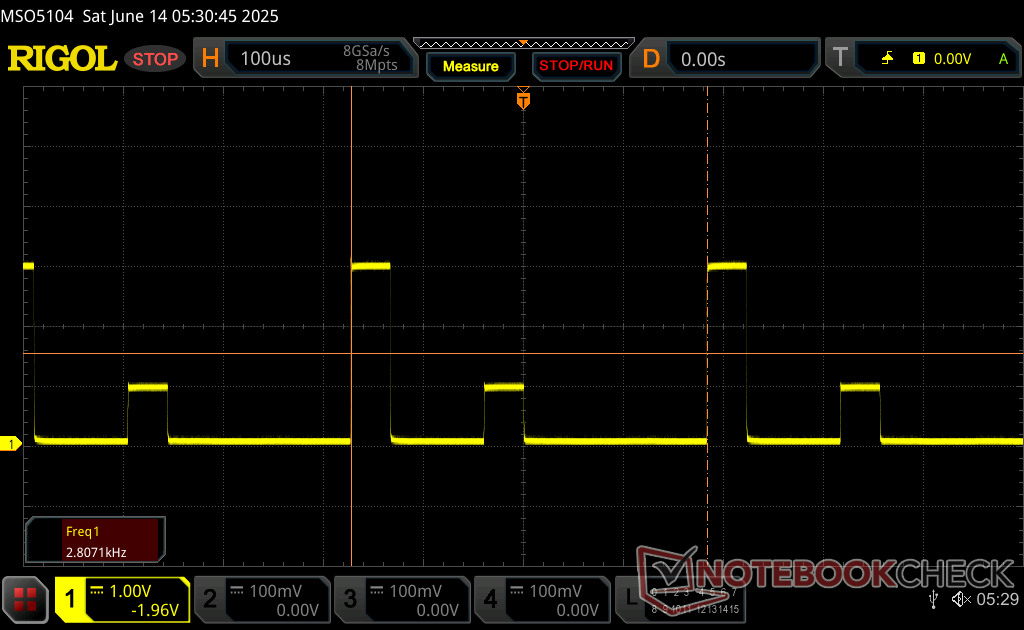 |
Il display sfarfalla a 2807 Hz (Probabilmente a causa dell'uso di PWM) Flickering rilevato ad una luminosita' di 100 % o inferiore. Non dovrebbe verificarsi flickering o PWM sopra questo valore di luminosita'. La frequenza di 2807 Hz è abbastanza alta, quindi la maggioranza degli utenti sensibili al PWM non dovrebbero notare alcun flickering. In confronto: 52 % di tutti i dispositivi testati non utilizza PWM per ridurre la luminosita' del display. Se è rilevato PWM, una media di 7748 (minimo: 5 - massimo: 343500) Hz è stata rilevata. | |||

Prestazioni
Condizioni del test
Abbiamo impostato Dell Optimizer in modalità Performance prima di eseguire i benchmark qui sotto.
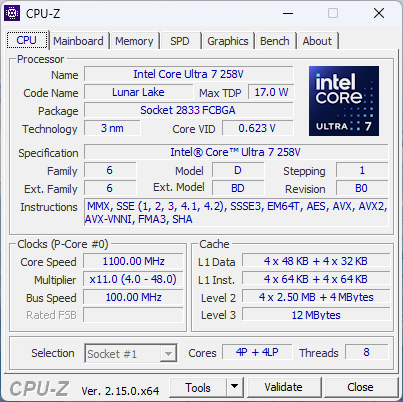
Processore
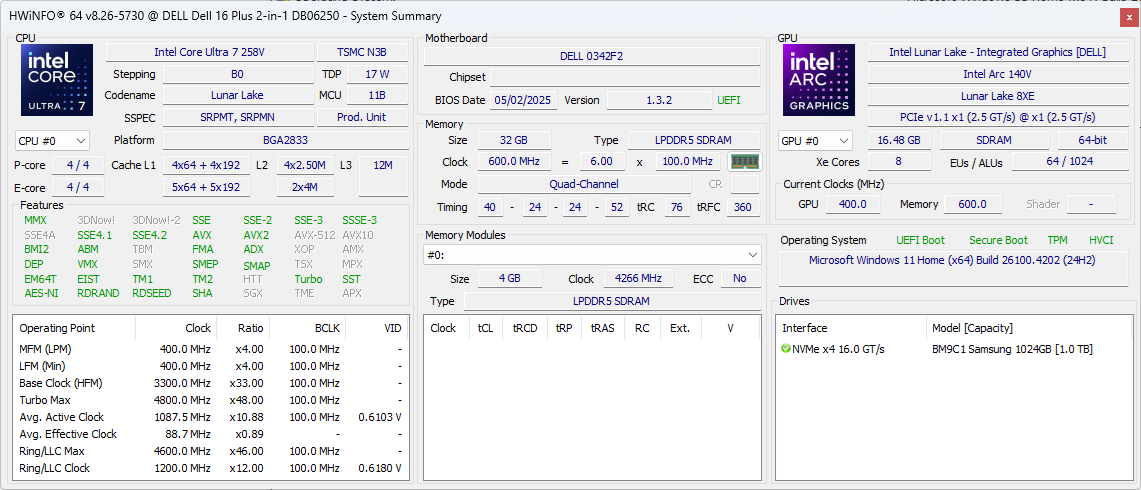
Il Core Ultra 7 256V enfatizza le prestazioni per watt rispetto alle prestazioni grezze e quindi offre molto poco rispetto alla generazione precedente Core Ultra 7 155U o anche del Core i7-1355U se gli utenti non utilizzano la NPU integrata. Forse la cosa più importante è che l'aggiornamento al più costoso Core Ultra 9 288V dovrebbe aumentare le prestazioni solo di un misero 5%, nella migliore delle ipotesi, in base al tempo trascorso con l'Acer Swift 16 AI. Il Core Ultra 7 155H dell'Inspiron 16 7640 2-in-1 dello scorso anno è circa 1,5 volte più veloce del nostro Core Ultra 256V.
Cinebench R15 Multi Loop
Cinebench R23: Multi Core | Single Core
Cinebench R20: CPU (Multi Core) | CPU (Single Core)
Cinebench R15: CPU Multi 64Bit | CPU Single 64Bit
Blender: v2.79 BMW27 CPU
7-Zip 18.03: 7z b 4 | 7z b 4 -mmt1
Geekbench 6.7: Multi-Core | Single-Core
Geekbench 5.5: Multi-Core | Single-Core
HWBOT x265 Benchmark v2.2: 4k Preset
LibreOffice : 20 Documents To PDF
R Benchmark 2.5: Overall mean
* ... Meglio usare valori piccoli
AIDA64: FP32 Ray-Trace | FPU Julia | CPU SHA3 | CPU Queen | FPU SinJulia | FPU Mandel | CPU AES | CPU ZLib | FP64 Ray-Trace | CPU PhotoWorxx
| Performance rating | |
| MSI Summit A16 AI Plus A3HMTG | |
| HP Envy x360 2-in-1 16-ad0097nr | |
| Dell Inspiron 16 7640 2-in-1 | |
| Dell 16 Plus 2-in-1 | |
| Lenovo Yoga 7 2-in-1 16ILL10 | |
| Media Intel Core Ultra 7 258V | |
| Samsung Galaxy Book5 Pro 360 | |
| AIDA64 / FP32 Ray-Trace | |
| MSI Summit A16 AI Plus A3HMTG | |
| HP Envy x360 2-in-1 16-ad0097nr | |
| Dell Inspiron 16 7640 2-in-1 | |
| Dell 16 Plus 2-in-1 | |
| Samsung Galaxy Book5 Pro 360 | |
| Lenovo Yoga 7 2-in-1 16ILL10 | |
| Media Intel Core Ultra 7 258V (8454 - 12781, n=26) | |
| AIDA64 / FPU Julia | |
| MSI Summit A16 AI Plus A3HMTG | |
| HP Envy x360 2-in-1 16-ad0097nr | |
| Dell Inspiron 16 7640 2-in-1 | |
| Samsung Galaxy Book5 Pro 360 | |
| Lenovo Yoga 7 2-in-1 16ILL10 | |
| Dell 16 Plus 2-in-1 | |
| Media Intel Core Ultra 7 258V (40875 - 63401, n=26) | |
| AIDA64 / CPU SHA3 | |
| MSI Summit A16 AI Plus A3HMTG | |
| HP Envy x360 2-in-1 16-ad0097nr | |
| Dell Inspiron 16 7640 2-in-1 | |
| Lenovo Yoga 7 2-in-1 16ILL10 | |
| Media Intel Core Ultra 7 258V (1930 - 2817, n=26) | |
| Samsung Galaxy Book5 Pro 360 | |
| Dell 16 Plus 2-in-1 | |
| AIDA64 / CPU Queen | |
| HP Envy x360 2-in-1 16-ad0097nr | |
| MSI Summit A16 AI Plus A3HMTG | |
| Dell Inspiron 16 7640 2-in-1 | |
| Dell 16 Plus 2-in-1 | |
| Lenovo Yoga 7 2-in-1 16ILL10 | |
| Media Intel Core Ultra 7 258V (48816 - 49818, n=24) | |
| Samsung Galaxy Book5 Pro 360 | |
| AIDA64 / FPU SinJulia | |
| MSI Summit A16 AI Plus A3HMTG | |
| HP Envy x360 2-in-1 16-ad0097nr | |
| Dell Inspiron 16 7640 2-in-1 | |
| Lenovo Yoga 7 2-in-1 16ILL10 | |
| Dell 16 Plus 2-in-1 | |
| Media Intel Core Ultra 7 258V (3817 - 4440, n=26) | |
| Samsung Galaxy Book5 Pro 360 | |
| AIDA64 / FPU Mandel | |
| MSI Summit A16 AI Plus A3HMTG | |
| HP Envy x360 2-in-1 16-ad0097nr | |
| Dell Inspiron 16 7640 2-in-1 | |
| Samsung Galaxy Book5 Pro 360 | |
| Lenovo Yoga 7 2-in-1 16ILL10 | |
| Dell 16 Plus 2-in-1 | |
| Media Intel Core Ultra 7 258V (21670 - 33565, n=26) | |
| AIDA64 / CPU AES | |
| Dell Inspiron 16 7640 2-in-1 | |
| HP Envy x360 2-in-1 16-ad0097nr | |
| MSI Summit A16 AI Plus A3HMTG | |
| Dell 16 Plus 2-in-1 | |
| Lenovo Yoga 7 2-in-1 16ILL10 | |
| Media Intel Core Ultra 7 258V (30957 - 40753, n=26) | |
| Samsung Galaxy Book5 Pro 360 | |
| AIDA64 / CPU ZLib | |
| MSI Summit A16 AI Plus A3HMTG | |
| Dell Inspiron 16 7640 2-in-1 | |
| HP Envy x360 2-in-1 16-ad0097nr | |
| Lenovo Yoga 7 2-in-1 16ILL10 | |
| Dell 16 Plus 2-in-1 | |
| Media Intel Core Ultra 7 258V (422 - 632, n=26) | |
| Samsung Galaxy Book5 Pro 360 | |
| AIDA64 / FP64 Ray-Trace | |
| MSI Summit A16 AI Plus A3HMTG | |
| HP Envy x360 2-in-1 16-ad0097nr | |
| Dell Inspiron 16 7640 2-in-1 | |
| Samsung Galaxy Book5 Pro 360 | |
| Dell 16 Plus 2-in-1 | |
| Lenovo Yoga 7 2-in-1 16ILL10 | |
| Media Intel Core Ultra 7 258V (4258 - 6930, n=26) | |
| AIDA64 / CPU PhotoWorxx | |
| Dell 16 Plus 2-in-1 | |
| Media Intel Core Ultra 7 258V (44223 - 59245, n=26) | |
| Lenovo Yoga 7 2-in-1 16ILL10 | |
| MSI Summit A16 AI Plus A3HMTG | |
| Samsung Galaxy Book5 Pro 360 | |
| Dell Inspiron 16 7640 2-in-1 | |
| HP Envy x360 2-in-1 16-ad0097nr | |
Prestazioni del sistema
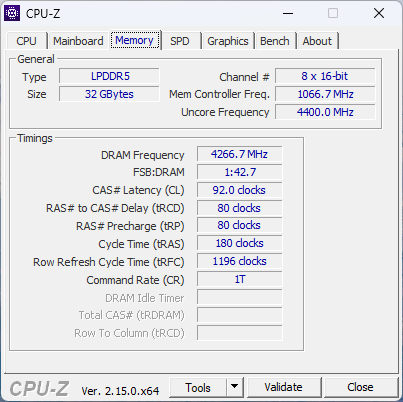
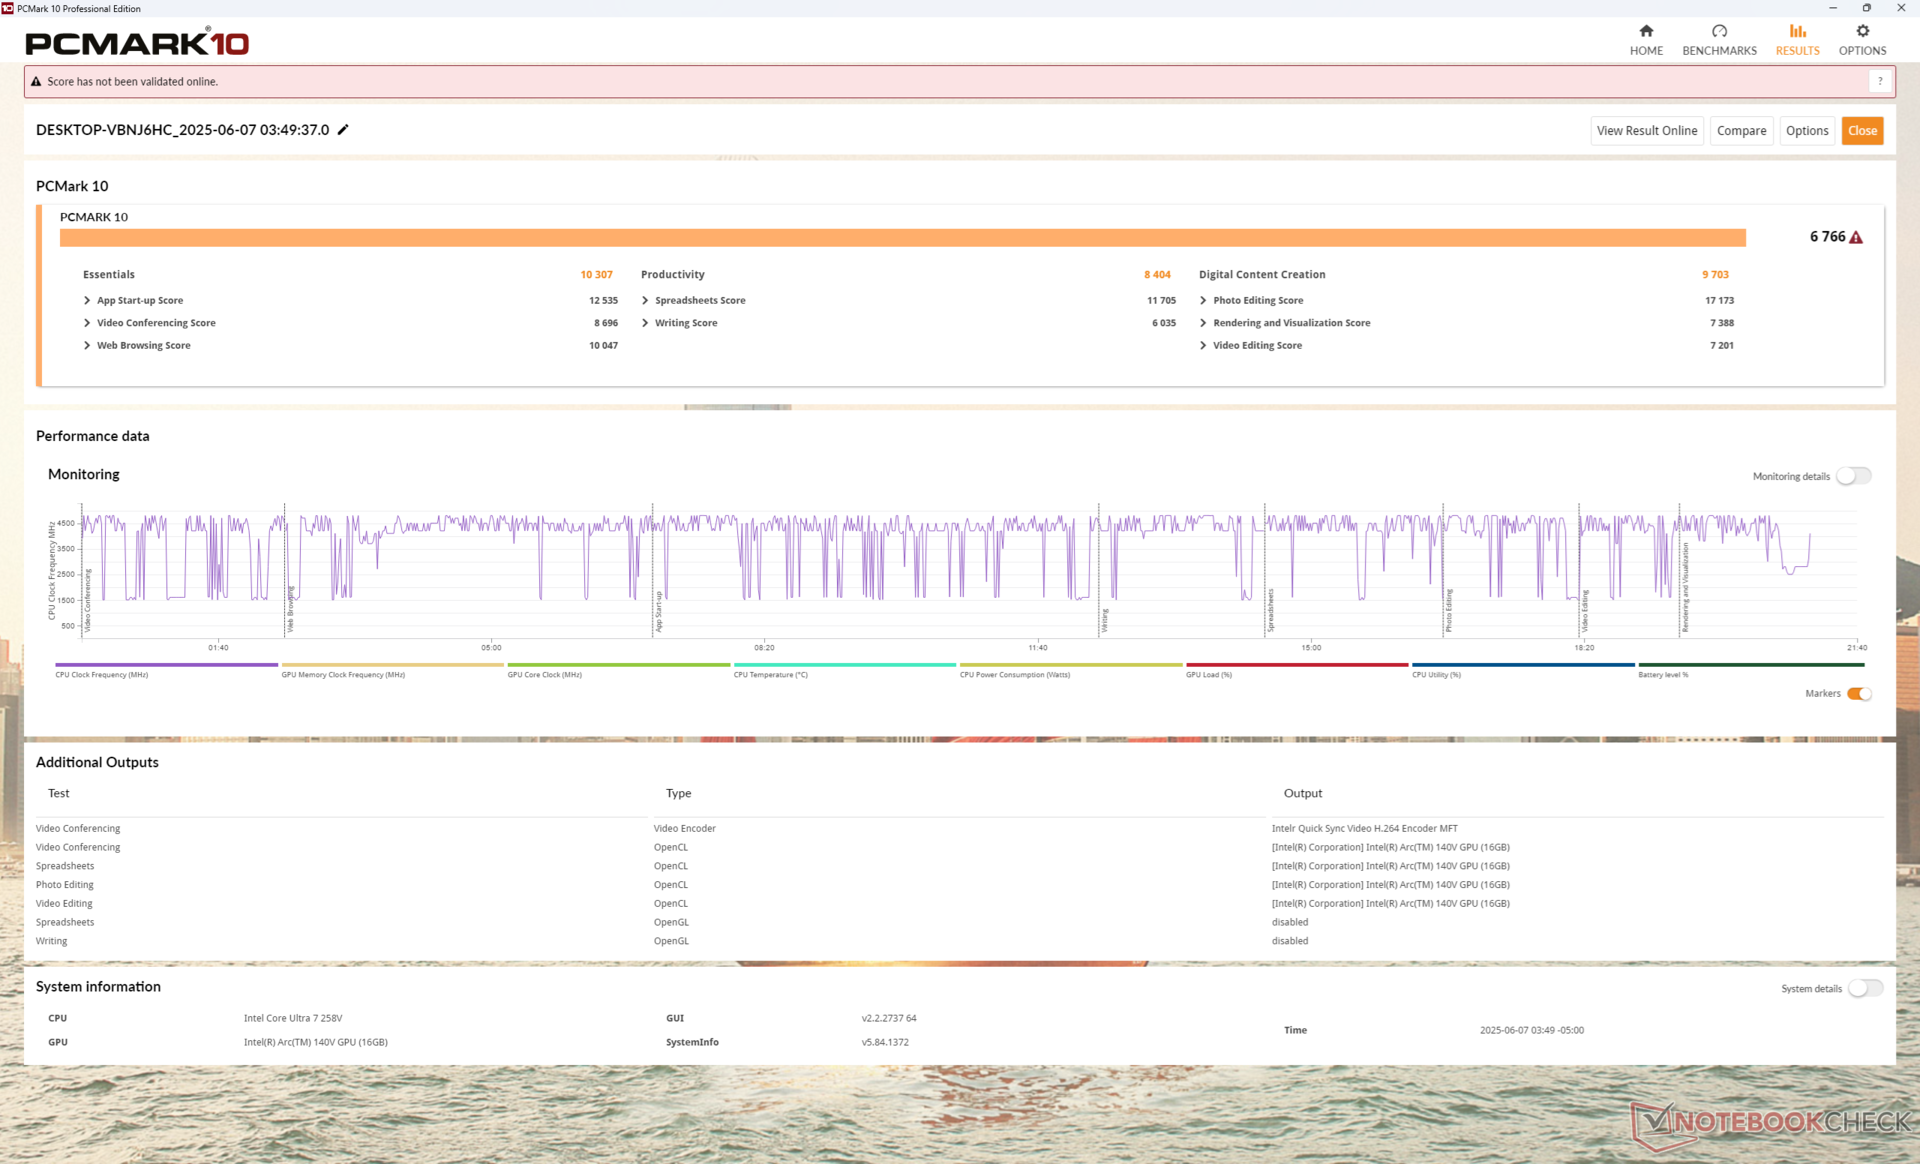
I risultati di PCMark 10 sono leggermente ma costantemente inferiori rispetto a quelli di Lenovo Yoga 7 2-in-1 16ILL10. Le prestazioni della RAM sono comunque molto veloci grazie all'architettura on-die di Lunar Lake.
PCMark 10: Score | Essentials | Productivity | Digital Content Creation
CrossMark: Overall | Productivity | Creativity | Responsiveness
WebXPRT 3: Overall
WebXPRT 4: Overall
Mozilla Kraken 1.1: Total
| Performance rating | |
| MSI Summit A16 AI Plus A3HMTG | |
| Lenovo Yoga 7 2-in-1 16ILL10 | |
| Dell Inspiron 16 7640 2-in-1 | |
| Dell 16 Plus 2-in-1 | |
| Media Intel Core Ultra 7 258V, Intel Arc Graphics 140V | |
| HP Envy x360 2-in-1 16-ad0097nr | |
| Samsung Galaxy Book5 Pro 360 | |
| PCMark 10 / Score | |
| MSI Summit A16 AI Plus A3HMTG | |
| Lenovo Yoga 7 2-in-1 16ILL10 | |
| Dell Inspiron 16 7640 2-in-1 | |
| HP Envy x360 2-in-1 16-ad0097nr | |
| Media Intel Core Ultra 7 258V, Intel Arc Graphics 140V (6265 - 7420, n=23) | |
| Dell 16 Plus 2-in-1 | |
| Samsung Galaxy Book5 Pro 360 | |
| PCMark 10 / Essentials | |
| Lenovo Yoga 7 2-in-1 16ILL10 | |
| MSI Summit A16 AI Plus A3HMTG | |
| Dell Inspiron 16 7640 2-in-1 | |
| HP Envy x360 2-in-1 16-ad0097nr | |
| Media Intel Core Ultra 7 258V, Intel Arc Graphics 140V (9295 - 11467, n=23) | |
| Dell 16 Plus 2-in-1 | |
| Samsung Galaxy Book5 Pro 360 | |
| PCMark 10 / Productivity | |
| HP Envy x360 2-in-1 16-ad0097nr | |
| MSI Summit A16 AI Plus A3HMTG | |
| Lenovo Yoga 7 2-in-1 16ILL10 | |
| Media Intel Core Ultra 7 258V, Intel Arc Graphics 140V (7357 - 13600, n=23) | |
| Samsung Galaxy Book5 Pro 360 | |
| Dell Inspiron 16 7640 2-in-1 | |
| Dell 16 Plus 2-in-1 | |
| PCMark 10 / Digital Content Creation | |
| MSI Summit A16 AI Plus A3HMTG | |
| Lenovo Yoga 7 2-in-1 16ILL10 | |
| Dell Inspiron 16 7640 2-in-1 | |
| Media Intel Core Ultra 7 258V, Intel Arc Graphics 140V (8160 - 10308, n=23) | |
| Dell 16 Plus 2-in-1 | |
| Samsung Galaxy Book5 Pro 360 | |
| HP Envy x360 2-in-1 16-ad0097nr | |
| CrossMark / Overall | |
| MSI Summit A16 AI Plus A3HMTG | |
| Lenovo Yoga 7 2-in-1 16ILL10 | |
| Dell Inspiron 16 7640 2-in-1 | |
| Dell 16 Plus 2-in-1 | |
| Media Intel Core Ultra 7 258V, Intel Arc Graphics 140V (1275 - 1742, n=22) | |
| HP Envy x360 2-in-1 16-ad0097nr | |
| Samsung Galaxy Book5 Pro 360 | |
| CrossMark / Productivity | |
| Lenovo Yoga 7 2-in-1 16ILL10 | |
| Dell Inspiron 16 7640 2-in-1 | |
| Dell 16 Plus 2-in-1 | |
| HP Envy x360 2-in-1 16-ad0097nr | |
| Media Intel Core Ultra 7 258V, Intel Arc Graphics 140V (1267 - 1684, n=22) | |
| MSI Summit A16 AI Plus A3HMTG | |
| Samsung Galaxy Book5 Pro 360 | |
| CrossMark / Creativity | |
| MSI Summit A16 AI Plus A3HMTG | |
| Lenovo Yoga 7 2-in-1 16ILL10 | |
| Dell Inspiron 16 7640 2-in-1 | |
| Dell 16 Plus 2-in-1 | |
| Media Intel Core Ultra 7 258V, Intel Arc Graphics 140V (1393 - 1977, n=22) | |
| HP Envy x360 2-in-1 16-ad0097nr | |
| Samsung Galaxy Book5 Pro 360 | |
| CrossMark / Responsiveness | |
| Dell Inspiron 16 7640 2-in-1 | |
| MSI Summit A16 AI Plus A3HMTG | |
| HP Envy x360 2-in-1 16-ad0097nr | |
| Lenovo Yoga 7 2-in-1 16ILL10 | |
| Samsung Galaxy Book5 Pro 360 | |
| Media Intel Core Ultra 7 258V, Intel Arc Graphics 140V (999 - 1411, n=22) | |
| Dell 16 Plus 2-in-1 | |
| WebXPRT 3 / Overall | |
| MSI Summit A16 AI Plus A3HMTG | |
| Lenovo Yoga 7 2-in-1 16ILL10 | |
| HP Envy x360 2-in-1 16-ad0097nr | |
| Dell 16 Plus 2-in-1 | |
| Dell Inspiron 16 7640 2-in-1 | |
| Media Intel Core Ultra 7 258V, Intel Arc Graphics 140V (219 - 317, n=22) | |
| Samsung Galaxy Book5 Pro 360 | |
| WebXPRT 4 / Overall | |
| Lenovo Yoga 7 2-in-1 16ILL10 | |
| Dell 16 Plus 2-in-1 | |
| Media Intel Core Ultra 7 258V, Intel Arc Graphics 140V (199.5 - 291, n=22) | |
| MSI Summit A16 AI Plus A3HMTG | |
| Samsung Galaxy Book5 Pro 360 | |
| Dell Inspiron 16 7640 2-in-1 | |
| HP Envy x360 2-in-1 16-ad0097nr | |
| Mozilla Kraken 1.1 / Total | |
| HP Envy x360 2-in-1 16-ad0097nr | |
| Dell Inspiron 16 7640 2-in-1 | |
| Samsung Galaxy Book5 Pro 360 | |
| Media Intel Core Ultra 7 258V, Intel Arc Graphics 140V (468 - 559, n=24) | |
| Dell 16 Plus 2-in-1 | |
| Lenovo Yoga 7 2-in-1 16ILL10 | |
| MSI Summit A16 AI Plus A3HMTG | |
* ... Meglio usare valori piccoli
| PCMark 10 Score | 6766 punti | |
Aiuto | ||
| AIDA64 / Memory Copy | |
| Media Intel Core Ultra 7 258V (104408 - 114336, n=24) | |
| Dell 16 Plus 2-in-1 | |
| Samsung Galaxy Book5 Pro 360 | |
| Lenovo Yoga 7 2-in-1 16ILL10 | |
| MSI Summit A16 AI Plus A3HMTG | |
| Dell Inspiron 16 7640 2-in-1 | |
| HP Envy x360 2-in-1 16-ad0097nr | |
| AIDA64 / Memory Read | |
| MSI Summit A16 AI Plus A3HMTG | |
| Lenovo Yoga 7 2-in-1 16ILL10 | |
| Dell 16 Plus 2-in-1 | |
| Media Intel Core Ultra 7 258V (82846 - 89417, n=24) | |
| Samsung Galaxy Book5 Pro 360 | |
| Dell Inspiron 16 7640 2-in-1 | |
| HP Envy x360 2-in-1 16-ad0097nr | |
| AIDA64 / Memory Write | |
| Lenovo Yoga 7 2-in-1 16ILL10 | |
| Dell 16 Plus 2-in-1 | |
| Media Intel Core Ultra 7 258V (108824 - 117989, n=24) | |
| Samsung Galaxy Book5 Pro 360 | |
| MSI Summit A16 AI Plus A3HMTG | |
| HP Envy x360 2-in-1 16-ad0097nr | |
| Dell Inspiron 16 7640 2-in-1 | |
| AIDA64 / Memory Latency | |
| Dell Inspiron 16 7640 2-in-1 | |
| HP Envy x360 2-in-1 16-ad0097nr | |
| MSI Summit A16 AI Plus A3HMTG | |
| Dell 16 Plus 2-in-1 | |
| Lenovo Yoga 7 2-in-1 16ILL10 | |
| Media Intel Core Ultra 7 258V (95 - 101.7, n=24) | |
| Samsung Galaxy Book5 Pro 360 | |
* ... Meglio usare valori piccoli
Latenza DPC
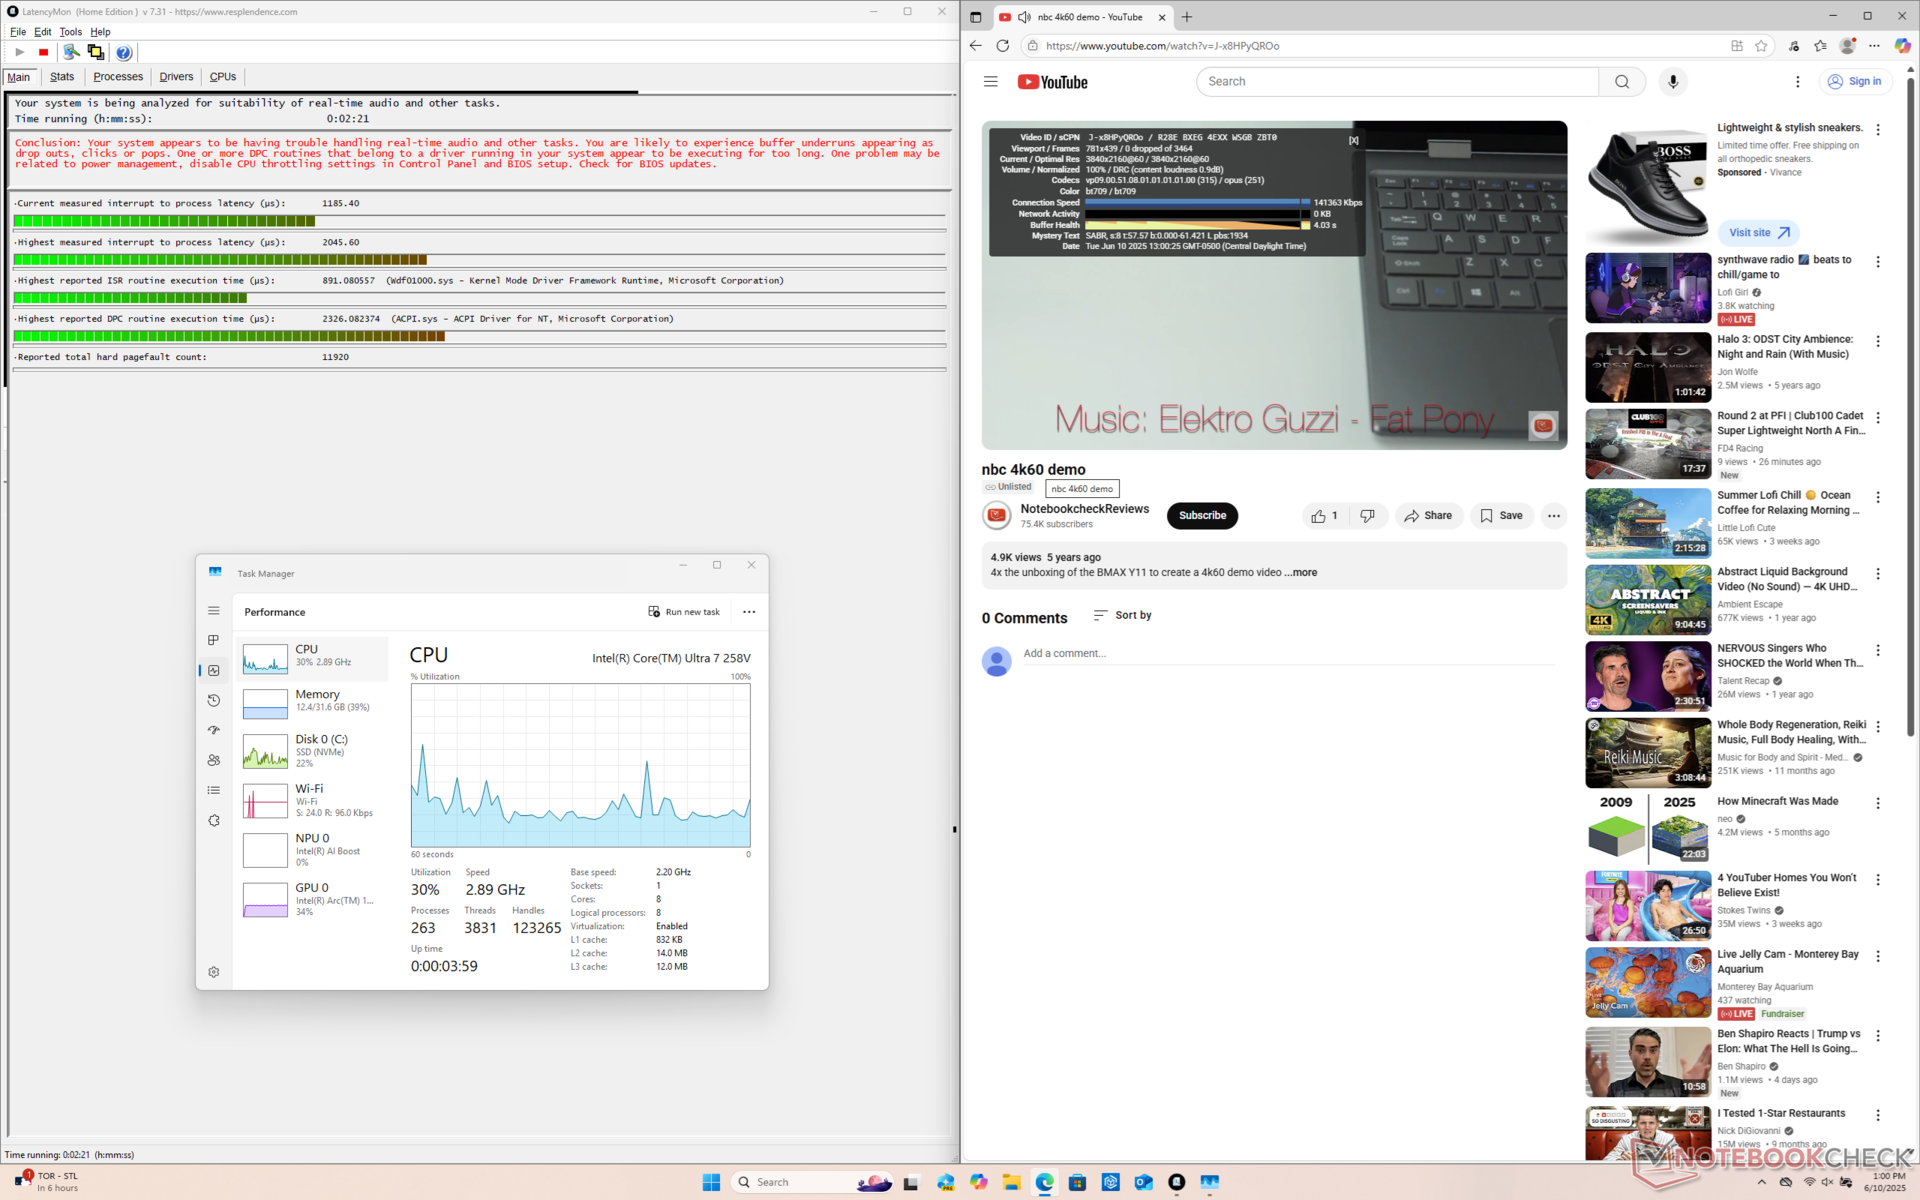
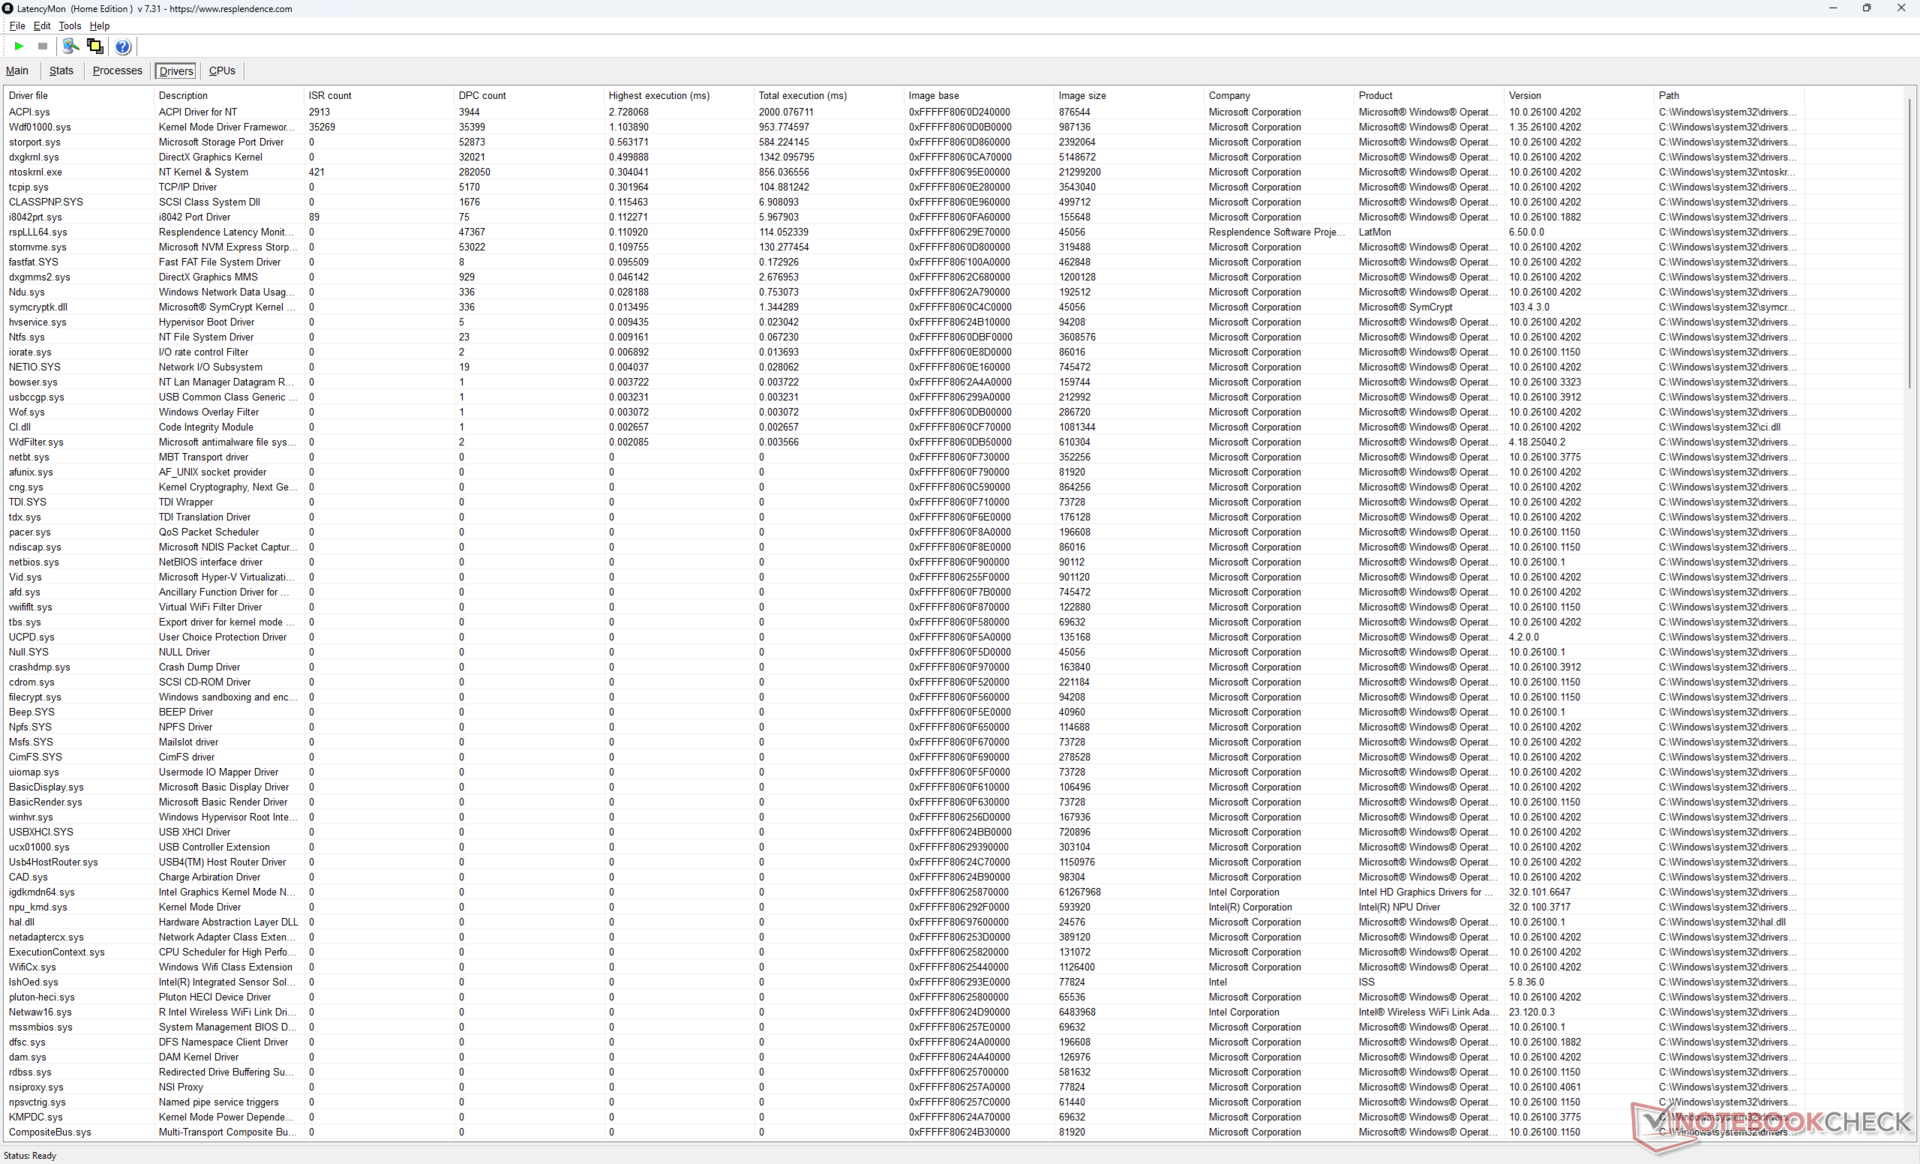
LatencyMon mostra lievi problemi di DPC quando si aprono più schede del browser della nostra homepage. la riproduzione di video 4K a 60 Hz è invece perfetta, senza alcuna perdita di fotogrammi.
| DPC Latencies / LatencyMon - interrupt to process latency (max), Web, Youtube, Prime95 | |
| MSI Summit A16 AI Plus A3HMTG | |
| Dell 16 Plus 2-in-1 | |
| HP Envy x360 2-in-1 16-ad0097nr | |
| Dell Inspiron 16 7640 2-in-1 | |
| Samsung Galaxy Book5 Pro 360 | |
| Lenovo Yoga 7 2-in-1 16ILL10 | |
* ... Meglio usare valori piccoli
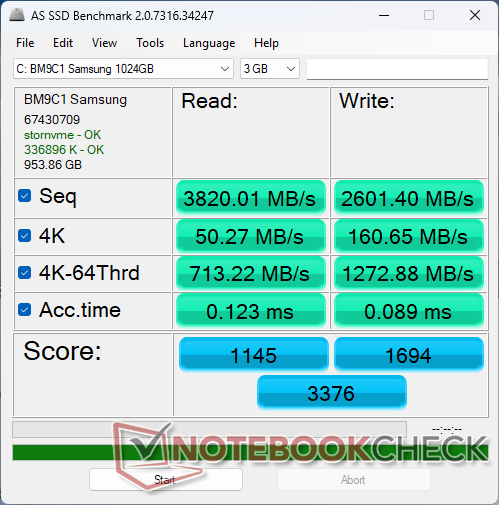
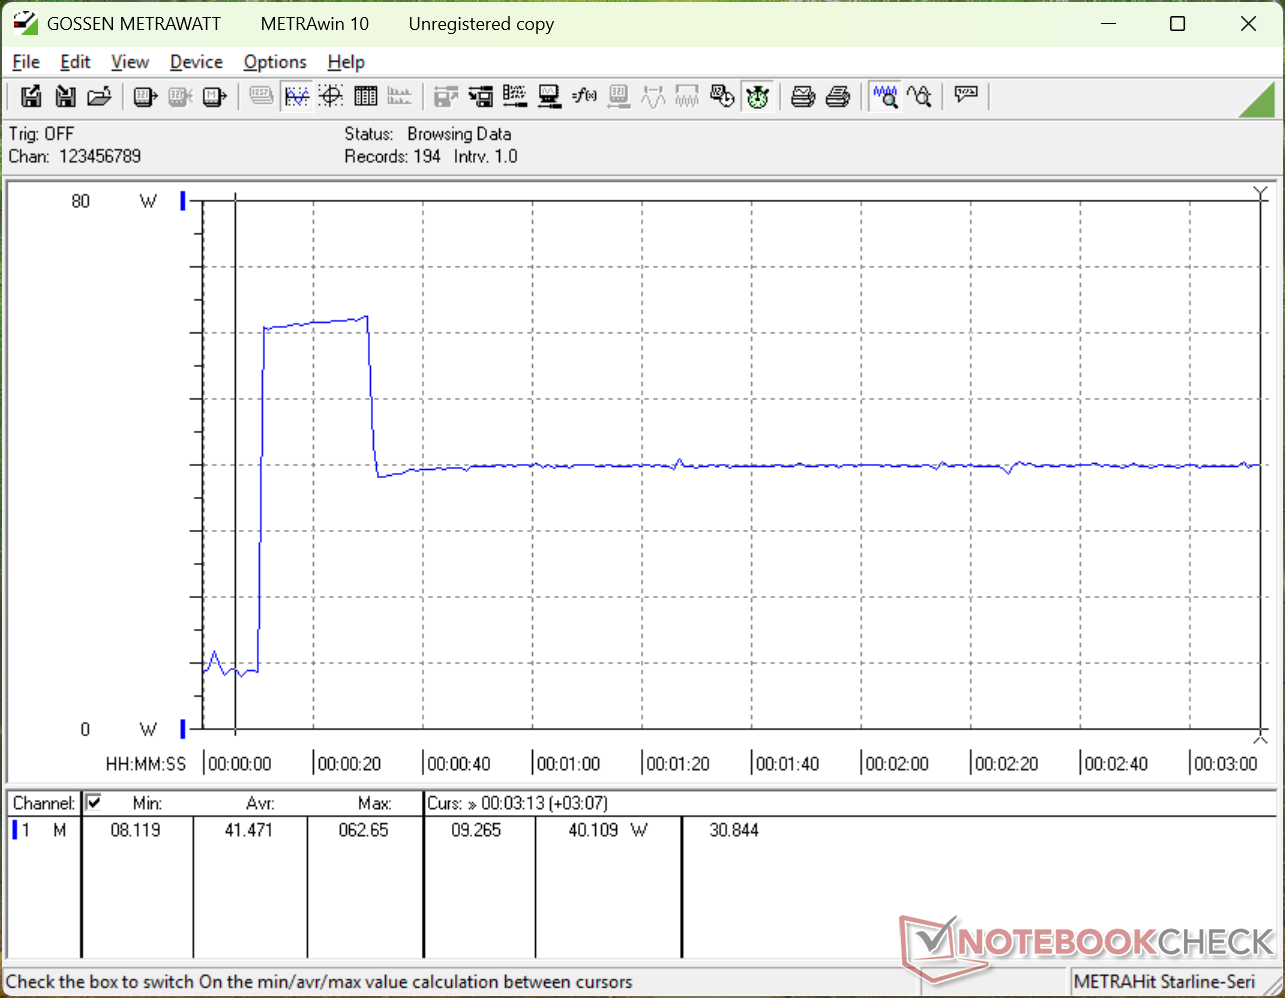
Dispositivi di archiviazione
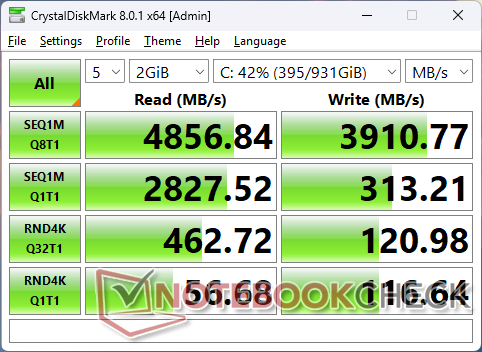
Non solo il Samsung BM9C1 SSD PCIe4 NVMe è più lento del Micron 2550 del modello dello scorso anno, ma tende anche a strozzarsi. Le velocità di trasferimento oscillavano tra 3400 MB/s e 4700 MB/s rispetto ai più stabili ~5000 MB/s dell'Inspiron 16 7640 2-in-1 durante l'esecuzione del nostro test DiskSpd loop, come mostra il grafico sottostante.

| Drive Performance rating - Percent | |
| Samsung Galaxy Book5 Pro 360 | |
| Dell Inspiron 16 7640 2-in-1 | |
| Lenovo Yoga 7 2-in-1 16ILL10 | |
| MSI Summit A16 AI Plus A3HMTG | |
| Dell 16 Plus 2-in-1 | |
| HP Envy x360 2-in-1 16-ad0097nr | |
* ... Meglio usare valori piccoli
Disk Throttling: DiskSpd Read Loop, Queue Depth 8
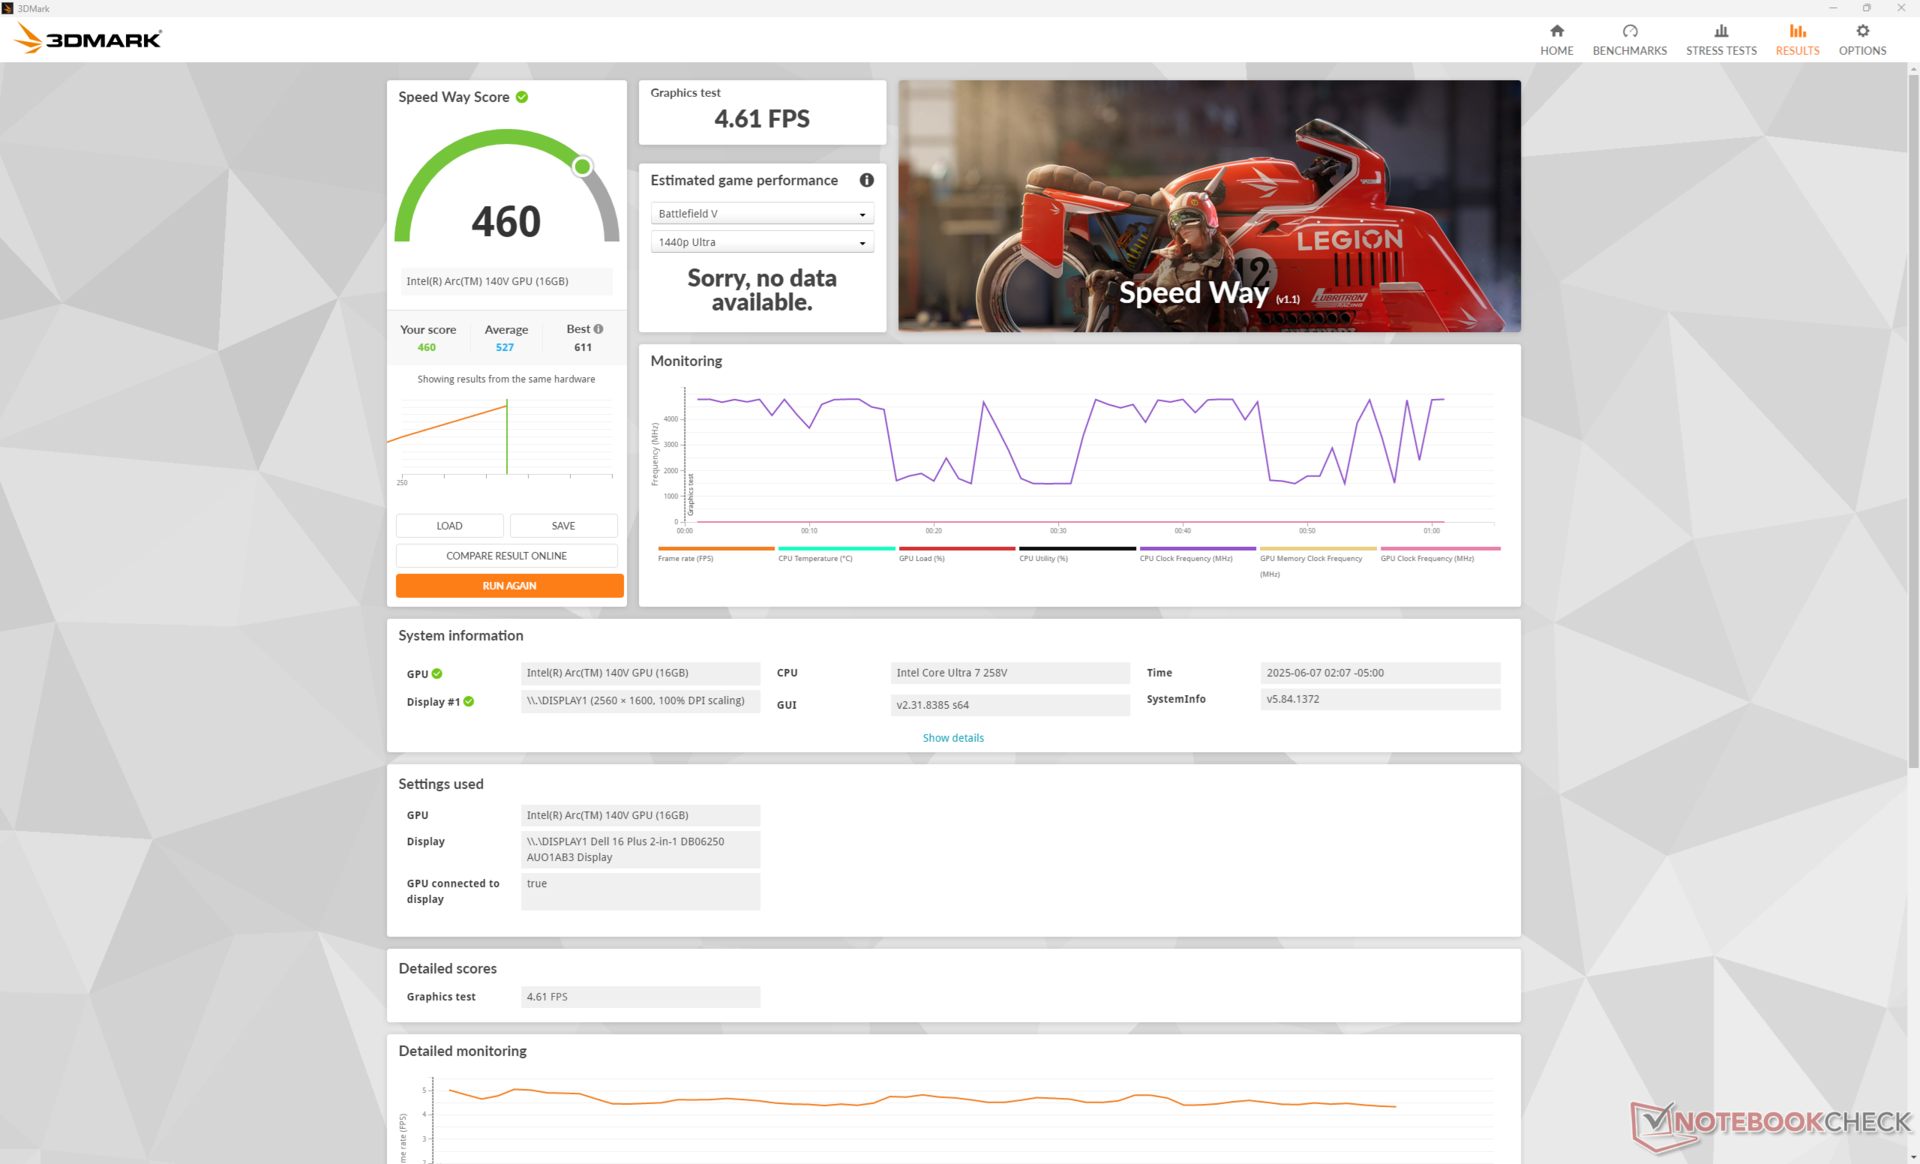
Prestazioni della GPU
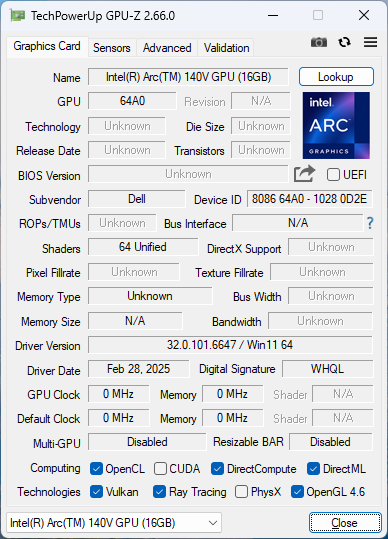
Mentre il Core Ultra 7 258V è più lento del Core Ultra 7 255H dell'Inspiron dell'anno scorso per quanto riguarda le prestazioni del processore, è vero il contrario quando si confronta l'Arc 140V Arc 140V al modello Arc 8. Il Dell 16 Plus 2-in-1 è in grado di eseguire giochi impegnativi come Final Fantasy XV o Cyberpunk 2077 con una velocità compresa tra il 35 e il 50 percento superiore, nonostante il processore più lento.
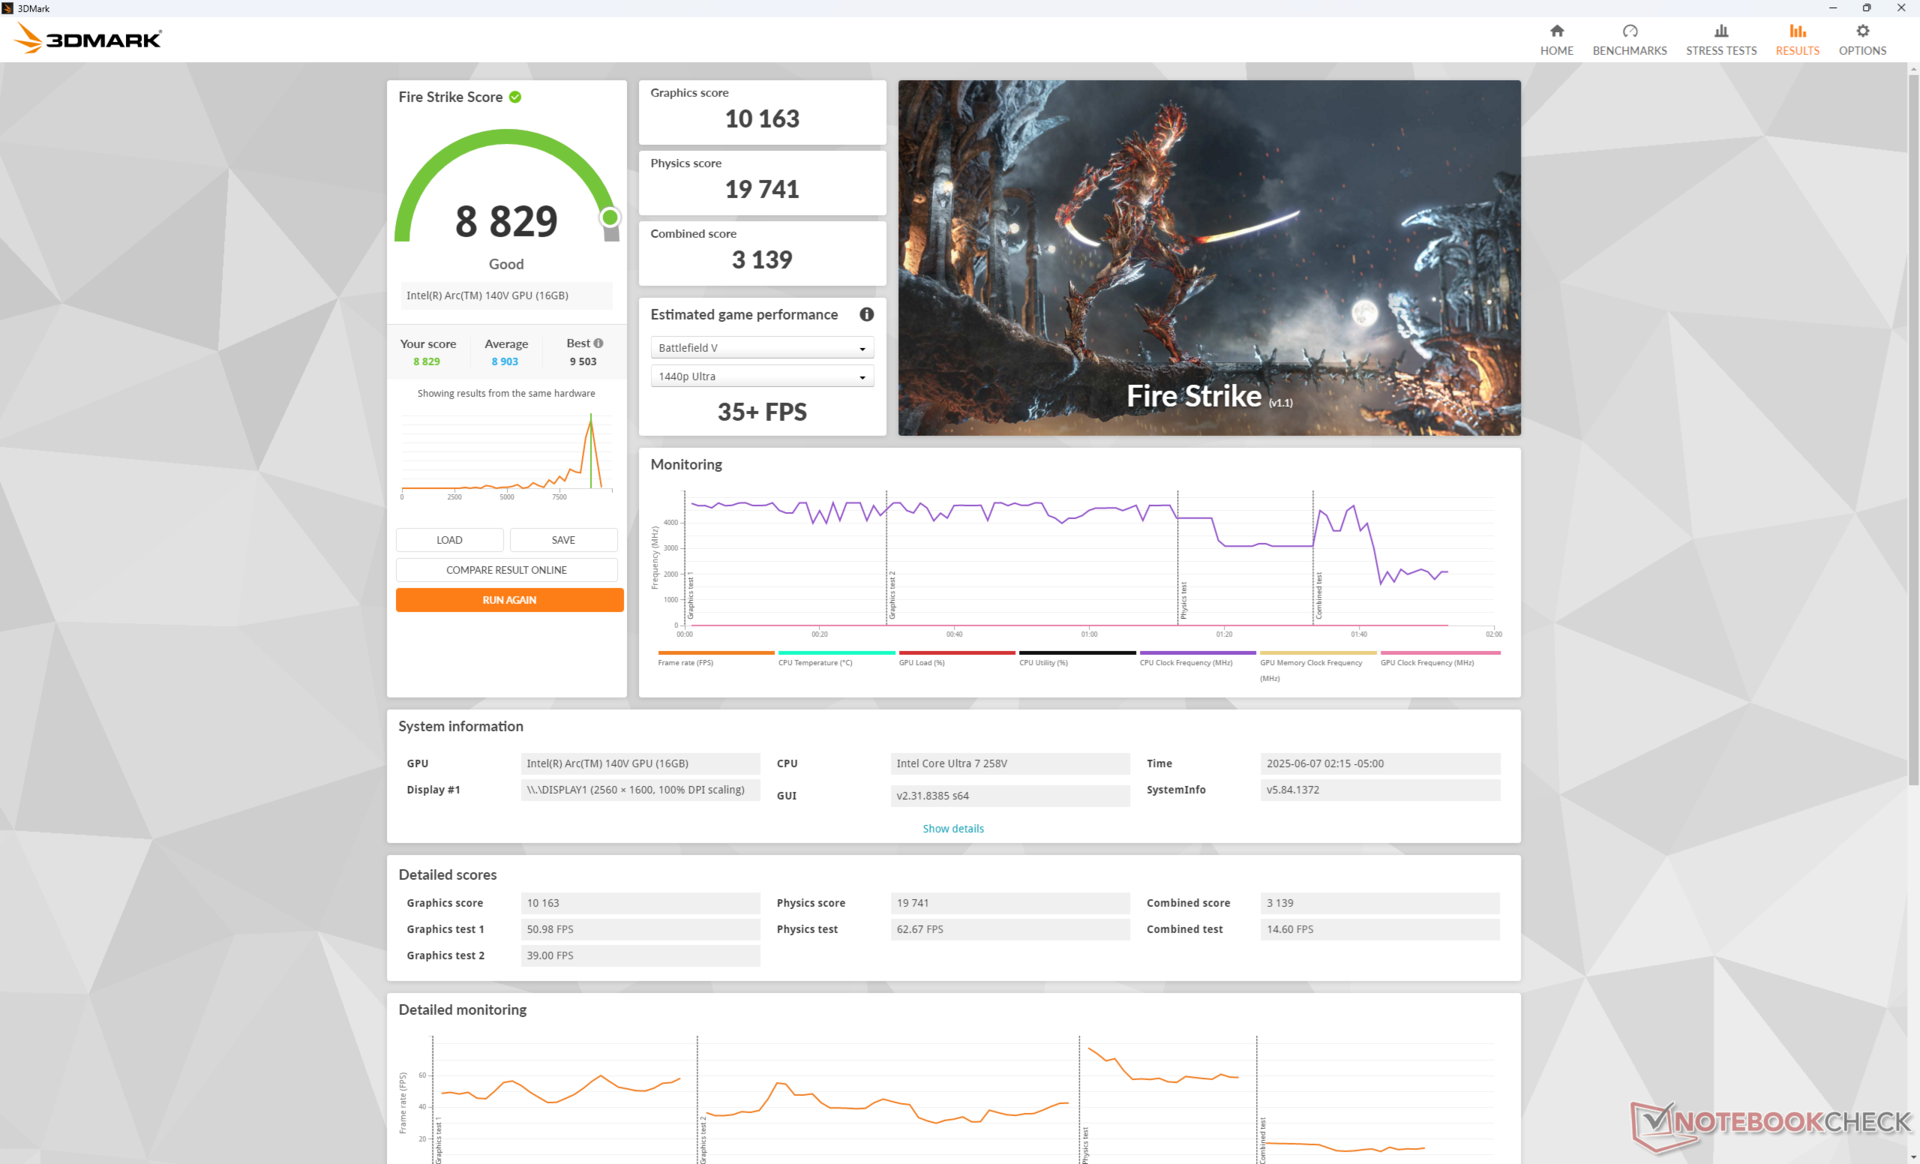
| Profilo di potenza | Punteggio grafico | Punteggio Fisica | Punteggio combinato |
| Modalità Prestazioni | 10163 | 19741 | 3139 |
| Modalità equilibrata | 8556 (-16%) | 16859 (-15%) | 2576 (-18%) |
| Alimentazione a batteria | 9568 (-6%) | 16911 (-14%) | 2651 (-16%) |
Le prestazioni diminuiscono di circa il 15% se si utilizza la modalità Bilanciata invece della modalità Prestazioni, come mostra la nostra tabella dei risultati Fire Strike qui sopra.
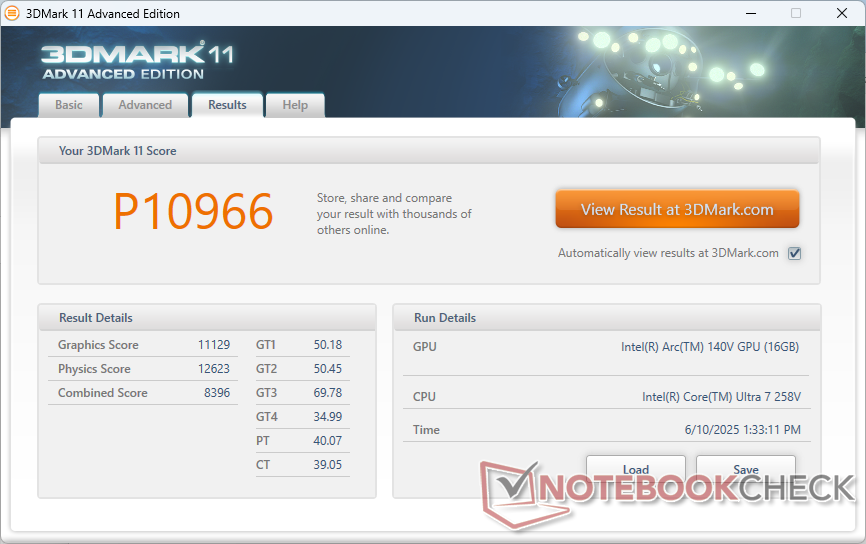
| 3DMark 11 Performance | 10966 punti | |
| 3DMark Fire Strike Score | 8829 punti | |
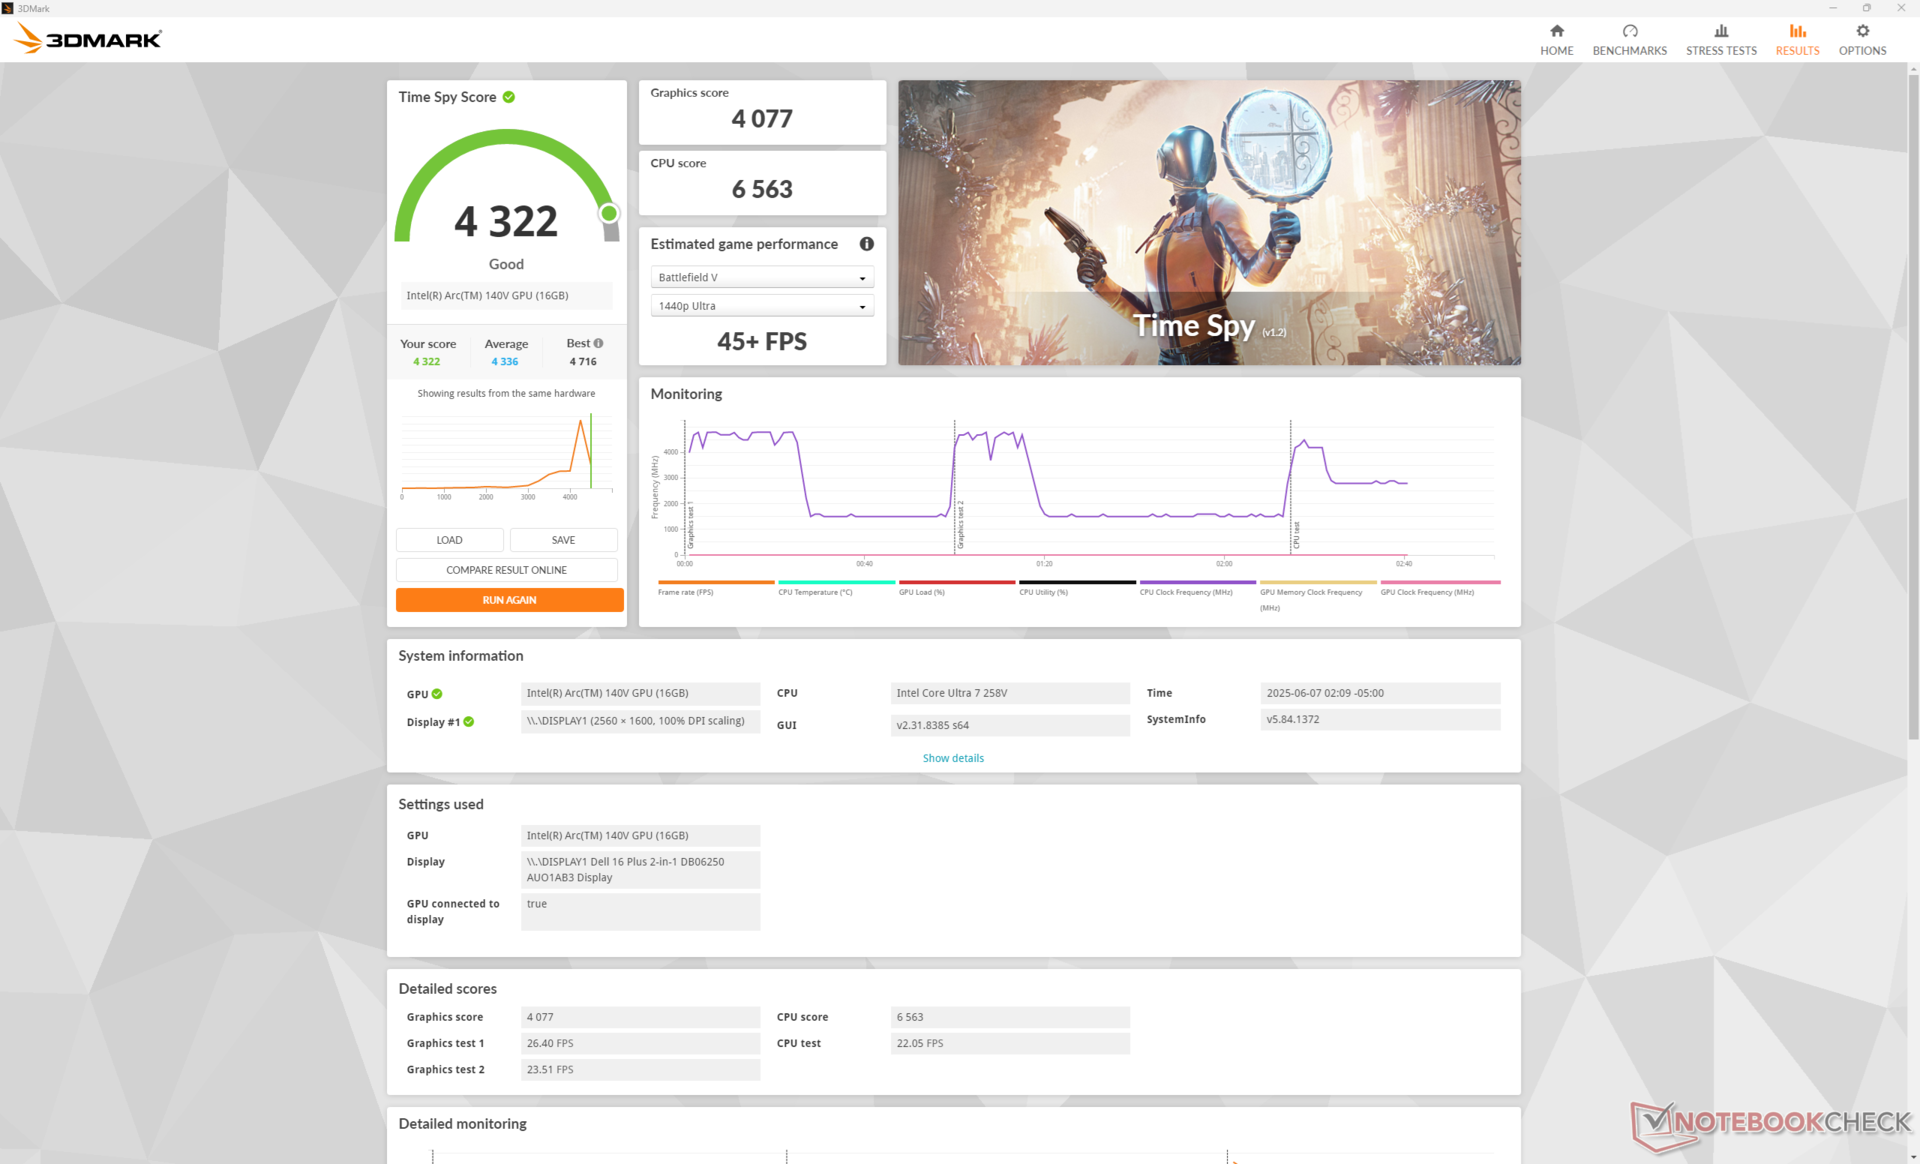
| 3DMark Time Spy Score | 4322 punti | |
Aiuto | ||
* ... Meglio usare valori piccoli
| F1 24 | |
| 1920x1080 Low Preset AA:T AF:16x | |
| Lenovo Yoga 7 2-in-1 16ILL10 | |
| Dell 16 Plus 2-in-1 | |
| Media Intel Arc Graphics 140V (54 - 99, n=25) | |
| Lenovo ThinkPad T16 Gen 3 21MN005XGE | |
| 1920x1080 Medium Preset AA:T AF:16x | |
| Lenovo Yoga 7 2-in-1 16ILL10 | |
| Dell 16 Plus 2-in-1 | |
| Media Intel Arc Graphics 140V (49.2 - 88.2, n=24) | |
| Lenovo ThinkPad T16 Gen 3 21MN005XGE | |
| 1920x1080 High Preset AA:T AF:16x | |
| Dell 16 Plus 2-in-1 | |
| Lenovo Yoga 7 2-in-1 16ILL10 | |
| Media Intel Arc Graphics 140V (34.4 - 66.4, n=27) | |
| Lenovo ThinkPad T16 Gen 3 21MN005XGE | |
| 1920x1080 Ultra High Preset AA:T AF:16x | |
| Lenovo Yoga 7 2-in-1 16ILL10 | |
| Dell 16 Plus 2-in-1 | |
| Media Intel Arc Graphics 140V (14.6 - 22, n=25) | |
| Lenovo ThinkPad T16 Gen 3 21MN005XGE | |
Cyberpunk 2077 ultra FPS Chart
| basso | medio | alto | ultra | |
|---|---|---|---|---|
| Dota 2 Reborn (2015) | 105.1 | 88.2 | 87.7 | 86 |
| Final Fantasy XV Benchmark (2018) | 83.5 | 48.2 | 35.4 | |
| X-Plane 11.11 (2018) | 46.7 | 37.9 | 31.2 | |
| Strange Brigade (2018) | 228 | 70 | 61 | 54.7 |
| Baldur's Gate 3 (2023) | 42.4 | 35.4 | 31.4 | 31 |
| Cyberpunk 2077 (2023) | 47.7 | 38.8 | 32.9 | 29 |
| F1 24 (2024) | 84.4 | 77.4 | 60.4 | 19.7 |
Emissioni
Rumore del sistema
La rumorosità della ventola e del soffitto è sostanzialmente invariata rispetto a quanto abbiamo osservato sul modello dello scorso anno, nonostante le differenze di prestazioni della CPU e dell'iGPU. Tuttavia, la ventola del Dell 16 Plus 2-in-1 è più lenta a reagire ai carichi sullo schermo e quindi il sistema può rimanere più silenzioso più a lungo prima che sia necessario aumentare i giri al minuto.
Rumorosità
| Idle |
| 23 / 23 / 24.7 dB(A) |
| Sotto carico |
| 32.5 / 45.6 dB(A) |
 | ||
30 dB silenzioso 40 dB(A) udibile 50 dB(A) rumoroso |
||
min: | ||
| Dell 16 Plus 2-in-1 Arc 140V, Core Ultra 7 258V, Samsung BM9C1 1024GB | Dell Inspiron 16 7640 2-in-1 Arc 8-Core, Ultra 7 155H, Micron 2550 1TB | Lenovo Yoga 7 2-in-1 16ILL10 Arc 140V, Core Ultra 7 256V, WD PC SN7100S SDFPMSL-512G-1101 | Samsung Galaxy Book5 Pro 360 Arc 130V, Core Ultra 5 226V, Samsung PM9B1 512GB MZVL4512HBLU | MSI Summit A16 AI Plus A3HMTG Radeon 880M, Ryzen AI 9 365, Samsung PM9C1 MZVL81T0HELB-00BTW | HP Envy x360 2-in-1 16-ad0097nr Radeon 780M, R7 8840HS, KIOXIA BG5 KBG50ZNV1T02 | |
|---|---|---|---|---|---|---|
| Noise | -6% | -3% | 3% | -12% | 7% | |
| off /ambiente * (dB) | 23.2 | 22.9 1% | 23.3 -0% | 23.6 -2% | 23.8 -3% | 22.9 1% |
| Idle Minimum * (dB) | 23 | 22.9 -0% | 23.3 -1% | 23.6 -3% | 25 -9% | 23 -0% |
| Idle Average * (dB) | 23 | 22.9 -0% | 23.3 -1% | 23.6 -3% | 25 -9% | 23 -0% |
| Idle Maximum * (dB) | 24.7 | 25 -1% | 25.7 -4% | 23.6 4% | 29.5 -19% | 23 7% |
| Load Average * (dB) | 32.5 | 45.1 -39% | 40.2 -24% | 29.4 10% | 37.5 -15% | 23.8 27% |
| Cyberpunk 2077 ultra * (dB) | 42.6 | 44.9 -5% | 41.6 2% | 40.6 5% | 46.5 -9% | |
| Load Maximum * (dB) | 45.6 | 44.9 2% | 41.6 9% | 40.6 11% | 56.1 -23% | 43.8 4% |
| Witcher 3 ultra * (dB) | 43.8 |
* ... Meglio usare valori piccoli
Temperatura
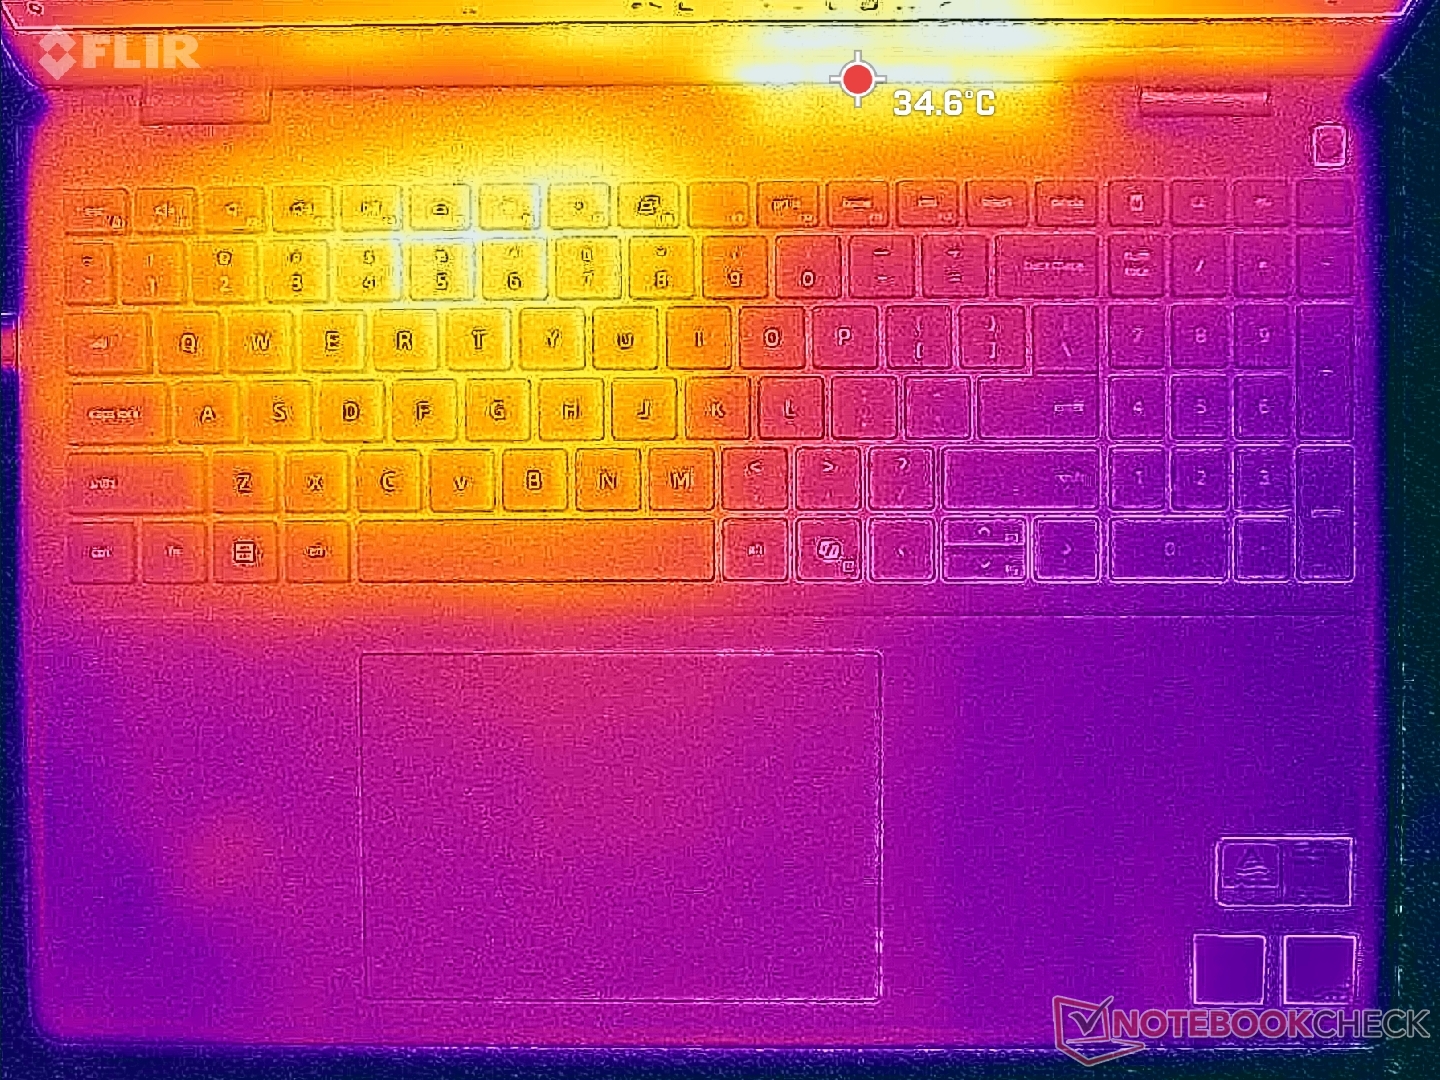
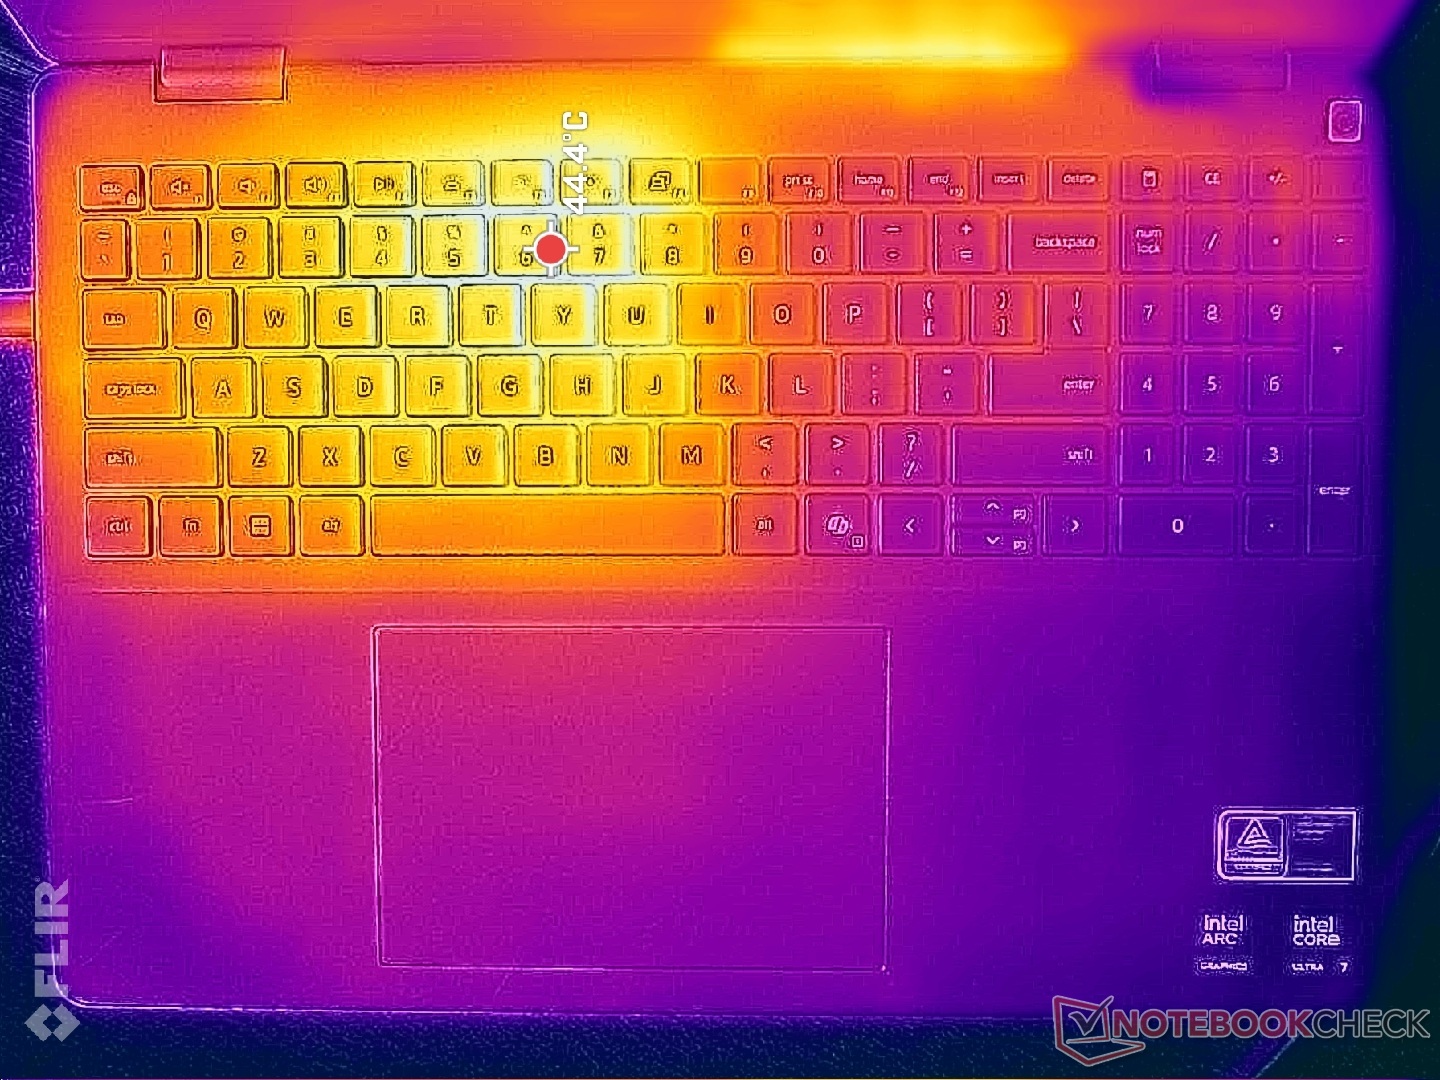
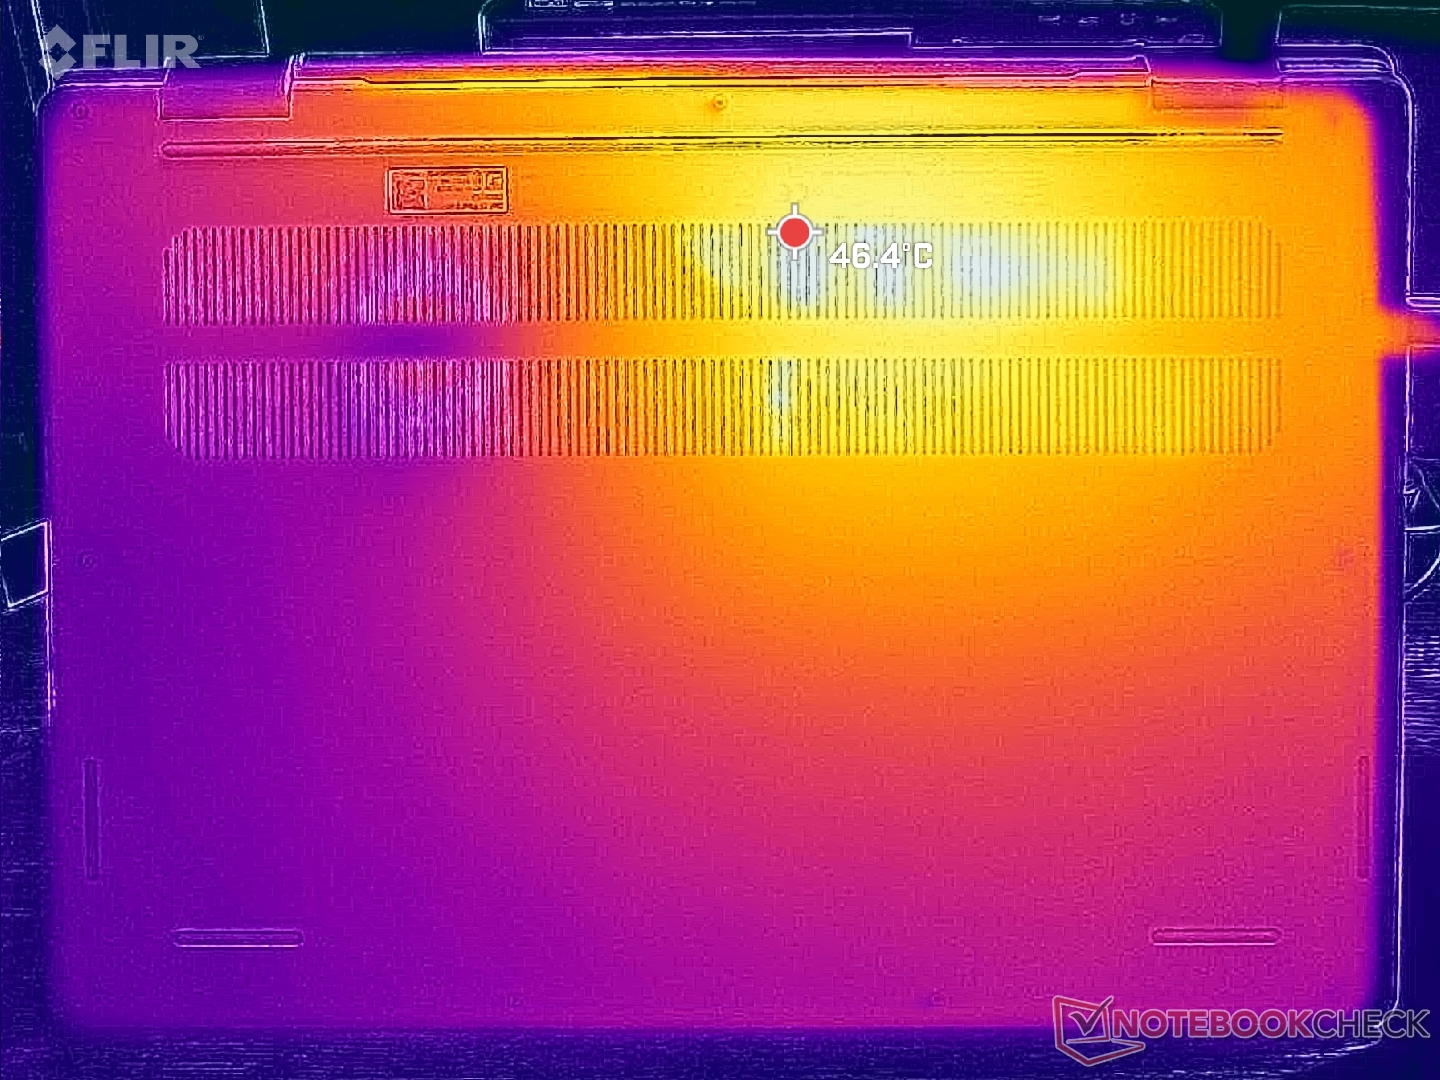
I punti caldi della temperatura superficiale possono raggiungere poco più di 44 C e 39 C sul piano tastiera e sul pannello inferiore, rispettivamente, che è solo leggermente più caldo di quello che abbiamo registrato sul modello concorrente Lenovo Yoga 7 2-in-1 16ILL10.
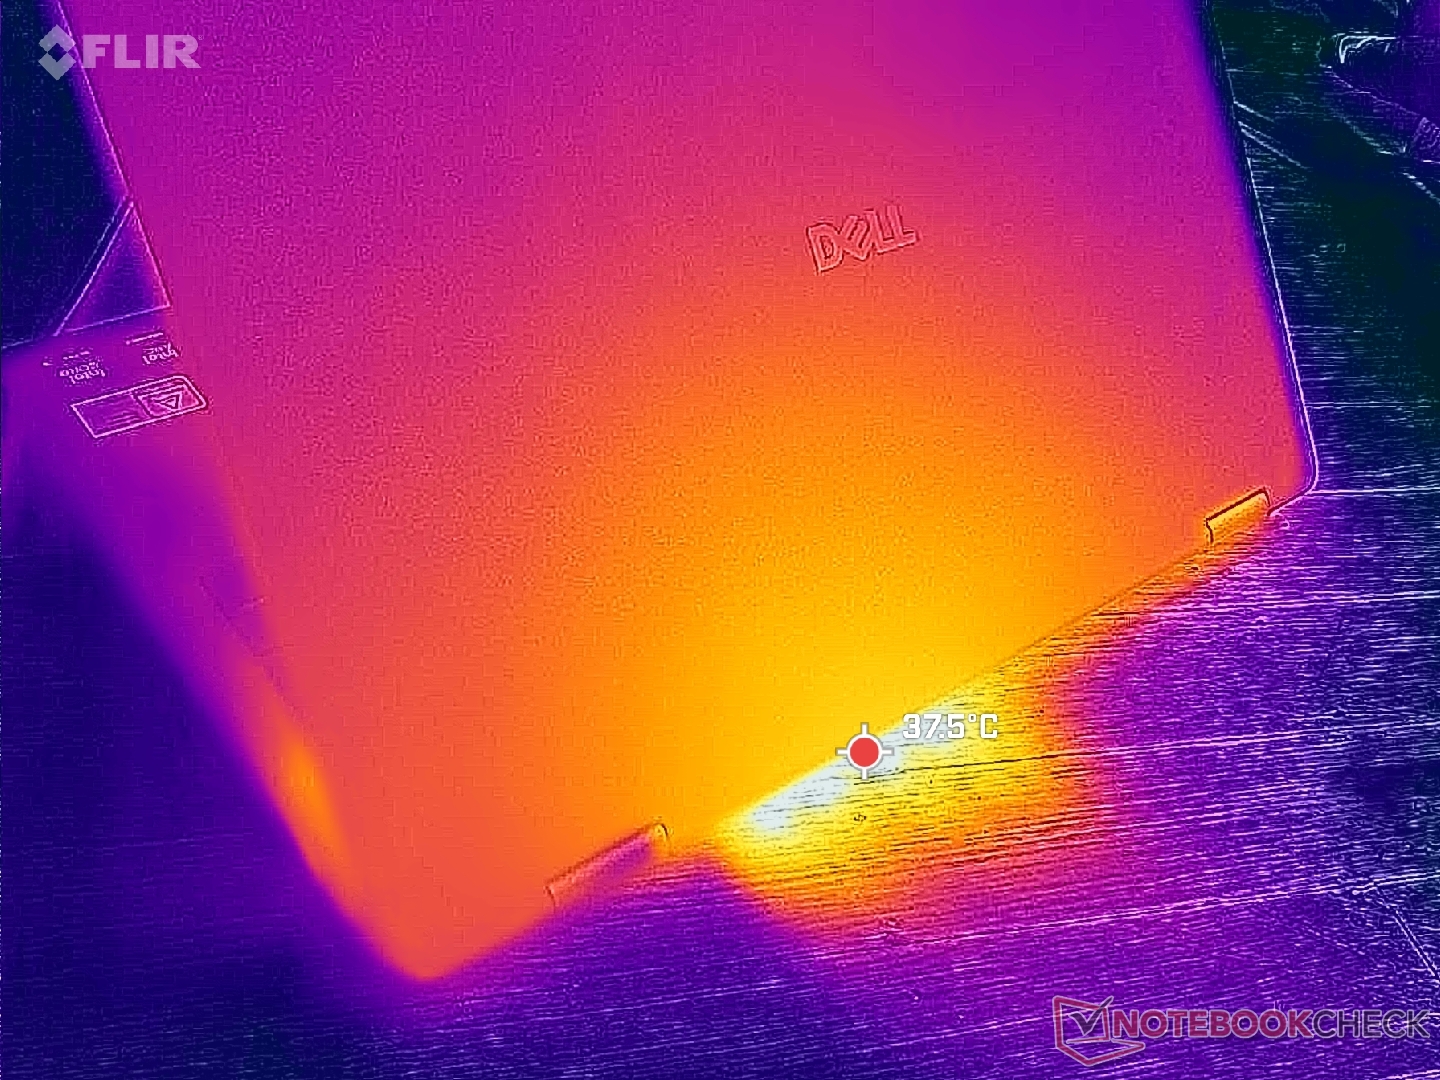
(±) La temperatura massima sul lato superiore è di 44 °C / 111 F, rispetto alla media di 35.4 °C / 96 F, che varia da 19.6 a 60 °C per questa classe Convertible.
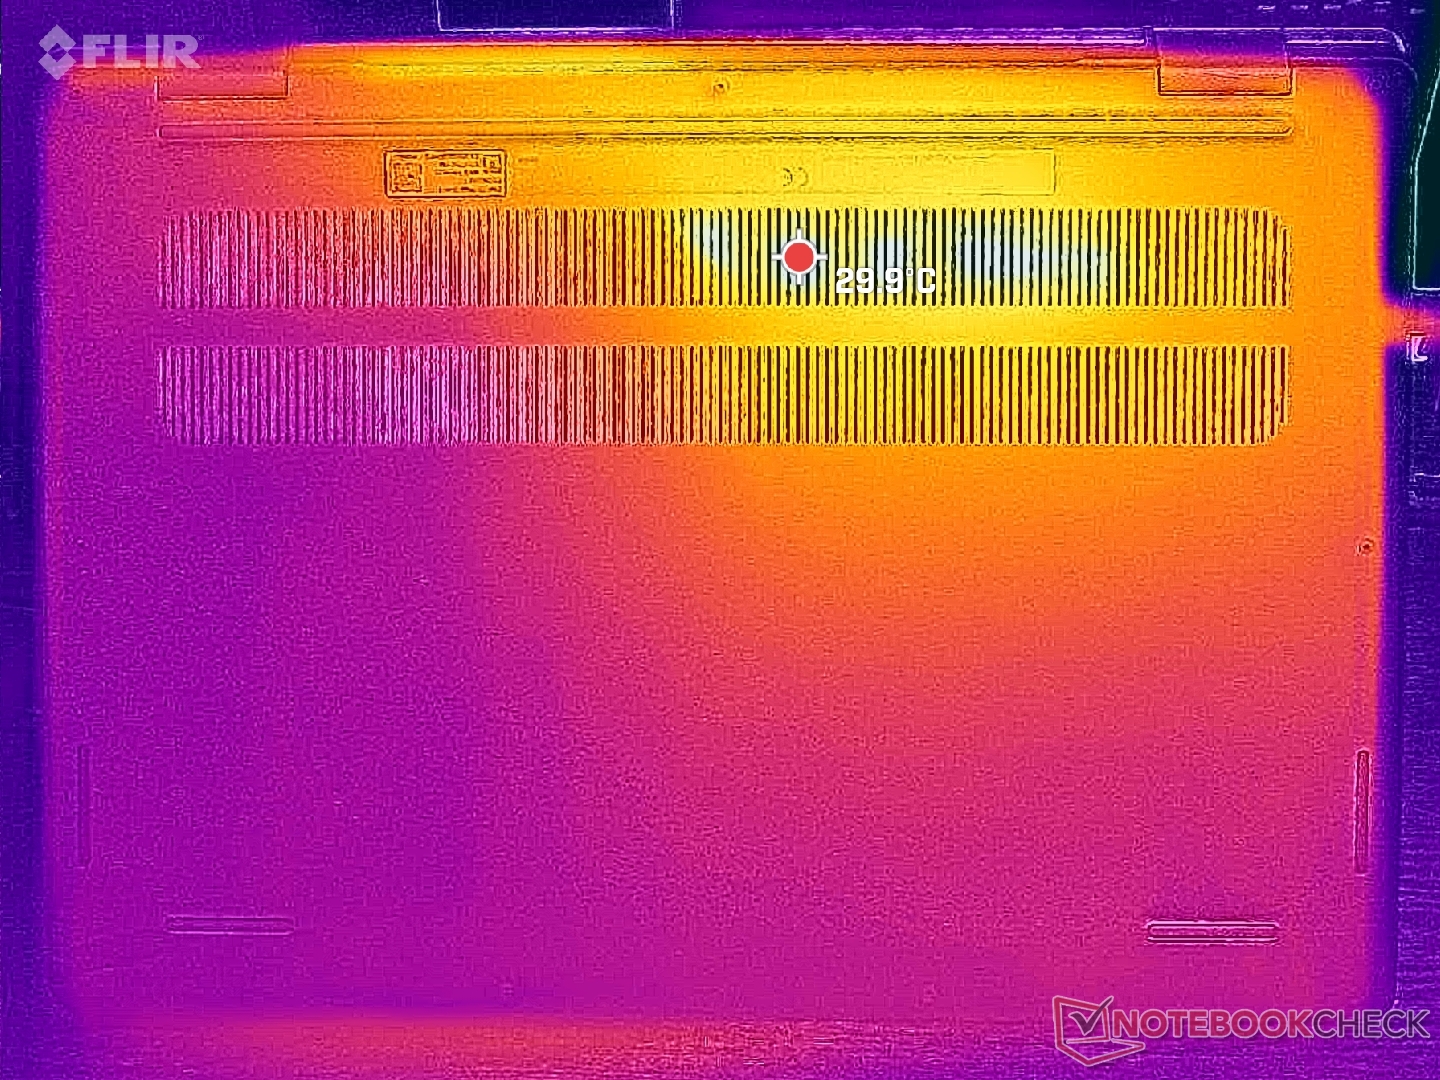
(+) Il lato inferiore si riscalda fino ad un massimo di 39.4 °C / 103 F, rispetto alla media di 36.9 °C / 98 F
(+) In idle, la temperatura media del lato superiore è di 28.7 °C / 84 F, rispetto alla media deld ispositivo di 30.3 °C / 87 F.
(+) I poggiapolsi e il touchpad sono piu' freddi della temperatura della pelle con un massimo di 26.8 °C / 80.2 F e sono quindi freddi al tatto.
(±) La temperatura media della zona del palmo della mano di dispositivi simili e'stata di 28 °C / 82.4 F (+1.2 °C / 2.2 F).
| Dell 16 Plus 2-in-1 Intel Core Ultra 7 258V, Intel Arc Graphics 140V | Dell Inspiron 16 7640 2-in-1 Intel Core Ultra 7 155H, Intel Arc 8-Core iGPU | Lenovo Yoga 7 2-in-1 16ILL10 Intel Core Ultra 7 256V, Intel Arc Graphics 140V | Samsung Galaxy Book5 Pro 360 Intel Core Ultra 5 226V, Intel Arc Graphics 130V | MSI Summit A16 AI Plus A3HMTG AMD Ryzen AI 9 365, AMD Radeon 880M | HP Envy x360 2-in-1 16-ad0097nr AMD Ryzen 7 8840HS, AMD Radeon 780M | |
|---|---|---|---|---|---|---|
| Heat | -4% | 12% | 12% | -3% | 4% | |
| Maximum Upper Side * (°C) | 44 | 46.8 -6% | 42.6 3% | 40.9 7% | 52.8 -20% | 42.6 3% |
| Maximum Bottom * (°C) | 39.4 | 45.6 -16% | 36.8 7% | 45.1 -14% | 42 -7% | 47.8 -21% |
| Idle Upper Side * (°C) | 31.8 | 32.2 -1% | 26.4 17% | 23.8 25% | 30.6 4% | 27.4 14% |
| Idle Bottom * (°C) | 34.2 | 31.4 8% | 26.6 22% | 23.5 31% | 29.6 13% | 27.8 19% |
* ... Meglio usare valori piccoli
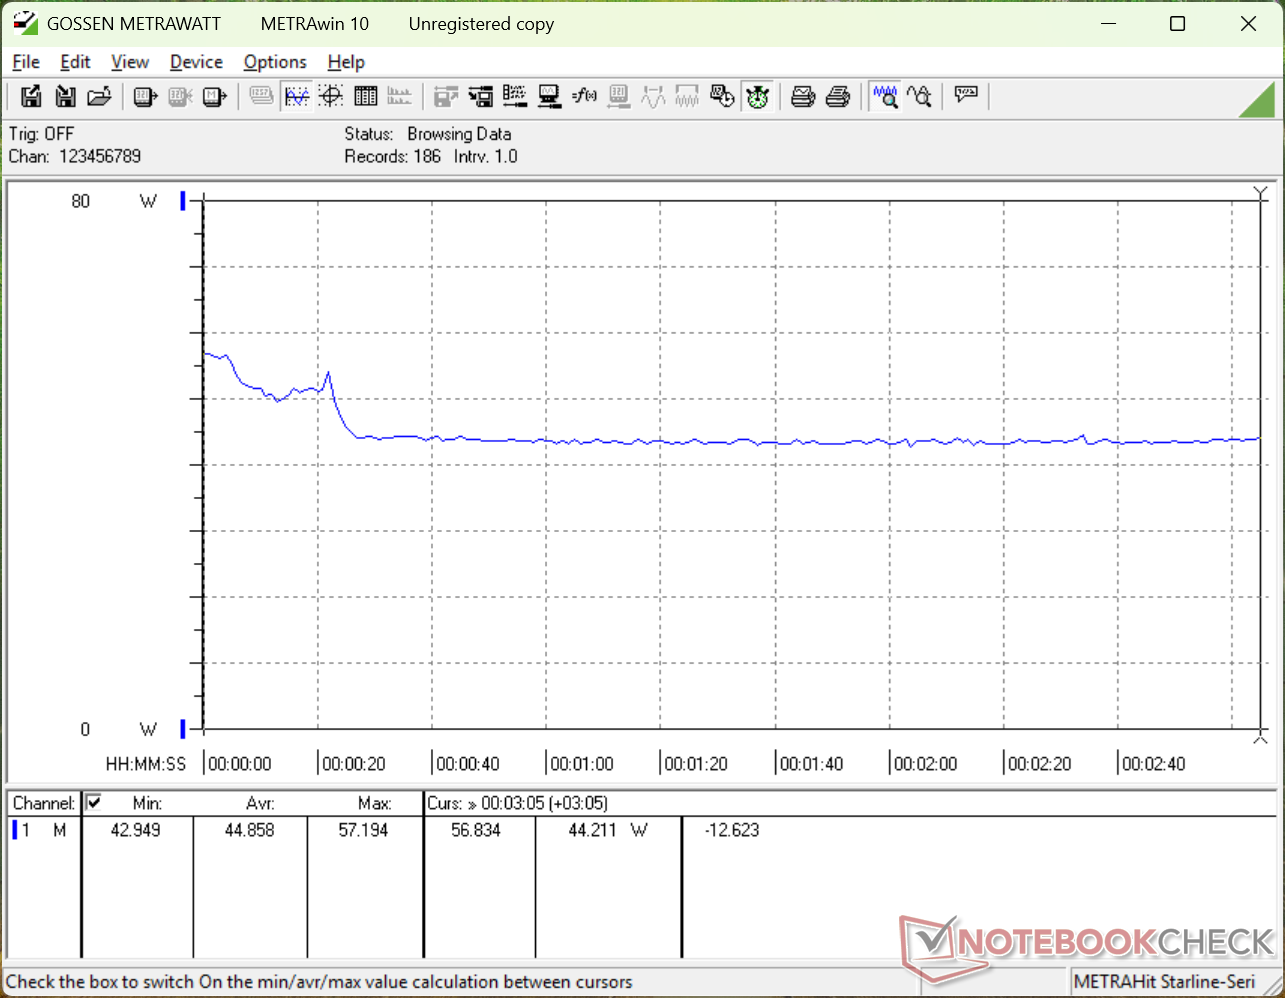
Test da sforzo
Quando si avvia lo stress Prime95, la CPU aumenta a 3,4 GHz e 38 W fino a raggiungere 93 C diversi secondi dopo. In seguito, le prestazioni sarebbero scese a 2,5 GHz e 22 W, per mantenere una temperatura del nucleo di 72 C. Questo valore è più basso di quasi 15 C rispetto all'Inspiron 16 7640 2-in-1 in condizioni simili, ma tenga presente che anche il Dell 16 Plus 2-in-1 viene fornito con un processore più lento.
Anche la temperatura del core, quando si esegue Cyberpunk 2077 per rappresentare i carichi di gioco tipici, sarebbe significativamente più fredda rispetto all'Inspiron dello scorso anno, pur offrendo prestazioni di gioco migliori.
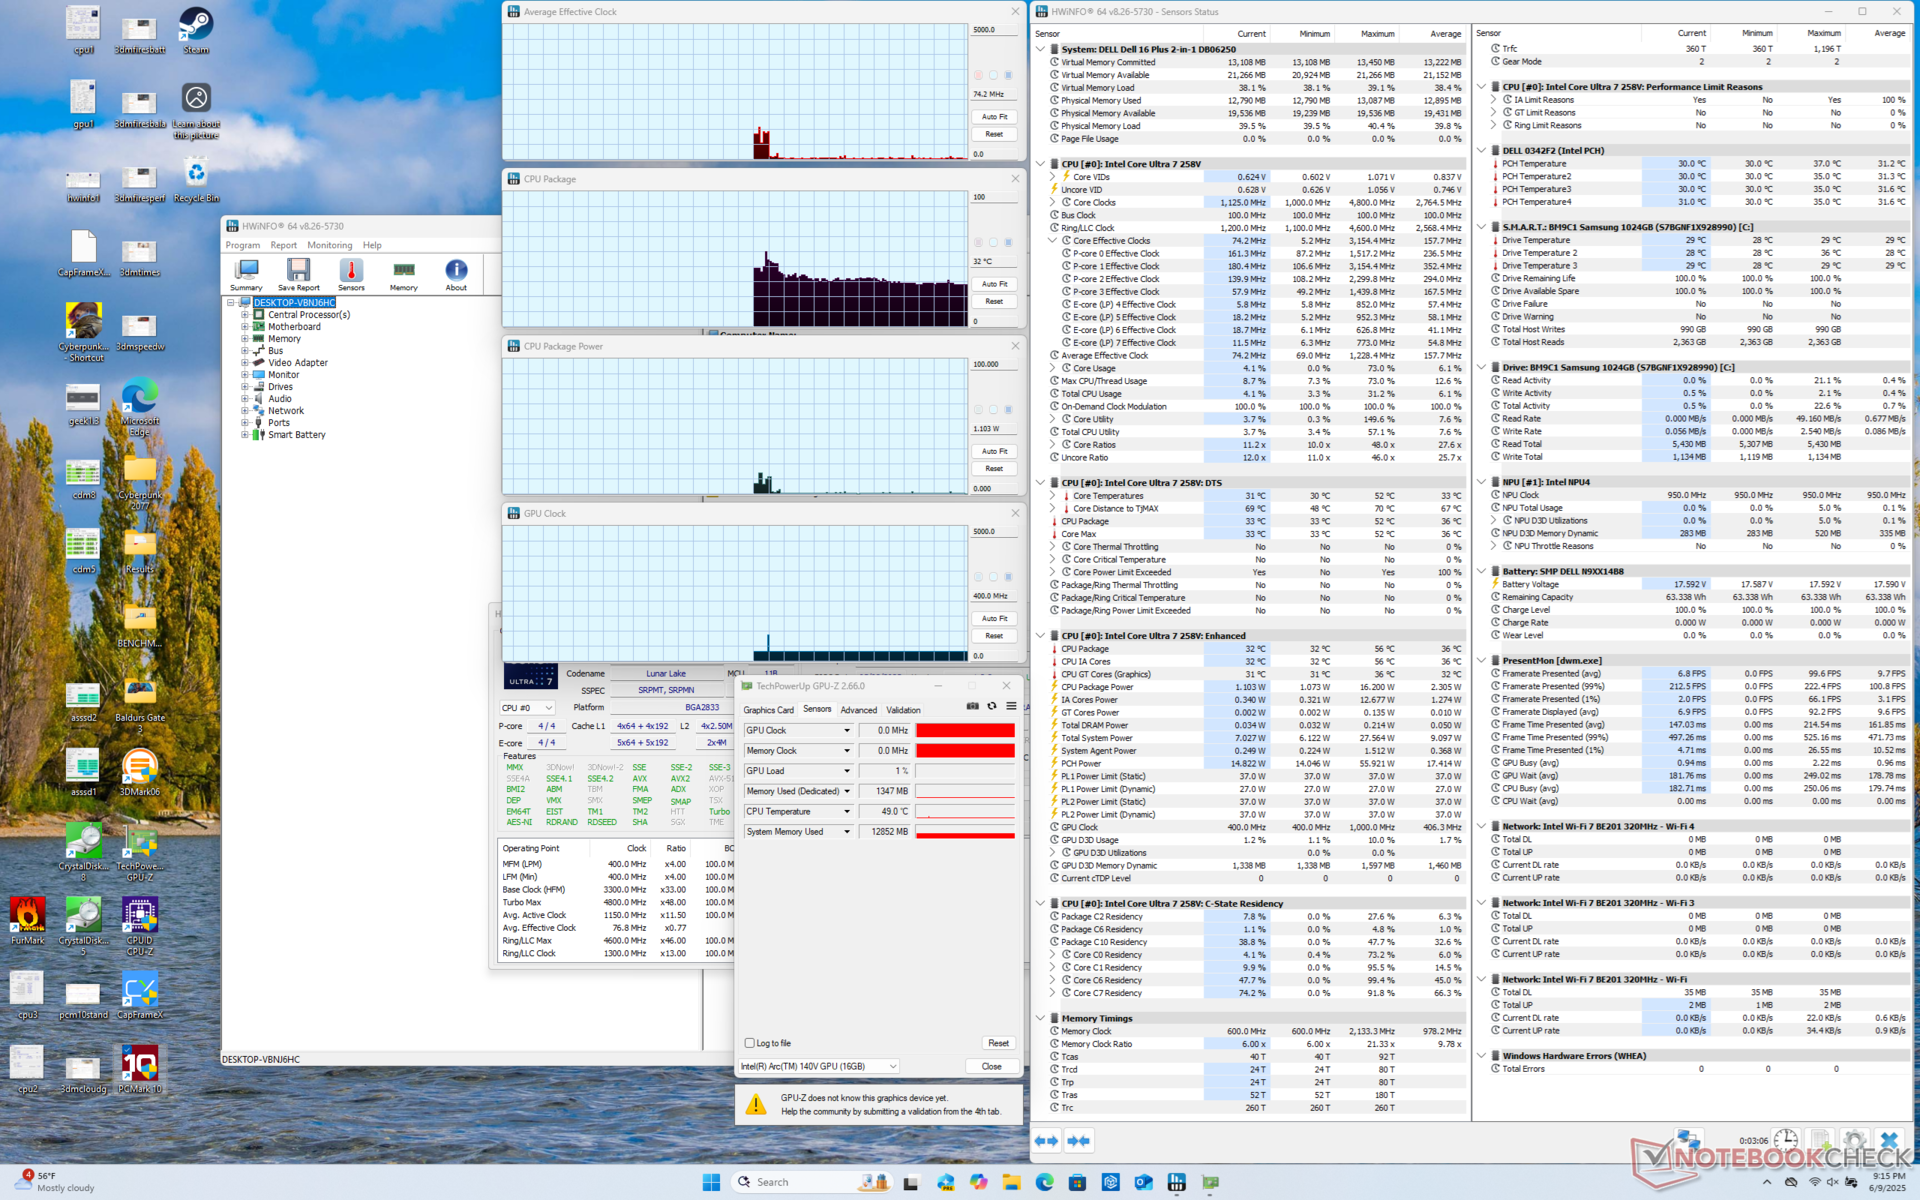
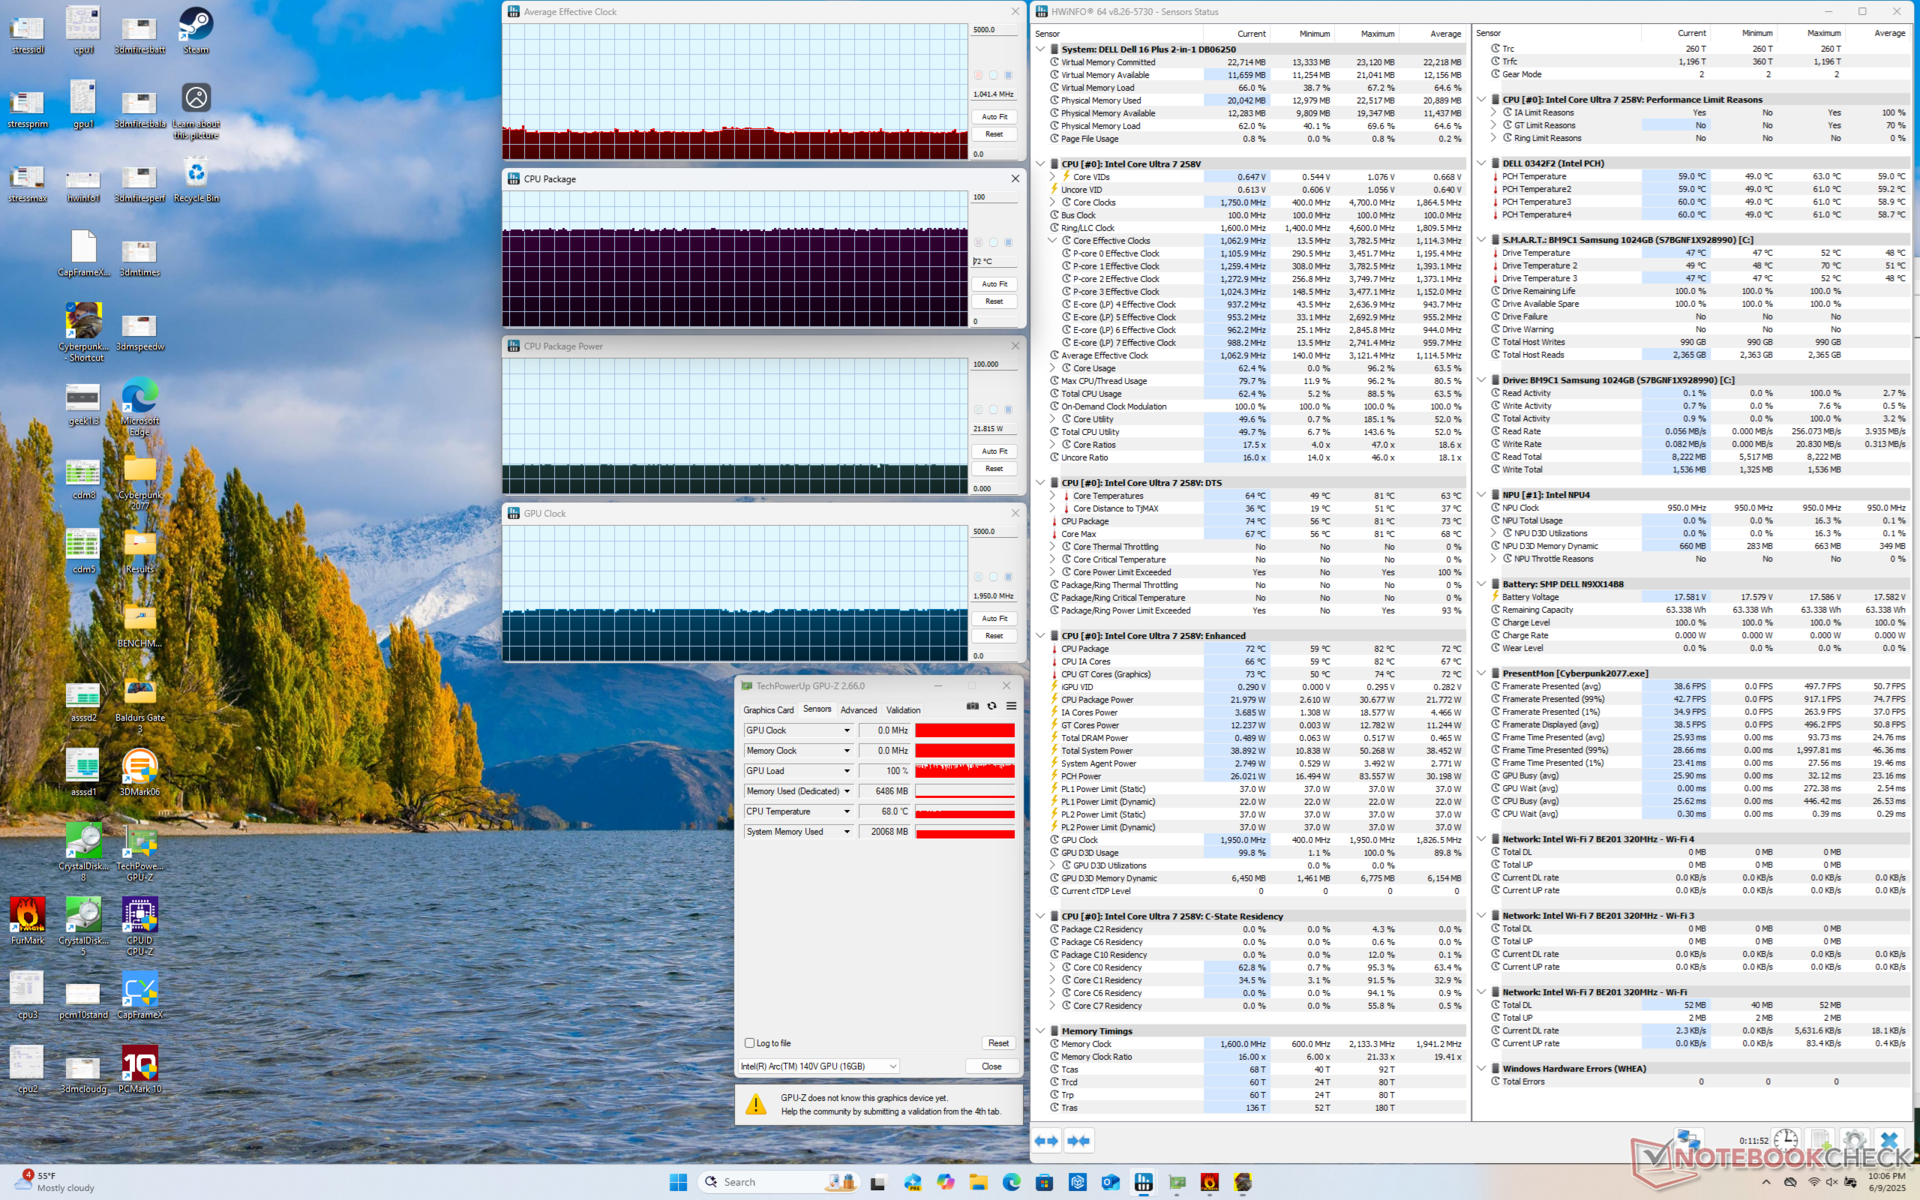
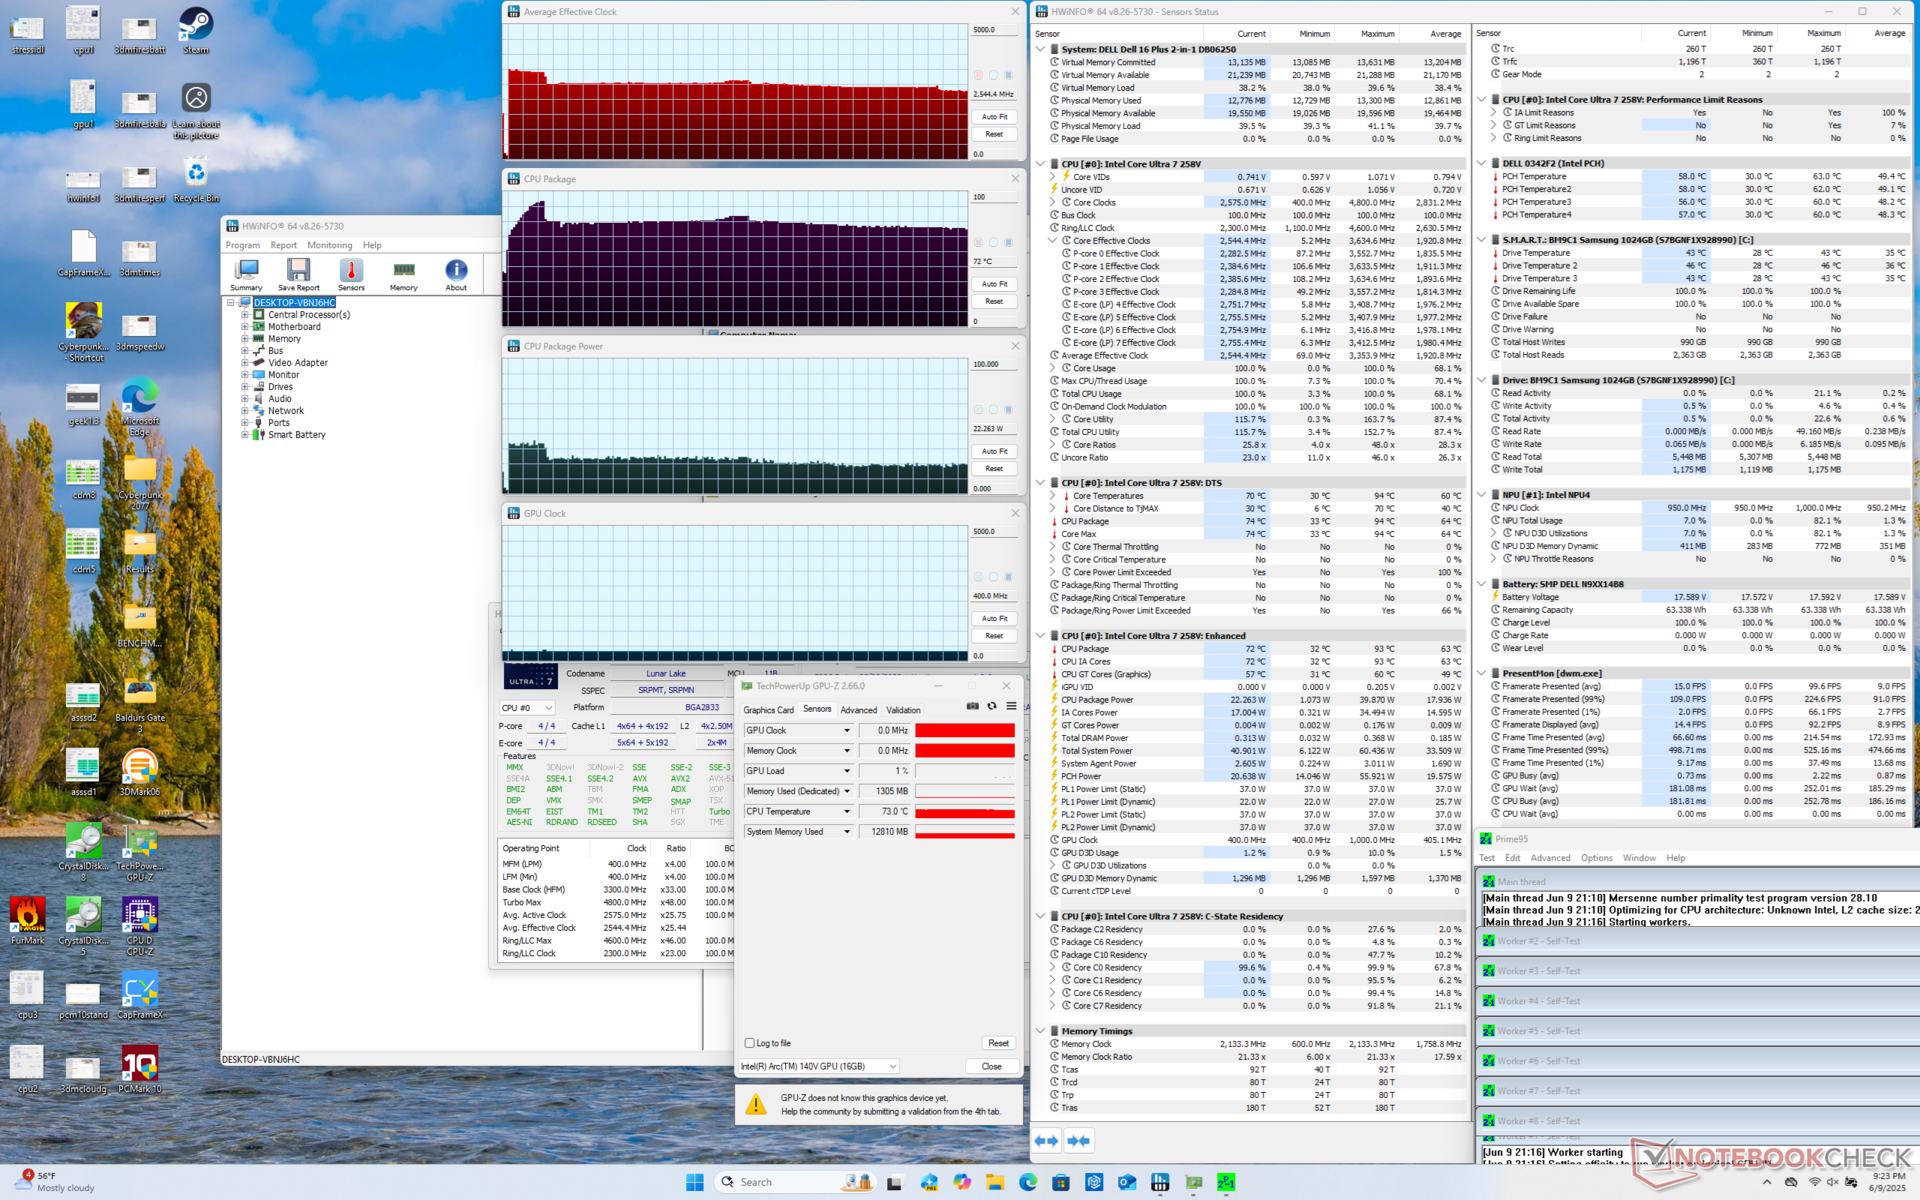
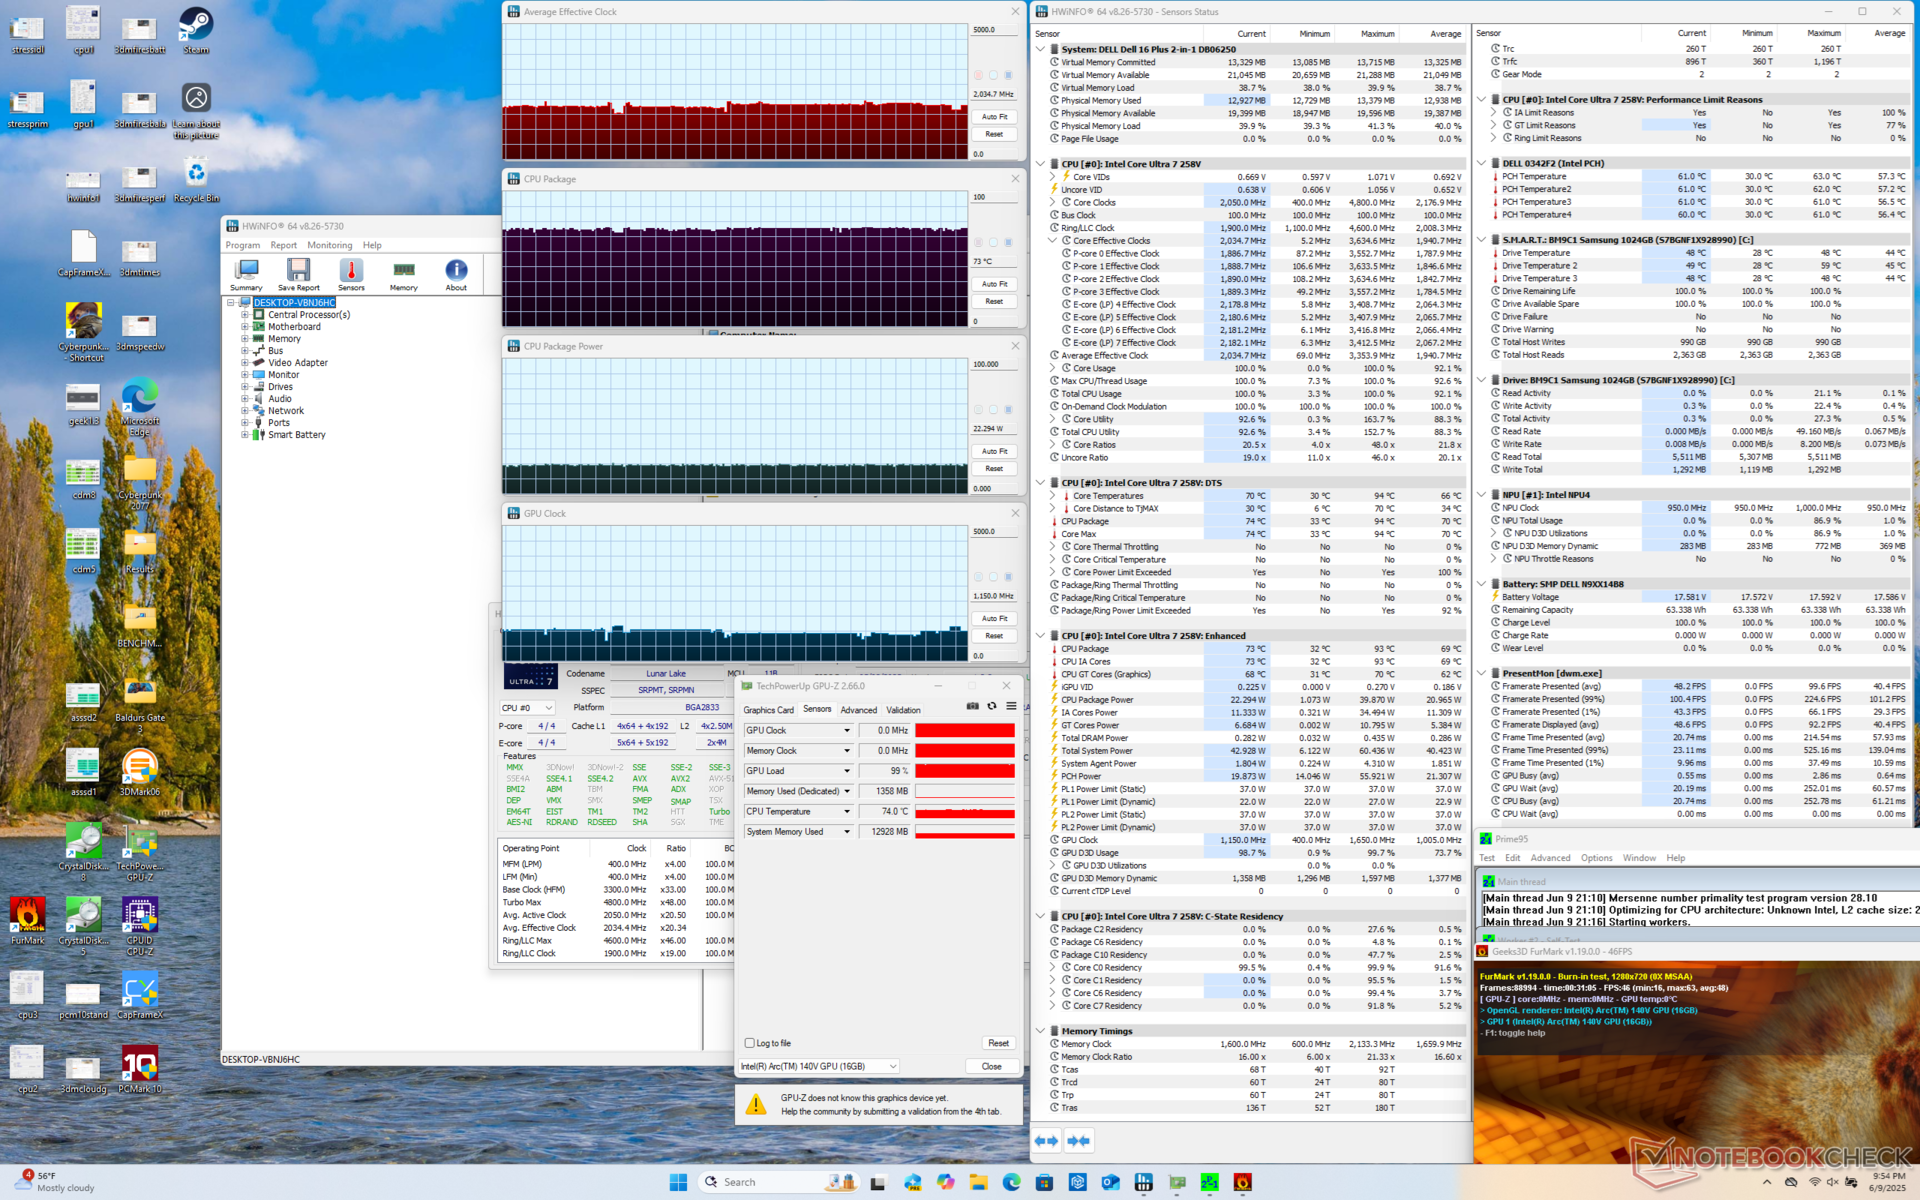
| Clock medio della CPU (GHz) | Clock della GPU (MHz) | Temperatura media della CPU (°C) | |
| Sistema inattivo | -- | -- | 32 |
| Prime95 Stress | 2.5 | 400 | 72 |
| Prime95 + FurMark Stress | 2.0 | 1150 | 73 |
| Cyberpunk 2077 Stress | 1.0 | 1950 | 72 |
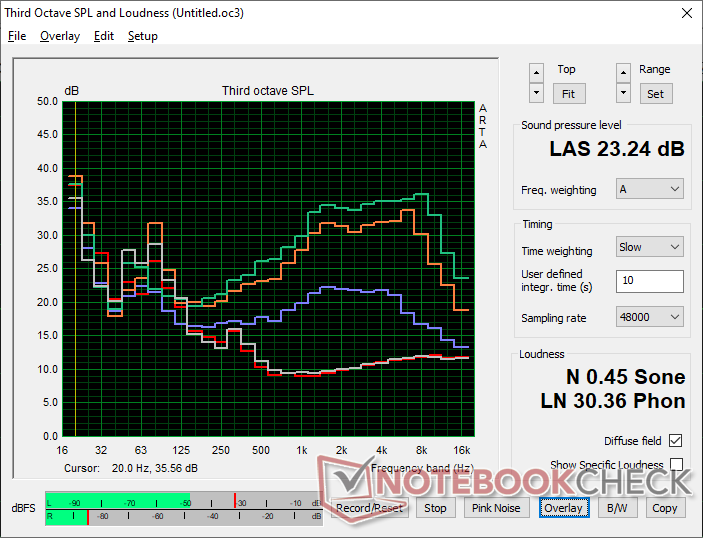
Altoparlanti
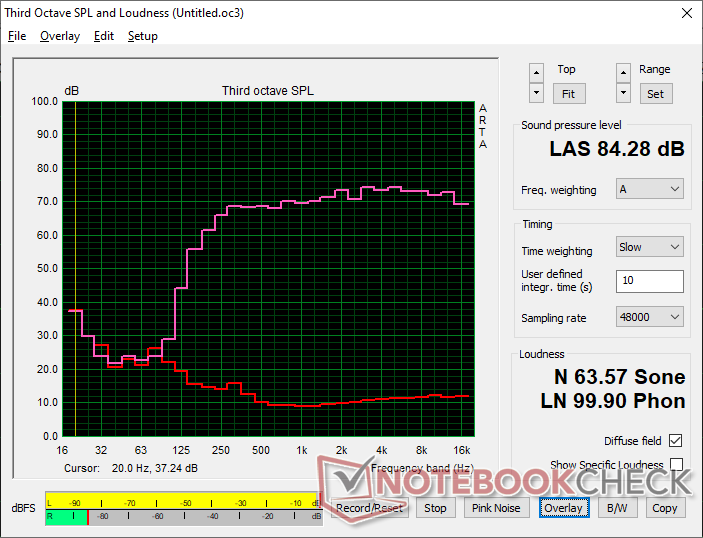
Dell 16 Plus 2-in-1 analisi audio
(+) | gli altoparlanti sono relativamente potenti (82.5 dB)
Bassi 100 - 315 Hz
(-) | quasi nessun basso - in media 16.2% inferiori alla media
(±) | la linearità dei bassi è media (12.1% delta rispetto alla precedente frequenza)
Medi 400 - 2000 Hz
(+) | medi bilanciati - solo only 0.8% rispetto alla media
(+) | medi lineari (1.8% delta rispetto alla precedente frequenza)
Alti 2 - 16 kHz
(+) | Alti bilanciati - appena 2.4% dalla media
(+) | alti lineari (2.9% delta rispetto alla precedente frequenza)
Nel complesso 100 - 16.000 Hz
(+) | suono nel complesso lineare (10.5% differenza dalla media)
Rispetto alla stessa classe
» 7% di tutti i dispositivi testati in questa classe è stato migliore, 2% simile, 91% peggiore
» Il migliore ha avuto un delta di 6%, medio di 20%, peggiore di 57%
Rispetto a tutti i dispositivi testati
» 5% di tutti i dispositivi testati in questa classe è stato migliore, 1% similare, 93% peggiore
» Il migliore ha avuto un delta di 4%, medio di 23%, peggiore di 134%
Apple MacBook Pro 16 2021 M1 Pro analisi audio
(+) | gli altoparlanti sono relativamente potenti (84.7 dB)
Bassi 100 - 315 Hz
(+) | bassi buoni - solo 3.8% dalla media
(+) | bassi in lineaa (5.2% delta rispetto alla precedente frequenza)
Medi 400 - 2000 Hz
(+) | medi bilanciati - solo only 1.3% rispetto alla media
(+) | medi lineari (2.1% delta rispetto alla precedente frequenza)
Alti 2 - 16 kHz
(+) | Alti bilanciati - appena 1.9% dalla media
(+) | alti lineari (2.7% delta rispetto alla precedente frequenza)
Nel complesso 100 - 16.000 Hz
(+) | suono nel complesso lineare (4.6% differenza dalla media)
Rispetto alla stessa classe
» 0% di tutti i dispositivi testati in questa classe è stato migliore, 0% simile, 100% peggiore
» Il migliore ha avuto un delta di 5%, medio di 17%, peggiore di 45%
Rispetto a tutti i dispositivi testati
» 0% di tutti i dispositivi testati in questa classe è stato migliore, 0% similare, 100% peggiore
» Il migliore ha avuto un delta di 4%, medio di 23%, peggiore di 134%
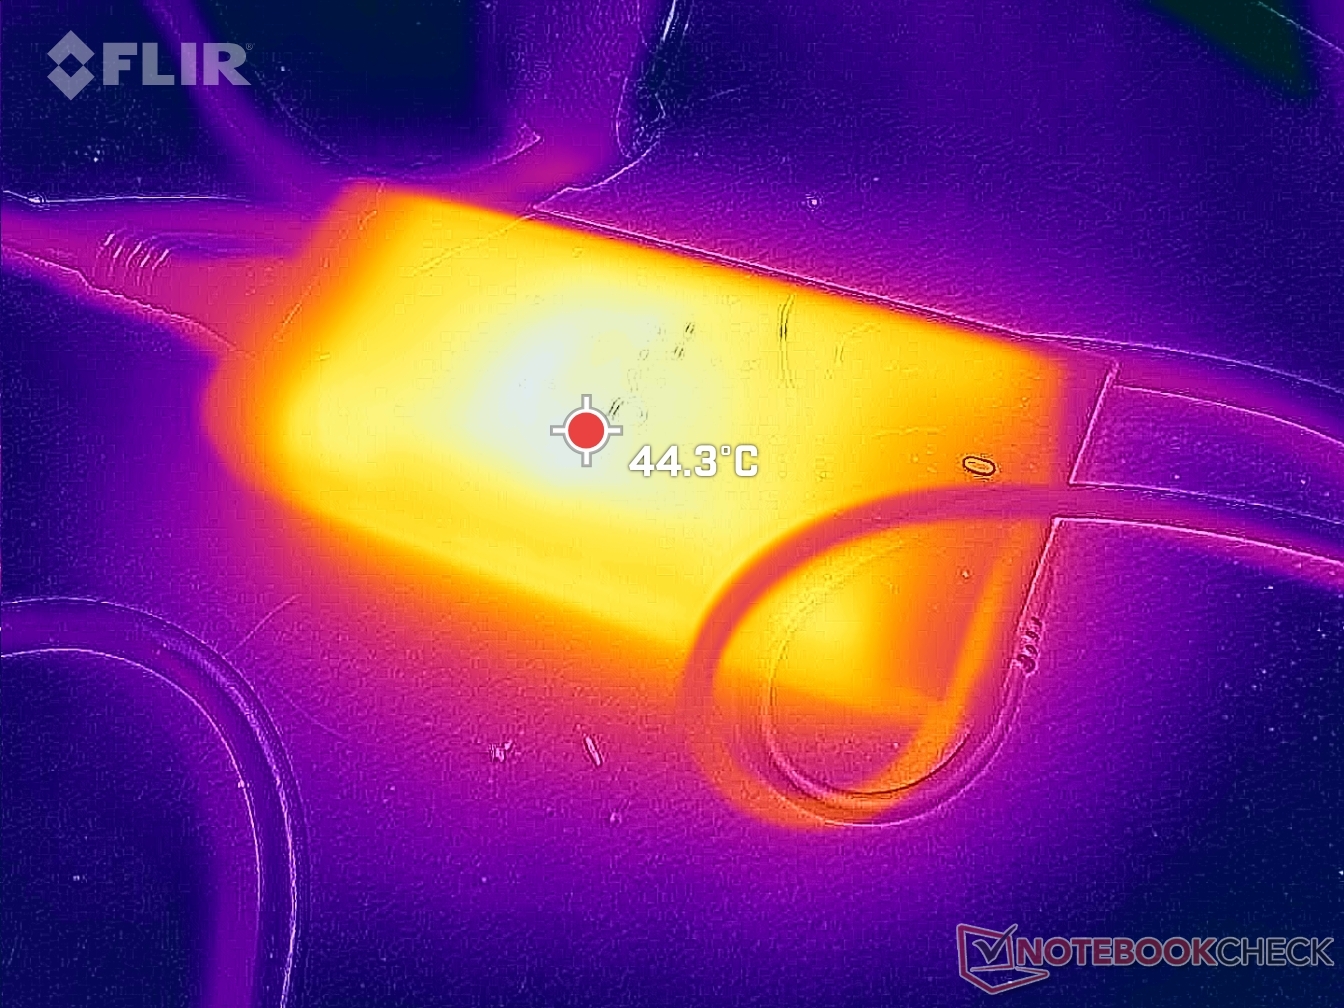
Gestione dell'energia
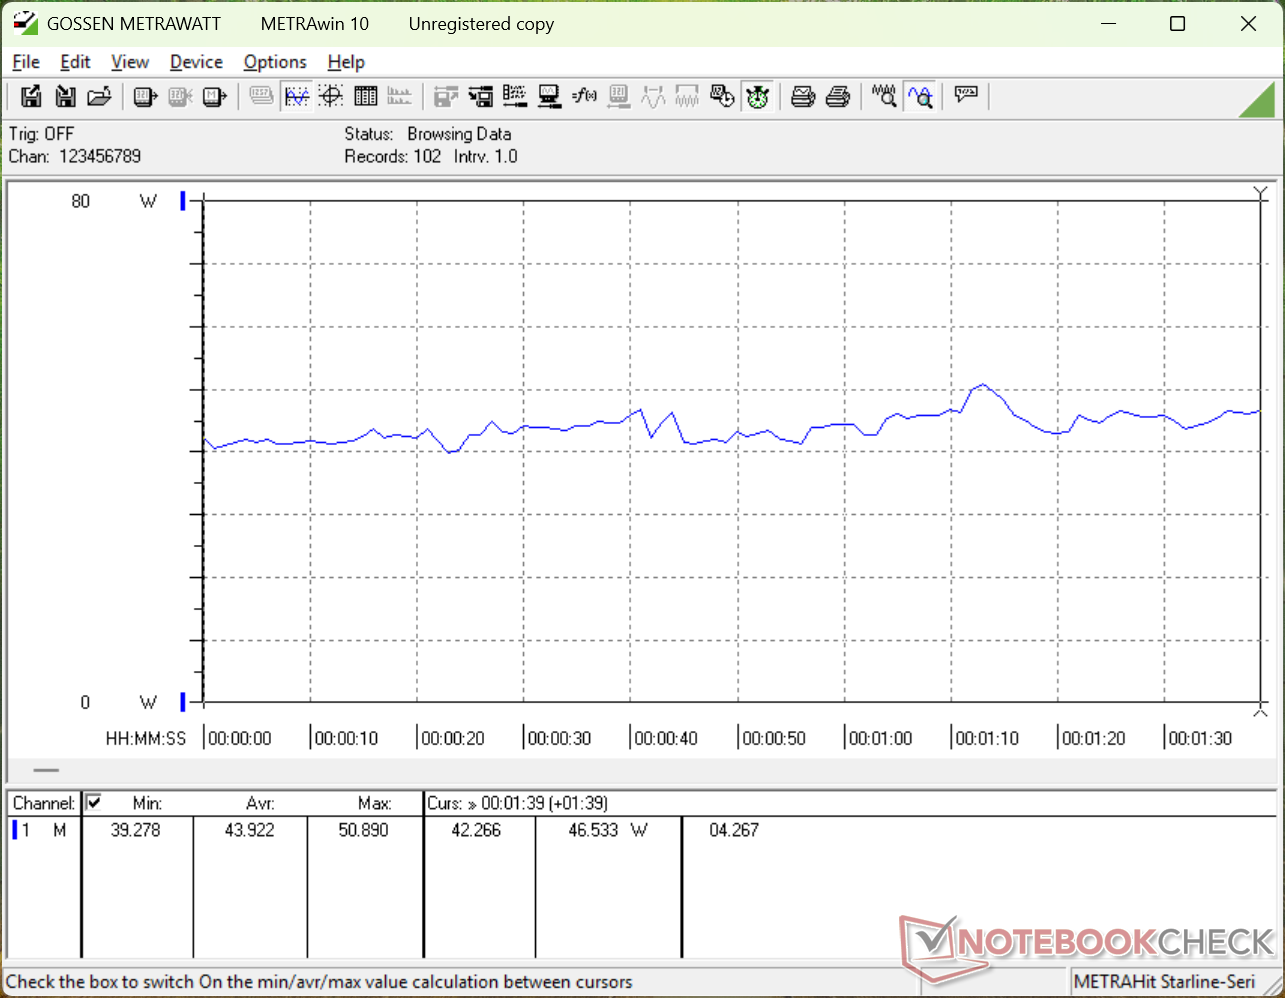
Consumo di energia
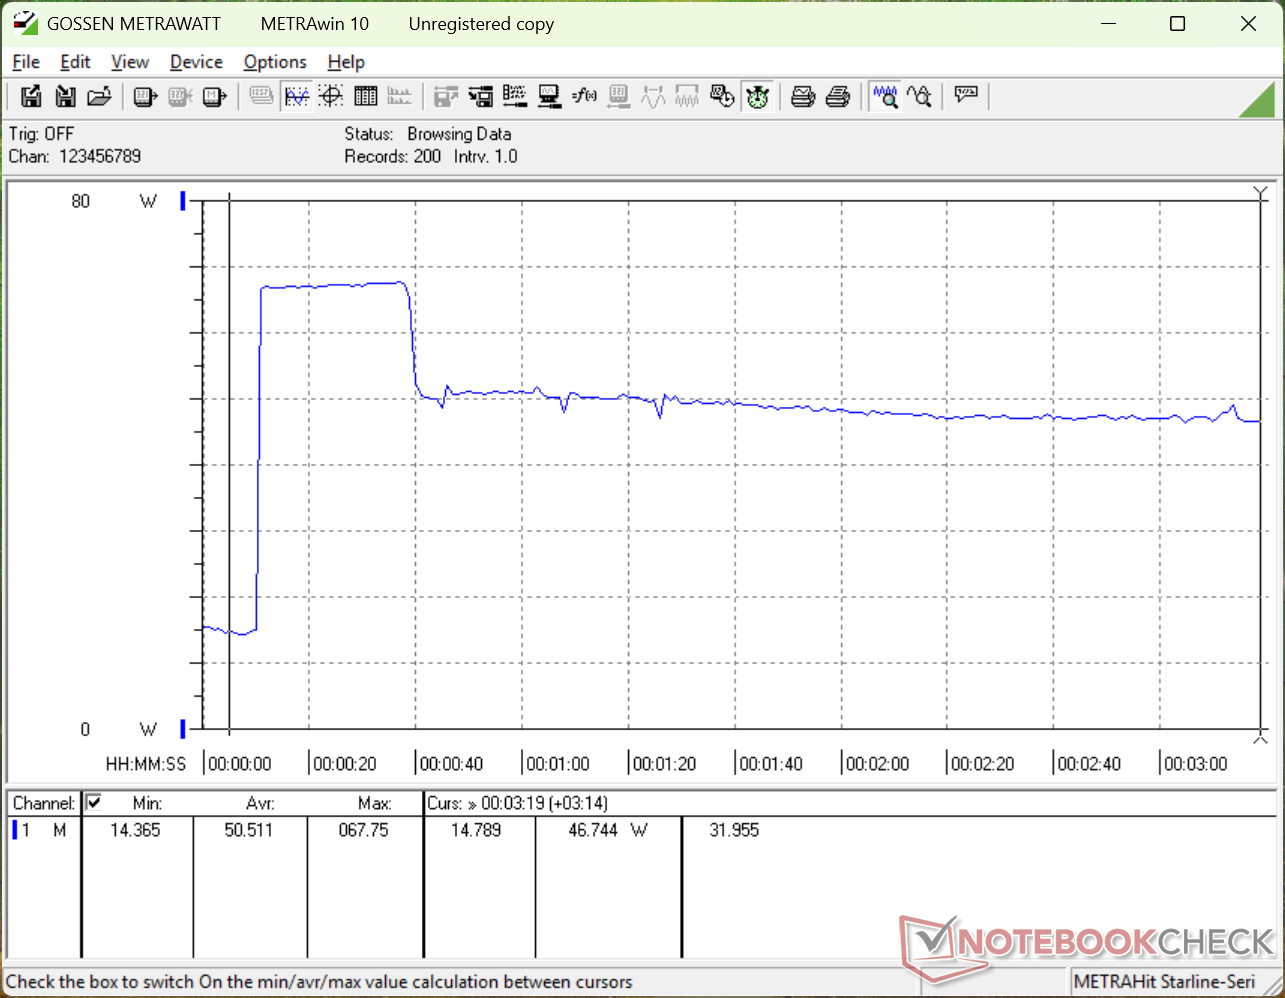
Il consumo al minimo è simile a quello che abbiamo registrato con l'Inspiron 16 7640 dello scorso anno Inspiron 16 7640 2-in-1 poiché condividono più di qualche componente simile. Quando esegue carichi più impegnativi, tuttavia, il Dell 16 Plus 2-in-1 richiede molta meno energia, poiché il Core Ultra 7 258V è più lento e più efficiente del Core Ultra 7 155H.
Siamo riusciti a misurare un consumo massimo di 67 W dal piccolo (~11 x 5 x 2,8 cm) adattatore CA USB-C da 65 W.
| Off / Standby | |
| Idle | |
| Sotto carico |
|
Leggenda:
min: | |
| Dell 16 Plus 2-in-1 Core Ultra 7 258V, Arc 140V, Samsung BM9C1 1024GB, Mini-LED, 2560x1600, 16" | Dell Inspiron 16 7640 2-in-1 Ultra 7 155H, Arc 8-Core, Micron 2550 1TB, Mini-LED, 2560x1600, 16" | Lenovo Yoga 7 2-in-1 16ILL10 Core Ultra 7 256V, Arc 140V, WD PC SN7100S SDFPMSL-512G-1101, IPS, 1920x1200, 16" | Samsung Galaxy Book5 Pro 360 Core Ultra 5 226V, Arc 130V, Samsung PM9B1 512GB MZVL4512HBLU, OLED, 2880x1800, 16" | MSI Summit A16 AI Plus A3HMTG Ryzen AI 9 365, Radeon 880M, Samsung PM9C1 MZVL81T0HELB-00BTW, IPS, 2560x1600, 16" | HP Envy x360 2-in-1 16-ad0097nr R7 8840HS, Radeon 780M, KIOXIA BG5 KBG50ZNV1T02, OLED, 2880x1800, 16" | |
|---|---|---|---|---|---|---|
| Power Consumption | -30% | 17% | 19% | -16% | 12% | |
| Idle Minimum * (Watt) | 7 | 6.1 13% | 4.2 40% | 5.3 24% | 5.4 23% | 5 29% |
| Idle Average * (Watt) | 13.2 | 13.5 -2% | 8.3 37% | 6.7 49% | 11 17% | 6.2 53% |
| Idle Maximum * (Watt) | 13.4 | 13.8 -3% | 9.5 29% | 7.3 46% | 11.2 16% | 14.7 -10% |
| Load Average * (Watt) | 43.9 | 63.6 -45% | 40.3 8% | 37.6 14% | 76.6 -74% | 49.9 -14% |
| Cyberpunk 2077 ultra external monitor * (Watt) | 40.7 | 64.6 -59% | 40.8 -0% | 42.8 -5% | 49.2 -21% | |
| Cyberpunk 2077 ultra * (Watt) | 44.9 | 67 -49% | 47.4 -6% | 44.6 1% | 61.1 -36% | |
| Load Maximum * (Watt) | 67.8 | 109.7 -62% | 59 13% | 64.1 5% | 91.8 -35% | 65 4% |
| Witcher 3 ultra * (Watt) | 54.5 |
* ... Meglio usare valori piccoli
Power Consumption Cyberpunk / Stress Test
Power Consumption external Monitor
Durata della batteria
La capacità della batteria è inferiore a quella dell'Inspiron 16 7640 2-in-1 dello scorso anno, il che influisce negativamente sull'autonomia della WLAN, ma supera di poco le due ore.
| Dell 16 Plus 2-in-1 Core Ultra 7 258V, Arc 140V, 64 Wh | Dell Inspiron 16 7640 2-in-1 Ultra 7 155H, Arc 8-Core, 90 Wh | Lenovo Yoga 7 2-in-1 16ILL10 Core Ultra 7 256V, Arc 140V, 70 Wh | Samsung Galaxy Book5 Pro 360 Core Ultra 5 226V, Arc 130V, 76 Wh | MSI Summit A16 AI Plus A3HMTG Ryzen AI 9 365, Radeon 880M, 82 Wh | HP Envy x360 2-in-1 16-ad0097nr R7 8840HS, Radeon 780M, 68 Wh | |
|---|---|---|---|---|---|---|
| Autonomia della batteria | 28% | 125% | 21% | 2% | -13% | |
| WiFi v1.3 (h) | 8.9 | 11.4 28% | 20 125% | 10.8 21% | 9.1 2% | 7.7 -13% |
| Reader / Idle (h) | 21.8 | 15.6 | ||||
| Load (h) | 1.6 | 2.1 | 1.9 | |||
| H.264 (h) | 19.7 |
Valutazione Notebookcheck
Dell 16 Plus 2-in-1
- 06/14/2025 v8
Allen Ngo
 Total Sustainability Score:
 Potential Competitors in Comparison
Immagine | Modello | Prezzo | Peso | Altezza | Schermo |
|---|---|---|---|---|---|
1. 83.5%  | Dell 16 Plus 2-in-1 Intel Core Ultra 7 258V ⎘ Intel Arc Graphics 140V ⎘ 32 GB Memoria, 1024 GB SSD | Amazon: $1,149.99 Prezzo di listino: 1500 USD | 2 kg | 16.99 mm | 16.00" 2560x1600 189 PPI Mini-LED |
2. 82.1%  | Dell Inspiron 16 7640 2-in-1 Intel Core Ultra 7 155H ⎘ Intel Arc 8-Core iGPU ⎘ 16 GB Memoria, 1024 GB SSD | Amazon: Prezzo di listino: 1000 USD | 2.1 kg | 18.99 mm | 16.00" 2560x1600 189 PPI Mini-LED |
3. 84.3%  | Lenovo Yoga 7 2-in-1 16ILL10 Intel Core Ultra 7 256V ⎘ Intel Arc Graphics 140V ⎘ 16 GB Memoria, 512 GB SSD | Amazon: Prezzo di listino: 1000 USD | 1.9 kg | 15.85 mm | 16.00" 1920x1200 142 PPI IPS |
4. 85.9%  | Samsung Galaxy Book5 Pro 360 Intel Core Ultra 5 226V ⎘ Intel Arc Graphics 130V ⎘ 16 GB Memoria, 512 GB SSD | Amazon: Prezzo di listino: 1799€ | 1.7 kg | 12.8 mm | 16.00" 2880x1800 212 PPI OLED |
5. 81.9%  | MSI Summit A16 AI Plus A3HMTG AMD Ryzen AI 9 365 ⎘ AMD Radeon 880M ⎘ 32 GB Memoria, 1024 GB SSD | Amazon: Prezzo di listino: 1600 USD | 2.1 kg | 16.85 mm | 16.00" 2560x1600 189 PPI IPS |
6. 87.2% v7 (old)  | HP Envy x360 2-in-1 16-ad0097nr AMD Ryzen 7 8840HS ⎘ AMD Radeon 780M ⎘ 16 GB Memoria, 1024 GB SSD | Amazon: 1. $135.99 Replacement for HP Envy x360... 2. $159.88 HPDELGB for HP Envy x360 2-i... 3. $699.99 HP Envy 2-in-1 16" 2K Touch-... Prezzo di listino: 1300 USD | 1.8 kg | 18.3 mm | 16.00" 2880x1800 212 PPI OLED |
Transparency
La selezione dei dispositivi da recensire viene effettuata dalla nostra redazione. Il campione di prova è stato fornito all'autore come prestito dal produttore o dal rivenditore ai fini di questa recensione. L'istituto di credito non ha avuto alcuna influenza su questa recensione, né il produttore ne ha ricevuto una copia prima della pubblicazione. Non vi era alcun obbligo di pubblicare questa recensione. In quanto società mediatica indipendente, Notebookcheck non è soggetta all'autorità di produttori, rivenditori o editori.
Ecco come Notebookcheck esegue i test
Ogni anno, Notebookcheck esamina in modo indipendente centinaia di laptop e smartphone utilizzando procedure standardizzate per garantire che tutti i risultati siano comparabili. Da circa 20 anni sviluppiamo continuamente i nostri metodi di prova e nel frattempo stabiliamo gli standard di settore. Nei nostri laboratori di prova, tecnici ed editori esperti utilizzano apparecchiature di misurazione di alta qualità. Questi test comportano un processo di validazione in più fasi. Il nostro complesso sistema di valutazione si basa su centinaia di misurazioni e parametri di riferimento ben fondati, che mantengono l'obiettività.
