Verdetto - Più snello e leggero di prima
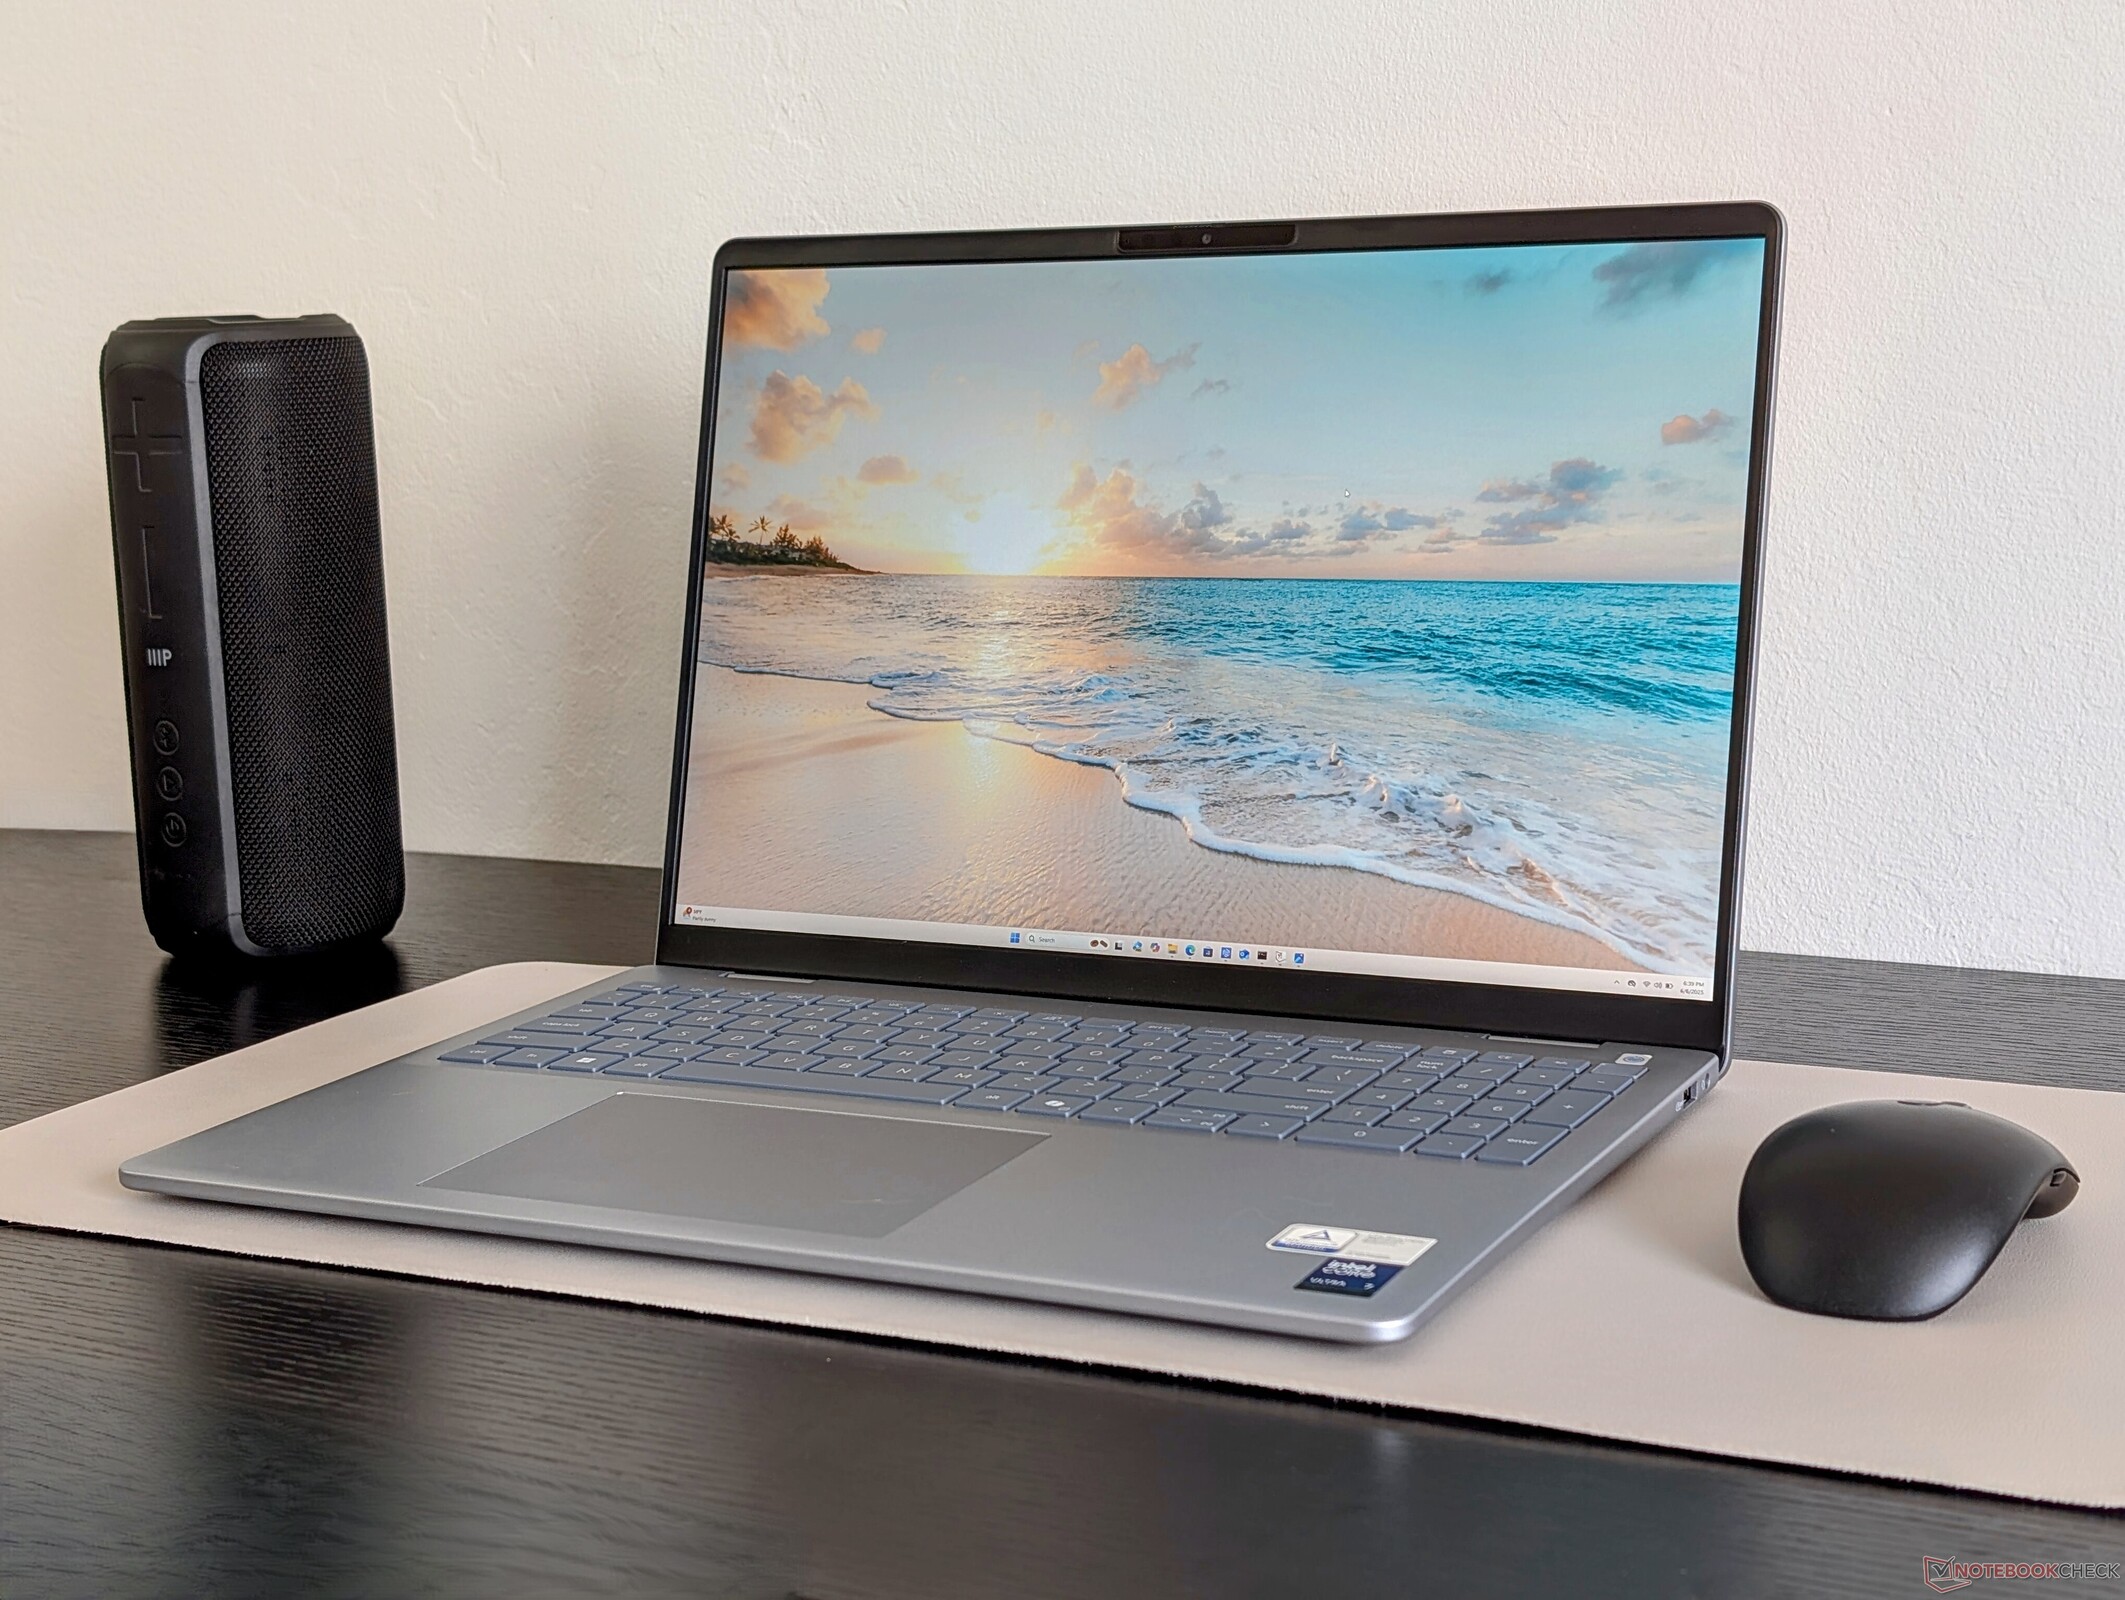
Sebbene possa assomigliare molto al suo predecessore, l' Inspiron 16 Plus 7640dell 16 Plus è una bestia diversa, grazie al passaggio da una CPU Core Ultra-H alla più recente Core Ultra-V Lunar Lake. Il risultato è una macchina più snella, più leggera e più duratura, che dovrebbe adattarsi meglio ad un pubblico multimediale più generico. Apprezziamo anche il fatto che il suo display IPS 1600p120 sia di serie, il che significa che non ci sono opzioni "di fascia bassa" con pannelli o colori scadenti.
Il principale punto dolente del Dell 16 Plus è la sua mancanza di prestazioni per le applicazioni più impegnative. Il vecchio Inspiron 16 Plus 7640 o Inspiron 16 7640 2-in-1 offrono opzioni Core-H o GPU discrete per prestazioni molto più veloci rispetto al Dell 16 Plus. Inoltre, offrono la stessa esperienza visiva, se non addirittura migliore, a circa lo stesso prezzo. Gli utenti che non hanno bisogno della potenza extra troveranno il Dell 16 Plus l'opzione più appropriata per i viaggi e l'editing occasionale. Altrimenti, la più potente Serie Dell Premium più potente, dovrebbe essere presa in considerazione.
Pro
Contro
Prezzo e disponibilità
Dell sta spedendo il Dell 16 Plus a partire da 1150 dollari, come configurato nella nostra recensione. Anche l'opzione Core Ultra 9 è in vendita su Amazon a 1400 dollari.
Il Dell 16 Plus sostituisce la serie Inspiron 16 Plus di ultima generazione. Sebbene il nome e le opzioni di processore siano molto diverse, le caratteristiche fisiche sono ancora molto simili a quelle dell'Inspiron 16 Plus dello scorso anno Inspiron 16 Plus 7640 o Inspiron 16 7640 2-in-1 come dimostrerà la nostra recensione.
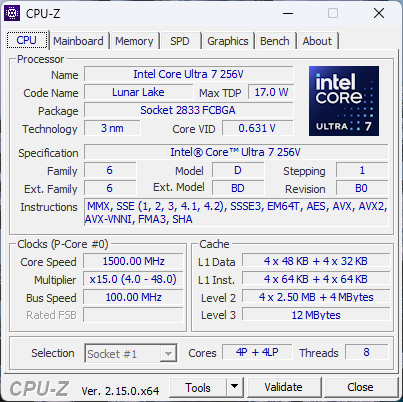
La nostra unità di prova è una configurazione intermedia con Core Ultra 7 256V e display IPS 1600p120 a partire da 1150 dollari. Le SKU di fascia più alta offrono il Core Ultra 7 258V o il Core Ultra 9 288V con il doppio della RAM e dell'archiviazione a 1650 dollari, mentre le altre opzioni di display includono 1200p IPS o 1600p Mini-LED.
I concorrenti in questo spazio includono altri computer portatili multimediali da 16 pollici di fascia media, come il modello Lenovo IdeaPad Pro 5 16, HP Pavilion Plus 16o Asus Vivobook 16.
Altre recensioni di Dell:
Specifiche
Caso
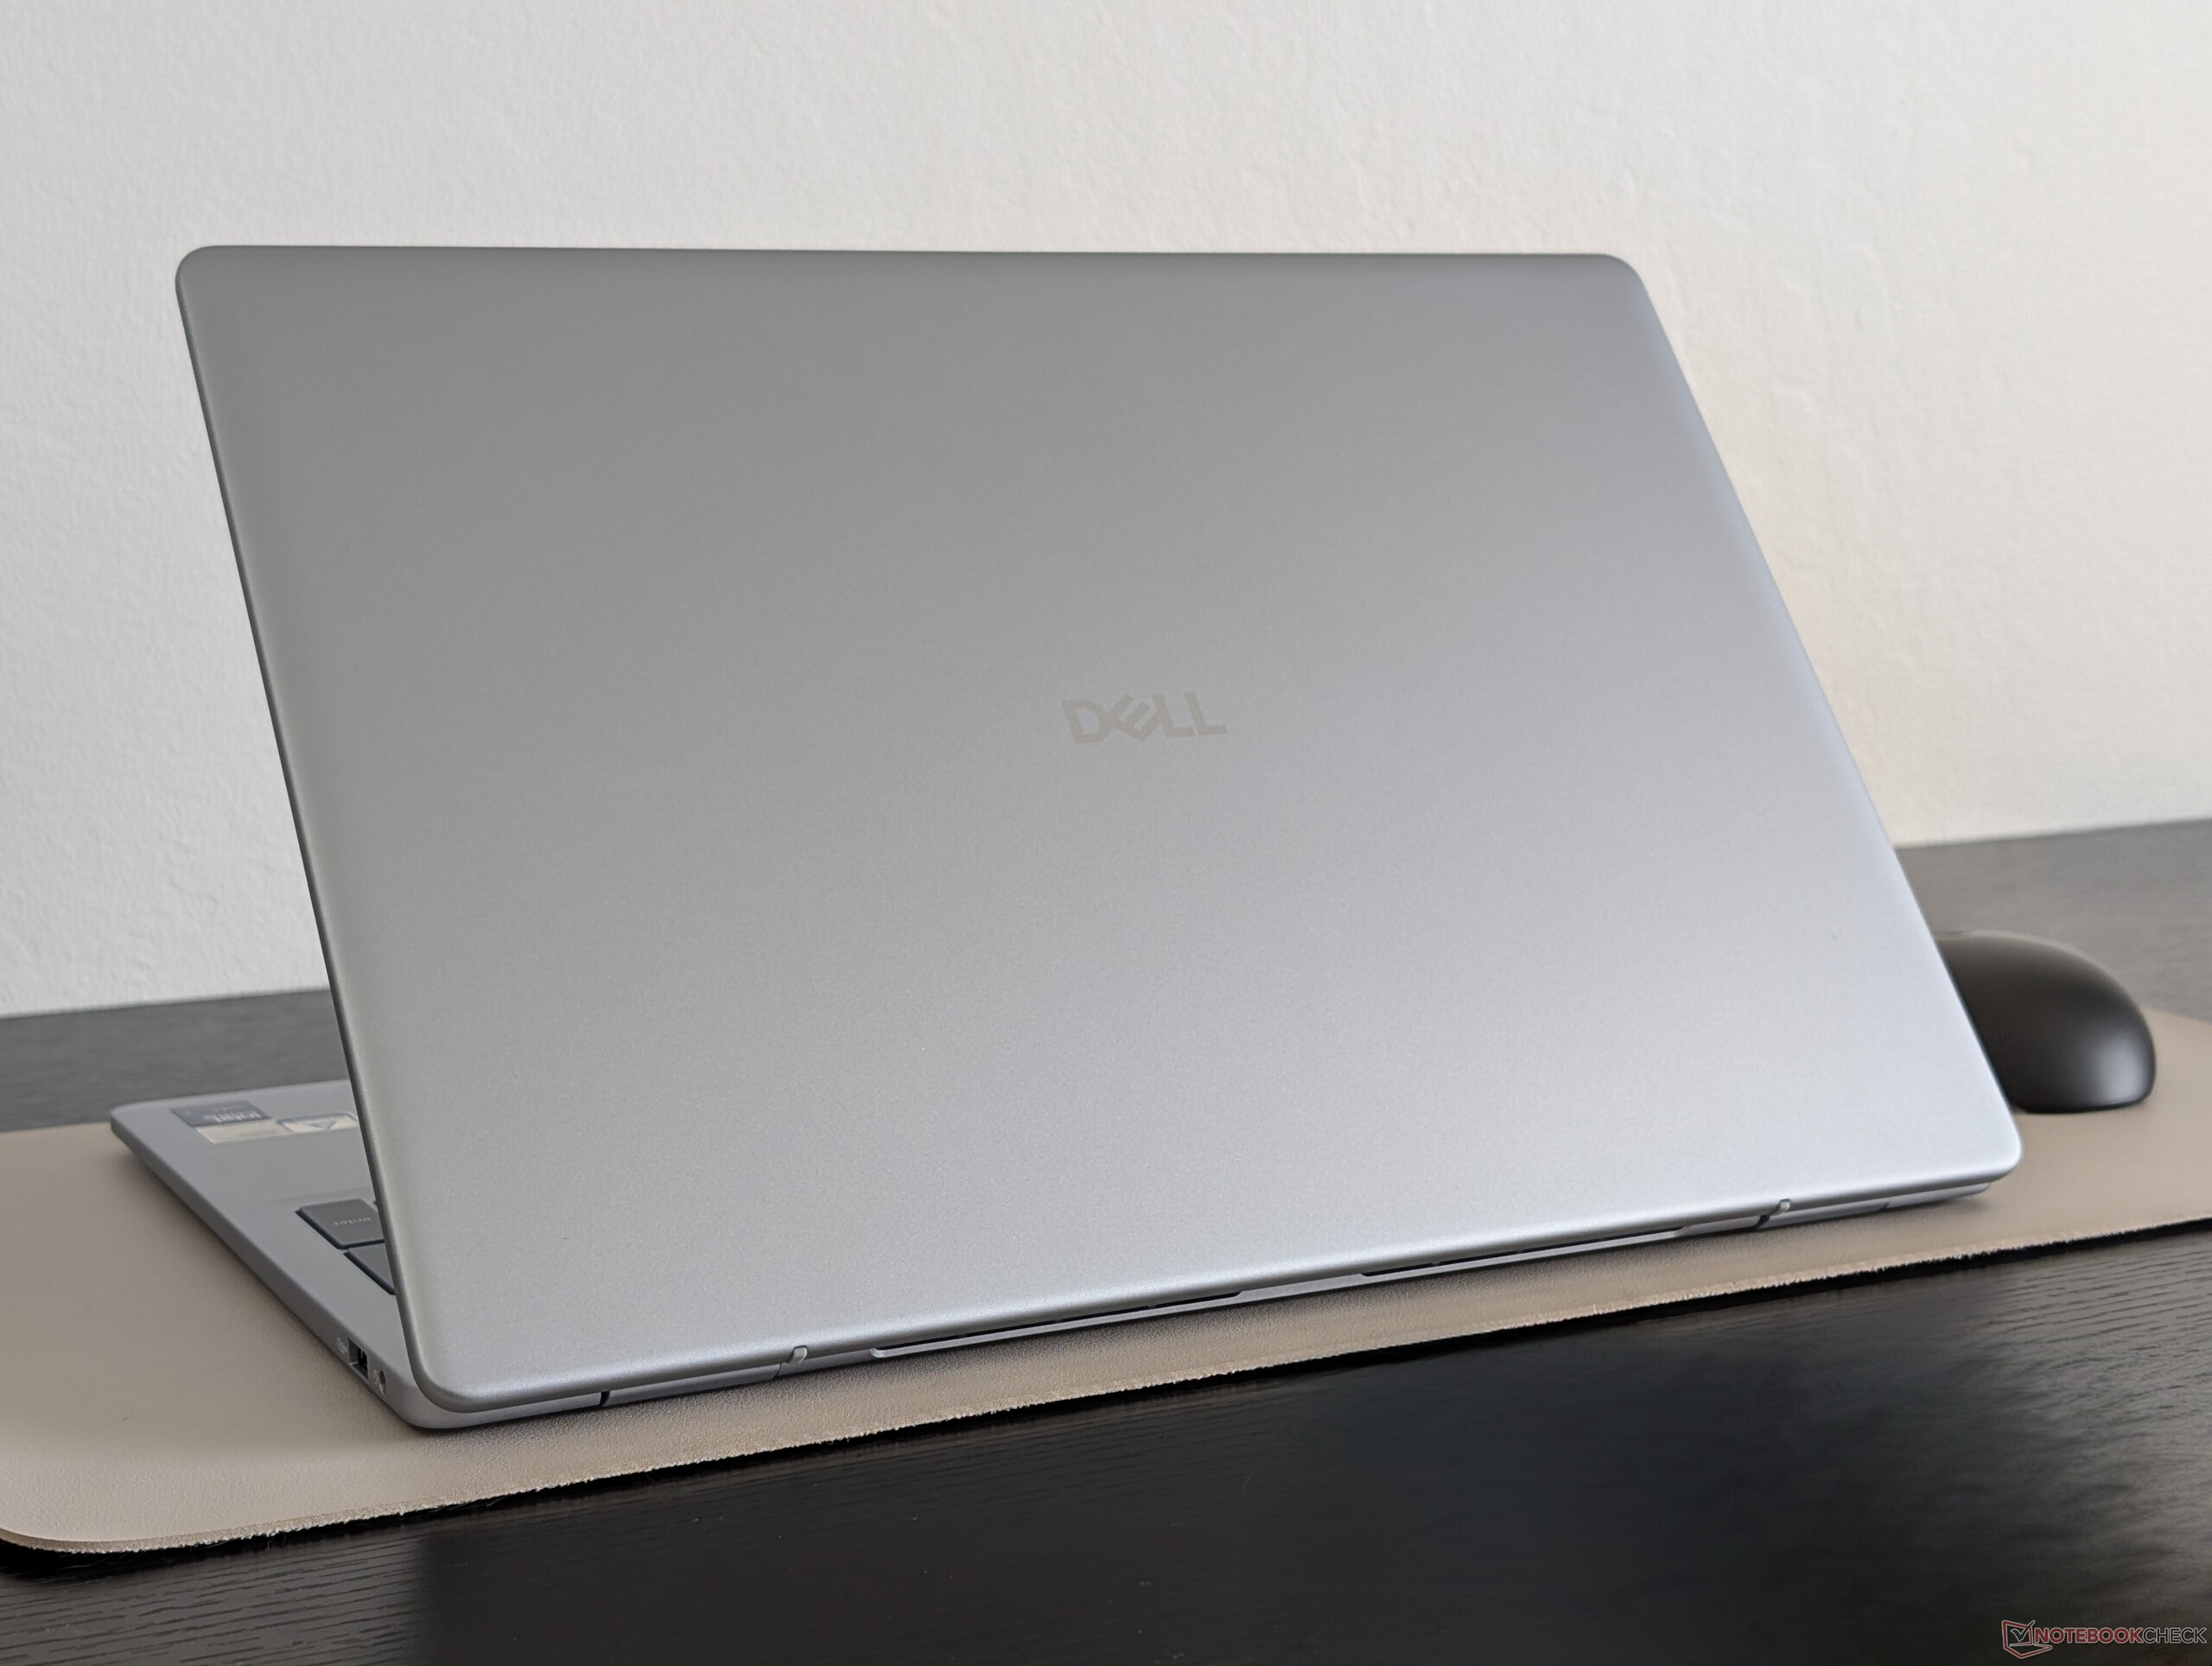
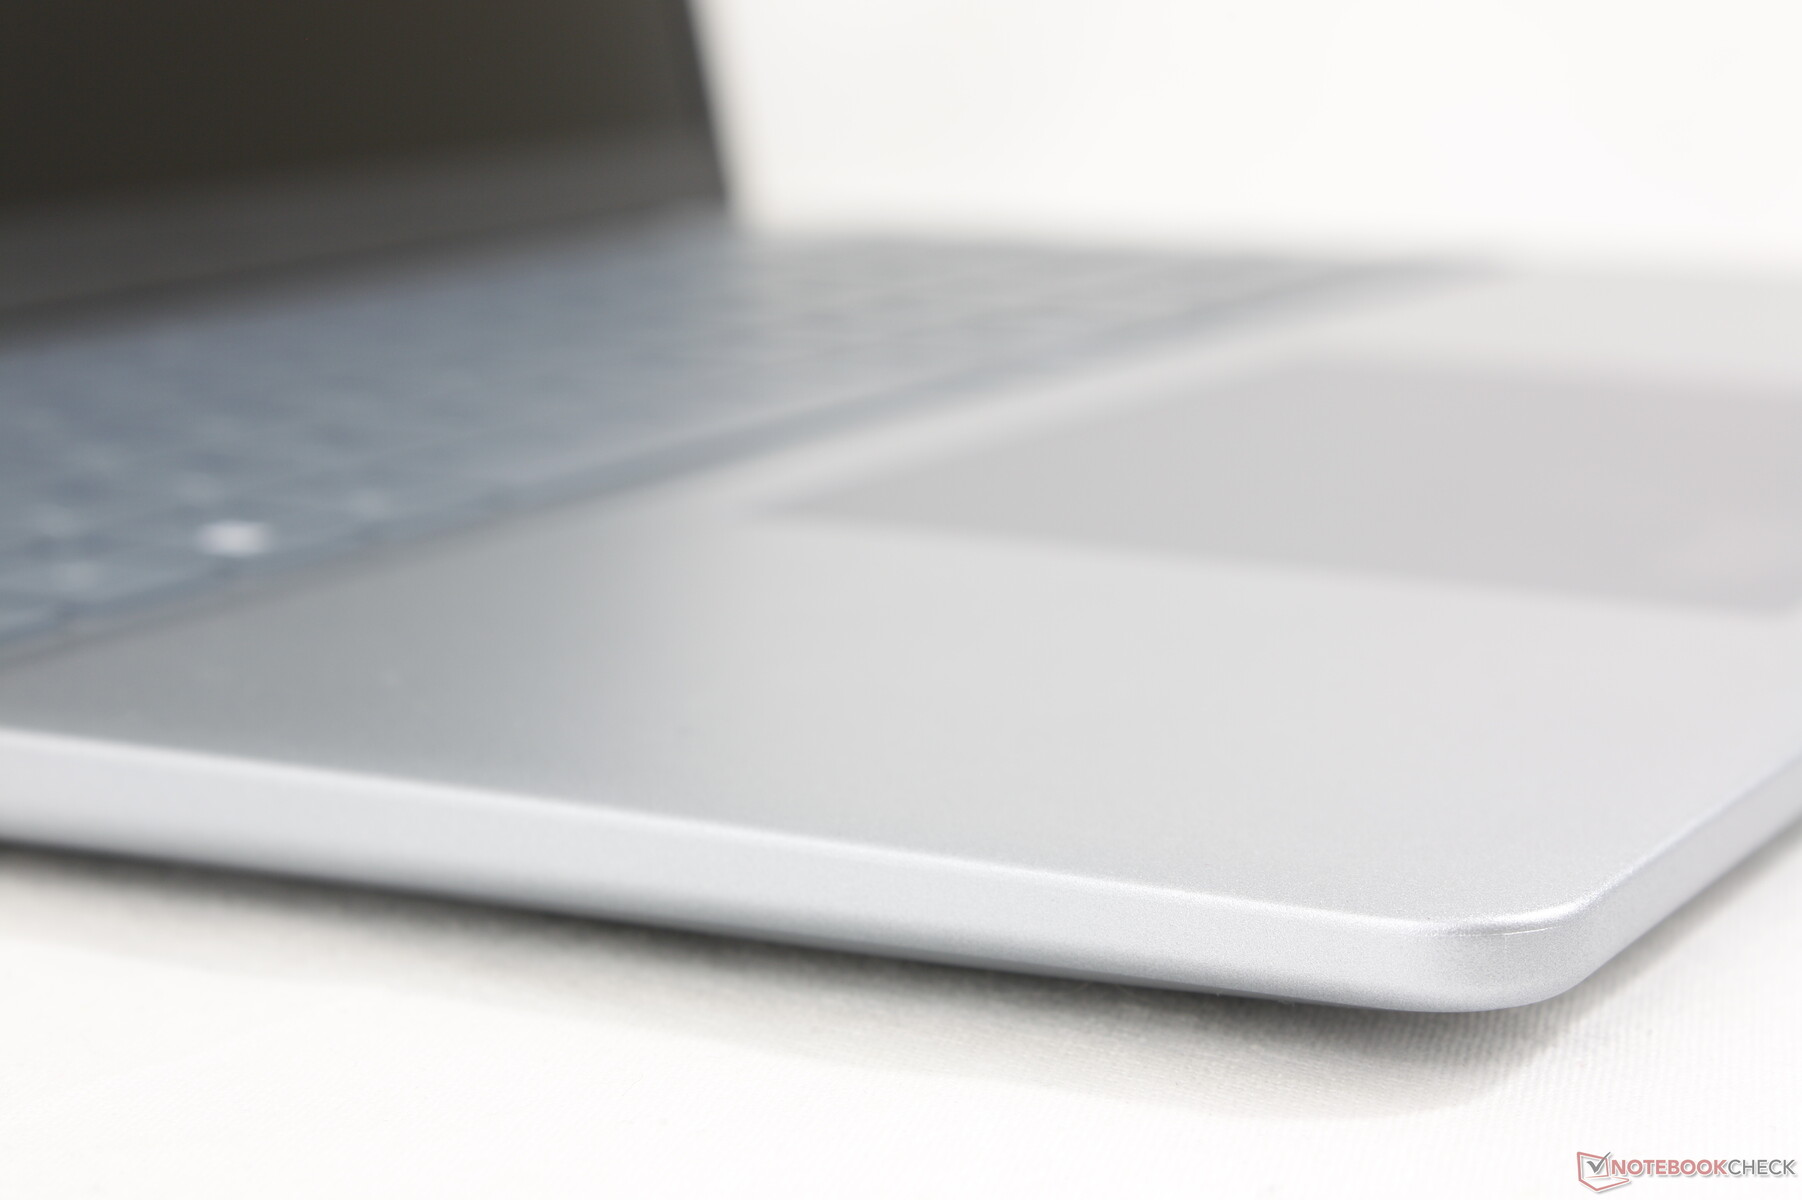
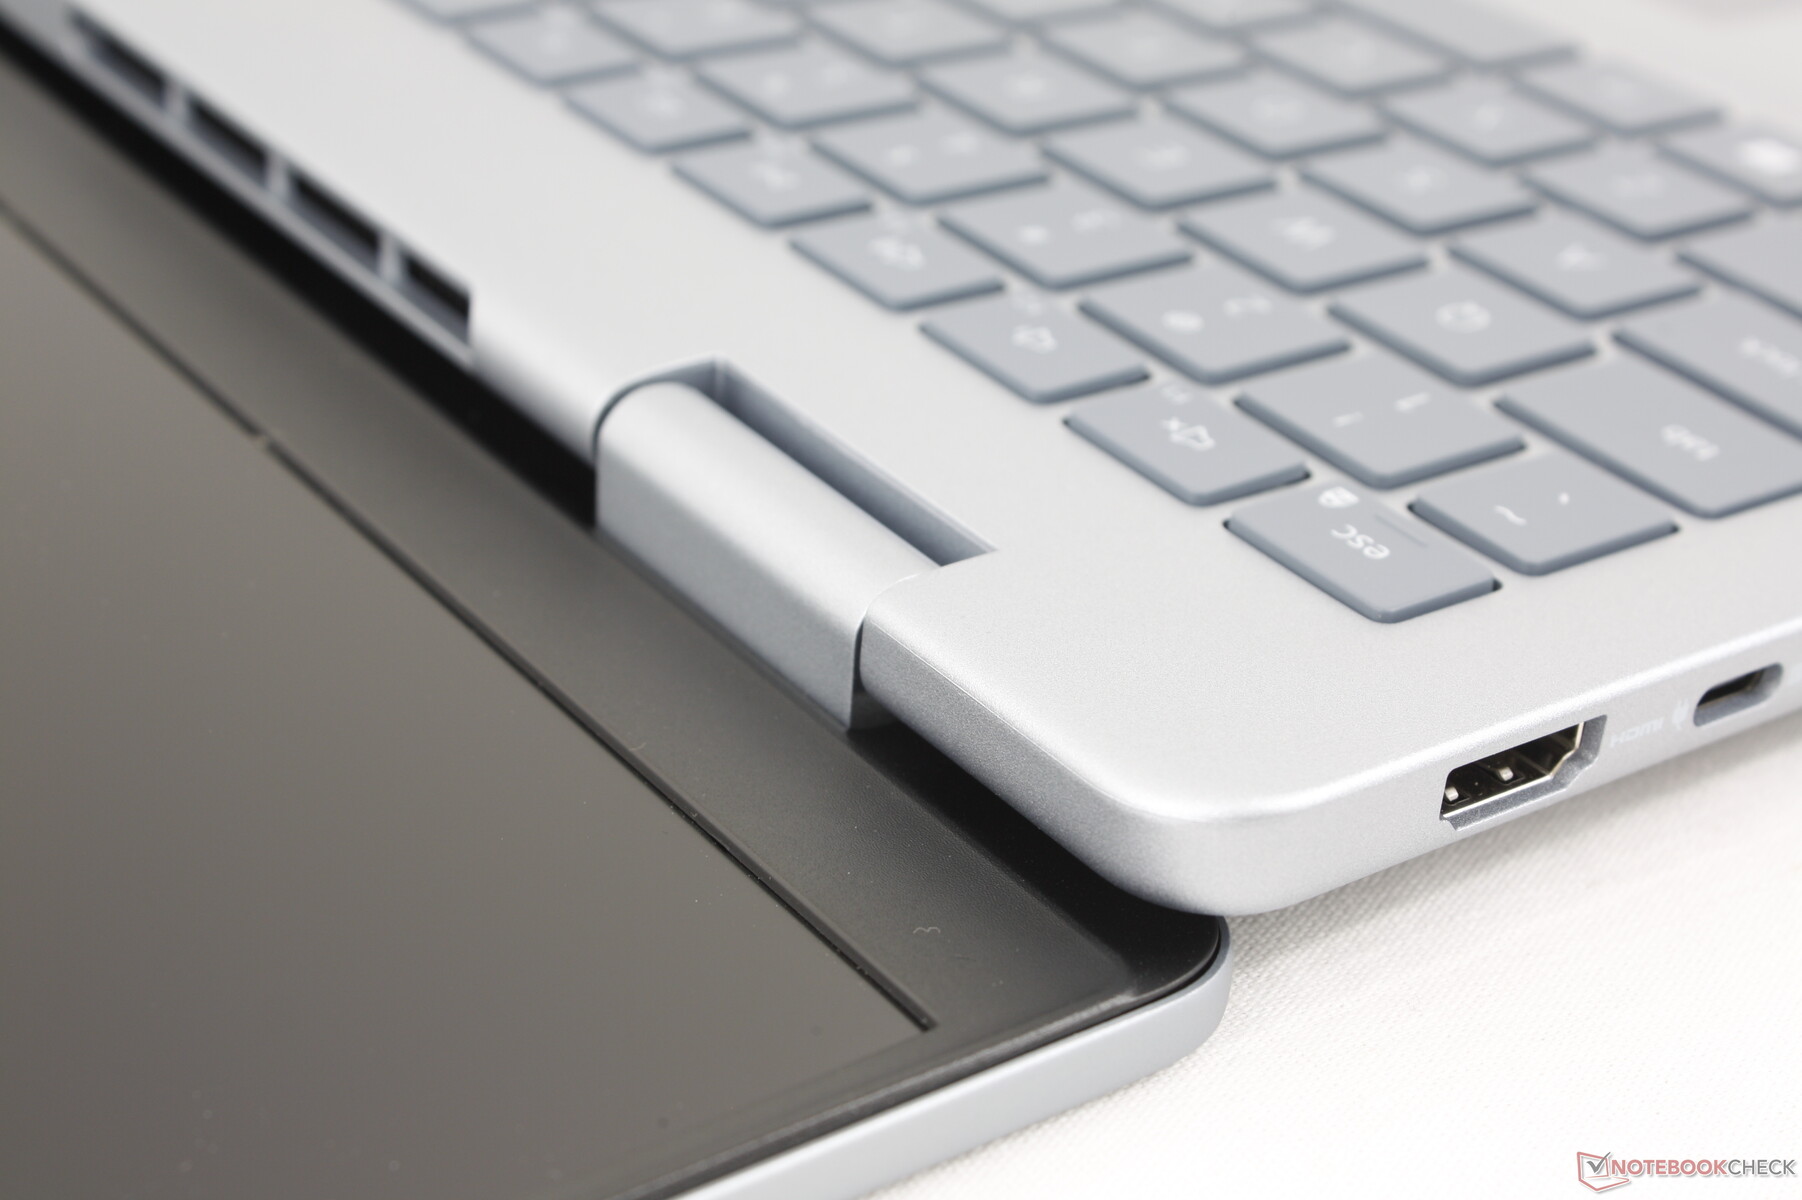
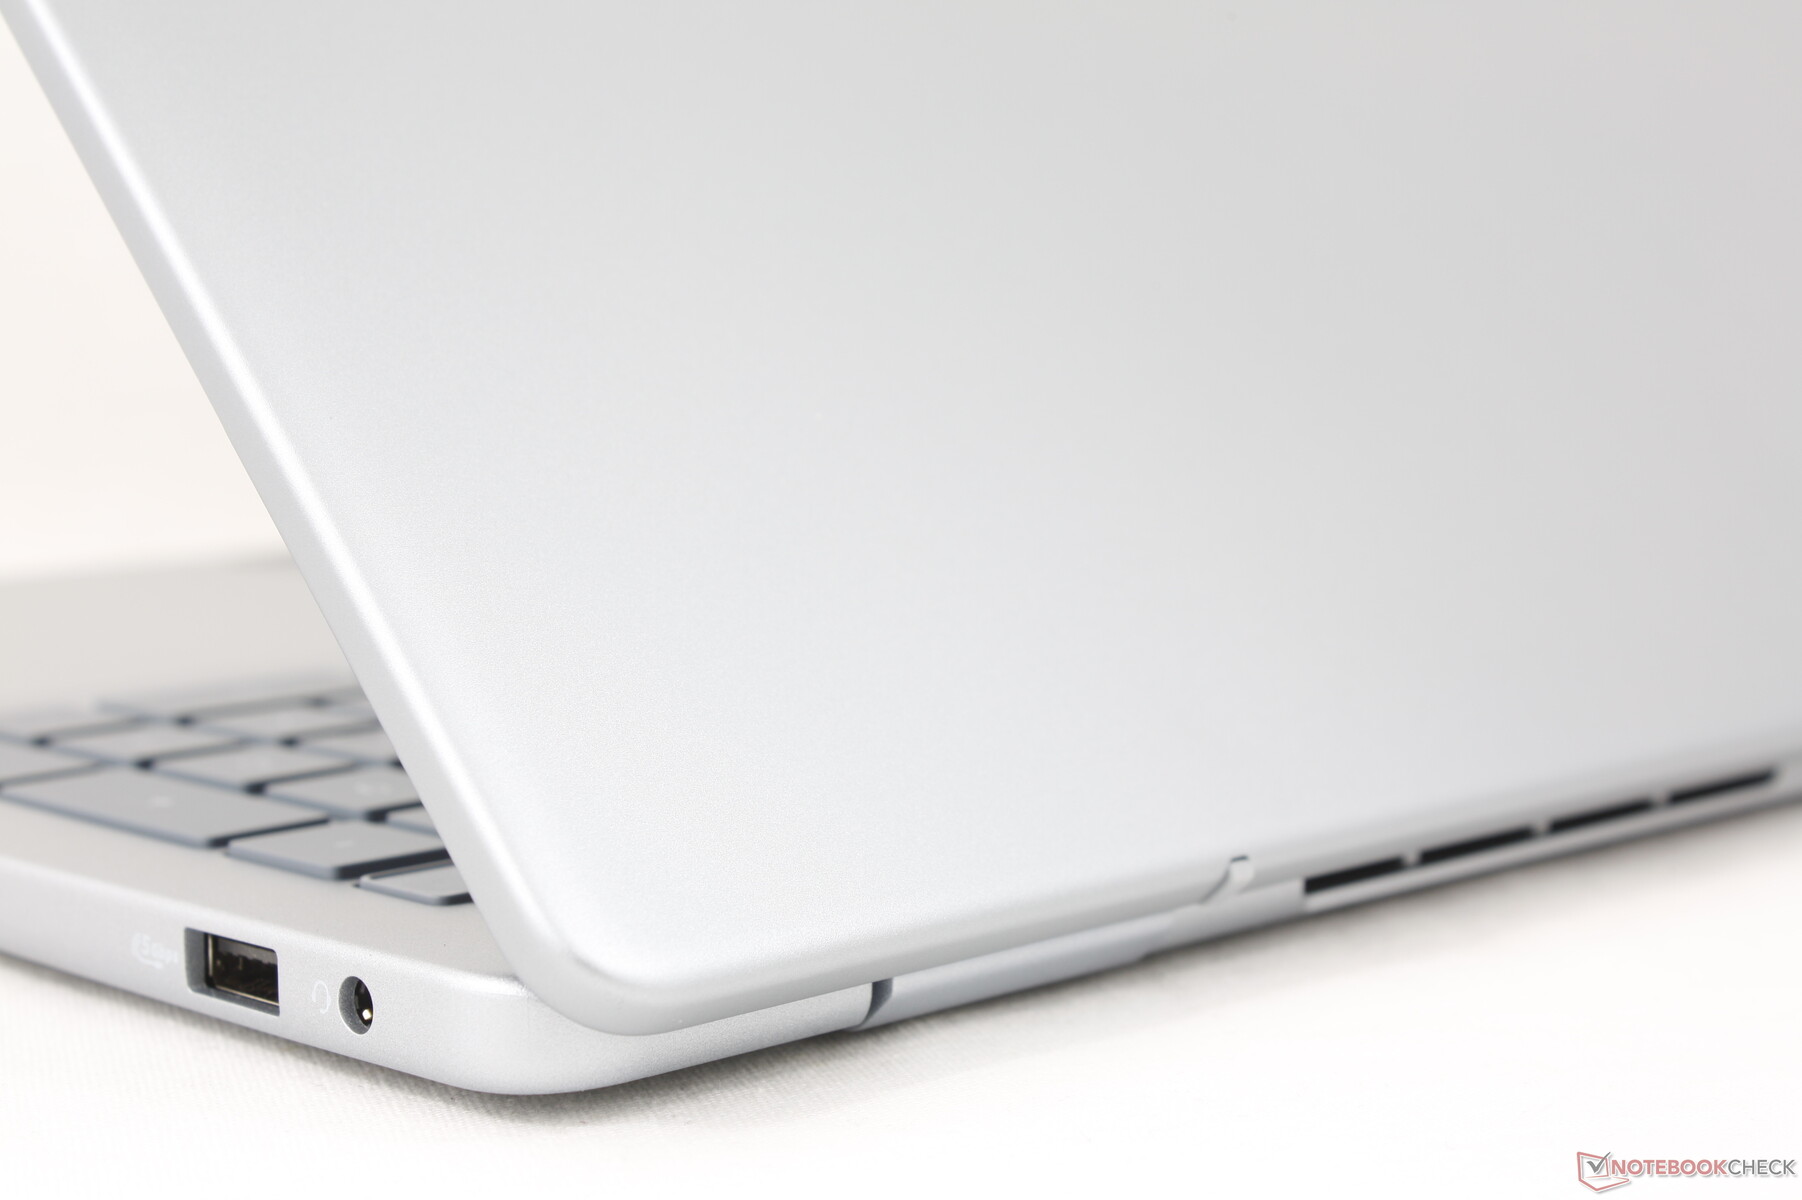
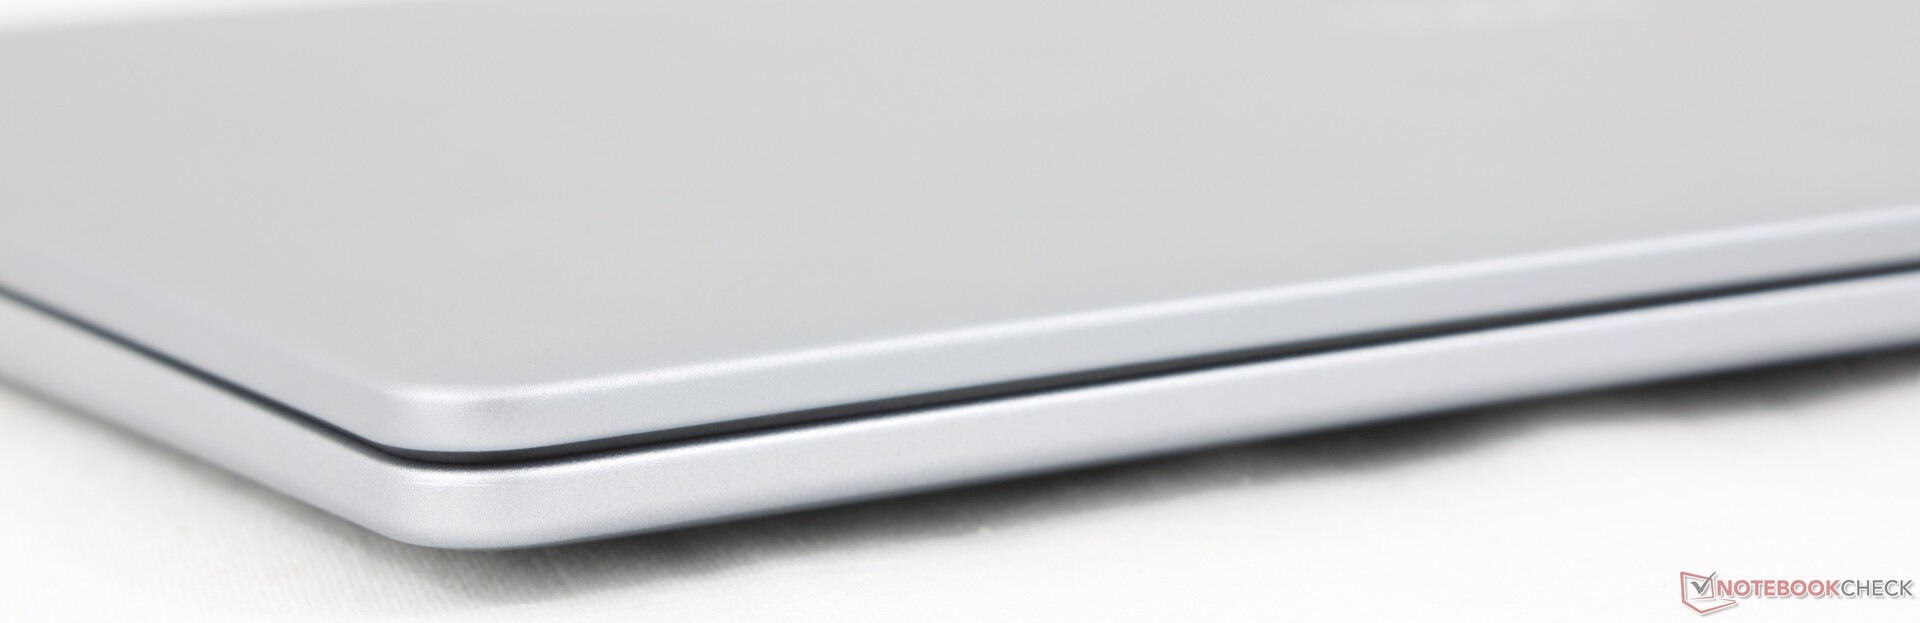
Il telaio liscio in argento opaco dovrebbe apparire e sembrare immediatamente familiare a chiunque abbia avuto esperienza con un modello Inspiron. I materiali e il design sono rimasti in gran parte gli stessi della generazione precedente, per una prima impressione simile. Lo chassis e il coperchio si piegano più facilmente rispetto alle alternative più costose, come il modello XPS 16 o Lenovo Yoga Pro 9 16ma per il resto è paragonabile all'HP Pavilion Plus 16 o all'Asus Vivobook 16.
Le dimensioni sono quasi 1:1 con l'uscente Inspiron 16 Plus 7640, se non leggermente più sottili. Invece, la differenza maggiore tra i due è il peso, in quanto il modello più recente è più leggero di circa 400 g, soprattutto grazie alla mancanza di opzioni di GPU discrete.
Connettività
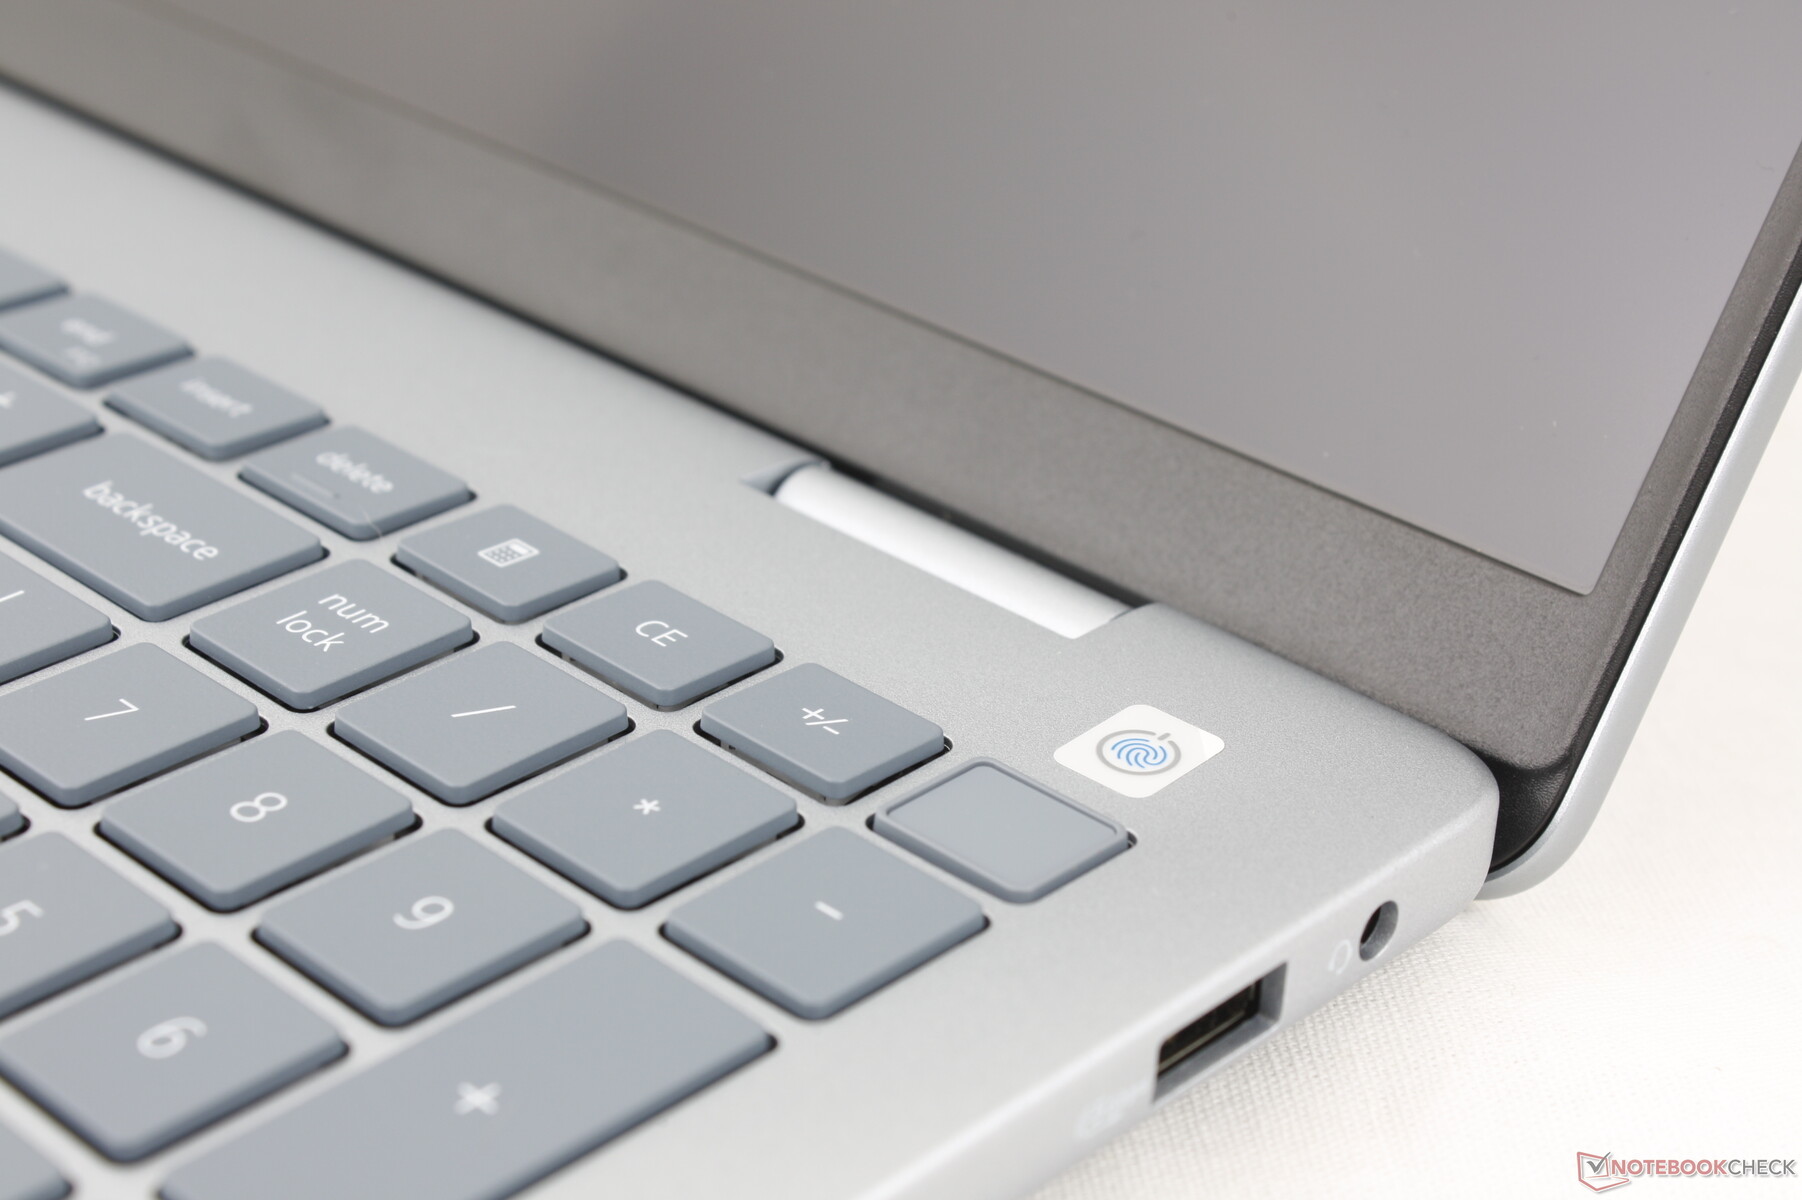
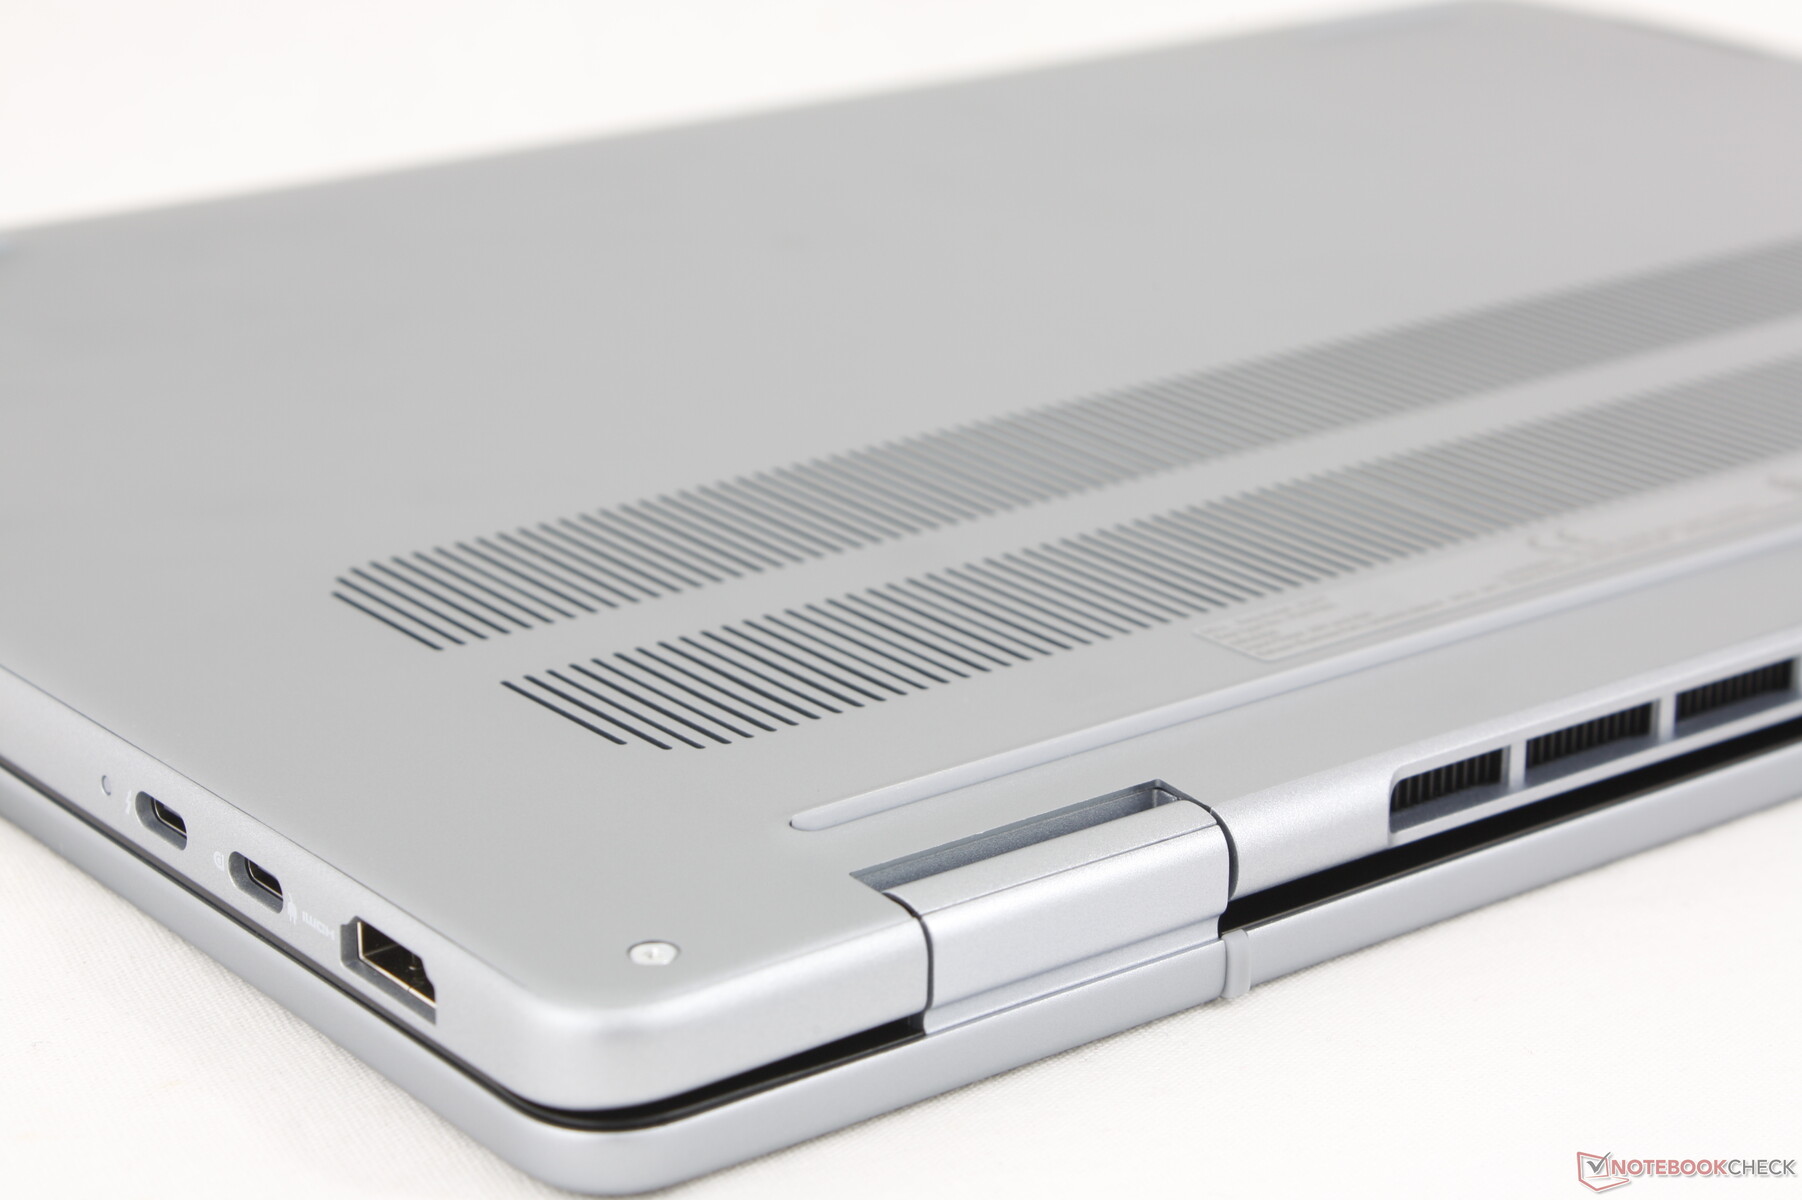
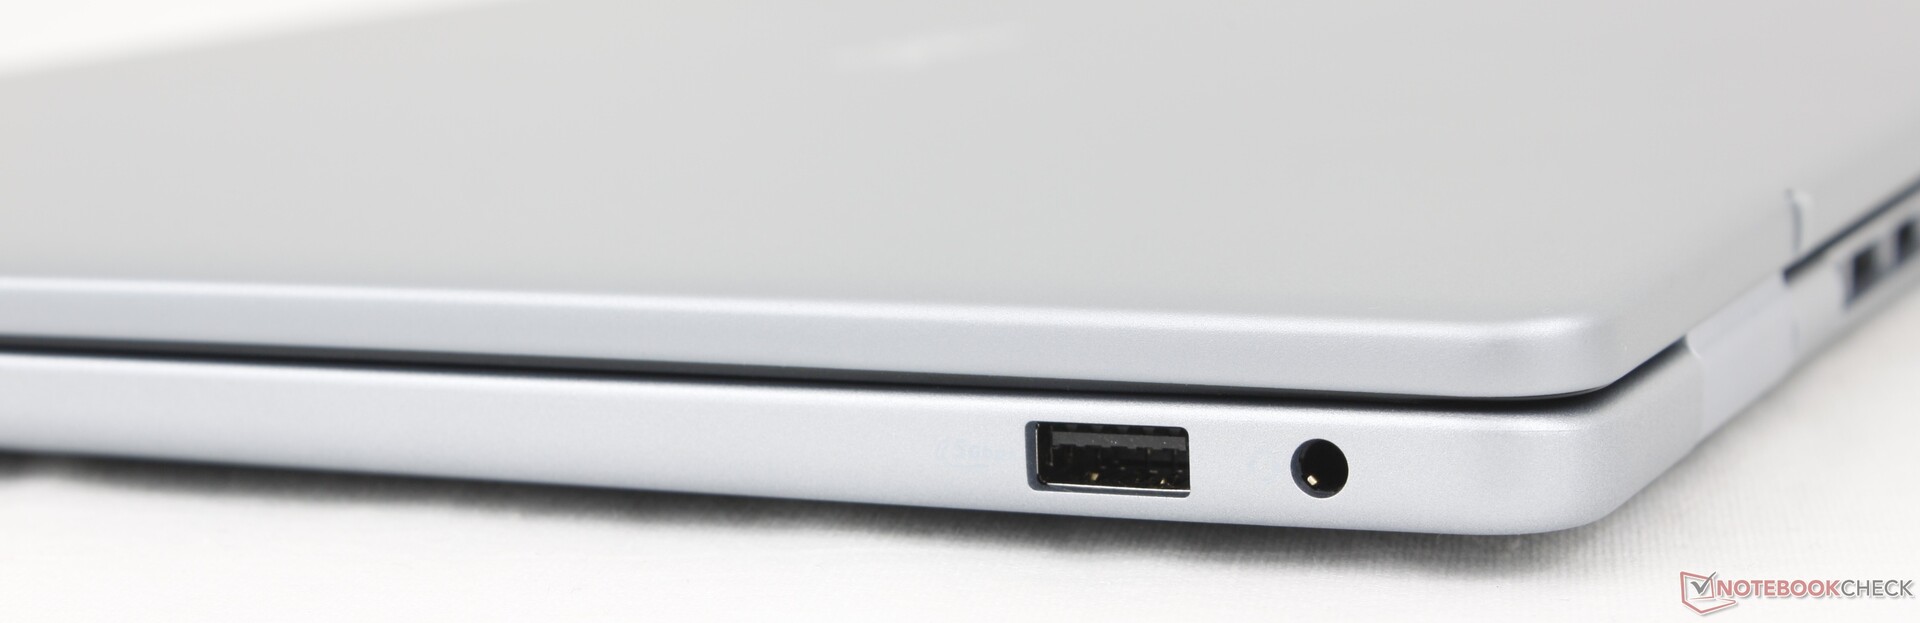
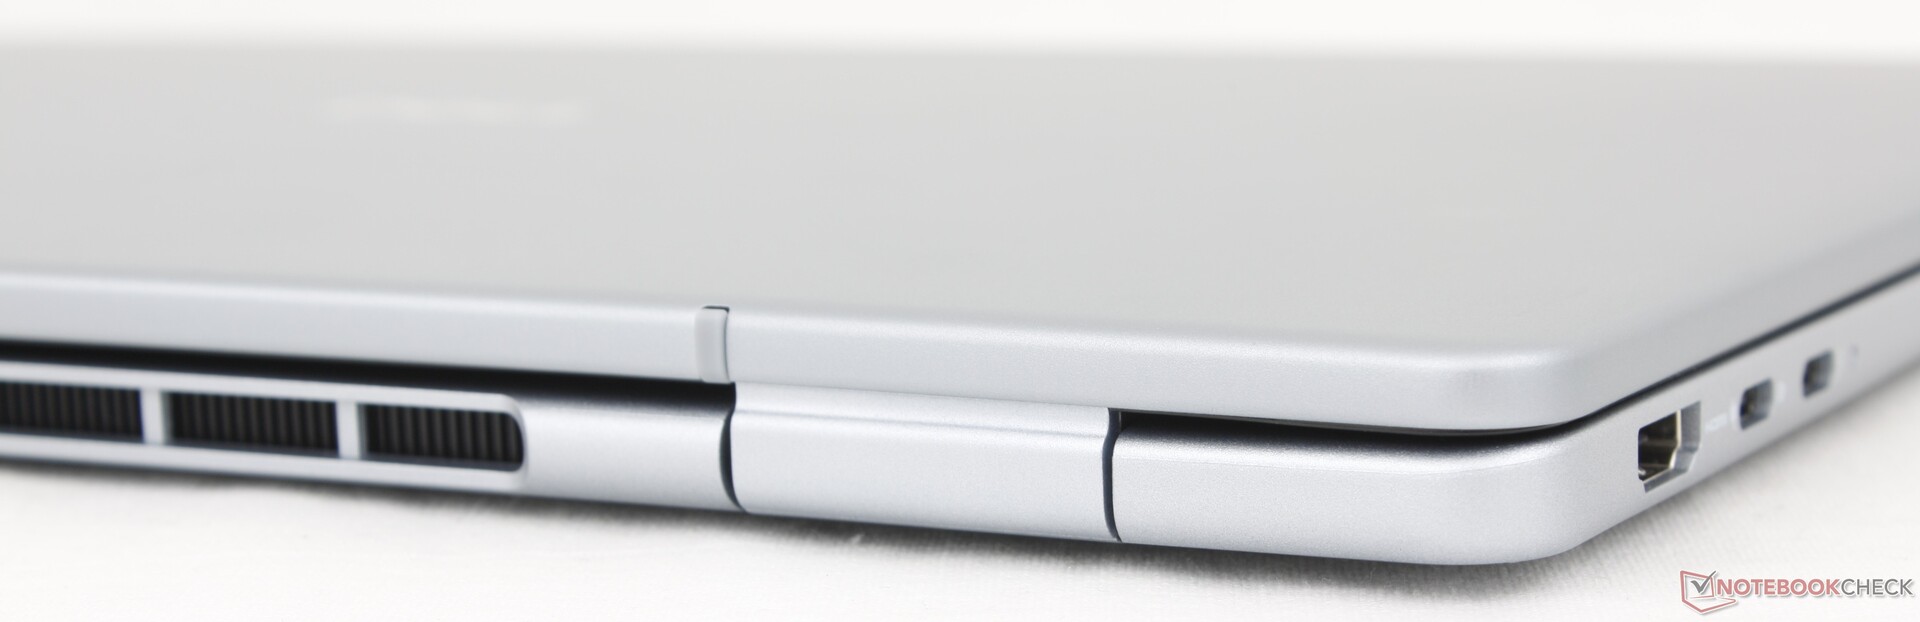
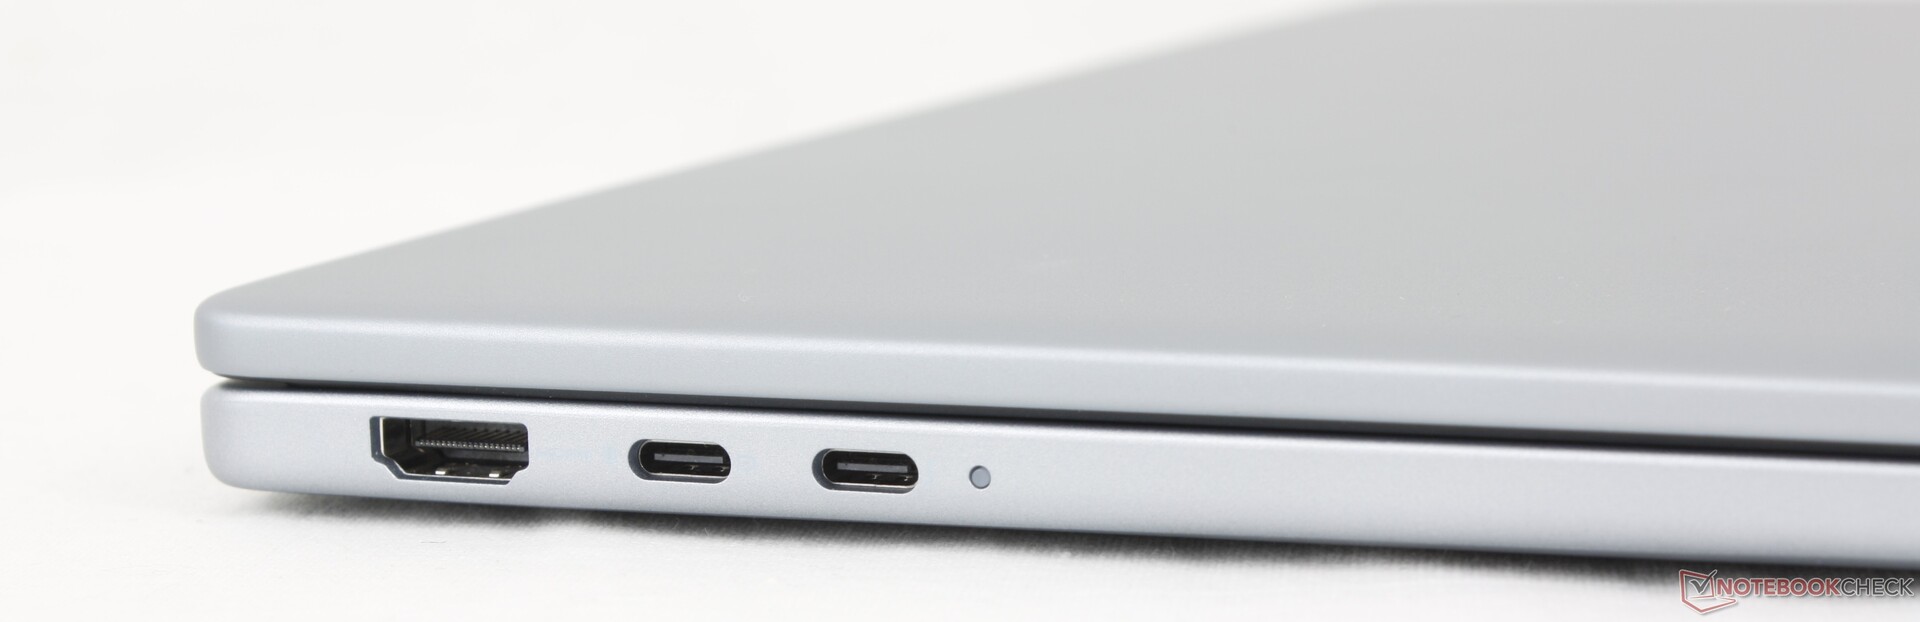
Ci sono meno porte rispetto a quelle disponibili sull'Inspiron 16 Plus 7640 o 7640 2-in-1 dello scorso anno. Il Dell 16 Plus ha abbandonato il lettore di schede SD e una delle porte USB-A a favore di una seconda porta USB-C. Notare che solo una delle due porte USB-C è compatibile con Thunderbolt 4 e DisplayPort 2.1.
Comunicazione
L'Intel BE201 è dotato di connettività Wi-Fi 7 e Bluetooth 5.4 di serie.
| Networking | |
| iperf3 transmit AXE11000 | |
| Lenovo ThinkBook 16 G7+ AMD | |
| HP Pavilion Plus 16-ab0456tx | |
| Dell 16 Plus | |
| Asus Vivobook 16 M1606K | |
| Dell Inspiron 16 Plus 7640 | |
| iperf3 receive AXE11000 | |
| Lenovo ThinkBook 16 G7+ AMD | |
| HP Pavilion Plus 16-ab0456tx | |
| Dell 16 Plus | |
| Dell Inspiron 16 Plus 7640 | |
| Asus Vivobook 16 M1606K | |
| iperf3 transmit AXE11000 6GHz | |
| HP Pavilion Plus 16-ab0456tx | |
| Dell 16 Plus | |
| Acer Swift 16 AI SF16-51T-932H, Ultra 9 288V | |
| Dell Inspiron 16 Plus 7640 | |
| iperf3 receive AXE11000 6GHz | |
| Acer Swift 16 AI SF16-51T-932H, Ultra 9 288V | |
| HP Pavilion Plus 16-ab0456tx | |
| Dell 16 Plus | |
| Dell Inspiron 16 Plus 7640 | |
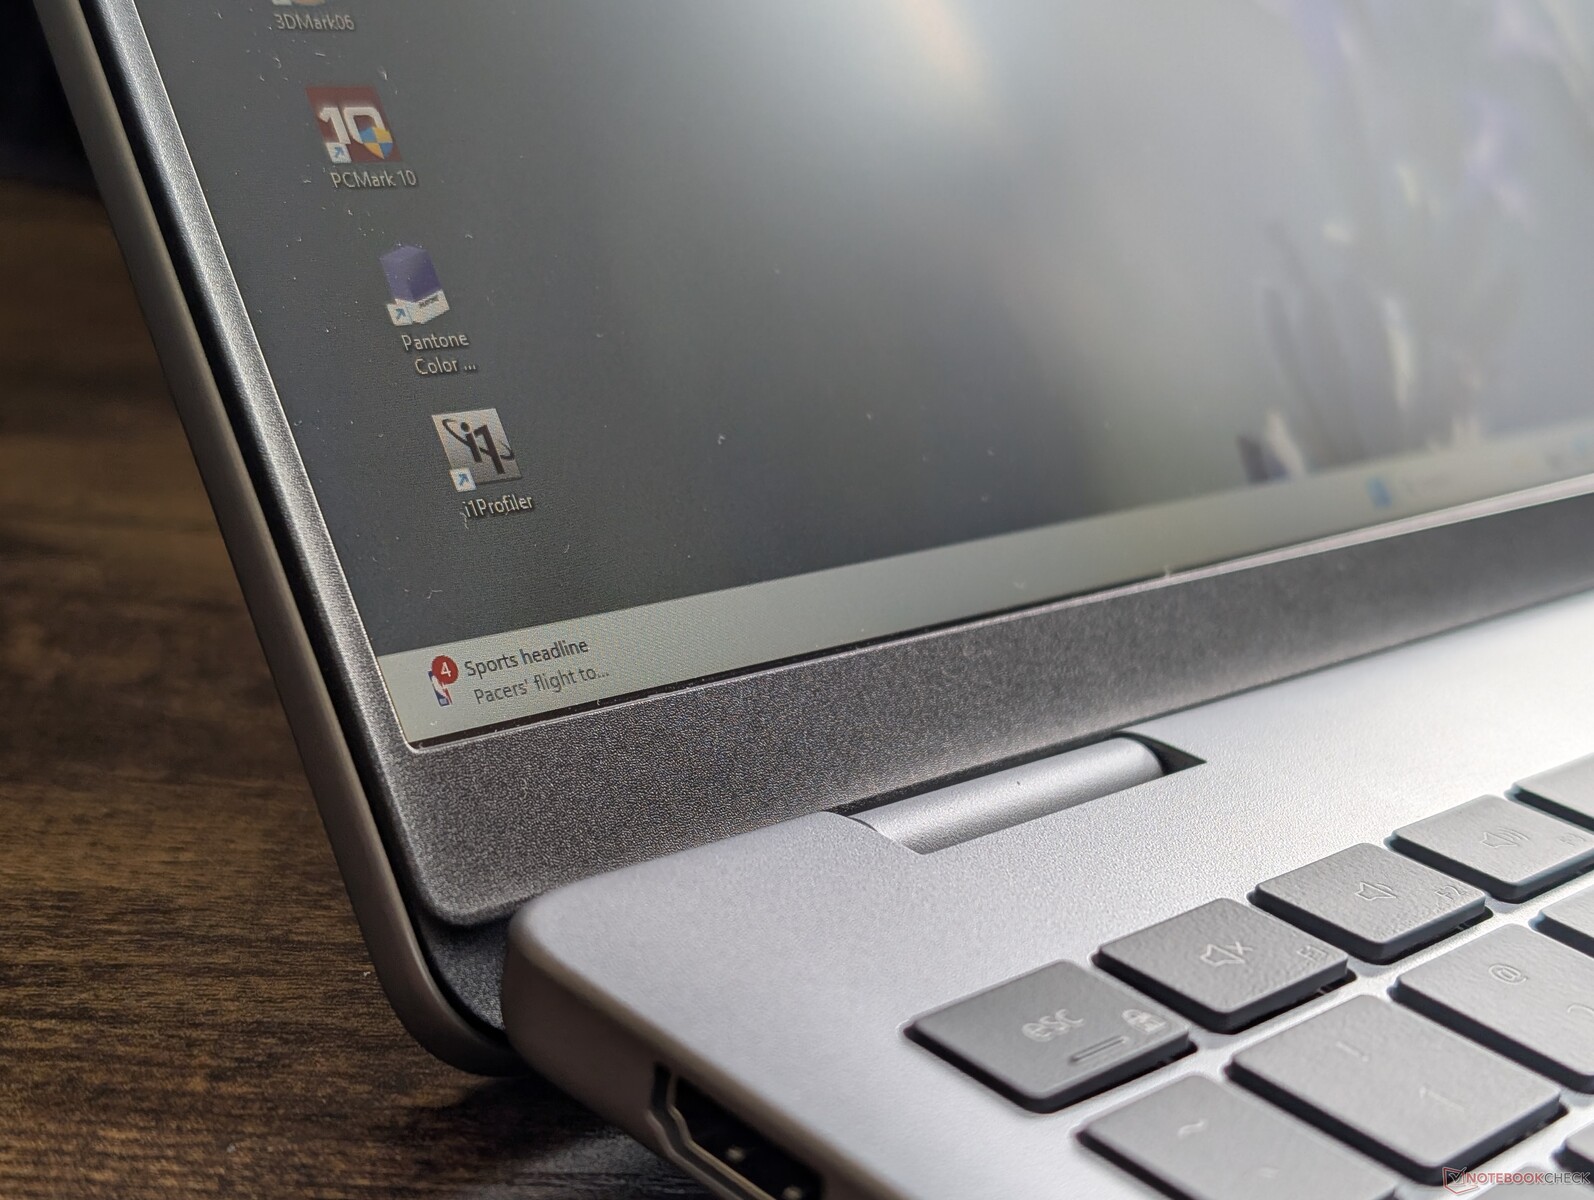
Webcam
La webcam da 2 MP è di serie, con otturatore IR e privacy fisica.


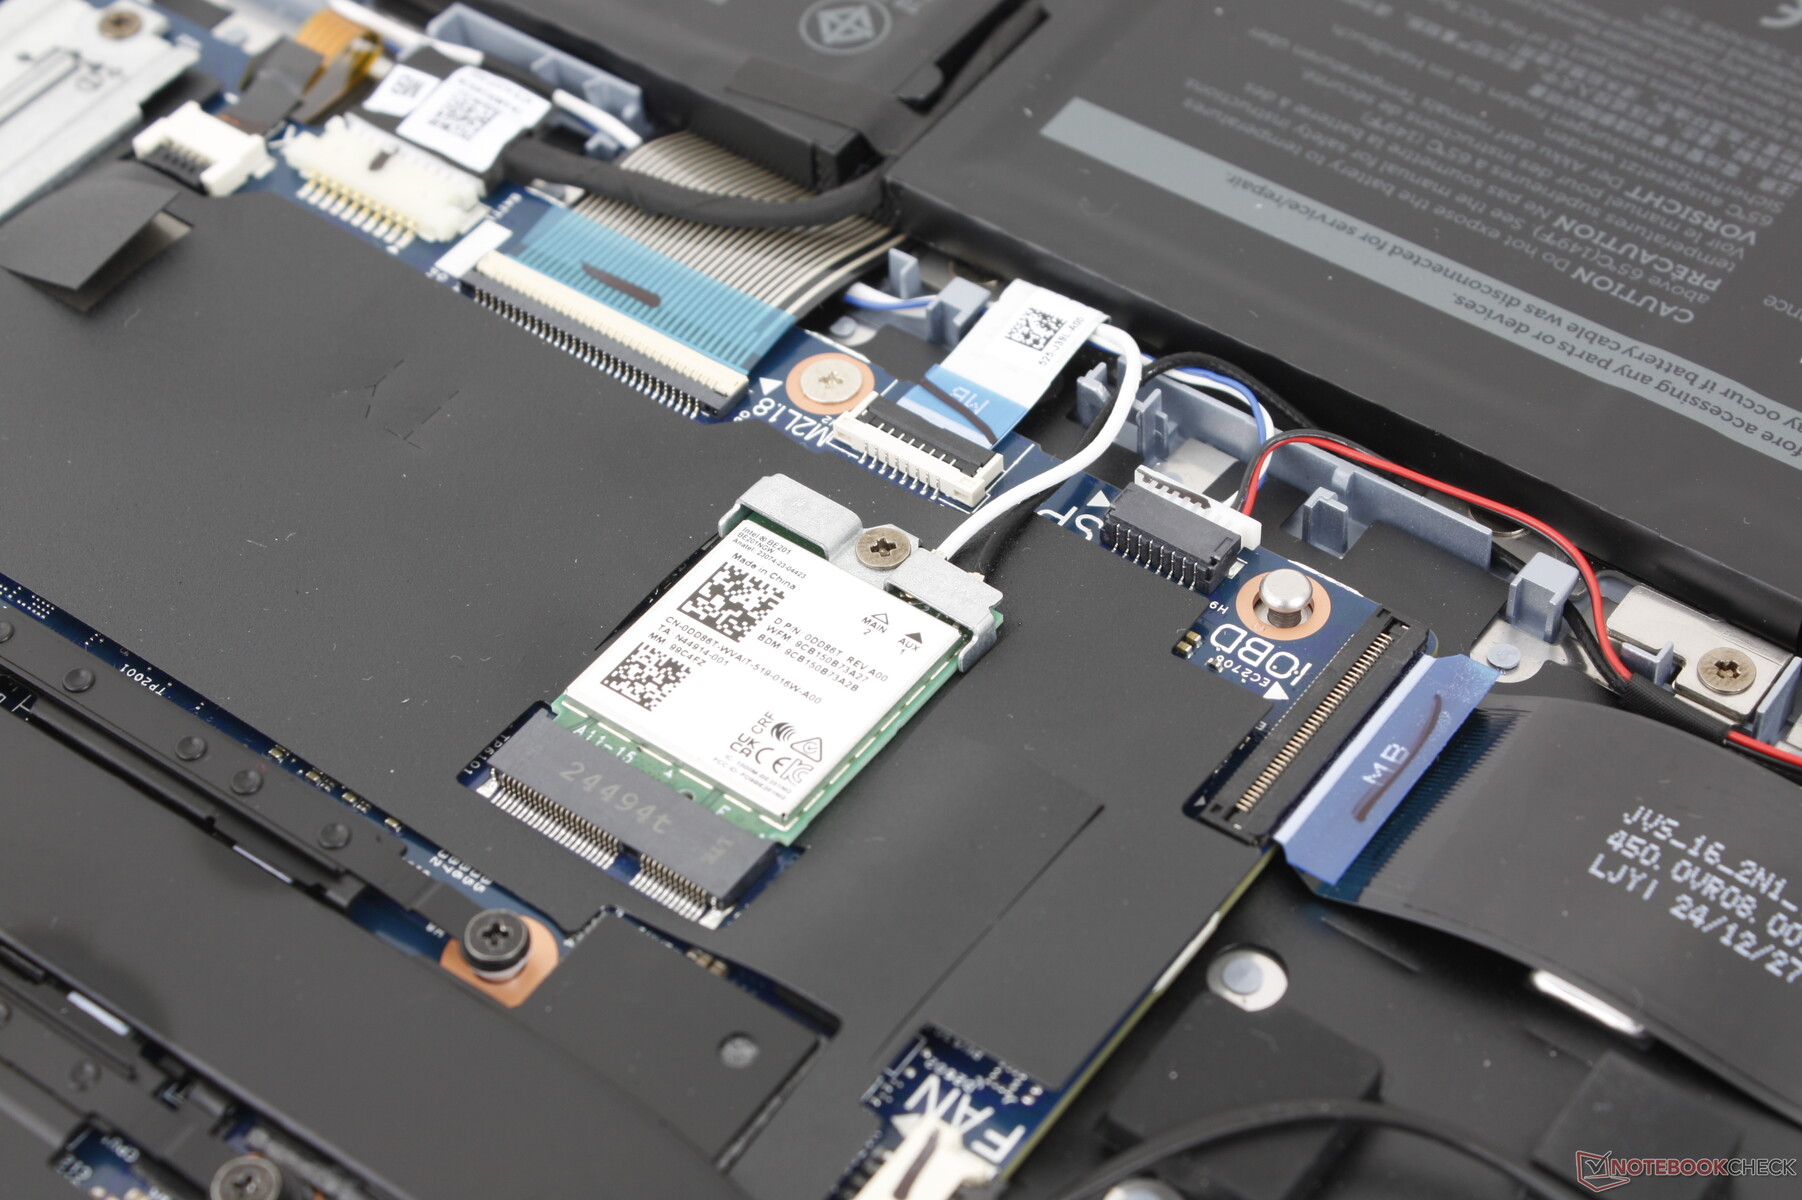
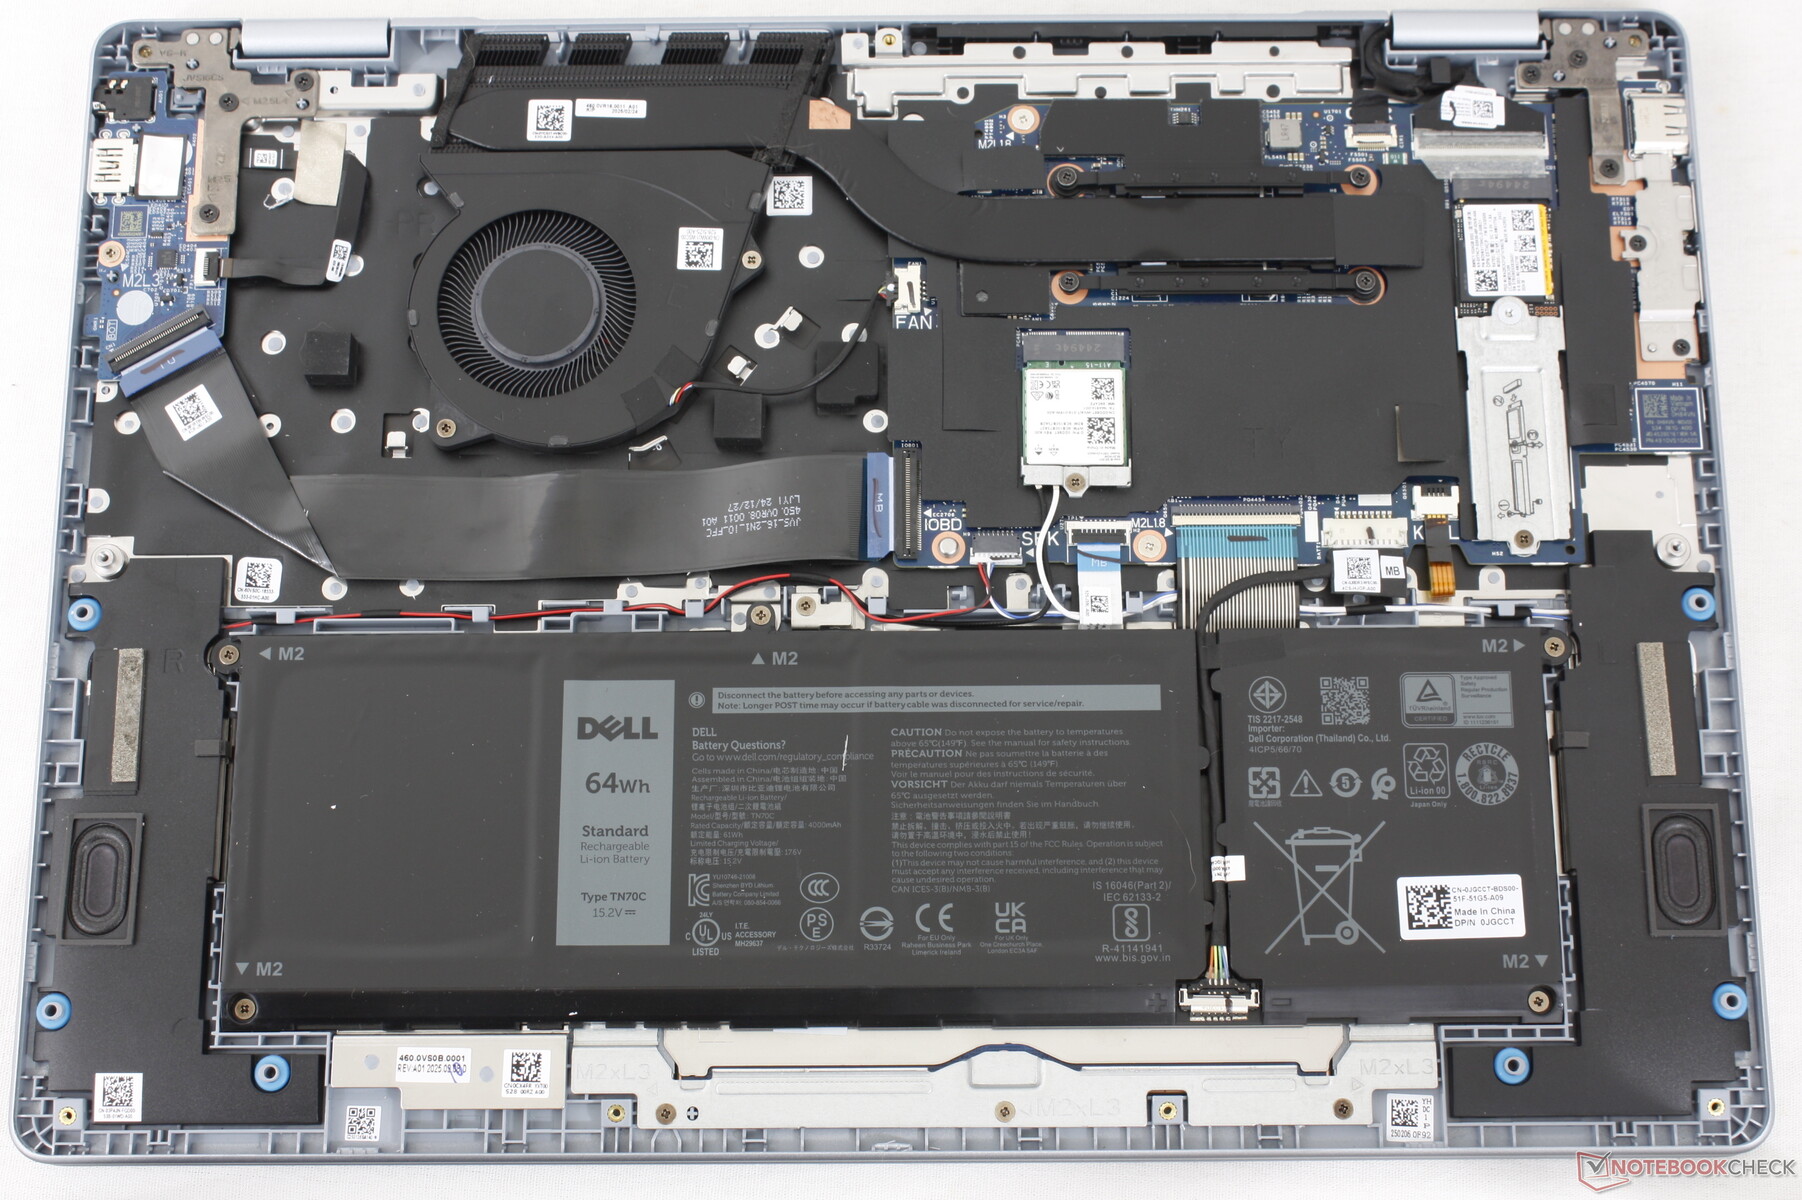
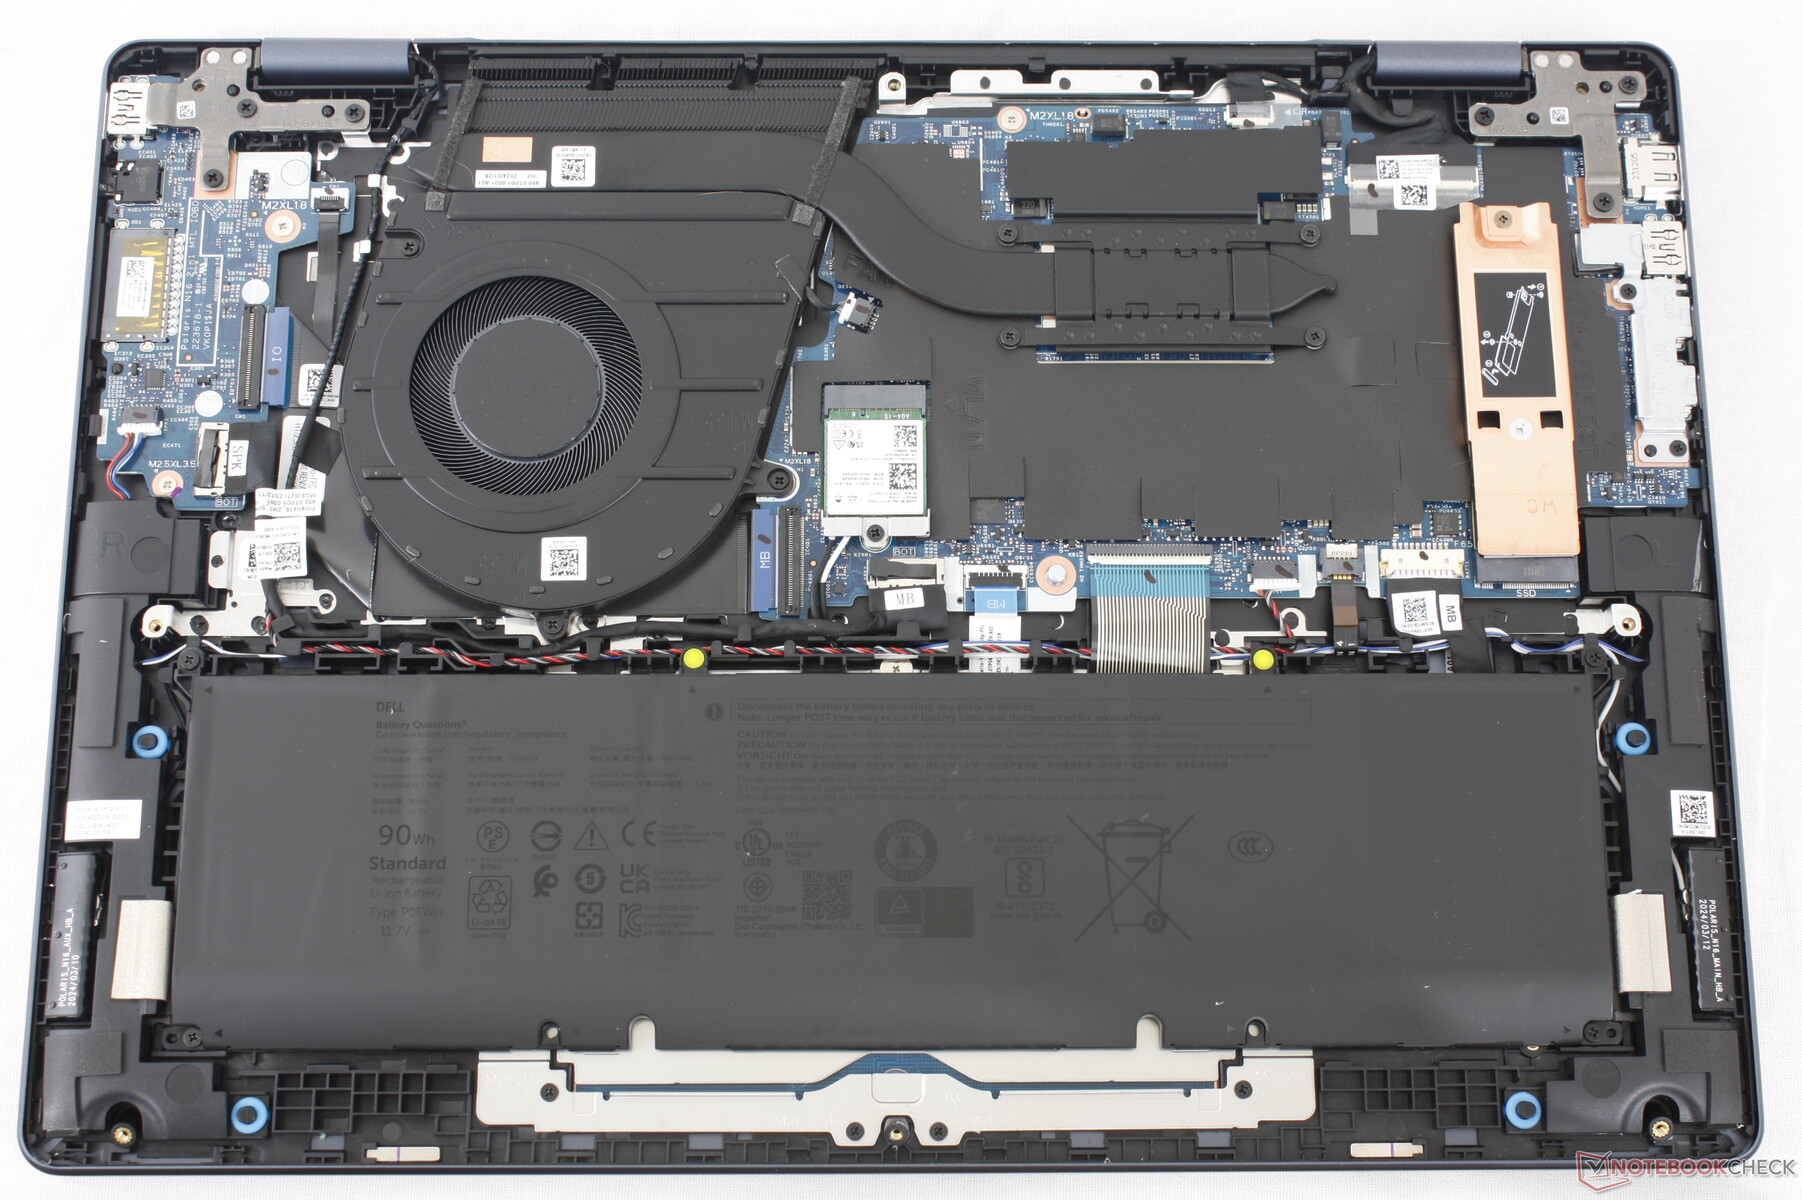
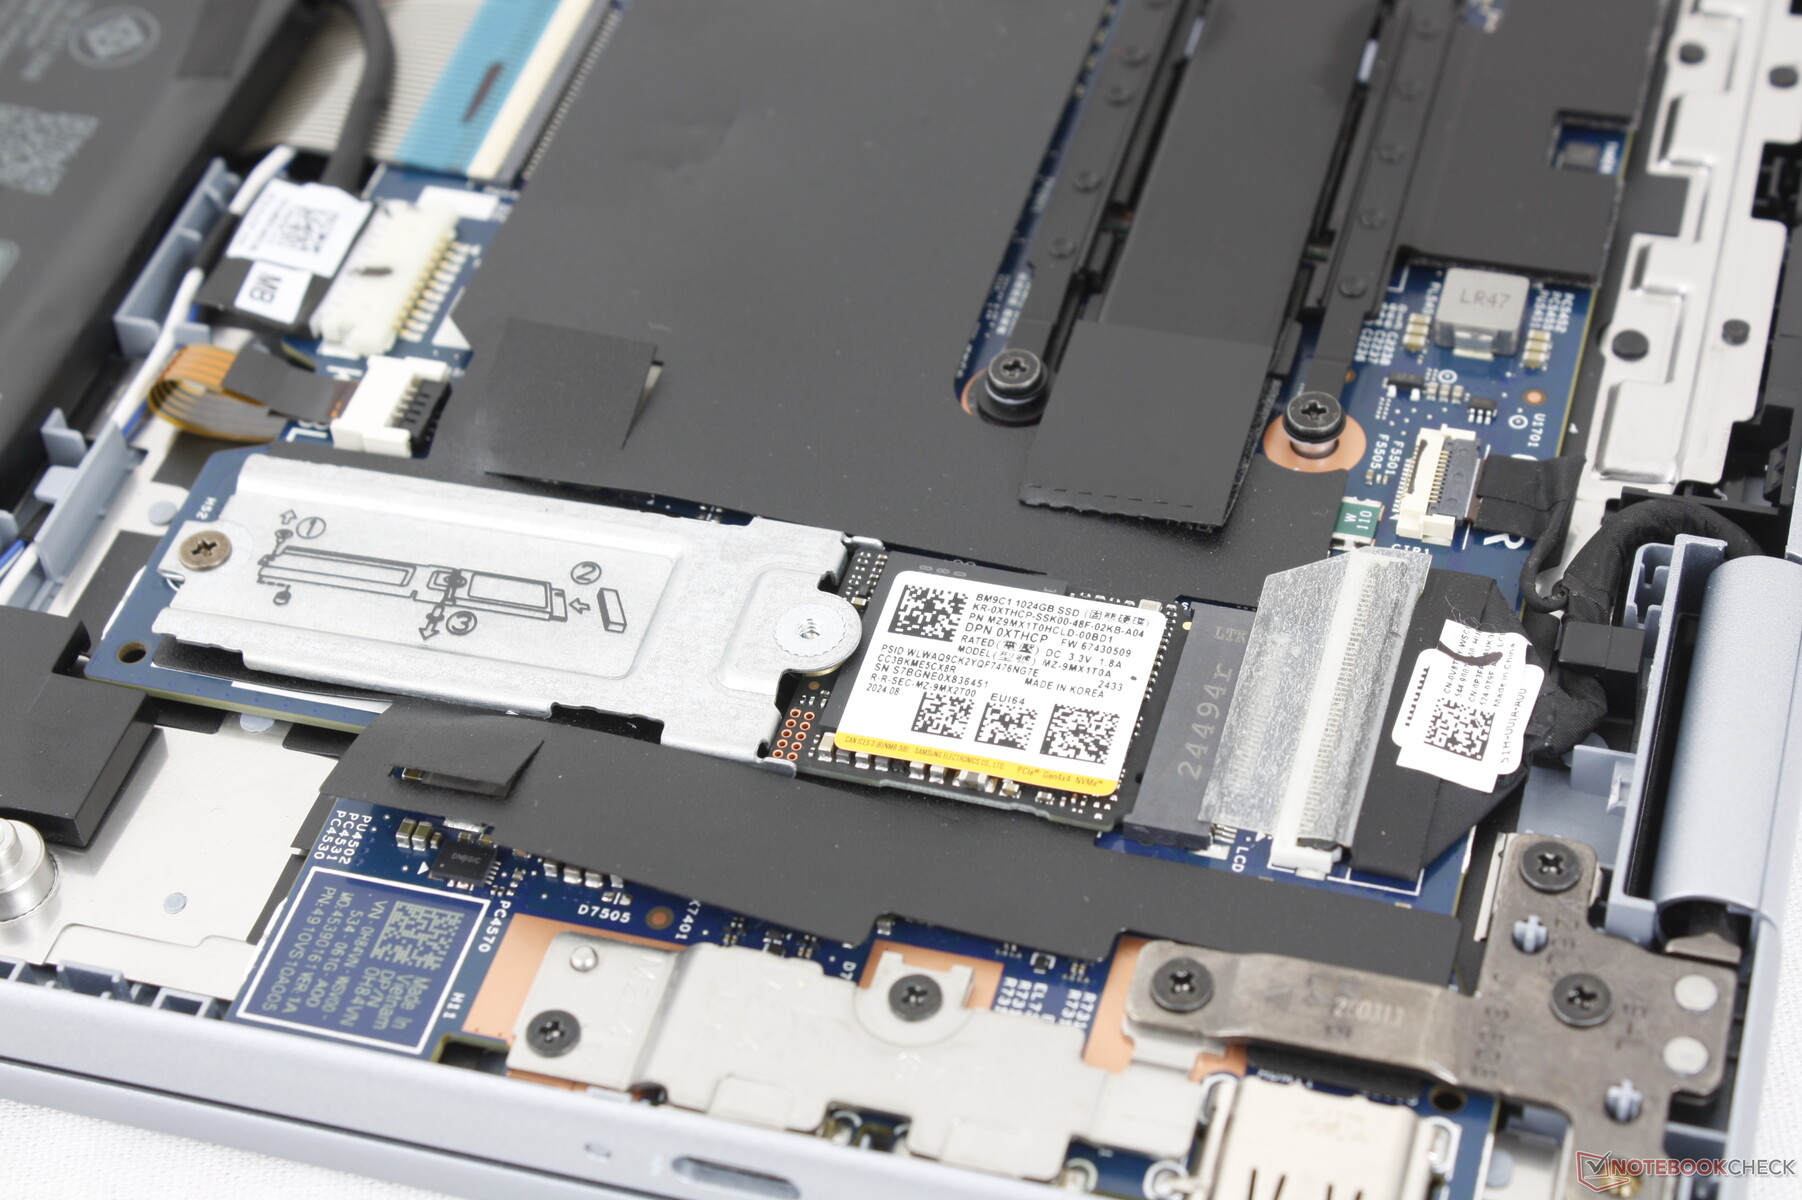
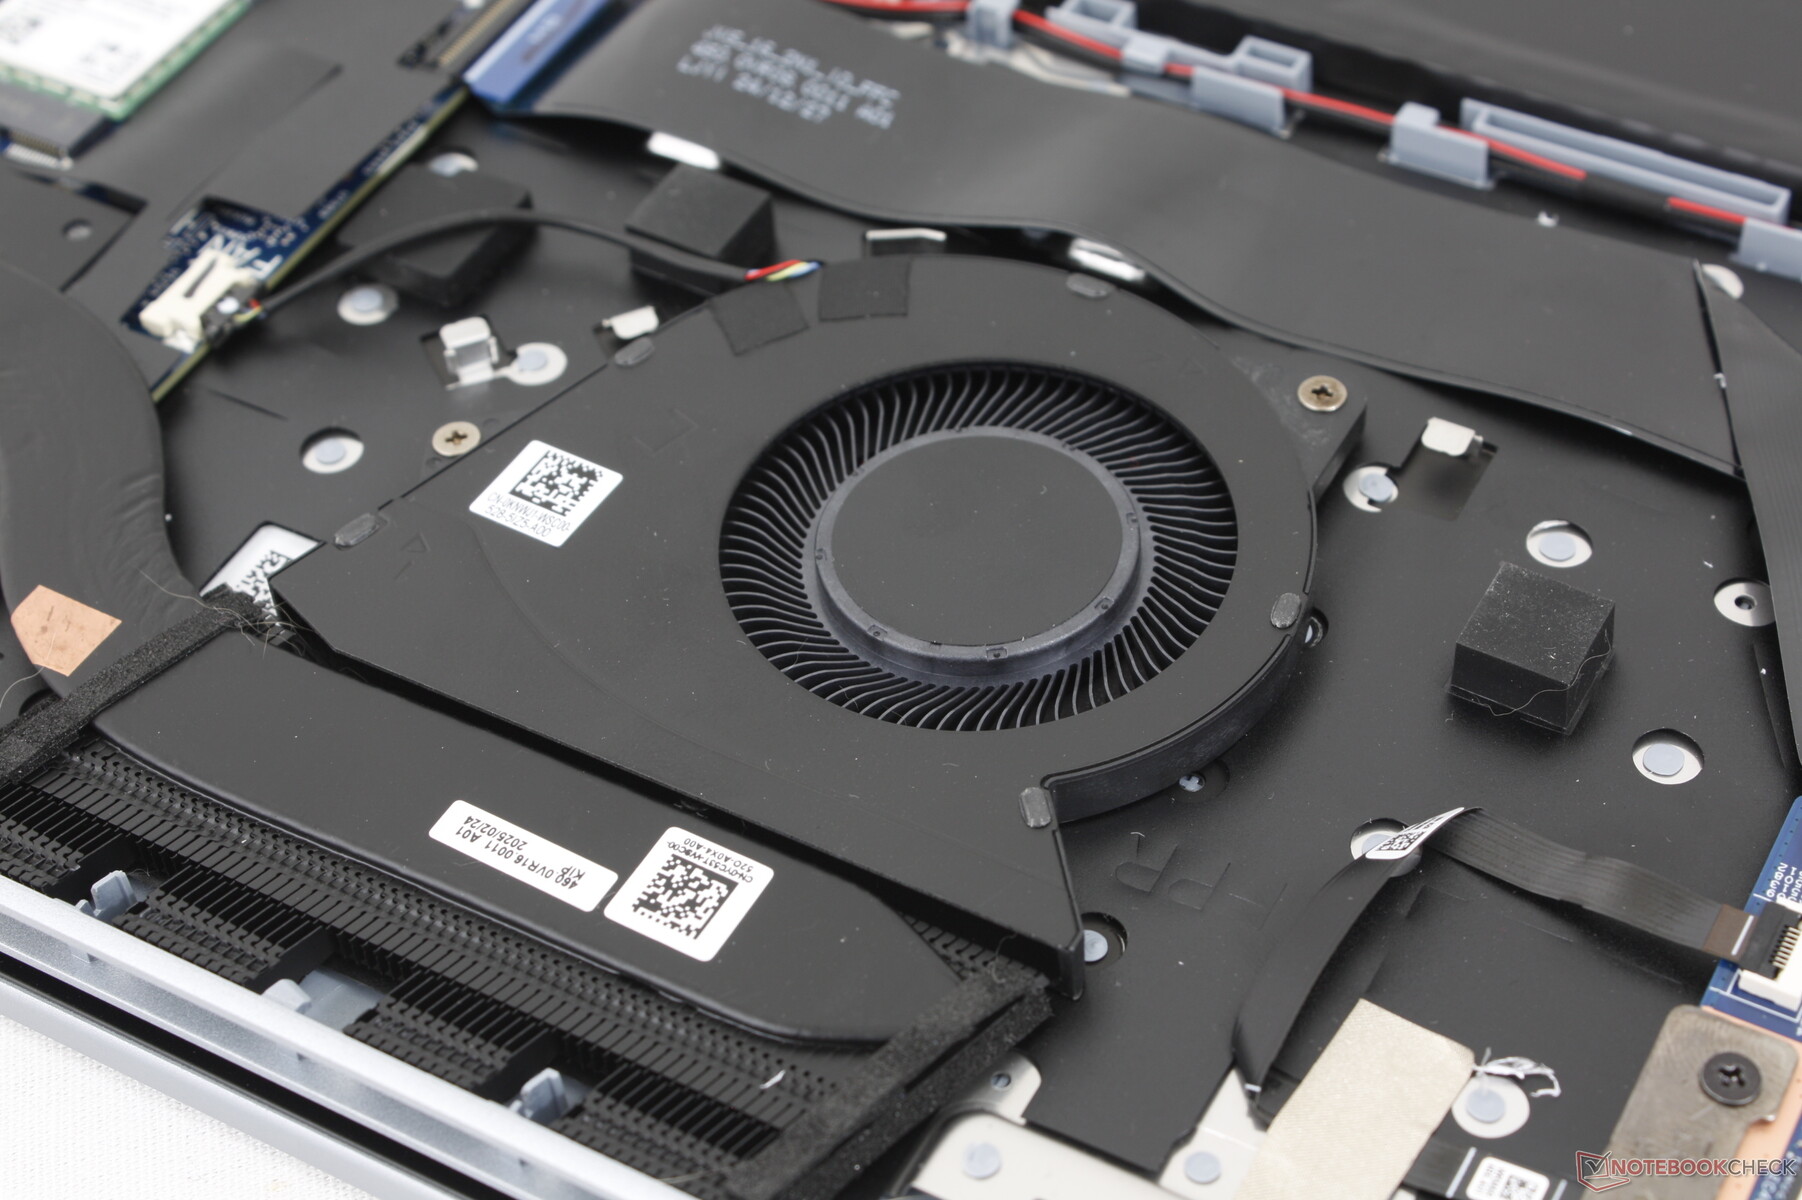
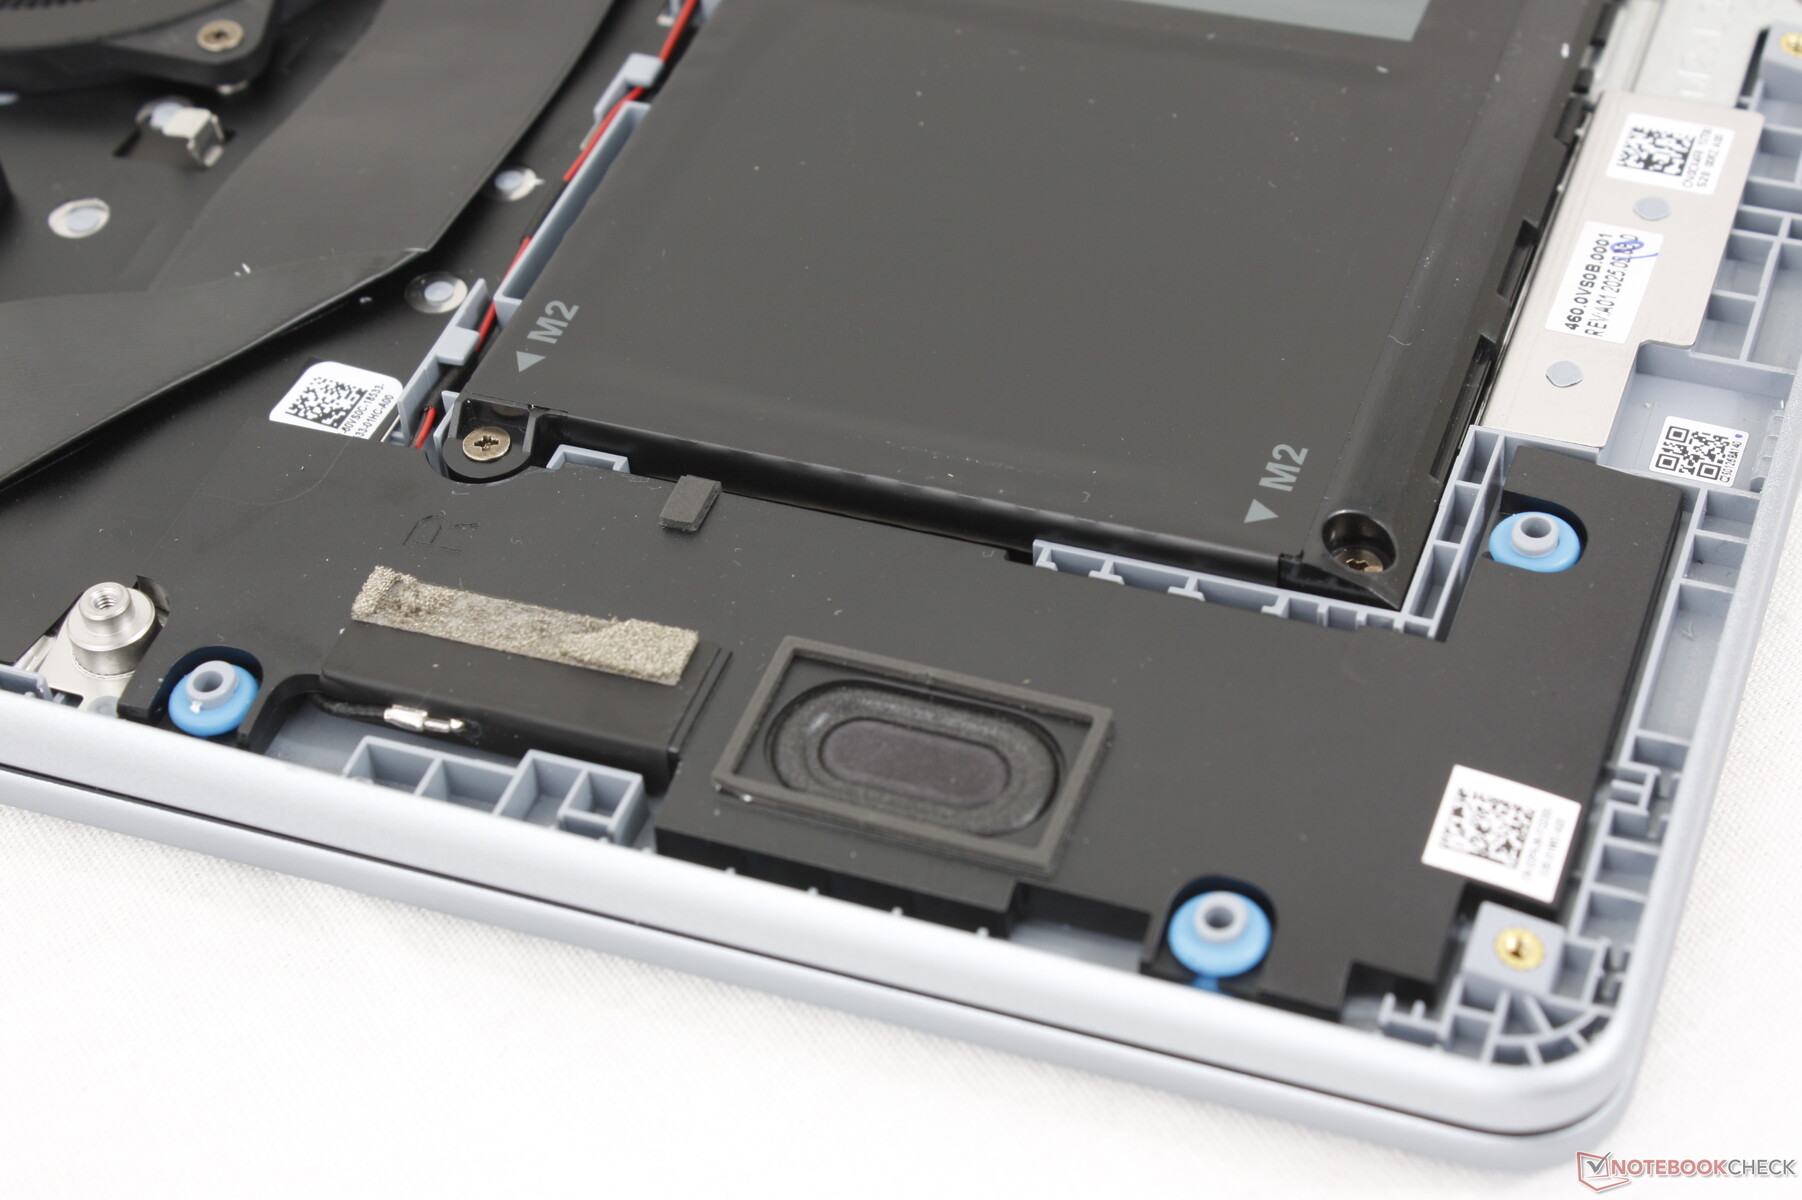
Manutenzione
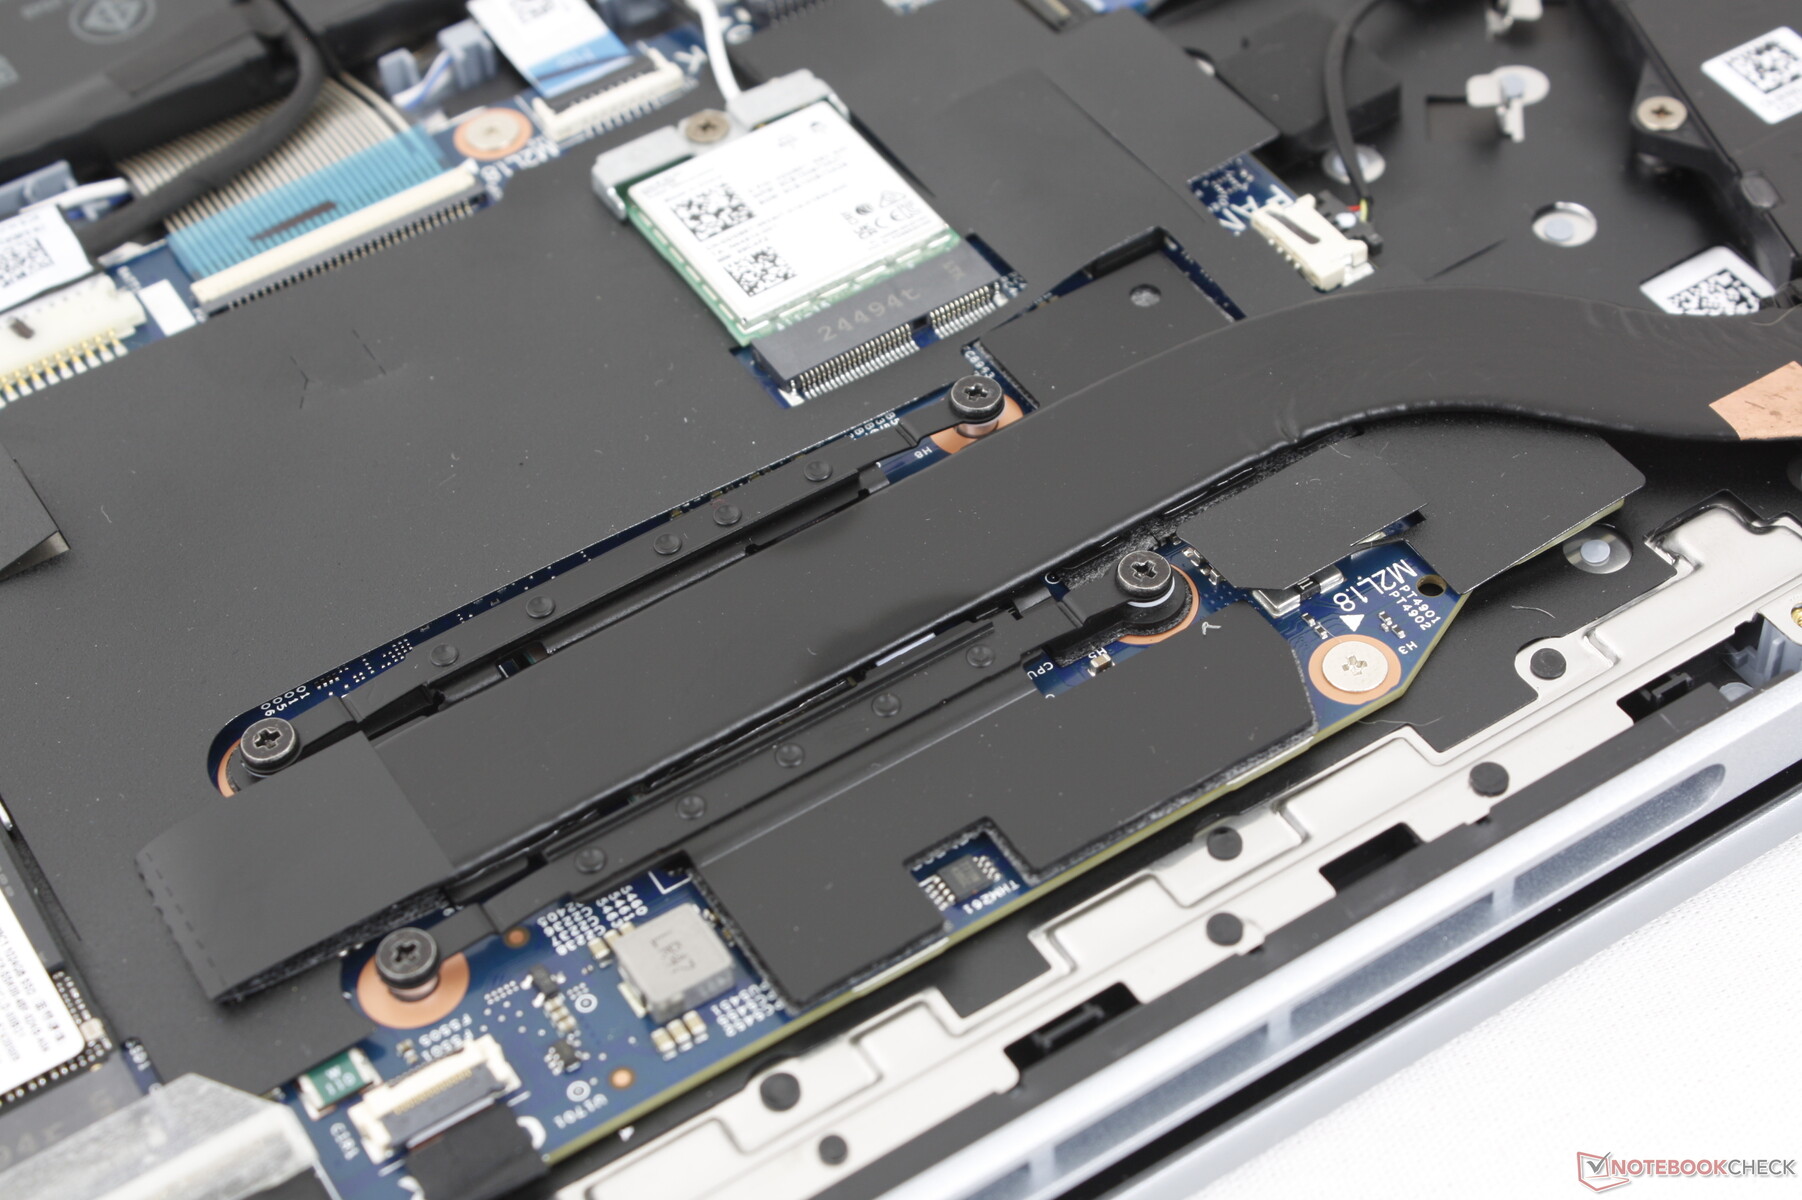
La parte inferiore è fissata da 8 viti Phillips per una manutenzione semplice. Tuttavia, si raccomanda di prestare attenzione e di usare una lama affilata, poiché i bordi del pannello sono agganciati alla base in modo più stretto rispetto alla maggior parte degli altri computer portatili. Una volta all'interno, gli utenti sono accolti senza moduli SODIMM rimovibili e con un solo slot M.2 2280 per l'archiviazione.
Il Dell 16 Plus condivide molte caratteristiche interne con l'Inspiron 16 Plus 7640 2-in-1, come mostrano le foto di confronto qui sotto.
Sostenibilità
Il modello utilizza alluminio riciclato, acciaio e plastica oceanica durante la produzione, mentre l'imballaggio è completamente riciclabile.
Accessori e garanzia
La confezione non contiene altri extra oltre all'adattatore CA e alla documentazione cartacea. Si applica la consueta garanzia limitata di un anno del produttore, se acquistata negli Stati Uniti.
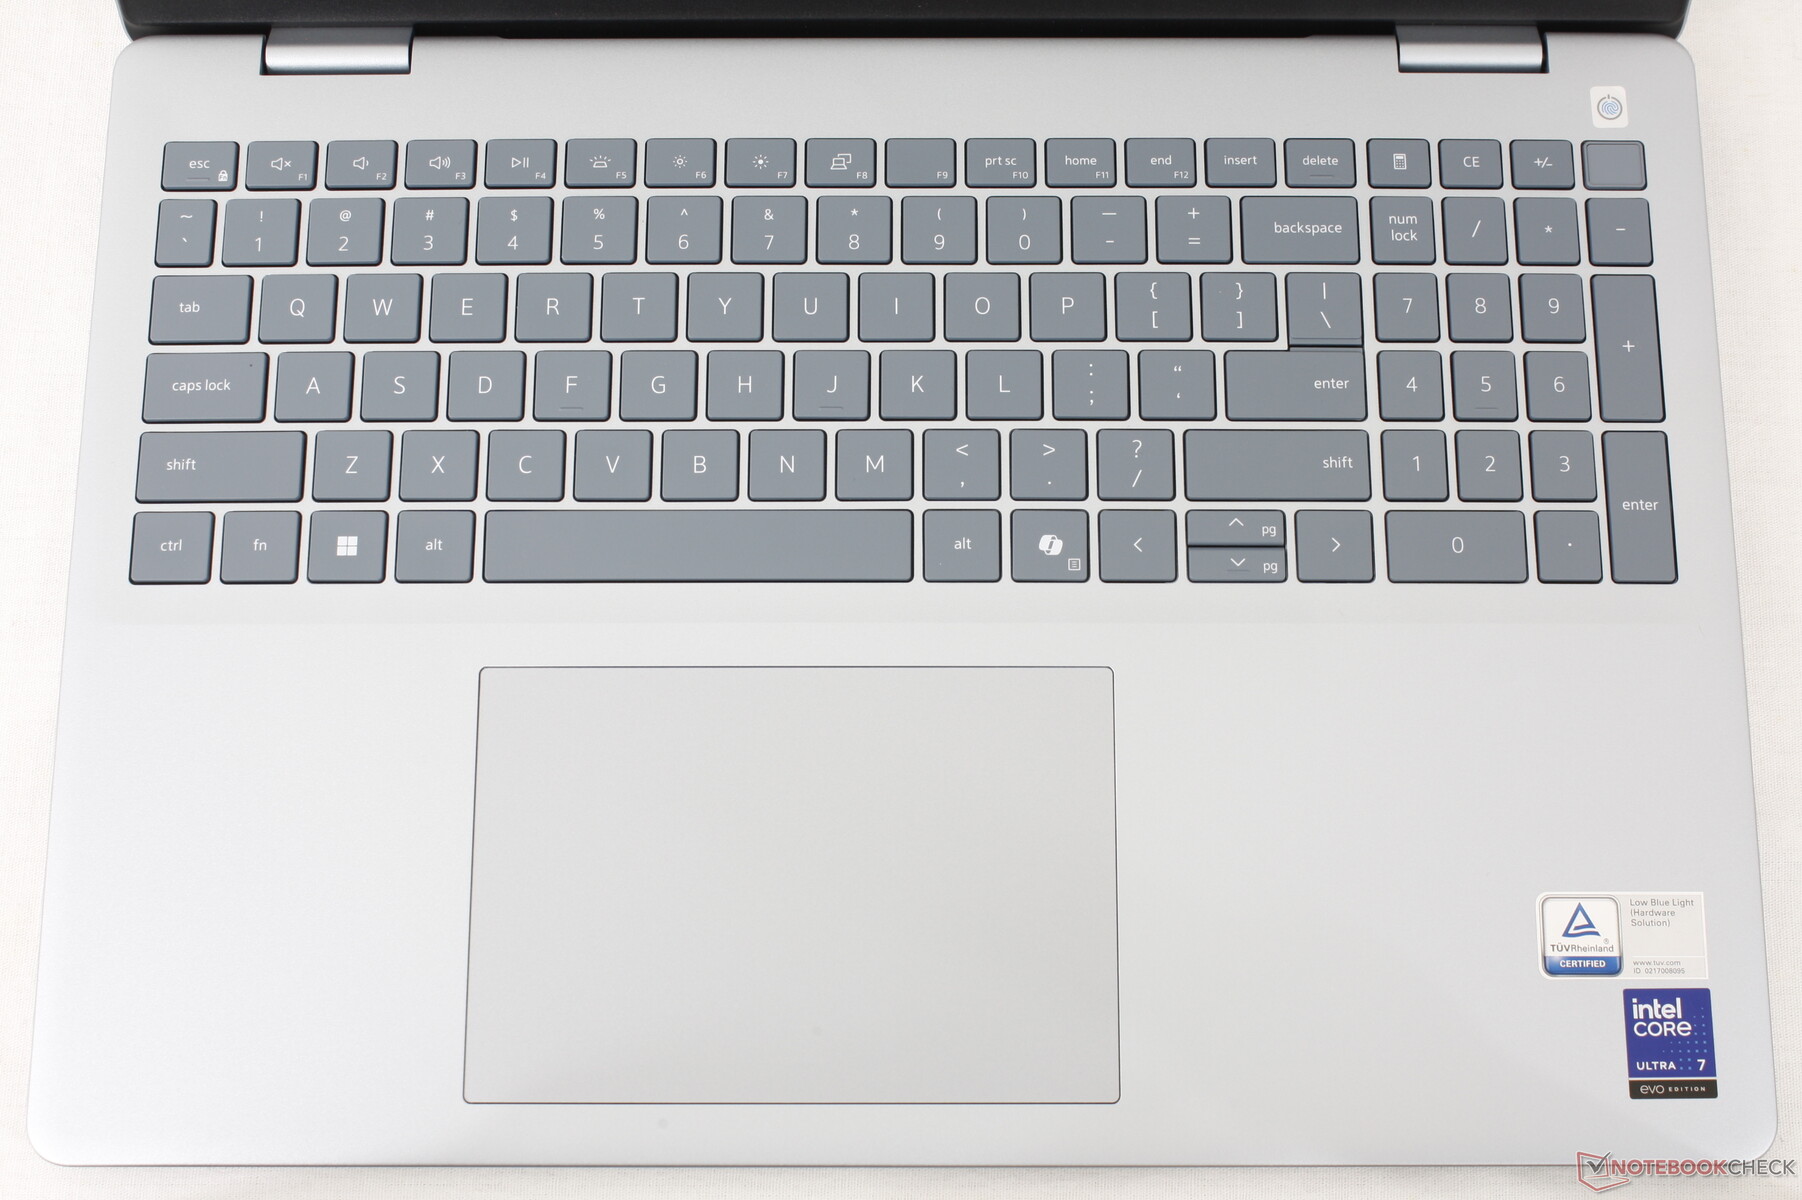
Dispositivi di ingresso
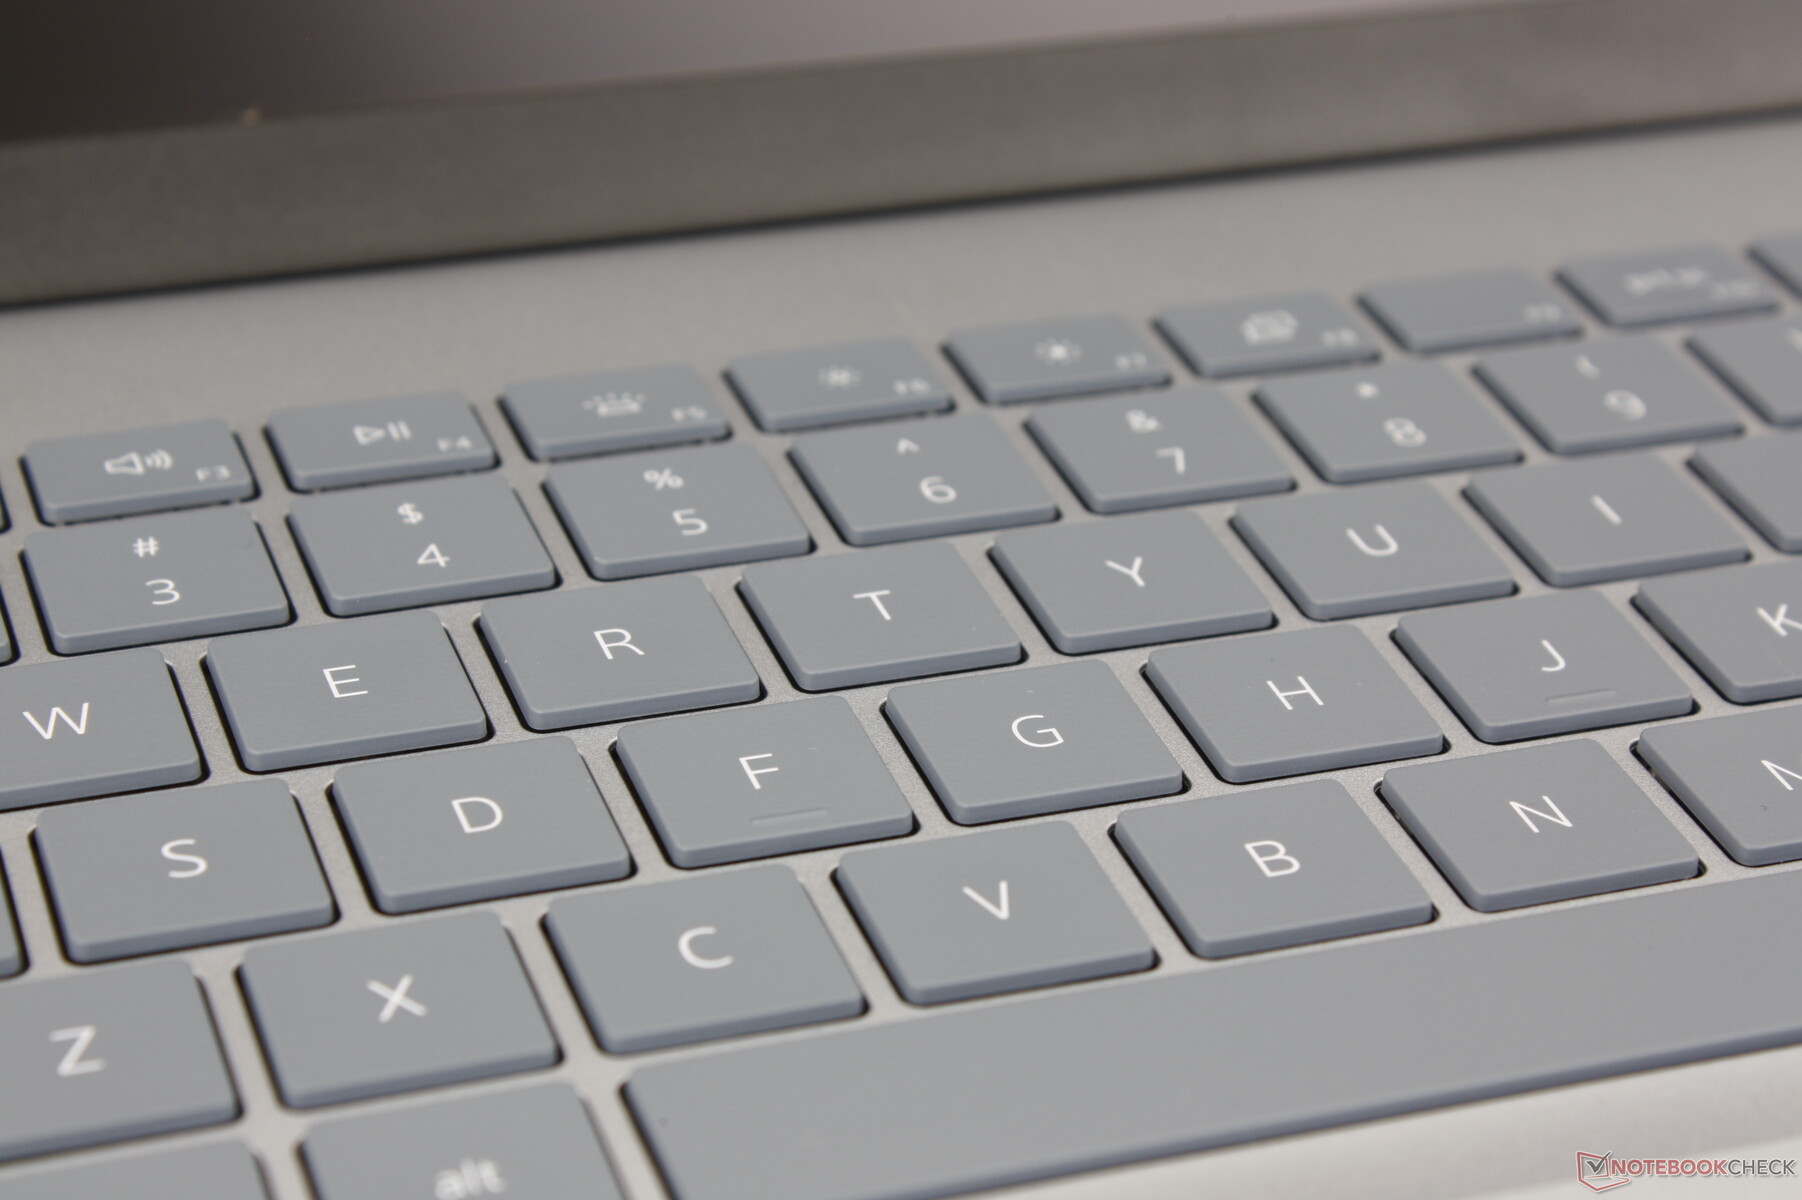
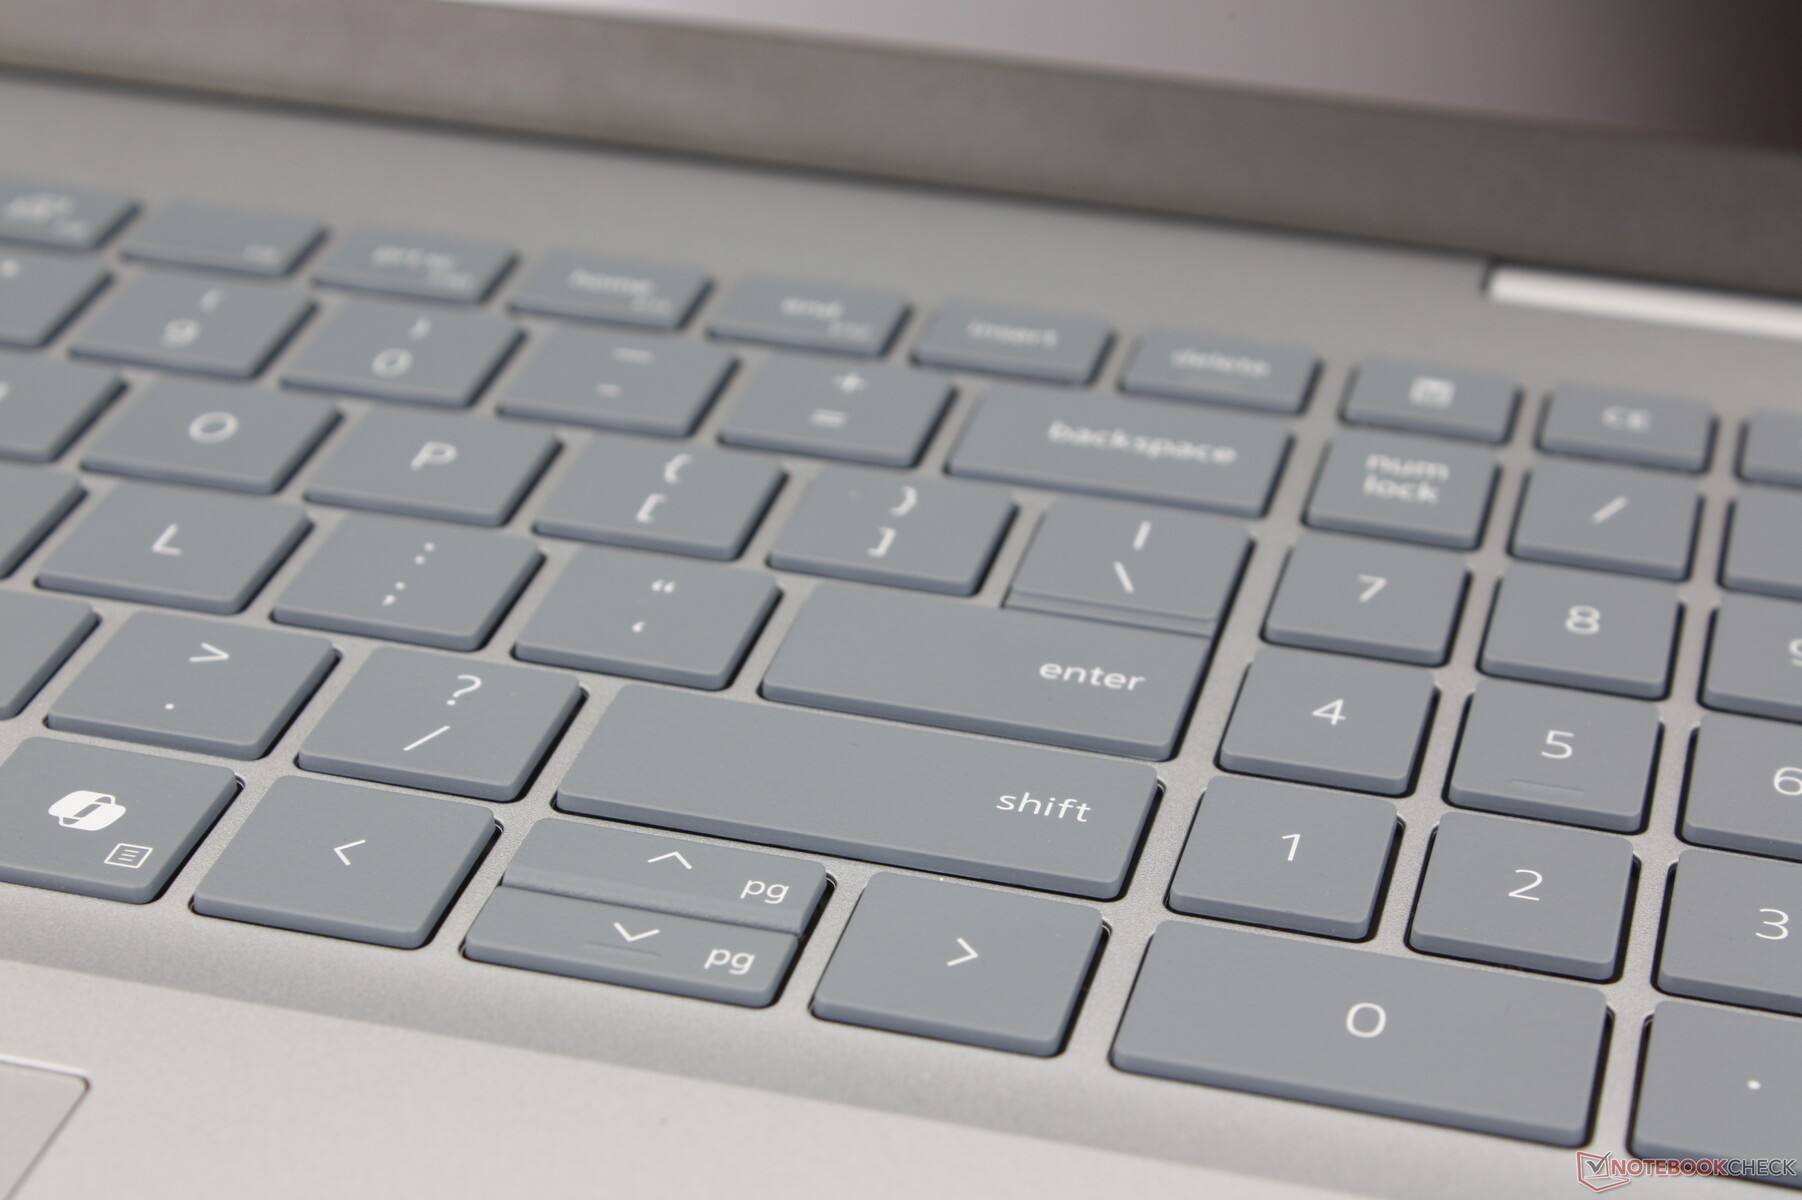
Tastiera
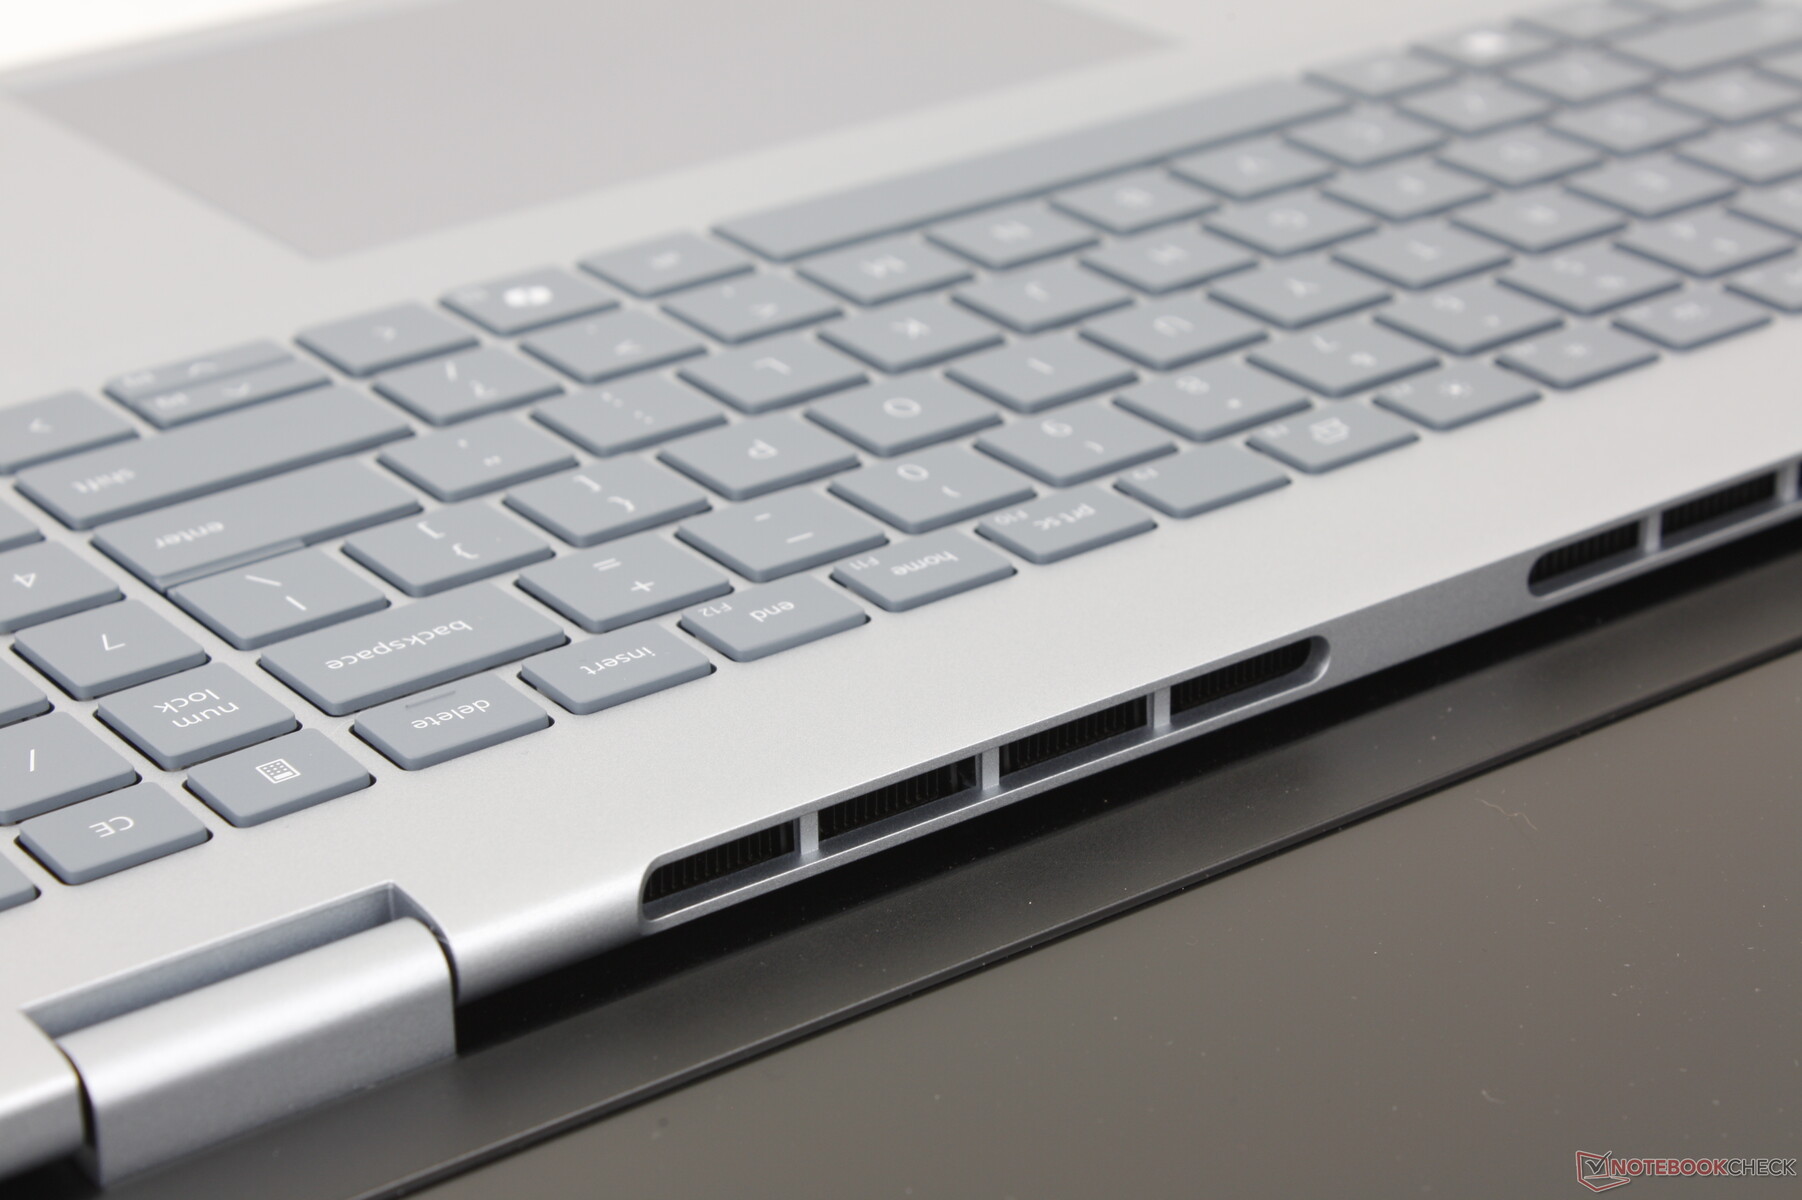
Il Dell 16 Plus introduce un tastierino numerico integrato, mentre questa funzione mancava nella linea Inspiron 16 Plus 7640. Per il resto, l'esperienza di digitazione è simile ai modelli Inspiron di vecchia generazione, nel bene e nel male. Il feedback dei tasti è più morbido, ma con una barra spaziatrice sufficientemente rumorosa e scattante.
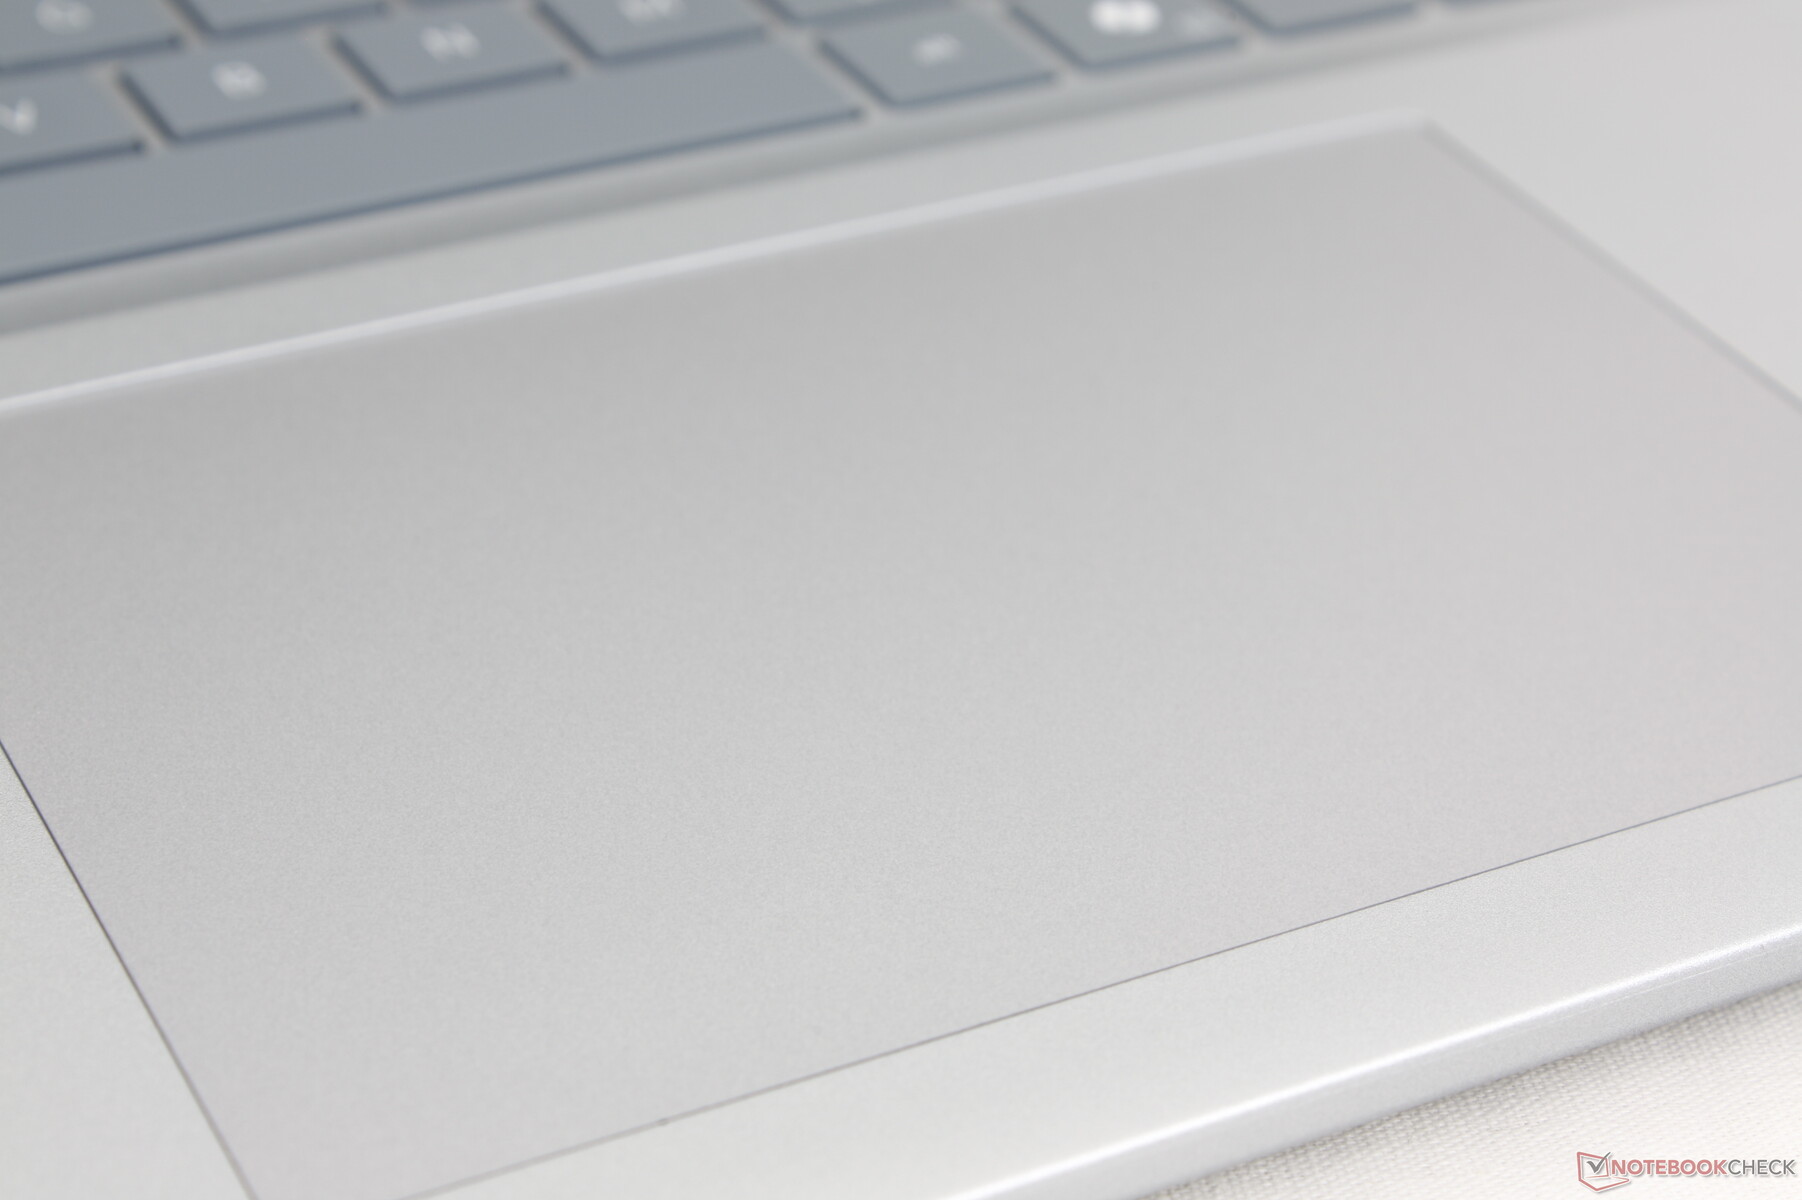
Touchpad
Mentre la tastiera è stata ampliata in termini di funzionalità, il clickpad rimane lo stesso di Inspiron 16 Plus 7640 2-in-1, anche nelle dimensioni (13,3 x 9 cm). È ampio e spazioso per un comodo controllo del cursore e per gli input multi-touch, ma fare clic sulla sua superficie richiede una forza maggiore rispetto alla maggior parte degli altri computer portatili.
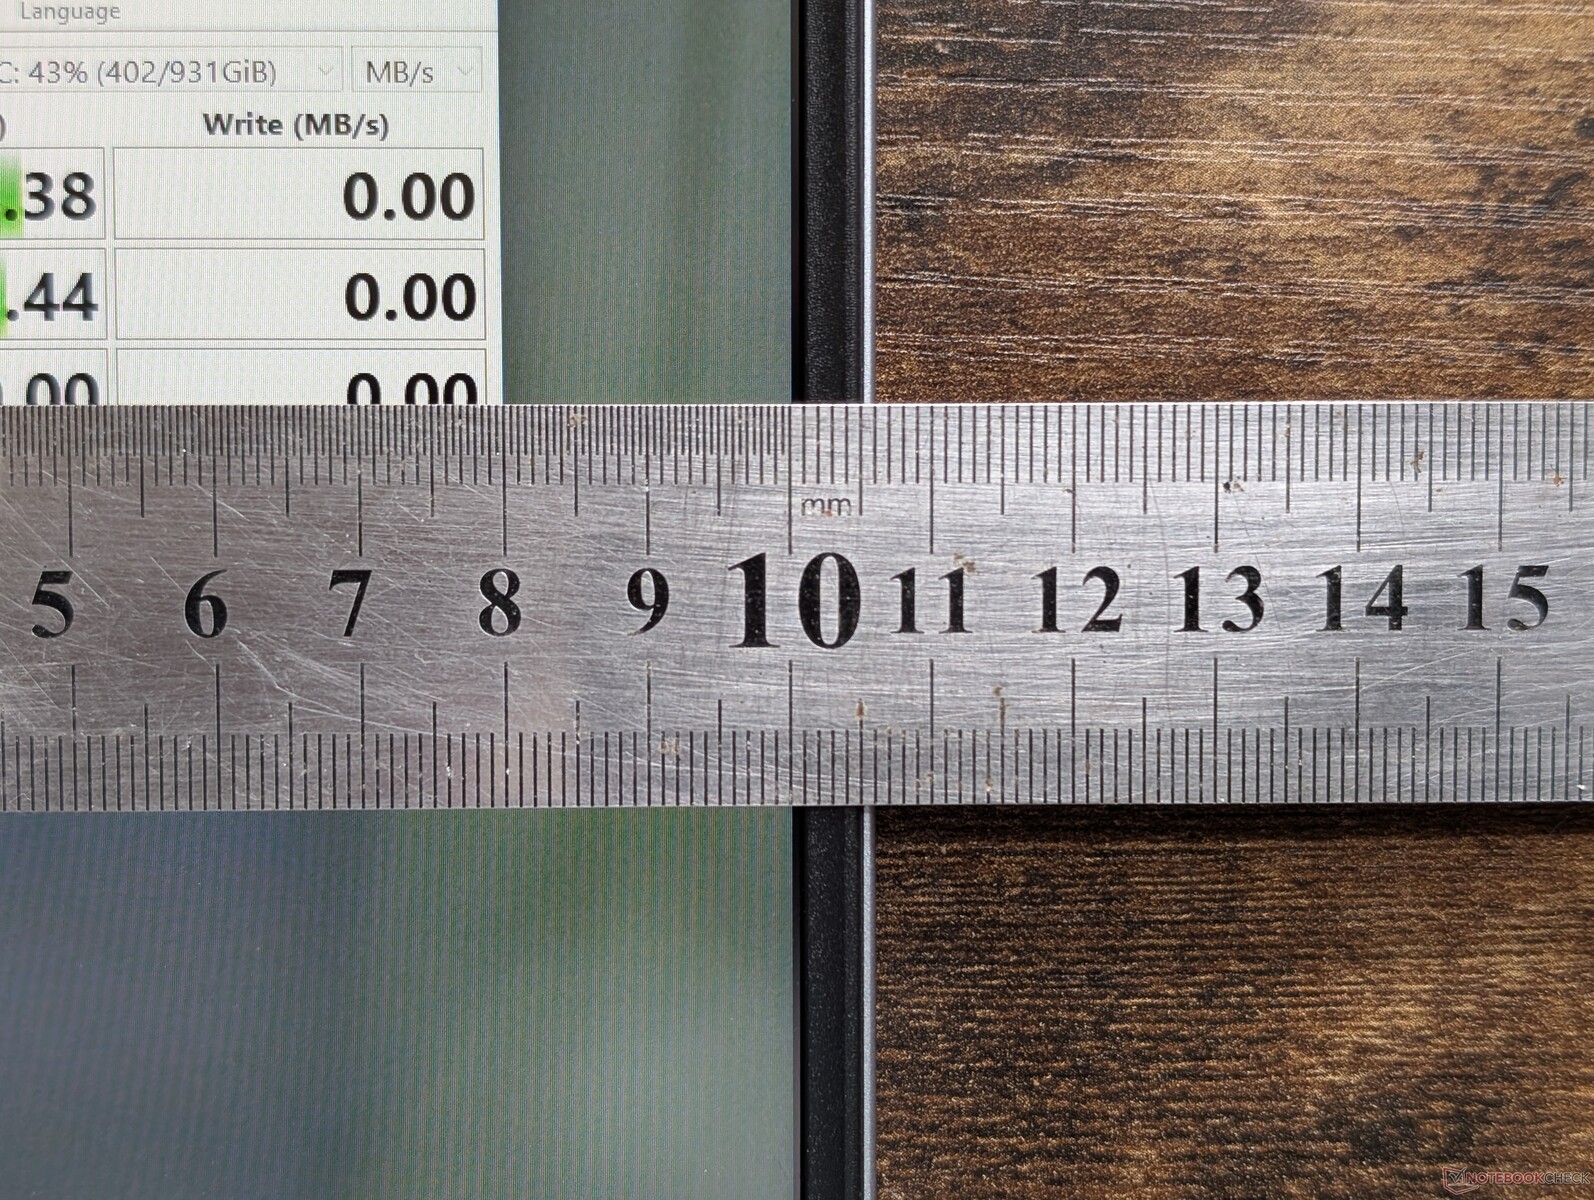
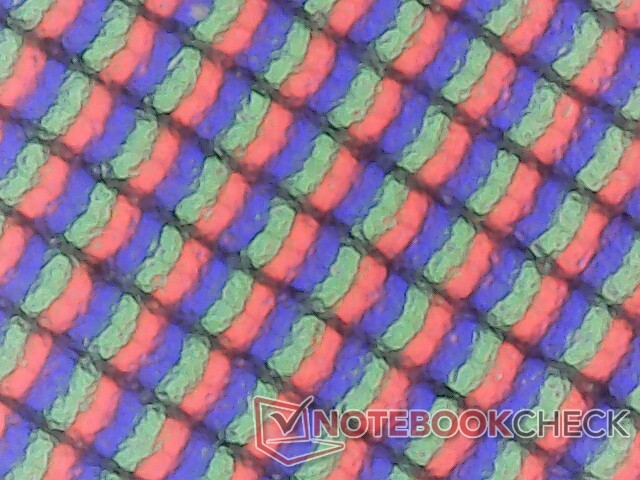
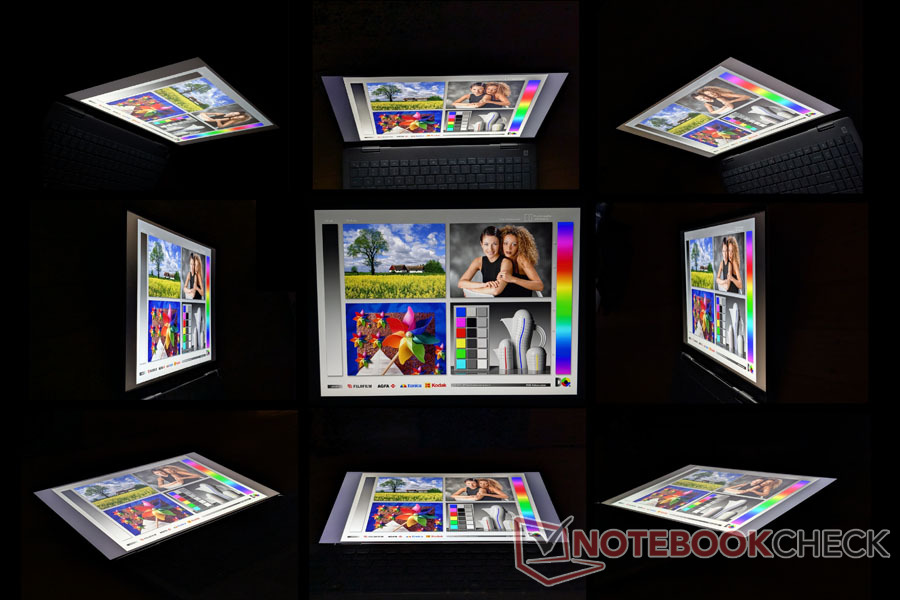
Display - 120 Hz e colori sRGB completi
Il Dell 16 Plus condivide lo stesso pannello AU Optronics B160QAN IPS che si trova sull'Inspiron 16 Plus 7640 Inspiron 16 Plus 7640 per un'esperienza visiva sostanzialmente identica tra i due. Tuttavia, ci sarebbe piaciuto vedere miglioramenti alla luminosità e al supporto per l'HDR.
La configurazione mini-LED a 90 Hz è più che probabile che sia lo stesso pannello presente sull'Inspiron 16 7640 2-in-1 dello scorso anno.
| |||||||||||||||||||||||||
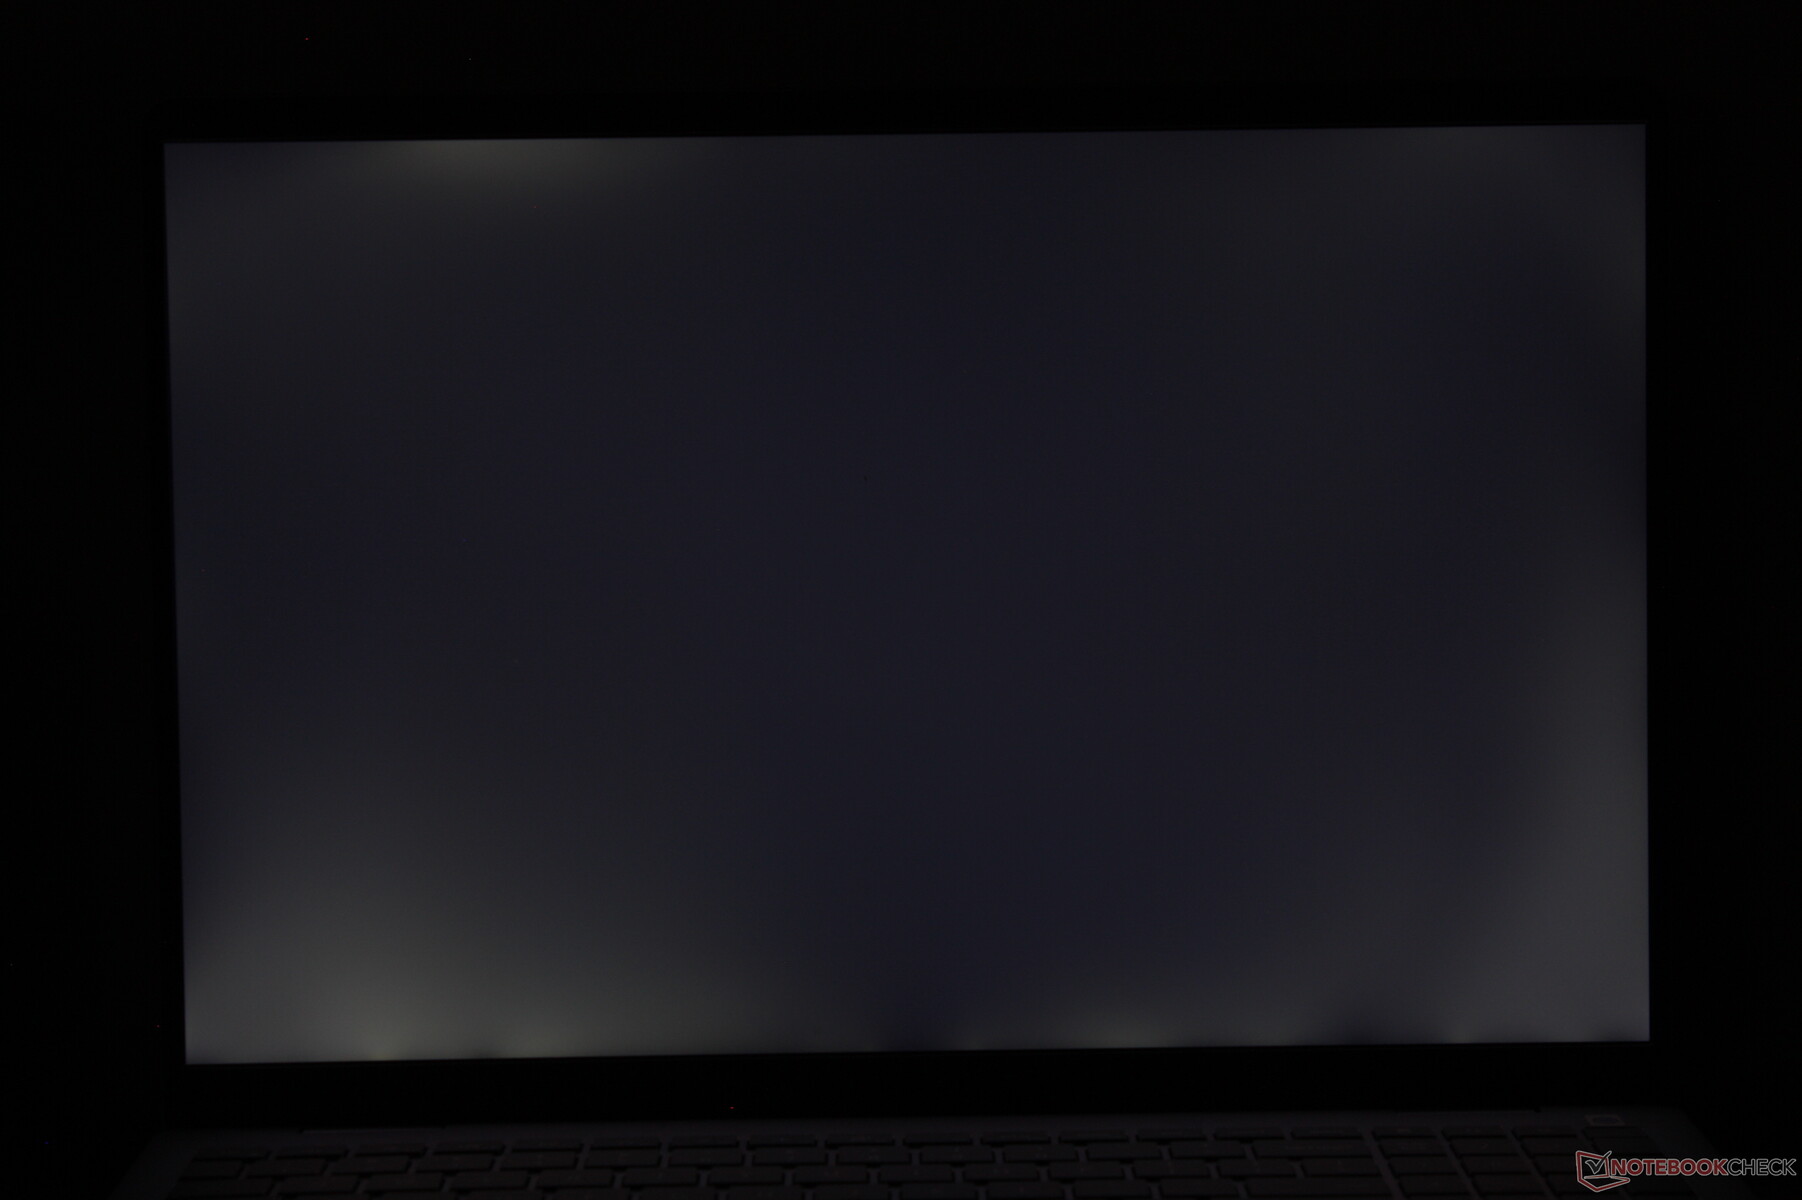
Distribuzione della luminosità: 88 %
Al centro con la batteria: 335.6 cd/m²
Contrasto: 1525:1 (Nero: 0.22 cd/m²)
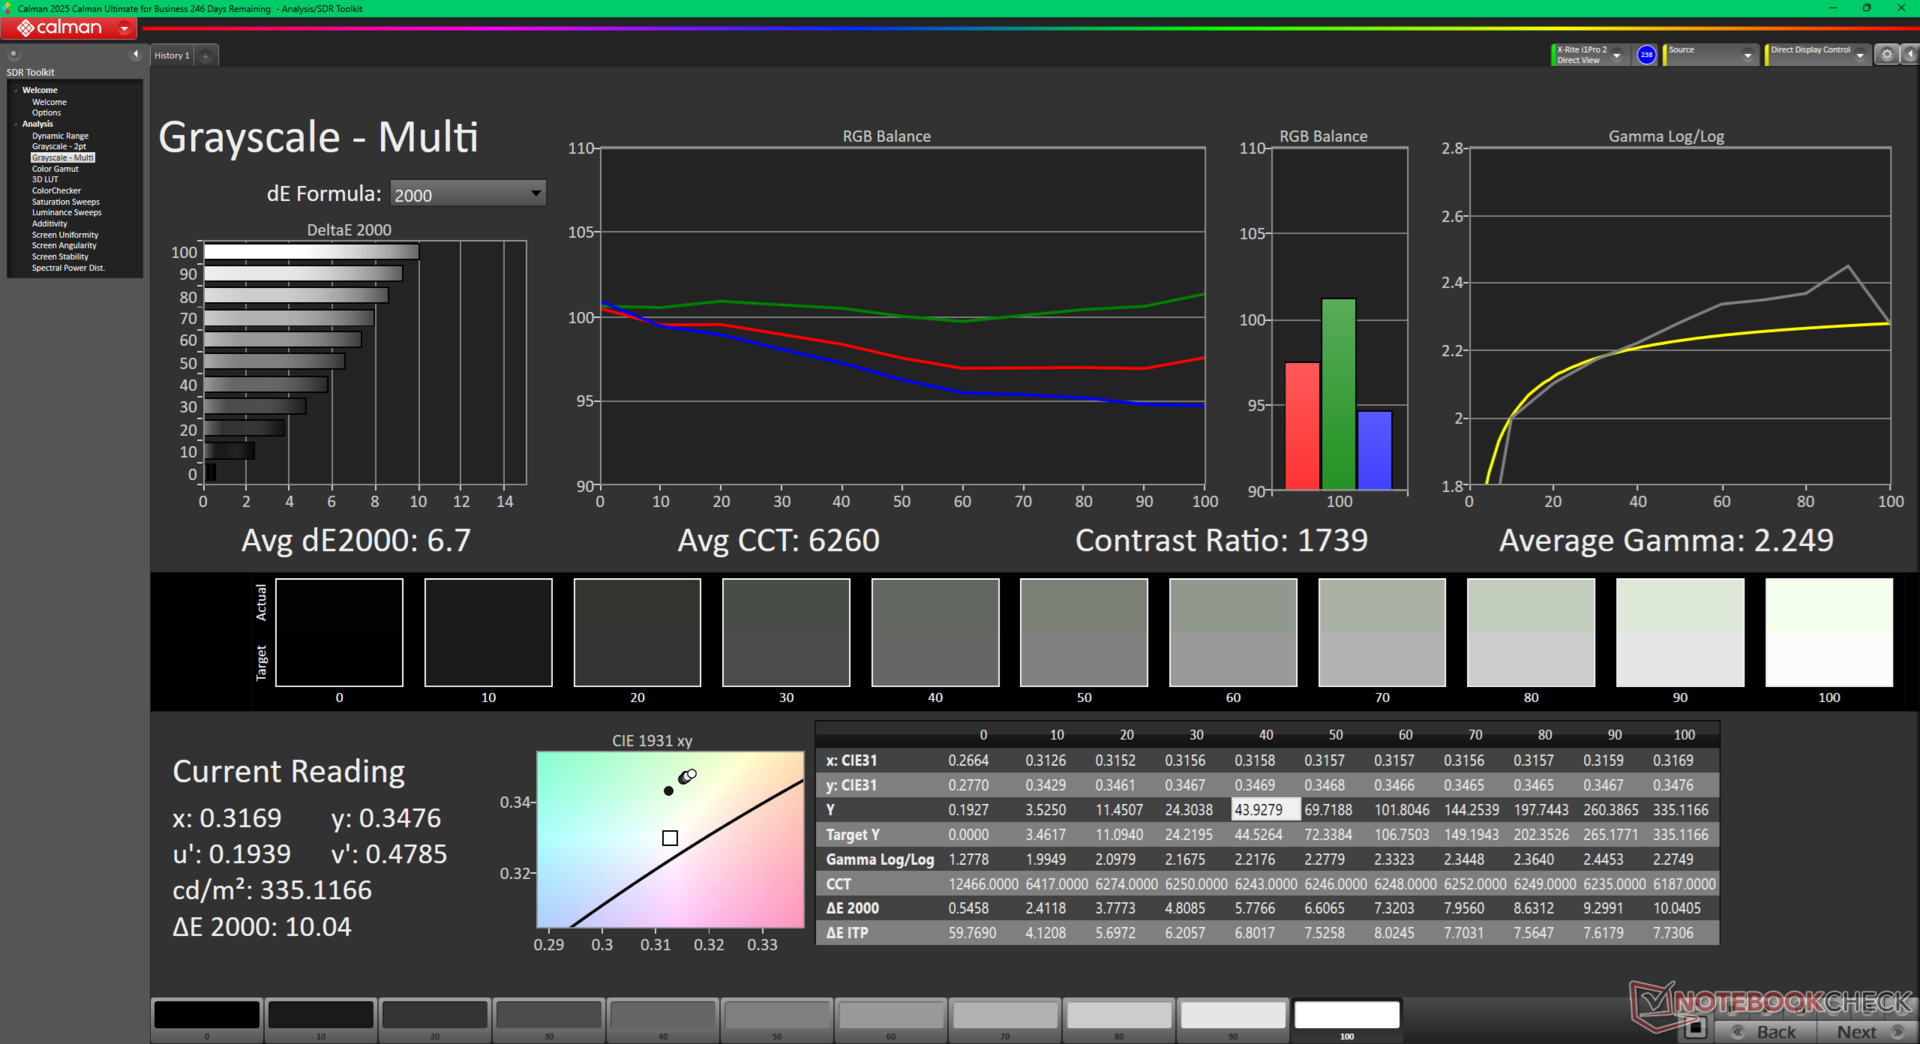
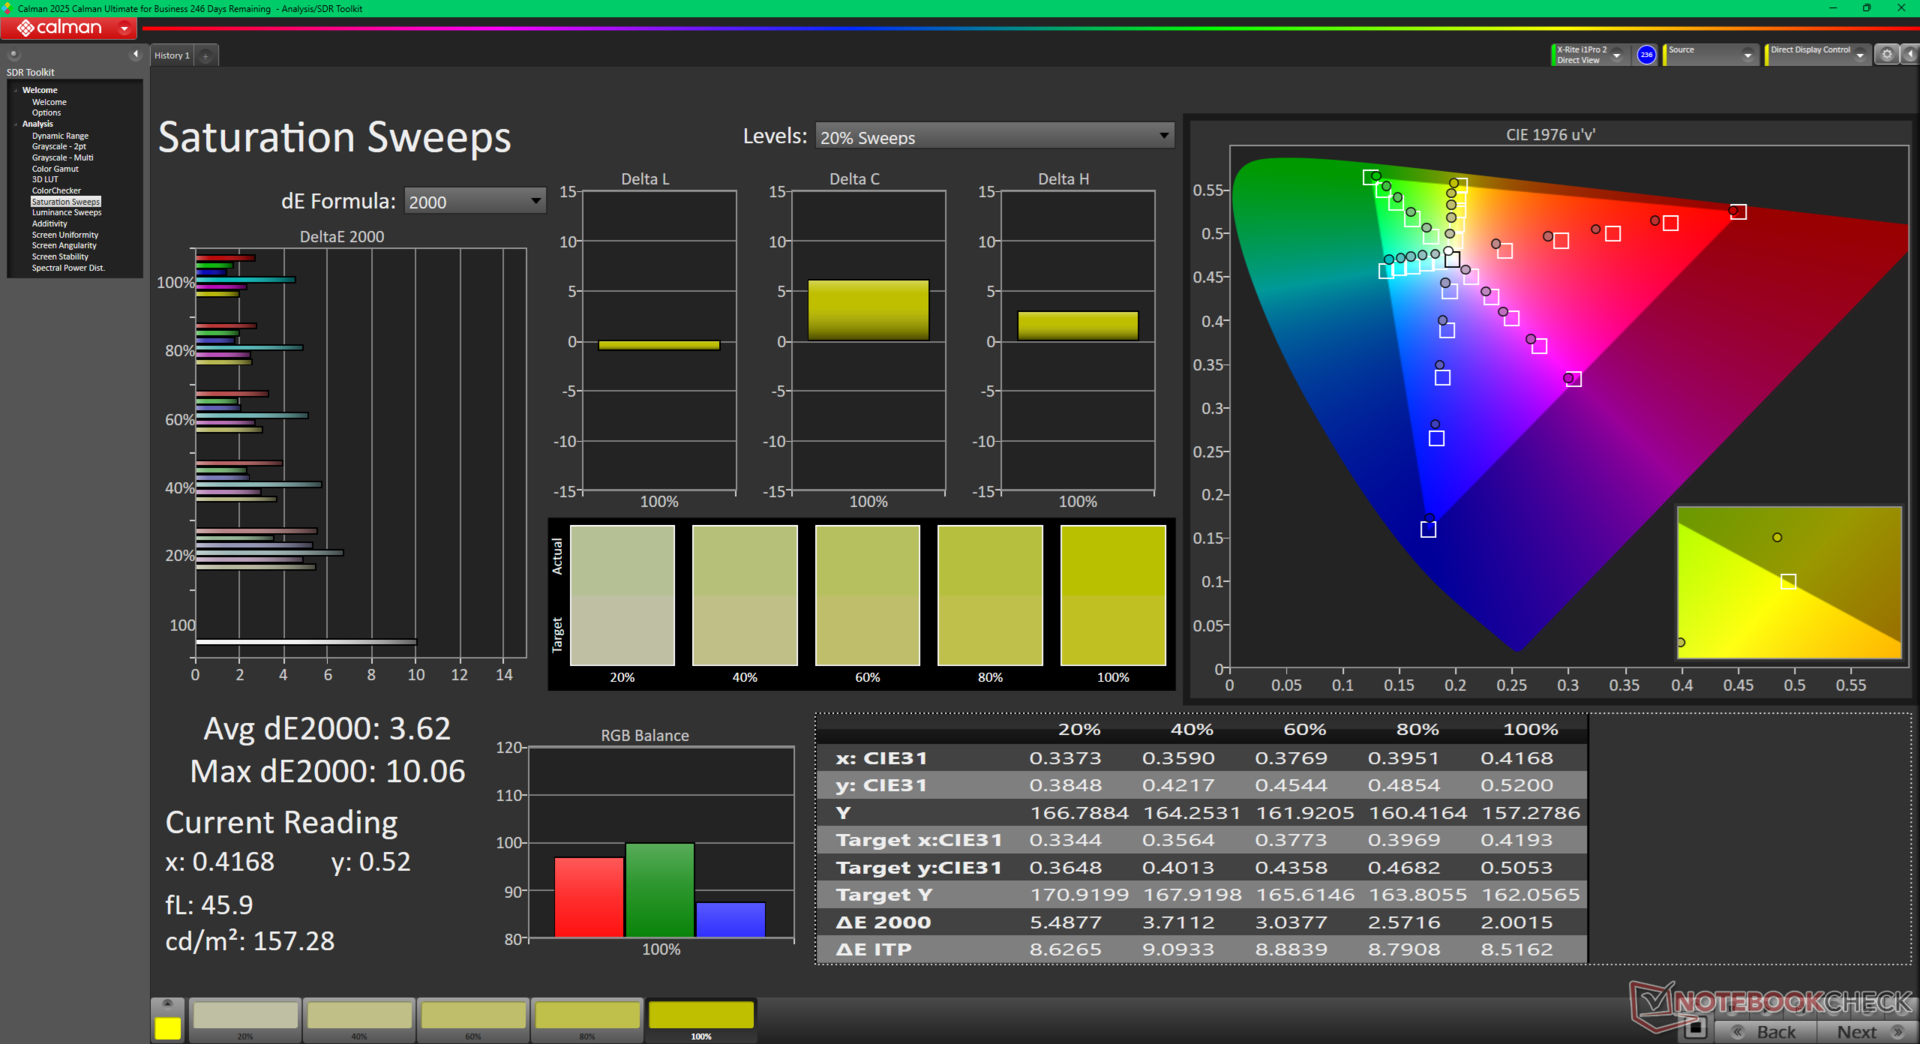
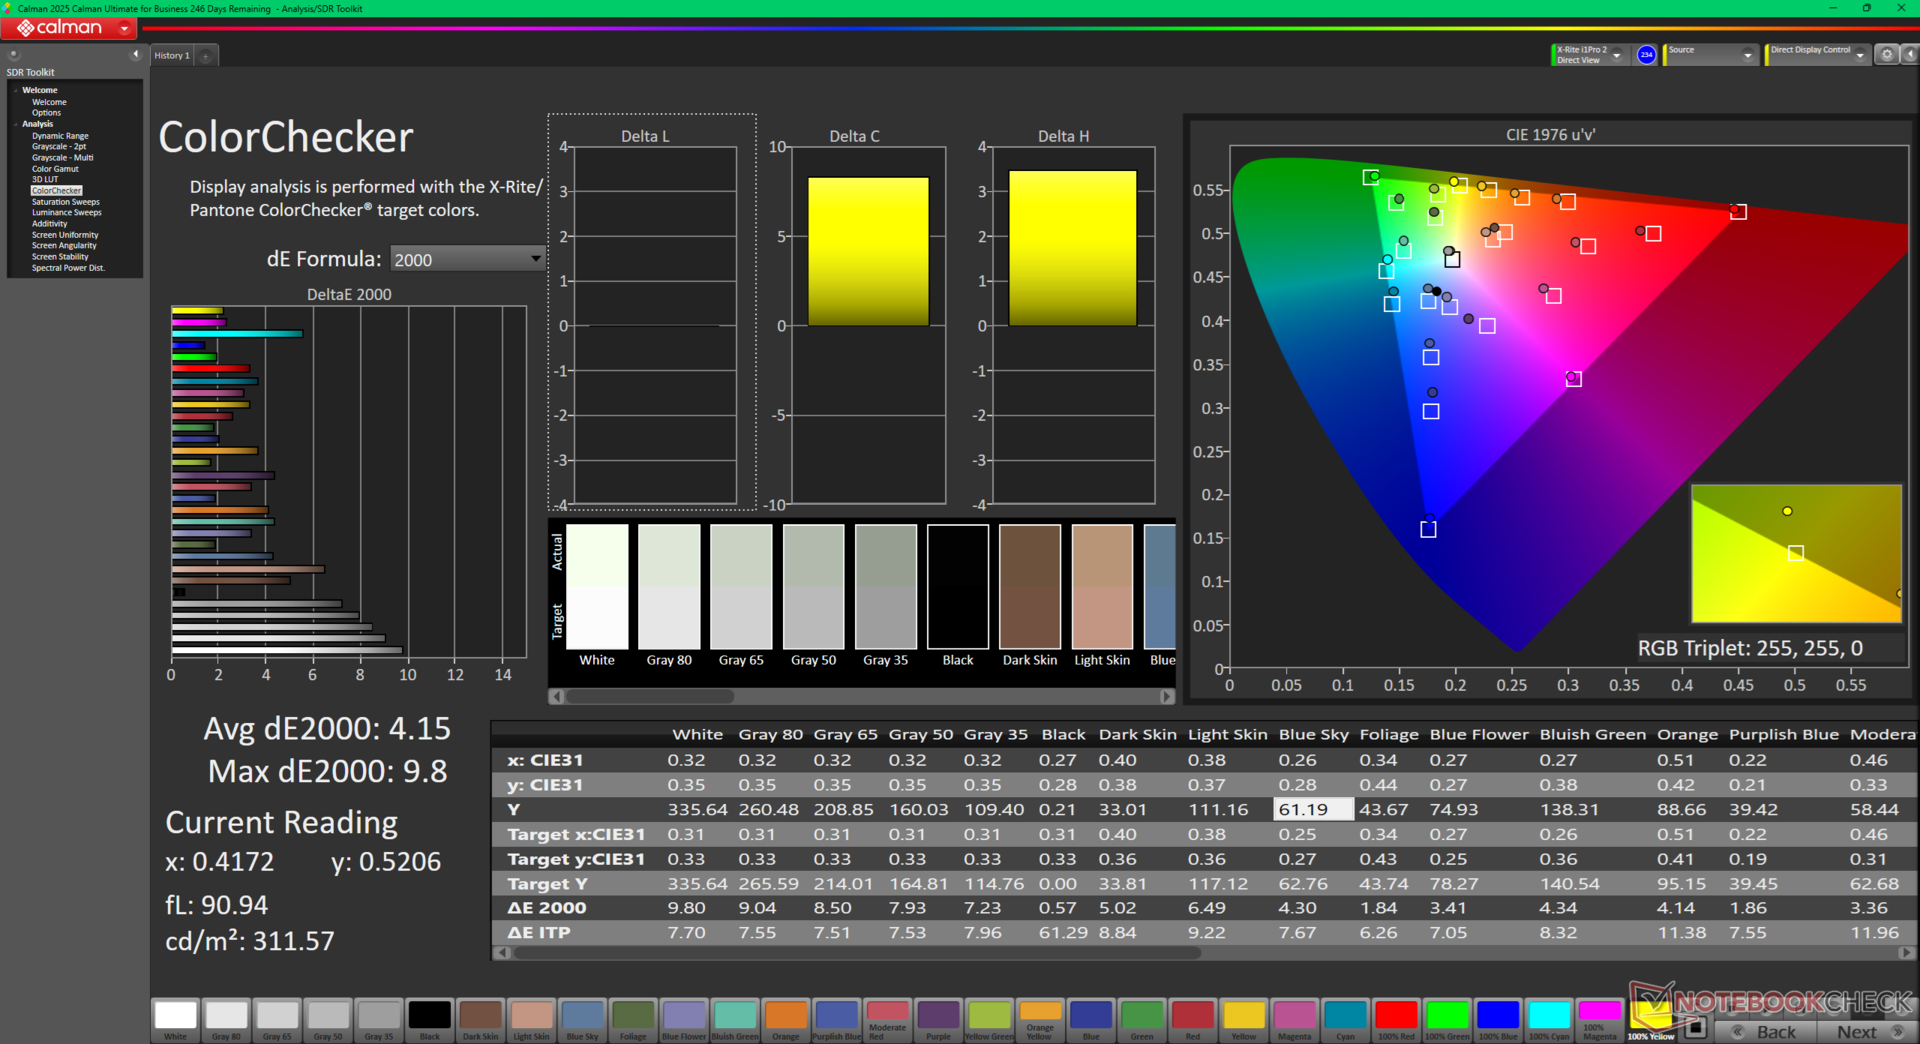
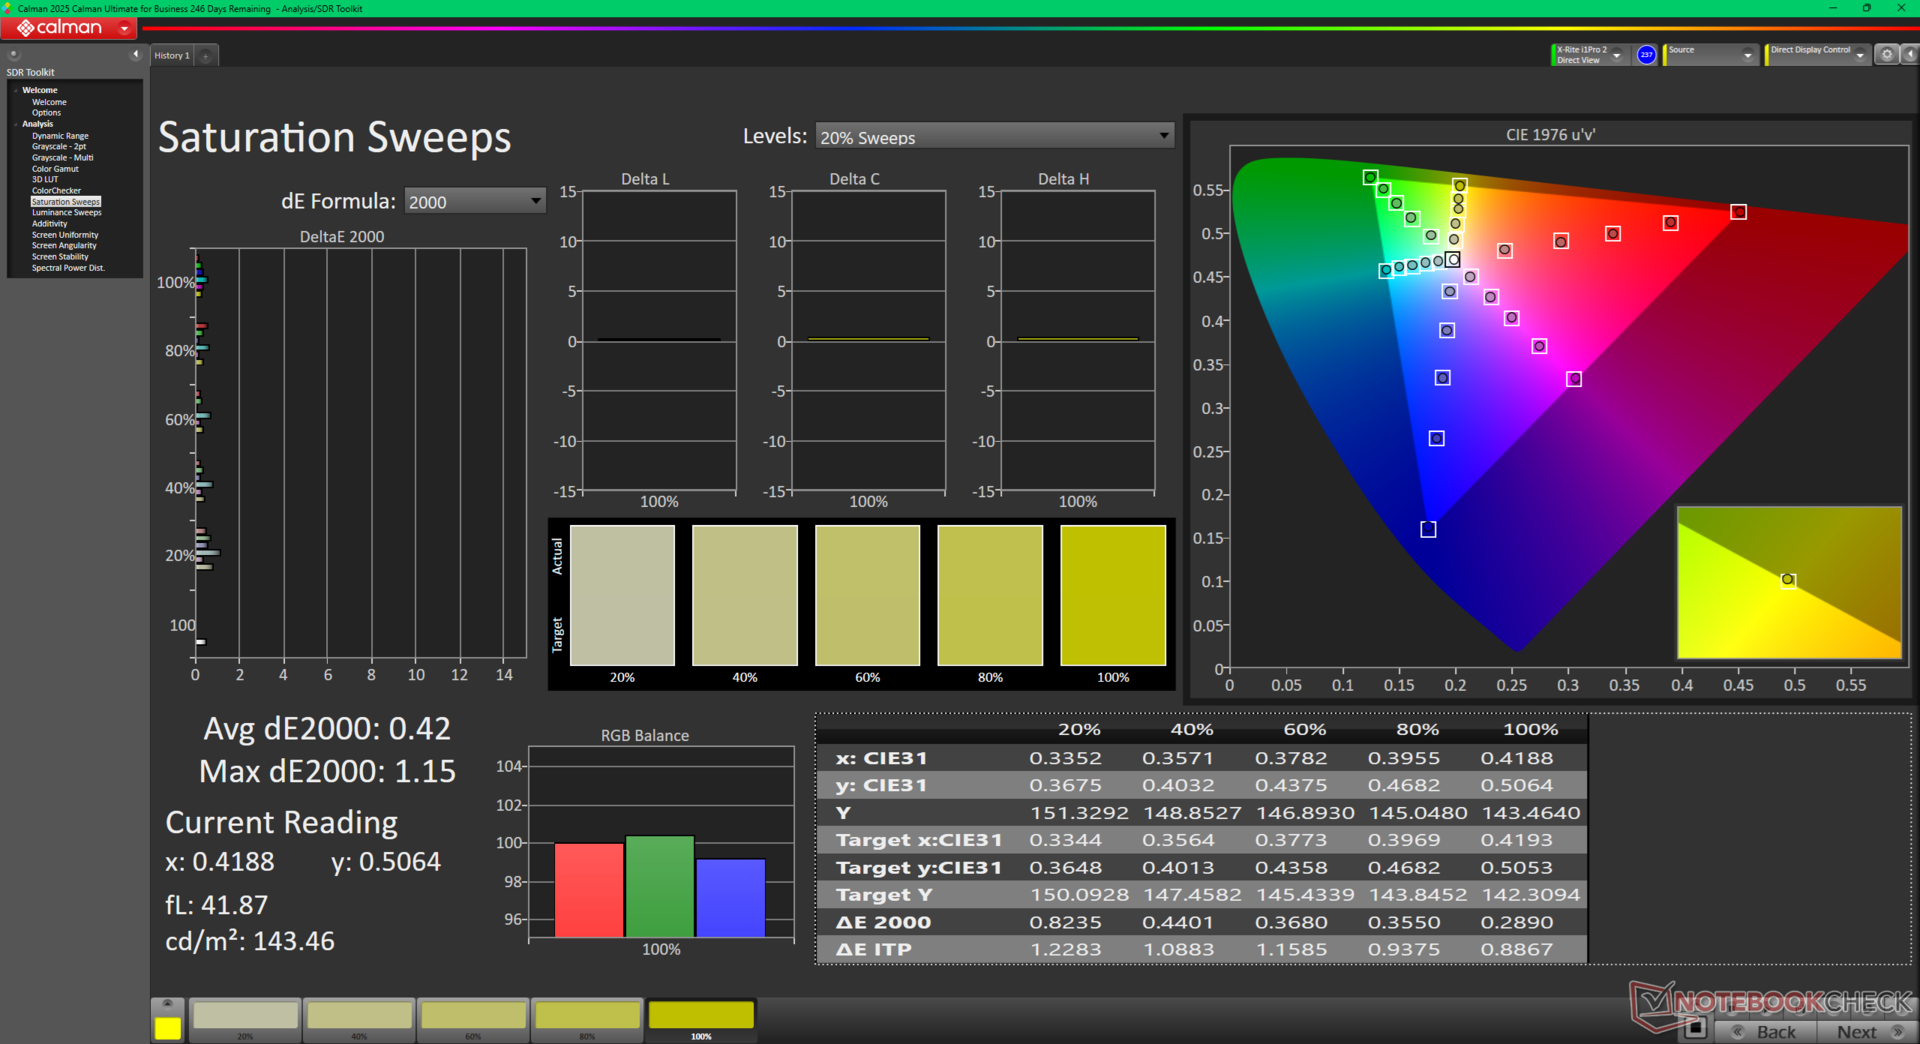
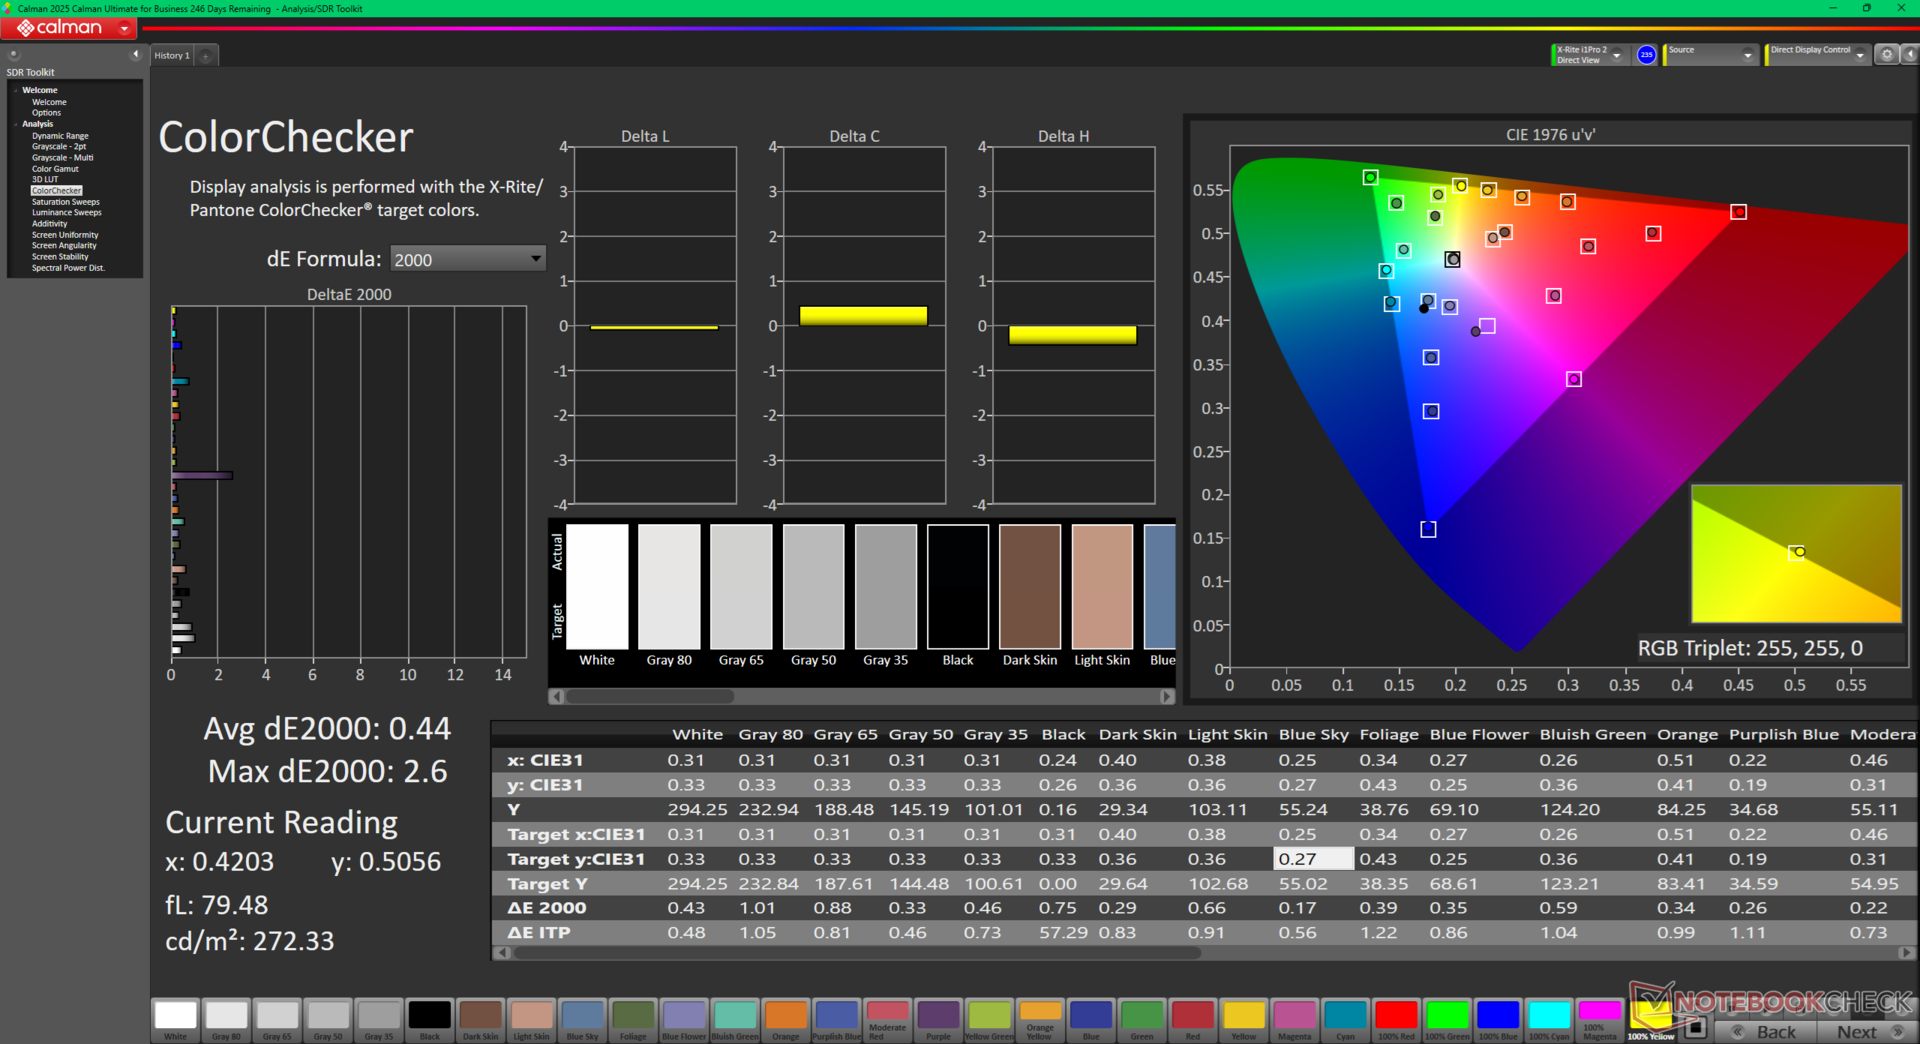
ΔE ColorChecker Calman: 4.15 | ∀{0.5-29.43 Ø4.71}
calibrated: 0.44
ΔE Greyscale Calman: 6.7 | ∀{0.09-98 Ø4.96}
78.4% AdobeRGB 1998 (Argyll 3D)
99.8% sRGB (Argyll 3D)
76.6% Display P3 (Argyll 3D)
Gamma: 2.25
CCT: 6260 K
| Dell 16 Plus AU Optronics B160QAN, IPS, 2560x1600, 16", 120 Hz | Dell Inspiron 16 Plus 7640 AU Optronics B160QAN, IPS, 2560x1600, 16", 120 Hz | Acer Swift 16 AI SF16-51T-932H, Ultra 9 288V SDC41B6, OLED, 2880x1800, 16", 120 Hz | Lenovo ThinkBook 16 G7+ AMD LEN160-3.2K, IPS, 3200x2000, 16", 165 Hz | HP Pavilion Plus 16-ab0456tx AU Optronics AUOFDA4, IPS, 2560x1600, 16", 120 Hz | Asus Vivobook 16 M1606K B160UAN04.3 (AUOA5AB), IPS, 1920x1200, 16", 60 Hz | |
|---|---|---|---|---|---|---|
| Display | -1% | 17% | 12% | -2% | -50% | |
| Display P3 Coverage (%) | 76.6 | 76 -1% | 99.9 30% | 96.3 26% | 74.6 -3% | 36.8 -52% |
| sRGB Coverage (%) | 99.8 | 99.8 0% | 100 0% | 100 0% | 99 -1% | 55.3 -45% |
| AdobeRGB 1998 Coverage (%) | 78.4 | 76.7 -2% | 94.6 21% | 86.9 11% | 76.5 -2% | 38 -52% |
| Response Times | 24% | 54% | 66% | 72% | -1% | |
| Response Time Grey 50% / Grey 80% * (ms) | 32.8 ? | 25.6 ? 22% | 4.8 ? 85% | 13.9 ? 58% | 9.06 ? 72% | 36 ? -10% |
| Response Time Black / White * (ms) | 23.4 ? | 17.6 ? 25% | 18 ? 23% | 6.3 ? 73% | 6.7 ? 71% | 21.4 ? 9% |
| PWM Frequency (Hz) | 481 | |||||
| PWM Amplitude * (%) | 39 | |||||
| Screen | 0% | 195% | 16% | -23% | -128% | |
| Brightness middle (cd/m²) | 335.6 | 314.7 -6% | 425 27% | 422 26% | 403 20% | 326 -3% |
| Brightness (cd/m²) | 308 | 291 -6% | 421 37% | 403 31% | 394 28% | 303 -2% |
| Brightness Distribution (%) | 88 | 89 1% | 98 11% | 93 6% | 90 2% | 89 1% |
| Black Level * (cd/m²) | 0.22 | 0.28 -27% | 0.0219 90% | 0.3 -36% | 0.34 -55% | 0.24 -9% |
| Contrast (:1) | 1525 | 1124 -26% | 19406 1173% | 1407 -8% | 1185 -22% | 1358 -11% |
| Colorchecker dE 2000 * | 4.15 | 1.62 61% | 1.73 58% | 1.7 59% | 3.13 25% | 6.48 -56% |
| Colorchecker dE 2000 max. * | 9.8 | 2.94 70% | 3.82 61% | 3.4 65% | 6.14 37% | 19.42 -98% |
| Colorchecker dE 2000 calibrated * | 0.44 | 1.08 -145% | 0.7 -59% | 1.65 -275% | 4.92 -1018% | |
| Greyscale dE 2000 * | 6.7 | 1.3 81% | 0.09 99% | 2.4 64% | 4.5 33% | 3.85 43% |
| Gamma | 2.25 98% | 2.26 97% | 2.346 94% | 2.19 100% | 2.18 101% | 2.79 79% |
| CCT | 6260 104% | 6385 102% | 6432 101% | 6989 93% | 6261 104% | 6739 96% |
| Media totale (Programma / Settaggio) | 8% /
3% | 89% /
132% | 31% /
23% | 16% /
-5% | -60% /
-93% |
* ... Meglio usare valori piccoli
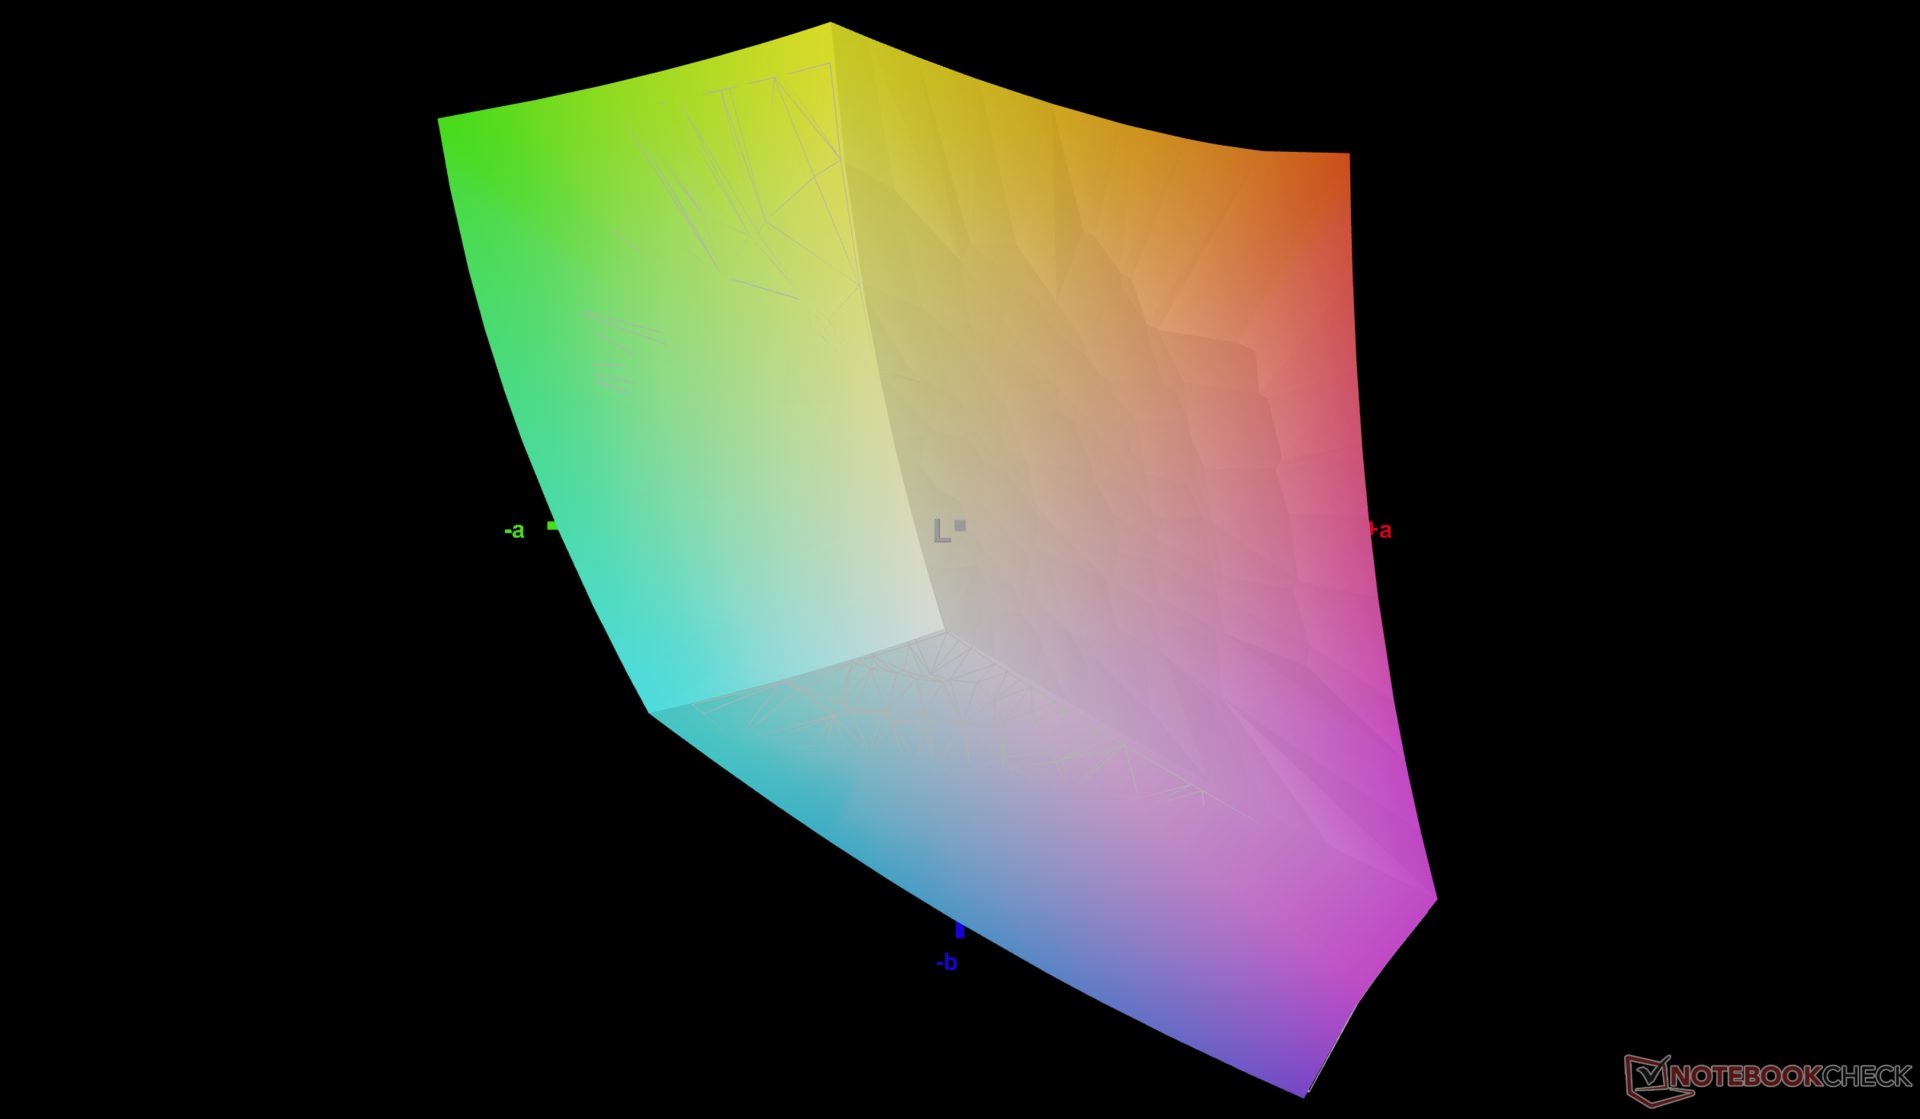

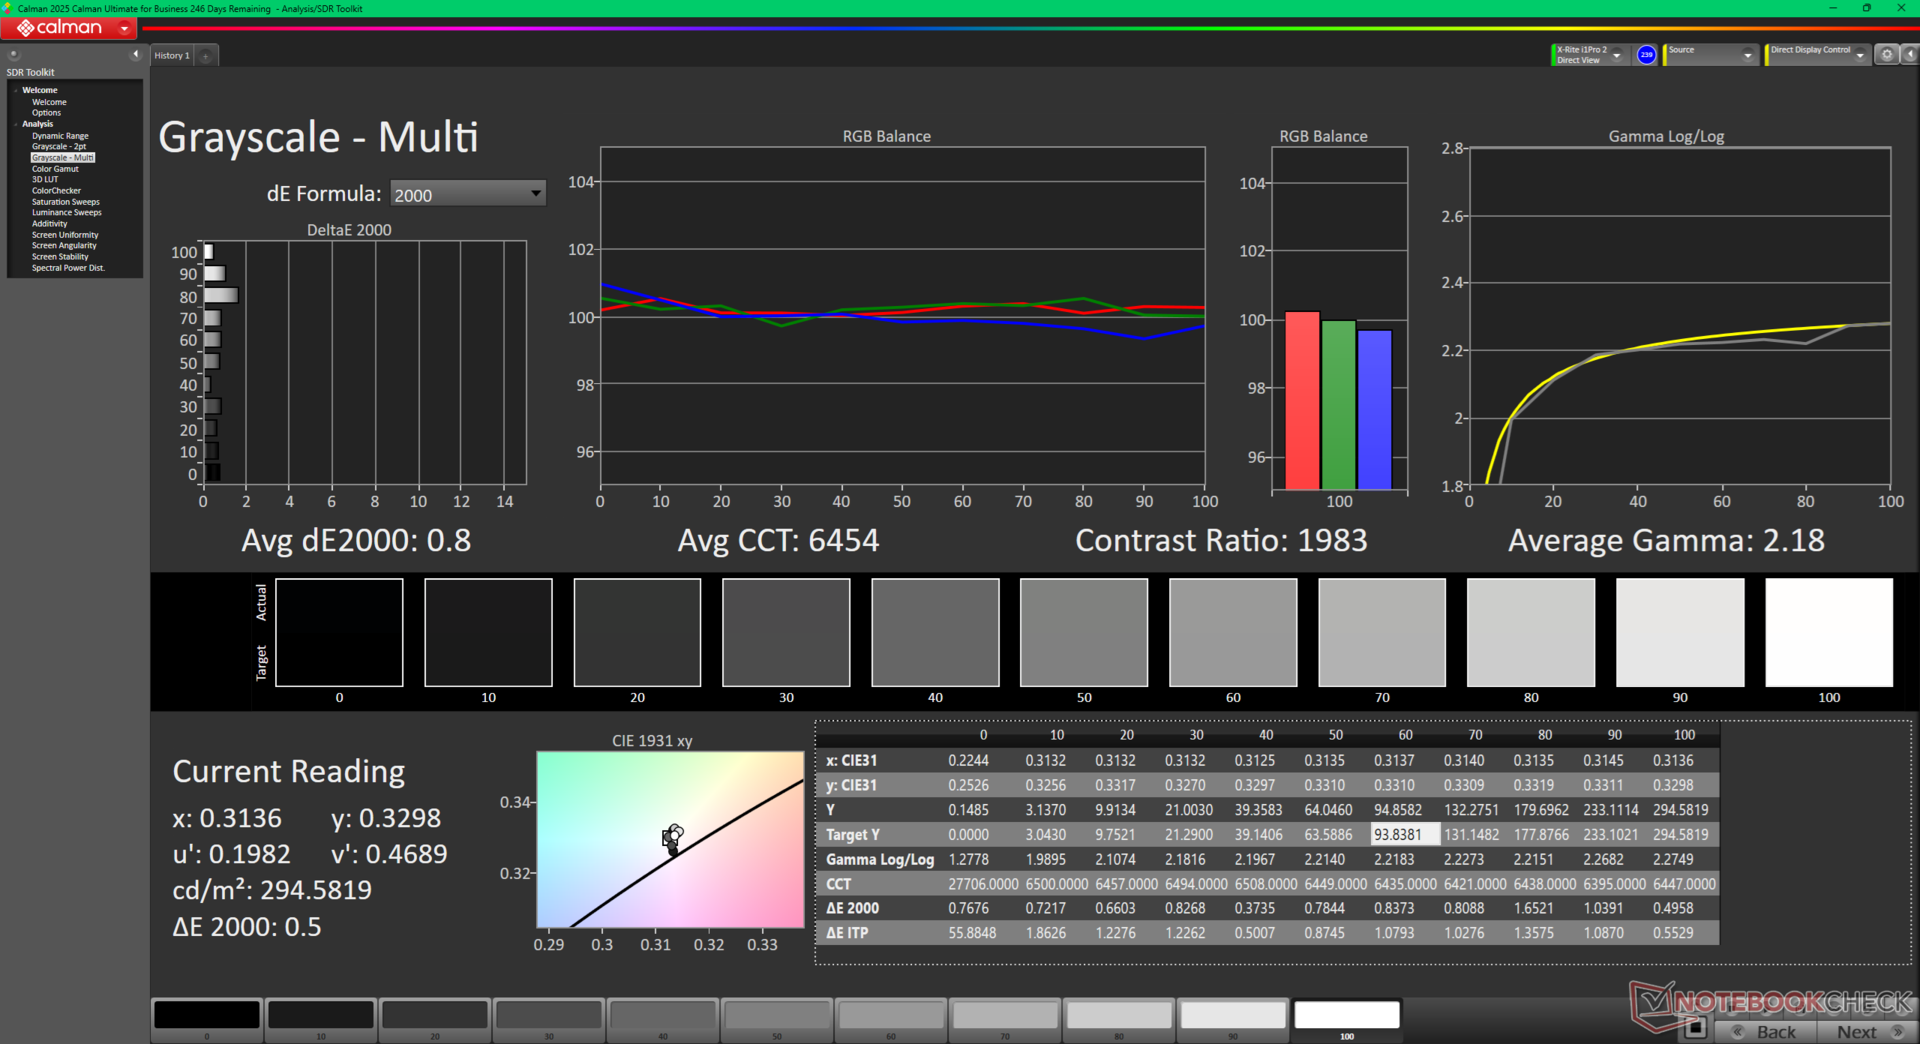
Il display non è ben calibrato, cosa comune alla maggior parte dei computer portatili di fascia media ed economica. La calibrazione del display da parte nostra con un colorimetro X-Rite migliorerebbe notevolmente i valori medi deltaE della scala di grigi e del colore da 6,7 e 4,15 a soli 0,8 e 0,44, rispettivamente, per sfruttare meglio l'intera copertura sRGB. Il nostro profilo ICM calibrato è disponibile gratuitamente per il download qui sopra.
Tempi di risposta del Display
| ↔ Tempi di risposta dal Nero al Bianco | ||
|---|---|---|
| 23.4 ms ... aumenta ↗ e diminuisce ↘ combinato | ↗ 11.6 ms Incremento | 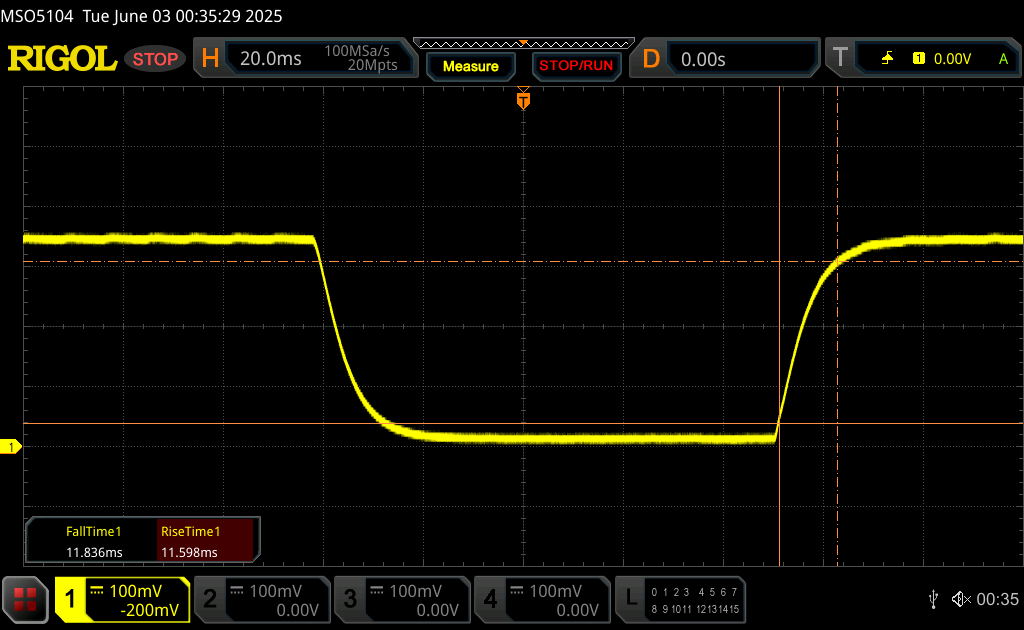 |
| ↘ 11.8 ms Calo | ||
| Lo schermo mostra buoni tempi di risposta durante i nostri tests, ma potrebbe essere troppo lento per i gamers competitivi. In confronto, tutti i dispositivi di test variano da 0.1 (minimo) a 240 (massimo) ms. » 54 % di tutti i dispositivi è migliore. Questo significa che i tempi di risposta rilevati sono peggiori rispetto alla media di tutti i dispositivi testati (19.8 ms). | ||
| ↔ Tempo di risposta dal 50% Grigio all'80% Grigio | ||
| 32.8 ms ... aumenta ↗ e diminuisce ↘ combinato | ↗ 16.1 ms Incremento | 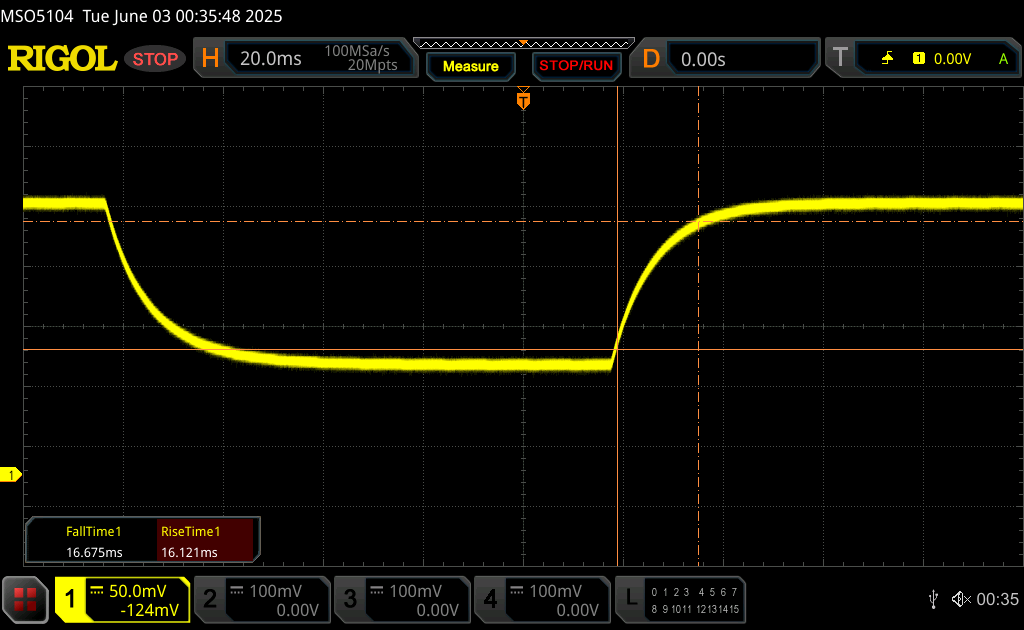 |
| ↘ 16.7 ms Calo | ||
| Lo schermo mostra tempi di risposta lenti nei nostri tests e sarà insoddisfacente per i gamers. In confronto, tutti i dispositivi di test variano da 0.165 (minimo) a 636 (massimo) ms. » 45 % di tutti i dispositivi è migliore. Questo significa che i tempi di risposta rilevati sono simili alla media di tutti i dispositivi testati (31 ms). | ||
Sfarfallio dello schermo / PWM (Pulse-Width Modulation)
| flickering dello schermo / PWM non rilevato |  | ||
In confronto: 52 % di tutti i dispositivi testati non utilizza PWM per ridurre la luminosita' del display. Se è rilevato PWM, una media di 7757 (minimo: 5 - massimo: 343500) Hz è stata rilevata. | |||
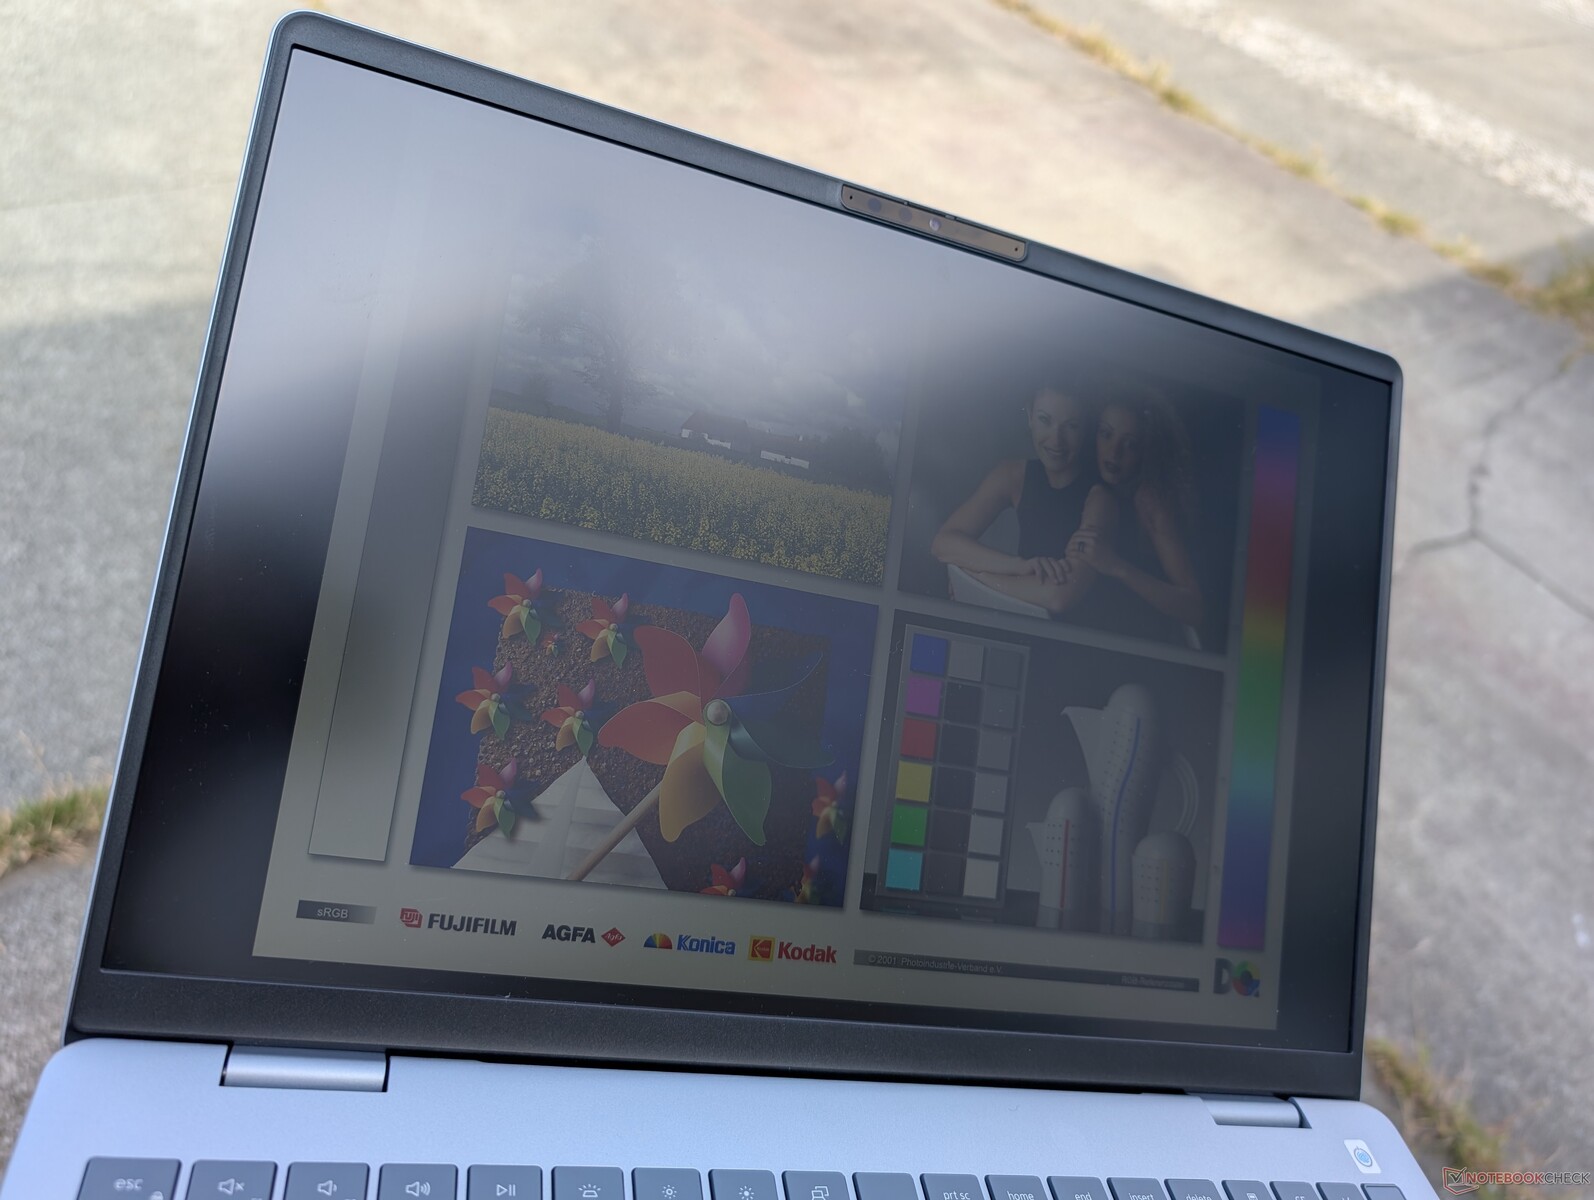
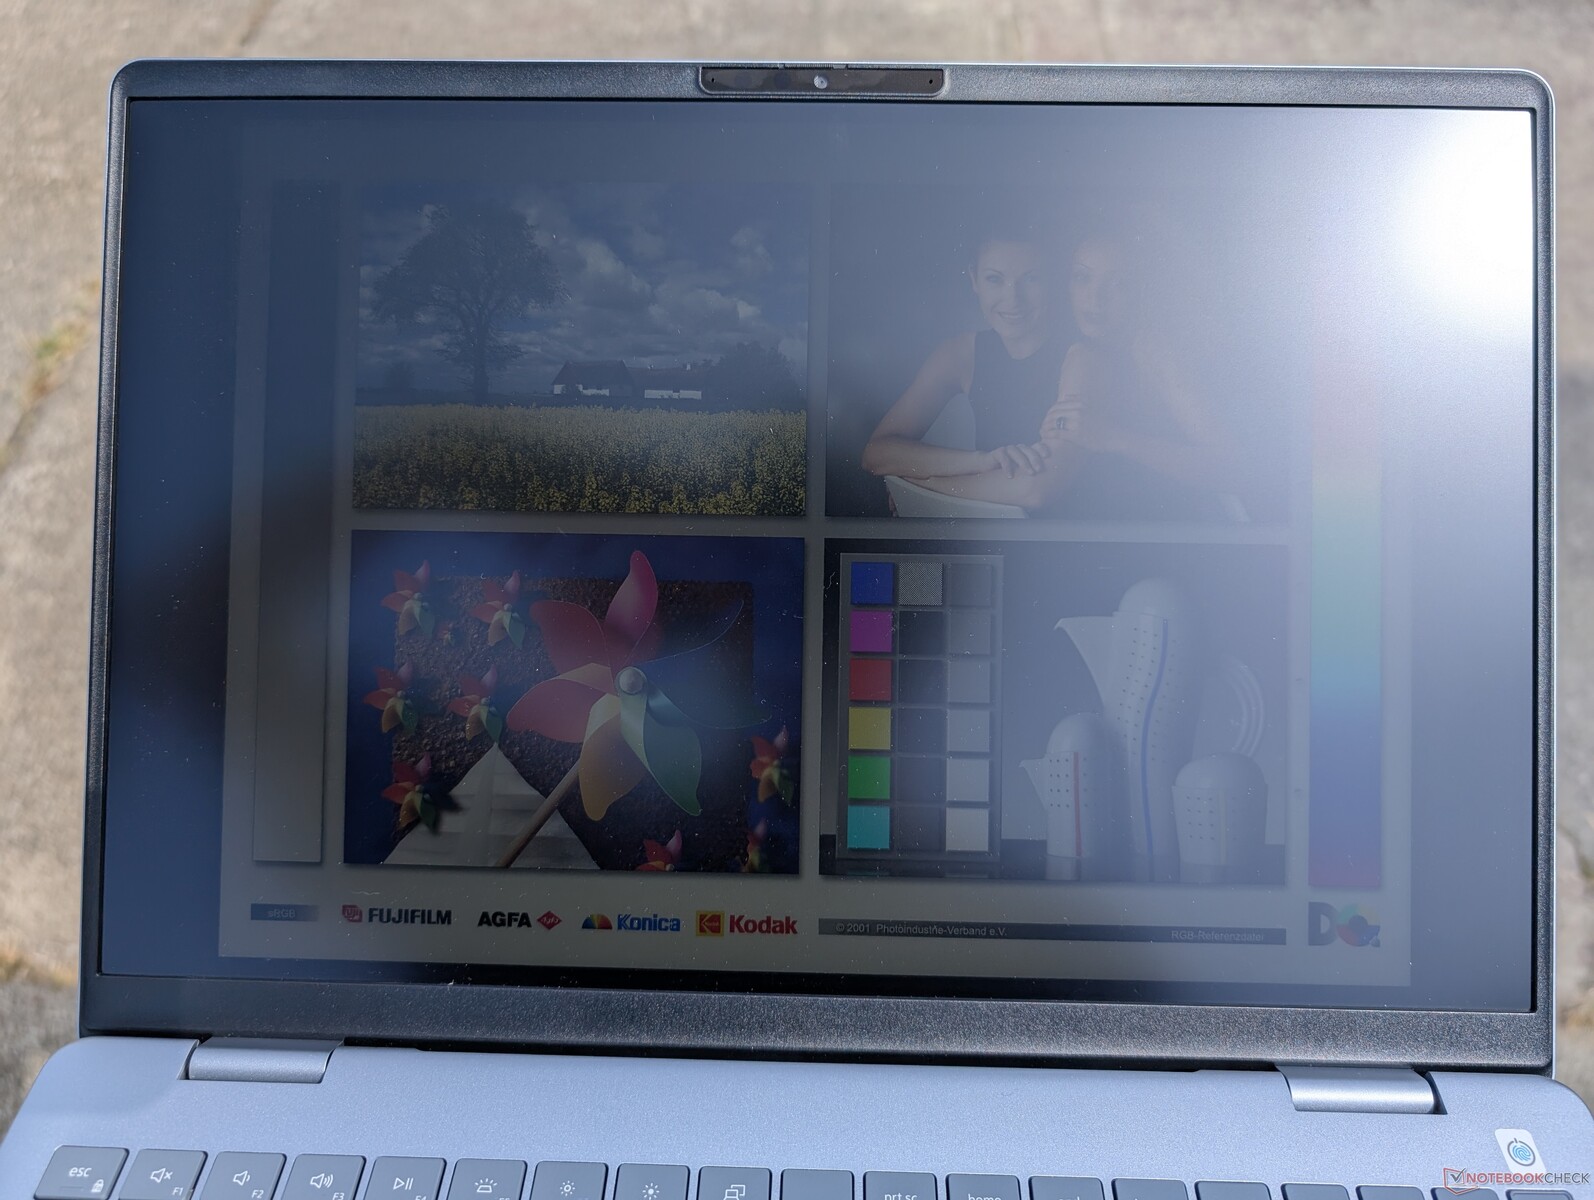
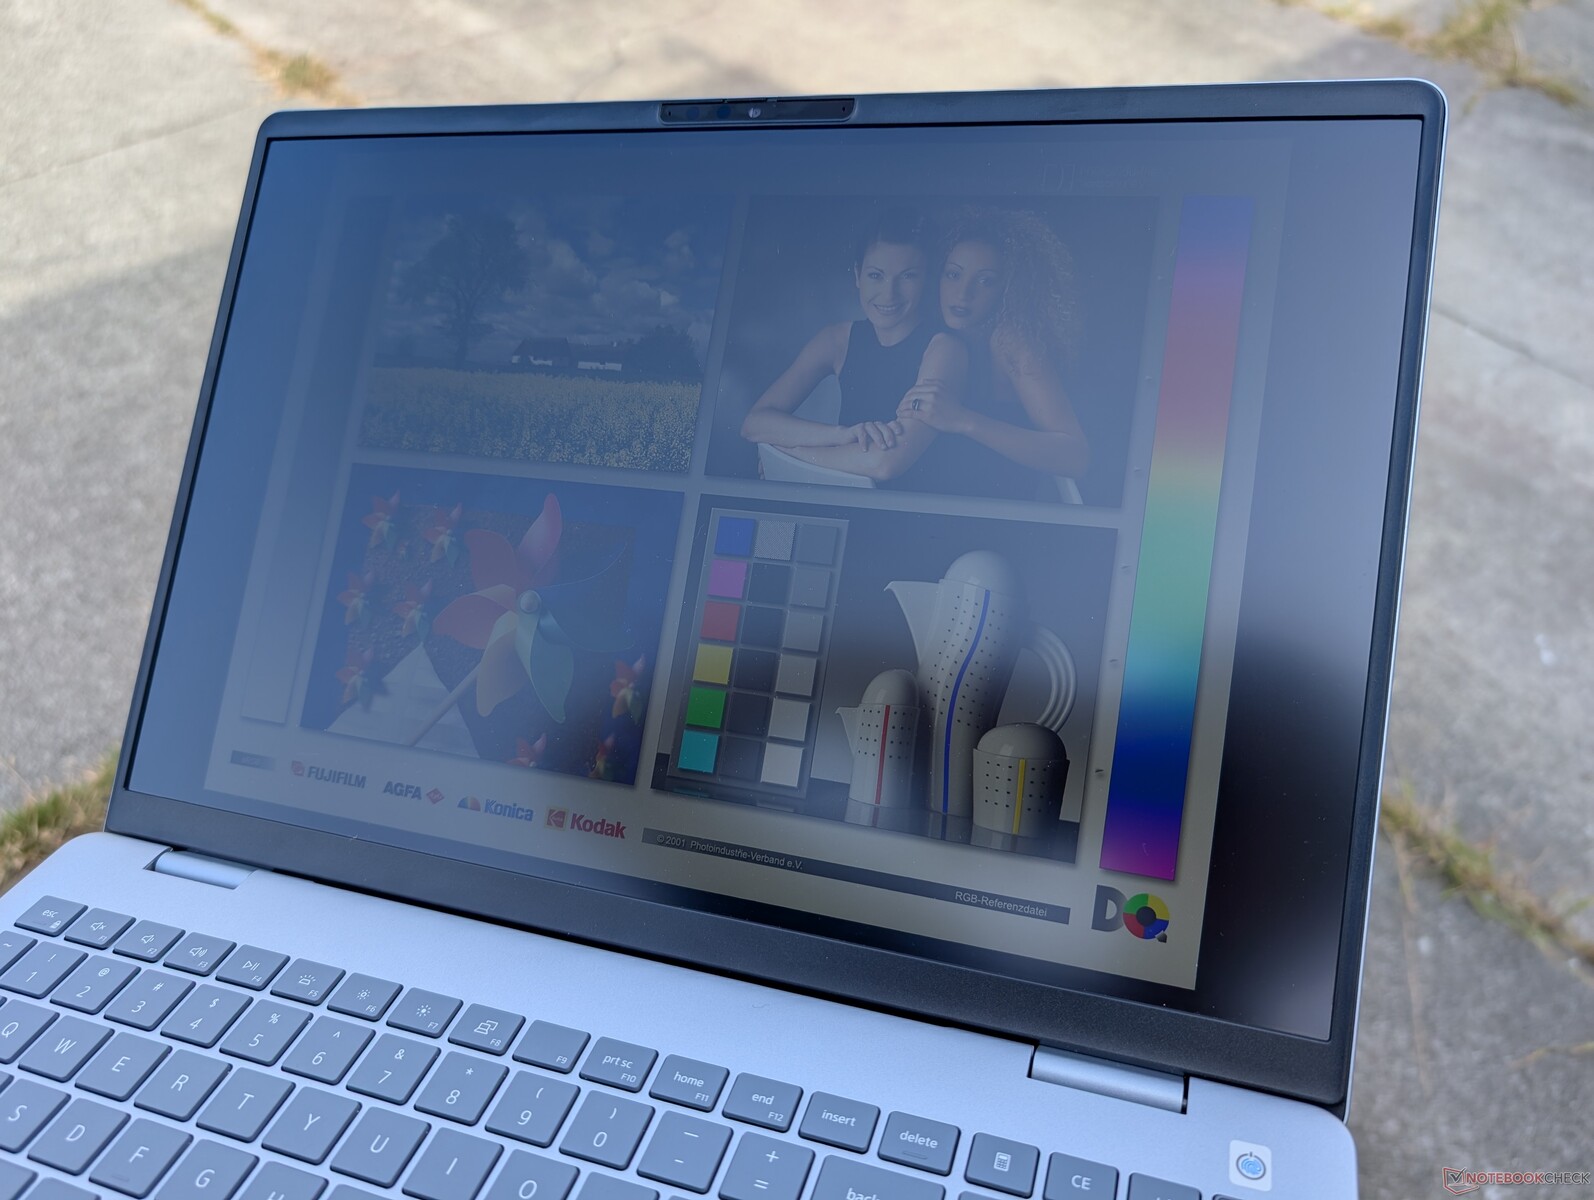
La visibilità all'aperto è scarsa, in quanto il display non è abbastanza luminoso da superare l'abbagliamento.
Prestazioni - Più efficiente con una grafica integrata più veloce
Condizioni del test
Abbiamo impostato Dell Optimizer in modalità Prestazioni prima di eseguire i benchmark qui sotto. I profili energetici di Dell sono correlati ai profili energetici predefiniti di Windows e la modifica di un profilo si sincronizza con l'altro.
Processore
Il Core Ultra 7 256V l'obiettivo è l'efficienza, pur mantenendo i livelli di prestazioni del processore grezzo della generazione precedente Core Ultra 7 155U. I modelli precedenti con opzioni Core H sono ancora significativamente più veloci, come l'Inspiron 16 7640 2-in-1. L'aggiornamento al Core Ultra 9 288V dovrebbe apportare guadagni minimi, al massimo inferiori al 10 percento, in base al tempo trascorso con l'Acer Swift 16 AI Acer Swift 16 AI.
La sostenibilità delle prestazioni potrebbe essere migliore, in quanto siamo riusciti a registrare un calo del 20 percento nel tempo durante l'esecuzione del nostro test CineBench R15 xT, come mostra il grafico sottostante.
Cinebench R15 Multi Loop
Cinebench R23: Multi Core | Single Core
Cinebench R20: CPU (Multi Core) | CPU (Single Core)
Cinebench R15: CPU Multi 64Bit | CPU Single 64Bit
Blender: v2.79 BMW27 CPU
7-Zip 18.03: 7z b 4 | 7z b 4 -mmt1
Geekbench 6.7: Multi-Core | Single-Core
Geekbench 5.5: Multi-Core | Single-Core
HWBOT x265 Benchmark v2.2: 4k Preset
LibreOffice : 20 Documents To PDF
R Benchmark 2.5: Overall mean
* ... Meglio usare valori piccoli
AIDA64: FP32 Ray-Trace | FPU Julia | CPU SHA3 | CPU Queen | FPU SinJulia | FPU Mandel | CPU AES | CPU ZLib | FP64 Ray-Trace | CPU PhotoWorxx
| Performance rating | |
| Lenovo ThinkBook 16 G7+ AMD | |
| Asus Vivobook 16 M1606K | |
| HP Pavilion Plus 16-ab0456tx | |
| Dell Inspiron 16 Plus 7640 | |
| Acer Swift 16 AI SF16-51T-932H, Ultra 9 288V | |
| Media Intel Core Ultra 7 256V | |
| Dell 16 Plus | |
| AIDA64 / FP32 Ray-Trace | |
| Lenovo ThinkBook 16 G7+ AMD | |
| Asus Vivobook 16 M1606K | |
| HP Pavilion Plus 16-ab0456tx | |
| Dell Inspiron 16 Plus 7640 | |
| Acer Swift 16 AI SF16-51T-932H, Ultra 9 288V | |
| Media Intel Core Ultra 7 256V (10524 - 12898, n=7) | |
| Dell 16 Plus | |
| AIDA64 / FPU Julia | |
| Lenovo ThinkBook 16 G7+ AMD | |
| Asus Vivobook 16 M1606K | |
| HP Pavilion Plus 16-ab0456tx | |
| Dell Inspiron 16 Plus 7640 | |
| Acer Swift 16 AI SF16-51T-932H, Ultra 9 288V | |
| Media Intel Core Ultra 7 256V (52443 - 62522, n=7) | |
| Dell 16 Plus | |
| AIDA64 / CPU SHA3 | |
| Lenovo ThinkBook 16 G7+ AMD | |
| Asus Vivobook 16 M1606K | |
| HP Pavilion Plus 16-ab0456tx | |
| Dell Inspiron 16 Plus 7640 | |
| Acer Swift 16 AI SF16-51T-932H, Ultra 9 288V | |
| Media Intel Core Ultra 7 256V (2364 - 2915, n=7) | |
| Dell 16 Plus | |
| AIDA64 / CPU Queen | |
| HP Pavilion Plus 16-ab0456tx | |
| Dell Inspiron 16 Plus 7640 | |
| Lenovo ThinkBook 16 G7+ AMD | |
| Asus Vivobook 16 M1606K | |
| Acer Swift 16 AI SF16-51T-932H, Ultra 9 288V | |
| Media Intel Core Ultra 7 256V (49622 - 49794, n=6) | |
| Dell 16 Plus | |
| AIDA64 / FPU SinJulia | |
| Lenovo ThinkBook 16 G7+ AMD | |
| Asus Vivobook 16 M1606K | |
| Dell Inspiron 16 Plus 7640 | |
| HP Pavilion Plus 16-ab0456tx | |
| Media Intel Core Ultra 7 256V (4401 - 4434, n=7) | |
| Acer Swift 16 AI SF16-51T-932H, Ultra 9 288V | |
| Dell 16 Plus | |
| AIDA64 / FPU Mandel | |
| Lenovo ThinkBook 16 G7+ AMD | |
| Asus Vivobook 16 M1606K | |
| HP Pavilion Plus 16-ab0456tx | |
| Dell Inspiron 16 Plus 7640 | |
| Acer Swift 16 AI SF16-51T-932H, Ultra 9 288V | |
| Media Intel Core Ultra 7 256V (27382 - 33019, n=7) | |
| Dell 16 Plus | |
| AIDA64 / CPU AES | |
| Lenovo ThinkBook 16 G7+ AMD | |
| Dell Inspiron 16 Plus 7640 | |
| HP Pavilion Plus 16-ab0456tx | |
| Asus Vivobook 16 M1606K | |
| Media Intel Core Ultra 7 256V (38495 - 75938, n=7) | |
| Acer Swift 16 AI SF16-51T-932H, Ultra 9 288V | |
| Dell 16 Plus | |
| AIDA64 / CPU ZLib | |
| Lenovo ThinkBook 16 G7+ AMD | |
| Dell Inspiron 16 Plus 7640 | |
| Asus Vivobook 16 M1606K | |
| HP Pavilion Plus 16-ab0456tx | |
| Media Intel Core Ultra 7 256V (536 - 632, n=7) | |
| Acer Swift 16 AI SF16-51T-932H, Ultra 9 288V | |
| Dell 16 Plus | |
| AIDA64 / FP64 Ray-Trace | |
| Lenovo ThinkBook 16 G7+ AMD | |
| Asus Vivobook 16 M1606K | |
| HP Pavilion Plus 16-ab0456tx | |
| Dell Inspiron 16 Plus 7640 | |
| Acer Swift 16 AI SF16-51T-932H, Ultra 9 288V | |
| Media Intel Core Ultra 7 256V (5655 - 6878, n=7) | |
| Dell 16 Plus | |
| AIDA64 / CPU PhotoWorxx | |
| Acer Swift 16 AI SF16-51T-932H, Ultra 9 288V | |
| Media Intel Core Ultra 7 256V (49906 - 57060, n=7) | |
| Dell 16 Plus | |
| Lenovo ThinkBook 16 G7+ AMD | |
| HP Pavilion Plus 16-ab0456tx | |
| Dell Inspiron 16 Plus 7640 | |
| Asus Vivobook 16 M1606K | |
Test da sforzo
Quando si esegue lo stress Prime95, la CPU sale a 3,2 GHz e 38 W per circa 20 secondi prima di raggiungere 83 C. Poi scende e si stabilizza a 2,5 GHz e 21 W per mantenere una temperatura del nucleo più fredda di 74 C, per rappresentare il potenziale limitato del Turbo Boost. Questo si riflette anche nel nostro test CineBench R15 xT in loop, come menzionato sopra.
Quando si esegue Cyberpunk 2077 per rappresentare lo stress tipico del gioco, il processore raggiunge di nuovo i 74 C, per essere significativamente più freddo rispetto a quanto abbiamo osservato sull'Inspiron 16 7640 2-in-1 Inspiron 16 7640 2-in-1.
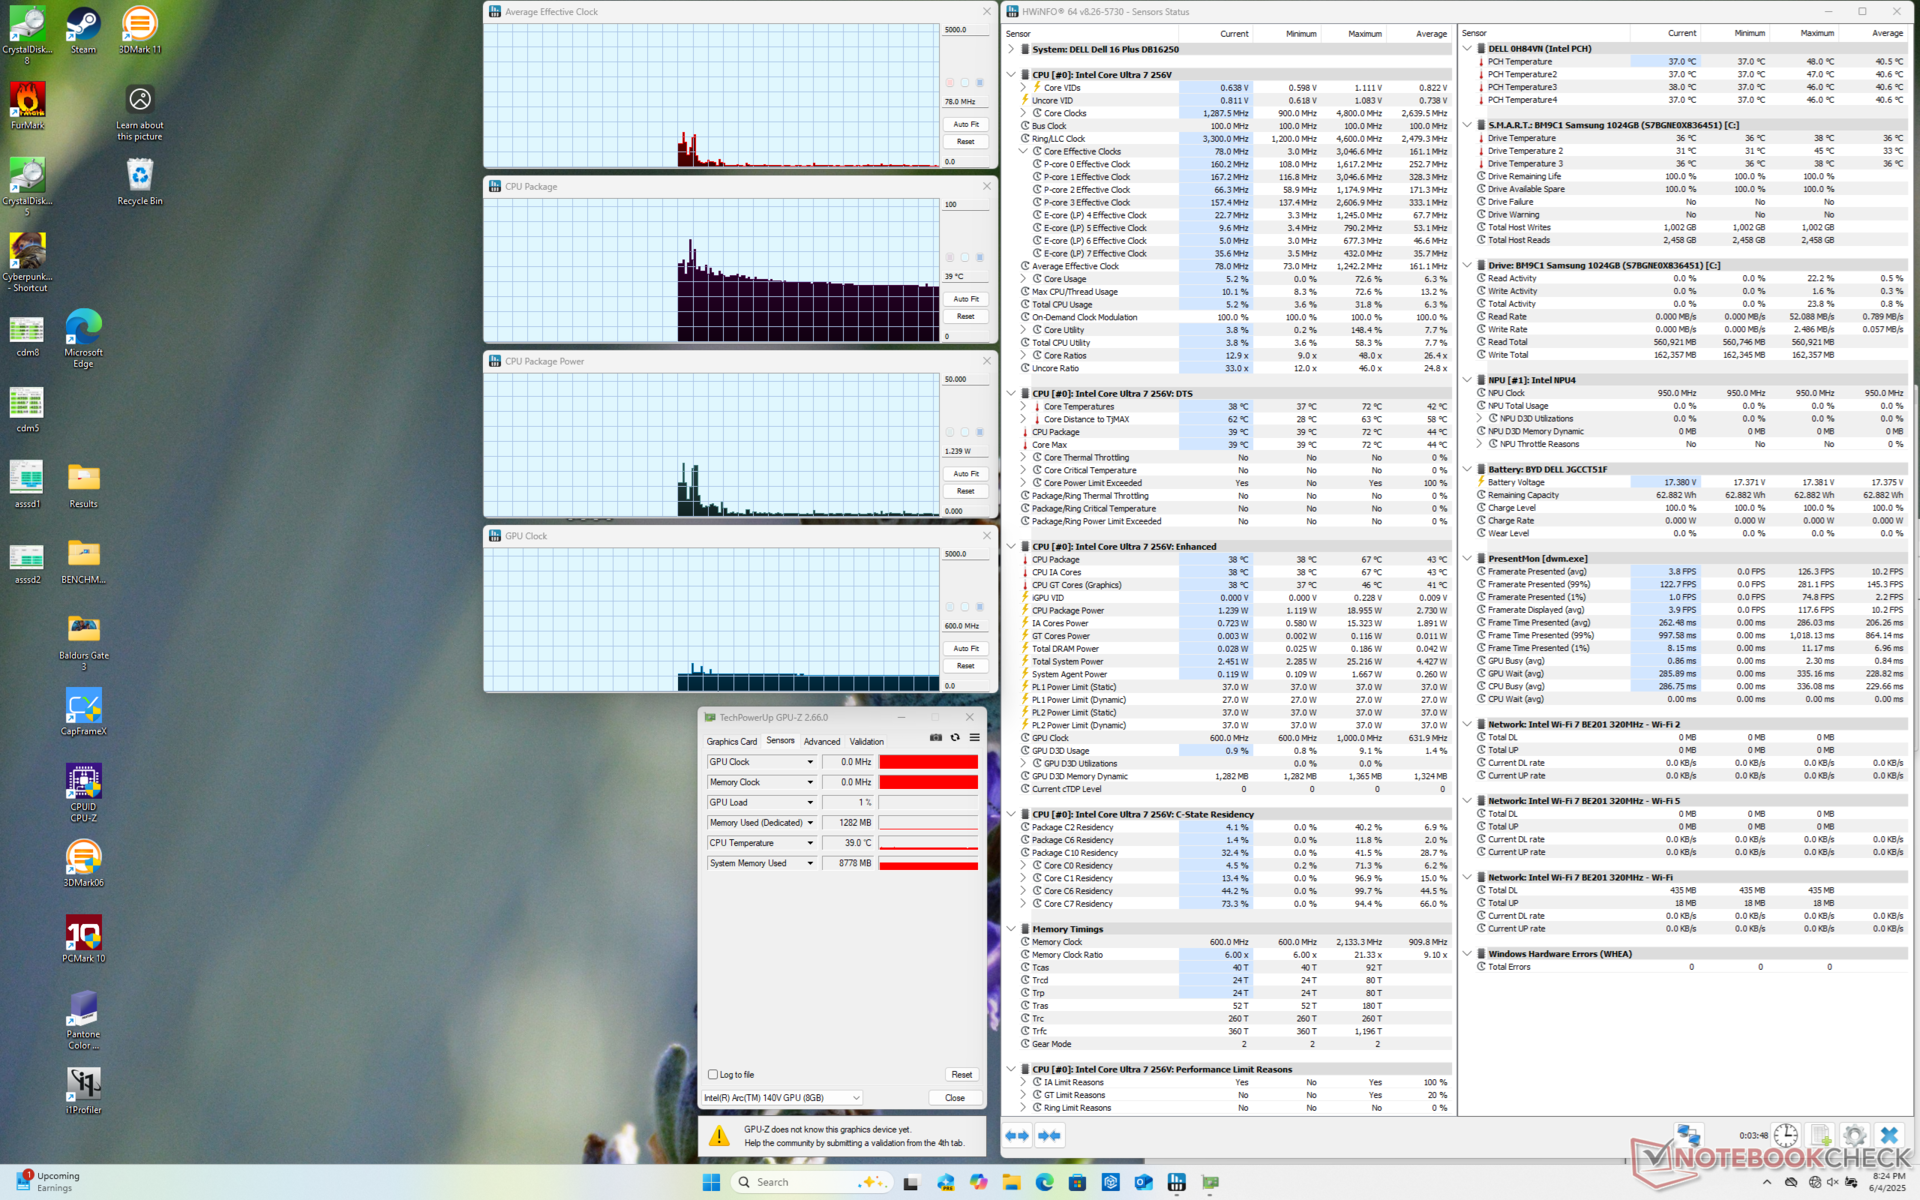
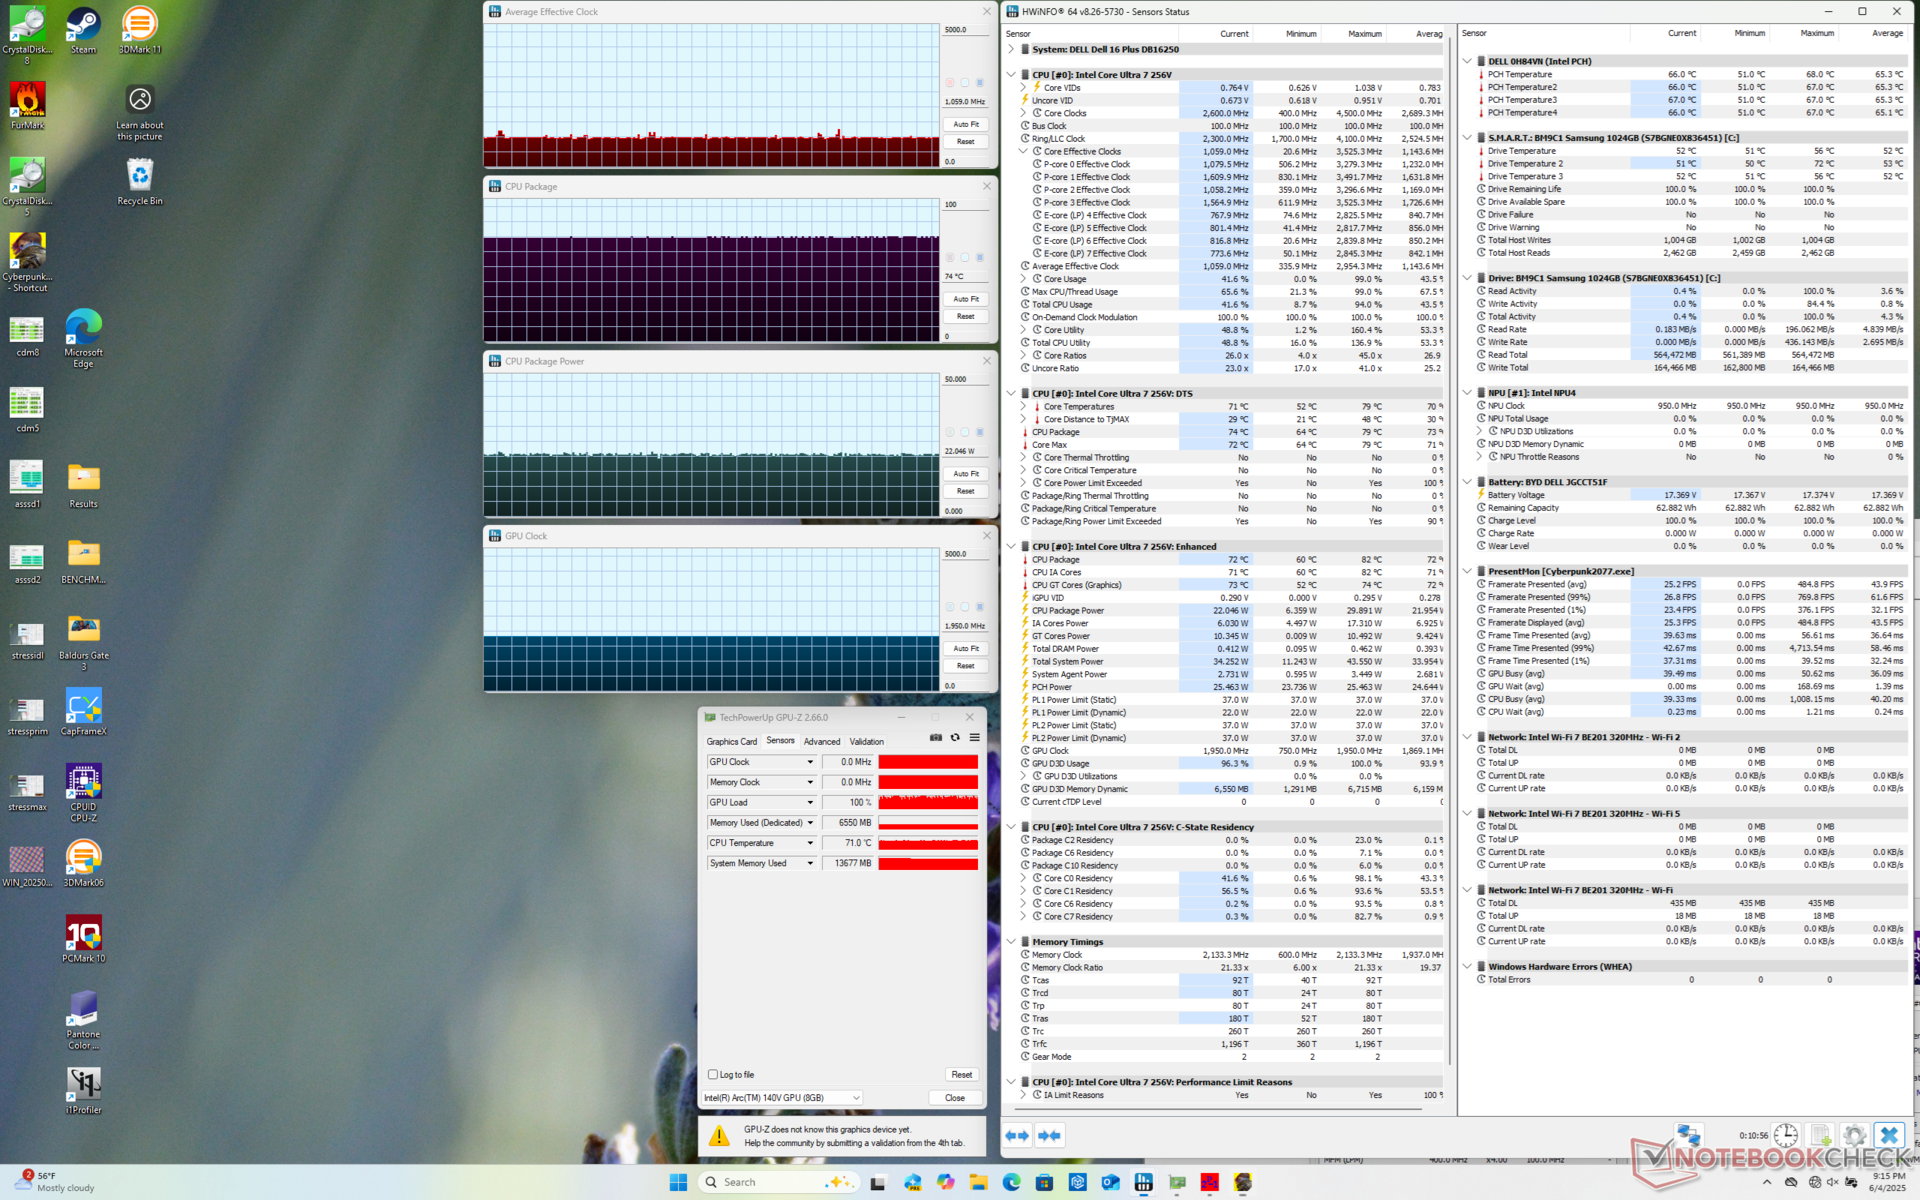
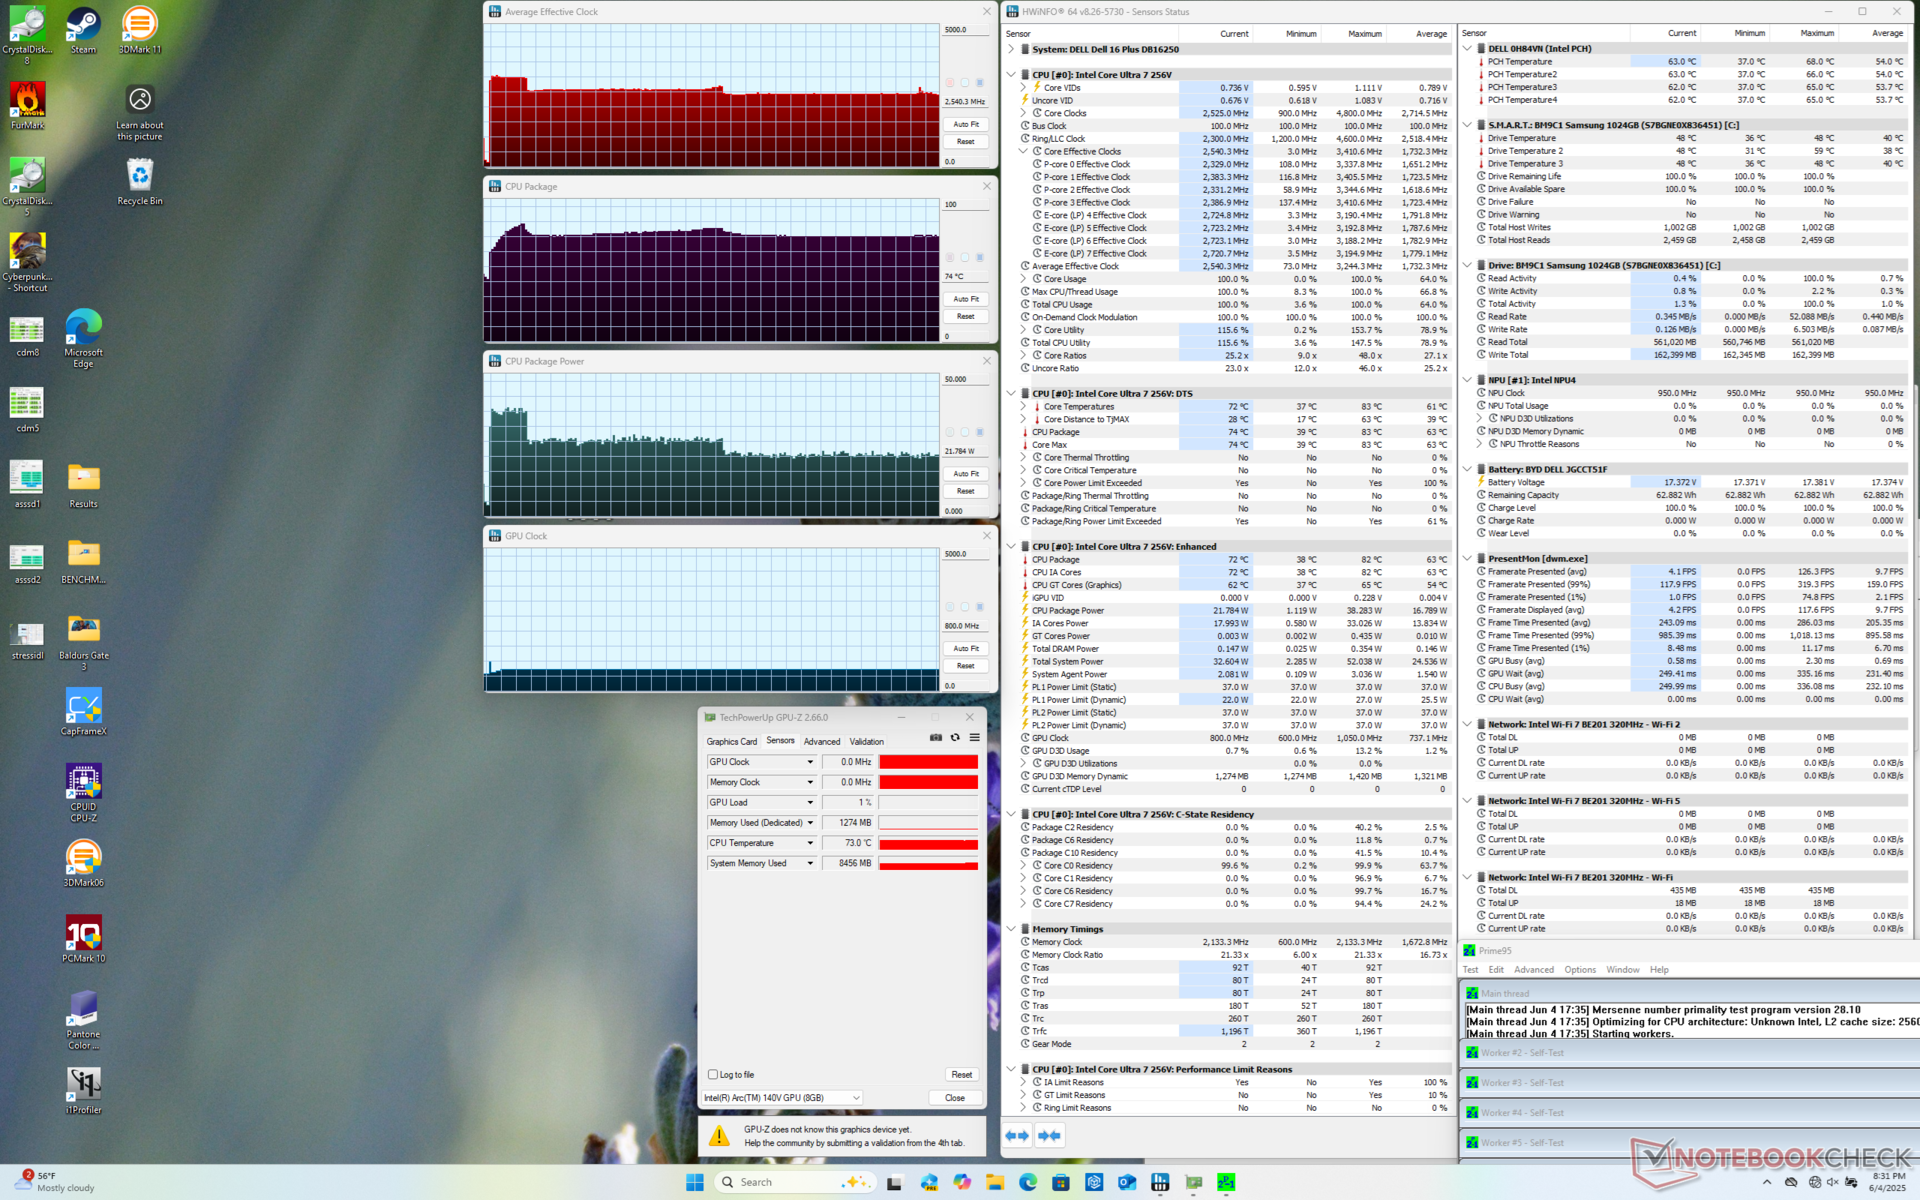
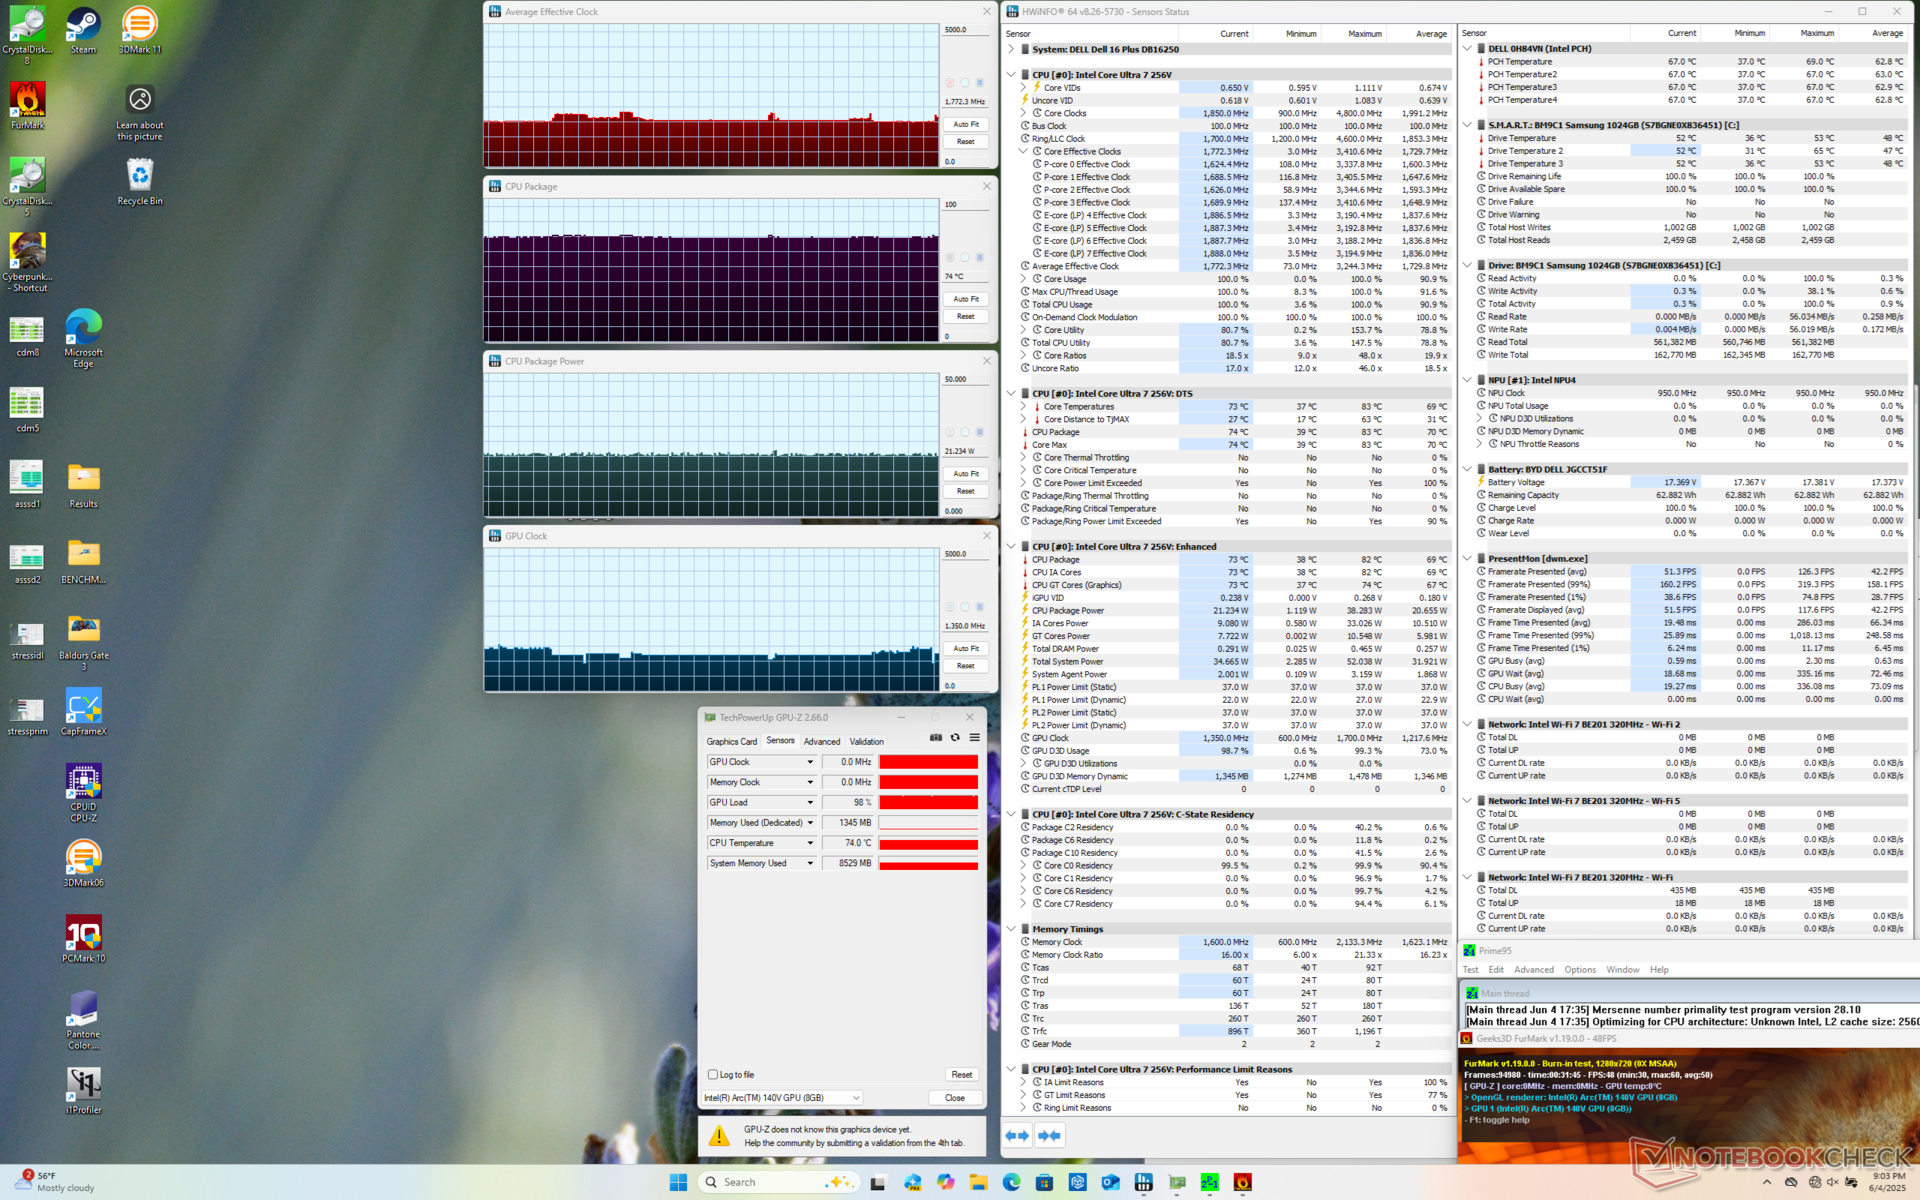
| Clock medio della CPU (GHz) | Clock della GPU (MHz) | Temperatura media della CPU (°C) | |
| Sistema inattivo | -- | -- | 39 |
| Stress Prime95 | 2,5 | -- | 74 |
| Prime95 + FurMark Stress | 1,7 | 1350 | 74 |
| Cyberpunk 2077 Stress | 1.0 | 1950 | 74 |
Prestazioni del sistema
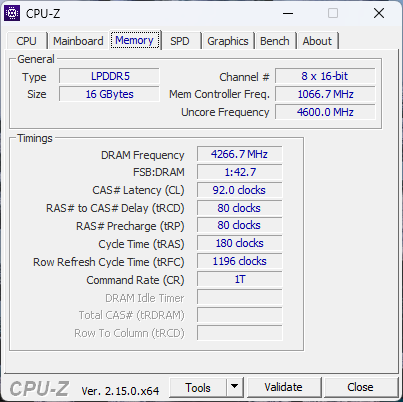
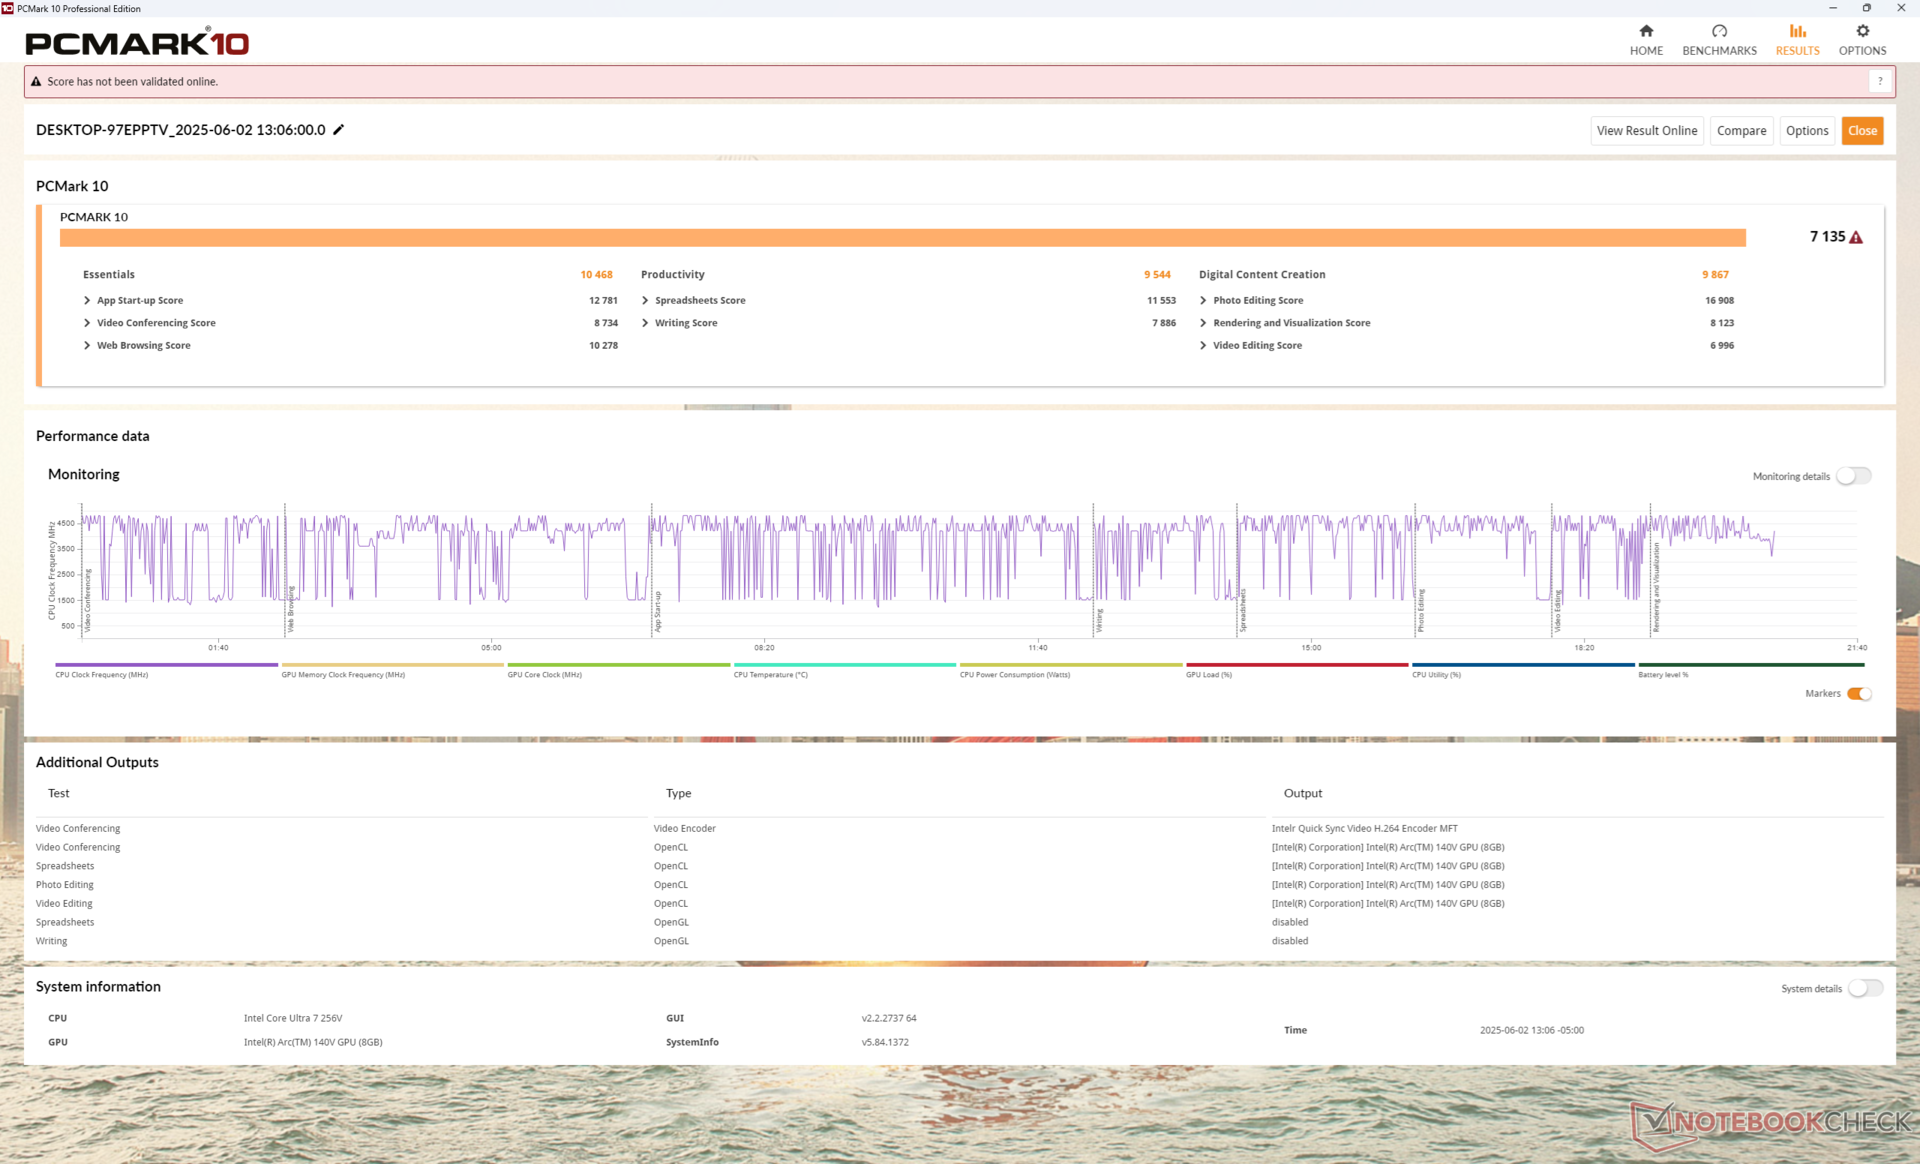
I punteggi di PCMark sono paragonabili a quelli dei portatili da 16 pollici della concorrenza, compresi quelli con CPU serie H più veloci, come l'Asus Vivobook 16 M160K Asus Vivobook 16 M1606K. Anche le prestazioni della RAM sono eccellenti, grazie al design on-package di Lunar Lake.
PCMark 10: Score | Essentials | Productivity | Digital Content Creation
CrossMark: Overall | Productivity | Creativity | Responsiveness
WebXPRT 3: Overall
WebXPRT 4: Overall
Mozilla Kraken 1.1: Total
| Performance rating | |
| Lenovo ThinkBook 16 G7+ AMD | |
| Acer Swift 16 AI SF16-51T-932H, Ultra 9 288V | |
| Dell 16 Plus | |
| Media Intel Core Ultra 7 256V, Intel Arc Graphics 140V | |
| Asus Vivobook 16 M1606K | |
| HP Pavilion Plus 16-ab0456tx | |
| Dell Inspiron 16 Plus 7640 | |
| PCMark 10 / Score | |
| Lenovo ThinkBook 16 G7+ AMD | |
| Acer Swift 16 AI SF16-51T-932H, Ultra 9 288V | |
| Dell 16 Plus | |
| Media Intel Core Ultra 7 256V, Intel Arc Graphics 140V (6677 - 7702, n=7) | |
| Dell Inspiron 16 Plus 7640 | |
| Asus Vivobook 16 M1606K | |
| HP Pavilion Plus 16-ab0456tx | |
| PCMark 10 / Essentials | |
| Asus Vivobook 16 M1606K | |
| Lenovo ThinkBook 16 G7+ AMD | |
| Acer Swift 16 AI SF16-51T-932H, Ultra 9 288V | |
| Dell 16 Plus | |
| Dell Inspiron 16 Plus 7640 | |
| Media Intel Core Ultra 7 256V, Intel Arc Graphics 140V (9627 - 11365, n=7) | |
| HP Pavilion Plus 16-ab0456tx | |
| PCMark 10 / Productivity | |
| Lenovo ThinkBook 16 G7+ AMD | |
| Asus Vivobook 16 M1606K | |
| Media Intel Core Ultra 7 256V, Intel Arc Graphics 140V (8161 - 12672, n=7) | |
| Dell 16 Plus | |
| Acer Swift 16 AI SF16-51T-932H, Ultra 9 288V | |
| HP Pavilion Plus 16-ab0456tx | |
| Dell Inspiron 16 Plus 7640 | |
| PCMark 10 / Digital Content Creation | |
| Dell Inspiron 16 Plus 7640 | |
| Lenovo ThinkBook 16 G7+ AMD | |
| Acer Swift 16 AI SF16-51T-932H, Ultra 9 288V | |
| Dell 16 Plus | |
| Media Intel Core Ultra 7 256V, Intel Arc Graphics 140V (9481 - 10126, n=7) | |
| Asus Vivobook 16 M1606K | |
| HP Pavilion Plus 16-ab0456tx | |
| CrossMark / Overall | |
| HP Pavilion Plus 16-ab0456tx | |
| Lenovo ThinkBook 16 G7+ AMD | |
| Acer Swift 16 AI SF16-51T-932H, Ultra 9 288V | |
| Asus Vivobook 16 M1606K | |
| Media Intel Core Ultra 7 256V, Intel Arc Graphics 140V (1636 - 1736, n=7) | |
| Dell Inspiron 16 Plus 7640 | |
| Dell 16 Plus | |
| CrossMark / Productivity | |
| Acer Swift 16 AI SF16-51T-932H, Ultra 9 288V | |
| HP Pavilion Plus 16-ab0456tx | |
| Media Intel Core Ultra 7 256V, Intel Arc Graphics 140V (1563 - 1682, n=7) | |
| Asus Vivobook 16 M1606K | |
| Dell 16 Plus | |
| Lenovo ThinkBook 16 G7+ AMD | |
| Dell Inspiron 16 Plus 7640 | |
| CrossMark / Creativity | |
| Lenovo ThinkBook 16 G7+ AMD | |
| HP Pavilion Plus 16-ab0456tx | |
| Acer Swift 16 AI SF16-51T-932H, Ultra 9 288V | |
| Dell Inspiron 16 Plus 7640 | |
| Media Intel Core Ultra 7 256V, Intel Arc Graphics 140V (1862 - 1962, n=7) | |
| Dell 16 Plus | |
| Asus Vivobook 16 M1606K | |
| CrossMark / Responsiveness | |
| HP Pavilion Plus 16-ab0456tx | |
| Asus Vivobook 16 M1606K | |
| Lenovo ThinkBook 16 G7+ AMD | |
| Dell Inspiron 16 Plus 7640 | |
| Acer Swift 16 AI SF16-51T-932H, Ultra 9 288V | |
| Media Intel Core Ultra 7 256V, Intel Arc Graphics 140V (1215 - 1371, n=7) | |
| Dell 16 Plus | |
| WebXPRT 3 / Overall | |
| Lenovo ThinkBook 16 G7+ AMD | |
| Dell 16 Plus | |
| Acer Swift 16 AI SF16-51T-932H, Ultra 9 288V | |
| Media Intel Core Ultra 7 256V, Intel Arc Graphics 140V (243 - 310, n=7) | |
| Asus Vivobook 16 M1606K | |
| Dell Inspiron 16 Plus 7640 | |
| HP Pavilion Plus 16-ab0456tx | |
| WebXPRT 4 / Overall | |
| Media Intel Core Ultra 7 256V, Intel Arc Graphics 140V (282 - 286, n=7) | |
| Dell 16 Plus | |
| Acer Swift 16 AI SF16-51T-932H, Ultra 9 288V | |
| HP Pavilion Plus 16-ab0456tx | |
| Dell Inspiron 16 Plus 7640 | |
| Lenovo ThinkBook 16 G7+ AMD | |
| Asus Vivobook 16 M1606K | |
| Mozilla Kraken 1.1 / Total | |
| Dell Inspiron 16 Plus 7640 | |
| HP Pavilion Plus 16-ab0456tx | |
| Media Intel Core Ultra 7 256V, Intel Arc Graphics 140V (470 - 480, n=7) | |
| Dell 16 Plus | |
| Acer Swift 16 AI SF16-51T-932H, Ultra 9 288V | |
| Asus Vivobook 16 M1606K | |
| Lenovo ThinkBook 16 G7+ AMD | |
* ... Meglio usare valori piccoli
| PCMark 10 Score | 7135 punti | |
Aiuto | ||
| AIDA64 / Memory Copy | |
| Acer Swift 16 AI SF16-51T-932H, Ultra 9 288V | |
| Media Intel Core Ultra 7 256V (99227 - 104459, n=7) | |
| Dell 16 Plus | |
| Lenovo ThinkBook 16 G7+ AMD | |
| HP Pavilion Plus 16-ab0456tx | |
| Dell Inspiron 16 Plus 7640 | |
| Asus Vivobook 16 M1606K | |
| AIDA64 / Memory Read | |
| Lenovo ThinkBook 16 G7+ AMD | |
| Dell 16 Plus | |
| Media Intel Core Ultra 7 256V (86352 - 89848, n=7) | |
| Acer Swift 16 AI SF16-51T-932H, Ultra 9 288V | |
| Dell Inspiron 16 Plus 7640 | |
| HP Pavilion Plus 16-ab0456tx | |
| Asus Vivobook 16 M1606K | |
| AIDA64 / Memory Write | |
| Dell 16 Plus | |
| Media Intel Core Ultra 7 256V (108692 - 117933, n=7) | |
| Acer Swift 16 AI SF16-51T-932H, Ultra 9 288V | |
| Lenovo ThinkBook 16 G7+ AMD | |
| HP Pavilion Plus 16-ab0456tx | |
| Dell Inspiron 16 Plus 7640 | |
| Asus Vivobook 16 M1606K | |
| AIDA64 / Memory Latency | |
| Dell Inspiron 16 Plus 7640 | |
| Lenovo ThinkBook 16 G7+ AMD | |
| Dell 16 Plus | |
| Media Intel Core Ultra 7 256V (96.1 - 99.6, n=7) | |
| Acer Swift 16 AI SF16-51T-932H, Ultra 9 288V | |
| HP Pavilion Plus 16-ab0456tx | |
| Asus Vivobook 16 M1606K | |
* ... Meglio usare valori piccoli
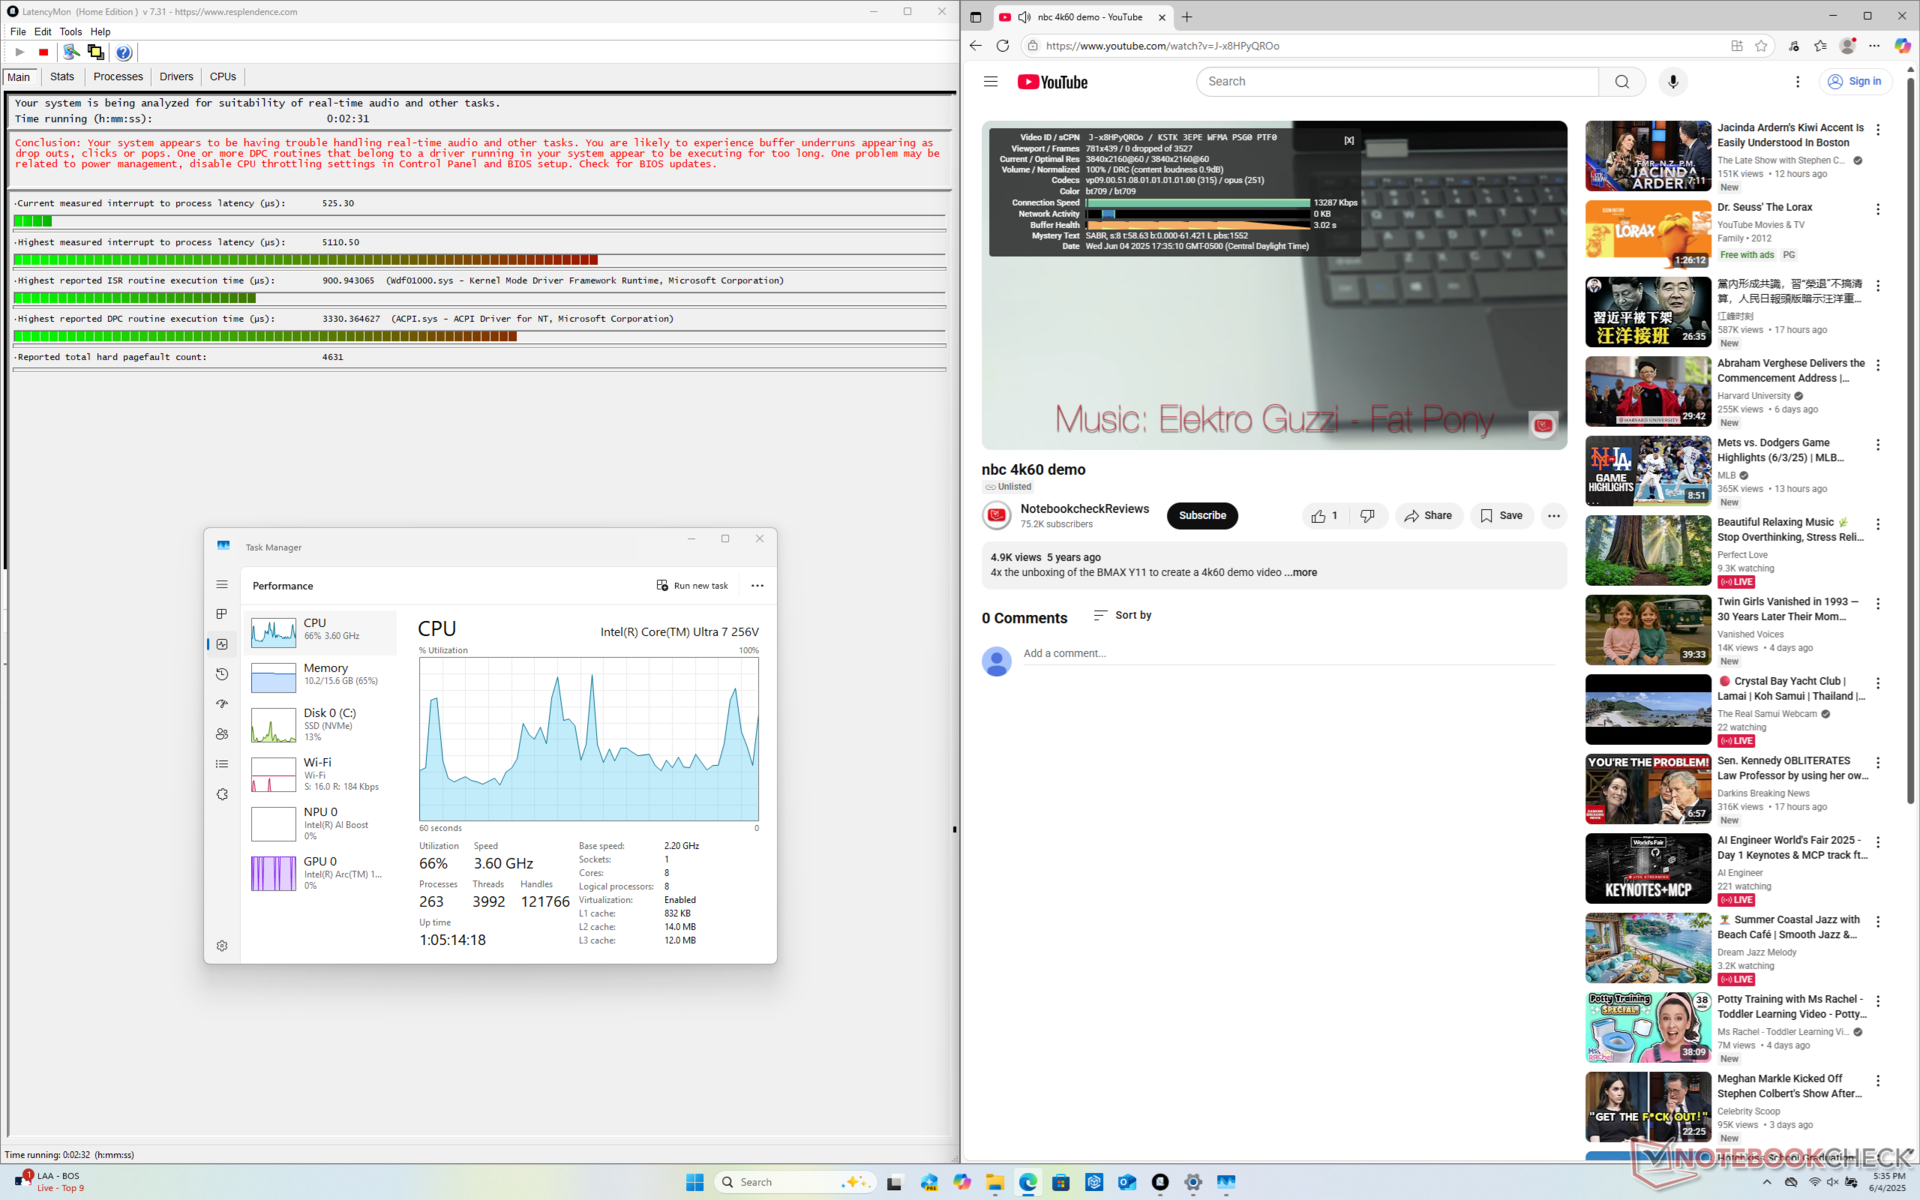
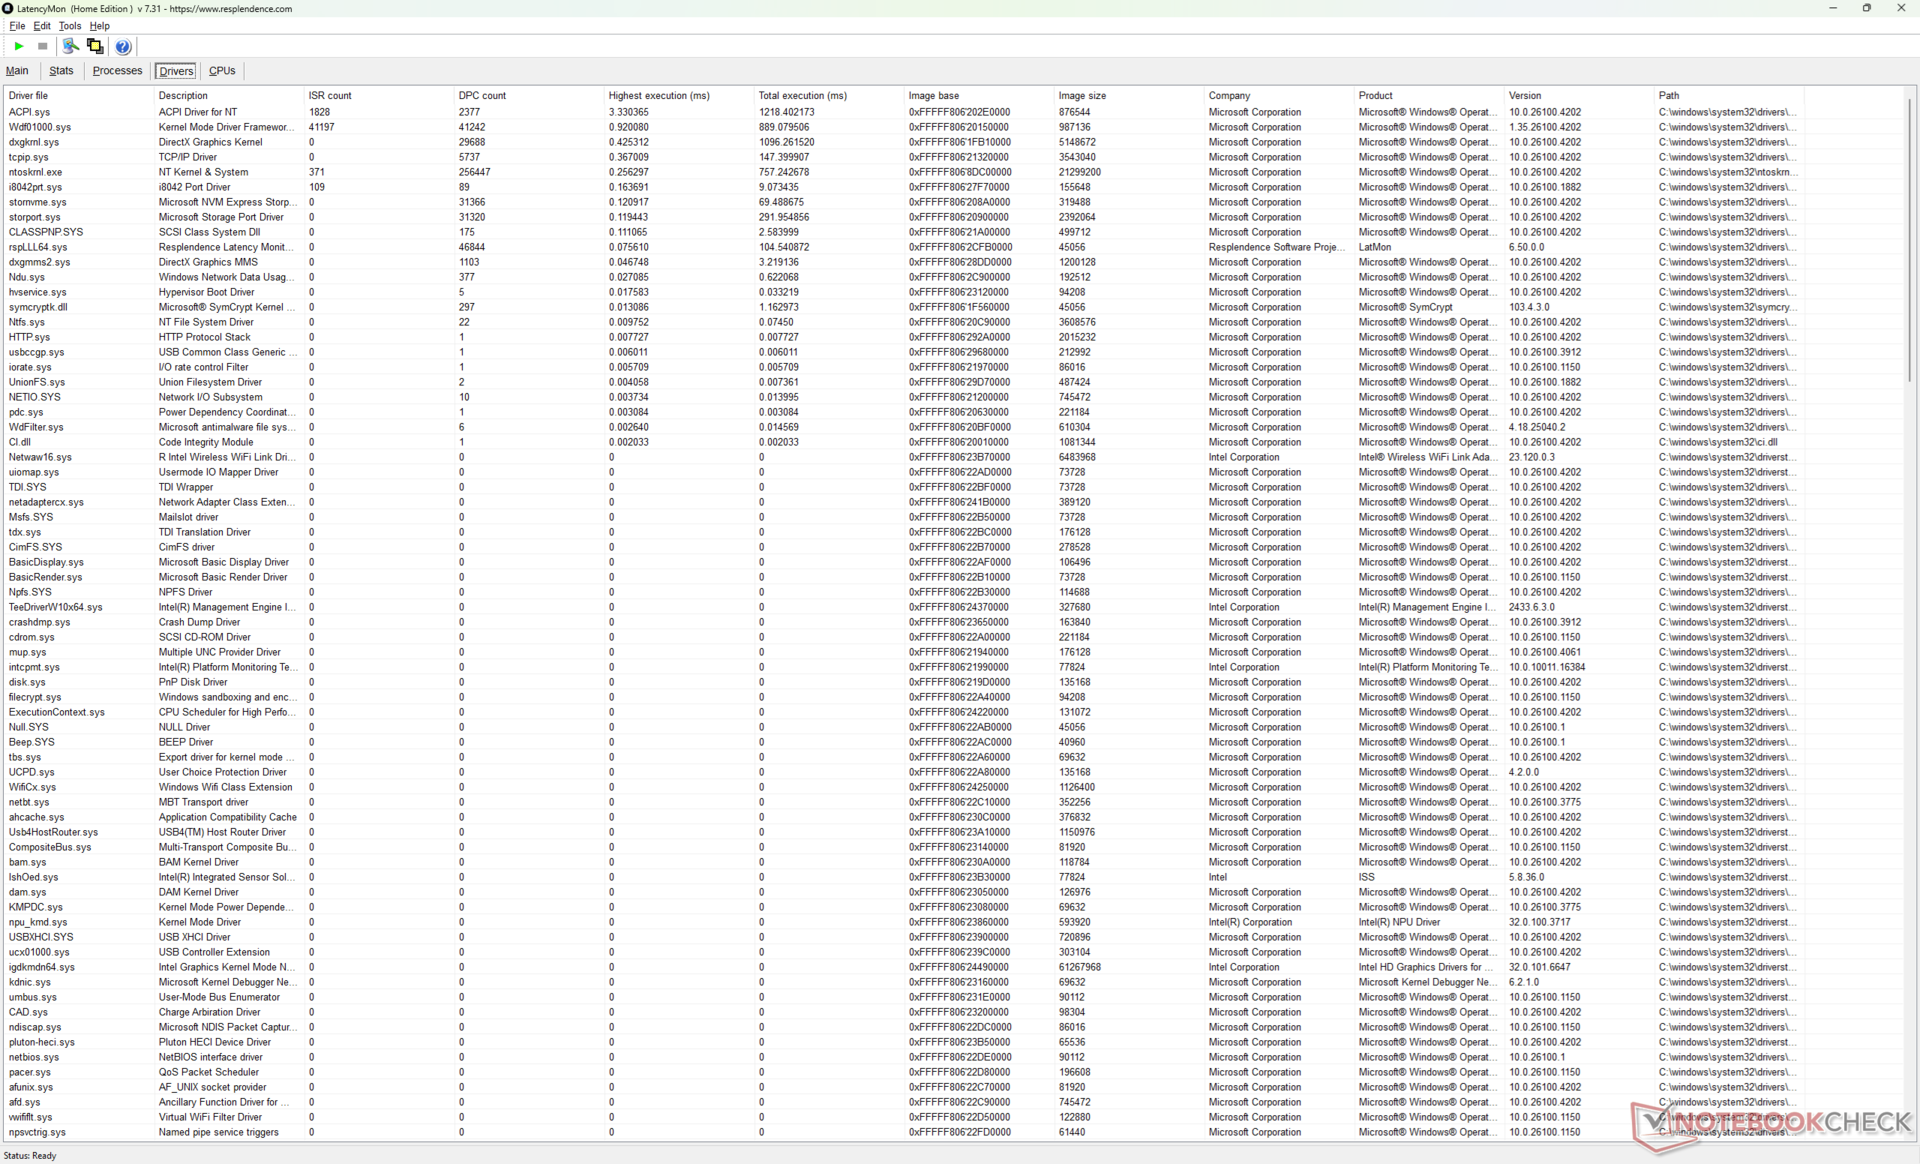
Latenza DPC
LatencyMon rivela problemi di DPC quando si aprono più schede del browser della nostra homepage. Stranamente, l'attività della GPU oscilla tra lo 0 e il 100 percento durante la riproduzione di video 4K60, mentre la GPU è stabile a ~40 percento sulla maggior parte degli altri laptop Lunar Lake. Per il resto, non ci sono cadute di fotogrammi registrate per un'esperienza di streaming 4K60 fluida.
| DPC Latencies / LatencyMon - interrupt to process latency (max), Web, Youtube, Prime95 | |
| HP Pavilion Plus 16-ab0456tx | |
| Dell 16 Plus | |
| Acer Swift 16 AI SF16-51T-932H, Ultra 9 288V | |
| Lenovo ThinkBook 16 G7+ AMD | |
| Asus Vivobook 16 M1606K | |
| Dell Inspiron 16 Plus 7640 | |
* ... Meglio usare valori piccoli
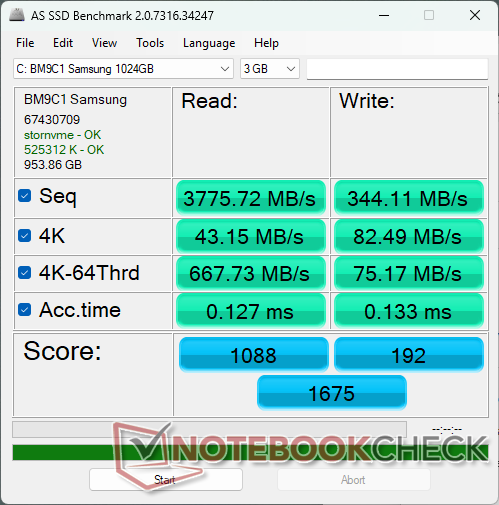
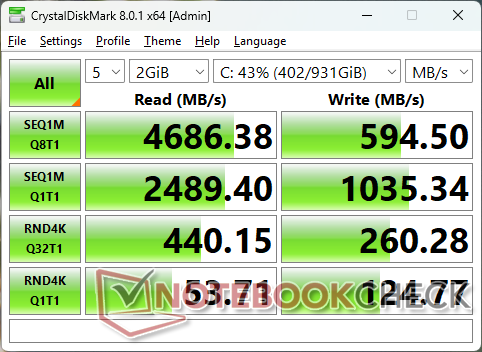
Dispositivi di archiviazione
Il Samsung BM9C1 è inferiore al Micron 2550 dell'Inspiron 16 7640 2-in-1 dello scorso anno. Le velocità di trasferimento non sono stabili, in quanto fluttuano tra 3600 MB/s e 4900 MB/s e addirittura fino a 2200 MB/s durante il nostro test DiskSpd loop.

| Drive Performance rating - Percent | |
| HP Pavilion Plus 16-ab0456tx | |
| Asus Vivobook 16 M1606K | |
| Lenovo ThinkBook 16 G7+ AMD | |
| Dell Inspiron 16 Plus 7640 | |
| Acer Swift 16 AI SF16-51T-932H, Ultra 9 288V | |
| Dell 16 Plus | |
* ... Meglio usare valori piccoli
Disk Throttling: DiskSpd Read Loop, Queue Depth 8
Prestazioni della GPU
Il Arc 140V è un discreto miglioramento rispetto al modello Arc 8. Infatti, il Dell 16 Plus esegue la maggior parte dei giochi in modo costantemente più veloce rispetto all'Inspiron 16 7640 2-in-1 dello scorso anno, fino al 25%, anche se quest'ultimo viene fornito con una CPU Core-H molto più veloce.
| Profilo di potenza | Punteggio grafico | Punteggio Fisica | Punteggio combinato |
| Modalità prestazioni | 9682 | 19037 | 3057 |
| Modalità equilibrata | 8164 (-16%) | 16591 (-13%) | 2296 (-25%) |
| Alimentazione a batteria | 8266 (-15%) | 16361 (-14%) | 2350 (-23%) |
L'esecuzione in modalità Bilanciata invece che in modalità Prestazioni ha un impatto sulle prestazioni complessive di un certo margine, come mostra la nostra tabella dei risultati Fire Strike qui sopra.
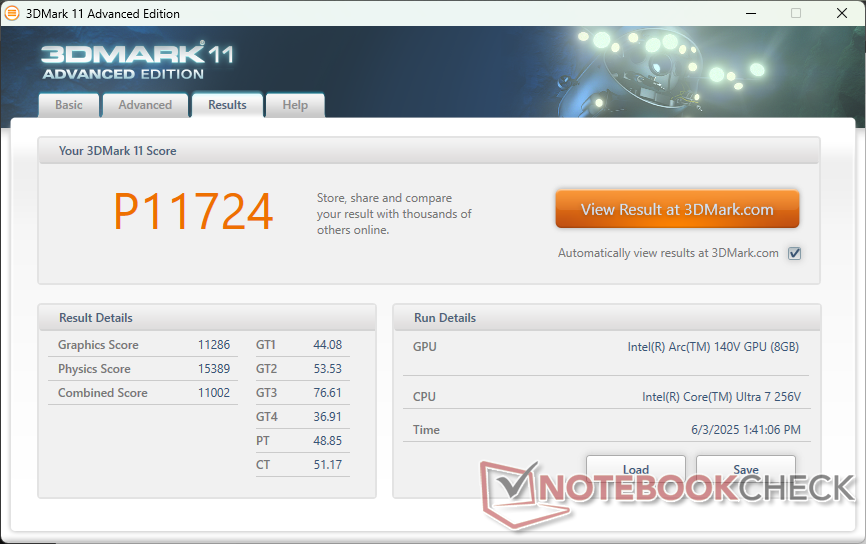

| 3DMark 11 Performance | 11724 punti | |
| 3DMark Fire Strike Score | 8470 punti | |
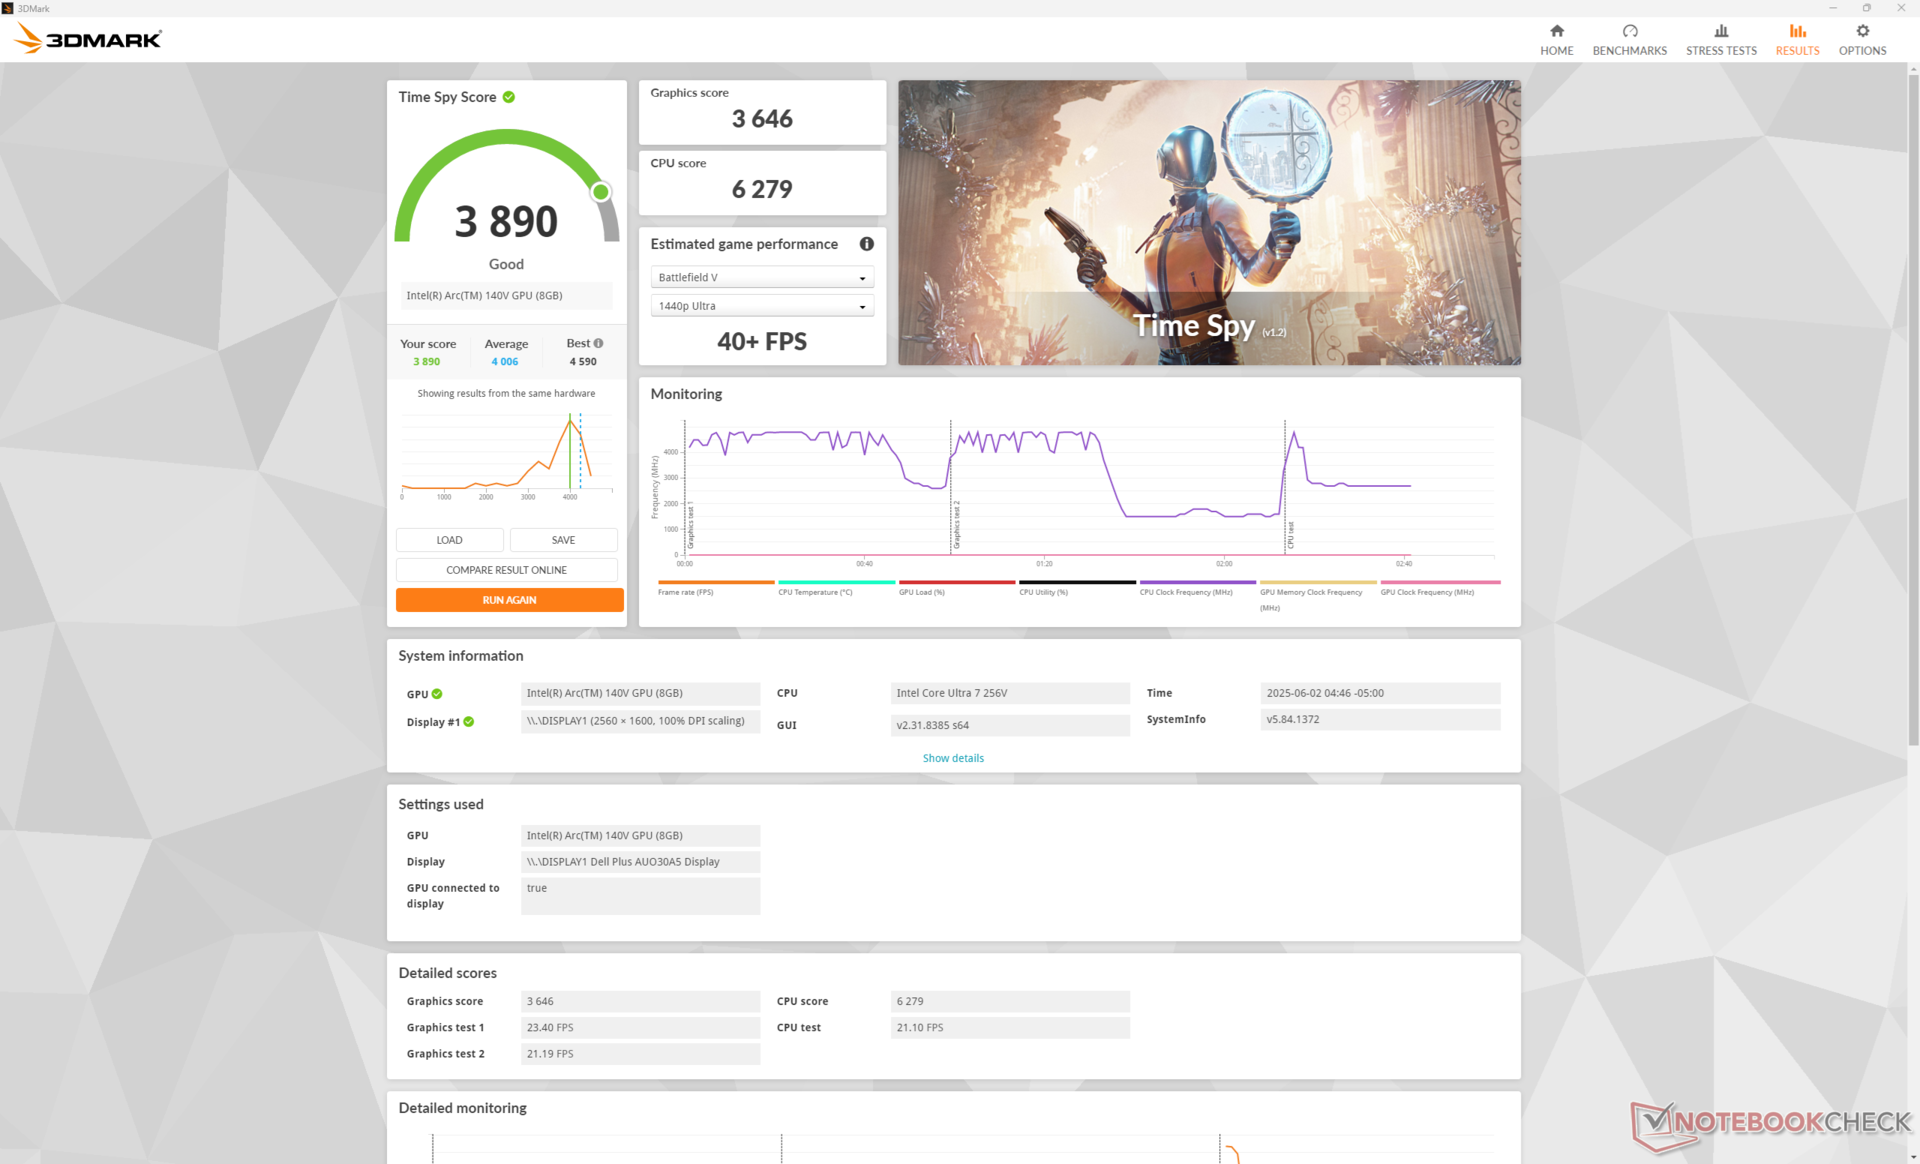
| 3DMark Time Spy Score | 3890 punti | |
Aiuto | ||
* ... Meglio usare valori piccoli
Prestazioni di gioco
La maggior parte dei titoli gira bene sul sistema a 1080p nativo e a impostazioni basse, compreso Baldur's Gate 3. I titoli più impegnativi come Cyberpunk 2077, invece, potrebbero dover scendere a 720p per un'esperienza più fluida.
| F1 24 | |
| 1920x1080 Low Preset AA:T AF:16x | |
| Media Intel Arc Graphics 140V (54 - 99, n=25) | |
| Dell 16 Plus | |
| Lenovo ThinkPad T16 Gen 3 21MN005XGE | |
| 1920x1080 Medium Preset AA:T AF:16x | |
| Media Intel Arc Graphics 140V (49.2 - 88.2, n=24) | |
| Dell 16 Plus | |
| Lenovo ThinkPad T16 Gen 3 21MN005XGE | |
| 1920x1080 High Preset AA:T AF:16x | |
| Media Intel Arc Graphics 140V (34.4 - 66.4, n=27) | |
| Dell 16 Plus | |
| LG Gram Pro 16Z90TS-G.AU89G | |
| Lenovo ThinkPad T16 Gen 3 21MN005XGE | |
| 1920x1080 Ultra High Preset AA:T AF:16x | |
| Dell 16 Plus | |
| Media Intel Arc Graphics 140V (14.6 - 22, n=25) | |
| Lenovo ThinkPad T16 Gen 3 21MN005XGE | |
Cyberpunk 2077 ultra FPS Chart
| basso | medio | alto | ultra | |
|---|---|---|---|---|
| Dota 2 Reborn (2015) | 98.3 | 70.3 | 71.1 | 71.9 |
| Final Fantasy XV Benchmark (2018) | 80.5 | 45.7 | 33.3 | |
| X-Plane 11.11 (2018) | 51.2 | 39.7 | 35.7 | |
| Strange Brigade (2018) | 205 | 81 | 68 | 56.9 |
| Baldur's Gate 3 (2023) | 38.1 | 31 | 27.7 | 27 |
| Cyberpunk 2077 (2023) | 44.2 | 35.2 | 24.7 | 24.1 |
| F1 24 (2024) | 75.3 | 70.7 | 55.3 | 18.8 |
Emissioni
Rumore del sistema
La ventola interna è generalmente letargica in risposta ai carichi, il che significa che aumenta lentamente quando si avviano o si eseguono applicazioni più impegnative. Questo è un bene, perché ci vuole più tempo prima che il rumore della ventola diventi più evidente durante l'uso intenso. Dopo un po', tuttavia, il sistema raggiunge un livello massimo simile a quello della maggior parte degli altri computer portatili multimediali da 16 pollici, tra cui l'Acer Swift 16 AI o l'Asus Vivobook 16.
Rumorosità
| Idle |
| 23.5 / 23.5 / 23.5 dB(A) |
| Sotto carico |
| 31.9 / 46.9 dB(A) |
 | ||
30 dB silenzioso 40 dB(A) udibile 50 dB(A) rumoroso |
||
min: | ||
| Dell 16 Plus Arc 140V, Core Ultra 7 256V, Samsung BM9C1 1024GB | Dell Inspiron 16 Plus 7640 GeForce RTX 4060 Laptop GPU, Ultra 7 155H, SK hynix BC901 HFS001TEJ4X164N | Acer Swift 16 AI SF16-51T-932H, Ultra 9 288V Arc 140V, Core Ultra 9 288V, Western Digital PC SN5000S SDEQNSJ-1T00 | Lenovo ThinkBook 16 G7+ AMD Radeon 880M, Ryzen AI 9 365, Samsung PM9C1a MZAL81T0HDLB | HP Pavilion Plus 16-ab0456tx GeForce RTX 3050 6GB Laptop GPU, i7-13700H, WDC PC SN810 1TB | Asus Vivobook 16 M1606K Radeon 860M, Ryzen AI 7 350, Micron 2500 1TB MTFDKBA1T0QGN | |
|---|---|---|---|---|---|---|
| Noise | -2% | -6% | -2% | -0% | 2% | |
| off /ambiente * (dB) | 23.4 | 23.8 -2% | 25.8 -10% | 24.5 -5% | 22.22 5% | 23 2% |
| Idle Minimum * (dB) | 23.5 | 24.2 -3% | 25.8 -10% | 24.5 -4% | 22.22 5% | 23 2% |
| Idle Average * (dB) | 23.5 | 24.2 -3% | 25.8 -10% | 24.5 -4% | 22.22 5% | 23 2% |
| Idle Maximum * (dB) | 23.5 | 24.2 -3% | 26.7 -14% | 25.9 -10% | 22.22 5% | 24.67 -5% |
| Load Average * (dB) | 31.9 | 28.9 9% | 36.2 -13% | 42.03 -32% | 31.72 1% | |
| Cyberpunk 2077 ultra * (dB) | 42.6 | 44.4 -4% | 40.1 6% | 41.53 3% | ||
| Load Maximum * (dB) | 46.9 | 51 -9% | 41.1 12% | 40.1 14% | 42.1 10% | 42.51 9% |
| Witcher 3 ultra * (dB) | 51 | 42.1 |
* ... Meglio usare valori piccoli
Temperatura
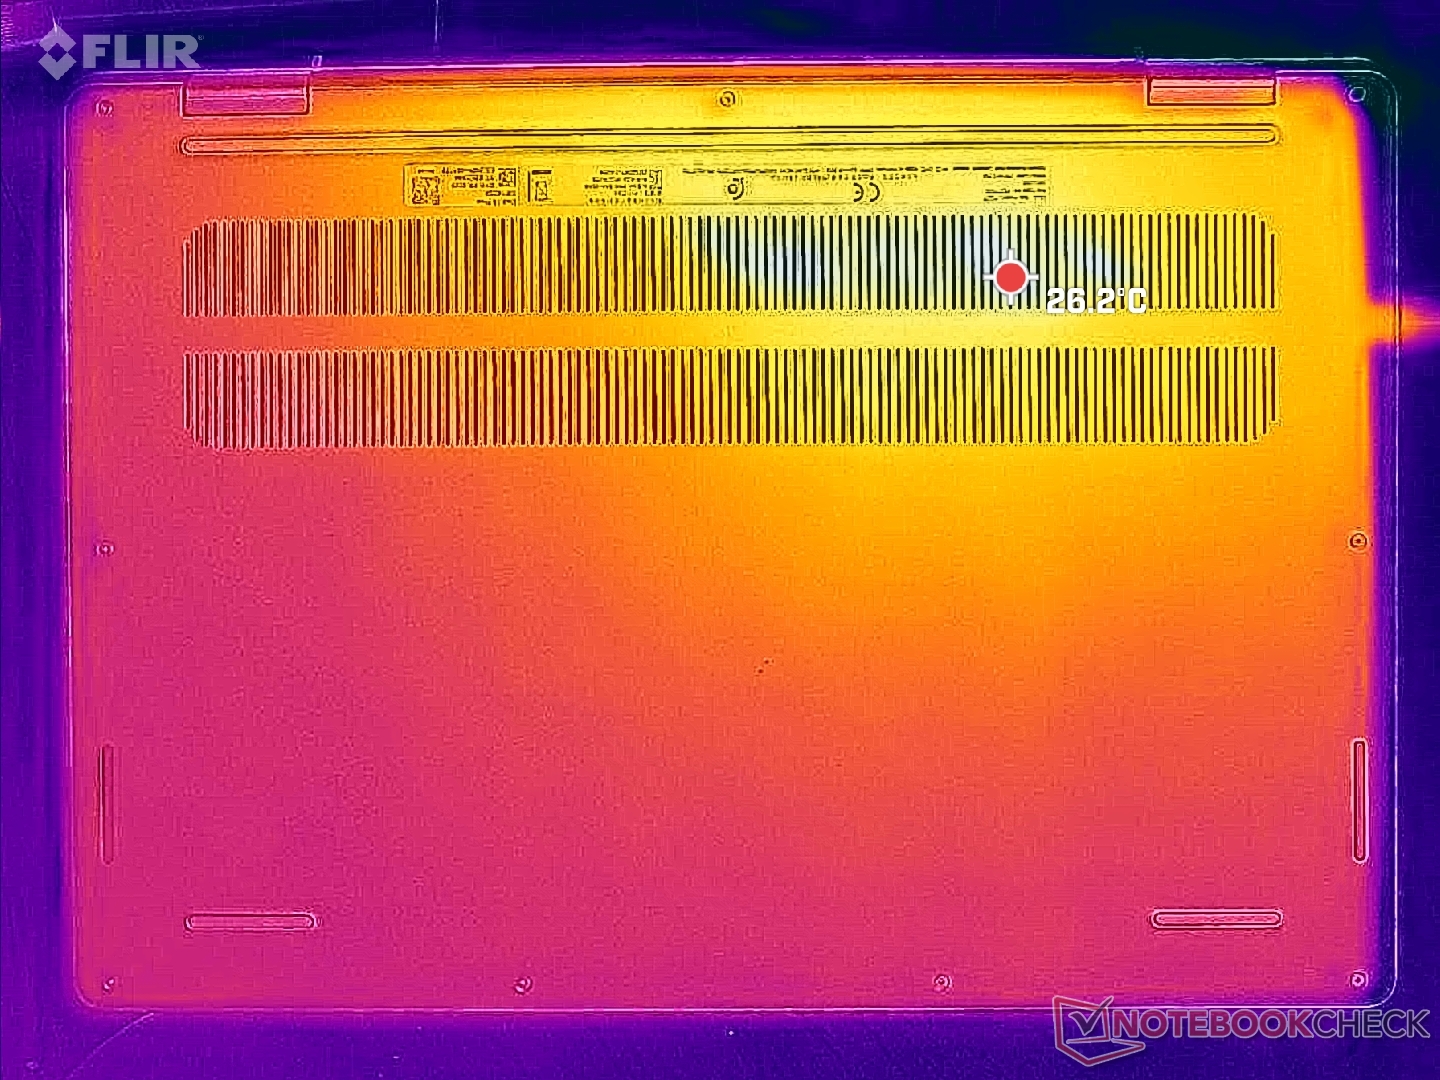
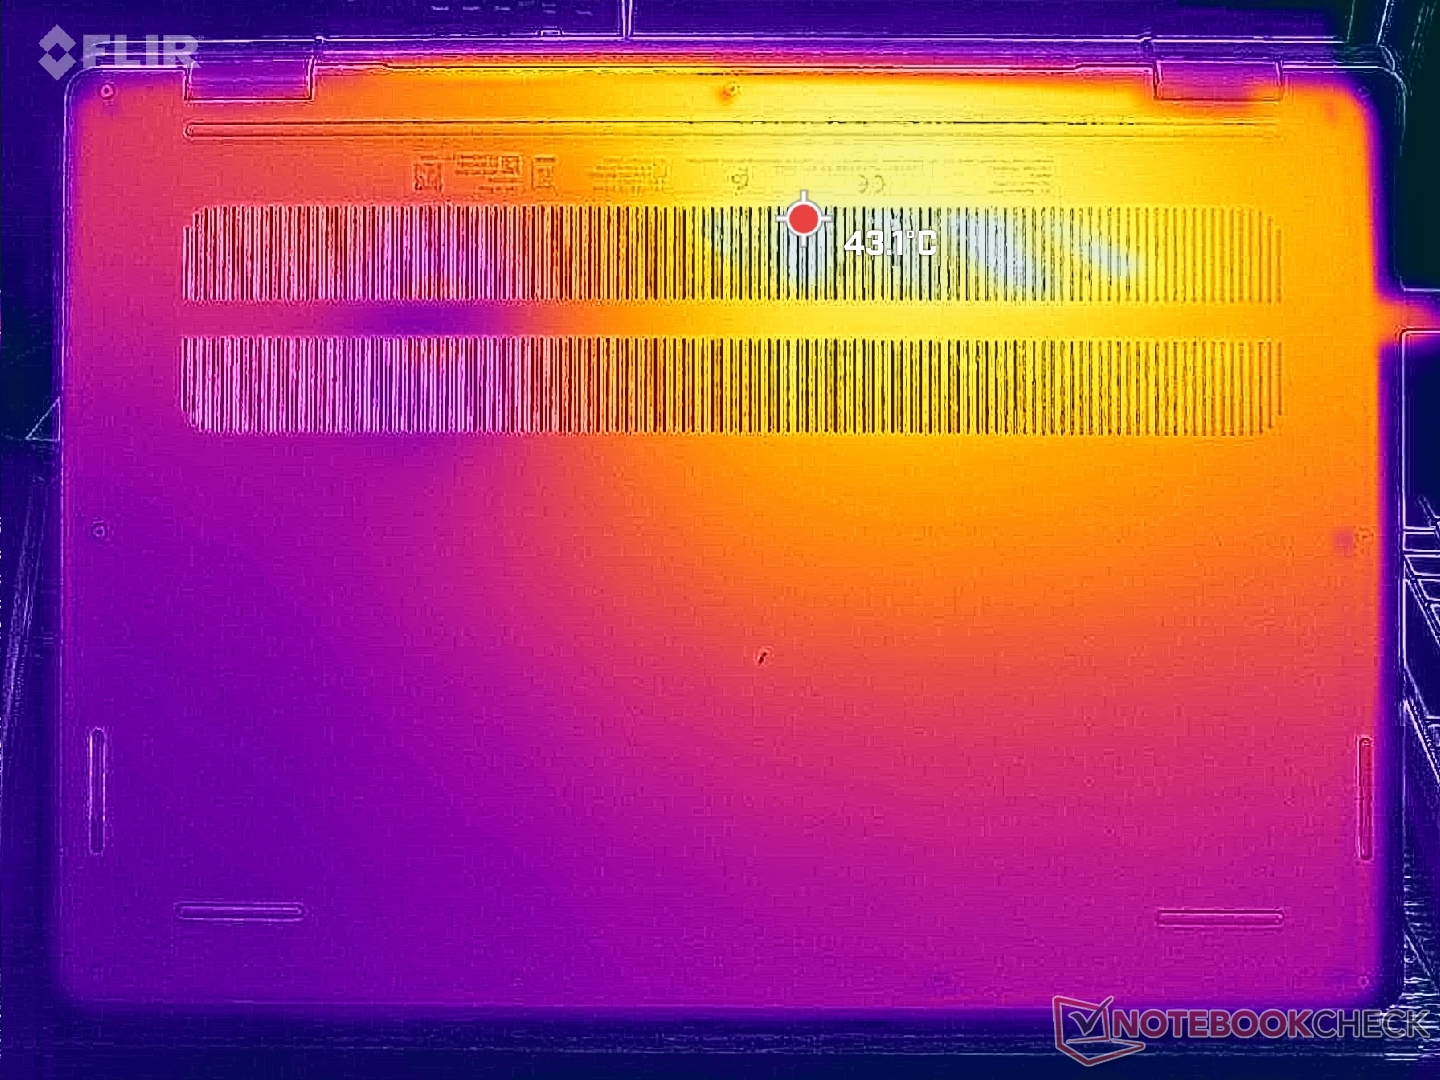
Le temperature di superficie sono sensibilmente più basse rispetto alla serie Inspiron 16 7640 uscente, grazie soprattutto ai cambiamenti del processore. I punti caldi raggiungono la fascia bassa dei 40 C, invece di quella più alta.
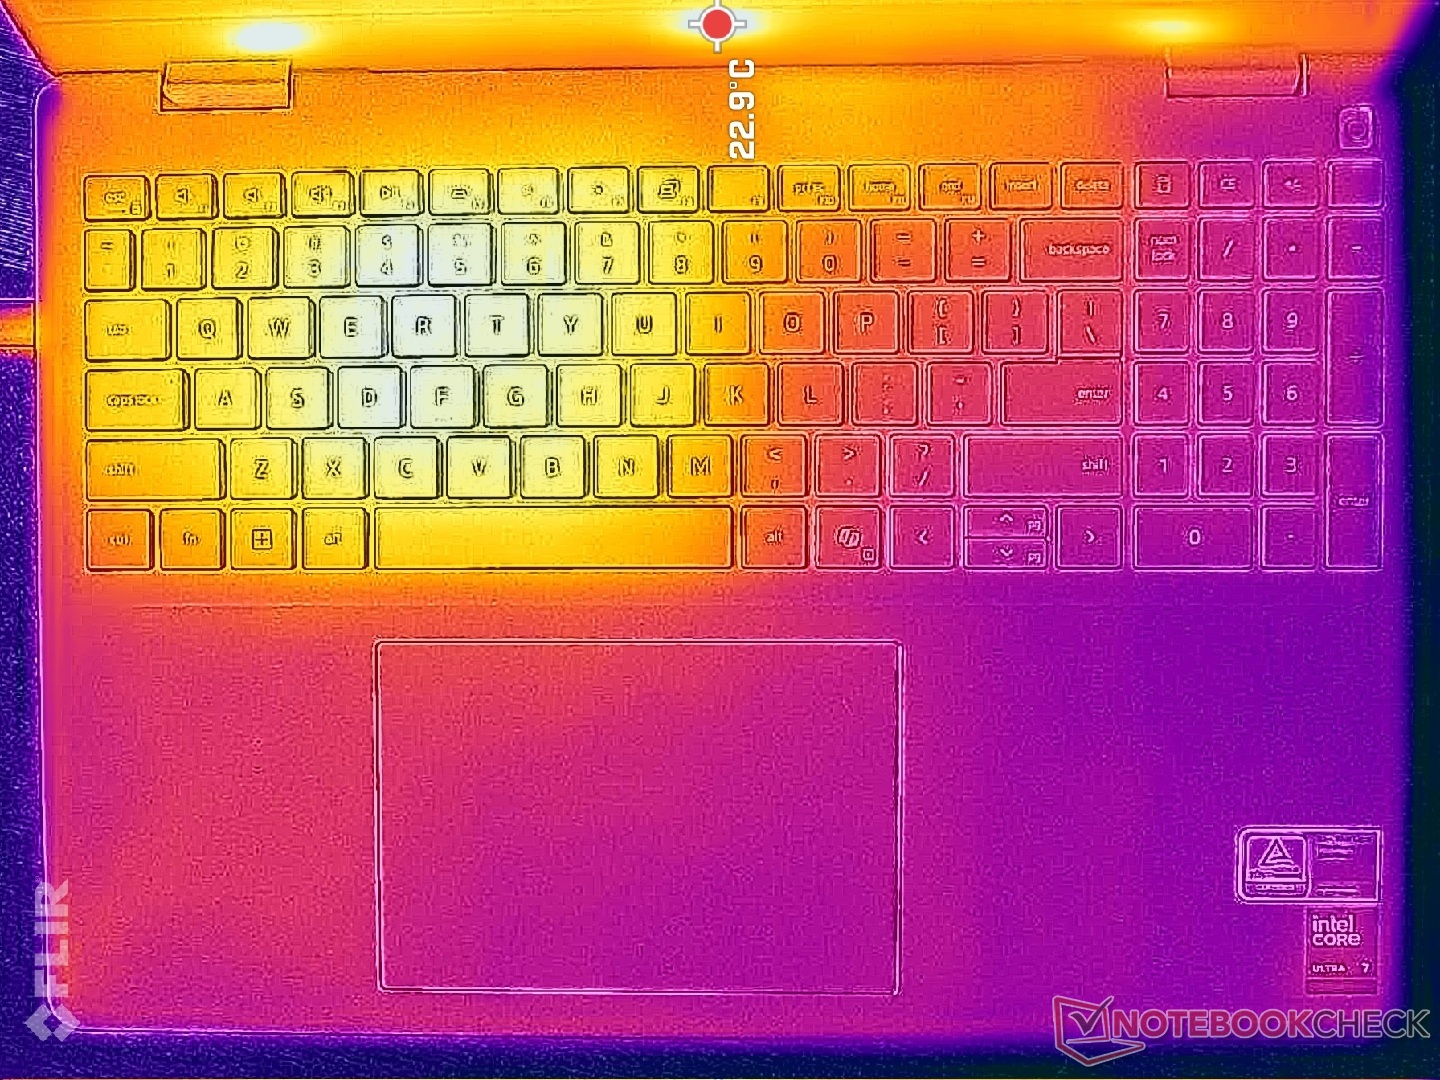
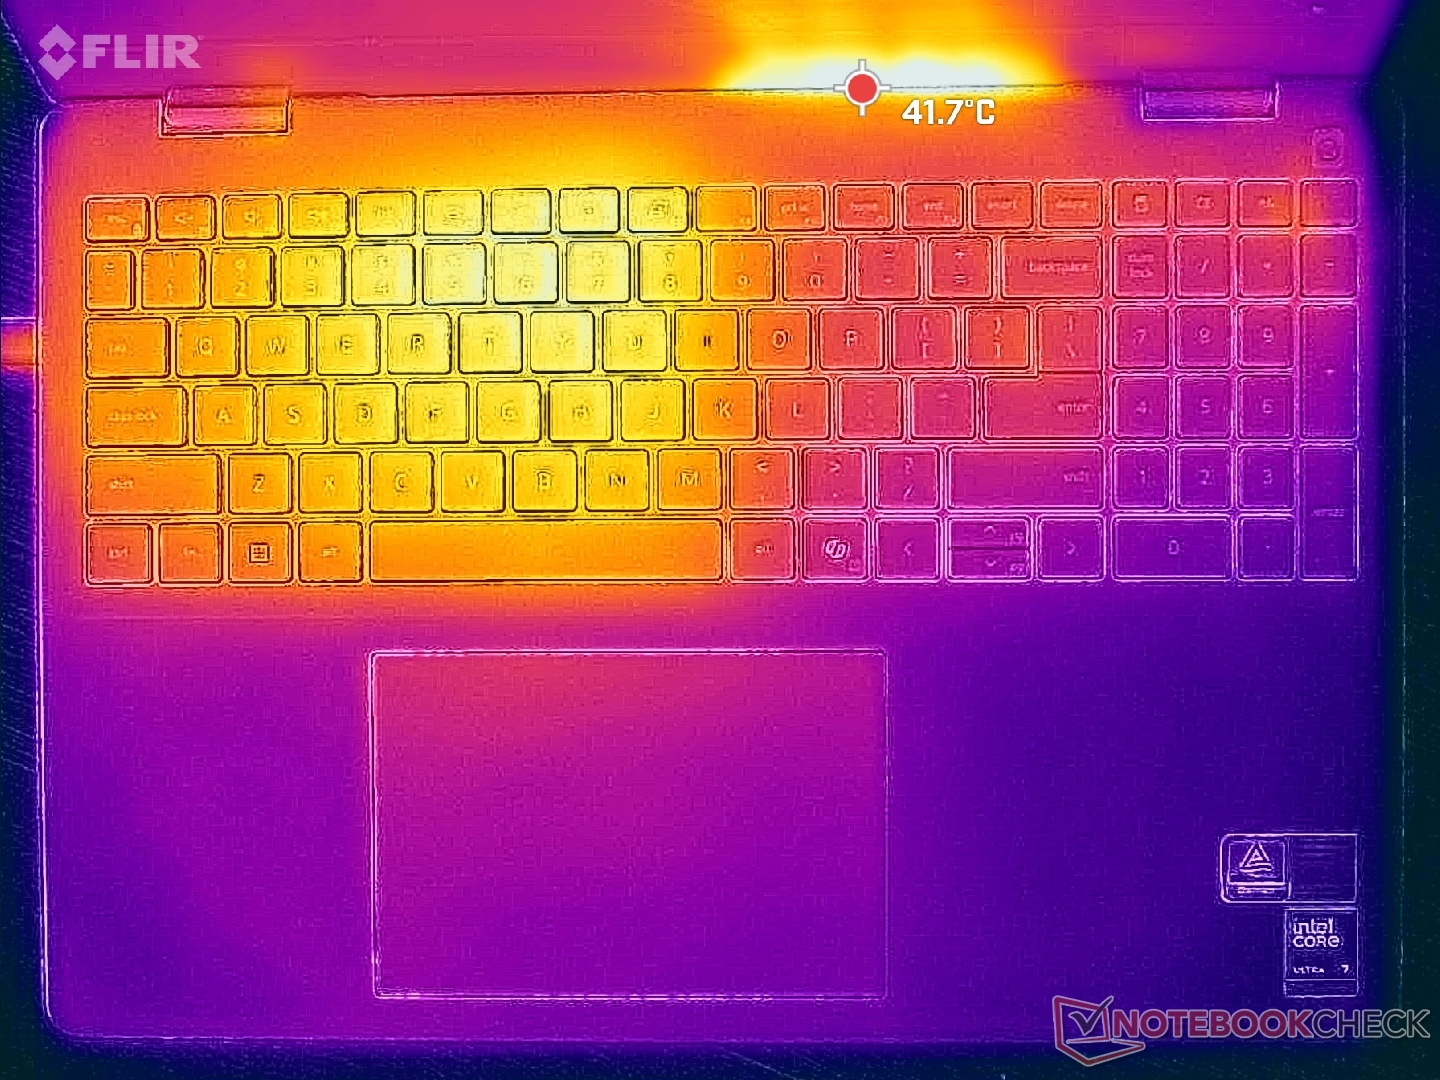
Il sistema non è chiaramente progettato per i giocatori, poiché la regione WASD può diventare molto più calda rispetto al resto della tastiera, come mostrano le mappe di temperatura qui sotto.
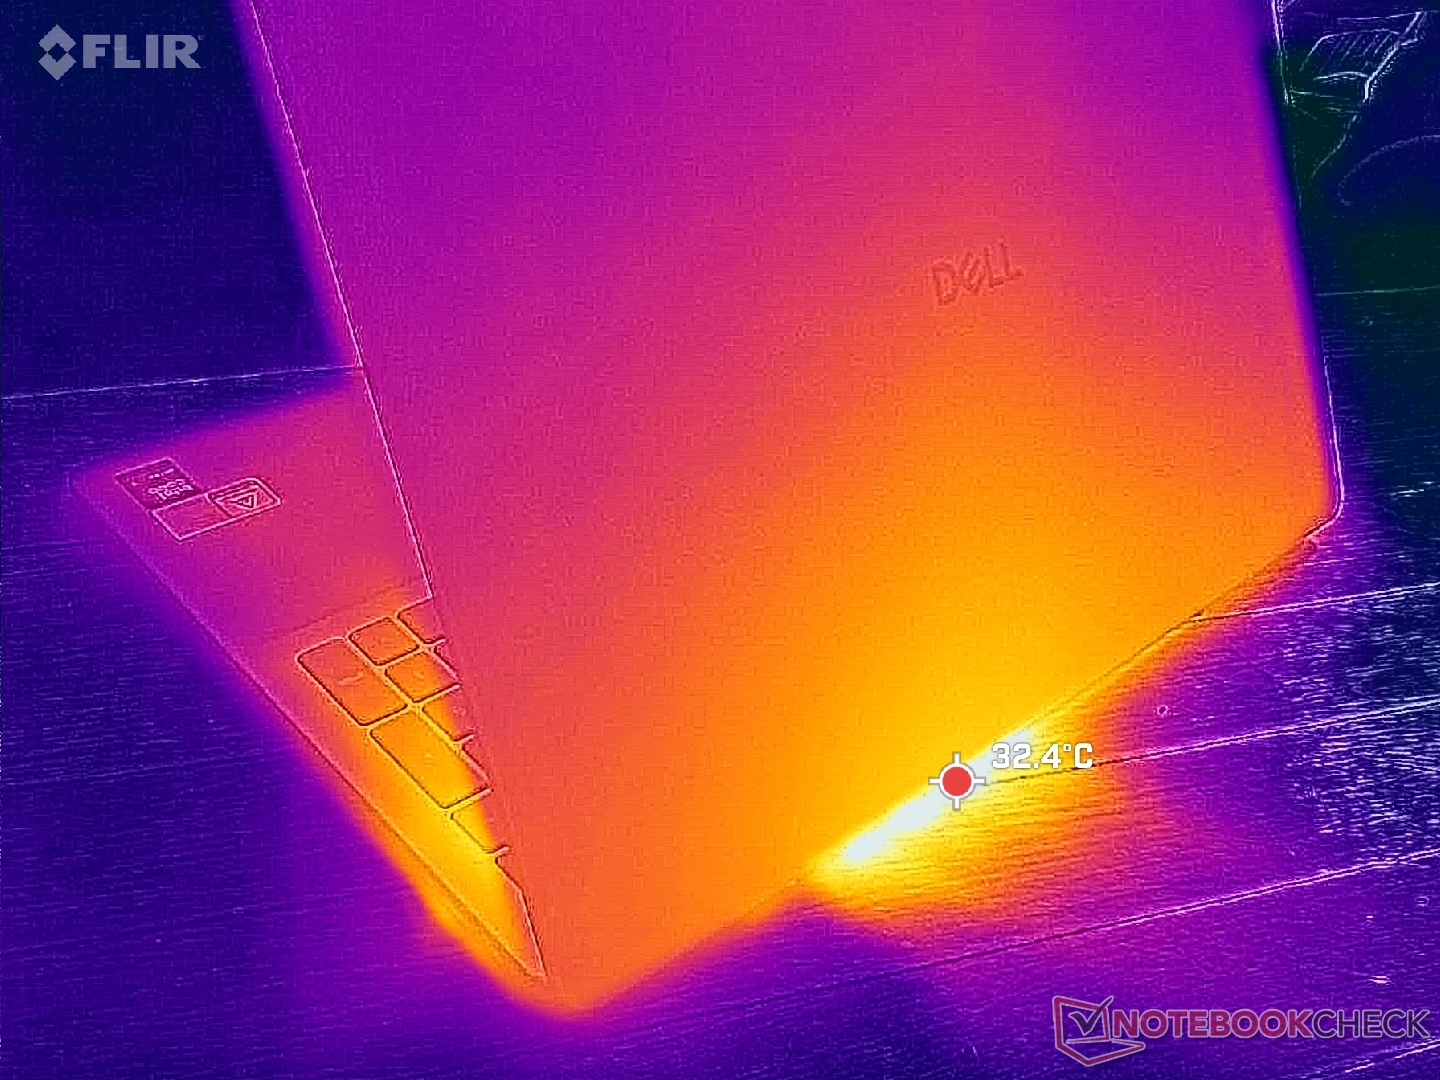
(±) La temperatura massima sul lato superiore è di 40.6 °C / 105 F, rispetto alla media di 36.8 °C / 98 F, che varia da 21 a 71 °C per questa classe Multimedia.
(±) Il lato inferiore si riscalda fino ad un massimo di 40 °C / 104 F, rispetto alla media di 39.1 °C / 102 F
(+) In idle, la temperatura media del lato superiore è di 27.2 °C / 81 F, rispetto alla media deld ispositivo di 31.3 °C / 88 F.
(+) I poggiapolsi e il touchpad sono piu' freddi della temperatura della pelle con un massimo di 25.8 °C / 78.4 F e sono quindi freddi al tatto.
(+) La temperatura media della zona del palmo della mano di dispositivi simili e'stata di 28.7 °C / 83.7 F (+2.9 °C / 5.3 F).
| Dell 16 Plus Intel Core Ultra 7 256V, Intel Arc Graphics 140V | Dell Inspiron 16 Plus 7640 Intel Core Ultra 7 155H, NVIDIA GeForce RTX 4060 Laptop GPU | Acer Swift 16 AI SF16-51T-932H, Ultra 9 288V Intel Core Ultra 9 288V, Intel Arc Graphics 140V | Lenovo ThinkBook 16 G7+ AMD AMD Ryzen AI 9 365, AMD Radeon 880M | HP Pavilion Plus 16-ab0456tx Intel Core i7-13700H, NVIDIA GeForce RTX 3050 6GB Laptop GPU | Asus Vivobook 16 M1606K AMD Ryzen AI 7 350, AMD Radeon 860M | |
|---|---|---|---|---|---|---|
| Heat | -9% | 7% | 9% | -24% | 0% | |
| Maximum Upper Side * (°C) | 40.6 | 43.4 -7% | 37.9 7% | 38.2 6% | 49.6 -22% | 48 -18% |
| Maximum Bottom * (°C) | 40 | 41.6 -4% | 31.5 21% | 37.9 5% | 45.8 -15% | 51 -27% |
| Idle Upper Side * (°C) | 29.2 | 32.8 -12% | 28.3 3% | 25.4 13% | 39.2 -34% | 22 25% |
| Idle Bottom * (°C) | 28.6 | 32.4 -13% | 29.7 -4% | 25.7 10% | 35.4 -24% | 23 20% |
* ... Meglio usare valori piccoli
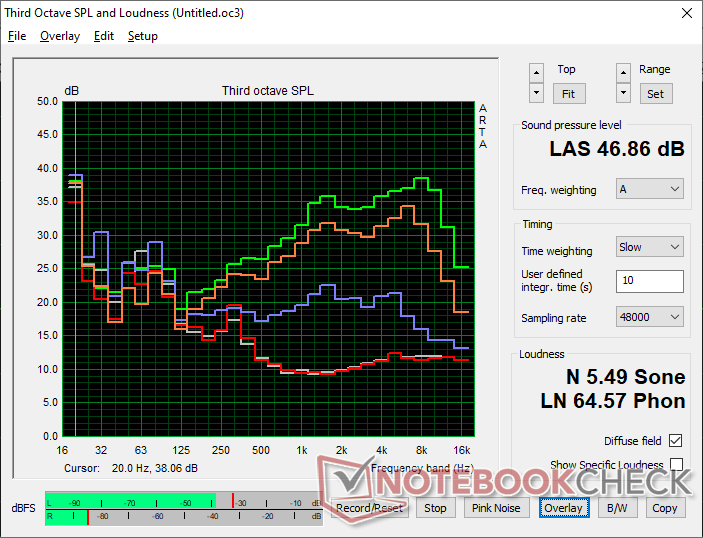
Altoparlanti
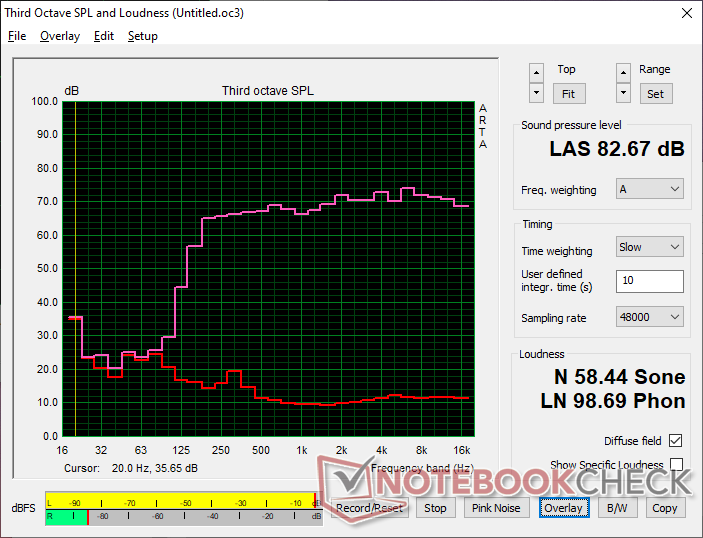
Dell 16 Plus analisi audio
(+) | gli altoparlanti sono relativamente potenti (82.7 dB)
Bassi 100 - 315 Hz
(±) | bassi ridotti - in media 14.1% inferiori alla media
(±) | la linearità dei bassi è media (11.8% delta rispetto alla precedente frequenza)
Medi 400 - 2000 Hz
(+) | medi bilanciati - solo only 1.6% rispetto alla media
(+) | medi lineari (2.4% delta rispetto alla precedente frequenza)
Alti 2 - 16 kHz
(+) | Alti bilanciati - appena 2.9% dalla media
(+) | alti lineari (3.3% delta rispetto alla precedente frequenza)
Nel complesso 100 - 16.000 Hz
(+) | suono nel complesso lineare (10% differenza dalla media)
Rispetto alla stessa classe
» 13% di tutti i dispositivi testati in questa classe è stato migliore, 2% simile, 84% peggiore
» Il migliore ha avuto un delta di 5%, medio di 17%, peggiore di 45%
Rispetto a tutti i dispositivi testati
» 4% di tutti i dispositivi testati in questa classe è stato migliore, 1% similare, 94% peggiore
» Il migliore ha avuto un delta di 4%, medio di 23%, peggiore di 134%
Apple MacBook Pro 16 2021 M1 Pro analisi audio
(+) | gli altoparlanti sono relativamente potenti (84.7 dB)
Bassi 100 - 315 Hz
(+) | bassi buoni - solo 3.8% dalla media
(+) | bassi in lineaa (5.2% delta rispetto alla precedente frequenza)
Medi 400 - 2000 Hz
(+) | medi bilanciati - solo only 1.3% rispetto alla media
(+) | medi lineari (2.1% delta rispetto alla precedente frequenza)
Alti 2 - 16 kHz
(+) | Alti bilanciati - appena 1.9% dalla media
(+) | alti lineari (2.7% delta rispetto alla precedente frequenza)
Nel complesso 100 - 16.000 Hz
(+) | suono nel complesso lineare (4.6% differenza dalla media)
Rispetto alla stessa classe
» 0% di tutti i dispositivi testati in questa classe è stato migliore, 0% simile, 100% peggiore
» Il migliore ha avuto un delta di 5%, medio di 17%, peggiore di 45%
Rispetto a tutti i dispositivi testati
» 0% di tutti i dispositivi testati in questa classe è stato migliore, 0% similare, 100% peggiore
» Il migliore ha avuto un delta di 4%, medio di 23%, peggiore di 134%
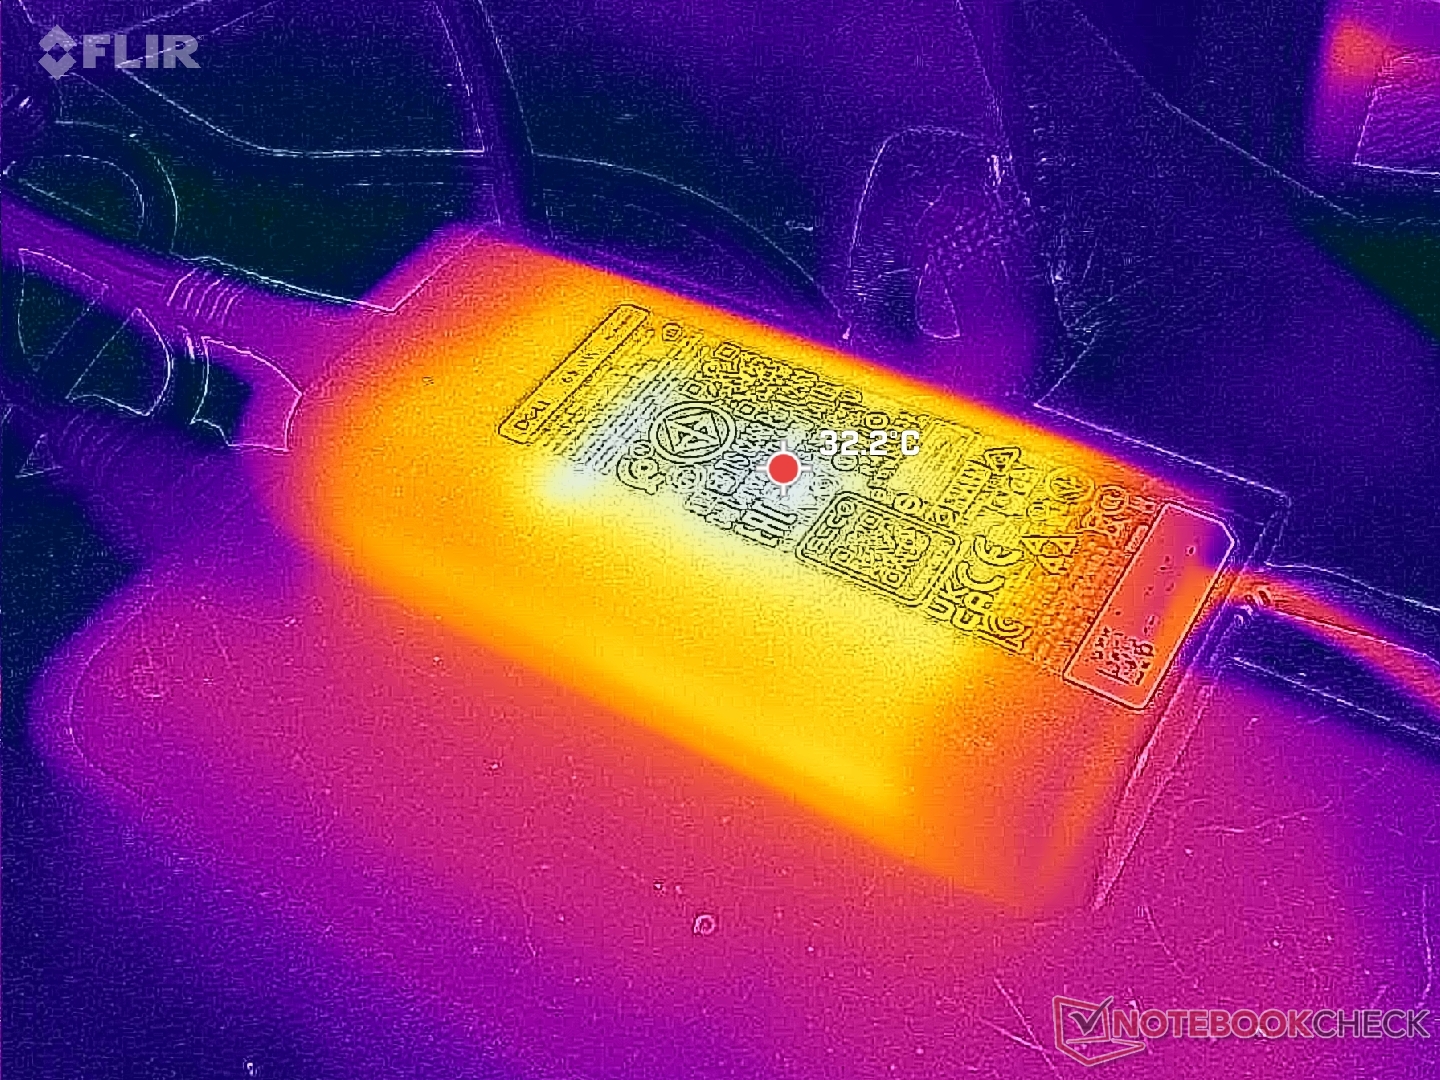
Gestione dell'energia
Consumo energetico - Migliori prestazioni per watt
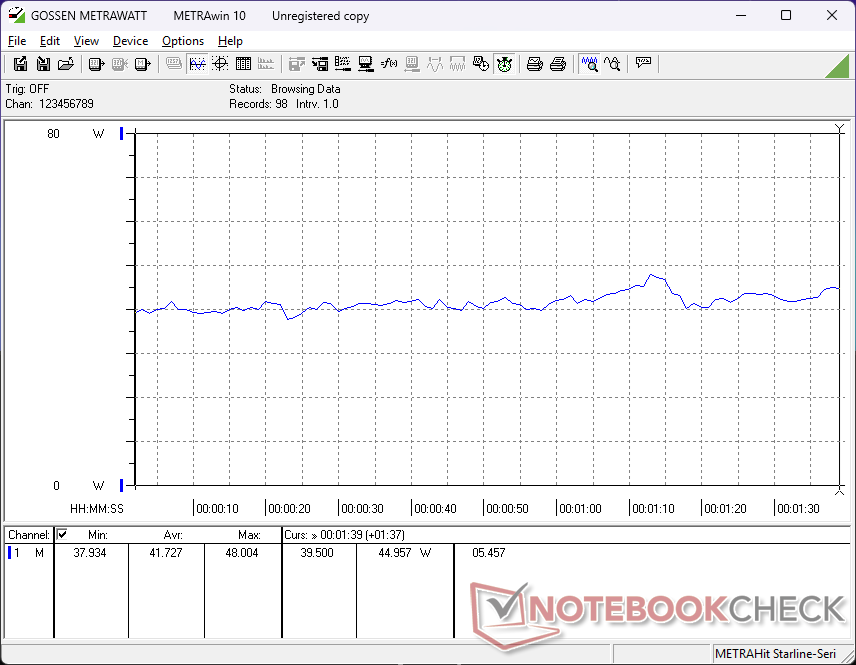
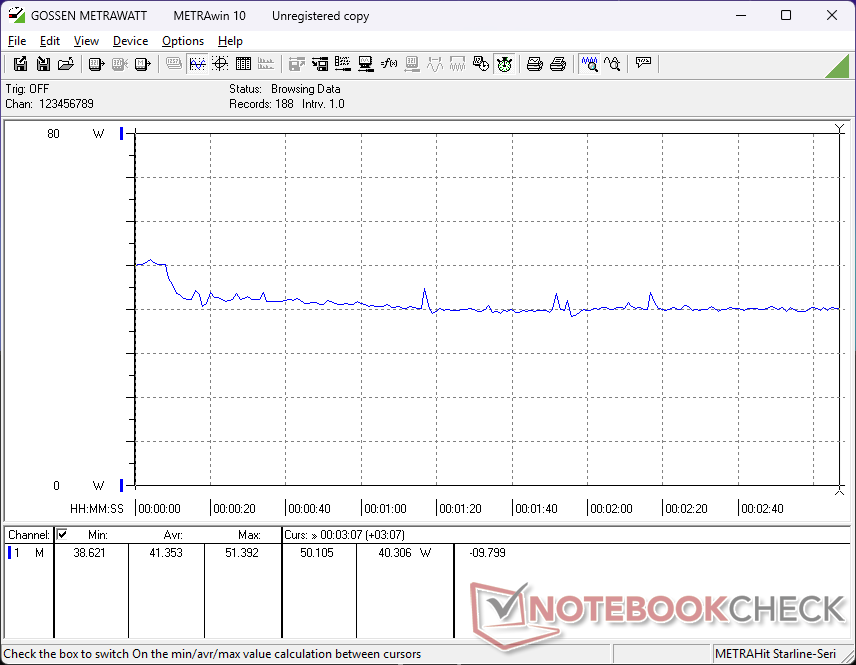
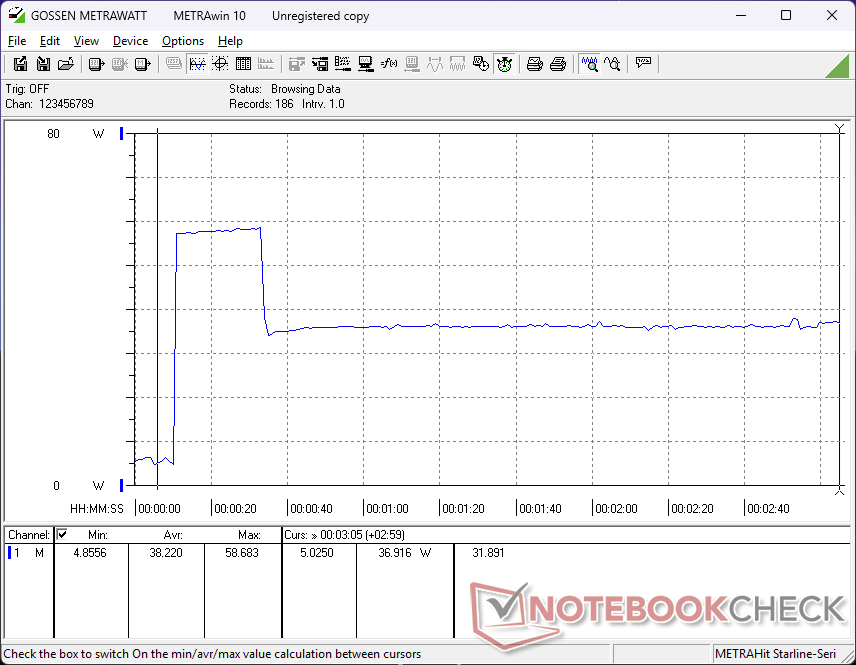
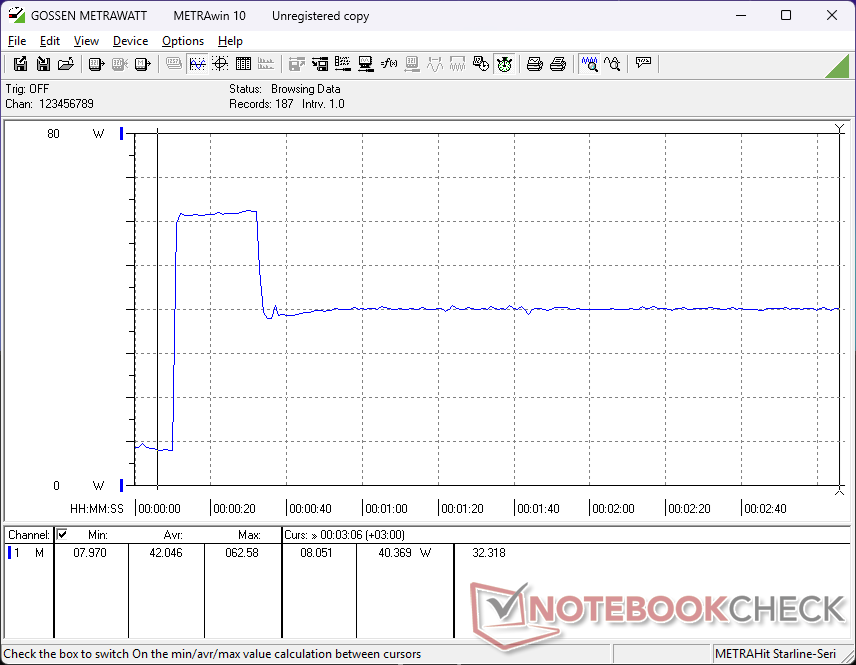
Il consumo complessivo è piuttosto basso per un portatile da 16 pollici, a causa della mancanza di una CPU della serie H, di una GPU discreta o di opzioni OLED, tutte molto più esigenti della nostra CPU della serie V, della GPU integrata e del pannello IPS. In particolare, il sistema assorbe solo 41 W durante l'esecuzione di Cyberpunk 2077 rispetto ai 67 W dell'Inspiron 16 7640 2-in-1, anche se il nostro Dell 16 Plus è in grado di eseguire il gioco circa il 25% più velocemente.
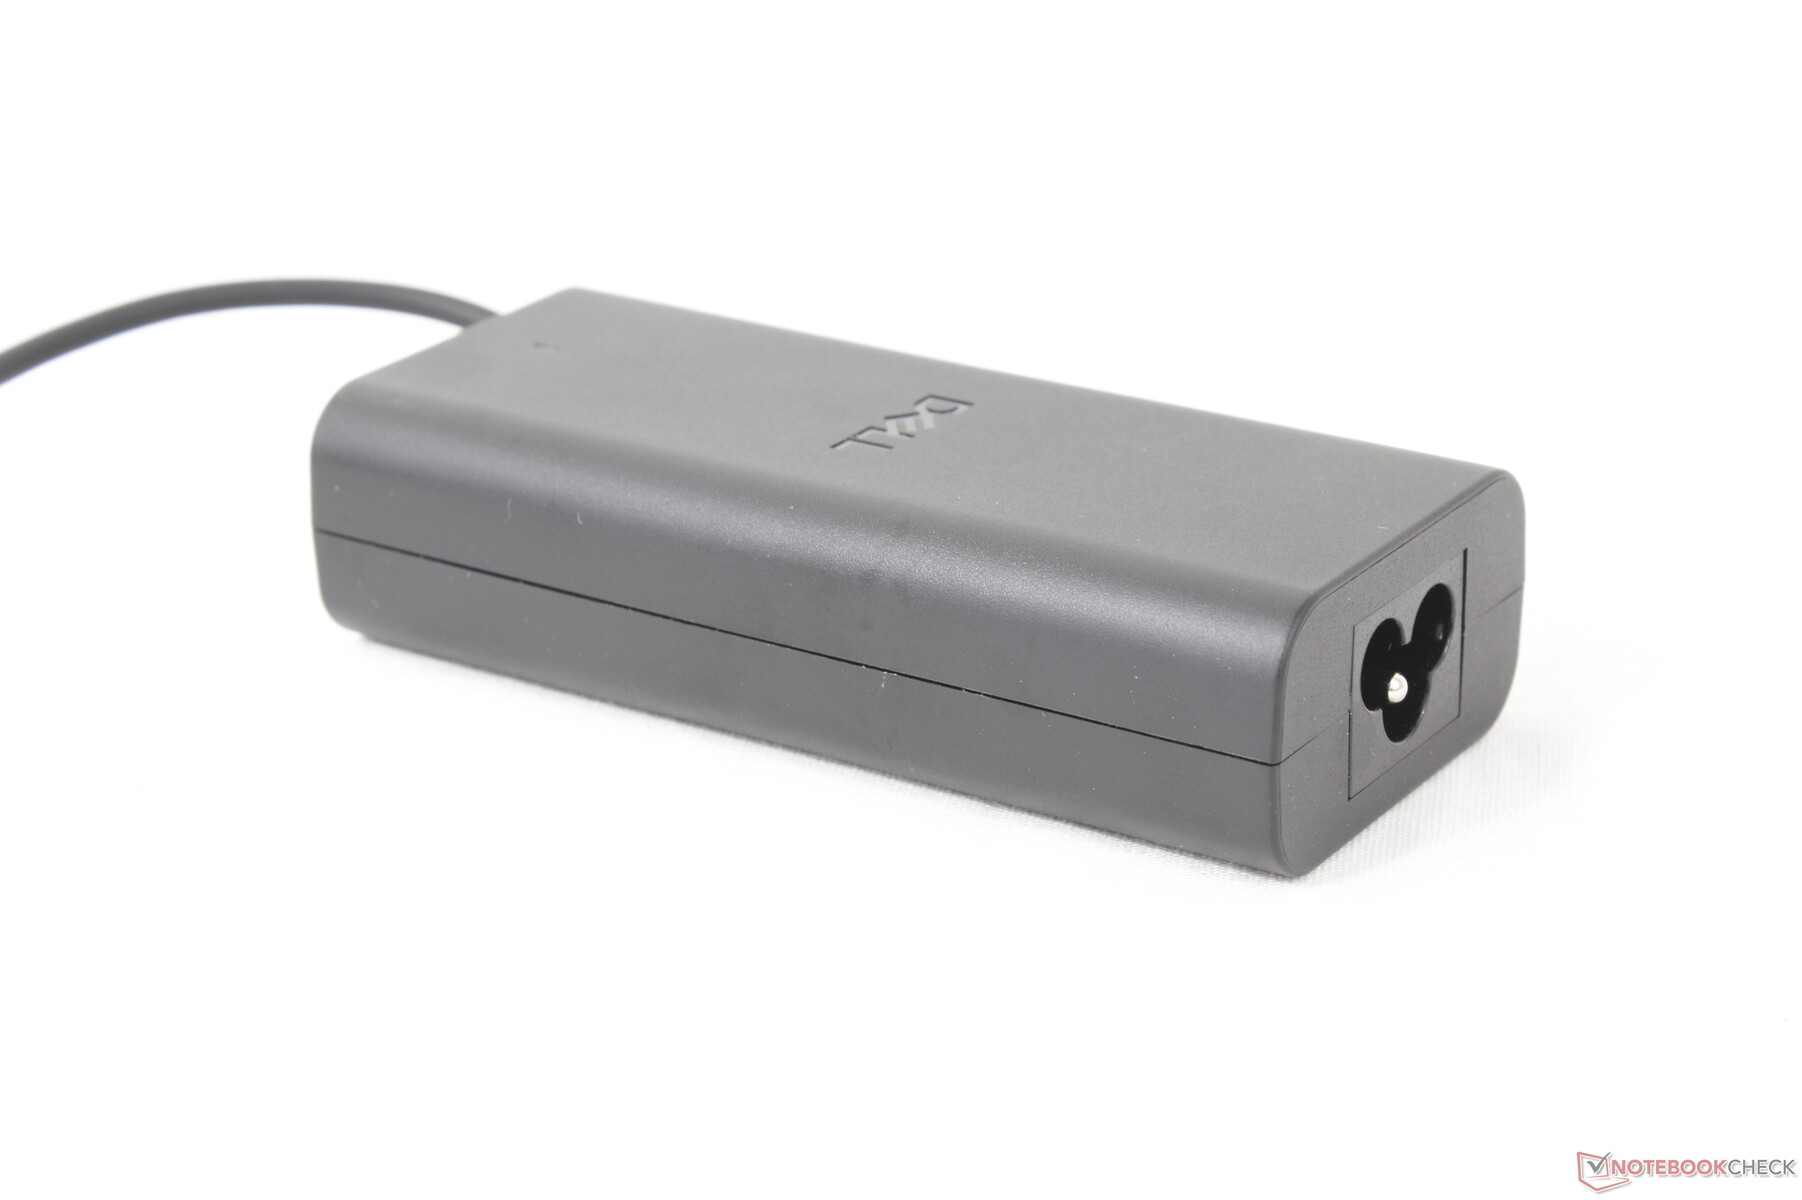
Siamo riusciti a registrare un consumo massimo temporaneo di 62 W dall'adattatore CA USB-C da 65 W, di dimensioni medio-piccole (~11,2 x 5 x 2,8 cm).
| Off / Standby | |
| Idle | |
| Sotto carico |
|
Leggenda:
min: | |
| Dell 16 Plus Core Ultra 7 256V, Arc 140V, Samsung BM9C1 1024GB, IPS, 2560x1600, 16" | Dell Inspiron 16 Plus 7640 Ultra 7 155H, GeForce RTX 4060 Laptop GPU, SK hynix BC901 HFS001TEJ4X164N, IPS, 2560x1600, 16" | Acer Swift 16 AI SF16-51T-932H, Ultra 9 288V Core Ultra 9 288V, Arc 140V, Western Digital PC SN5000S SDEQNSJ-1T00, OLED, 2880x1800, 16" | Lenovo ThinkBook 16 G7+ AMD Ryzen AI 9 365, Radeon 880M, Samsung PM9C1a MZAL81T0HDLB, IPS, 3200x2000, 16" | HP Pavilion Plus 16-ab0456tx i7-13700H, GeForce RTX 3050 6GB Laptop GPU, WDC PC SN810 1TB, IPS, 2560x1600, 16" | Asus Vivobook 16 M1606K Ryzen AI 7 350, Radeon 860M, Micron 2500 1TB MTFDKBA1T0QGN, IPS, 1920x1200, 16" | |
|---|---|---|---|---|---|---|
| Power Consumption | -64% | -22% | -93% | -60% | -36% | |
| Idle Minimum * (Watt) | 3.4 | 4.2 -24% | 5.7 -68% | 6.4 -88% | 3.3 3% | 4.7 -38% |
| Idle Average * (Watt) | 6.9 | 6.9 -0% | 7.4 -7% | 14.1 -104% | 7.3 -6% | 8.2 -19% |
| Idle Maximum * (Watt) | 7.4 | 15.2 -105% | 7.9 -7% | 14.3 -93% | 14.24 -92% | 9 -22% |
| Load Average * (Watt) | 41.7 | 70.4 -69% | 83.4 -100% | 91.7 -120% | 59 -41% | |
| Cyberpunk 2077 ultra external monitor * (Watt) | 38 | 77.5 -104% | 58 -53% | |||
| Cyberpunk 2077 ultra * (Watt) | 41.4 | 49.8 -20% | 79.8 -93% | 65 -57% | ||
| Load Maximum * (Watt) | 62 | 137.4 -122% | 65.41 -6% | 102.9 -66% | 115.8 -87% | 74 -19% |
| Witcher 3 ultra * (Watt) | 115.9 | 96.2 |
* ... Meglio usare valori piccoli
Power Consumption Cyberpunk / Stress Test
Power Consumption external Monitor
Durata della batteria
I tempi di esecuzione sono molto lunghi, come ci si può aspettare da un laptop alimentato da Lunar Lake. L'autonomia della batteria WLAN è di poco superiore alle 14 ore, persino più lunga dell'Inspiron 16 Plus 7640, nonostante il fatto che il Dell 16 Plus abbia una batteria più piccola del 30%.
| Dell 16 Plus Core Ultra 7 256V, Arc 140V, 64 Wh | Dell Inspiron 16 Plus 7640 Ultra 7 155H, GeForce RTX 4060 Laptop GPU, 90 Wh | Acer Swift 16 AI SF16-51T-932H, Ultra 9 288V Core Ultra 9 288V, Arc 140V, 70 Wh | Lenovo ThinkBook 16 G7+ AMD Ryzen AI 9 365, Radeon 880M, 85 Wh | HP Pavilion Plus 16-ab0456tx i7-13700H, GeForce RTX 3050 6GB Laptop GPU, 68 Wh | Asus Vivobook 16 M1606K Ryzen AI 7 350, Radeon 860M, 42 Wh | |
|---|---|---|---|---|---|---|
| Autonomia della batteria | -6% | -6% | -23% | -26% | -52% | |
| WiFi v1.3 (h) | 14.1 | 13.3 -6% | 13.2 -6% | 10.8 -23% | 10.4 -26% | 6.8 -52% |
| H.264 (h) | 13.9 | 12 | 6.8 | |||
| Load (h) | 1.1 |
Valutazione Notebookcheck
Dell 16 Plus
- 06/06/2025 v8
Allen Ngo
 Total Sustainability Score:
 Potential Competitors in Comparison
Immagine | Modello | Prezzo | Peso | Altezza | Schermo |
|---|---|---|---|---|---|
1. 81.8%  | Dell 16 Plus Intel Core Ultra 7 256V ⎘ Intel Arc Graphics 140V ⎘ 16 GB Memoria, 1024 GB SSD | Amazon: Prezzo di listino: 1150 USD | 1.8 kg | 16.99 mm | 16.00" 2560x1600 189 PPI IPS |
2. 83.4%  | Dell Inspiron 16 Plus 7640 Intel Core Ultra 7 155H ⎘ NVIDIA GeForce RTX 4060 Laptop GPU ⎘ 16 GB Memoria, 1024 GB SSD | Amazon: Prezzo di listino: 1300 USD | 2.2 kg | 19.9 mm | 16.00" 2560x1600 189 PPI IPS |
3. 85.3%  | Acer Swift 16 AI SF16-51T-932H, Ultra 9 288V Intel Core Ultra 9 288V ⎘ Intel Arc Graphics 140V ⎘ 32 GB Memoria, 1024 GB SSD | Amazon: | 1.5 kg | 15.95 mm | 16.00" 2880x1800 212 PPI OLED |
4. 86.6%  | Lenovo ThinkBook 16 G7+ AMD AMD Ryzen AI 9 365 ⎘ AMD Radeon 880M ⎘ 32 GB Memoria, 1024 GB SSD | Amazon: 1. $1,199.99 Lenovo ThinkBook 16 G7 Busin... 2. $999.95 Lenovo ThinkBook 16 G7 Busin... 3. $1,199.95 Lenovo ThinkBook 16 G7 Busin... Prezzo di listino: 1399€ | 1.9 kg | 16.9 mm | 16.00" 3200x2000 236 PPI IPS |
5. 88.7% v7 (old)  | HP Pavilion Plus 16-ab0456tx Intel Core i7-13700H ⎘ NVIDIA GeForce RTX 3050 6GB Laptop GPU ⎘ 16 GB Memoria, 1024 GB SSD | Amazon: 1. $799.99 HP Pavilion Plus 16 inch Lap... 2. $34.00 Laptop Right Fan for HP Pavi... 3. $439.99 HP Pavilion | 15.6" HD Displ... Prezzo di listino: 1350 USD | 1.9 kg | 19.9 mm | 16.00" 2560x1600 189 PPI IPS |
6. 77.6% 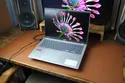 | Asus Vivobook 16 M1606K AMD Ryzen AI 7 350 ⎘ AMD Radeon 860M ⎘ 16 GB Memoria, 1024 GB SSD | Amazon: 1. $129.00 Replacement Screen 16.0" for... 2. $123.00 16.0" WUXGA 1920(RGB)*1200 f... 3. $689.00 ASUS Vivobook 16 Laptop, 16�... | 1.9 kg | 19.9 mm | 16.00" 1920x1200 142 PPI IPS |
Transparency
La selezione dei dispositivi da recensire viene effettuata dalla nostra redazione. Il campione di prova è stato fornito all'autore come prestito dal produttore o dal rivenditore ai fini di questa recensione. L'istituto di credito non ha avuto alcuna influenza su questa recensione, né il produttore ne ha ricevuto una copia prima della pubblicazione. Non vi era alcun obbligo di pubblicare questa recensione. In quanto società mediatica indipendente, Notebookcheck non è soggetta all'autorità di produttori, rivenditori o editori.
Ecco come Notebookcheck esegue i test
Ogni anno, Notebookcheck esamina in modo indipendente centinaia di laptop e smartphone utilizzando procedure standardizzate per garantire che tutti i risultati siano comparabili. Da circa 20 anni sviluppiamo continuamente i nostri metodi di prova e nel frattempo stabiliamo gli standard di settore. Nei nostri laboratori di prova, tecnici ed editori esperti utilizzano apparecchiature di misurazione di alta qualità. Questi test comportano un processo di validazione in più fasi. Il nostro complesso sistema di valutazione si basa su centinaia di misurazioni e parametri di riferimento ben fondati, che mantengono l'obiettività.
