Verdetto - Copre tutte le basi
In qualità di subnotebook di fascia media economico, Dell 14 Plus non offre molto in termini di campane e fischietti di lusso o design accattivanti. Al contrario, si concentra sulle caratteristiche principali che interessano agli utenti attenti al budget, tra cui una CPU moderna, un display IPS ad alta risoluzione con colori sRGB completi e una struttura relativamente sottile e leggera per un facile trasporto. Il processore da solo è responsabile della lunga durata della batteria e dell'efficienza superiore rispetto ai modelli della generazione precedente.
Alcuni svantaggi includono la GPU integrata poco performante, i tempi di risposta in bianco e nero nella media e il pannello opaco un po' sgranato. Il sistema è quindi meno che ideale quando si tratta di giocare, ma anche in questo caso gioca molto meglio dei suoi predecessori con grafica Iris Xe. Anche la mancanza di opzioni touchscreen potrebbe deludere alcuni utenti.
Pro
Contro
Prezzo e disponibilità
Dell sta spedendo il Dell 14 Plus, come recensito, al prezzo di 1100 dollari USA. In alternativa, anche Amazon ha delle SKU specifiche in magazzino.
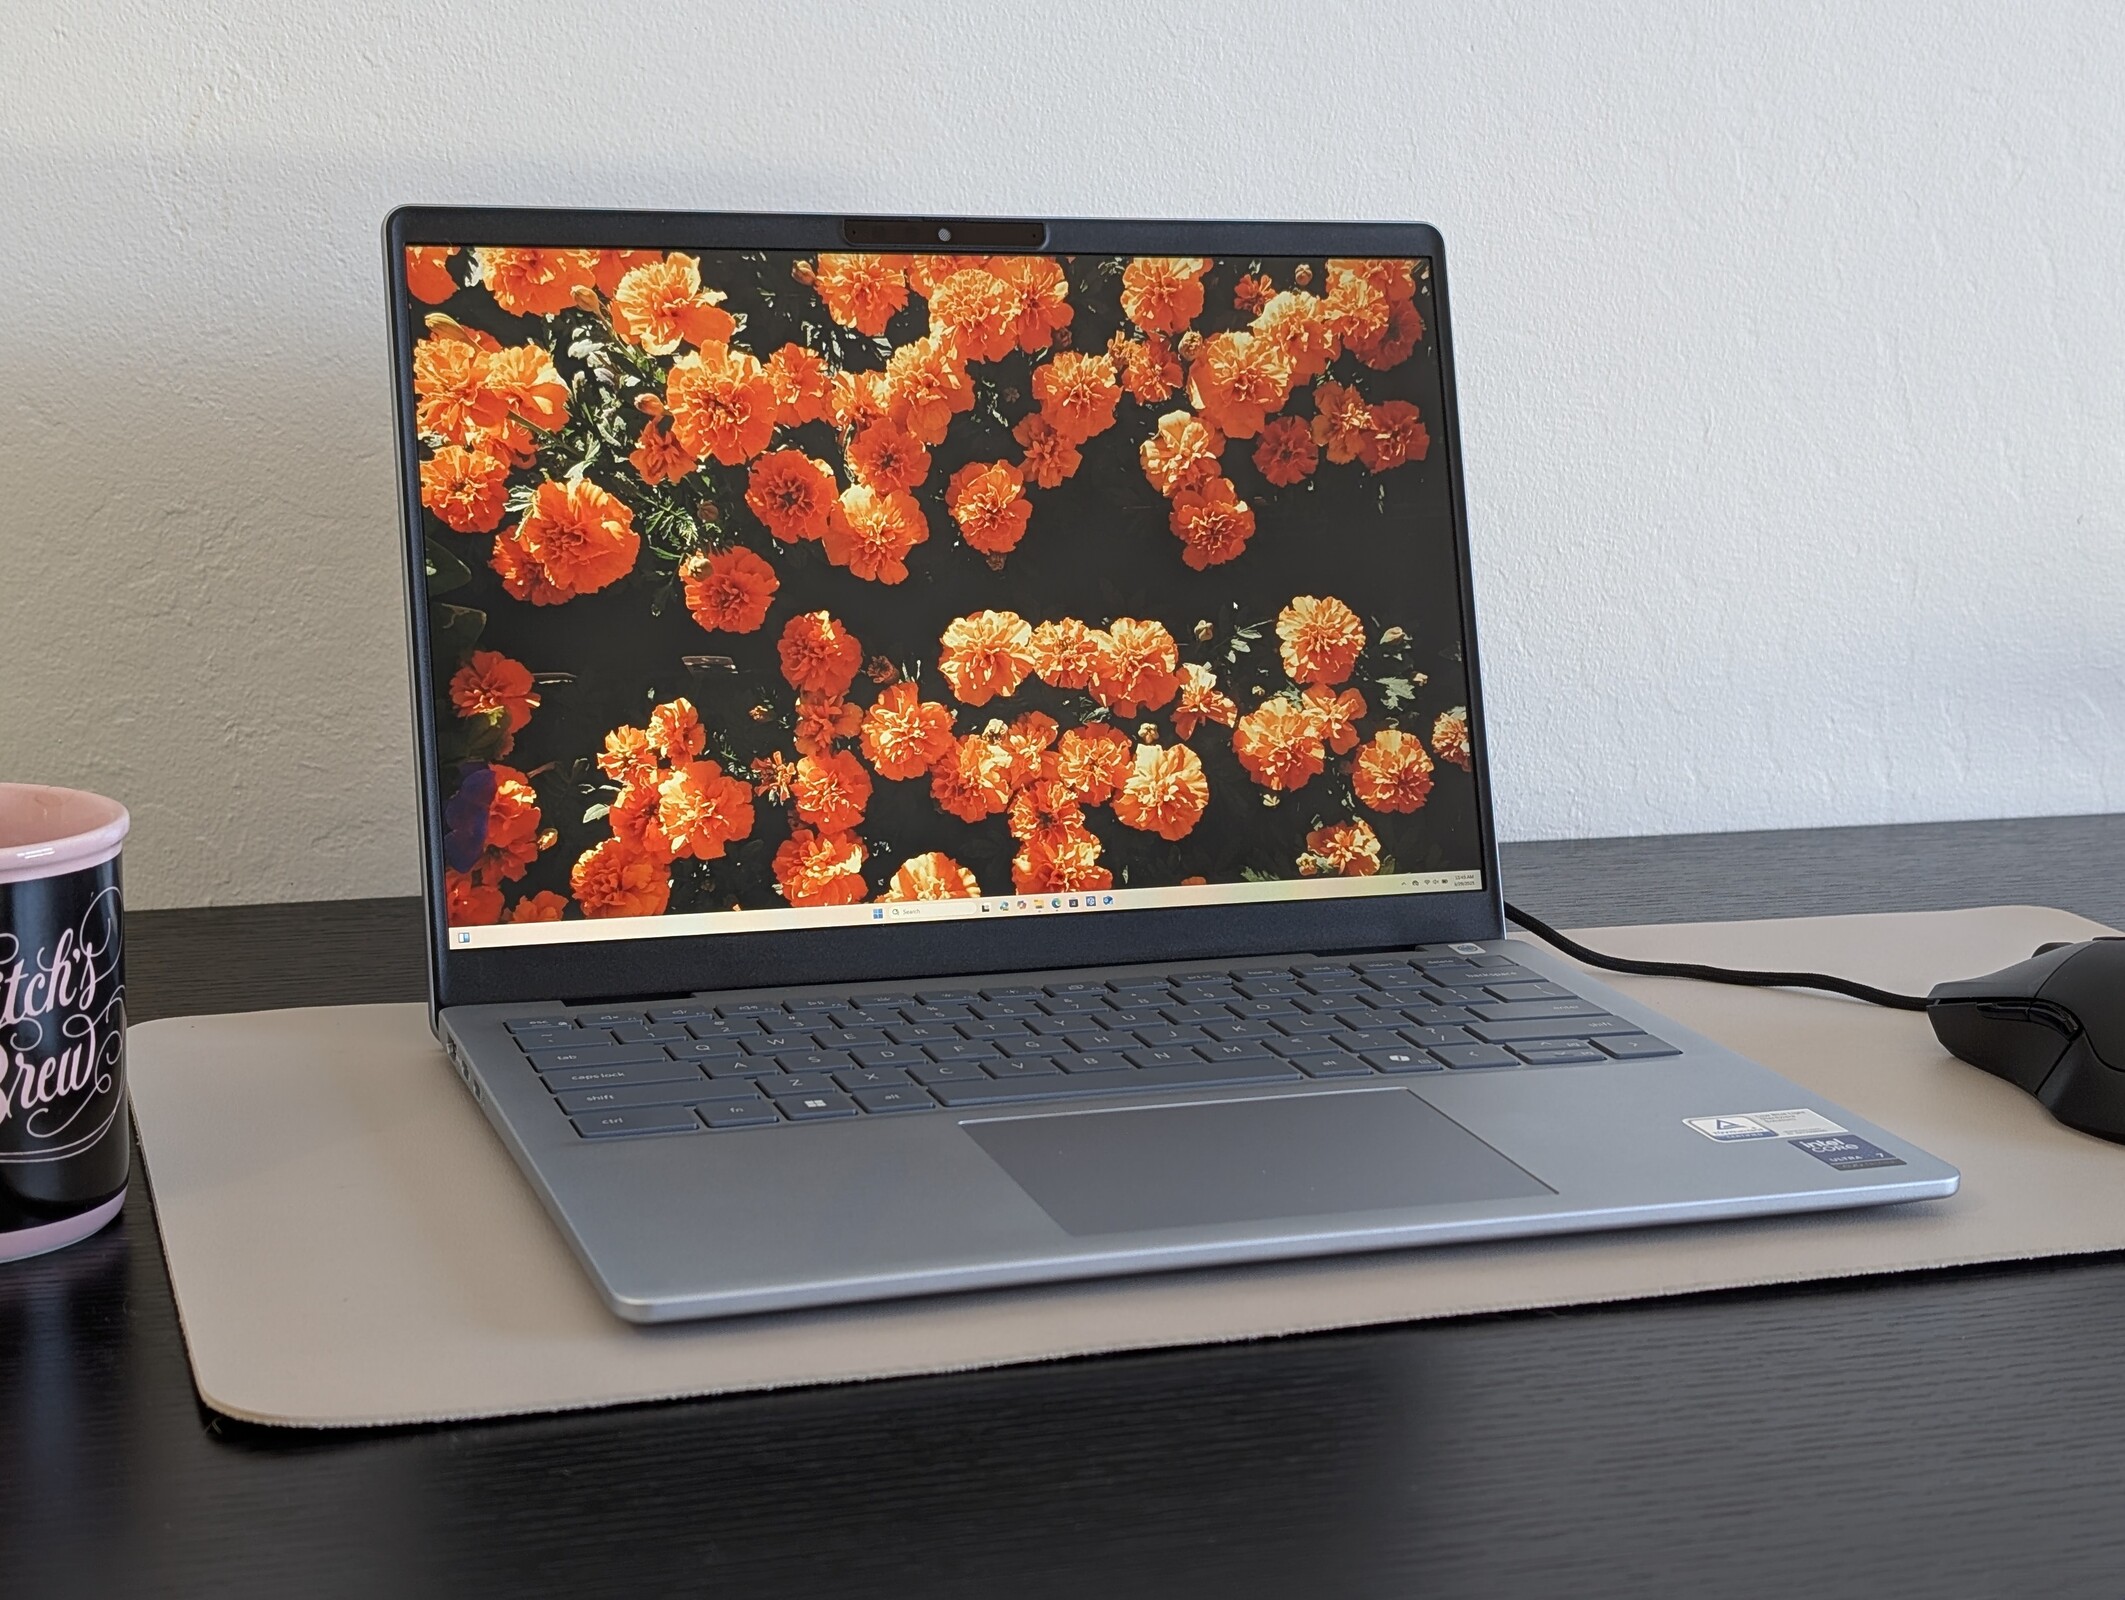
Il Dell 14 Plus succede all'Inspiron 14 Plus dello scorso anno Inspiron 14 Plus 7440 per essere un'opzione economica di fascia media, pensata per la multimedialità domestica o per gli studenti. Condivide le principali caratteristiche di design con l'Inspiron, come dimostrerà la nostra recensione qui sotto.
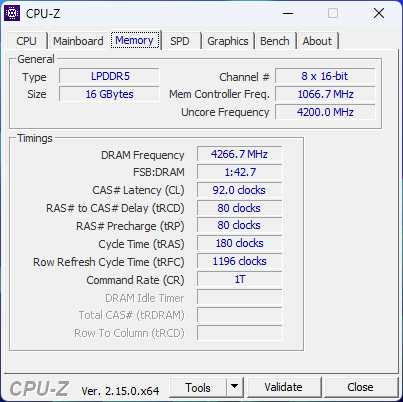
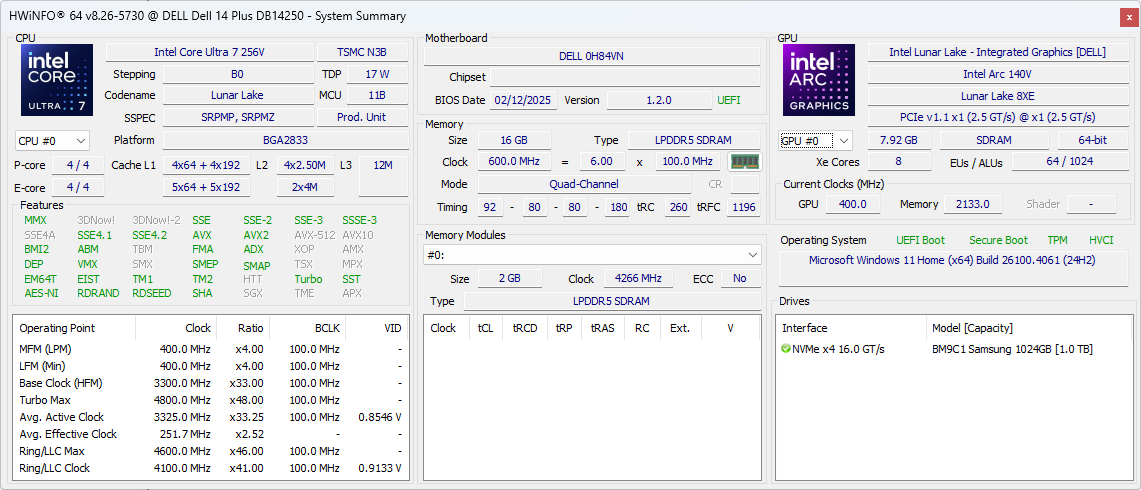
La nostra unità di prova è una configurazione di fascia bassa con CPU Core Ultra 7 256V e 16 GB di RAM per circa 1100 dollari. Le SKU di fascia più alta sono dotate di Core Ultra 7 258V o Core Ultra 9 288V con il doppio della RAM, ma il display da 2,5K 90 Hz rimane costante in tutte le configurazioni attuali.
Le alternative al Dell 14 Plus includono altri clamshell da 14 pollici per i consumatori, come il Lenovo IdeaPad Pro 5 14 o HP Pavilion Plus 14.
Altre recensioni Dell:
Specifiche
Caso
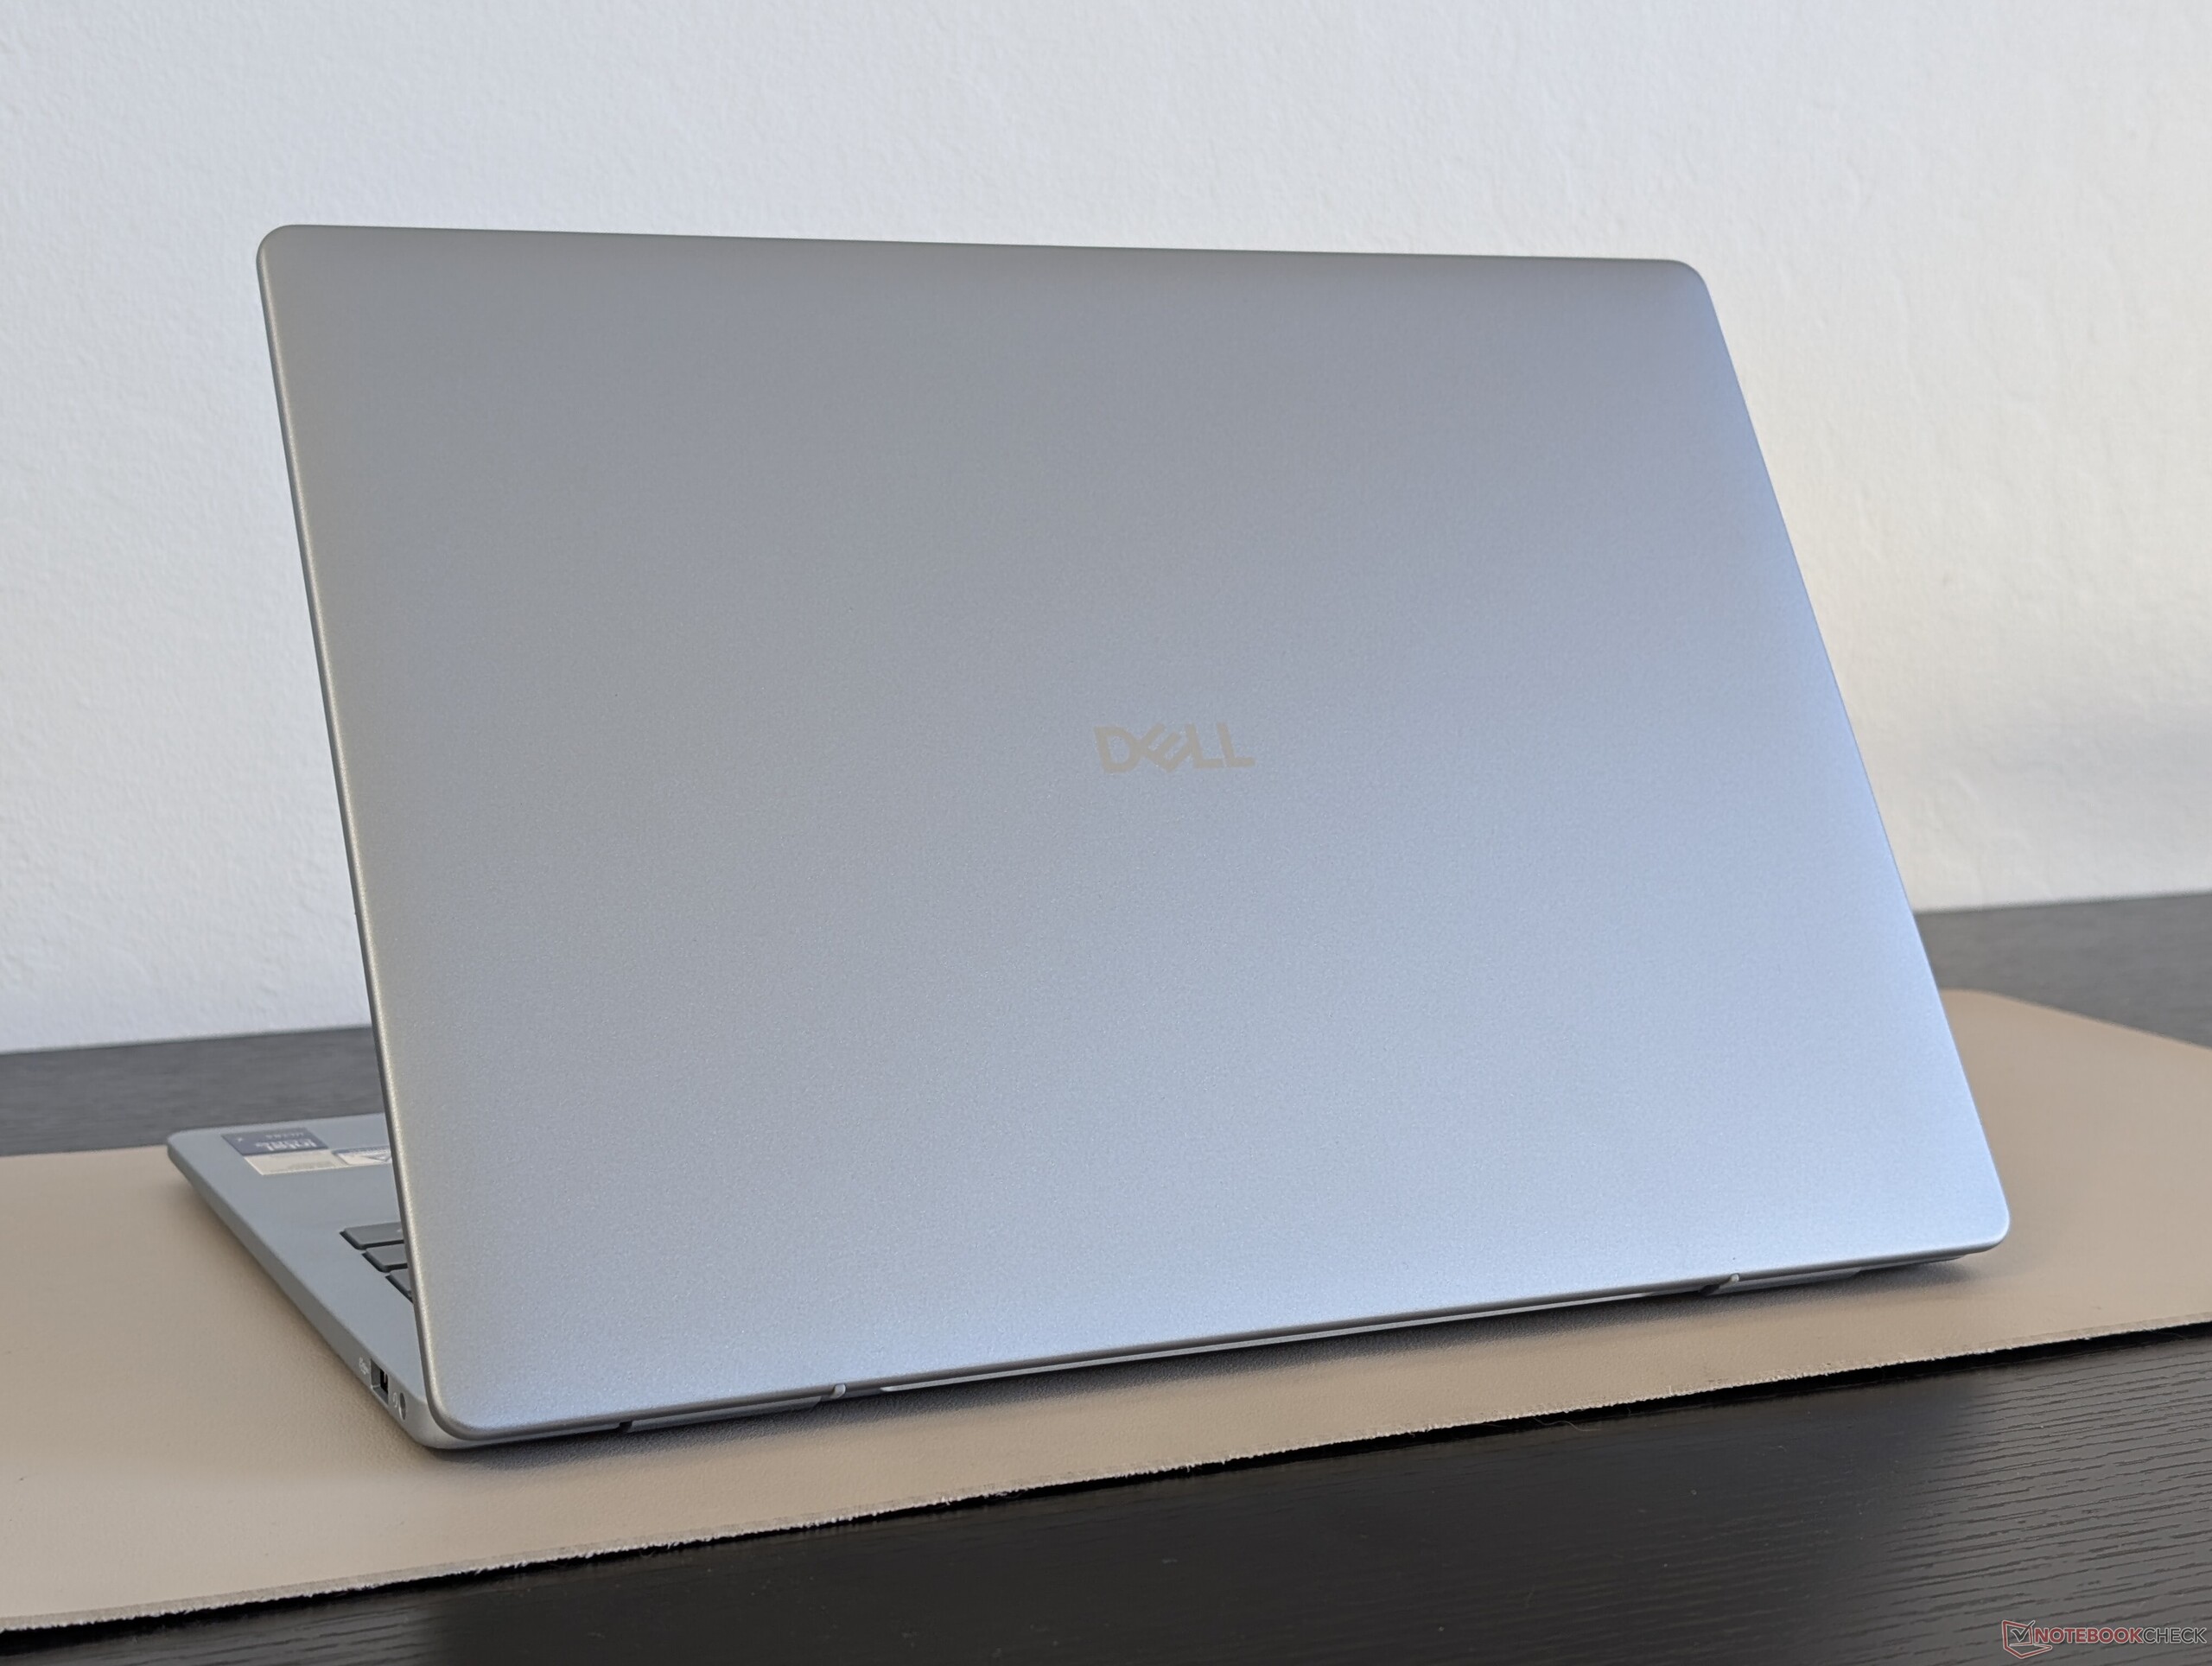
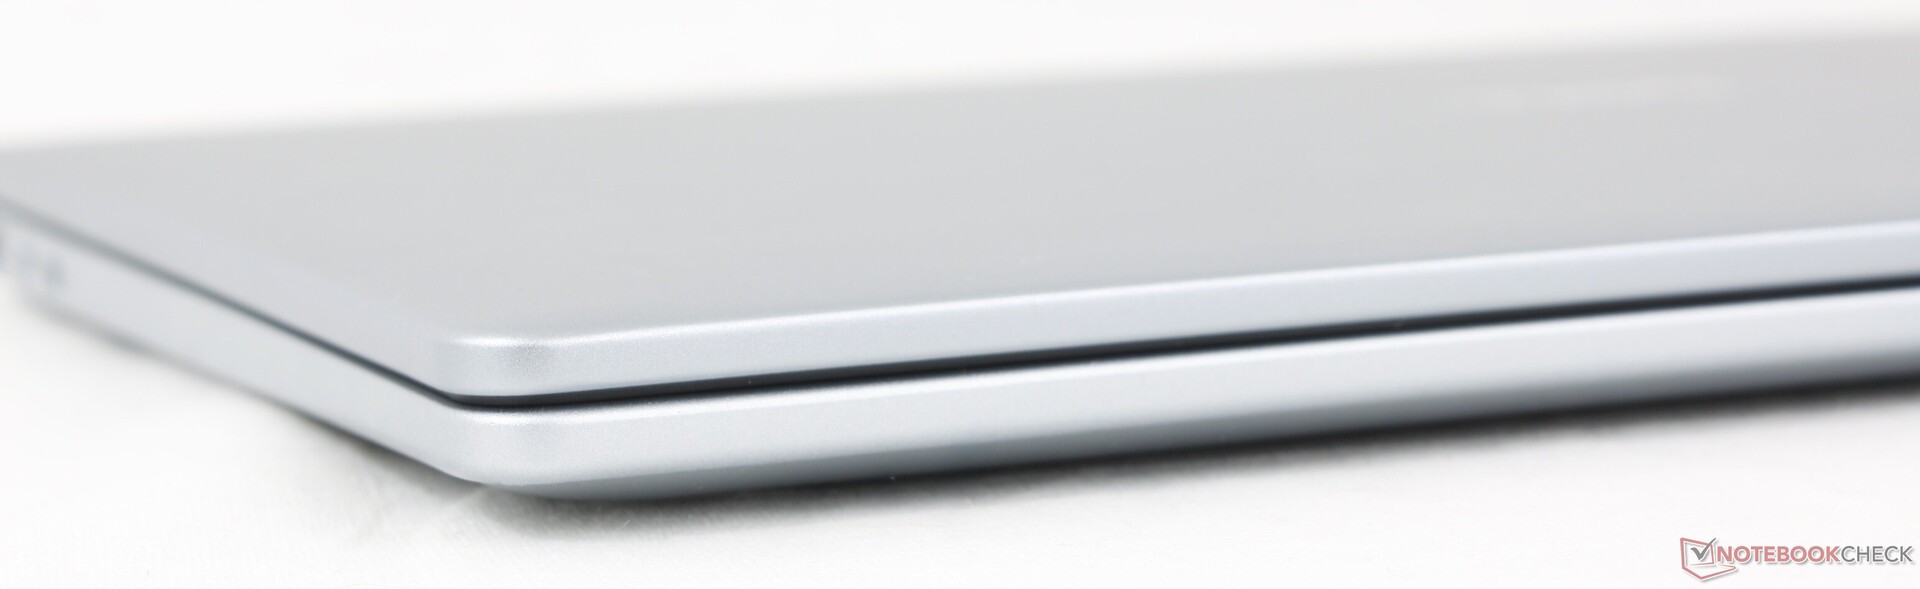
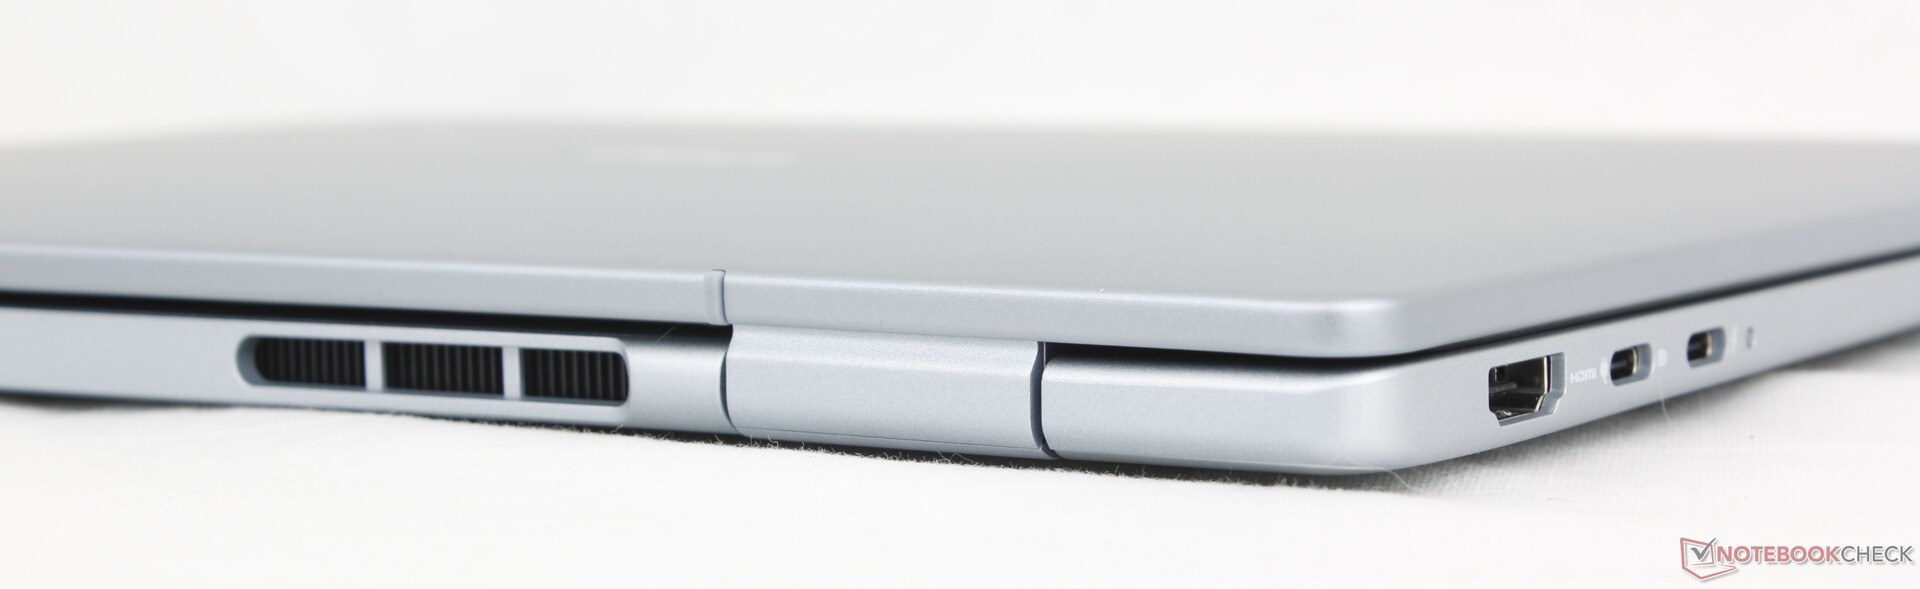
Il telaio ha molto in comune con l'Inspiron 14 Plus 7440 per quanto riguarda i materiali, la combinazione di colori e persino le dimensioni. Forse la differenza più evidente sta nelle cerniere, in quanto il coperchio del modello più recente può aprirsi di 180 gradi, mentre il modello dello scorso anno era limitato a un massimo di ~150 gradi. Ci sono anche piccole differenze nelle griglie di ventilazione posteriori e nel logo sul coperchio esterno. Per il resto, sembra ancora un Inspiron, nonostante l'abbandono del nome.
Connettività
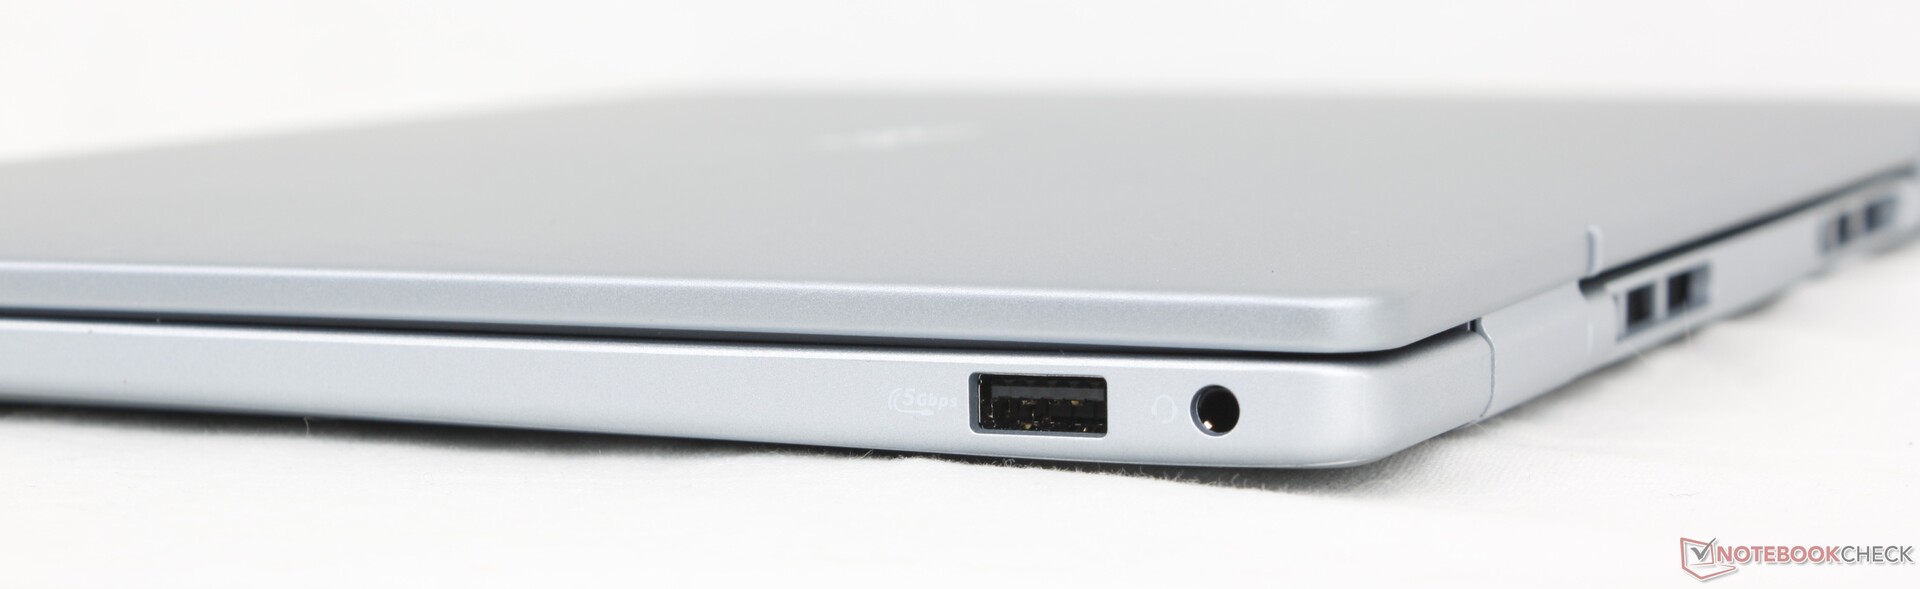
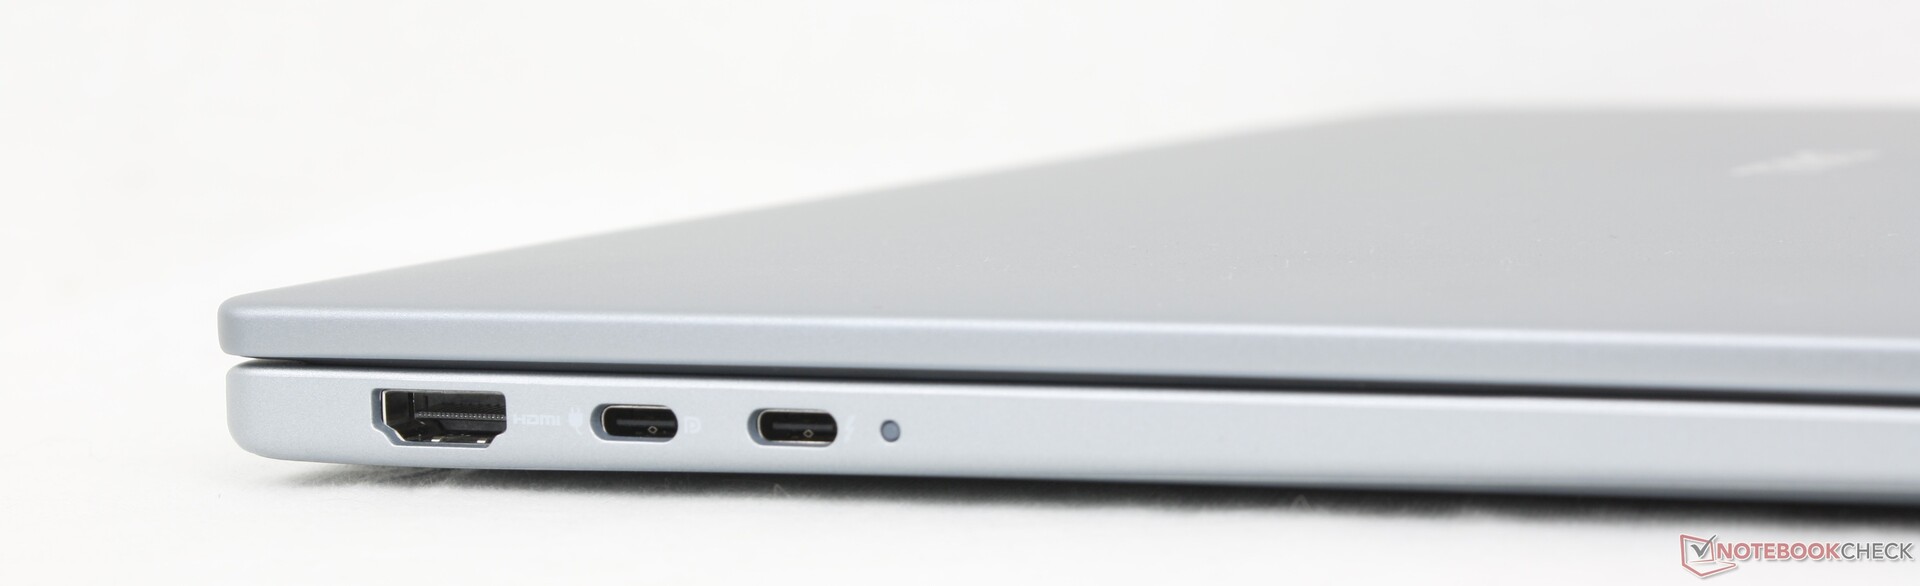
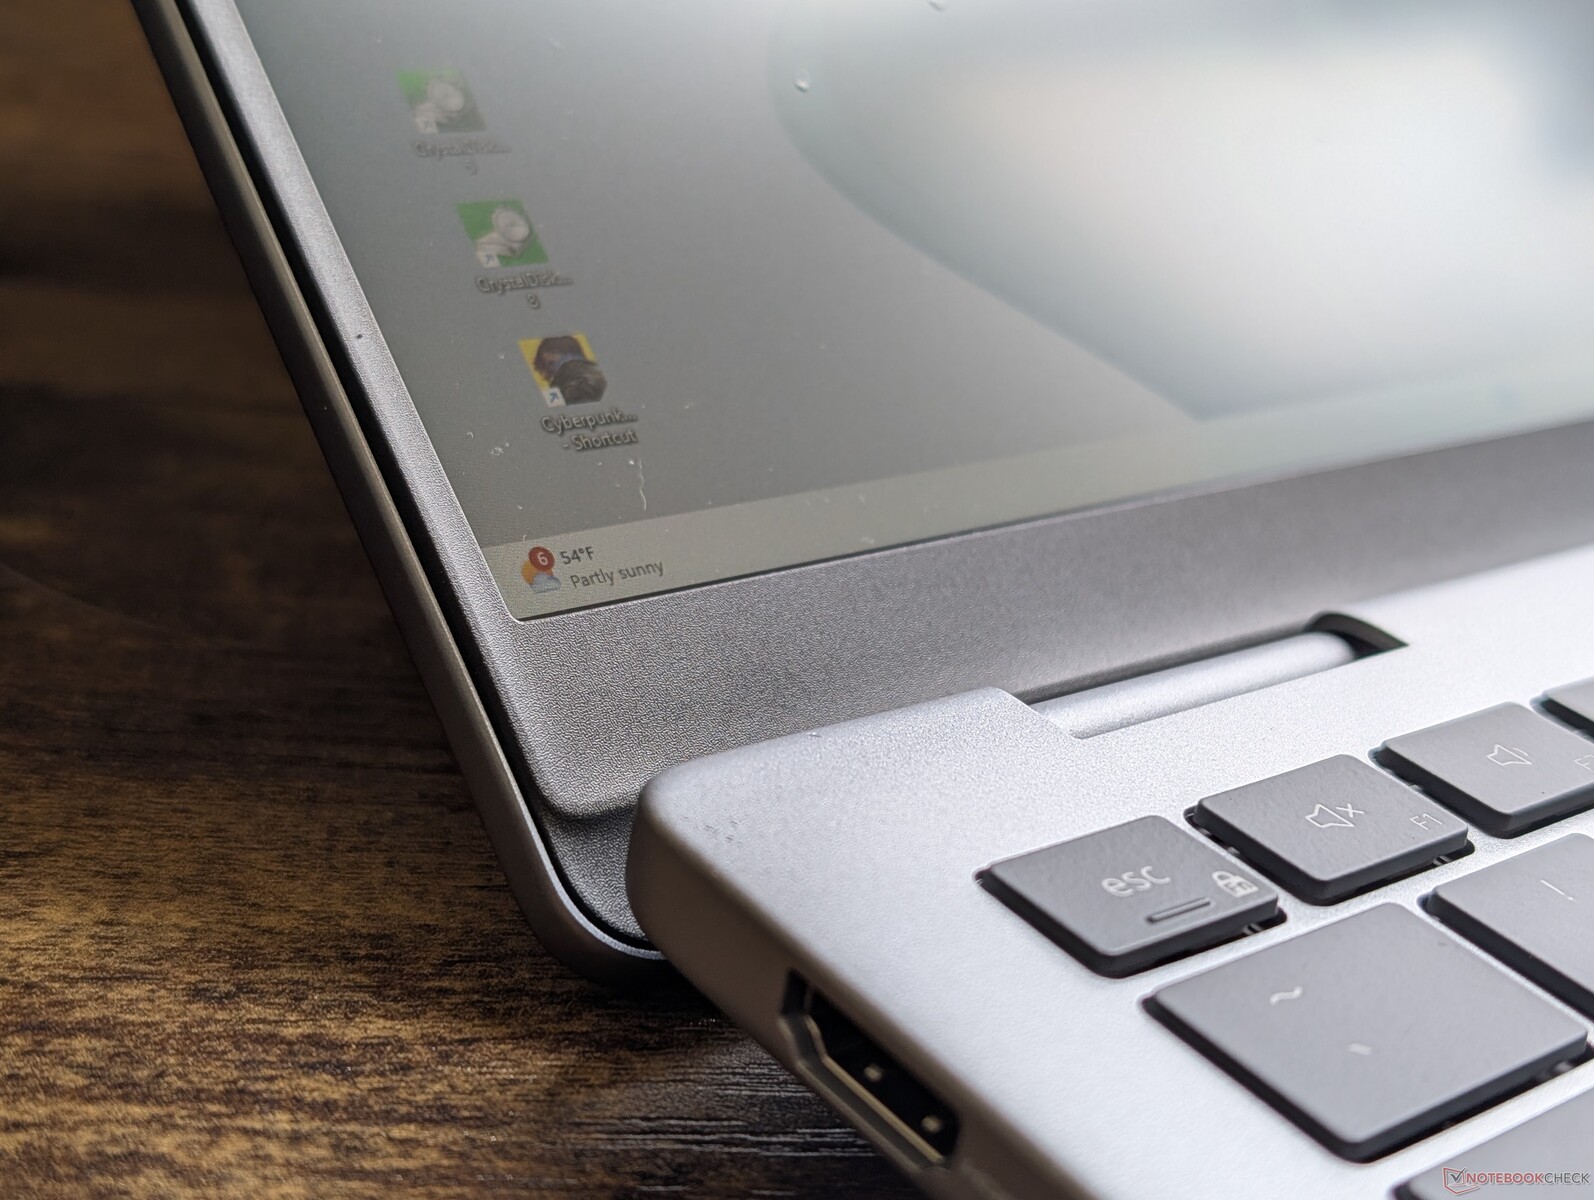
Le opzioni delle porte sono discrete, con due porte USB-C e una sola porta USB-A. La porta dell'adattatore CA a barile, che era presente nei modelli Inspiron precedenti, è stata abbandonata per abbracciare completamente la ricarica USB-C.
Da notare che solo una delle due porte USB-C supporta Thunderbolt 4 e DisplayPort 2.1.
Comunicazione
| Networking | |
| iperf3 transmit AX12 | |
| Dell Inspiron 14 5425 6VPKR | |
| iperf3 receive AX12 | |
| Dell Inspiron 14 5425 6VPKR | |
| iperf3 transmit AXE11000 | |
| Lenovo IdeaPad Pro 5 14AKP G10 | |
| HP Pavilion Plus 14-ew0153TU | |
| Dell 14 Plus | |
| Dell Latitude 3440 | |
| Lenovo ThinkPad E14 G6 | |
| iperf3 receive AXE11000 | |
| Lenovo IdeaPad Pro 5 14AKP G10 | |
| HP Pavilion Plus 14-ew0153TU | |
| Dell 14 Plus | |
| Dell Latitude 3440 | |
| Lenovo ThinkPad E14 G6 | |
| iperf3 transmit AXE11000 6GHz | |
| HP Pavilion Plus 14-ew0153TU | |
| Dell 14 Plus | |
| Dell Latitude 3440 | |
| iperf3 receive AXE11000 6GHz | |
| HP Pavilion Plus 14-ew0153TU | |
| Dell 14 Plus | |
| Dell Latitude 3440 | |
Webcam
Una webcam da 2 MP è di serie, insieme a IR e a un otturatore fisico.


Manutenzione
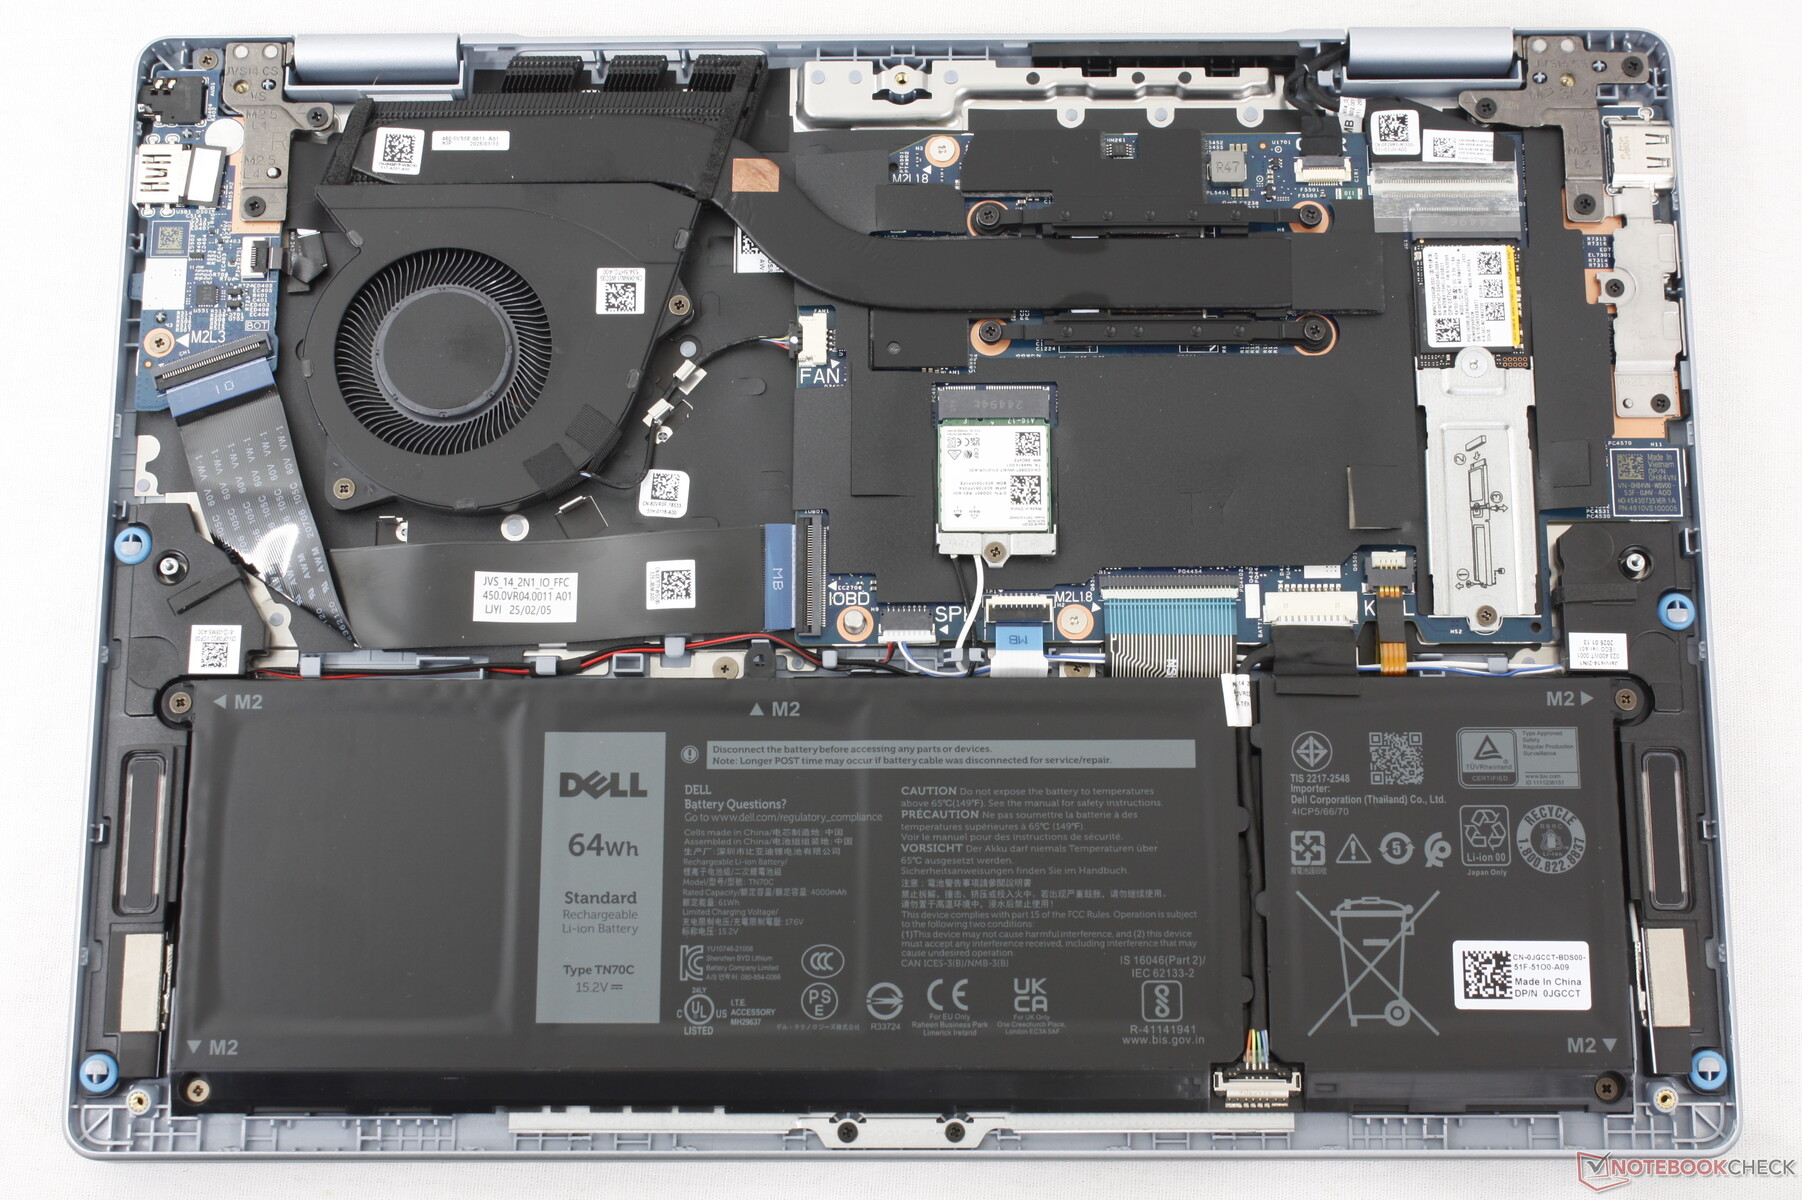
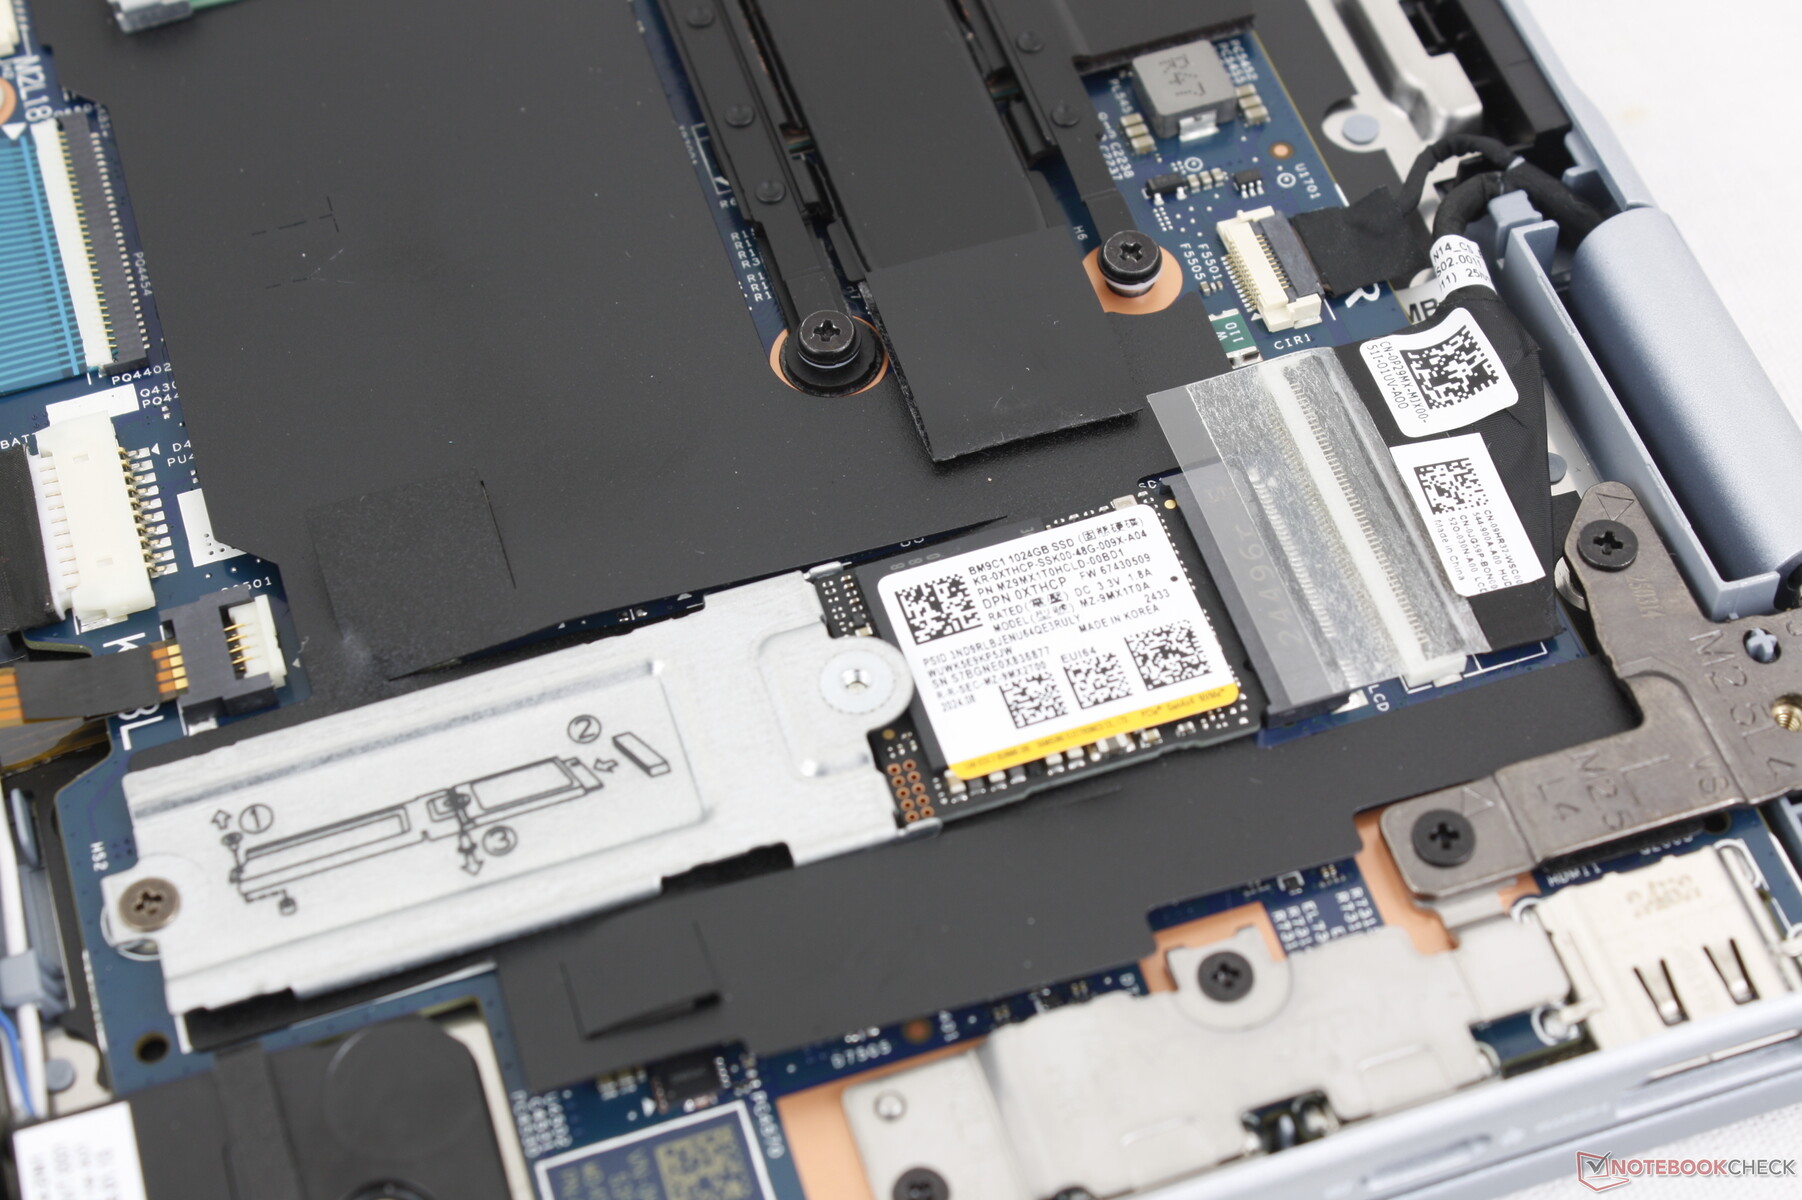
La scheda madre è quasi identica a quella dell'Inspiron 14 Plus 7440, con solo piccole modifiche alla soluzione di raffreddamento.
Sostenibilità
Il coperchio superiore è costituito dal 50 percento di alluminio riciclato, mentre l'alloggiamento della ventola è costituito dal 25 percento di plastica riciclata proveniente dagli oceani. La staffa dei palmari è composta dal 15 percento di acciaio riciclato.
L'imballaggio non utilizza plastica per facilitare il riciclaggio.
Accessori e garanzia
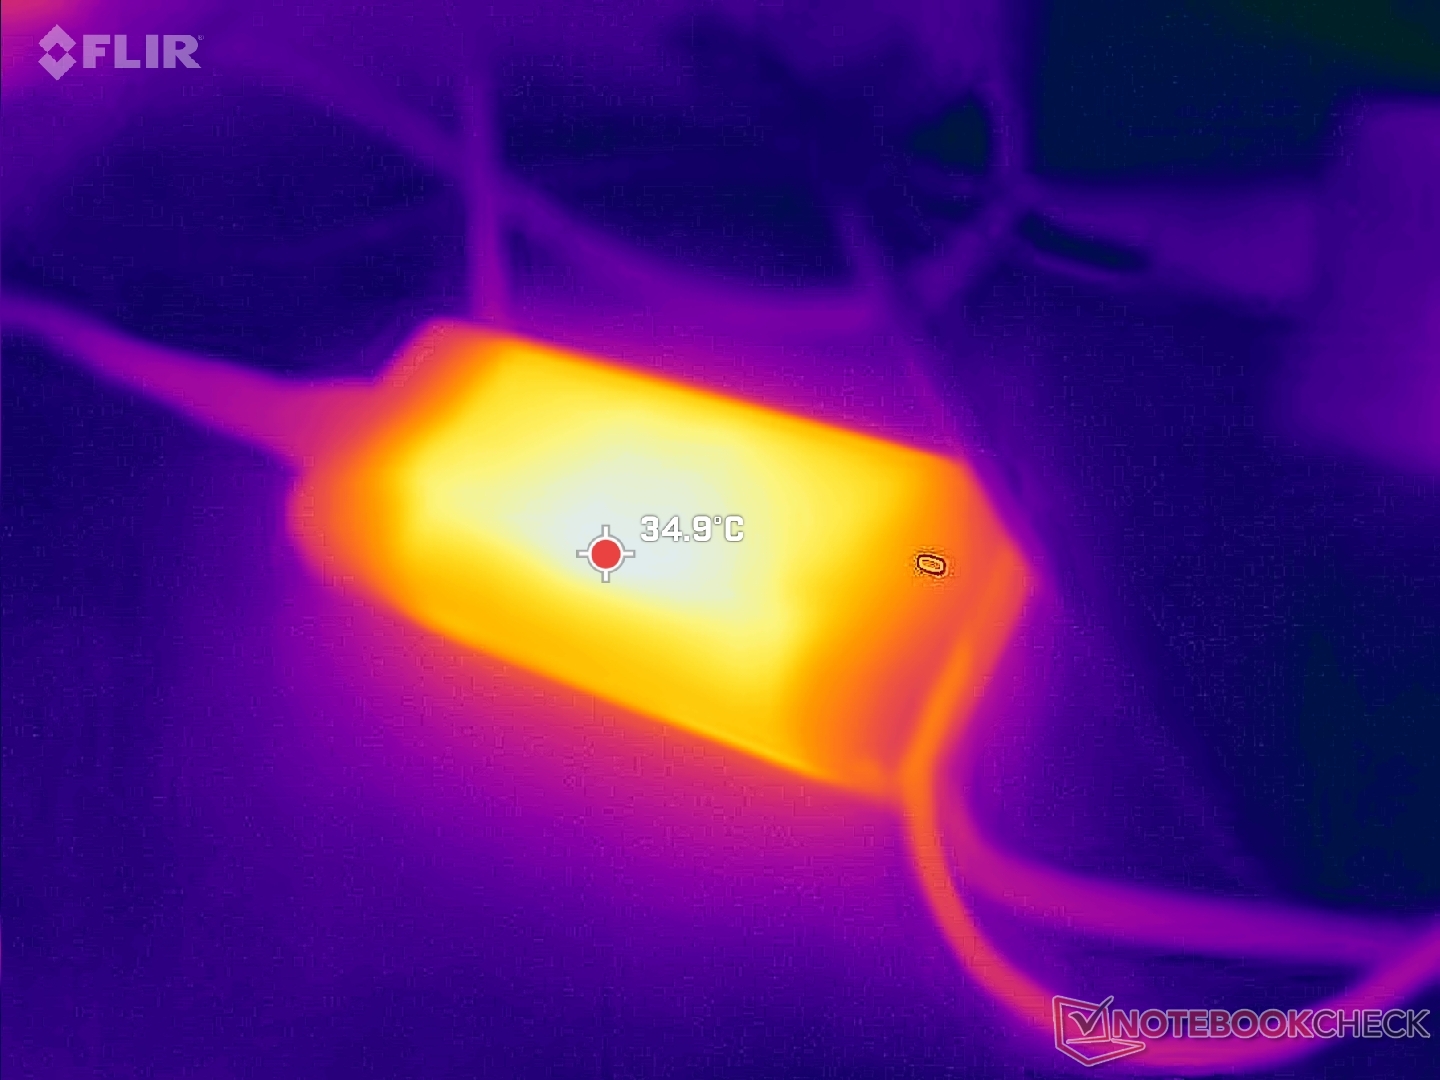
La confezione di vendita al dettaglio include un piccolo (~11,1 x 5 x 2,8 cm) adattatore CA USB-C da 65 W e la consueta documentazione. Se acquistato negli Stati Uniti, si applica una garanzia limitata di un anno del produttore.
Dispositivi di ingresso
Tastiera
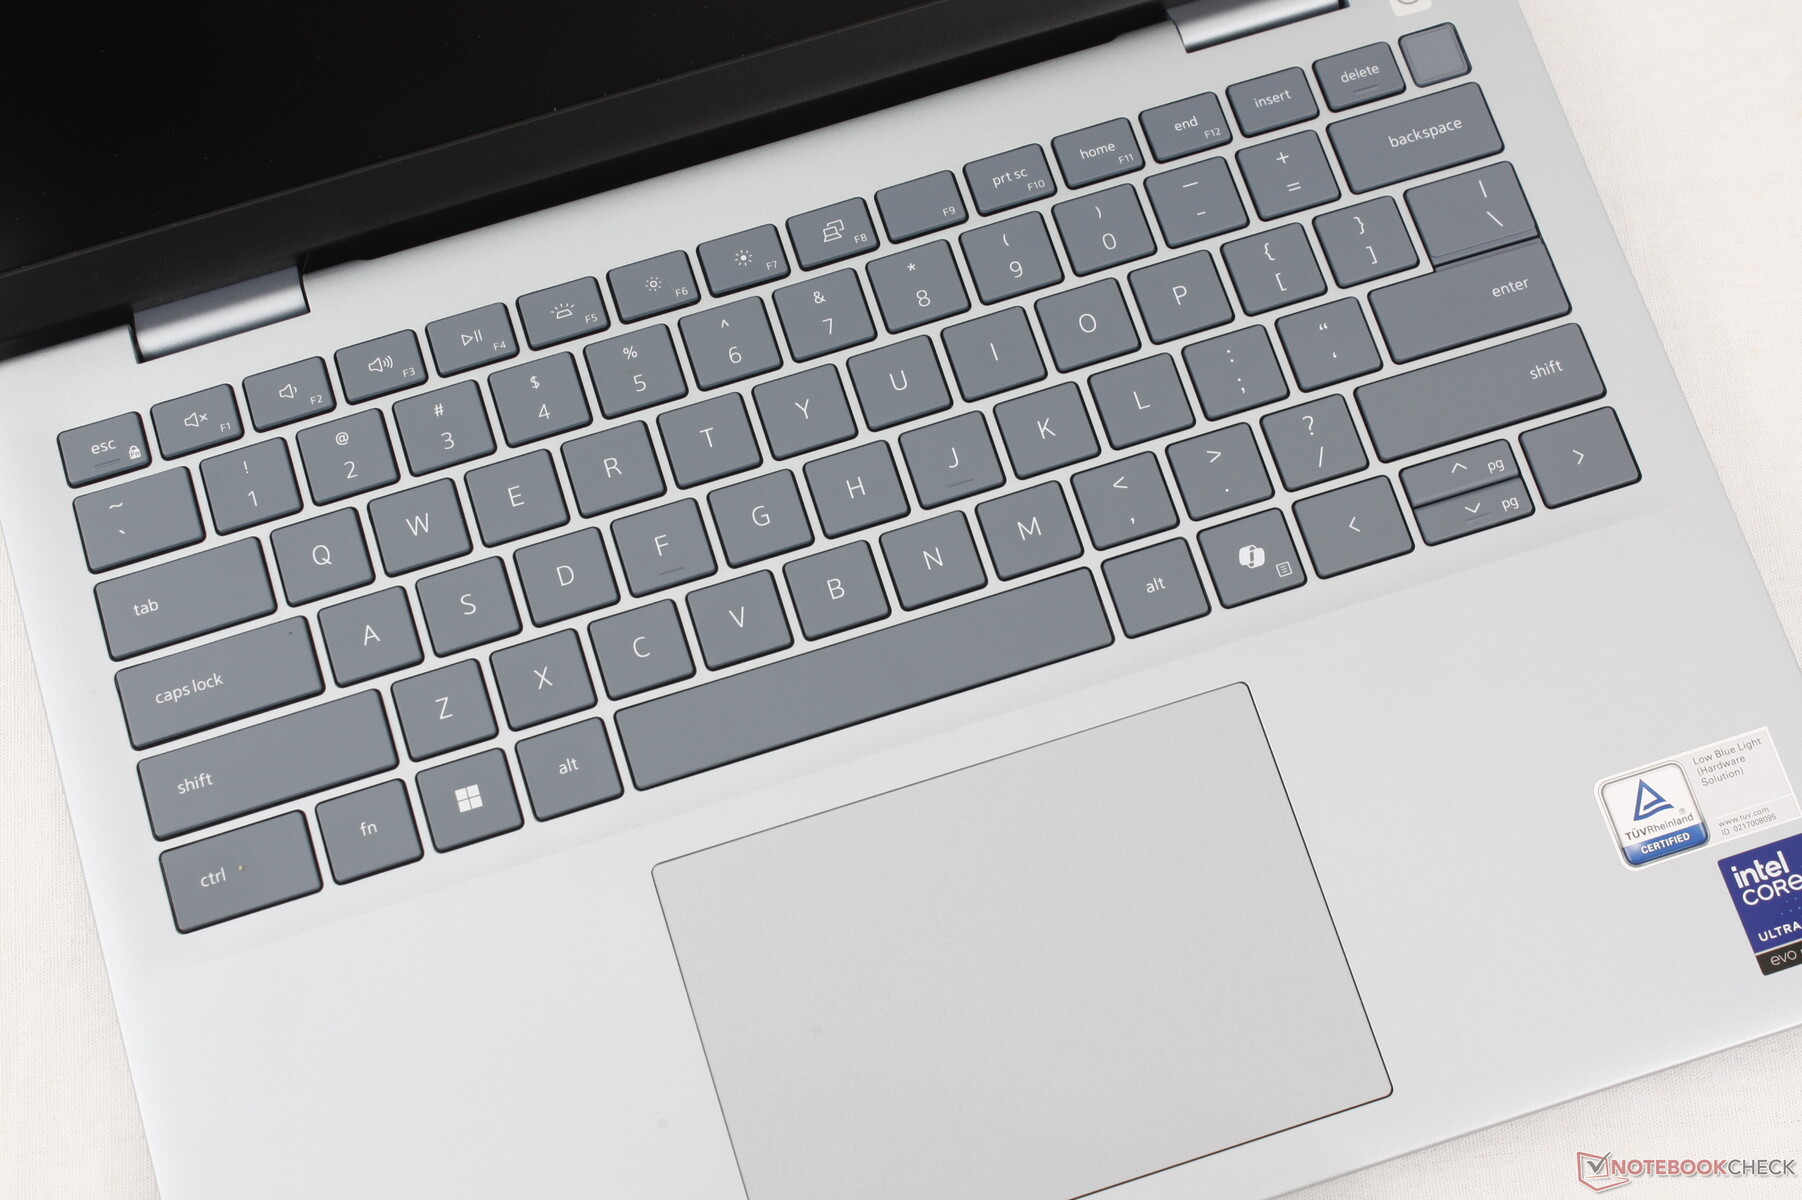
La tastiera è essenzialmente identica a quella dell'Inspiron 14 Plus 7440 dello scorso anno per quanto riguarda il feedback, il carattere e persino le funzioni secondarie. L'unica differenza visiva è il tasto Co-Pilot dedicato che sostituisce il tasto Ctrl destro.
Touchpad
Il clickpad ha esattamente le stesse dimensioni di quello dell'Inspiron 14 Plus 7440 dello scorso anno, 12,5 x 8 cm. Il controllo del cursore è spazioso e affidabile, ma il feedback quando preme sulla superficie è troppo debole e superficiale.
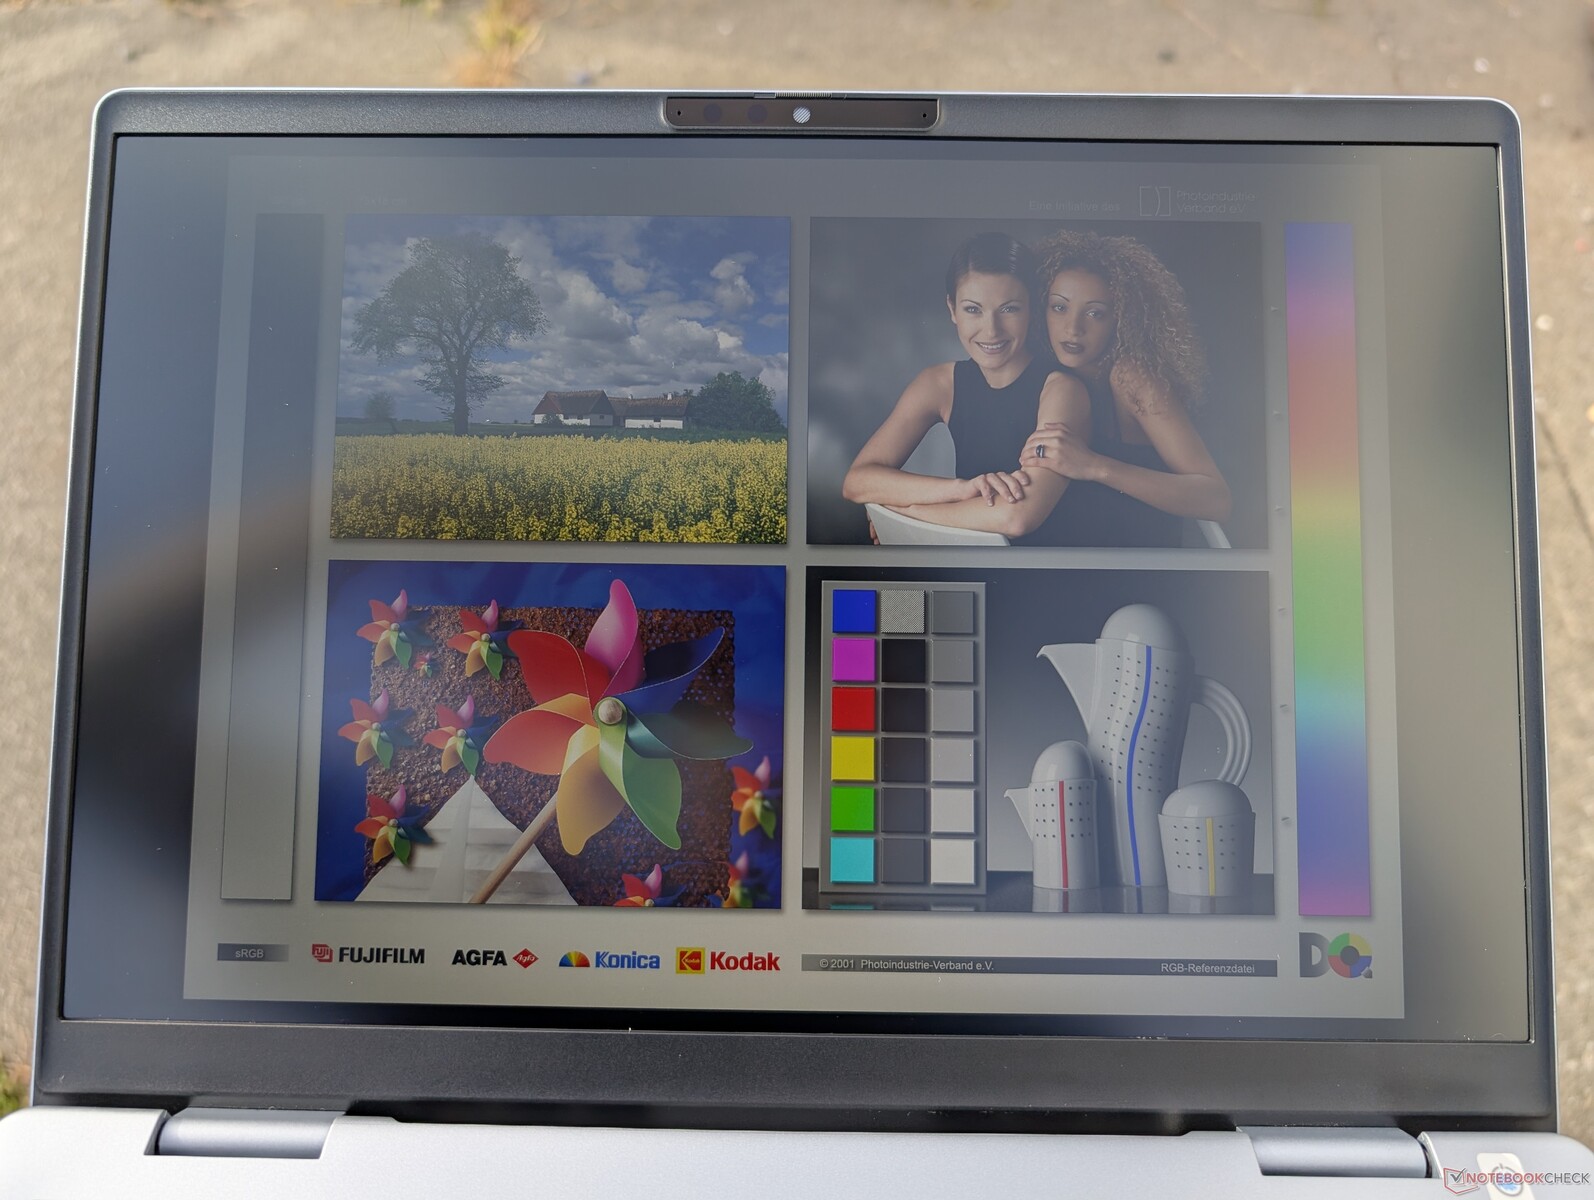
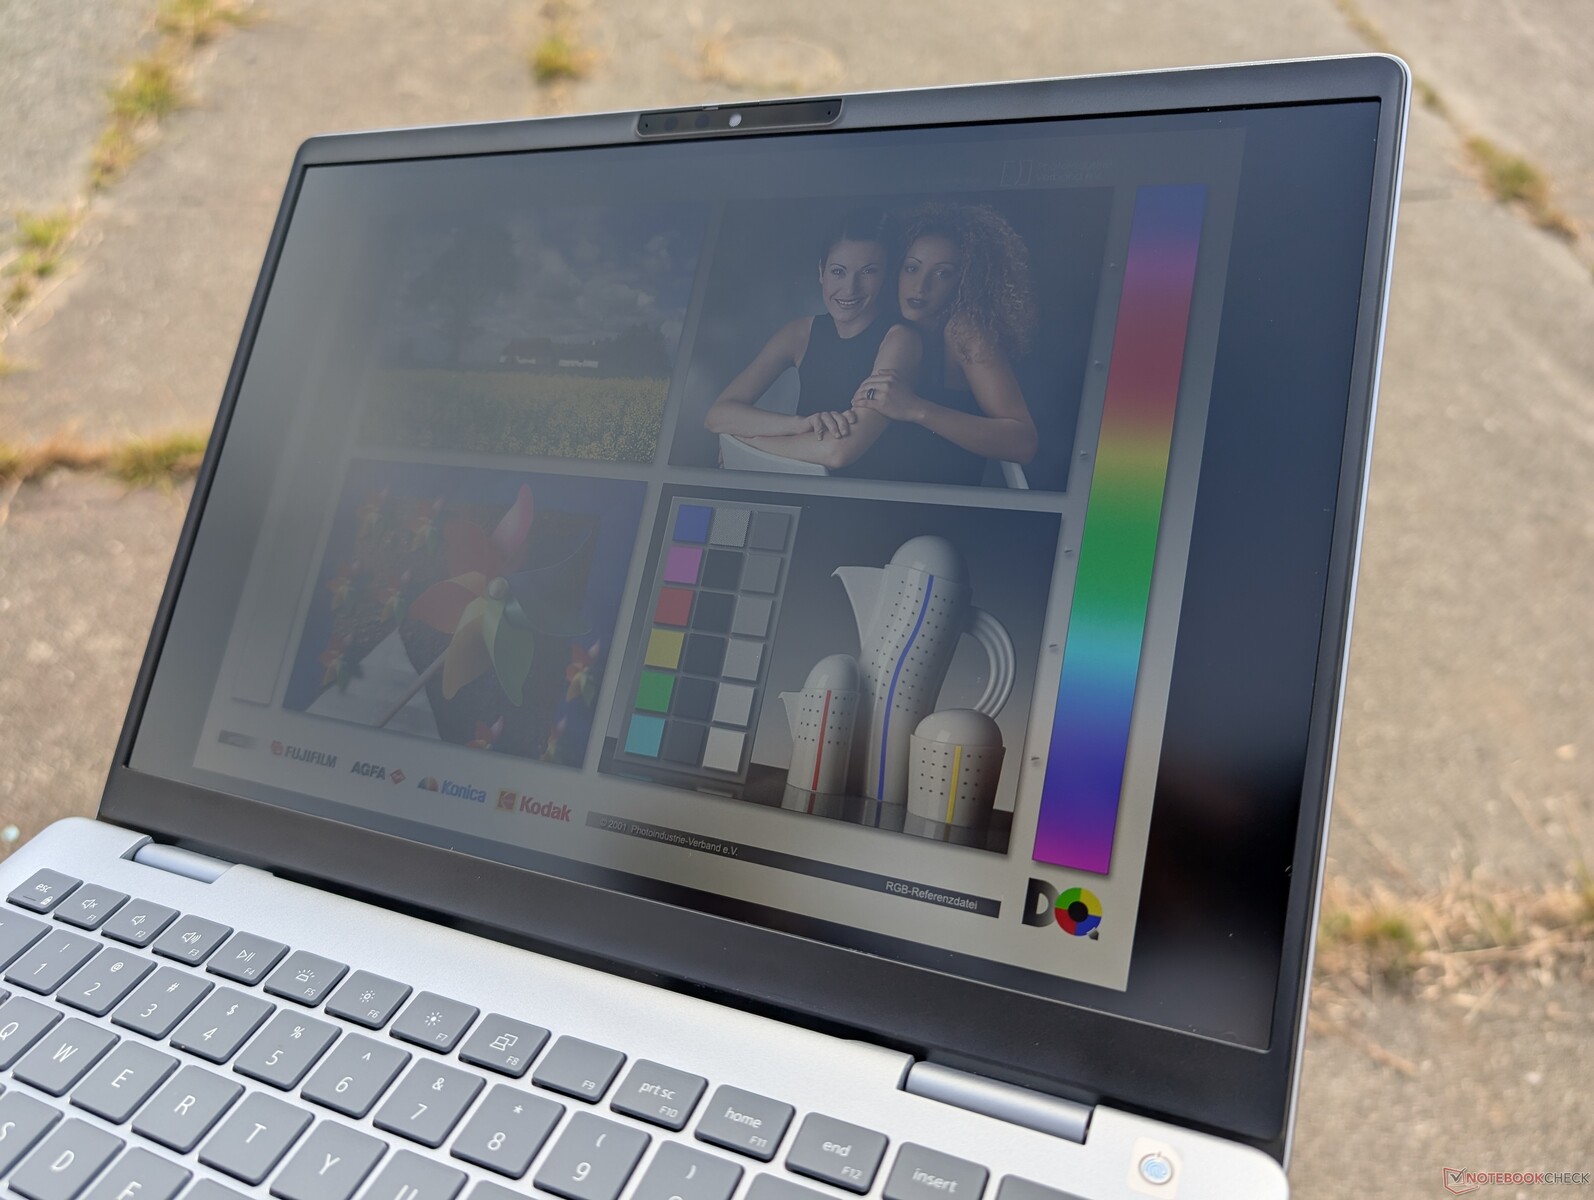
Display
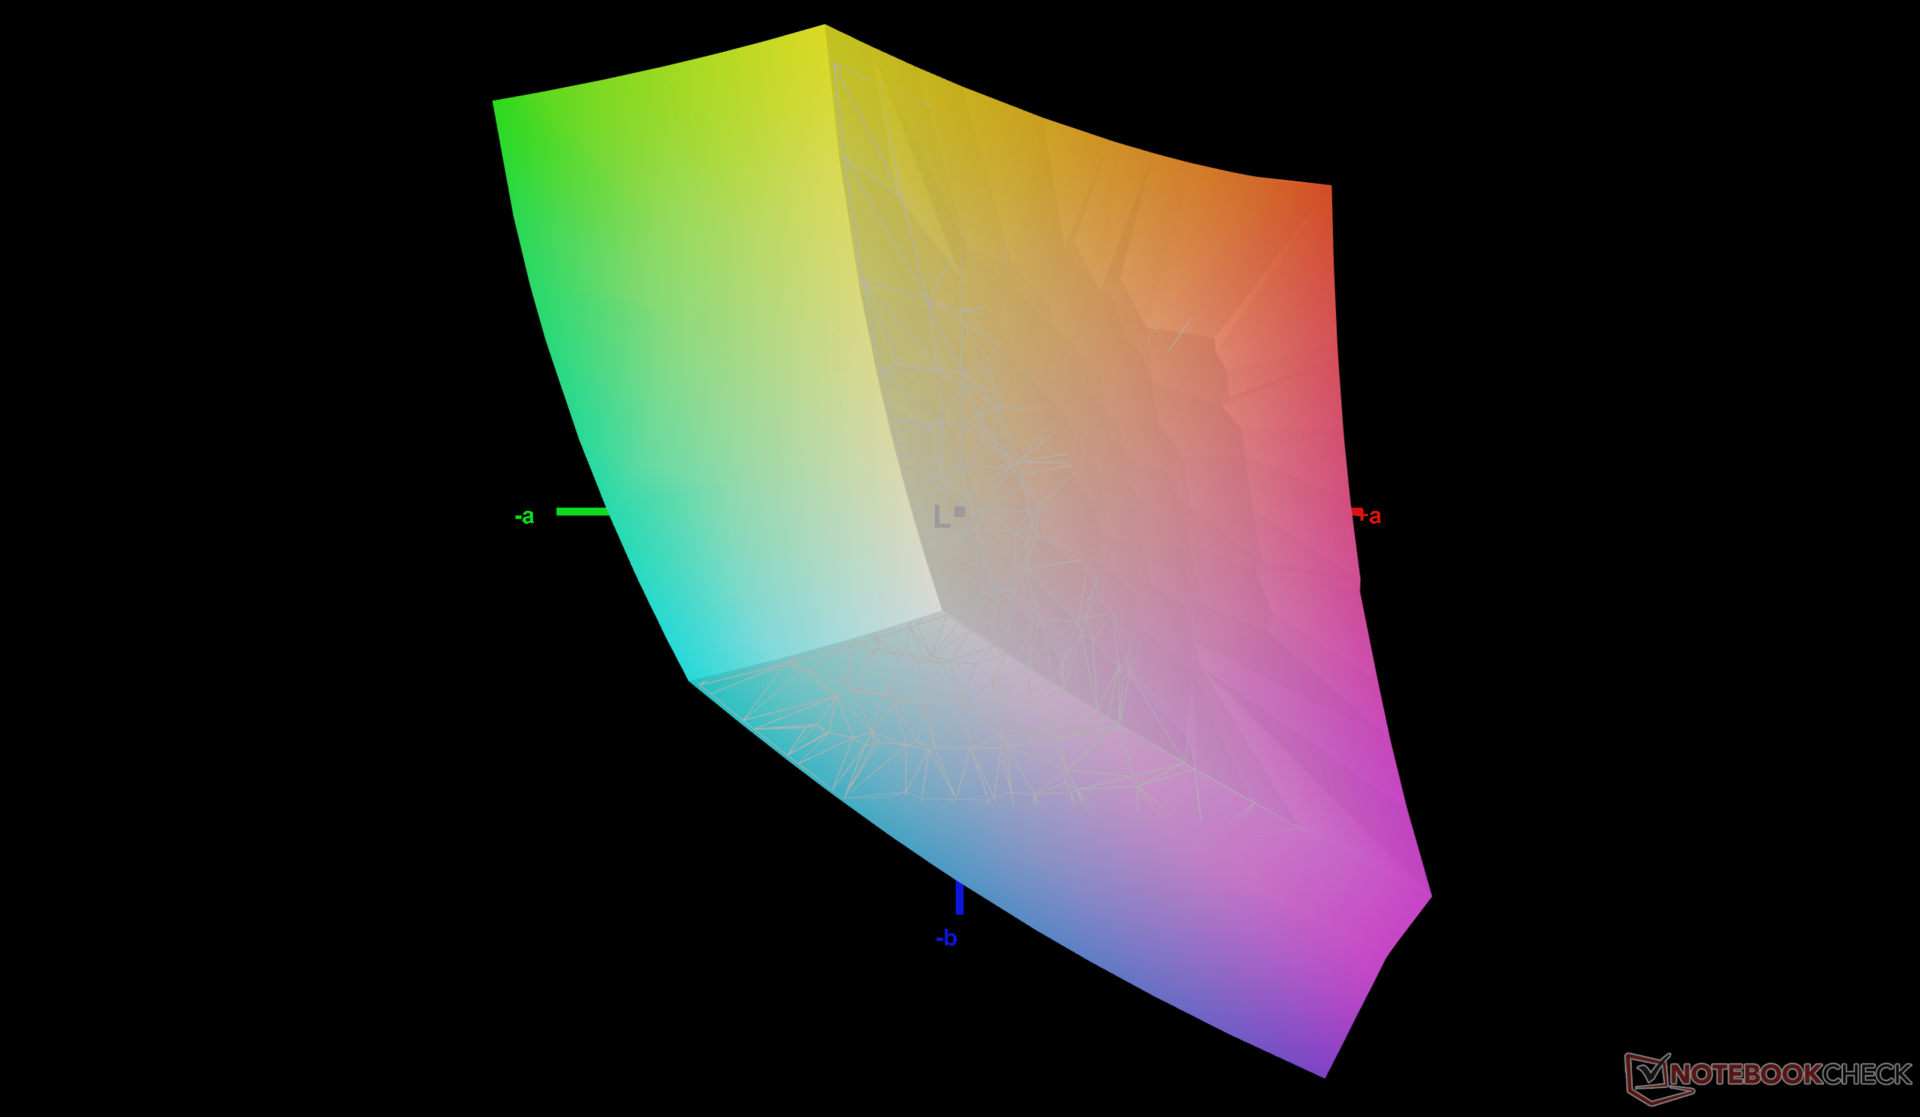
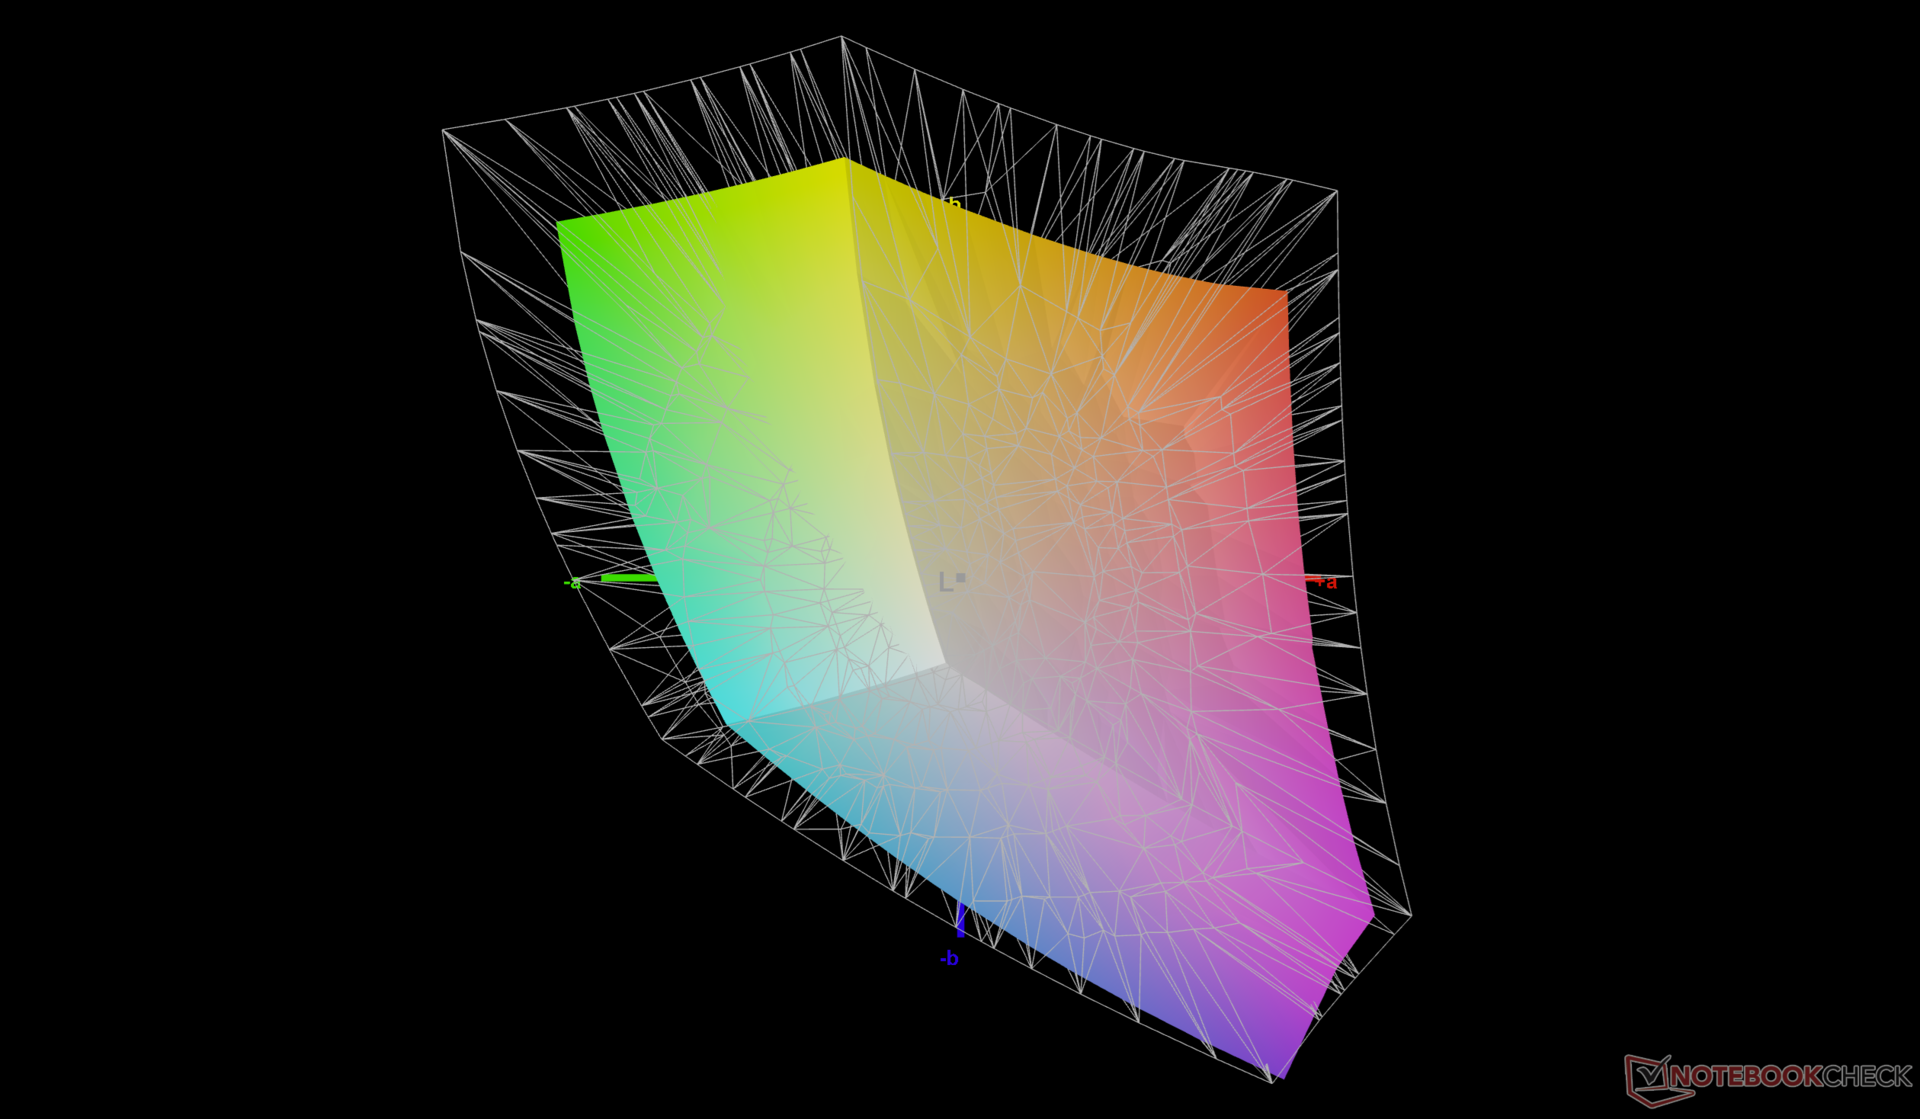
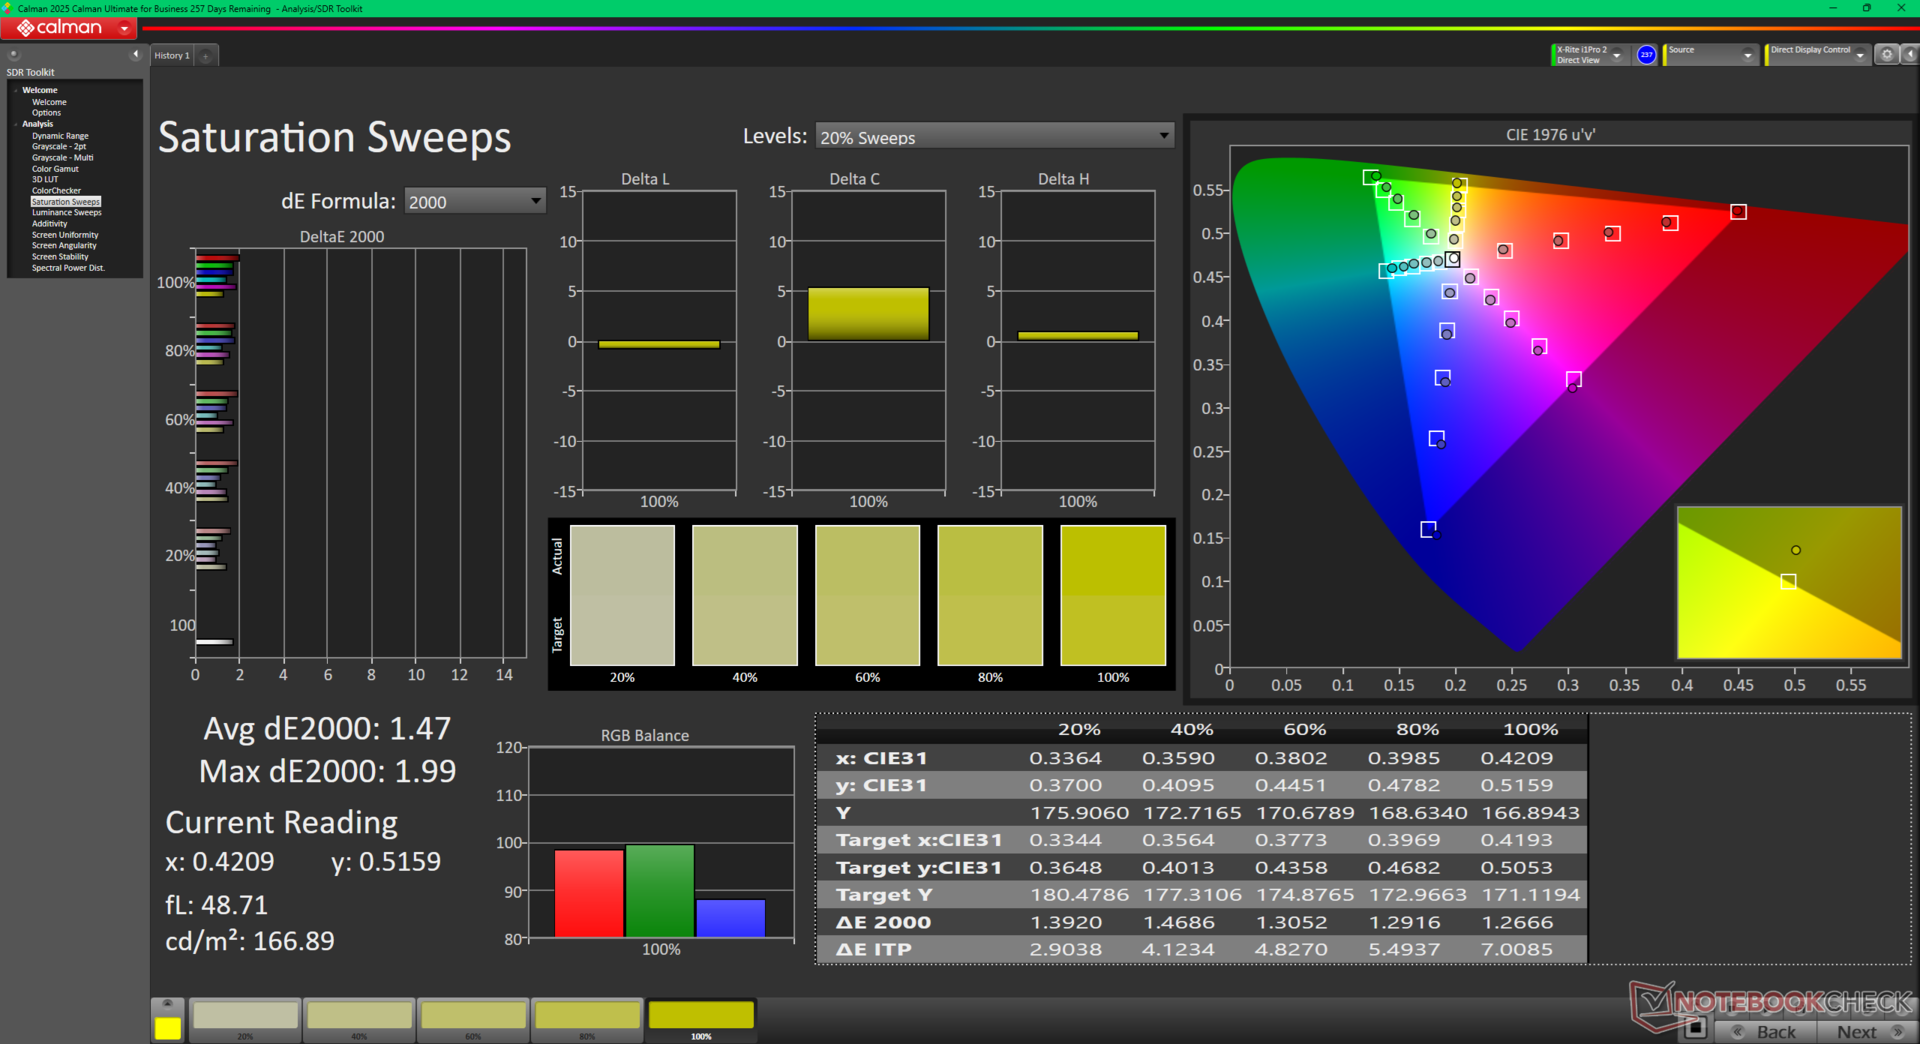
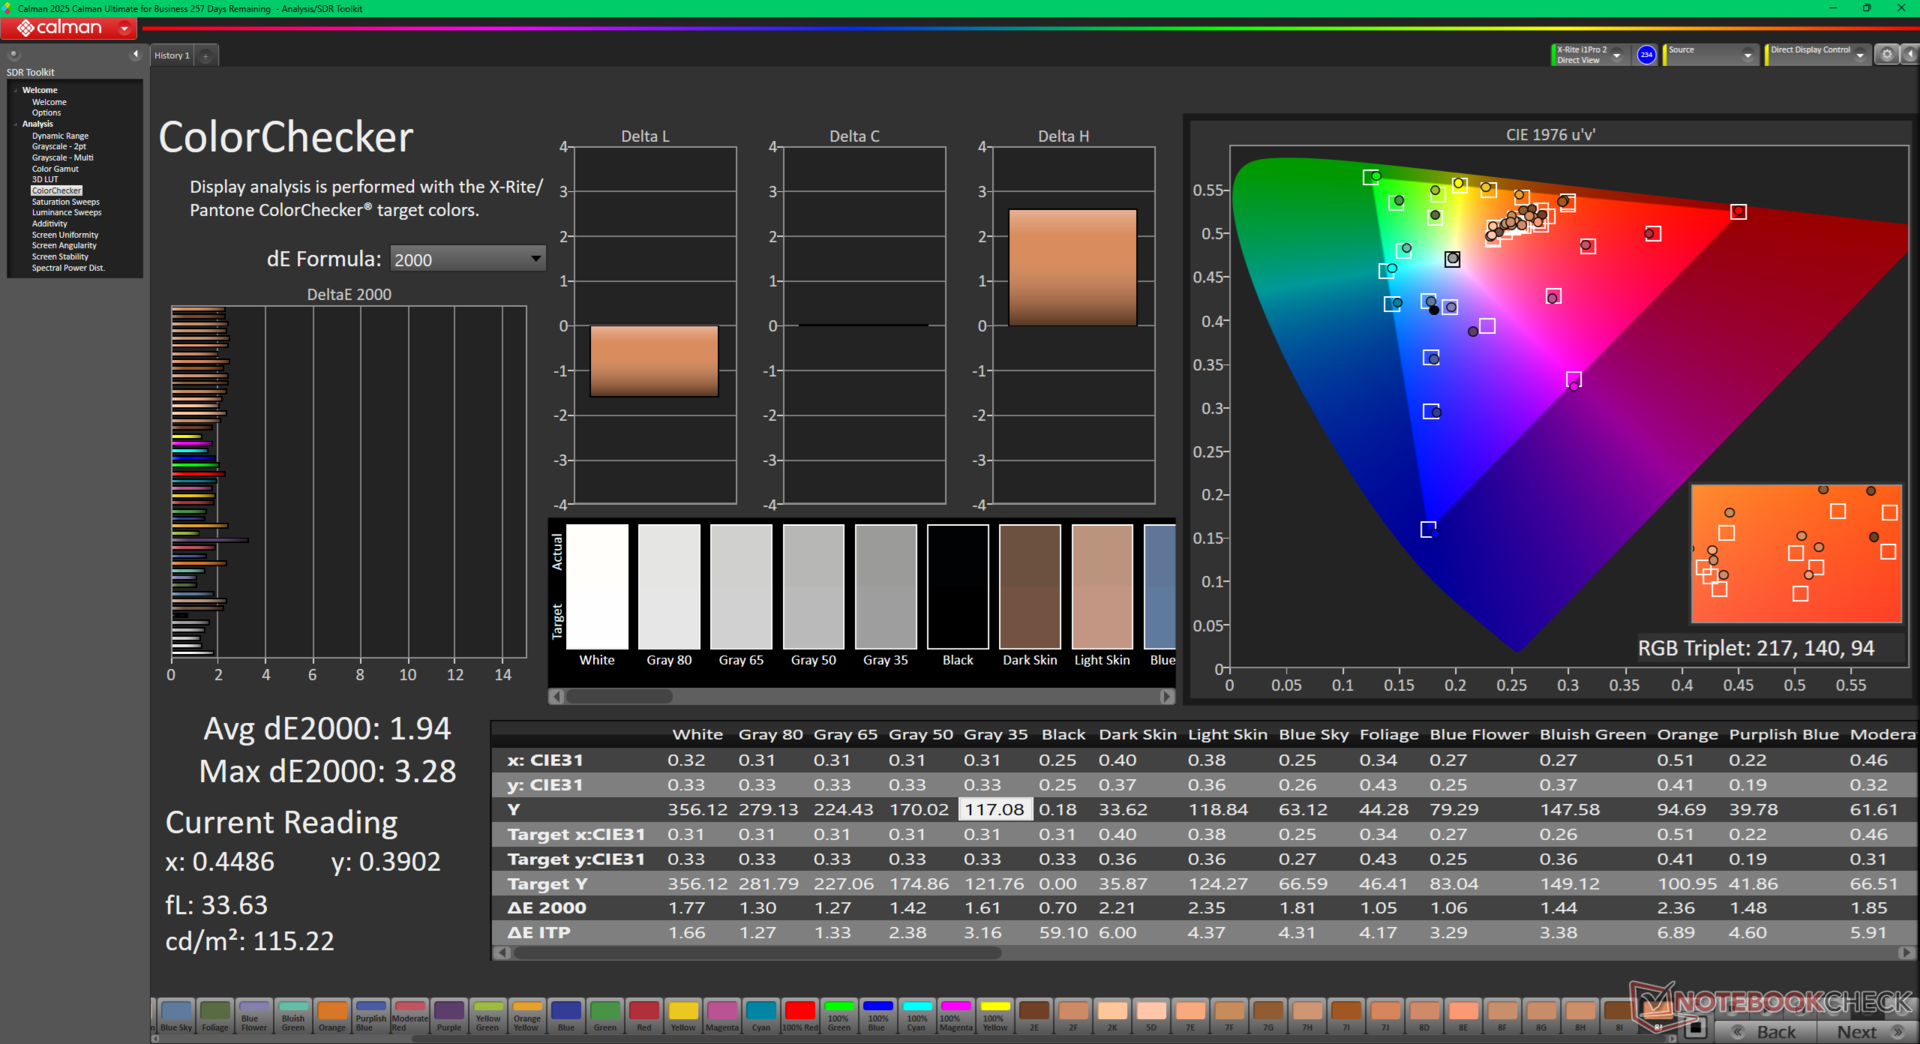
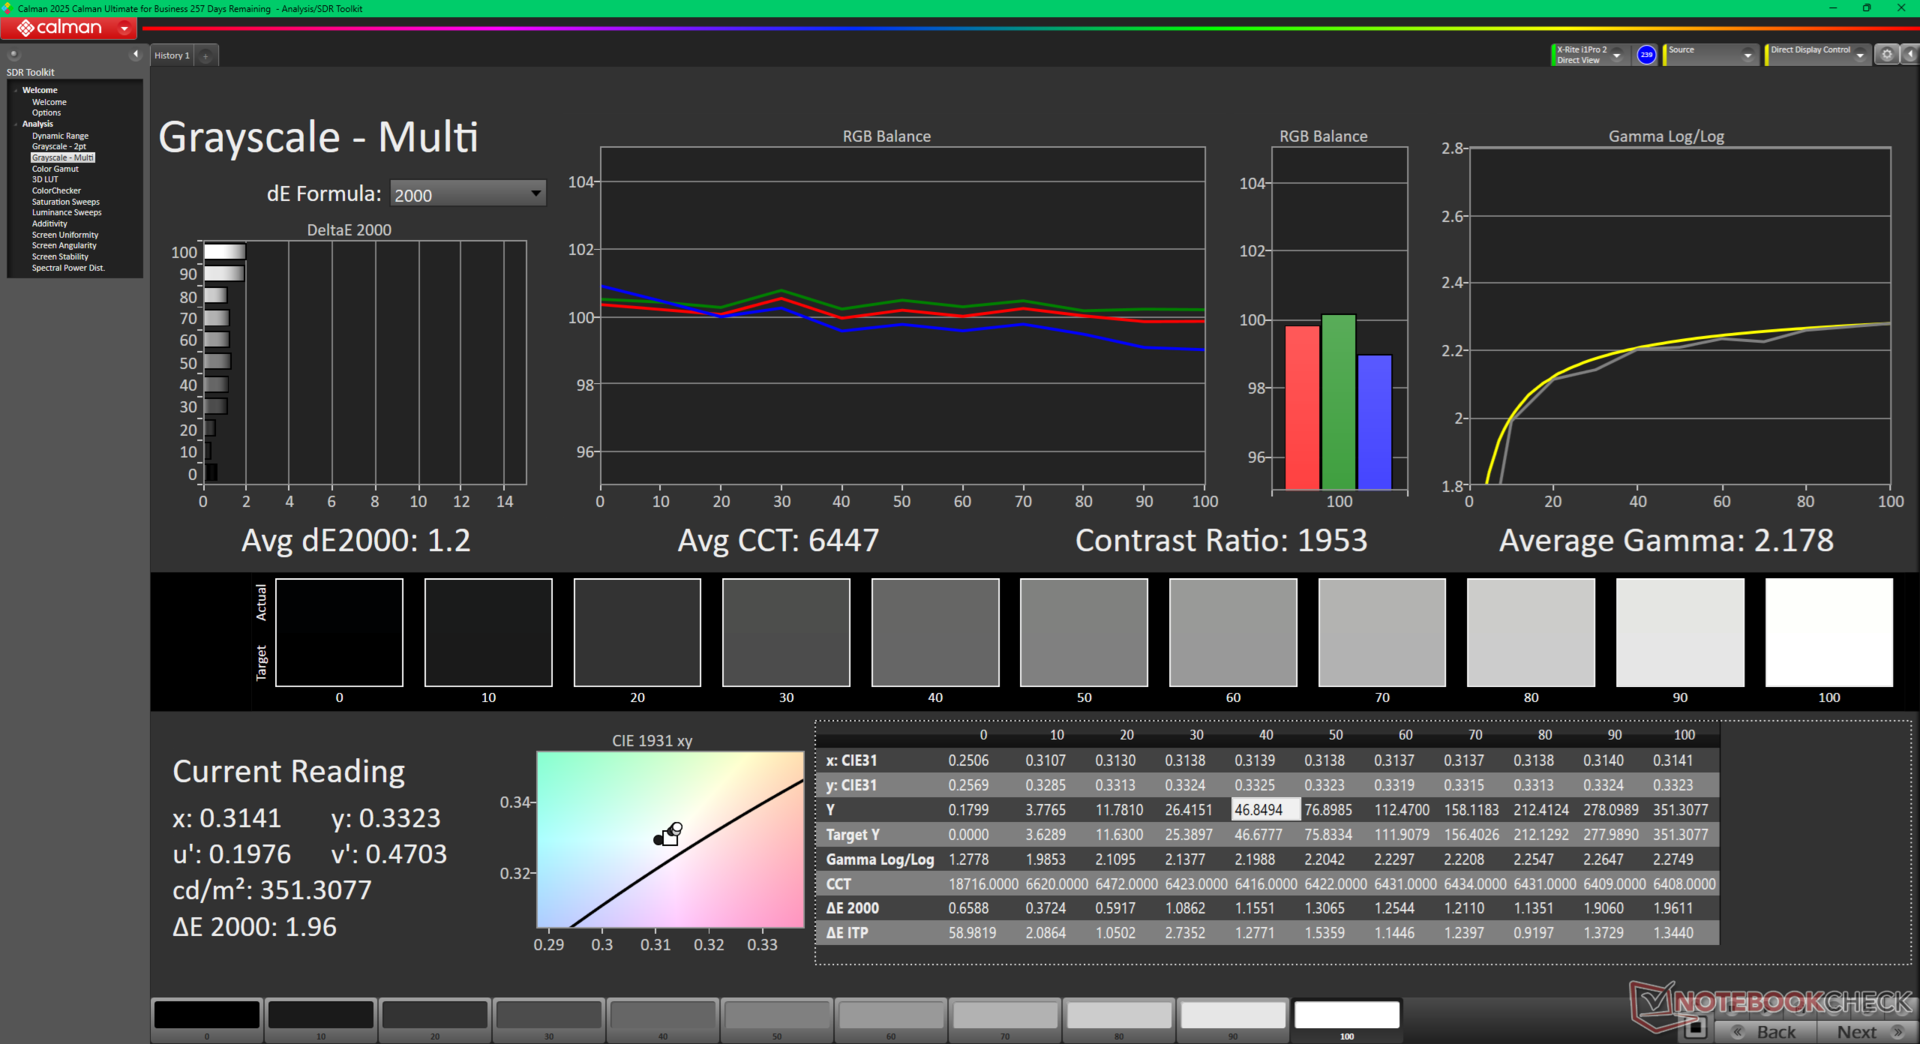
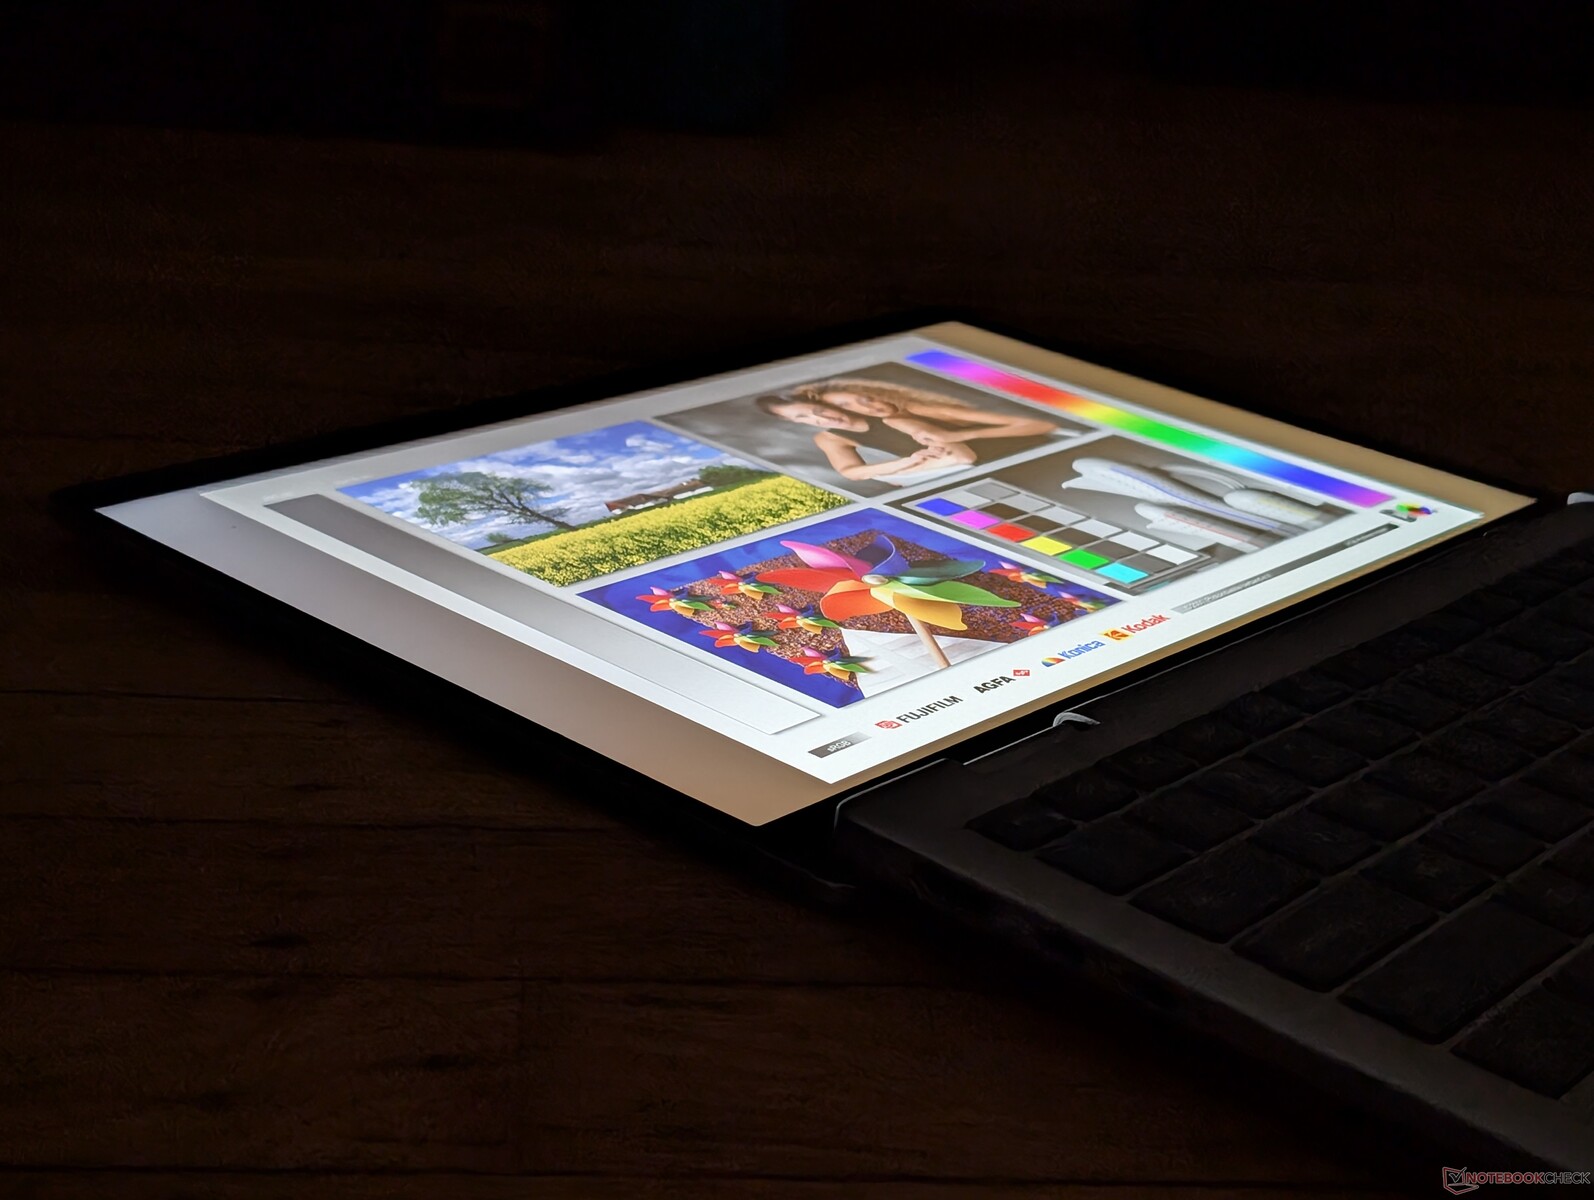
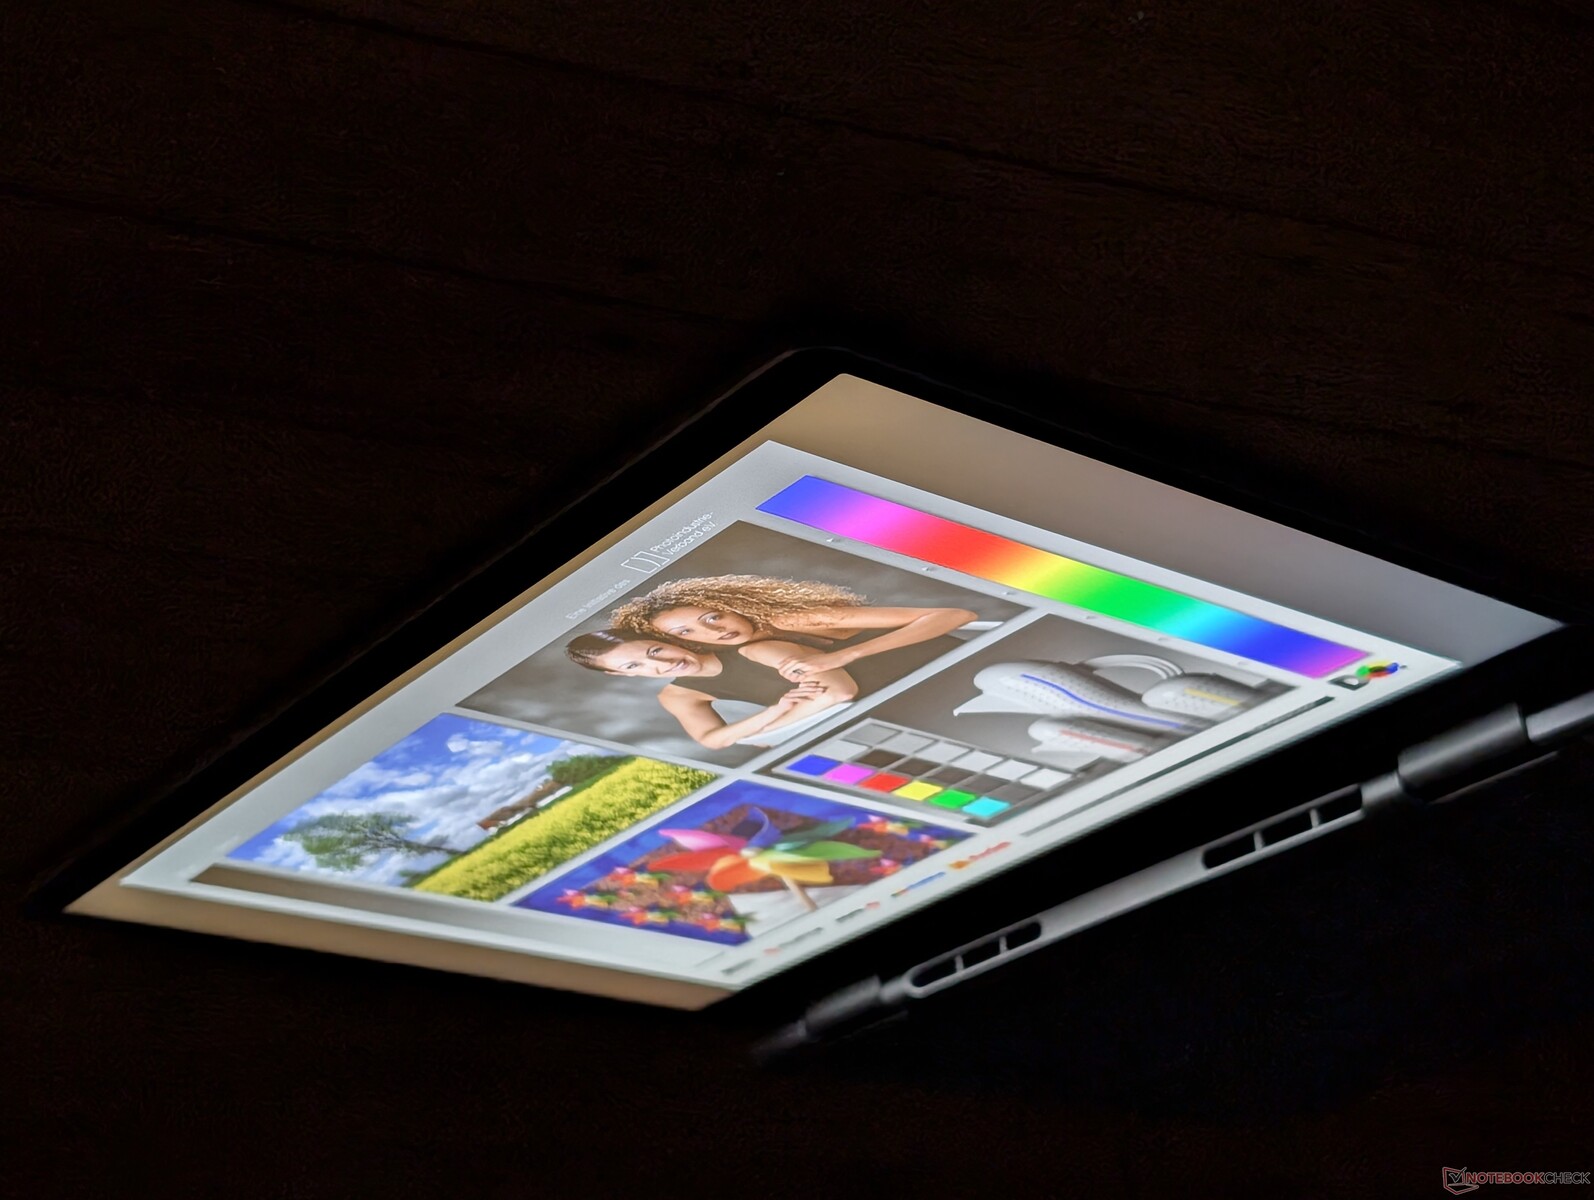
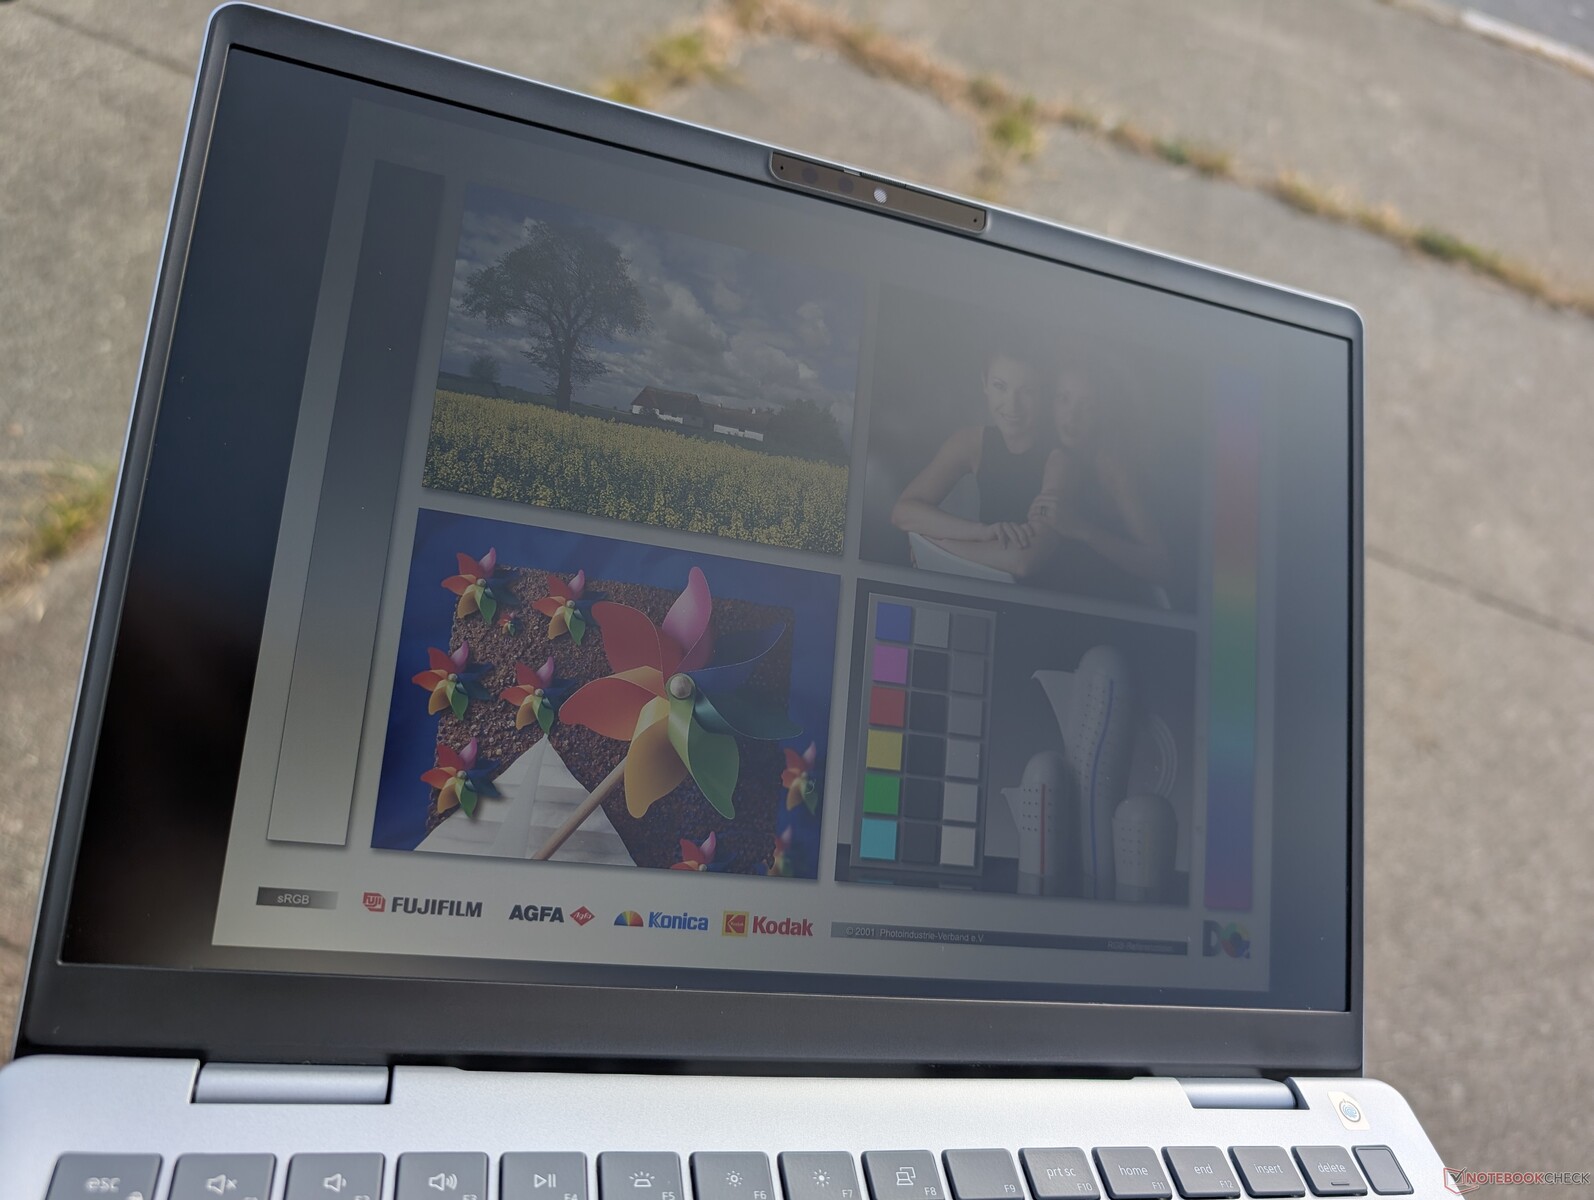
Il display da 1600p offre colori sRGB completi, un rapporto di contrasto elevato per un pannello IPS e una frequenza di aggiornamento di 90 Hz, per essere migliore della maggior parte dei display dei computer portatili economici. I principali inconvenienti sono i tempi di risposta in bianco e nero relativamente lenti e l'overlay opaco leggermente sgranato. Per la navigazione e la riproduzione di video, tuttavia, gli inconvenienti dovrebbero avere un impatto minimo sull'esperienza visiva.

| |||||||||||||||||||||||||
Distribuzione della luminosità: 92 %
Al centro con la batteria: 354 cd/m²
Contrasto: 1686:1 (Nero: 0.21 cd/m²)
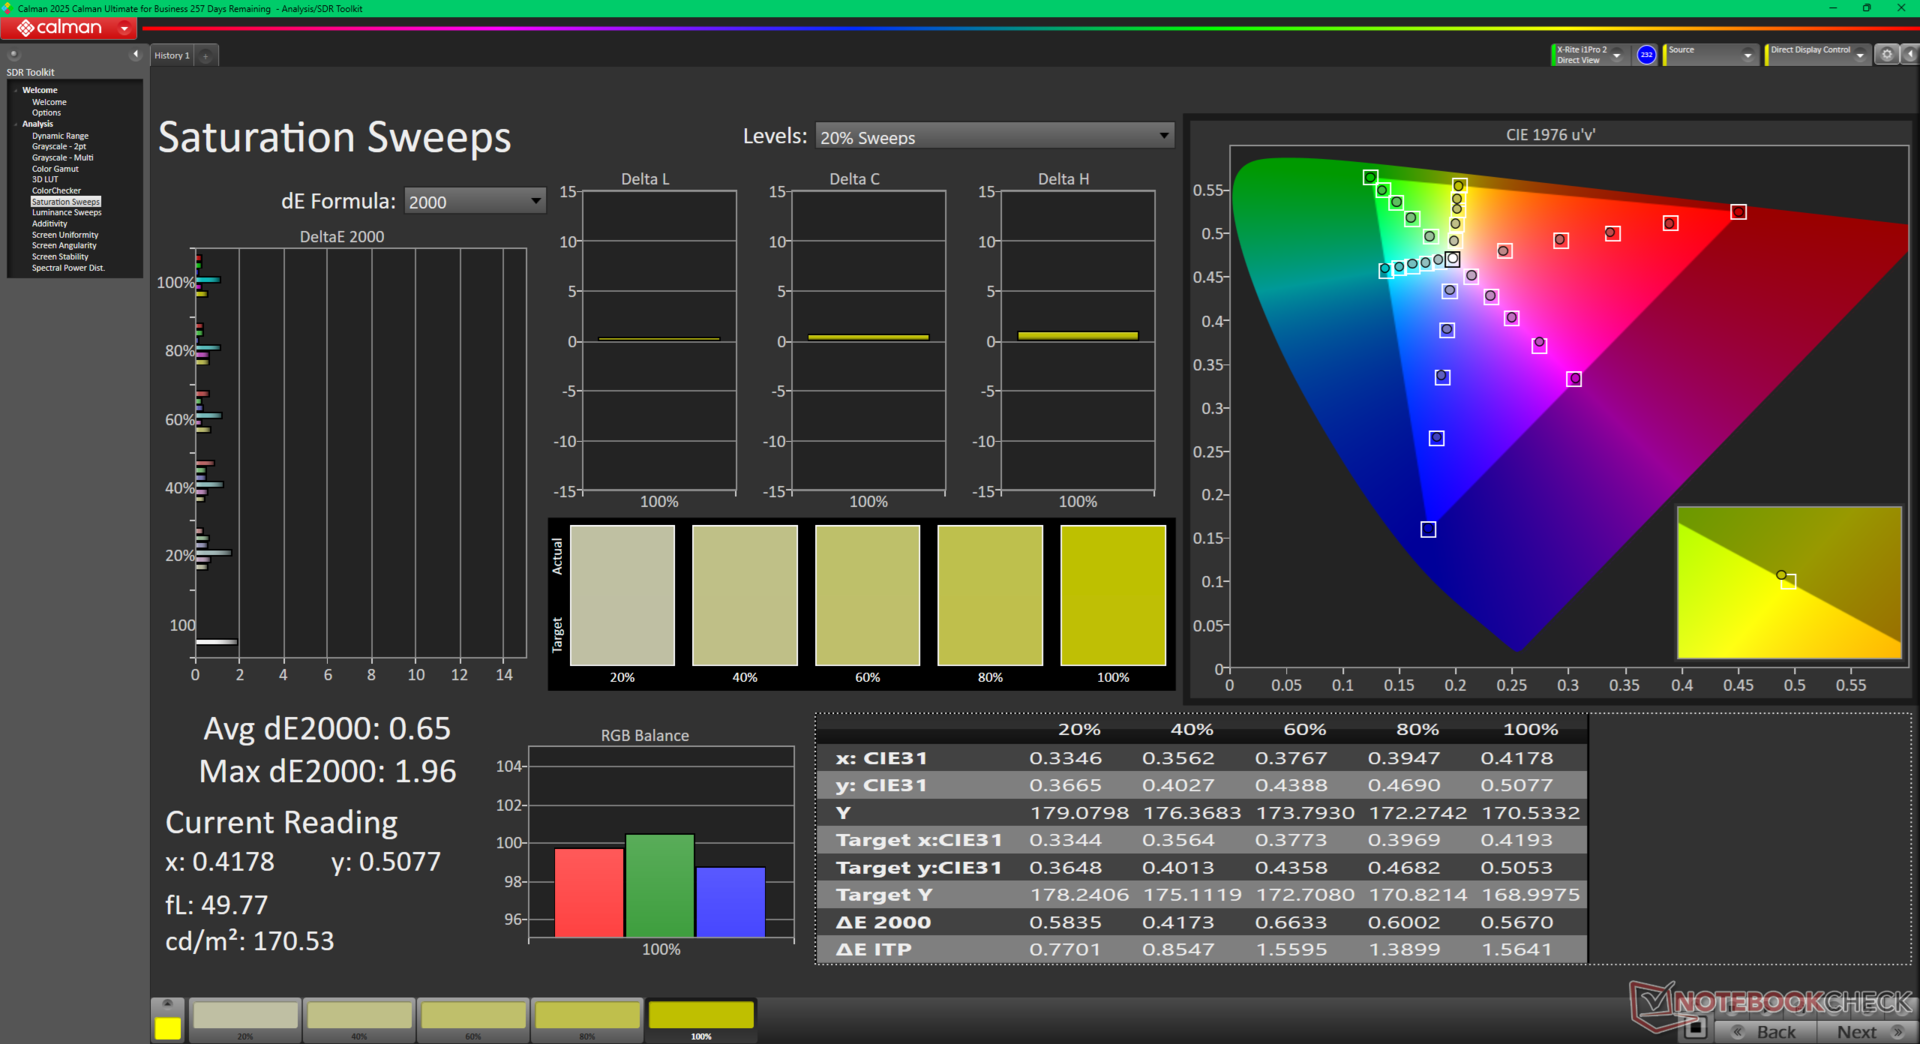
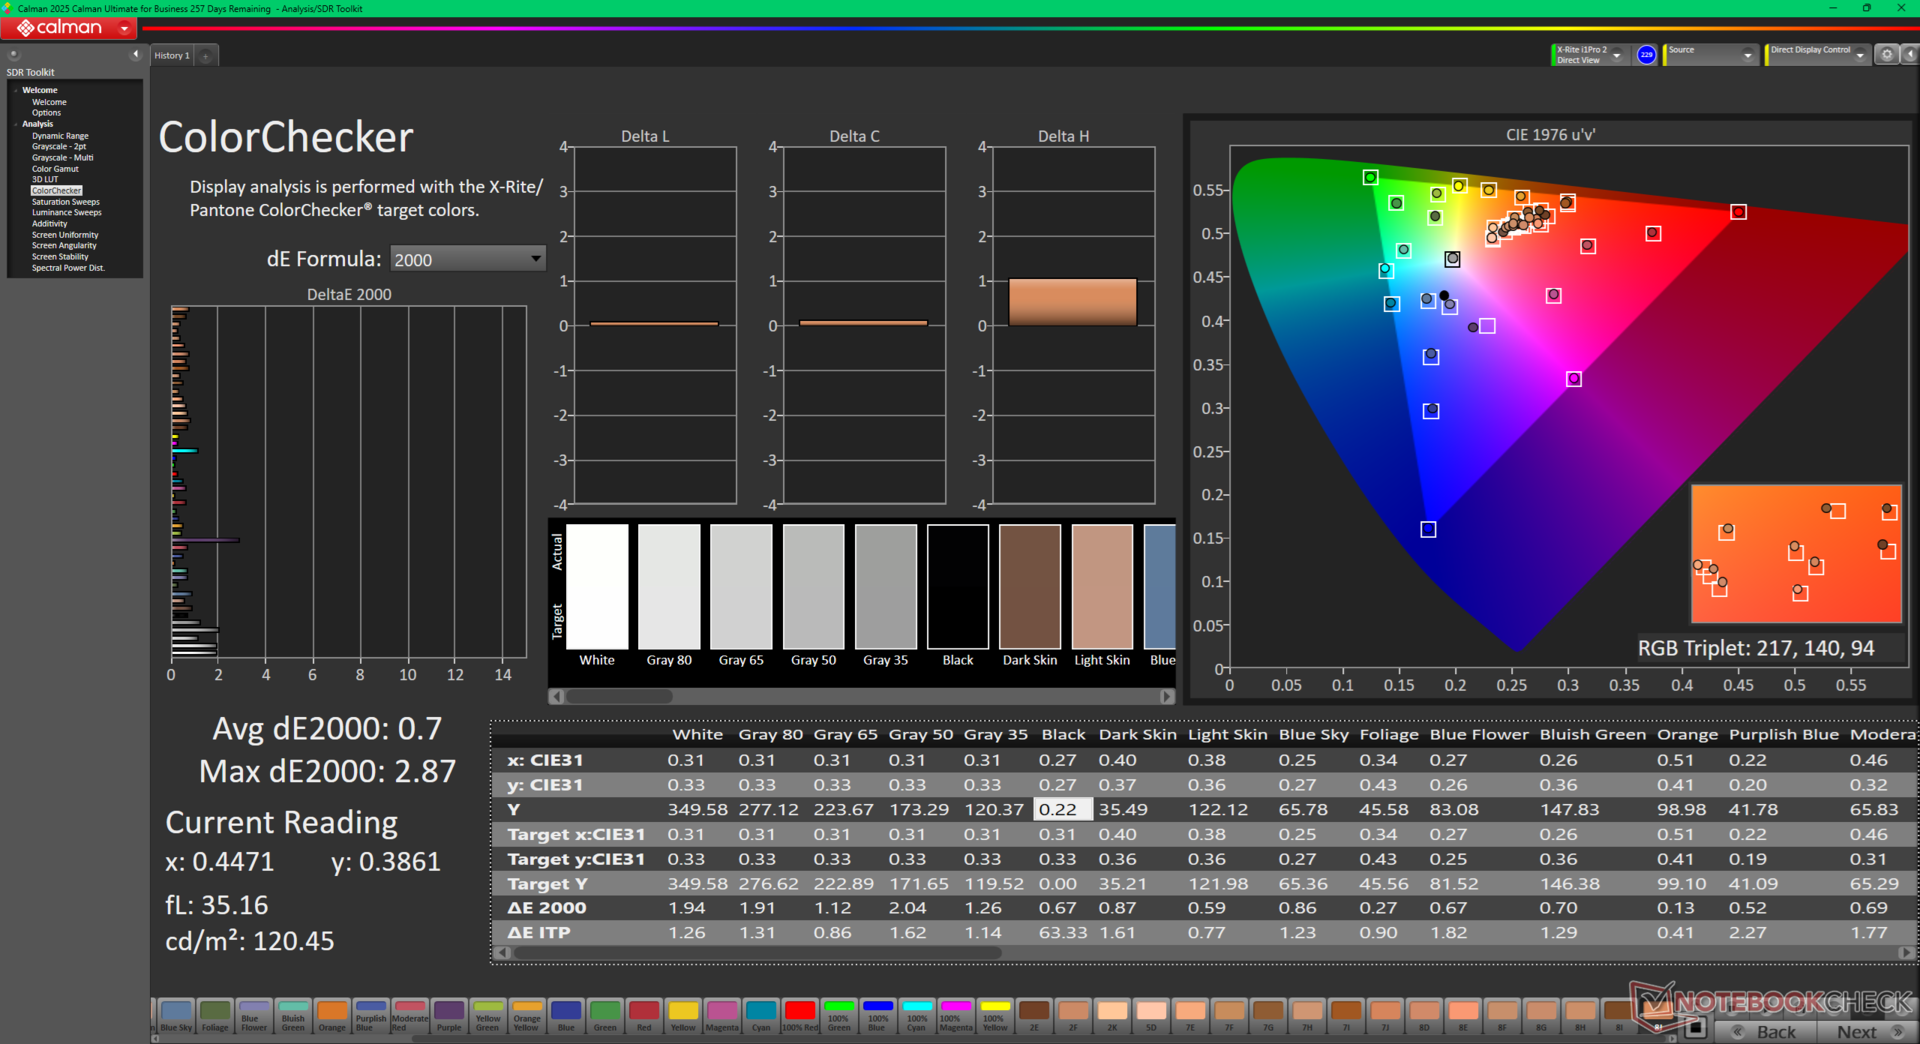
ΔE ColorChecker Calman: 1.94 | ∀{0.5-29.43 Ø4.72}
calibrated: 0.7
ΔE Greyscale Calman: 1.4 | ∀{0.09-98 Ø4.97}
71.9% AdobeRGB 1998 (Argyll 3D)
99.9% sRGB (Argyll 3D)
71.7% Display P3 (Argyll 3D)
Gamma: 2.25
CCT: 6453 K
| Dell 14 Plus BOE NE14N42, IPS, 2560x1600, 14", 90 Hz | Dell Inspiron 14 5425 6VPKR BOE NV14N42, IPS, 1920x1200, 14", 60 Hz | Dell Latitude 3440 BOE NE140FH, IPS, 1920x1080, 14", 60 Hz | Lenovo IdeaPad Pro 5 14AKP G10 LEN140WQ+, OLED, 2880x1800, 14", 120 Hz | Lenovo ThinkPad E14 G6 AU Optronics B140UAN03.2, IPS, 1920x1200, 14", 60 Hz | HP Pavilion Plus 14-ew0153TU Samsung SDC4197, OLED, 2880x1800, 14", 120 Hz | |
|---|---|---|---|---|---|---|
| Display | -44% | -42% | 23% | -40% | 22% | |
| Display P3 Coverage (%) | 71.7 | 39.2 -45% | 40.4 -44% | 99.9 39% | 41.3 -42% | 97.9 37% |
| sRGB Coverage (%) | 99.9 | 57.4 -43% | 60.7 -39% | 100 0% | 61.8 -38% | 99.6 0% |
| AdobeRGB 1998 Coverage (%) | 71.9 | 40.5 -44% | 41.8 -42% | 94.5 31% | 42.7 -41% | 92.1 28% |
| Response Times | 43% | -1% | 99% | 29% | 69% | |
| Response Time Grey 50% / Grey 80% * (ms) | 42.7 ? | 23 ? 46% | 35.3 ? 17% | 0.39 ? 99% | 28.8 ? 33% | 10.8 ? 75% |
| Response Time Black / White * (ms) | 25.2 ? | 15 ? 40% | 29.8 ? -18% | 0.49 ? 98% | 19.1 ? 24% | 9.29 ? 63% |
| PWM Frequency (Hz) | 1200 ? | 120 ? | ||||
| PWM Amplitude * (%) | 22 | |||||
| Screen | -133% | -104% | 17% | -109% | 234% | |
| Brightness middle (cd/m²) | 354 | 292 -18% | 292.6 -17% | 473 34% | 369.9 4% | 387 9% |
| Brightness (cd/m²) | 333 | 279 -16% | 270 -19% | 474 42% | 361 8% | 387 16% |
| Brightness Distribution (%) | 92 | 90 -2% | 88 -4% | 99 8% | 93 1% | 97 5% |
| Black Level * (cd/m²) | 0.21 | 0.34 -62% | 0.19 10% | 0.24 -14% | 0.01 95% | |
| Contrast (:1) | 1686 | 859 -49% | 1540 -9% | 1541 -9% | 38700 2195% | |
| Colorchecker dE 2000 * | 1.94 | 6.26 -223% | 4.63 -139% | 1.2 38% | 5.2 -168% | 2.03 -5% |
| Colorchecker dE 2000 max. * | 3.28 | 19.14 -484% | 17.1 -421% | 3.8 -16% | 18.41 -461% | 3.86 -18% |
| Colorchecker dE 2000 calibrated * | 0.7 | 2.13 -204% | 2.04 -191% | 1.6 -129% | ||
| Greyscale dE 2000 * | 1.4 | 4.31 -208% | 3.2 -129% | 1.5 -7% | 3.5 -150% | 2.3 -64% |
| Gamma | 2.25 98% | 2.27 97% | 2.34 94% | 2.27 97% | 2.06 107% | 2.23 99% |
| CCT | 6453 101% | 6102 107% | 7184 90% | 6214 105% | 6204 105% | 6523 100% |
| Media totale (Programma / Settaggio) | -45% /
-85% | -49% /
-76% | 46% /
33% | -40% /
-75% | 108% /
165% |
* ... Meglio usare valori piccoli
Il Dell 14 Plus è uno dei pochi computer portatili economici che viene fornito ben calibrato insieme alla certificazione TUV. I valori DeltaE medi della scala di grigi e del colore sono rispettivamente di 1,4 e 1,89, anche prima di qualsiasi tentativo di calibrazione da parte dell'utente finale.

Tempi di risposta del Display
| ↔ Tempi di risposta dal Nero al Bianco | ||
|---|---|---|
| 25.2 ms ... aumenta ↗ e diminuisce ↘ combinato | ↗ 12.7 ms Incremento | 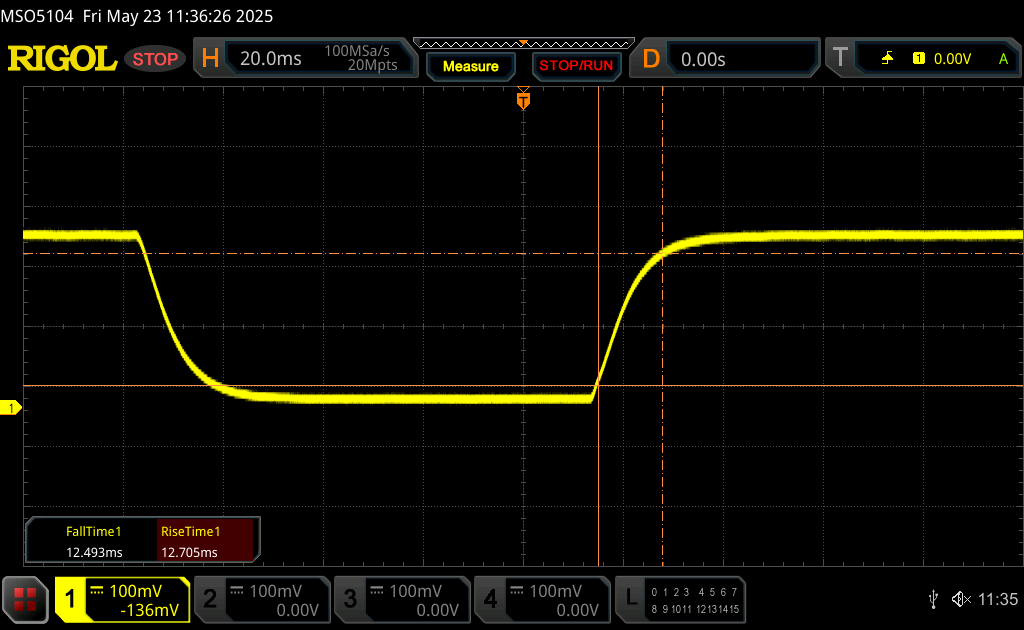 |
| ↘ 12.5 ms Calo | ||
| Lo schermo mostra tempi di risposta relativamente lenti nei nostri tests e potrebbe essere troppo lento per i gamers. In confronto, tutti i dispositivi di test variano da 0.1 (minimo) a 240 (massimo) ms. » 61 % di tutti i dispositivi è migliore. Questo significa che i tempi di risposta rilevati sono peggiori rispetto alla media di tutti i dispositivi testati (19.8 ms). | ||
| ↔ Tempo di risposta dal 50% Grigio all'80% Grigio | ||
| 42.7 ms ... aumenta ↗ e diminuisce ↘ combinato | ↗ 20.2 ms Incremento | 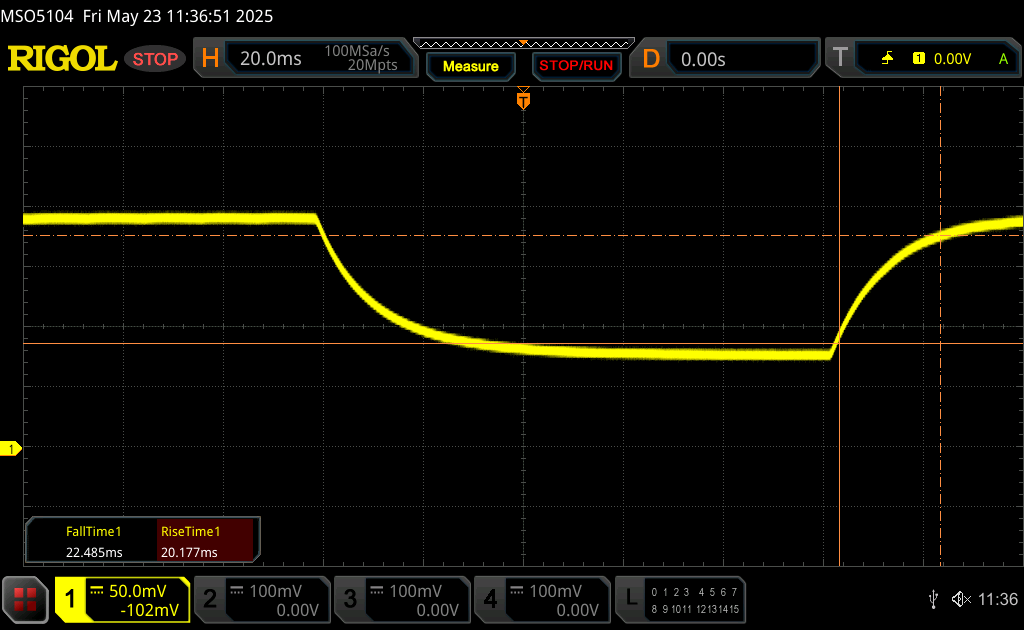 |
| ↘ 22.5 ms Calo | ||
| Lo schermo mostra tempi di risposta lenti nei nostri tests e sarà insoddisfacente per i gamers. In confronto, tutti i dispositivi di test variano da 0.165 (minimo) a 636 (massimo) ms. » 70 % di tutti i dispositivi è migliore. Questo significa che i tempi di risposta rilevati sono peggiori rispetto alla media di tutti i dispositivi testati (31 ms). | ||
Sfarfallio dello schermo / PWM (Pulse-Width Modulation)
| flickering dello schermo / PWM non rilevato |  | ||
In confronto: 52 % di tutti i dispositivi testati non utilizza PWM per ridurre la luminosita' del display. Se è rilevato PWM, una media di 7750 (minimo: 5 - massimo: 343500) Hz è stata rilevata. | |||

Prestazioni
Condizioni del test
Abbiamo impostato Windows in modalità Prestazioni prima di eseguire i benchmark qui sotto.
Processore
Le prestazioni grezze della CPU sono paragonabili a quelle del vecchio Core Ultra 7 155U. I vantaggi principali del nuovo Core Ultra 7 256V risiedono invece nelle prestazioni per watt, nella NPU integrata, nella RAM più veloce e nella GPU integrata migliorata.
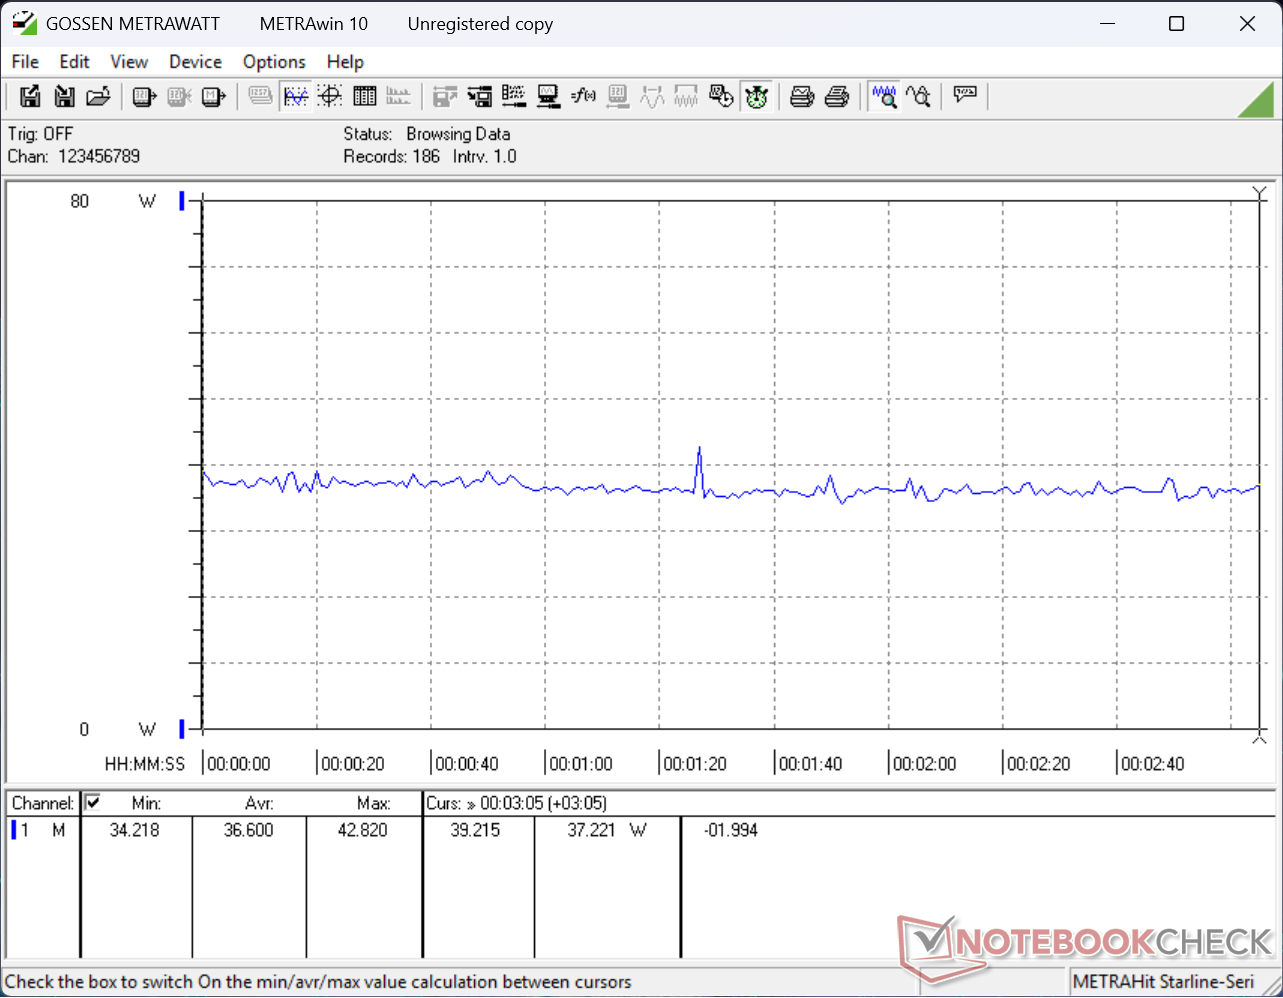
La sostenibilità del Turbo Boost potrebbe essere migliore; le prestazioni diminuiscono di circa il 17% nel tempo quando si esegue CineBench R15 xT in un ciclo, come mostra il nostro grafico di confronto qui sotto.
Cinebench R15 Multi Loop
Cinebench R23: Multi Core | Single Core
Cinebench R20: CPU (Multi Core) | CPU (Single Core)
Cinebench R15: CPU Multi 64Bit | CPU Single 64Bit
Blender: v2.79 BMW27 CPU
7-Zip 18.03: 7z b 4 | 7z b 4 -mmt1
Geekbench 6.7: Multi-Core | Single-Core
Geekbench 5.5: Multi-Core | Single-Core
HWBOT x265 Benchmark v2.2: 4k Preset
LibreOffice : 20 Documents To PDF
R Benchmark 2.5: Overall mean
* ... Meglio usare valori piccoli
AIDA64: FP32 Ray-Trace | FPU Julia | CPU SHA3 | CPU Queen | FPU SinJulia | FPU Mandel | CPU AES | CPU ZLib | FP64 Ray-Trace | CPU PhotoWorxx
| Performance rating | |
| Lenovo IdeaPad Pro 5 14AKP G10 | |
| Media Intel Core Ultra 7 256V | |
| Dell 14 Plus | |
| Lenovo ThinkPad E14 G6 | |
| Dell Inspiron 14 5425 6VPKR | |
| Dell Latitude 3440 | |
| HP Pavilion Plus 14-ew0153TU | |
| AIDA64 / FP32 Ray-Trace | |
| Lenovo IdeaPad Pro 5 14AKP G10 | |
| Media Intel Core Ultra 7 256V (10524 - 12898, n=7) | |
| Dell 14 Plus | |
| Dell Inspiron 14 5425 6VPKR | |
| Lenovo ThinkPad E14 G6 | |
| Dell Latitude 3440 | |
| HP Pavilion Plus 14-ew0153TU | |
| AIDA64 / FPU Julia | |
| Lenovo IdeaPad Pro 5 14AKP G10 | |
| Dell Inspiron 14 5425 6VPKR | |
| Media Intel Core Ultra 7 256V (52443 - 62522, n=7) | |
| Dell 14 Plus | |
| Lenovo ThinkPad E14 G6 | |
| Dell Latitude 3440 | |
| HP Pavilion Plus 14-ew0153TU | |
| AIDA64 / CPU SHA3 | |
| Lenovo IdeaPad Pro 5 14AKP G10 | |
| Media Intel Core Ultra 7 256V (2364 - 2915, n=7) | |
| Lenovo ThinkPad E14 G6 | |
| Dell 14 Plus | |
| Dell Inspiron 14 5425 6VPKR | |
| Dell Latitude 3440 | |
| HP Pavilion Plus 14-ew0153TU | |
| AIDA64 / CPU Queen | |
| Lenovo IdeaPad Pro 5 14AKP G10 | |
| Dell Inspiron 14 5425 6VPKR | |
| Dell Latitude 3440 | |
| HP Pavilion Plus 14-ew0153TU | |
| Dell 14 Plus | |
| Media Intel Core Ultra 7 256V (49622 - 49794, n=6) | |
| Lenovo ThinkPad E14 G6 | |
| AIDA64 / FPU SinJulia | |
| Lenovo IdeaPad Pro 5 14AKP G10 | |
| Dell Inspiron 14 5425 6VPKR | |
| Lenovo ThinkPad E14 G6 | |
| Dell Latitude 3440 | |
| Dell 14 Plus | |
| Media Intel Core Ultra 7 256V (4401 - 4434, n=7) | |
| HP Pavilion Plus 14-ew0153TU | |
| AIDA64 / FPU Mandel | |
| Lenovo IdeaPad Pro 5 14AKP G10 | |
| Dell Inspiron 14 5425 6VPKR | |
| Media Intel Core Ultra 7 256V (27382 - 33019, n=7) | |
| Dell 14 Plus | |
| Lenovo ThinkPad E14 G6 | |
| Dell Latitude 3440 | |
| HP Pavilion Plus 14-ew0153TU | |
| AIDA64 / CPU AES | |
| Lenovo IdeaPad Pro 5 14AKP G10 | |
| Lenovo ThinkPad E14 G6 | |
| Media Intel Core Ultra 7 256V (38495 - 75938, n=7) | |
| Dell 14 Plus | |
| Dell Latitude 3440 | |
| Dell Inspiron 14 5425 6VPKR | |
| HP Pavilion Plus 14-ew0153TU | |
| AIDA64 / CPU ZLib | |
| Lenovo IdeaPad Pro 5 14AKP G10 | |
| Lenovo ThinkPad E14 G6 | |
| Media Intel Core Ultra 7 256V (536 - 632, n=7) | |
| Dell 14 Plus | |
| Dell Latitude 3440 | |
| Dell Inspiron 14 5425 6VPKR | |
| HP Pavilion Plus 14-ew0153TU | |
| AIDA64 / FP64 Ray-Trace | |
| Lenovo IdeaPad Pro 5 14AKP G10 | |
| Media Intel Core Ultra 7 256V (5655 - 6878, n=7) | |
| Dell 14 Plus | |
| Dell Inspiron 14 5425 6VPKR | |
| Lenovo ThinkPad E14 G6 | |
| Dell Latitude 3440 | |
| HP Pavilion Plus 14-ew0153TU | |
| AIDA64 / CPU PhotoWorxx | |
| Media Intel Core Ultra 7 256V (49906 - 57060, n=7) | |
| Dell 14 Plus | |
| Lenovo IdeaPad Pro 5 14AKP G10 | |
| Lenovo ThinkPad E14 G6 | |
| HP Pavilion Plus 14-ew0153TU | |
| Dell Latitude 3440 | |
| Dell Inspiron 14 5425 6VPKR | |
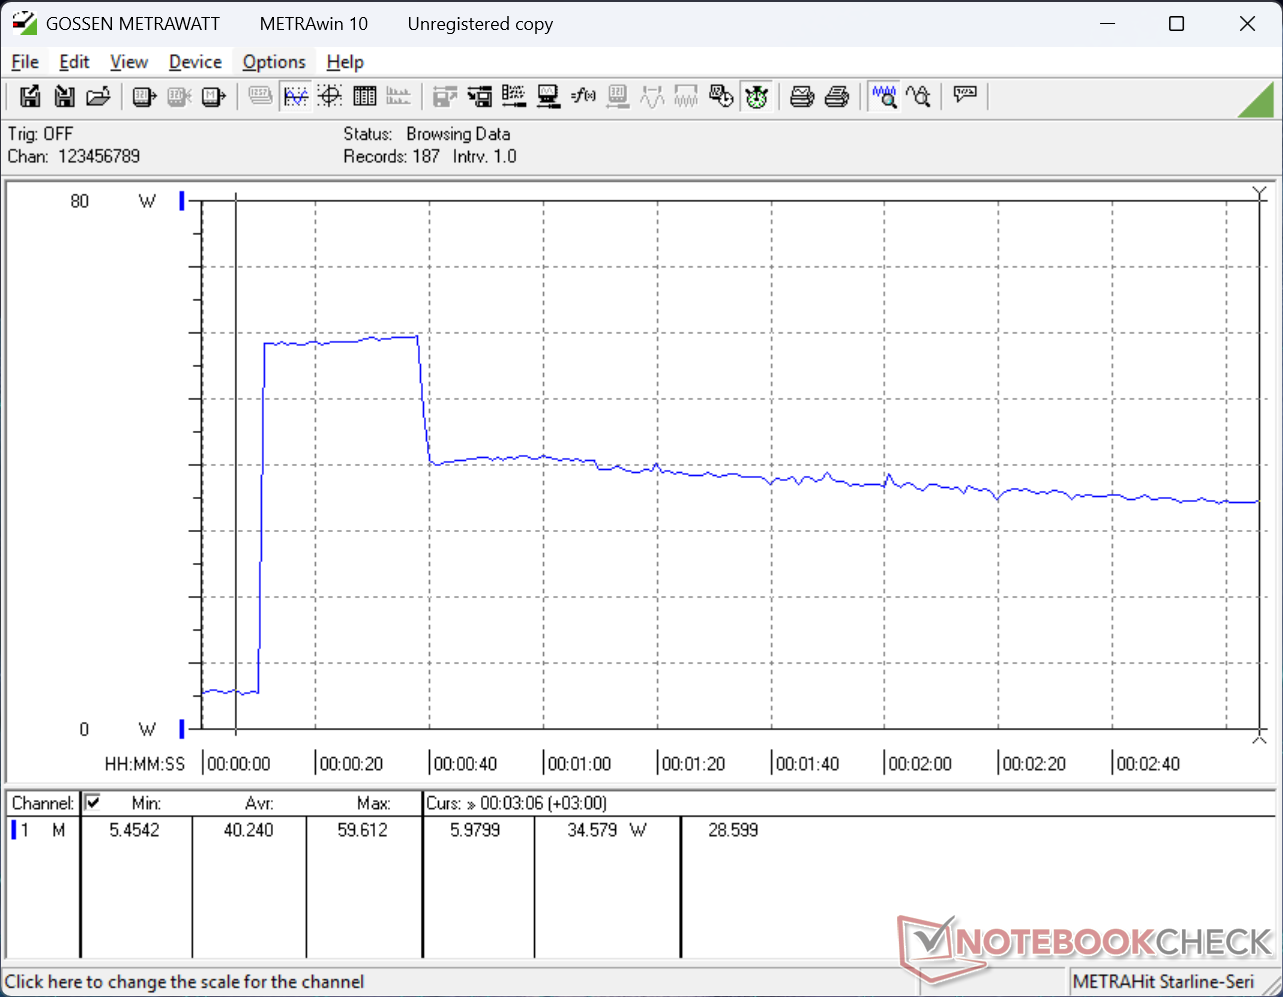
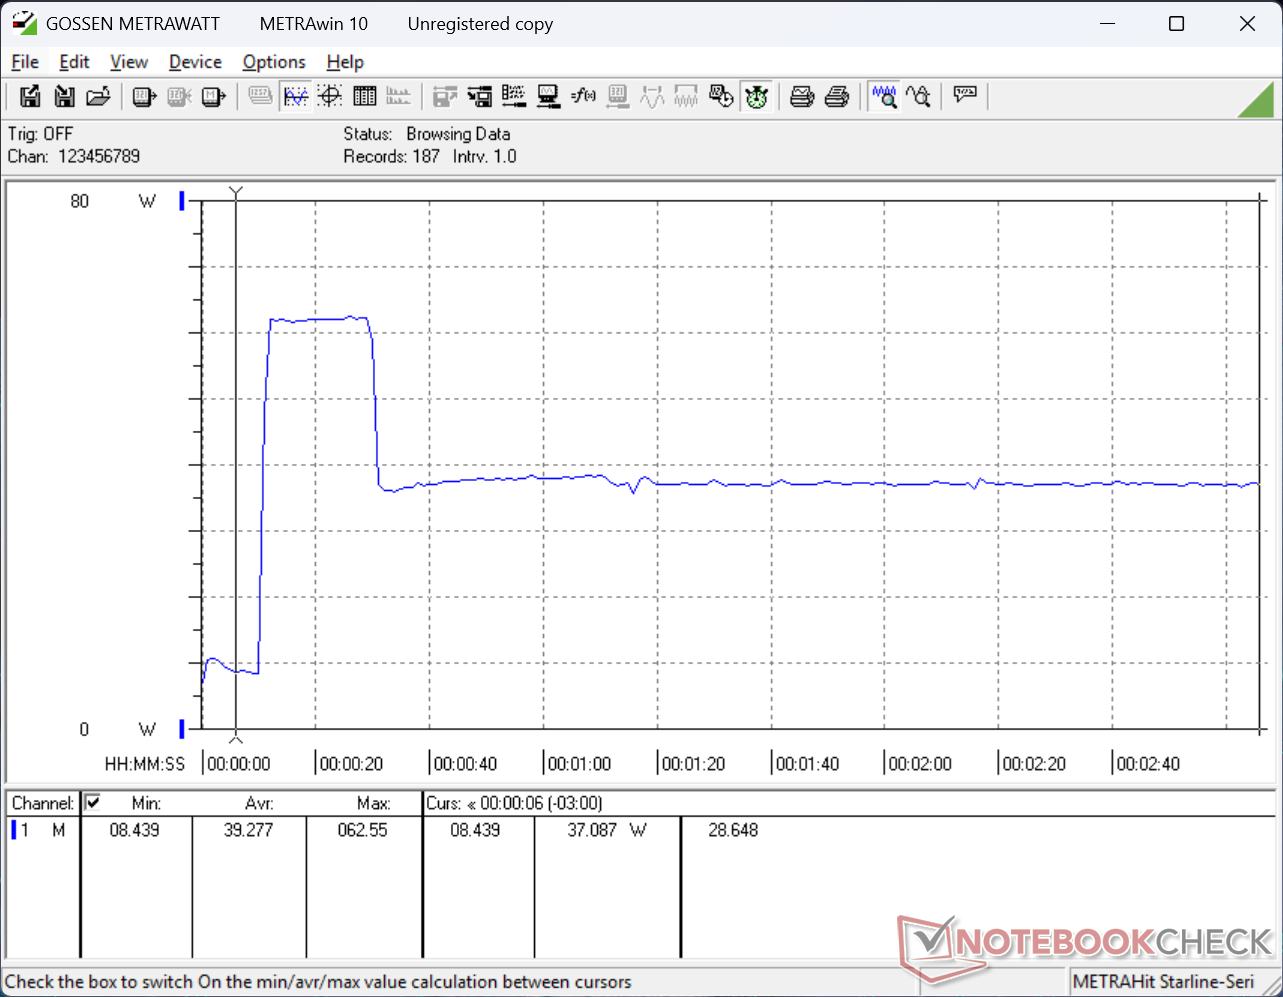
Test da sforzo
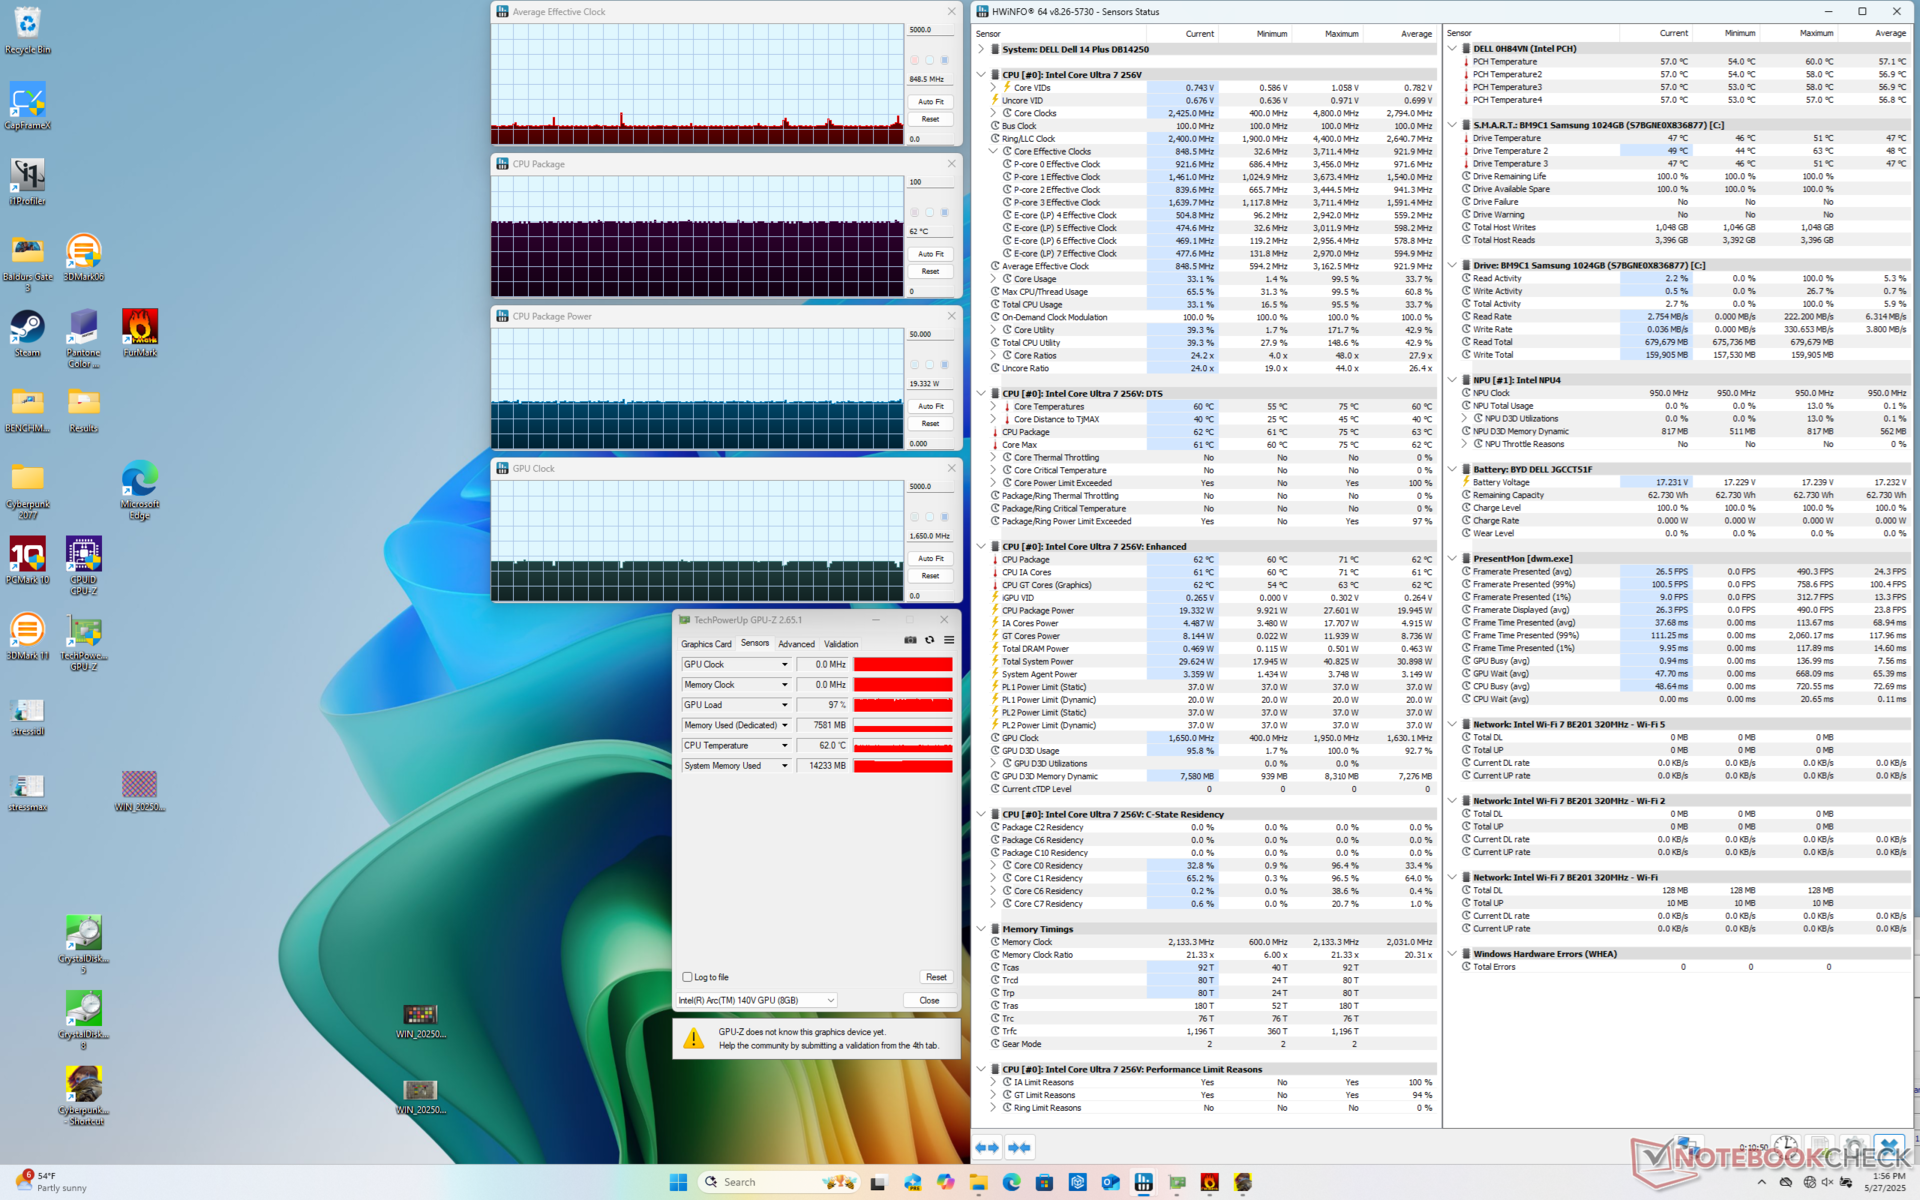
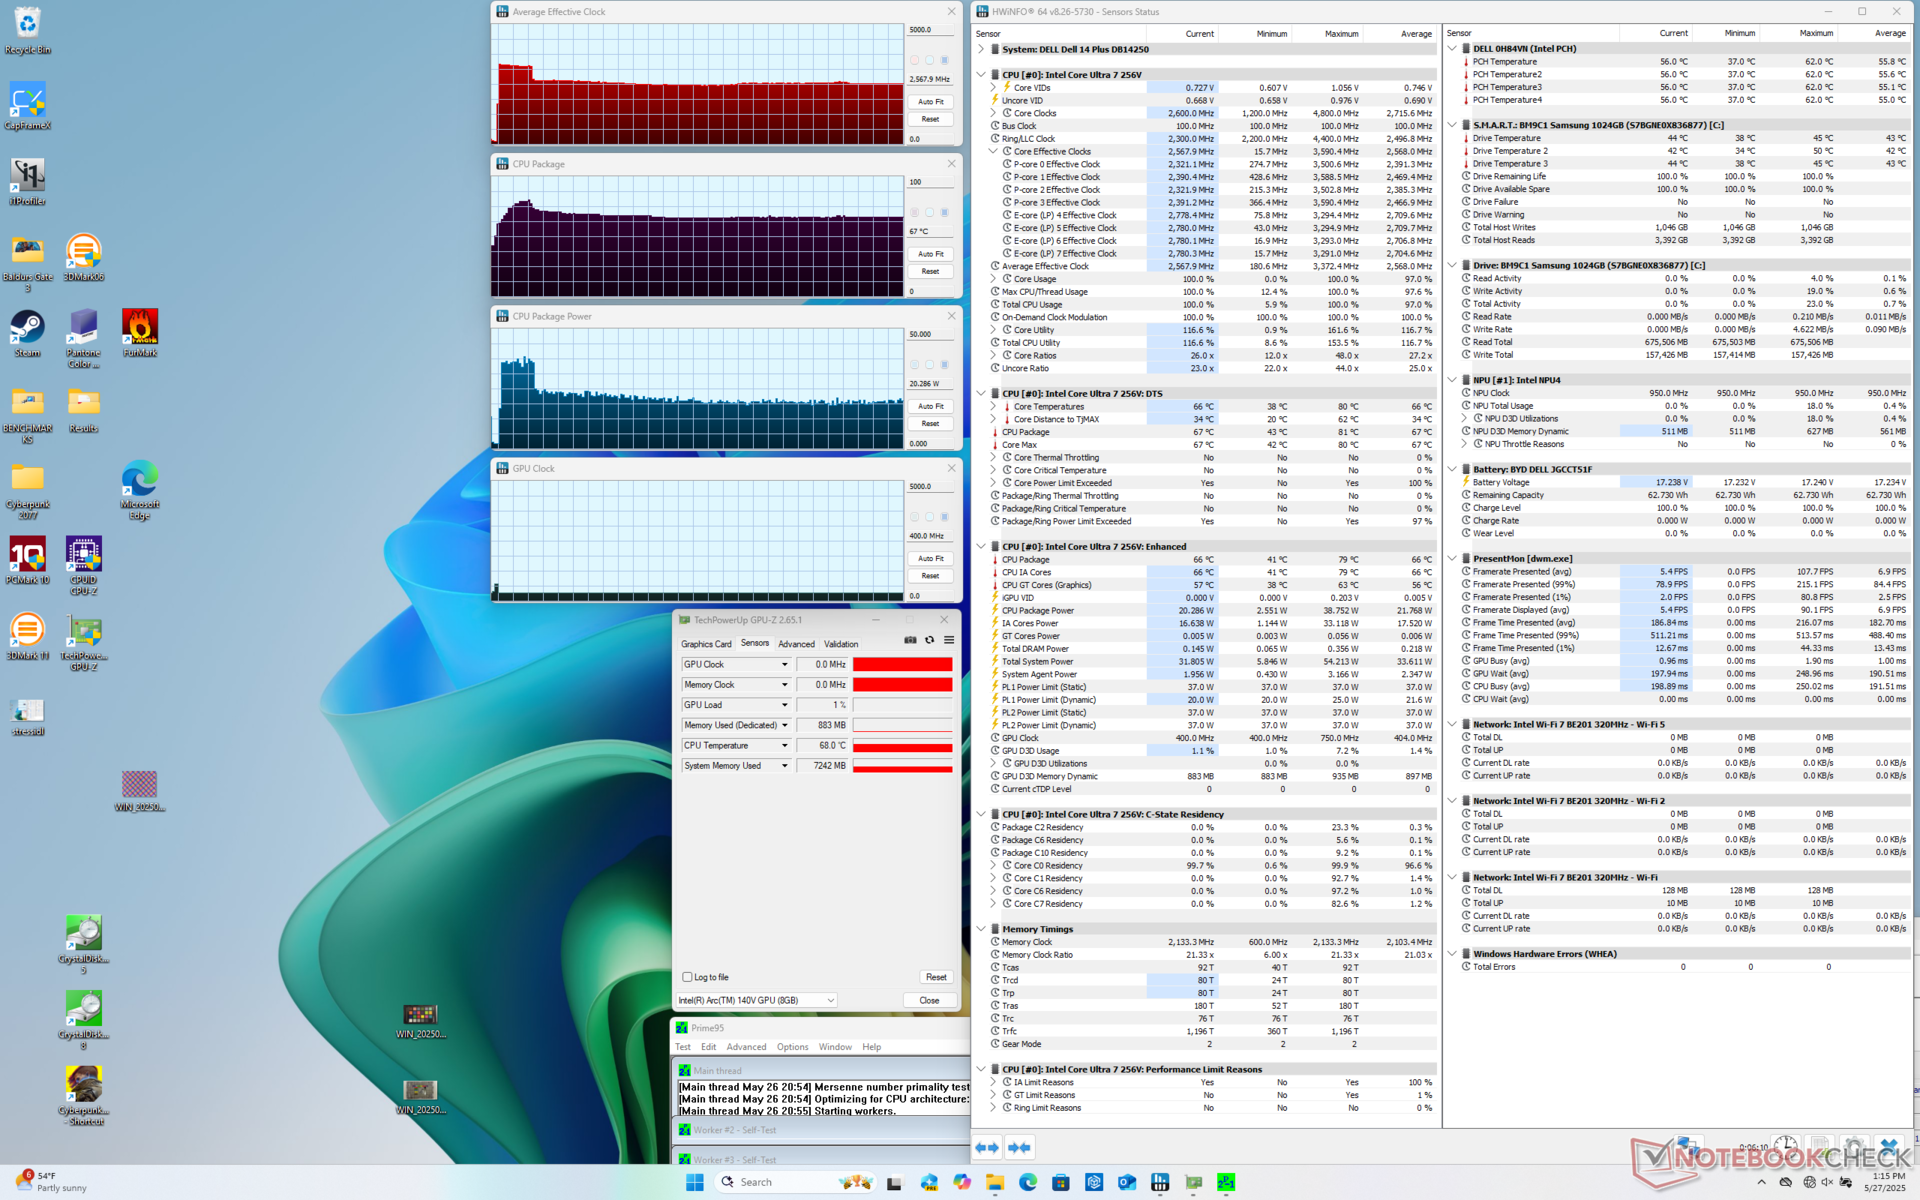
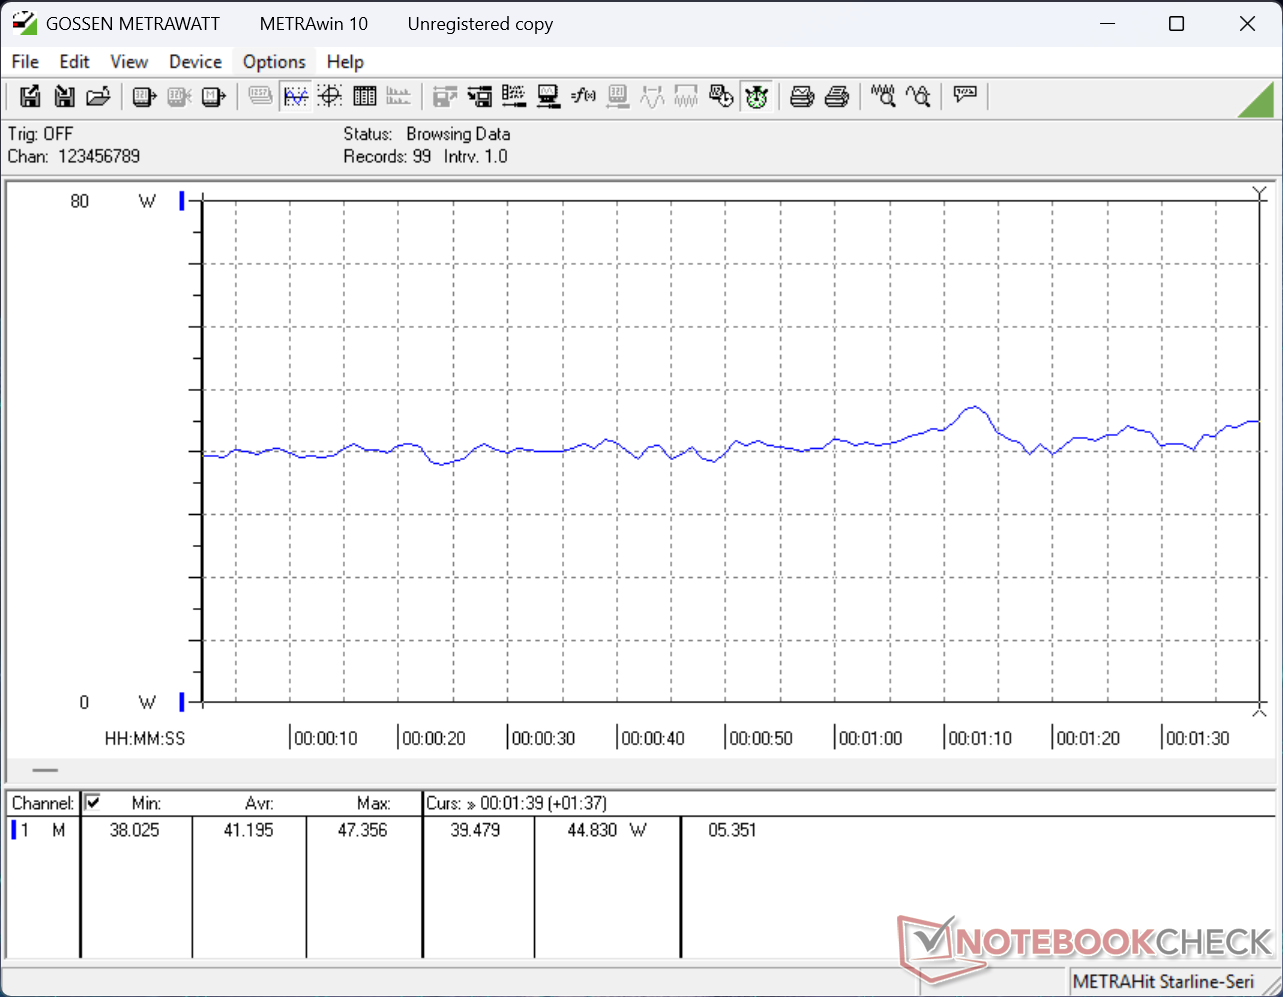
Durante l'esecuzione dello stress Prime95, la CPU aumentava a 3,4 GHz e 39 W, prima di raggiungere una temperatura del core di 80 C circa 30 secondi dopo. In seguito, la CPU si stabilizzava a 2,6 GHz, 20 W e 67 C.
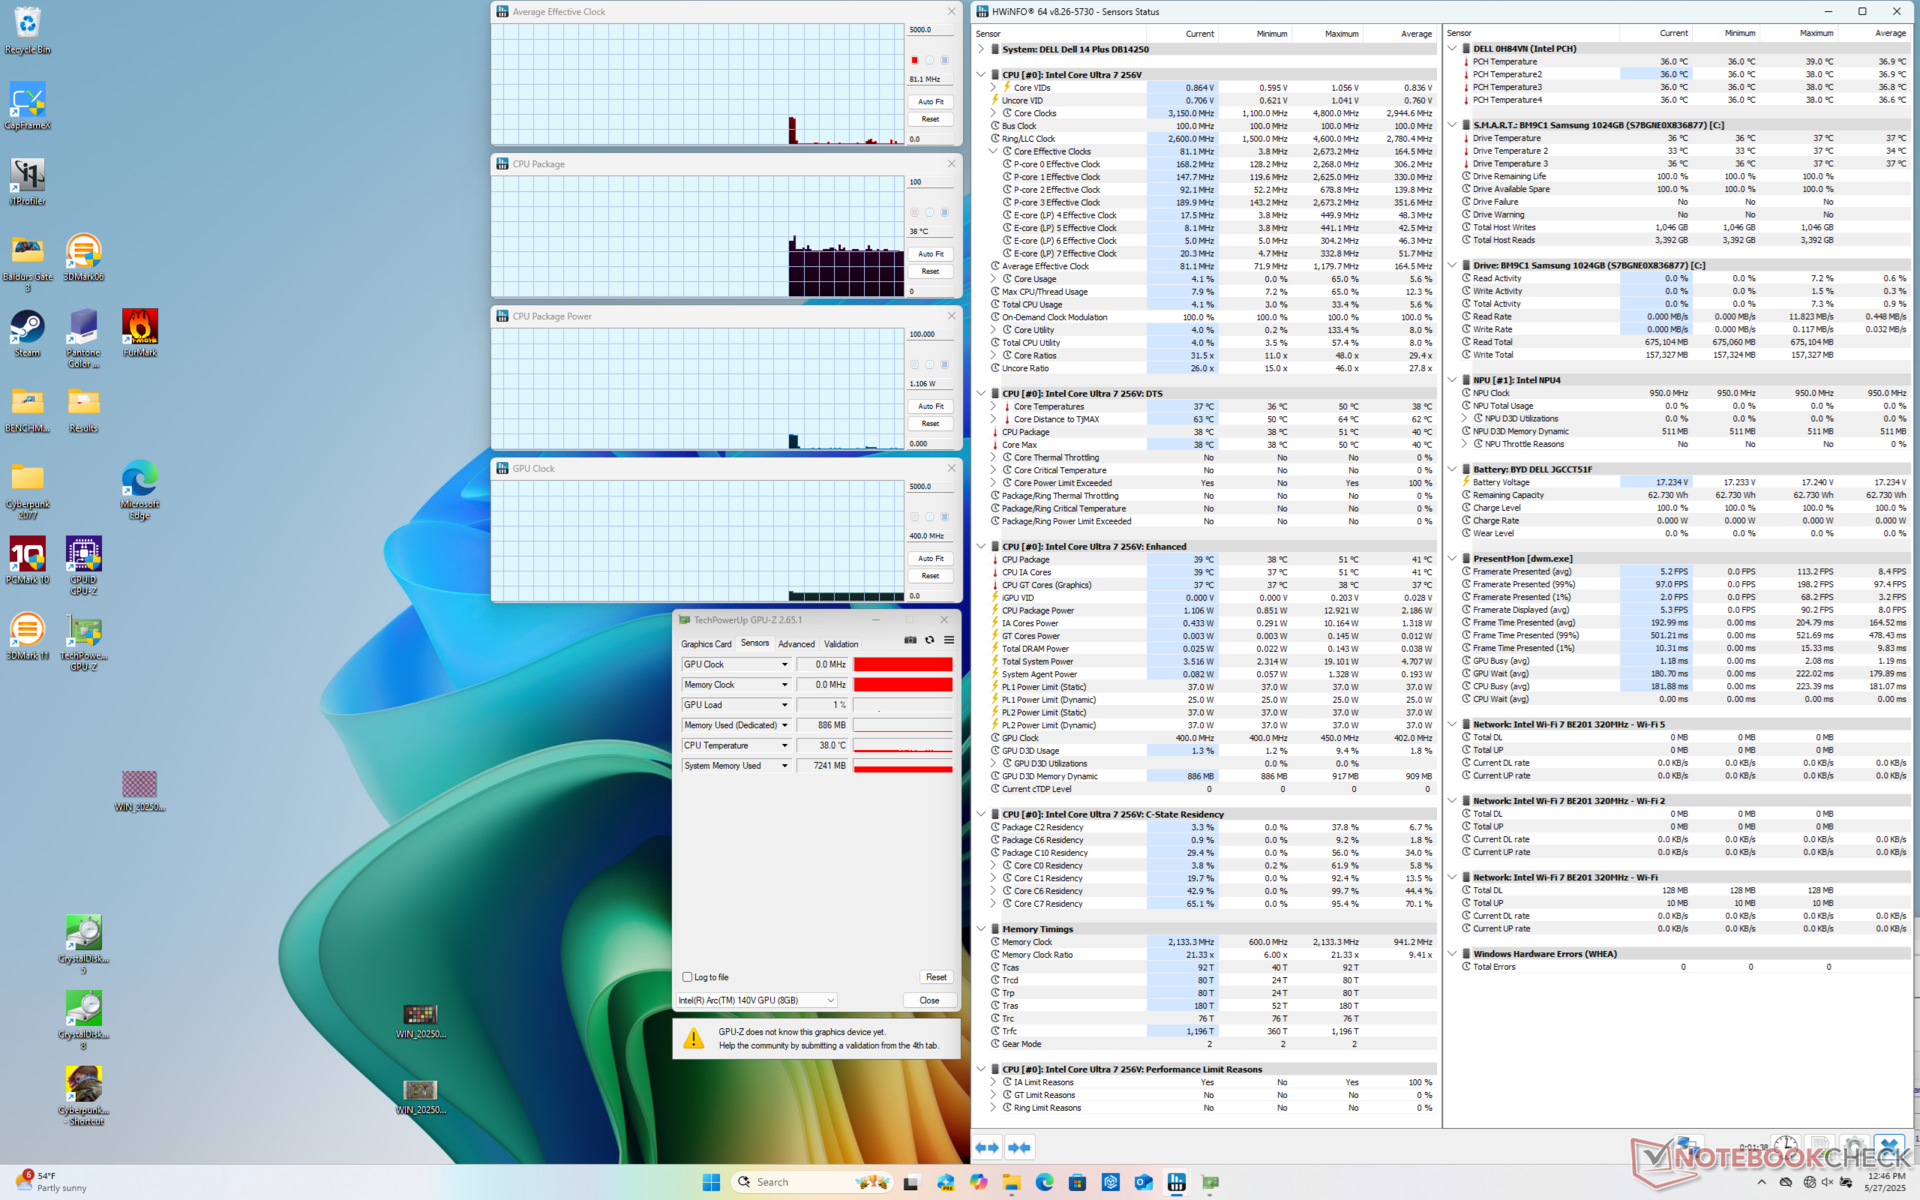

| Clock medio della CPU (GHz) | Clock della GPU (MHz) | Temperatura media della CPU (°C) | |
| Sistema inattivo | -- | -- | 38 |
| Stress Prime95 | 2,6 | -- | 67 |
| Prime95 + FurMark Stress | 1,6 | 1250 | 63 |
| Cyberpunk 2077 Stress | 0,8 | 1650 | 62 |
Prestazioni del sistema
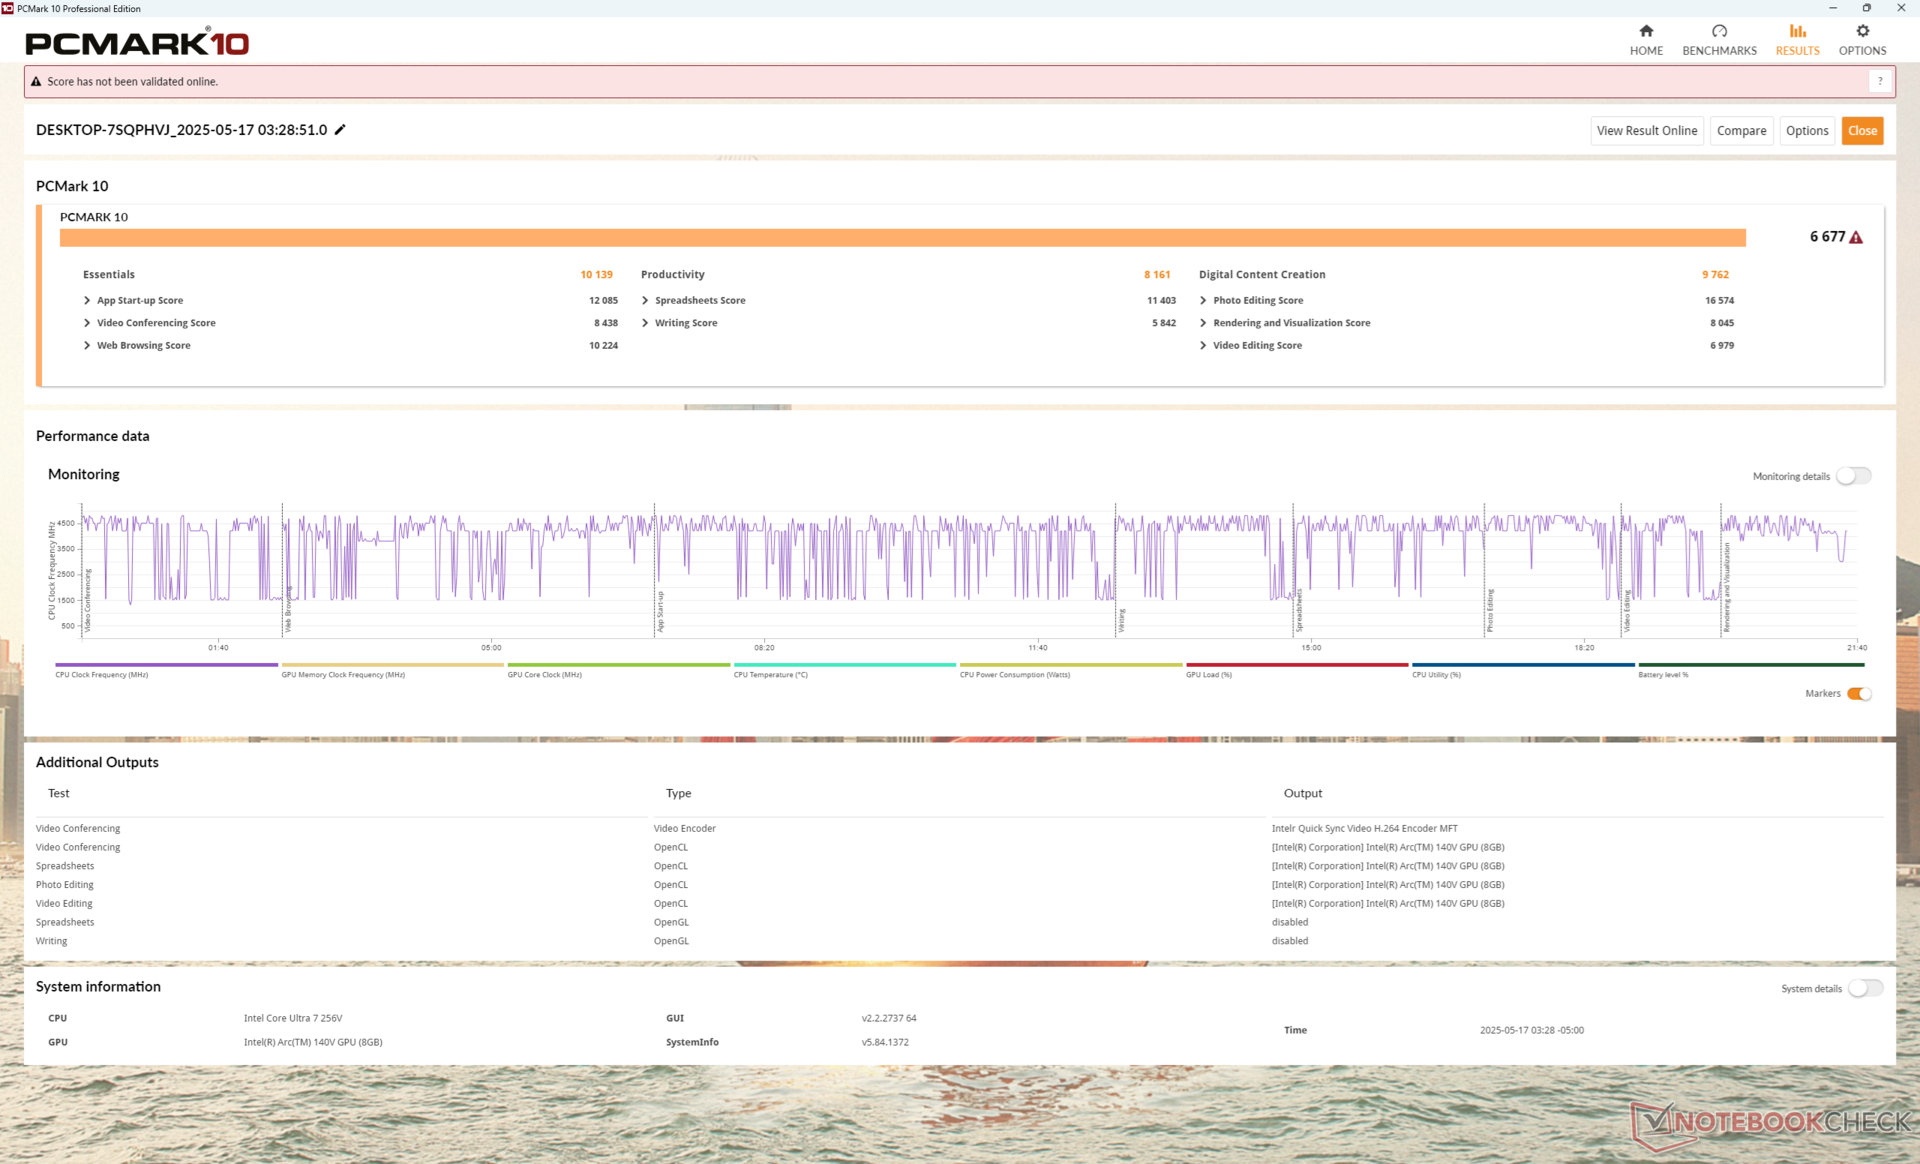
PCMark 10: Score | Essentials | Productivity | Digital Content Creation
CrossMark: Overall | Productivity | Creativity | Responsiveness
WebXPRT 3: Overall
WebXPRT 4: Overall
Mozilla Kraken 1.1: Total
| Performance rating | |
| Lenovo IdeaPad Pro 5 14AKP G10 | |
| Media Intel Core Ultra 7 256V, Intel Arc Graphics 140V | |
| Dell 14 Plus | |
| Lenovo ThinkPad E14 G6 | |
| HP Pavilion Plus 14-ew0153TU | |
| Dell Latitude 3440 | |
| Dell Inspiron 14 5425 6VPKR | |
| PCMark 10 / Score | |
| Lenovo IdeaPad Pro 5 14AKP G10 | |
| Media Intel Core Ultra 7 256V, Intel Arc Graphics 140V (6677 - 7702, n=7) | |
| Dell 14 Plus | |
| Lenovo ThinkPad E14 G6 | |
| Dell Inspiron 14 5425 6VPKR | |
| HP Pavilion Plus 14-ew0153TU | |
| Dell Latitude 3440 | |
| PCMark 10 / Essentials | |
| Lenovo IdeaPad Pro 5 14AKP G10 | |
| Dell Latitude 3440 | |
| Lenovo ThinkPad E14 G6 | |
| Media Intel Core Ultra 7 256V, Intel Arc Graphics 140V (9627 - 11365, n=7) | |
| HP Pavilion Plus 14-ew0153TU | |
| Dell 14 Plus | |
| Dell Inspiron 14 5425 6VPKR | |
| PCMark 10 / Productivity | |
| Lenovo IdeaPad Pro 5 14AKP G10 | |
| Media Intel Core Ultra 7 256V, Intel Arc Graphics 140V (8161 - 12672, n=7) | |
| Dell Inspiron 14 5425 6VPKR | |
| Lenovo ThinkPad E14 G6 | |
| Dell 14 Plus | |
| Dell Latitude 3440 | |
| HP Pavilion Plus 14-ew0153TU | |
| PCMark 10 / Digital Content Creation | |
| Media Intel Core Ultra 7 256V, Intel Arc Graphics 140V (9481 - 10126, n=7) | |
| Dell 14 Plus | |
| Lenovo IdeaPad Pro 5 14AKP G10 | |
| Lenovo ThinkPad E14 G6 | |
| HP Pavilion Plus 14-ew0153TU | |
| Dell Inspiron 14 5425 6VPKR | |
| Dell Latitude 3440 | |
| CrossMark / Overall | |
| Lenovo IdeaPad Pro 5 14AKP G10 | |
| Dell 14 Plus | |
| Media Intel Core Ultra 7 256V, Intel Arc Graphics 140V (1636 - 1736, n=7) | |
| Lenovo ThinkPad E14 G6 | |
| HP Pavilion Plus 14-ew0153TU | |
| Dell Latitude 3440 | |
| Dell Inspiron 14 5425 6VPKR | |
| CrossMark / Productivity | |
| Lenovo IdeaPad Pro 5 14AKP G10 | |
| Dell 14 Plus | |
| Media Intel Core Ultra 7 256V, Intel Arc Graphics 140V (1563 - 1682, n=7) | |
| HP Pavilion Plus 14-ew0153TU | |
| Lenovo ThinkPad E14 G6 | |
| Dell Latitude 3440 | |
| Dell Inspiron 14 5425 6VPKR | |
| CrossMark / Creativity | |
| Lenovo IdeaPad Pro 5 14AKP G10 | |
| Dell 14 Plus | |
| Media Intel Core Ultra 7 256V, Intel Arc Graphics 140V (1862 - 1962, n=7) | |
| Lenovo ThinkPad E14 G6 | |
| HP Pavilion Plus 14-ew0153TU | |
| Dell Latitude 3440 | |
| Dell Inspiron 14 5425 6VPKR | |
| CrossMark / Responsiveness | |
| Lenovo IdeaPad Pro 5 14AKP G10 | |
| Lenovo ThinkPad E14 G6 | |
| HP Pavilion Plus 14-ew0153TU | |
| Media Intel Core Ultra 7 256V, Intel Arc Graphics 140V (1215 - 1371, n=7) | |
| Dell 14 Plus | |
| Dell Latitude 3440 | |
| Dell Inspiron 14 5425 6VPKR | |
| WebXPRT 3 / Overall | |
| Lenovo IdeaPad Pro 5 14AKP G10 | |
| Dell 14 Plus | |
| Media Intel Core Ultra 7 256V, Intel Arc Graphics 140V (243 - 310, n=7) | |
| Lenovo ThinkPad E14 G6 | |
| Dell Latitude 3440 | |
| HP Pavilion Plus 14-ew0153TU | |
| Dell Inspiron 14 5425 6VPKR | |
| WebXPRT 4 / Overall | |
| Dell 14 Plus | |
| Media Intel Core Ultra 7 256V, Intel Arc Graphics 140V (282 - 286, n=7) | |
| Lenovo IdeaPad Pro 5 14AKP G10 | |
| HP Pavilion Plus 14-ew0153TU | |
| Lenovo ThinkPad E14 G6 | |
| Dell Latitude 3440 | |
| Dell Inspiron 14 5425 6VPKR | |
| Mozilla Kraken 1.1 / Total | |
| Dell Inspiron 14 5425 6VPKR | |
| Dell Latitude 3440 | |
| Lenovo ThinkPad E14 G6 | |
| HP Pavilion Plus 14-ew0153TU | |
| Dell 14 Plus | |
| Media Intel Core Ultra 7 256V, Intel Arc Graphics 140V (470 - 480, n=7) | |
| Lenovo IdeaPad Pro 5 14AKP G10 | |
* ... Meglio usare valori piccoli
| PCMark 10 Score | 6677 punti | |
Aiuto | ||
| AIDA64 / Memory Copy | |
| Media Intel Core Ultra 7 256V (99227 - 104459, n=7) | |
| Dell 14 Plus | |
| Lenovo IdeaPad Pro 5 14AKP G10 | |
| Lenovo ThinkPad E14 G6 | |
| HP Pavilion Plus 14-ew0153TU | |
| Dell Latitude 3440 | |
| Dell Inspiron 14 5425 6VPKR | |
| AIDA64 / Memory Read | |
| Media Intel Core Ultra 7 256V (86352 - 89848, n=7) | |
| Dell 14 Plus | |
| Lenovo ThinkPad E14 G6 | |
| Lenovo IdeaPad Pro 5 14AKP G10 | |
| HP Pavilion Plus 14-ew0153TU | |
| Dell Latitude 3440 | |
| Dell Inspiron 14 5425 6VPKR | |
| AIDA64 / Memory Write | |
| Dell 14 Plus | |
| Media Intel Core Ultra 7 256V (108692 - 117933, n=7) | |
| Lenovo IdeaPad Pro 5 14AKP G10 | |
| HP Pavilion Plus 14-ew0153TU | |
| Lenovo ThinkPad E14 G6 | |
| Dell Latitude 3440 | |
| Dell Inspiron 14 5425 6VPKR | |
| AIDA64 / Memory Latency | |
| Lenovo ThinkPad E14 G6 | |
| HP Pavilion Plus 14-ew0153TU | |
| Lenovo IdeaPad Pro 5 14AKP G10 | |
| Dell Inspiron 14 5425 6VPKR | |
| Media Intel Core Ultra 7 256V (96.1 - 99.6, n=7) | |
| Dell 14 Plus | |
| Dell Latitude 3440 | |
* ... Meglio usare valori piccoli
Latenza DPC

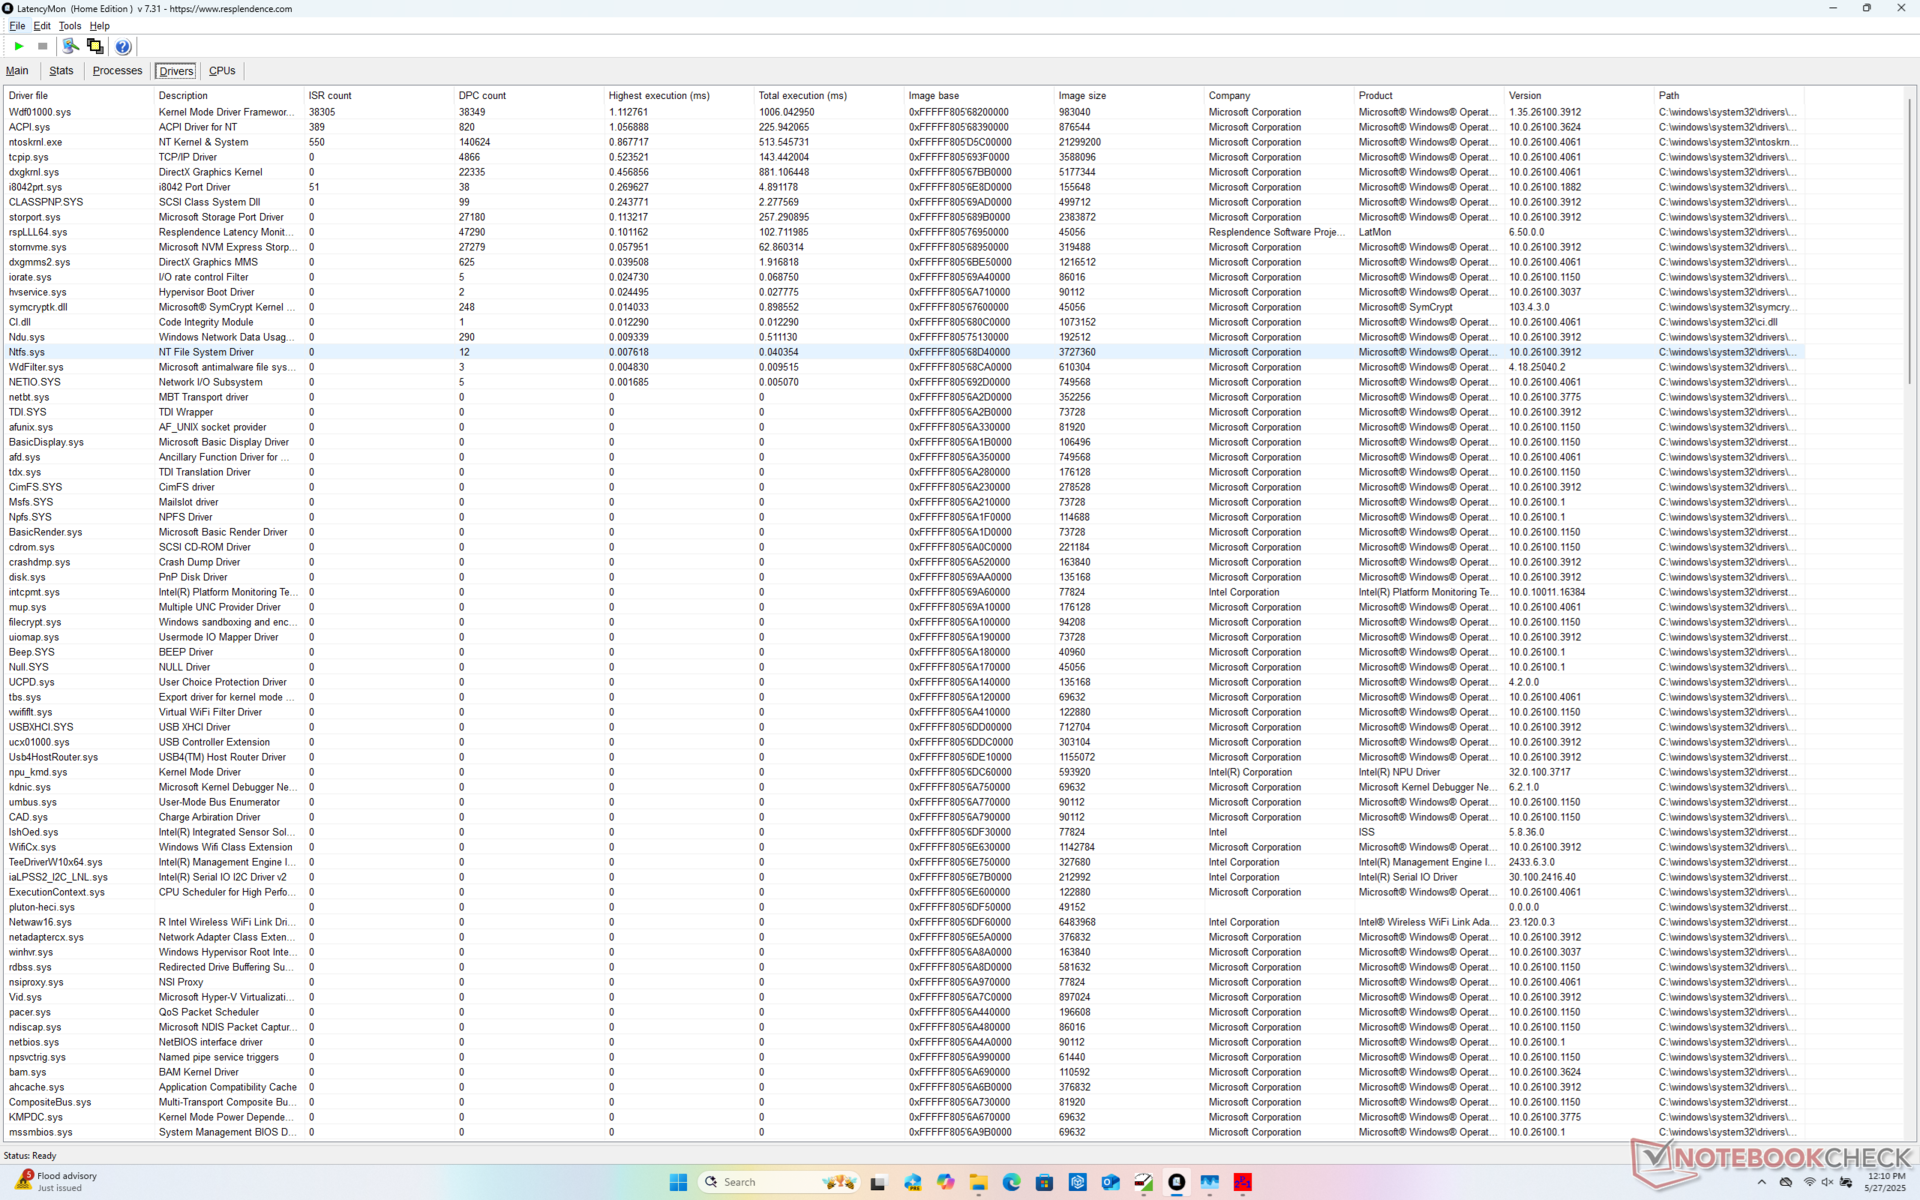
| DPC Latencies / LatencyMon - interrupt to process latency (max), Web, Youtube, Prime95 | |
| Lenovo ThinkPad E14 G6 | |
| Dell Latitude 3440 | |
| HP Pavilion Plus 14-ew0153TU | |
| Dell 14 Plus | |
| Dell Inspiron 14 5425 6VPKR | |
| Lenovo IdeaPad Pro 5 14AKP G10 | |
* ... Meglio usare valori piccoli
Dispositivi di archiviazione
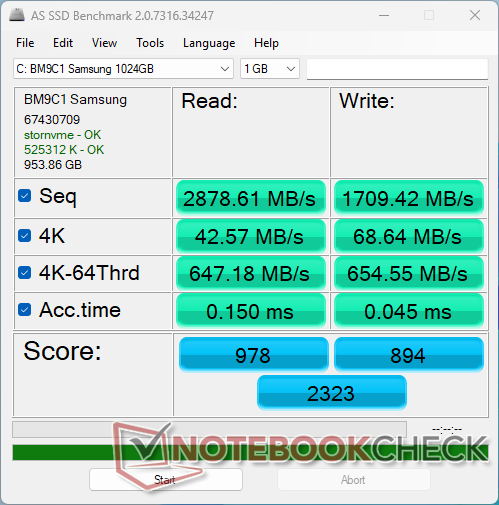
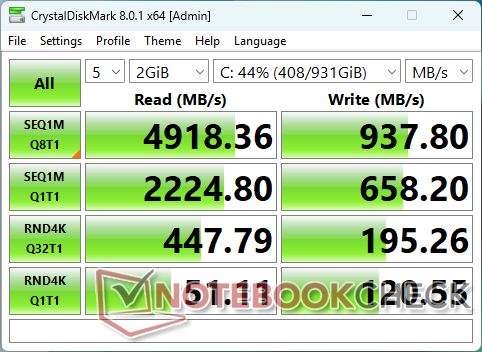
La nostra unità viene fornita con il modello di fascia media Samsung BM9C1 SSD PCIe4 NVMe di fascia media con velocità di lettura decenti, fino a 4900 MB/s. Le velocità di scrittura, tuttavia, possono essere molto più basse, meno della metà.

| Drive Performance rating - Percent | |
| Lenovo IdeaPad Pro 5 14AKP G10 | |
| HP Pavilion Plus 14-ew0153TU | |
| Lenovo ThinkPad E14 G6 | |
| Dell Latitude 3440 | |
| Dell Inspiron 14 5425 6VPKR | |
| Dell 14 Plus | |
* ... Meglio usare valori piccoli
Disk Throttling: DiskSpd Read Loop, Queue Depth 8
Prestazioni della GPU
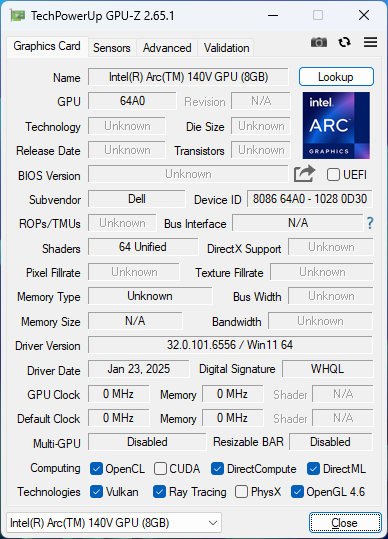
Il Arc 140V nella nostra unità si comporta in modo più lento rispetto al laptop medio del nostro database con la stessa iGPU, fino al 20 percento. Nonostante ciò, il sistema rappresenta comunque un aggiornamento significativo rispetto all'obsoleta Iris Xe 96 EU da cui molti acquirenti faranno l'upgrade.
| Profilo di potenza | Punteggio grafico | Punteggio di fisica | Punteggio combinato |
| Modalità prestazioni | 7706 | 17387 | 2671 |
| Modalità equilibrata | 7182 (-7%) | 16601 (-5%) | 2426 (-9%) |
| Alimentazione a batteria | 7374(-4%) | 16277 (-6%) | 2373 (-11%) |
L'esecuzione in modalità Bilanciata o a batteria riduce le prestazioni solo di pochi punti percentuali, come mostra la nostra tabella dei risultati Fire Strike qui sopra.
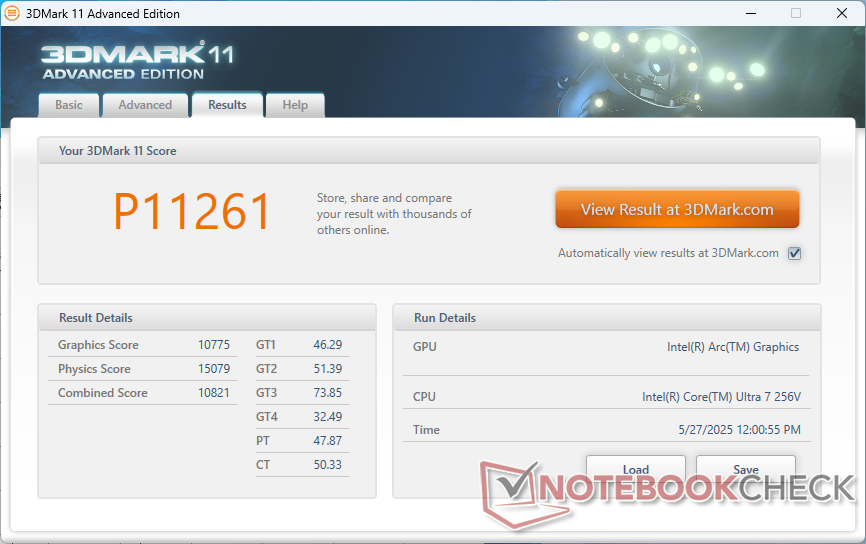
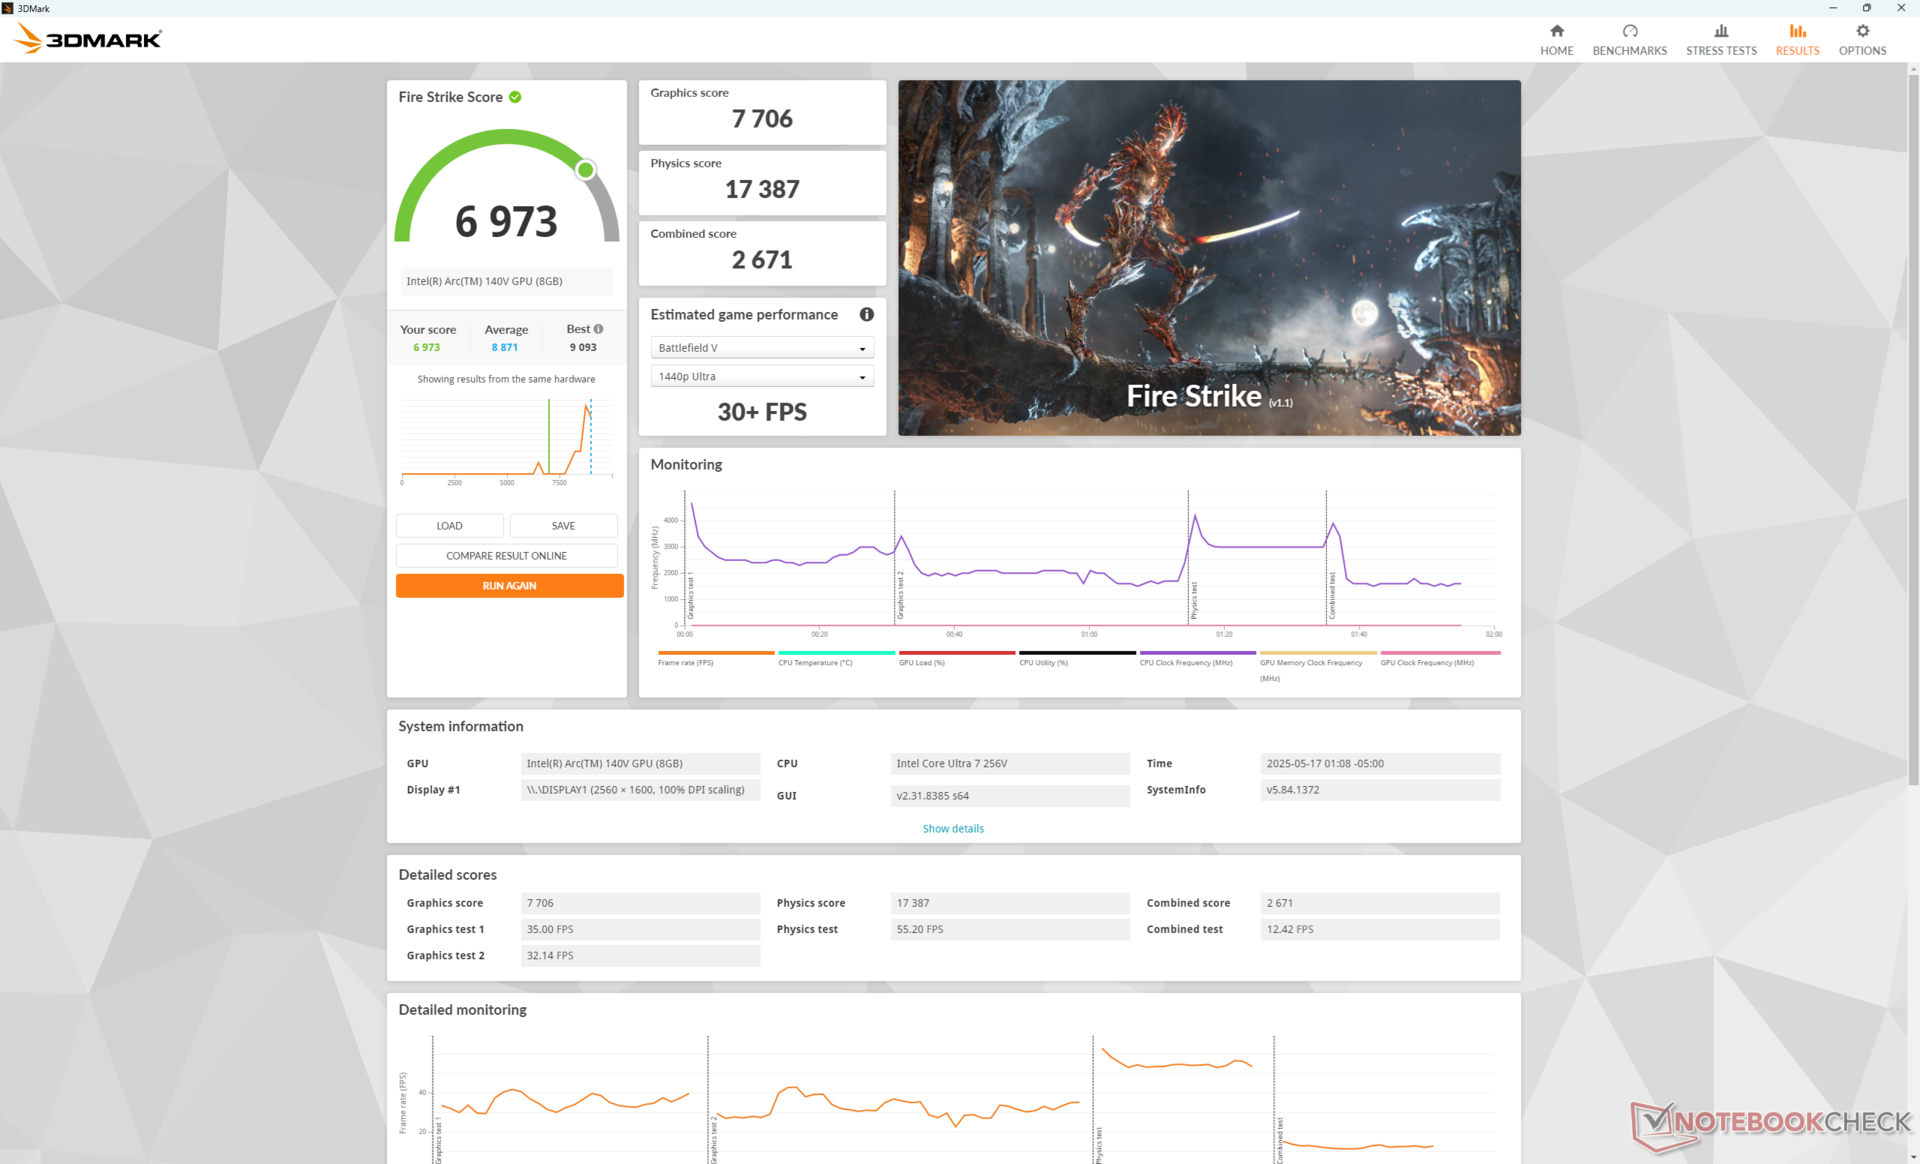
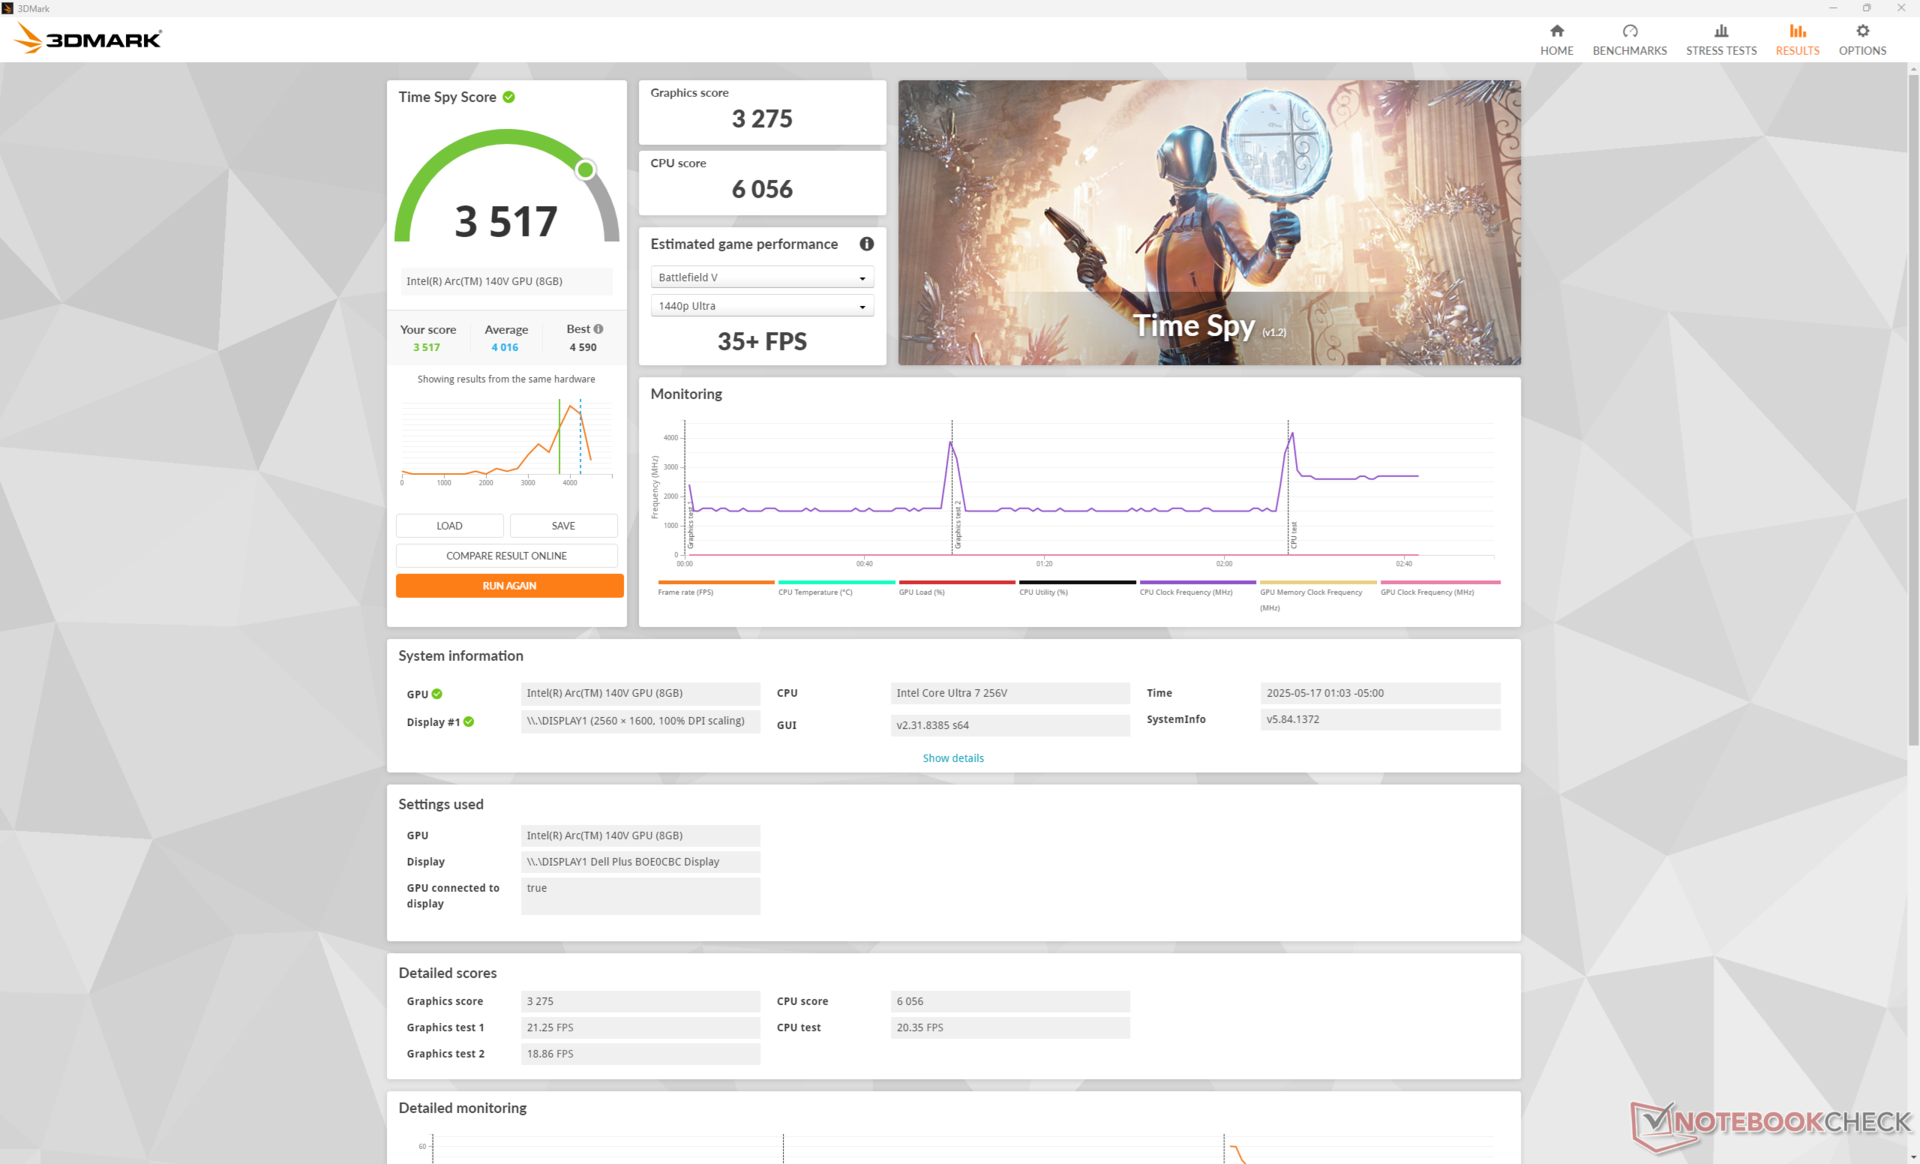
| 3DMark 11 Performance | 11261 punti | |
| 3DMark Fire Strike Score | 6973 punti | |
| 3DMark Time Spy Score | 3517 punti | |
Aiuto | ||
* ... Meglio usare valori piccoli
| F1 24 | |
| 1920x1080 High Preset AA:T AF:16x | |
| Media Intel Arc Graphics 140V (34.4 - 66.4, n=27) | |
| Lenovo ThinkPad X1 2-in-1 Gen 10 | |
| Lenovo IdeaPad Pro 5 14AKP G10 | |
| Dell 14 Plus | |
| Lenovo Yoga 7 2-in-1 14AKP10 | |
| 1920x1080 Ultra High Preset AA:T AF:16x | |
| Media Intel Arc Graphics 140V (14.6 - 22, n=25) | |
| Lenovo ThinkPad X1 2-in-1 Gen 10 | |
| Dell 14 Plus | |
| Lenovo IdeaPad Pro 5 14AKP G10 | |
Cyberpunk 2077 ultra FPS Chart
| basso | medio | alto | ultra | |
|---|---|---|---|---|
| Dota 2 Reborn (2015) | 98.6 | 59.7 | 74.5 | 69.1 |
| Final Fantasy XV Benchmark (2018) | 76.9 | 42.8 | 32.3 | |
| X-Plane 11.11 (2018) | 43.8 | 35.3 | 36 | |
| Strange Brigade (2018) | 193.4 | 56.2 | 52.6 | 48.8 |
| Baldur's Gate 3 (2023) | 38.1 | 32.1 | 27.9 | 27.4 |
| Cyberpunk 2077 (2023) | 43.5 | 35.1 | 26 | 24.2 |
| F1 24 (2024) | 64.3 | 62.2 | 45.9 | 16.5 |
Emissioni
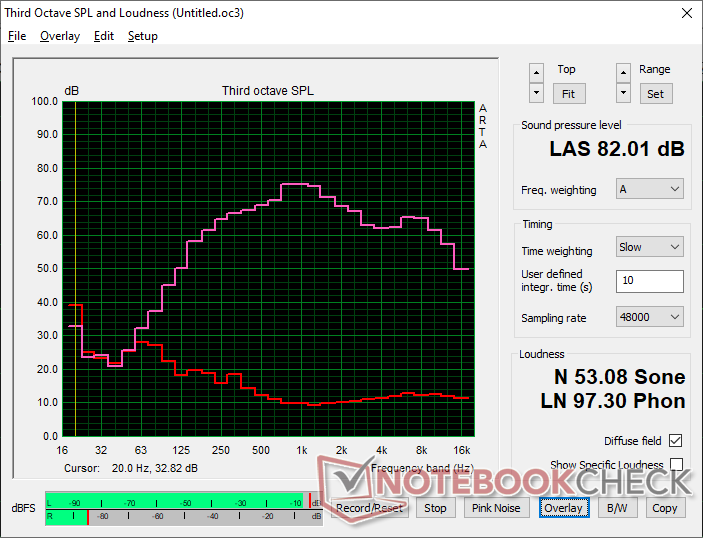
Rumore del sistema
La ventola interna è generalmente letargica e silenziosa sotto la maggior parte dei carichi medio-bassi, come nel caso della maggior parte dei subnotebook alimentati da Lunar Lake. La ventola impiega un po' di tempo per entrare in funzione quando si introducono carichi più elevati, ma altrimenti raggiunge un livello massimo simile a quello della maggior parte degli altri concorrenti da 14 pollici.
Rumorosità
| Idle |
| 23.8 / 23.8 / 23.8 dB(A) |
| Sotto carico |
| 31.4 / 45.2 dB(A) |
 | ||
30 dB silenzioso 40 dB(A) udibile 50 dB(A) rumoroso |
||
min: | ||
| Dell 14 Plus Arc 140V, Core Ultra 7 256V | Dell Inspiron 14 5425 6VPKR Vega 7, R5 5625U, SK Hynix BC711 512GB HFM512GD3GX013N | Dell Latitude 3440 Iris Xe G7 80EUs, i5-1345U, Samsung PM9A1 MZVL2512HCJQ | Lenovo IdeaPad Pro 5 14AKP G10 Radeon 860M, Ryzen AI 7 350, SK hynix PVC10 HFS001TEM4X182N | Lenovo ThinkPad E14 G6 Graphics 4-Core iGPU (Arrow Lake), Ultra 7 155U, Samsung PM9C1a MZAL8512HDLU | HP Pavilion Plus 14-ew0153TU Iris Xe G7 96EUs, i7-1355U, SK hynix PC801 HFS001TEJ9X101N | |
|---|---|---|---|---|---|---|
| Noise | -7% | -3% | -10% | 2% | 15% | |
| off /ambiente * (dB) | 23.8 | 25.5 -7% | 23.9 -0% | 23.6 1% | 24.6 -3% | 19.35 19% |
| Idle Minimum * (dB) | 23.8 | 25.5 -7% | 24.4 -3% | 23.6 1% | 24.6 -3% | 20.57 14% |
| Idle Average * (dB) | 23.8 | 25.5 -7% | 24.4 -3% | 23.6 1% | 24.6 -3% | 20.57 14% |
| Idle Maximum * (dB) | 23.8 | 25.5 -7% | 24.4 -3% | 23.6 1% | 24.6 -3% | 20.57 14% |
| Load Average * (dB) | 31.4 | 37.7 -20% | 37.1 -18% | 46.5 -48% | 27.5 12% | 32.18 -2% |
| Cyberpunk 2077 ultra * (dB) | 42 | 48.9 -16% | 39.4 6% | |||
| Load Maximum * (dB) | 45.2 | 43.3 4% | 40.2 11% | 48.9 -8% | 42.5 6% | 32.26 29% |
| Witcher 3 ultra * (dB) | 38.2 | 29.44 |
* ... Meglio usare valori piccoli
Temperatura
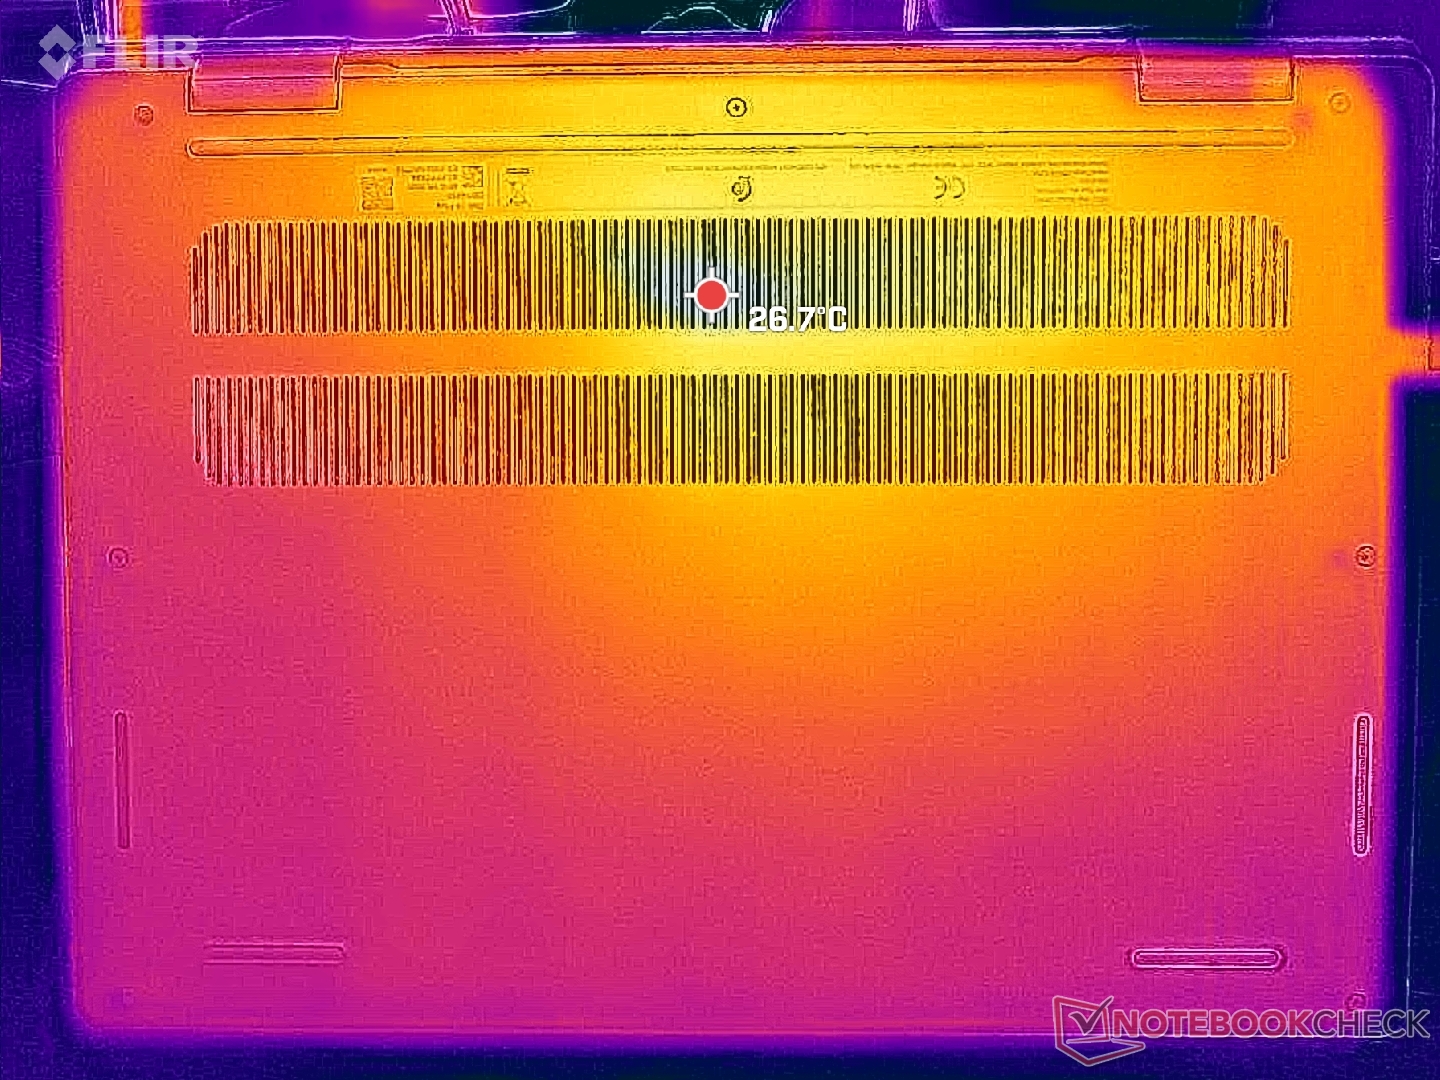
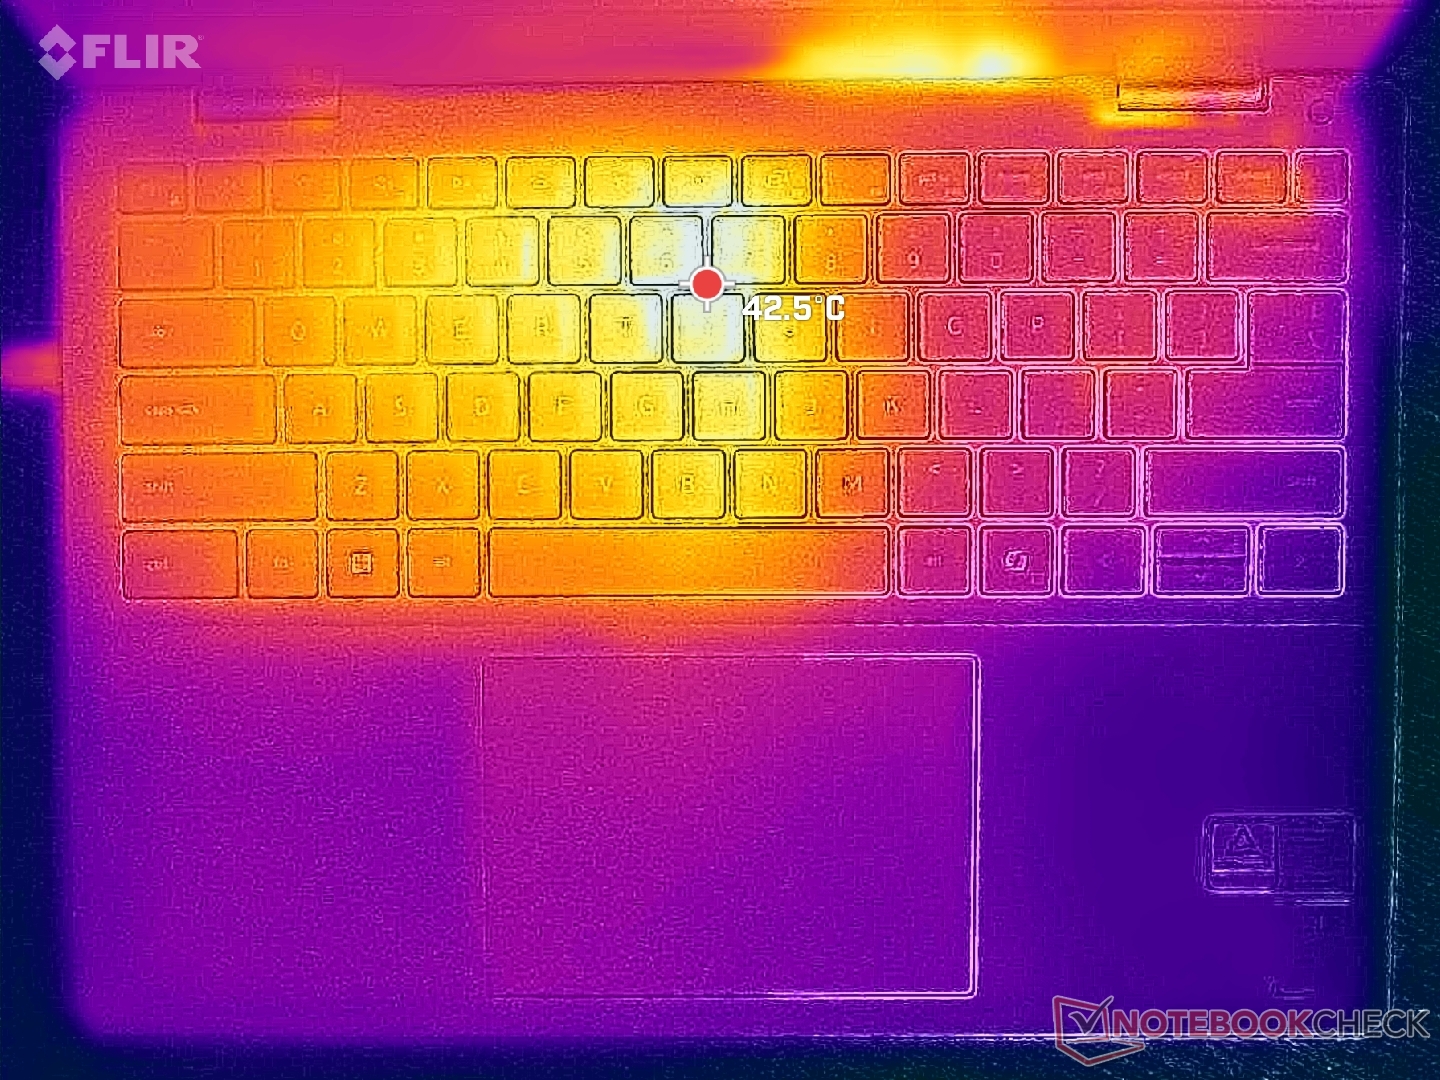
I punti caldi della temperatura della superficie sotto carico possono raggiungere fino a 43 C sia sul piano tastiera che sul fondo, per essere sensibilmente più caldi rispetto a quanto abbiamo registrato su HP Pavilion Plus 14 di qualche grado.
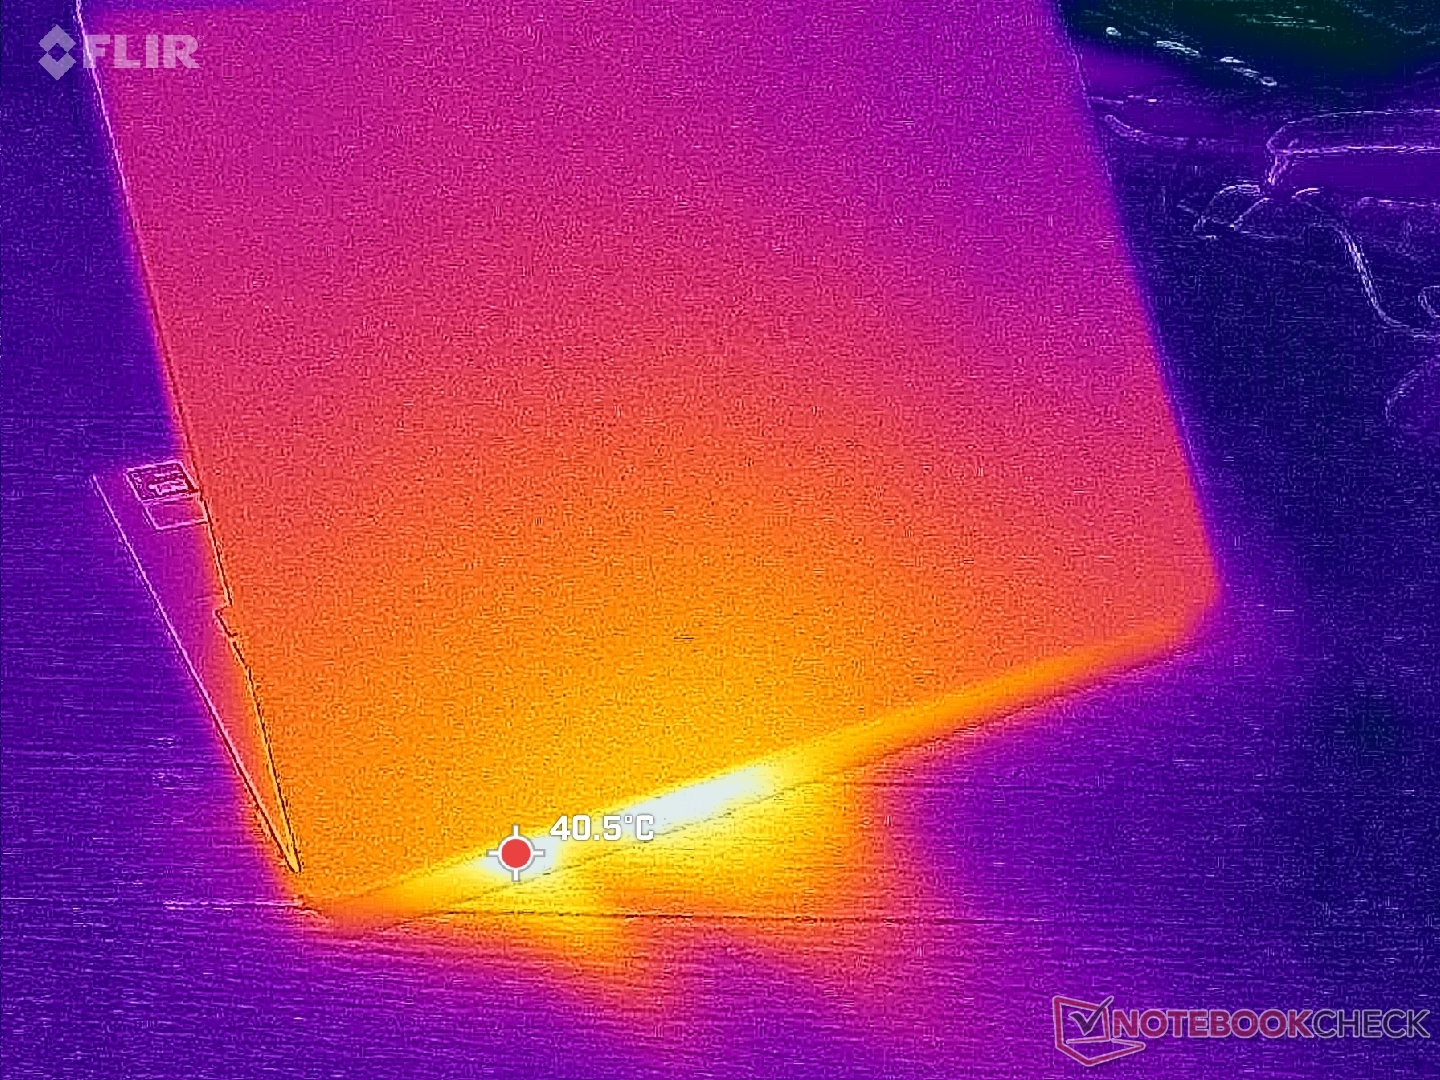
(±) La temperatura massima sul lato superiore è di 43 °C / 109 F, rispetto alla media di 35.9 °C / 97 F, che varia da 21.4 a 59 °C per questa classe Subnotebook.
(±) Il lato inferiore si riscalda fino ad un massimo di 42.6 °C / 109 F, rispetto alla media di 39.2 °C / 103 F
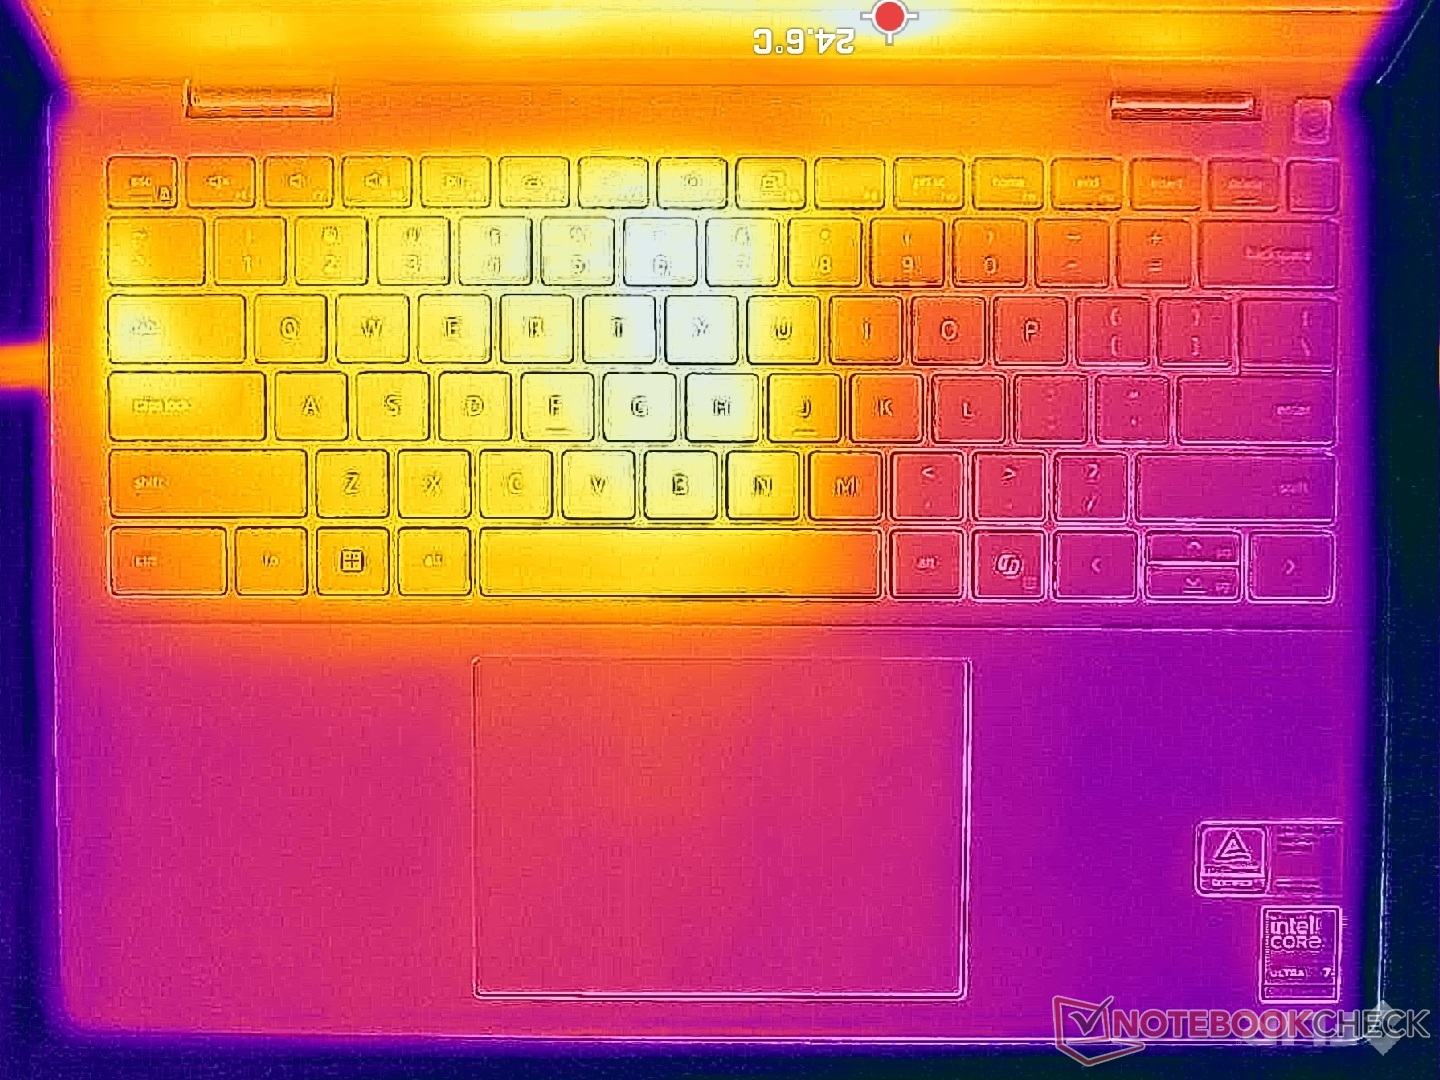
(+) In idle, la temperatura media del lato superiore è di 28.8 °C / 84 F, rispetto alla media deld ispositivo di 30.8 °C / 87 F.
(+) I poggiapolsi e il touchpad sono piu' freddi della temperatura della pelle con un massimo di 28.4 °C / 83.1 F e sono quindi freddi al tatto.
(±) La temperatura media della zona del palmo della mano di dispositivi simili e'stata di 28.2 °C / 82.8 F (-0.2 °C / -0.3 F).
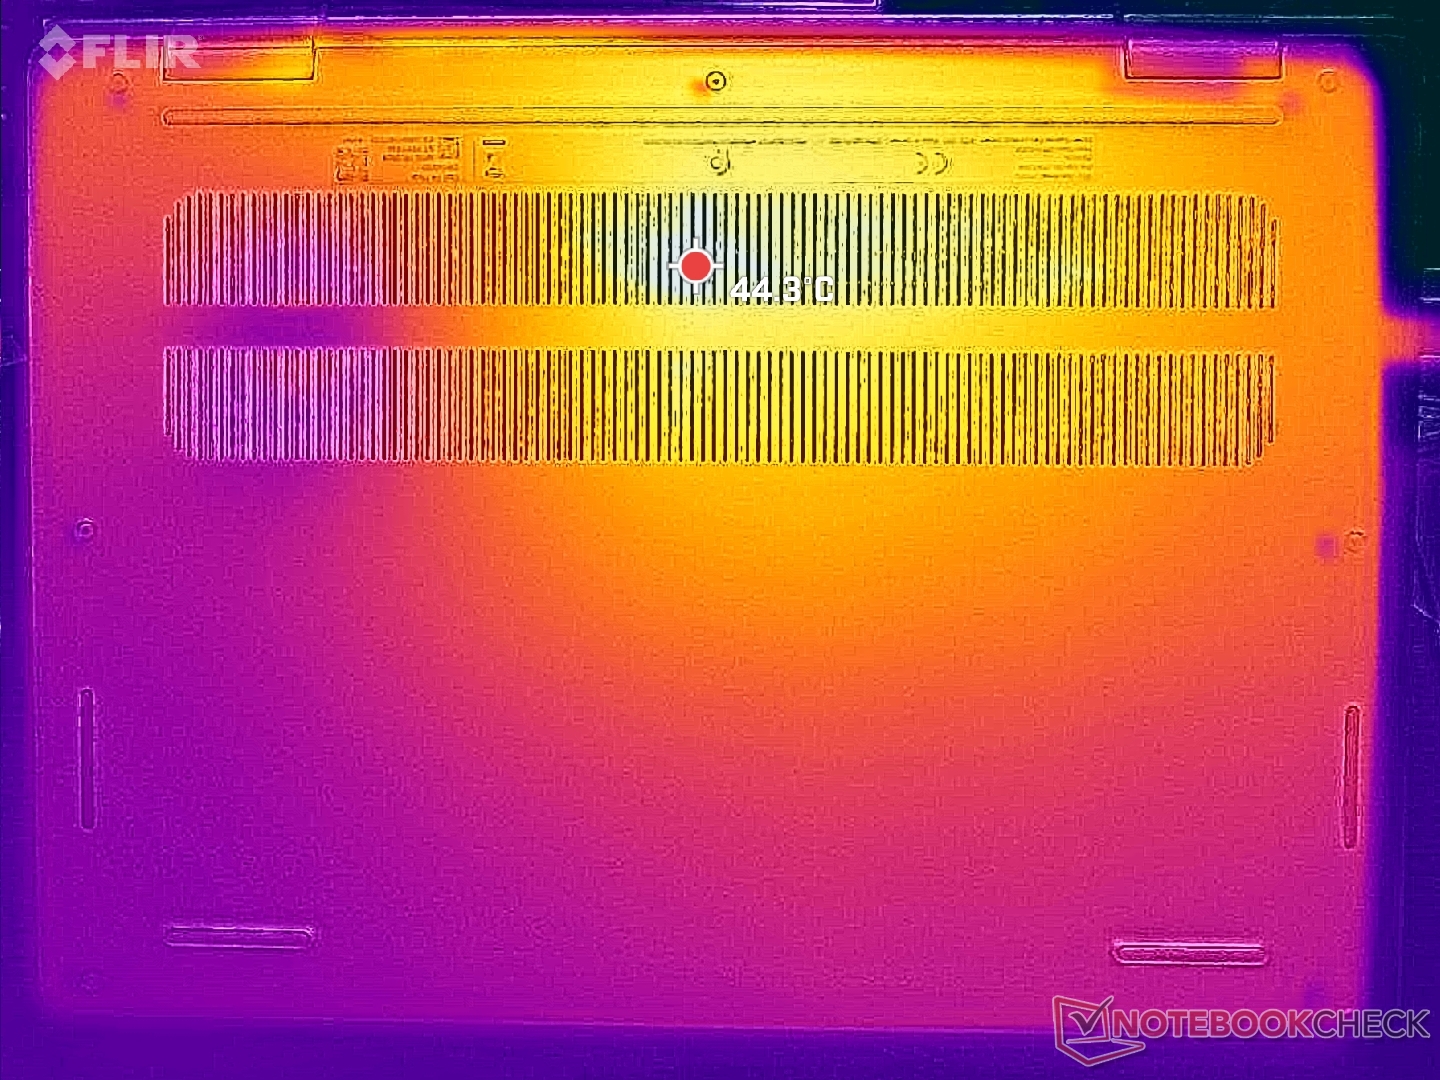
| Dell 14 Plus Intel Core Ultra 7 256V, Intel Arc Graphics 140V | Dell Inspiron 14 5425 6VPKR AMD Ryzen 5 5625U, AMD Radeon RX Vega 7 | Dell Latitude 3440 Intel Core i5-1345U, Intel Iris Xe Graphics G7 80EUs | Lenovo IdeaPad Pro 5 14AKP G10 AMD Ryzen AI 7 350, AMD Radeon 860M | Lenovo ThinkPad E14 G6 Intel Core Ultra 7 155U, Intel Graphics 4-Core iGPU (Meteor / Arrow Lake) | HP Pavilion Plus 14-ew0153TU Intel Core i7-1355U, Intel Iris Xe Graphics G7 96EUs | |
|---|---|---|---|---|---|---|
| Heat | 3% | 6% | 10% | 20% | 8% | |
| Maximum Upper Side * (°C) | 43 | 39.1 9% | 35.2 18% | 42.2 2% | 35 19% | 36.6 15% |
| Maximum Bottom * (°C) | 42.6 | 41.9 2% | 41 4% | 42.4 -0% | 35.6 16% | 37.2 13% |
| Idle Upper Side * (°C) | 31.6 | 31.2 1% | 29.8 6% | 25.4 20% | 23.8 25% | 31.6 -0% |
| Idle Bottom * (°C) | 30.6 | 30.9 -1% | 32 -5% | 25.7 16% | 24.8 19% | 30 2% |
* ... Meglio usare valori piccoli
Altoparlanti
Dell 14 Plus analisi audio
(+) | gli altoparlanti sono relativamente potenti (82 dB)
Bassi 100 - 315 Hz
(±) | bassi ridotti - in media 7.8% inferiori alla media
(±) | la linearità dei bassi è media (9.2% delta rispetto alla precedente frequenza)
Medi 400 - 2000 Hz
(±) | medi elevati - circa 6.5% superiore alla media
(+) | medi lineari (3.6% delta rispetto alla precedente frequenza)
Alti 2 - 16 kHz
(+) | Alti bilanciati - appena 1.9% dalla media
(+) | alti lineari (3.7% delta rispetto alla precedente frequenza)
Nel complesso 100 - 16.000 Hz
(+) | suono nel complesso lineare (12.4% differenza dalla media)
Rispetto alla stessa classe
» 16% di tutti i dispositivi testati in questa classe è stato migliore, 4% simile, 79% peggiore
» Il migliore ha avuto un delta di 5%, medio di 18%, peggiore di 53%
Rispetto a tutti i dispositivi testati
» 11% di tutti i dispositivi testati in questa classe è stato migliore, 2% similare, 87% peggiore
» Il migliore ha avuto un delta di 4%, medio di 23%, peggiore di 134%
Apple MacBook Pro 16 2021 M1 Pro analisi audio
(+) | gli altoparlanti sono relativamente potenti (84.7 dB)
Bassi 100 - 315 Hz
(+) | bassi buoni - solo 3.8% dalla media
(+) | bassi in lineaa (5.2% delta rispetto alla precedente frequenza)
Medi 400 - 2000 Hz
(+) | medi bilanciati - solo only 1.3% rispetto alla media
(+) | medi lineari (2.1% delta rispetto alla precedente frequenza)
Alti 2 - 16 kHz
(+) | Alti bilanciati - appena 1.9% dalla media
(+) | alti lineari (2.7% delta rispetto alla precedente frequenza)
Nel complesso 100 - 16.000 Hz
(+) | suono nel complesso lineare (4.6% differenza dalla media)
Rispetto alla stessa classe
» 0% di tutti i dispositivi testati in questa classe è stato migliore, 0% simile, 100% peggiore
» Il migliore ha avuto un delta di 5%, medio di 17%, peggiore di 45%
Rispetto a tutti i dispositivi testati
» 0% di tutti i dispositivi testati in questa classe è stato migliore, 0% similare, 100% peggiore
» Il migliore ha avuto un delta di 4%, medio di 23%, peggiore di 134%
Gestione dell'energia
Consumo di energia
Il consumo complessivo è abbastanza vicino a quello del Dell Latitude 7450 2-in-1 alimentato dal Core Ultra 7 165U, anche se il nostro Dell 14 Plus offre un'accelerazione AI, prestazioni RAM e prestazioni iGPU significativamente più veloci, per un aumento delle prestazioni per watt.
| Off / Standby | |
| Idle | |
| Sotto carico |
|
Leggenda:
min: | |
| Dell 14 Plus Core Ultra 7 256V, Arc 140V, , IPS, 2560x1600, 14" | Dell Inspiron 14 5425 6VPKR R5 5625U, Vega 7, SK Hynix BC711 512GB HFM512GD3GX013N, IPS, 1920x1200, 14" | Dell Latitude 3440 i5-1345U, Iris Xe G7 80EUs, Samsung PM9A1 MZVL2512HCJQ, IPS, 1920x1080, 14" | Lenovo IdeaPad Pro 5 14AKP G10 Ryzen AI 7 350, Radeon 860M, SK hynix PVC10 HFS001TEM4X182N, OLED, 2880x1800, 14" | Lenovo ThinkPad E14 G6 Ultra 7 155U, Graphics 4-Core iGPU (Arrow Lake), Samsung PM9C1a MZAL8512HDLU, IPS, 1920x1200, 14" | HP Pavilion Plus 14-ew0153TU i7-1355U, Iris Xe G7 96EUs, SK hynix PC801 HFS001TEJ9X101N, OLED, 2880x1800, 14" | |
|---|---|---|---|---|---|---|
| Power Consumption | -4% | -12% | -66% | -36% | -34% | |
| Idle Minimum * (Watt) | 3.6 | 4 -11% | 3.7 -3% | 5.1 -42% | 5.4 -50% | 6.7 -86% |
| Idle Average * (Watt) | 6.7 | 6.6 1% | 6.5 3% | 6.8 -1% | 9.7 -45% | 7.16 -7% |
| Idle Maximum * (Watt) | 6.9 | 9.4 -36% | 9.5 -38% | 6.9 -0% | 10.4 -51% | 11.17 -62% |
| Load Average * (Watt) | 41.2 | 37 10% | 46.9 -14% | 71.7 -74% | 49.2 -19% | 46.5 -13% |
| Cyberpunk 2077 ultra external monitor * (Watt) | 34.2 | 83.5 -144% | 47.1 -38% | |||
| Cyberpunk 2077 ultra * (Watt) | 36.6 | 84.8 -132% | 50.1 -37% | |||
| Load Maximum * (Watt) | 62.6 | 53.7 14% | 67 -7% | 104.8 -67% | 68.9 -10% | 64.36 -3% |
| Witcher 3 ultra * (Watt) | 37.1 | 42.1 | 37.2 |
* ... Meglio usare valori piccoli
Power Consumption Cyberpunk / Stress Test
Power Consumption external Monitor
Durata della batteria
L'autonomia della WLAN è molto lunga, oltre 14 ore, grazie alla notevole batteria da 64 Wh.
| Dell 14 Plus Core Ultra 7 256V, Arc 140V, 64 Wh | Dell Inspiron 14 5425 6VPKR R5 5625U, Vega 7, 54 Wh | Dell Latitude 3440 i5-1345U, Iris Xe G7 80EUs, 54 Wh | Lenovo IdeaPad Pro 5 14AKP G10 Ryzen AI 7 350, Radeon 860M, 84 Wh | Lenovo ThinkPad E14 G6 Ultra 7 155U, Graphics 4-Core iGPU (Arrow Lake), 47 Wh | HP Pavilion Plus 14-ew0153TU i7-1355U, Iris Xe G7 96EUs, 68 Wh | |
|---|---|---|---|---|---|---|
| Autonomia della batteria | -10% | -38% | -3% | -34% | -33% | |
| WiFi v1.3 (h) | 14.3 | 12.8 -10% | 8.8 -38% | 13.9 -3% | 9.4 -34% | 9.6 -33% |
| H.264 (h) | 19.6 | 12 | ||||
| Load (h) | 0.9 | 1.5 | ||||
| Reader / Idle (h) | 22.8 |
Valutazione Notebookcheck
Dell 14 Plus
- 06/01/2025 v8
Allen Ngo
 Total Sustainability Score:
 Potential Competitors in Comparison
Immagine | Modello | Prezzo | Peso | Altezza | Schermo |
|---|---|---|---|---|---|
1. 83.4%  | Dell 14 Plus Intel Core Ultra 7 256V ⎘ Intel Arc Graphics 140V ⎘ 16 GB Memoria | Amazon: Prezzo di listino: 1100 USD | 1.5 kg | 16.95 mm | 14.00" 2560x1600 216 PPI IPS |
2. 84.6% v7 (old) 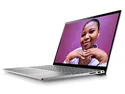 | Dell Inspiron 14 5425 6VPKR AMD Ryzen 5 5625U ⎘ AMD Radeon RX Vega 7 ⎘ 16 GB Memoria, 512 GB SSD | Amazon: 1. $37.75 54Wh V6W33 Battery for Dell ... 2. $297.99 Dell Inspiron 14 5440 Laptop... 3. $429.00 Dell Inspiron 14 5425 Notebo... Prezzo di listino: 849 Euro | 1.6 kg | 18.37 mm | 14.00" 1920x1200 162 PPI IPS |
3. 85.3% v7 (old)  | Dell Latitude 3440 Intel Core i5-1345U ⎘ Intel Iris Xe Graphics G7 80EUs ⎘ 16 GB Memoria, 512 GB SSD | Amazon: 1. $446.96 Dell Latitude 3440 14" Busin... 2. $499.99 Dell Latitude 3000 3440 (Lat... 3. $421.96 Dell Latitude 3440 Laptop Bu... Prezzo di listino: 1100 USD | 1.5 kg | 19.4 mm | 14.00" 1920x1080 157 PPI IPS |
4. 87.4%  | Lenovo IdeaPad Pro 5 14AKP G10 AMD Ryzen AI 7 350 ⎘ AMD Radeon 860M ⎘ 32 GB Memoria, 1024 GB SSD | Amazon: Prezzo di listino: 989€ | 1.4 kg | 15.5 mm | 14.00" 2880x1800 243 PPI OLED |
5. 84.8%  | Lenovo ThinkPad E14 G6 Intel Core Ultra 7 155U ⎘ Intel Graphics 4-Core iGPU (Meteor / Arrow Lake) ⎘ 16 GB Memoria, 512 GB SSD | Amazon: Prezzo di listino: 990 USD | 1.5 kg | 17.99 mm | 14.00" 1920x1200 162 PPI IPS |
6. 87.5% v7 (old)  | HP Pavilion Plus 14-ew0153TU Intel Core i7-1355U ⎘ Intel Iris Xe Graphics G7 96EUs ⎘ 16 GB Memoria, 1024 GB SSD | Amazon: 1. $22.00 FRUPART for HP Pavilion Plus... 2. $45.99 68Wh WE04XL N39857-005 Repla... 3. $639.00 HP Pavilion x360 14 Converti... Prezzo di listino: 1020 USD | 1.4 kg | 17.5 mm | 14.00" 2880x1800 243 PPI OLED |
Transparency
La selezione dei dispositivi da recensire viene effettuata dalla nostra redazione. Il campione di prova è stato fornito all'autore come prestito dal produttore o dal rivenditore ai fini di questa recensione. L'istituto di credito non ha avuto alcuna influenza su questa recensione, né il produttore ne ha ricevuto una copia prima della pubblicazione. Non vi era alcun obbligo di pubblicare questa recensione. In quanto società mediatica indipendente, Notebookcheck non è soggetta all'autorità di produttori, rivenditori o editori.
Ecco come Notebookcheck esegue i test
Ogni anno, Notebookcheck esamina in modo indipendente centinaia di laptop e smartphone utilizzando procedure standardizzate per garantire che tutti i risultati siano comparabili. Da circa 20 anni sviluppiamo continuamente i nostri metodi di prova e nel frattempo stabiliamo gli standard di settore. Nei nostri laboratori di prova, tecnici ed editori esperti utilizzano apparecchiature di misurazione di alta qualità. Questi test comportano un processo di validazione in più fasi. Il nostro complesso sistema di valutazione si basa su centinaia di misurazioni e parametri di riferimento ben fondati, che mantengono l'obiettività.
