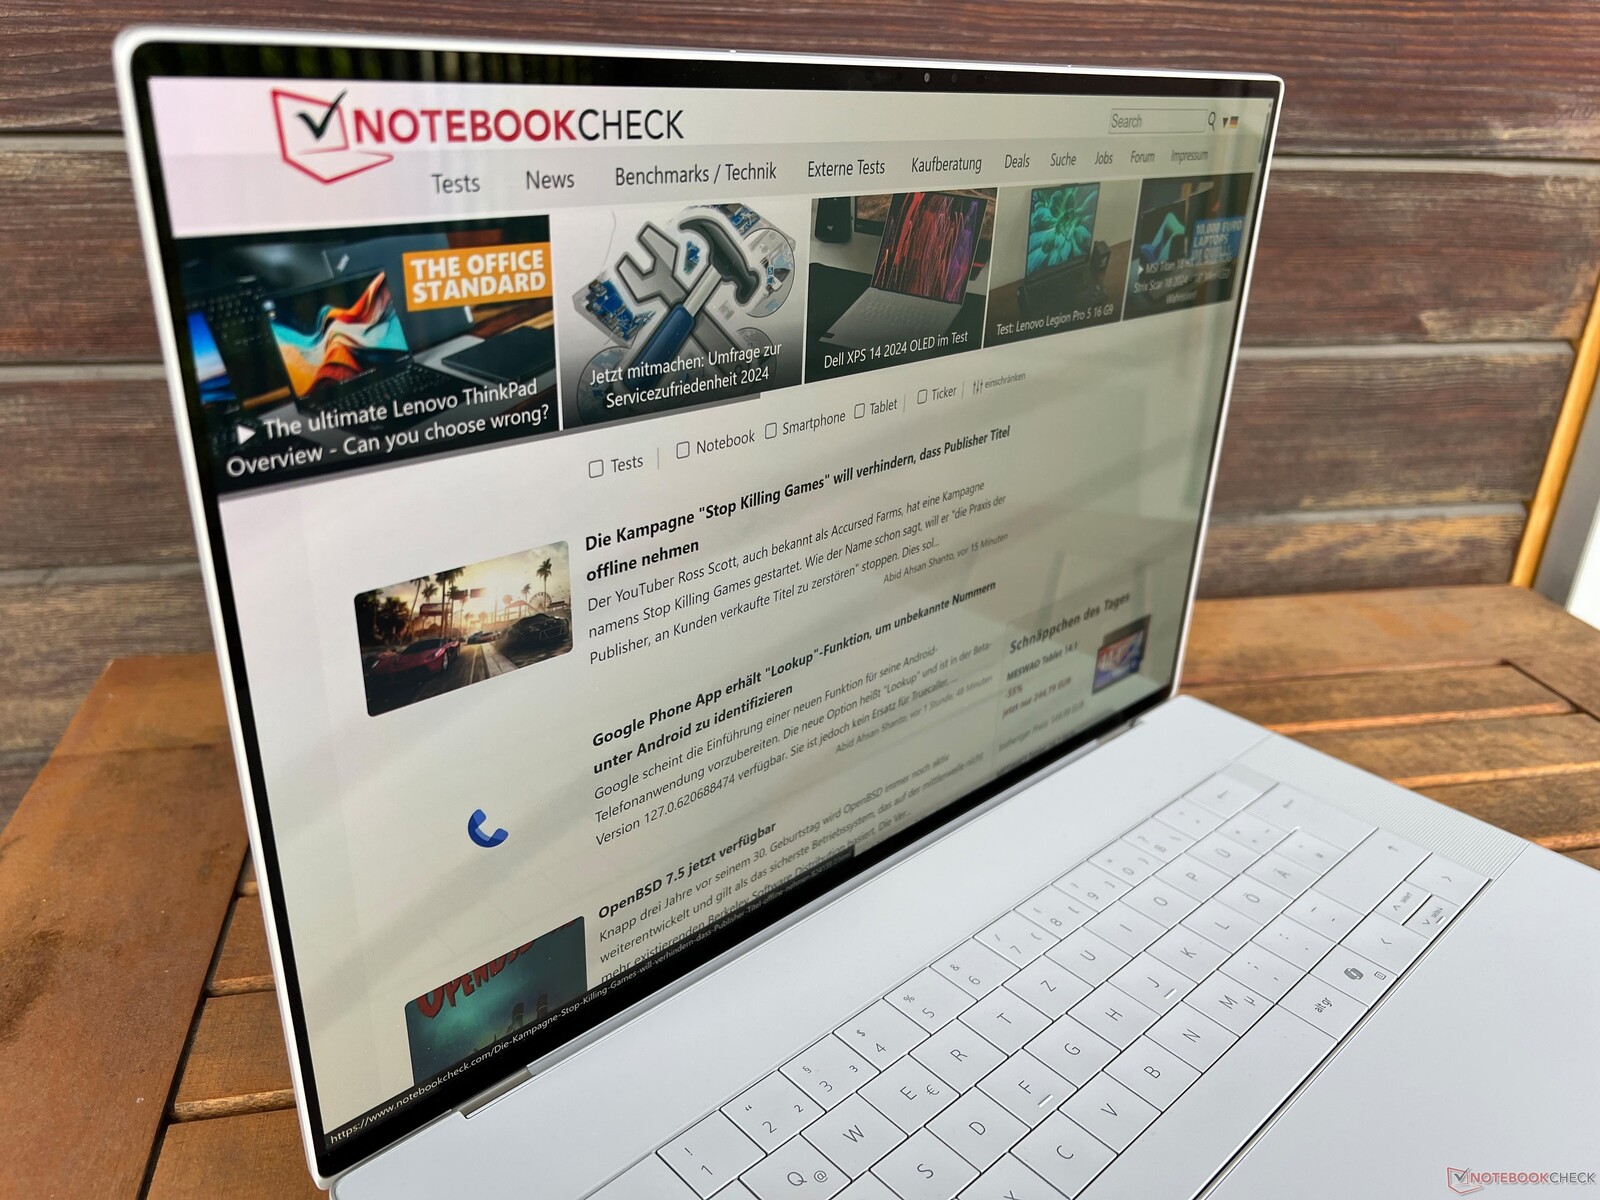
Recensione del Dell XPS 16 9640 - un portatile multimediale con OLED 4K e una fastidiosa touch bar
Dell ha sostituito il suo noto computer portatile multimediale, l'XPS 15, con due nuovi modelli: In primo luogo, il più compatto XPS 14, che abbiamo già testato a fondo-e il suo concetto ci ha rivelato parecchie domande. Oggi daremo un'occhiata al modello più grande da 16 pollici, vale a dire l'XPS 16. In generale, la ricetta è identica e, a parte i nuovi processori Meteor Lake di Intel, si avvale di schede grafiche dedicate di Nvidia, ma questa volta anche dei modelli più potenti, fino alla RTX 4070 Laptop. Ci sono alcune differenze aggiuntive, di cui parleremo in modo più approfondito nel corso di questa recensione.
Il nostro dispositivo di prova è una configurazione ben equipaggiata con Core Ultra 7 155H, RTX 4070 Laptop, 32 GB di RAM, un SSD da 1 TB e un touchscreen OLED ad alta risoluzione per 2.899 dollari. Di conseguenza, l'XPS 16 compete con altri computer portatili multimediali di alta qualità e ibridi gaming/multimedia come ROG Zephyrus G16.
Potenziali concorrenti a confrontos
Punteggio | Data | Modello | Peso | Altezza | Dimensione | Risoluzione | Prezzo |
|---|---|---|---|---|---|---|---|
| 88.6 % v7 (old) | 04/2024 | Dell XPS 16 9640 Ultra 7 155H, GeForce RTX 4070 Laptop GPU | 2.3 kg | 18.7 mm | 16.30" | 3840x2400 | |
| 90.4 % v7 (old) | 03/2024 | Samsung Galaxy Book4 Ultra Ultra 7 155H, GeForce RTX 4050 Laptop GPU | 1.8 kg | 17 mm | 16.00" | 2880x1800 | |
| 90 % v7 (old) | 03/2024 | Honor MagicBook Pro 16 2024 Ultra 7 155H, GeForce RTX 4060 Laptop GPU | 1.9 kg | 17.9 mm | 16.00" | 3072x1920 | |
| 92.3 % v7 (old) | 02/2024 | Asus ROG Zephyrus G16 2024 GU605M Ultra 7 155H, GeForce RTX 4070 Laptop GPU | 1.8 kg | 16.4 mm | 16.00" | 2560x1600 | |
| 88.4 % v7 (old) | 08/2023 | Lenovo Yoga Pro 9 16-IRP G8 i7-13705H, GeForce RTX 4060 Laptop GPU | 2.2 kg | 18.2 mm | 16.00" | 3200x2000 | |
| 88.6 % v7 (old) | 07/2023 | Schenker VISION 16 Pro (M23) i7-13700H, GeForce RTX 4070 Laptop GPU | 1.6 kg | 17.1 mm | 16.00" | 2560x1600 | |
| 90.3 % v7 (old) | 04/2023 | Dell XPS 15 9530 RTX 4070 i7-13700H, GeForce RTX 4070 Laptop GPU | 1.9 kg | 18 mm | 15.60" | 3456x2160 |
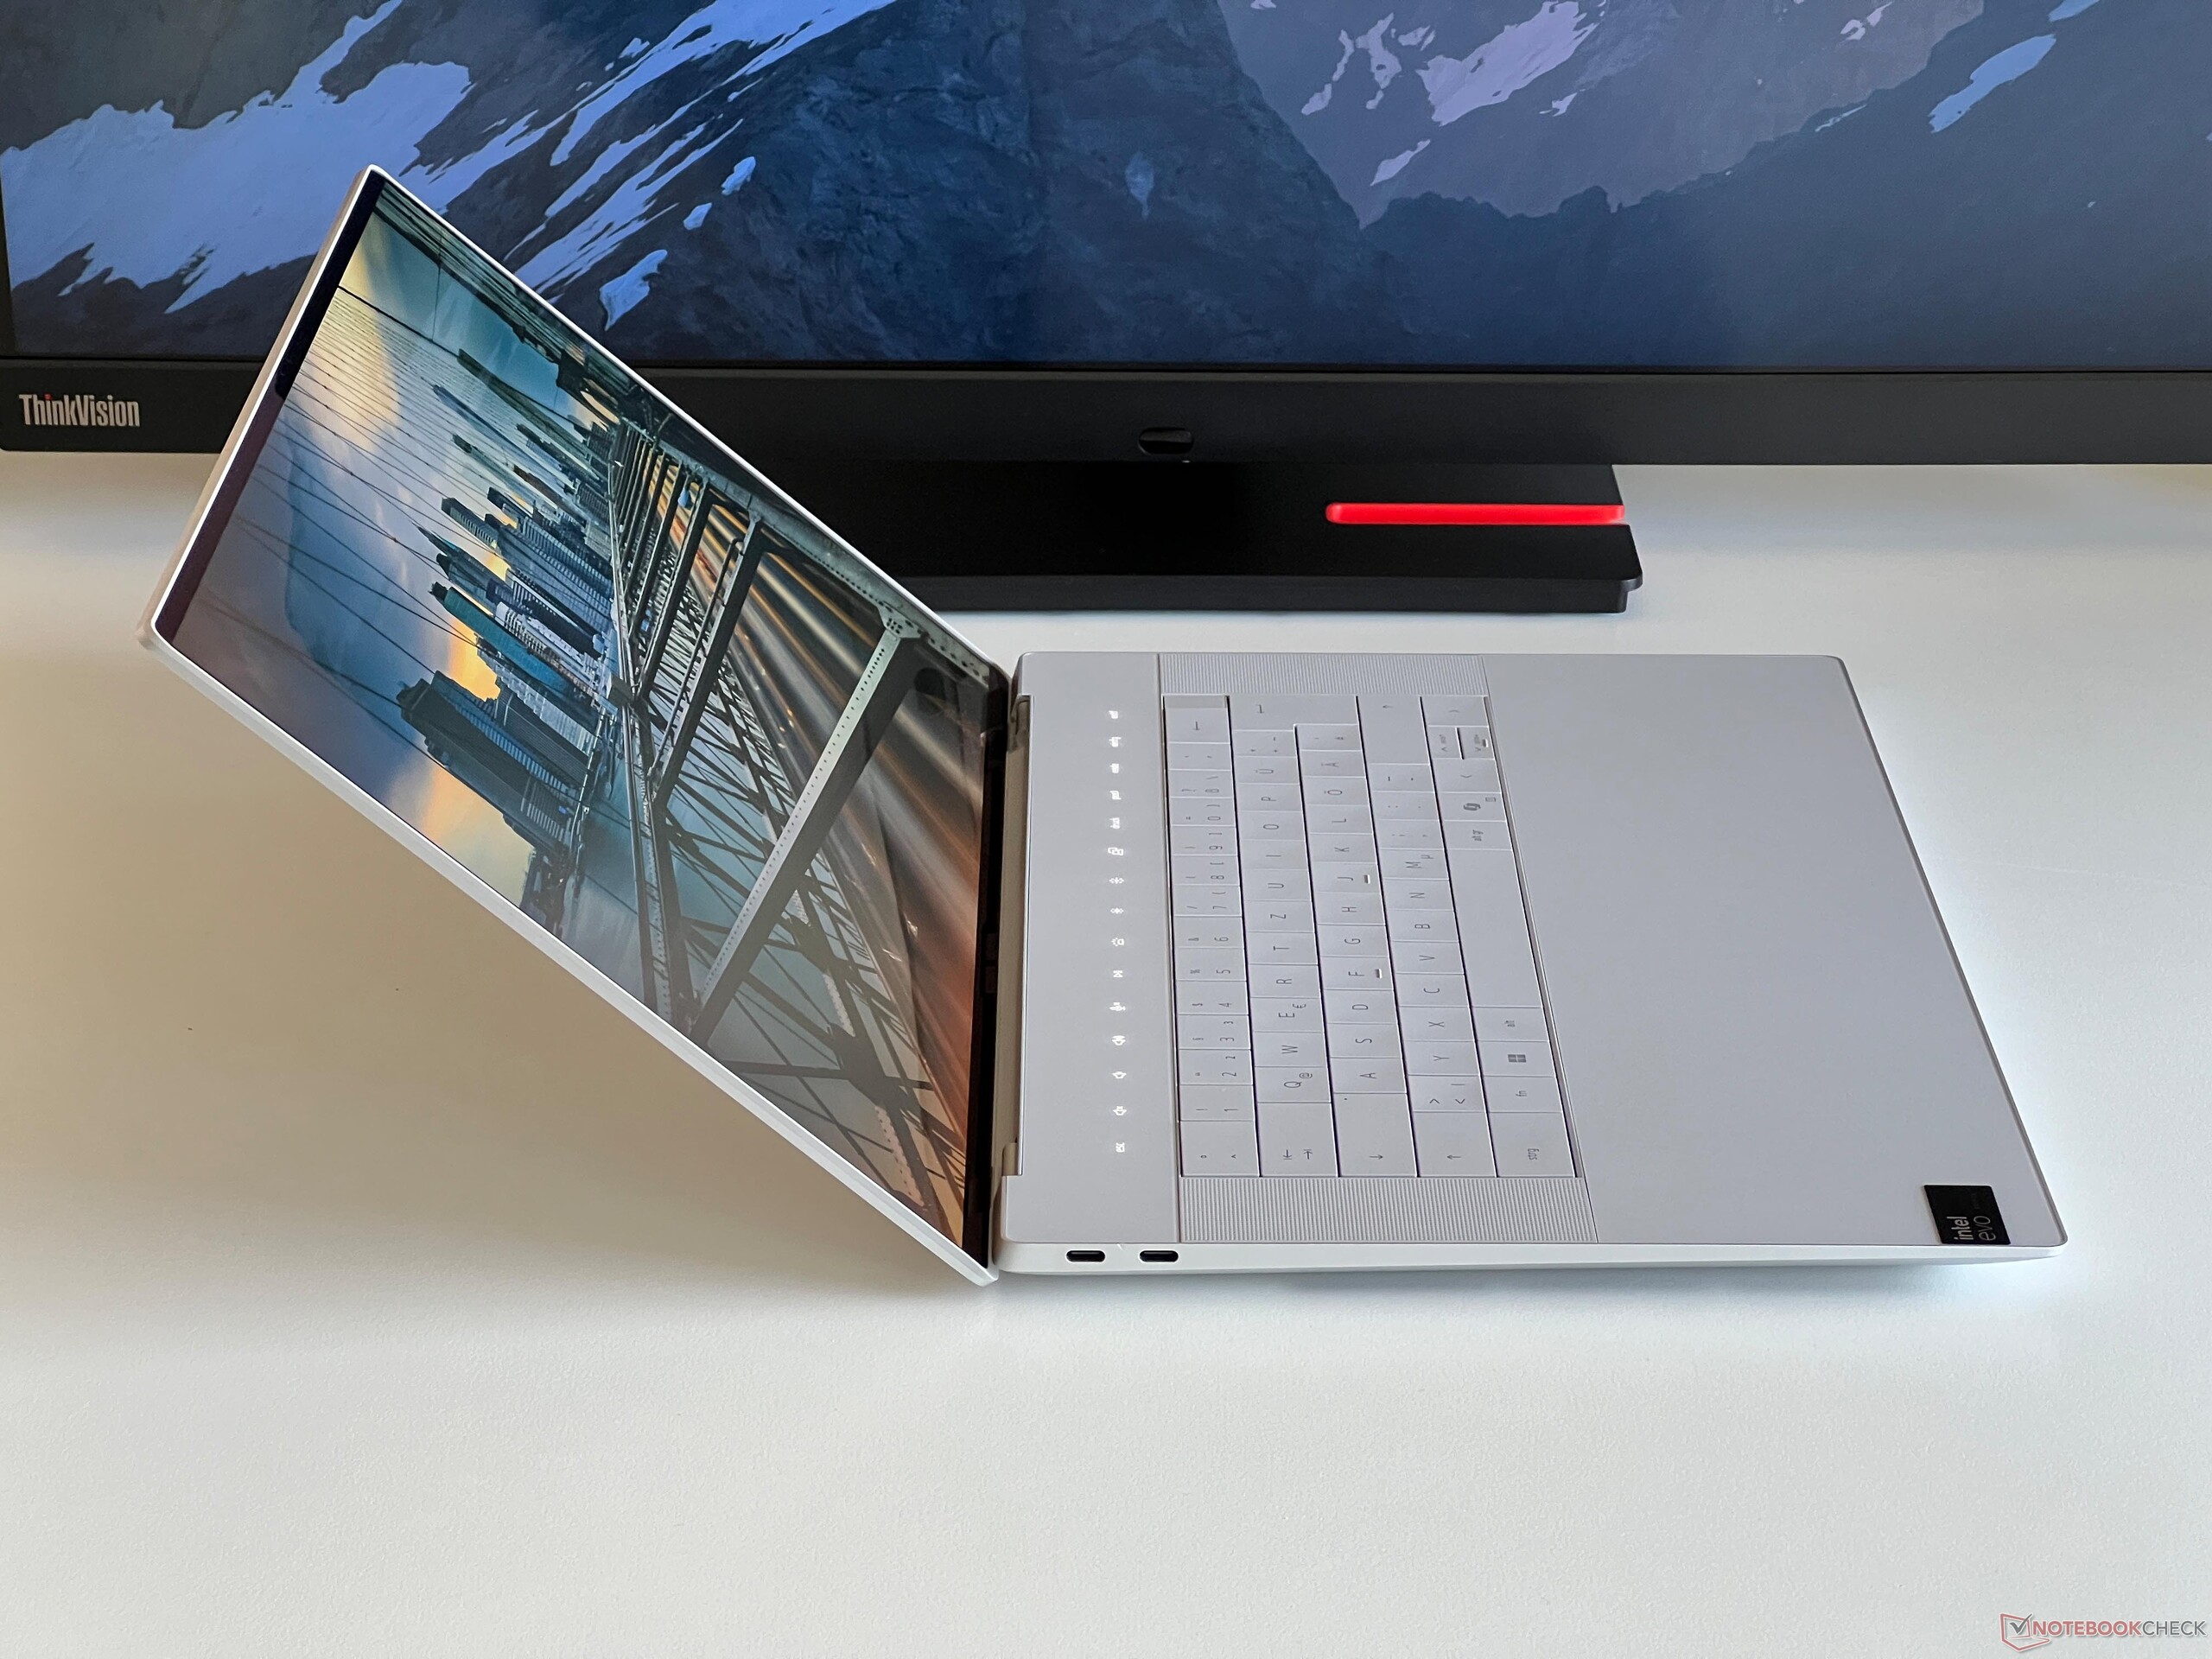
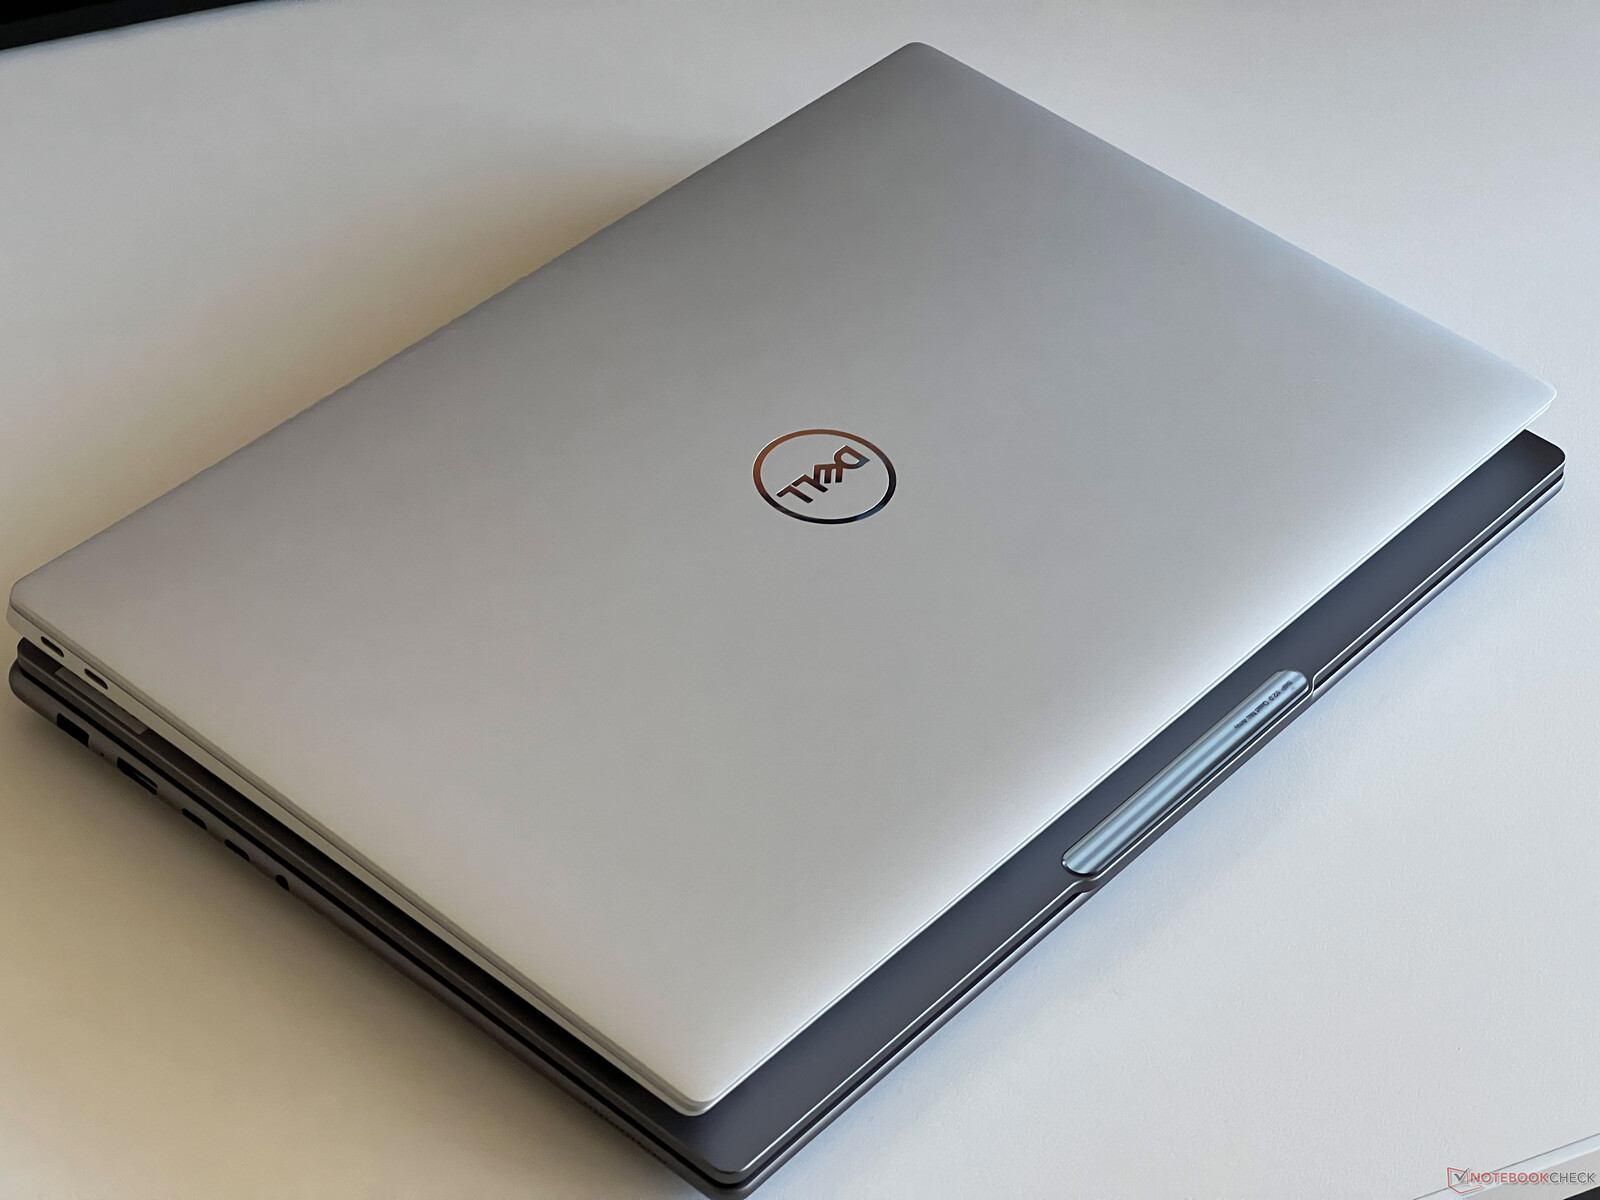
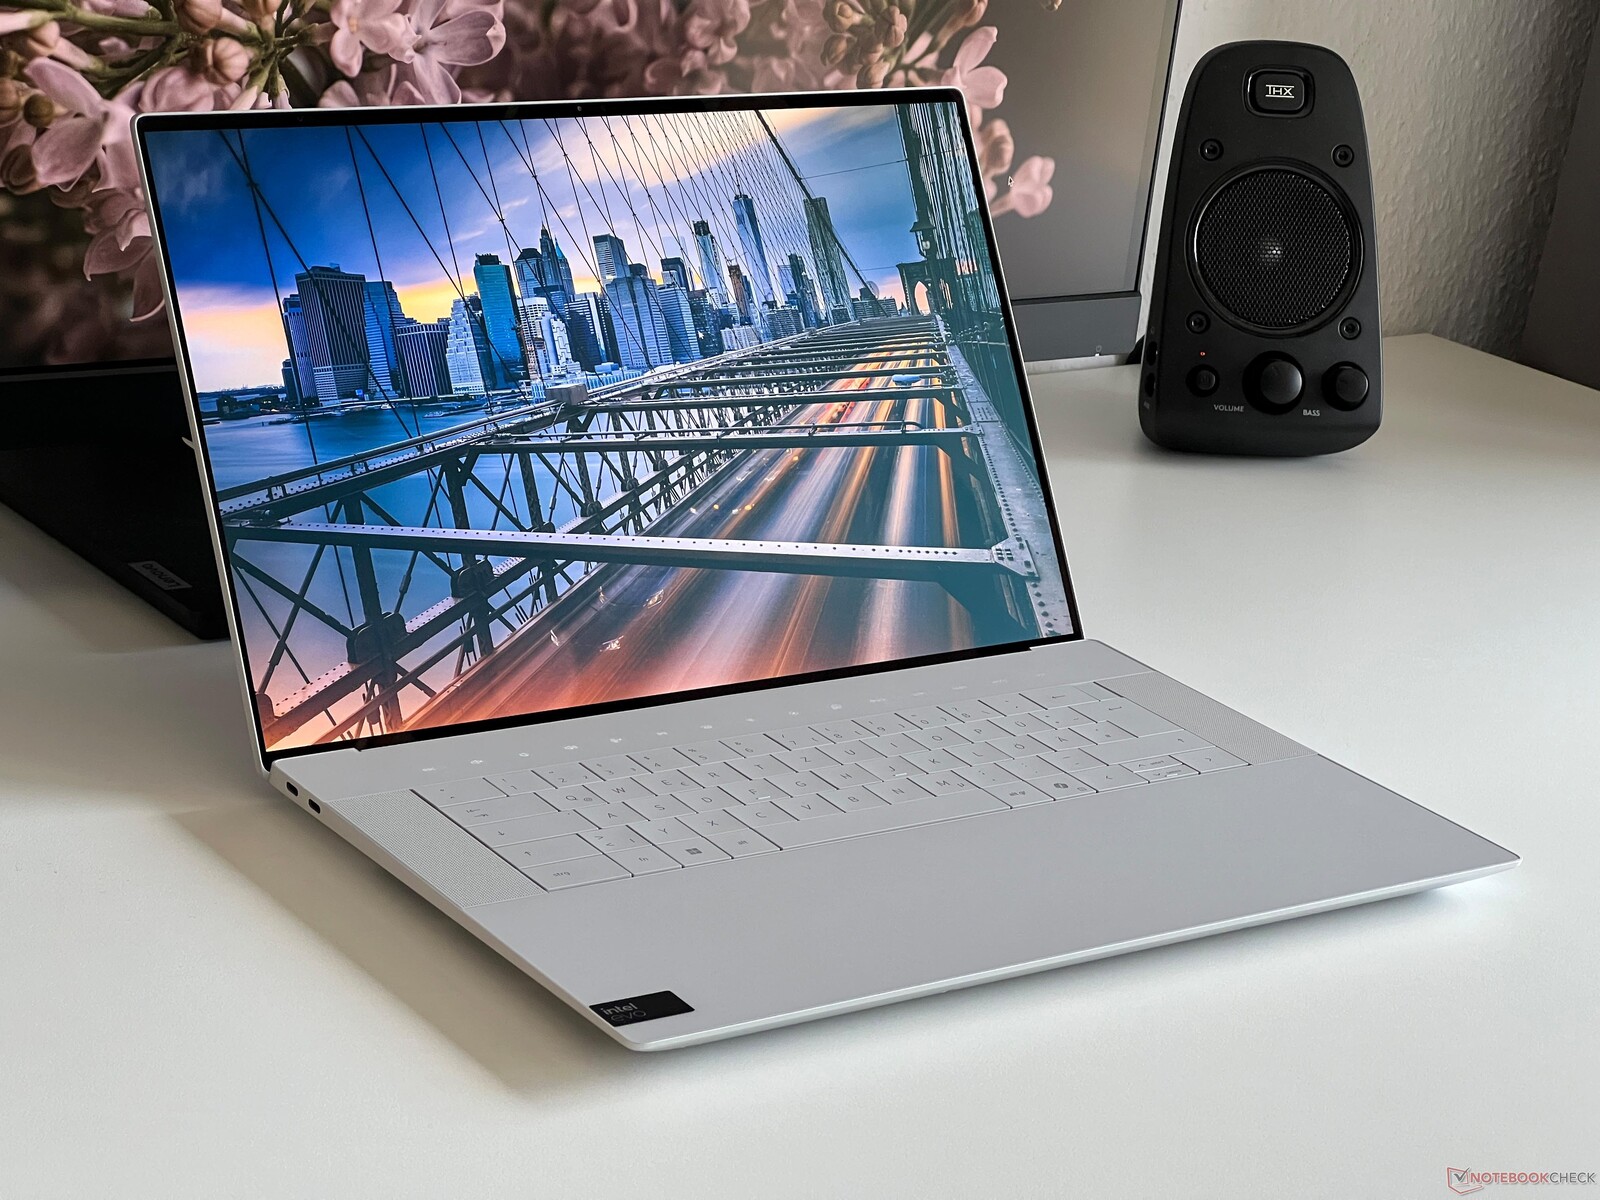
Custodia - Stabile custodia in alluminio
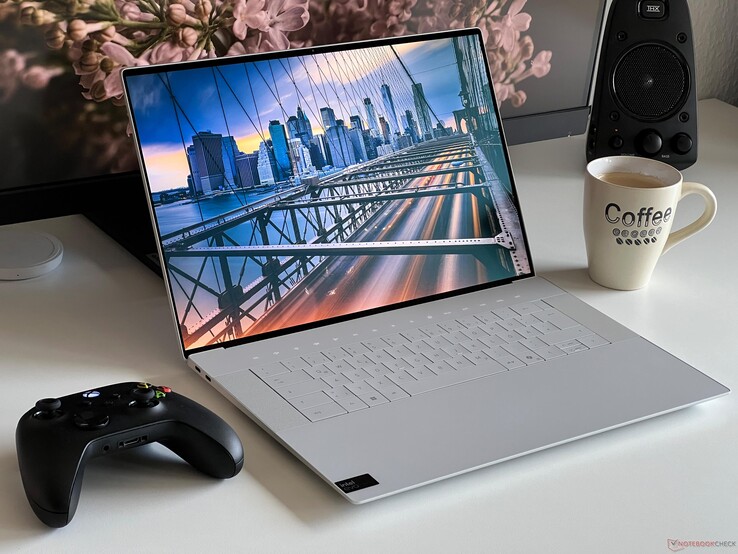
Dell ha utilizzato lo stesso design di base per tutte e tre le varianti dell'attuale serie XPS, ispirandosi al modello XPS 13 Plus XPS 13 Plus con il suo ampio poggiapolsi in vetro continuo e l'insolita tastiera con touch bar. Il design è attraente e, oltre alla nostra versione chiara, Dell offre anche una versione grigio scuro del portatile. Le sue cornici sono sottili su tutti e quattro i lati, con un aspetto moderno. Grazie al suo ingombro maggiore, l'XPS 16 non sembra così ingombrante come il più piccolo XPS 14 più piccolo XPS 14.
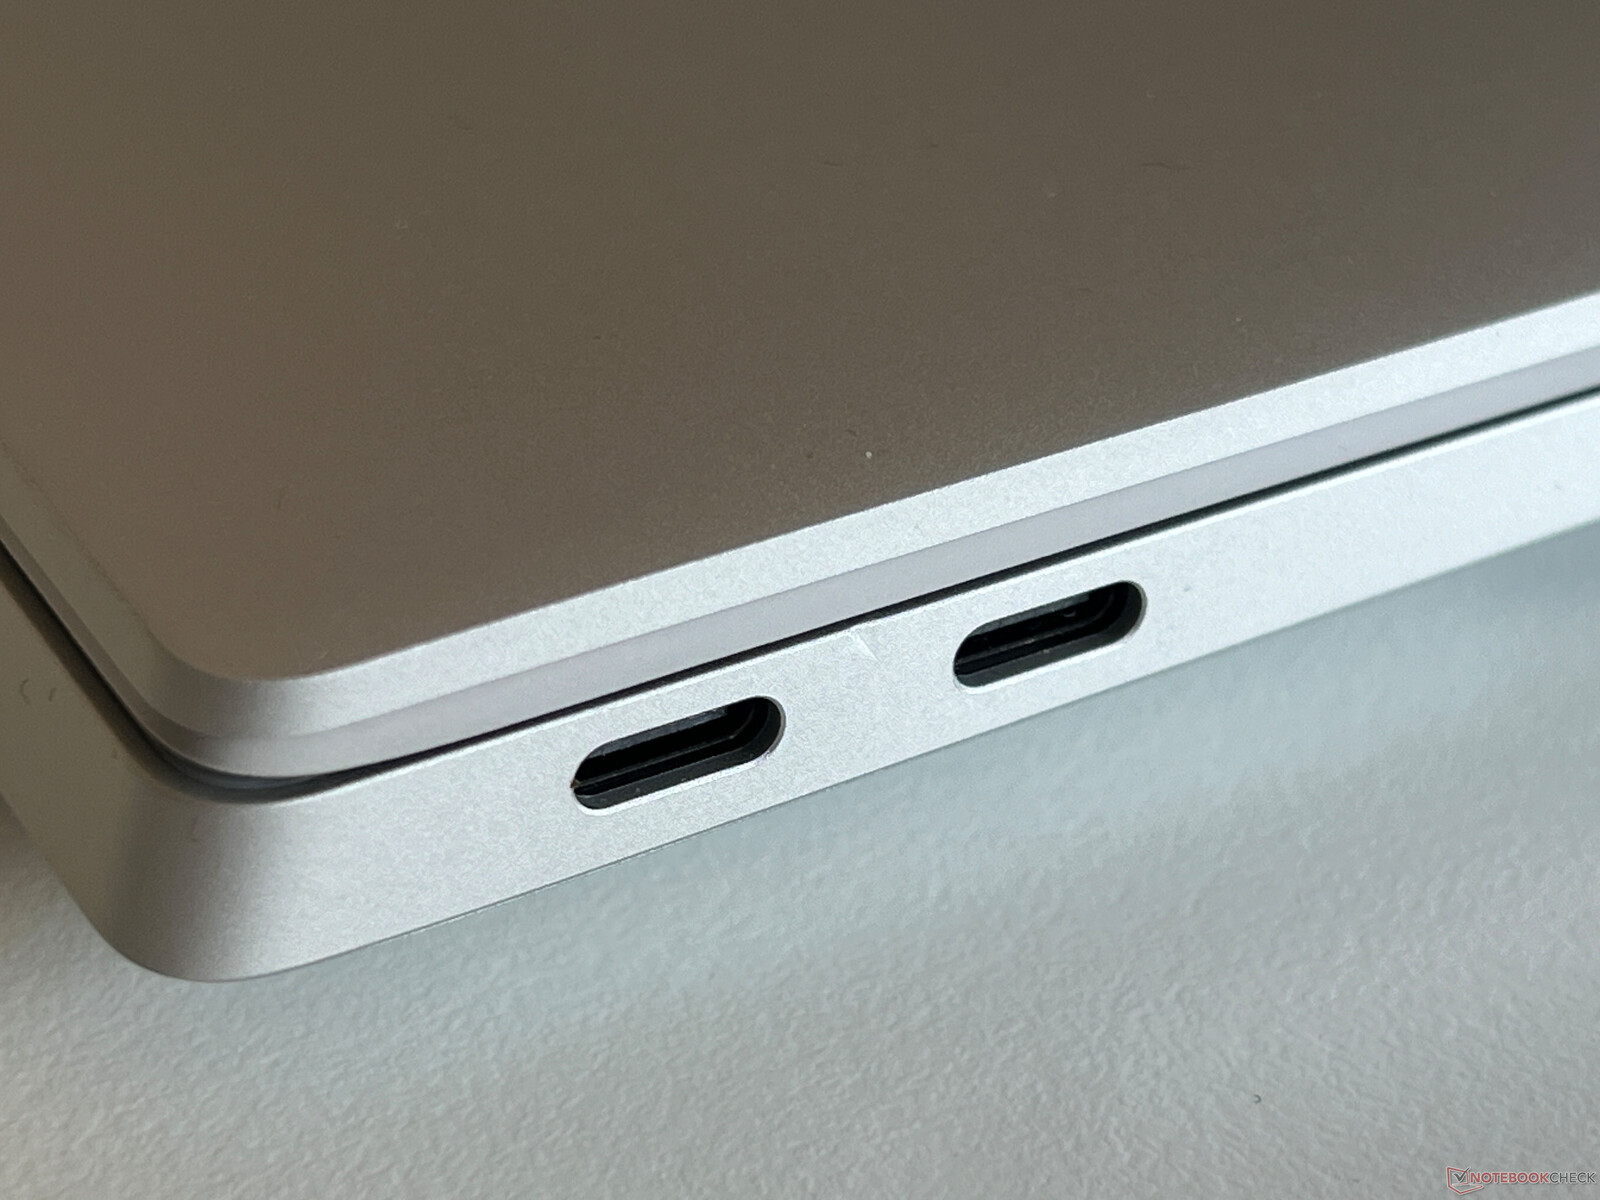
La custodia è molto robusta e in generale è costruita molto bene, tuttavia abbiamo notato un piccolo difetto tra le due porte USB-C sul lato sinistro del nostro dispositivo di prova. Anche lo schermo è molto stabile e il coperchio rimbalza solo leggermente quando si regola l'angolo di apertura (massimo 135 gradi). Tuttavia, a causa della forma del bordo anteriore, è difficile aprire il coperchio con una sola mano.
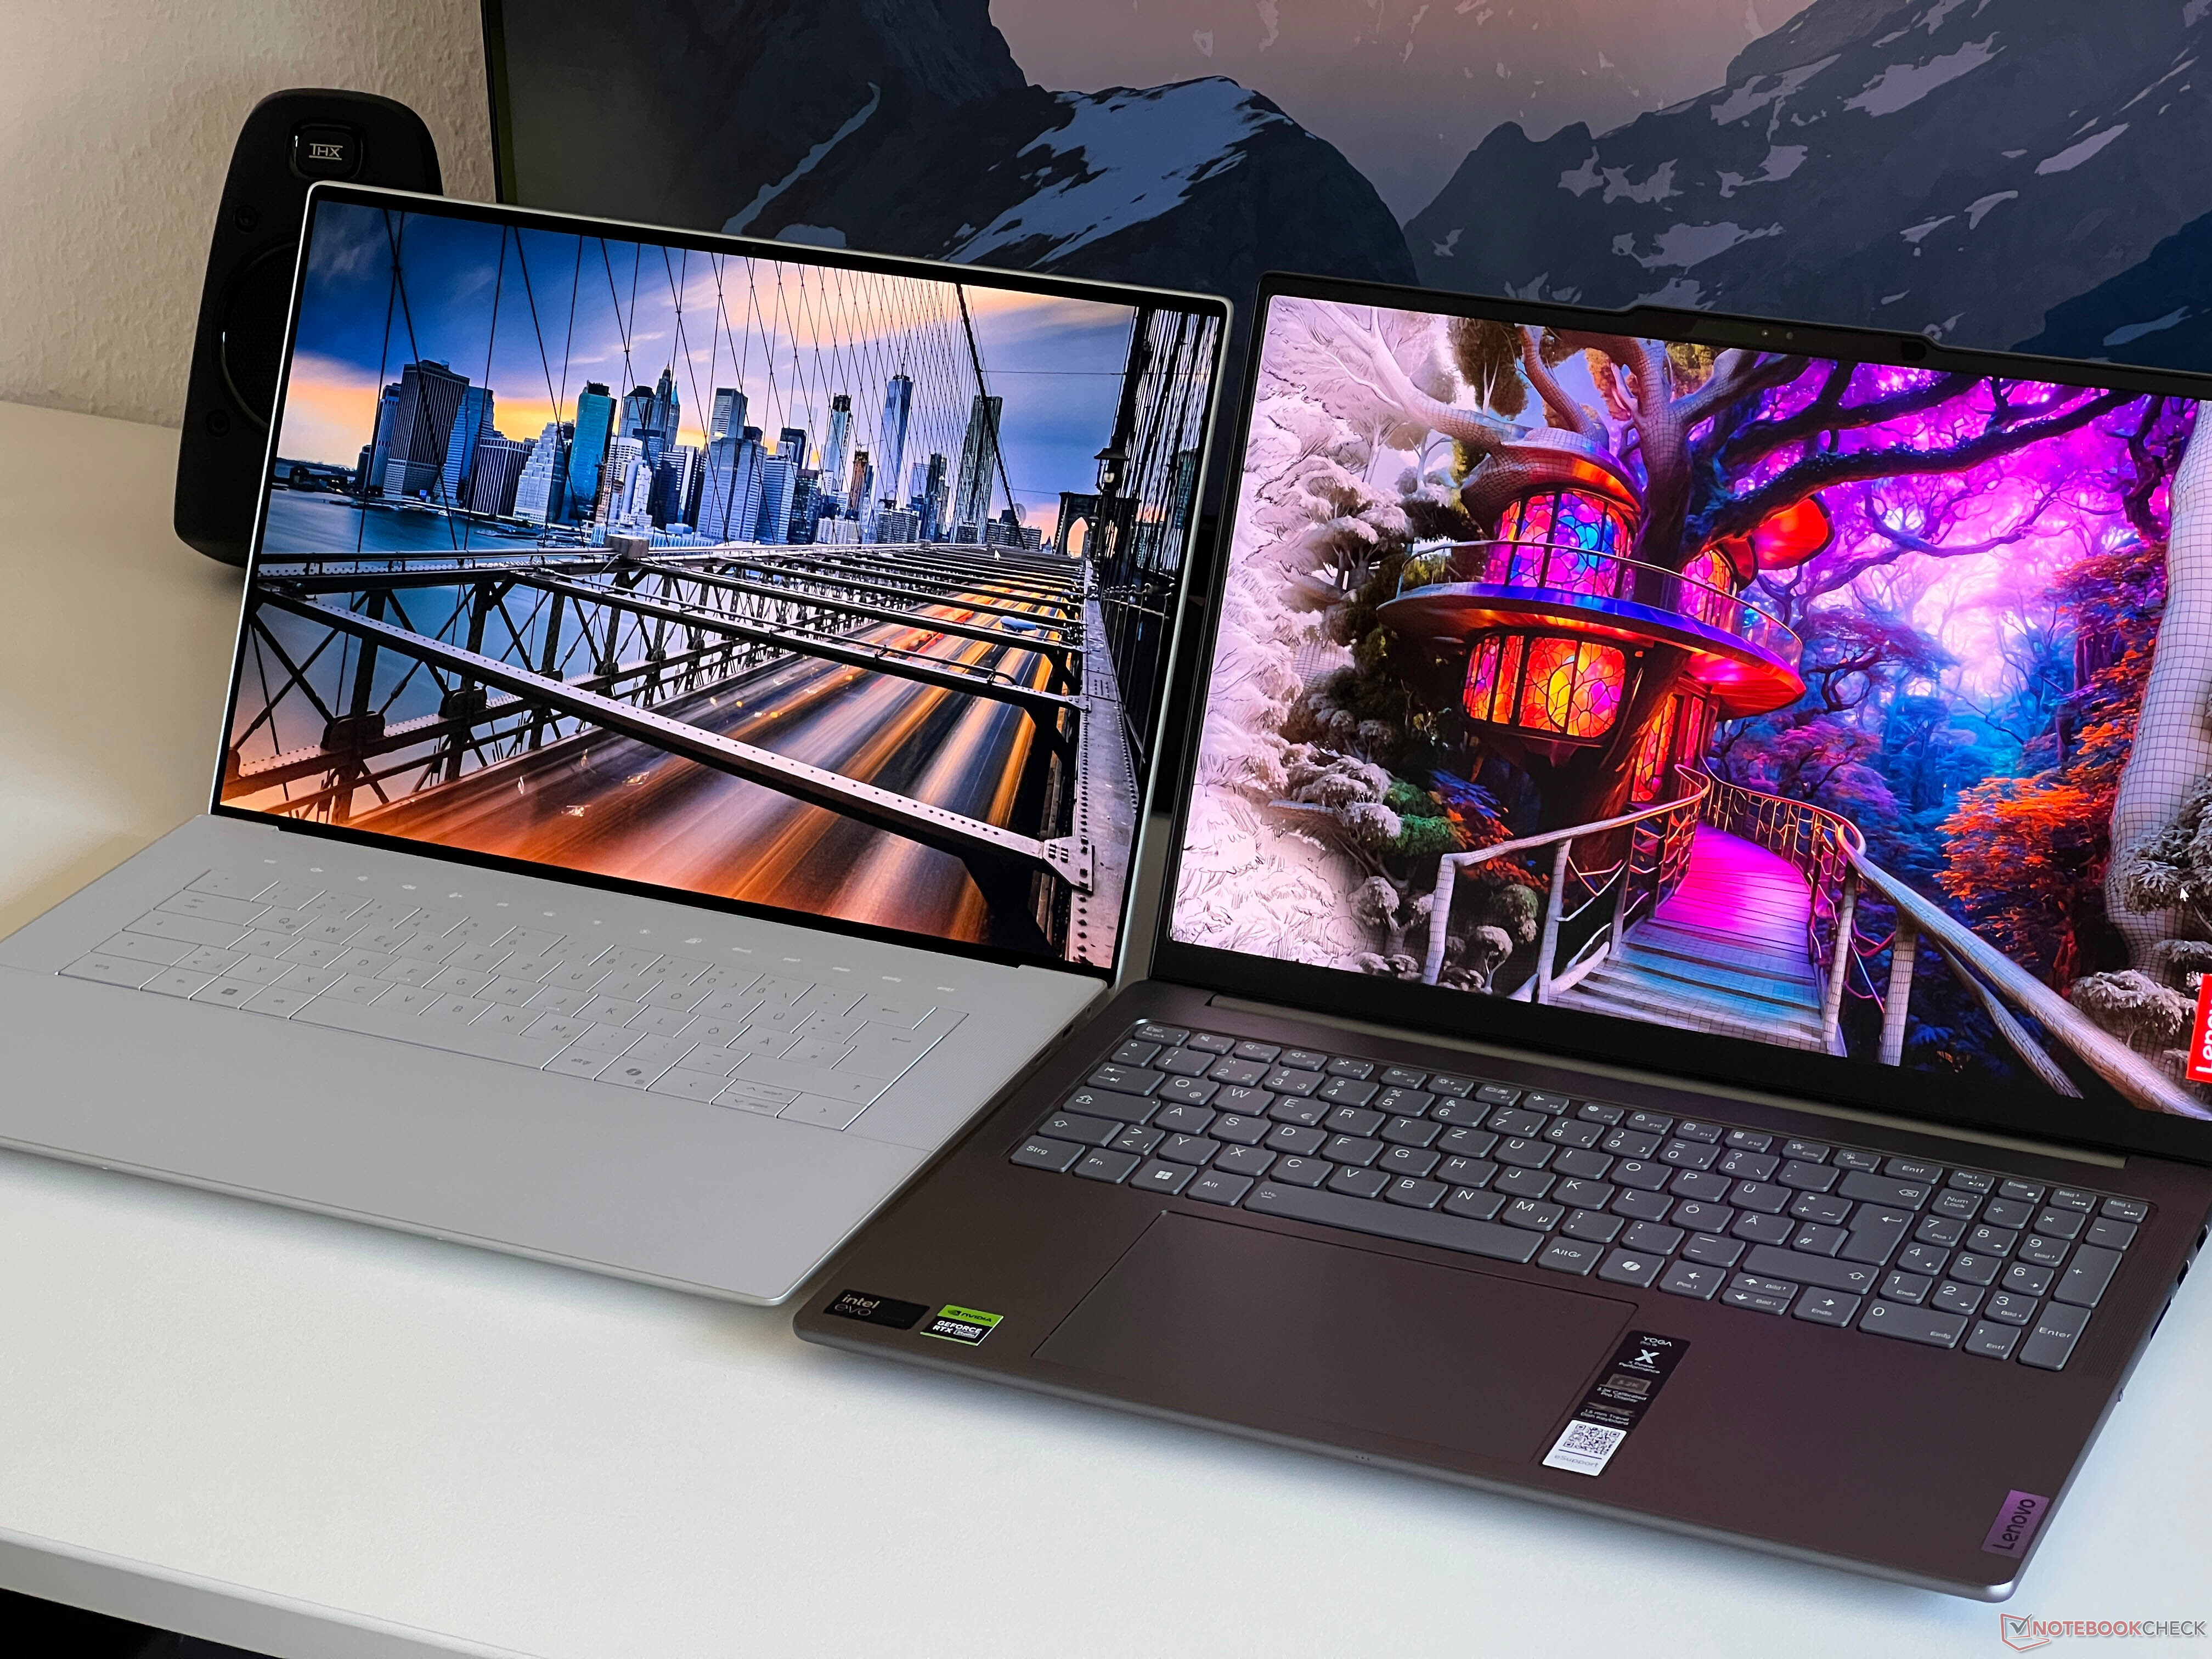
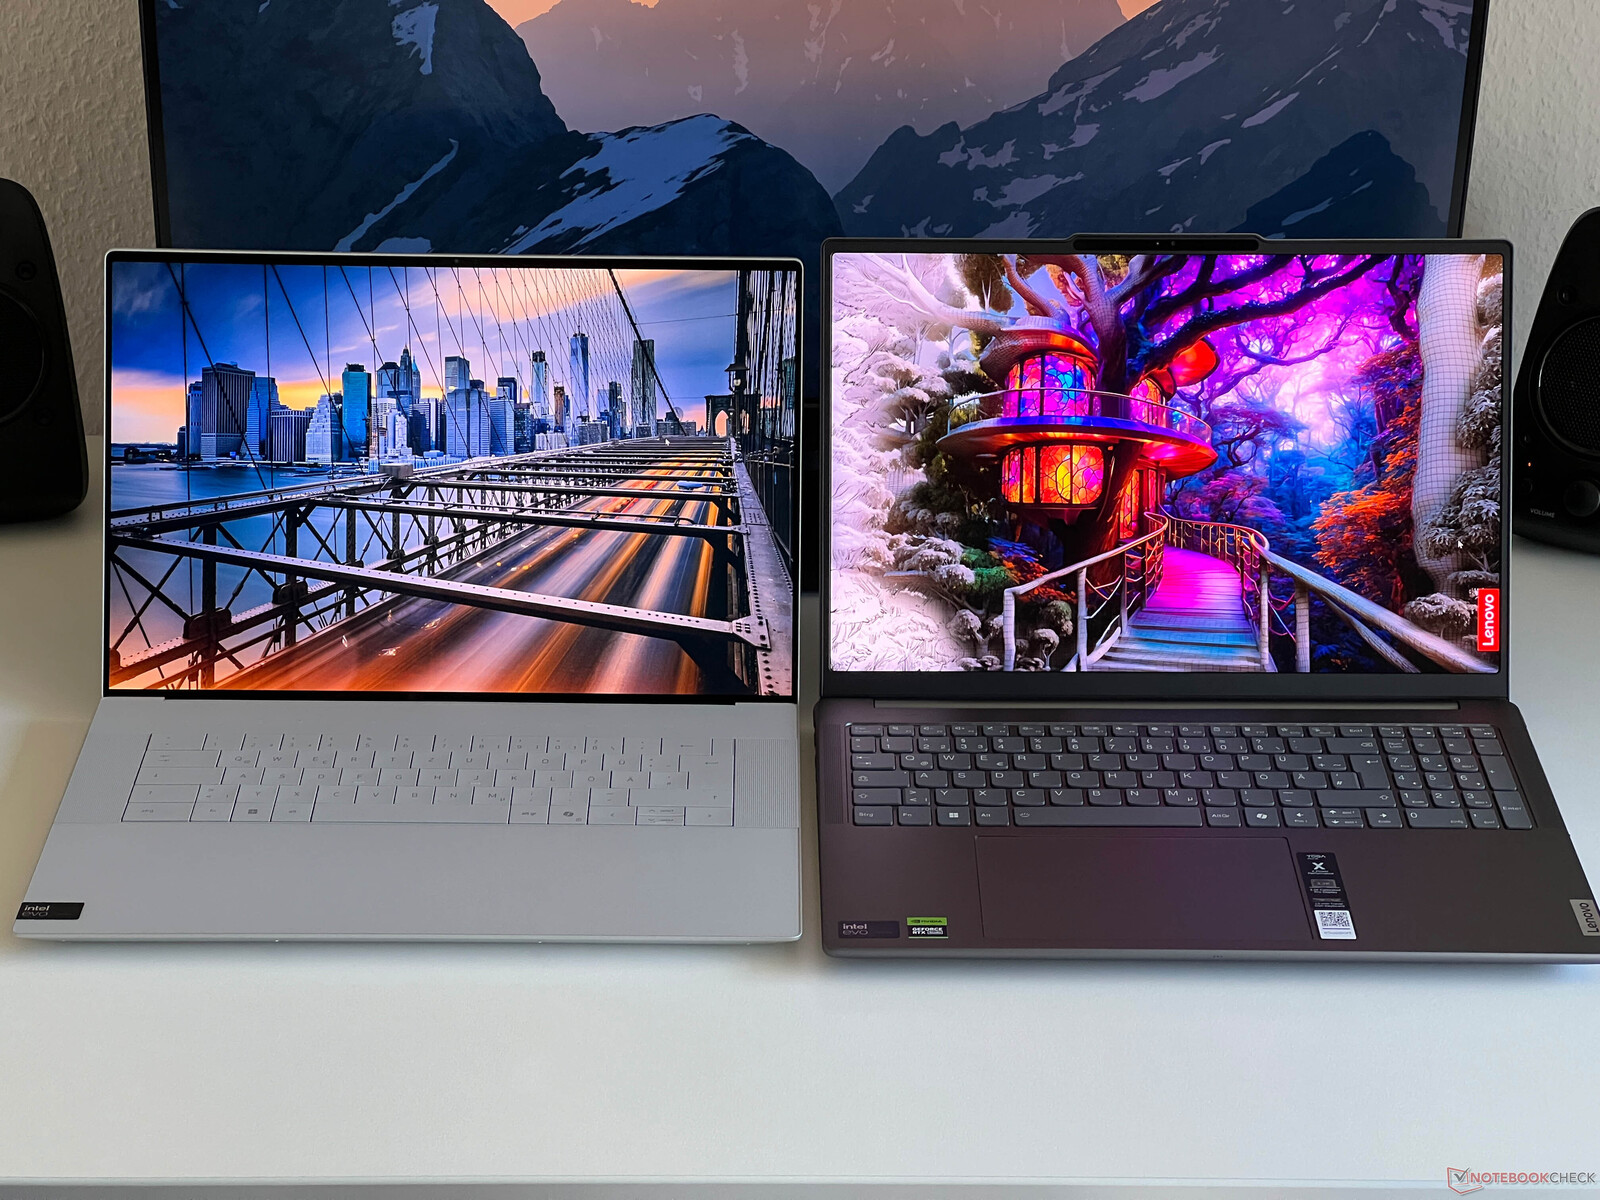
Come già accennato, il nuovo design del modello da 16 pollici ha un aspetto più gradevole rispetto all'XPS 14 e non ci sono grandi differenze rispetto alla concorrenza, soprattutto in termini di ingombro e di spessore del case. Rispetto all'attuale Yoga Pro 9 16 2024 (vedere le immagini di confronto qui sotto), l'XPS beneficia di cornici più sottili. Tuttavia, con i suoi 2,313 kg, l'XPS 16 è ancora il dispositivo più pesante del nostro gruppo di confronto.
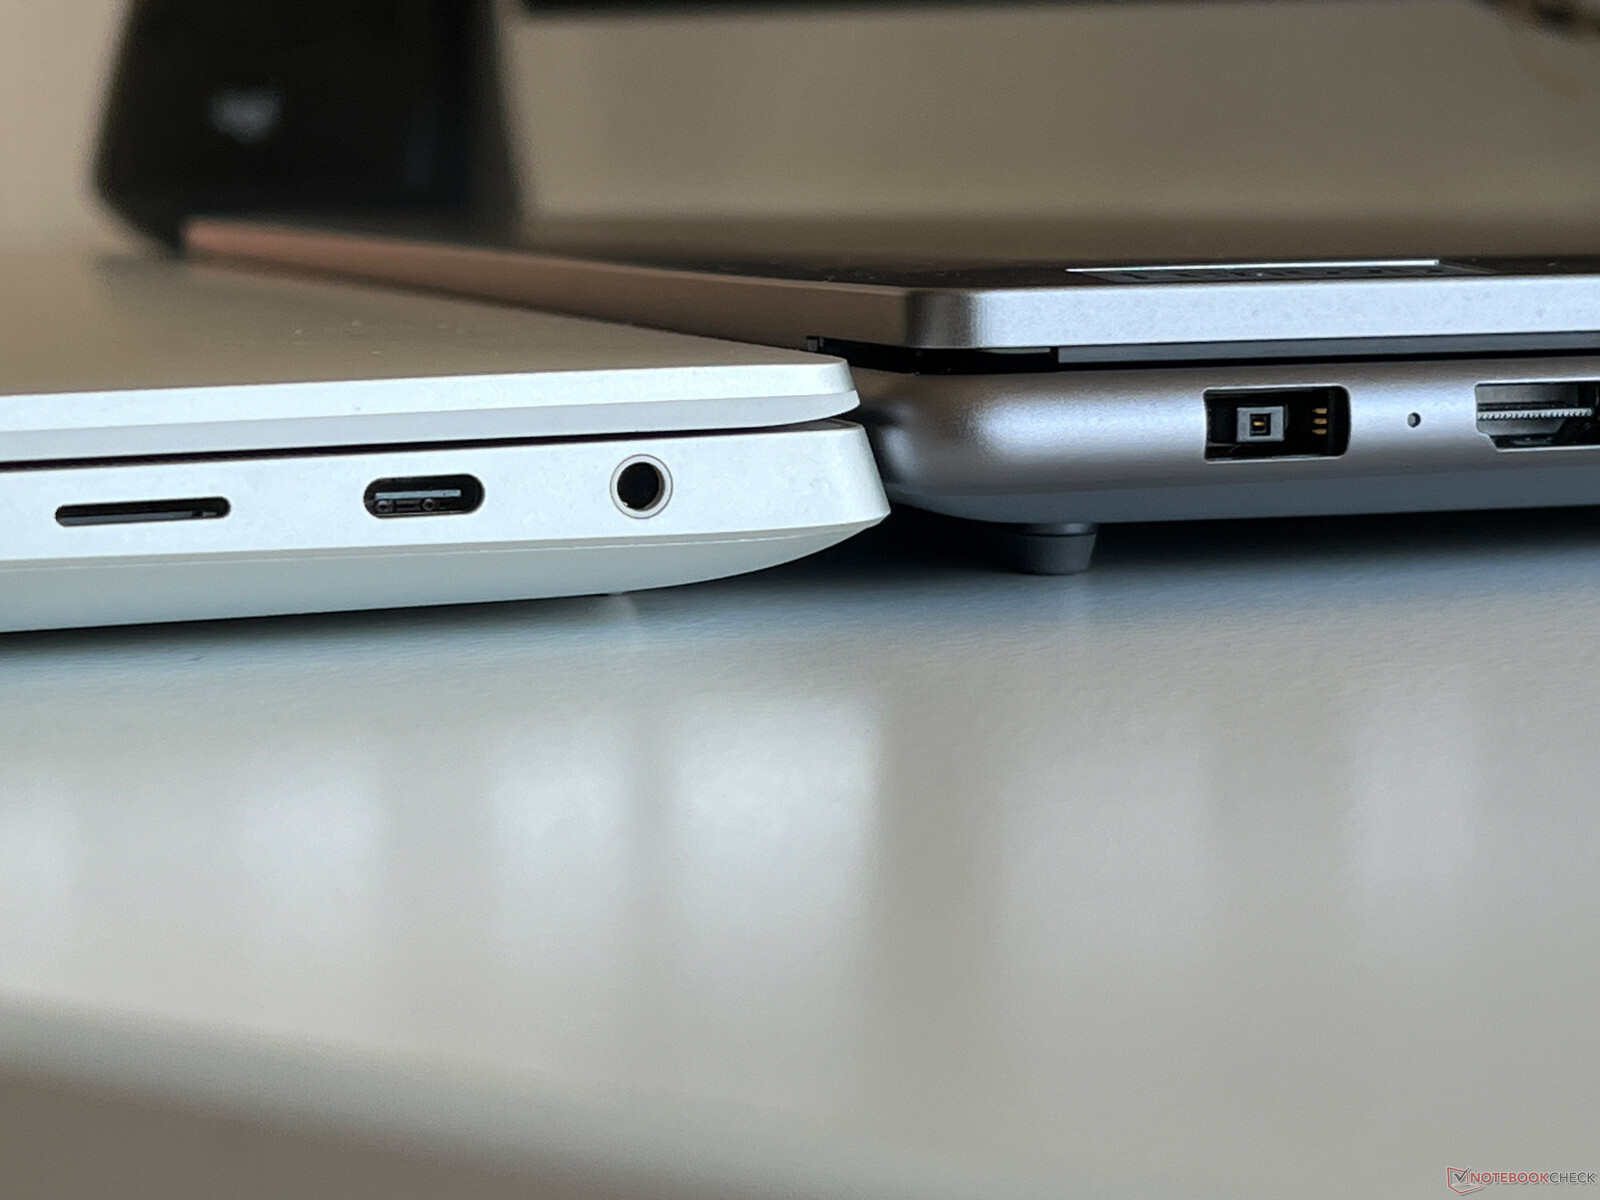
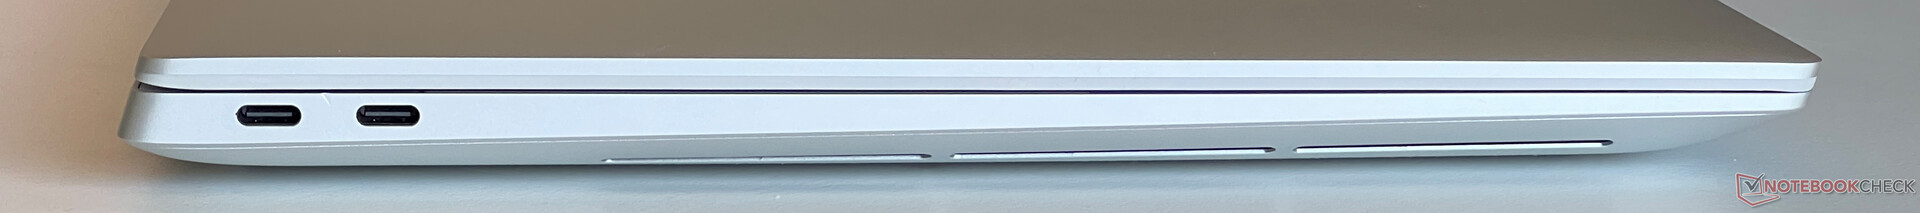
Connettività - Il più veloce XPS 16 solo con 2x Thunderbolt 4
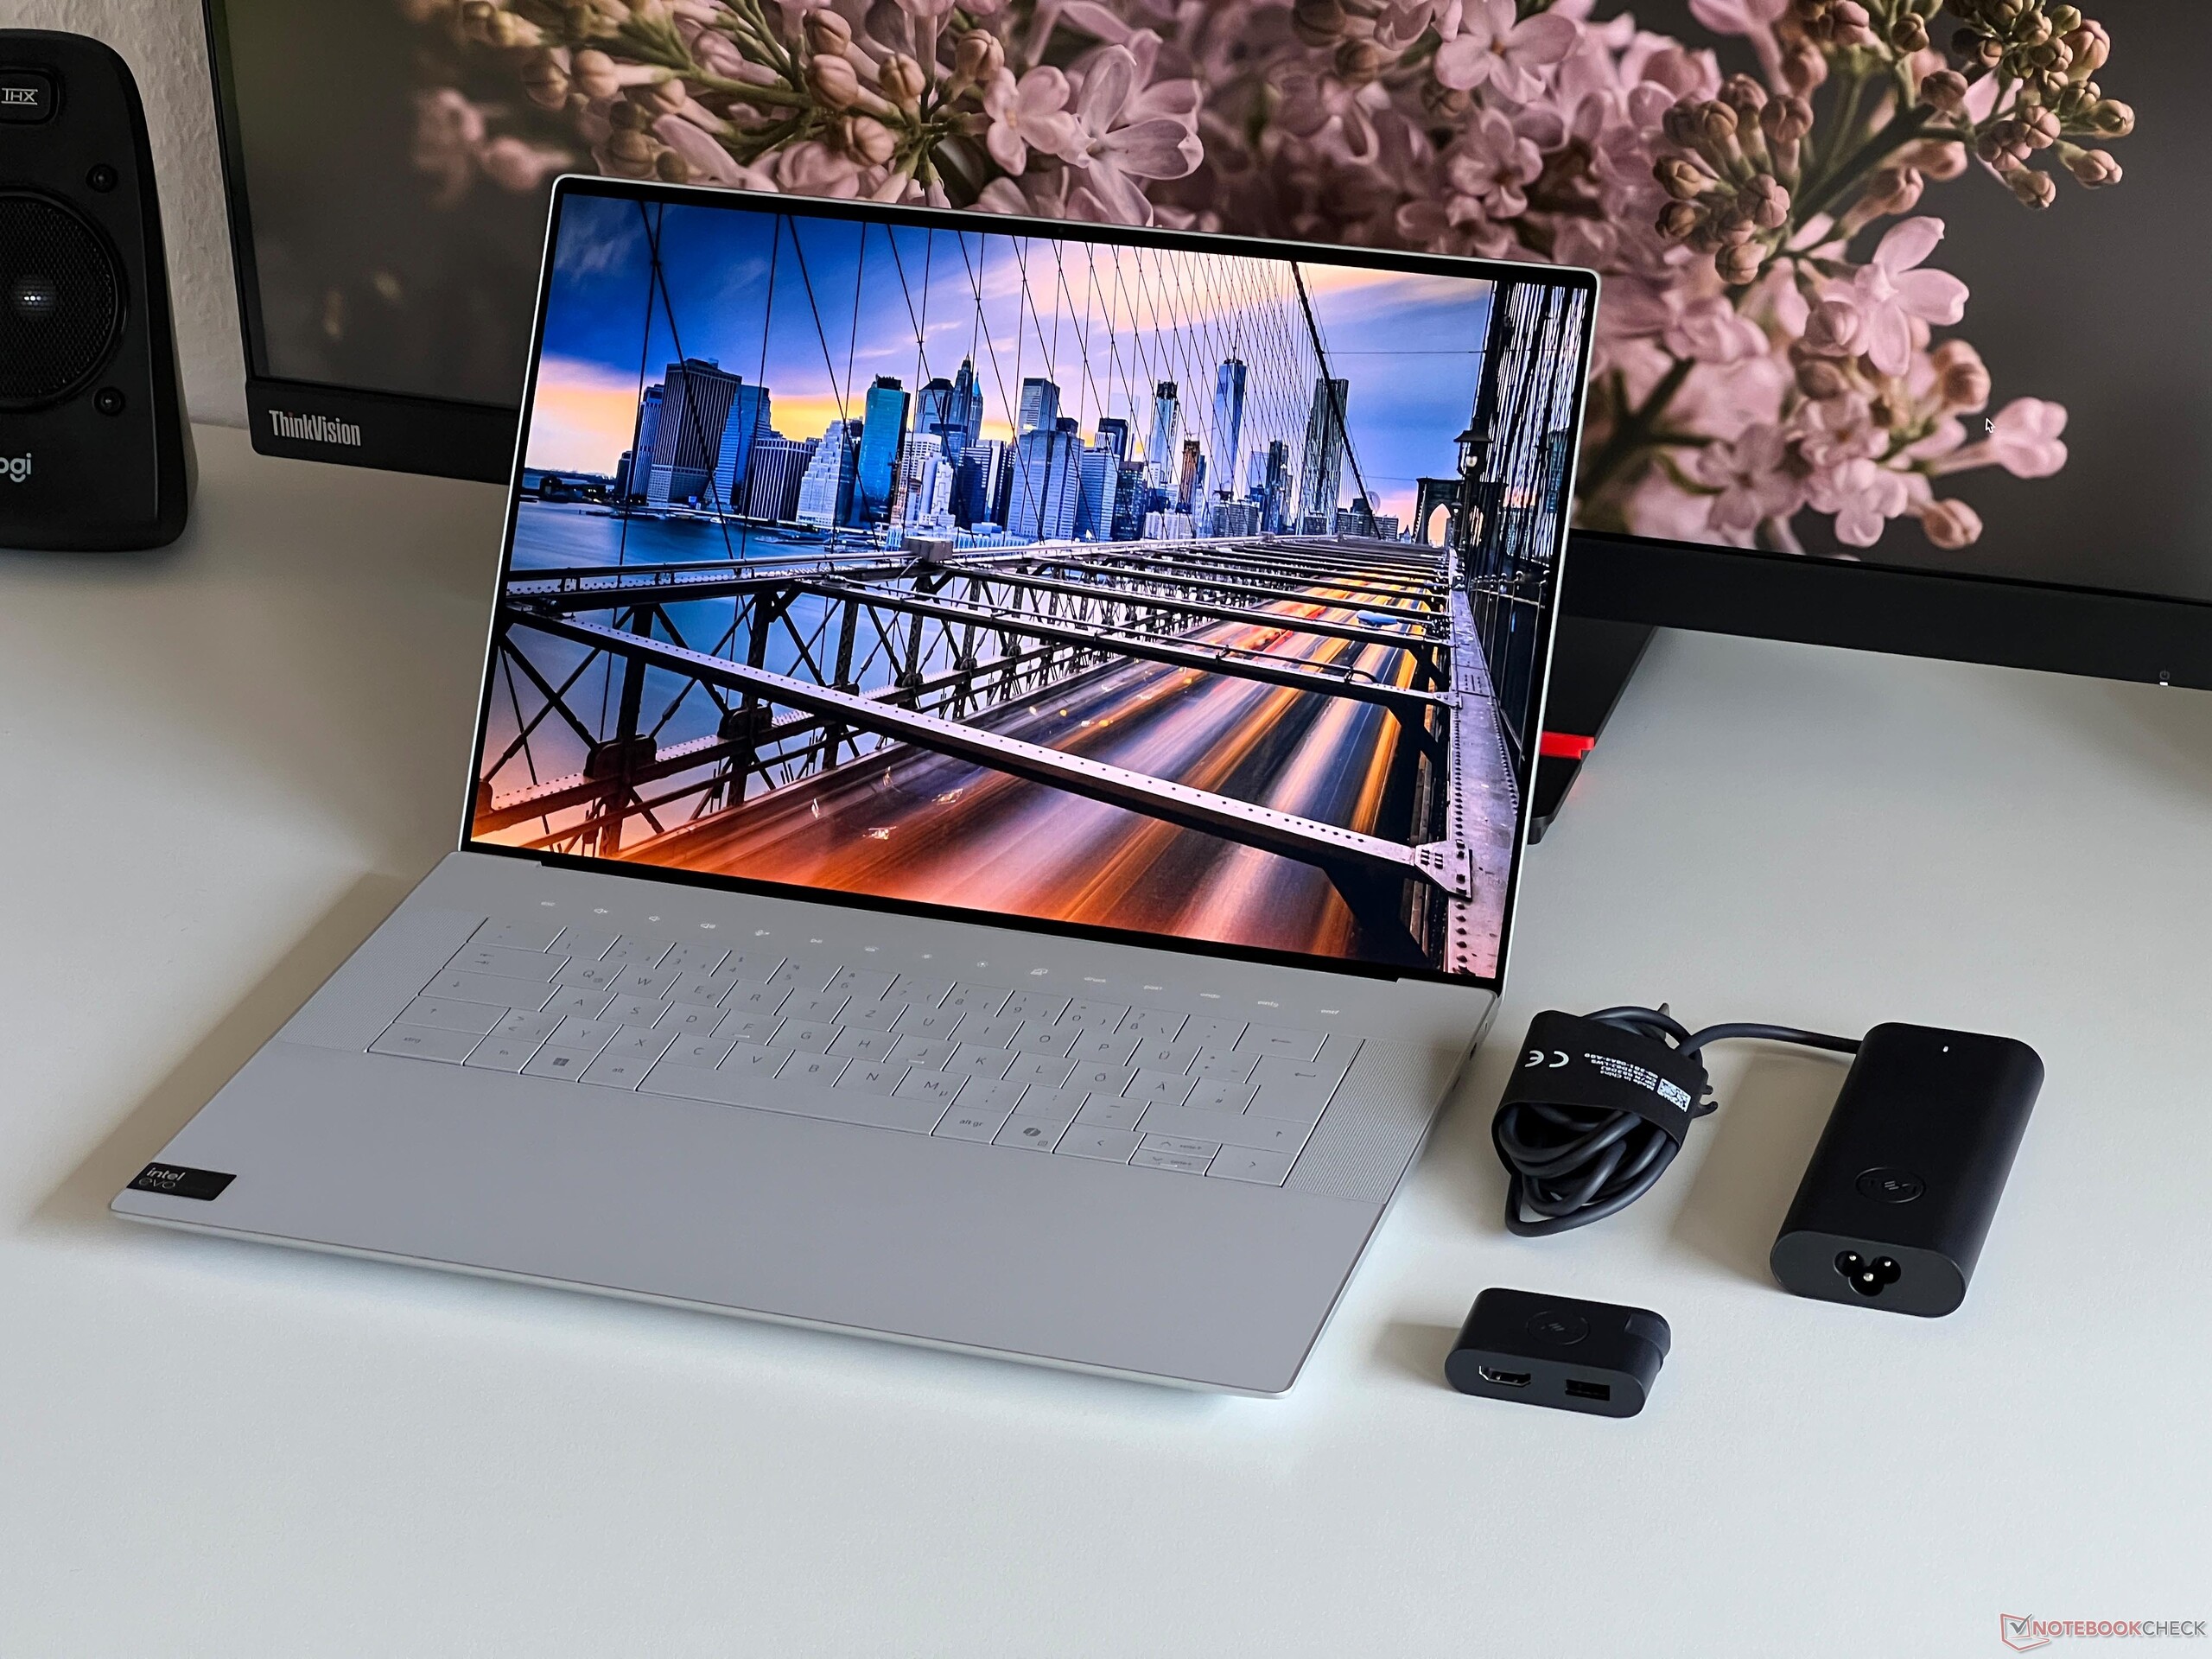
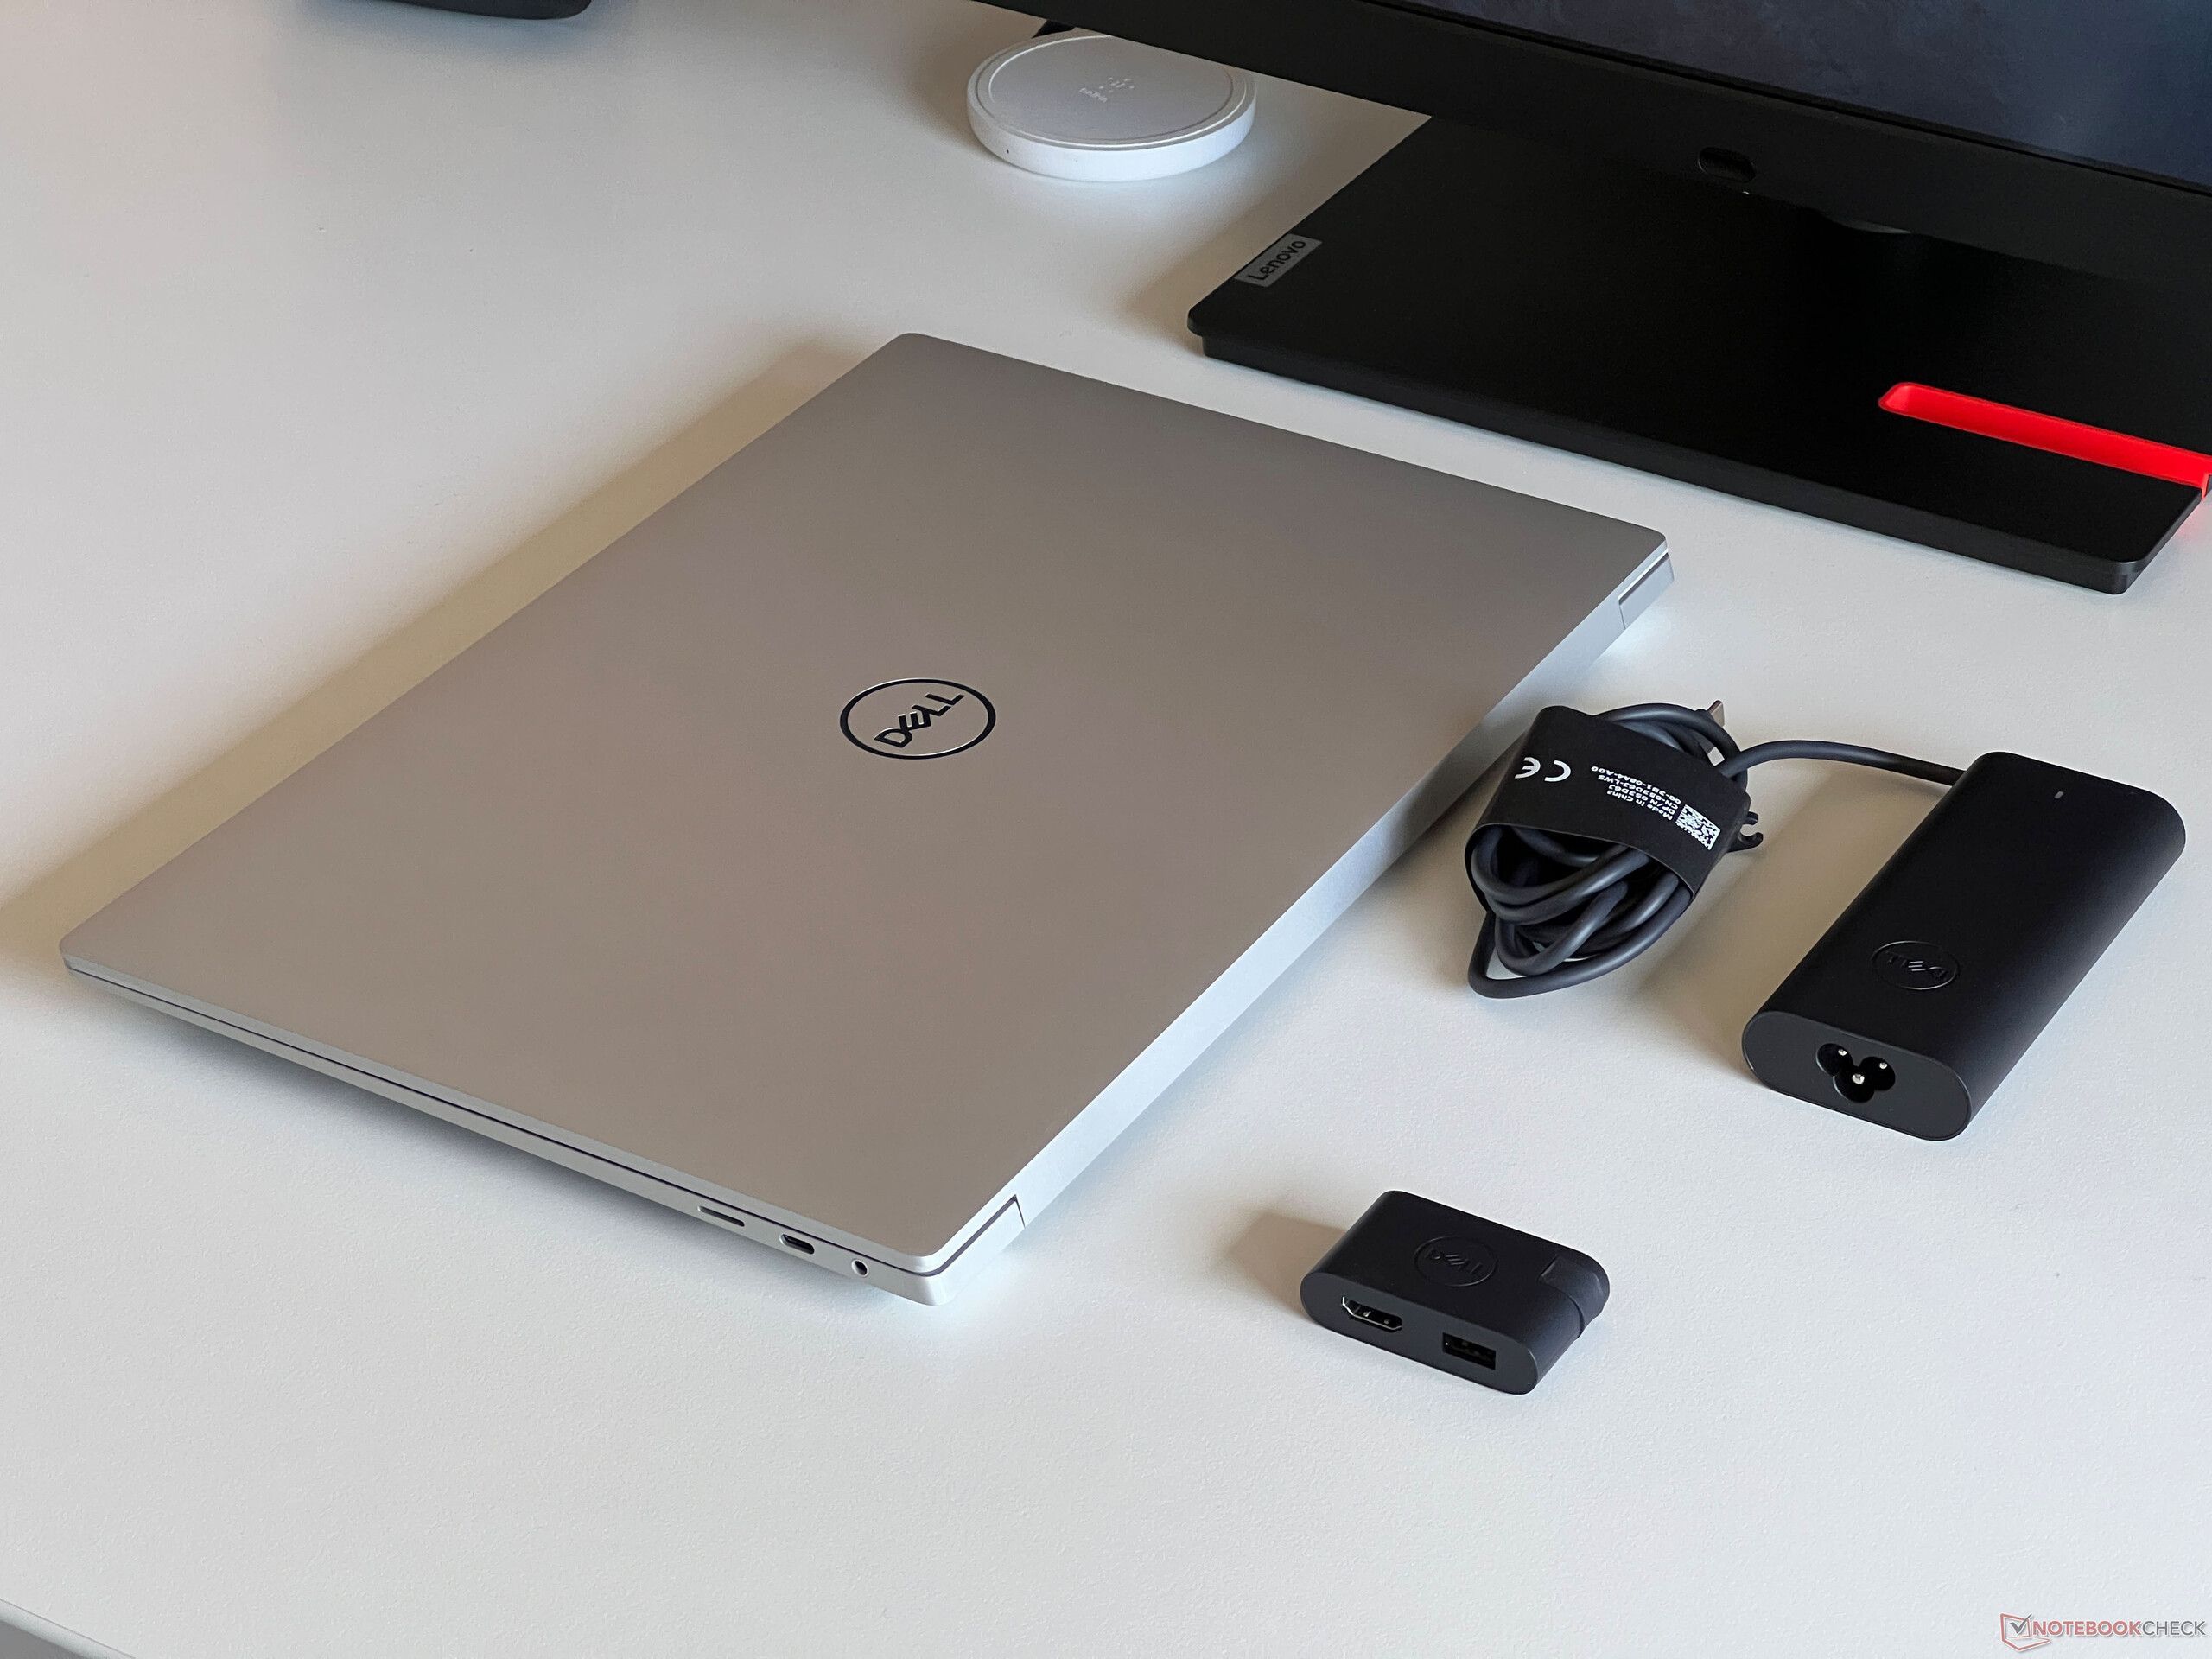
L'XPS 16 presenta le stesse opzioni di connettività del più piccolo XPS 14con Dell che lascia inutilizzato lo spazio aggiuntivo. Ci sono in totale 3 porte USB-C e un lettore di schede, e questo è tutto. A peggiorare le cose, solo le due porte sul lato sinistro dei modelli con la veloce RTX 4070 supportano Thunderbolt 4, mentre sul lato destro è supportata solo la porta USB-C 3.2 Gen 2. Al contrario, tutte e tre le porte delle varianti più lente supportano la Thunderbolt 4. Inoltre, tutte le uscite USB-C sono collegate tramite l'iGPU. La fornitura comprende anche una piccola docking station con una porta USB-A e un'uscita HDMI.
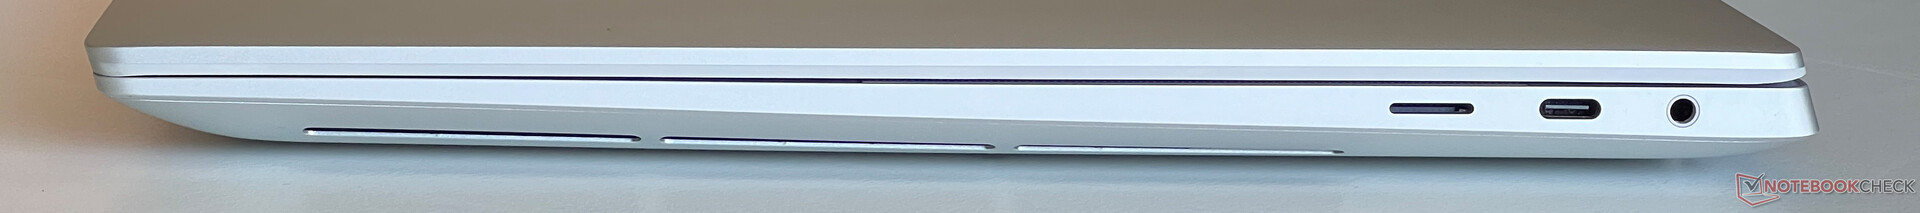
Lettore di schede SD
Il lettore di schede microSD (meccanismo a molla) si trova sul lato destro del dispositivo e accoglie quasi completamente le schede di memoria compatte. In combinazione con la nostra scheda di riferimento (Angelbird AV Pro V60), le sue velocità di trasferimento hanno raggiunto un massimo di circa 204 MB/s e durante la copia di file di immagini, abbiamo misurato ben 148 MB/s.
| SD Card Reader | |
| average JPG Copy Test (av. of 3 runs) | |
| Dell XPS 15 9530 RTX 4070 (Toshiba Exceria Pro SDXC 64 GB UHS-II) | |
| Dell XPS 16 9640 (Angelbird AV Pro V60) | |
| Media della classe Multimedia (23 - 531, n=40, ultimi 2 anni) | |
| Samsung Galaxy Book4 Ultra (Angelbird AV Pro V60) | |
| Asus ROG Zephyrus G16 2024 GU605M | |
| Lenovo Yoga Pro 9 16-IRP G8 (Angelibird AV Pro V60) | |
| Schenker VISION 16 Pro (M23) (Angelbird AV Pro V60) | |
| maximum AS SSD Seq Read Test (1GB) | |
| Dell XPS 16 9640 (Angelbird AV Pro V60) | |
| Media della classe Multimedia (37.3 - 1455, n=39, ultimi 2 anni) | |
| Dell XPS 15 9530 RTX 4070 (Toshiba Exceria Pro SDXC 64 GB UHS-II) | |
| Asus ROG Zephyrus G16 2024 GU605M | |
| Samsung Galaxy Book4 Ultra (Angelbird AV Pro V60) | |
| Lenovo Yoga Pro 9 16-IRP G8 (Angelibird AV Pro V60) | |
| Schenker VISION 16 Pro (M23) (Angelbird AV Pro V60) | |
Comunicazione
In contrasto con il più piccolo XPS 14dell ha installato un modulo Wi-Fi-7 di Intel nell'XPS 16. Supporta anche il Bluetooth 5.4. Non possiamo ancora testare le prestazioni del suo Wi-Fi 7, ma in combinazione con il nostro router di riferimento di Asus, le sue prestazioni erano leggermente peggiori rispetto, ad esempio, all'XPS 14 con il suo modulo Wi-Fi 6E. Tuttavia, non dovrebbe notare alcuna limitazione e nel corso del nostro test non abbiamo notato alcun problema di connessione.
| Networking | |
| Dell XPS 16 9640 | |
| iperf3 transmit AXE11000 | |
| iperf3 receive AXE11000 | |
| Samsung Galaxy Book4 Ultra | |
| iperf3 transmit AXE11000 | |
| iperf3 receive AXE11000 | |
| Honor MagicBook Pro 16 2024 | |
| iperf3 transmit AXE11000 | |
| iperf3 receive AXE11000 | |
| Asus ROG Zephyrus G16 2024 GU605M | |
| iperf3 transmit AXE11000 | |
| iperf3 receive AXE11000 | |
| Lenovo Yoga Pro 9 16-IRP G8 | |
| iperf3 transmit AXE11000 | |
| iperf3 receive AXE11000 | |
| Schenker VISION 16 Pro (M23) | |
| iperf3 transmit AXE11000 | |
| iperf3 receive AXE11000 | |
| Dell XPS 15 9530 RTX 4070 | |
| iperf3 transmit AXE11000 | |
| iperf3 receive AXE11000 | |
Webcam
Dell ha installato una webcam da 1080p nella cornice del display superiore, oltre a una telecamera IR per il riconoscimento facciale tramite Windows Hello. La qualità della webcam è buona in condizioni di buona illuminazione. Inoltre, la fotocamera supporta gli effetti studio (soft focus dello sfondo, tracciamento degli occhi, inquadratura automatica) come parte del sistema operativo, il che significa che funziona indipendentemente dall'applicazione in uso.


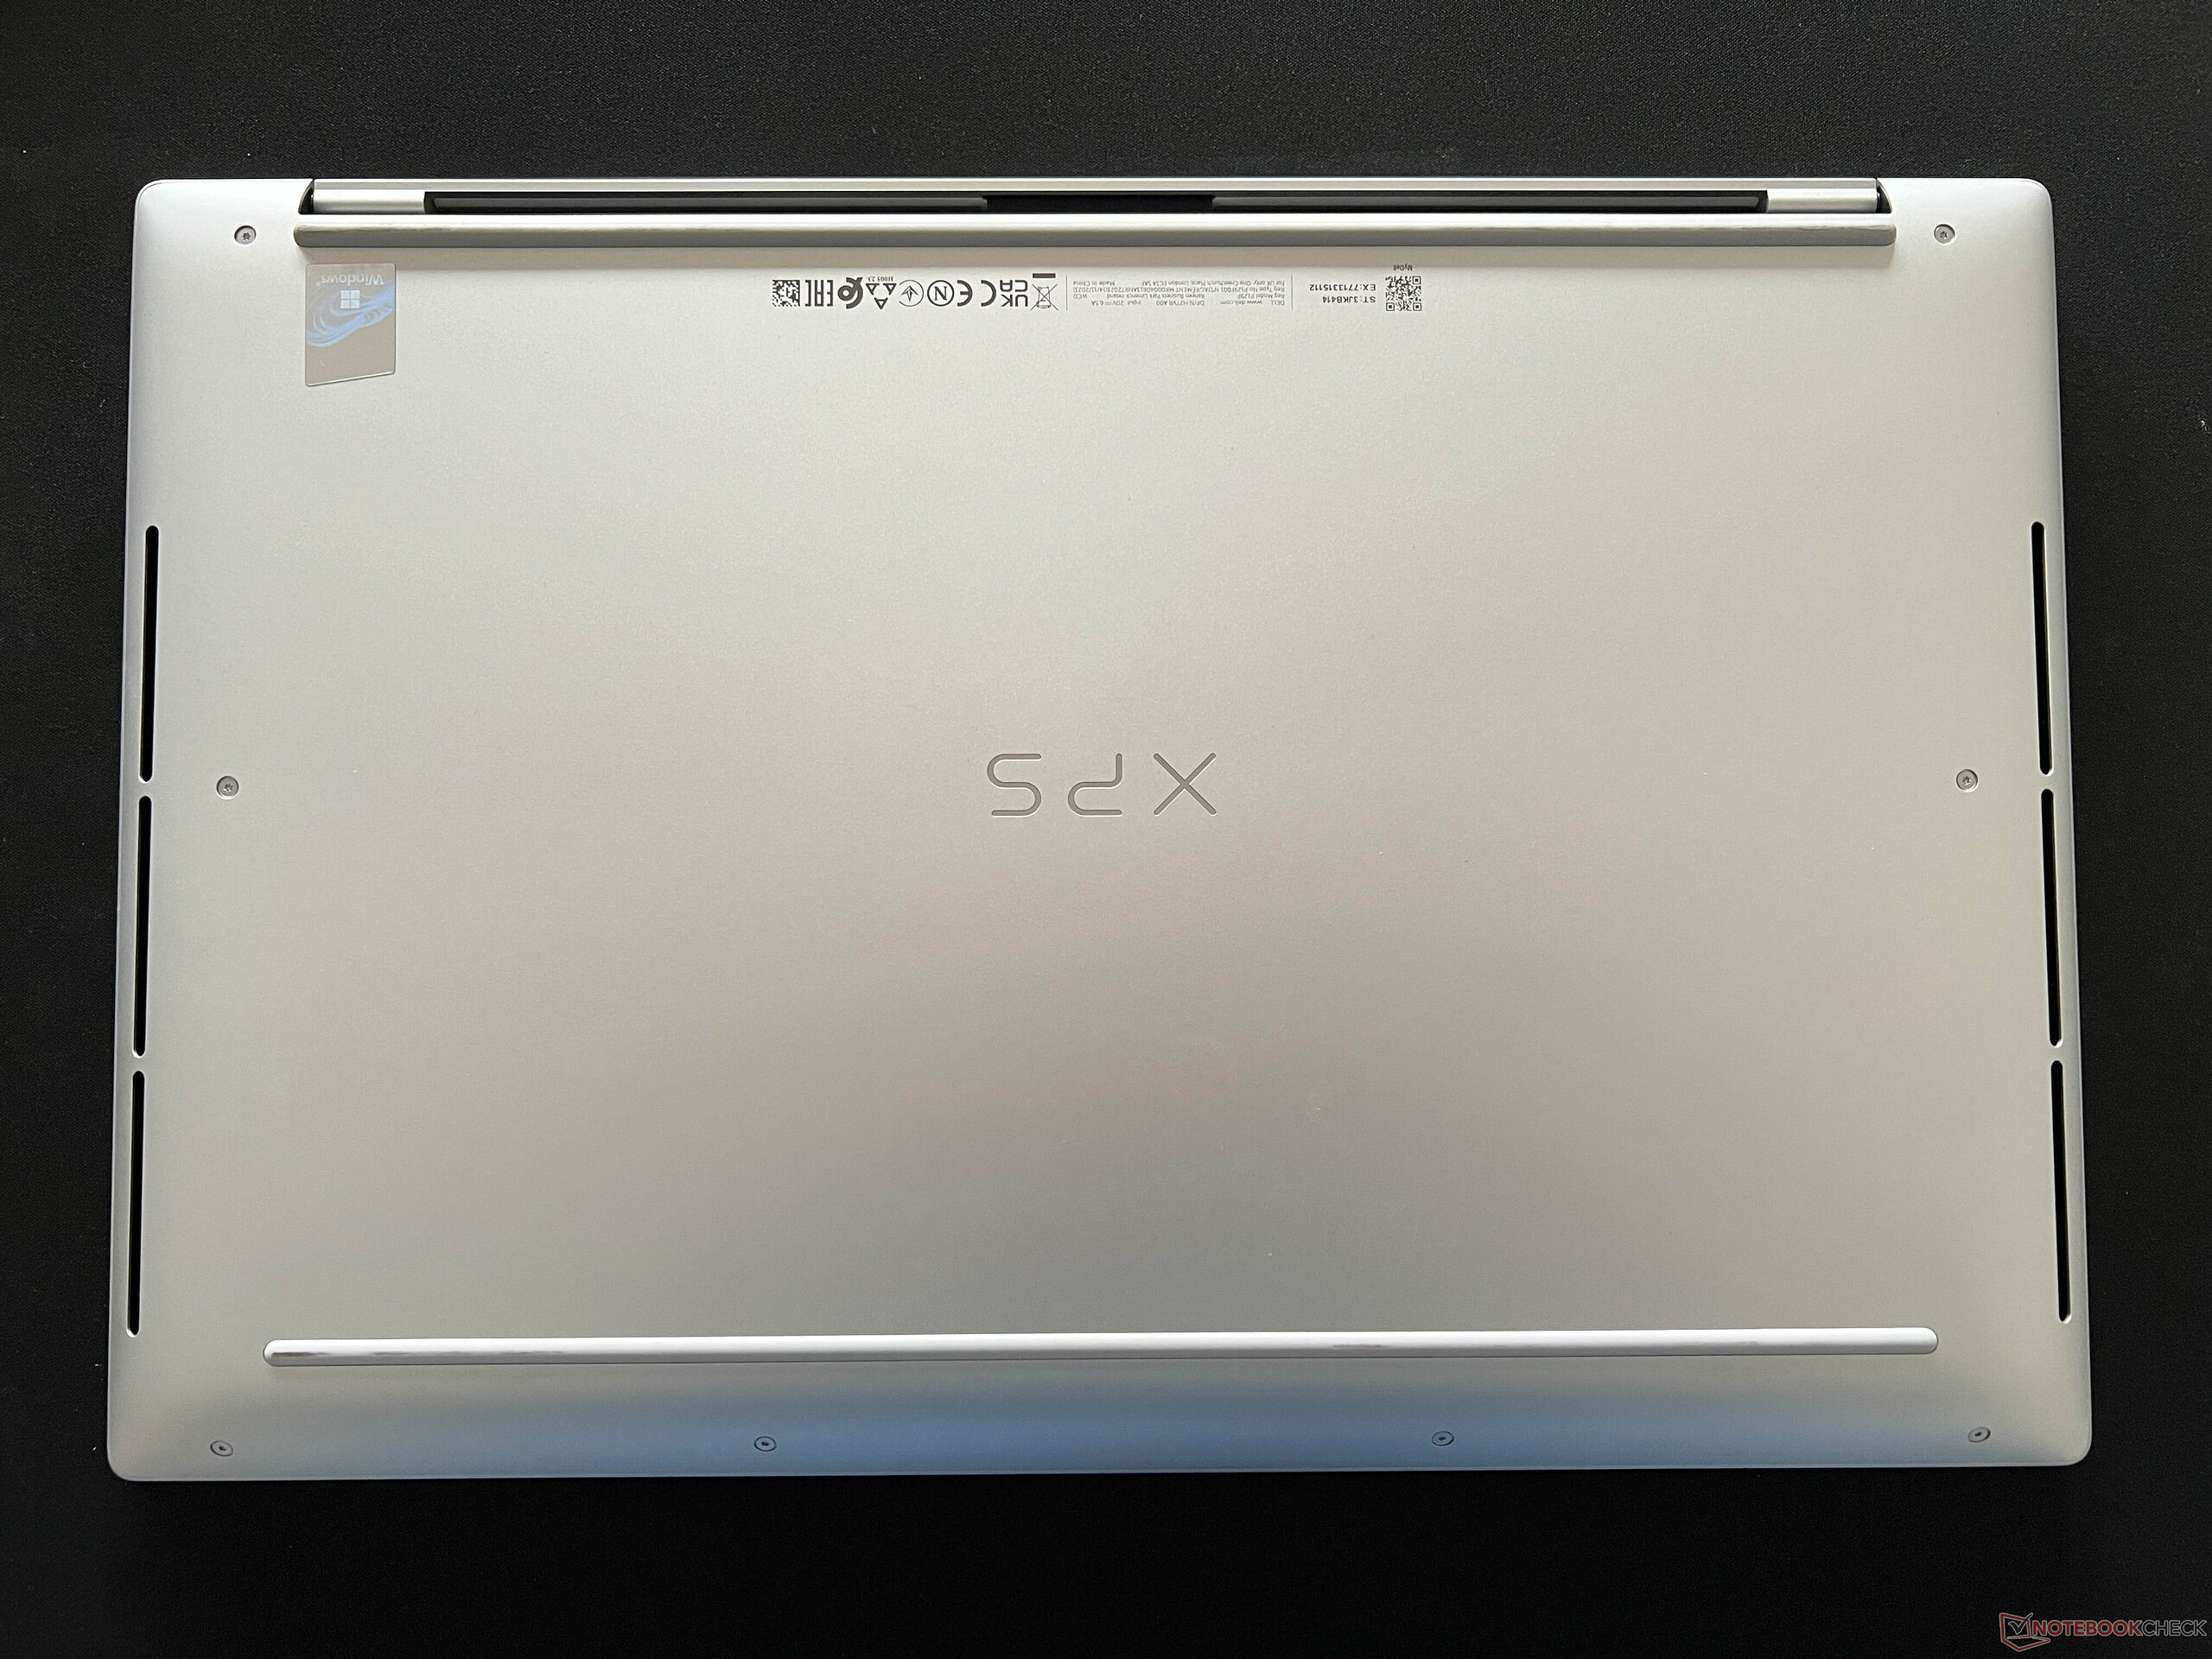
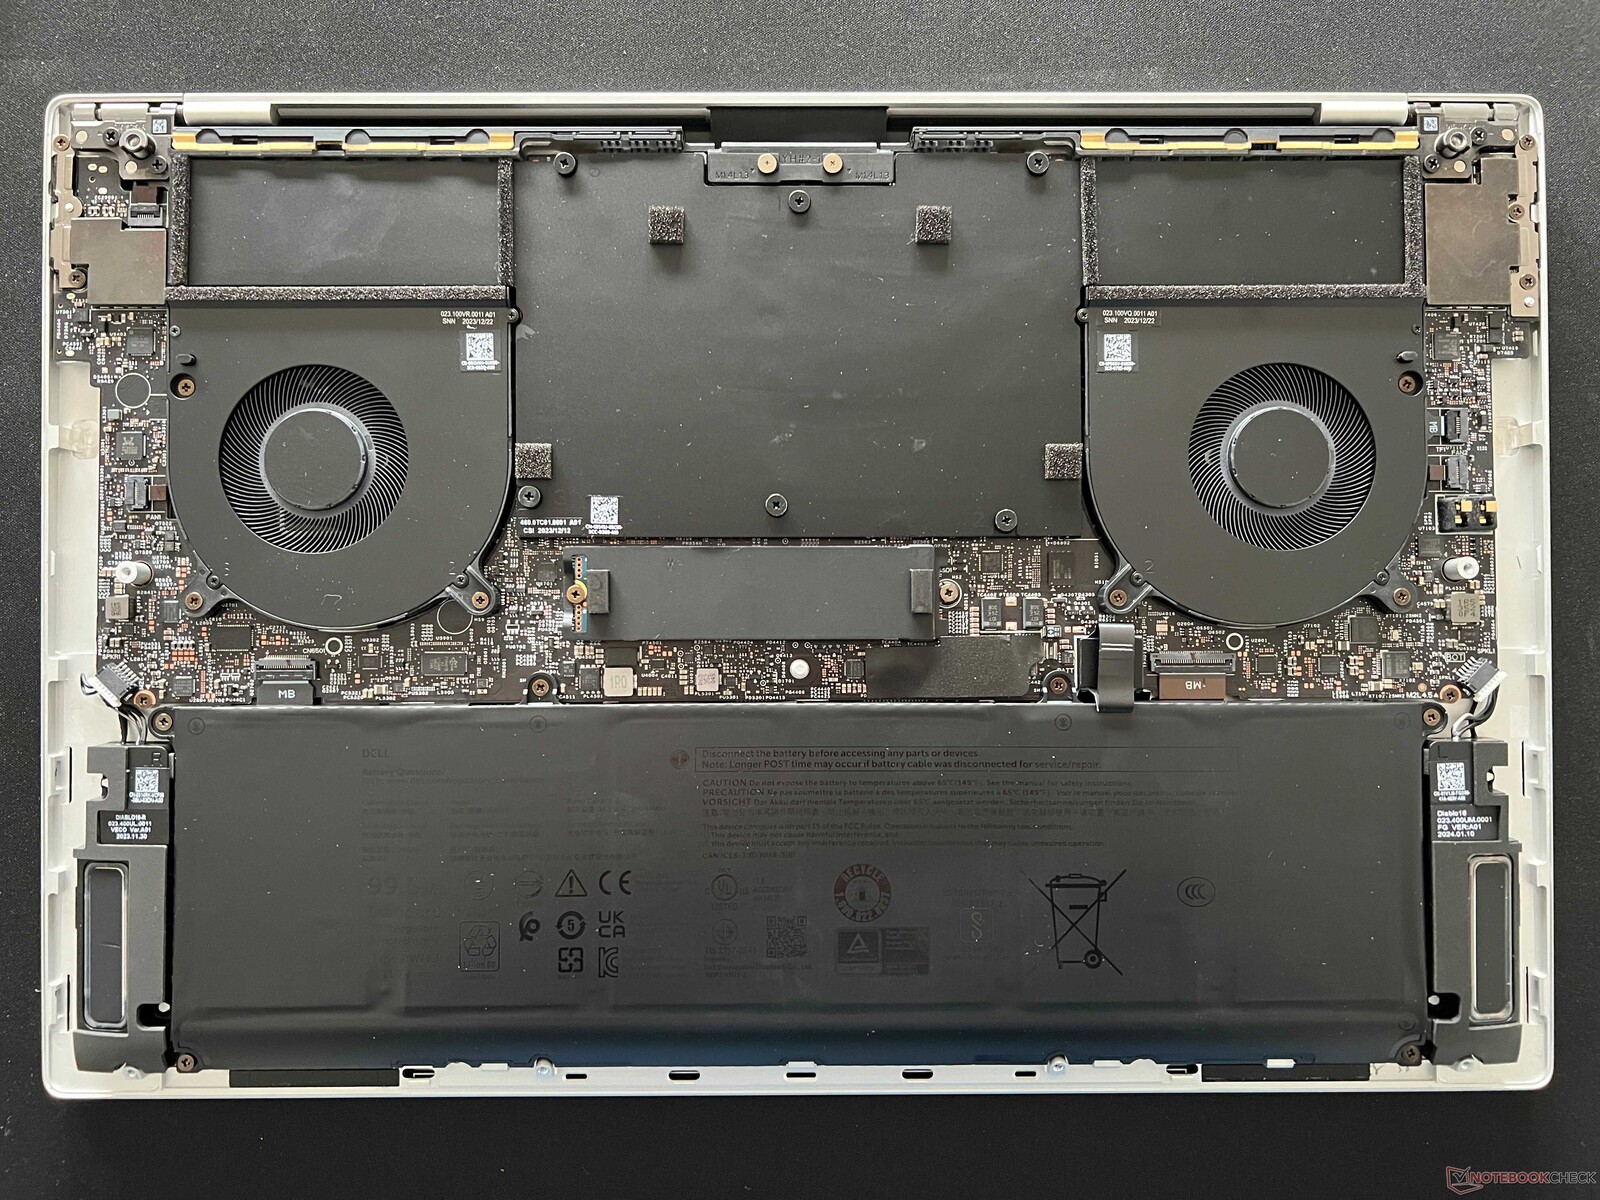
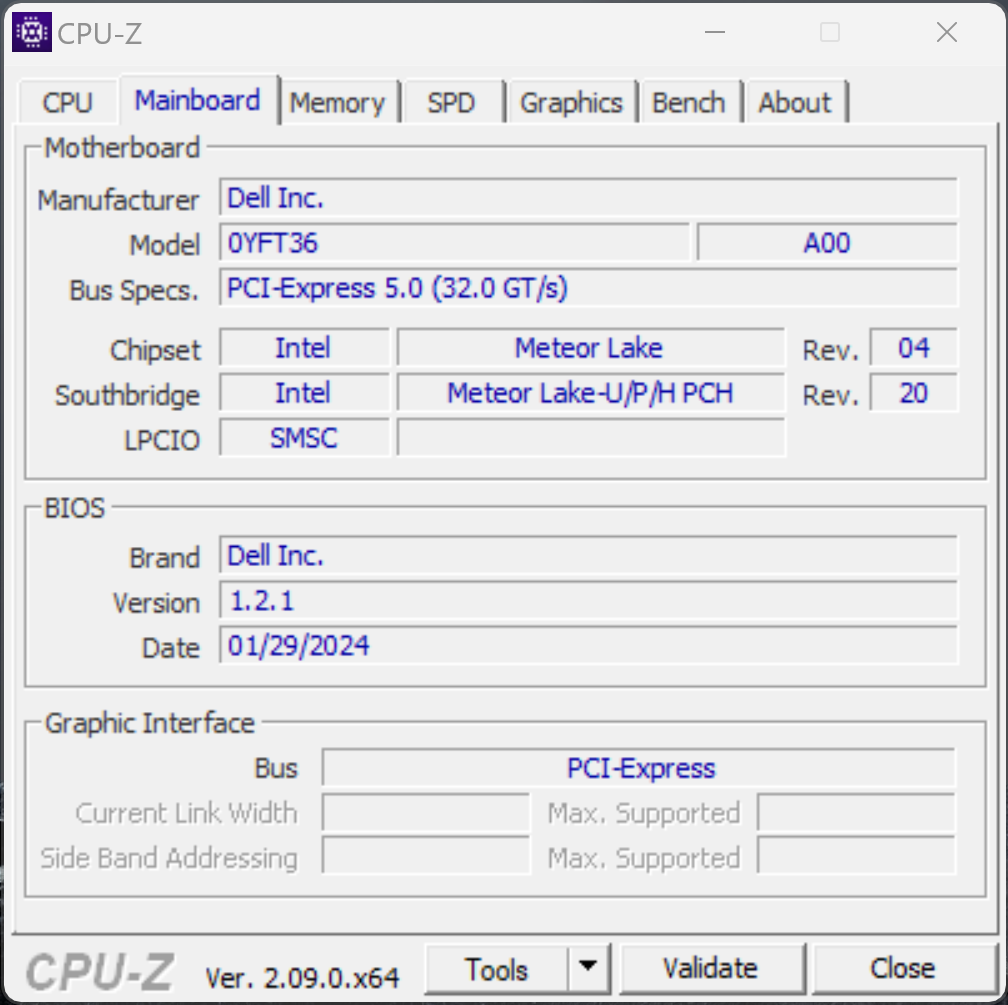
Manutenzione
Il coperchio del telaio inferiore è fissato tramite viti Torx (T5) e può essere rimosso facilmente. La struttura interna è dominata dall'unità di raffreddamento e dalla batteria. È possibile eseguire la manutenzione solo sull'SSD M.2-2280 e pulire le ventole del portatile; inoltre, è possibile sostituire la batteria se necessario. Tutti gli altri componenti, compresi il modulo WLAN e la RAM, sono saldati.
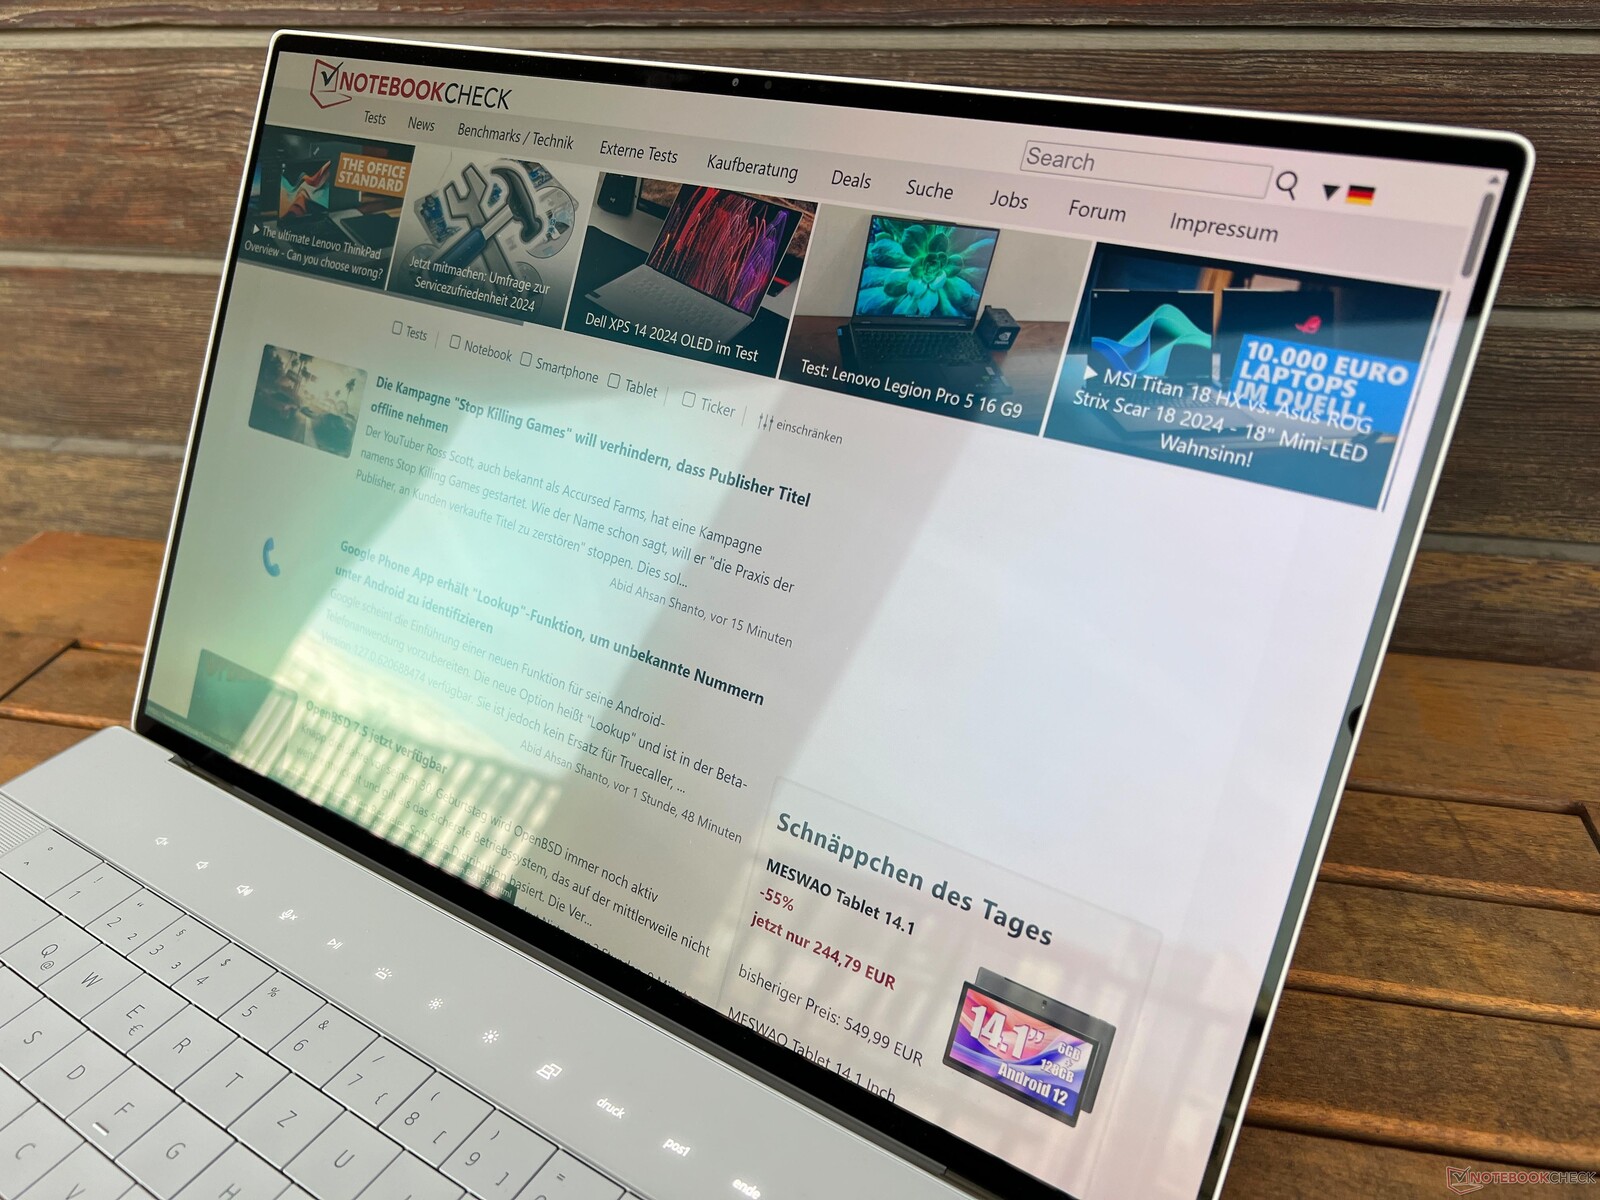
Dispositivi di input - La tastiera richiede un po' di tempo per abituarsi e i tasti funzione sono fastidiosi
Come già notato sul XPS 14dell utilizza lo stesso design della tastiera del vecchio XPS 13 Plus anche per il modello più grande XPS 16, che non presenta spazi tra i singoli tasti. Non dispone di un tastierino numerico, invece lo spazio accanto alla tastiera è utilizzato per gli altoparlanti del portatile. I tasti sono leggermente concavi e la digitazione è molto comoda, in quanto la pressione dei tasti è precisa. Tuttavia, abbiamo notato un problema occasionale, in quanto spesso abbiamo toccato il tasto sbagliato per sbaglio, quindi è necessario un po' di tempo per abituarsi a questa tastiera. Abbiamo anche trovato i piccoli tasti freccia verticali fastidiosi da premere con le dita più grandi, e il rumore dei tasti più grandi è molto più forte (barra spaziatrice, tasto invio). Il pulsante di accensione si trova in alto a destra (incluso lo scanner per le impronte digitali), dove di solito ci si aspetterebbe di trovare il tasto di cancellazione; questo ci porta al problema successivo.
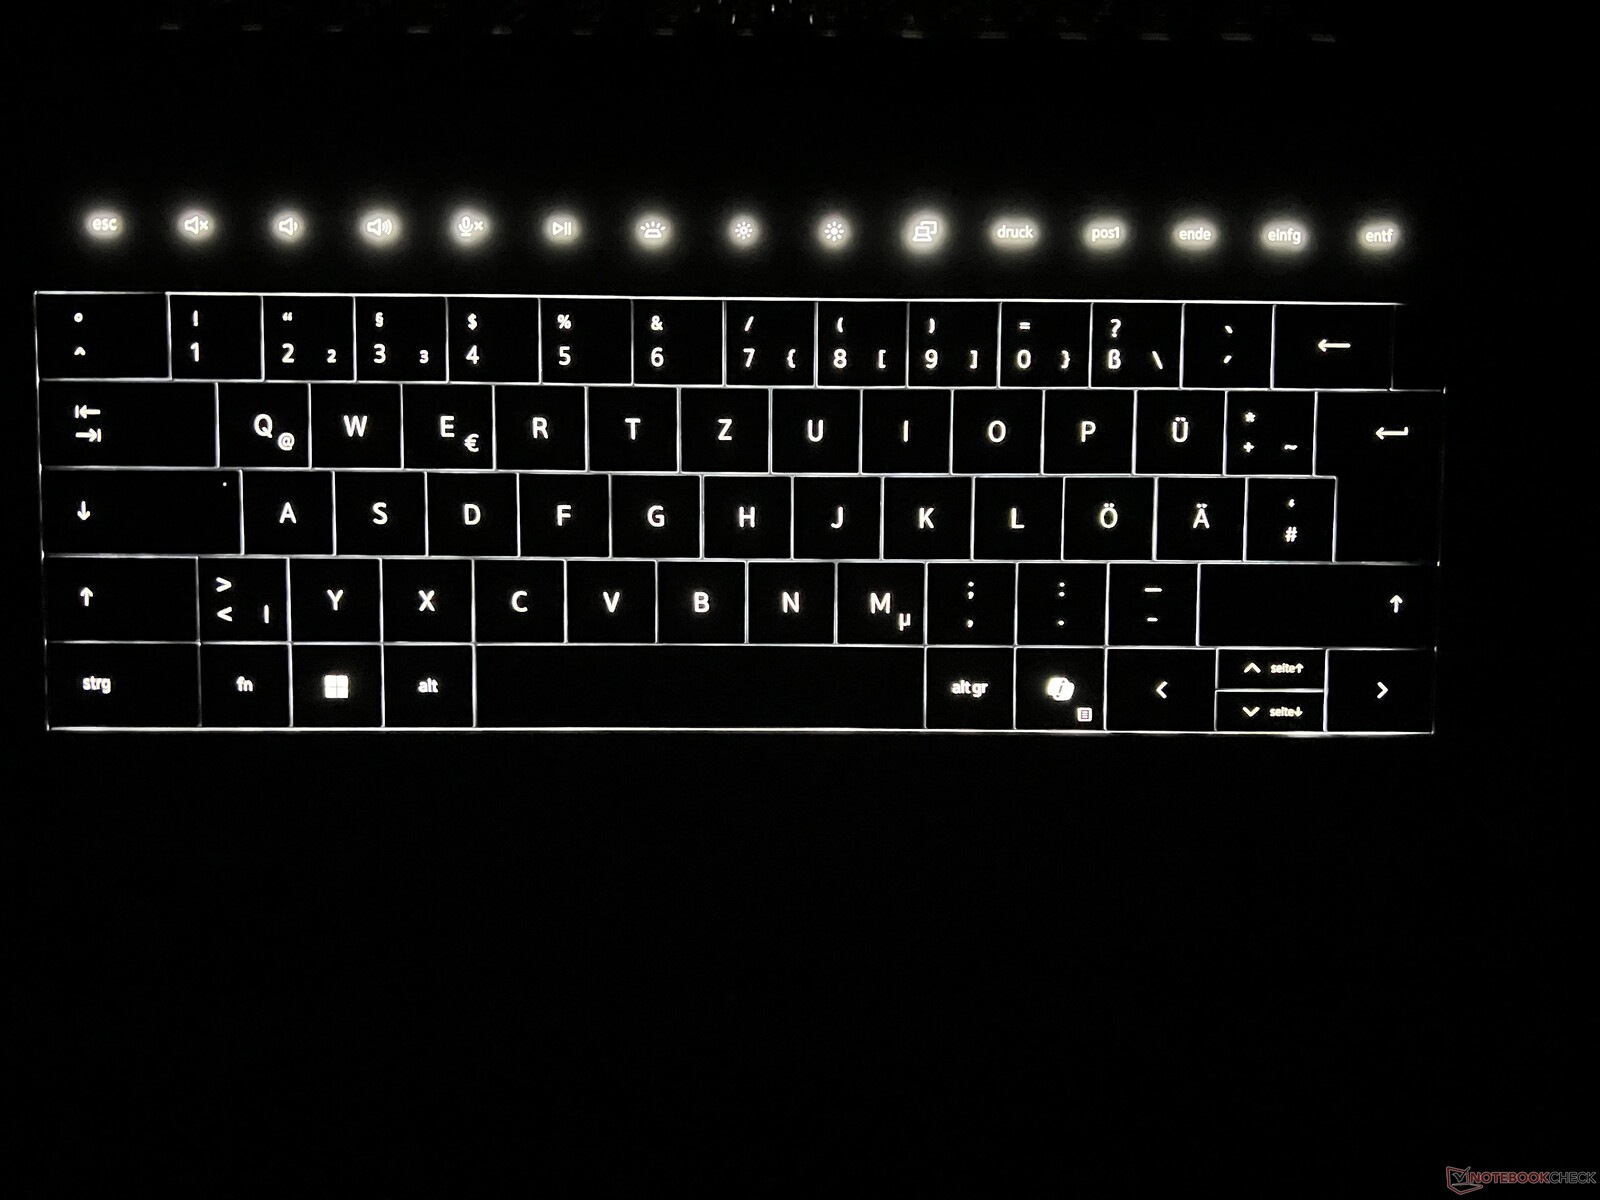
I tasti funzione sono installati come una barra touch che non solo non aggiunge alcun valore al dispositivo per gli utenti, ma è anche piuttosto fastidiosa. Di conseguenza, non si può nemmeno premere il tasto di cancellazione alla cieca e bisogna sempre guardare i tasti. La retroilluminazione è altrettanto fastidiosa, in quanto si spegne durante i periodi di inattività, ma non quando si guarda un video per ore e ore, anche se non si tocca alcun tasto. Inoltre, quando la retroilluminazione è disattivata, non si sa dove premere, il che significa che si potrebbero toccare i tasti sbagliati fino a quando l'illuminazione non viene riattivata. La stessa retroilluminazione bianca viene adattata costantemente tramite un sensore e non è possibile influenzare l'intensità, o almeno non siamo riusciti a trovare l'opzione per farlo. Inoltre, il sensore non è interessato a sapere se in precedenza ha disattivato manualmente la retroilluminazione e non appena le condizioni di luce cambiano, questa viene riattivata.
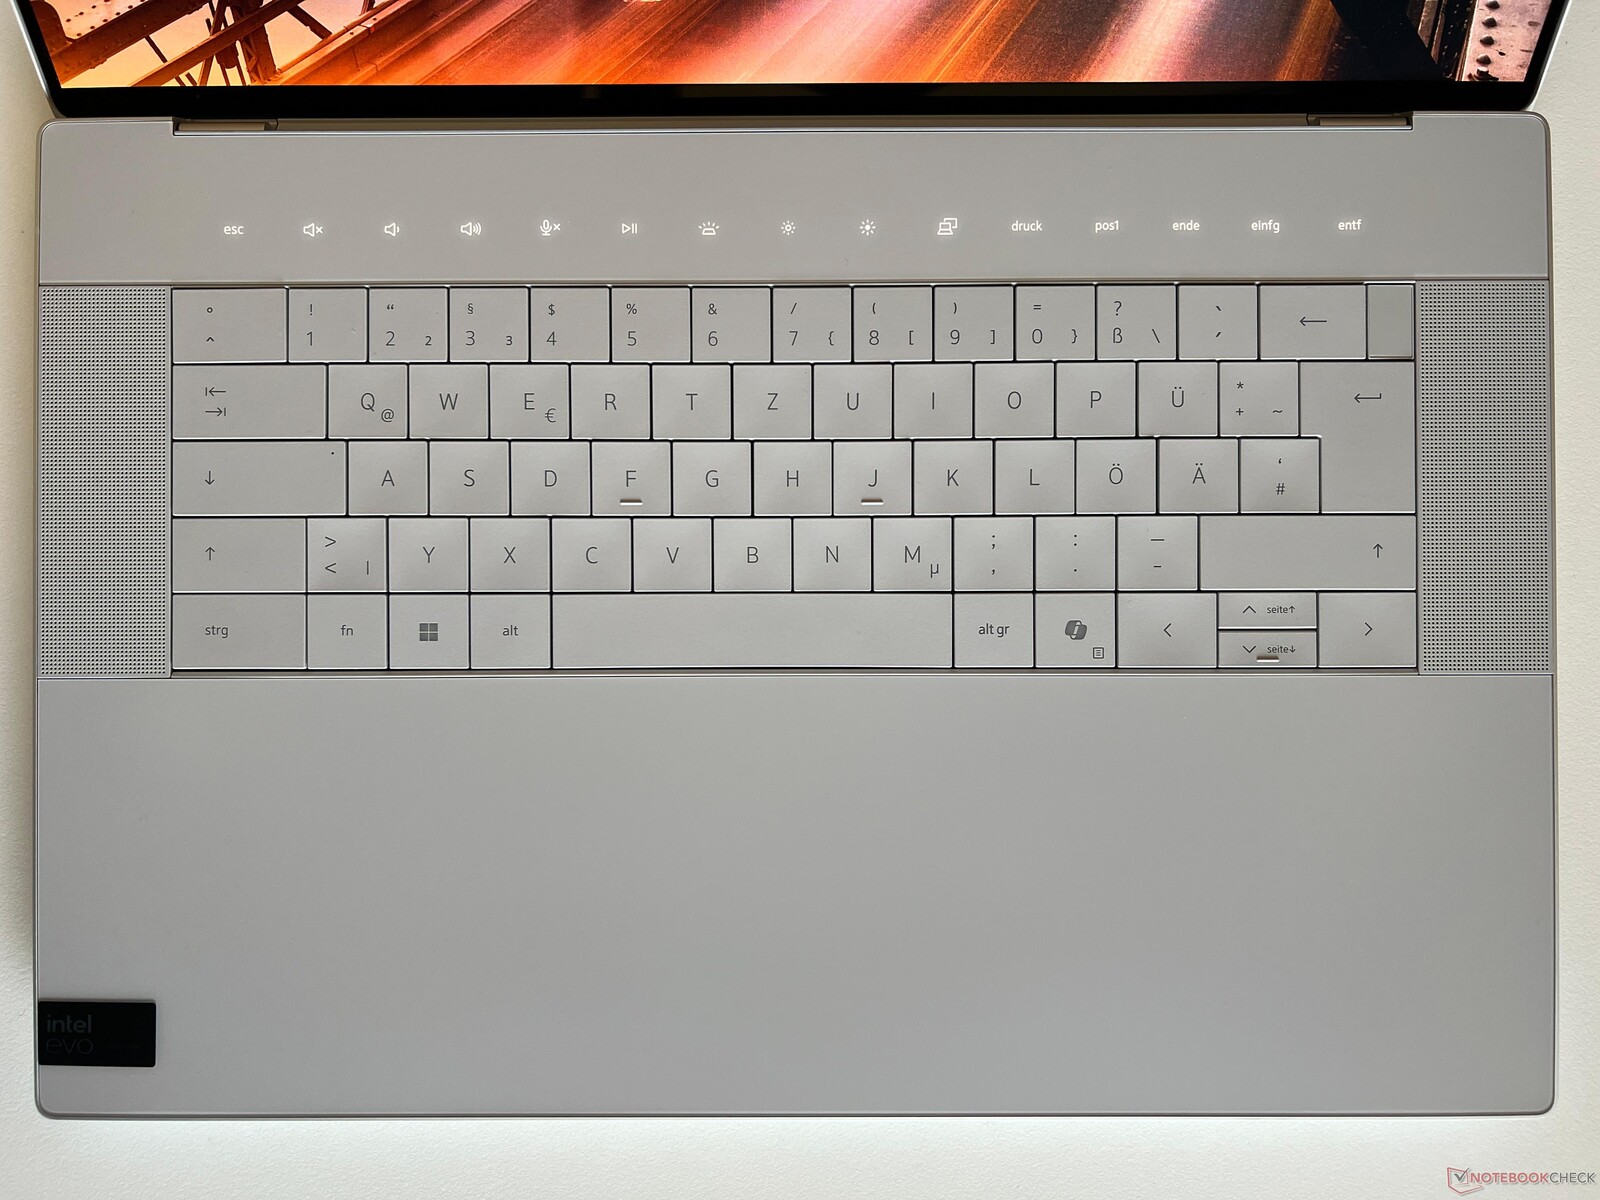
Il touchpad è completamente integrato nel palm rest e non ci sono confini visibili. Il touchpad utilizza l'intera altezza del palm rest e la sua larghezza si estende dal centro del tasto Fn sinistro al centro del tasto freccia sinistro. In generale, funziona bene ed è piacevole e fluido con un clic uniforme, ma occasionalmente abbiamo riscontrato alcuni problemi se si lasciava l'area o si iniziavano movimenti leggermente al di fuori dell'area effettiva del touchpad. A differenza della barra touch, tuttavia, questo è solo un punto critico minore. Il pannello OLED opzionale è dotato anche di un touchscreen capacitivo e funziona perfettamente.
Display - OLED 4K a 90 Hz
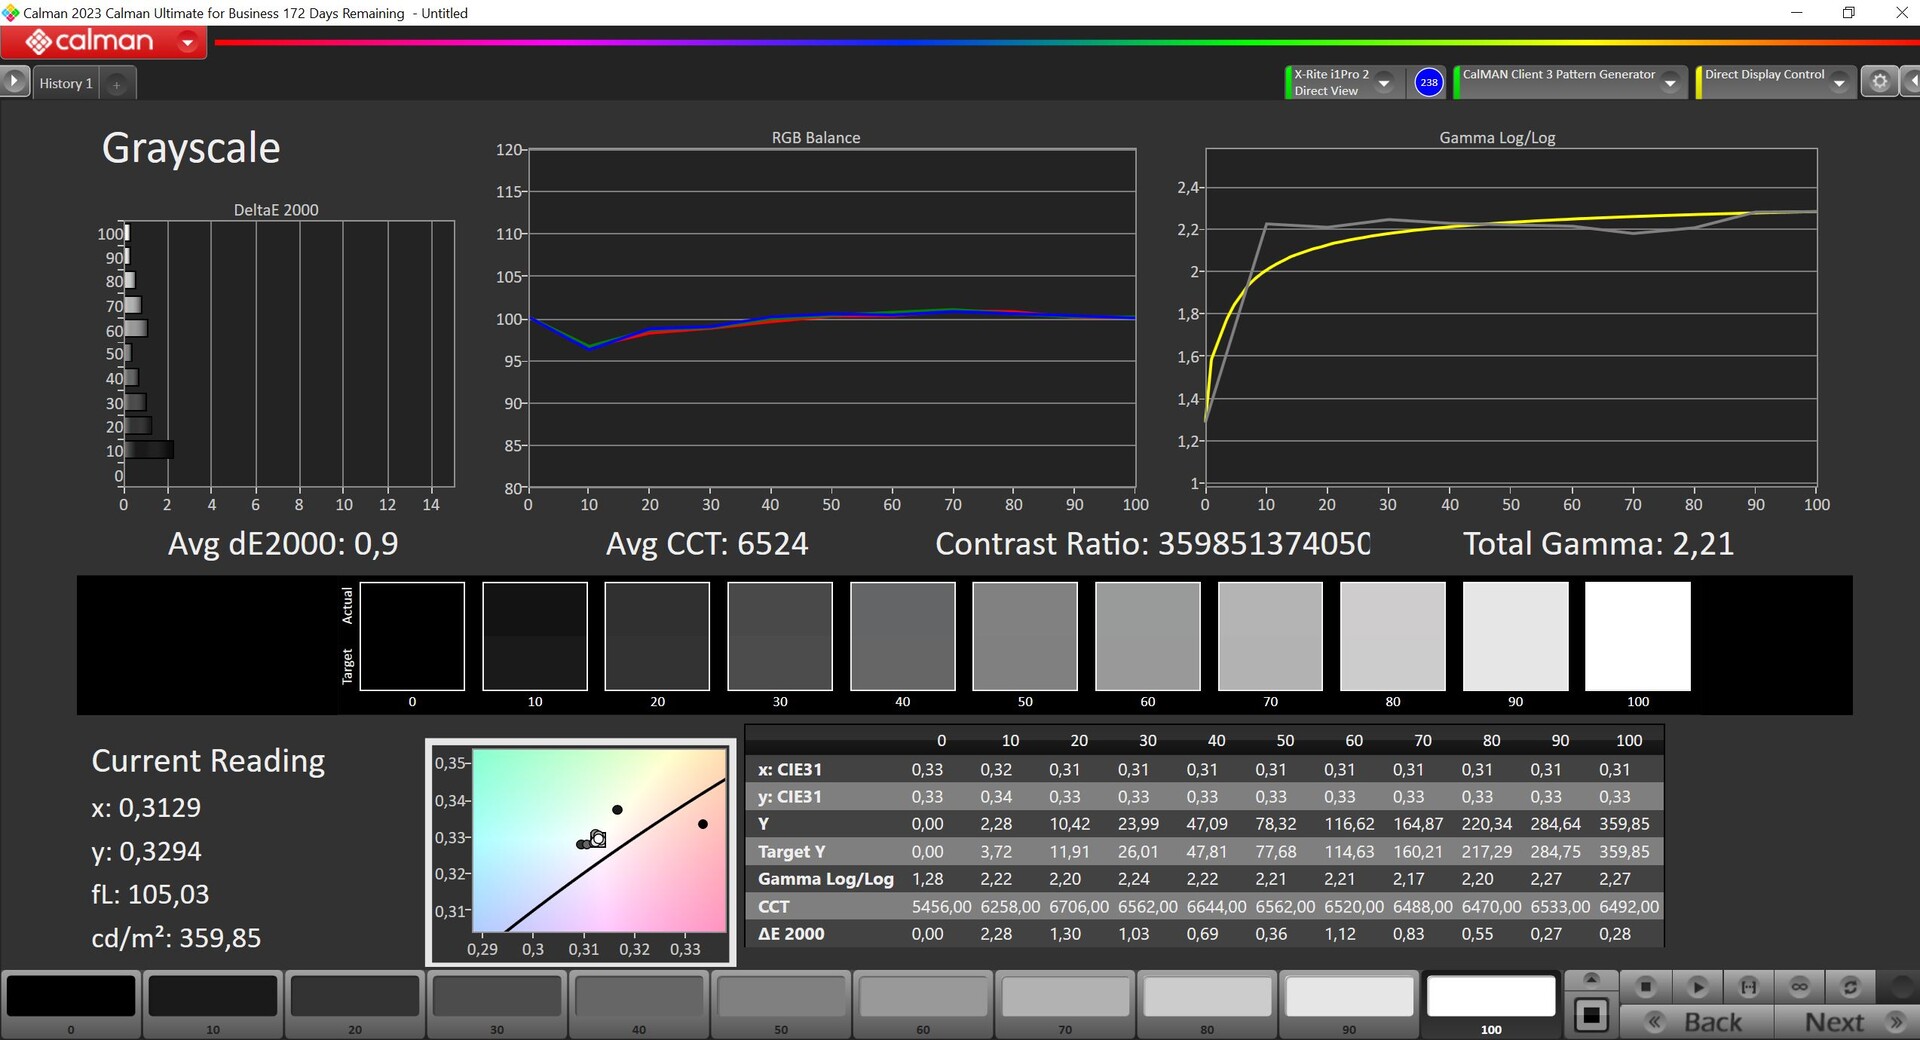
Dell offre due diversi pannelli da 16,3 pollici con una superficie riflettente per il suo nuovo XPS 16. Un modello 1080p (500 cd/m²) senza touchscreen è installato di serie, ma con un supplemento di 300 dollari, è possibile ottenere un touchscreen OLED di Samsung con una risoluzione di 3.840 x 2.400 pixel, che è anche quello installato nel nostro dispositivo di prova. Nonostante la sua buona qualità d'immagine soggettiva, il pannello dell'XPS 16 presenta alcuni svantaggi rispetto all'ultima generazione OLED di Samsung (che è installata nel Galaxy Book4 Ultra, ad esempio), nonostante la sua risoluzione più elevata. Innanzitutto, la sua frequenza di aggiornamento è di soli 90 Hz invece di 120 Hz e un effetto raster può essere notato a un esame più attento quando vengono visualizzati contenuti luminosi. Il Dell XPS 16 rimane leggermente indietro anche per quanto riguarda la luminosità massima SDR, con una media di ~367 cd/m². Il suo valore di nero è pari a 0, il che comporta un rapporto di contrasto estremamente elevato. Abbiamo notato un massimo di 580 cd/m² in modalità HDR (che deve essere attivata manualmente). Siamo stati in grado di rilevare la PWM con una frequenza di 360 Hz su tutti i livelli di luminosità da 0 a 90%.
| |||||||||||||||||||||||||
Distribuzione della luminosità: 96 %
Al centro con la batteria: 366 cd/m²
Contrasto: ∞:1 (Nero: 0 cd/m²)
ΔE ColorChecker Calman: 1.3 | ∀{0.5-29.43 Ø4.71}
calibrated: 1
ΔE Greyscale Calman: 2.2 | ∀{0.09-98 Ø4.96}
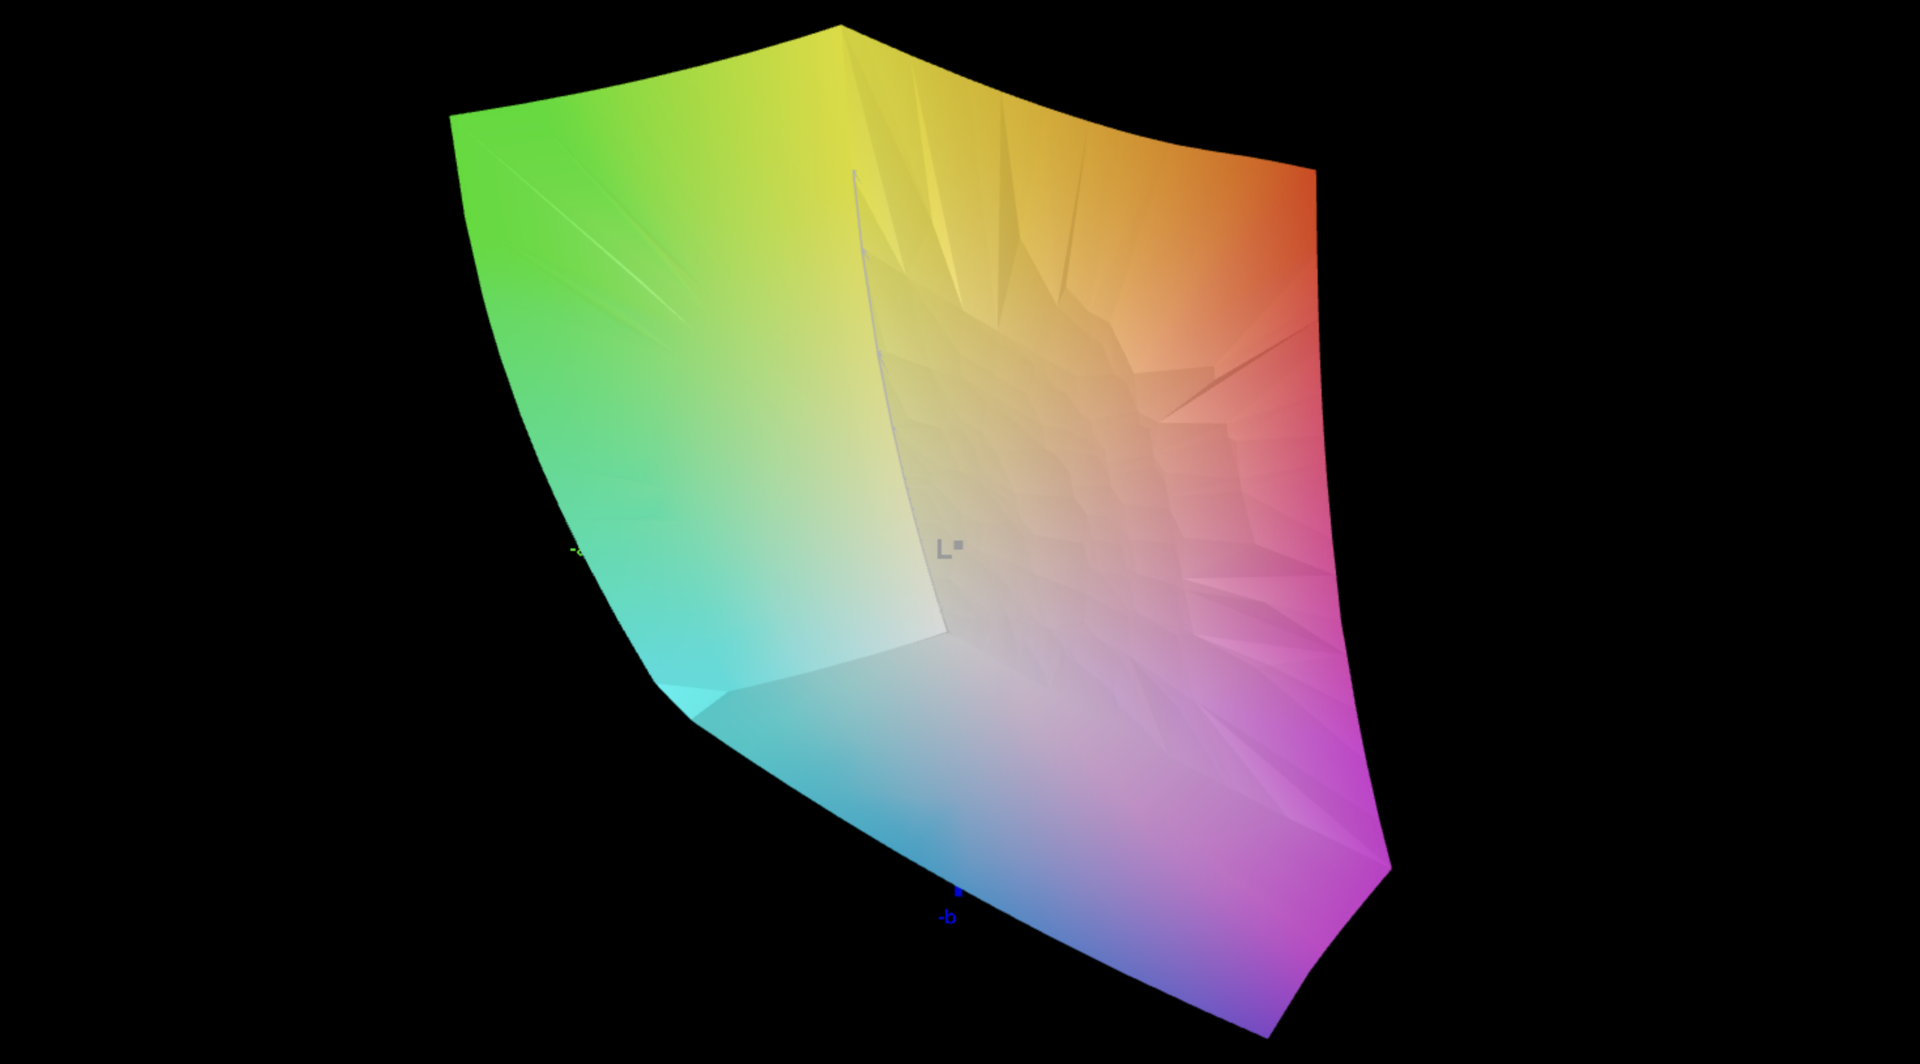
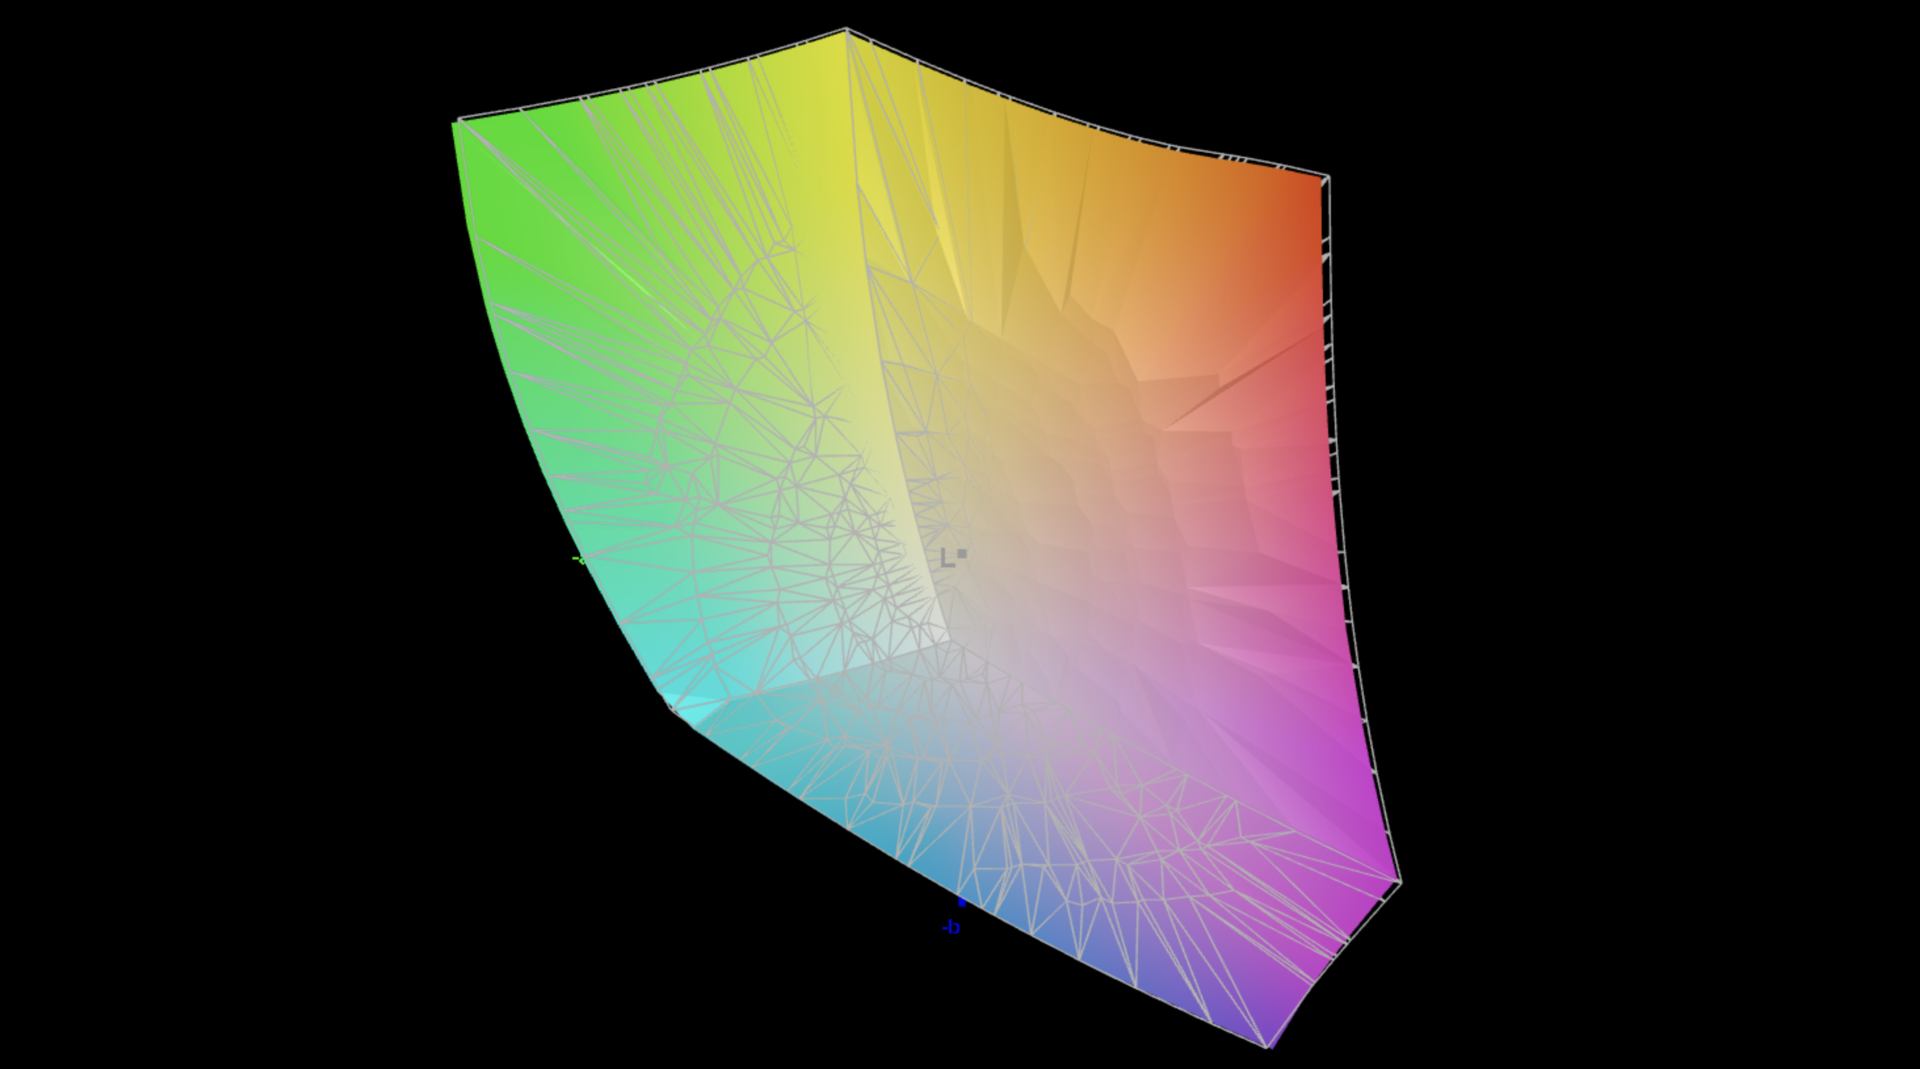
87.8% AdobeRGB 1998 (Argyll 3D)
100% sRGB (Argyll 3D)
98.3% Display P3 (Argyll 3D)
Gamma: 2.14
CCT: 6680 K
| Dell XPS 16 9640 SDC4196, OLED, 3840x2400, 16.3" | Samsung Galaxy Book4 Ultra ATNA60CL07-0, OLED, 2880x1800, 16" | Honor MagicBook Pro 16 2024 TL160MDMP01, IPS, 3072x1920, 16" | Asus ROG Zephyrus G16 2024 GU605M ATNA60DL01-0, OLED, 2560x1600, 16" | Lenovo Yoga Pro 9 16-IRP G8 LEN160-3.2K, Mini-LED, 3200x2000, 16" | Schenker VISION 16 Pro (M23) NE160QDM-NZ1, IPS, 2560x1600, 16" | Dell XPS 15 9530 RTX 4070 Samsung 156XG01, OLED, 3456x2160, 15.6" | |
|---|---|---|---|---|---|---|---|
| Display | 0% | 1% | 4% | 2% | -17% | 5% | |
| Display P3 Coverage (%) | 98.3 | 98.6 0% | 98.8 1% | 99.9 2% | 97 -1% | 68.8 -30% | 99.8 2% |
| sRGB Coverage (%) | 100 | 99.9 0% | 100 0% | 100 0% | 99.8 0% | 98.8 -1% | 100 0% |
| AdobeRGB 1998 Coverage (%) | 87.8 | 88.5 1% | 89.1 1% | 96.9 10% | 95.1 8% | 70 -20% | 98.4 12% |
| Response Times | 27% | -614% | 72% | -1295% | -1212% | -117% | |
| Response Time Grey 50% / Grey 80% * (ms) | 0.82 ? | 0.54 ? 34% | 6.3 ? -668% | 0.22 ? 73% | 14 ? -1607% | 13.7 ? -1571% | 1.68 ? -105% |
| Response Time Black / White * (ms) | 0.85 ? | 0.69 ? 19% | 5.6 ? -559% | 0.25 ? 71% | 9.2 ? -982% | 8.1 ? -853% | 1.94 ? -128% |
| PWM Frequency (Hz) | 360 ? | 240 ? | 960 ? | 5800 ? | 239 | ||
| Screen | 6% | 5% | 4% | 22% | -58% | -64% | |
| Brightness middle (cd/m²) | 366 | 390 7% | 551 51% | 416 14% | 539 47% | 384 5% | 389.5 6% |
| Brightness (cd/m²) | 367 | 393 7% | 524 43% | 418 14% | 546 49% | 371 1% | 392 7% |
| Brightness Distribution (%) | 96 | 98 2% | 91 -5% | 96 0% | 96 0% | 88 -8% | 98 2% |
| Black Level * (cd/m²) | 0.52 | 0.18 | 0.3 | ||||
| Colorchecker dE 2000 * | 1.3 | 1.4 -8% | 1.7 -31% | 1.6 -23% | 1.4 -8% | 3.4 -162% | 4.95 -281% |
| Colorchecker dE 2000 max. * | 3.6 | 2.7 25% | 4.1 -14% | 2.1 42% | 2.1 42% | 9.2 -156% | 8.65 -140% |
| Colorchecker dE 2000 calibrated * | 1 | 1 -0% | 1.3 -30% | 1.53 -53% | |||
| Greyscale dE 2000 * | 2.2 | 2.1 5% | 2.4 -9% | 2.7 -23% | 2.2 -0% | 3.4 -55% | 2 9% |
| Gamma | 2.14 103% | 2.27 97% | 2.2 100% | 2.16 102% | 2.19 100% | 2.16 102% | 2.27 97% |
| CCT | 6680 97% | 6431 101% | 6842 95% | 6331 103% | 6479 100% | 7462 87% | 6265 104% |
| Contrast (:1) | 1060 | 2994 | 1280 | ||||
| Media totale (Programma / Settaggio) | 11% /
8% | -203% /
-99% | 27% /
16% | -424% /
-223% | -429% /
-240% | -59% /
-56% |
* ... Meglio usare valori piccoli

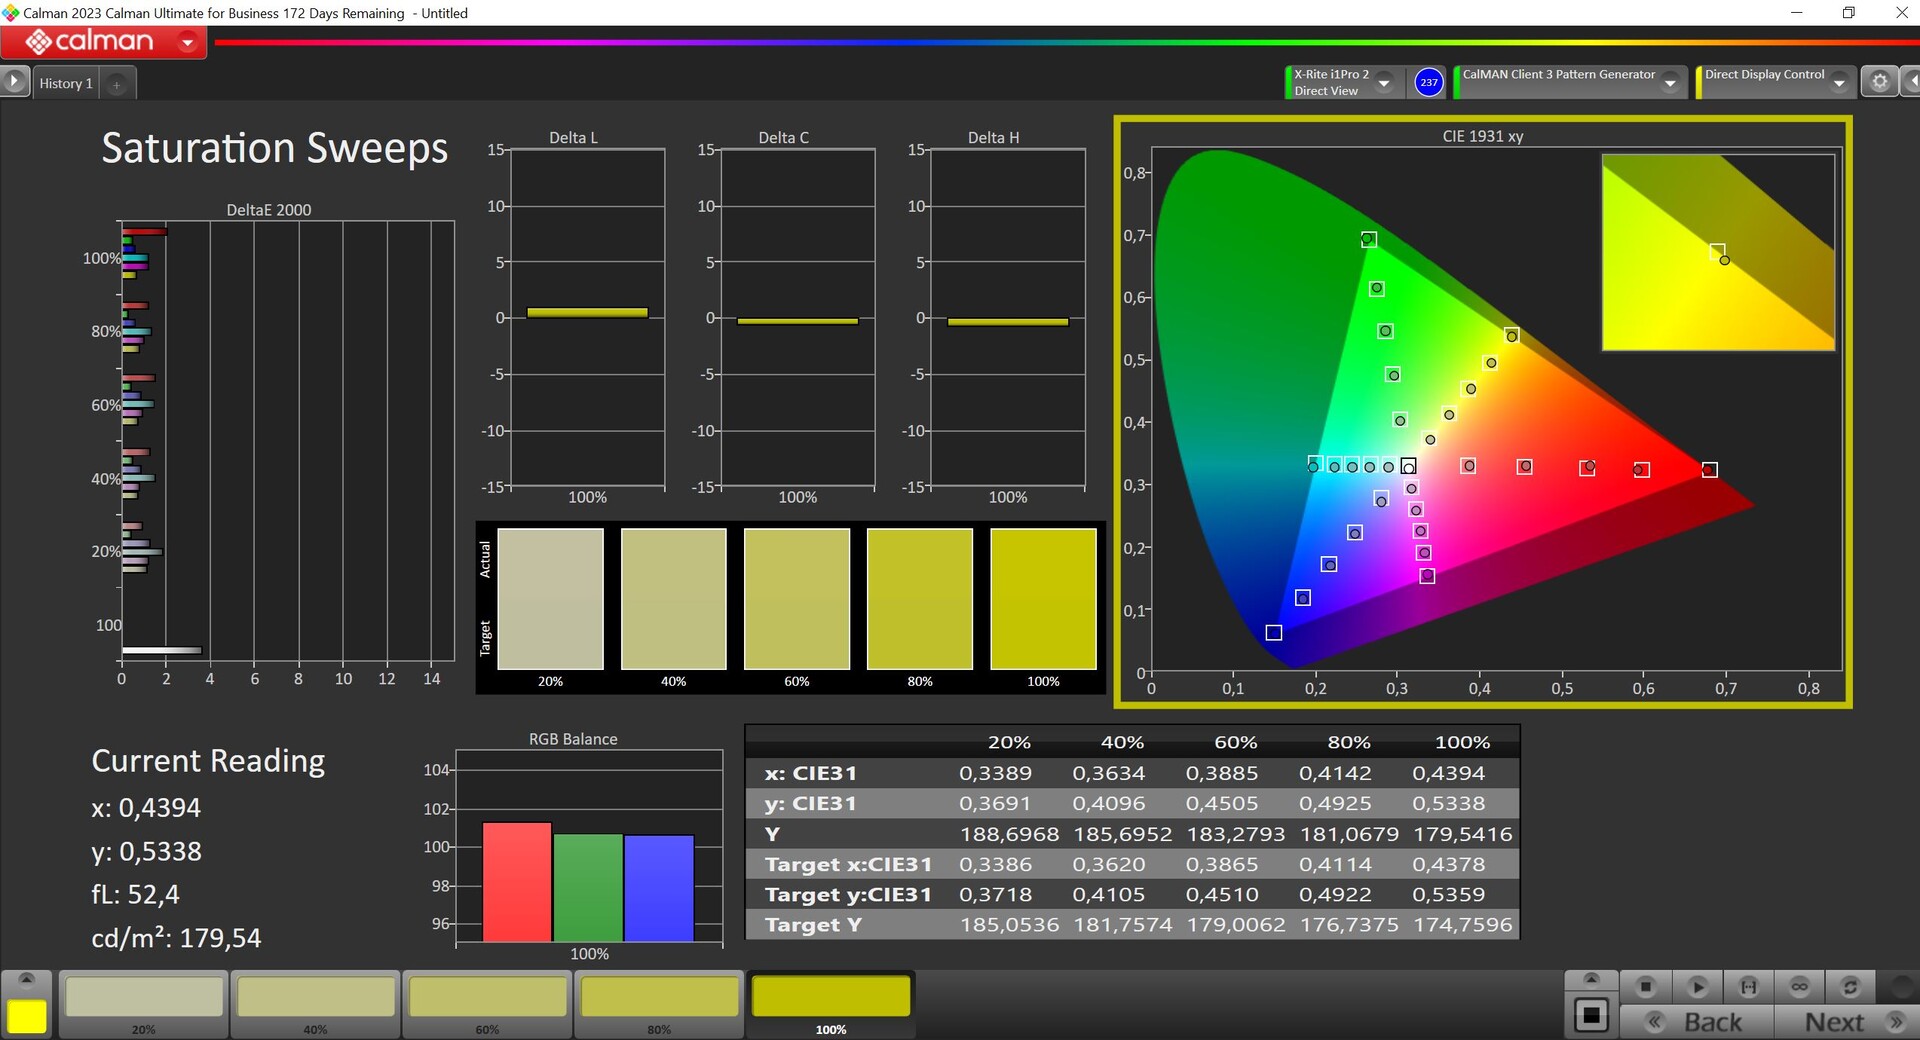

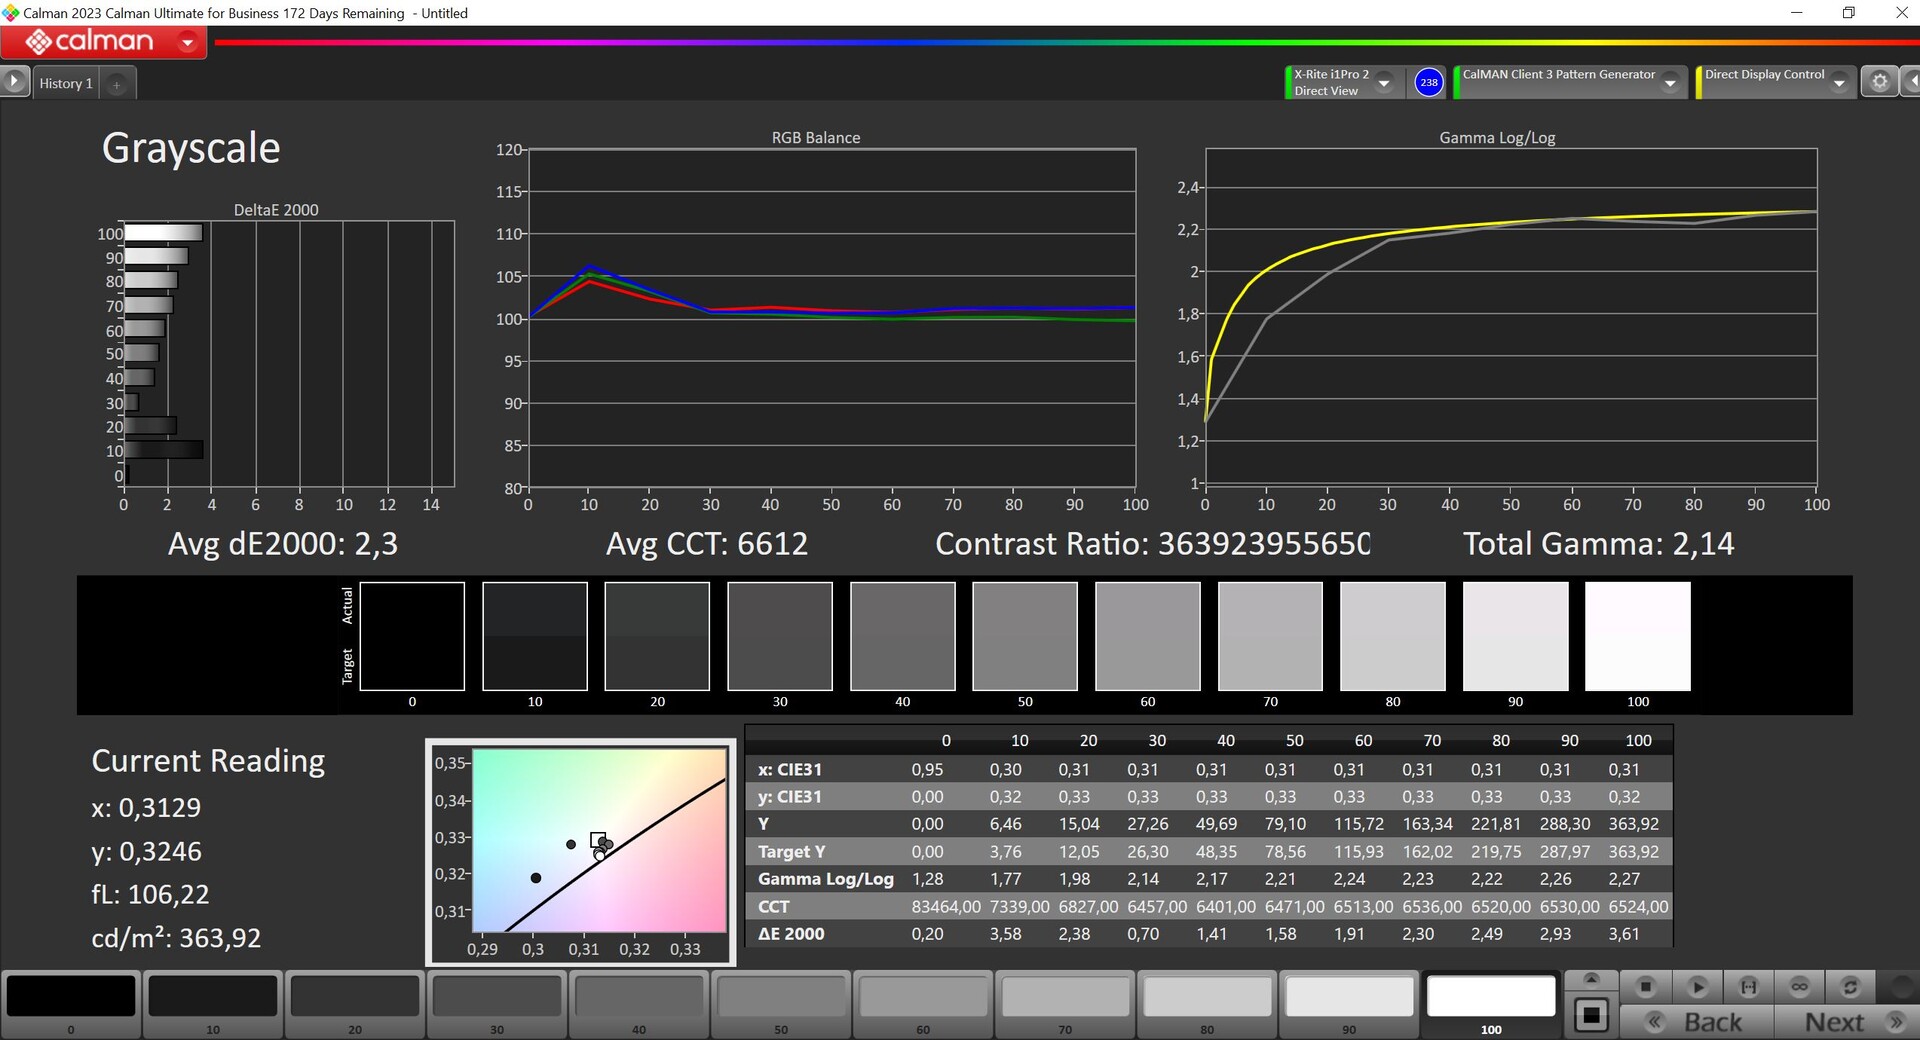

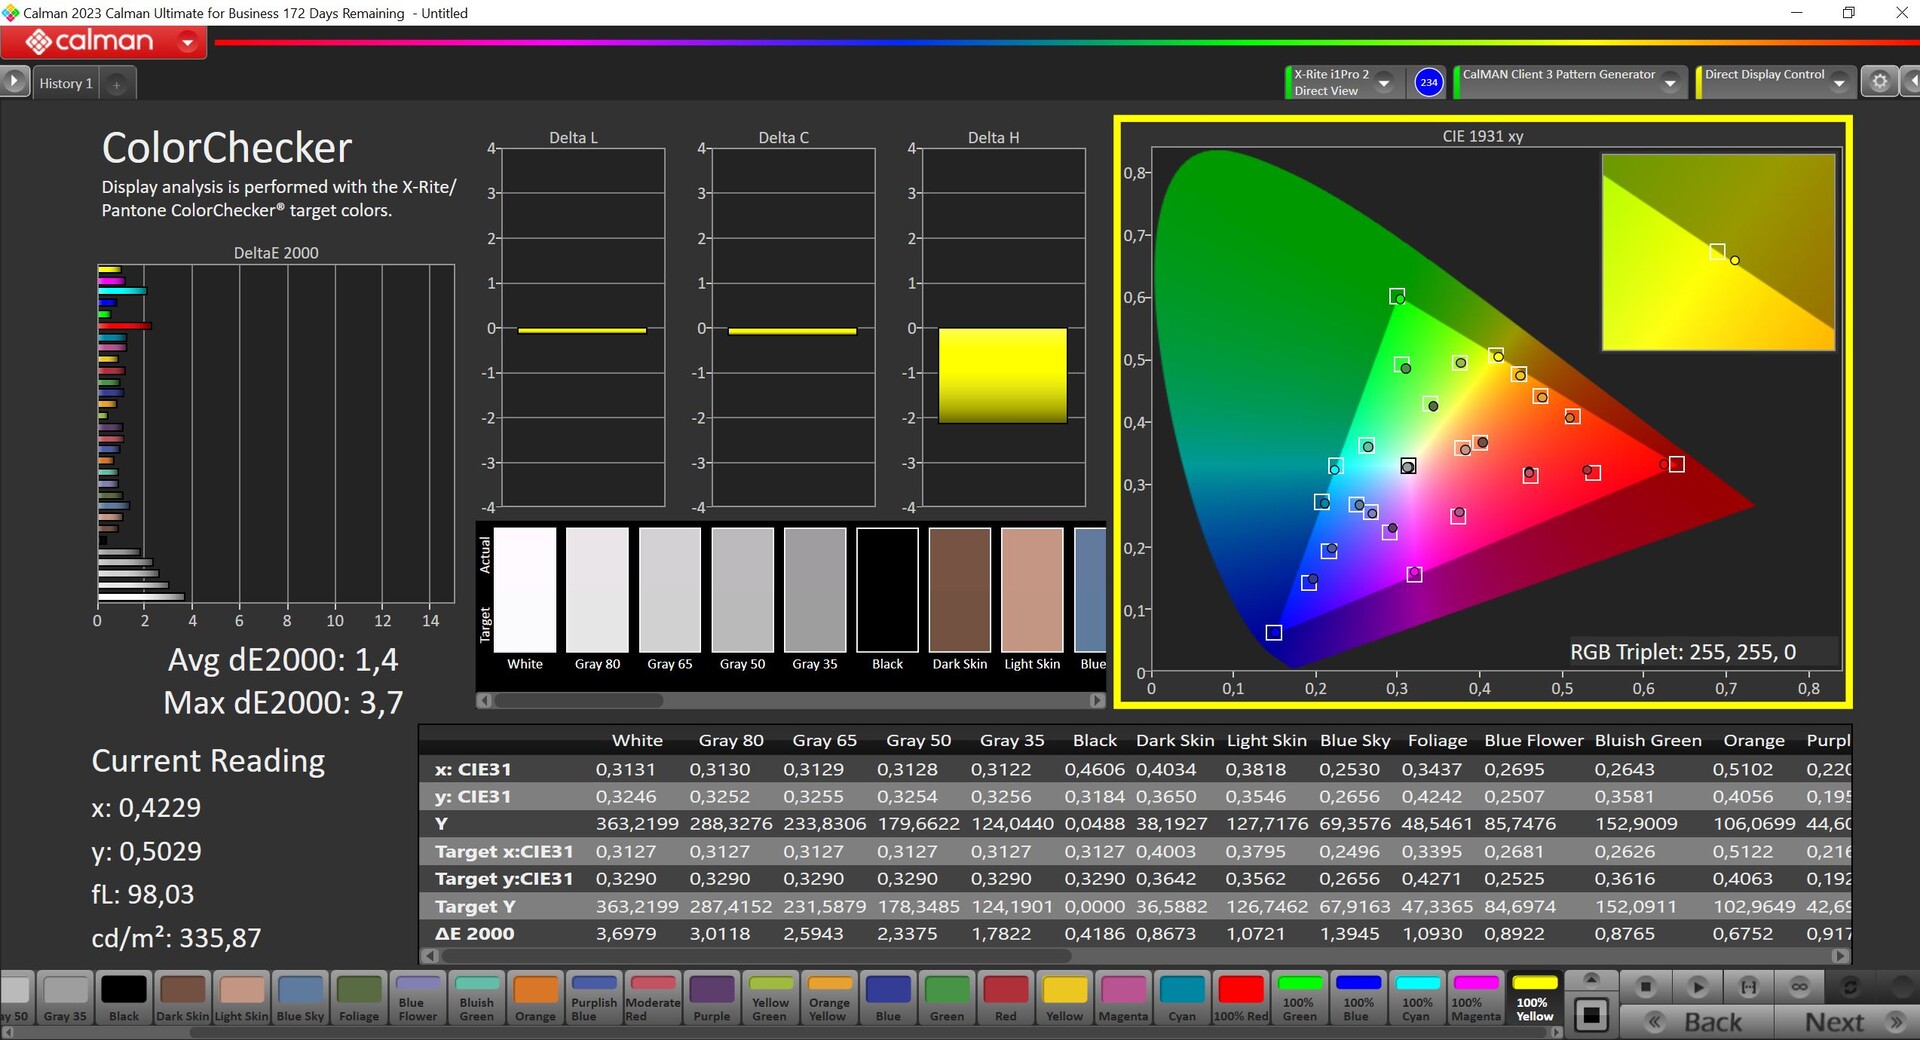
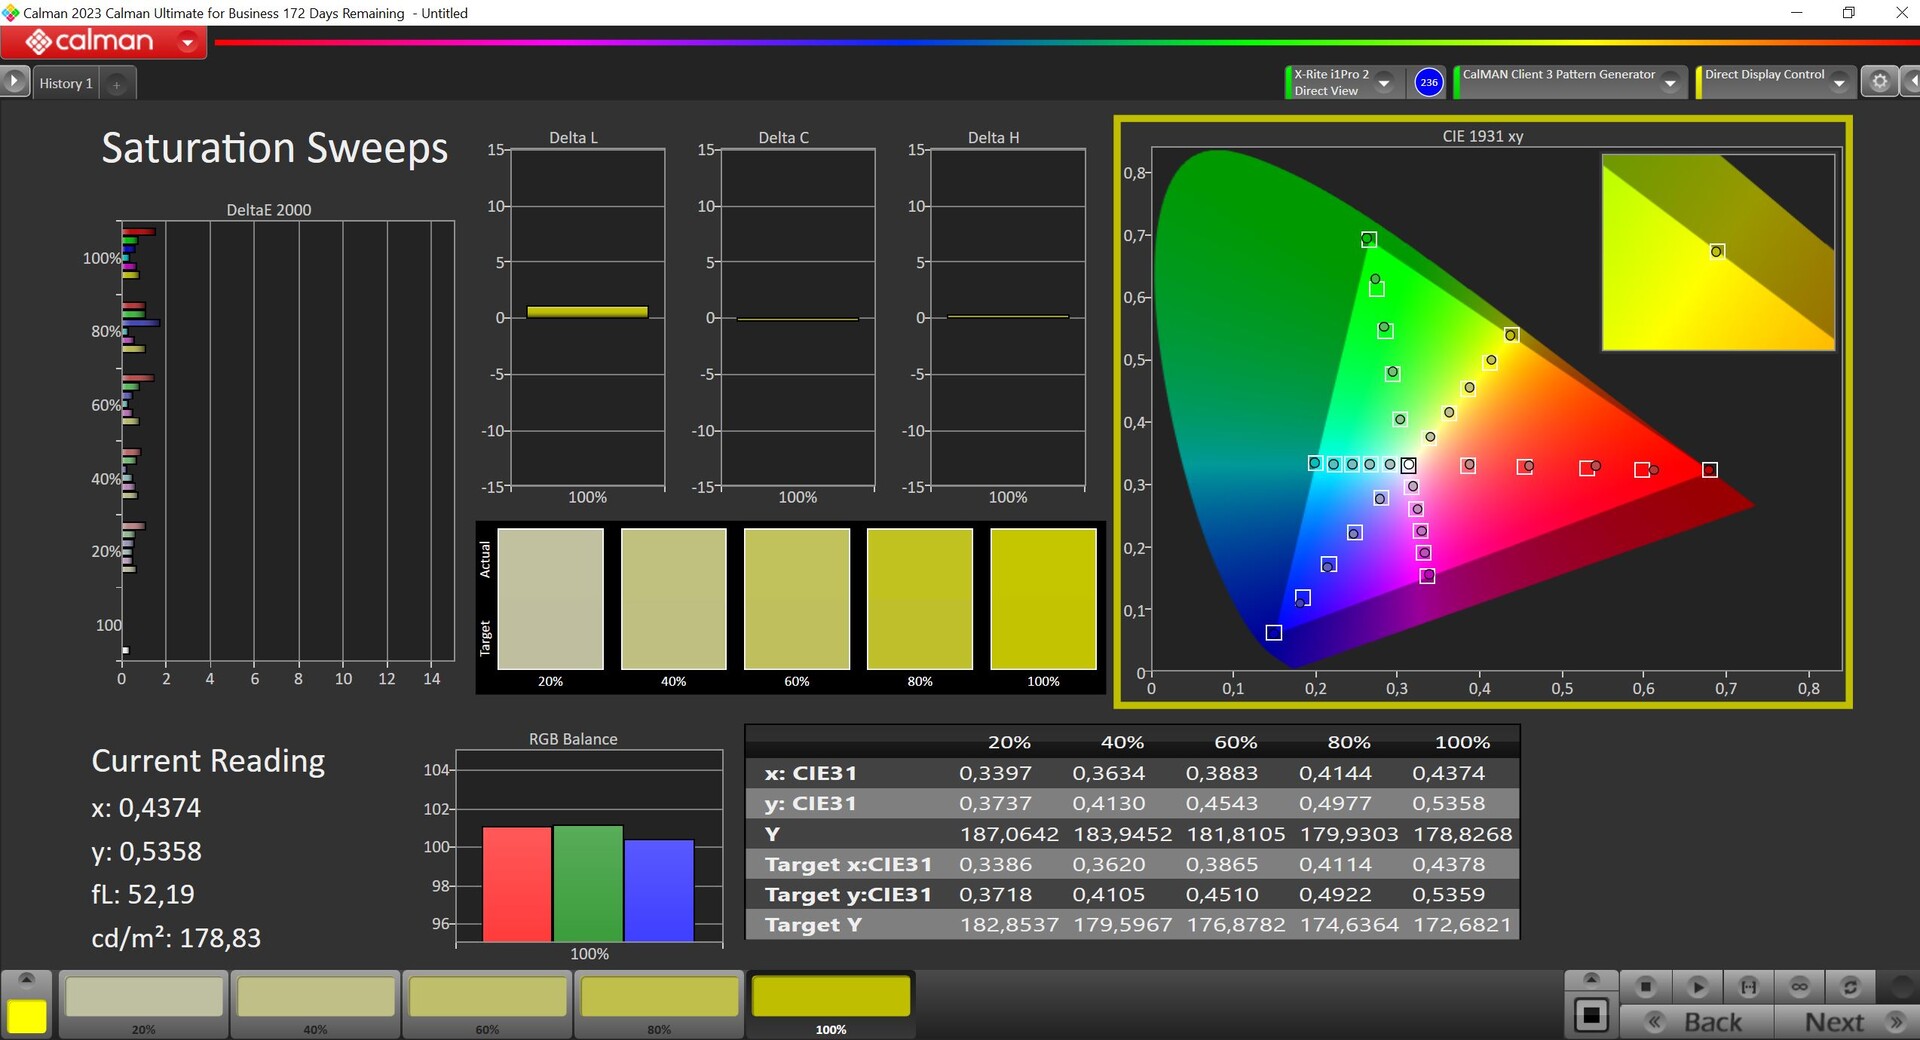
Abbiamo analizzato il pannello utilizzando il software professionale CalMAN (X-Rite i1 Pro 2). Dell offre diversi profili di colore e il profilo preselezionato Vivid offre già colori molto precisi, solo i toni di grigio mostrano ancora qualche leggera deviazione. Utilizzando la nostra calibrazione (può scaricare gratuitamente il profilo corrispondente qui sopra), siamo riusciti a migliorare ulteriormente la rappresentazione. Se le piace modificare le foto, apprezzerà l'accurato profilo Internet, che limita lo spazio colore a sRGB.


Tempi di risposta del Display
| ↔ Tempi di risposta dal Nero al Bianco | ||
|---|---|---|
| 0.85 ms ... aumenta ↗ e diminuisce ↘ combinato | ↗ 0.46 ms Incremento | 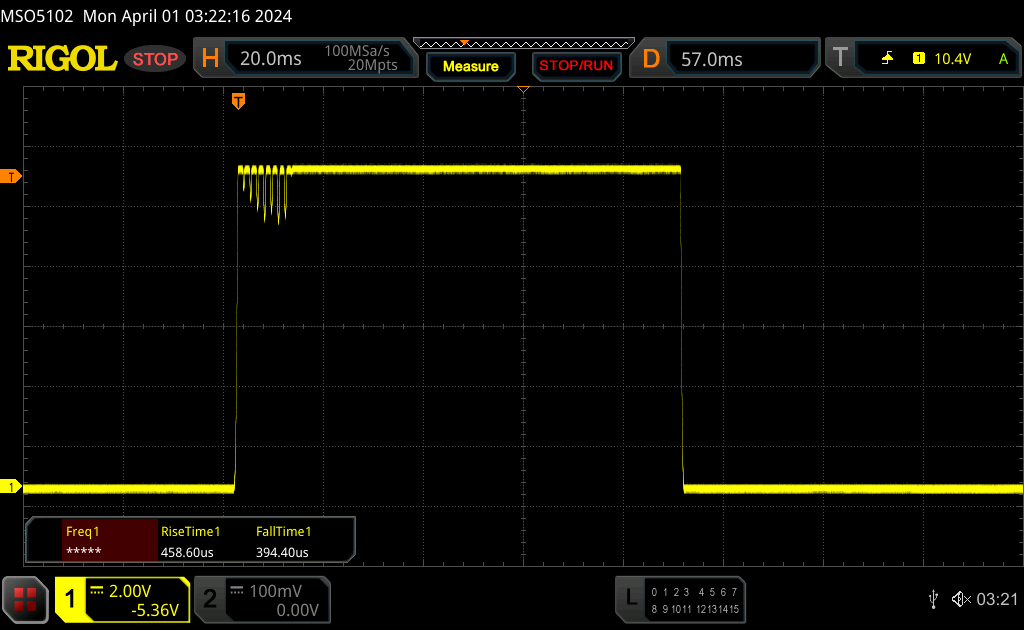 |
| ↘ 0.39 ms Calo | ||
| Lo schermo ha mostrato valori di risposta molto veloci nei nostri tests ed è molto adatto per i gaming veloce. In confronto, tutti i dispositivi di test variano da 0.1 (minimo) a 240 (massimo) ms. » 3 % di tutti i dispositivi è migliore. Questo significa che i tempi di risposta rilevati sono migliori rispettto alla media di tutti i dispositivi testati (19.8 ms). | ||
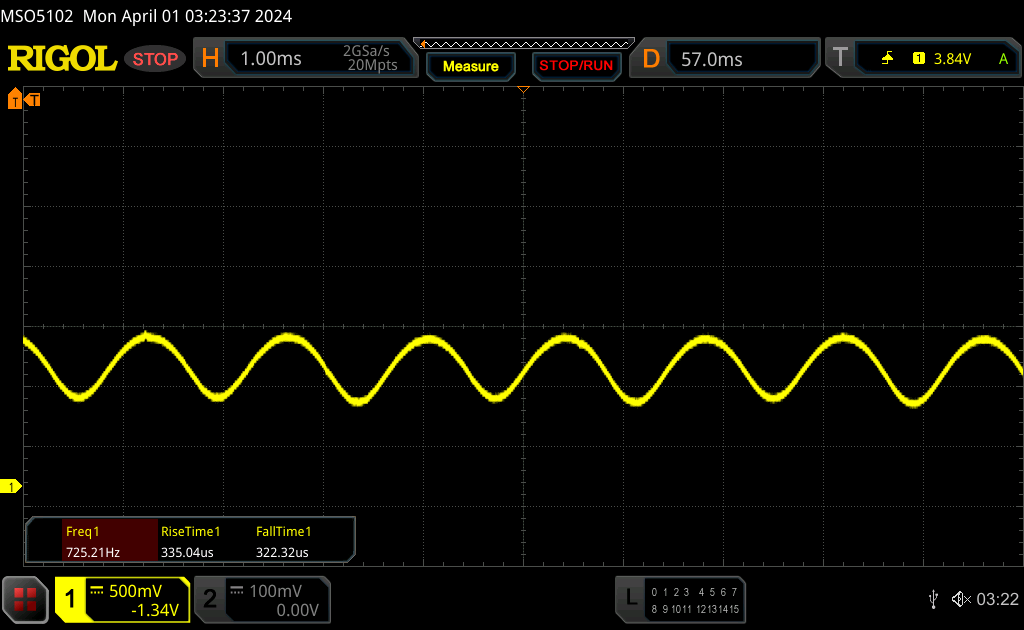
| ↔ Tempo di risposta dal 50% Grigio all'80% Grigio | ||
| 0.82 ms ... aumenta ↗ e diminuisce ↘ combinato | ↗ 0.43 ms Incremento | 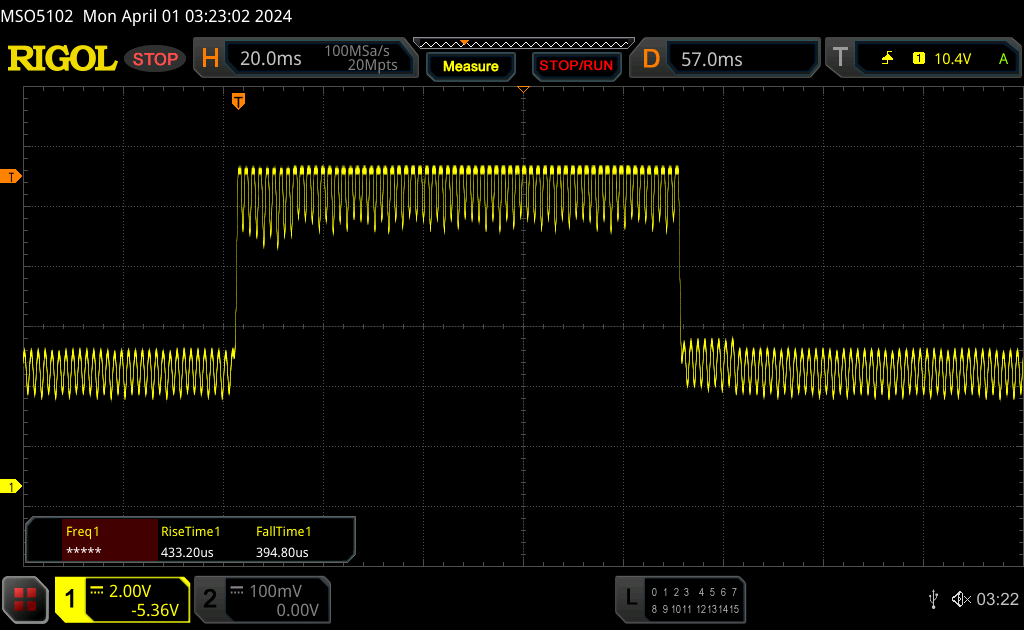 |
| ↘ 0.39 ms Calo | ||
| Lo schermo ha mostrato valori di risposta molto veloci nei nostri tests ed è molto adatto per i gaming veloce. In confronto, tutti i dispositivi di test variano da 0.165 (minimo) a 636 (massimo) ms. » 3 % di tutti i dispositivi è migliore. Questo significa che i tempi di risposta rilevati sono migliori rispettto alla media di tutti i dispositivi testati (31 ms). | ||
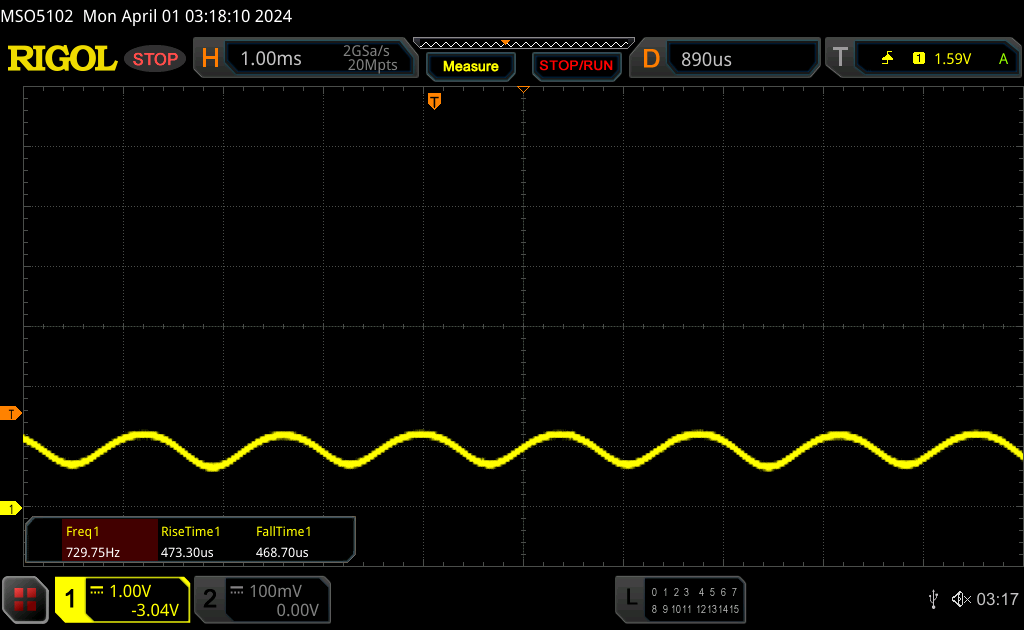
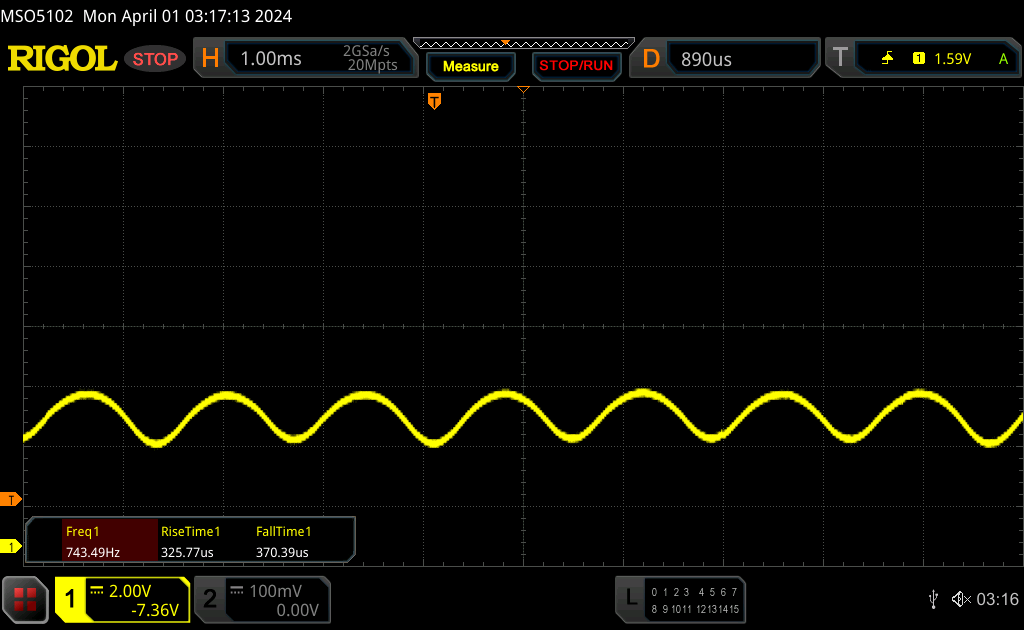
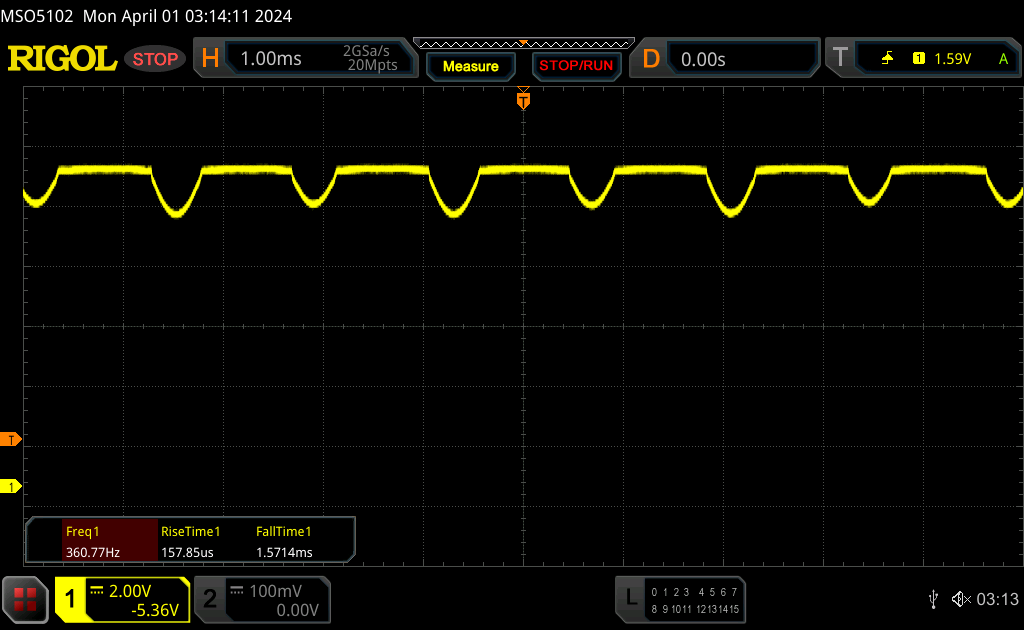
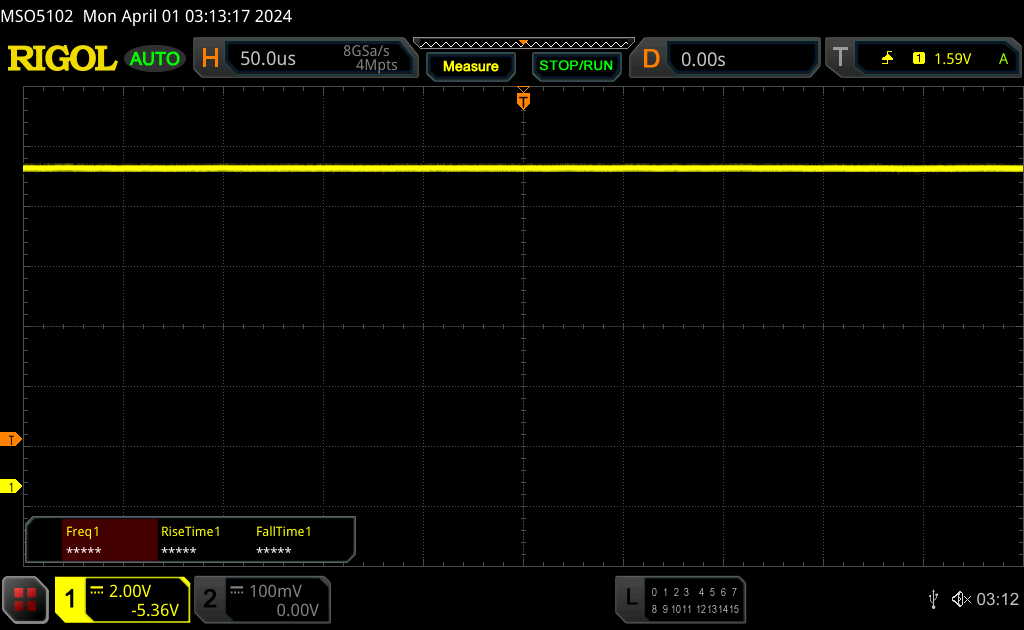
Sfarfallio dello schermo / PWM (Pulse-Width Modulation)
| flickering dello schermo / PWM rilevato | 360 Hz | ≤ 90 % settaggio luminosita' | 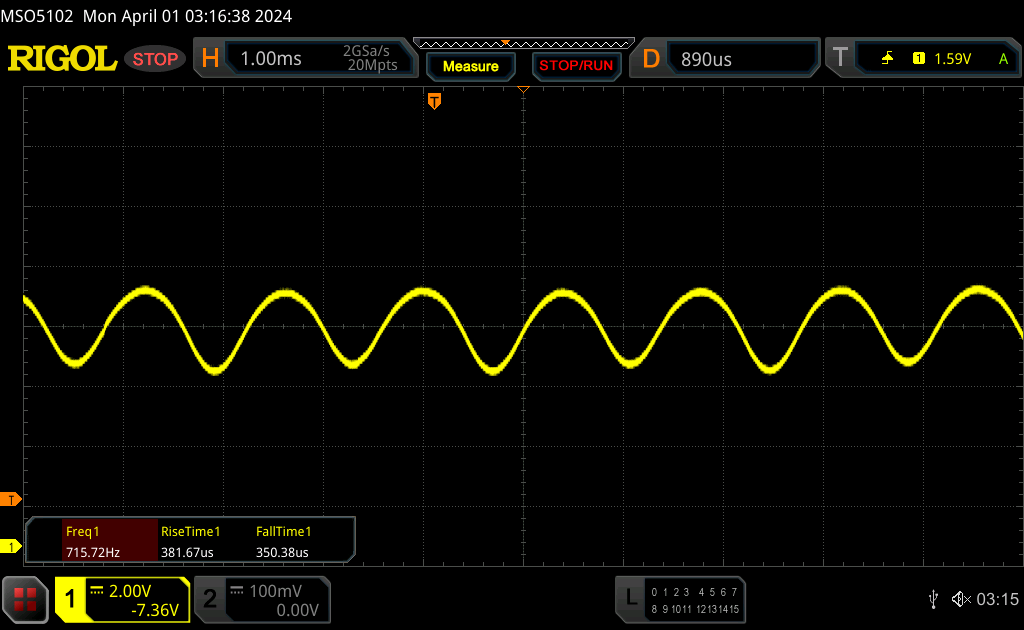 |
Il display sfarfalla a 360 Hz (Probabilmente a causa dell'uso di PWM) Flickering rilevato ad una luminosita' di 90 % o inferiore. Non dovrebbe verificarsi flickering o PWM sopra questo valore di luminosita'. La frequenza di 360 Hz è relativamente elevata, quindi la maggioranza degli utenti sensibili al PWM non dovrebbe notare alcun flickering. Tuttavia, è stato segnalato che alcuni utenti sono sensibili al PWM a 500 Hz ed oltre, quindi prestate attenzione. In confronto: 52 % di tutti i dispositivi testati non utilizza PWM per ridurre la luminosita' del display. Se è rilevato PWM, una media di 7747 (minimo: 5 - massimo: 343500) Hz è stata rilevata. | |||
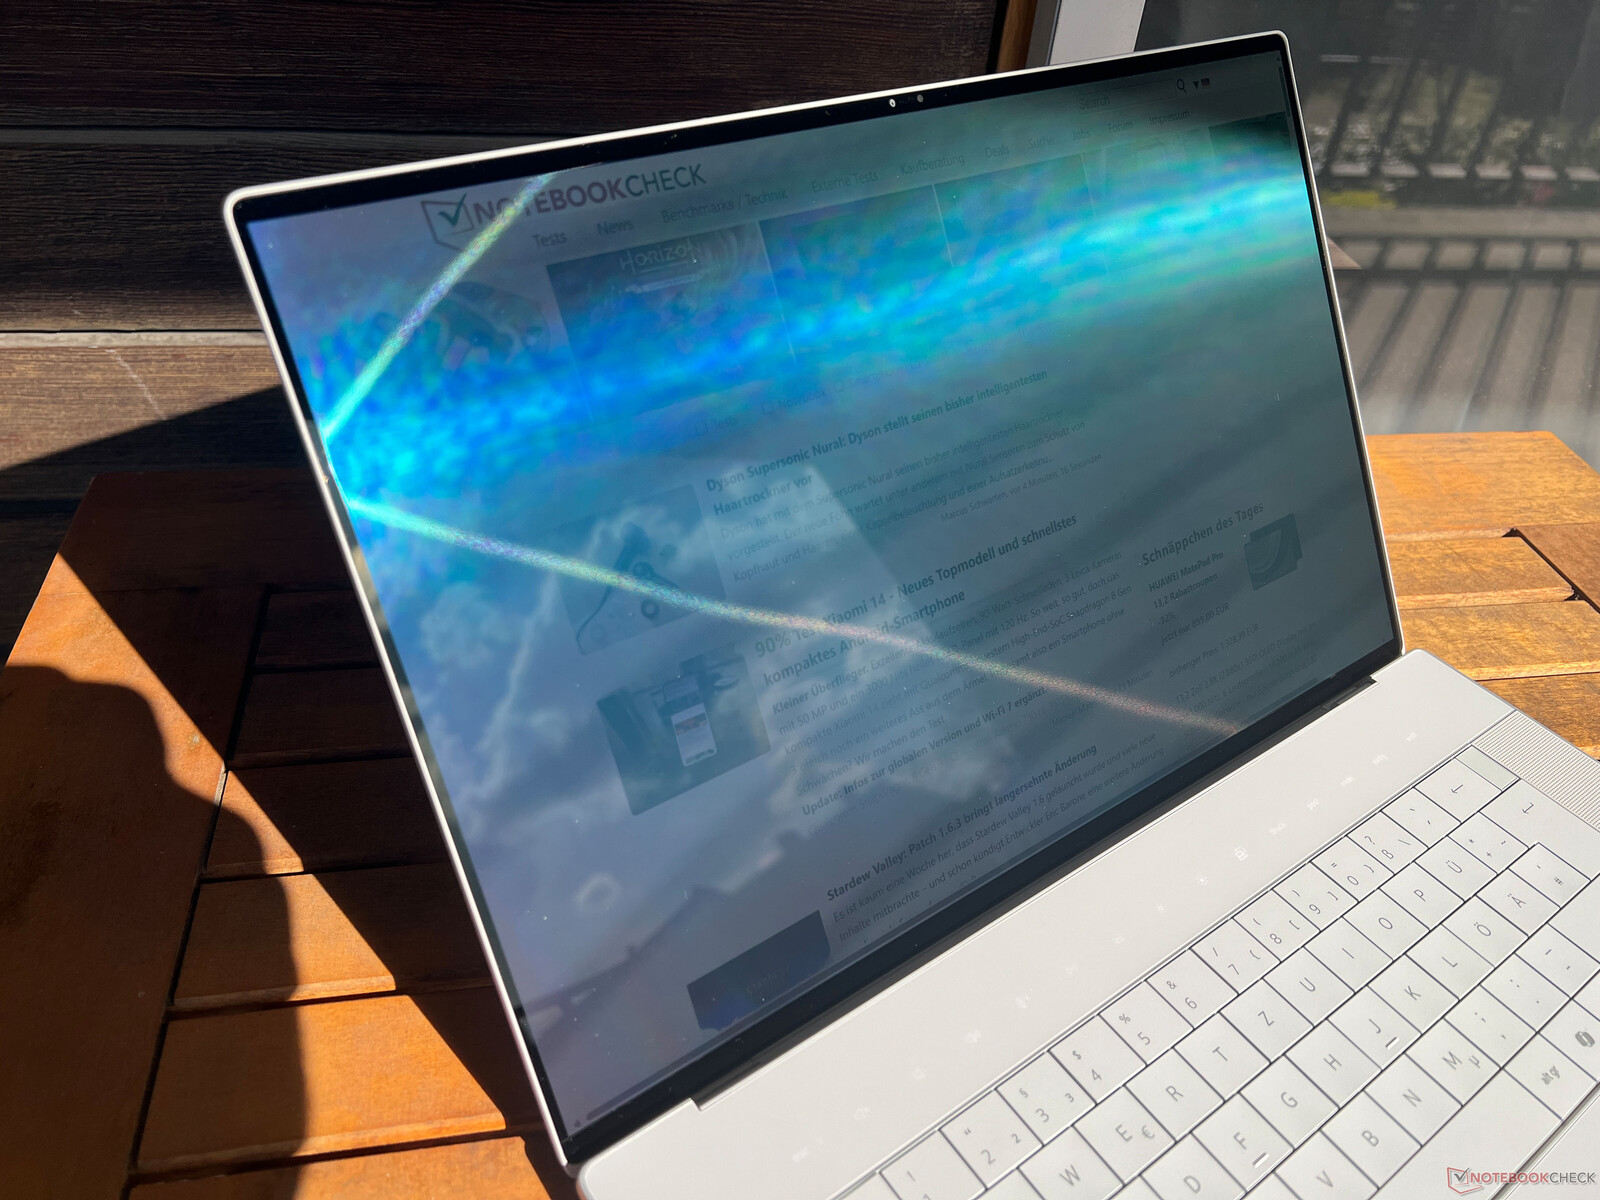
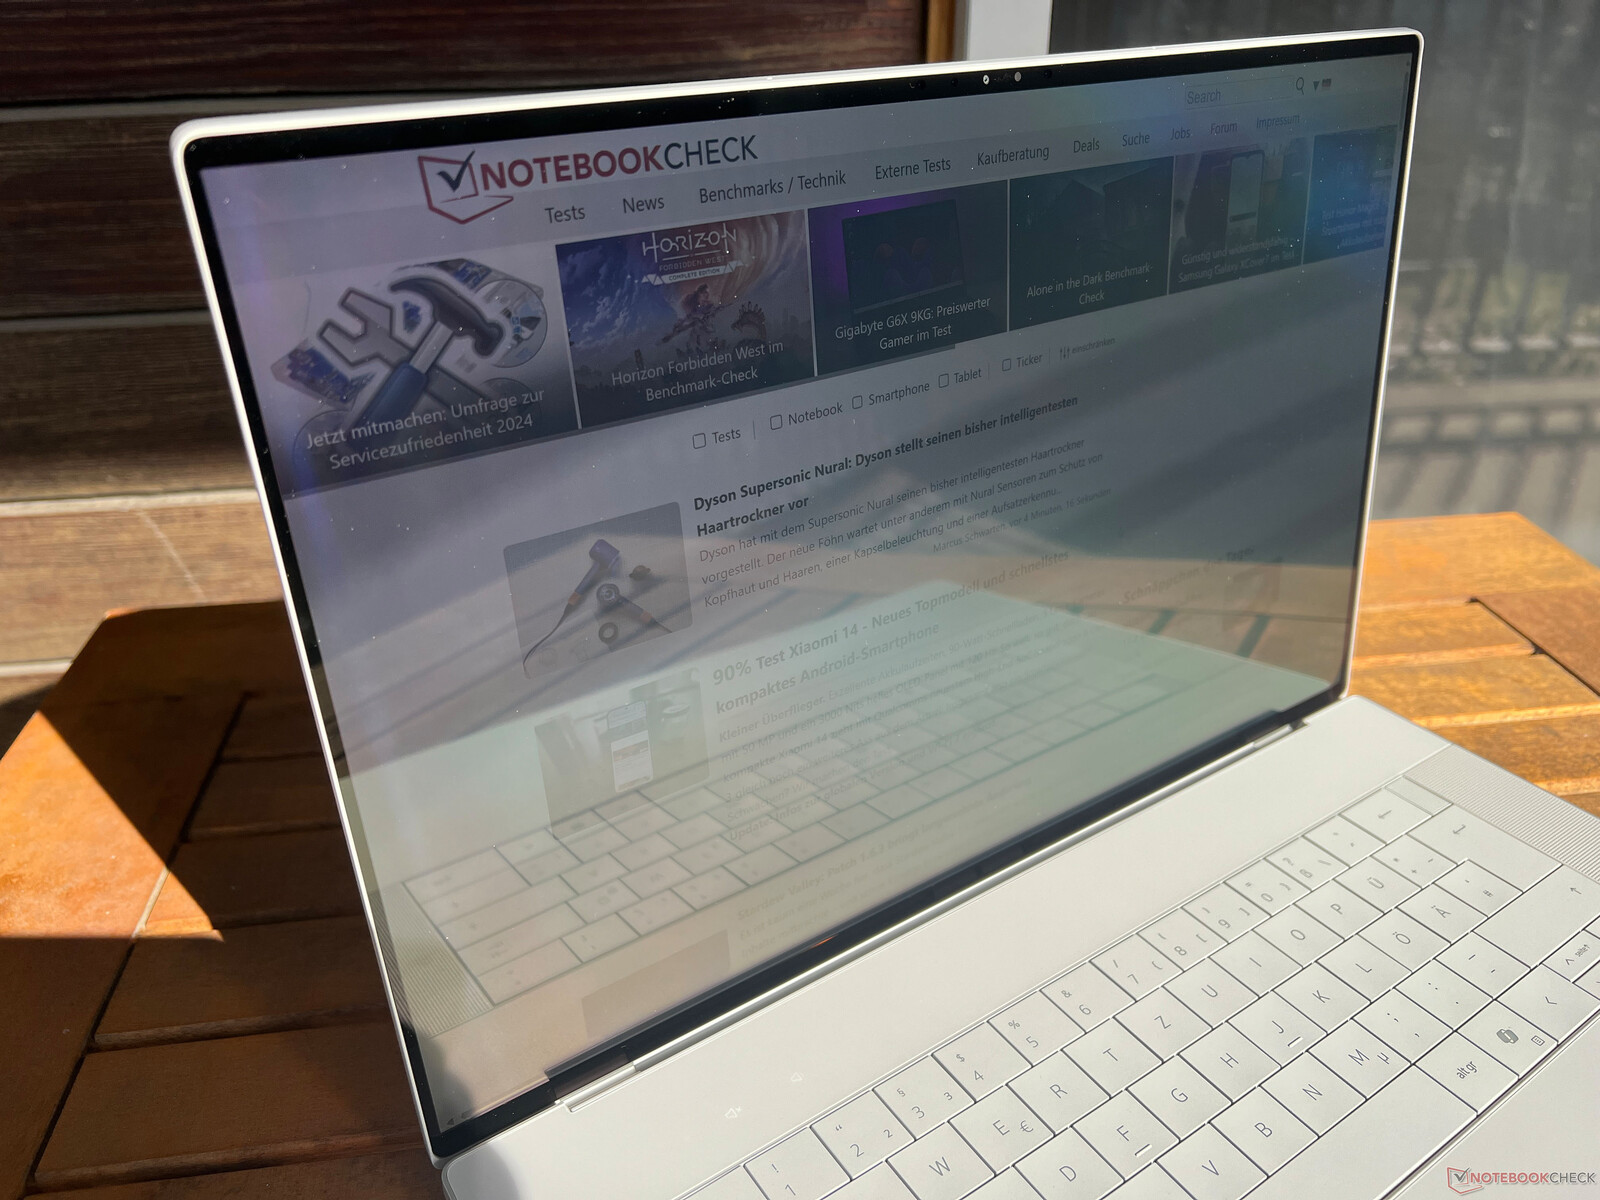
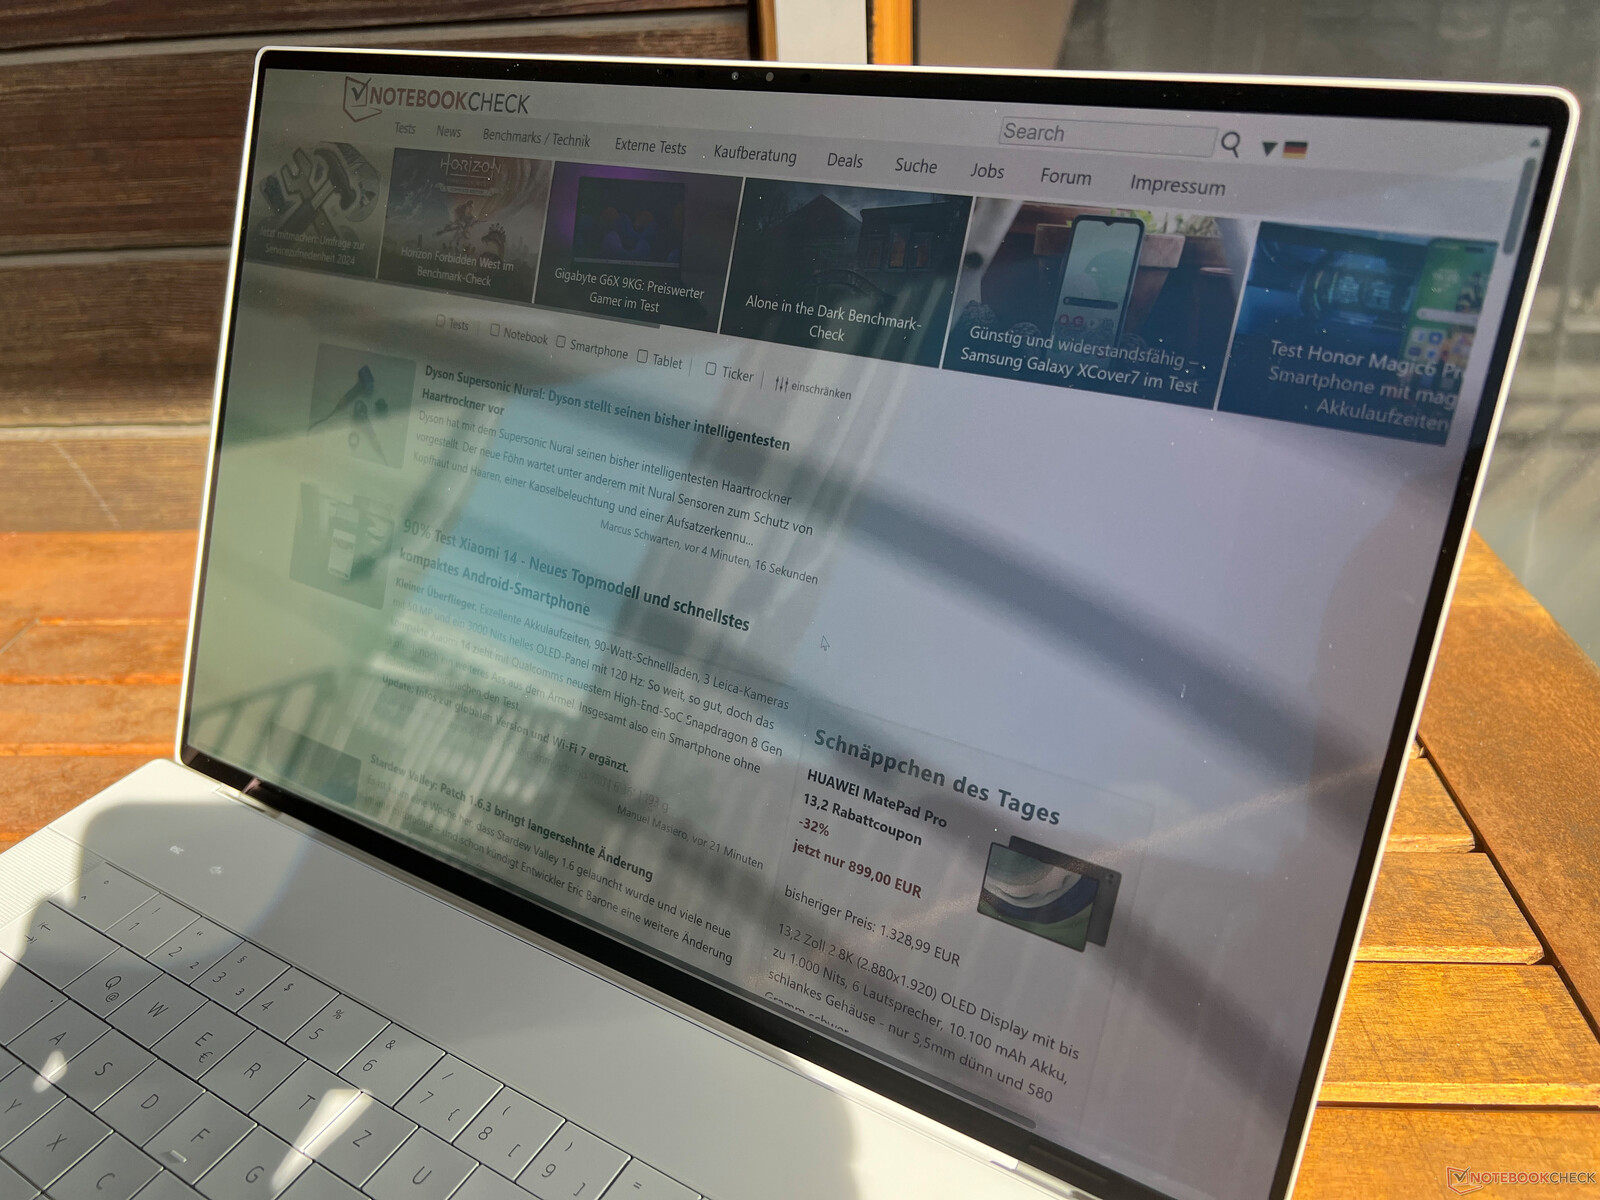
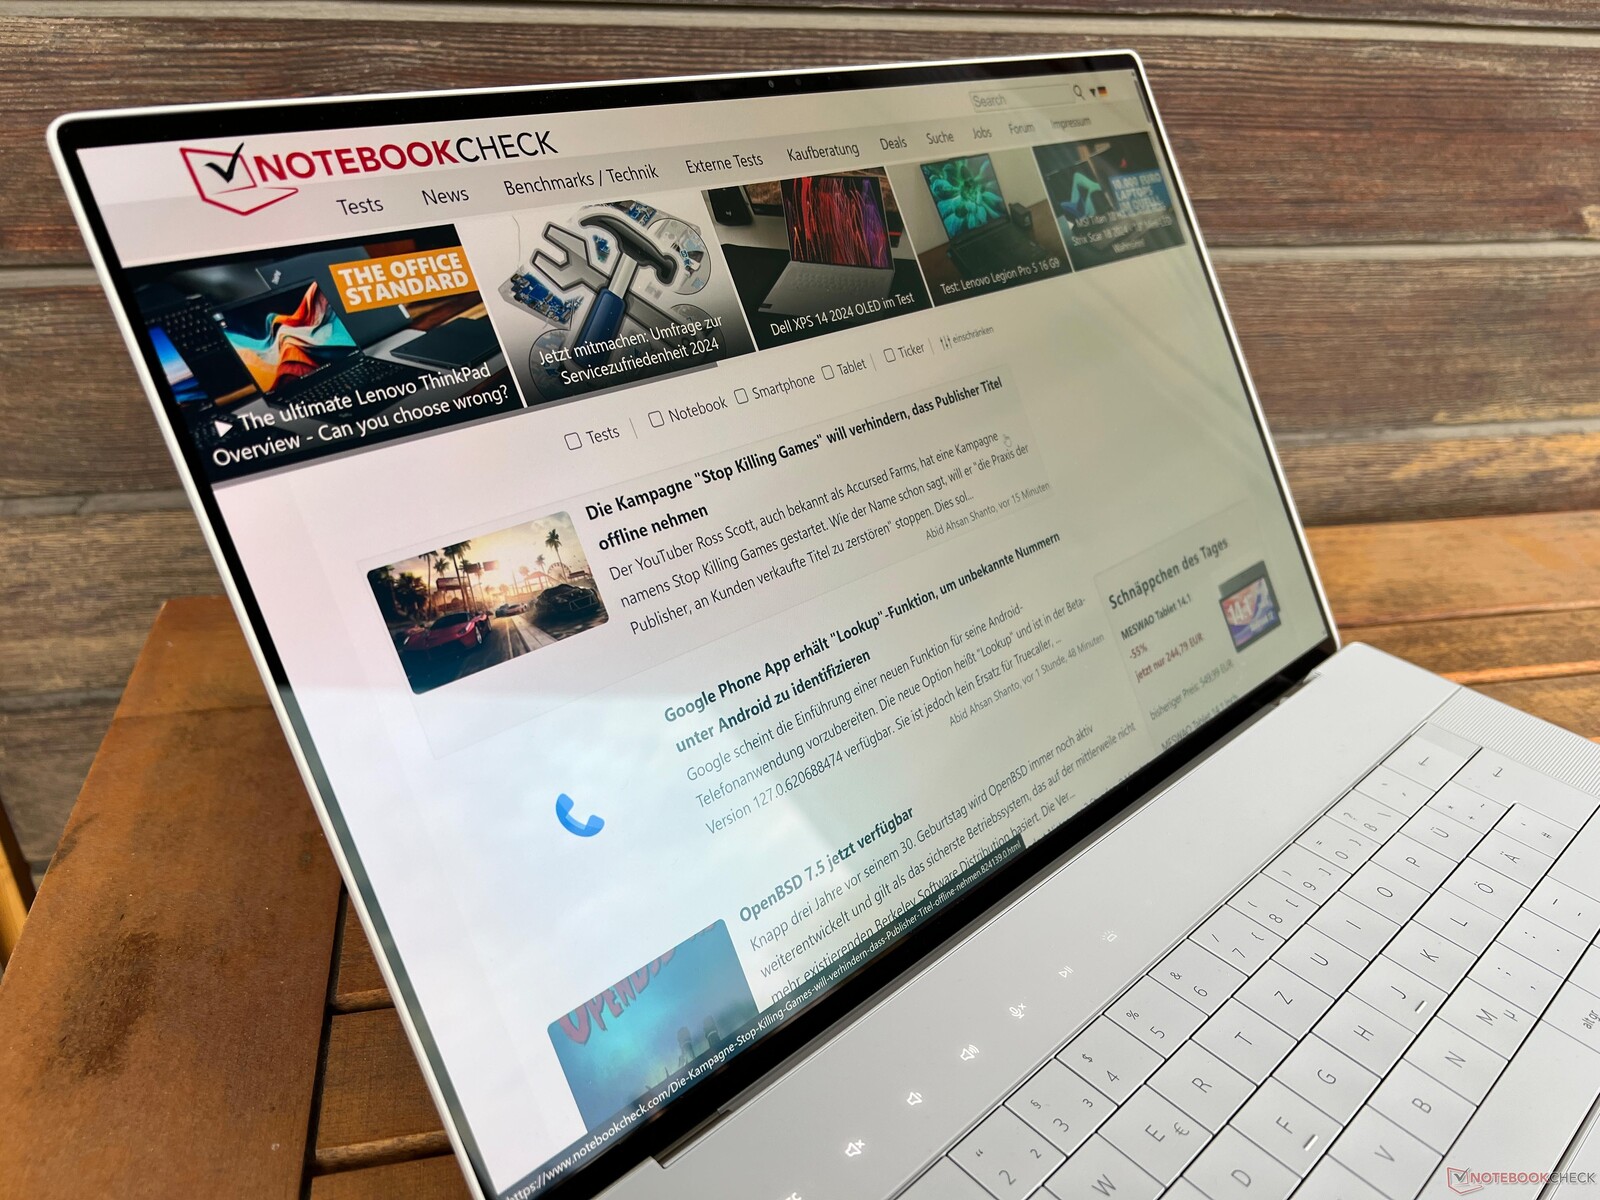
Il touchscreen è molto riflettente e i riflessi possono essere un problema anche in ambienti chiusi. All'esterno, dovrà anche cercare di evitare i riflessi delle fonti di luce o delle superfici luminose. È possibile utilizzare il portatile nelle giornate nuvolose, ma può diventare problematico nelle giornate luminose con molta luce solare. La stabilità dell'angolo di visione è generalmente molto buona, ma se ci sono grandi deviazioni dal centro dello schermo, si può notare il tipico luccichio blu OLED.

Prestazioni - L'XPS 16 con Advanced Optimus e fino a 64 GB di RAM
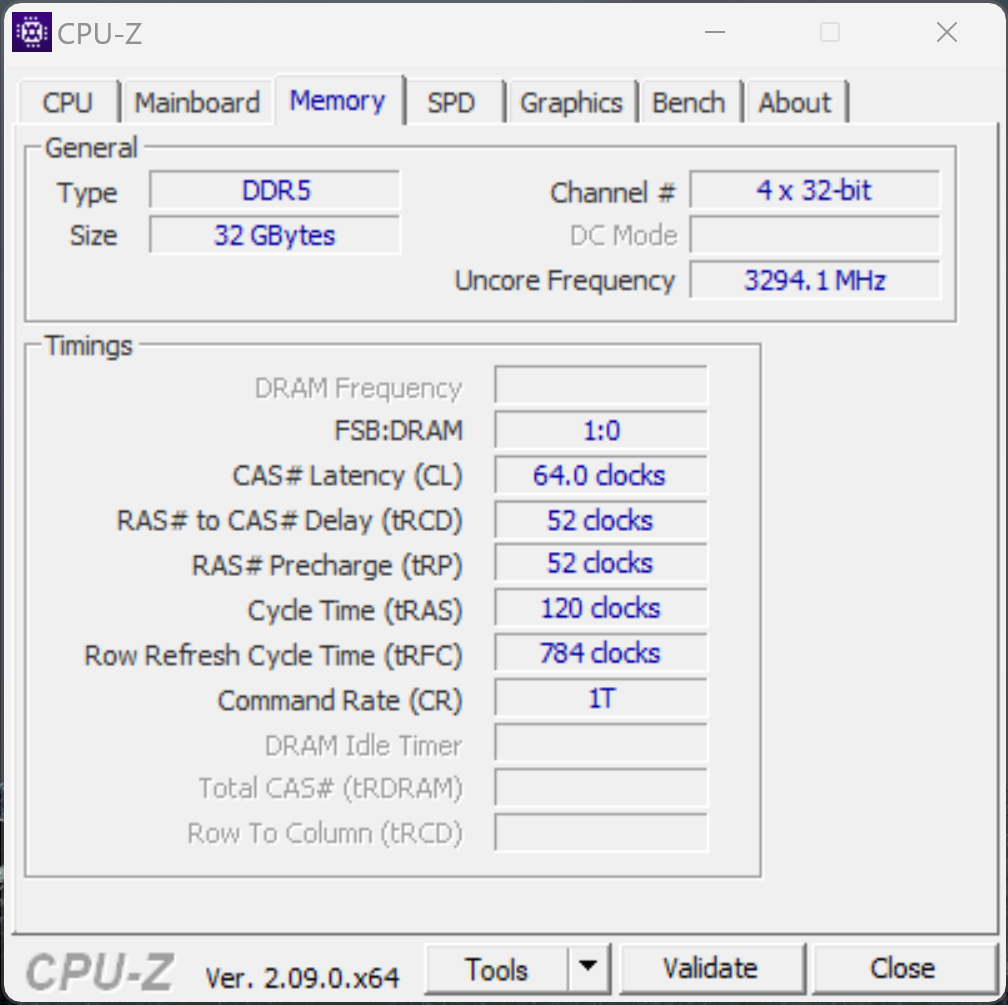
Come per il più piccolo XPS 14il nuovo XPS 16 può essere configurato senza una scheda grafica dedicata, ma solo in combinazione con 16 GB di RAM (LPDDR5x-6400). 32 GB di RAM sono disponibili solo in combinazione con GPU dedicate, e la RAM più veloce LPDDR5x-7467 può essere selezionata solo in combinazione con la scheda grafica RTX 4070 Laptop. Se desidera 64 GB di RAM, dovrà scegliere anche il modello Core Ultra 9 185H e almeno il RTX 4060 Laptop. L'XPS 16 è dotato di uno switch MUX e di uno switching grafico Advanced Optimus.
Condizioni di test
Dell consente agli utenti di selezionare diversi profili energetici, che possono anche essere combinati con le impostazioni delle prestazioni di Windows. Il profilo predefinito è Ottimizzato, ma le prestazioni complete della scheda grafica sono disponibili solo utilizzando la modalità Ultra Performance. Poiché le emissioni di rumore della ventola sono molto simili utilizzando questi due profili, abbiamo selezionato la modalità Ultra Performance per i nostri benchmark e misurazioni.
| Profilo energetico | Carico della CPU | CB R23 Multi | Carico della GPU | Time Spy Grafica | Cyberpunk 2077 QHD Ultra |
emissioni acustiche massime della ventola |
|---|---|---|---|---|---|---|
| Silenzioso | 80 -> 75 watt | 18.296 punti | 50 watt | 8.186 punti | 30,8fps | 43,3 dB(A) |
| Ottimizzato | 80 -> 75 watt | 18.248 punti | 50 watt | 8.532 punti | 37,4 fps | 48,1 dB(A) |
| Ultra Performance | 100 -> 85 watt | 18.518 punti | 60 watt | 9.638 punti | 39,6 fps | 49,7 dB(A) |
Durante il nostro test, ci siamo imbattuti in un bug durante il processo di commutazione della grafica, in quanto V-Sync era sempre attivo in modalità a schermo intero. In modalità a finestre e selezionando manualmente la GPU Nvidia nel driver grafico, il problema non si è verificato. Quando si collega un monitor esterno, la normale commutazione Optimus è attiva (poiché tutte le porte Thunderbolt funzionano tramite la GPU Intel) e il problema può essere riscontrato anche qui.
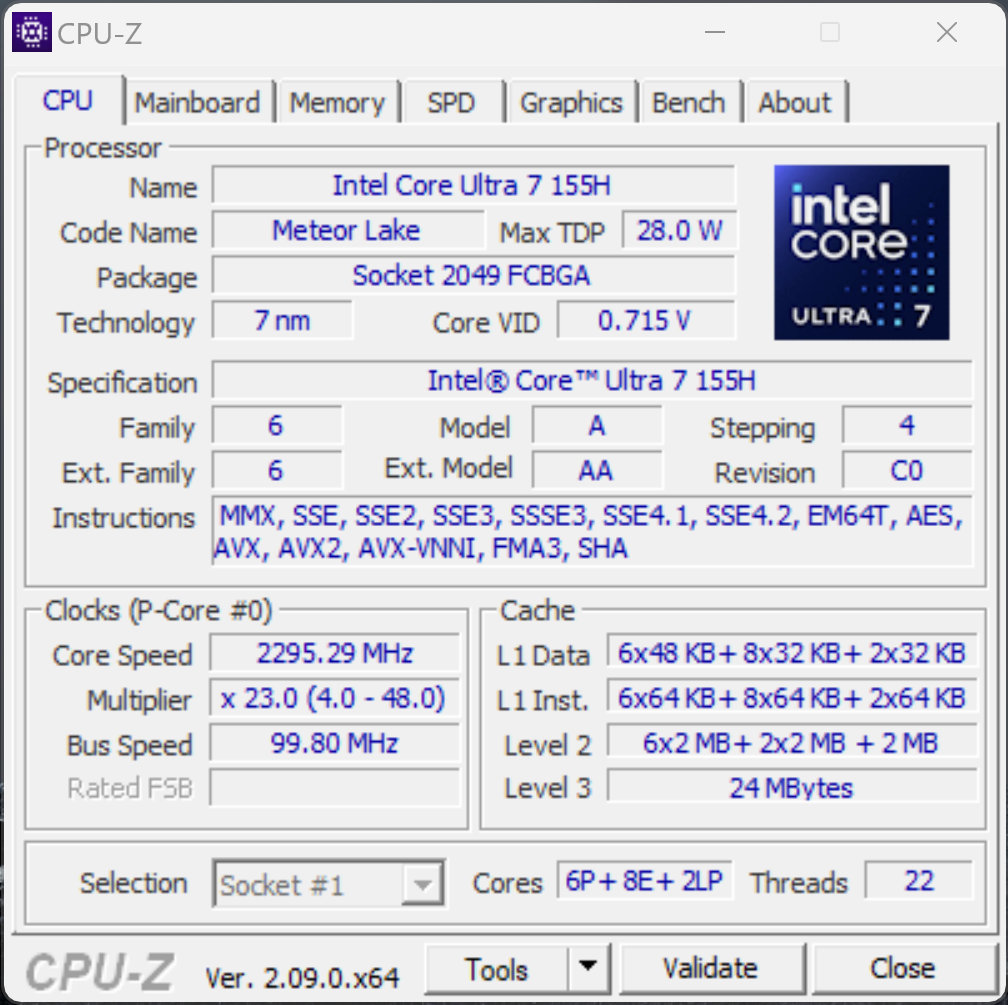
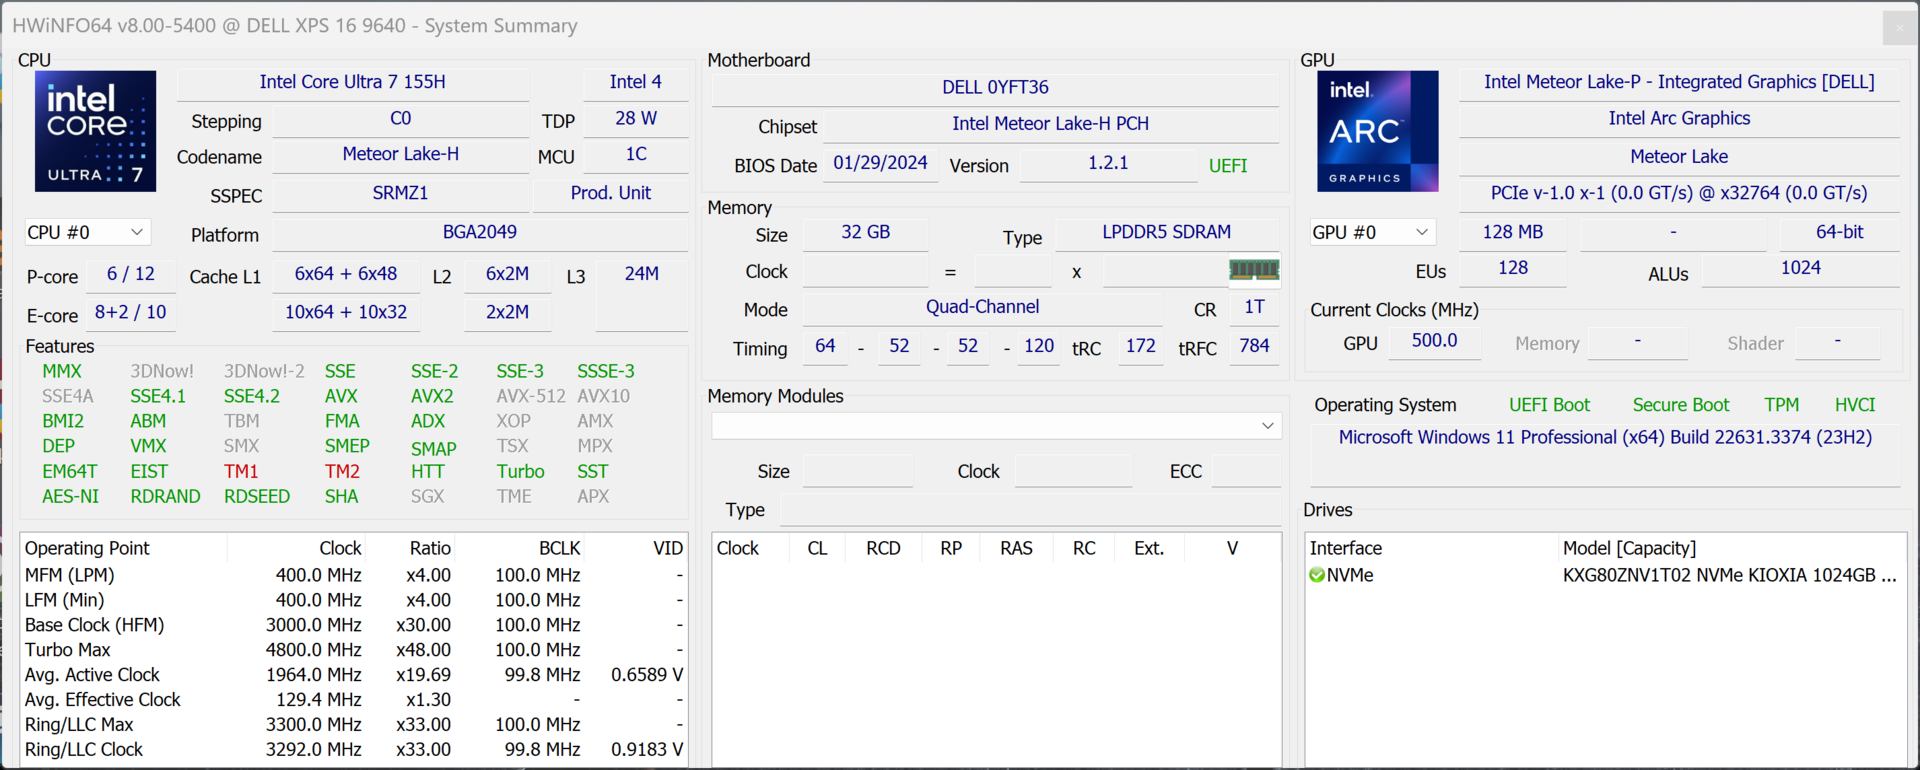
Processore - Core Ultra 7 155H
Il Core Ultra 7 155H fa parte dell'attuale generazione Meteor Lake di Intel, e sostituisce il vecchio Core i7-13700H. Ha 16 core (22 thread) e raggiunge una frequenza di clock massima di 4,8 GHz. Inoltre, anche le sue prestazioni multi-core complessive sono ottime, grazie agli elevati limiti di potenza (100/85 watt). Tuttavia, non c'è praticamente alcun vantaggio in termini di prestazioni rispetto ai vecchi chip Raptor Lake e le differenze tra i singoli dispositivi derivano dai diversi limiti di potenza. Per quanto riguarda le prestazioni single-core, invece, i nuovi chip Meteor Lake hanno un leggero svantaggio rispetto ai vecchi modelli Raptor Lake, come il 13700H. Nell'uso della batteria, il processore può consumare 75/45 watt (dove i 75 watt possono essere mantenuti per un bel po') e le sue prestazioni multi-core si riducono solo del 4% circa. A sua volta, le differenze sono maggiori con periodi di carico più lunghi. Ulteriori benchmark della CPU sono disponibili nella la nostra sezione tecnica.
Cinebench R15 Multi continuous test
Cinebench R23: Multi Core | Single Core
Cinebench R20: CPU (Multi Core) | CPU (Single Core)
Cinebench R15: CPU Multi 64Bit | CPU Single 64Bit
Blender: v2.79 BMW27 CPU
7-Zip 18.03: 7z b 4 | 7z b 4 -mmt1
Geekbench 6.7: Multi-Core | Single-Core
Geekbench 5.5: Multi-Core | Single-Core
HWBOT x265 Benchmark v2.2: 4k Preset
LibreOffice : 20 Documents To PDF
R Benchmark 2.5: Overall mean
| CPU Performance rating | |
| Lenovo Yoga Pro 9 16-IRP G8 | |
| Honor MagicBook Pro 16 2024 | |
| Dell XPS 16 9640 | |
| Media della classe Multimedia | |
| Asus ROG Zephyrus G16 2024 GU605M | |
| Dell XPS 15 9530 RTX 4070 -2! | |
| Samsung Galaxy Book4 Ultra | |
| Schenker VISION 16 Pro (M23) -2! | |
| Media Intel Core Ultra 7 155H | |
| Cinebench R23 / Multi Core | |
| Lenovo Yoga Pro 9 16-IRP G8 | |
| Honor MagicBook Pro 16 2024 | |
| Dell XPS 16 9640 | |
| Asus ROG Zephyrus G16 2024 GU605M | |
| Media della classe Multimedia (4861 - 33362, n=76, ultimi 2 anni) | |
| Samsung Galaxy Book4 Ultra | |
| Dell XPS 15 9530 RTX 4070 | |
| Media Intel Core Ultra 7 155H (9769 - 19007, n=52) | |
| Schenker VISION 16 Pro (M23) | |
| Cinebench R23 / Single Core | |
| Media della classe Multimedia (1128 - 2459, n=68, ultimi 2 anni) | |
| Schenker VISION 16 Pro (M23) | |
| Lenovo Yoga Pro 9 16-IRP G8 | |
| Dell XPS 15 9530 RTX 4070 | |
| Dell XPS 16 9640 | |
| Samsung Galaxy Book4 Ultra | |
| Honor MagicBook Pro 16 2024 | |
| Media Intel Core Ultra 7 155H (1496 - 1815, n=52) | |
| Asus ROG Zephyrus G16 2024 GU605M | |
| Cinebench R20 / CPU (Multi Core) | |
| Lenovo Yoga Pro 9 16-IRP G8 | |
| Honor MagicBook Pro 16 2024 | |
| Dell XPS 16 9640 | |
| Asus ROG Zephyrus G16 2024 GU605M | |
| Media della classe Multimedia (1887 - 12912, n=59, ultimi 2 anni) | |
| Samsung Galaxy Book4 Ultra | |
| Dell XPS 15 9530 RTX 4070 | |
| Media Intel Core Ultra 7 155H (3798 - 7409, n=50) | |
| Schenker VISION 16 Pro (M23) | |
| Cinebench R20 / CPU (Single Core) | |
| Lenovo Yoga Pro 9 16-IRP G8 | |
| Media della classe Multimedia (425 - 853, n=59, ultimi 2 anni) | |
| Schenker VISION 16 Pro (M23) | |
| Dell XPS 15 9530 RTX 4070 | |
| Asus ROG Zephyrus G16 2024 GU605M | |
| Samsung Galaxy Book4 Ultra | |
| Honor MagicBook Pro 16 2024 | |
| Dell XPS 16 9640 | |
| Media Intel Core Ultra 7 155H (601 - 696, n=50) | |
| Cinebench R15 / CPU Multi 64Bit | |
| Lenovo Yoga Pro 9 16-IRP G8 | |
| Honor MagicBook Pro 16 2024 | |
| Dell XPS 16 9640 | |
| Asus ROG Zephyrus G16 2024 GU605M | |
| Dell XPS 15 9530 RTX 4070 | |
| Media della classe Multimedia (856 - 5224, n=63, ultimi 2 anni) | |
| Samsung Galaxy Book4 Ultra | |
| Media Intel Core Ultra 7 155H (1932 - 2880, n=56) | |
| Schenker VISION 16 Pro (M23) | |
| Cinebench R15 / CPU Single 64Bit | |
| Media della classe Multimedia (184.8 - 326, n=61, ultimi 2 anni) | |
| Schenker VISION 16 Pro (M23) | |
| Lenovo Yoga Pro 9 16-IRP G8 | |
| Dell XPS 15 9530 RTX 4070 | |
| Honor MagicBook Pro 16 2024 | |
| Asus ROG Zephyrus G16 2024 GU605M | |
| Dell XPS 16 9640 | |
| Samsung Galaxy Book4 Ultra | |
| Media Intel Core Ultra 7 155H (99.6 - 268, n=52) | |
| Blender / v2.79 BMW27 CPU | |
| Media della classe Multimedia (100 - 557, n=60, ultimi 2 anni) | |
| Media Intel Core Ultra 7 155H (175 - 381, n=47) | |
| Schenker VISION 16 Pro (M23) | |
| Samsung Galaxy Book4 Ultra | |
| Dell XPS 15 9530 RTX 4070 | |
| Asus ROG Zephyrus G16 2024 GU605M | |
| Honor MagicBook Pro 16 2024 | |
| Dell XPS 16 9640 | |
| Lenovo Yoga Pro 9 16-IRP G8 | |
| 7-Zip 18.03 / 7z b 4 | |
| Lenovo Yoga Pro 9 16-IRP G8 | |
| Dell XPS 16 9640 | |
| Honor MagicBook Pro 16 2024 | |
| Asus ROG Zephyrus G16 2024 GU605M | |
| Samsung Galaxy Book4 Ultra | |
| Schenker VISION 16 Pro (M23) | |
| Dell XPS 15 9530 RTX 4070 | |
| Media Intel Core Ultra 7 155H (41739 - 70254, n=50) | |
| Media della classe Multimedia (26062 - 130368, n=57, ultimi 2 anni) | |
| 7-Zip 18.03 / 7z b 4 -mmt1 | |
| Schenker VISION 16 Pro (M23) | |
| Dell XPS 15 9530 RTX 4070 | |
| Lenovo Yoga Pro 9 16-IRP G8 | |
| Media della classe Multimedia (3666 - 7545, n=58, ultimi 2 anni) | |
| Samsung Galaxy Book4 Ultra | |
| Honor MagicBook Pro 16 2024 | |
| Dell XPS 16 9640 | |
| Asus ROG Zephyrus G16 2024 GU605M | |
| Media Intel Core Ultra 7 155H (4594 - 5621, n=50) | |
| Geekbench 6.7 / Multi-Core | |
| Media della classe Multimedia (4983 - 29415, n=71, ultimi 2 anni) | |
| Lenovo Yoga Pro 9 16-IRP G8 | |
| Dell XPS 16 9640 | |
| Asus ROG Zephyrus G16 2024 GU605M | |
| Honor MagicBook Pro 16 2024 | |
| Samsung Galaxy Book4 Ultra | |
| Media Intel Core Ultra 7 155H (7732 - 13656, n=55) | |
| Geekbench 6.7 / Single-Core | |
| Media della classe Multimedia (1534 - 4335, n=70, ultimi 2 anni) | |
| Lenovo Yoga Pro 9 16-IRP G8 | |
| Honor MagicBook Pro 16 2024 | |
| Samsung Galaxy Book4 Ultra | |
| Dell XPS 16 9640 | |
| Asus ROG Zephyrus G16 2024 GU605M | |
| Media Intel Core Ultra 7 155H (1901 - 2473, n=52) | |
| Geekbench 5.5 / Multi-Core | |
| Lenovo Yoga Pro 9 16-IRP G8 | |
| Dell XPS 16 9640 | |
| Dell XPS 15 9530 RTX 4070 | |
| Honor MagicBook Pro 16 2024 | |
| Media della classe Multimedia (4652 - 20422, n=58, ultimi 2 anni) | |
| Asus ROG Zephyrus G16 2024 GU605M | |
| Samsung Galaxy Book4 Ultra | |
| Media Intel Core Ultra 7 155H (10017 - 13556, n=52) | |
| Schenker VISION 16 Pro (M23) | |
| Geekbench 5.5 / Single-Core | |
| Media della classe Multimedia (805 - 2974, n=58, ultimi 2 anni) | |
| Dell XPS 15 9530 RTX 4070 | |
| Schenker VISION 16 Pro (M23) | |
| Samsung Galaxy Book4 Ultra | |
| Honor MagicBook Pro 16 2024 | |
| Lenovo Yoga Pro 9 16-IRP G8 | |
| Dell XPS 16 9640 | |
| Asus ROG Zephyrus G16 2024 GU605M | |
| Media Intel Core Ultra 7 155H (1462 - 1824, n=52) | |
| HWBOT x265 Benchmark v2.2 / 4k Preset | |
| Lenovo Yoga Pro 9 16-IRP G8 | |
| Dell XPS 16 9640 | |
| Honor MagicBook Pro 16 2024 | |
| Asus ROG Zephyrus G16 2024 GU605M | |
| Media della classe Multimedia (5.26 - 36.1, n=58, ultimi 2 anni) | |
| Dell XPS 15 9530 RTX 4070 | |
| Samsung Galaxy Book4 Ultra | |
| Schenker VISION 16 Pro (M23) | |
| Media Intel Core Ultra 7 155H (9.93 - 21.2, n=50) | |
| LibreOffice / 20 Documents To PDF | |
| Media della classe Multimedia (23.9 - 146.7, n=59, ultimi 2 anni) | |
| Asus ROG Zephyrus G16 2024 GU605M | |
| Media Intel Core Ultra 7 155H (37.5 - 79.2, n=49) | |
| Lenovo Yoga Pro 9 16-IRP G8 | |
| Schenker VISION 16 Pro (M23) | |
| Honor MagicBook Pro 16 2024 | |
| Samsung Galaxy Book4 Ultra | |
| Dell XPS 16 9640 | |
| Dell XPS 15 9530 RTX 4070 | |
| R Benchmark 2.5 / Overall mean | |
| Dell XPS 16 9640 | |
| Media Intel Core Ultra 7 155H (0.4457 - 0.53, n=49) | |
| Samsung Galaxy Book4 Ultra | |
| Asus ROG Zephyrus G16 2024 GU605M | |
| Media della classe Multimedia (0.3604 - 0.947, n=58, ultimi 2 anni) | |
| Honor MagicBook Pro 16 2024 | |
| Lenovo Yoga Pro 9 16-IRP G8 | |
| Dell XPS 15 9530 RTX 4070 | |
| Schenker VISION 16 Pro (M23) | |
* ... Meglio usare valori piccoli
AIDA64: FP32 Ray-Trace | FPU Julia | CPU SHA3 | CPU Queen | FPU SinJulia | FPU Mandel | CPU AES | CPU ZLib | FP64 Ray-Trace | CPU PhotoWorxx
| Performance rating | |
| Honor MagicBook Pro 16 2024 | |
| Lenovo Yoga Pro 9 16-IRP G8 | |
| Dell XPS 16 9640 | |
| Asus ROG Zephyrus G16 2024 GU605M | |
| Media della classe Multimedia | |
| Samsung Galaxy Book4 Ultra | |
| Schenker VISION 16 Pro (M23) | |
| Dell XPS 15 9530 RTX 4070 | |
| Media Intel Core Ultra 7 155H | |
| AIDA64 / FP32 Ray-Trace | |
| Media della classe Multimedia (2214 - 50388, n=55, ultimi 2 anni) | |
| Lenovo Yoga Pro 9 16-IRP G8 | |
| Honor MagicBook Pro 16 2024 | |
| Dell XPS 16 9640 | |
| Asus ROG Zephyrus G16 2024 GU605M | |
| Dell XPS 15 9530 RTX 4070 | |
| Samsung Galaxy Book4 Ultra | |
| Schenker VISION 16 Pro (M23) | |
| Media Intel Core Ultra 7 155H (6670 - 18470, n=50) | |
| AIDA64 / FPU Julia | |
| Honor MagicBook Pro 16 2024 | |
| Lenovo Yoga Pro 9 16-IRP G8 | |
| Dell XPS 16 9640 | |
| Asus ROG Zephyrus G16 2024 GU605M | |
| Media della classe Multimedia (12867 - 201874, n=56, ultimi 2 anni) | |
| Samsung Galaxy Book4 Ultra | |
| Schenker VISION 16 Pro (M23) | |
| Media Intel Core Ultra 7 155H (40905 - 93181, n=50) | |
| Dell XPS 15 9530 RTX 4070 | |
| AIDA64 / CPU SHA3 | |
| Honor MagicBook Pro 16 2024 | |
| Lenovo Yoga Pro 9 16-IRP G8 | |
| Dell XPS 16 9640 | |
| Media della classe Multimedia (626 - 8623, n=56, ultimi 2 anni) | |
| Asus ROG Zephyrus G16 2024 GU605M | |
| Samsung Galaxy Book4 Ultra | |
| Media Intel Core Ultra 7 155H (1940 - 4436, n=50) | |
| Schenker VISION 16 Pro (M23) | |
| Dell XPS 15 9530 RTX 4070 | |
| AIDA64 / CPU Queen | |
| Lenovo Yoga Pro 9 16-IRP G8 | |
| Dell XPS 15 9530 RTX 4070 | |
| Schenker VISION 16 Pro (M23) | |
| Asus ROG Zephyrus G16 2024 GU605M | |
| Dell XPS 16 9640 | |
| Samsung Galaxy Book4 Ultra | |
| Honor MagicBook Pro 16 2024 | |
| Media Intel Core Ultra 7 155H (64698 - 94181, n=50) | |
| Media della classe Multimedia (13483 - 181505, n=43, ultimi 2 anni) | |
| AIDA64 / FPU SinJulia | |
| Lenovo Yoga Pro 9 16-IRP G8 | |
| Asus ROG Zephyrus G16 2024 GU605M | |
| Honor MagicBook Pro 16 2024 | |
| Dell XPS 16 9640 | |
| Samsung Galaxy Book4 Ultra | |
| Media Intel Core Ultra 7 155H (5639 - 10647, n=50) | |
| Schenker VISION 16 Pro (M23) | |
| Media della classe Multimedia (886 - 28794, n=56, ultimi 2 anni) | |
| Dell XPS 15 9530 RTX 4070 | |
| AIDA64 / FPU Mandel | |
| Dell XPS 16 9640 | |
| Honor MagicBook Pro 16 2024 | |
| Media della classe Multimedia (6395 - 105740, n=55, ultimi 2 anni) | |
| Lenovo Yoga Pro 9 16-IRP G8 | |
| Asus ROG Zephyrus G16 2024 GU605M | |
| Samsung Galaxy Book4 Ultra | |
| Media Intel Core Ultra 7 155H (18236 - 47685, n=50) | |
| Dell XPS 15 9530 RTX 4070 | |
| Schenker VISION 16 Pro (M23) | |
| AIDA64 / CPU AES | |
| Honor MagicBook Pro 16 2024 | |
| Lenovo Yoga Pro 9 16-IRP G8 | |
| Dell XPS 16 9640 | |
| Asus ROG Zephyrus G16 2024 GU605M | |
| Media Intel Core Ultra 7 155H (45713 - 152179, n=50) | |
| Samsung Galaxy Book4 Ultra | |
| Schenker VISION 16 Pro (M23) | |
| Media della classe Multimedia (8171 - 126790, n=56, ultimi 2 anni) | |
| Dell XPS 15 9530 RTX 4070 | |
| AIDA64 / CPU ZLib | |
| Honor MagicBook Pro 16 2024 | |
| Lenovo Yoga Pro 9 16-IRP G8 | |
| Dell XPS 16 9640 | |
| Asus ROG Zephyrus G16 2024 GU605M | |
| Media della classe Multimedia (143.8 - 2022, n=56, ultimi 2 anni) | |
| Samsung Galaxy Book4 Ultra | |
| Media Intel Core Ultra 7 155H (557 - 1250, n=50) | |
| Schenker VISION 16 Pro (M23) | |
| Dell XPS 15 9530 RTX 4070 | |
| AIDA64 / FP64 Ray-Trace | |
| Media della classe Multimedia (1014 - 26875, n=56, ultimi 2 anni) | |
| Lenovo Yoga Pro 9 16-IRP G8 | |
| Dell XPS 16 9640 | |
| Honor MagicBook Pro 16 2024 | |
| Asus ROG Zephyrus G16 2024 GU605M | |
| Dell XPS 15 9530 RTX 4070 | |
| Schenker VISION 16 Pro (M23) | |
| Samsung Galaxy Book4 Ultra | |
| Media Intel Core Ultra 7 155H (3569 - 9802, n=50) | |
| AIDA64 / CPU PhotoWorxx | |
| Lenovo Yoga Pro 9 16-IRP G8 | |
| Dell XPS 16 9640 | |
| Samsung Galaxy Book4 Ultra | |
| Media della classe Multimedia (8187 - 88154, n=56, ultimi 2 anni) | |
| Asus ROG Zephyrus G16 2024 GU605M | |
| Media Intel Core Ultra 7 155H (32719 - 54223, n=50) | |
| Honor MagicBook Pro 16 2024 | |
| Schenker VISION 16 Pro (M23) | |
| Dell XPS 15 9530 RTX 4070 | |
Prestazioni del sistema
Nell'uso quotidiano, il nuovo XPS 16 9640 è un dispositivo molto reattivo e non abbiamo notato anomalie nemmeno nei benchmark sintetici. Non abbiamo avuto problemi con il portatile durante il nostro test.
CrossMark: Overall | Productivity | Creativity | Responsiveness
WebXPRT 3: Overall
WebXPRT 4: Overall
Mozilla Kraken 1.1: Total
| PCMark 10 / Score | |
| Media della classe Multimedia (4325 - 10386, n=54, ultimi 2 anni) | |
| Media Intel Core Ultra 7 155H, NVIDIA GeForce RTX 4070 Laptop GPU (7084 - 7761, n=4) | |
| Schenker VISION 16 Pro (M23) | |
| Lenovo Yoga Pro 9 16-IRP G8 | |
| Dell XPS 15 9530 RTX 4070 | |
| Asus ROG Zephyrus G16 2024 GU605M | |
| Dell XPS 16 9640 | |
| Samsung Galaxy Book4 Ultra | |
| Honor MagicBook Pro 16 2024 | |
| PCMark 10 / Essentials | |
| Dell XPS 15 9530 RTX 4070 | |
| Lenovo Yoga Pro 9 16-IRP G8 | |
| Schenker VISION 16 Pro (M23) | |
| Media della classe Multimedia (8025 - 11664, n=53, ultimi 2 anni) | |
| Samsung Galaxy Book4 Ultra | |
| Dell XPS 16 9640 | |
| Media Intel Core Ultra 7 155H, NVIDIA GeForce RTX 4070 Laptop GPU (10038 - 10393, n=4) | |
| Asus ROG Zephyrus G16 2024 GU605M | |
| Honor MagicBook Pro 16 2024 | |
| PCMark 10 / Productivity | |
| Media della classe Multimedia (7323 - 18233, n=53, ultimi 2 anni) | |
| Schenker VISION 16 Pro (M23) | |
| Media Intel Core Ultra 7 155H, NVIDIA GeForce RTX 4070 Laptop GPU (9192 - 9518, n=4) | |
| Asus ROG Zephyrus G16 2024 GU605M | |
| Dell XPS 16 9640 | |
| Samsung Galaxy Book4 Ultra | |
| Lenovo Yoga Pro 9 16-IRP G8 | |
| Dell XPS 15 9530 RTX 4070 | |
| Honor MagicBook Pro 16 2024 | |
| PCMark 10 / Digital Content Creation | |
| Media Intel Core Ultra 7 155H, NVIDIA GeForce RTX 4070 Laptop GPU (10100 - 13035, n=4) | |
| Lenovo Yoga Pro 9 16-IRP G8 | |
| Schenker VISION 16 Pro (M23) | |
| Honor MagicBook Pro 16 2024 | |
| Dell XPS 15 9530 RTX 4070 | |
| Asus ROG Zephyrus G16 2024 GU605M | |
| Media della classe Multimedia (3651 - 16240, n=53, ultimi 2 anni) | |
| Dell XPS 16 9640 | |
| Samsung Galaxy Book4 Ultra | |
| CrossMark / Overall | |
| Schenker VISION 16 Pro (M23) | |
| Dell XPS 15 9530 RTX 4070 | |
| Media della classe Multimedia (866 - 2728, n=62, ultimi 2 anni) | |
| Dell XPS 16 9640 | |
| Lenovo Yoga Pro 9 16-IRP G8 | |
| Media Intel Core Ultra 7 155H, NVIDIA GeForce RTX 4070 Laptop GPU (1687 - 1848, n=4) | |
| Samsung Galaxy Book4 Ultra | |
| Honor MagicBook Pro 16 2024 | |
| Asus ROG Zephyrus G16 2024 GU605M | |
| CrossMark / Productivity | |
| Schenker VISION 16 Pro (M23) | |
| Media della classe Multimedia (931 - 2489, n=62, ultimi 2 anni) | |
| Dell XPS 15 9530 RTX 4070 | |
| Dell XPS 16 9640 | |
| Lenovo Yoga Pro 9 16-IRP G8 | |
| Honor MagicBook Pro 16 2024 | |
| Media Intel Core Ultra 7 155H, NVIDIA GeForce RTX 4070 Laptop GPU (1589 - 1750, n=4) | |
| Samsung Galaxy Book4 Ultra | |
| Asus ROG Zephyrus G16 2024 GU605M | |
| CrossMark / Creativity | |
| Media della classe Multimedia (907 - 3465, n=62, ultimi 2 anni) | |
| Dell XPS 15 9530 RTX 4070 | |
| Lenovo Yoga Pro 9 16-IRP G8 | |
| Dell XPS 16 9640 | |
| Schenker VISION 16 Pro (M23) | |
| Asus ROG Zephyrus G16 2024 GU605M | |
| Media Intel Core Ultra 7 155H, NVIDIA GeForce RTX 4070 Laptop GPU (1860 - 2014, n=4) | |
| Samsung Galaxy Book4 Ultra | |
| Honor MagicBook Pro 16 2024 | |
| CrossMark / Responsiveness | |
| Schenker VISION 16 Pro (M23) | |
| Dell XPS 16 9640 | |
| Dell XPS 15 9530 RTX 4070 | |
| Honor MagicBook Pro 16 2024 | |
| Media Intel Core Ultra 7 155H, NVIDIA GeForce RTX 4070 Laptop GPU (1424 - 1683, n=4) | |
| Lenovo Yoga Pro 9 16-IRP G8 | |
| Media della classe Multimedia (605 - 2024, n=62, ultimi 2 anni) | |
| Samsung Galaxy Book4 Ultra | |
| Asus ROG Zephyrus G16 2024 GU605M | |
| WebXPRT 3 / Overall | |
| Media della classe Multimedia (136.4 - 596, n=65, ultimi 2 anni) | |
| Dell XPS 15 9530 RTX 4070 | |
| Schenker VISION 16 Pro (M23) | |
| Lenovo Yoga Pro 9 16-IRP G8 | |
| Honor MagicBook Pro 16 2024 | |
| Asus ROG Zephyrus G16 2024 GU605M | |
| Dell XPS 16 9640 | |
| Samsung Galaxy Book4 Ultra | |
| Media Intel Core Ultra 7 155H, NVIDIA GeForce RTX 4070 Laptop GPU (264 - 294, n=4) | |
| WebXPRT 4 / Overall | |
| Media della classe Multimedia (167.3 - 402, n=67, ultimi 2 anni) | |
| Dell XPS 15 9530 RTX 4070 | |
| Schenker VISION 16 Pro (M23) | |
| Lenovo Yoga Pro 9 16-IRP G8 | |
| Honor MagicBook Pro 16 2024 | |
| Samsung Galaxy Book4 Ultra | |
| Asus ROG Zephyrus G16 2024 GU605M | |
| Dell XPS 16 9640 | |
| Media Intel Core Ultra 7 155H, NVIDIA GeForce RTX 4070 Laptop GPU (247 - 257, n=4) | |
| Mozilla Kraken 1.1 / Total | |
| Media Intel Core Ultra 7 155H, NVIDIA GeForce RTX 4070 Laptop GPU (546 - 568, n=3) | |
| Asus ROG Zephyrus G16 2024 GU605M | |
| Honor MagicBook Pro 16 2024 | |
| Lenovo Yoga Pro 9 16-IRP G8 | |
| Dell XPS 15 9530 RTX 4070 | |
| Schenker VISION 16 Pro (M23) | |
| Media della classe Multimedia (228 - 835, n=68, ultimi 2 anni) | |
| Samsung Galaxy Book4 Ultra | |
* ... Meglio usare valori piccoli
| PCMark 10 Score | 7084 punti | |
Aiuto | ||
| AIDA64 / Memory Copy | |
| Dell XPS 16 9640 | |
| Samsung Galaxy Book4 Ultra | |
| Asus ROG Zephyrus G16 2024 GU605M | |
| Honor MagicBook Pro 16 2024 | |
| Media Intel Core Ultra 7 155H (62397 - 96791, n=50) | |
| Media della classe Multimedia (11299 - 132135, n=56, ultimi 2 anni) | |
| Lenovo Yoga Pro 9 16-IRP G8 | |
| Dell XPS 15 9530 RTX 4070 | |
| Schenker VISION 16 Pro (M23) | |
| AIDA64 / Memory Read | |
| Samsung Galaxy Book4 Ultra | |
| Asus ROG Zephyrus G16 2024 GU605M | |
| Dell XPS 16 9640 | |
| Media della classe Multimedia (11624 - 174586, n=56, ultimi 2 anni) | |
| Media Intel Core Ultra 7 155H (60544 - 90647, n=50) | |
| Lenovo Yoga Pro 9 16-IRP G8 | |
| Honor MagicBook Pro 16 2024 | |
| Schenker VISION 16 Pro (M23) | |
| Dell XPS 15 9530 RTX 4070 | |
| AIDA64 / Memory Write | |
| Lenovo Yoga Pro 9 16-IRP G8 | |
| Media della classe Multimedia (11755 - 134998, n=56, ultimi 2 anni) | |
| Honor MagicBook Pro 16 2024 | |
| Samsung Galaxy Book4 Ultra | |
| Dell XPS 16 9640 | |
| Asus ROG Zephyrus G16 2024 GU605M | |
| Media Intel Core Ultra 7 155H (58692 - 93451, n=50) | |
| Dell XPS 15 9530 RTX 4070 | |
| Schenker VISION 16 Pro (M23) | |
| AIDA64 / Memory Latency | |
| Media Intel Core Ultra 7 155H (116.2 - 233, n=50) | |
| Honor MagicBook Pro 16 2024 | |
| Samsung Galaxy Book4 Ultra | |
| Asus ROG Zephyrus G16 2024 GU605M | |
| Dell XPS 16 9640 | |
| Media della classe Multimedia (7 - 535, n=55, ultimi 2 anni) | |
| Lenovo Yoga Pro 9 16-IRP G8 | |
| Dell XPS 15 9530 RTX 4070 | |
| Schenker VISION 16 Pro (M23) | |
* ... Meglio usare valori piccoli
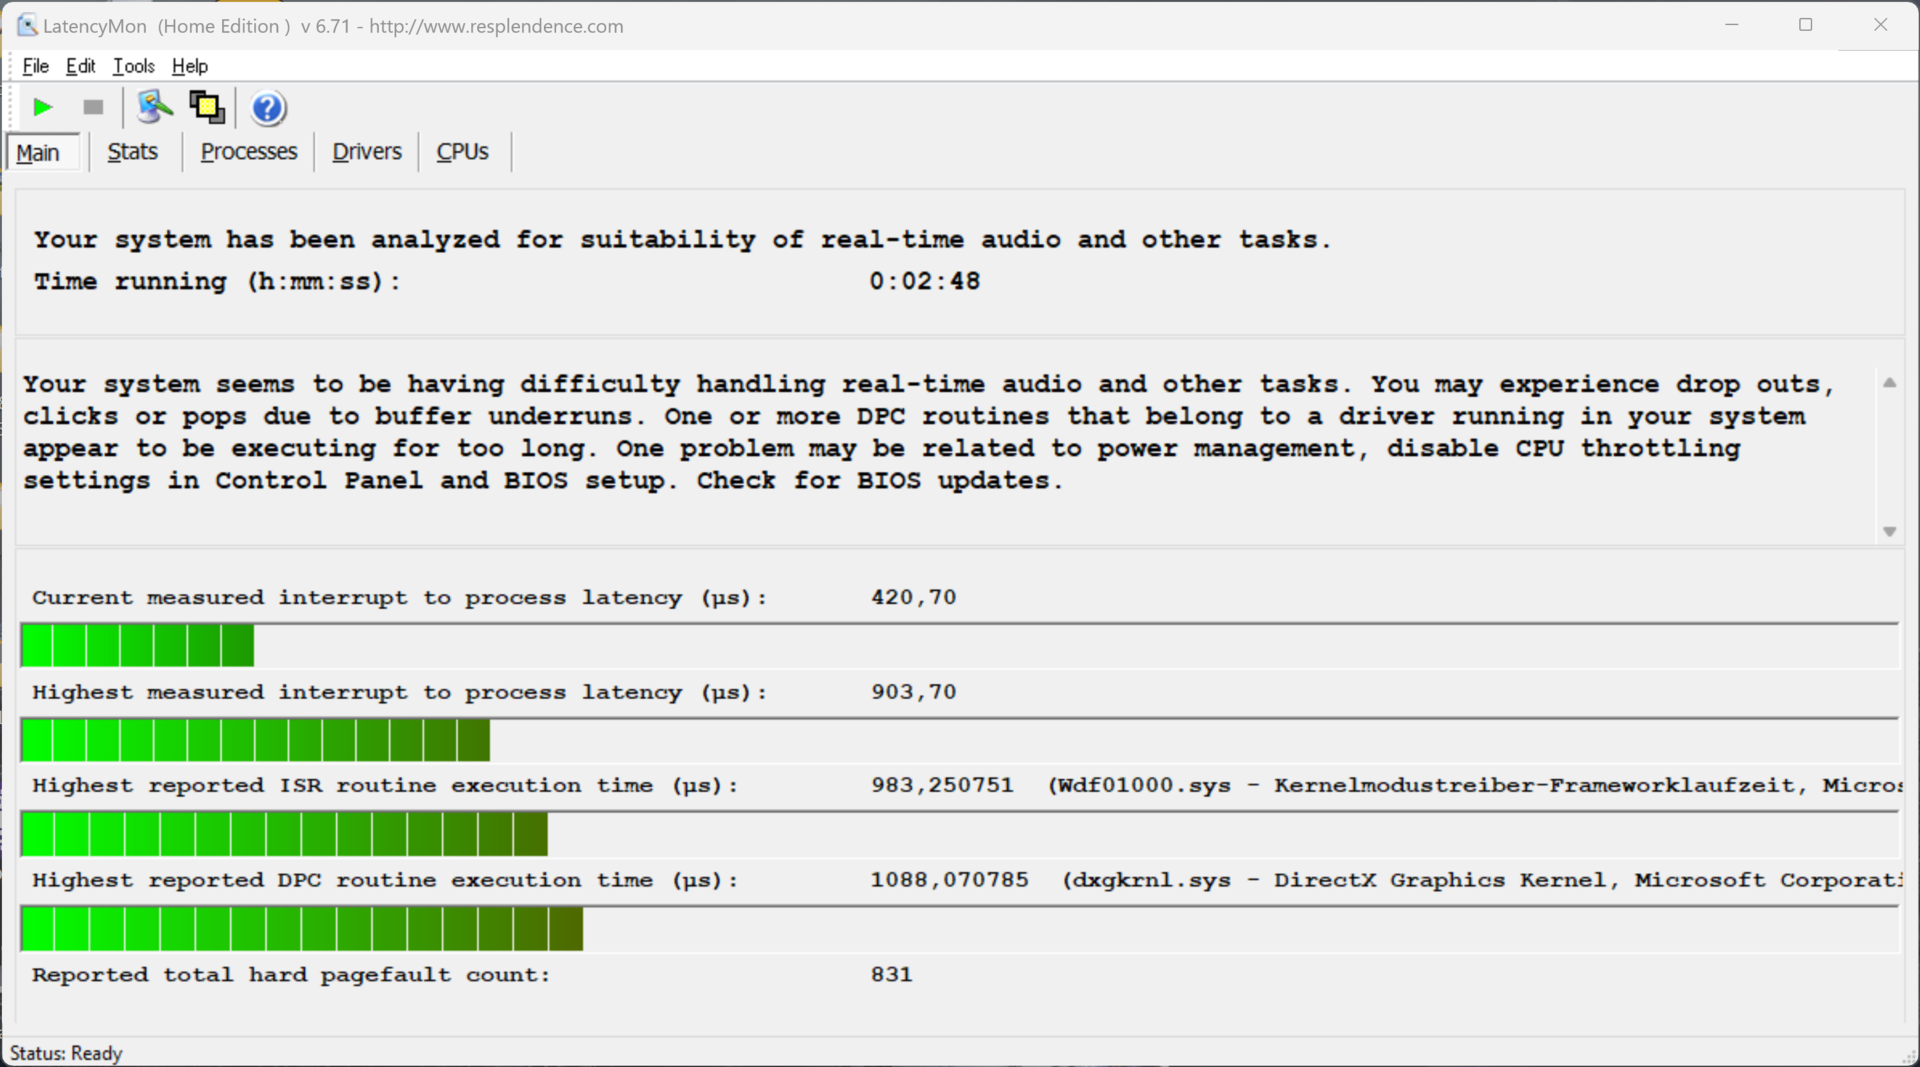
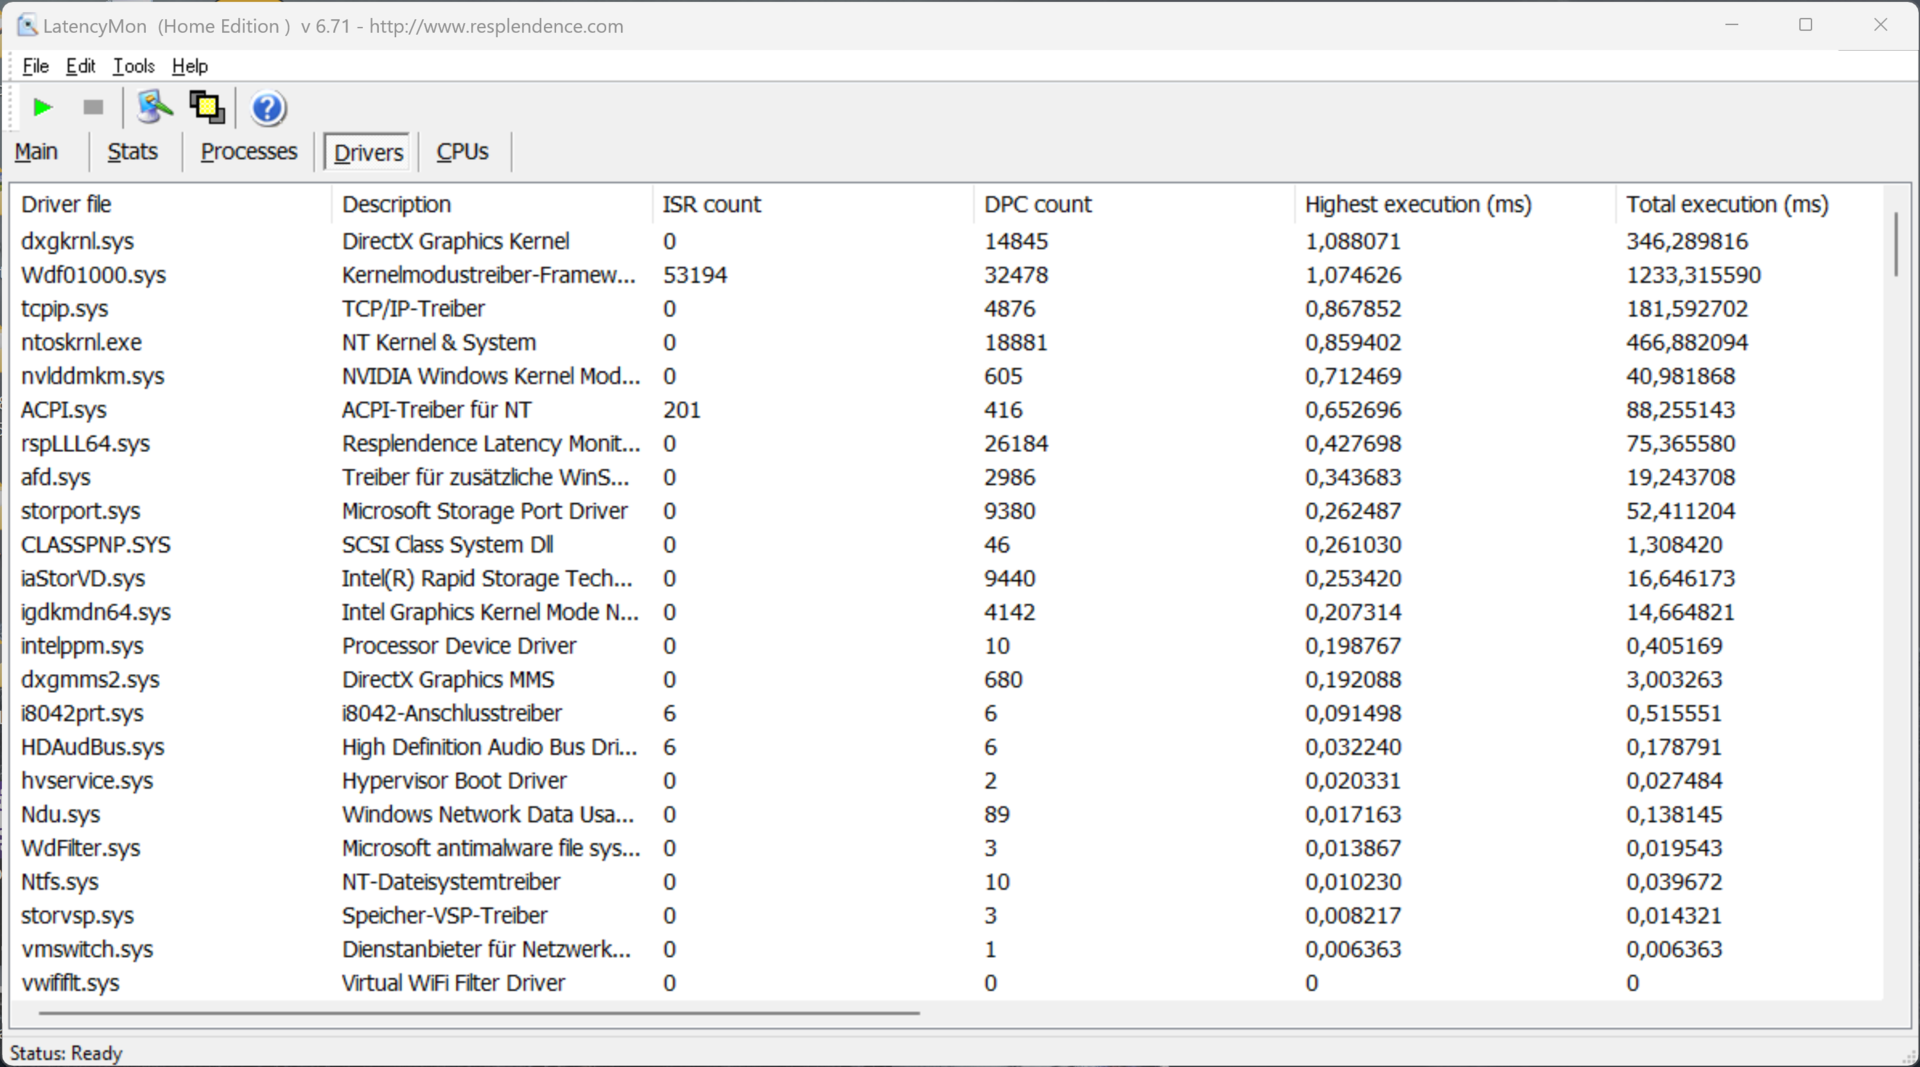
Latenza DPC
Nel nostro test di latenza standardizzato (navigazione web, riproduzione YouTube 4K, carico della CPU), il nostro dispositivo di prova con l'attuale versione del BIOS ha mostrato solo lievi limitazioni quando si utilizzavano applicazioni audio in tempo reale.
| DPC Latencies / LatencyMon - interrupt to process latency (max), Web, Youtube, Prime95 | |
| Lenovo Yoga Pro 9 16-IRP G8 | |
| Asus ROG Zephyrus G16 2024 GU605M | |
| Honor MagicBook Pro 16 2024 | |
| Dell XPS 15 9530 RTX 4070 | |
| Dell XPS 16 9640 | |
| Schenker VISION 16 Pro (M23) | |
| Samsung Galaxy Book4 Ultra | |
* ... Meglio usare valori piccoli
Dispositivo di archiviazione
Una versione da 1 TB di Kioxia XG8 è installata nel nostro dispositivo di prova, con 834 GB a disposizione degli utenti dopo il primo avvio del portatile. Le prestazioni dell'SSD PCIe-4.0 sono molto buone e, soprattutto, molto stabili. Non c'è uno slot per un SSD aggiuntivo. Altri benchmark SSD sono elencati qui.

* ... Meglio usare valori piccoli
Reading continuous performance: DiskSpd Read Loop, Queue Depth 8
Scheda grafica
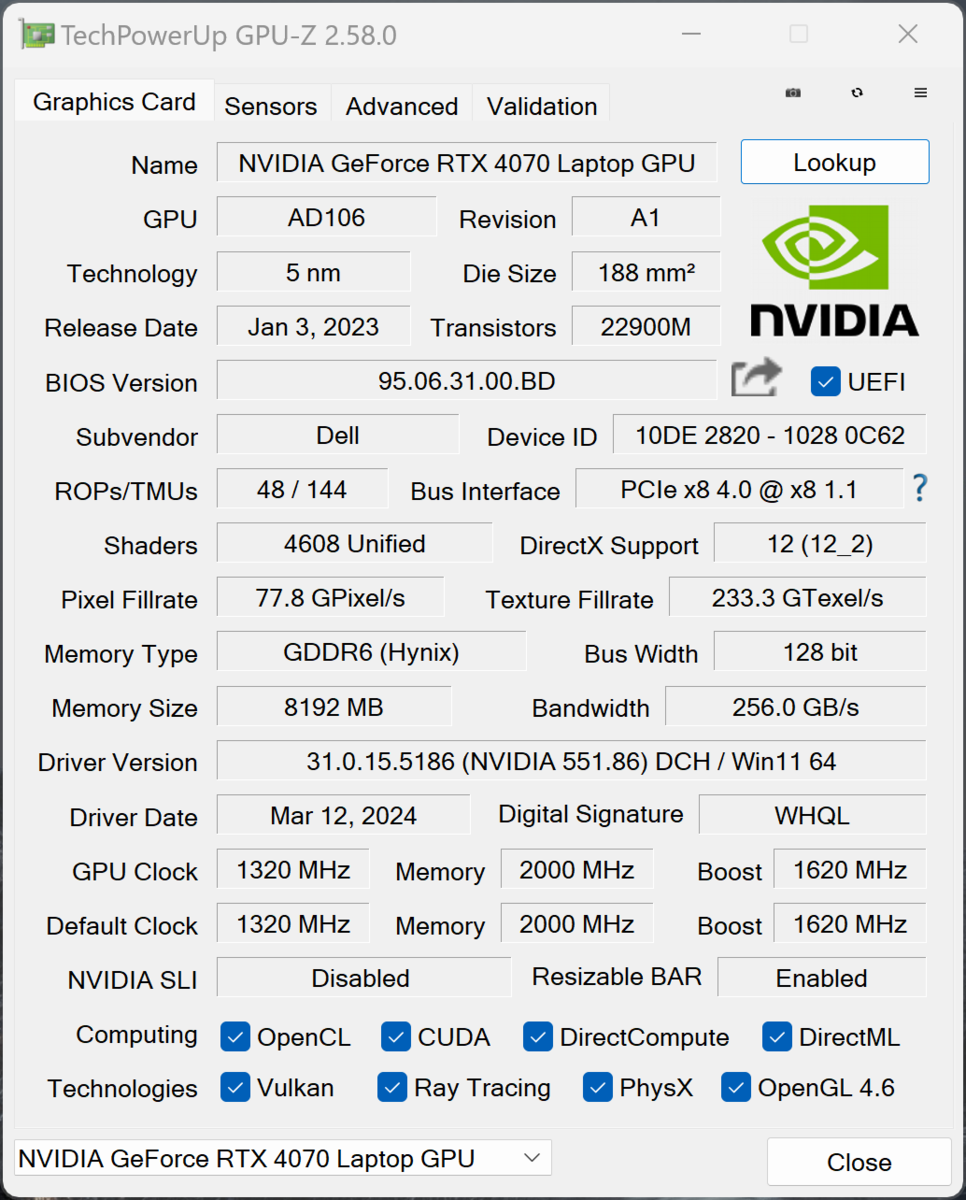
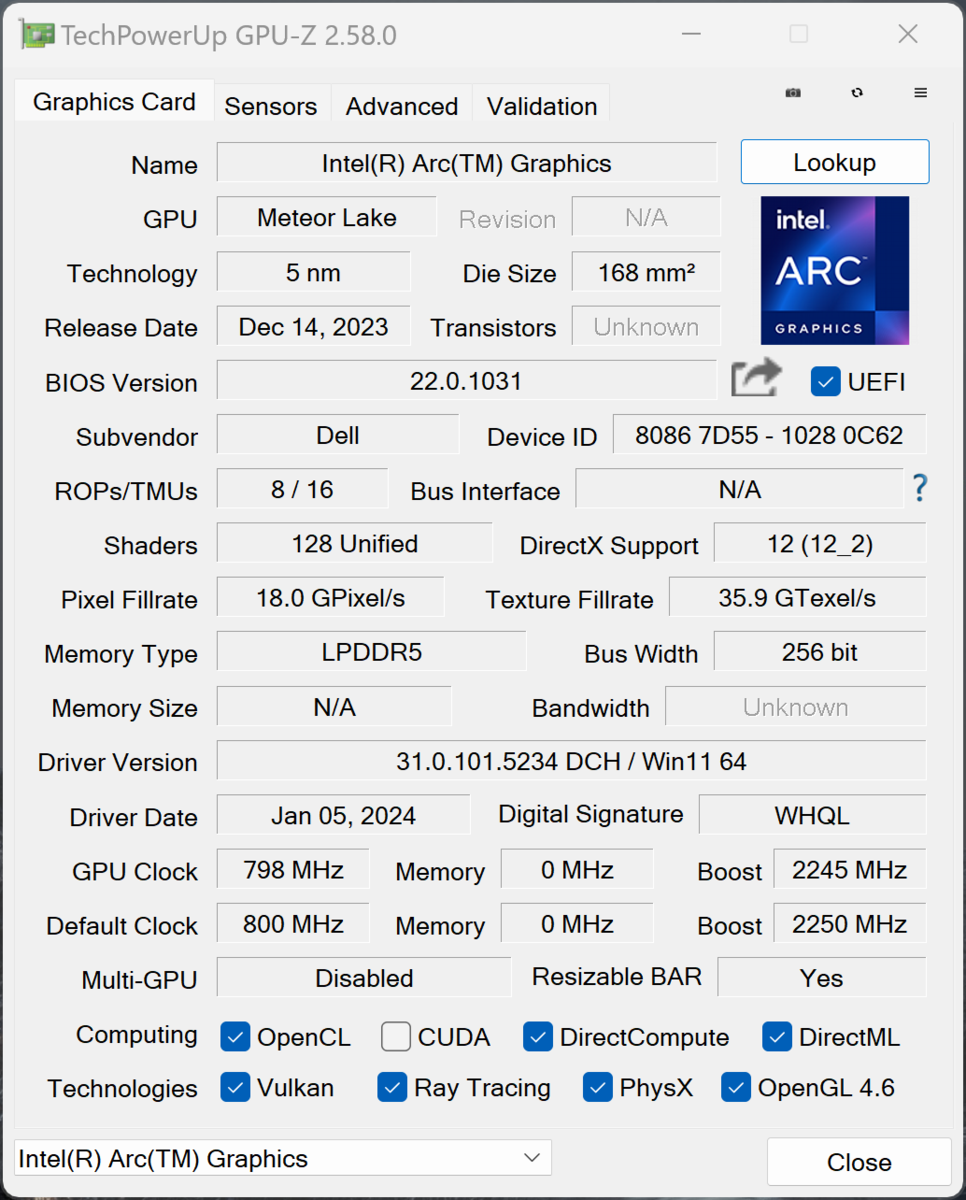
Il nostro dispositivo di prova è dotato di GeForce RTX 4070 Laptop con 8 GB di VRAM, per cui il suo TGP è di 50-60 watt a seconda del profilo energetico selezionato. L'XPS 16 dispone di uno switch MUX e supporta la commutazione grafica tramite Advanced Optimus - i calcoli grafici semplici sono gestiti dalla scheda grafica integrata Intel Arc Graphics Grafica Intel Arc integrata.
Di conseguenza, le sue prestazioni sono migliori rispetto al vecchio XPS 15 con la versione da 50 watt della RTX 4070 Laptop, ma i concorrenti di questo segmento offrono modelli più veloci e, di conseguenza, anche maggiori prestazioni della GPU. Lo scorso anno Yoga Pro 9 16 con la versione da 100 watt del RTX 4060 Laptopper esempio, non è molto più lento. Sotto questo aspetto, si sarebbe potuto fare molto di più.
Le sue prestazioni grafiche rimangono stabili sotto carico continuo, ma la GPU può consumare un massimo di 50 watt in modalità batteria, con una riduzione delle prestazioni di poco inferiore al 10%. Ulteriori benchmark della GPU sono disponibili qui.
| 3DMark 11 Performance | 29315 punti | |
| 3DMark Fire Strike Score | 21848 punti | |
| 3DMark Time Spy Score | 9774 punti | |
Aiuto | ||
| Blender / v3.3 Classroom OPTIX/RTX | |
| Media della classe Multimedia (12 - 105, n=23, ultimi 2 anni) | |
| Samsung Galaxy Book4 Ultra | |
| Dell XPS 15 9530 RTX 4070 | |
| Lenovo Yoga Pro 9 16-IRP G8 | |
| Schenker VISION 16 Pro (M23) | |
| Honor MagicBook Pro 16 2024 | |
| Asus ROG Zephyrus G16 2024 GU605M | |
| Media NVIDIA GeForce RTX 4070 Laptop GPU (18 - 30, n=68) | |
| Dell XPS 16 9640 | |
| Blender / v3.3 Classroom CUDA | |
| Media della classe Multimedia (20 - 186, n=23, ultimi 2 anni) | |
| Samsung Galaxy Book4 Ultra | |
| Dell XPS 15 9530 RTX 4070 | |
| Lenovo Yoga Pro 9 16-IRP G8 | |
| Honor MagicBook Pro 16 2024 | |
| Dell XPS 16 9640 | |
| Schenker VISION 16 Pro (M23) | |
| Media NVIDIA GeForce RTX 4070 Laptop GPU (32 - 50, n=67) | |
| Asus ROG Zephyrus G16 2024 GU605M | |
| Blender / v3.3 Classroom CPU | |
| Media della classe Multimedia (134.5 - 1042, n=63, ultimi 2 anni) | |
| Schenker VISION 16 Pro (M23) | |
| Samsung Galaxy Book4 Ultra | |
| Dell XPS 15 9530 RTX 4070 | |
| Asus ROG Zephyrus G16 2024 GU605M | |
| Honor MagicBook Pro 16 2024 | |
| Lenovo Yoga Pro 9 16-IRP G8 | |
| Dell XPS 16 9640 | |
| Media NVIDIA GeForce RTX 4070 Laptop GPU (158 - 440, n=67) | |
* ... Meglio usare valori piccoli
Prestazioni di gioco
Con l'RTX 4070 Laptop, le prestazioni di gioco dell'XPS 16 9640 non sono troppo scadenti: tutti i giochi che abbiamo testato potevano essere giocati senza problemi con la risoluzione QHD e con il massimo dei dettagli. Per la risoluzione nativa dello schermo di 3.840 x 2.400 pixel, tuttavia, è necessario ridurre i dettagli o utilizzare tecnologie di upscaling come il DLSS di Nvidia. Rispetto alla concorrenza, l'XPS è ancora una volta inferiore ai modelli dotati di RTX 4070 Laptop e alle versioni veloci di RTX 4060 Laptop (Honor MagicBook Pro, Lenovo Yoga Pro 9 16). Le sue prestazioni di gioco rimangono stabili anche durante le sessioni più lunghe.
| The Witcher 3 - 1920x1080 Ultra Graphics & Postprocessing (HBAO+) | |
| Schenker VISION 16 Pro (M23) | |
| Asus ROG Zephyrus G16 2024 GU605M | |
| Lenovo Yoga Pro 9 16-IRP G8 | |
| Dell XPS 16 9640 | |
| Honor MagicBook Pro 16 2024 | |
| Dell XPS 15 9530 RTX 4070 | |
| Media della classe Multimedia (11 - 121, n=10, ultimi 2 anni) | |
| Samsung Galaxy Book4 Ultra | |
| Baldur's Gate 3 | |
| 1920x1080 Ultra Preset AA:T | |
| Media NVIDIA GeForce RTX 4070 Laptop GPU (66.7 - 128.5, n=30) | |
| Dell XPS 16 9640 | |
| Media della classe Multimedia (7.8 - 158.7, n=67, ultimi 2 anni) | |
| 2560x1440 Ultra Preset AA:T | |
| Media NVIDIA GeForce RTX 4070 Laptop GPU (54.4 - 89.6, n=25) | |
| Media della classe Multimedia (28.7 - 121, n=25, ultimi 2 anni) | |
| Dell XPS 16 9640 | |
| Horizon Forbidden West | |
| 1920x1080 Very High Preset AA:T | |
| Media NVIDIA GeForce RTX 4070 Laptop GPU (53.2 - 76.7, n=10) | |
| Dell XPS 16 9640 | |
| Media della classe Multimedia (12.4 - 64.4, n=3, ultimi 2 anni) | |
| 2560x1440 Very High Preset AA:T | |
| Media NVIDIA GeForce RTX 4070 Laptop GPU (40.3 - 59.1, n=9) | |
| Media della classe Multimedia (n=1ultimi 2 anni) | |
| Dell XPS 16 9640 | |
Witcher 3 FPS diagram
| basso | medio | alto | ultra | QHD | 4K | |
|---|---|---|---|---|---|---|
| GTA V (2015) | 177 | 170.7 | 103.6 | 81.3 | ||
| The Witcher 3 (2015) | 399 | 327 | 195 | 87.8 | 73 | |
| Dota 2 Reborn (2015) | 89.8 | 89.6 | 89.5 | 89.7 | 115.7 | |
| Final Fantasy XV Benchmark (2018) | 150.2 | 123.2 | 93.1 | 70 | ||
| X-Plane 11.11 (2018) | 125.1 | 108.5 | 84.7 | 68.9 | ||
| Far Cry 5 (2018) | 140 | 126 | 122 | 115 | 94 | |
| Strange Brigade (2018) | 423 | 258 | 202 | 175 | 116 | |
| F1 23 (2023) | 214 | 189.7 | 175.1 | 55.5 | 35.2 | |
| Baldur's Gate 3 (2023) | 135.7 | 107.1 | 93.5 | 91.8 | 63.8 | |
| Cyberpunk 2077 (2023) | 112 | 87.6 | 74.7 | 64.3 | 39.6 | |
| Horizon Forbidden West (2024) | 96.6 | 83.7 | 58.5 | 53.2 | 40.3 |
Emissioni - Dell ha installato una Camera a Vapore nell'XPS 16
Emissioni di rumore
In contrasto con il xPS 14 più piccolodell ha installato un'unità di raffreddamento Vapor Chamber con due ventole nell'XPS 16 più grande. Soprattutto in condizioni di basso carico, le ventole rimangono spesso disattivate o semplicemente molto silenziose, ma in condizioni di carico più elevato, il rumore si fa sentire molto rapidamente. Siamo rimasti particolarmente sorpresi dalla piccola differenza tra i profili Ottimizzato (max. 48,1 dB(A)) e Ultra Performance (max. 49,7 dB(A)), entrambi troppo rumorosi per poter giocare senza bisogno di cuffie. Con un massimo di 43,3 dB(A), il profilo Quiet non è affatto silenzioso. Molti concorrenti, come il MagicBook Pro o lo Zephyrus G16offrono prestazioni migliori con emissioni acustiche inferiori. Non abbiamo notato alcun rumore elettronico aggiuntivo proveniente dal nostro campione di prova.
Rumorosità
| Idle |
| 24.5 / 24.5 / 27.5 dB(A) |
| Sotto carico |
| 39.6 / 49.7 dB(A) |
 | ||
30 dB silenzioso 40 dB(A) udibile 50 dB(A) rumoroso |
||
min: | ||
| Dell XPS 16 9640 GeForce RTX 4070 Laptop GPU, Ultra 7 155H, Kioxia XG8 KXG80ZNV1T02 | Samsung Galaxy Book4 Ultra GeForce RTX 4050 Laptop GPU, Ultra 7 155H, Samsung PM9A1 MZVL2512HCJQ | Honor MagicBook Pro 16 2024 GeForce RTX 4060 Laptop GPU, Ultra 7 155H, WD PC SN740 SDDPNQD-1T00 | Asus ROG Zephyrus G16 2024 GU605M GeForce RTX 4070 Laptop GPU, Ultra 7 155H, WD PC SN560 SDDPNQE-1T00 | Lenovo Yoga Pro 9 16-IRP G8 GeForce RTX 4060 Laptop GPU, i7-13705H, Samsung PM9A1 MZVL21T0HCLR | Schenker VISION 16 Pro (M23) GeForce RTX 4070 Laptop GPU, i7-13700H, Samsung 990 Pro 1 TB | Dell XPS 15 9530 RTX 4070 GeForce RTX 4070 Laptop GPU, i7-13700H, SK hynix PC801 HFS001TEJ9X101N | |
|---|---|---|---|---|---|---|---|
| Noise | 7% | 8% | 1% | -3% | -10% | 13% | |
| off /ambiente * (dB) | 24.5 | 24.2 1% | 24 2% | 23.9 2% | 24.7 -1% | 25.9 -6% | 23.1 6% |
| Idle Minimum * (dB) | 24.5 | 24.2 1% | 24 2% | 23.9 2% | 24.7 -1% | 25.9 -6% | 23.1 6% |
| Idle Average * (dB) | 24.5 | 24.2 1% | 24 2% | 27.8 -13% | 26.2 -7% | 25.9 -6% | 23.1 6% |
| Idle Maximum * (dB) | 27.5 | 24.2 12% | 27.2 1% | 30.1 -9% | 26.2 5% | 32 -16% | 24.2 12% |
| Load Average * (dB) | 39.6 | 37.9 4% | 29 27% | 34.2 14% | 39.7 -0% | 47.2 -19% | 27.1 32% |
| Witcher 3 ultra * (dB) | 49.7 | 41.7 16% | 42.1 15% | 46.4 7% | 53.2 -7% | 53.1 -7% | 40.1 19% |
| Load Maximum * (dB) | 49.7 | 41.7 16% | 45 9% | 46.4 7% | 53.2 -7% | 53.1 -7% | 44.6 10% |
* ... Meglio usare valori piccoli
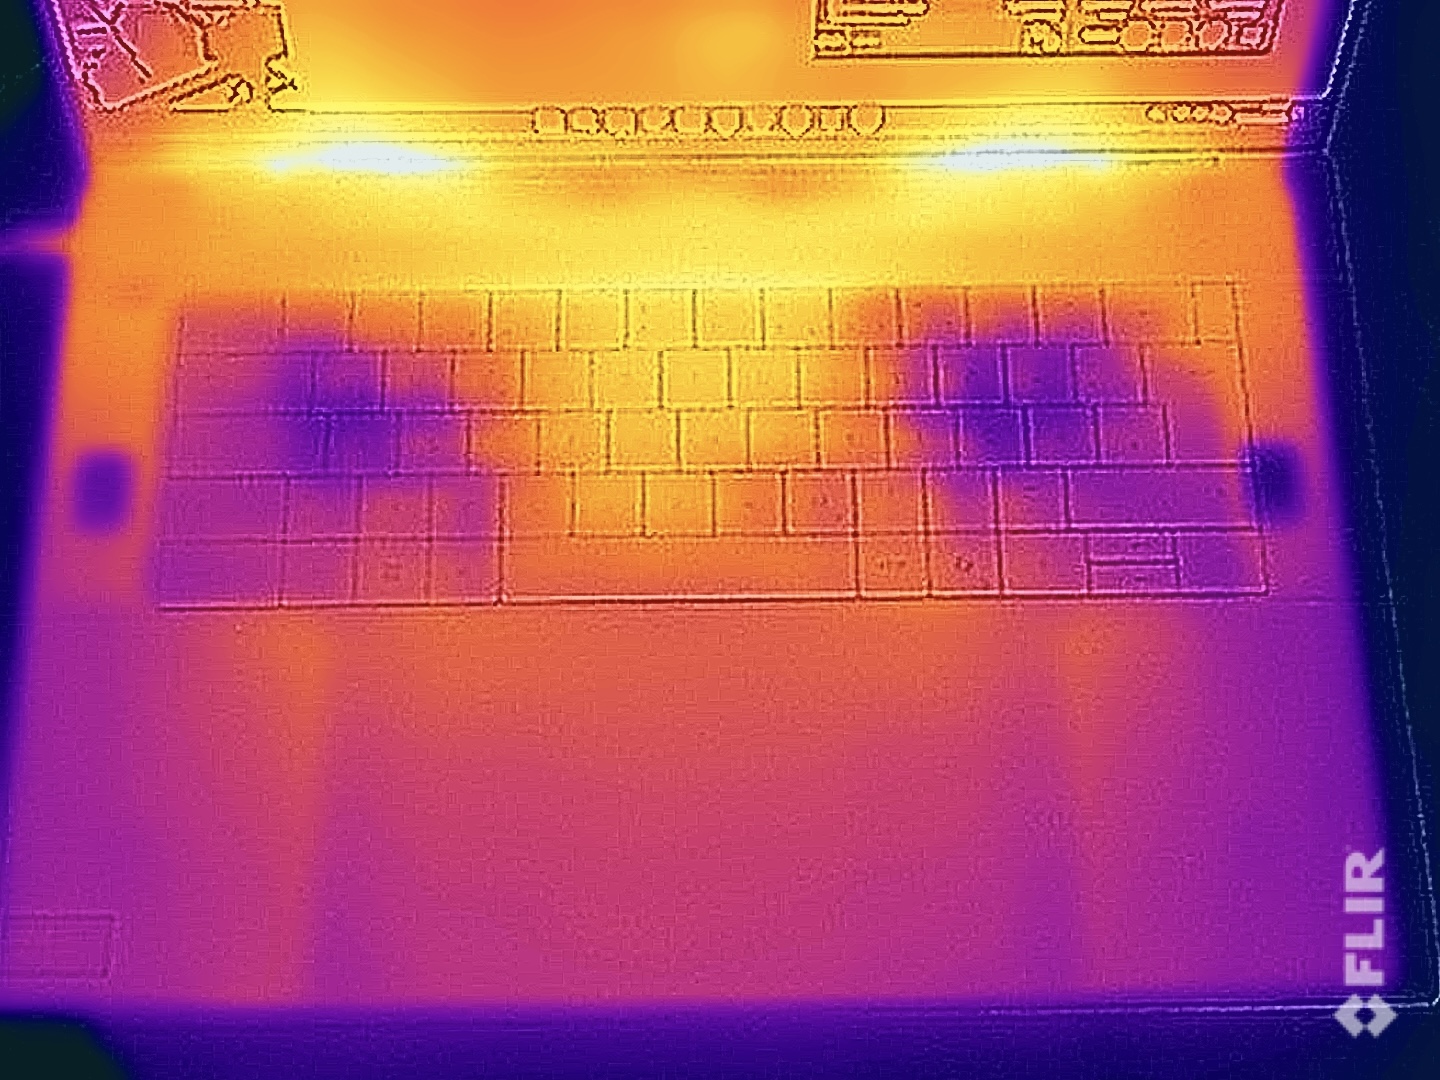
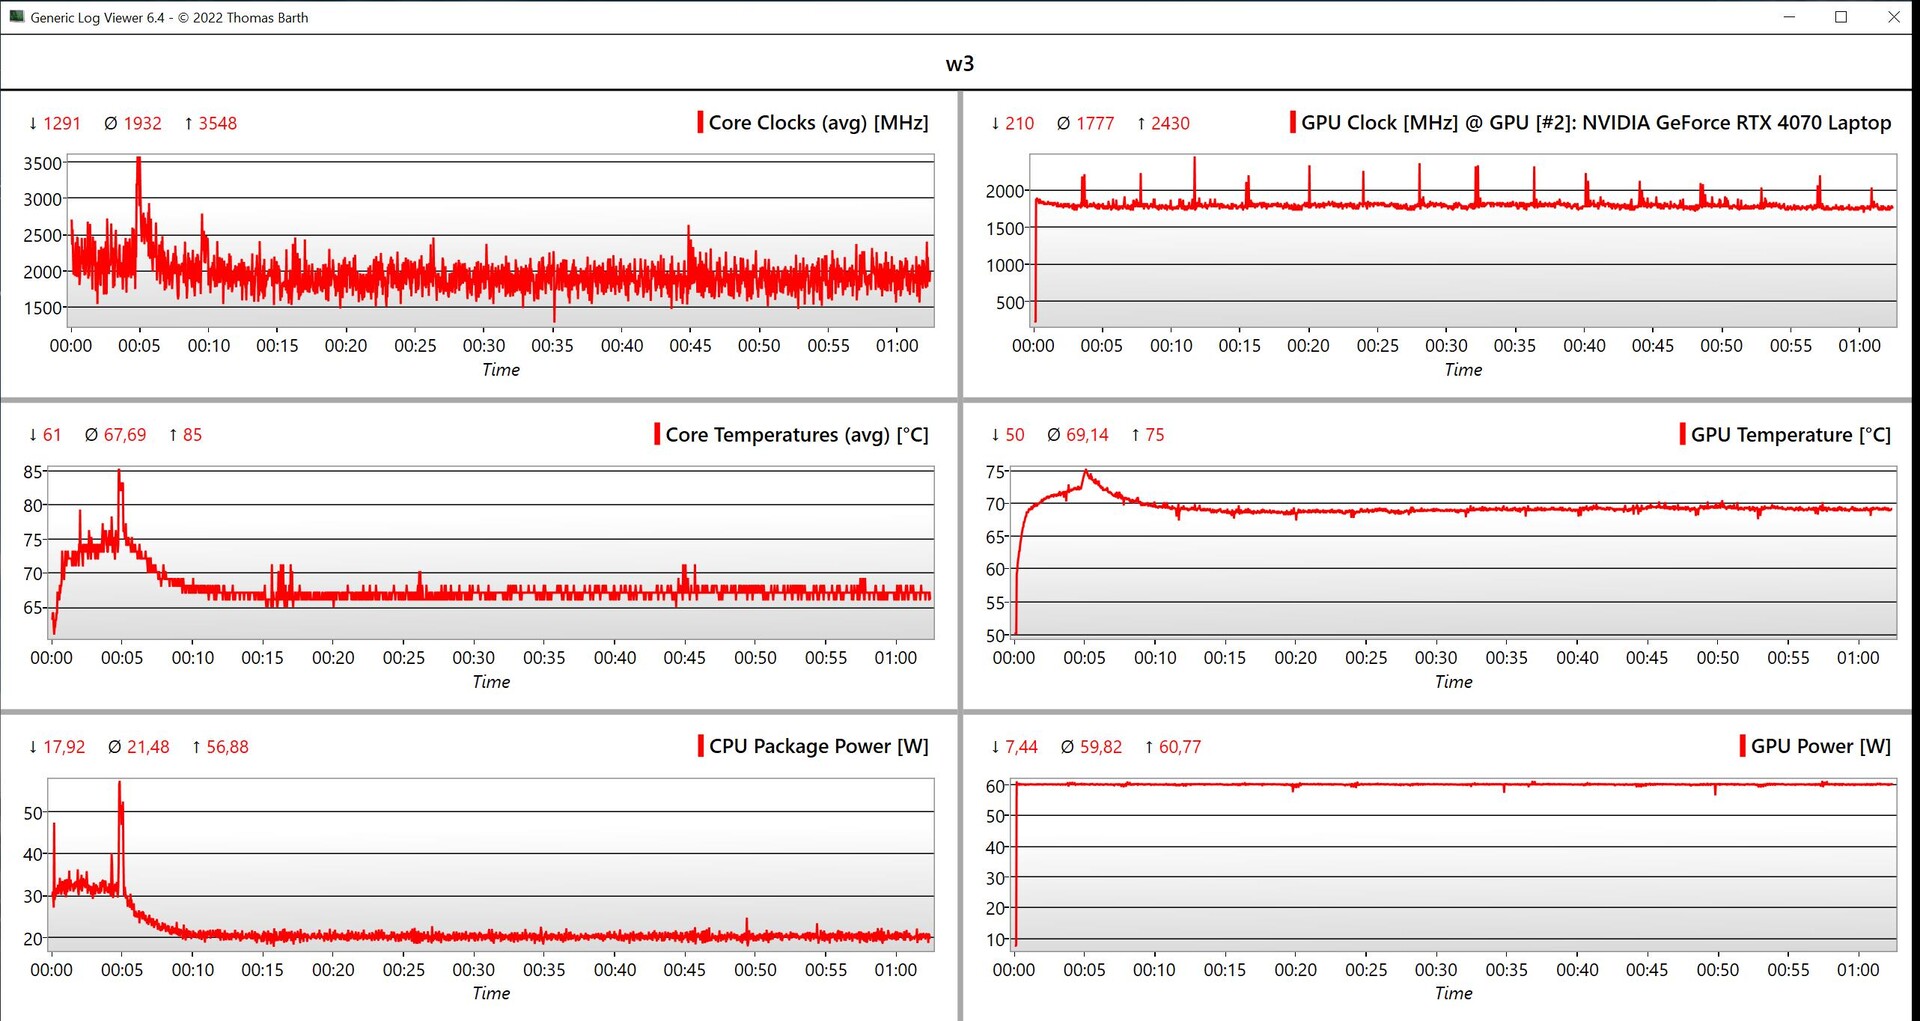
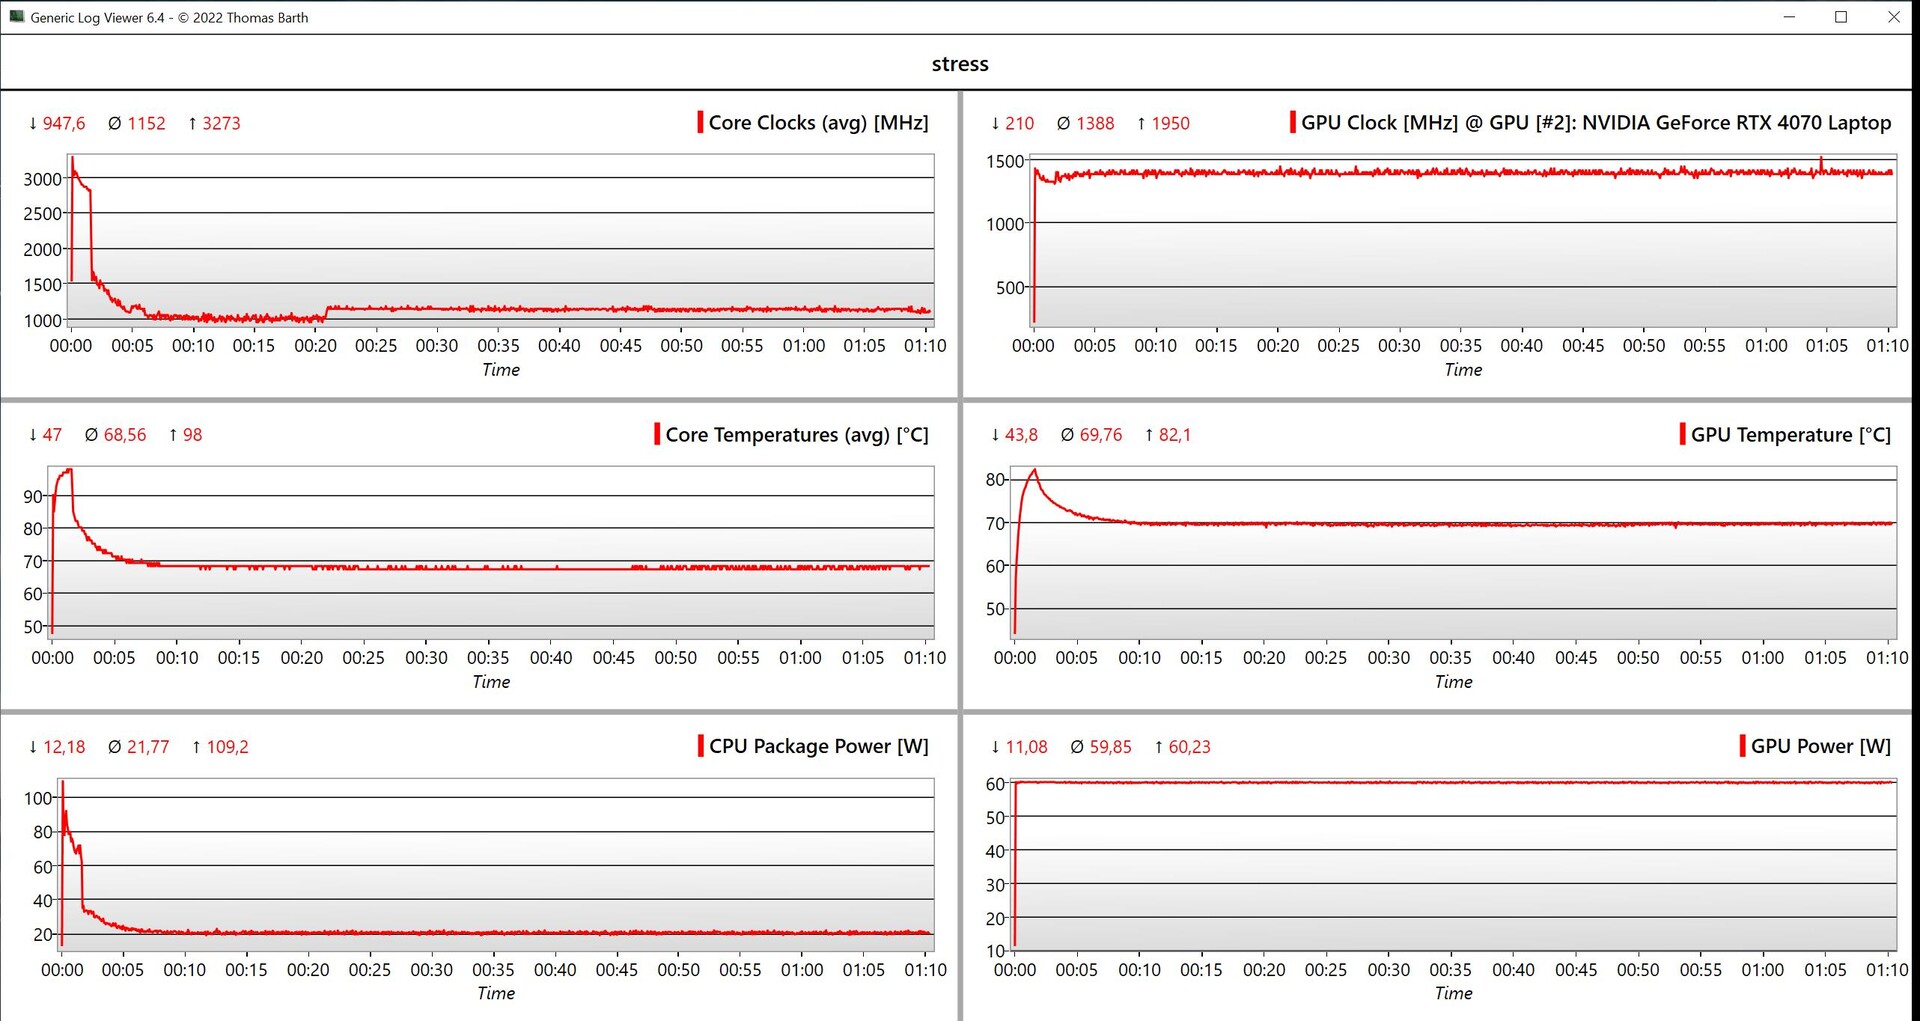
Temperatura
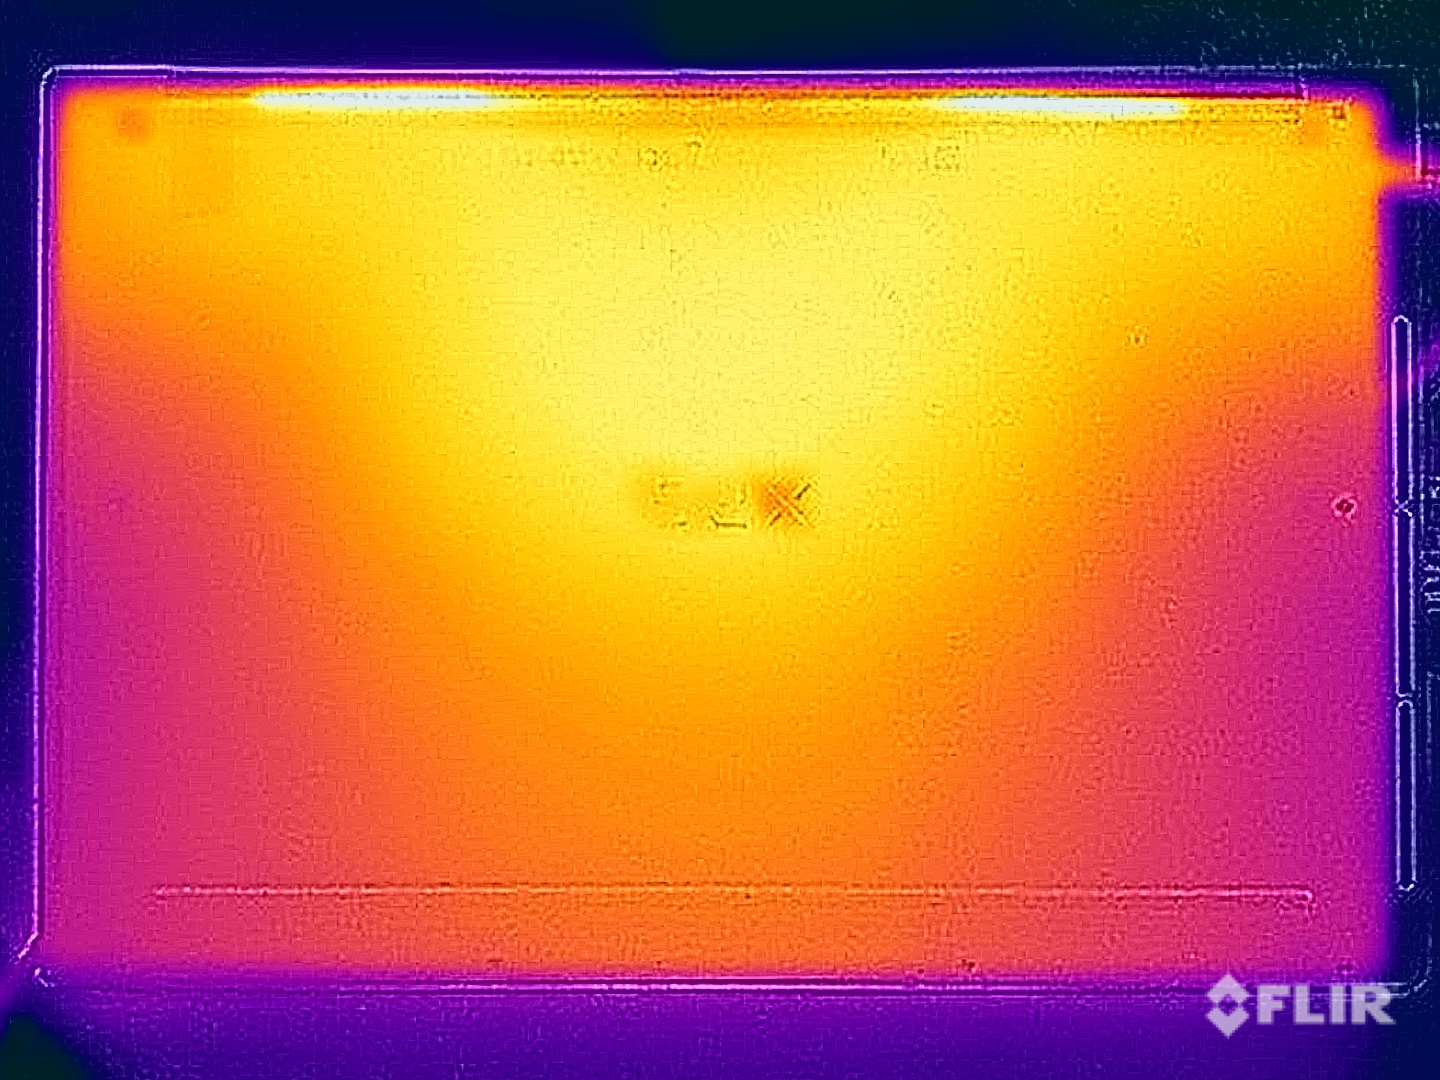
Le temperature superficiali del portatile dimostrano che Dell potrebbe aumentare le prestazioni dei componenti o ridurre la velocità delle ventole, dato che anche durante lo stress test non abbiamo mai misurato più di 40°C. Il case in alluminio non si scalda quasi per niente durante le attività semplici e quando è al minimo. Nel test di stress con carico combinato CPU/GPU, la scheda grafica è rimasta stabile a 60 watt, mentre il processore ha dovuto accontentarsi di soli 20 watt.
(+) La temperatura massima sul lato superiore è di 39.4 °C / 103 F, rispetto alla media di 36.8 °C / 98 F, che varia da 21 a 71 °C per questa classe Multimedia.
(+) Il lato inferiore si riscalda fino ad un massimo di 36.9 °C / 98 F, rispetto alla media di 39.1 °C / 102 F
(+) In idle, la temperatura media del lato superiore è di 26.3 °C / 79 F, rispetto alla media deld ispositivo di 31.3 °C / 88 F.
(±) Riproducendo The Witcher 3, la temperatura media per il lato superiore e' di 34 °C / 93 F, rispetto alla media del dispositivo di 31.3 °C / 88 F.
(+) I poggiapolsi e il touchpad sono piu' freddi della temperatura della pelle con un massimo di 30.2 °C / 86.4 F e sono quindi freddi al tatto.
(±) La temperatura media della zona del palmo della mano di dispositivi simili e'stata di 28.7 °C / 83.7 F (-1.5 °C / -2.7 F).
| Dell XPS 16 9640 Intel Core Ultra 7 155H, NVIDIA GeForce RTX 4070 Laptop GPU | Samsung Galaxy Book4 Ultra Intel Core Ultra 7 155H, NVIDIA GeForce RTX 4050 Laptop GPU | Honor MagicBook Pro 16 2024 Intel Core Ultra 7 155H, NVIDIA GeForce RTX 4060 Laptop GPU | Asus ROG Zephyrus G16 2024 GU605M Intel Core Ultra 7 155H, NVIDIA GeForce RTX 4070 Laptop GPU | Lenovo Yoga Pro 9 16-IRP G8 Intel Core i7-13705H, NVIDIA GeForce RTX 4060 Laptop GPU | Schenker VISION 16 Pro (M23) Intel Core i7-13700H, NVIDIA GeForce RTX 4070 Laptop GPU | Dell XPS 15 9530 RTX 4070 Intel Core i7-13700H, NVIDIA GeForce RTX 4070 Laptop GPU | |
|---|---|---|---|---|---|---|---|
| Heat | 5% | 3% | -17% | -10% | -15% | -18% | |
| Maximum Upper Side * (°C) | 39.4 | 38.5 2% | 39.7 -1% | 50.3 -28% | 41.6 -6% | 46.7 -19% | 45.6 -16% |
| Maximum Bottom * (°C) | 36.9 | 41.2 -12% | 42.9 -16% | 48 -30% | 50 -36% | 54.1 -47% | 42 -14% |
| Idle Upper Side * (°C) | 28.2 | 23.5 17% | 23.7 16% | 28.8 -2% | 26.8 5% | 26.5 6% | 34.4 -22% |
| Idle Bottom * (°C) | 27.4 | 24.1 12% | 23.5 14% | 29.8 -9% | 27.9 -2% | 26.8 2% | 33.2 -21% |
* ... Meglio usare valori piccoli
Altoparlanti
Il sistema audio dell'XPS 16 è composto da quattro altoparlanti con una potenza totale di 10 watt. Il suono risultante è buono e difficilmente rimarrà deluso, ma i concorrenti come il ROG Zephyrus G16 dimostrano che potrebbe essere ancora migliore. Secondo la nostra analisi, il nuovo XPS 16 si colloca leggermente dietro il vecchio XPS 15.
Dell XPS 16 9640 analisi audio
(+) | gli altoparlanti sono relativamente potenti (83.4 dB)
Bassi 100 - 315 Hz
(±) | bassi ridotti - in media 11.2% inferiori alla media
(±) | la linearità dei bassi è media (8.9% delta rispetto alla precedente frequenza)
Medi 400 - 2000 Hz
(+) | medi bilanciati - solo only 4.5% rispetto alla media
(+) | medi lineari (3% delta rispetto alla precedente frequenza)
Alti 2 - 16 kHz
(+) | Alti bilanciati - appena 1.4% dalla media
(+) | alti lineari (2% delta rispetto alla precedente frequenza)
Nel complesso 100 - 16.000 Hz
(+) | suono nel complesso lineare (10% differenza dalla media)
Rispetto alla stessa classe
» 13% di tutti i dispositivi testati in questa classe è stato migliore, 2% simile, 84% peggiore
» Il migliore ha avuto un delta di 5%, medio di 17%, peggiore di 45%
Rispetto a tutti i dispositivi testati
» 4% di tutti i dispositivi testati in questa classe è stato migliore, 1% similare, 94% peggiore
» Il migliore ha avuto un delta di 4%, medio di 23%, peggiore di 134%
Asus ROG Zephyrus G16 2024 GU605M analisi audio
(+) | gli altoparlanti sono relativamente potenti (83.3 dB)
Bassi 100 - 315 Hz
(+) | bassi buoni - solo 3.8% dalla media
(±) | la linearità dei bassi è media (8.1% delta rispetto alla precedente frequenza)
Medi 400 - 2000 Hz
(+) | medi bilanciati - solo only 3.5% rispetto alla media
(+) | medi lineari (2.4% delta rispetto alla precedente frequenza)
Alti 2 - 16 kHz
(+) | Alti bilanciati - appena 2.2% dalla media
(+) | alti lineari (3.7% delta rispetto alla precedente frequenza)
Nel complesso 100 - 16.000 Hz
(+) | suono nel complesso lineare (7.3% differenza dalla media)
Rispetto alla stessa classe
» 1% di tutti i dispositivi testati in questa classe è stato migliore, 0% simile, 99% peggiore
» Il migliore ha avuto un delta di 6%, medio di 18%, peggiore di 132%
Rispetto a tutti i dispositivi testati
» 1% di tutti i dispositivi testati in questa classe è stato migliore, 0% similare, 99% peggiore
» Il migliore ha avuto un delta di 4%, medio di 23%, peggiore di 134%
Lenovo Yoga Pro 9 16-IRP G8 analisi audio
(±) | potenza degli altiparlanti media ma buona (80.5 dB)
Bassi 100 - 315 Hz
(+) | bassi buoni - solo 4.9% dalla media
(±) | la linearità dei bassi è media (9.1% delta rispetto alla precedente frequenza)
Medi 400 - 2000 Hz
(+) | medi bilanciati - solo only 3.2% rispetto alla media
(+) | medi lineari (6.5% delta rispetto alla precedente frequenza)
Alti 2 - 16 kHz
(+) | Alti bilanciati - appena 2.9% dalla media
(+) | alti lineari (3% delta rispetto alla precedente frequenza)
Nel complesso 100 - 16.000 Hz
(+) | suono nel complesso lineare (8.4% differenza dalla media)
Rispetto alla stessa classe
» 9% di tutti i dispositivi testati in questa classe è stato migliore, 2% simile, 89% peggiore
» Il migliore ha avuto un delta di 5%, medio di 17%, peggiore di 45%
Rispetto a tutti i dispositivi testati
» 2% di tutti i dispositivi testati in questa classe è stato migliore, 1% similare, 97% peggiore
» Il migliore ha avuto un delta di 4%, medio di 23%, peggiore di 134%
Dell XPS 15 9530 RTX 4070 analisi audio
(+) | gli altoparlanti sono relativamente potenti (83.4 dB)
Bassi 100 - 315 Hz
(+) | bassi buoni - solo 3.9% dalla media
(+) | bassi in lineaa (6.8% delta rispetto alla precedente frequenza)
Medi 400 - 2000 Hz
(+) | medi bilanciati - solo only 4.4% rispetto alla media
(+) | medi lineari (4.1% delta rispetto alla precedente frequenza)
Alti 2 - 16 kHz
(+) | Alti bilanciati - appena 1.1% dalla media
(+) | alti lineari (3.3% delta rispetto alla precedente frequenza)
Nel complesso 100 - 16.000 Hz
(+) | suono nel complesso lineare (6.4% differenza dalla media)
Rispetto alla stessa classe
» 4% di tutti i dispositivi testati in questa classe è stato migliore, 1% simile, 95% peggiore
» Il migliore ha avuto un delta di 5%, medio di 17%, peggiore di 45%
Rispetto a tutti i dispositivi testati
» 1% di tutti i dispositivi testati in questa classe è stato migliore, 0% similare, 99% peggiore
» Il migliore ha avuto un delta di 4%, medio di 23%, peggiore di 134%
Gestione dell'energia - Tanta resistenza grazie a una batteria da 99,5 Wh
Consumo di energia
Nelle nostre misurazioni dei consumi, il touchscreen OLED ad alta risoluzione si è dimostrato sorprendentemente frugale, perché nonostante l'immagine di sfondo standard scura, un consumo massimo di 10,6 watt non è molto per uno schermo da 16,3 pollici. Non abbiamo notato sorprese sotto carico. Durante lo stress test, il consumo ha toccato brevemente i 138 watt, ma poi si è stabilizzato a 125 watt dopo 1,5 minuti e successivamente a 115 watt. Forse non c'è molto margine di manovra, ma nel complesso l'alimentatore compatto da 130 watt è sufficientemente dimensionato.
| Off / Standby | |
| Idle | |
| Sotto carico |
|
Leggenda:
min: | |
| Dell XPS 16 9640 Ultra 7 155H, GeForce RTX 4070 Laptop GPU, Kioxia XG8 KXG80ZNV1T02, OLED, 3840x2400, 16.3" | Samsung Galaxy Book4 Ultra Ultra 7 155H, GeForce RTX 4050 Laptop GPU, Samsung PM9A1 MZVL2512HCJQ, OLED, 2880x1800, 16" | Honor MagicBook Pro 16 2024 Ultra 7 155H, GeForce RTX 4060 Laptop GPU, WD PC SN740 SDDPNQD-1T00, IPS, 3072x1920, 16" | Asus ROG Zephyrus G16 2024 GU605M Ultra 7 155H, GeForce RTX 4070 Laptop GPU, WD PC SN560 SDDPNQE-1T00, OLED, 2560x1600, 16" | Lenovo Yoga Pro 9 16-IRP G8 i7-13705H, GeForce RTX 4060 Laptop GPU, Samsung PM9A1 MZVL21T0HCLR, Mini-LED, 3200x2000, 16" | Schenker VISION 16 Pro (M23) i7-13700H, GeForce RTX 4070 Laptop GPU, Samsung 990 Pro 1 TB, IPS, 2560x1600, 16" | Dell XPS 15 9530 RTX 4070 i7-13700H, GeForce RTX 4070 Laptop GPU, SK hynix PC801 HFS001TEJ9X101N, OLED, 3456x2160, 15.6" | Media NVIDIA GeForce RTX 4070 Laptop GPU | Media della classe Multimedia | |
|---|---|---|---|---|---|---|---|---|---|
| Power Consumption | 22% | -20% | -11% | -58% | -16% | -57% | -73% | 8% | |
| Idle Minimum * (Watt) | 7.7 | 4.8 38% | 5.2 32% | 8.3 -8% | 10.9 -42% | 8.6 -12% | 20 -160% | 13.2 ? -71% | 5.72 ? 26% |
| Idle Average * (Watt) | 10.3 | 7.5 27% | 14.4 -40% | 12.5 -21% | 22.6 -119% | 12 -17% | 20.7 -101% | 18.2 ? -77% | 10.2 ? 1% |
| Idle Maximum * (Watt) | 10.6 | 7.9 25% | 15.4 -45% | 12.8 -21% | 23.5 -122% | 12.4 -17% | 22.4 -111% | 24.6 ? -132% | 12.4 ? -17% |
| Load Average * (Watt) | 76.5 | 79.3 -4% | 105.4 -38% | 71.3 7% | 84.6 -11% | 80 -5% | 77.1 -1% | 97 ? -27% | 65.5 ? 14% |
| Witcher 3 ultra * (Watt) | 126.4 | 79.2 37% | 107.6 15% | 127.5 -1% | 159.5 -26% | 147.7 -17% | 95.4 25% | ||
| Load Maximum * (Watt) | 138.5 | 125 10% | 195.2 -41% | 169.1 -22% | 177.3 -28% | 173.1 -25% | 133.4 4% | 221 ? -60% | 114 ? 18% |
* ... Meglio usare valori piccoli
Power consumption Witcher 3 / stress test
Power consumption with external monitor
Tempi di esecuzione
Dell ha installato la batteria più grande possibile nel nuovo XPS 16, che ha una capacità di 99,5 Wh e, in totale, i suoi tempi di esecuzione sono molto buoni. Nel nostro test WLAN a 150 cd/m² (corrisponde al 57% della luminosità massima SDR del dispositivo di test), abbiamo misurato 10:29 ore a 60 Hz (09:56 ore a 90 Hz) e poco più di 8 ore a piena luminosità e 60 Hz (~07:20 ore a 90 Hz). Durante il test video a 150 cd/m², abbiamo notato un'ottima durata di 16,5 ore e qui il processore Meteor Lake beneficia dei suoi due core a bassa efficienza energetica. Un video HDR a piena luminosità ha potuto essere riprodotto per poco più di 6,5 ore e a pieno carico, il test si è concluso dopo poco meno di 1,5 ore.
L'XPS 16 offre due velocità di ricarica: In modalità normale, occorrono 151 minuti (80% dopo 93 minuti) prima che la batteria sia completamente carica all'accensione del dispositivo; in modalità express, occorrono 97 minuti (80% dopo 50 minuti).
| Dell XPS 16 9640 Ultra 7 155H, GeForce RTX 4070 Laptop GPU, 99.5 Wh | Samsung Galaxy Book4 Ultra Ultra 7 155H, GeForce RTX 4050 Laptop GPU, 76 Wh | Honor MagicBook Pro 16 2024 Ultra 7 155H, GeForce RTX 4060 Laptop GPU, 75 Wh | Asus ROG Zephyrus G16 2024 GU605M Ultra 7 155H, GeForce RTX 4070 Laptop GPU, 90 Wh | Lenovo Yoga Pro 9 16-IRP G8 i7-13705H, GeForce RTX 4060 Laptop GPU, 75 Wh | Schenker VISION 16 Pro (M23) i7-13700H, GeForce RTX 4070 Laptop GPU, 80 Wh | Dell XPS 15 9530 RTX 4070 i7-13700H, GeForce RTX 4070 Laptop GPU, 86 Wh | Media della classe Multimedia | |
|---|---|---|---|---|---|---|---|---|
| Autonomia della batteria | -0% | -13% | -27% | -49% | -31% | -12% | 9% | |
| H.264 (h) | 16.5 | 17.9 8% | 13.1 -21% | 11.2 -32% | 7.5 -55% | 7.8 -53% | 16.4 ? -1% | |
| WiFi v1.3 (h) | 10.5 | 10.9 4% | 12.2 16% | 7.3 -30% | 6.4 -39% | 7.8 -26% | 8 -24% | 12.2 ? 16% |
| Load (h) | 1.5 | 1.3 -13% | 1 -33% | 1.2 -20% | 0.7 -53% | 1.3 -13% | 1.5 0% | 1.668 ? 11% |
Pro
Contro
Verdetto - Il nuovo design di XPS funziona meglio come dispositivo da 16 pollici
In totale, il nuovo Dell XPS 16 fa un'impressione migliore rispetto al modello modello più piccolo da 14 pollici. Nonostante il suo peso elevato, il design del portatile non è terribilmente ingombrante e il suo ingombro è migliore rispetto alla concorrenza, grazie anche alle sue cornici sottili. Tuttavia, bisogna notare che anche questo modello pone il design in primo piano, in particolare per quanto riguarda i 60 watt di potenza della RTX 4070 Laptop'è solo nella media per quanto riguarda le prestazioni grafiche. A sua volta, le prestazioni della CPU sono buone, anche se i processori Meteor Lake non offrono alcun vantaggio rispetto ai vecchi modelli Raptor-Lake.
Il touchscreen OLED 4K del dispositivo mostra una buona qualità dell'immagine con colori accurati, ma rispetto ai pannelli OLED più attuali, si nota un chiaro effetto raster quando si visualizzano contenuti leggeri; inoltre, la sua frequenza di aggiornamento di 90 Hz non è più del tutto aggiornata. Anche i suoi nuovi dispositivi di input non sono il massimo: la tastiera richiede un po' di tempo per abituarsi e la touch bar in particolare è piuttosto scomoda nell'uso quotidiano. Per quanto riguarda la connettività, dovrà accontentarsi di tre porte USB-C, come sul più piccolo XPS 14, mentre il più costoso XPS 16 con RTX 4070 Laptop sembra avere solo 2x Thunderbolt ed entrambi i modelli più deboli dispongono di 3x Thunderbolt 4.
Dell XPS 16 si concentra sul design e offre buone prestazioni della CPU, ma l'ergonomia del dispositivo di input e le prestazioni della GPU ne risentono. Inoltre, con un prezzo di 2.899 dollari, è estremamente costoso.
Non abbiamo nulla di negativo da dire sugli altoparlanti e sui tempi di esecuzione del laptop e, in generale, la sua costruzione e la stabilità del case sono buone, anche se il nostro campione di prova ha mostrato un piccolo difetto di costruzione tra le due porte USB-C. Le temperature superficiali rimangono molto basse anche sotto carico, tuttavia le ventole sono molto rumorose e non abbiamo notato grandi differenze tra tutti i profili energetici. Le opzioni di configurazione mostrano parecchie limitazioni, soprattutto per quanto riguarda la RAM. È possibile selezionare un massimo di 64 GB di RAM, ma solo in combinazione con il Core Ultra 9 185H.
Bisogna essere chiari su una cosa: le prestazioni non sono l'unico punto di forza dell'XPS 16. La concorrenza offre molte più prestazioni, soprattutto nel campo delle GPU. Allo stesso tempo, a 2.899 dollari, il prezzo del Dell XPS 16 è estremamente elevato e molti dei suoi concorrenti offrono un rapporto prezzo-prestazioni migliore.
Prezzo e disponibilità
Il nuovo XPS 16 9640 può essere ordinato direttamente da Dell, con prezzi a partire da 1.699 dollari.
Dell XPS 16 9640
- 04/09/2024 v7 (old)
Andreas Osthoff
Transparency
La selezione dei dispositivi da recensire viene effettuata dalla nostra redazione. Il campione di prova è stato fornito all'autore come prestito dal produttore o dal rivenditore ai fini di questa recensione. L'istituto di credito non ha avuto alcuna influenza su questa recensione, né il produttore ne ha ricevuto una copia prima della pubblicazione. Non vi era alcun obbligo di pubblicare questa recensione. In quanto società mediatica indipendente, Notebookcheck non è soggetta all'autorità di produttori, rivenditori o editori.
Ecco come Notebookcheck esegue i test
Ogni anno, Notebookcheck esamina in modo indipendente centinaia di laptop e smartphone utilizzando procedure standardizzate per garantire che tutti i risultati siano comparabili. Da circa 20 anni sviluppiamo continuamente i nostri metodi di prova e nel frattempo stabiliamo gli standard di settore. Nei nostri laboratori di prova, tecnici ed editori esperti utilizzano apparecchiature di misurazione di alta qualità. Questi test comportano un processo di validazione in più fasi. Il nostro complesso sistema di valutazione si basa su centinaia di misurazioni e parametri di riferimento ben fondati, che mantengono l'obiettività.Price comparison

