Verdetto: Prestazioni eccellenti, ma mobilità pari a zero con MSI Raider A18 HX
Se sta cercando uno dei computer portatili più potenti in circolazione, MSI Raider A18 HX dovrebbe essere in cima alla sua lista. Con AMD Ryzen 9 9955HX3D, il fiore all'occhiello dei processori mobili di AMD nell'anno 2025, non ci sono molti portatili attualmente sul mercato in grado di superare questo gigante del gaming. Questo vale anche per la dGPU - sebbene contenga "solo" la Nvidia GeForce RTX 5080 e non la RTX 5090, gli utenti possono aspettarsi prestazioni da GPU di punta.
Cosa non possono aspettarsi: Una buona durata della batteria o un computer portatile silenzioso. Se cerca queste qualità, MSI Raider A18 non fa per lei. Una cosa che ci ha deluso è il sistema di altoparlanti, che è forte, ma senza bassi. Il lato positivo è che il laptop MSI offre caratteristiche come il lettore di schede SD o l'Ethernet da 2,5 Gbit, che lo rendono non solo un ottimo laptop da gioco, ma anche potenzialmente una solida workstation mobile.
Pro
Contro
Prezzo e disponibilità
Al momento in cui scriviamo, MSI Raider A18 HX costa oltre 6.000 dollari negli Stati Uniti - Amazon lo offre.
Sommario
- Verdetto: Prestazioni eccellenti, ma mobilità pari a zero con MSI Raider A18 HX
- Specifiche tecniche: Gamma Fire di AMD combinata con RTX 5080
- Caso: enorme laptop MSI con un sacco di fascino da gioco
- Connettività: MSI include una scheda SD e una rete Ethernet da 2,5 Gbit
- Dispositivi di input: La tastiera RGB di MSI può illuminarsi come vuole
- Display: MSI Raider A18 HX ha uno schermo miniLED luminoso e opaco
- Prestazioni: AMD Fire Range equivale a Intel Arrow Lake HX, con un consumo energetico inferiore
- Emissioni: La ventola pulsante rende fastidioso MSI Raider A18
- Gestione dell'energia: Il portatile MSI consuma velocemente la batteria grande
- Valutazione Notebookcheck
- Potential Competitors in Comparison
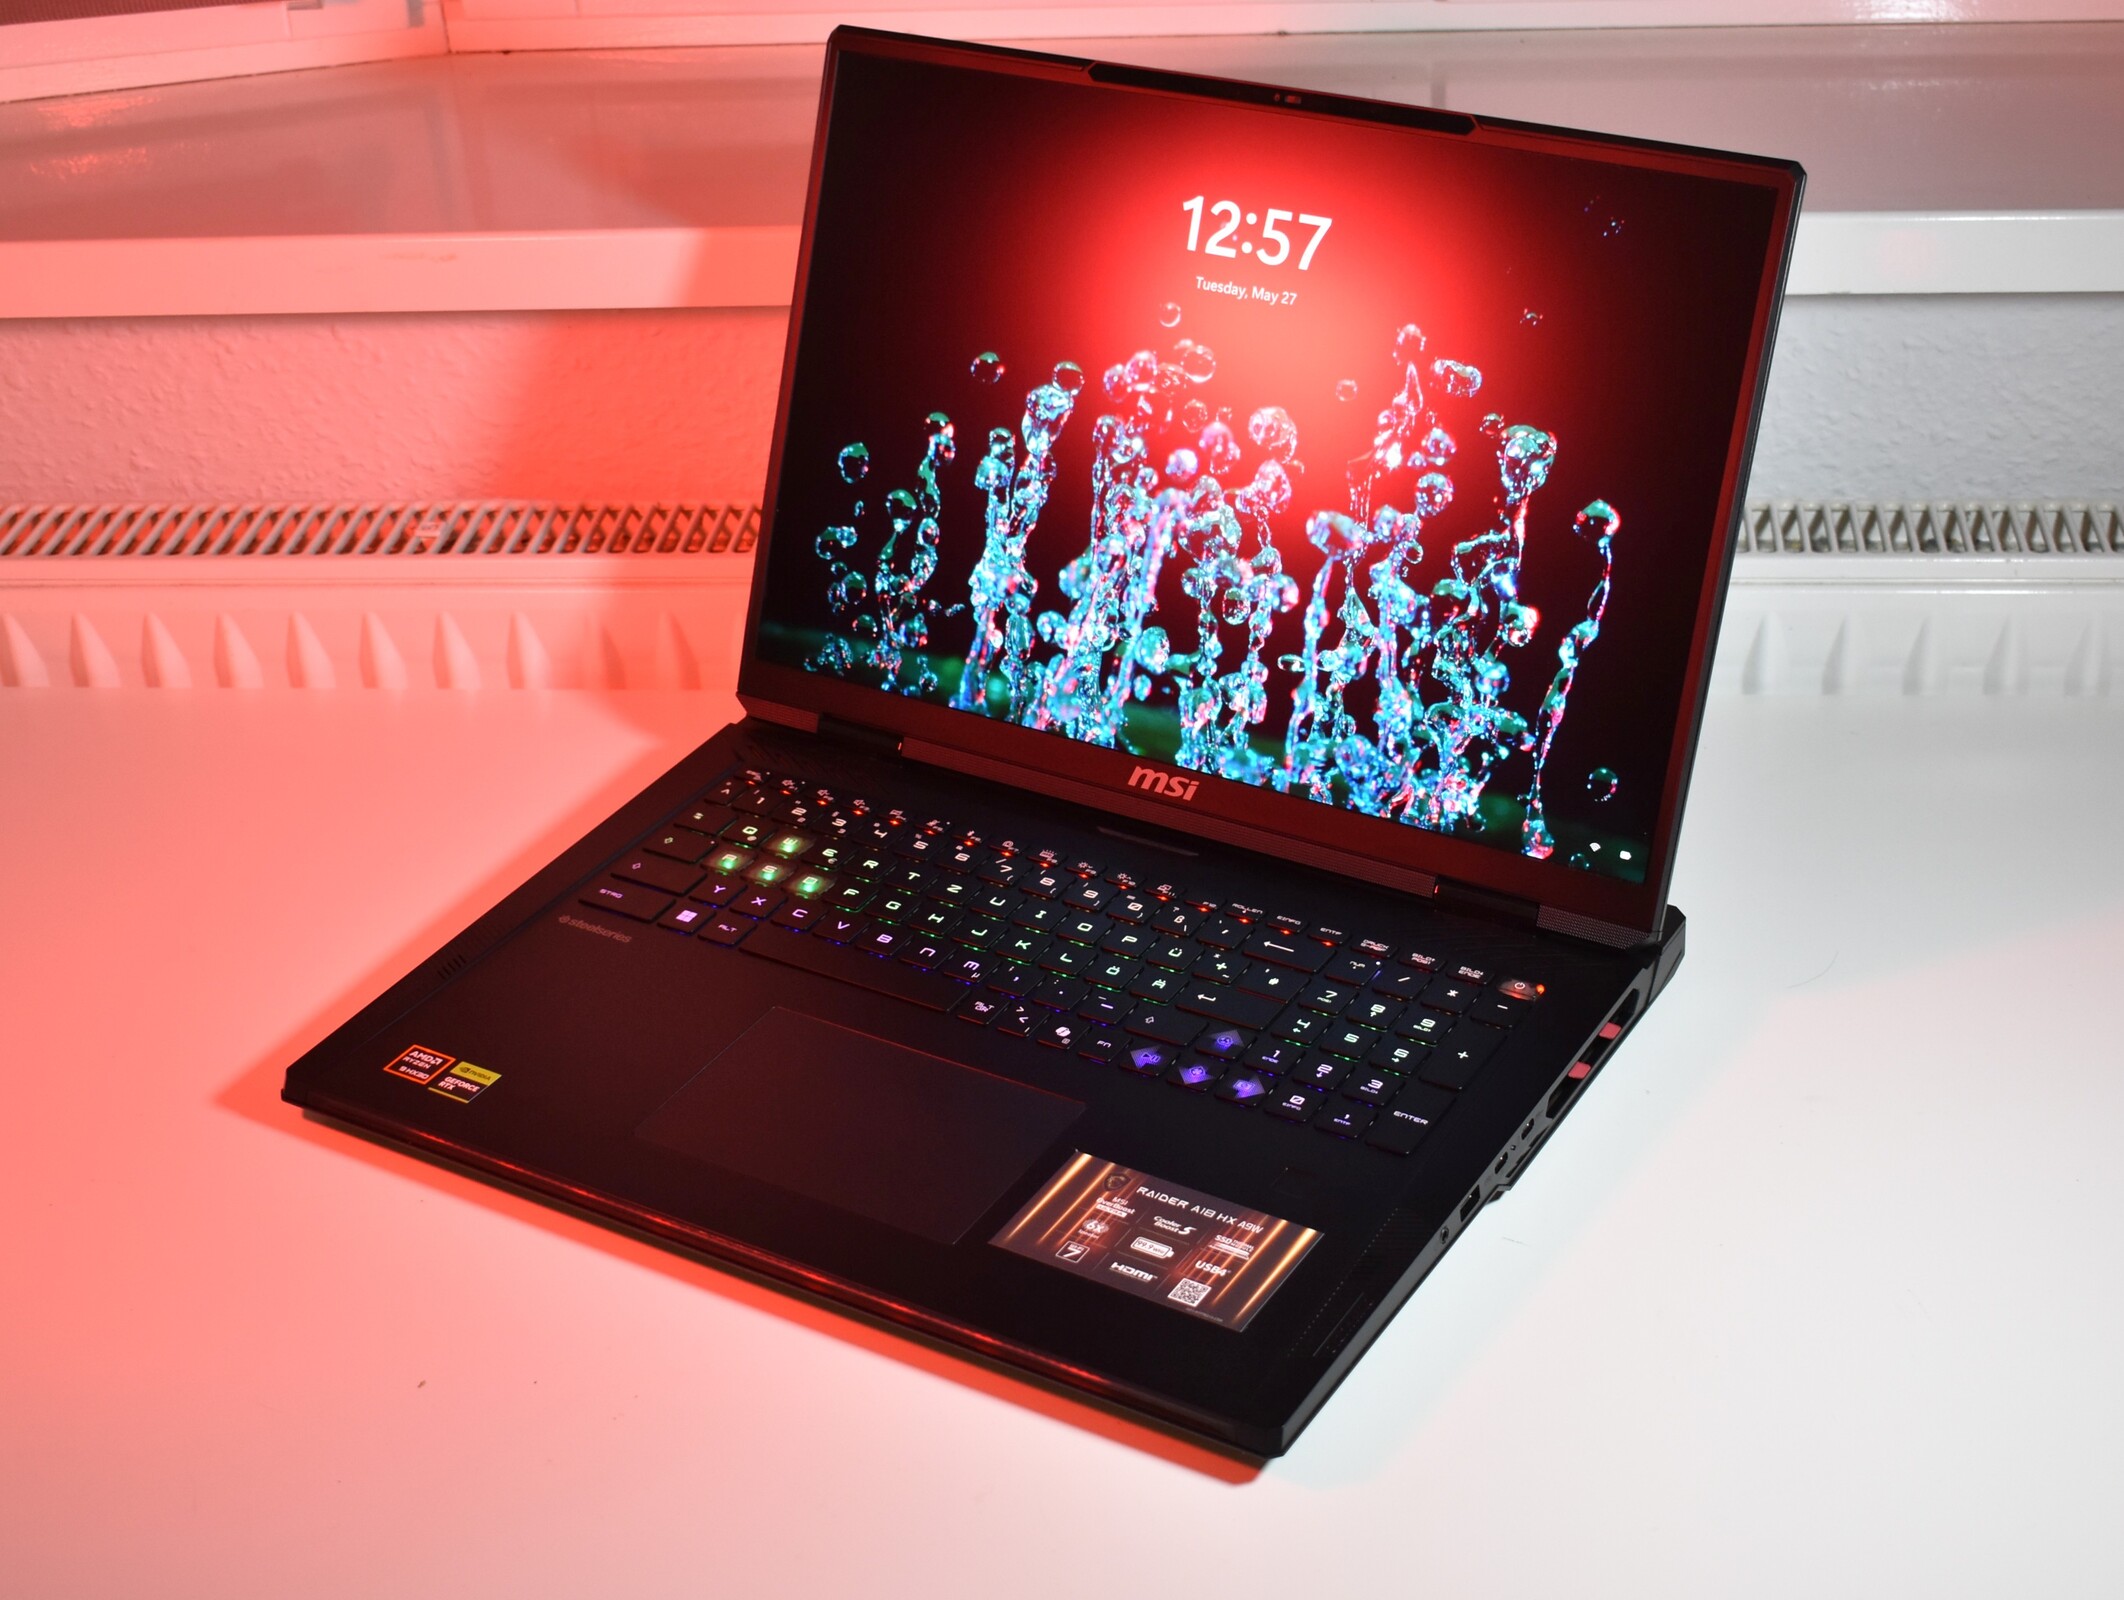
Le offerte mobile di AMD che ricevono maggiore attenzione sono senza dubbio Strix Point e la sua variante ancora più potente, incentrata sulla GPU, Strix Halo. Ma Strix Halo non è l'opzione più potente di AMD per i computer portatili, questo onore va alla gamma Fire di AMD, che sono essenzialmente i chip desktop di AMD per i computer portatili. Con questa recensione, abbiamo la possibilità di testare un portatile enorme con un raffreddamento abbastanza potente per questi colossi di processori: MSI Raider A18 HX A9WIG-080, che sfoggia un grande display miniLED da 18 pollici e la Nvidia GeForce RTX 5080, anche.
Specifiche tecniche: Gamma Fire di AMD combinata con RTX 5080
Caso: enorme laptop MSI con un sacco di fascino da gioco
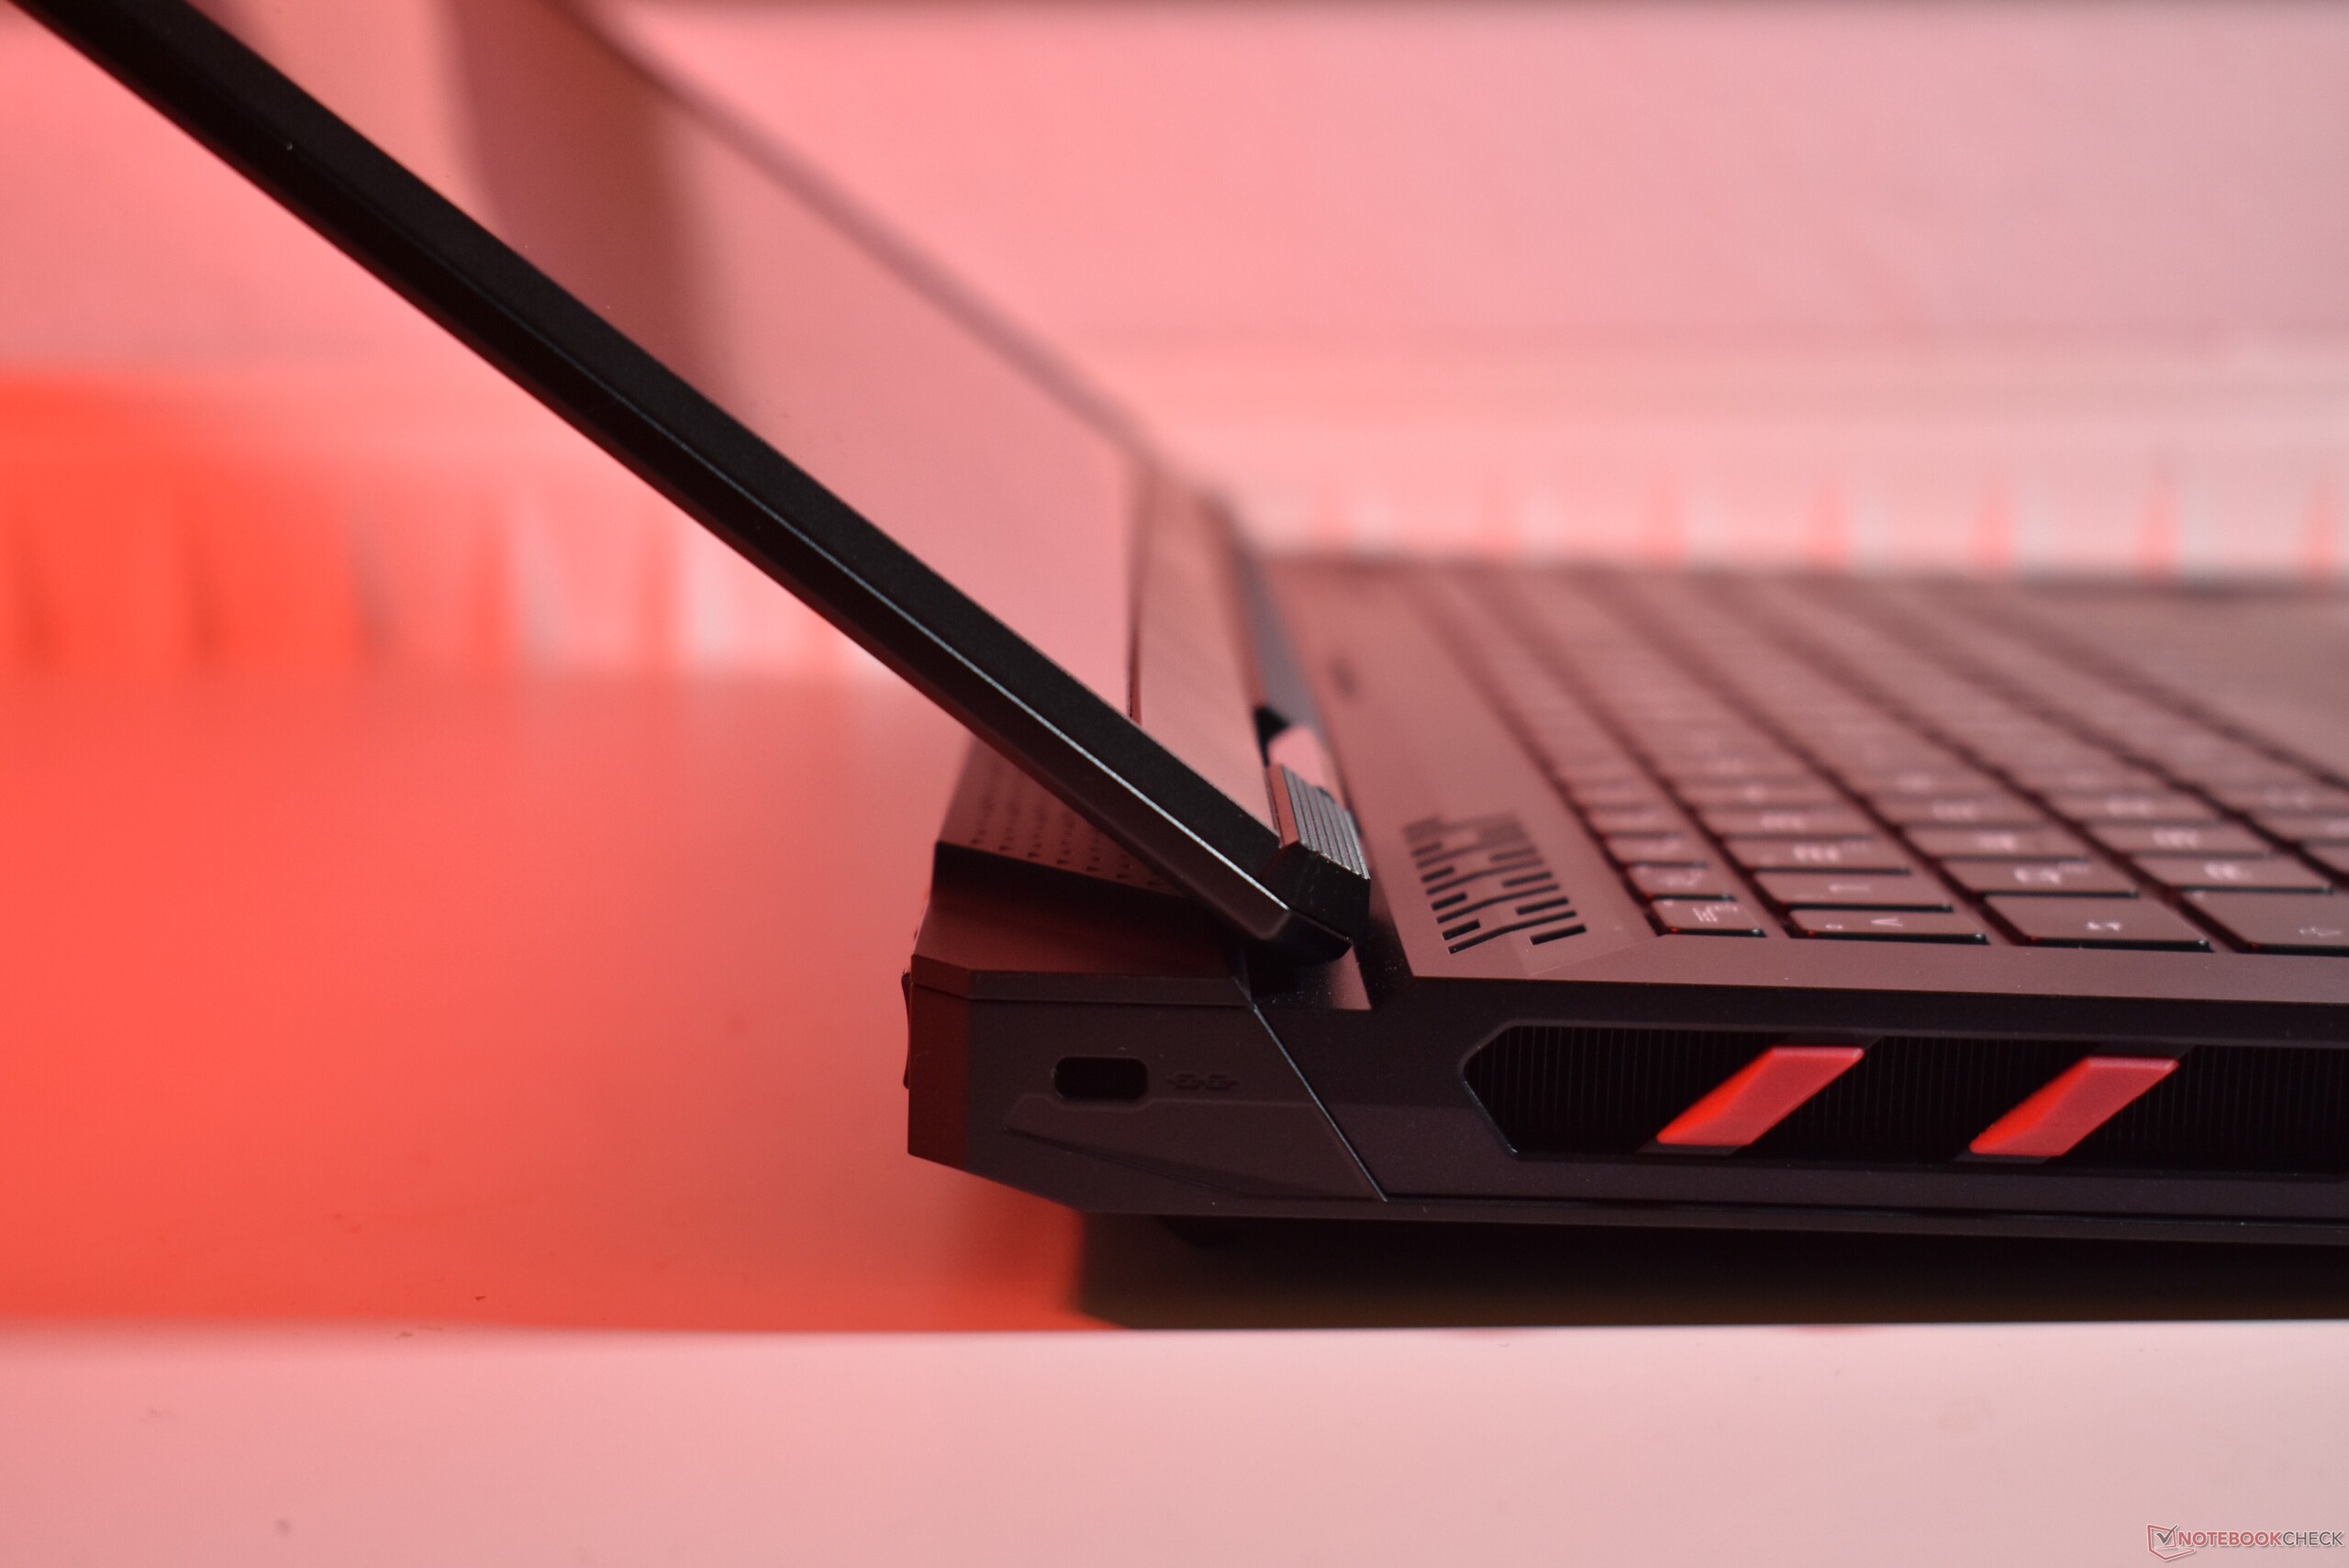
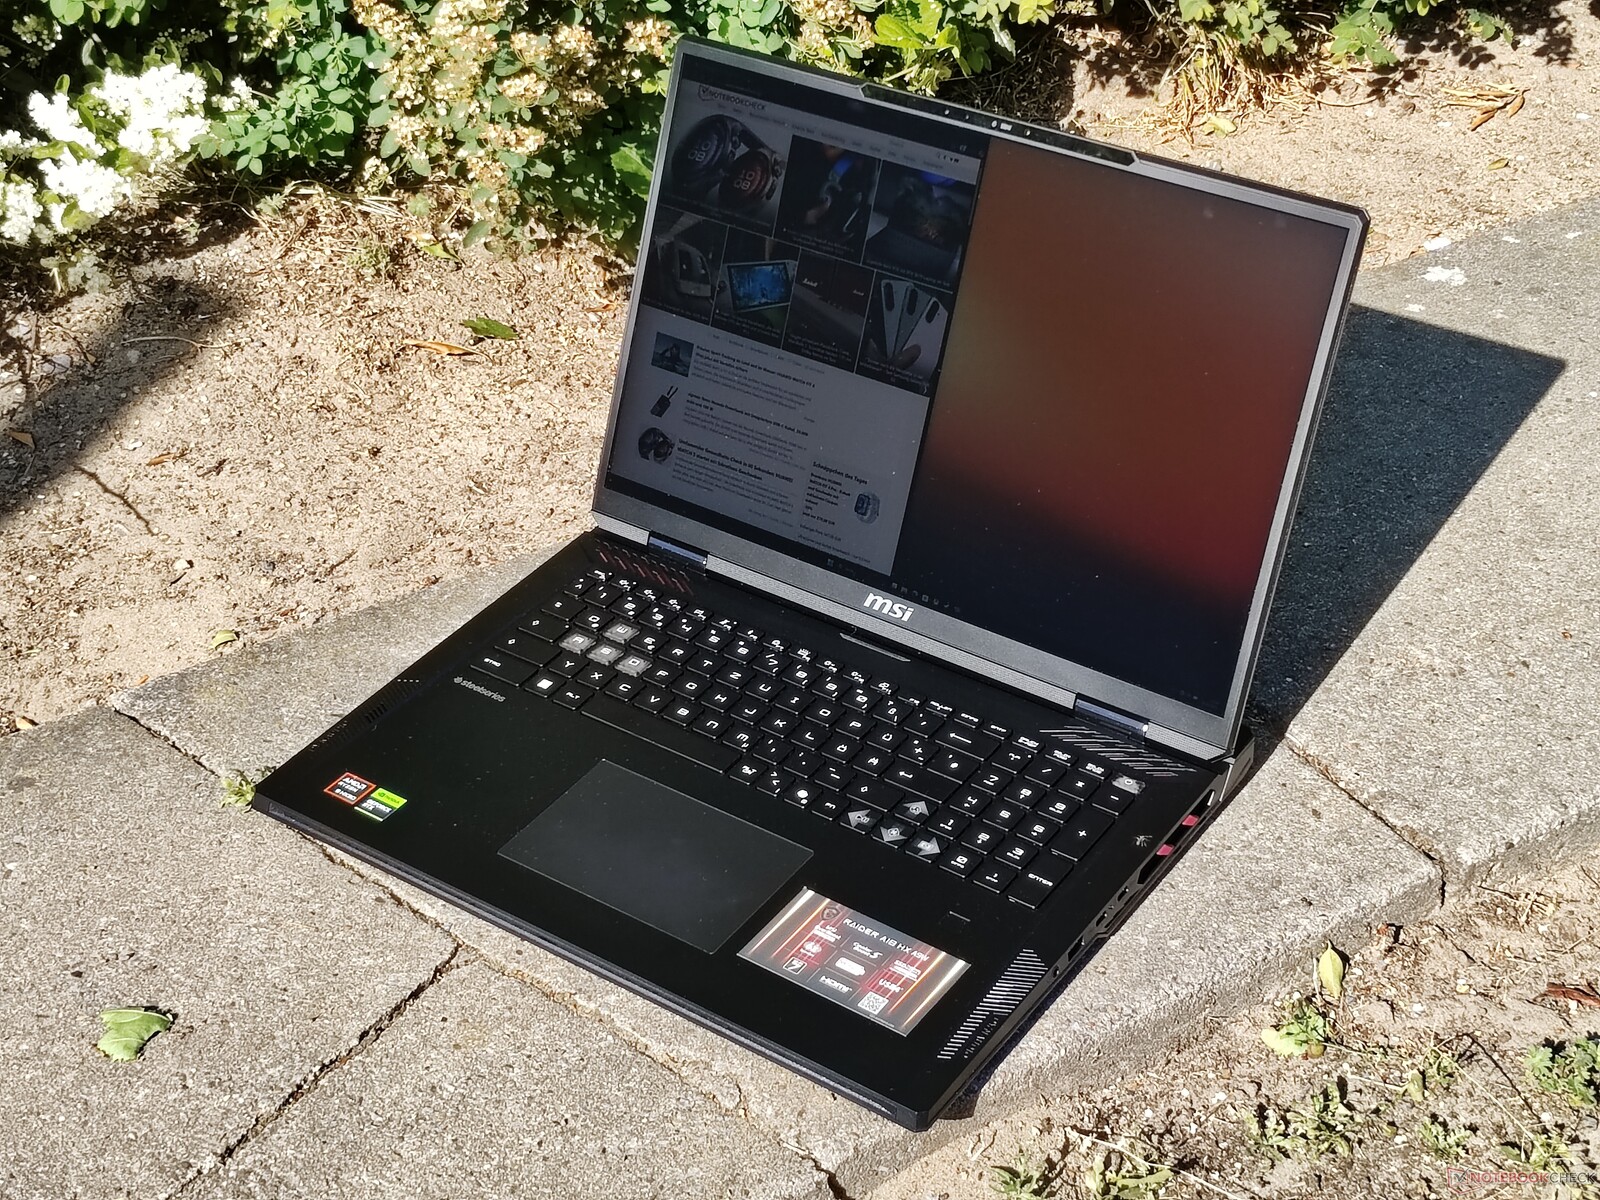
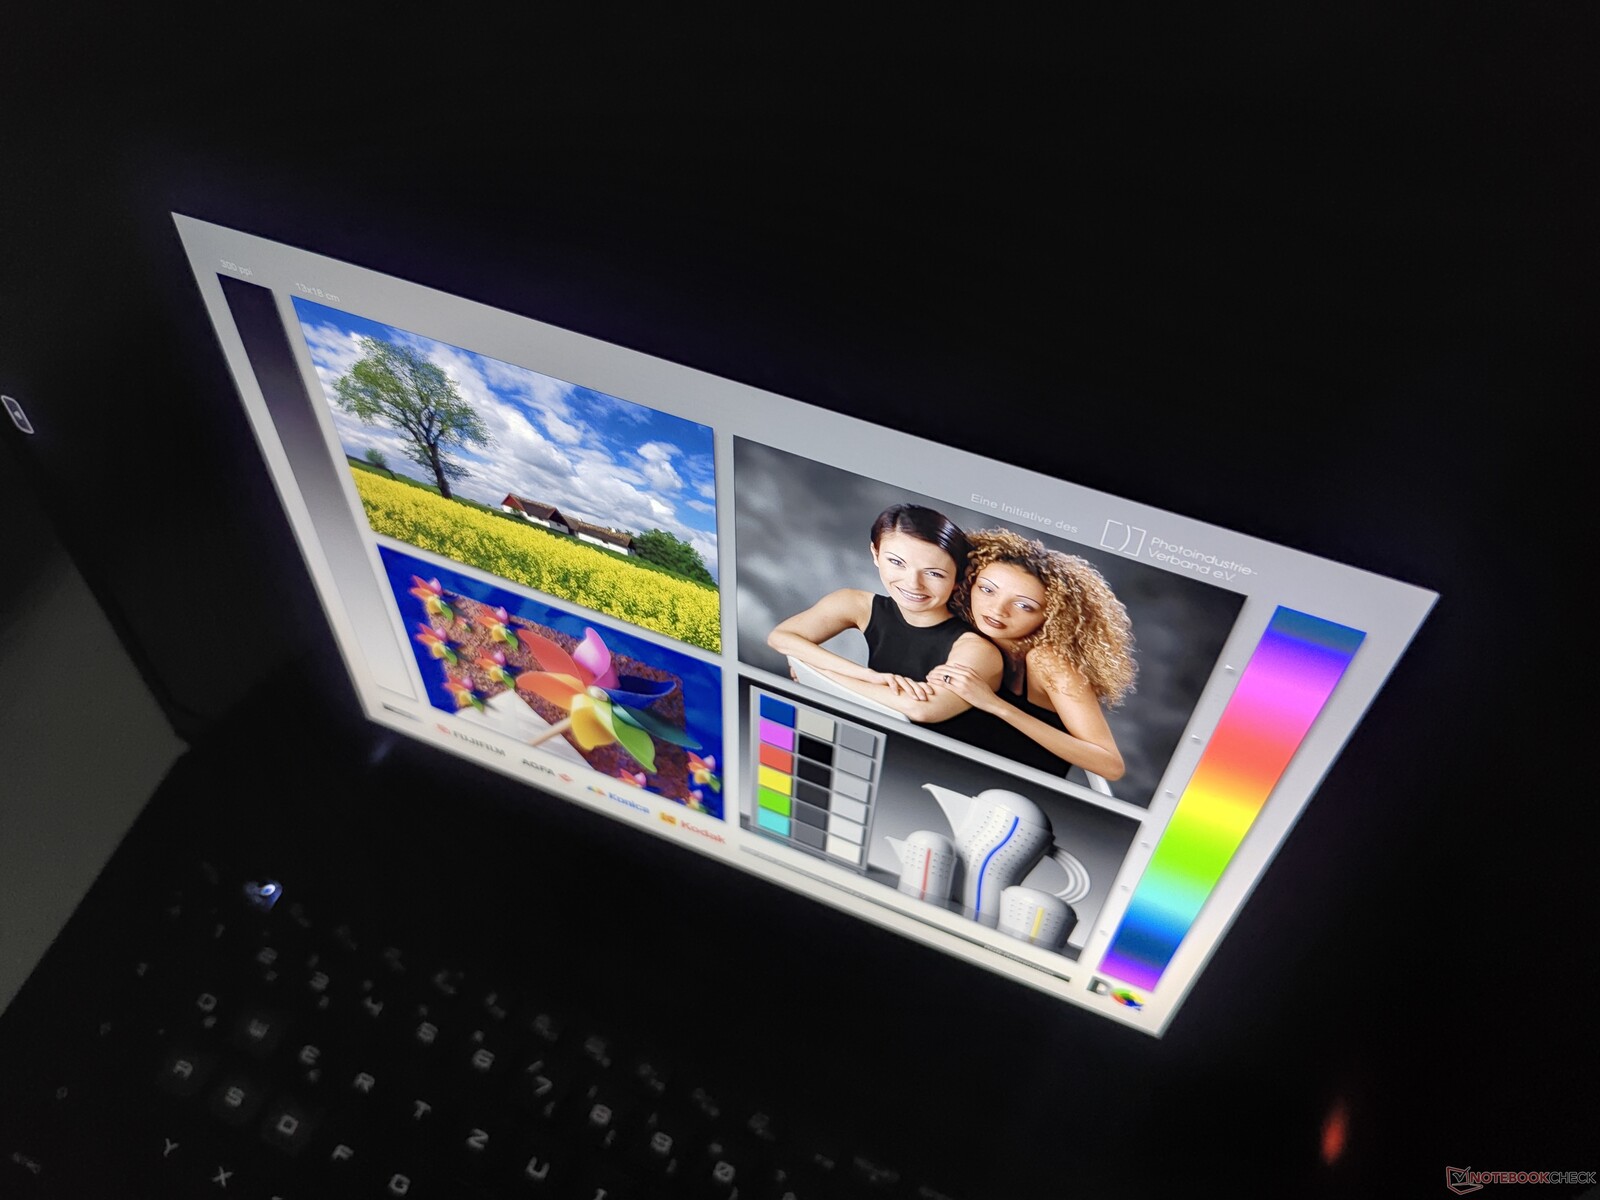
Questo gigantesco portatile è un PC da gioco e lo sembra anche. Ci sono molti accenti rossi nello chassis nero, oltre a luci RGB nel logo sul coperchio, nella tastiera e nel bordo anteriore. Ci sono anche angoli e molte pieghe sul telaio, che aumentano il "fascino del giocatore". MSI utilizza sia l'alluminio che la plastica come materiali di scelta per il Raider A18. La base spessa, che ha un telaio in magnesio all'interno, ha un'elevata resistenza, anche se la copertura dello schermo non è altrettanto resistente e presenta una certa flessione.
Sebbene sia possibile aprire lo schermo con una sola mano, si nota una leggera oscillazione della cerniera. Inoltre, lo schermo si apre solo a 130 gradi, poiché il blocco di raffreddamento dietro lo schermo ne impedisce l'ulteriore apertura.
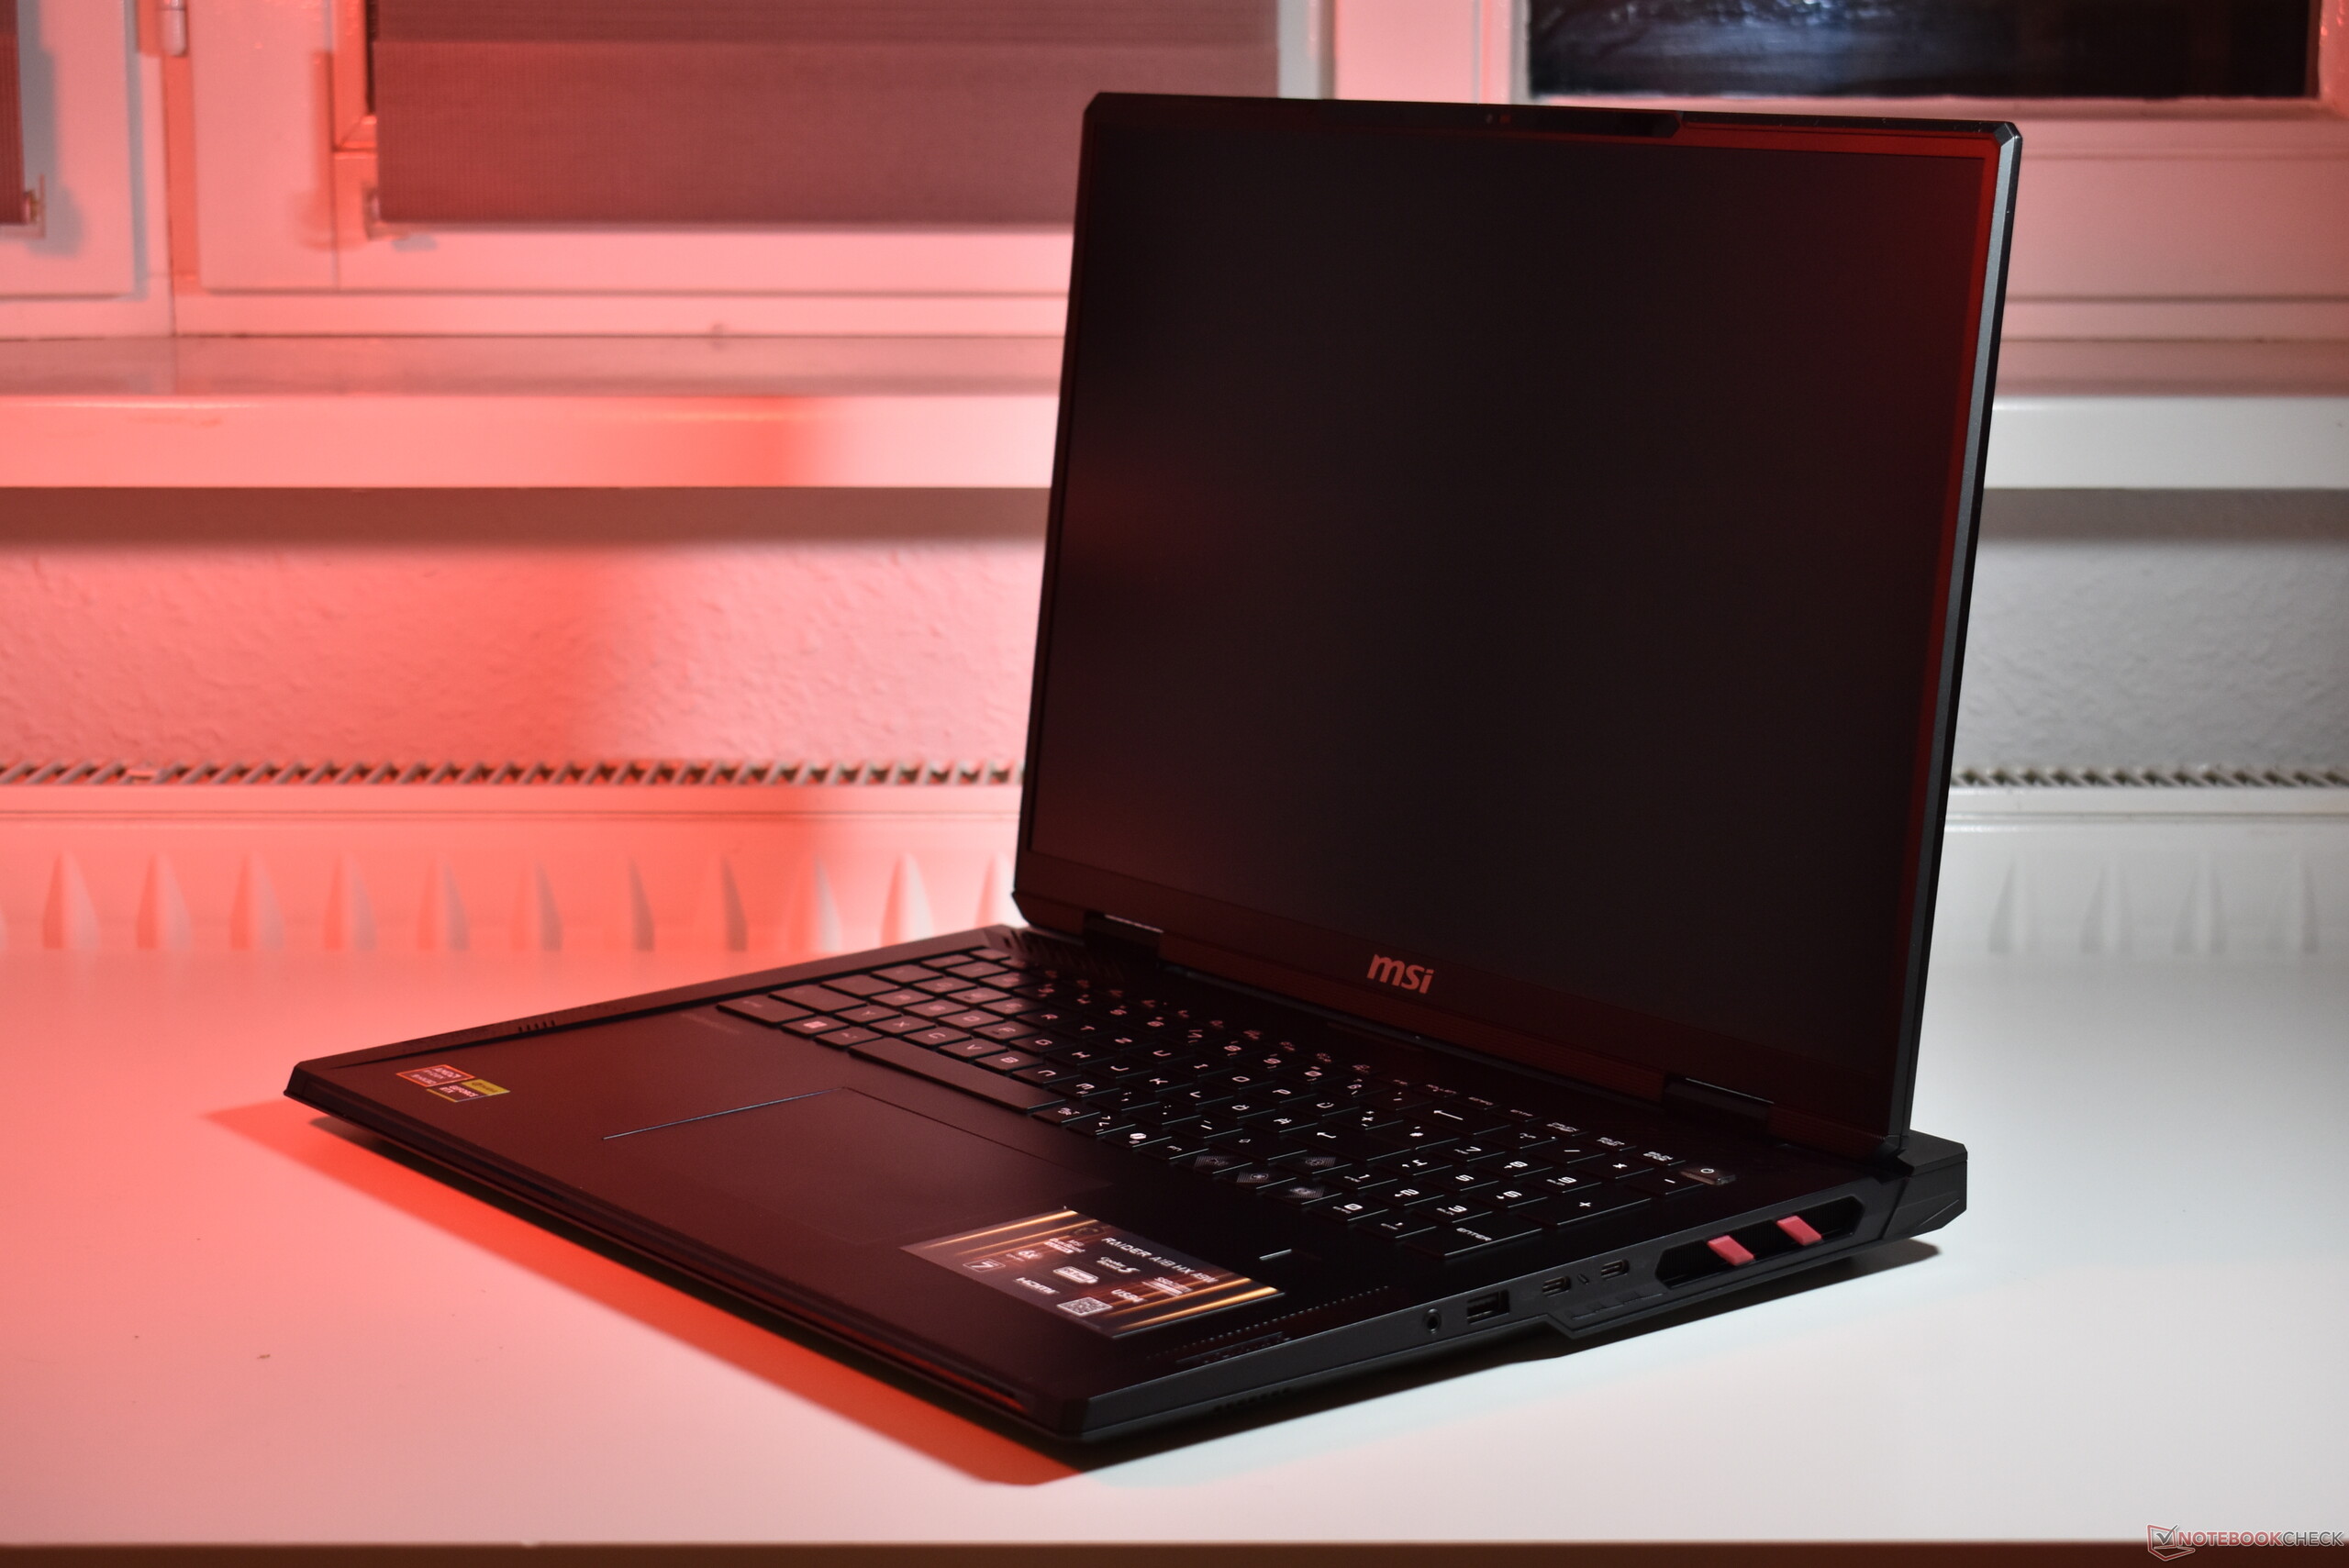

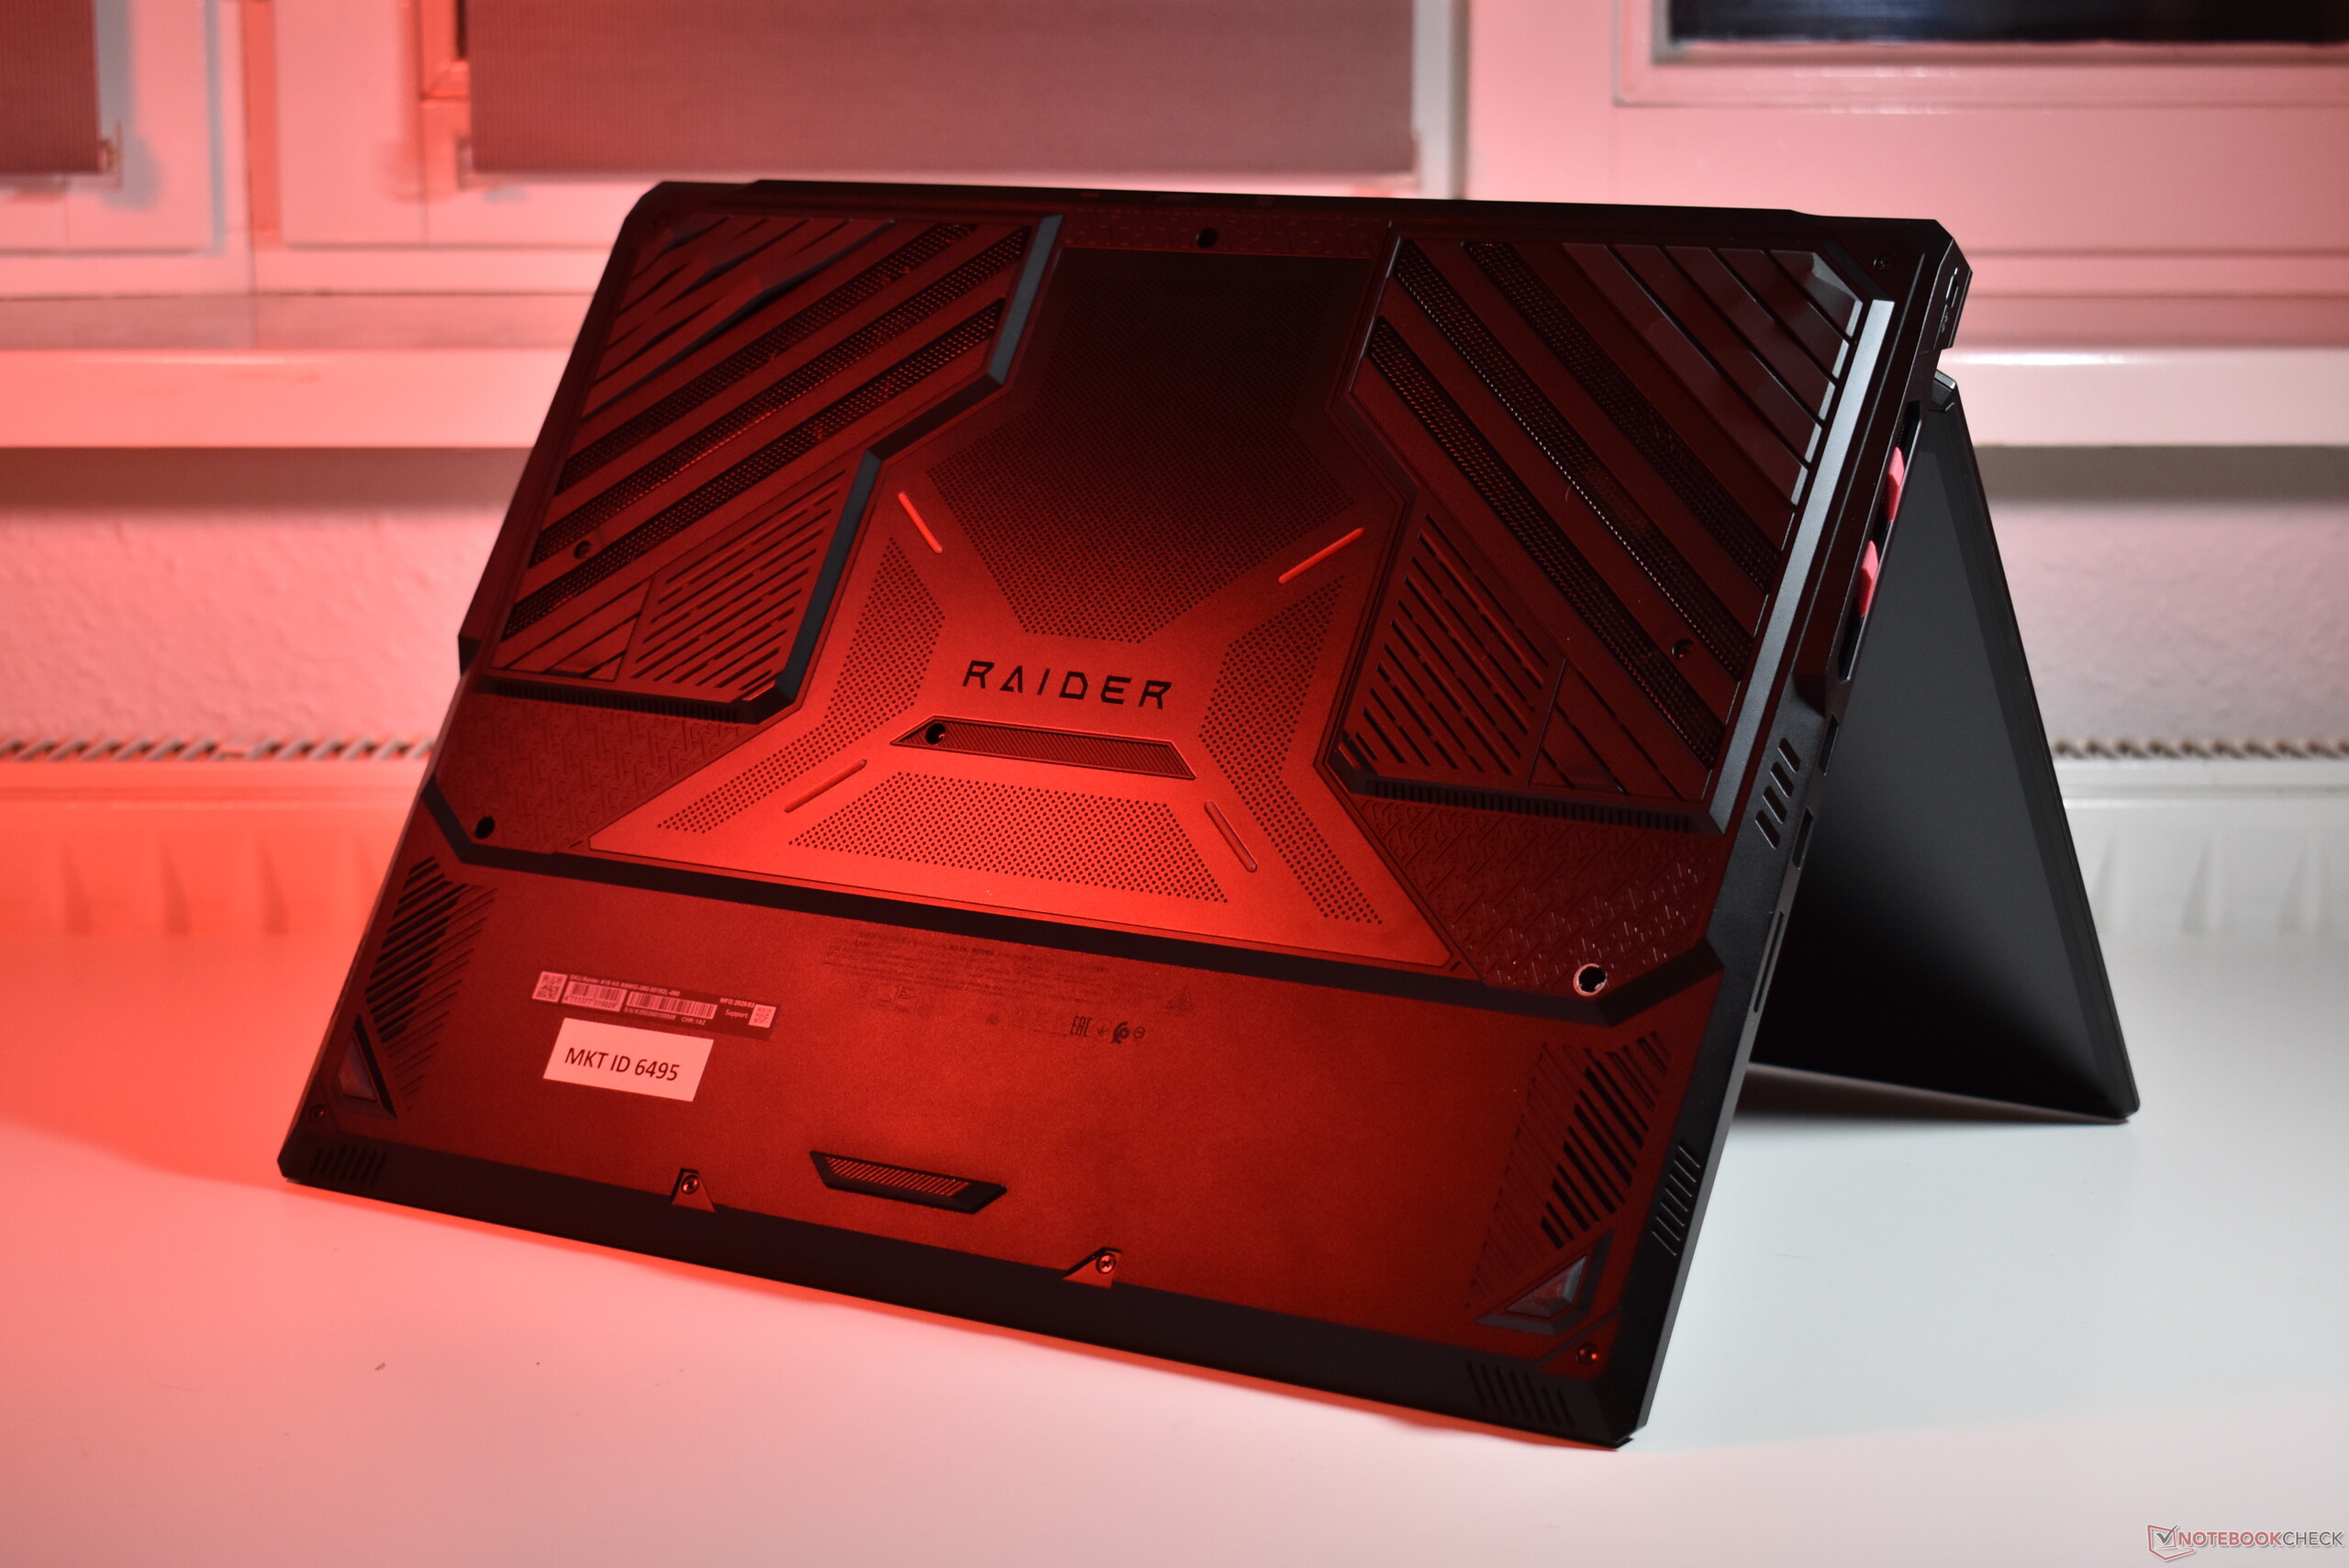
MSI Raider A18 è il portatile da 18 pollici più pesante del nostro confronto, anche se nessuno di questi dispositivi è veramente adatto all'uso mobile. La categoria dei 18 pollici è strettamente dominata da modelli sostitutivi dei desktop, che raramente lasceranno la scrivania di casa.
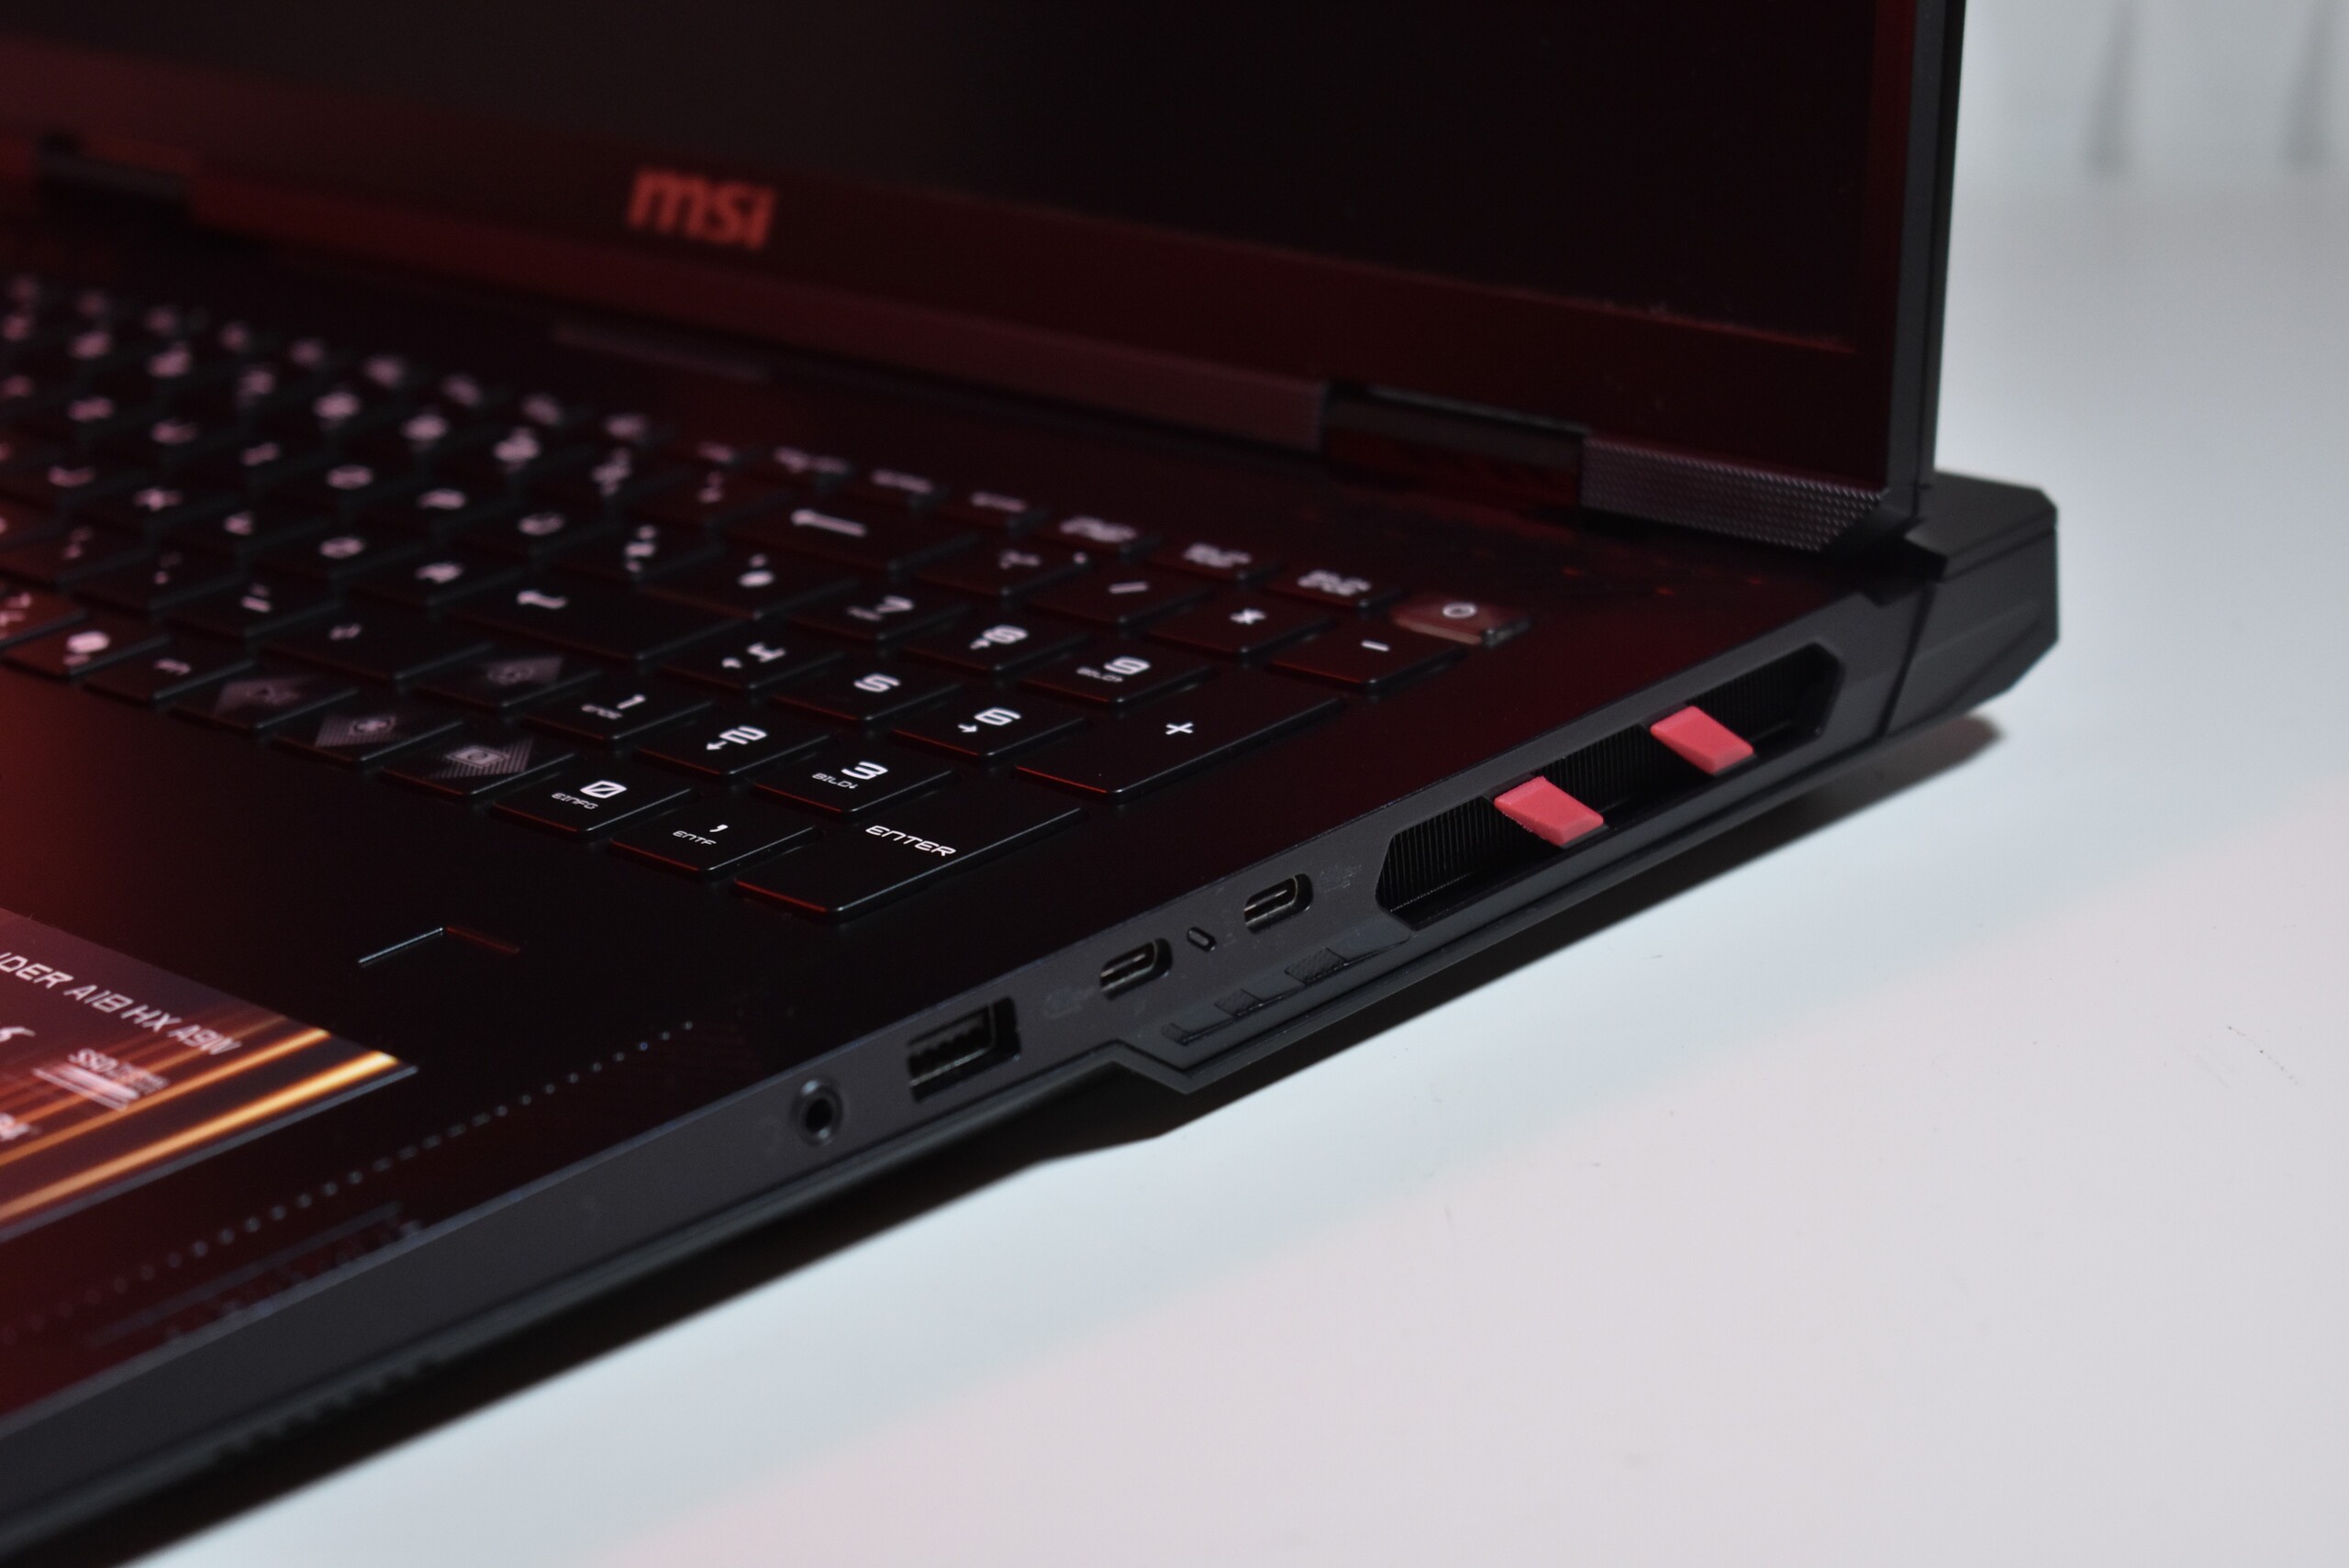
Connettività: MSI include una scheda SD e una rete Ethernet da 2,5 Gbit
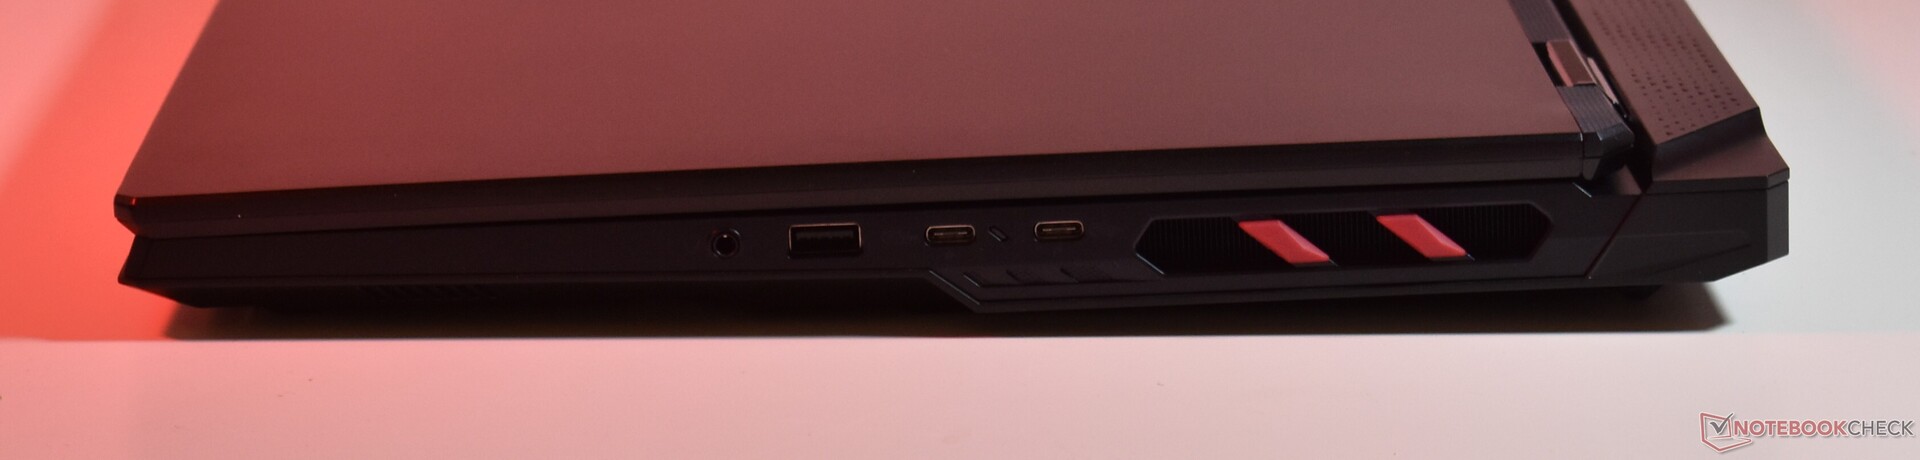
MSI include tutte le porte che si possono desiderare in un computer portatile moderno - per fortuna, visto che lo chassis spesso e grande offre uno spazio più che sufficiente. Le porte sono posizionate sui lati destro e sinistro, oltre che sul retro. Un po' di confusione: La porta di ricarica sembra una porta USB A, ma non è così. Inoltre, sarebbe stato bello se MSI avesse potuto collocare una delle porte USB-C/Thunderbolt 4 anche sul lato sinistro.
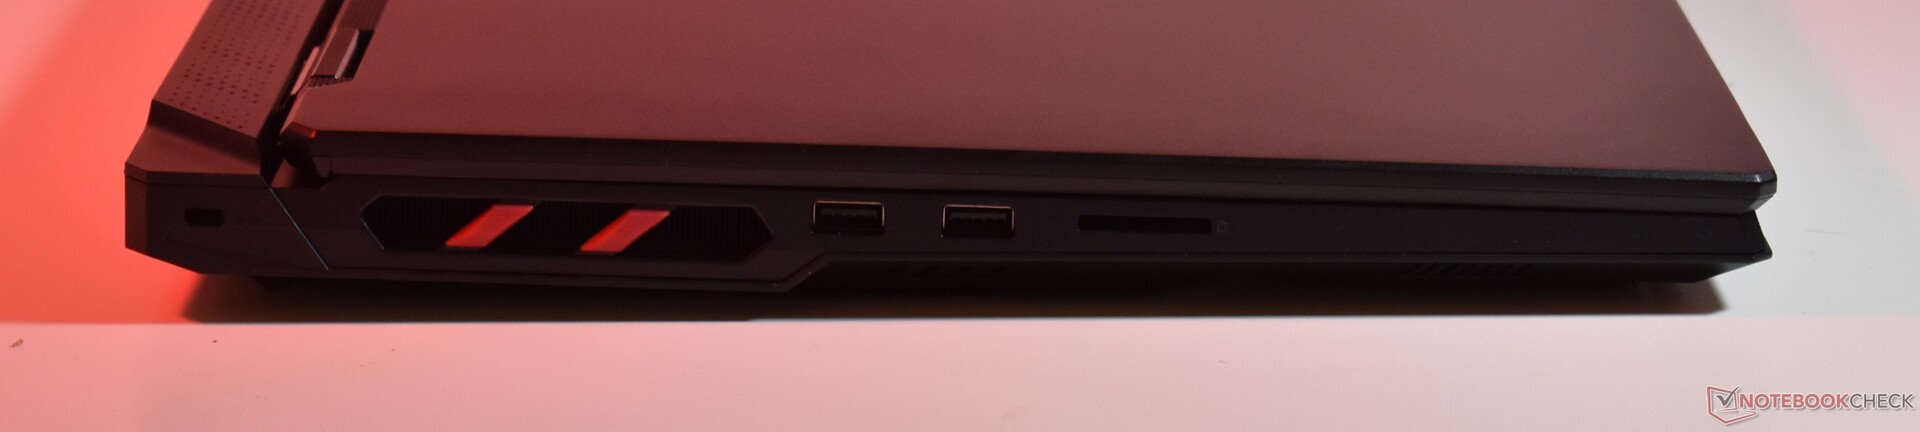
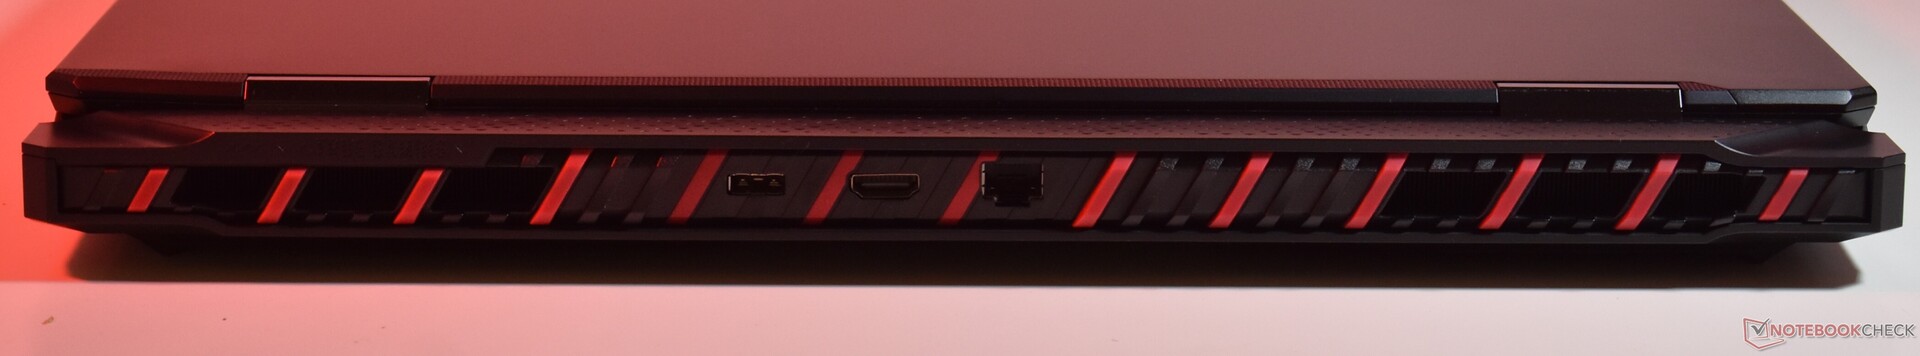
Lettore di schede SD
Il lettore di schede SD full-size non riesce ad alloggiare completamente le schede, che fuoriescono. Abbiamo testato la sua velocità con la scheda di riferimento AV PRO microSD 128 GB V60: Il lettore di schede è molto veloce quando legge i dati, ma offre solo una velocità media quando trasferisce i dati sulla scheda.
| SD Card Reader | |
| average JPG Copy Test (av. of 3 runs) | |
| Medion Erazer Beast 18 X1 MD62731 (AV PRO microSD 128 GB V60) | |
| Aorus Master 18 AM8H (AV PRO microSD 128 GB V60) | |
| Media della classe Gaming (20.9 - 210, n=54, ultimi 2 anni) | |
| MSI Raider 18 HX A14V (Toshiba Exceria Pro SDXC 64 GB UHS-II) | |
| MSI Raider A18 HX A9WIG-080 | |
| maximum AS SSD Seq Read Test (1GB) | |
| MSI Raider A18 HX A9WIG-080 | |
| Aorus Master 18 AM8H (AV PRO microSD 128 GB V60) | |
| Medion Erazer Beast 18 X1 MD62731 (AV PRO microSD 128 GB V60) | |
| Media della classe Gaming (25.5 - 261, n=51, ultimi 2 anni) | |
| MSI Raider 18 HX A14V (Toshiba Exceria Pro SDXC 64 GB UHS-II) | |
Comunicazione
Questo MSI Raider A18 supporta lo standard Wi-Fi 7 con MediaTek Wi-Fi 7 MT7925. Le velocità di trasferimento sono molto buone, il portatile non dovrebbe avere problemi durante le sessioni di gioco intense. In alternativa, per una connessione ancora più stabile, sul retro è presente un connettore Ethernet da 2,5 GBit.
Webcam
MSI utilizza una semplice webcam a 1080p, dotata di una telecamera IR e di un otturatore per la privacy. La webcam è appena sufficiente per le videochiamate, ma la qualità dell'immagine non è eccezionale.


Accessori
Oltre all'enorme caricatore da 400 W con spina proprietaria, non ci sono altri accessori inclusi nella confezione.
Manutenzione
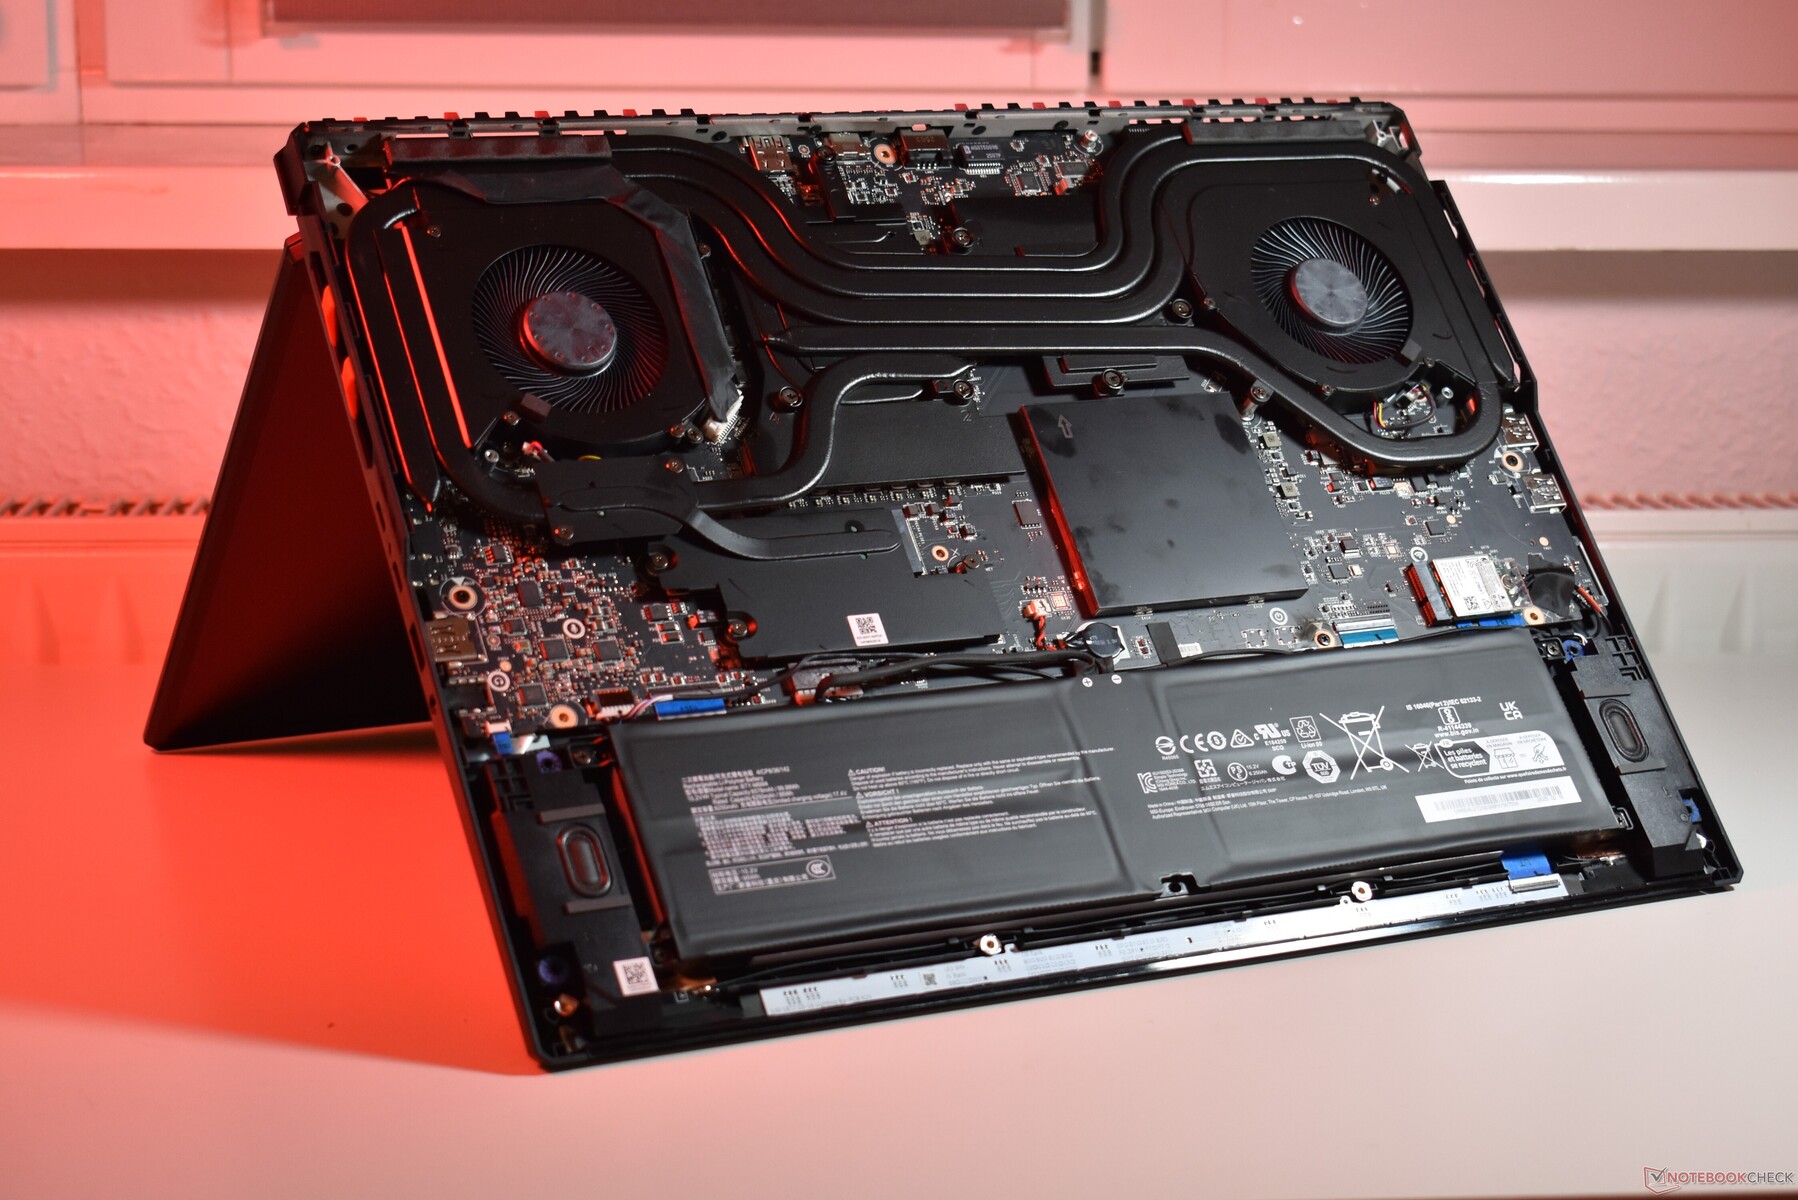
In totale, ci sono dodici viti a testa di Philips che fissano il coperchio inferiore del portatile MSI Raider A18. Inoltre, MSI colloca alcune clip intorno ai bordi della base che tengono fermo il coperchio e che devono essere aperte con uno strumento di plastica per fare leva.
Una volta rimosso il coperchio, è possibile accedere ai componenti interni. Memoria, archiviazione e Wi-Fi sono tutti modulari, con l'SSD nascosto sotto un'unità termica collegata al sistema di raffreddamento. Inoltre, il sistema di raffreddamento può essere pulito e la batteria sostituita, se necessario.
Sostenibilità
Non ci sono molte informazioni sugli sforzi di MSI per la sostenibilità di MSI Raider A18 HX. Il portatile è certificato EPEAT Silver, ma queste sono tutte le informazioni che abbiamo.
Garanzia
Come molti altri computer portatili consumer nel mercato UE, MSI Raider A18 HX ha una garanzia di 24 mesi. Il dispositivo deve essere spedito e la garanzia è valida solo in Germania.
Dispositivi di input: La tastiera RGB di MSI può illuminarsi come vuole
Tastiera
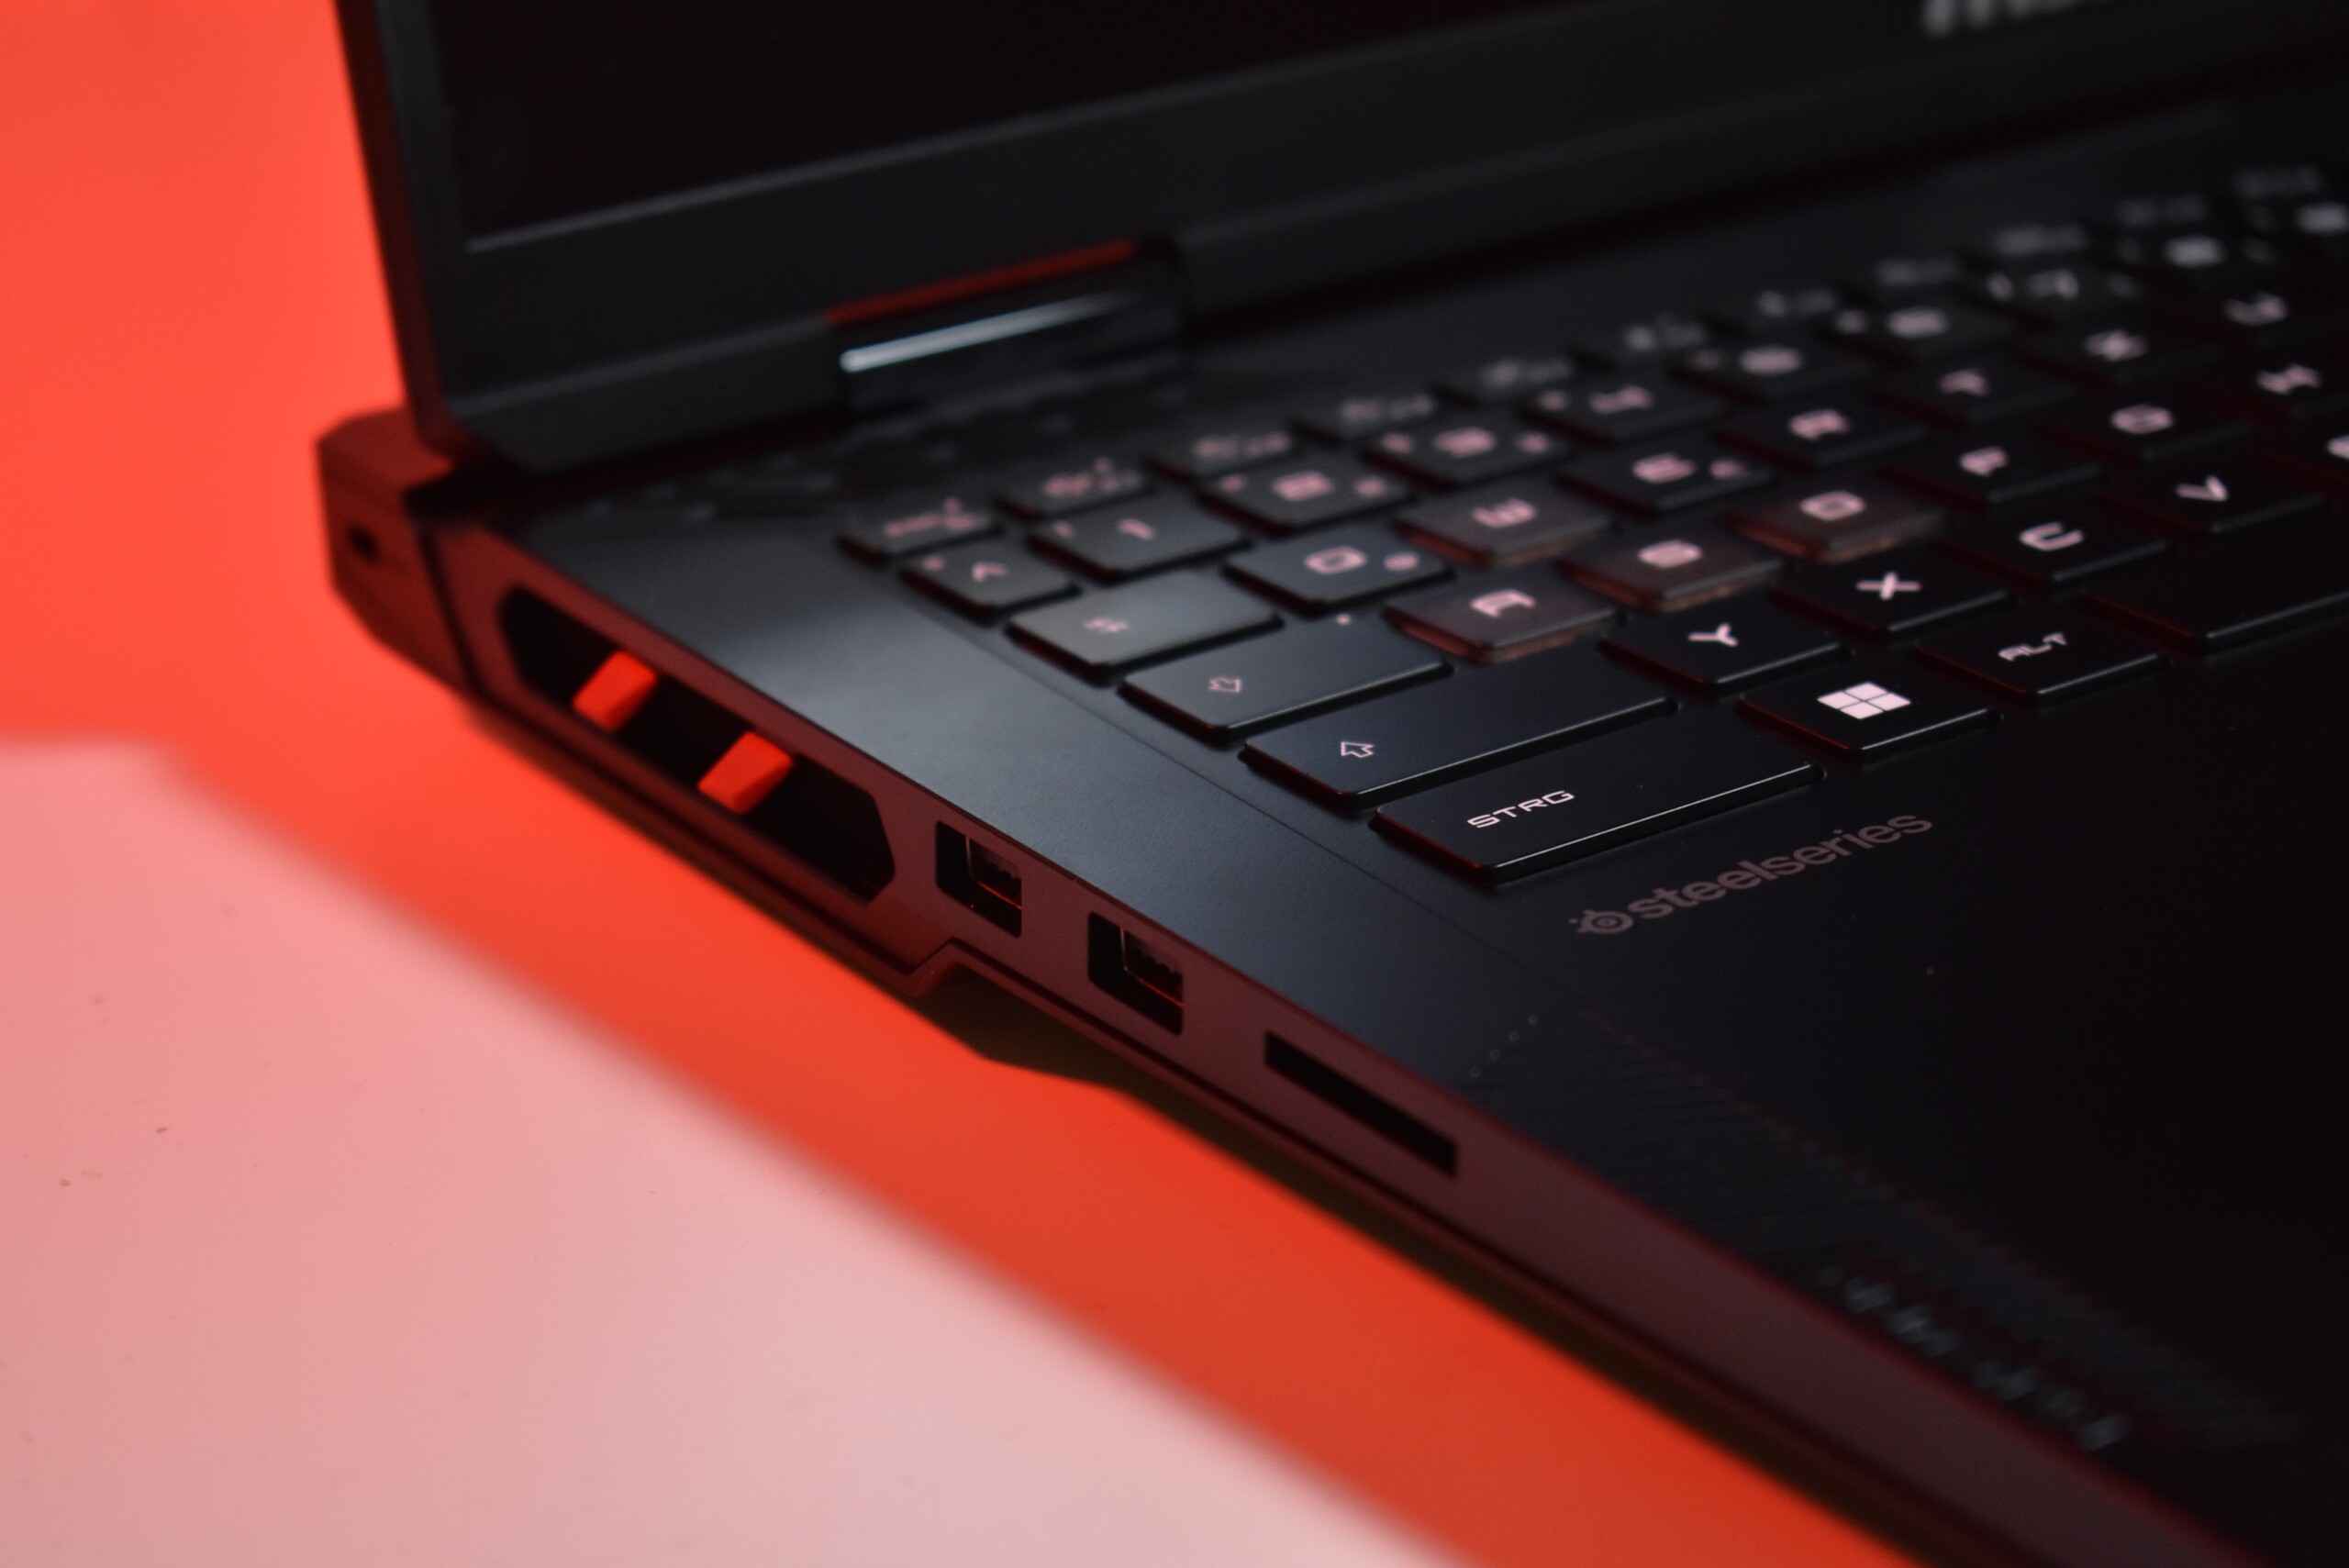
La tastiera è una parte fondamentale di MSI Raider A18 HX. MSI utilizza una tastiera Steelseries, che offre un'esperienza di digitazione molto piacevole. Si tratta di una tastiera full-size con tastierino numerico, con una lunga corsa dei tasti e una sensazione morbida e soffice. C'è una retroilluminazione RGB che offre una personalizzazione tasto per tasto e una gamma di effetti diversi.
Ci sono dei punti deboli: L'area intorno al tasto R presenta una certa flessione in caso di digitazione intensa. Inoltre, il layout non è eccezionale, con stranezze come la strana posizione del tasto FN e il piccolo tasto Invio su un'unità europea.
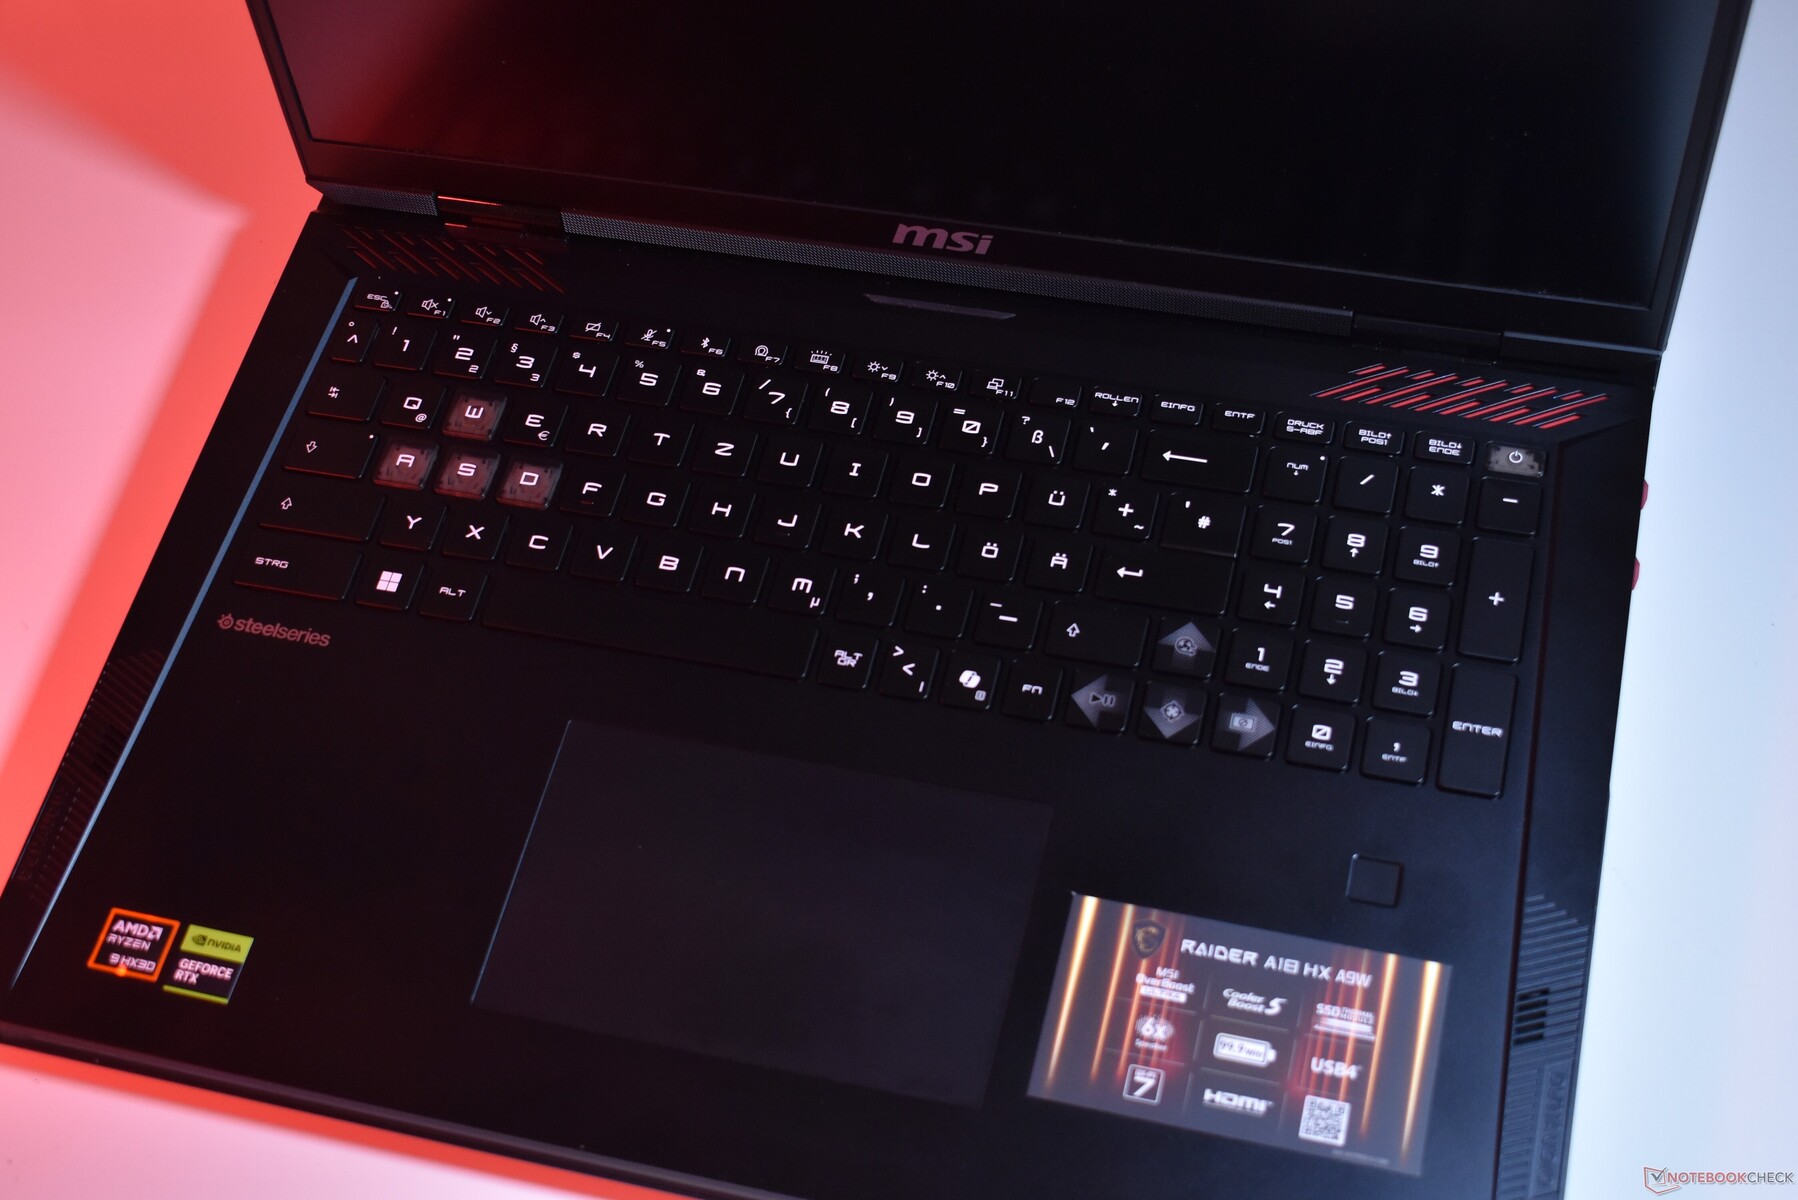
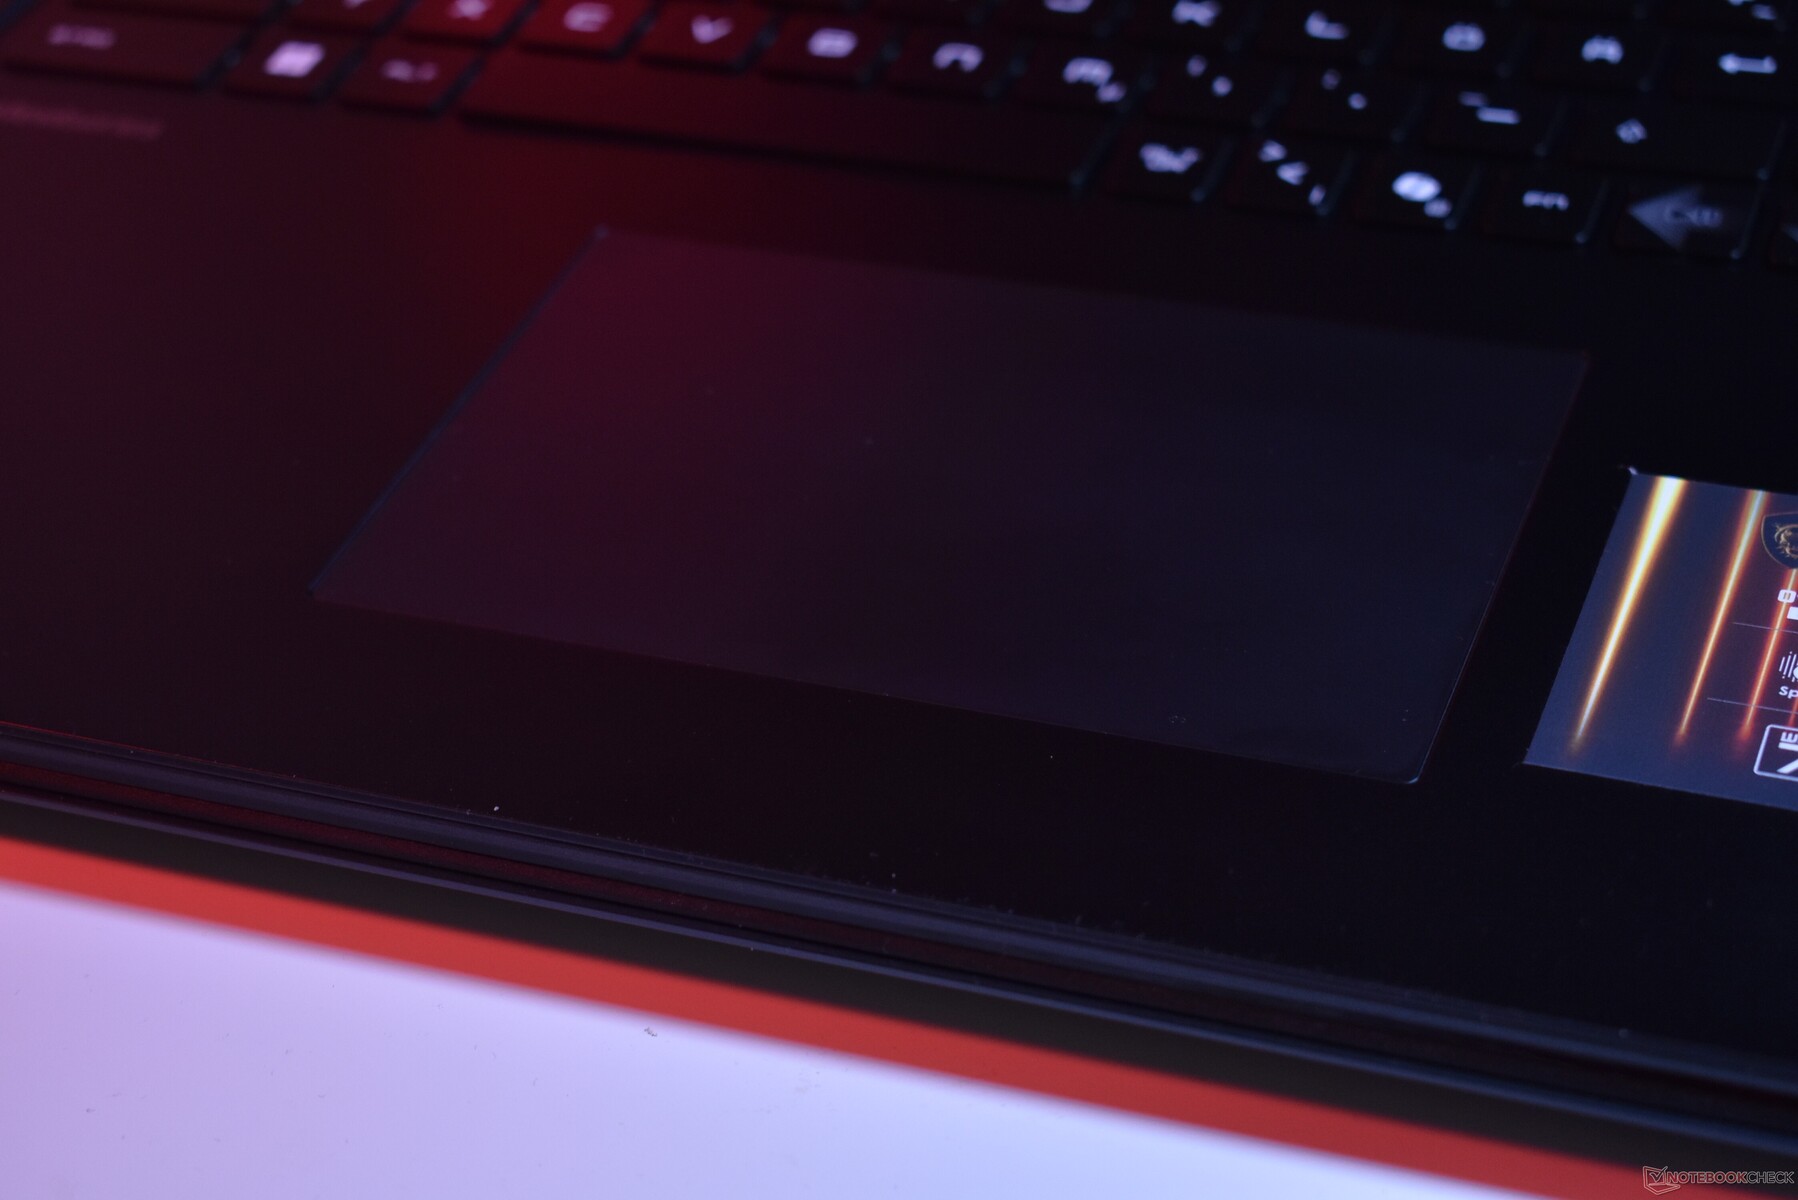
Touchpad
MSI ha inserito un clickpad meccanico, che misura 13,1 x 8,2 cm. Il clic meccanico è piacevole, abbastanza forte ma comunque smorzato. Il suo meccanismo non è nemmeno troppo rumoroso. La superficie è realizzata in plastica nera opaca, molto liscia, ideale per far scorrere le dita su di essa. Nel complesso, ci piace questo touchpad e funziona bene, anche se un touchpad in vetro aptico sarebbe stato ancora migliore.
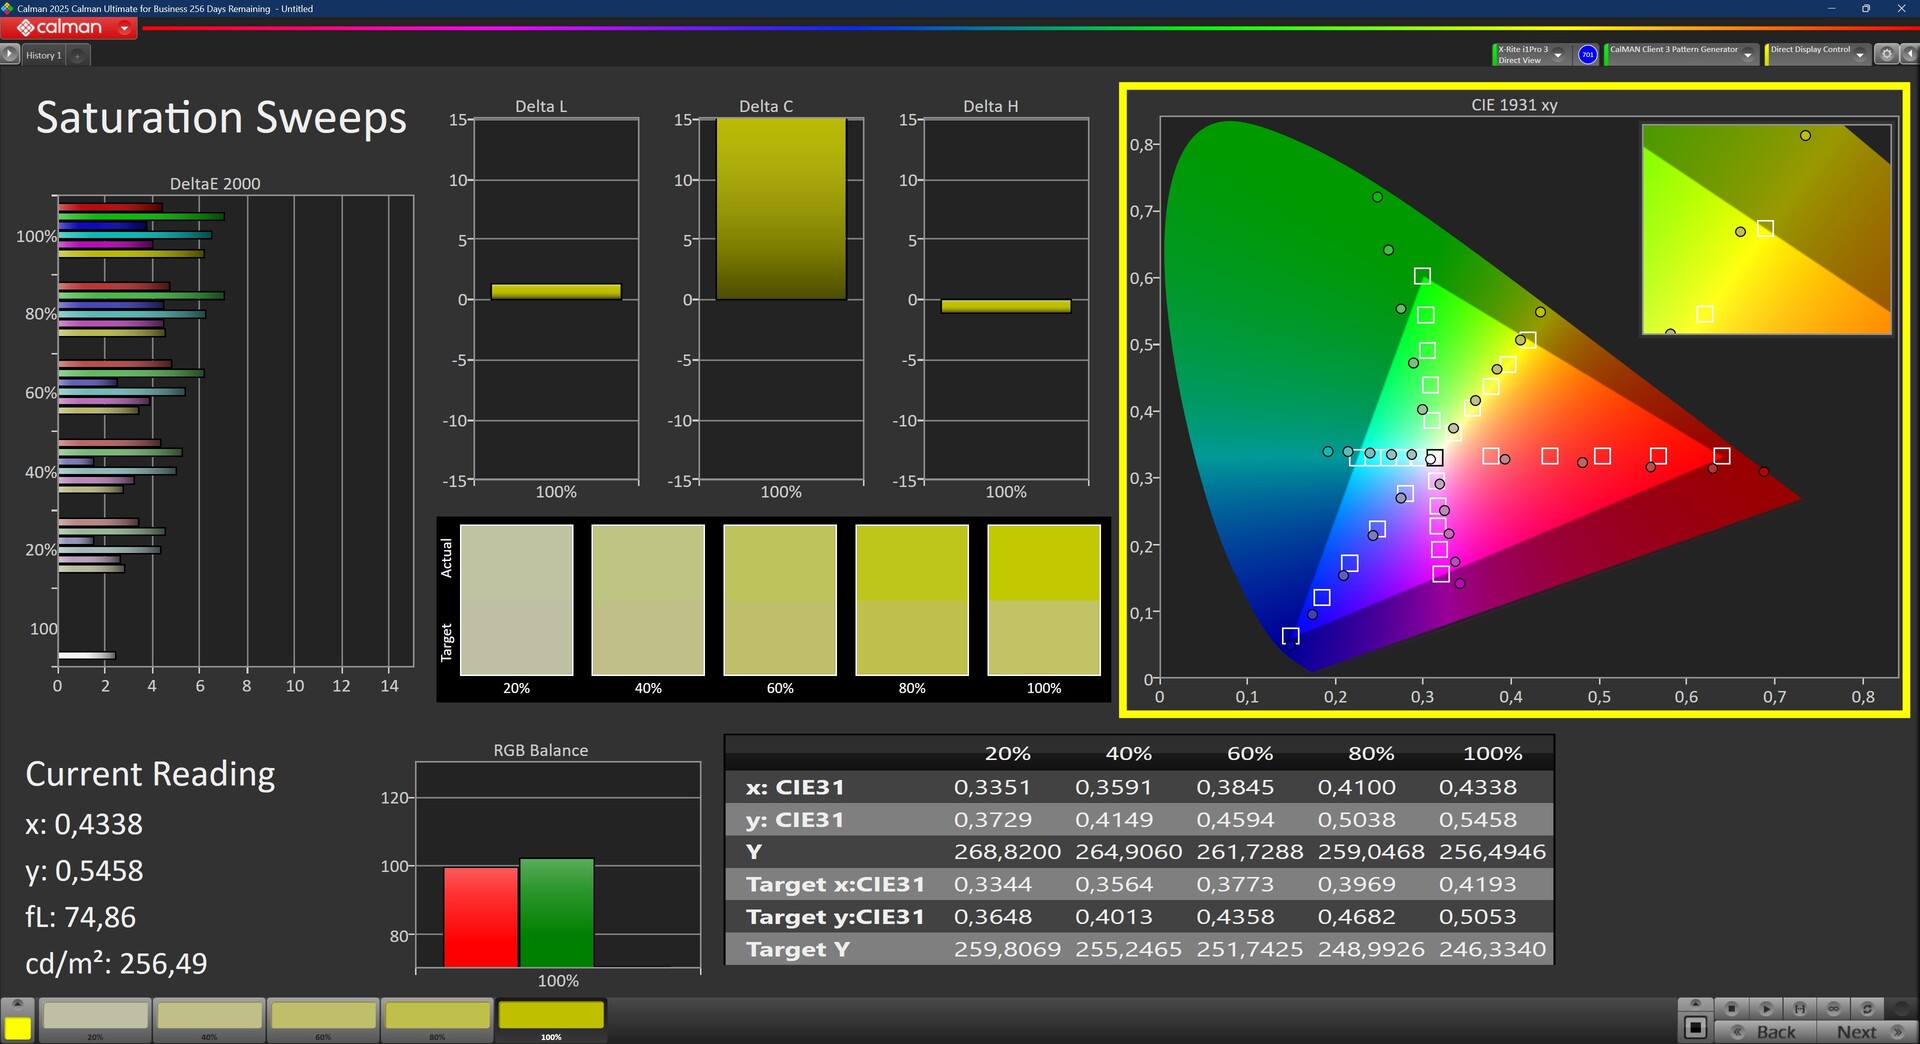
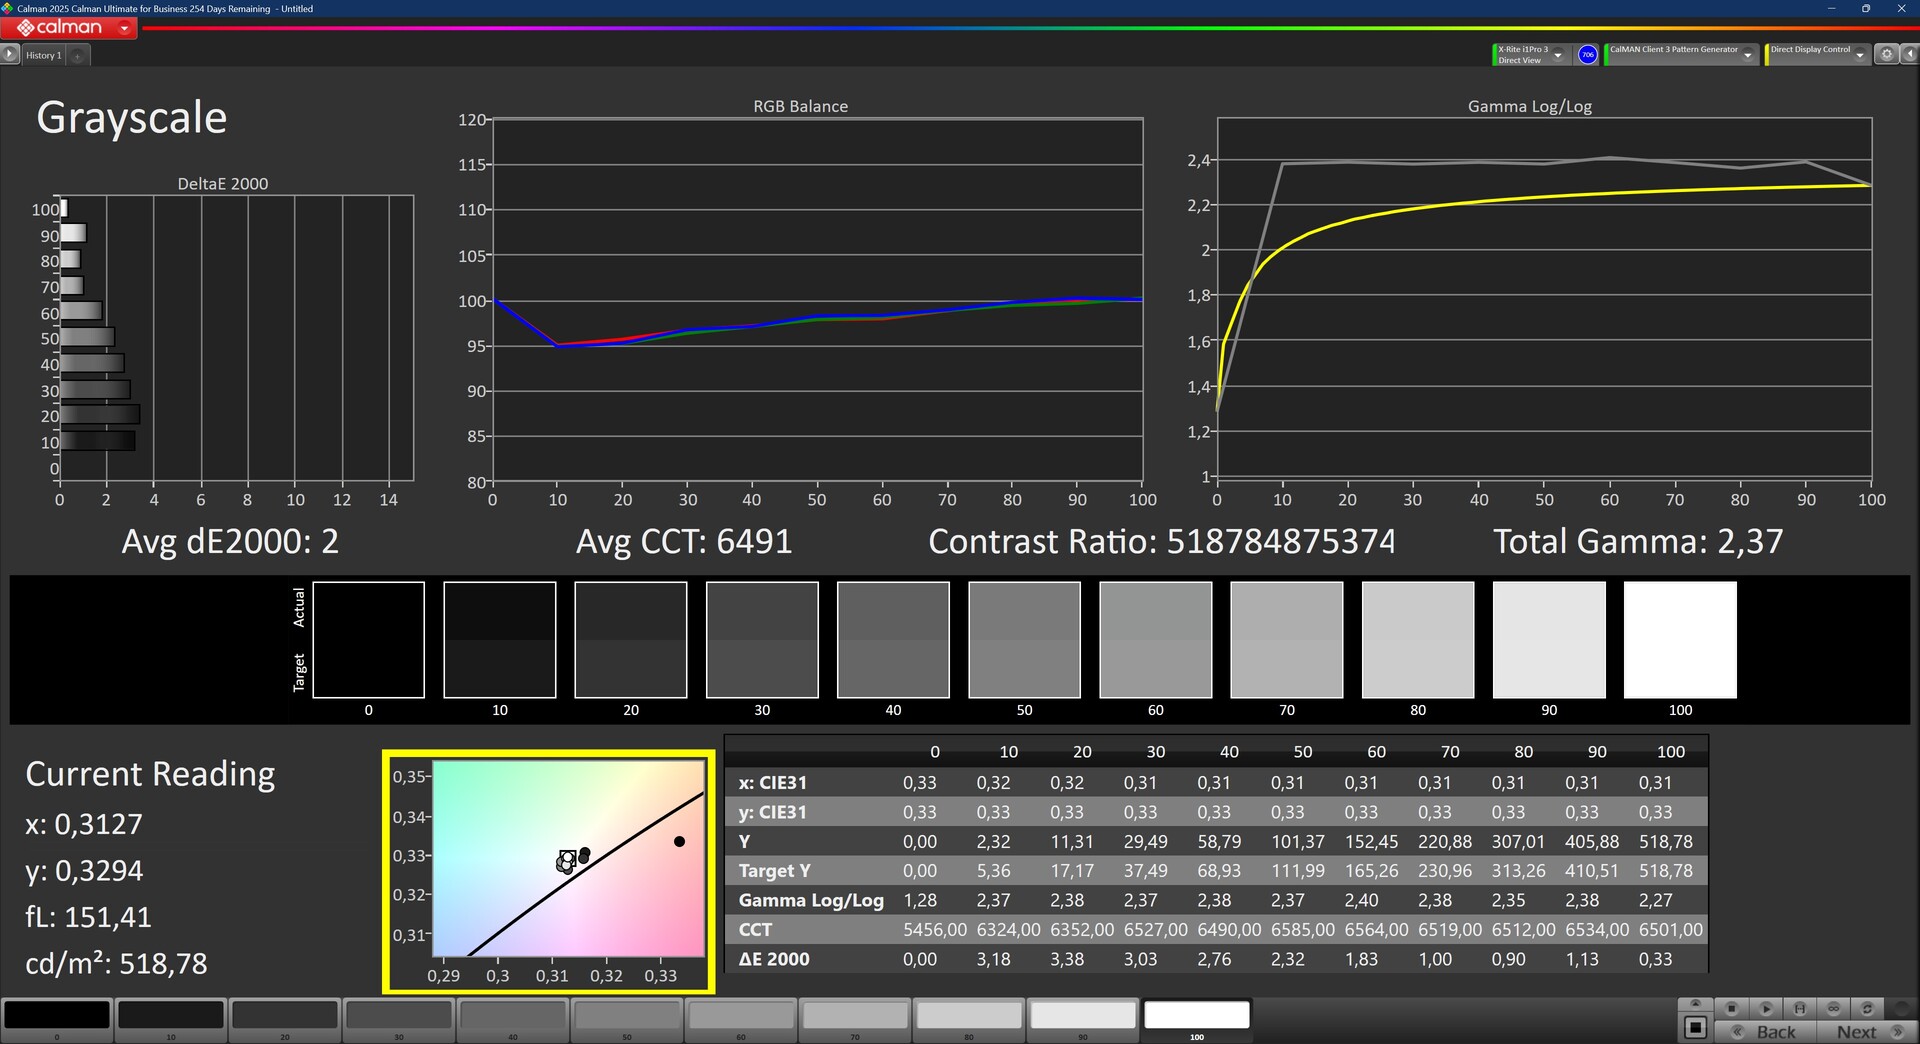
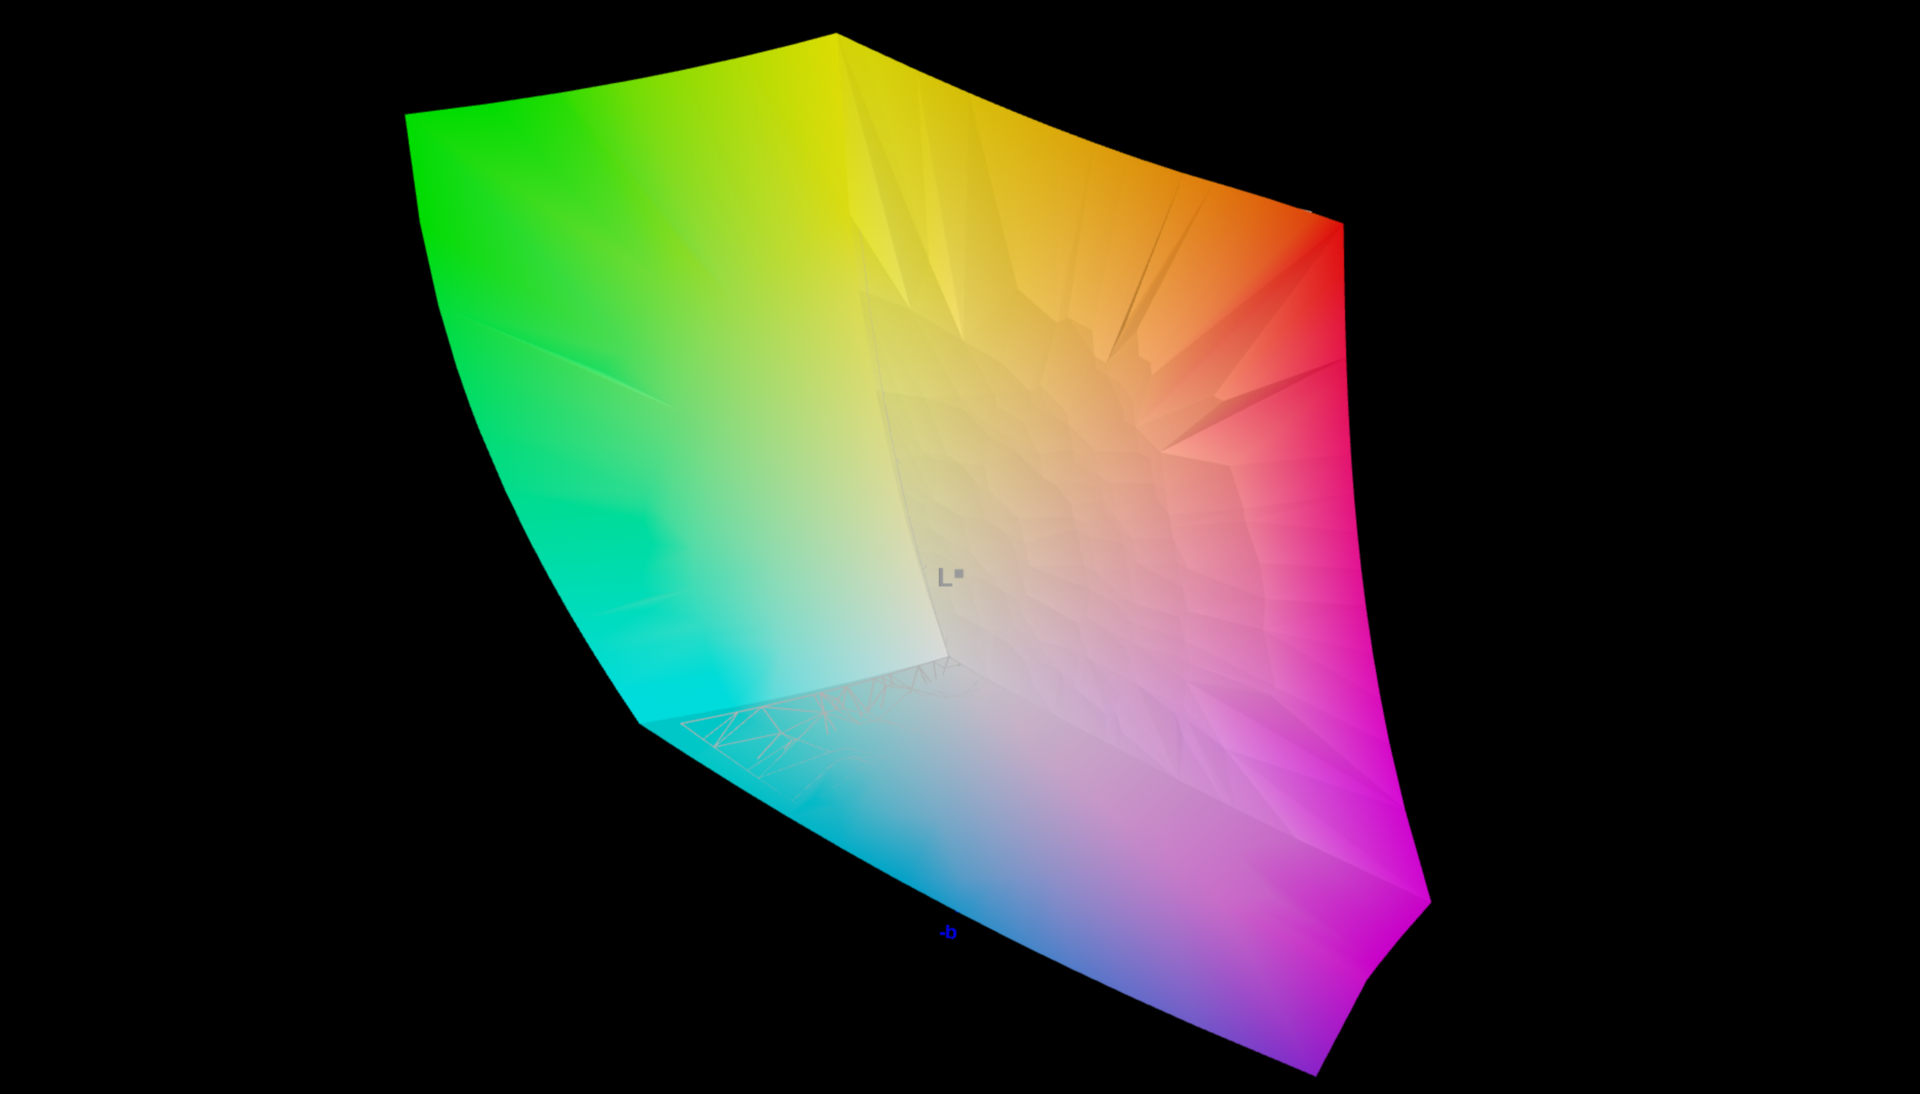
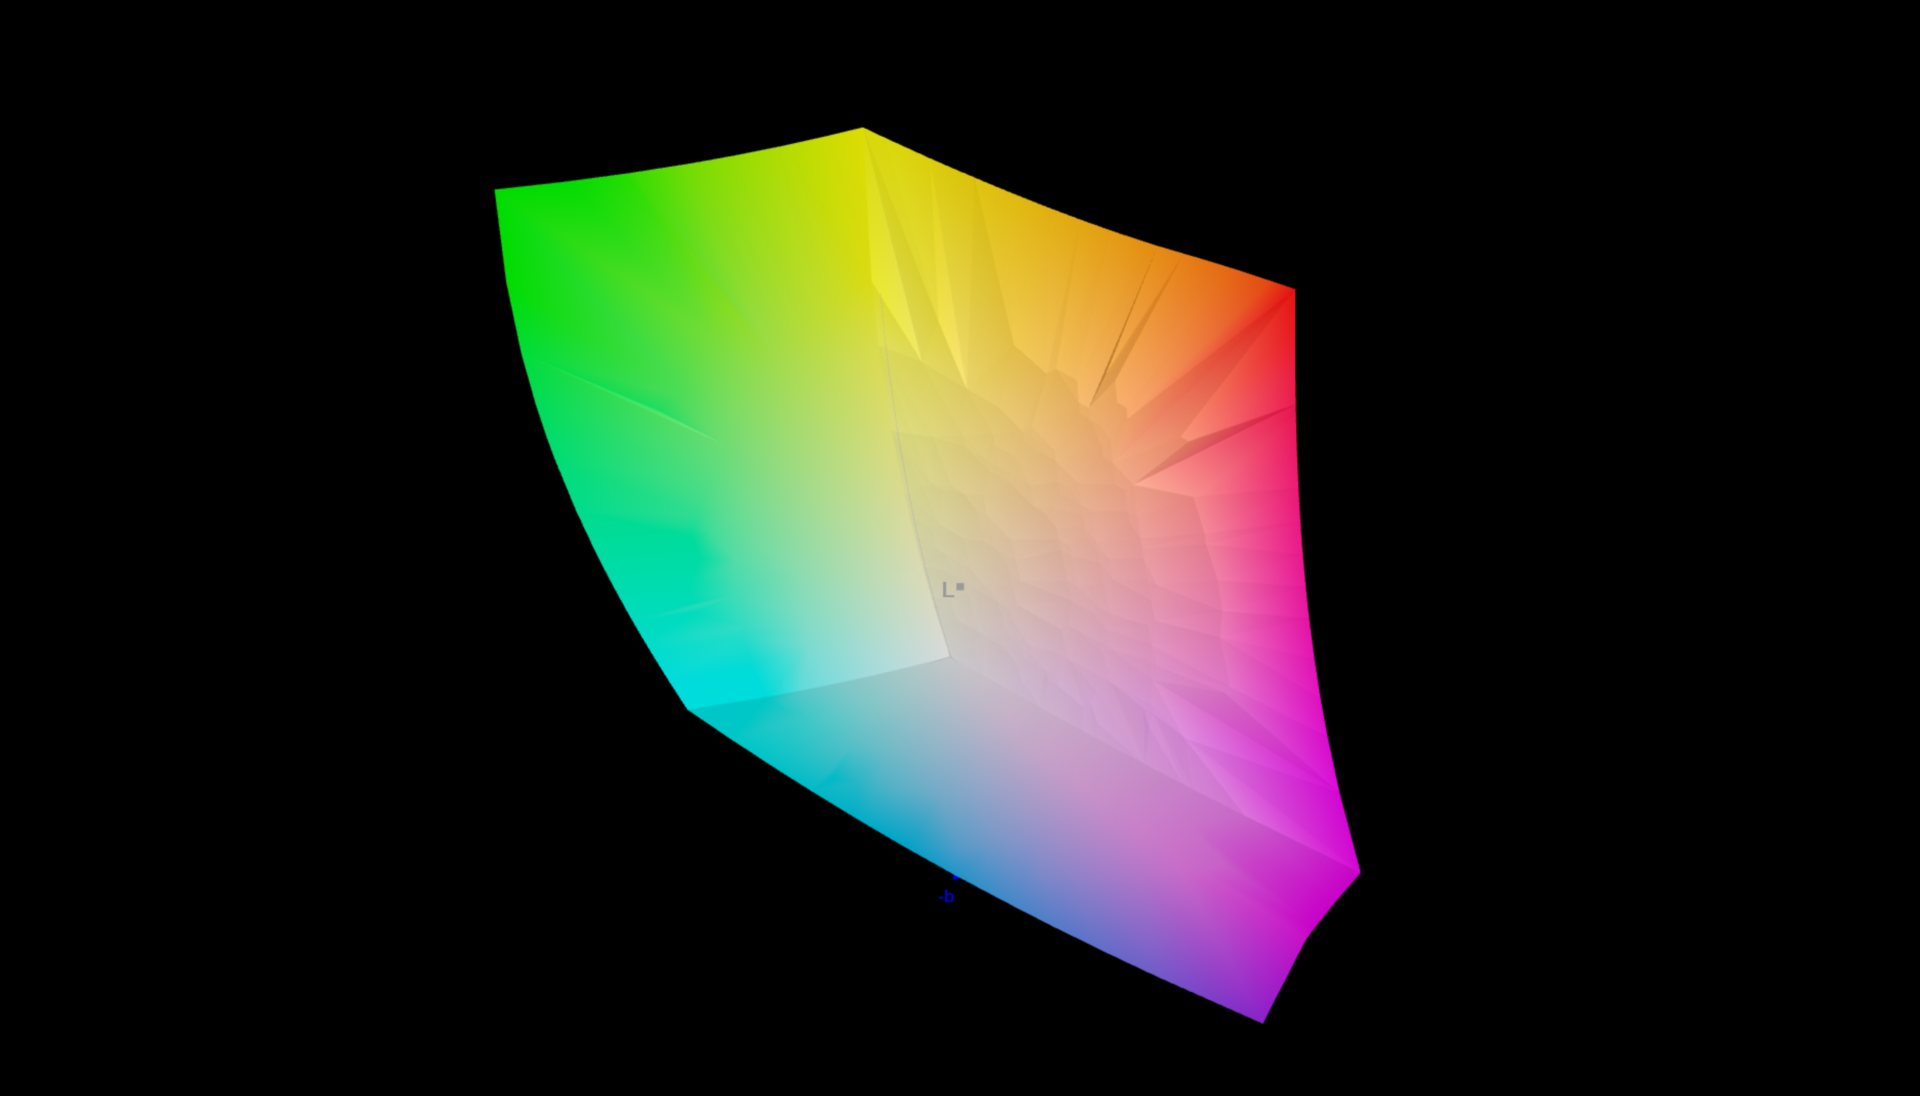
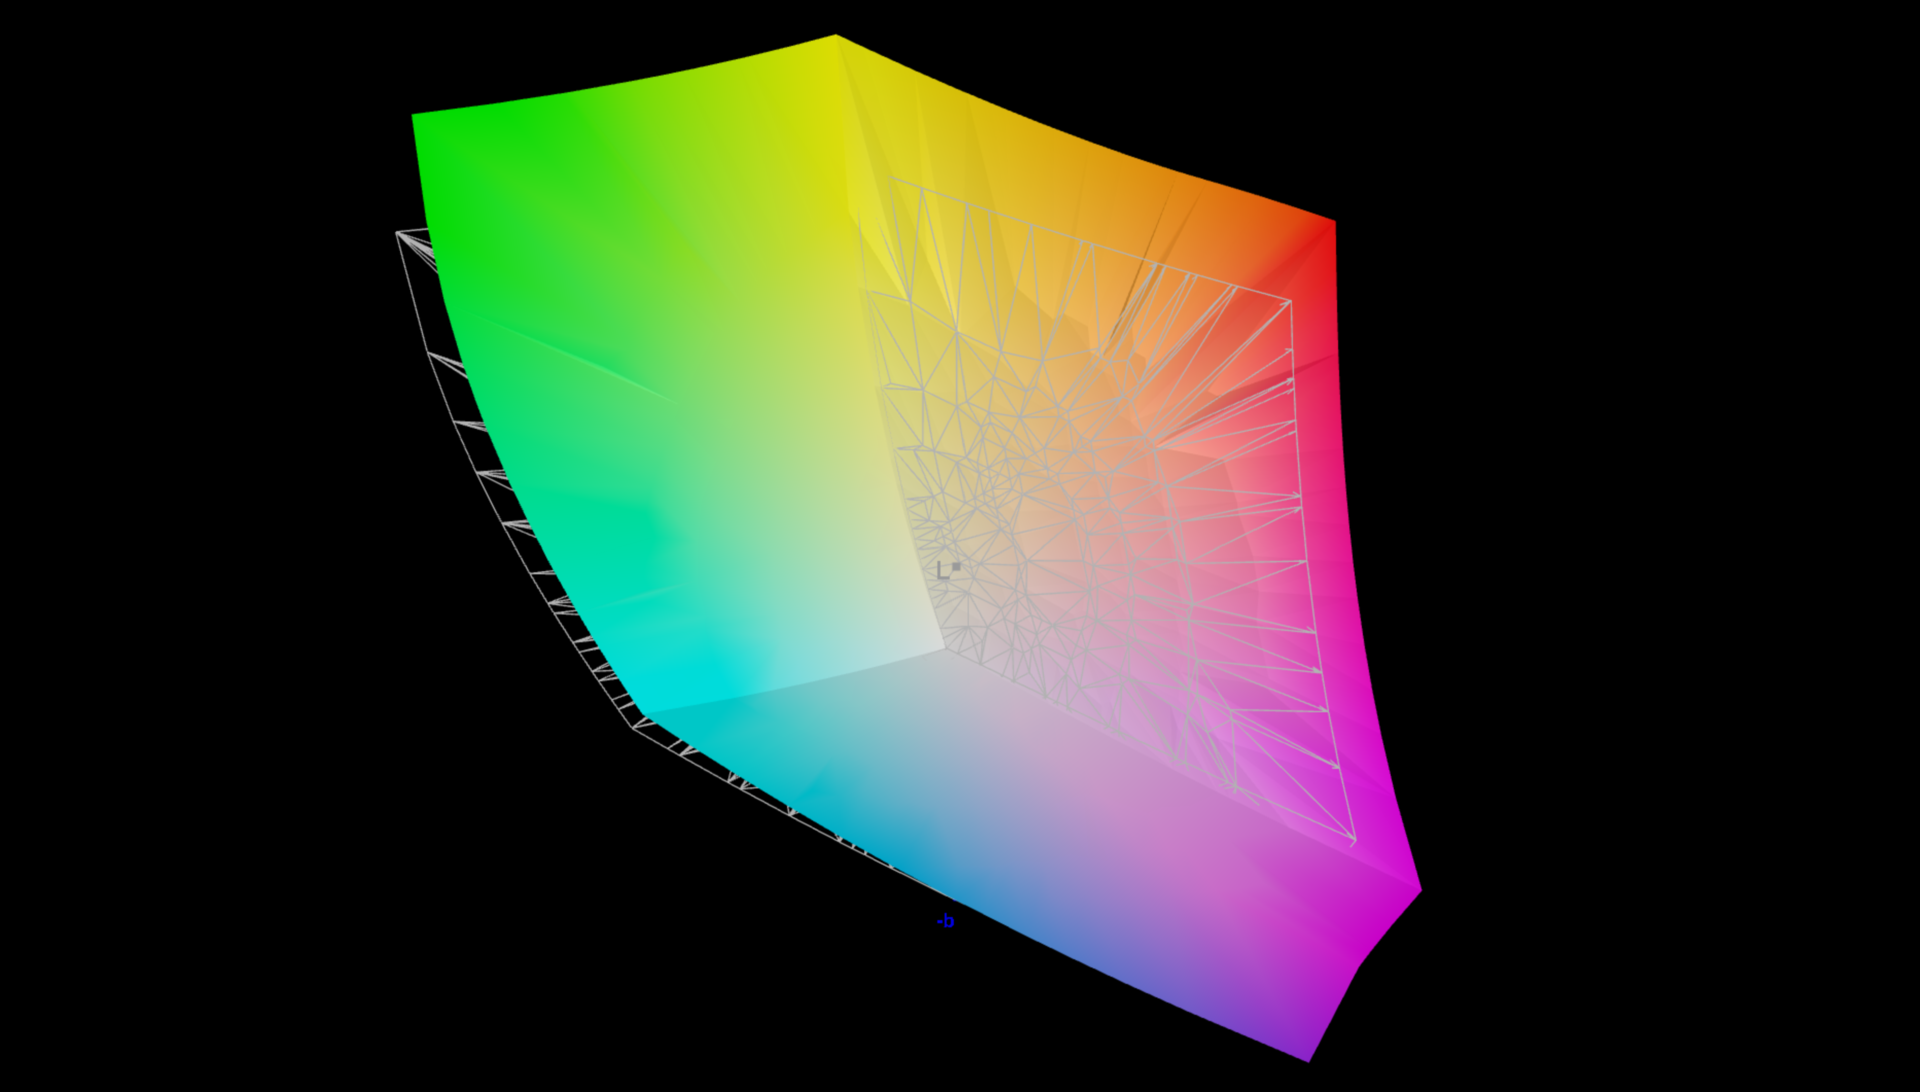
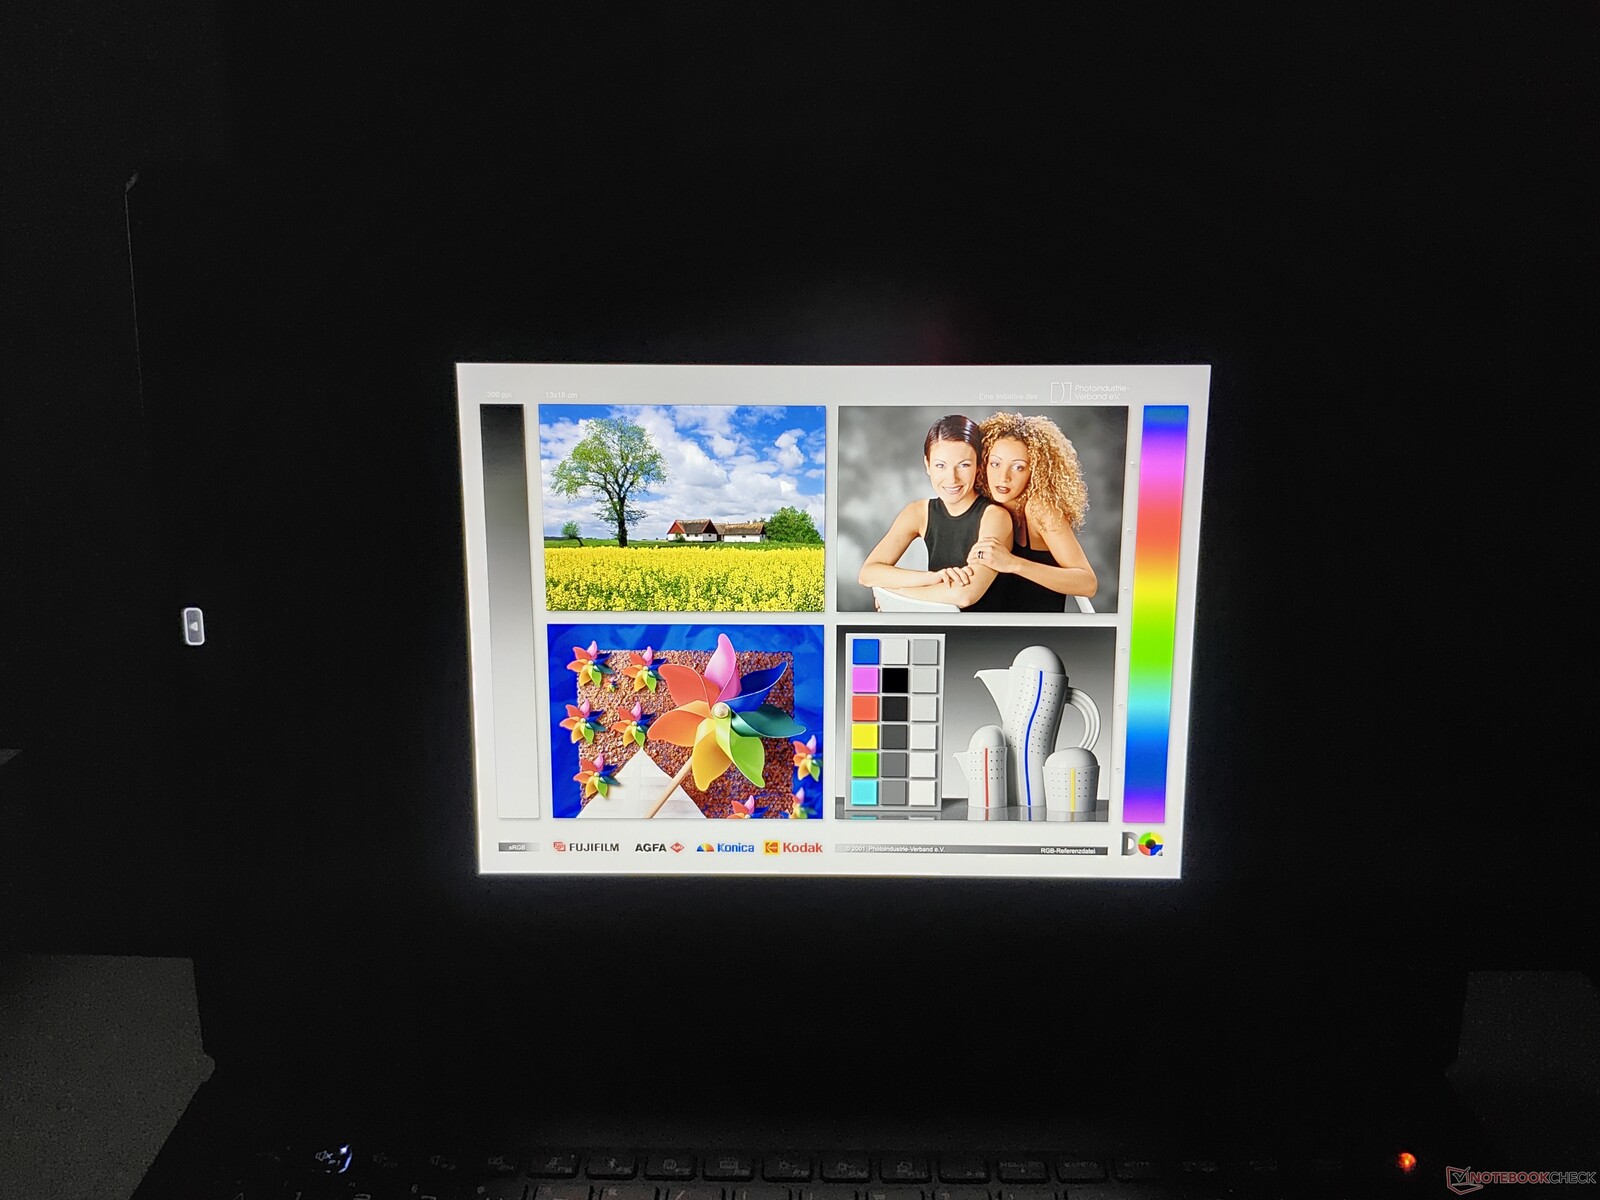
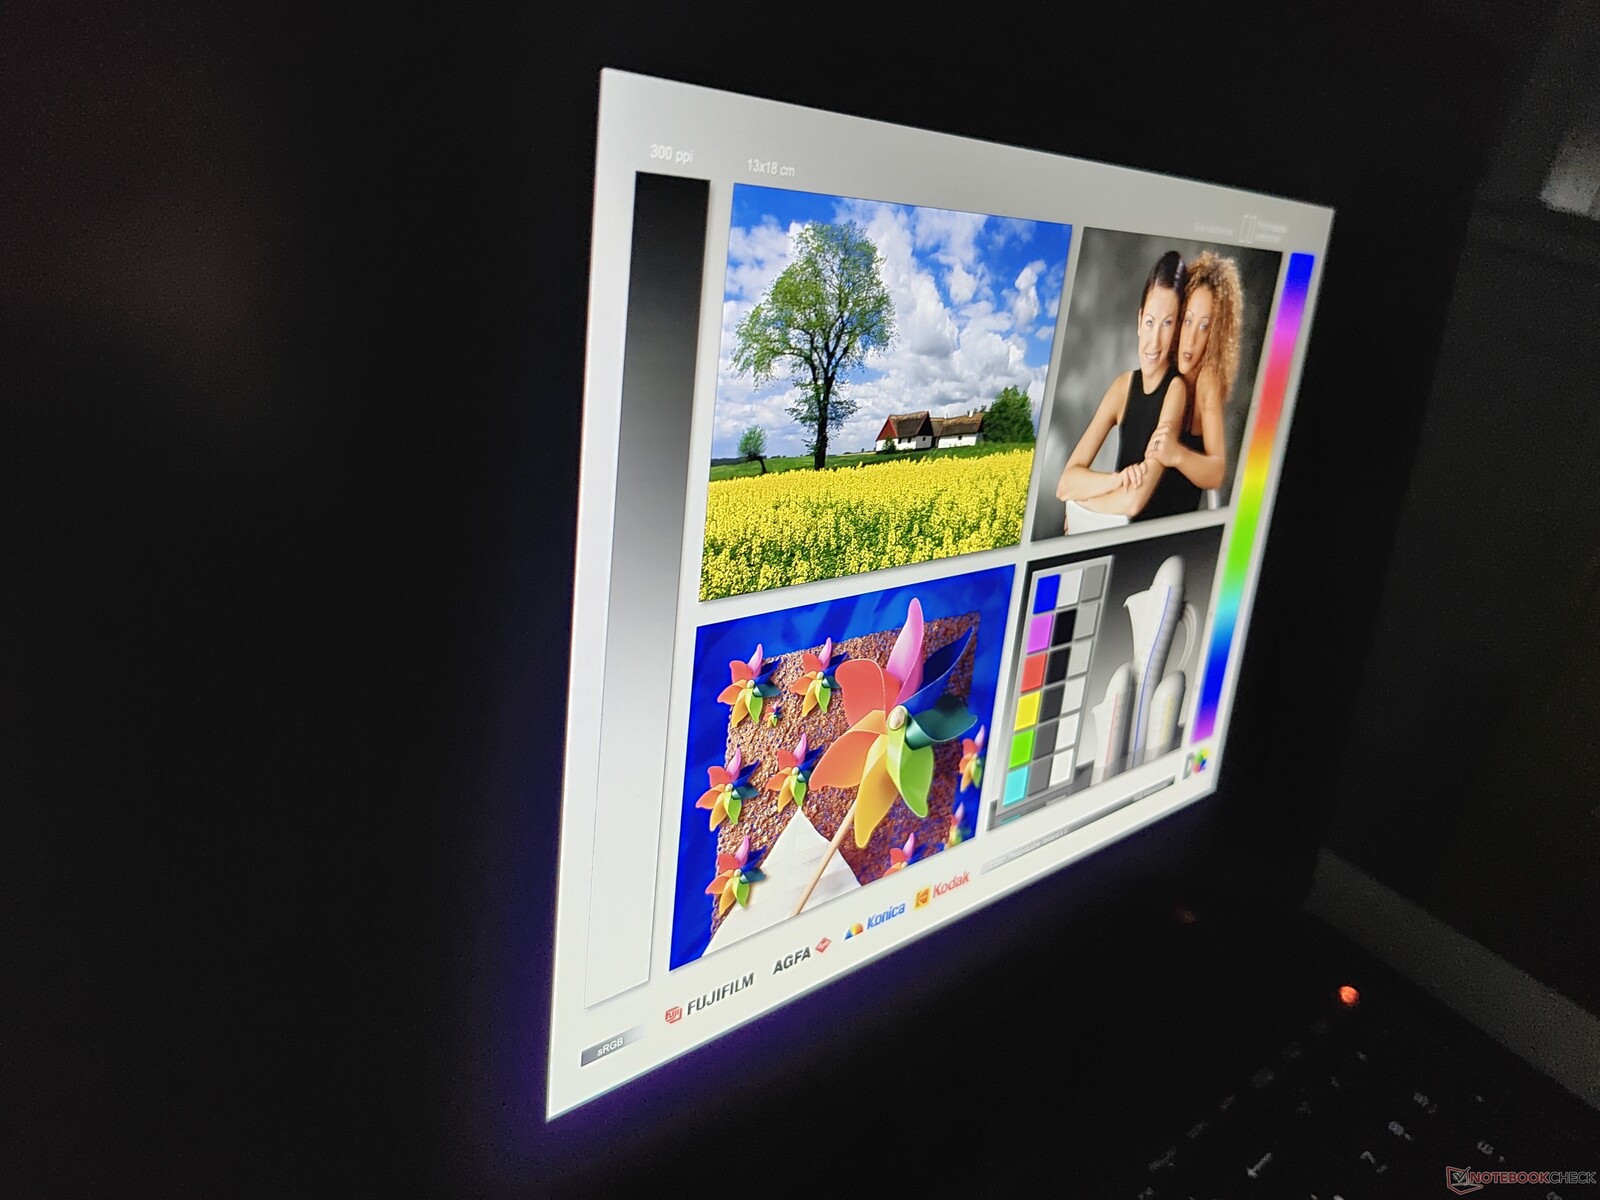
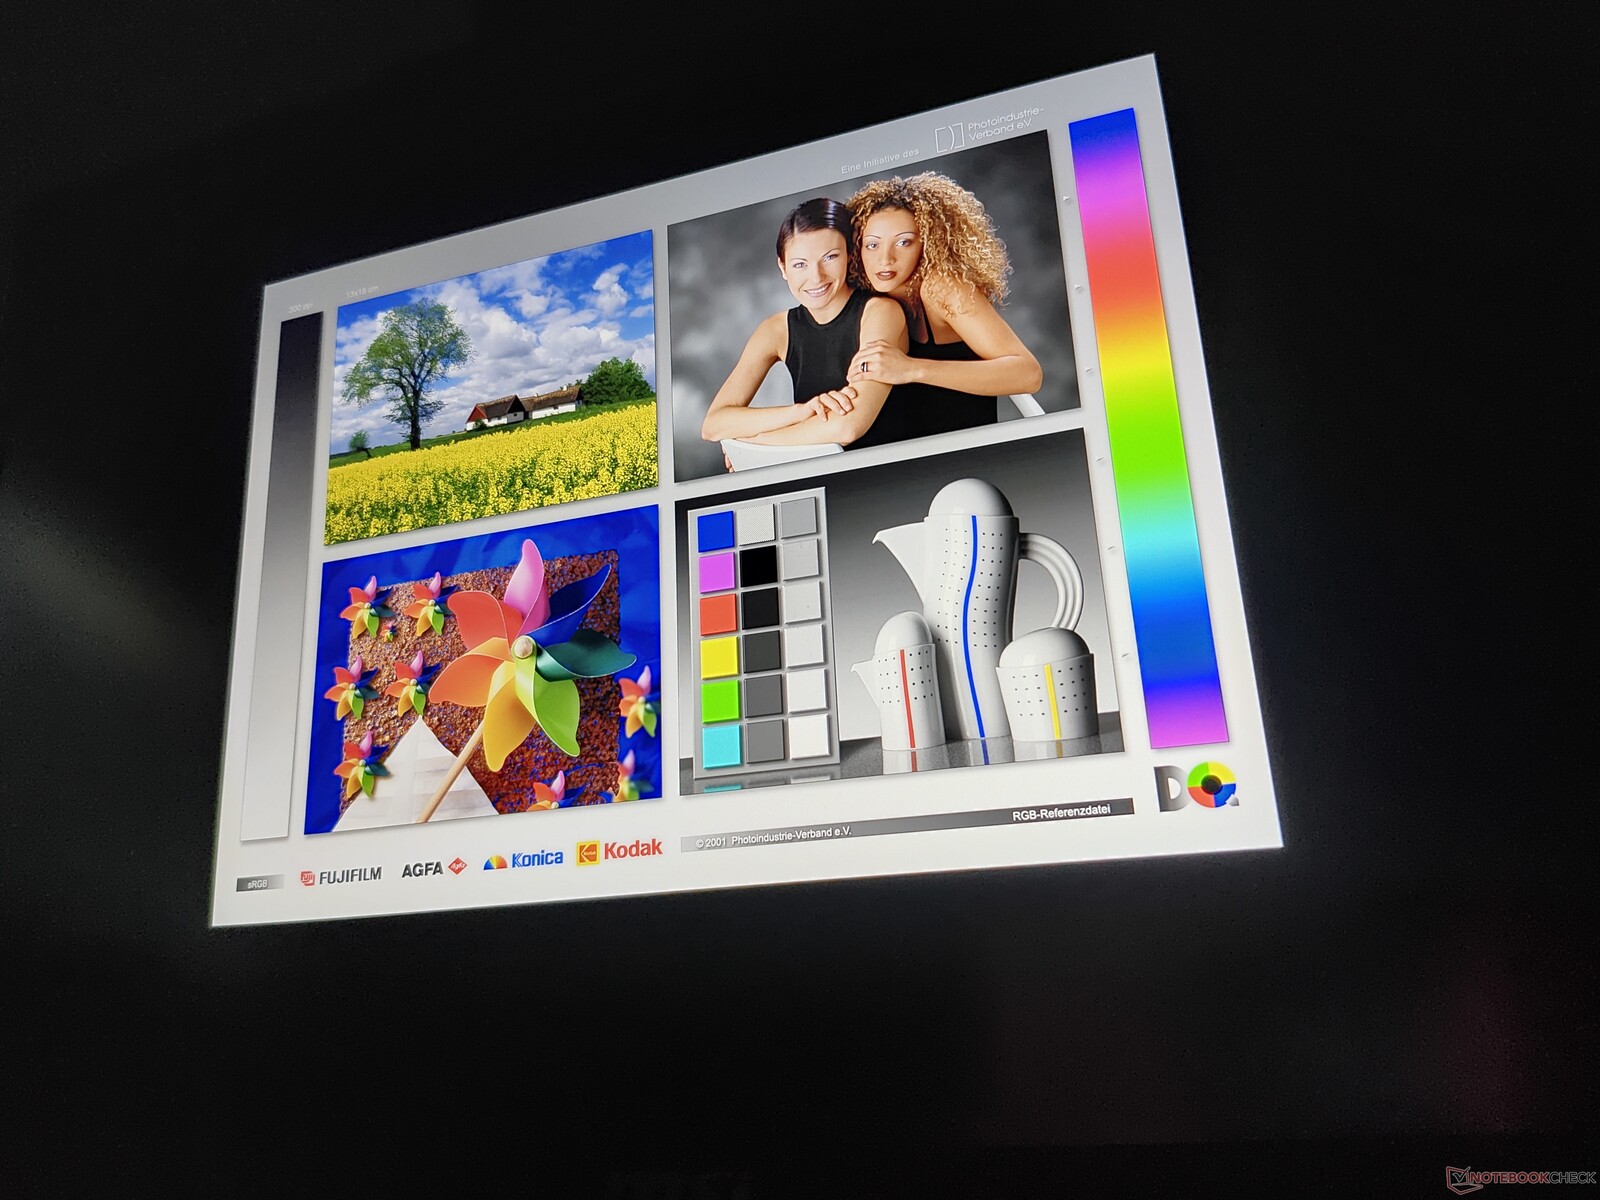
Display: MSI Raider A18 HX ha uno schermo miniLED luminoso e opaco
Le specifiche di MSI Raider A18 HX elencano quattro diversi schermi, tutti con dimensioni di 18 pollici e rapporto di aspetto 16:10:
- WUXGA (1.920 x 1.200), IPS, 144 Hz
- WUXGA (1.920 x 1.200), IPS, 165 Hz
- WQXGA / 2.5K (2.560 x 1.600), IPS, 240 Hz
- WQUXGA / 4K-UHD (3.840 x 2.400), miniLED, 120 Hz
MSI utilizza uno schermo opaco prodotto da AU Optotronics. Quando lo schermo viene utilizzato in modalità SDR, la luminosità raggiunge un massimo di circa 500 cd/m² - in modalità HDR, questo valore aumenta a circa 900 cd/m². Abbiamo misurato un massimo di 889 cd/m² al centro del display in modalità HDR.
Lo schermo utilizza il PWM, ma la frequenza è estremamente elevata. Anche se l'ampiezza è molto alta, la maggior parte degli utenti non dovrebbe essere influenzata da questa frequenza elevata.
| |||||||||||||||||||||||||
Distribuzione della luminosità: 85 %
Al centro con la batteria: 510 cd/m²
Contrasto: 51000:1 (Nero: 0.01 cd/m²)
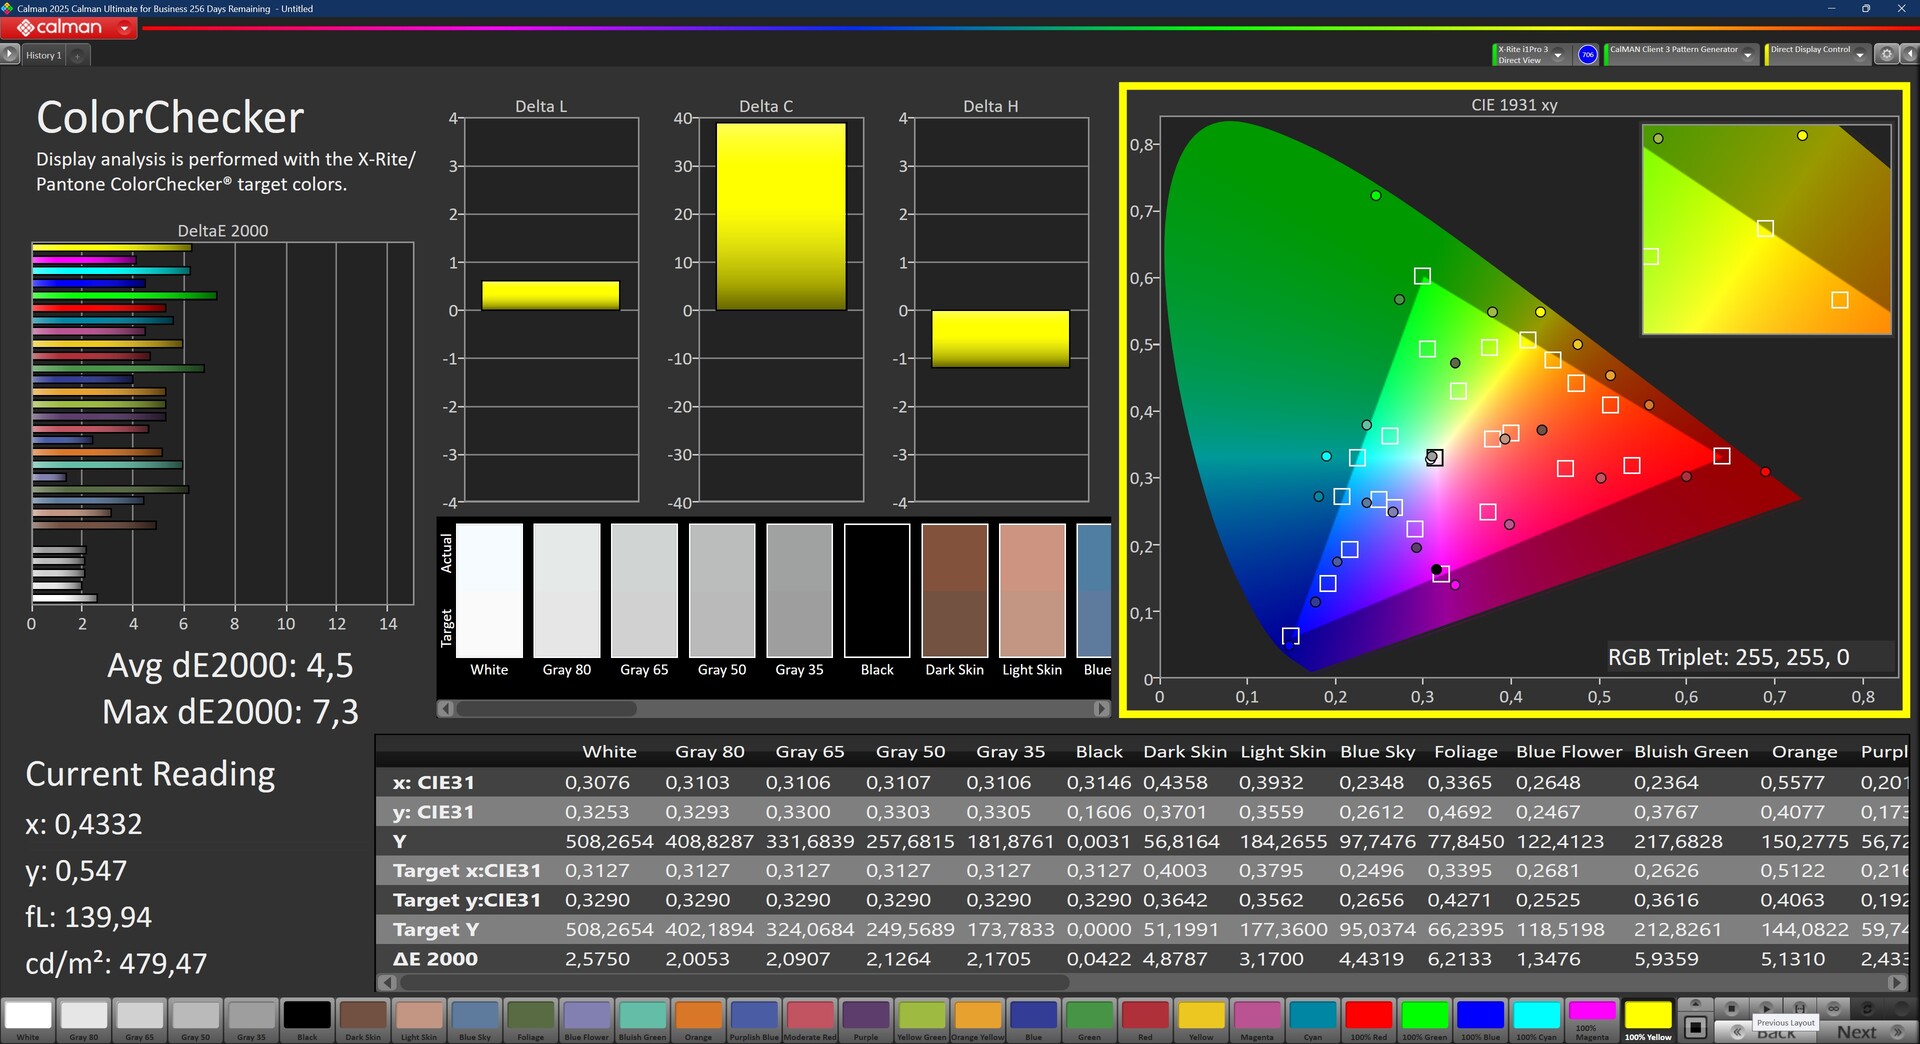
ΔE ColorChecker Calman: 4.5 | ∀{0.5-29.43 Ø4.72}
calibrated: 5.7
ΔE Greyscale Calman: 2.3 | ∀{0.09-98 Ø4.97}
93.9% AdobeRGB 1998 (Argyll 3D)
100% sRGB (Argyll 3D)
99.9% Display P3 (Argyll 3D)
Gamma: 2.08
CCT: 6648 K
| MSI Raider A18 HX A9WIG-080 B180ZAN01.0, MiniLED IPS, 3840x2400, 18", 120 Hz | MSI Raider 18 HX A14V AU Optronics B180ZAN1.0, Mini-LED, 3840x2400, 18", 120 Hz | Medion Erazer Beast 18 X1 MD62731 BOEhydis NE180QDM-NZ2, IPS, 2560x1600, 18", 240 Hz | Aorus Master 18 AM8H NE180QDM-NM1 (BOE0C58), Mini-LED, 2560x1600, 18", 240 Hz | Asus Strix Scar 18 G835LX N180QDM-NM2, Mini-LED, 2560x1600, 18", 240 Hz | |
|---|---|---|---|---|---|
| Display | -4% | -4% | -2% | -3% | |
| Display P3 Coverage (%) | 99.9 | 96.6 -3% | 97.1 -3% | 99.9 0% | 99 -1% |
| sRGB Coverage (%) | 100 | 99.9 0% | 99.9 0% | 100 0% | 100 0% |
| AdobeRGB 1998 Coverage (%) | 93.9 | 84.8 -10% | 84.7 -10% | 87.7 -7% | 87.2 -7% |
| Response Times | -112% | 64% | 25% | 33% | |
| Response Time Grey 50% / Grey 80% * (ms) | 23 ? | 10.4 ? 55% | 5.6 ? 76% | 16.4 ? 29% | 7.4 ? 68% |
| Response Time Black / White * (ms) | 15.1 ? | 75.8 ? -402% | 7.3 ? 52% | 8.1 ? 46% | 10.4 ? 31% |
| PWM Frequency (Hz) | 15203 | 2606.2 ? | 1398 ? | 20610 ? | |
| PWM Amplitude * (%) | 100 | 90 10% | 100 -0% | 100 -0% | |
| Screen | -6% | -451% | -147% | -87% | |
| Brightness middle (cd/m²) | 510 | 575.7 13% | 478 -6% | 438 -14% | 764 50% |
| Brightness (cd/m²) | 470 | 574 22% | 456 -3% | 451 -4% | 747 59% |
| Brightness Distribution (%) | 85 | 94 11% | 89 5% | 90 6% | 93 9% |
| Black Level * (cd/m²) | 0.01 | 0.4 -3900% | 0.13 -1200% | 0.1 -900% | |
| Contrast (:1) | 51000 | 1195 -98% | 3369 -93% | 7640 -85% | |
| Colorchecker dE 2000 * | 4.5 | 3.56 21% | 3.94 12% | 1.25 72% | 1.2 73% |
| Colorchecker dE 2000 max. * | 7.3 | 8.64 -18% | 8.6 -18% | 4.93 32% | 2.8 62% |
| Colorchecker dE 2000 calibrated * | 5.7 | 2.69 53% | 0.75 87% | ||
| Greyscale dE 2000 * | 2.3 | 5.6 -143% | 5.5 -139% | 1.7 26% | 1.5 35% |
| Gamma | 2.08 106% | 2.34 94% | 2.212 99% | 2.173 101% | 2.17 101% |
| CCT | 6648 98% | 7872 83% | 7059 92% | 6518 100% | 6556 99% |
| Media totale (Programma / Settaggio) | -41% /
-30% | -130% /
-282% | -41% /
-79% | -19% /
-43% |
* ... Meglio usare valori piccoli
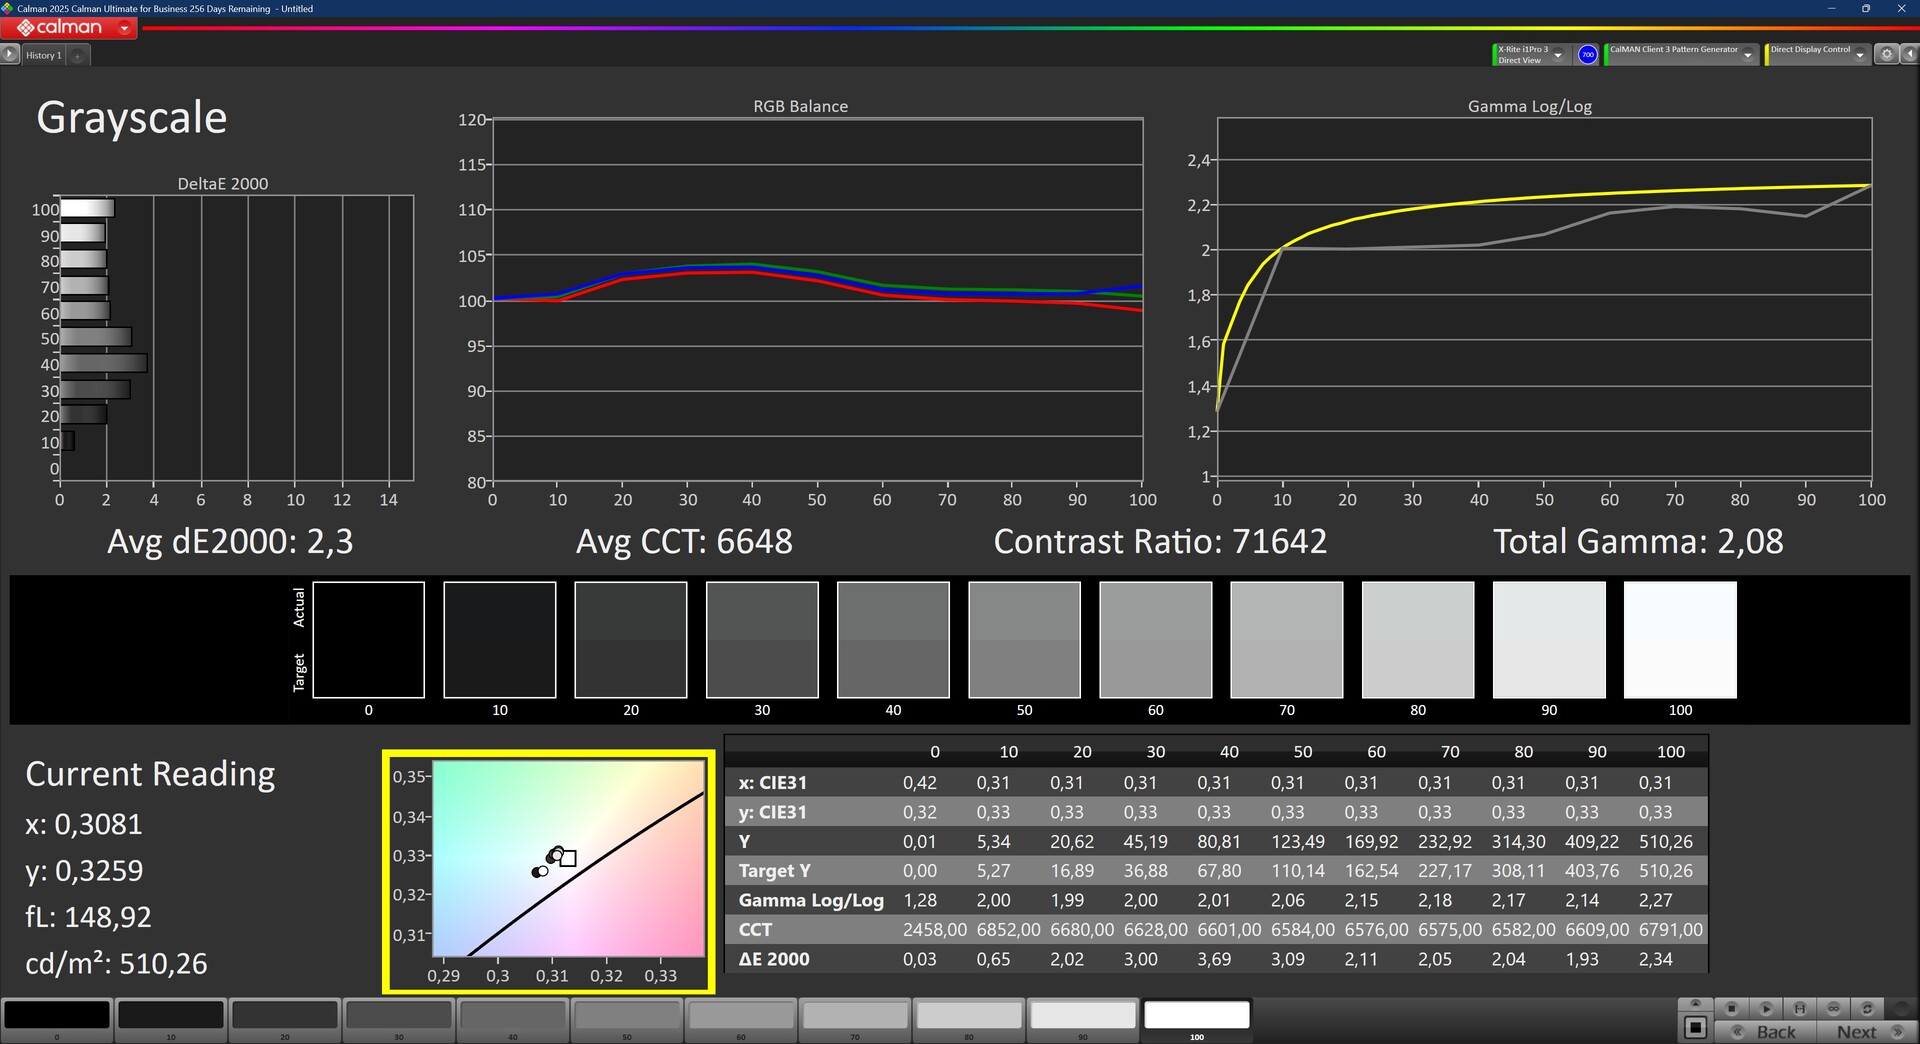


C'è un selettore di modalità di colore di MSI, noi abbiamo selezionato la modalità sRGB per le nostre misurazioni. Purtroppo, i colori non sono molto precisi, anche dopo una calibrazione.
La copertura della gamma cromatica dello schermo è ottima. Entrambe le gamme cromatiche sRGB e DCI P3 sono completamente coperte, rendendo lo schermo adatto per alcuni lavori critici sul colore.
All'esterno, lo schermo è sicuramente utilizzabile, anche in modalità SDR. L'elevata luminosità e la superficie opaca costituiscono un'ottima combinazione.
Tempi di risposta del Display
| ↔ Tempi di risposta dal Nero al Bianco | ||
|---|---|---|
| 15.1 ms ... aumenta ↗ e diminuisce ↘ combinato | ↗ 8.6 ms Incremento | 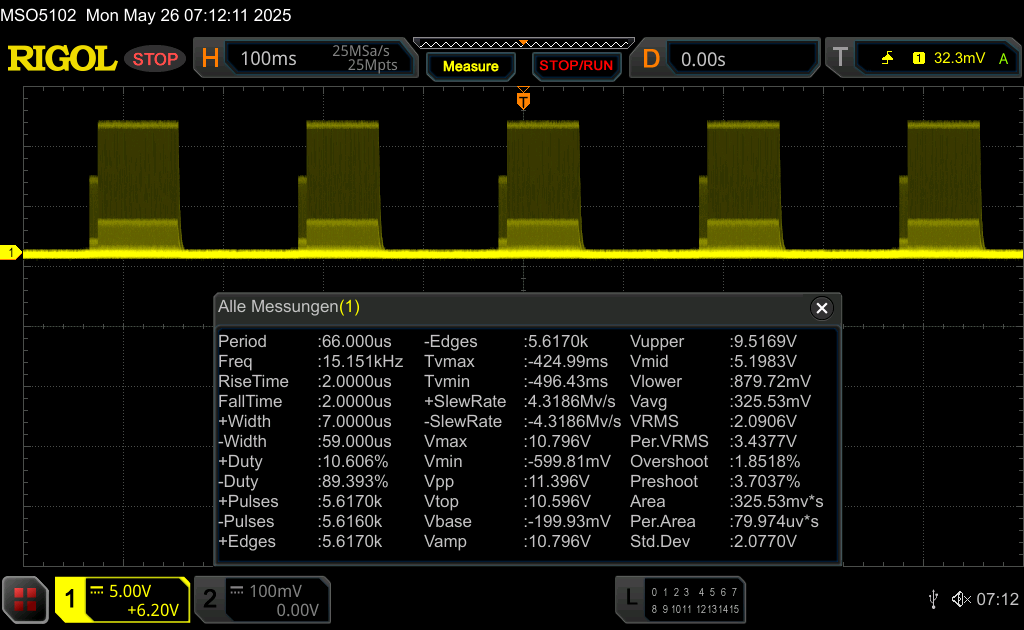 |
| ↘ 6.6 ms Calo | ||
| Lo schermo mostra buoni tempi di risposta durante i nostri tests, ma potrebbe essere troppo lento per i gamers competitivi. In confronto, tutti i dispositivi di test variano da 0.1 (minimo) a 240 (massimo) ms. » 36 % di tutti i dispositivi è migliore. Questo significa che i tempi di risposta rilevati sono migliori rispettto alla media di tutti i dispositivi testati (19.8 ms). | ||
| ↔ Tempo di risposta dal 50% Grigio all'80% Grigio | ||
| 23 ms ... aumenta ↗ e diminuisce ↘ combinato | ↗ 12.4 ms Incremento |  |
| ↘ 10.6 ms Calo | ||
| Lo schermo mostra buoni tempi di risposta durante i nostri tests, ma potrebbe essere troppo lento per i gamers competitivi. In confronto, tutti i dispositivi di test variano da 0.165 (minimo) a 636 (massimo) ms. » 34 % di tutti i dispositivi è migliore. Questo significa che i tempi di risposta rilevati sono migliori rispettto alla media di tutti i dispositivi testati (31 ms). | ||
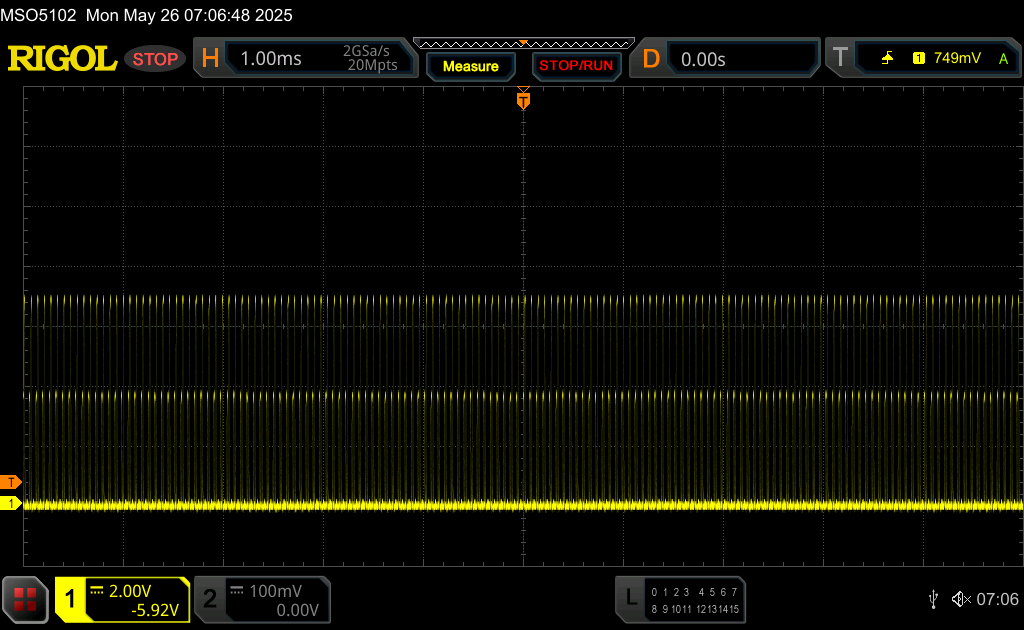
Sfarfallio dello schermo / PWM (Pulse-Width Modulation)
| flickering dello schermo / PWM rilevato | 15203 Hz Amplitude: 100 % |  | |
Il display sfarfalla a 15203 Hz (Probabilmente a causa dell'uso di PWM) . La frequenza di 15203 Hz è abbastanza alta, quindi la maggioranza degli utenti sensibili al PWM non dovrebbero notare alcun flickering. In confronto: 52 % di tutti i dispositivi testati non utilizza PWM per ridurre la luminosita' del display. Se è rilevato PWM, una media di 7750 (minimo: 5 - massimo: 343500) Hz è stata rilevata. | |||


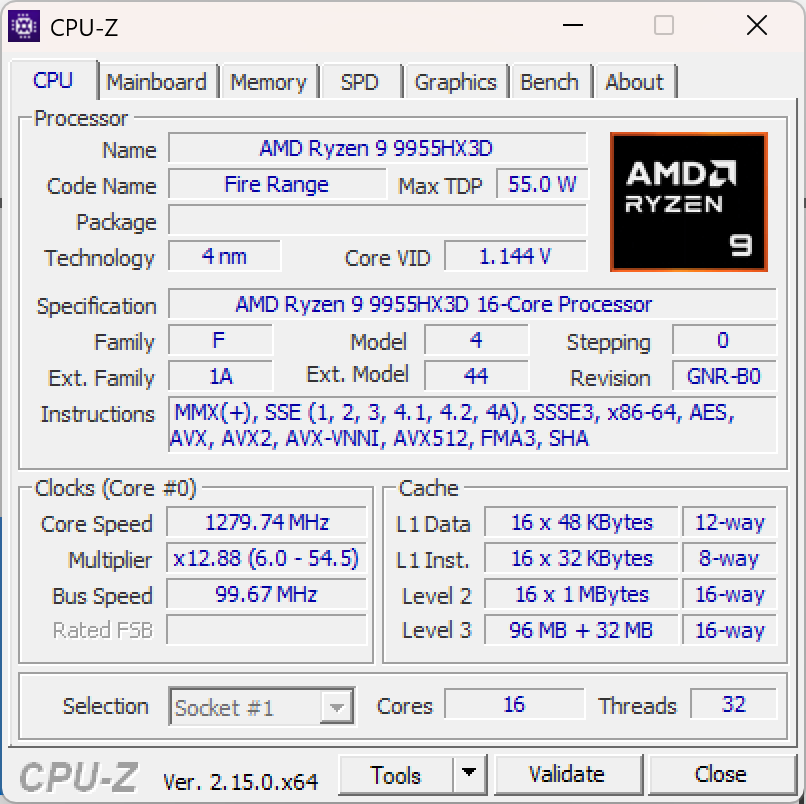
Prestazioni: AMD Fire Range equivale a Intel Arrow Lake HX, con un consumo energetico inferiore
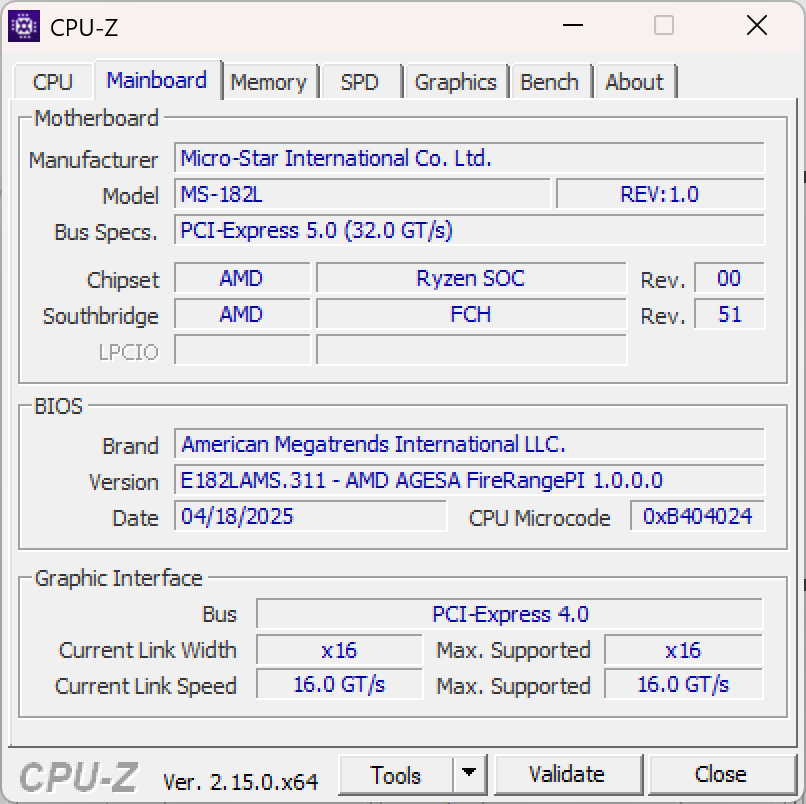
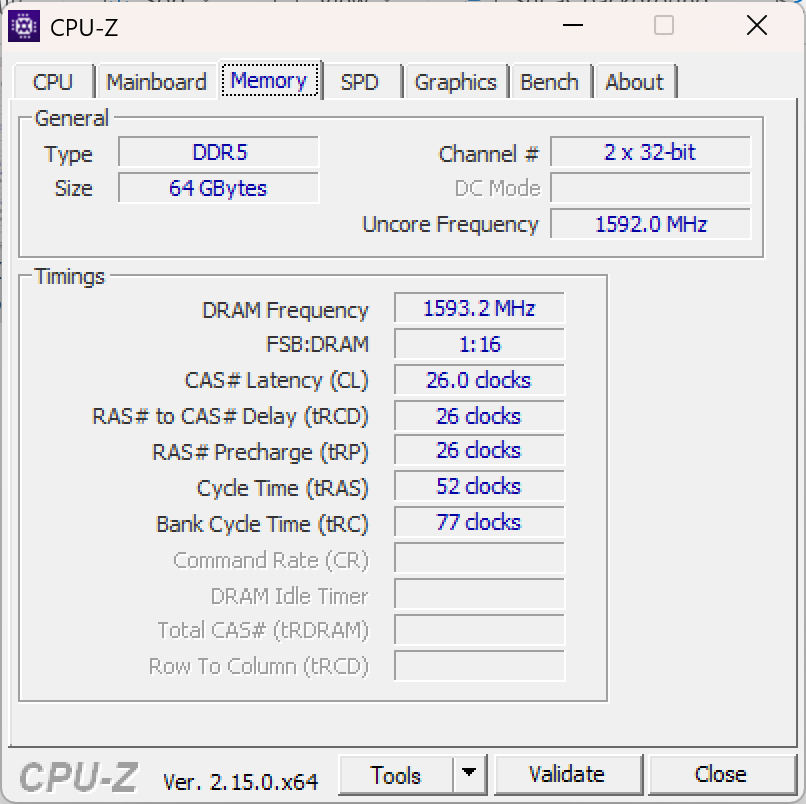
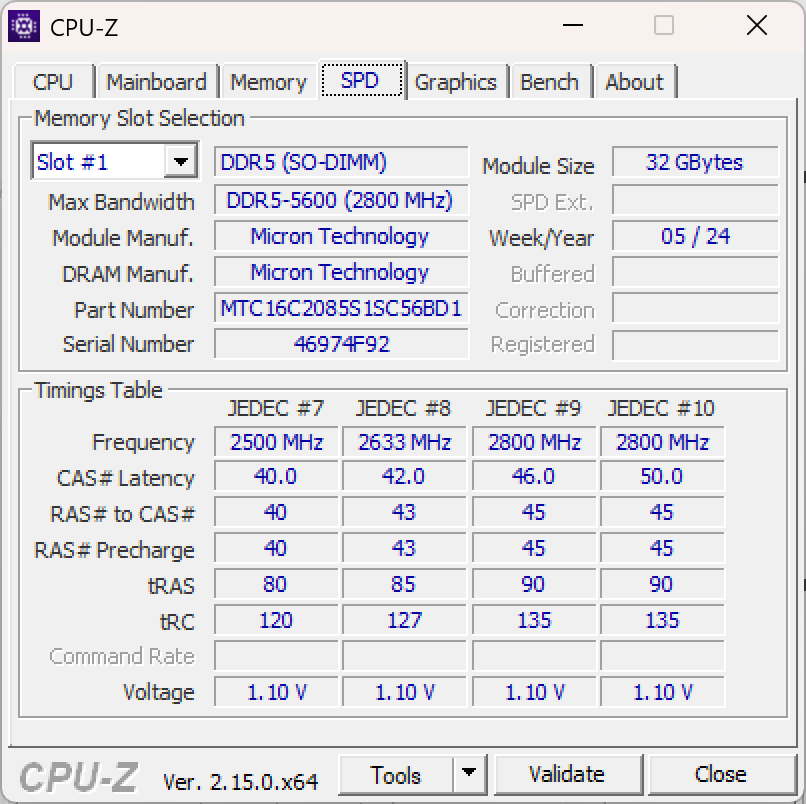
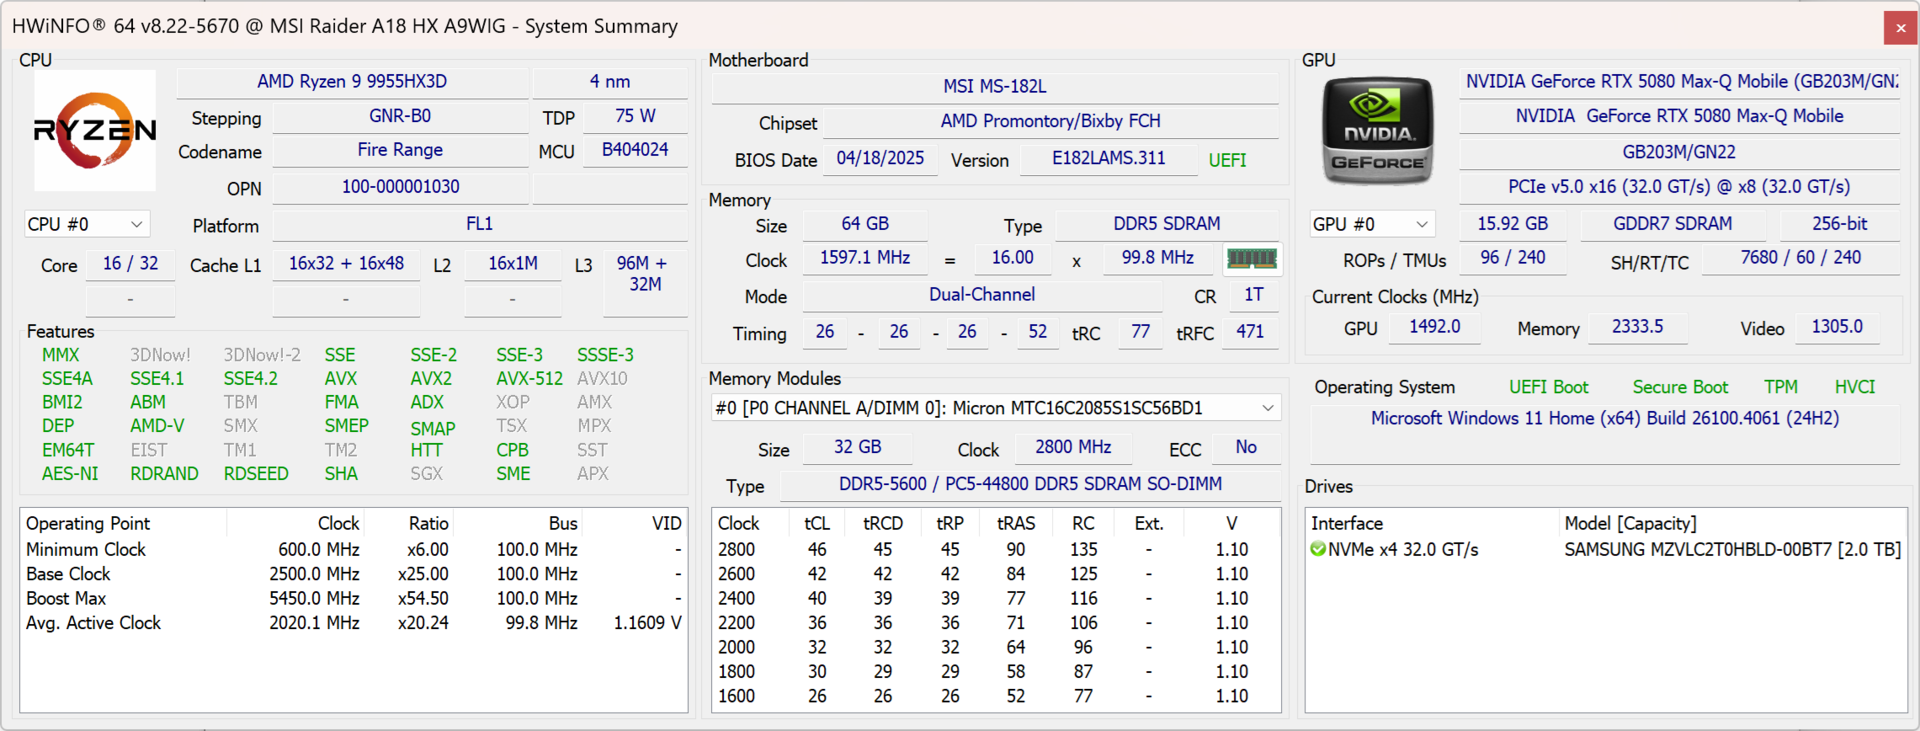
La versione AMD di MSI Raider A18 HX è disponibile solo con il processore AMD Ryzen 9 9955HX3D. Le GPU dedicate disponibili includono la Nvidia GeForce RTX 5080 e GeForce RTX 5090. In termini di memoria, ci sono due prese SO-DIMM, che offrono fino a 96 GB di RAM DDR5-5600. C'è un singolo slot M.2 2280 per un SSD, che MSI offre fino a 2 TB di capacità.
Condizioni del test
I profili di alimentazione possono essere gestiti con l'applicazione MSI Center. Sono disponibili i seguenti profili, che influenzano i limiti di potenza della CPU (PL1 / consumo sostenuto della CPU, PL2 / consumo massimo della CPU) e il TGP della GPU (potenza grafica totale):
- ECO-Silenzioso: PL1 30 W / PL2 30 W | TGP 85 W
- Bilanciato: PL1 72 W / PL2 72 W | TGP 105 W
- Prestazioni estreme: PL1 130 W / PL2 130 W | TGP 165 W
Abbiamo eseguito tutti i benchmark in modalità "Prestazioni estreme".
Processore
Il AMD Ryzen 9 9955HX3D è il processore AMD più potente per i computer portatili. La CPU "Fire Range" ha sedici core Zen5 con velocità di clock da 2,5 a 5,4 GHz. Il suo TDP è di 55 W, questa CPU è fatta per le workstation e i portatili da gioco. Per ulteriori confronti, le consigliamo di utilizzare la nostra Elenco comparativo di CPU.
Nei nostri test, MSI Raider A18 HX ha eguagliato le prestazioni di Asus Strix Scar 18 con il Intel Core Ultra 9 275HXma mentre l'Asus aveva un TDP di 150 W, MSI ha fornito queste prestazioni con soli 130 W. Se desidera le massime prestazioni della CPU in un computer portatile, MSI Raider A18 può certamente essere un concorrente.
Questo però vale solo quando è collegato un adattatore CA. Con l'alimentazione a batteria, le prestazioni si dimezzano (19278 punti in CB23 multicore, meno 102 percento).
Cinebench R15 Multi Loop
Cinebench R23: Multi Core | Single Core
Cinebench R20: CPU (Multi Core) | CPU (Single Core)
Cinebench R15: CPU Multi 64Bit | CPU Single 64Bit
Blender: v2.79 BMW27 CPU
7-Zip 18.03: 7z b 4 | 7z b 4 -mmt1
Geekbench 6.7: Multi-Core | Single-Core
Geekbench 5.5: Multi-Core | Single-Core
HWBOT x265 Benchmark v2.2: 4k Preset
LibreOffice : 20 Documents To PDF
R Benchmark 2.5: Overall mean
| CPU Performance rating | |
| Media AMD Ryzen 9 9955HX3D | |
| Asus Strix Scar 18 G835LX | |
| MSI Raider A18 HX A9WIG-080 | |
| Aorus Master 18 AM8H | |
| MSI Raider 18 HX A14V | |
| Medion Erazer Beast 18 X1 MD62731 | |
| Media della classe Gaming | |
| Cinebench R23 / Multi Core | |
| Media AMD Ryzen 9 9955HX3D (38864 - 39266, n=2) | |
| Asus Strix Scar 18 G835LX | |
| MSI Raider A18 HX A9WIG-080 | |
| Aorus Master 18 AM8H | |
| Medion Erazer Beast 18 X1 MD62731 | |
| MSI Raider 18 HX A14V | |
| Media della classe Gaming (10488 - 40970, n=106, ultimi 2 anni) | |
| Cinebench R23 / Single Core | |
| Medion Erazer Beast 18 X1 MD62731 | |
| Asus Strix Scar 18 G835LX | |
| MSI Raider 18 HX A14V | |
| Media AMD Ryzen 9 9955HX3D (2165 - 2179, n=2) | |
| MSI Raider A18 HX A9WIG-080 | |
| Aorus Master 18 AM8H | |
| Media della classe Gaming (1166 - 2387, n=106, ultimi 2 anni) | |
| Cinebench R20 / CPU (Multi Core) | |
| Asus Strix Scar 18 G835LX | |
| Media AMD Ryzen 9 9955HX3D (15146 - 15177, n=2) | |
| MSI Raider A18 HX A9WIG-080 | |
| Aorus Master 18 AM8H | |
| Medion Erazer Beast 18 X1 MD62731 | |
| MSI Raider 18 HX A14V | |
| Media della classe Gaming (4029 - 16108, n=105, ultimi 2 anni) | |
| Cinebench R20 / CPU (Single Core) | |
| Asus Strix Scar 18 G835LX | |
| Medion Erazer Beast 18 X1 MD62731 | |
| MSI Raider 18 HX A14V | |
| MSI Raider A18 HX A9WIG-080 | |
| Media AMD Ryzen 9 9955HX3D (847 - 851, n=2) | |
| Aorus Master 18 AM8H | |
| Media della classe Gaming (442 - 904, n=105, ultimi 2 anni) | |
| Cinebench R15 / CPU Multi 64Bit | |
| Asus Strix Scar 18 G835LX | |
| Media AMD Ryzen 9 9955HX3D (6041 - 6044, n=2) | |
| MSI Raider A18 HX A9WIG-080 | |
| Aorus Master 18 AM8H | |
| Medion Erazer Beast 18 X1 MD62731 | |
| MSI Raider 18 HX A14V | |
| Media della classe Gaming (1578 - 6271, n=104, ultimi 2 anni) | |
| Cinebench R15 / CPU Single 64Bit | |
| Asus Strix Scar 18 G835LX | |
| Medion Erazer Beast 18 X1 MD62731 | |
| Aorus Master 18 AM8H | |
| Media AMD Ryzen 9 9955HX3D (321 - 333, n=2) | |
| MSI Raider A18 HX A9WIG-080 | |
| MSI Raider 18 HX A14V | |
| Media della classe Gaming (188.8 - 344, n=105, ultimi 2 anni) | |
| Blender / v2.79 BMW27 CPU | |
| Media della classe Gaming (80 - 330, n=103, ultimi 2 anni) | |
| Medion Erazer Beast 18 X1 MD62731 | |
| MSI Raider 18 HX A14V | |
| Aorus Master 18 AM8H | |
| Asus Strix Scar 18 G835LX | |
| MSI Raider A18 HX A9WIG-080 | |
| Media AMD Ryzen 9 9955HX3D (80 - 80, n=2) | |
| 7-Zip 18.03 / 7z b 4 | |
| Media AMD Ryzen 9 9955HX3D (145803 - 148086, n=2) | |
| MSI Raider A18 HX A9WIG-080 | |
| Asus Strix Scar 18 G835LX | |
| MSI Raider 18 HX A14V | |
| Aorus Master 18 AM8H | |
| Medion Erazer Beast 18 X1 MD62731 | |
| Media della classe Gaming (33491 - 148086, n=104, ultimi 2 anni) | |
| 7-Zip 18.03 / 7z b 4 -mmt1 | |
| Media AMD Ryzen 9 9955HX3D (7151 - 7300, n=2) | |
| MSI Raider A18 HX A9WIG-080 | |
| Medion Erazer Beast 18 X1 MD62731 | |
| Asus Strix Scar 18 G835LX | |
| Aorus Master 18 AM8H | |
| MSI Raider 18 HX A14V | |
| Media della classe Gaming (4199 - 7436, n=104, ultimi 2 anni) | |
| Geekbench 6.7 / Multi-Core | |
| Asus Strix Scar 18 G835LX | |
| Media AMD Ryzen 9 9955HX3D (19788 - 20551, n=4) | |
| MSI Raider A18 HX A9WIG-080 | |
| Aorus Master 18 AM8H | |
| Medion Erazer Beast 18 X1 MD62731 | |
| MSI Raider 18 HX A14V | |
| Media della classe Gaming (6625 - 22104, n=105, ultimi 2 anni) | |
| Geekbench 6.7 / Single-Core | |
| Media AMD Ryzen 9 9955HX3D (3146 - 3237, n=4) | |
| Asus Strix Scar 18 G835LX | |
| MSI Raider A18 HX A9WIG-080 | |
| Medion Erazer Beast 18 X1 MD62731 | |
| Aorus Master 18 AM8H | |
| MSI Raider 18 HX A14V | |
| Media della classe Gaming (1490 - 3259, n=105, ultimi 2 anni) | |
| Geekbench 5.5 / Multi-Core | |
| Asus Strix Scar 18 G835LX | |
| Media AMD Ryzen 9 9955HX3D (23468 - 23669, n=2) | |
| MSI Raider A18 HX A9WIG-080 | |
| Aorus Master 18 AM8H | |
| MSI Raider 18 HX A14V | |
| Medion Erazer Beast 18 X1 MD62731 | |
| Media della classe Gaming (6460 - 27010, n=104, ultimi 2 anni) | |
| Geekbench 5.5 / Single-Core | |
| MSI Raider A18 HX A9WIG-080 | |
| Media AMD Ryzen 9 9955HX3D (2381 - 2401, n=2) | |
| Asus Strix Scar 18 G835LX | |
| Medion Erazer Beast 18 X1 MD62731 | |
| Aorus Master 18 AM8H | |
| MSI Raider 18 HX A14V | |
| Media della classe Gaming (986 - 2474, n=104, ultimi 2 anni) | |
| HWBOT x265 Benchmark v2.2 / 4k Preset | |
| MSI Raider A18 HX A9WIG-080 | |
| Media AMD Ryzen 9 9955HX3D (42.3 - 42.7, n=2) | |
| Asus Strix Scar 18 G835LX | |
| Aorus Master 18 AM8H | |
| MSI Raider 18 HX A14V | |
| Medion Erazer Beast 18 X1 MD62731 | |
| Media della classe Gaming (11.5 - 44.3, n=104, ultimi 2 anni) | |
| LibreOffice / 20 Documents To PDF | |
| Aorus Master 18 AM8H | |
| Media della classe Gaming (33.2 - 88.8, n=104, ultimi 2 anni) | |
| Medion Erazer Beast 18 X1 MD62731 | |
| Media AMD Ryzen 9 9955HX3D (44.9 - 46.6, n=2) | |
| MSI Raider A18 HX A9WIG-080 | |
| Asus Strix Scar 18 G835LX | |
| MSI Raider 18 HX A14V | |
| R Benchmark 2.5 / Overall mean | |
| Media della classe Gaming (0.3439 - 0.759, n=105, ultimi 2 anni) | |
| Aorus Master 18 AM8H | |
| Medion Erazer Beast 18 X1 MD62731 | |
| Asus Strix Scar 18 G835LX | |
| MSI Raider 18 HX A14V | |
| MSI Raider A18 HX A9WIG-080 | |
| Media AMD Ryzen 9 9955HX3D (0.3552 - 0.3677, n=2) | |
* ... Meglio usare valori piccoli
AIDA64: FP32 Ray-Trace | FPU Julia | CPU SHA3 | CPU Queen | FPU SinJulia | FPU Mandel | CPU AES | CPU ZLib | FP64 Ray-Trace | CPU PhotoWorxx
| Performance rating | |
| MSI Raider A18 HX A9WIG-080 | |
| Media AMD Ryzen 9 9955HX3D | |
| Asus Strix Scar 18 G835LX | |
| Aorus Master 18 AM8H | |
| MSI Raider 18 HX A14V | |
| Medion Erazer Beast 18 X1 MD62731 | |
| Media della classe Gaming | |
| AIDA64 / FP32 Ray-Trace | |
| MSI Raider A18 HX A9WIG-080 | |
| Media AMD Ryzen 9 9955HX3D (80619 - 84943, n=2) | |
| Asus Strix Scar 18 G835LX | |
| Aorus Master 18 AM8H | |
| Media della classe Gaming (10227 - 85542, n=103, ultimi 2 anni) | |
| Medion Erazer Beast 18 X1 MD62731 | |
| MSI Raider 18 HX A14V | |
| AIDA64 / FPU Julia | |
| MSI Raider A18 HX A9WIG-080 | |
| Media AMD Ryzen 9 9955HX3D (230738 - 238426, n=2) | |
| Asus Strix Scar 18 G835LX | |
| Aorus Master 18 AM8H | |
| Medion Erazer Beast 18 X1 MD62731 | |
| Media della classe Gaming (51376 - 238426, n=103, ultimi 2 anni) | |
| MSI Raider 18 HX A14V | |
| AIDA64 / CPU SHA3 | |
| MSI Raider A18 HX A9WIG-080 | |
| Media AMD Ryzen 9 9955HX3D (9656 - 9750, n=2) | |
| Asus Strix Scar 18 G835LX | |
| Aorus Master 18 AM8H | |
| Medion Erazer Beast 18 X1 MD62731 | |
| MSI Raider 18 HX A14V | |
| Media della classe Gaming (2180 - 9817, n=103, ultimi 2 anni) | |
| AIDA64 / CPU Queen | |
| Media AMD Ryzen 9 9955HX3D (171718 - 173351, n=2) | |
| MSI Raider A18 HX A9WIG-080 | |
| MSI Raider 18 HX A14V | |
| Asus Strix Scar 18 G835LX | |
| Aorus Master 18 AM8H | |
| Media della classe Gaming (49785 - 173351, n=89, ultimi 2 anni) | |
| Medion Erazer Beast 18 X1 MD62731 | |
| AIDA64 / FPU SinJulia | |
| MSI Raider A18 HX A9WIG-080 | |
| Media AMD Ryzen 9 9955HX3D (32989 - 33636, n=2) | |
| MSI Raider 18 HX A14V | |
| Media della classe Gaming (4424 - 33636, n=103, ultimi 2 anni) | |
| Asus Strix Scar 18 G835LX | |
| Aorus Master 18 AM8H | |
| Medion Erazer Beast 18 X1 MD62731 | |
| AIDA64 / FPU Mandel | |
| MSI Raider A18 HX A9WIG-080 | |
| Media AMD Ryzen 9 9955HX3D (122088 - 126658, n=2) | |
| Asus Strix Scar 18 G835LX | |
| Aorus Master 18 AM8H | |
| Media della classe Gaming (25115 - 128721, n=103, ultimi 2 anni) | |
| Medion Erazer Beast 18 X1 MD62731 | |
| MSI Raider 18 HX A14V | |
| AIDA64 / CPU AES | |
| MSI Raider A18 HX A9WIG-080 | |
| Media AMD Ryzen 9 9955HX3D (161913 - 163423, n=2) | |
| Asus Strix Scar 18 G835LX | |
| MSI Raider 18 HX A14V | |
| Aorus Master 18 AM8H | |
| Medion Erazer Beast 18 X1 MD62731 | |
| Media della classe Gaming (39258 - 247074, n=103, ultimi 2 anni) | |
| AIDA64 / CPU ZLib | |
| MSI Raider A18 HX A9WIG-080 | |
| Media AMD Ryzen 9 9955HX3D (2497 - 2517, n=2) | |
| Asus Strix Scar 18 G835LX | |
| MSI Raider 18 HX A14V | |
| Aorus Master 18 AM8H | |
| Medion Erazer Beast 18 X1 MD62731 | |
| Media della classe Gaming (574 - 2531, n=103, ultimi 2 anni) | |
| AIDA64 / FP64 Ray-Trace | |
| MSI Raider A18 HX A9WIG-080 | |
| Media AMD Ryzen 9 9955HX3D (42676 - 45384, n=2) | |
| Asus Strix Scar 18 G835LX | |
| Aorus Master 18 AM8H | |
| Media della classe Gaming (5509 - 45446, n=103, ultimi 2 anni) | |
| MSI Raider 18 HX A14V | |
| Medion Erazer Beast 18 X1 MD62731 | |
| AIDA64 / CPU PhotoWorxx | |
| Asus Strix Scar 18 G835LX | |
| Aorus Master 18 AM8H | |
| Medion Erazer Beast 18 X1 MD62731 | |
| Media della classe Gaming (12271 - 89891, n=103, ultimi 2 anni) | |
| Media AMD Ryzen 9 9955HX3D (38765 - 43032, n=2) | |
| MSI Raider 18 HX A14V | |
| MSI Raider A18 HX A9WIG-080 | |
Prestazioni del sistema
Come previsto, i benchmark delle prestazioni di sistema sono eccellenti e il portatile MSI vola nell'uso quotidiano.
PCMark 10: Score | Essentials | Productivity | Digital Content Creation
CrossMark: Overall | Productivity | Creativity | Responsiveness
WebXPRT 3: Overall
WebXPRT 4: Overall
Mozilla Kraken 1.1: Total
| Performance rating | |
| MSI Raider A18 HX A9WIG-080 | |
| Media AMD Ryzen 9 9955HX3D, NVIDIA GeForce RTX 5080 Laptop | |
| MSI Raider 18 HX A14V | |
| Aorus Master 18 AM8H | |
| Asus Strix Scar 18 G835LX | |
| Media della classe Gaming | |
| Medion Erazer Beast 18 X1 MD62731 | |
| PCMark 10 / Score | |
| MSI Raider 18 HX A14V | |
| MSI Raider A18 HX A9WIG-080 | |
| Media AMD Ryzen 9 9955HX3D, NVIDIA GeForce RTX 5080 Laptop (n=1) | |
| Asus Strix Scar 18 G835LX | |
| Aorus Master 18 AM8H | |
| Media della classe Gaming (5828 - 11730, n=92, ultimi 2 anni) | |
| Medion Erazer Beast 18 X1 MD62731 | |
| PCMark 10 / Essentials | |
| MSI Raider 18 HX A14V | |
| MSI Raider A18 HX A9WIG-080 | |
| Media AMD Ryzen 9 9955HX3D, NVIDIA GeForce RTX 5080 Laptop (n=1) | |
| Aorus Master 18 AM8H | |
| Asus Strix Scar 18 G835LX | |
| Media della classe Gaming (8810 - 11935, n=96, ultimi 2 anni) | |
| Medion Erazer Beast 18 X1 MD62731 | |
| PCMark 10 / Productivity | |
| MSI Raider 18 HX A14V | |
| Media della classe Gaming (6845 - 21327, n=94, ultimi 2 anni) | |
| MSI Raider A18 HX A9WIG-080 | |
| Media AMD Ryzen 9 9955HX3D, NVIDIA GeForce RTX 5080 Laptop (n=1) | |
| Medion Erazer Beast 18 X1 MD62731 | |
| Asus Strix Scar 18 G835LX | |
| Aorus Master 18 AM8H | |
| PCMark 10 / Digital Content Creation | |
| Asus Strix Scar 18 G835LX | |
| Aorus Master 18 AM8H | |
| MSI Raider 18 HX A14V | |
| Medion Erazer Beast 18 X1 MD62731 | |
| MSI Raider A18 HX A9WIG-080 | |
| Media AMD Ryzen 9 9955HX3D, NVIDIA GeForce RTX 5080 Laptop (n=1) | |
| Media della classe Gaming (7602 - 19954, n=94, ultimi 2 anni) | |
| CrossMark / Overall | |
| Aorus Master 18 AM8H | |
| MSI Raider A18 HX A9WIG-080 | |
| Media AMD Ryzen 9 9955HX3D, NVIDIA GeForce RTX 5080 Laptop (n=1) | |
| Asus Strix Scar 18 G835LX | |
| MSI Raider 18 HX A14V | |
| Media della classe Gaming (1366 - 2409, n=93, ultimi 2 anni) | |
| Medion Erazer Beast 18 X1 MD62731 | |
| CrossMark / Productivity | |
| Aorus Master 18 AM8H | |
| Asus Strix Scar 18 G835LX | |
| MSI Raider A18 HX A9WIG-080 | |
| Media AMD Ryzen 9 9955HX3D, NVIDIA GeForce RTX 5080 Laptop (n=1) | |
| MSI Raider 18 HX A14V | |
| Media della classe Gaming (1386 - 2254, n=93, ultimi 2 anni) | |
| Medion Erazer Beast 18 X1 MD62731 | |
| CrossMark / Creativity | |
| MSI Raider A18 HX A9WIG-080 | |
| Media AMD Ryzen 9 9955HX3D, NVIDIA GeForce RTX 5080 Laptop (n=1) | |
| Asus Strix Scar 18 G835LX | |
| Aorus Master 18 AM8H | |
| MSI Raider 18 HX A14V | |
| Media della classe Gaming (1343 - 2729, n=93, ultimi 2 anni) | |
| Medion Erazer Beast 18 X1 MD62731 | |
| CrossMark / Responsiveness | |
| Aorus Master 18 AM8H | |
| MSI Raider 18 HX A14V | |
| MSI Raider A18 HX A9WIG-080 | |
| Media AMD Ryzen 9 9955HX3D, NVIDIA GeForce RTX 5080 Laptop (n=1) | |
| Asus Strix Scar 18 G835LX | |
| Media della classe Gaming (1226 - 2334, n=93, ultimi 2 anni) | |
| Medion Erazer Beast 18 X1 MD62731 | |
| WebXPRT 3 / Overall | |
| MSI Raider A18 HX A9WIG-080 | |
| Media AMD Ryzen 9 9955HX3D, NVIDIA GeForce RTX 5080 Laptop (n=1) | |
| Asus Strix Scar 18 G835LX | |
| Medion Erazer Beast 18 X1 MD62731 | |
| MSI Raider 18 HX A14V | |
| Media della classe Gaming (220 - 532, n=97, ultimi 2 anni) | |
| Aorus Master 18 AM8H | |
| WebXPRT 4 / Overall | |
| Asus Strix Scar 18 G835LX | |
| MSI Raider A18 HX A9WIG-080 | |
| Media AMD Ryzen 9 9955HX3D, NVIDIA GeForce RTX 5080 Laptop (n=1) | |
| Medion Erazer Beast 18 X1 MD62731 | |
| MSI Raider 18 HX A14V | |
| Aorus Master 18 AM8H | |
| Media della classe Gaming (165 - 354, n=97, ultimi 2 anni) | |
| Mozilla Kraken 1.1 / Total | |
| Media della classe Gaming (391 - 590, n=99, ultimi 2 anni) | |
| MSI Raider 18 HX A14V | |
| Aorus Master 18 AM8H | |
| Medion Erazer Beast 18 X1 MD62731 | |
| Asus Strix Scar 18 G835LX | |
| MSI Raider A18 HX A9WIG-080 | |
| Media AMD Ryzen 9 9955HX3D, NVIDIA GeForce RTX 5080 Laptop (n=1) | |
* ... Meglio usare valori piccoli
| PCMark 10 Score | 8859 punti | |
Aiuto | ||
| AIDA64 / Memory Copy | |
| Asus Strix Scar 18 G835LX | |
| Medion Erazer Beast 18 X1 MD62731 | |
| Aorus Master 18 AM8H | |
| Media della classe Gaming (21750 - 129946, n=103, ultimi 2 anni) | |
| MSI Raider 18 HX A14V | |
| Media AMD Ryzen 9 9955HX3D (56383 - 61533, n=2) | |
| MSI Raider A18 HX A9WIG-080 | |
| AIDA64 / Memory Read | |
| Medion Erazer Beast 18 X1 MD62731 | |
| Asus Strix Scar 18 G835LX | |
| Aorus Master 18 AM8H | |
| Media della classe Gaming (22956 - 118858, n=103, ultimi 2 anni) | |
| Media AMD Ryzen 9 9955HX3D (59750 - 65369, n=2) | |
| MSI Raider 18 HX A14V | |
| MSI Raider A18 HX A9WIG-080 | |
| AIDA64 / Memory Write | |
| Asus Strix Scar 18 G835LX | |
| Medion Erazer Beast 18 X1 MD62731 | |
| Media della classe Gaming (22297 - 135096, n=103, ultimi 2 anni) | |
| Aorus Master 18 AM8H | |
| Media AMD Ryzen 9 9955HX3D (59506 - 72898, n=2) | |
| MSI Raider 18 HX A14V | |
| MSI Raider A18 HX A9WIG-080 | |
| AIDA64 / Memory Latency | |
| Aorus Master 18 AM8H | |
| Medion Erazer Beast 18 X1 MD62731 | |
| Asus Strix Scar 18 G835LX | |
| Media della classe Gaming (75.3 - 259, n=103, ultimi 2 anni) | |
| Media AMD Ryzen 9 9955HX3D (96.1 - 103.6, n=2) | |
| MSI Raider 18 HX A14V | |
| MSI Raider A18 HX A9WIG-080 | |
* ... Meglio usare valori piccoli
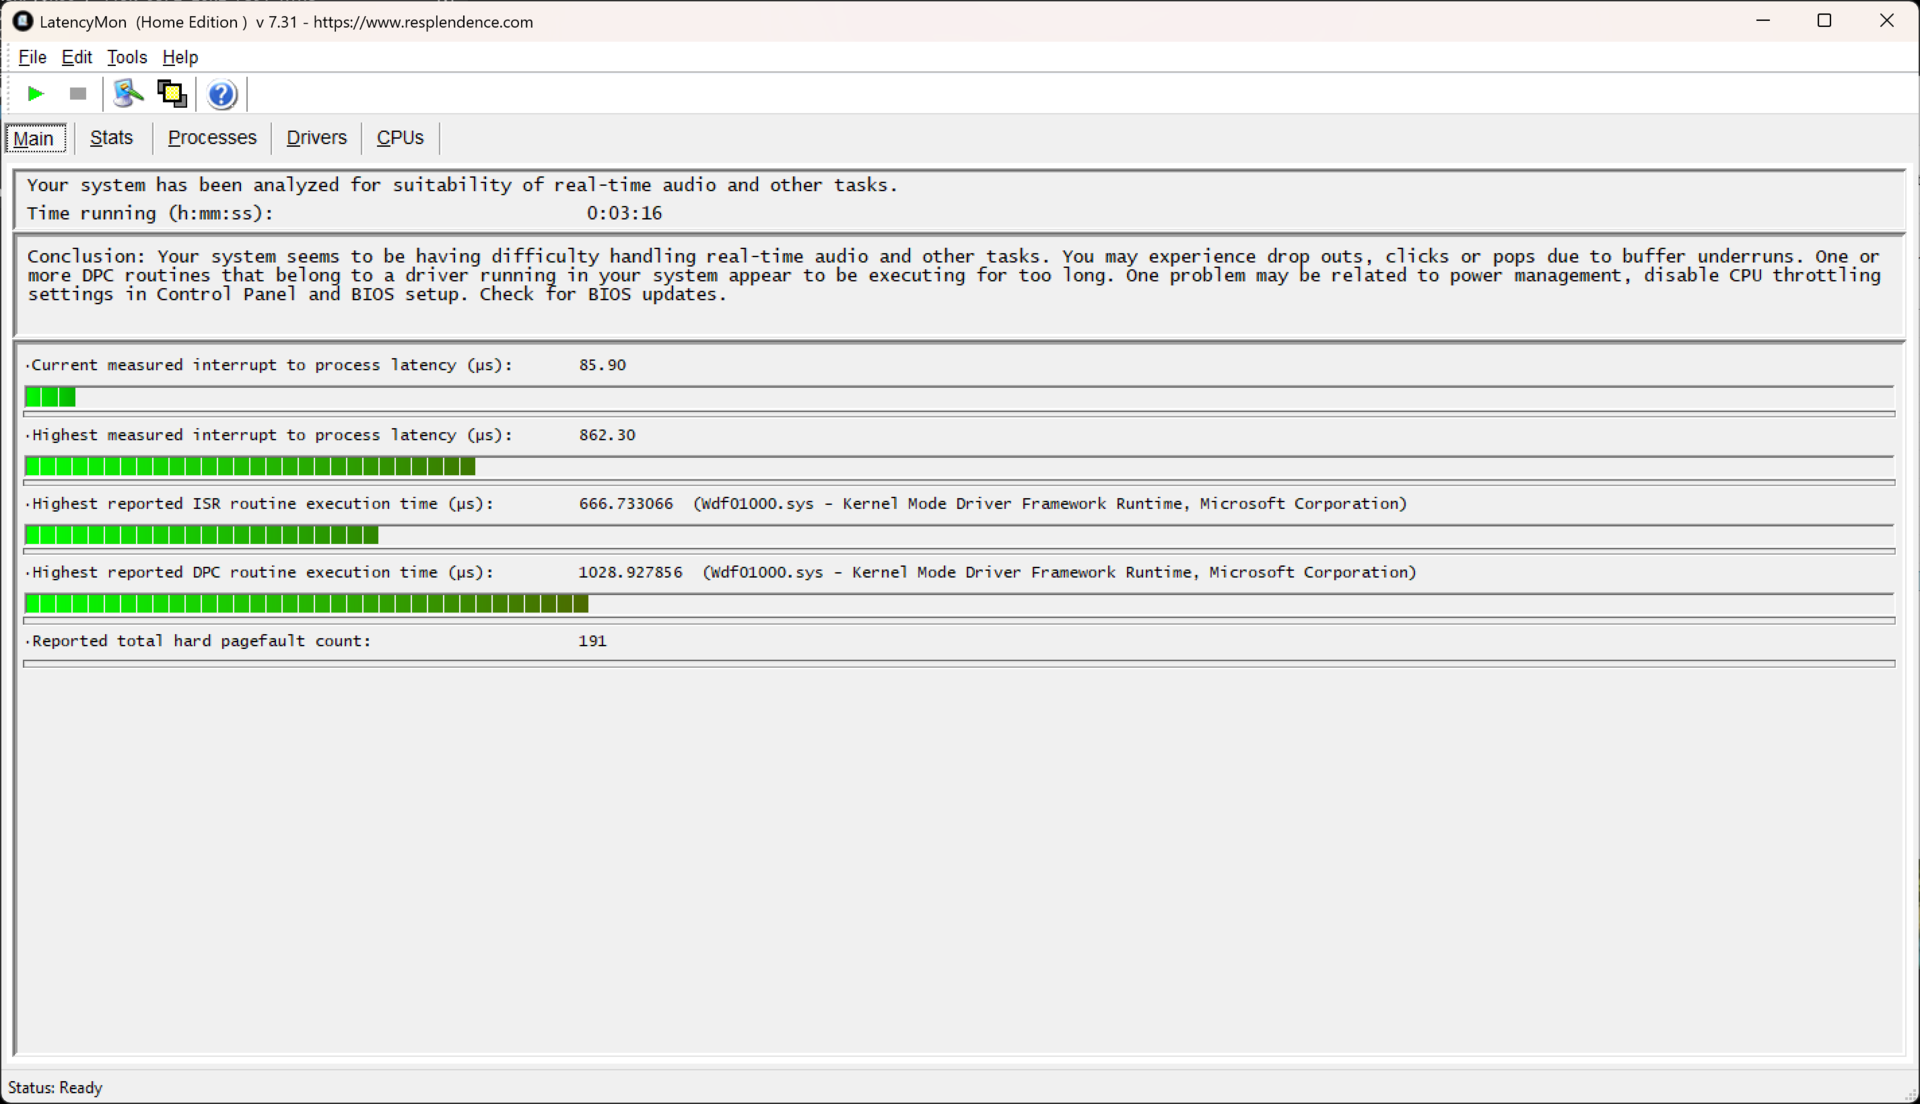
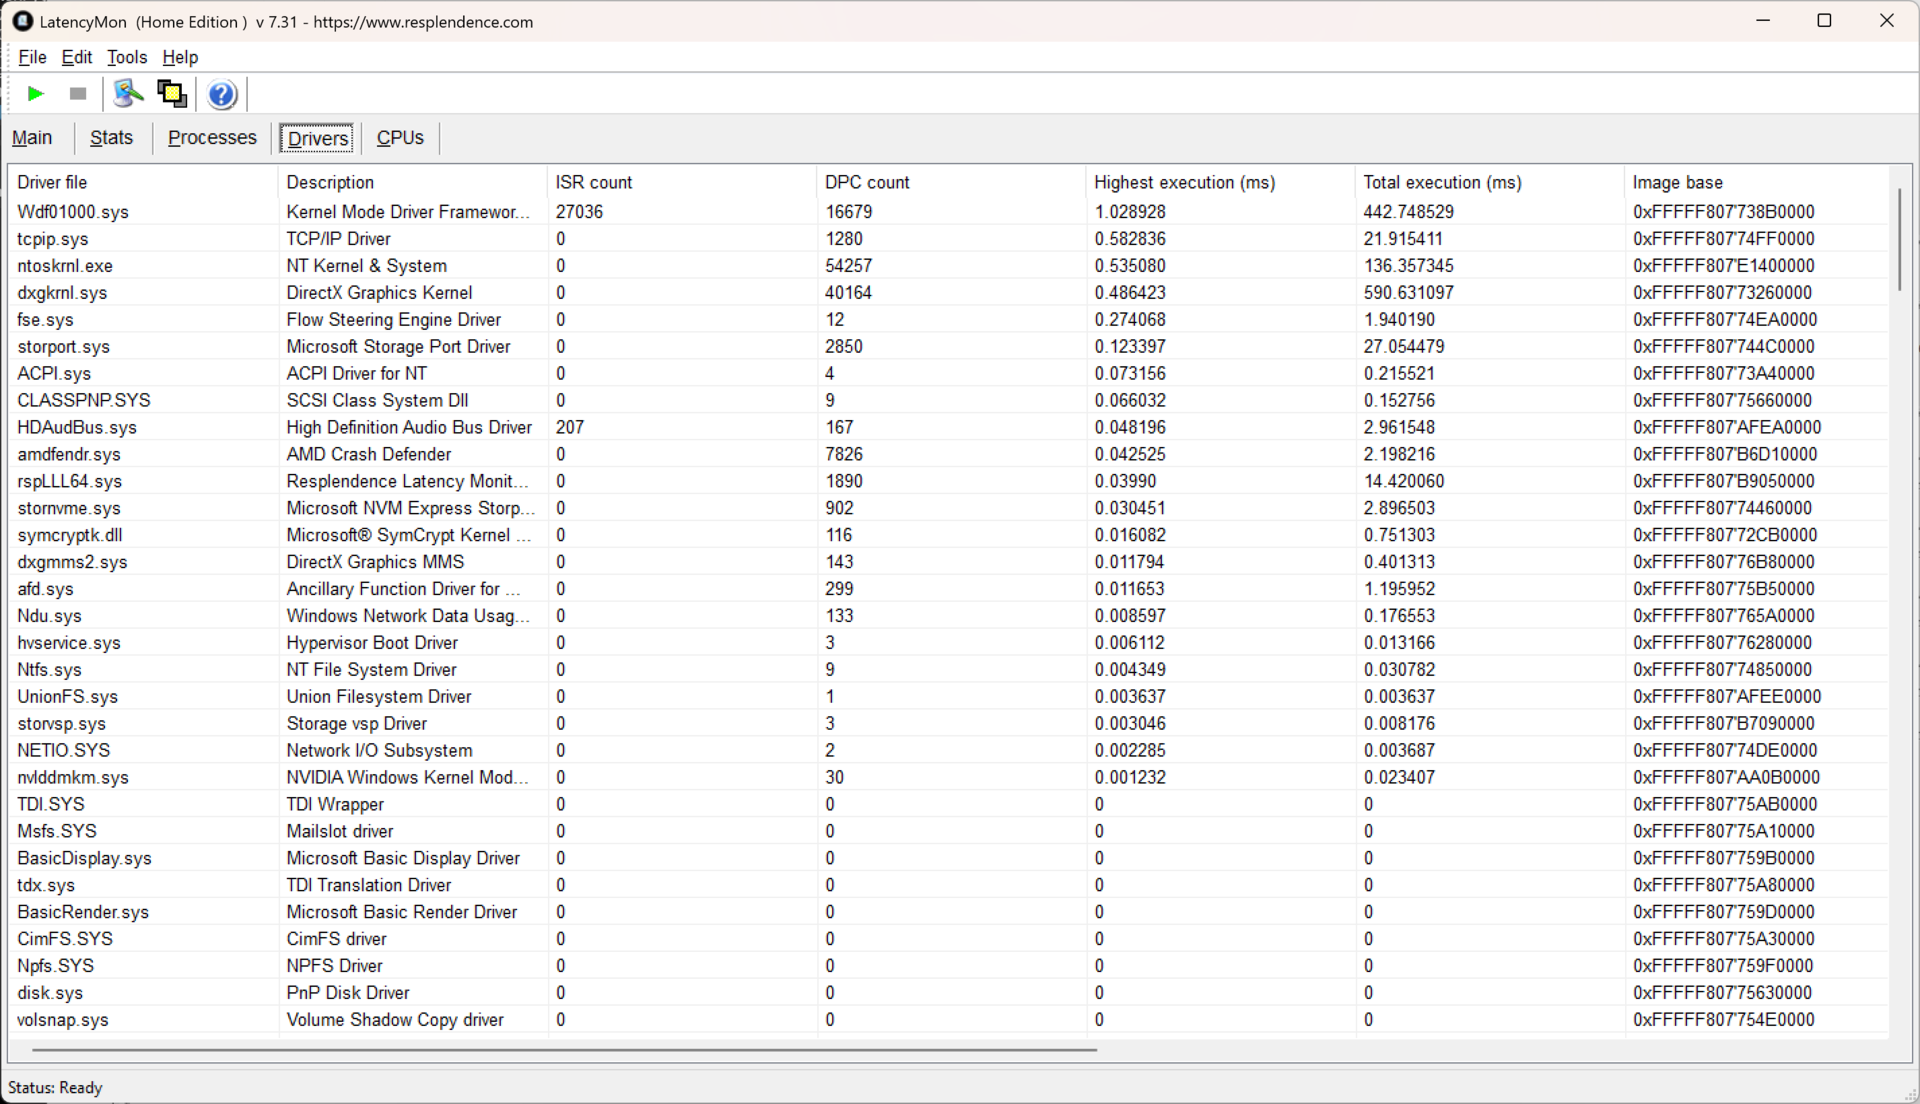
Latenza DPC
Ci sono alcuni problemi di caduta della latenza DPC su MSI Raider A18 HX, ma potrebbero essere risolti con un aggiornamento del driver o del BIOS.
| DPC Latencies / LatencyMon - interrupt to process latency (max), Web, Youtube, Prime95 | |
| Medion Erazer Beast 18 X1 MD62731 | |
| MSI Raider 18 HX A14V | |
| Aorus Master 18 AM8H | |
| MSI Raider A18 HX A9WIG-080 | |
| Asus Strix Scar 18 G835LX | |
* ... Meglio usare valori piccoli
Dispositivi di archiviazione
MSI utilizza un'unità SSD NVMe PCIe 5.0 molto veloce, con una capacità di 2 TB e prodotta da Samsung. Il PM9E1 è l'unità più veloce del nostro confronto e non presenta alcun throttling - grazie alla competente soluzione di raffreddamento dell'SSD di MSI.

* ... Meglio usare valori piccoli
Disk Throttling: DiskSpd Read Loop, Queue Depth 8
Prestazioni della GPU
Il Nvidia GeForce RTX 5080 Laptop è la seconda GPU consumer più veloce di Nvidia dell'attuale generazione "Blackwell". Ha la stessa interfaccia di memoria a 256 bit della più costosa RTX 5090ma con meno unità shader - 8192 invece di 10496 - anche se con velocità di clock superiori, da 0,98 a 2,29 GHz. Come per le CPU, abbiamo un Elenco di confronto delle GPU con altri numeri di benchmark.
Come mostrano i benchmark, le differenze tra la RTX 5090 e la 5080 sono minime quando si tratta di benchmark sintetici della GPU. La RTX 5090 è forse il cinque percento più veloce, anche se va detto che la RTX 5080 nel Raider A18 HX è anche leggermente più veloce della media per quella GPU.
| 3DMark 11 Performance | 51993 punti | |
| 3DMark Fire Strike Score | 41506 punti | |
| 3DMark Time Spy Score | 19302 punti | |
Aiuto | ||
* ... Meglio usare valori piccoli
Prestazioni di gioco
MSI Raider A18 HX raggiunge ottime prestazioni di gioco. Con la Nvidia GeForce RTX 5080batte persino di poco i portatili dotati di RTX 5090 nel confronto. Inoltre, le prestazioni rimangono stabili sotto carico sostenuto nel nostro test di carico di Cyberpunk 2077.
| Performance rating - Percent | |
| MSI Raider A18 HX A9WIG-080 | |
| Asus Strix Scar 18 G835LX | |
| Aorus Master 18 AM8H -1! | |
| MSI Raider 18 HX A14V -1! | |
| Medion Erazer Beast 18 X1 MD62731 -1! | |
| Media della classe Gaming | |
| Baldur's Gate 3 - 1920x1080 Ultra Preset AA:T | |
| Aorus Master 18 AM8H | |
| Asus Strix Scar 18 G835LX | |
| Medion Erazer Beast 18 X1 MD62731 | |
| MSI Raider A18 HX A9WIG-080 | |
| Media della classe Gaming (59.4 - 246, n=101, ultimi 2 anni) | |
| GTA V - 1920x1080 Highest AA:4xMSAA + FX AF:16x | |
| MSI Raider A18 HX A9WIG-080 | |
| Aorus Master 18 AM8H | |
| Asus Strix Scar 18 G835LX | |
| MSI Raider 18 HX A14V | |
| Medion Erazer Beast 18 X1 MD62731 | |
| Media della classe Gaming (48.3 - 186.9, n=93, ultimi 2 anni) | |
| Final Fantasy XV Benchmark - 1920x1080 High Quality | |
| Aorus Master 18 AM8H | |
| Asus Strix Scar 18 G835LX | |
| MSI Raider A18 HX A9WIG-080 | |
| Medion Erazer Beast 18 X1 MD62731 | |
| MSI Raider 18 HX A14V | |
| Media della classe Gaming (41 - 215, n=94, ultimi 2 anni) | |
| Dota 2 Reborn - 1920x1080 ultra (3/3) best looking | |
| MSI Raider A18 HX A9WIG-080 | |
| Asus Strix Scar 18 G835LX | |
| MSI Raider 18 HX A14V | |
| Aorus Master 18 AM8H | |
| Medion Erazer Beast 18 X1 MD62731 | |
| Media della classe Gaming (84.8 - 248, n=106, ultimi 2 anni) | |
| X-Plane 11.11 - 1920x1080 high (fps_test=3) | |
| MSI Raider 18 HX A14V | |
| Asus Strix Scar 18 G835LX | |
| MSI Raider A18 HX A9WIG-080 | |
| Aorus Master 18 AM8H | |
| Medion Erazer Beast 18 X1 MD62731 | |
| Media della classe Gaming (55.5 - 143.5, n=108, ultimi 2 anni) | |
| Cyberpunk 2077 - 3840x2160 Ultra Preset (FSR off) | |
| Asus Strix Scar 18 G835LX | |
| MSI Raider A18 HX A9WIG-080 | |
| Media della classe Gaming (25.1 - 128.8, n=35, ultimi 2 anni) | |
| MSI Raider 18 HX A14V | |
Cyberpunk 2077 ultra FPS Chart
| basso | medio | alto | ultra | QHD DLSS | QHD | 4K DLSS | 4K | |
|---|---|---|---|---|---|---|---|---|
| GTA V (2015) | 190.2 | 189.5 | 189 | 185 | 177.8 | 173.3 | ||
| Dota 2 Reborn (2015) | 327 | 304 | 271 | 239 | 199.2 | |||
| Final Fantasy XV Benchmark (2018) | 233 | 232 | 194.8 | 151.2 | 87 | |||
| X-Plane 11.11 (2018) | 158 | 138.2 | 113.9 | 124.1 | ||||
| Baldur's Gate 3 (2023) | 244 | 195.5 | 171.9 | 169.3 | 132.8 | 114.6 | 70.6 | |
| Cyberpunk 2077 (2023) | 225 | 197.1 | 167.9 | 151.9 | 104 | 46.3 | ||
| Alan Wake 2 (2023) | 134.7 | 125.7 | 116.4 | 78.3 | 63.1 | 40.7 | ||
| F1 24 (2024) | 396 | 349 | 277 | 134.8 | 126.9 | 79.3 | 68.2 | 39.4 |
| Black Myth: Wukong (2024) | 124 | 96 | 56 | 41 | 42 | 24 | ||
| Indiana Jones and the Great Circle (2024) | 189.3 | 141.8 | 127.2 | 99.5 | 61.8 | |||
| Monster Hunter Wilds (2025) | 127.6 | 111 | 90 | 70.6 | 59.3 | 42.9 | ||
| Assassin's Creed Shadows (2025) | 115 | 104 | 91 | 69 | 55 | 52 | 38 |
Emissioni: La ventola pulsante rende fastidioso MSI Raider A18
Rumore del sistema
Se acquista MSI Raider A18 HX, è meglio che preveda di indossare sempre le cuffie. Le due ventole di questo portatile MSI Raider non si spengono mai, a parte quando il dispositivo è spento. Almeno al minimo, le ventole rimangono sotto i 30 dB(a), ma si sentono sicuramente. Peggio ancora, le ventole tendono a emettere un rumore pulsante molto fastidioso. Sotto carico, MSI raggiunge un massimo di 55 dB(a) quando si esegue Cyberpunk 2077.
Rumorosità
| Idle |
| 28.6 / 28.9 / 29.2 dB(A) |
| Sotto carico |
| 45.6 / 45.8 dB(A) |
 | ||
30 dB silenzioso 40 dB(A) udibile 50 dB(A) rumoroso |
||
min: | ||
| MSI Raider A18 HX A9WIG-080 GeForce RTX 5080 Laptop, R9 9955HX3D, Samsung PM9E1 MZVLC2T0HBLD | MSI Raider 18 HX A14V GeForce RTX 4080 Laptop GPU, i9-14900HX, Samsung PM9A1 MZVL22T0HBLB | Medion Erazer Beast 18 X1 MD62731 GeForce RTX 5080 Laptop, Ultra 9 275HX, Phison E31 2 TB | Aorus Master 18 AM8H GeForce RTX 5090 Laptop, Ultra 9 275HX, Kingston KC3000 2048G SKC3000D2048G | Asus Strix Scar 18 G835LX GeForce RTX 5090 Laptop, Ultra 9 275HX, WD PC SN8000S 2TB | |
|---|---|---|---|---|---|
| Noise | -6% | -14% | -4% | -1% | |
| off /ambiente * (dB) | 25.1 | 23.3 7% | 25 -0% | 25 -0% | 23.3 7% |
| Idle Minimum * (dB) | 28.6 | 28.6 -0% | 25 13% | 26 9% | 29.8 -4% |
| Idle Average * (dB) | 28.9 | 28.6 1% | 39 -35% | 29 -0% | 29.8 -3% |
| Idle Maximum * (dB) | 29.2 | 31.3 -7% | 42 -44% | 34 -16% | 29.8 -2% |
| Load Average * (dB) | 45.6 | 44.1 3% | 52 -14% | 50 -10% | 42.9 6% |
| Cyberpunk 2077 ultra * (dB) | 55.6 | 59.4 -7% | 53 5% | 52 6% | 53.7 3% |
| Load Maximum * (dB) | 45.8 | 62.7 -37% | 55 -20% | 53 -16% | 53.7 -17% |
* ... Meglio usare valori piccoli
Temperatura
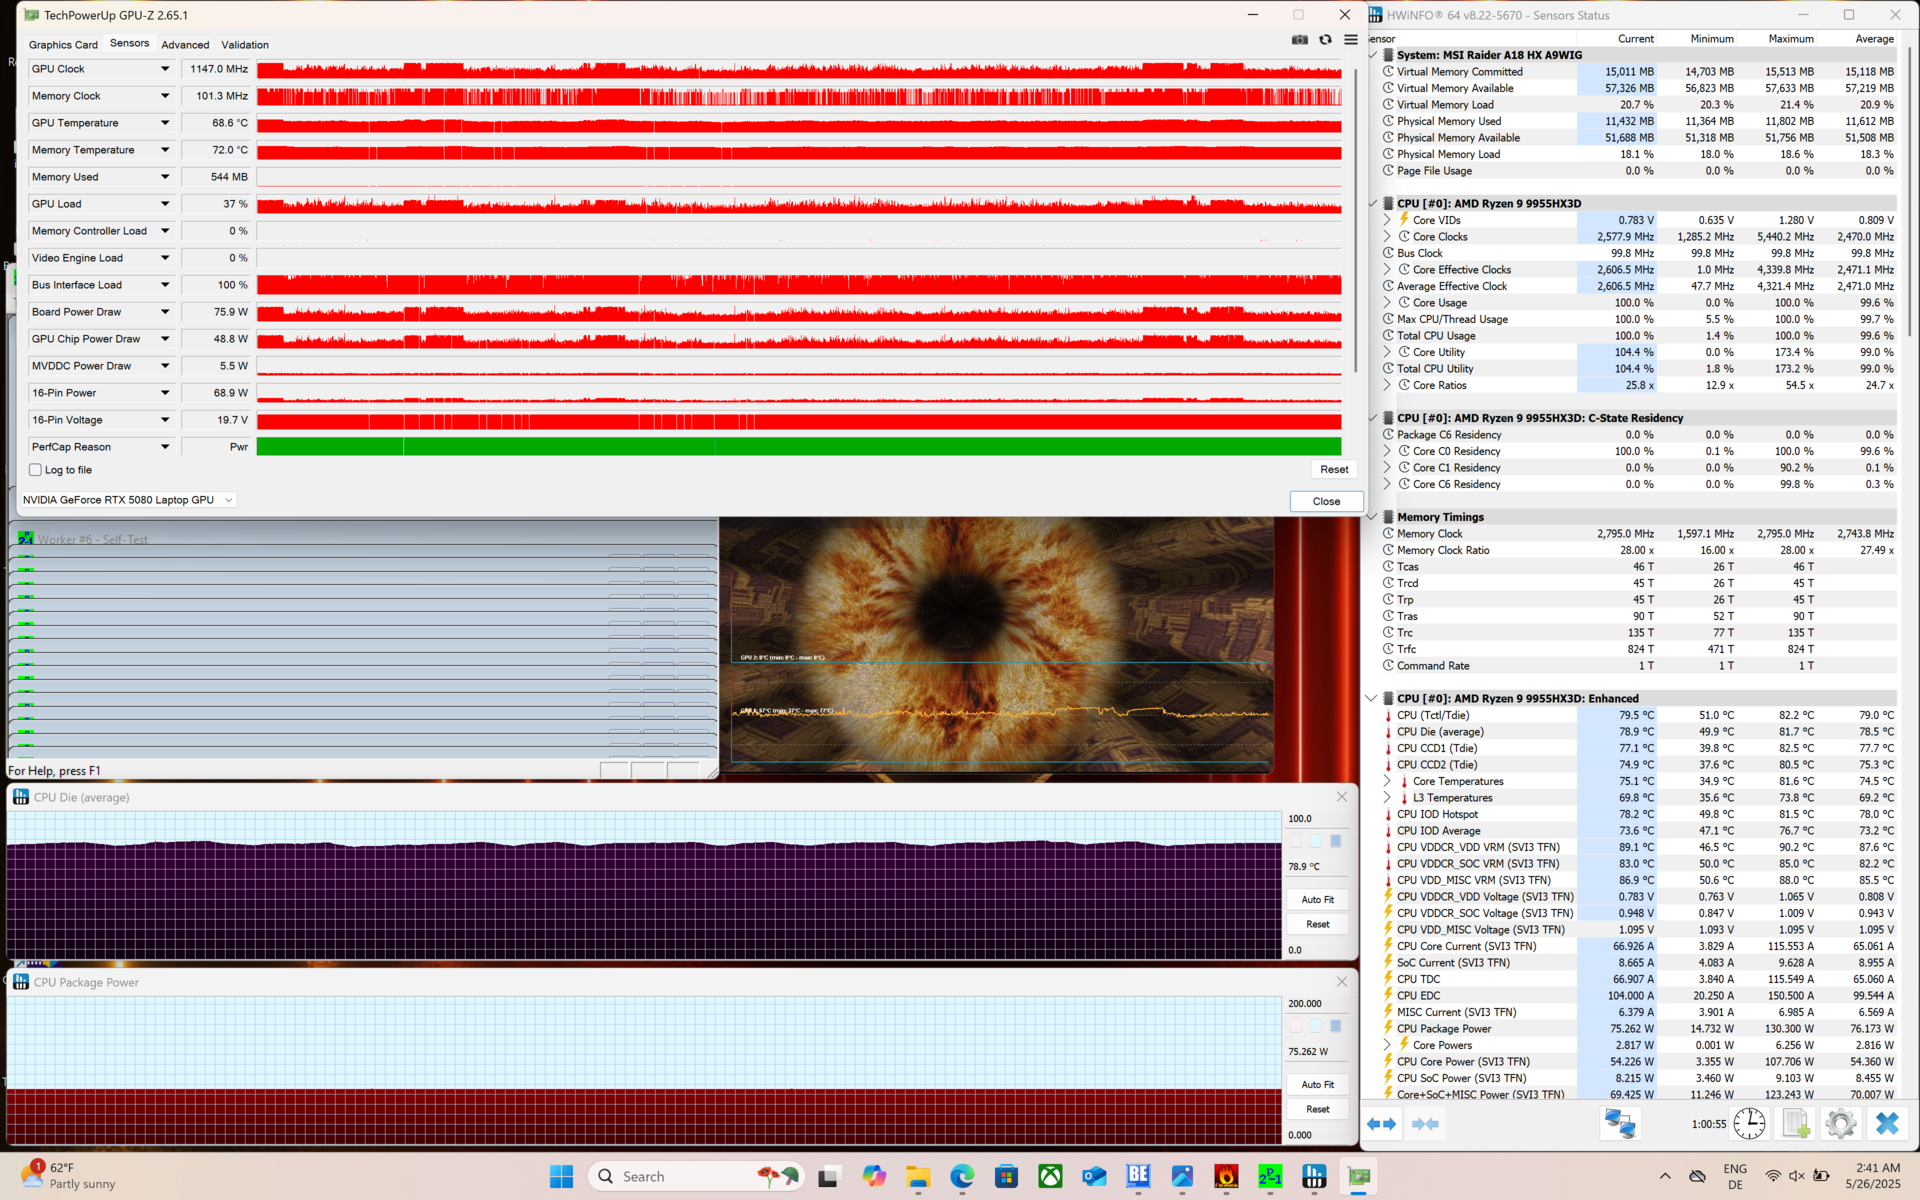
Un dispositivo con una tale potenza grezza si surriscalda, anche con le ventole che fanno gli straordinari. Almeno le temperature non sono estreme: abbiamo misurato un massimo di 52,7 gradi Celsius o 127 F nel nostro test di Cyberpunk 2077 . Inoltre, l'area del poggiapolsi, che è la zona più toccata dagli utenti, non si scalda affatto.
Con un carico del 100 percento su CPU e GPU, il processore può consumare fino a 75 W e lo stesso vale per la GPU. Ciò significa che il dispositivo è in grado di raffreddare un massimo di 150 W sostenuti quando si combinano le due cose.
(-) La temperatura massima sul lato superiore è di 49.3 °C / 121 F, rispetto alla media di 40.4 °C / 105 F, che varia da 21.2 a 68.8 °C per questa classe Gaming.
(-) Il lato inferiore si riscalda fino ad un massimo di 50.9 °C / 124 F, rispetto alla media di 43.2 °C / 110 F
(+) In idle, la temperatura media del lato superiore è di 30 °C / 86 F, rispetto alla media deld ispositivo di 33.9 °C / 93 F.
(±) 3: The average temperature for the upper side is 34.8 °C / 95 F, compared to the average of 33.9 °C / 93 F for the class Gaming.
(+) I poggiapolsi e il touchpad sono piu' freddi della temperatura della pelle con un massimo di 29.4 °C / 84.9 F e sono quindi freddi al tatto.
(±) La temperatura media della zona del palmo della mano di dispositivi simili e'stata di 28.8 °C / 83.8 F (-0.6 °C / -1.1 F).
| MSI Raider A18 HX A9WIG-080 AMD Ryzen 9 9955HX3D, NVIDIA GeForce RTX 5080 Laptop | MSI Raider 18 HX A14V Intel Core i9-14900HX, NVIDIA GeForce RTX 4080 Laptop GPU | Medion Erazer Beast 18 X1 MD62731 Intel Core Ultra 9 275HX, NVIDIA GeForce RTX 5080 Laptop | Aorus Master 18 AM8H Intel Core Ultra 9 275HX, NVIDIA GeForce RTX 5090 Laptop | Asus Strix Scar 18 G835LX Intel Core Ultra 9 275HX, NVIDIA GeForce RTX 5090 Laptop | |
|---|---|---|---|---|---|
| Heat | 5% | 8% | 1% | 12% | |
| Maximum Upper Side * (°C) | 49.3 | 40.8 17% | 47 5% | 50 -1% | 45.6 8% |
| Maximum Bottom * (°C) | 50.9 | 43.4 15% | 48 6% | 46 10% | 46 10% |
| Idle Upper Side * (°C) | 35.2 | 36.4 -3% | 29 18% | 36 -2% | 28.9 18% |
| Idle Bottom * (°C) | 33.5 | 36.4 -9% | 33 1% | 35 -4% | 29.2 13% |
* ... Meglio usare valori piccoli
Altoparlanti
Gli altoparlanti di MSI Raider A18 HX sono in totale sei e sono molto forti, con un buon livello di volume di 85,9 dB(a). Tuttavia, MSI sembra essersi dimenticata dei bassi, in quanto il suono è davvero piccolo e troppo pesante sugli alti - non è affatto l'esperienza premium che avremmo sperato da un portatile da gioco.
MSI Raider A18 HX A9WIG-080 analisi audio
(+) | gli altoparlanti sono relativamente potenti (85.9 dB)
Bassi 100 - 315 Hz
(-) | quasi nessun basso - in media 17.1% inferiori alla media
(±) | la linearità dei bassi è media (8.5% delta rispetto alla precedente frequenza)
Medi 400 - 2000 Hz
(±) | medi elevati - circa 9.4% superiore alla media
(±) | linearità dei medi adeguata (9.1% delta rispetto alla precedente frequenza)
Alti 2 - 16 kHz
(+) | Alti bilanciati - appena 3.8% dalla media
(+) | alti lineari (5.8% delta rispetto alla precedente frequenza)
Nel complesso 100 - 16.000 Hz
(±) | la linearità complessiva del suono è media (18.9% di differenza rispetto alla media
Rispetto alla stessa classe
» 63% di tutti i dispositivi testati in questa classe è stato migliore, 8% simile, 29% peggiore
» Il migliore ha avuto un delta di 6%, medio di 18%, peggiore di 132%
Rispetto a tutti i dispositivi testati
» 44% di tutti i dispositivi testati in questa classe è stato migliore, 8% similare, 48% peggiore
» Il migliore ha avuto un delta di 4%, medio di 23%, peggiore di 134%
Asus Strix Scar 18 G835LX analisi audio
(+) | gli altoparlanti sono relativamente potenti (86.3 dB)
Bassi 100 - 315 Hz
(±) | bassi ridotti - in media 7.5% inferiori alla media
(±) | la linearità dei bassi è media (7.7% delta rispetto alla precedente frequenza)
Medi 400 - 2000 Hz
(±) | medi elevati - circa 9.9% superiore alla media
(+) | medi lineari (6.9% delta rispetto alla precedente frequenza)
Alti 2 - 16 kHz
(+) | Alti bilanciati - appena 2.2% dalla media
(+) | alti lineari (4.1% delta rispetto alla precedente frequenza)
Nel complesso 100 - 16.000 Hz
(+) | suono nel complesso lineare (13.7% differenza dalla media)
Rispetto alla stessa classe
» 21% di tutti i dispositivi testati in questa classe è stato migliore, 7% simile, 72% peggiore
» Il migliore ha avuto un delta di 6%, medio di 18%, peggiore di 132%
Rispetto a tutti i dispositivi testati
» 15% di tutti i dispositivi testati in questa classe è stato migliore, 4% similare, 81% peggiore
» Il migliore ha avuto un delta di 4%, medio di 23%, peggiore di 134%
Gestione dell'energia: Il portatile MSI consuma velocemente la batteria grande
Consumo di energia
L'MSI Raider A18 non è efficiente dal punto di vista energetico. Anche con tutto spento e con la luminosità dello schermo abbassata, ha consumato più di 40 W. Questo è peggiore di tutti gli altri portatili del nostro confronto.
Al massimo, il laptop MSI assorbe 323 W - una sfida non da poco per il caricatore da 400 W.
| Off / Standby | |
| Idle | |
| Sotto carico |
|
Leggenda:
min: | |
| MSI Raider A18 HX A9WIG-080 R9 9955HX3D, GeForce RTX 5080 Laptop, Samsung PM9E1 MZVLC2T0HBLD, MiniLED IPS, 3840x2400, 18" | MSI Raider 18 HX A14V i9-14900HX, GeForce RTX 4080 Laptop GPU, Samsung PM9A1 MZVL22T0HBLB, Mini-LED, 3840x2400, 18" | Medion Erazer Beast 18 X1 MD62731 Ultra 9 275HX, GeForce RTX 5080 Laptop, Phison E31 2 TB, IPS, 2560x1600, 18" | Aorus Master 18 AM8H Ultra 9 275HX, GeForce RTX 5090 Laptop, Kingston KC3000 2048G SKC3000D2048G, Mini-LED, 2560x1600, 18" | Asus Strix Scar 18 G835LX Ultra 9 275HX, GeForce RTX 5090 Laptop, WD PC SN8000S 2TB, Mini-LED, 2560x1600, 18" | Media NVIDIA GeForce RTX 5080 Laptop | Media della classe Gaming | |
|---|---|---|---|---|---|---|---|
| Power Consumption | 13% | 40% | 14% | 13% | 35% | 49% | |
| Idle Minimum * (Watt) | 41.5 | 27.7 33% | 7.9 81% | 29 30% | 11.4 73% | 19.1 ? 54% | 13 ? 69% |
| Idle Average * (Watt) | 53.5 | 38.3 28% | 11.5 79% | 33 38% | 39.2 27% | 25.3 ? 53% | 18.7 ? 65% |
| Idle Maximum * (Watt) | 53.8 | 47.1 12% | 16.6 69% | 48 11% | 40.2 25% | 30.4 ? 43% | 24.3 ? 55% |
| Load Average * (Watt) | 168.5 | 121.2 28% | 130 23% | 141 16% | 161.2 4% | 128.5 ? 24% | 110.2 ? 35% |
| Cyberpunk 2077 ultra * (Watt) | 298 | 313 -5% | 253 15% | 283 5% | 303 -2% | ||
| Cyberpunk 2077 ultra external monitor * (Watt) | 295 | 306 -4% | 245 17% | 283 4% | 295 -0% | ||
| Load Maximum * (Watt) | 323.7 | 321.8 1% | 330 -2% | 340 -5% | 430.9 -33% | 314 ? 3% | 258 ? 20% |
* ... Meglio usare valori piccoli
Power Consumption Cyberpunk / Stress Test
Power Consumption external Monitor
Durata della batteria
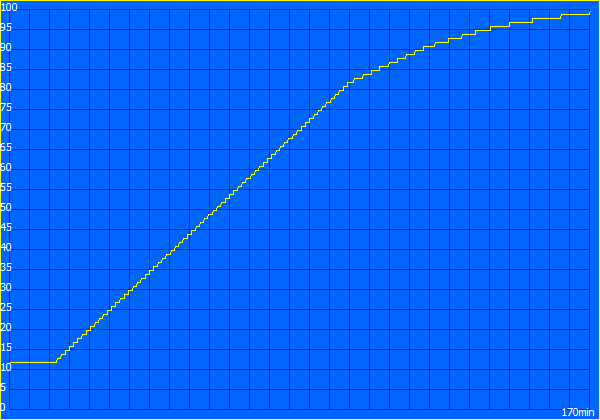
Se spera di utilizzare MSI Raider A18 HX senza un caricabatterie collegato: Se lo scordi. Nonostante la batteria da 99,9 Wh, il portatile è durato a malapena due ore nel nostro test Wi-Fi (luminosità di 150 cd/m²). Si tratta fondamentalmente di un desktop che può trasportare tra diverse scrivanie, e sempre con il caricabatterie in punta.
| MSI Raider A18 HX A9WIG-080 R9 9955HX3D, GeForce RTX 5080 Laptop, 99 Wh | MSI Raider 18 HX A14V i9-14900HX, GeForce RTX 4080 Laptop GPU, 99.9 Wh | Medion Erazer Beast 18 X1 MD62731 Ultra 9 275HX, GeForce RTX 5080 Laptop, 99 Wh | Aorus Master 18 AM8H Ultra 9 275HX, GeForce RTX 5090 Laptop, 99 Wh | Asus Strix Scar 18 G835LX Ultra 9 275HX, GeForce RTX 5090 Laptop, 90 Wh | Media della classe Gaming | |
|---|---|---|---|---|---|---|
| Autonomia della batteria | 38% | 276% | 103% | 86% | 139% | |
| WiFi v1.3 (h) | 2.1 | 3.3 57% | 7.9 276% | 4.9 133% | 5.5 162% | 7.15 ? 240% |
| Load (h) | 1.1 | 1.3 18% | 1.9 73% | 1.2 9% | 1.502 ? 37% | |
| Cyberpunk 2077 ultra 150cd (h) | 0.7 |
Valutazione Notebookcheck
MSI Raider A18 HX è uno dei computer portatili più potenti sul mercato, adatto sia per i giochi che per le attività lavorative intensive. Tuttavia, è necessario tenerlo sempre collegato al suo enorme caricabatterie da 400 W, poiché dura a malapena più di due ore al massimo, anche con la sua batteria da 99 Wh.
MSI Raider A18 HX A9WIG-080
- 06/01/2025 v8
Benjamin Herzig
 Total Sustainability Score:
 Potential Competitors in Comparison
Immagine | Modello | Prezzo | Peso | Altezza | Schermo |
|---|---|---|---|---|---|
1. 85.1%  | MSI Raider A18 HX A9WIG-080 AMD Ryzen 9 9955HX3D ⎘ NVIDIA GeForce RTX 5080 Laptop ⎘ 64 GB Memoria, 2048 GB SSD | Amazon: Prezzo di listino: 4350 Euro | 3.6 kg | 34 mm | 18.00" 3840x2400 252 PPI MiniLED IPS |
2. 84.7%  | MSI Raider 18 HX A14V Intel Core i9-14900HX ⎘ NVIDIA GeForce RTX 4080 Laptop GPU ⎘ 64 GB Memoria, 2048 GB SSD | Amazon: 1. $74.99 330W 280W Laptop Charger Fit... 2. $89.99 400W 20V 20A Laptop Charger ... 3. $99.99 400W 20V 20A AC Adapter for ... Prezzo di listino: 3400 USD | 3.6 kg | 32 mm | 18.00" 3840x2400 252 PPI Mini-LED |
3. 82.5%  | Medion Erazer Beast 18 X1 MD62731 Intel Core Ultra 9 275HX ⎘ NVIDIA GeForce RTX 5080 Laptop ⎘ 32 GB Memoria, SSD | Amazon: Prezzo di listino: 3700 EUR | 3.6 kg | 30.4 mm | 18.00" 2560x1600 168 PPI IPS |
4. 86.8%  | Aorus Master 18 AM8H Intel Core Ultra 9 275HX ⎘ NVIDIA GeForce RTX 5090 Laptop ⎘ 64 GB Memoria, 2048 GB SSD | Amazon: Prezzo di listino: 5000 EUR | 3.4 kg | 31 mm | 18.00" 2560x1600 168 PPI Mini-LED |
5. 88%  | Asus Strix Scar 18 G835LX Intel Core Ultra 9 275HX ⎘ NVIDIA GeForce RTX 5090 Laptop ⎘ 64 GB Memoria, 2048 GB SSD | Amazon: Prezzo di listino: 5799€ | 3.3 kg | 32 mm | 18.00" 2560x1600 168 PPI Mini-LED |
Transparency
La selezione dei dispositivi da recensire viene effettuata dalla nostra redazione. Il campione di prova è stato fornito all'autore come prestito dal produttore o dal rivenditore ai fini di questa recensione. L'istituto di credito non ha avuto alcuna influenza su questa recensione, né il produttore ne ha ricevuto una copia prima della pubblicazione. Non vi era alcun obbligo di pubblicare questa recensione. In quanto società mediatica indipendente, Notebookcheck non è soggetta all'autorità di produttori, rivenditori o editori.
Ecco come Notebookcheck esegue i test
Ogni anno, Notebookcheck esamina in modo indipendente centinaia di laptop e smartphone utilizzando procedure standardizzate per garantire che tutti i risultati siano comparabili. Da circa 20 anni sviluppiamo continuamente i nostri metodi di prova e nel frattempo stabiliamo gli standard di settore. Nei nostri laboratori di prova, tecnici ed editori esperti utilizzano apparecchiature di misurazione di alta qualità. Questi test comportano un processo di validazione in più fasi. Il nostro complesso sistema di valutazione si basa su centinaia di misurazioni e parametri di riferimento ben fondati, che mantengono l'obiettività.
