Verdetto - ThinkPad X13 scende a troppi compromessi
Il nuovo ThinkPad X13 G6 è un computer portatile business compatto, ma la sua attenzione alla mobilità comporta una serie di compromessi. Questi includono la rigidità del telaio, la qualità della tastiera e le cerniere del display. Purtroppo, sono proprio queste le aree in cui gli utenti ThinkPad di lunga data probabilmente si sentiranno delusi.
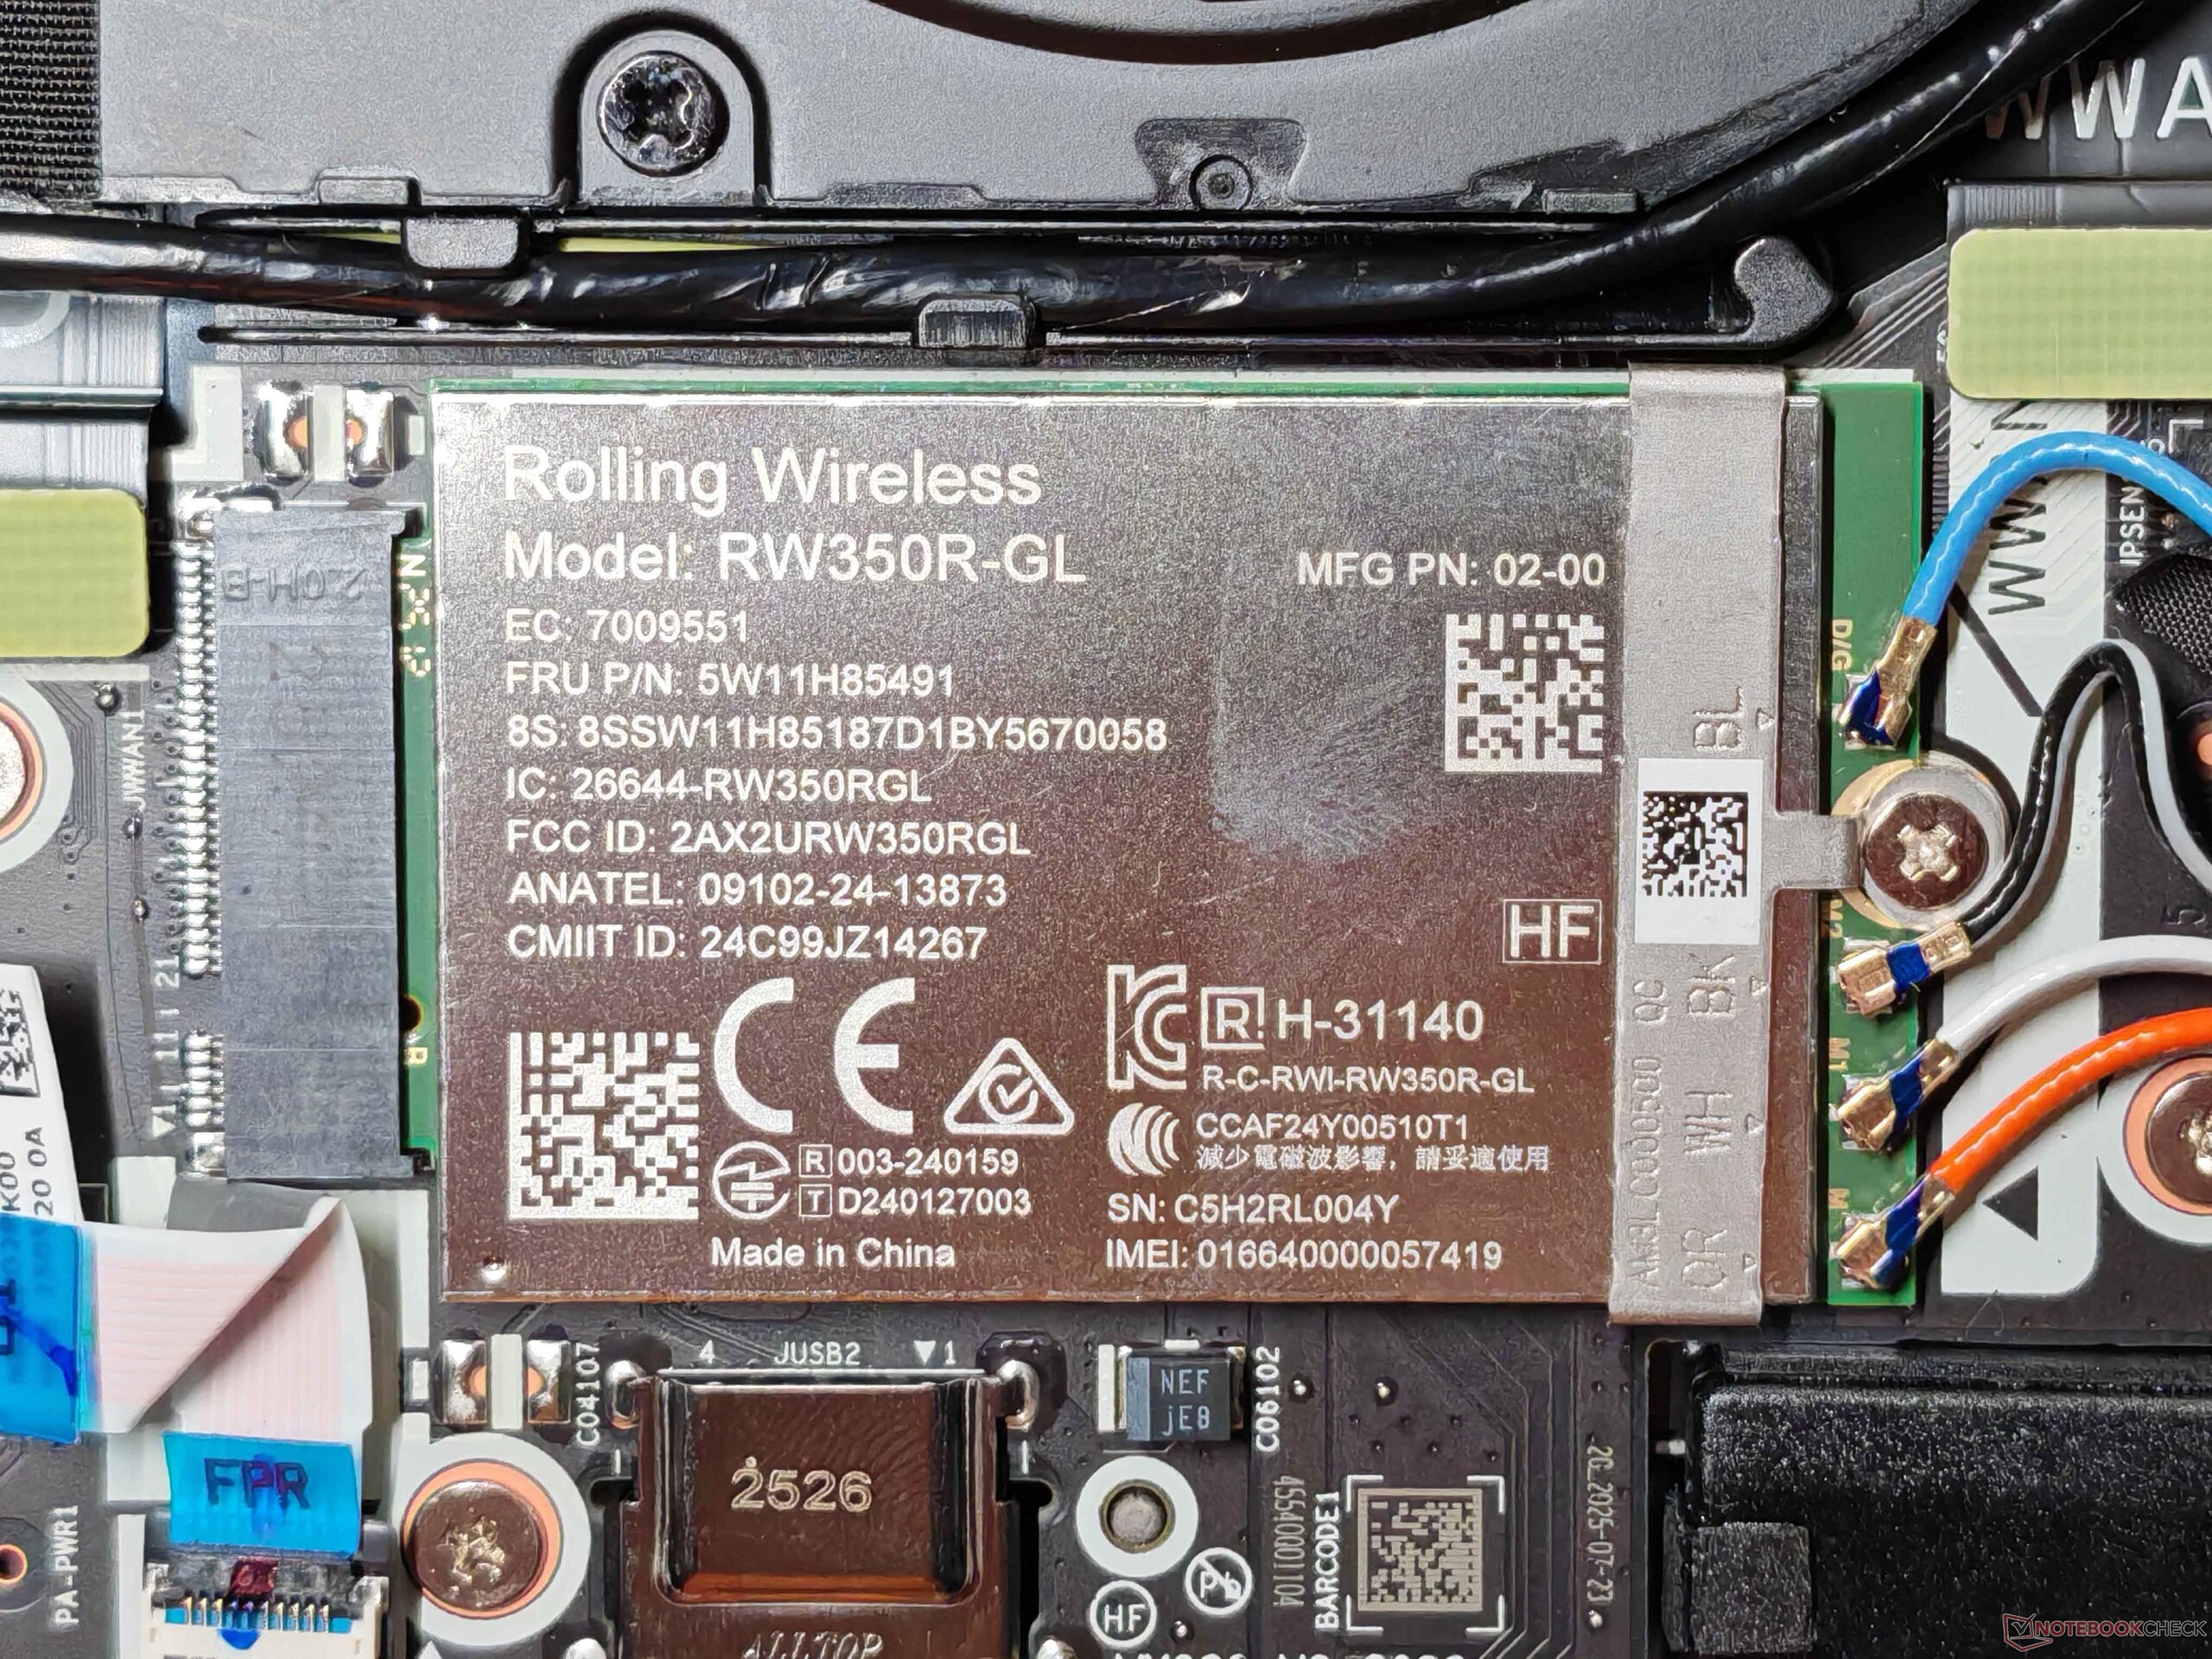
In termini di caratteristiche, l'X13 AMD fa una forte impressione con Thunderbolt 4, un lettore di SmartCard, 5G e Wi-Fi 7, ma la concorrenza dimostra che è possibile fare di più quando si tratta di consumo energetico e durata della batteria. Inoltre, è presente solo un display Full HD a 60 Hz.
Le prestazioni della CPU del processore AMD sono complessivamente molto buone e superiori alla concorrenza diretta, ma in termini di pacchetto completo, il Dell Pro 13 Premium è il migliore Dell Pro 13 Premium rimane la scelta più forte.
Pro
Contro
Prezzo e disponibilità

L'unità di recensione di ThinkPad X13 G6 AMD è disponibile presso Campuspoint a partire da 1.759 euro, mentre Lenovo offre attualmente modelli configurabili del ThinkPad X13 G6 a partire da circa 1.300 euro. Negli Stati Uniti, una configurazione AMD comparabile del ThinkPad X13 G6 è attualmente in listino a circa 1.349 dollari presso rivenditori come CDWanche se i prezzi possono variare a seconda della regione e della configurazione.
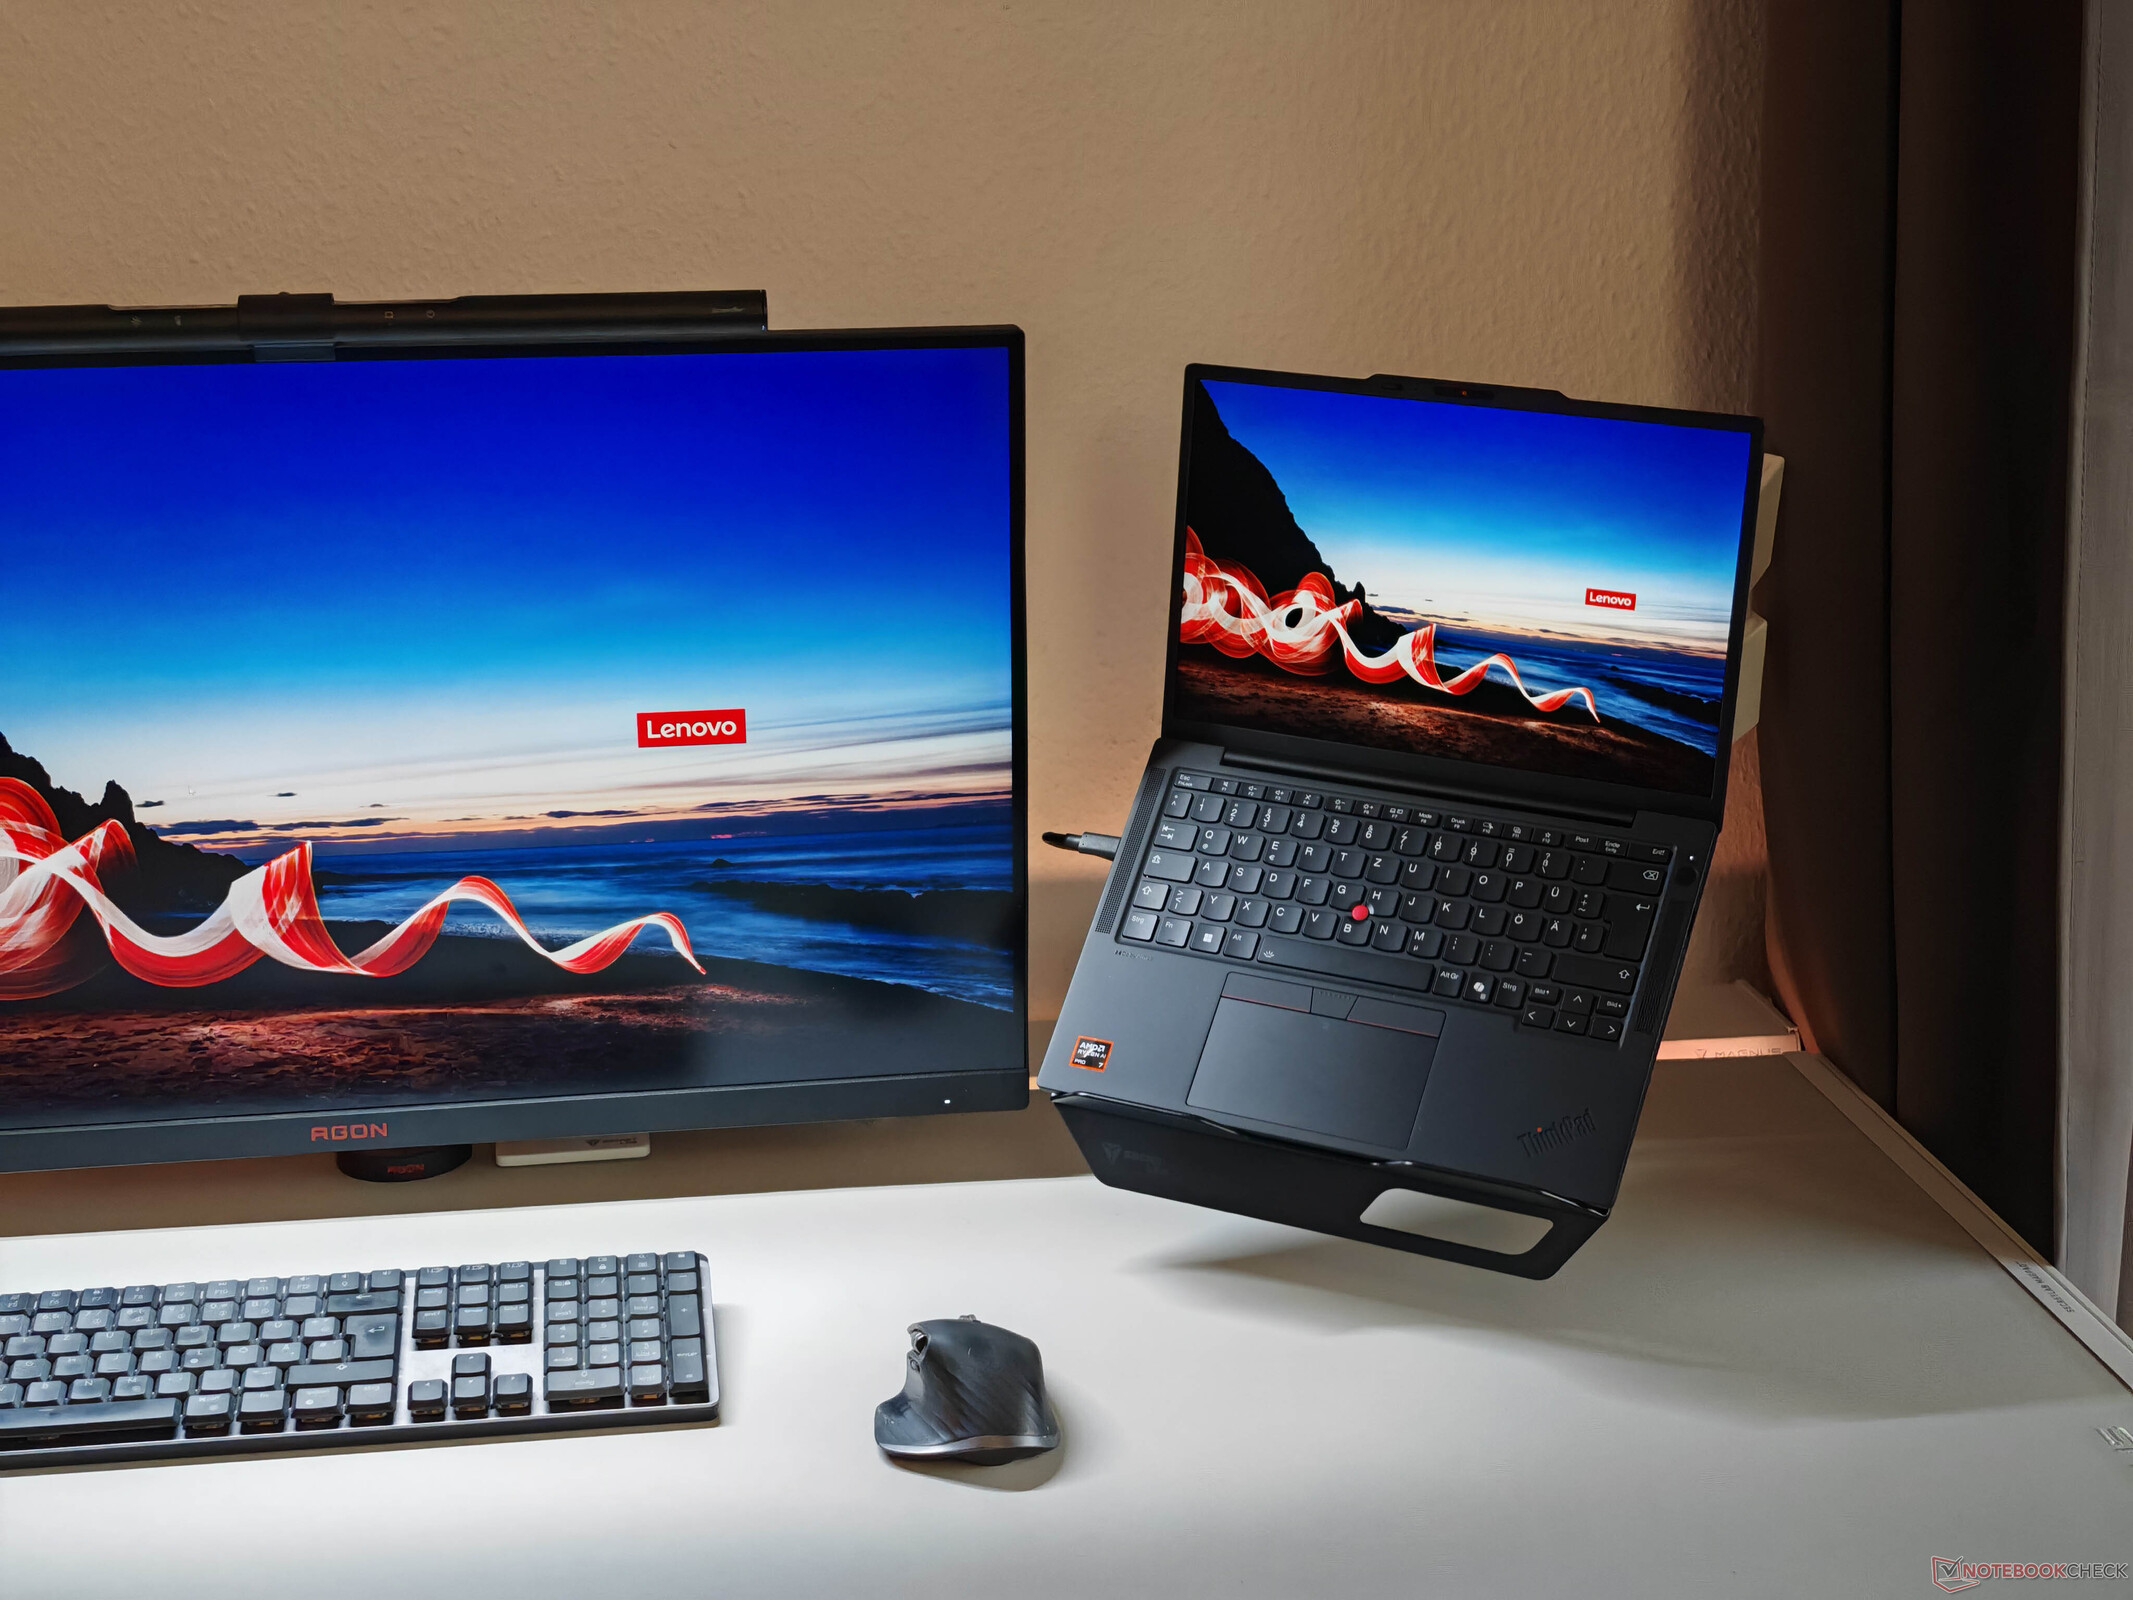
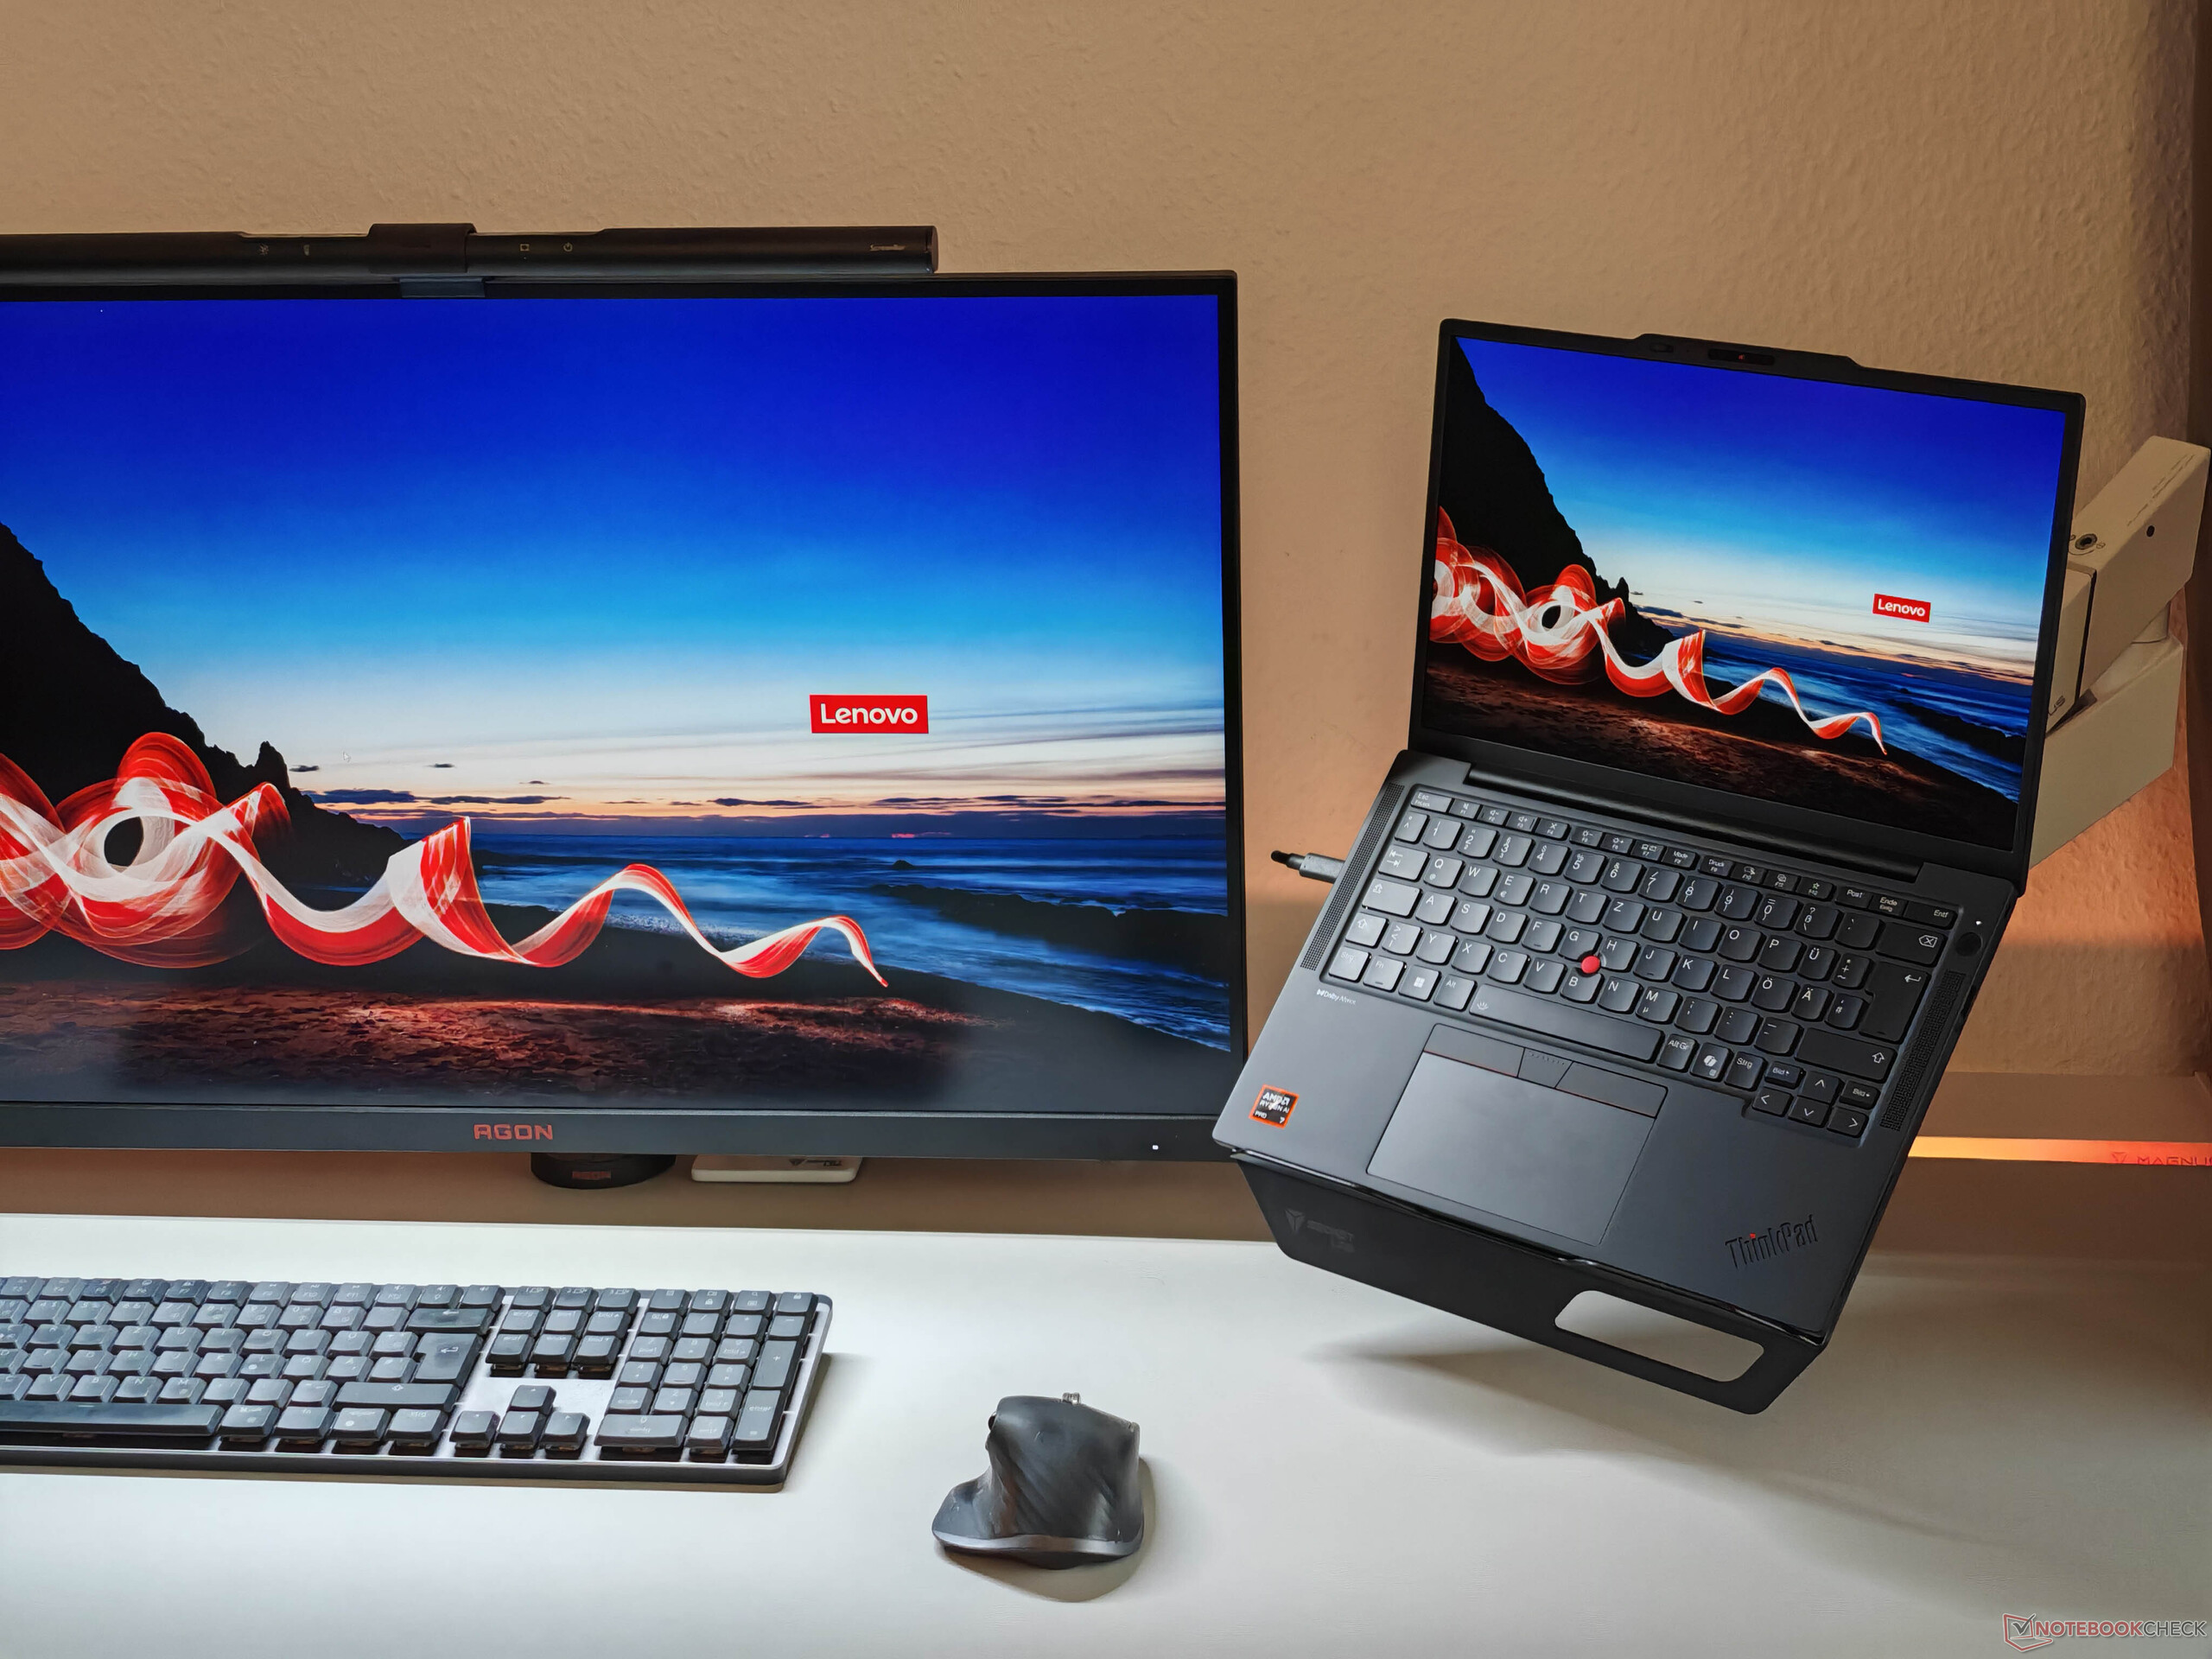
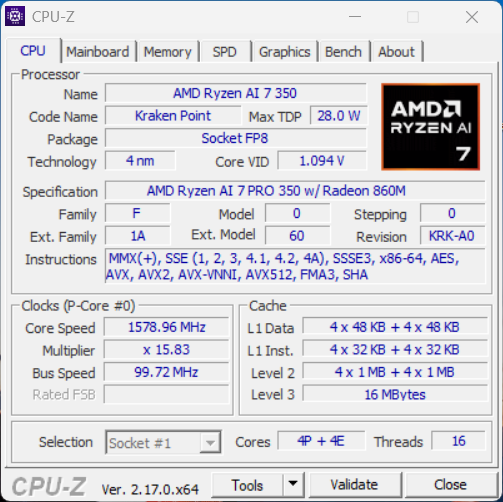
Con il ThinkPad X13, Lenovo offre un computer portatile business molto compatto, completamente riprogettato per la sesta generazione. L'attenzione è ora rivolta a una migliore mobilità e i modelli con processori Intel pesano meno di 1 kg. Per evitare la sovrapposizione con il ThinkPad X1 Carbon nella line-up di Lenovo, il ThinkPad X13 ha un prezzo notevolmente inferiore e parte da circa 1.300 euro. La nostra unità di recensione, equipaggiata con un AMD Ryzen AI 7 PRO 350, 32 GB di RAM, un modulo 5G e il display IPS Full HD ad alta efficienza energetica, costa 1.855 euro (1.759 euro con il programma Campus).
Specifiche
Telaio e caratteristiche
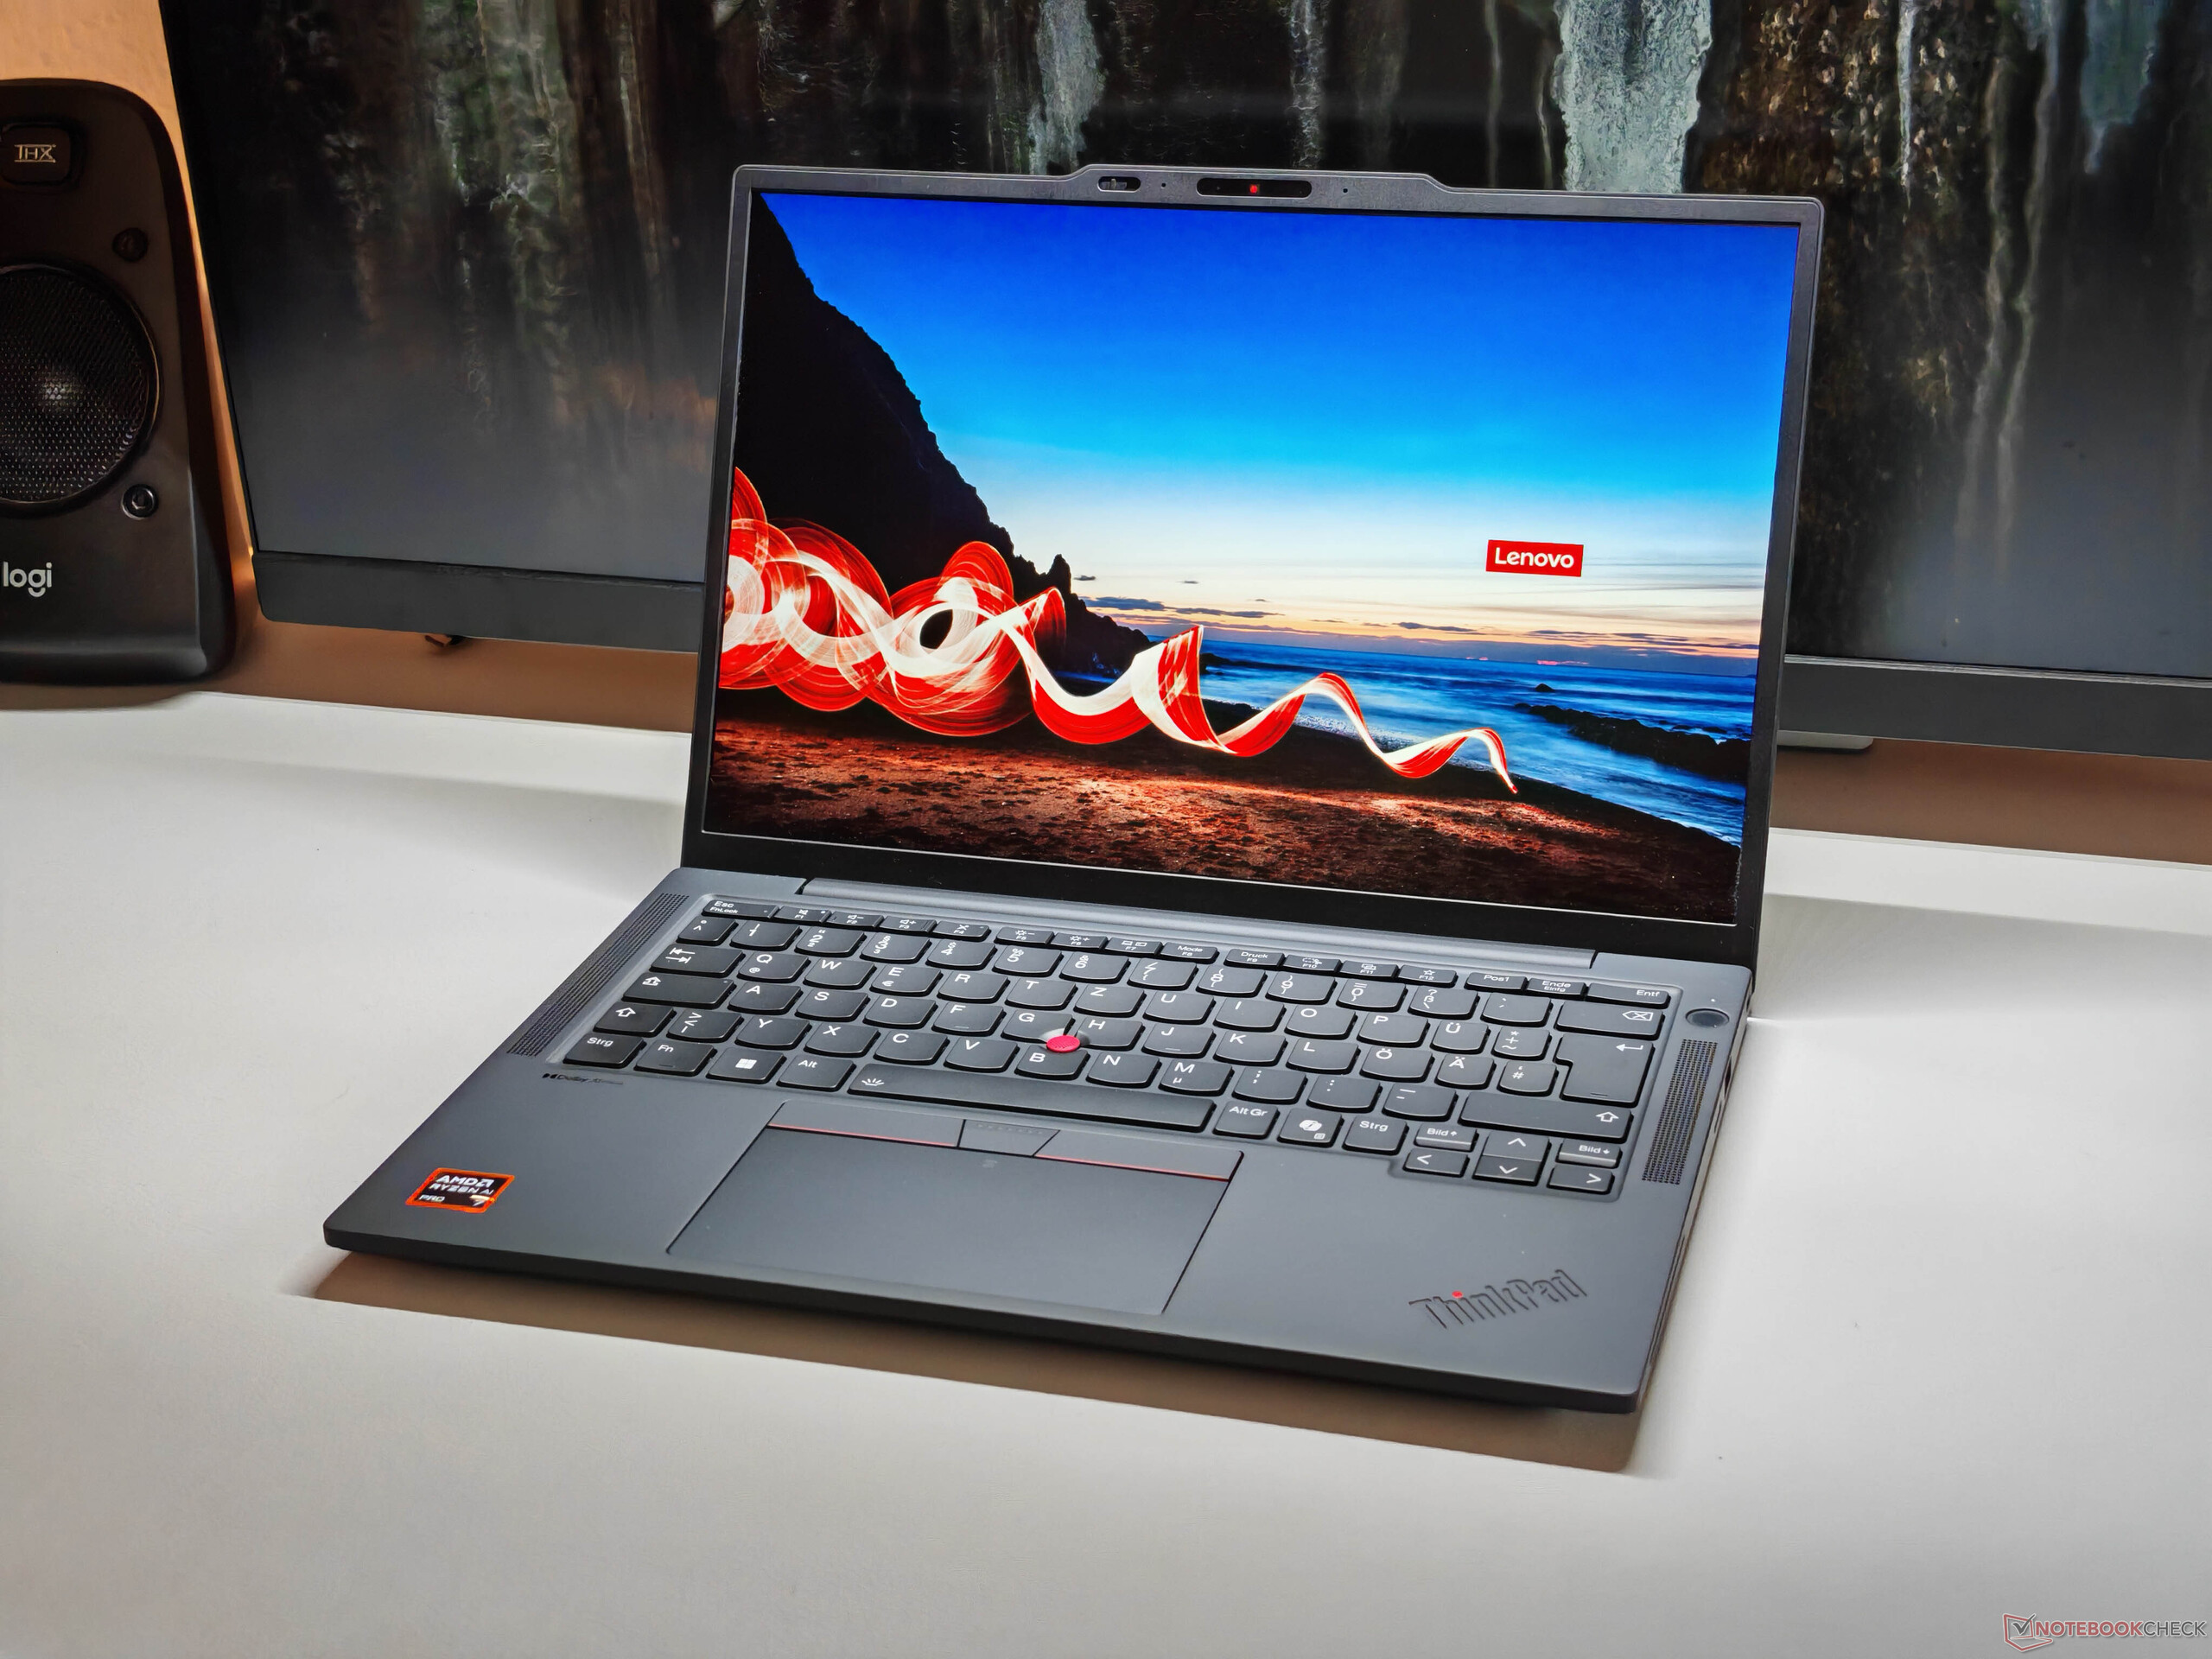
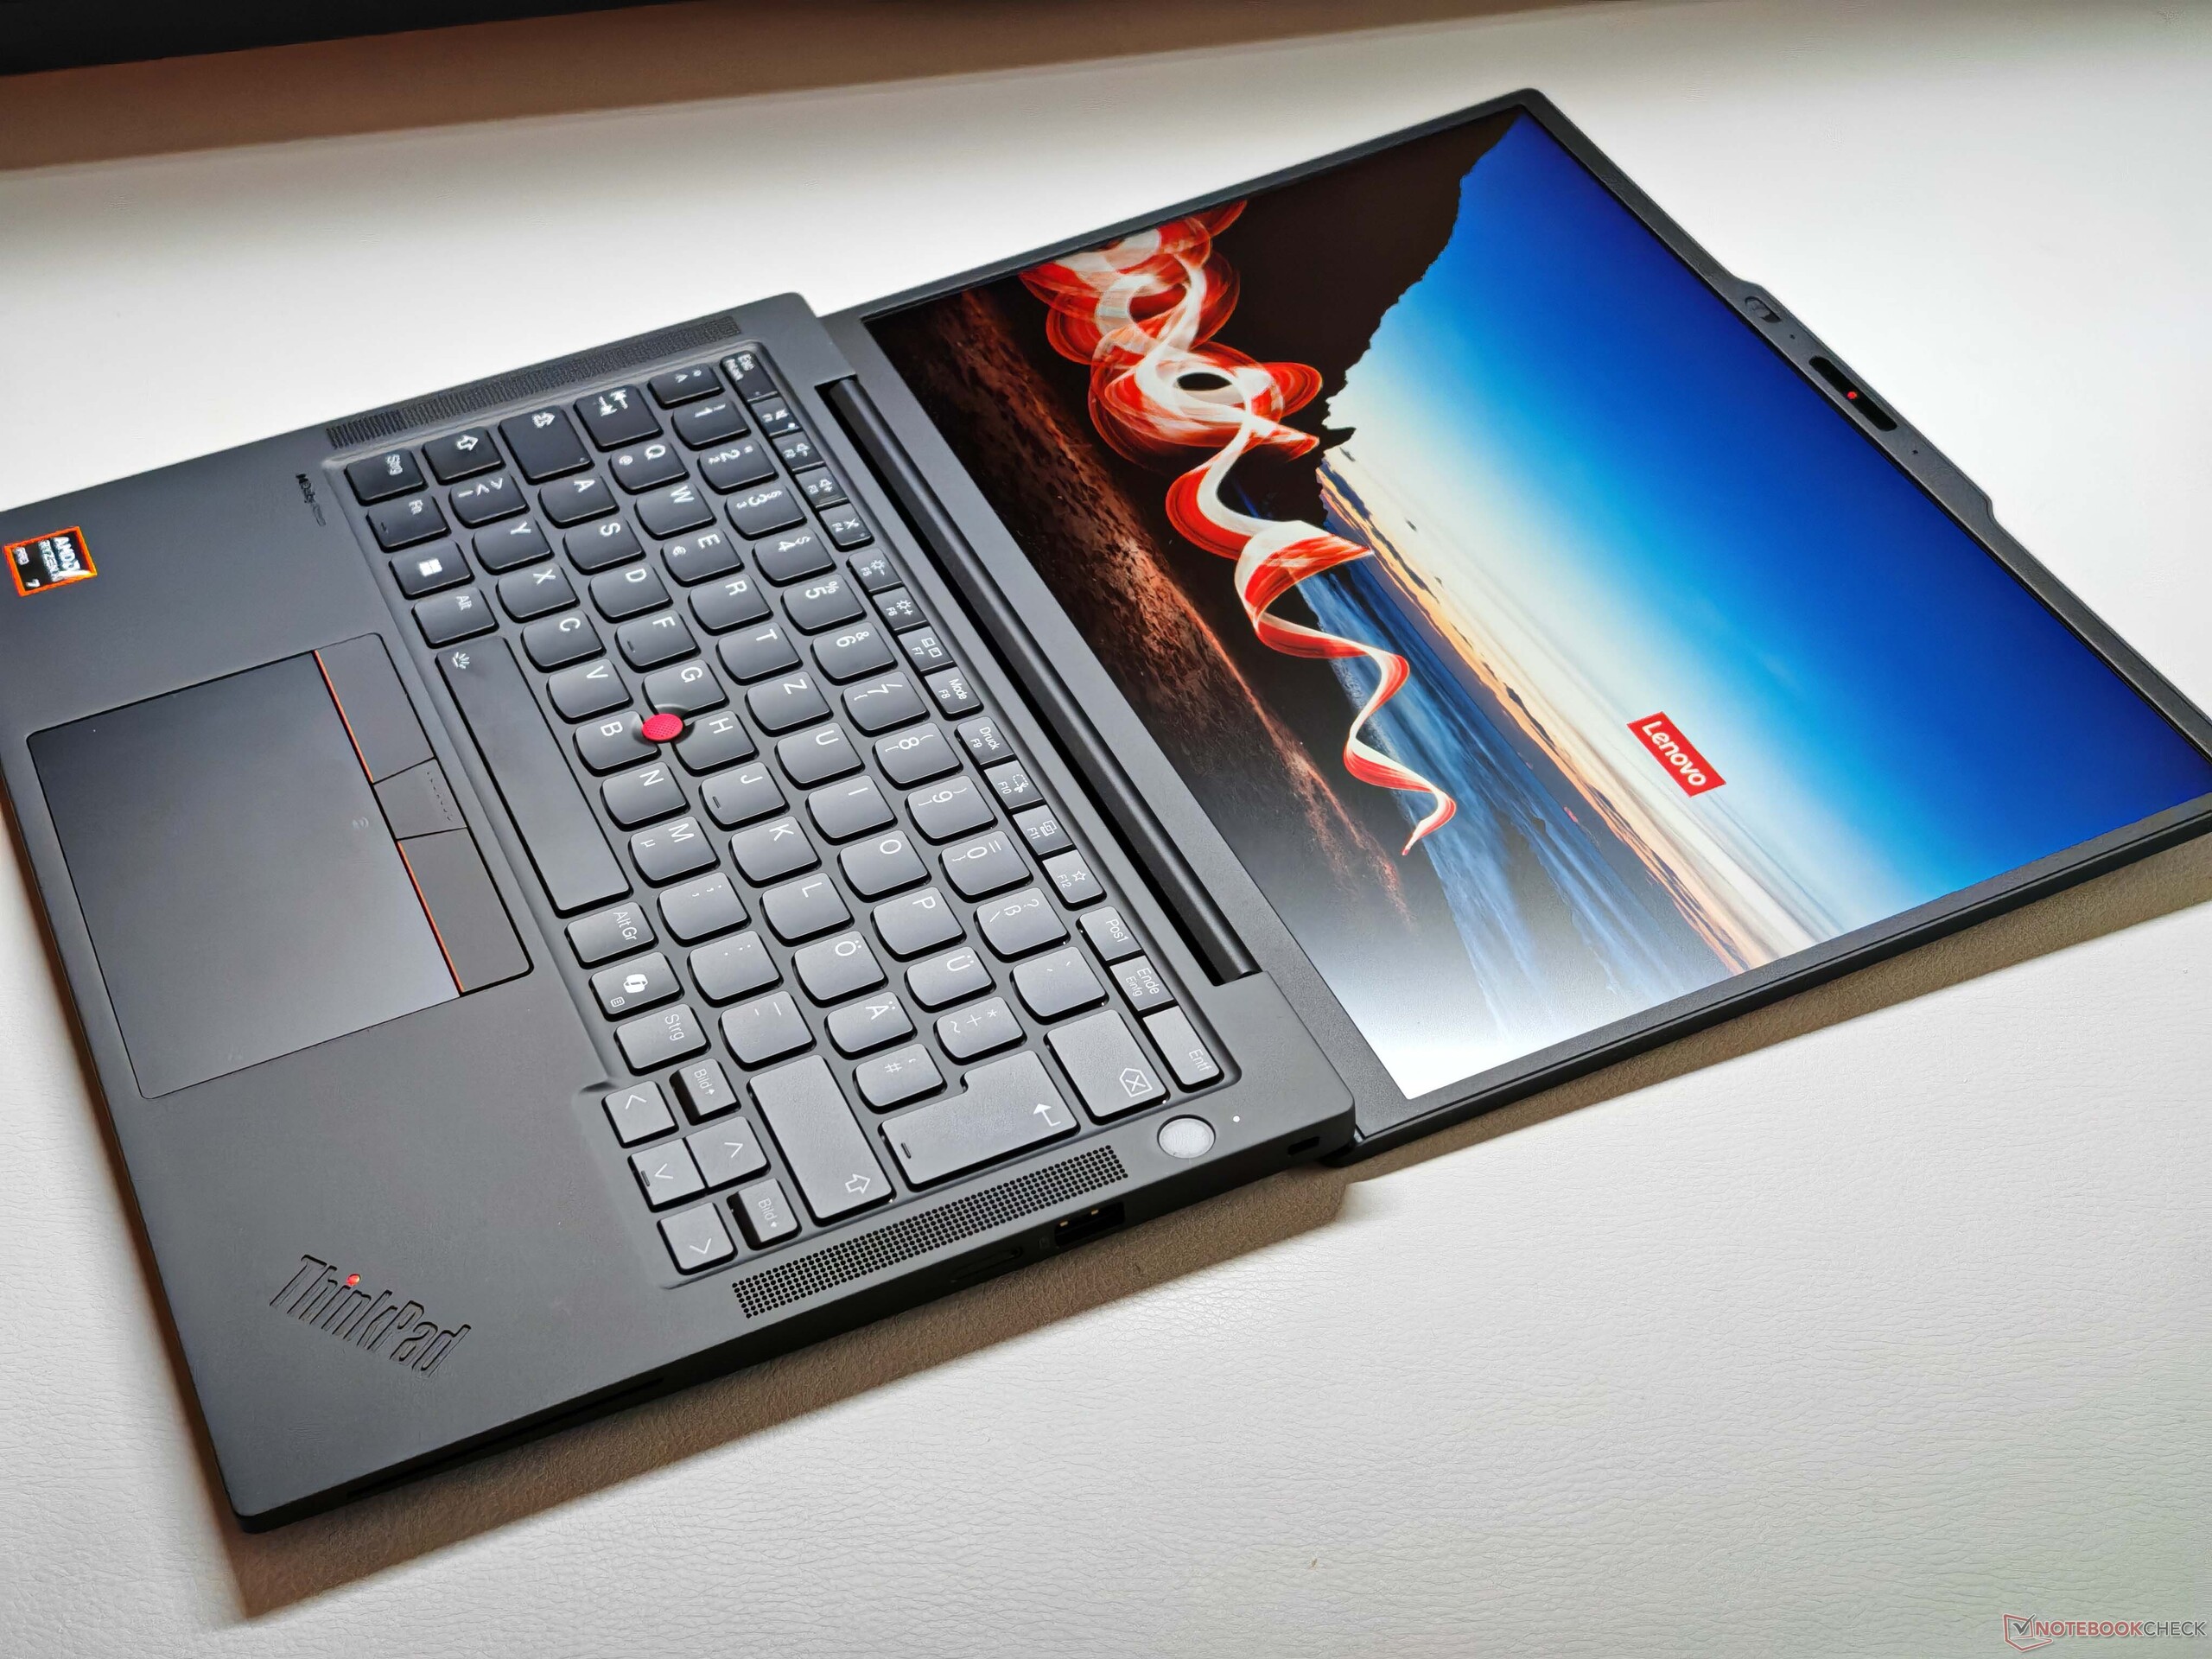
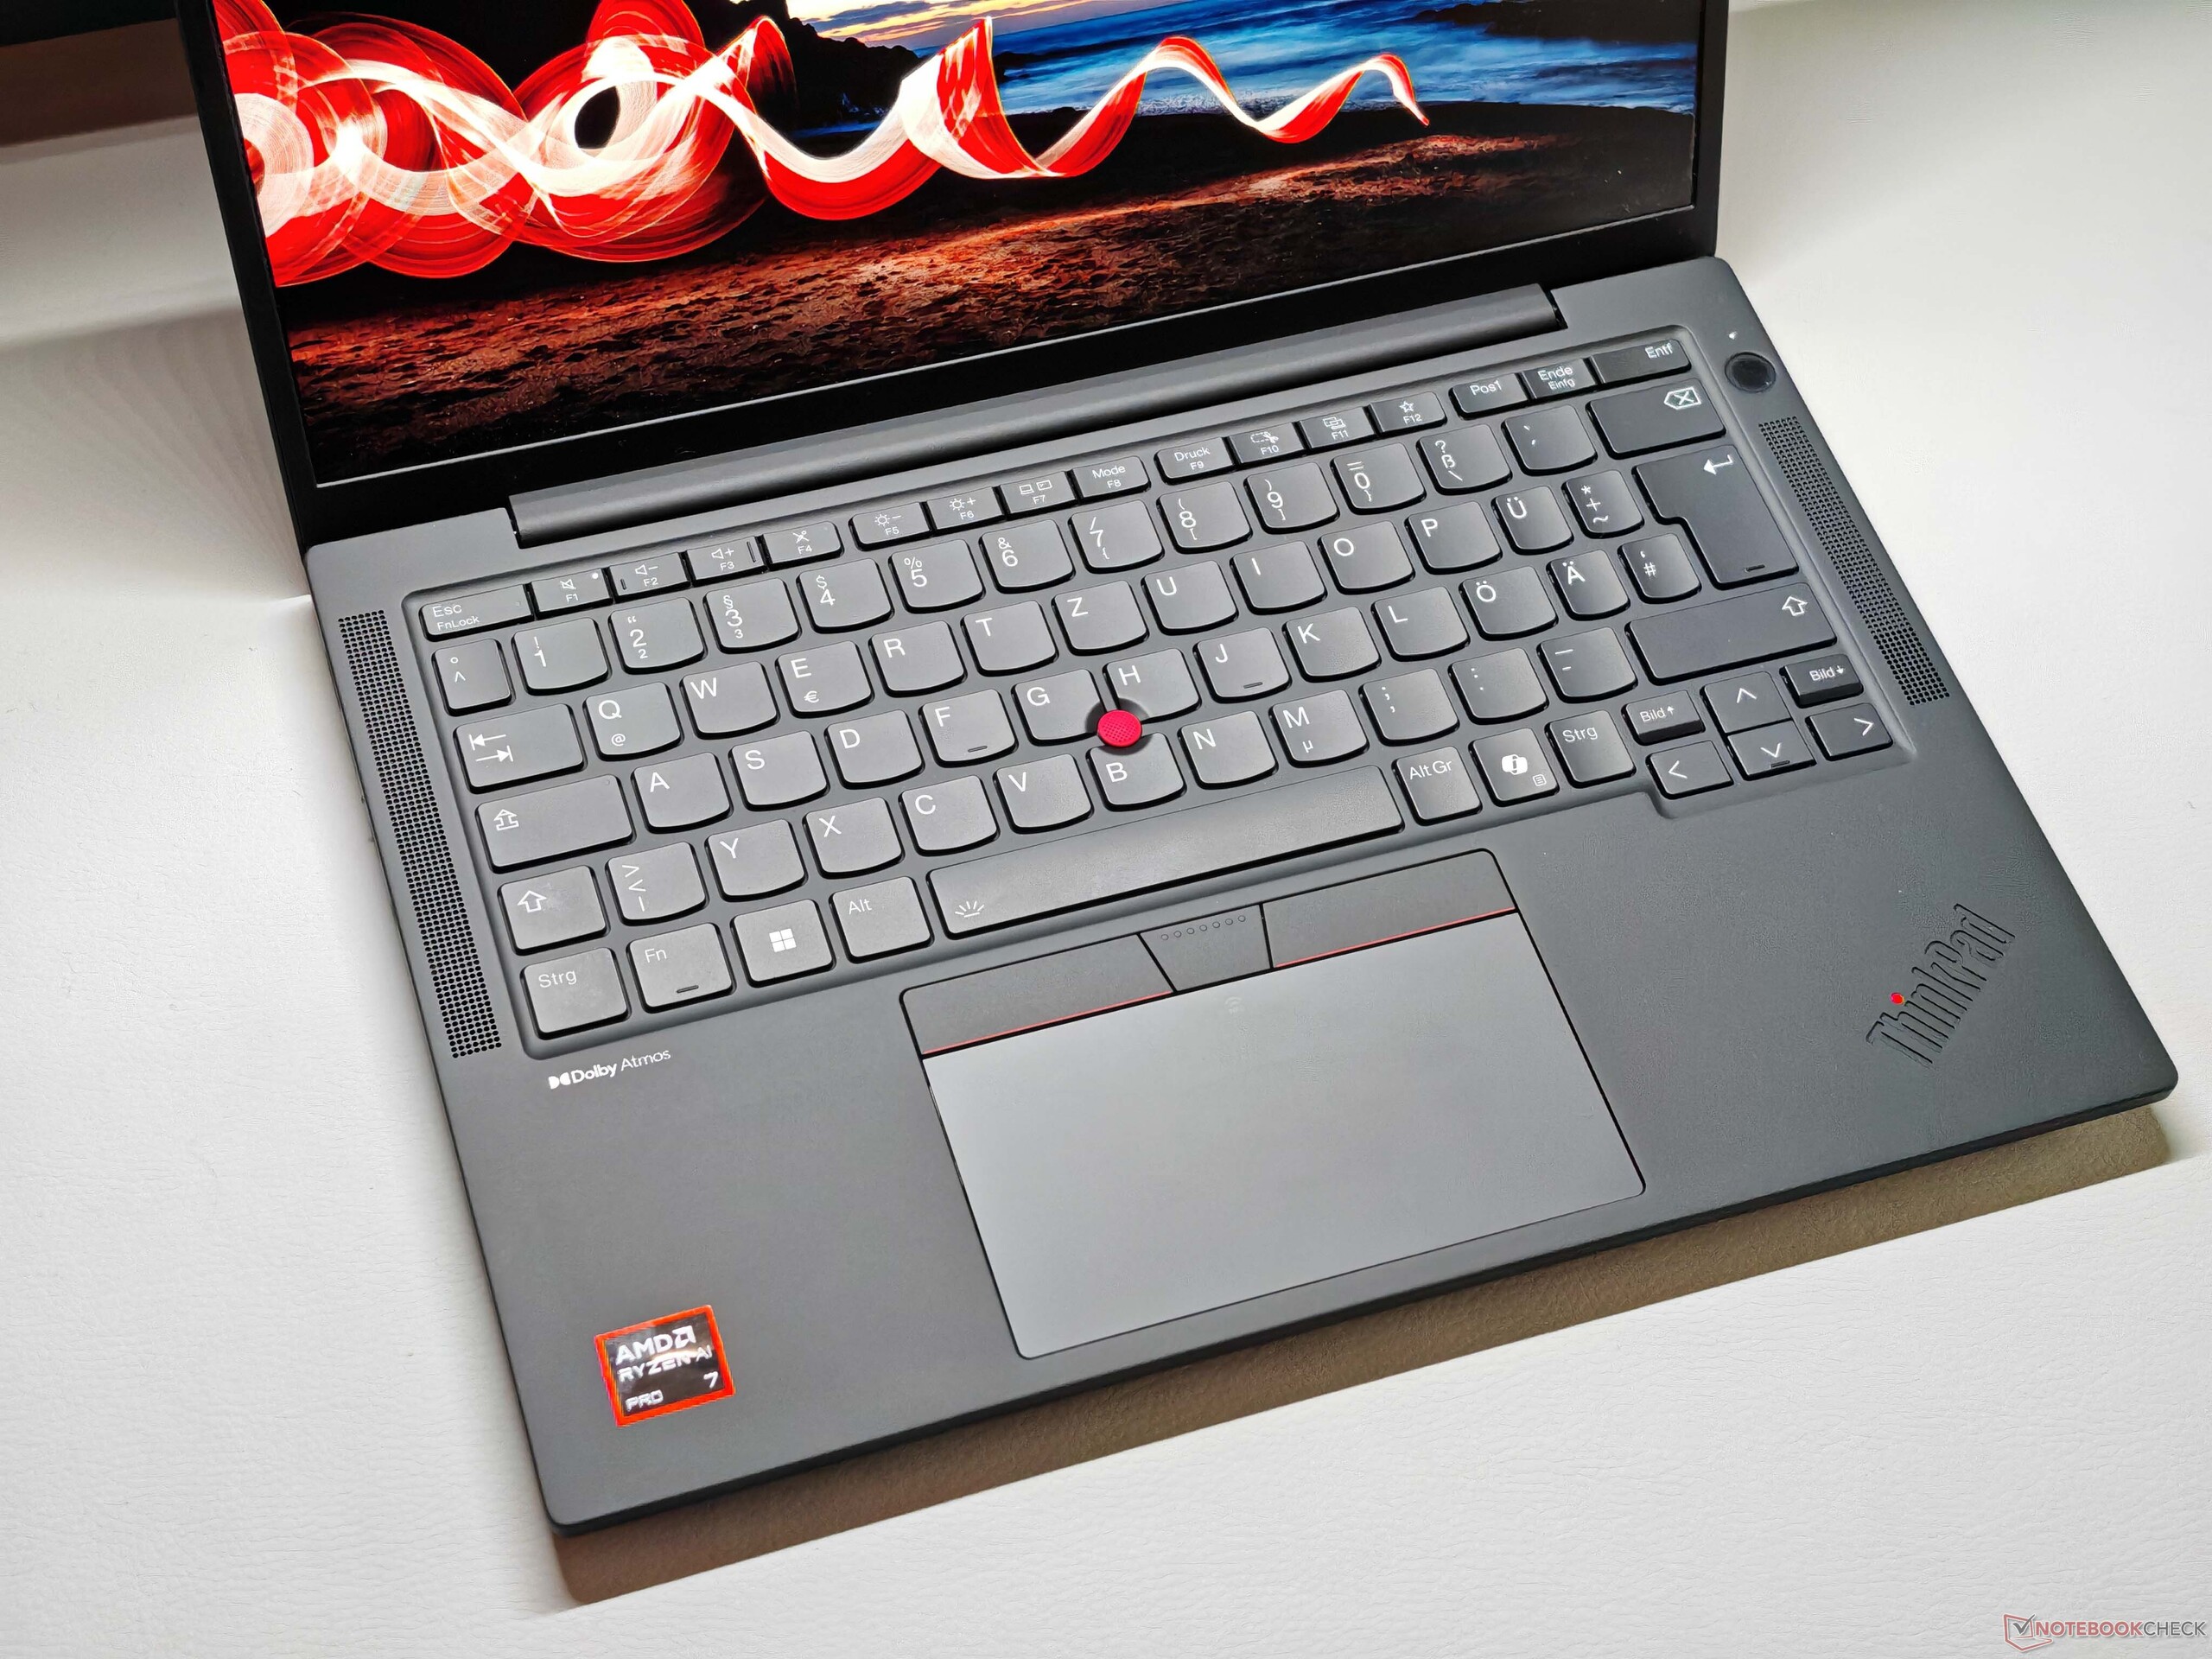
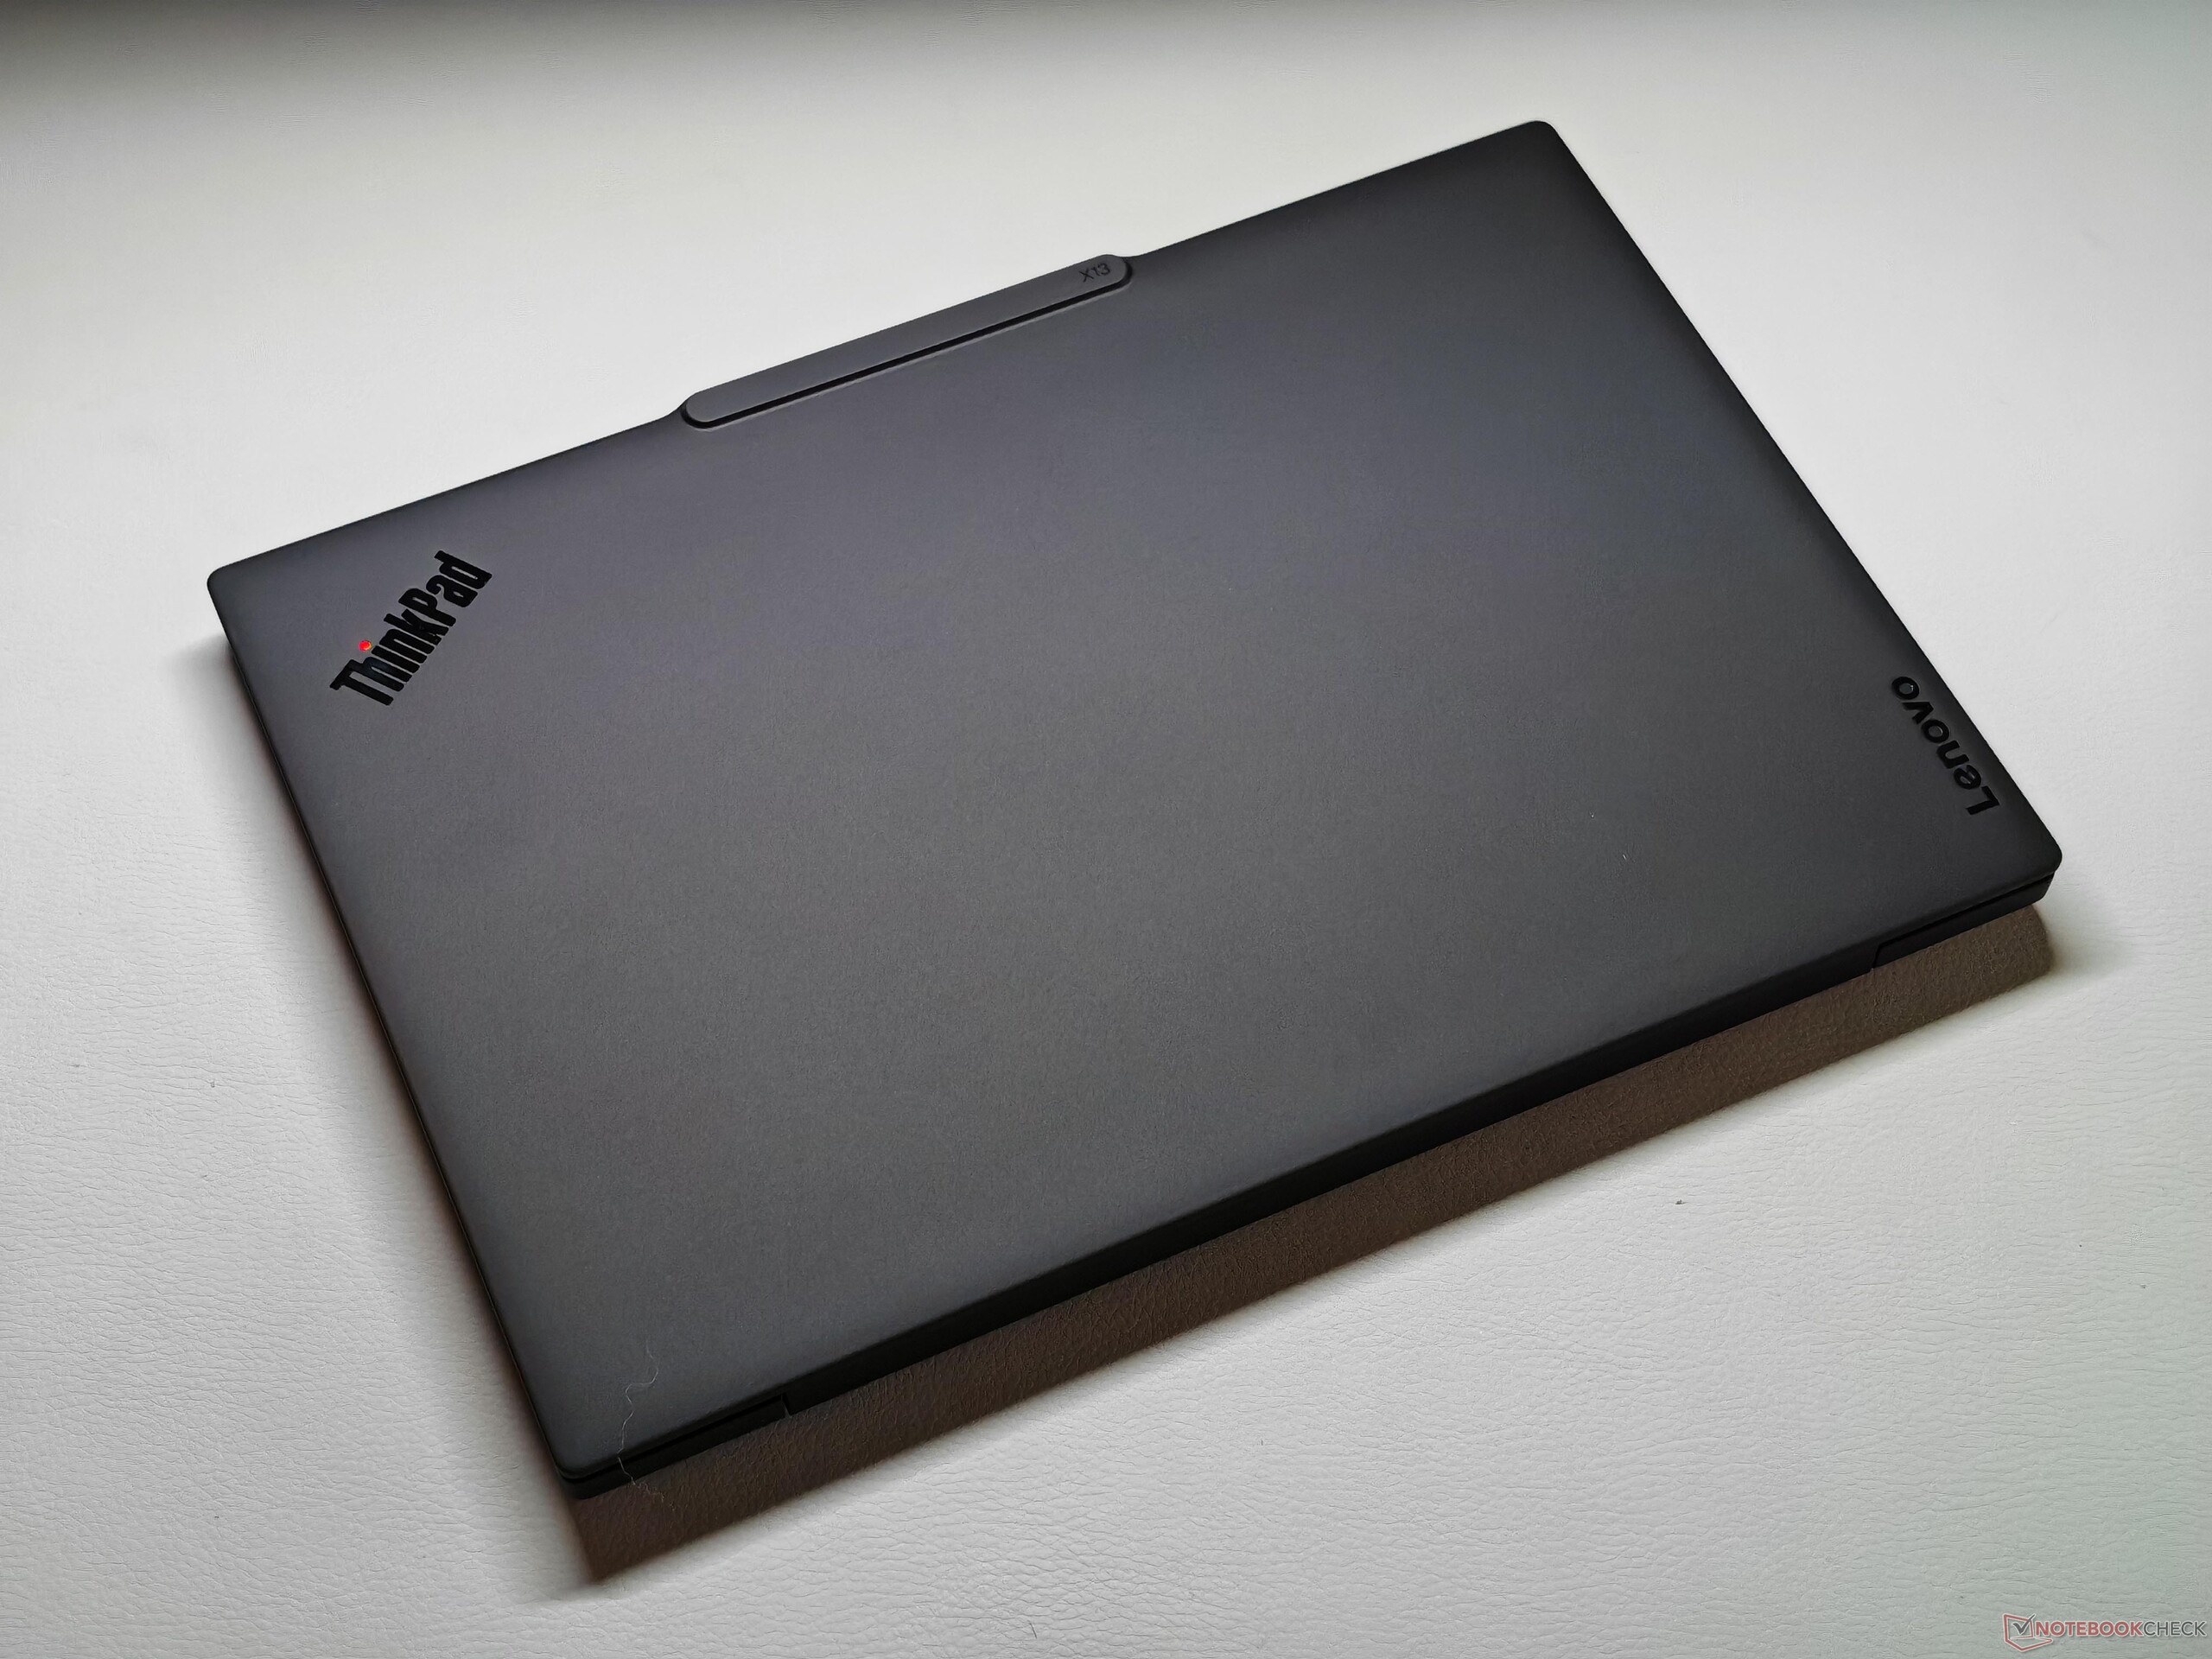
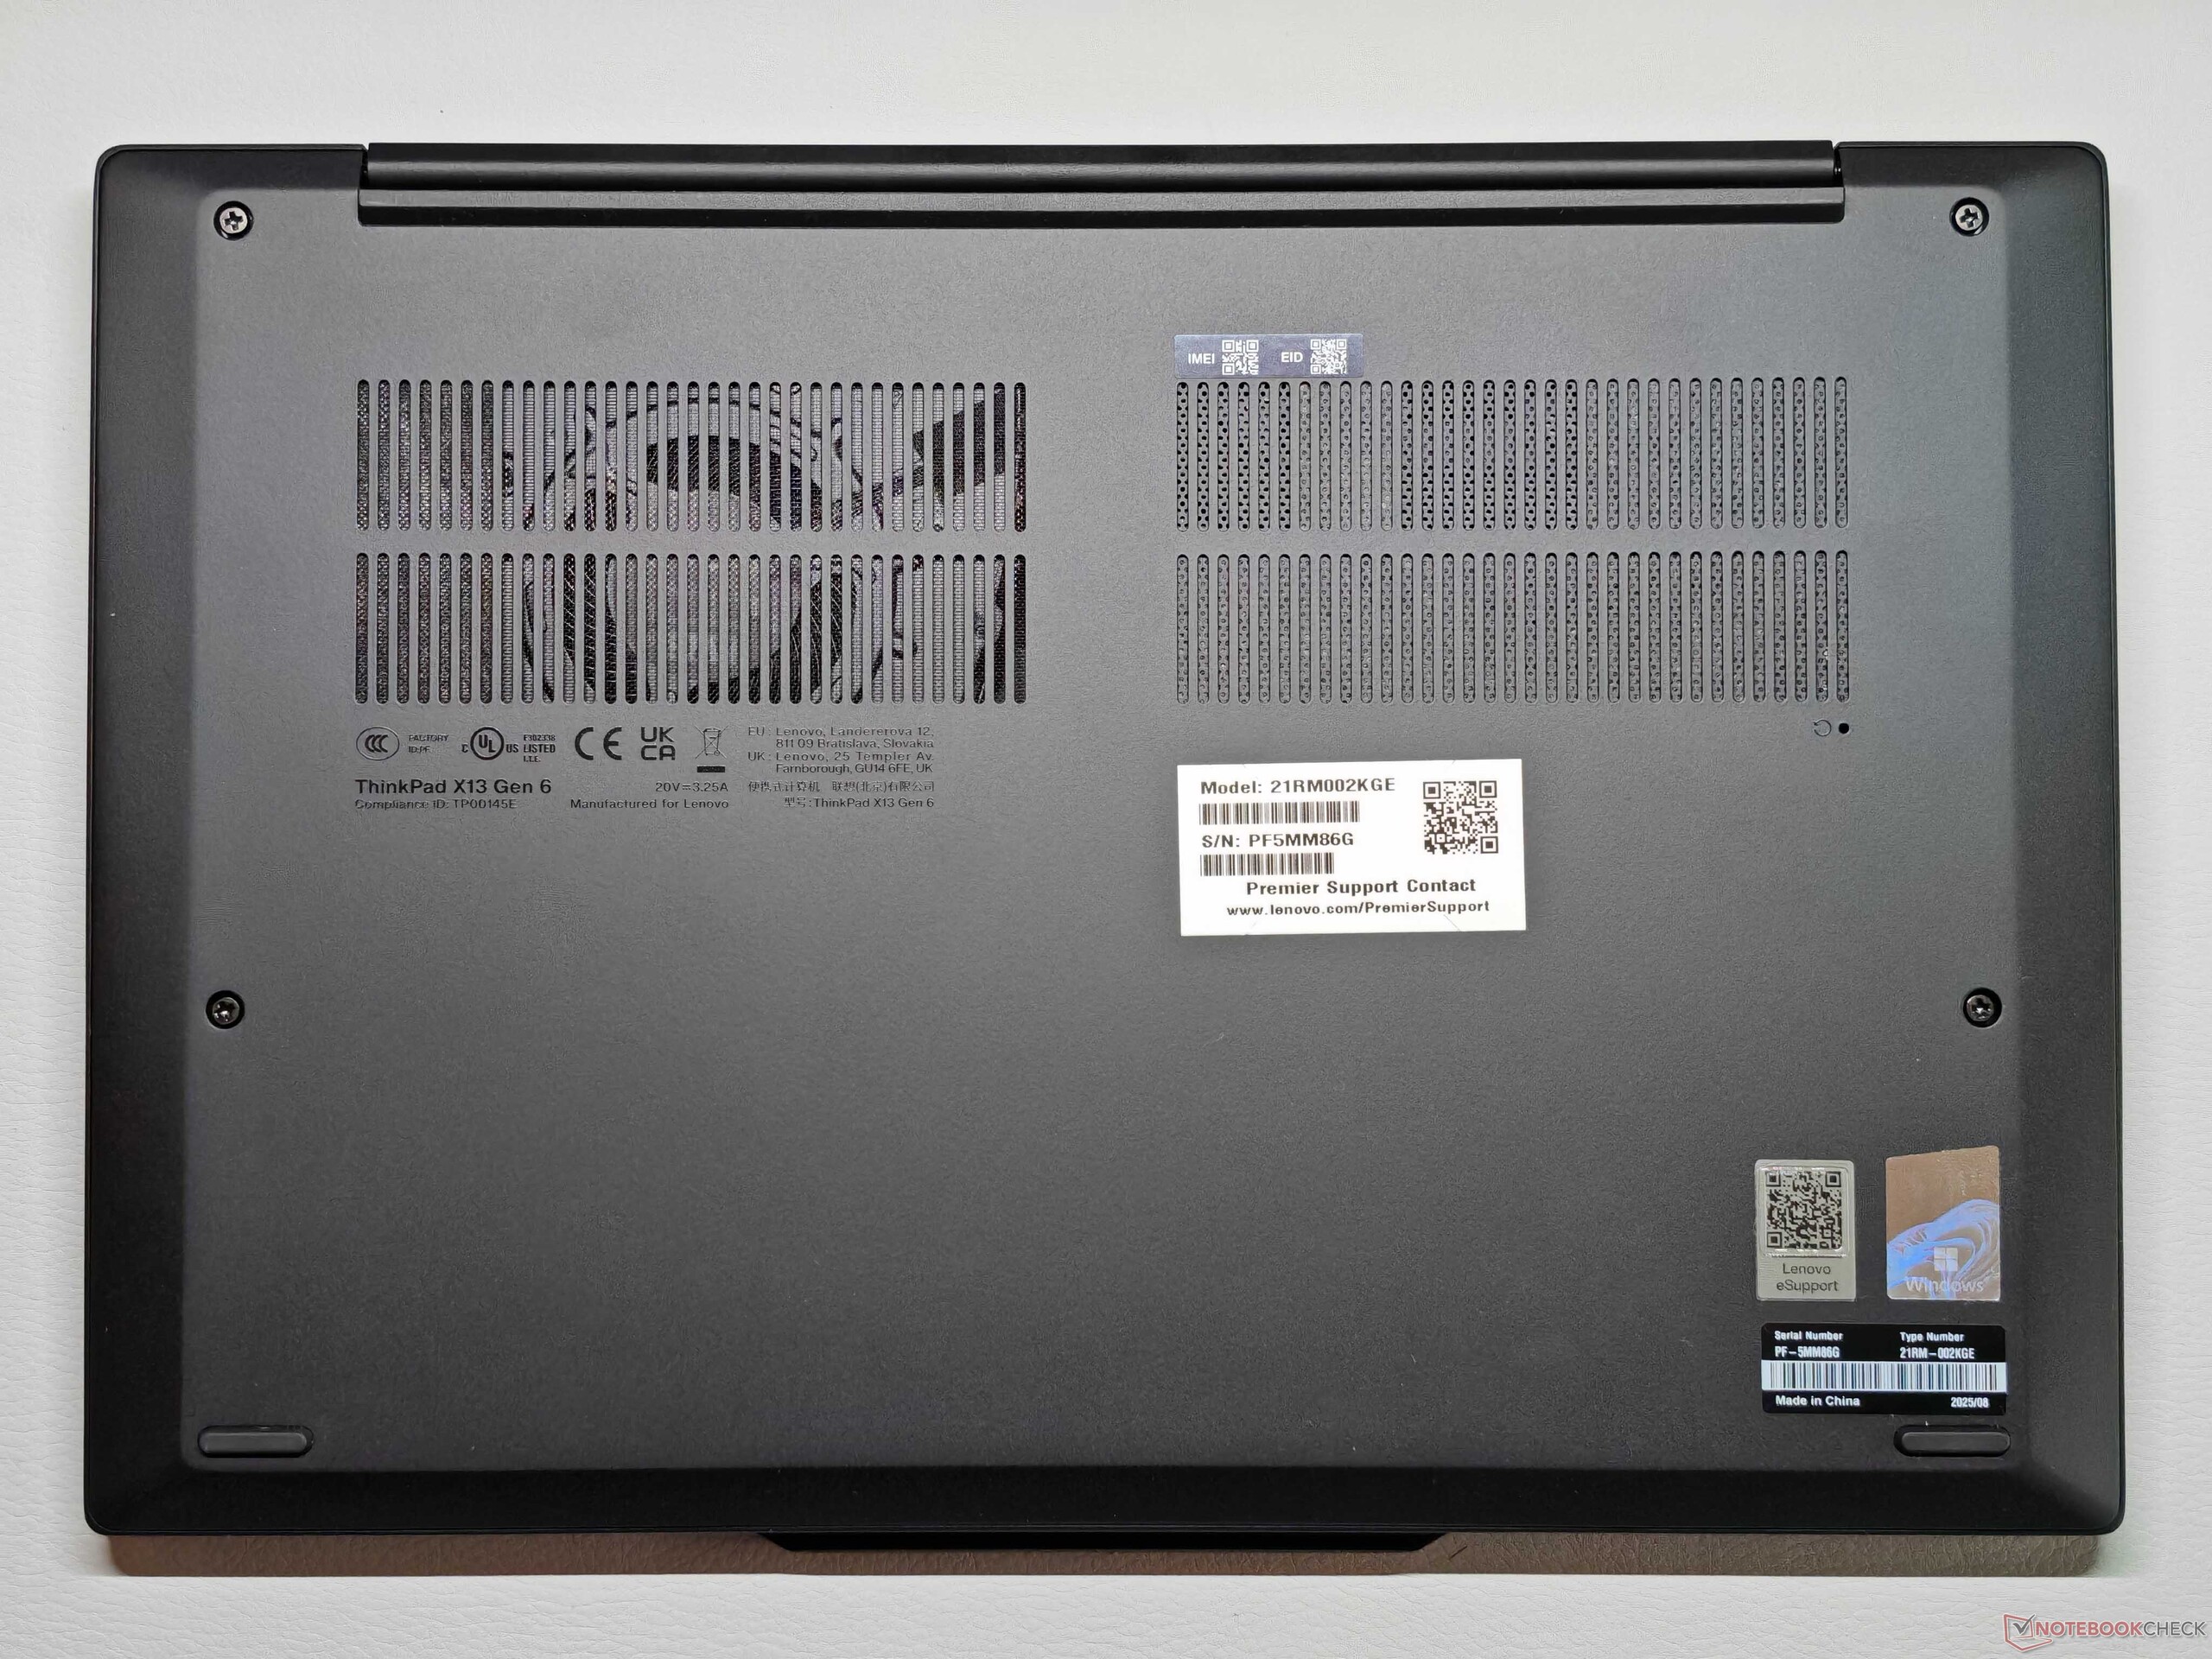
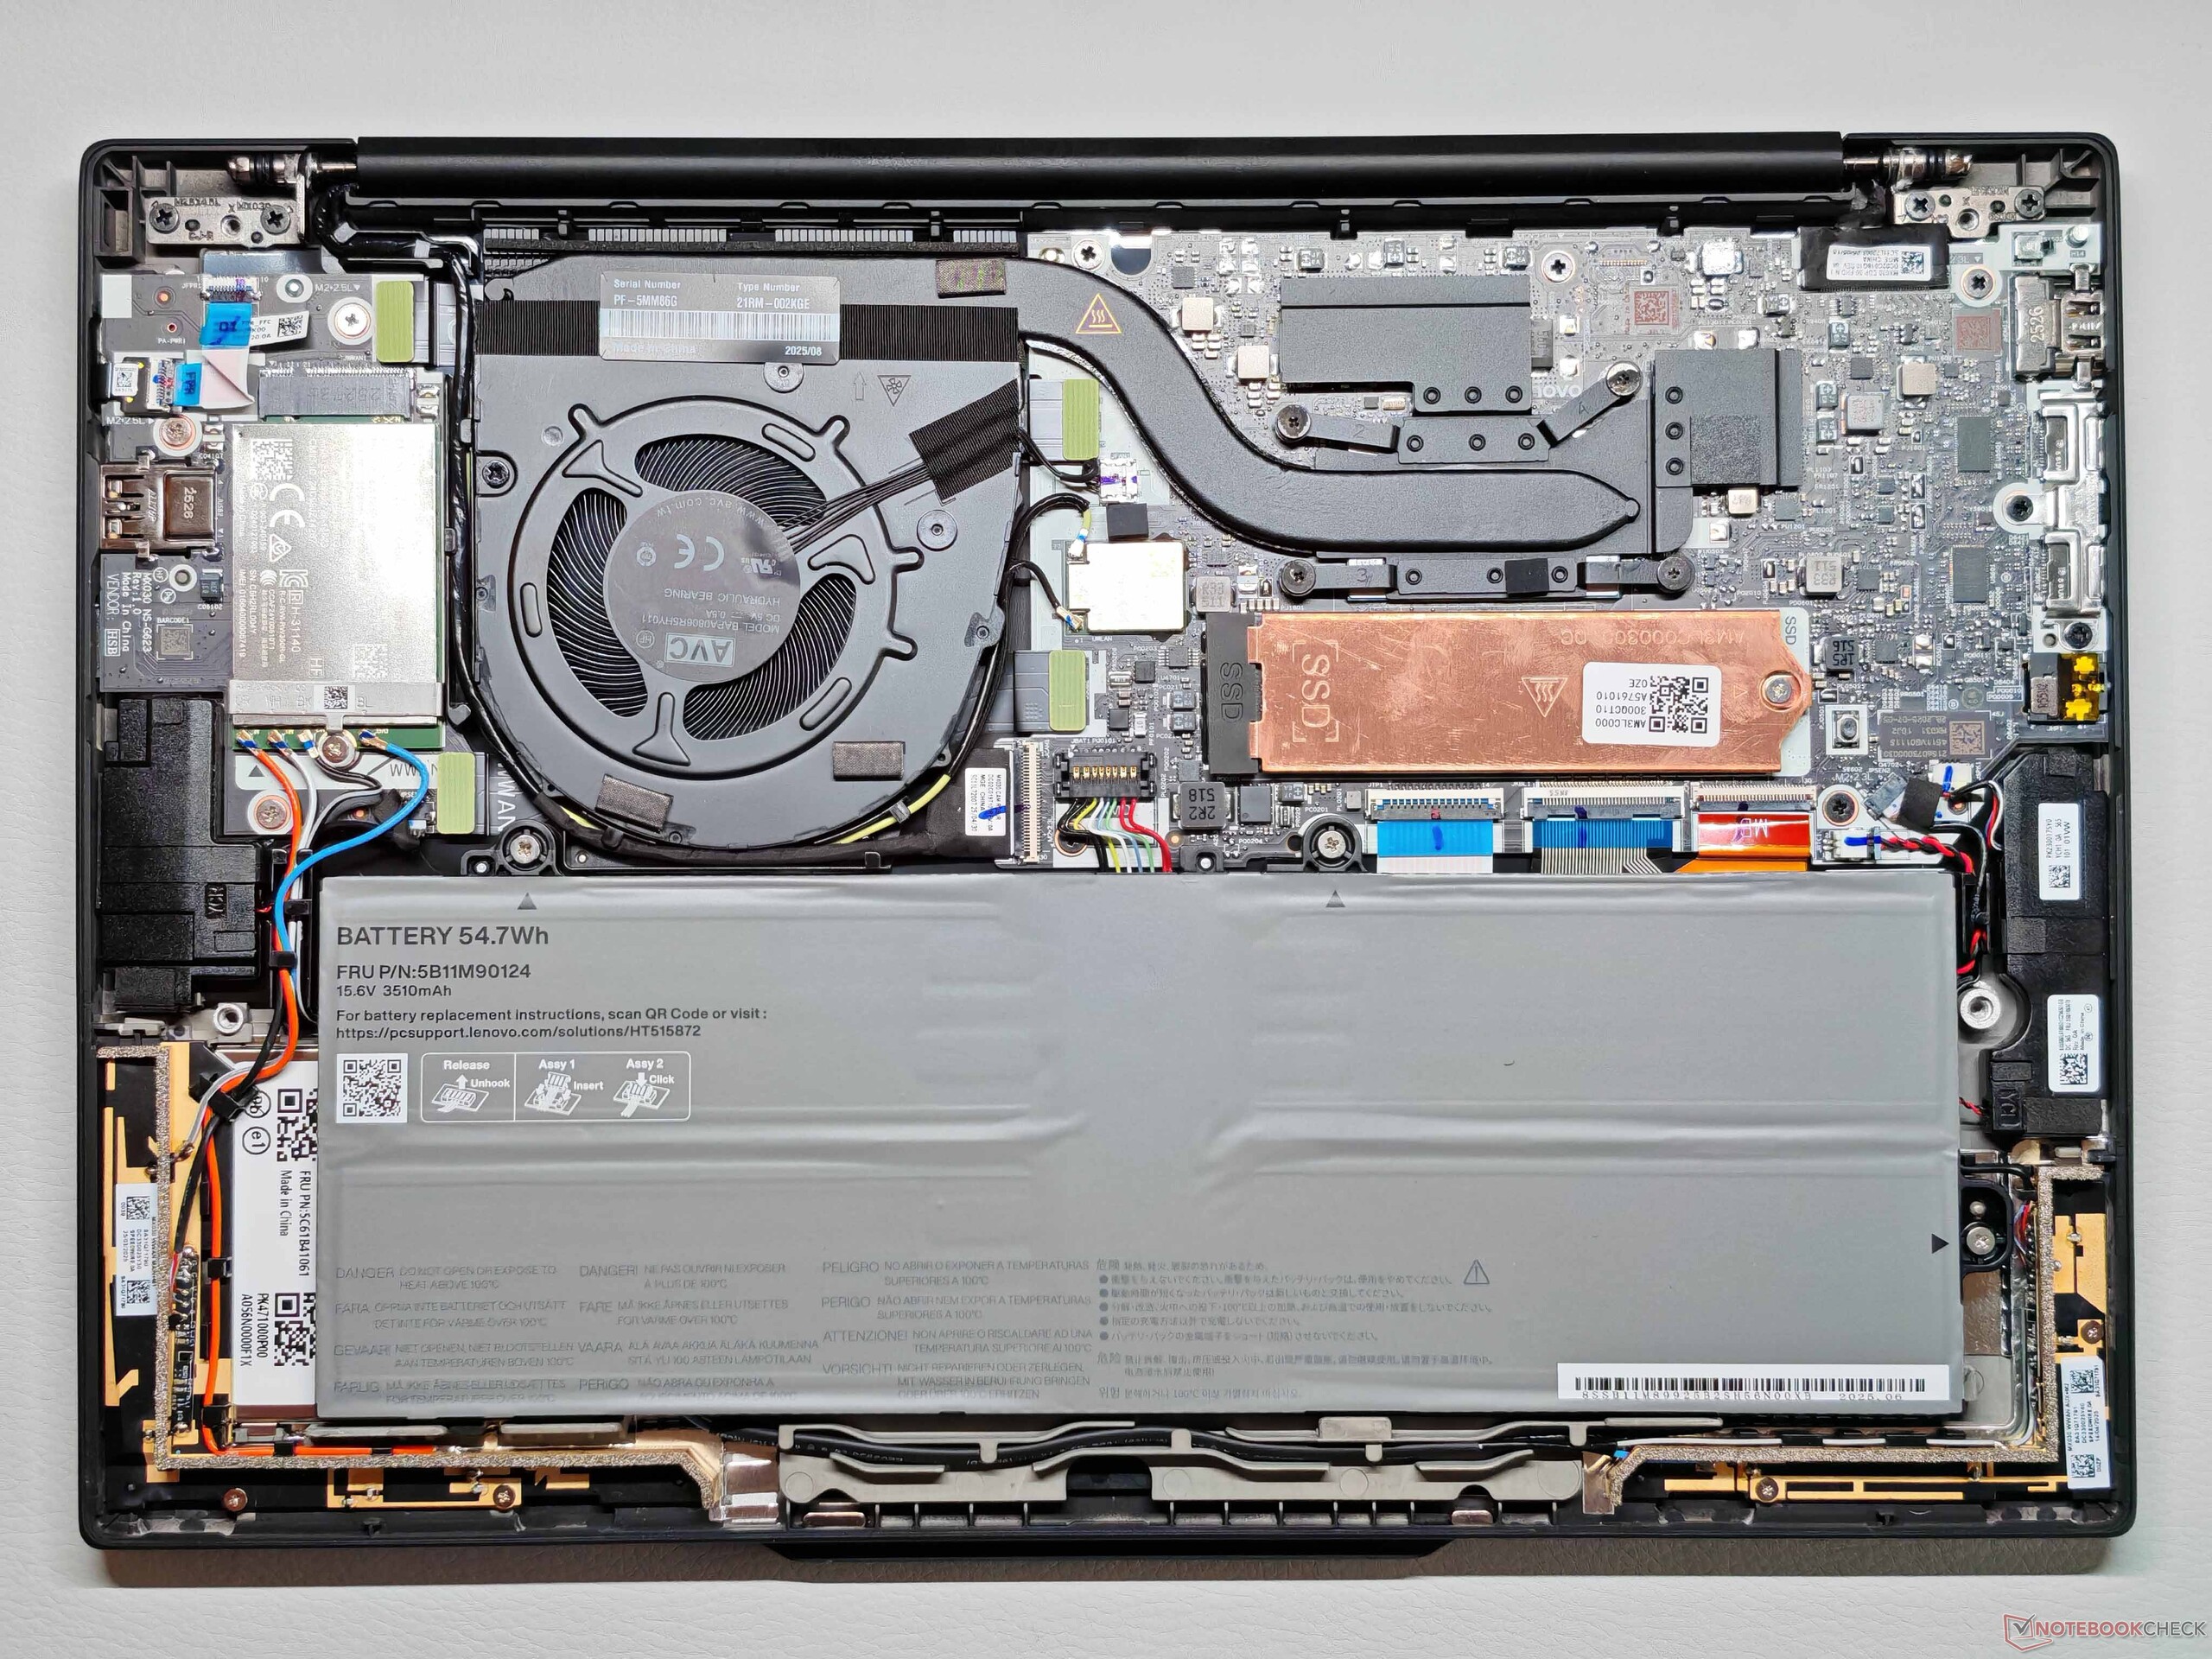
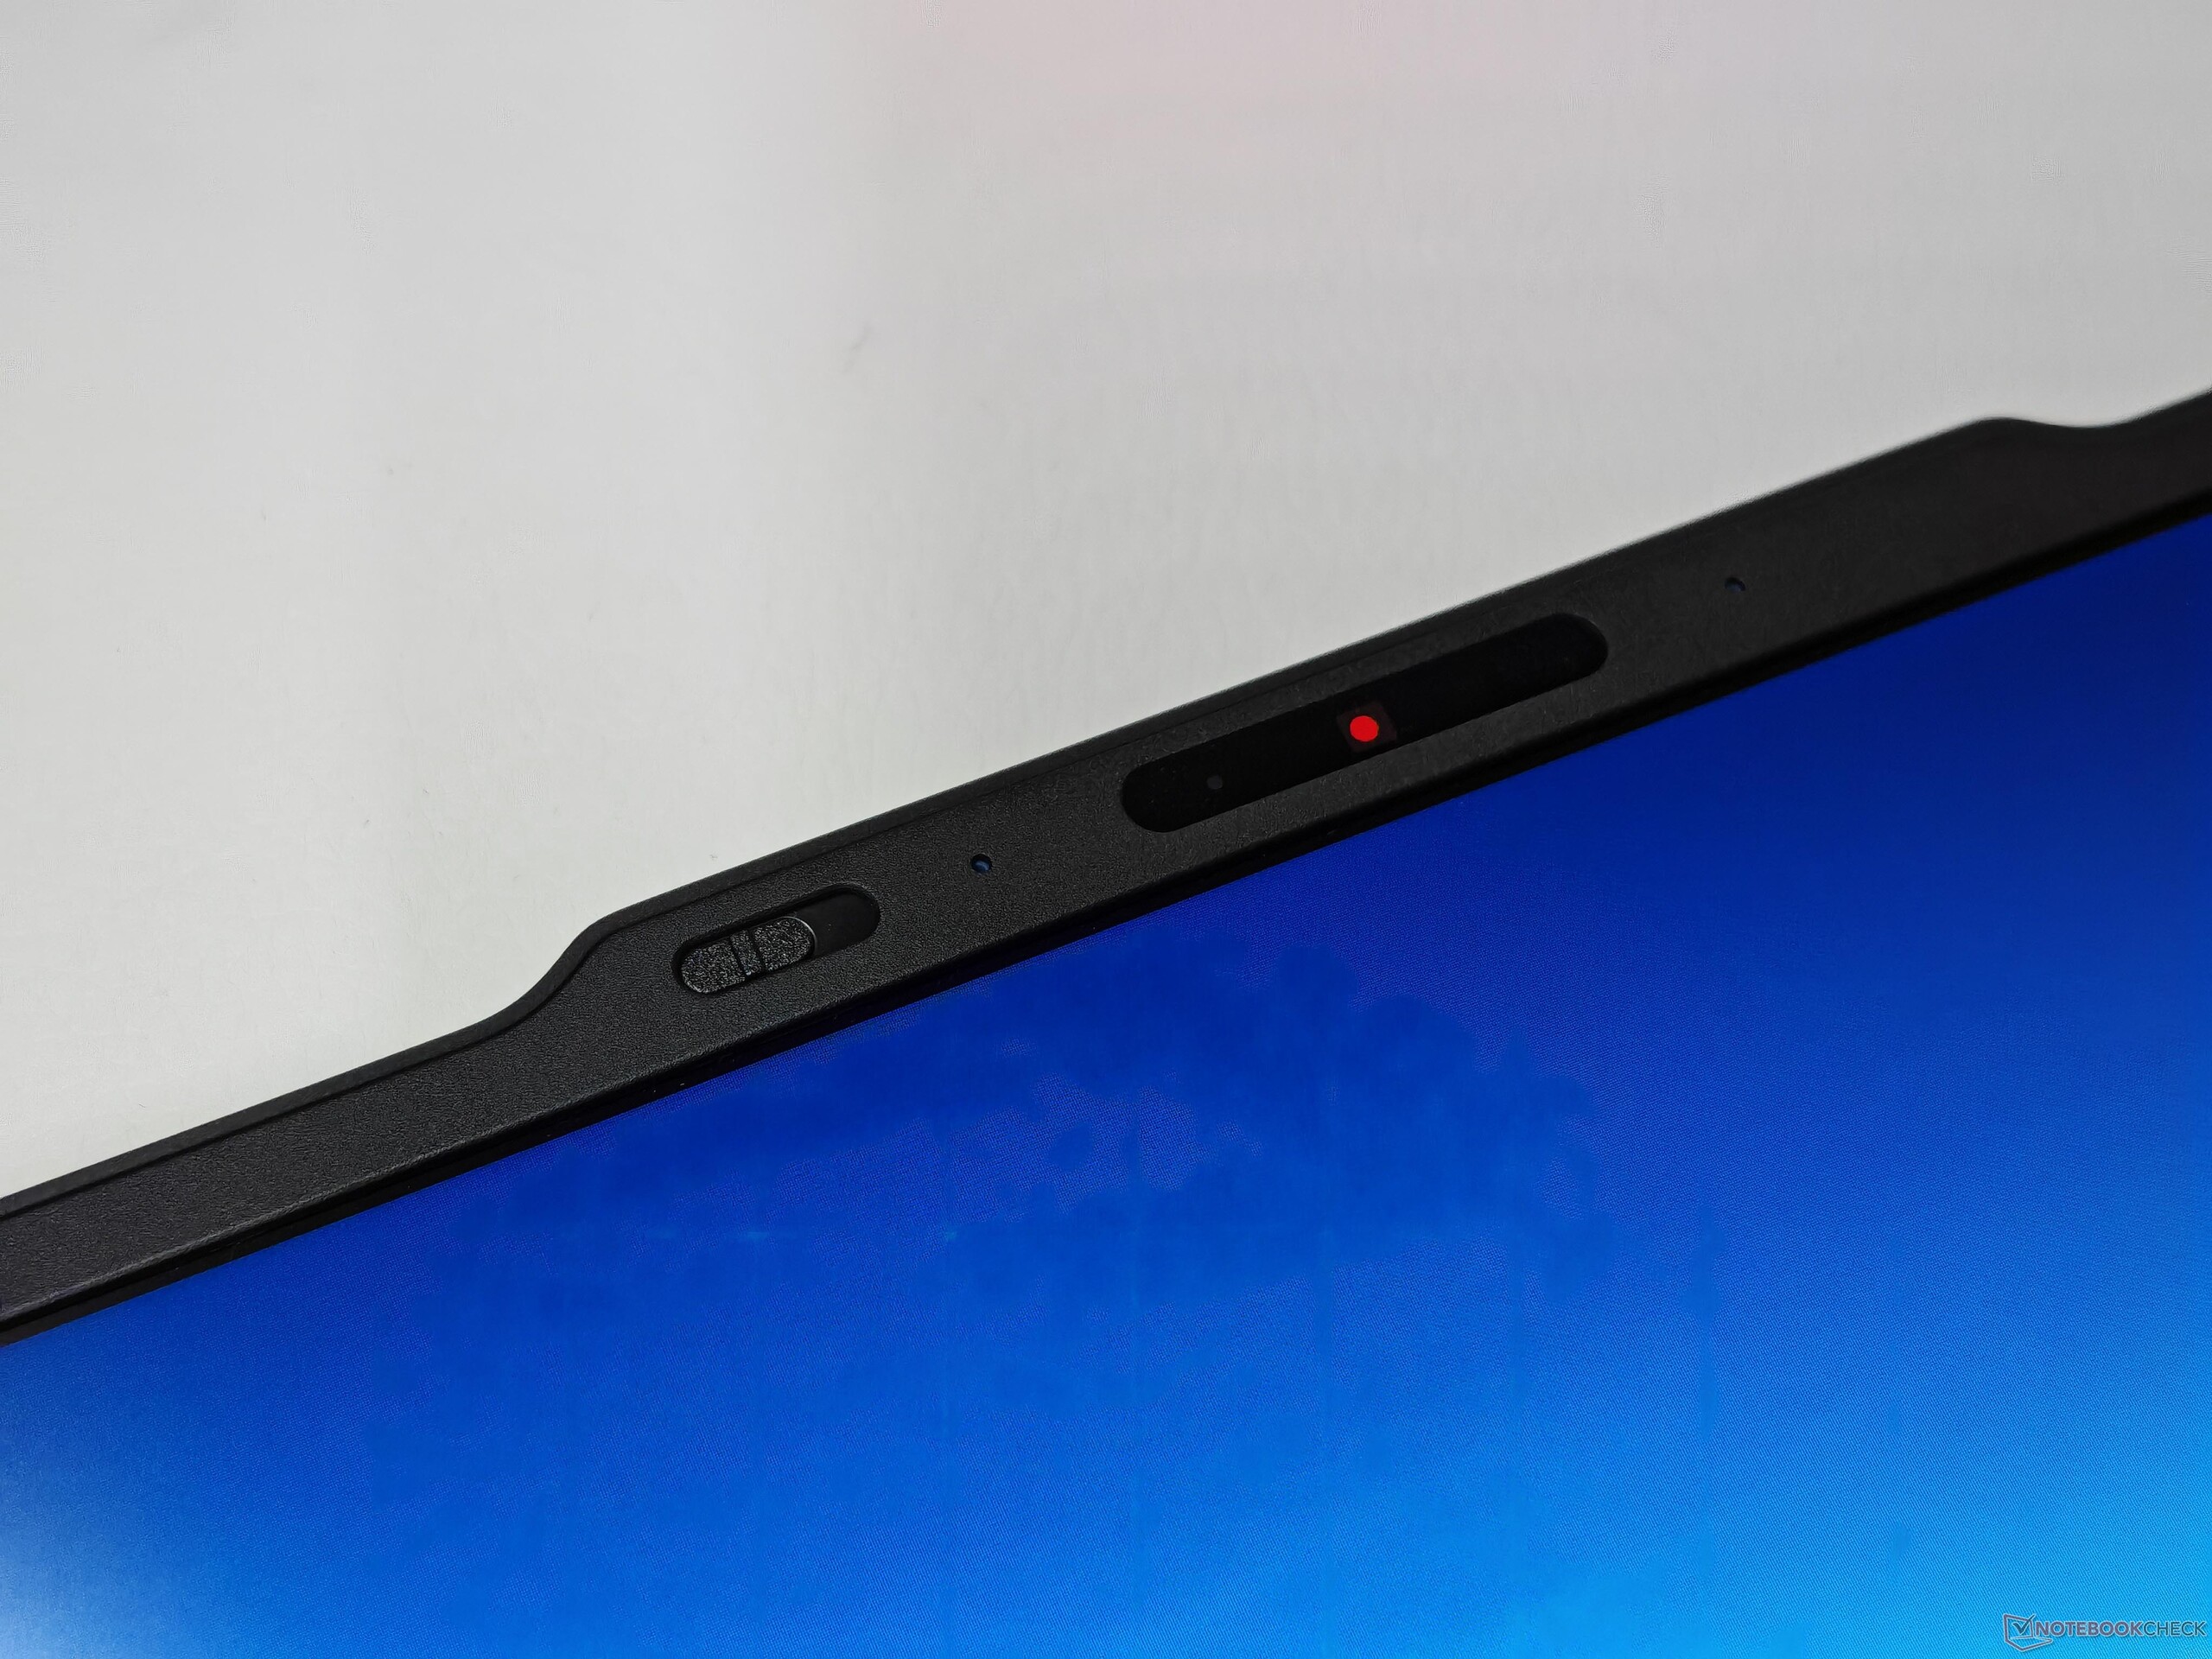
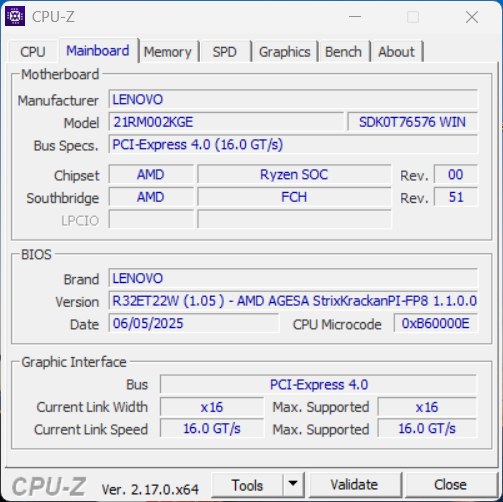
Visivamente, il nuovo X13 G6 è inconfondibilmente un ThinkPad e segue l'attuale linguaggio di design, compreso l'alloggiamento della fotocamera piuttosto prominente. Maneggiando il dispositivo, si notano subito le dimensioni compatte e il peso ridotto. Le superfici hanno una finitura leggermente strutturata che dà una sensazione di qualità, non è eccessivamente incline alle impronte digitali ed è relativamente facile da pulire. Il coperchio è realizzato in plastica rinforzata con fibra di carbonio e l'unità di base è in alluminio. Tuttavia, l'attenzione alla mobilità ha un impatto sulla rigidità complessiva. L'unità base può essere leggermente schiacciata nell'area centrale e produce lievi scricchiolii quando viene ruotata. Il coperchio stesso è ragionevolmente robusto, ma le cerniere sono il problema principale. L'angolo di apertura massimo è di 180 gradi, ma le cerniere sono un po' troppo allentate e oscillano troppo. Il coperchio inferiore è fissato con solo quattro viti ed è facile da rimuovere. La ventola, la batteria, il modulo WWAN e l'SSD sono riparabili, anche se la RAM e il modulo WLAN sono saldati.
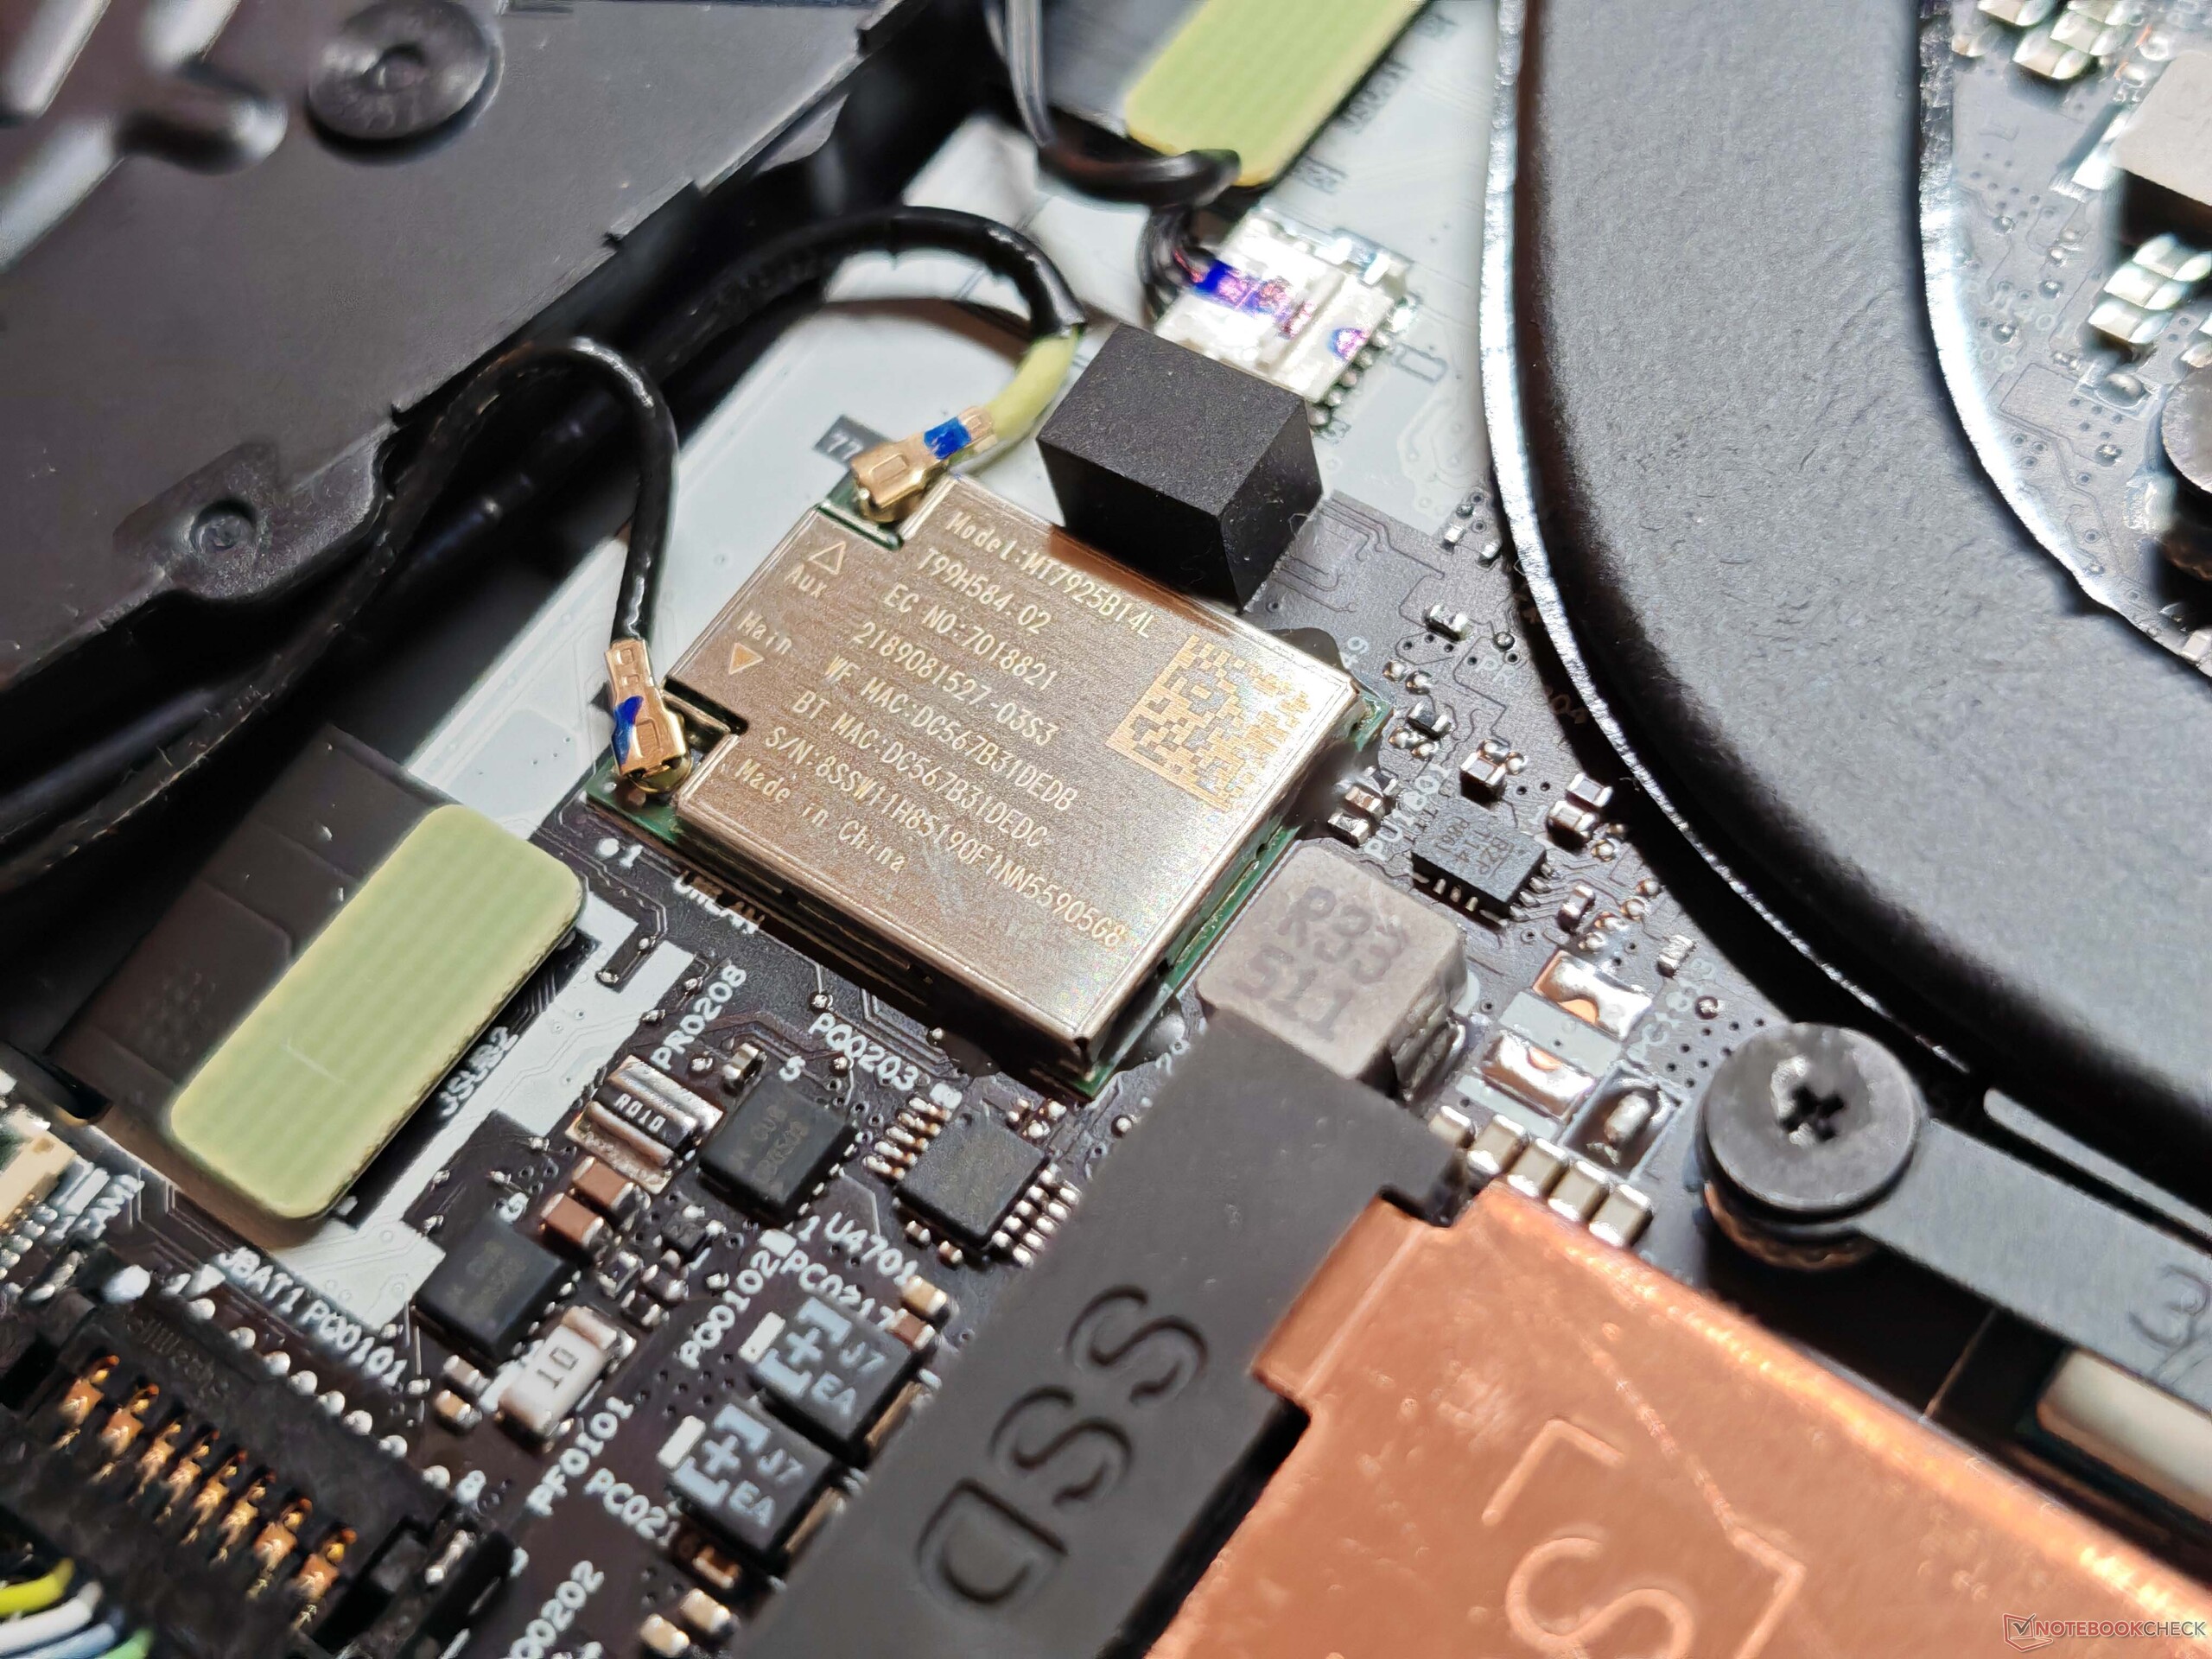
In termini di porte, ora c'è un solo connettore USB-A sul lato destro, mentre le due porte USB-C, compresa la Thunderbolt 4, si trovano sul lato sinistro. Il modulo WLAN supporta il Wi-Fi 7 e offre velocità di trasferimento molto elevate e stabili. La fotocamera da 5 MP (inclusa IR) offre una qualità d'immagine accettabile e dispone di un otturatore meccanico.


| Networking | |
| Lenovo ThinkPad X13 G6 AMD | |
| iperf3 transmit AXE11000 | |
| iperf3 receive AXE11000 | |
| Dell Pro 13 Premium PA13250 | |
| iperf3 transmit AXE11000 | |
| iperf3 receive AXE11000 | |
| iperf3 transmit AXE11000 6GHz | |
| iperf3 receive AXE11000 6GHz | |
| MSI Prestige 13 AI Plus Evo A2VMG | |
| iperf3 transmit AXE11000 | |
| iperf3 receive AXE11000 | |
| iperf3 transmit AXE11000 6GHz | |
| iperf3 receive AXE11000 6GHz | |
| Microsoft Surface Laptop 7 13.8 Copilot+ | |
| iperf3 transmit AXE11000 | |
| iperf3 receive AXE11000 | |
| iperf3 transmit AXE11000 6GHz | |
| iperf3 receive AXE11000 6GHz | |
| Lenovo ThinkPad X1 Carbon Gen 13 21NS0010GE | |
| iperf3 transmit AXE11000 | |
| iperf3 receive AXE11000 | |
| iperf3 transmit AXE11000 6GHz | |
| iperf3 receive AXE11000 6GHz | |


Sostenibilità
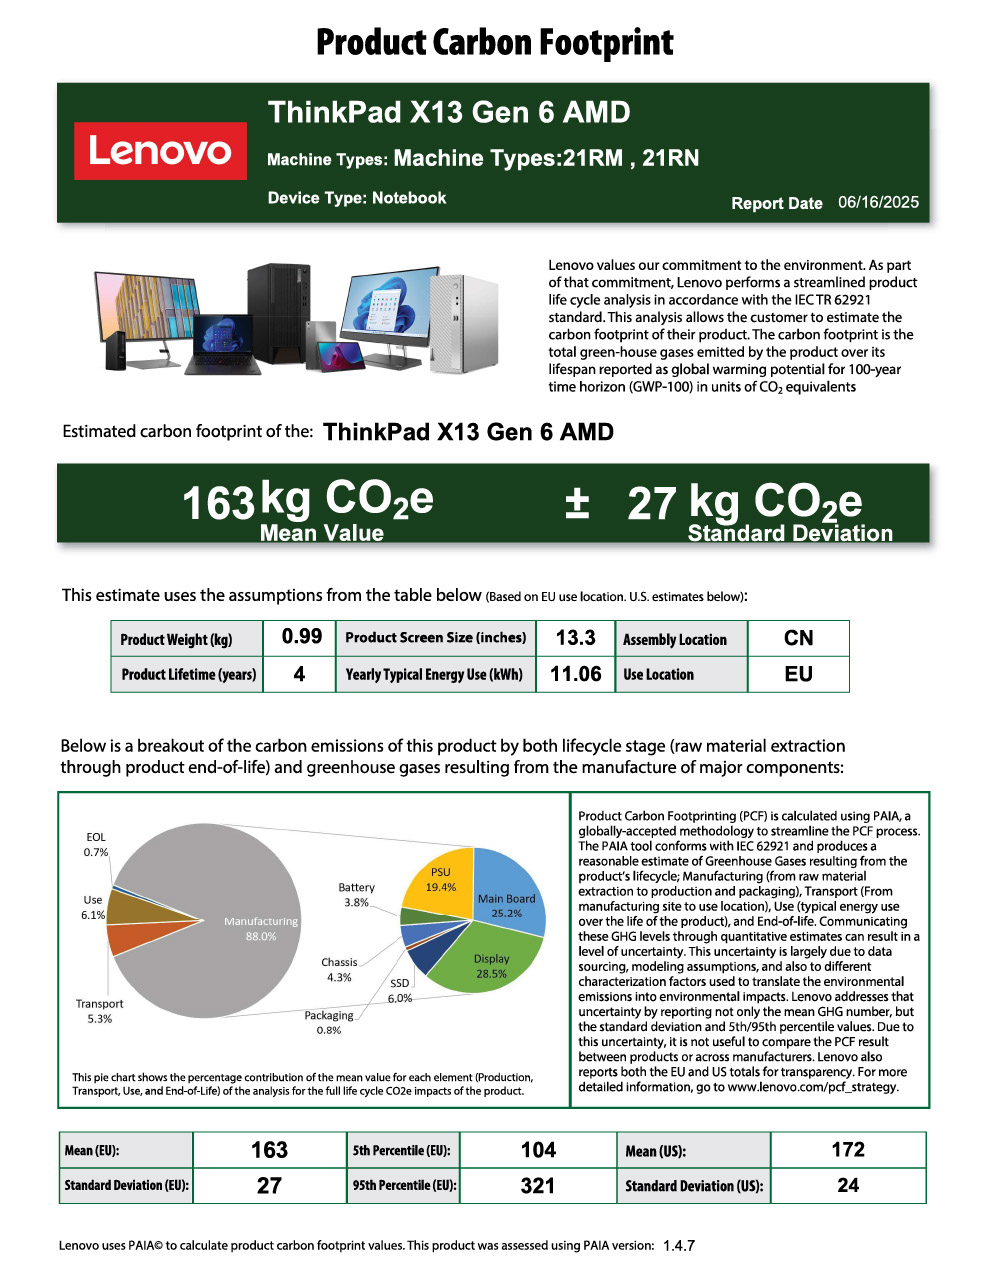
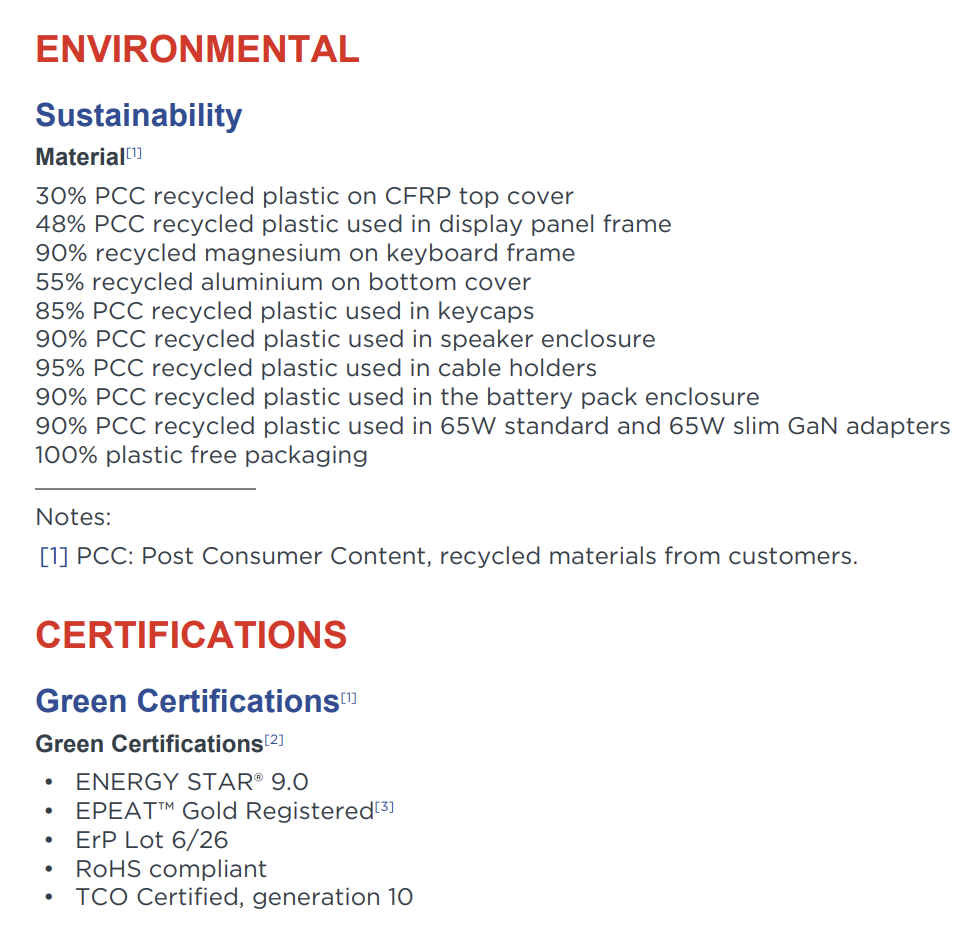
Il ThinkPad X13 G6 soddisfa diversi standard ambientali, tra cui Energy Star, e Lenovo fornisce ampie informazioni sull'impronta di carbonio del dispositivo e sull'uso di materiali riciclati. L'imballaggio è completamente riciclabile e non contiene plastica.
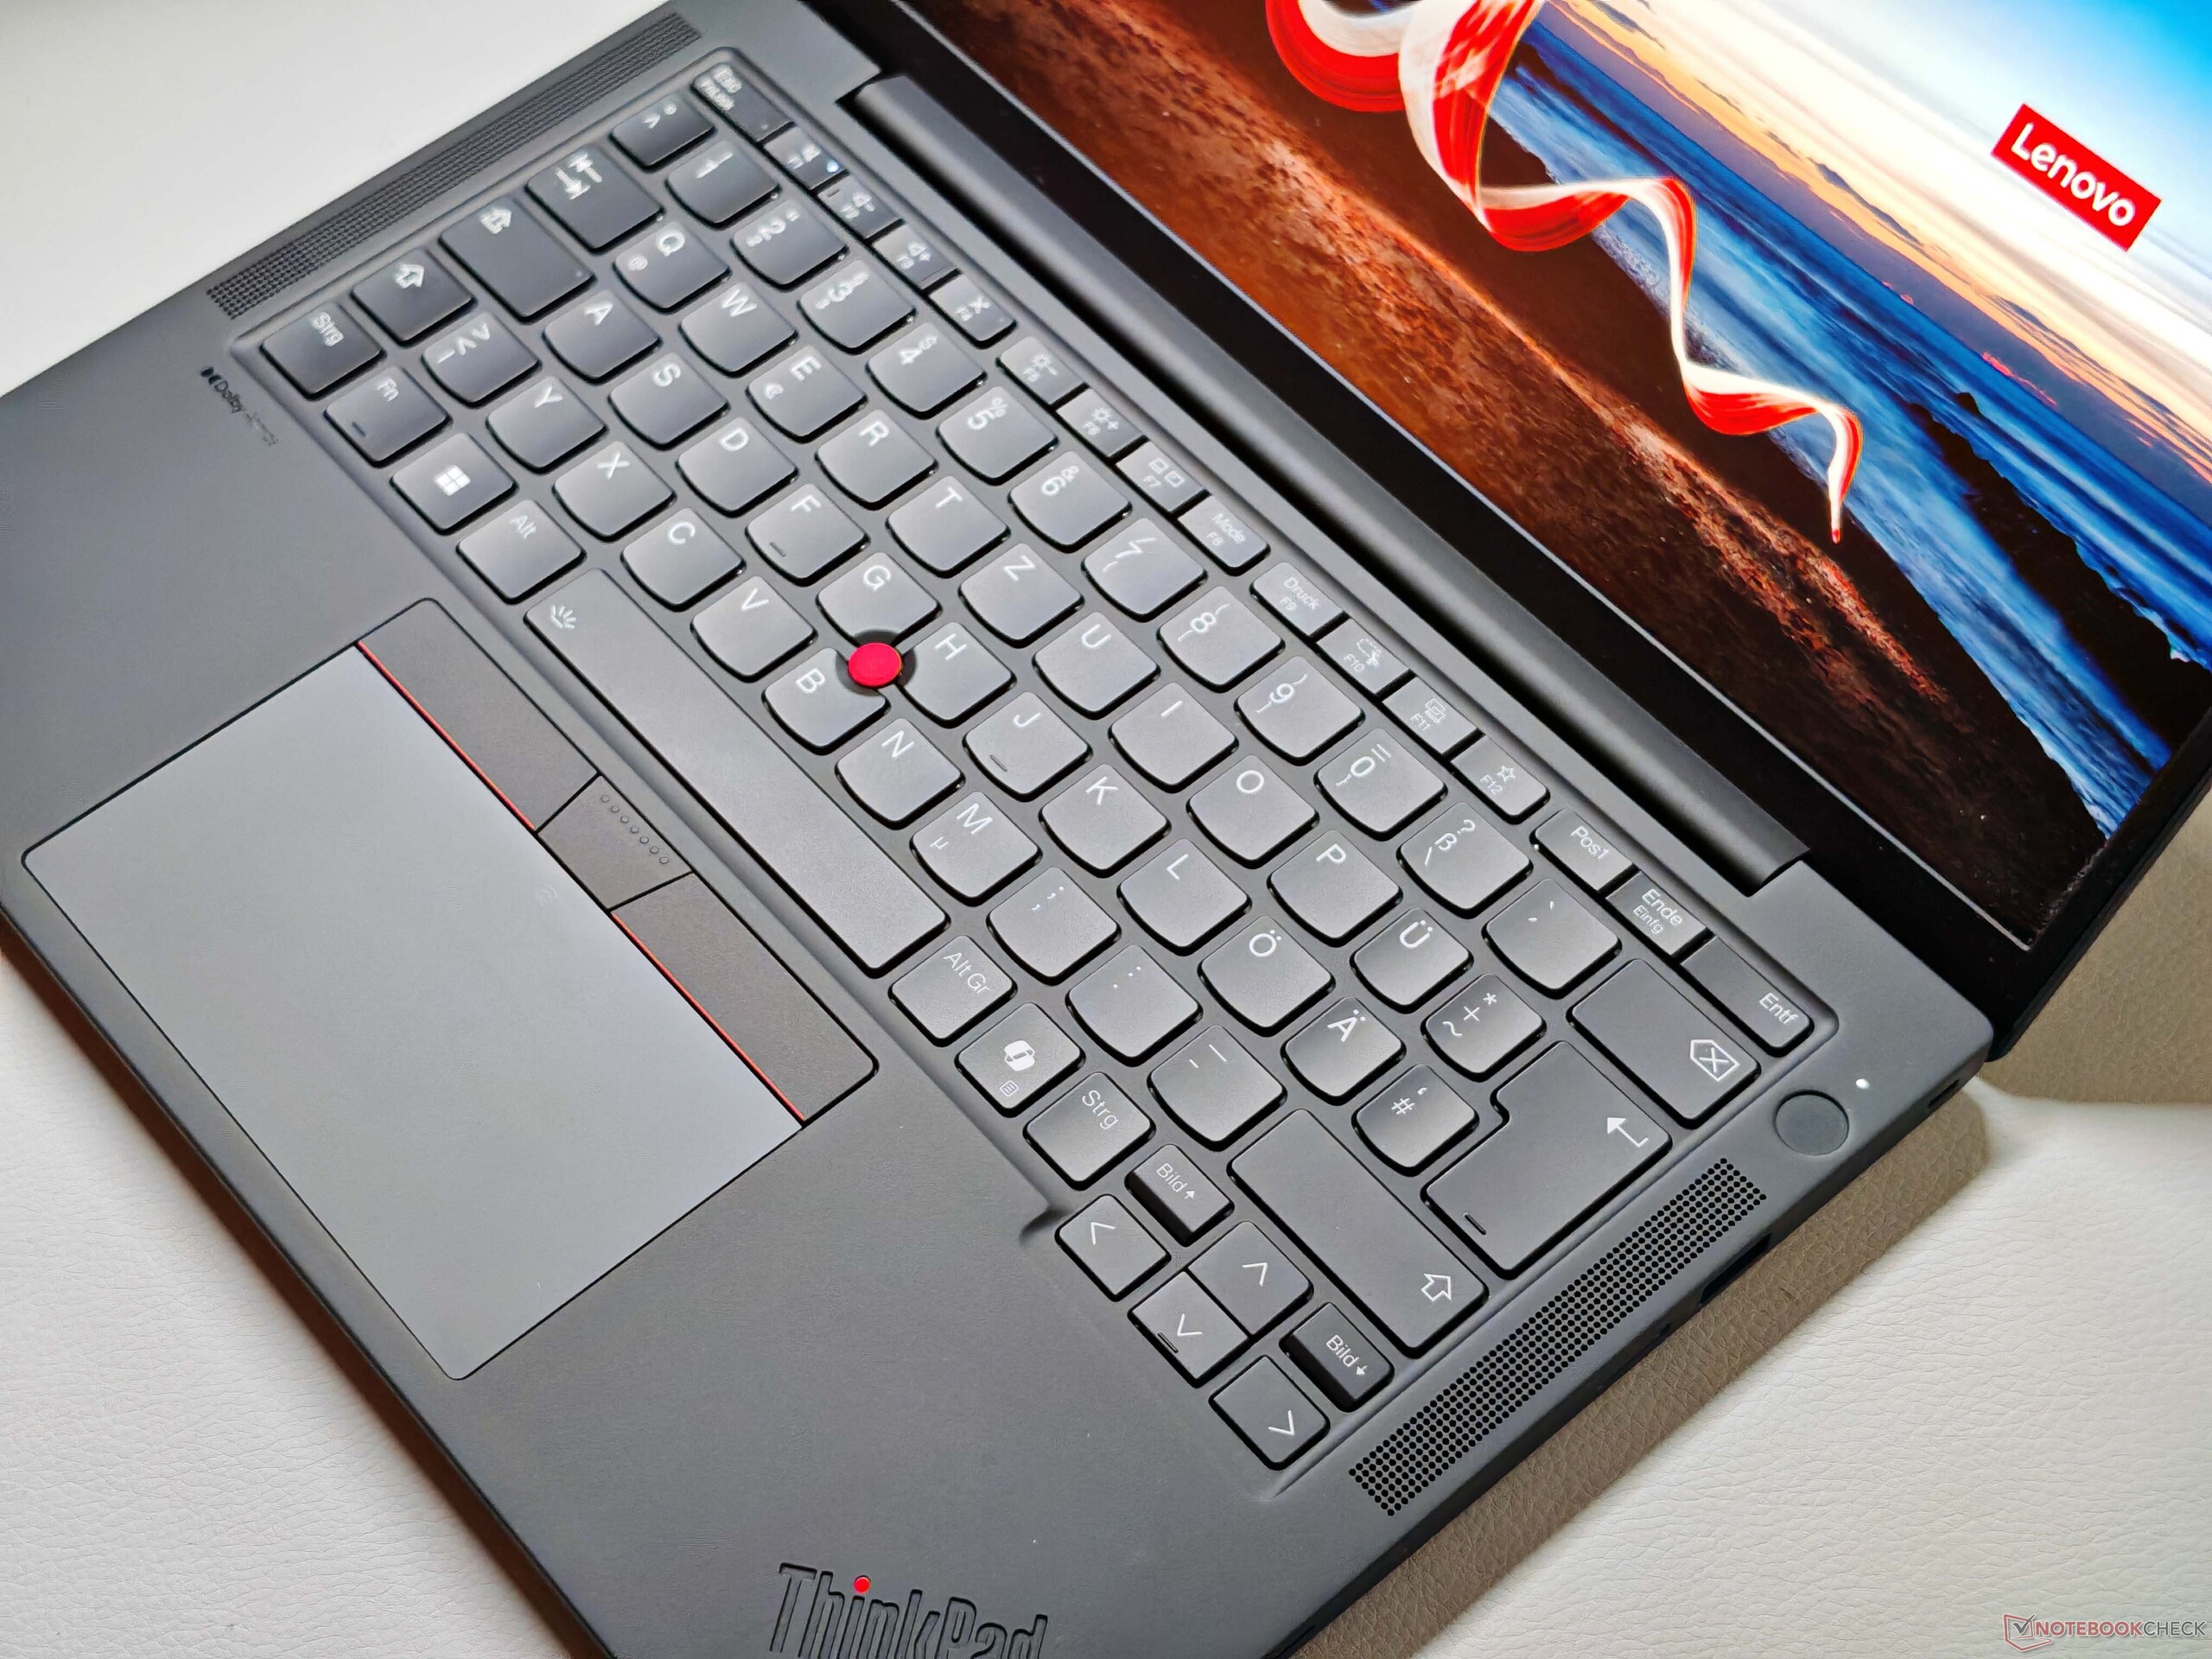
Dispositivi di input - Tastiera debole
La tastiera retroilluminata offre una corsa di 1,5 mm per la maggior parte dei tasti, mentre i tasti G, H e B (che si trovano accanto al TrackPoint) e i tasti funzione offrono solo 1,35 mm. Nel complesso, l'esperienza di digitazione è semplicemente nella media anche per gli standard moderni di ThinkPad e non è più realmente paragonabile ai modelli più vecchi, come il ThinkPad X1 Carbon G6 del 2018 ThinkPad X1 Carbon G6 del 2018. La pressione dei tasti è precisa, ma la sensazione generale di digitazione non è particolarmente confortevole.


Il TrackPoint funziona bene e i pulsanti associati offrono un clic soddisfacente. Il ClickPad relativamente piccolo (11,5 × 7,4 cm) funziona come previsto e offre buone proprietà di scorrimento, anche se i clic meccanici nell'area inferiore sono un po' rumorosi.
Display - IPS a basso consumo

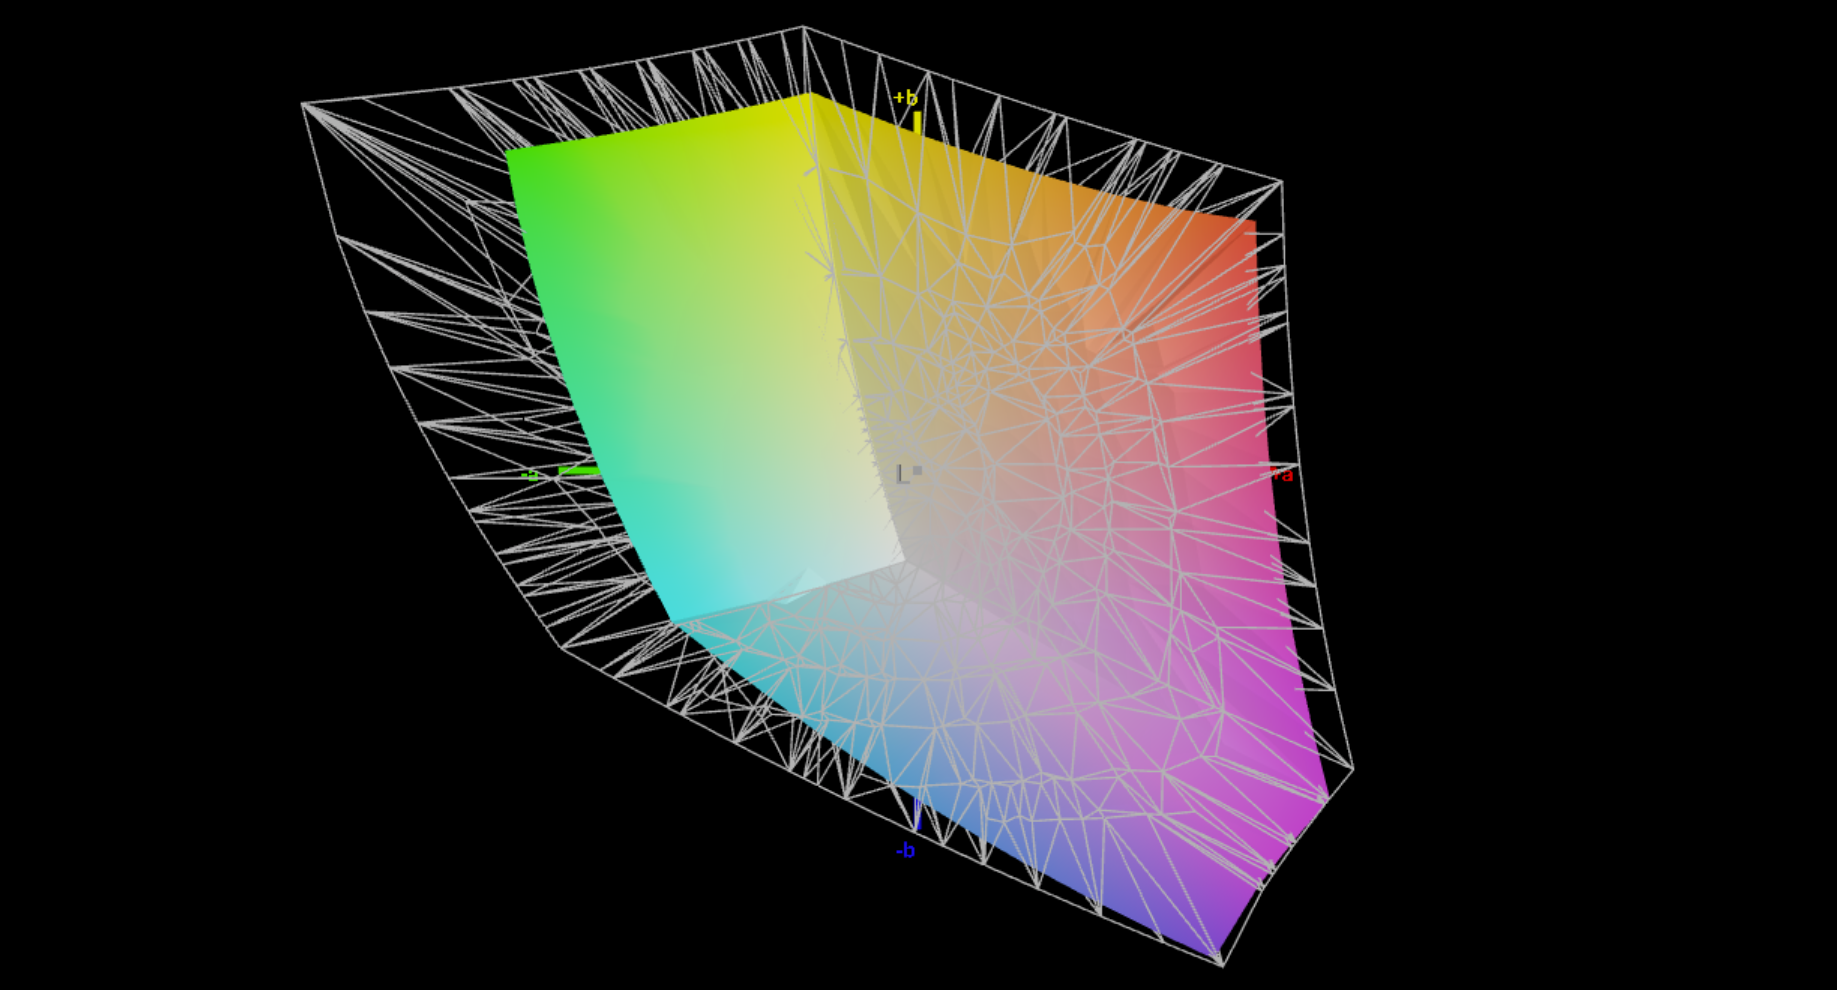
La mobilità è la priorità anche per quanto riguarda il display, motivo per cui è disponibile solo un pannello Full HD opaco nella versione a basso consumo (opzionalmente con supporto touch). La qualità complessiva dell'immagine è decente per un computer portatile business, con colori ricchi e assenza di granulosità nelle aree luminose. Inoltre, non c'è sfarfallio PWM. Tuttavia, la frequenza di aggiornamento è limitata a 60 Hz e i tempi di risposta non sono particolarmente rapidi, il che comporta un visibile ghosting.
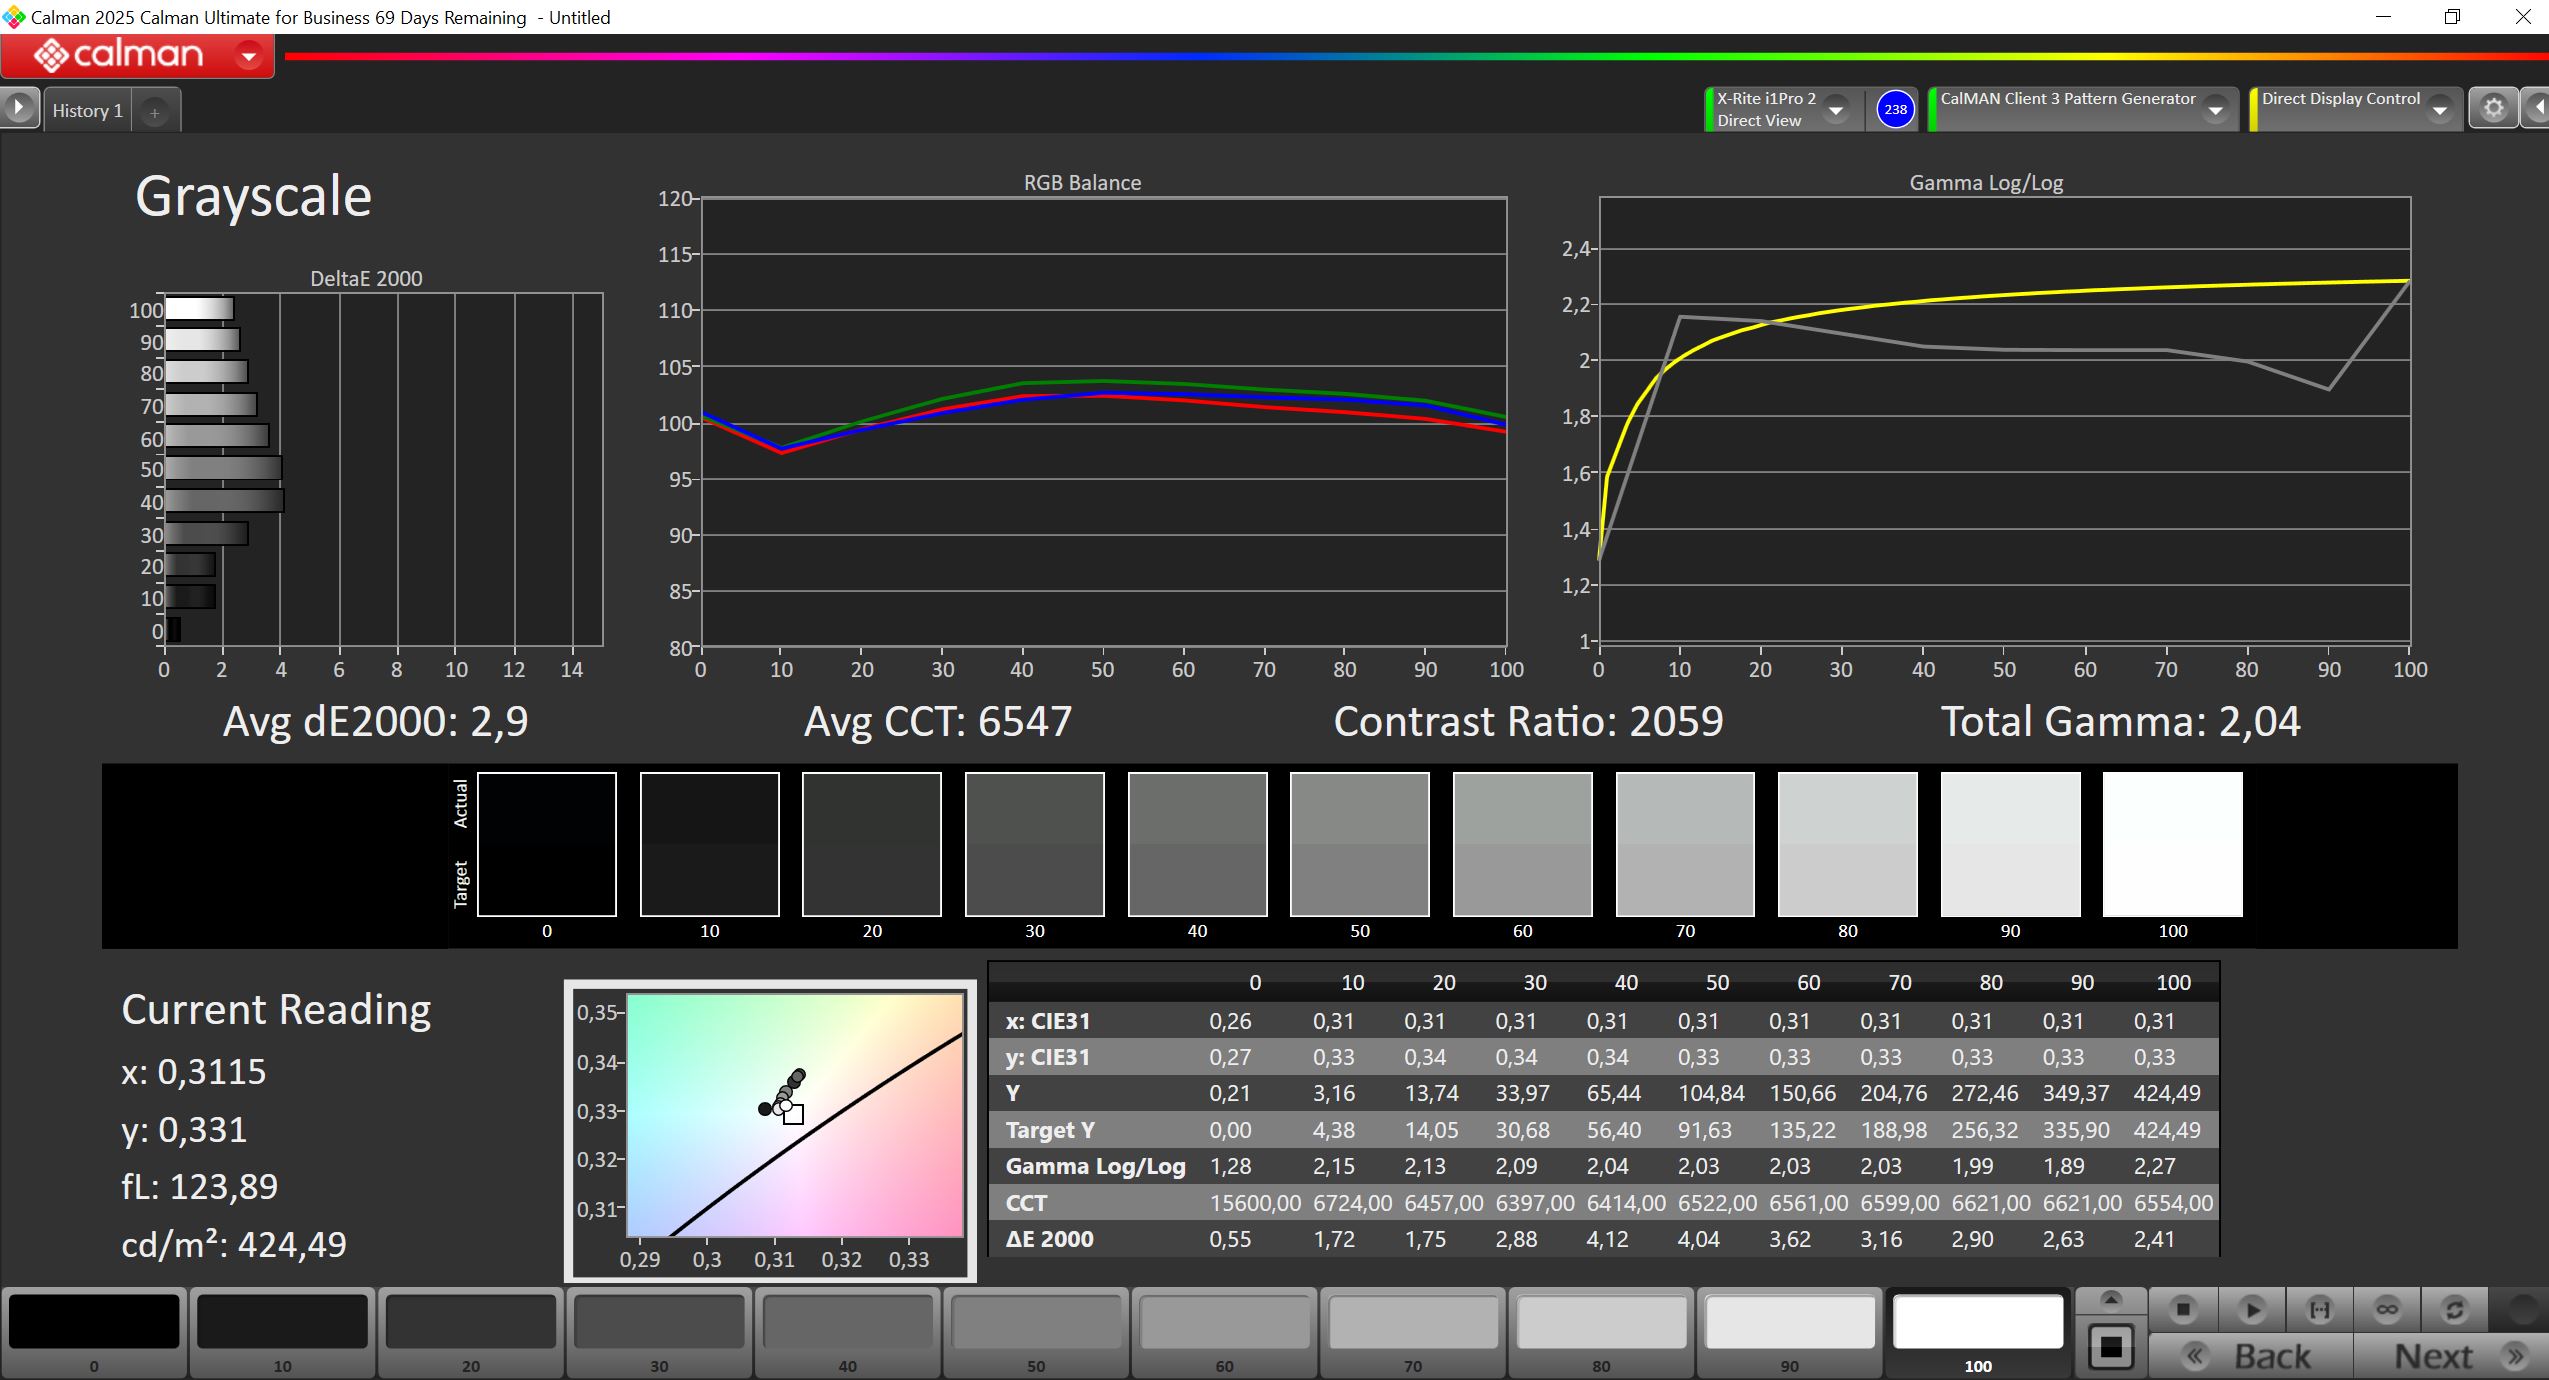
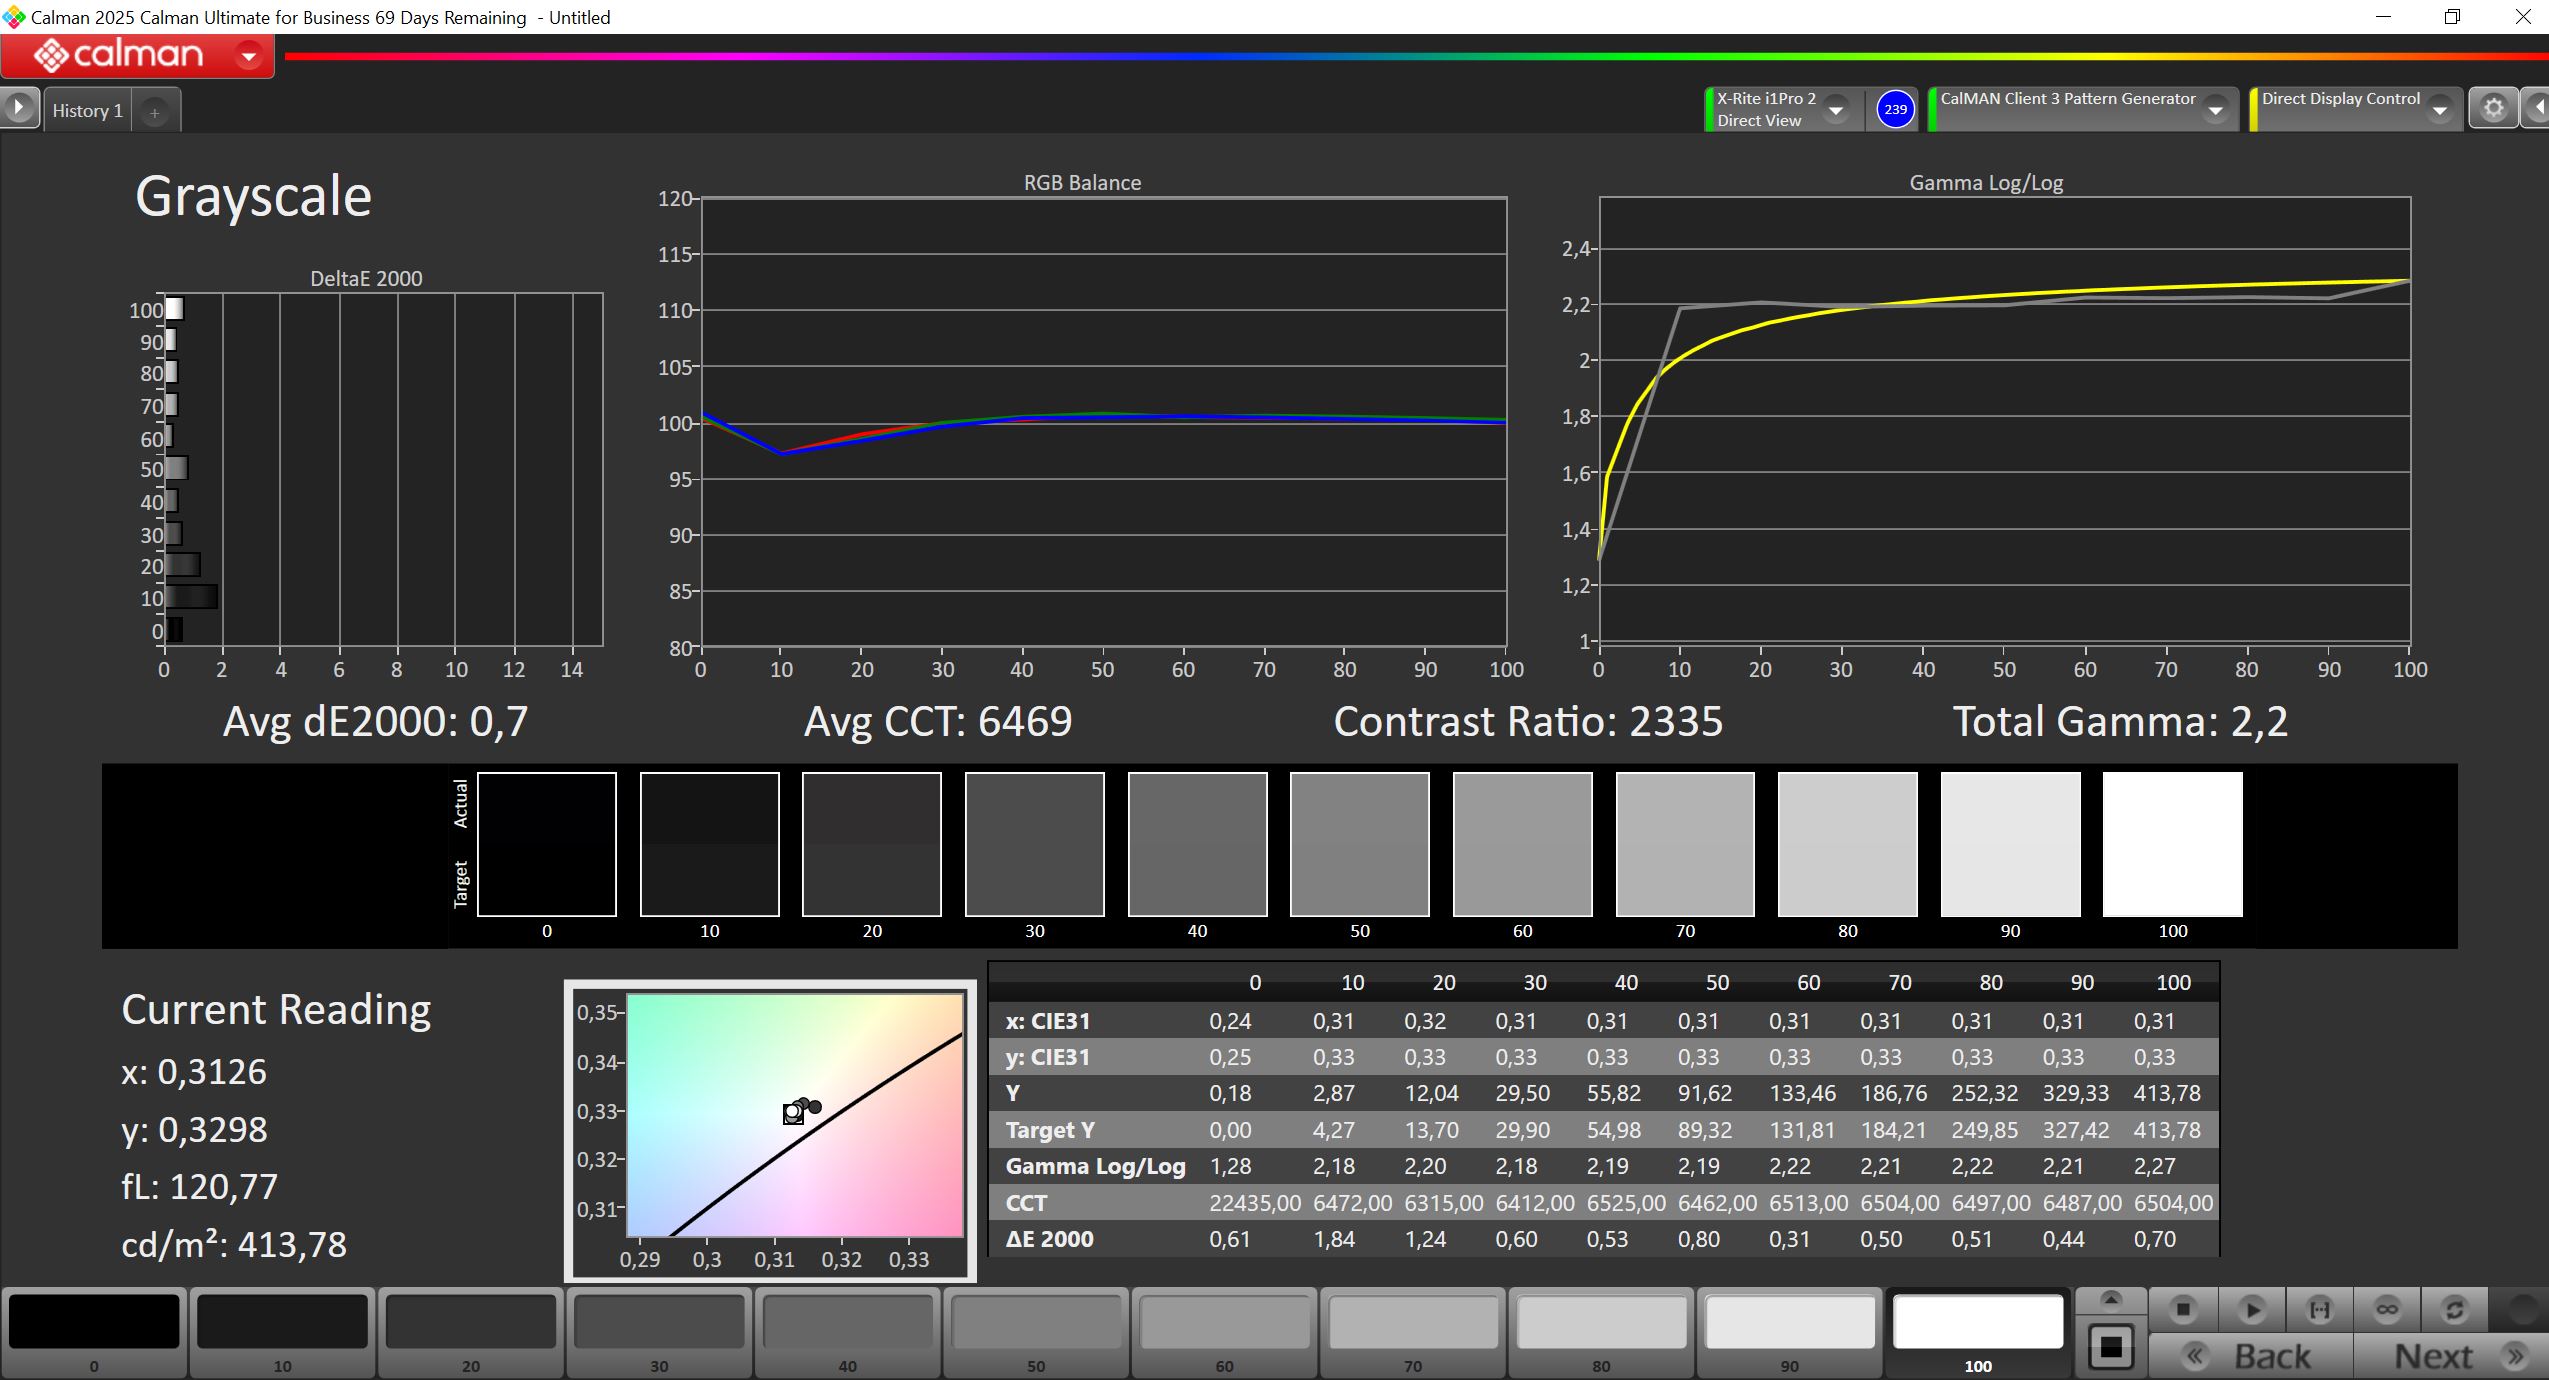
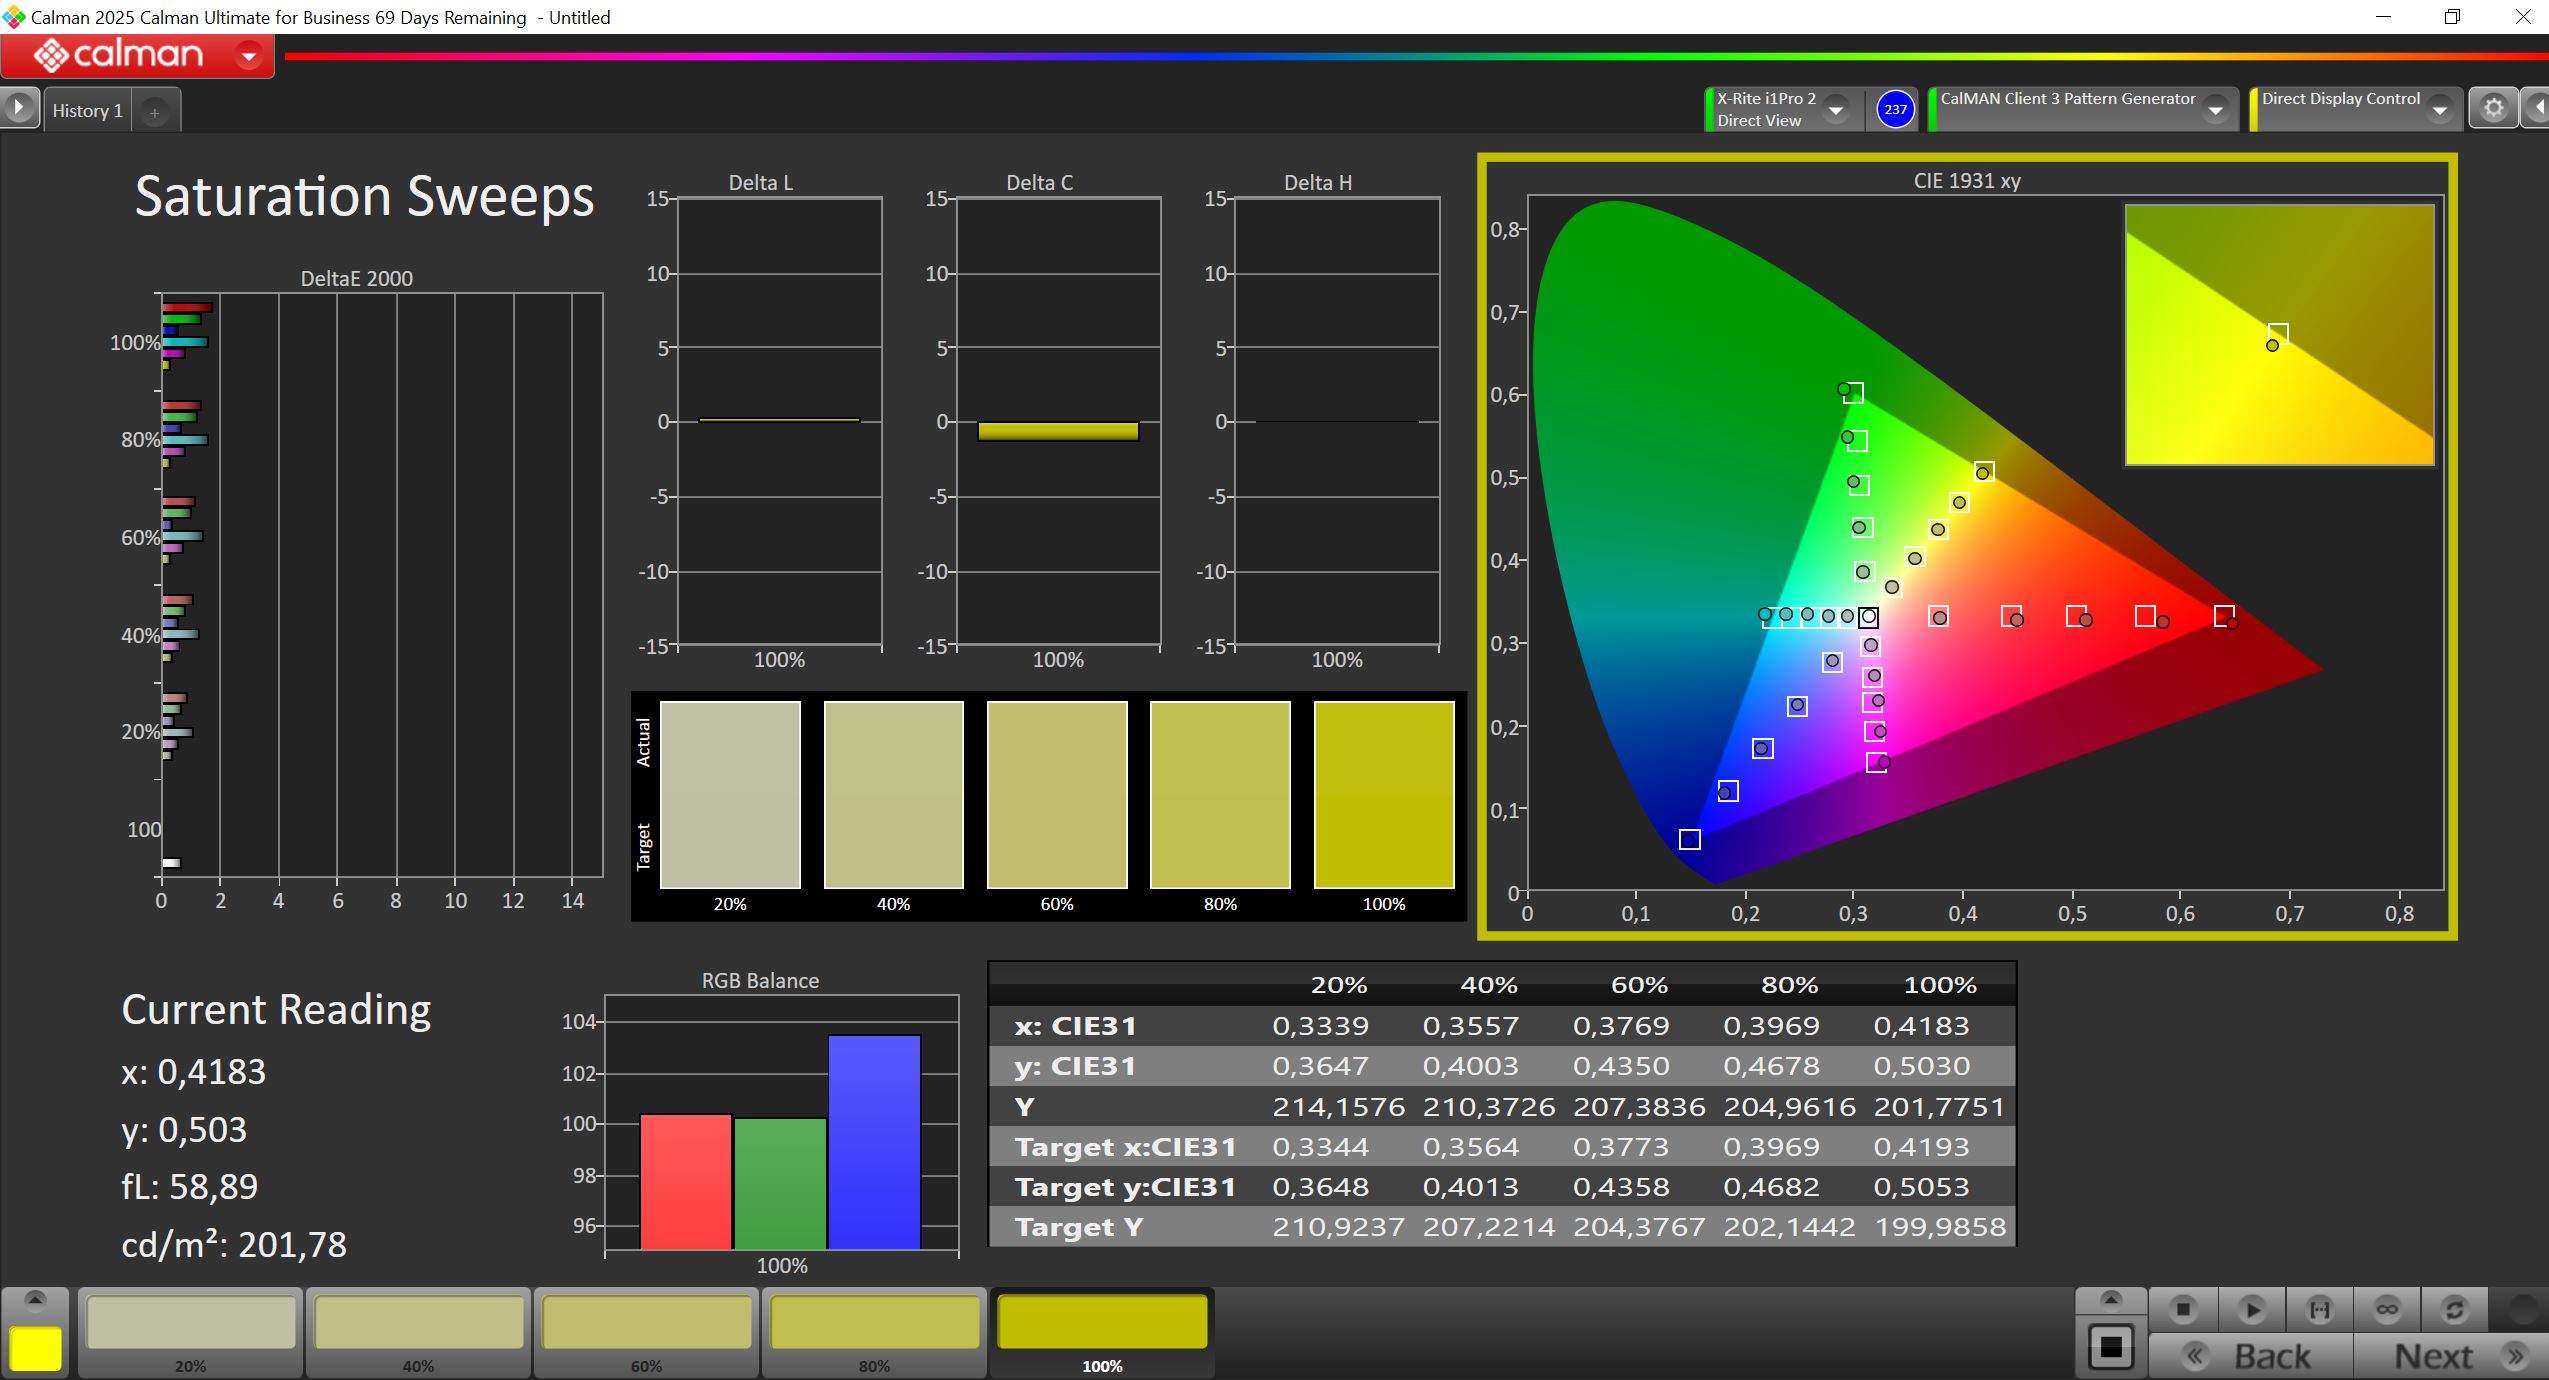
Lenovo valuta il display a 400 cd/m², un valore che la nostra unità di recensione raggiunge facilmente. Anche il livello del nero è molto basso, con un rapporto di contrasto molto elevato. La calibrazione di fabbrica offre già risultati solidi nella nostra analisi con il software professionale CalMAN, anche se la nostra calibrazione migliora ulteriormente la precisione del colore (il profilo è disponibile per il download gratuito nel riquadro a destra).
| |||||||||||||||||||||||||
Distribuzione della luminosità: 92 %
Al centro con la batteria: 424 cd/m²
Contrasto: 2019:1 (Nero: 0.21 cd/m²)
ΔE ColorChecker Calman: 2.3 | ∀{0.5-29.43 Ø4.72}
calibrated: 0.9
ΔE Greyscale Calman: 2.9 | ∀{0.09-98 Ø4.97}
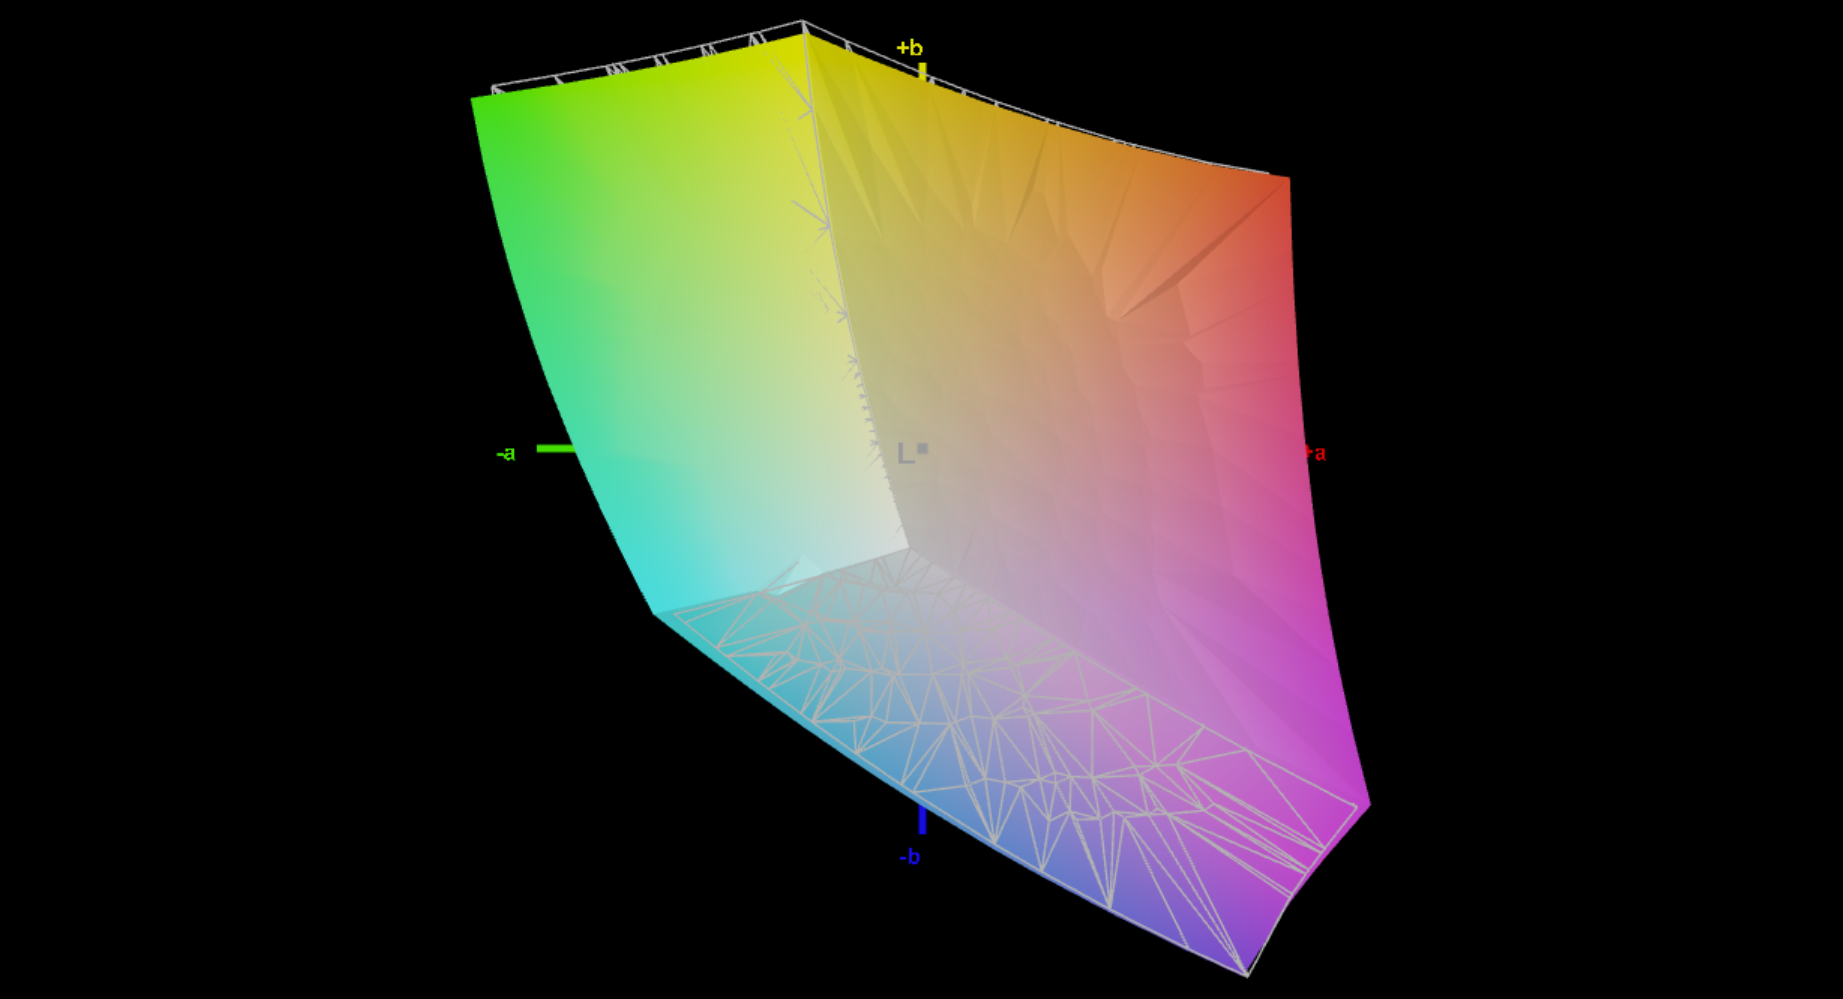
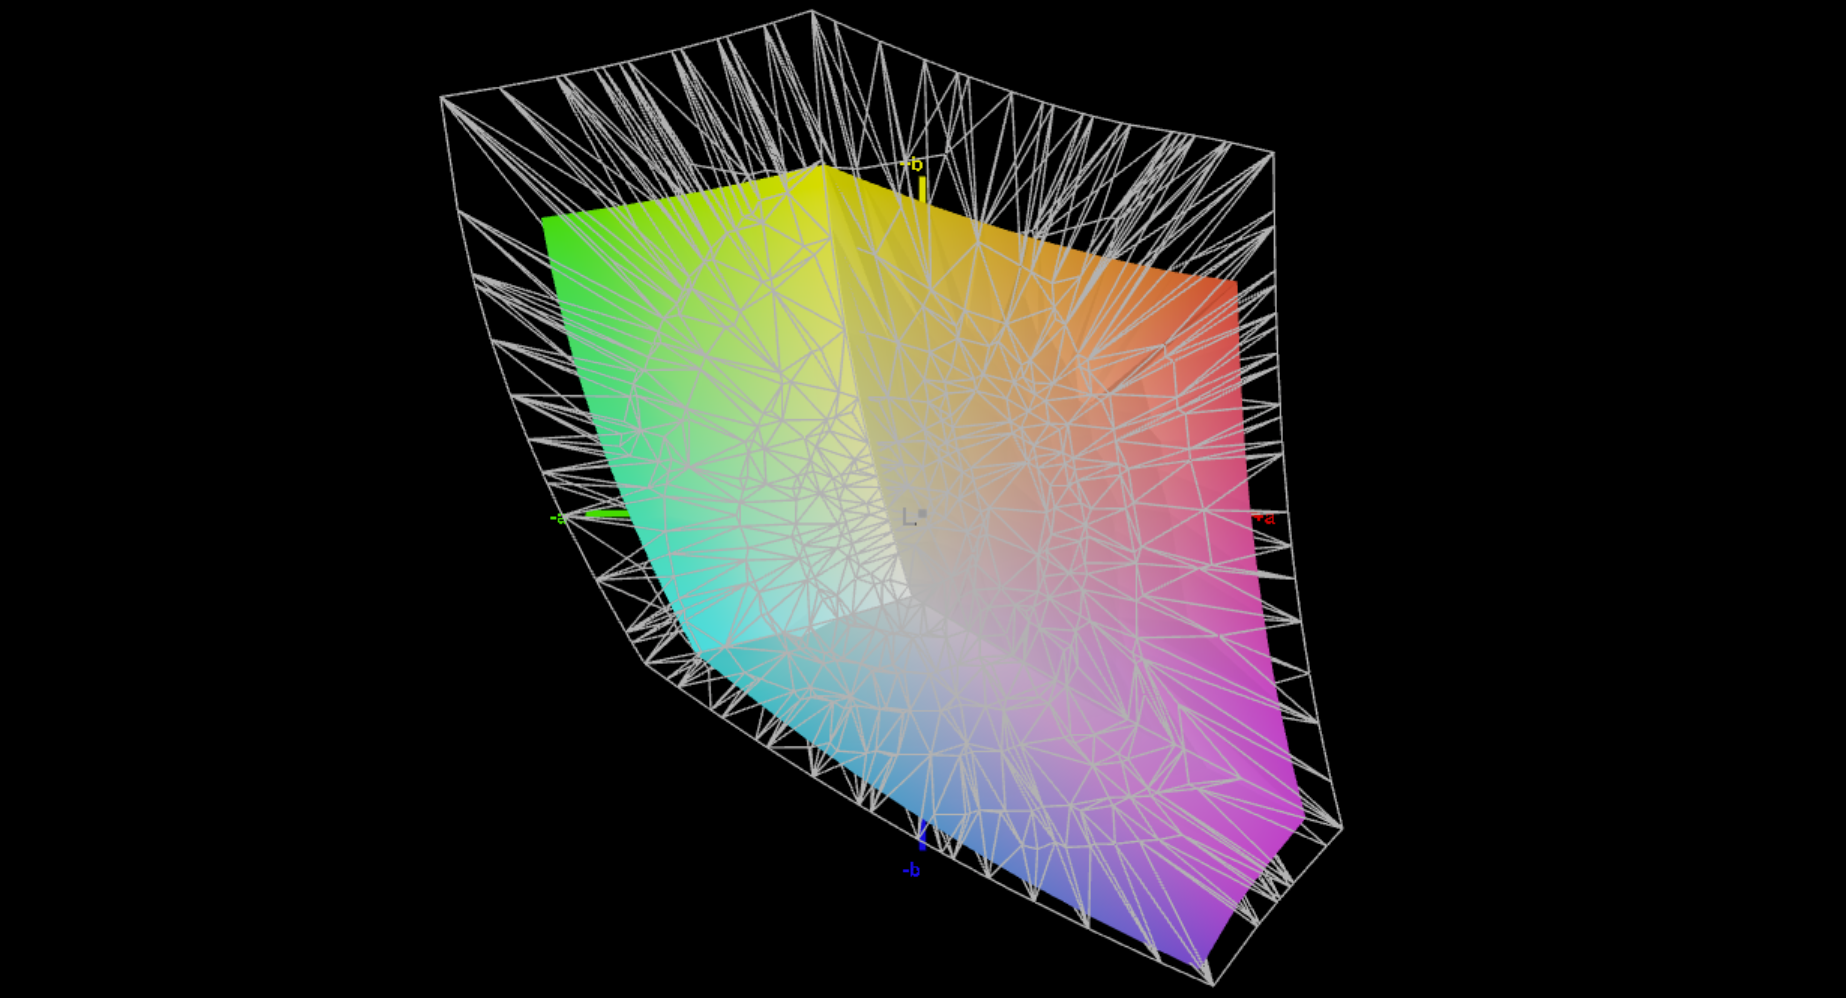
70.5% AdobeRGB 1998 (Argyll 3D)
98.4% sRGB (Argyll 3D)
69.6% Display P3 (Argyll 3D)
Gamma: 2.04
CCT: 6547 K
| Lenovo ThinkPad X13 G6 AMD NV133WUM-N6D, IPS, 1920x1200, 13.3", 60 Hz | Dell Pro 13 Premium PA13250 B133UAN (AUOBEB0), IPS, 1920x1200, 13.3", 60 Hz | MSI Prestige 13 AI Plus Evo A2VMG ATNA33AA07-0, OLED, 2880x1800, 13.3", 60 Hz | Microsoft Surface Laptop 7 13.8 Copilot+ LQ138P1JX61, IPS, 2304x1536, 13.8", 120 Hz | Lenovo ThinkPad X1 Carbon Gen 13 21NS0010GE ATNA40YK20-0, OLED, 2880x1800, 14", 120 Hz | |
|---|---|---|---|---|---|
| Display | 5% | 27% | 22% | 28% | |
| Display P3 Coverage (%) | 69.6 | 74.3 7% | 99.9 44% | 97.8 41% | 99.5 43% |
| sRGB Coverage (%) | 98.4 | 99.1 1% | 100 2% | 98.2 0% | 100 2% |
| AdobeRGB 1998 Coverage (%) | 70.5 | 75.9 8% | 95.8 36% | 87.3 24% | 97.1 38% |
| Response Times | -19% | 93% | 18% | 93% | |
| Response Time Grey 50% / Grey 80% * (ms) | 52.8 ? | 52.8 ? -0% | 1.94 ? 96% | 38.9 ? 26% | 2.4 ? 95% |
| Response Time Black / White * (ms) | 19.3 ? | 26.4 ? -37% | 2.02 ? 90% | 17.4 ? 10% | 1.9 ? 90% |
| PWM Frequency (Hz) | 60 ? | 240 ? | |||
| PWM Amplitude * (%) | 21.9 | 33 | |||
| Screen | -25% | 0% | 10% | -89% | |
| Brightness middle (cd/m²) | 424 | 456 8% | 382.4 -10% | 606 43% | 407 -4% |
| Brightness (cd/m²) | 409 | 460 12% | 383 -6% | 592 45% | 410 0% |
| Brightness Distribution (%) | 92 | 89 -3% | 99 8% | 94 2% | 99 8% |
| Black Level * (cd/m²) | 0.21 | 0.23 -10% | 0.43 -105% | ||
| Contrast (:1) | 2019 | 1983 -2% | 1409 -30% | ||
| Colorchecker dE 2000 * | 2.3 | 3.3 -43% | 3.84 -67% | 1.3 43% | 4.9 -113% |
| Colorchecker dE 2000 max. * | 4.3 | 6.47 -50% | 6.66 -55% | 2.1 51% | 9.1 -112% |
| Colorchecker dE 2000 calibrated * | 0.9 | 1.7 -89% | 0.41 54% | 4.7 -422% | |
| Greyscale dE 2000 * | 2.9 | 4.35 -50% | 0.7 76% | 2.1 28% | 2.3 21% |
| Gamma | 2.04 108% | 2.51 88% | 2.23 99% | 2.16 102% | 2.26 97% |
| CCT | 6547 99% | 6215 105% | 6475 100% | 6842 95% | 6310 103% |
| Media totale (Programma / Settaggio) | -13% /
-18% | 40% /
22% | 17% /
14% | 11% /
-30% |
* ... Meglio usare valori piccoli


Tempi di risposta del Display
| ↔ Tempi di risposta dal Nero al Bianco | ||
|---|---|---|
| 19.3 ms ... aumenta ↗ e diminuisce ↘ combinato | ↗ 6.8 ms Incremento | 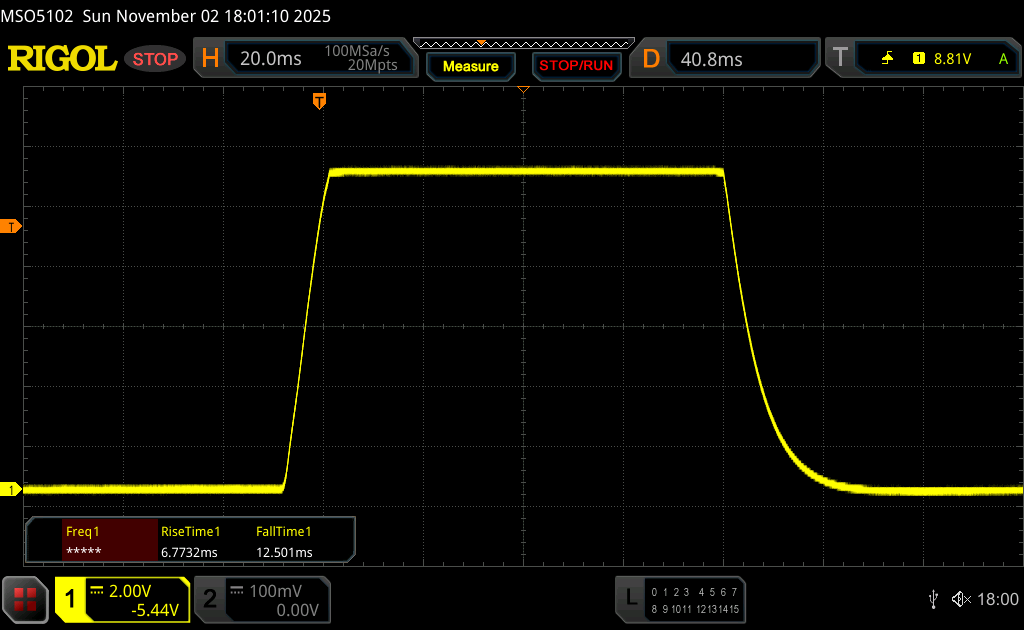 |
| ↘ 12.5 ms Calo | ||
| Lo schermo mostra buoni tempi di risposta durante i nostri tests, ma potrebbe essere troppo lento per i gamers competitivi. In confronto, tutti i dispositivi di test variano da 0.1 (minimo) a 240 (massimo) ms. » 43 % di tutti i dispositivi è migliore. Questo significa che i tempi di risposta rilevati sono simili alla media di tutti i dispositivi testati (19.8 ms). | ||
| ↔ Tempo di risposta dal 50% Grigio all'80% Grigio | ||
| 52.8 ms ... aumenta ↗ e diminuisce ↘ combinato | ↗ 23 ms Incremento | 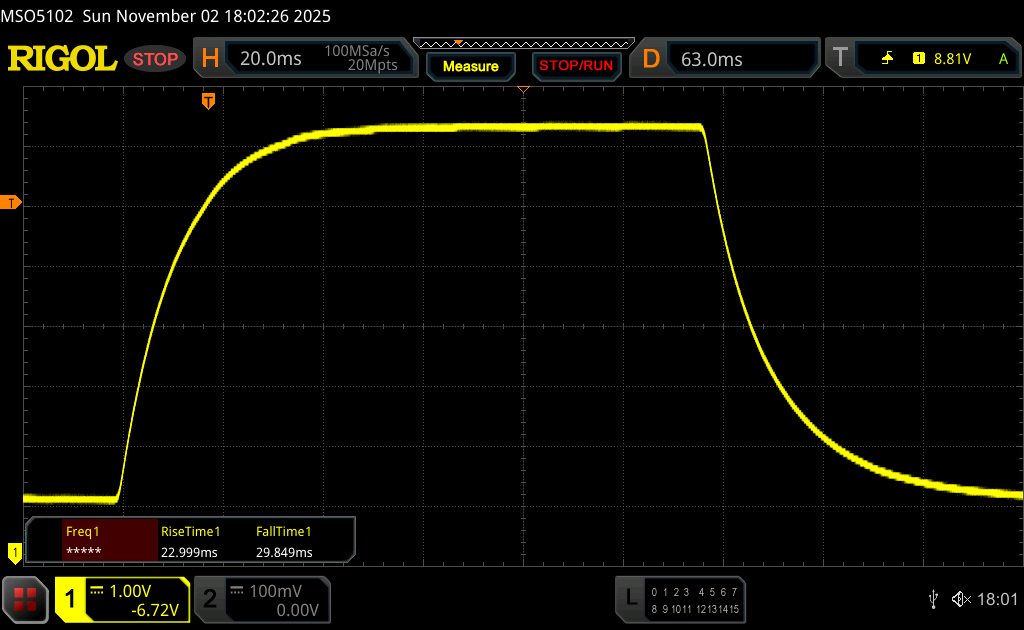 |
| ↘ 29.8 ms Calo | ||
| Lo schermo mostra tempi di risposta lenti nei nostri tests e sarà insoddisfacente per i gamers. In confronto, tutti i dispositivi di test variano da 0.165 (minimo) a 636 (massimo) ms. » 89 % di tutti i dispositivi è migliore. Questo significa che i tempi di risposta rilevati sono peggiori rispetto alla media di tutti i dispositivi testati (31 ms). | ||
Sfarfallio dello schermo / PWM (Pulse-Width Modulation)
| flickering dello schermo / PWM non rilevato | 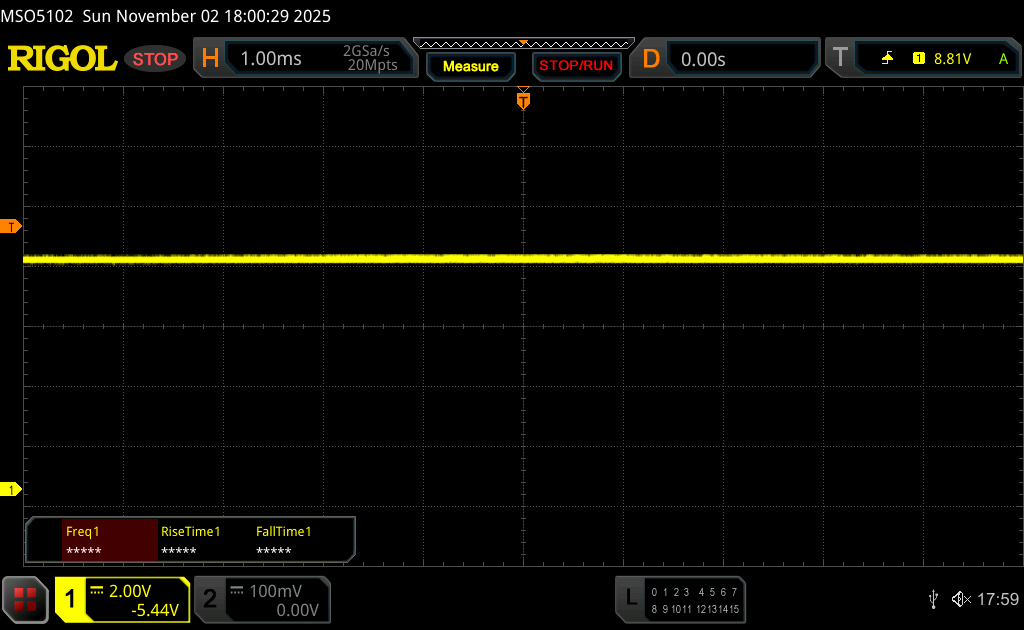 | ||
In confronto: 52 % di tutti i dispositivi testati non utilizza PWM per ridurre la luminosita' del display. Se è rilevato PWM, una media di 7750 (minimo: 5 - massimo: 343500) Hz è stata rilevata. | |||


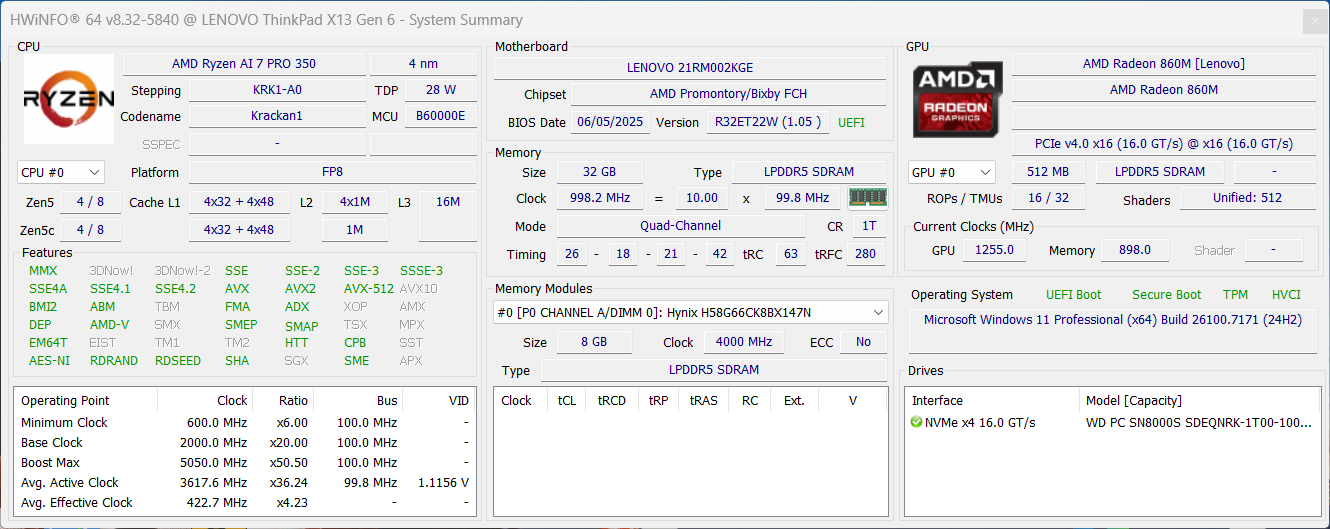
Prestazioni - Zen 5 con 32 GB di RAM
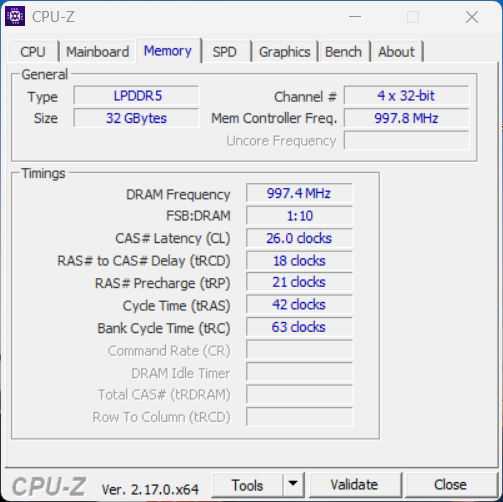
Secondo le specifiche ufficiali di Lenovo, il ThinkPad X13 G6 è disponibile con un massimo di 32 GB di RAM LPDDR5x-8000, non aggiornabile.
Condizioni del test
Sui dispositivi ThinkPad, i profili energetici di Lenovo sono direttamente collegati alle impostazioni energetiche di Windows. Abbiamo condotto tutti i benchmark utilizzando la modalità " Migliori prestazioni".
Processore
Il AMD Ryzen AI 7 PRO 350 (Krackan Point) è attualmente utilizzato in molti computer portatili e presenta core Zen 5 (4× Zen 5, 4× Zen 5c), con la versione PRO che offre anche funzioni di sicurezza aggiuntive. Nell'X13, il processore è in grado di consumare fino a 40 watt e poi si assesta intorno ai 35 watt, un buon risultato considerando le dimensioni compatte del dispositivo. Di conseguenza, l'X13 supera chiaramente i suoi concorrenti diretti nei benchmark della CPU. Le prestazioni rimangono costanti con l'alimentazione a batteria.
Cinebench R15 Multi loop
Cinebench R23: Multi Core | Single Core
Cinebench R20: CPU (Multi Core) | CPU (Single Core)
Cinebench R15: CPU Multi 64Bit | CPU Single 64Bit
Blender: v2.79 BMW27 CPU
7-Zip 18.03: 7z b 4 | 7z b 4 -mmt1
Geekbench 6.7: Multi-Core | Single-Core
Geekbench 5.5: Multi-Core | Single-Core
HWBOT x265 Benchmark v2.2: 4k Preset
LibreOffice : 20 Documents To PDF
R Benchmark 2.5: Overall mean
| CPU Performance rating | |
| Lenovo ThinkPad X13 G6 AMD | |
| Media AMD Ryzen AI 7 PRO 350 | |
| Media della classe Subnotebook | |
| Lenovo ThinkPad X1 Carbon Gen 13 21NS0010GE | |
| MSI Prestige 13 AI Plus Evo A2VMG | |
| Dell Pro 13 Premium PA13250 | |
| Microsoft Surface Laptop 7 13.8 Copilot+ -2! | |
| Cinebench R23 / Multi Core | |
| Lenovo ThinkPad X13 G6 AMD | |
| Media AMD Ryzen AI 7 PRO 350 (12684 - 15543, n=6) | |
| Media della classe Subnotebook (1555 - 21812, n=59, ultimi 2 anni) | |
| MSI Prestige 13 AI Plus Evo A2VMG | |
| Lenovo ThinkPad X1 Carbon Gen 13 21NS0010GE | |
| Microsoft Surface Laptop 7 13.8 Copilot+ | |
| Dell Pro 13 Premium PA13250 | |
| Cinebench R23 / Single Core | |
| Dell Pro 13 Premium PA13250 | |
| Lenovo ThinkPad X13 G6 AMD | |
| Media AMD Ryzen AI 7 PRO 350 (1950 - 1960, n=6) | |
| Lenovo ThinkPad X1 Carbon Gen 13 21NS0010GE | |
| MSI Prestige 13 AI Plus Evo A2VMG | |
| Media della classe Subnotebook (358 - 2213, n=60, ultimi 2 anni) | |
| Microsoft Surface Laptop 7 13.8 Copilot+ | |
| Cinebench R20 / CPU (Multi Core) | |
| Lenovo ThinkPad X13 G6 AMD | |
| Media AMD Ryzen AI 7 PRO 350 (4950 - 6071, n=6) | |
| Media della classe Subnotebook (579 - 8541, n=56, ultimi 2 anni) | |
| MSI Prestige 13 AI Plus Evo A2VMG | |
| Lenovo ThinkPad X1 Carbon Gen 13 21NS0010GE | |
| Dell Pro 13 Premium PA13250 | |
| Microsoft Surface Laptop 7 13.8 Copilot+ | |
| Cinebench R20 / CPU (Single Core) | |
| Lenovo ThinkPad X13 G6 AMD | |
| Media AMD Ryzen AI 7 PRO 350 (763 - 773, n=6) | |
| Dell Pro 13 Premium PA13250 | |
| Lenovo ThinkPad X1 Carbon Gen 13 21NS0010GE | |
| MSI Prestige 13 AI Plus Evo A2VMG | |
| Media della classe Subnotebook (128 - 832, n=56, ultimi 2 anni) | |
| Microsoft Surface Laptop 7 13.8 Copilot+ | |
| Cinebench R15 / CPU Multi 64Bit | |
| Media AMD Ryzen AI 7 PRO 350 (1969 - 2439, n=6) | |
| Lenovo ThinkPad X13 G6 AMD | |
| Microsoft Surface Laptop 7 13.8 Copilot+ | |
| Media della classe Subnotebook (327 - 3345, n=56, ultimi 2 anni) | |
| MSI Prestige 13 AI Plus Evo A2VMG | |
| Dell Pro 13 Premium PA13250 | |
| Lenovo ThinkPad X1 Carbon Gen 13 21NS0010GE | |
| Cinebench R15 / CPU Single 64Bit | |
| Dell Pro 13 Premium PA13250 | |
| Lenovo ThinkPad X1 Carbon Gen 13 21NS0010GE | |
| Lenovo ThinkPad X13 G6 AMD | |
| MSI Prestige 13 AI Plus Evo A2VMG | |
| Media della classe Subnotebook (72.4 - 322, n=56, ultimi 2 anni) | |
| Media AMD Ryzen AI 7 PRO 350 (198.4 - 299, n=6) | |
| Microsoft Surface Laptop 7 13.8 Copilot+ | |
| Blender / v2.79 BMW27 CPU | |
| Dell Pro 13 Premium PA13250 | |
| Media della classe Subnotebook (159 - 2271, n=57, ultimi 2 anni) | |
| Lenovo ThinkPad X1 Carbon Gen 13 21NS0010GE | |
| Microsoft Surface Laptop 7 13.8 Copilot+ | |
| MSI Prestige 13 AI Plus Evo A2VMG | |
| Media AMD Ryzen AI 7 PRO 350 (206 - 251, n=6) | |
| Lenovo ThinkPad X13 G6 AMD | |
| 7-Zip 18.03 / 7z b 4 | |
| Lenovo ThinkPad X13 G6 AMD | |
| Media AMD Ryzen AI 7 PRO 350 (50709 - 57736, n=6) | |
| Microsoft Surface Laptop 7 13.8 Copilot+ | |
| Media della classe Subnotebook (11668 - 77867, n=56, ultimi 2 anni) | |
| Lenovo ThinkPad X1 Carbon Gen 13 21NS0010GE | |
| MSI Prestige 13 AI Plus Evo A2VMG | |
| Dell Pro 13 Premium PA13250 | |
| 7-Zip 18.03 / 7z b 4 -mmt1 | |
| Dell Pro 13 Premium PA13250 | |
| Lenovo ThinkPad X1 Carbon Gen 13 21NS0010GE | |
| Lenovo ThinkPad X13 G6 AMD | |
| Media AMD Ryzen AI 7 PRO 350 (4445 - 6052, n=6) | |
| MSI Prestige 13 AI Plus Evo A2VMG | |
| Media della classe Subnotebook (2643 - 6699, n=58, ultimi 2 anni) | |
| Microsoft Surface Laptop 7 13.8 Copilot+ | |
| Geekbench 6.7 / Multi-Core | |
| Microsoft Surface Laptop 7 13.8 Copilot+ | |
| Lenovo ThinkPad X13 G6 AMD | |
| Media AMD Ryzen AI 7 PRO 350 (11406 - 13566, n=7) | |
| Media della classe Subnotebook (2244 - 20325, n=62, ultimi 2 anni) | |
| Lenovo ThinkPad X1 Carbon Gen 13 21NS0010GE | |
| MSI Prestige 13 AI Plus Evo A2VMG | |
| Dell Pro 13 Premium PA13250 | |
| Geekbench 6.7 / Single-Core | |
| Lenovo ThinkPad X13 G6 AMD | |
| Media AMD Ryzen AI 7 PRO 350 (2720 - 2881, n=7) | |
| Dell Pro 13 Premium PA13250 | |
| Microsoft Surface Laptop 7 13.8 Copilot+ | |
| Media della classe Subnotebook (960 - 4195, n=61, ultimi 2 anni) | |
| Lenovo ThinkPad X1 Carbon Gen 13 21NS0010GE | |
| MSI Prestige 13 AI Plus Evo A2VMG | |
| Geekbench 5.5 / Multi-Core | |
| Lenovo ThinkPad X13 G6 AMD | |
| Media AMD Ryzen AI 7 PRO 350 (10537 - 11719, n=6) | |
| Media della classe Subnotebook (2557 - 17218, n=47, ultimi 2 anni) | |
| Lenovo ThinkPad X1 Carbon Gen 13 21NS0010GE | |
| MSI Prestige 13 AI Plus Evo A2VMG | |
| Dell Pro 13 Premium PA13250 | |
| Geekbench 5.5 / Single-Core | |
| Media AMD Ryzen AI 7 PRO 350 (2070 - 2128, n=6) | |
| Lenovo ThinkPad X13 G6 AMD | |
| Lenovo ThinkPad X1 Carbon Gen 13 21NS0010GE | |
| Dell Pro 13 Premium PA13250 | |
| MSI Prestige 13 AI Plus Evo A2VMG | |
| Media della classe Subnotebook (726 - 2224, n=47, ultimi 2 anni) | |
| HWBOT x265 Benchmark v2.2 / 4k Preset | |
| Lenovo ThinkPad X13 G6 AMD | |
| Media AMD Ryzen AI 7 PRO 350 (15.8 - 19.7, n=6) | |
| MSI Prestige 13 AI Plus Evo A2VMG | |
| Media della classe Subnotebook (0.97 - 25.1, n=56, ultimi 2 anni) | |
| Lenovo ThinkPad X1 Carbon Gen 13 21NS0010GE | |
| Dell Pro 13 Premium PA13250 | |
| Microsoft Surface Laptop 7 13.8 Copilot+ | |
| LibreOffice / 20 Documents To PDF | |
| Microsoft Surface Laptop 7 13.8 Copilot+ | |
| Media AMD Ryzen AI 7 PRO 350 (50.7 - 93.1, n=6) | |
| Dell Pro 13 Premium PA13250 | |
| Media della classe Subnotebook (39.9 - 220, n=55, ultimi 2 anni) | |
| Lenovo ThinkPad X13 G6 AMD | |
| MSI Prestige 13 AI Plus Evo A2VMG | |
| Lenovo ThinkPad X1 Carbon Gen 13 21NS0010GE | |
| R Benchmark 2.5 / Overall mean | |
| Microsoft Surface Laptop 7 13.8 Copilot+ | |
| Media della classe Subnotebook (0.4024 - 1.456, n=57, ultimi 2 anni) | |
| Media AMD Ryzen AI 7 PRO 350 (0.4136 - 0.733, n=6) | |
| MSI Prestige 13 AI Plus Evo A2VMG | |
| Lenovo ThinkPad X1 Carbon Gen 13 21NS0010GE | |
| Lenovo ThinkPad X13 G6 AMD | |
| Dell Pro 13 Premium PA13250 | |
* ... Meglio usare valori piccoli
AIDA64: FP32 Ray-Trace | FPU Julia | CPU SHA3 | CPU Queen | FPU SinJulia | FPU Mandel | CPU AES | CPU ZLib | FP64 Ray-Trace | CPU PhotoWorxx
| Performance rating | |
| Lenovo ThinkPad X13 G6 AMD | |
| Media AMD Ryzen AI 7 PRO 350 | |
| Media della classe Subnotebook | |
| MSI Prestige 13 AI Plus Evo A2VMG | |
| Lenovo ThinkPad X1 Carbon Gen 13 21NS0010GE | |
| Dell Pro 13 Premium PA13250 | |
| Microsoft Surface Laptop 7 13.8 Copilot+ | |
| AIDA64 / FP32 Ray-Trace | |
| Lenovo ThinkPad X13 G6 AMD | |
| Media AMD Ryzen AI 7 PRO 350 (20019 - 24795, n=7) | |
| Media della classe Subnotebook (1135 - 32888, n=57, ultimi 2 anni) | |
| MSI Prestige 13 AI Plus Evo A2VMG | |
| Dell Pro 13 Premium PA13250 | |
| Lenovo ThinkPad X1 Carbon Gen 13 21NS0010GE | |
| Microsoft Surface Laptop 7 13.8 Copilot+ | |
| AIDA64 / FPU Julia | |
| Lenovo ThinkPad X13 G6 AMD | |
| Media AMD Ryzen AI 7 PRO 350 (74210 - 94532, n=7) | |
| MSI Prestige 13 AI Plus Evo A2VMG | |
| Media della classe Subnotebook (5218 - 123315, n=57, ultimi 2 anni) | |
| Lenovo ThinkPad X1 Carbon Gen 13 21NS0010GE | |
| Dell Pro 13 Premium PA13250 | |
| Microsoft Surface Laptop 7 13.8 Copilot+ | |
| AIDA64 / CPU SHA3 | |
| Lenovo ThinkPad X13 G6 AMD | |
| Media AMD Ryzen AI 7 PRO 350 (3434 - 4091, n=7) | |
| Media della classe Subnotebook (444 - 5287, n=57, ultimi 2 anni) | |
| Microsoft Surface Laptop 7 13.8 Copilot+ | |
| MSI Prestige 13 AI Plus Evo A2VMG | |
| Lenovo ThinkPad X1 Carbon Gen 13 21NS0010GE | |
| Dell Pro 13 Premium PA13250 | |
| AIDA64 / CPU Queen | |
| Media AMD Ryzen AI 7 PRO 350 (73484 - 77055, n=6) | |
| Lenovo ThinkPad X13 G6 AMD | |
| Microsoft Surface Laptop 7 13.8 Copilot+ | |
| Media della classe Subnotebook (10579 - 95002, n=49, ultimi 2 anni) | |
| MSI Prestige 13 AI Plus Evo A2VMG | |
| Lenovo ThinkPad X1 Carbon Gen 13 21NS0010GE | |
| Dell Pro 13 Premium PA13250 | |
| AIDA64 / FPU SinJulia | |
| Lenovo ThinkPad X13 G6 AMD | |
| Media AMD Ryzen AI 7 PRO 350 (12252 - 13653, n=7) | |
| Media della classe Subnotebook (744 - 18418, n=57, ultimi 2 anni) | |
| MSI Prestige 13 AI Plus Evo A2VMG | |
| Dell Pro 13 Premium PA13250 | |
| Lenovo ThinkPad X1 Carbon Gen 13 21NS0010GE | |
| Microsoft Surface Laptop 7 13.8 Copilot+ | |
| AIDA64 / FPU Mandel | |
| Lenovo ThinkPad X13 G6 AMD | |
| Media AMD Ryzen AI 7 PRO 350 (39707 - 50597, n=7) | |
| MSI Prestige 13 AI Plus Evo A2VMG | |
| Media della classe Subnotebook (3341 - 65433, n=57, ultimi 2 anni) | |
| Lenovo ThinkPad X1 Carbon Gen 13 21NS0010GE | |
| Dell Pro 13 Premium PA13250 | |
| Microsoft Surface Laptop 7 13.8 Copilot+ | |
| AIDA64 / CPU AES | |
| Lenovo ThinkPad X13 G6 AMD | |
| Media AMD Ryzen AI 7 PRO 350 (65710 - 82843, n=7) | |
| Microsoft Surface Laptop 7 13.8 Copilot+ | |
| Media della classe Subnotebook (638 - 96917, n=57, ultimi 2 anni) | |
| MSI Prestige 13 AI Plus Evo A2VMG | |
| Lenovo ThinkPad X1 Carbon Gen 13 21NS0010GE | |
| Dell Pro 13 Premium PA13250 | |
| AIDA64 / CPU ZLib | |
| Lenovo ThinkPad X13 G6 AMD | |
| Media AMD Ryzen AI 7 PRO 350 (834 - 1029, n=7) | |
| Media della classe Subnotebook (164.9 - 1379, n=57, ultimi 2 anni) | |
| Microsoft Surface Laptop 7 13.8 Copilot+ | |
| MSI Prestige 13 AI Plus Evo A2VMG | |
| Lenovo ThinkPad X1 Carbon Gen 13 21NS0010GE | |
| Dell Pro 13 Premium PA13250 | |
| AIDA64 / FP64 Ray-Trace | |
| Lenovo ThinkPad X13 G6 AMD | |
| Media AMD Ryzen AI 7 PRO 350 (10760 - 13384, n=7) | |
| Media della classe Subnotebook (610 - 17495, n=57, ultimi 2 anni) | |
| MSI Prestige 13 AI Plus Evo A2VMG | |
| Dell Pro 13 Premium PA13250 | |
| Lenovo ThinkPad X1 Carbon Gen 13 21NS0010GE | |
| Microsoft Surface Laptop 7 13.8 Copilot+ | |
| AIDA64 / CPU PhotoWorxx | |
| MSI Prestige 13 AI Plus Evo A2VMG | |
| Lenovo ThinkPad X1 Carbon Gen 13 21NS0010GE | |
| Media della classe Subnotebook (6569 - 85600, n=57, ultimi 2 anni) | |
| Dell Pro 13 Premium PA13250 | |
| Lenovo ThinkPad X13 G6 AMD | |
| Microsoft Surface Laptop 7 13.8 Copilot+ | |
| Media AMD Ryzen AI 7 PRO 350 (26358 - 43805, n=7) | |
Prestazioni del sistema
Il ThinkPad X13 G6 è una macchina molto reattiva e non abbiamo riscontrato problemi di stabilità in nessun momento del periodo di test.
PCMark 10: Score | Essentials | Productivity | Digital Content Creation
CrossMark: Overall | Productivity | Creativity | Responsiveness
WebXPRT 3: Overall
WebXPRT 4: Overall
Mozilla Kraken 1.1: Total
| Performance rating | |
| Lenovo ThinkPad X1 Carbon Gen 13 21NS0010GE -1! | |
| Lenovo ThinkPad X13 G6 AMD | |
| Media della classe Subnotebook | |
| MSI Prestige 13 AI Plus Evo A2VMG | |
| Media AMD Ryzen AI 7 PRO 350, AMD Radeon 860M | |
| Dell Pro 13 Premium PA13250 | |
| Microsoft Surface Laptop 7 13.8 Copilot+ -4! | |
| PCMark 10 / Score | |
| Lenovo ThinkPad X13 G6 AMD | |
| Media AMD Ryzen AI 7 PRO 350, AMD Radeon 860M (6888 - 7626, n=6) | |
| Lenovo ThinkPad X1 Carbon Gen 13 21NS0010GE | |
| Media della classe Subnotebook (4920 - 9939, n=44, ultimi 2 anni) | |
| MSI Prestige 13 AI Plus Evo A2VMG | |
| Dell Pro 13 Premium PA13250 | |
| PCMark 10 / Essentials | |
| Media AMD Ryzen AI 7 PRO 350, AMD Radeon 860M (10671 - 11594, n=6) | |
| Lenovo ThinkPad X13 G6 AMD | |
| Lenovo ThinkPad X1 Carbon Gen 13 21NS0010GE | |
| Media della classe Subnotebook (8552 - 11646, n=44, ultimi 2 anni) | |
| MSI Prestige 13 AI Plus Evo A2VMG | |
| Dell Pro 13 Premium PA13250 | |
| PCMark 10 / Productivity | |
| Media AMD Ryzen AI 7 PRO 350, AMD Radeon 860M (9823 - 10925, n=6) | |
| Lenovo ThinkPad X13 G6 AMD | |
| Media della classe Subnotebook (5435 - 16606, n=44, ultimi 2 anni) | |
| Lenovo ThinkPad X1 Carbon Gen 13 21NS0010GE | |
| Dell Pro 13 Premium PA13250 | |
| MSI Prestige 13 AI Plus Evo A2VMG | |
| PCMark 10 / Digital Content Creation | |
| Lenovo ThinkPad X1 Carbon Gen 13 21NS0010GE | |
| MSI Prestige 13 AI Plus Evo A2VMG | |
| Media della classe Subnotebook (5722 - 13779, n=44, ultimi 2 anni) | |
| Lenovo ThinkPad X13 G6 AMD | |
| Dell Pro 13 Premium PA13250 | |
| Media AMD Ryzen AI 7 PRO 350, AMD Radeon 860M (8441 - 9503, n=6) | |
| CrossMark / Overall | |
| Lenovo ThinkPad X13 G6 AMD | |
| Lenovo ThinkPad X1 Carbon Gen 13 21NS0010GE | |
| MSI Prestige 13 AI Plus Evo A2VMG | |
| Media AMD Ryzen AI 7 PRO 350, AMD Radeon 860M (1426 - 1851, n=6) | |
| Media della classe Subnotebook (365 - 2356, n=59, ultimi 2 anni) | |
| Dell Pro 13 Premium PA13250 | |
| Microsoft Surface Laptop 7 13.8 Copilot+ | |
| CrossMark / Productivity | |
| Lenovo ThinkPad X13 G6 AMD | |
| Lenovo ThinkPad X1 Carbon Gen 13 21NS0010GE | |
| MSI Prestige 13 AI Plus Evo A2VMG | |
| Media AMD Ryzen AI 7 PRO 350, AMD Radeon 860M (1256 - 1702, n=6) | |
| Dell Pro 13 Premium PA13250 | |
| Media della classe Subnotebook (364 - 2277, n=59, ultimi 2 anni) | |
| Microsoft Surface Laptop 7 13.8 Copilot+ | |
| CrossMark / Creativity | |
| Lenovo ThinkPad X13 G6 AMD | |
| Media AMD Ryzen AI 7 PRO 350, AMD Radeon 860M (1734 - 2174, n=6) | |
| Lenovo ThinkPad X1 Carbon Gen 13 21NS0010GE | |
| MSI Prestige 13 AI Plus Evo A2VMG | |
| Dell Pro 13 Premium PA13250 | |
| Media della classe Subnotebook (372 - 2743, n=59, ultimi 2 anni) | |
| Microsoft Surface Laptop 7 13.8 Copilot+ | |
| CrossMark / Responsiveness | |
| Lenovo ThinkPad X13 G6 AMD | |
| Media AMD Ryzen AI 7 PRO 350, AMD Radeon 860M (1161 - 1472, n=6) | |
| Media della classe Subnotebook (312 - 1854, n=59, ultimi 2 anni) | |
| Microsoft Surface Laptop 7 13.8 Copilot+ | |
| Lenovo ThinkPad X1 Carbon Gen 13 21NS0010GE | |
| MSI Prestige 13 AI Plus Evo A2VMG | |
| Dell Pro 13 Premium PA13250 | |
| WebXPRT 3 / Overall | |
| Microsoft Surface Laptop 7 13.8 Copilot+ | |
| Media della classe Subnotebook (156 - 530, n=55, ultimi 2 anni) | |
| MSI Prestige 13 AI Plus Evo A2VMG | |
| Media AMD Ryzen AI 7 PRO 350, AMD Radeon 860M (250 - 320, n=6) | |
| Dell Pro 13 Premium PA13250 | |
| Lenovo ThinkPad X13 G6 AMD | |
| WebXPRT 4 / Overall | |
| Microsoft Surface Laptop 7 13.8 Copilot+ | |
| MSI Prestige 13 AI Plus Evo A2VMG | |
| Lenovo ThinkPad X1 Carbon Gen 13 21NS0010GE | |
| Media della classe Subnotebook (132 - 378, n=60, ultimi 2 anni) | |
| Dell Pro 13 Premium PA13250 | |
| Media AMD Ryzen AI 7 PRO 350, AMD Radeon 860M (166.3 - 270, n=6) | |
| Lenovo ThinkPad X13 G6 AMD | |
| Mozilla Kraken 1.1 / Total | |
| Media AMD Ryzen AI 7 PRO 350, AMD Radeon 860M (446 - 749, n=6) | |
| Lenovo ThinkPad X13 G6 AMD | |
| Dell Pro 13 Premium PA13250 | |
| Media della classe Subnotebook (234 - 1104, n=60, ultimi 2 anni) | |
| MSI Prestige 13 AI Plus Evo A2VMG | |
| Lenovo ThinkPad X1 Carbon Gen 13 21NS0010GE | |
| Microsoft Surface Laptop 7 13.8 Copilot+ | |
* ... Meglio usare valori piccoli
| PCMark 10 Score | 7271 punti | |
Aiuto | ||
| AIDA64 / Memory Copy | |
| Lenovo ThinkPad X1 Carbon Gen 13 21NS0010GE | |
| MSI Prestige 13 AI Plus Evo A2VMG | |
| Dell Pro 13 Premium PA13250 | |
| Media della classe Subnotebook (14554 - 131023, n=57, ultimi 2 anni) | |
| Lenovo ThinkPad X13 G6 AMD | |
| Media AMD Ryzen AI 7 PRO 350 (36835 - 83623, n=7) | |
| Microsoft Surface Laptop 7 13.8 Copilot+ | |
| AIDA64 / Memory Read | |
| Microsoft Surface Laptop 7 13.8 Copilot+ | |
| Lenovo ThinkPad X1 Carbon Gen 13 21NS0010GE | |
| MSI Prestige 13 AI Plus Evo A2VMG | |
| Media della classe Subnotebook (15948 - 127174, n=57, ultimi 2 anni) | |
| Dell Pro 13 Premium PA13250 | |
| Lenovo ThinkPad X13 G6 AMD | |
| Media AMD Ryzen AI 7 PRO 350 (42869 - 63536, n=7) | |
| AIDA64 / Memory Write | |
| Lenovo ThinkPad X1 Carbon Gen 13 21NS0010GE | |
| MSI Prestige 13 AI Plus Evo A2VMG | |
| Dell Pro 13 Premium PA13250 | |
| Lenovo ThinkPad X13 G6 AMD | |
| Media della classe Subnotebook (15709 - 135141, n=57, ultimi 2 anni) | |
| Media AMD Ryzen AI 7 PRO 350 (39737 - 104146, n=7) | |
| Microsoft Surface Laptop 7 13.8 Copilot+ | |
| AIDA64 / Memory Latency | |
| Lenovo ThinkPad X13 G6 AMD | |
| Media AMD Ryzen AI 7 PRO 350 (103.2 - 119.1, n=7) | |
| Dell Pro 13 Premium PA13250 | |
| MSI Prestige 13 AI Plus Evo A2VMG | |
| Media della classe Subnotebook (6.1 - 159.9, n=55, ultimi 2 anni) | |
| Lenovo ThinkPad X1 Carbon Gen 13 21NS0010GE | |
| Microsoft Surface Laptop 7 13.8 Copilot+ | |
* ... Meglio usare valori piccoli
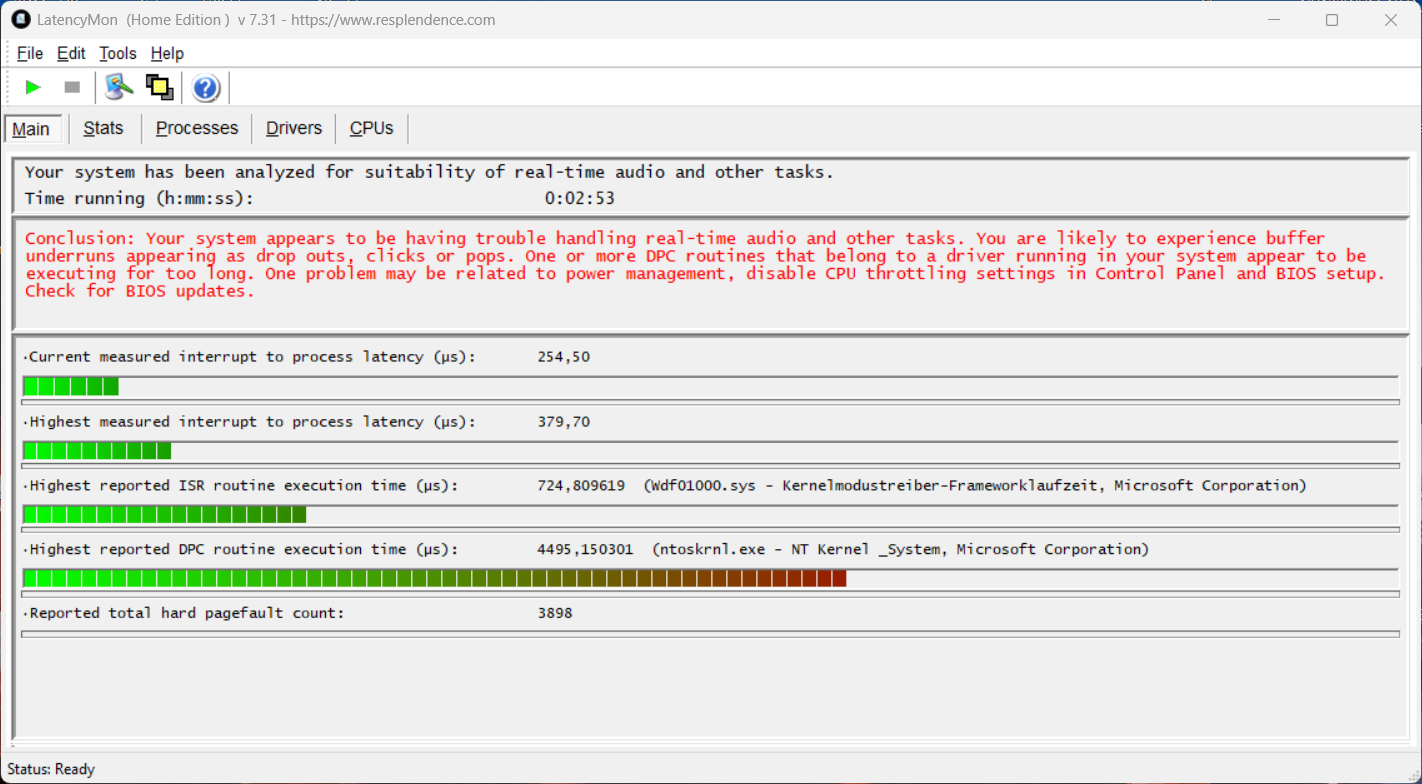
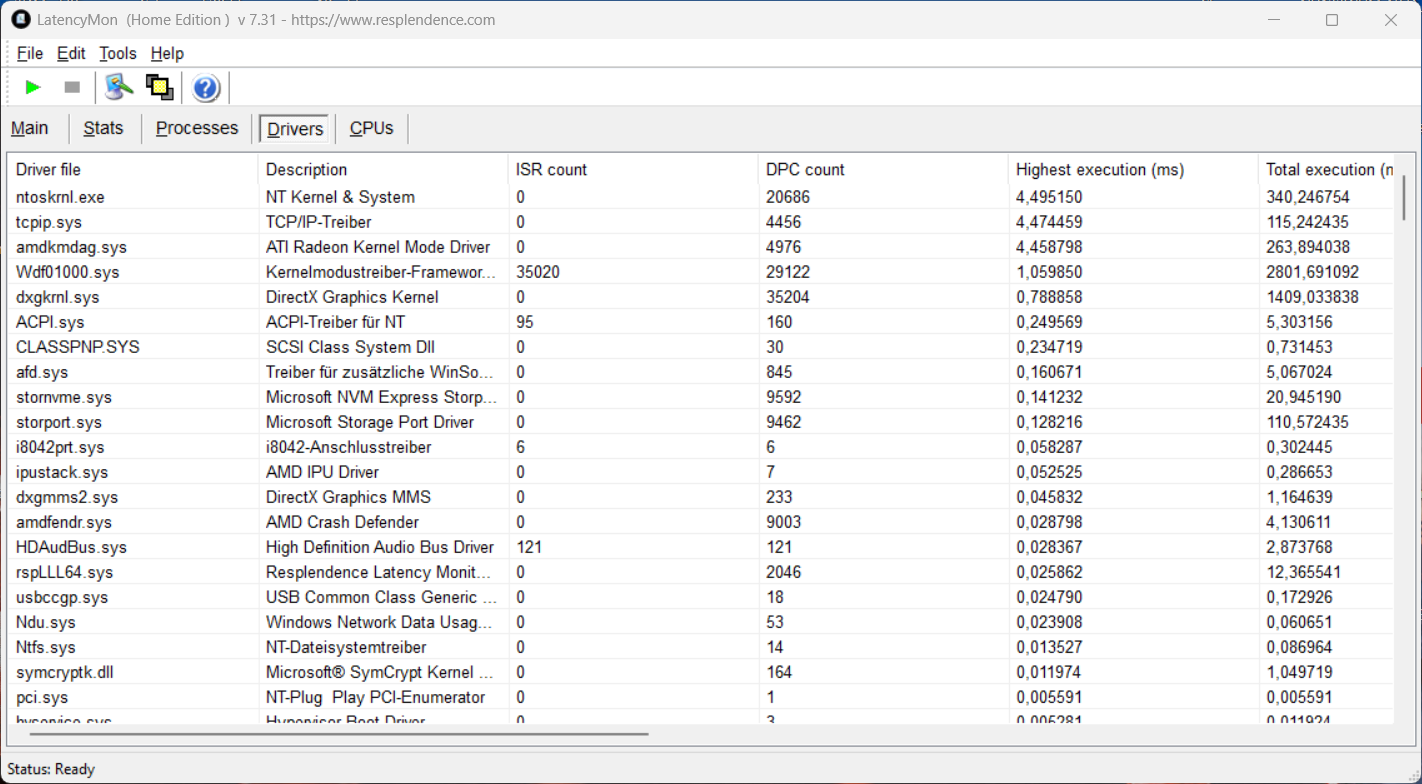
Latenze DPC
Nel nostro test di latenza standardizzato (navigazione web, riproduzione di YouTube 4K, carico della CPU), l'unità di recensione mostra dei limiti per le applicazioni audio in tempo reale con l'attuale versione del BIOS.
| DPC Latencies / LatencyMon - interrupt to process latency (max), Web, Youtube, Prime95 | |
| Dell Pro 13 Premium PA13250 | |
| Lenovo ThinkPad X1 Carbon Gen 13 21NS0010GE | |
| MSI Prestige 13 AI Plus Evo A2VMG | |
| Lenovo ThinkPad X13 G6 AMD | |
* ... Meglio usare valori piccoli
Conservazione
L'SSD da 1 TB di Western Digital (872 GB liberi) offre elevate velocità di trasferimento, anche se le prestazioni non sono completamente stabili sotto carico sostenuto. Nell'uso quotidiano, tuttavia, l'impatto è limitato.

* ... Meglio usare valori piccoli
Prestazioni di lettura sostenute: Ciclo di lettura DiskSpd, profondità di coda 8
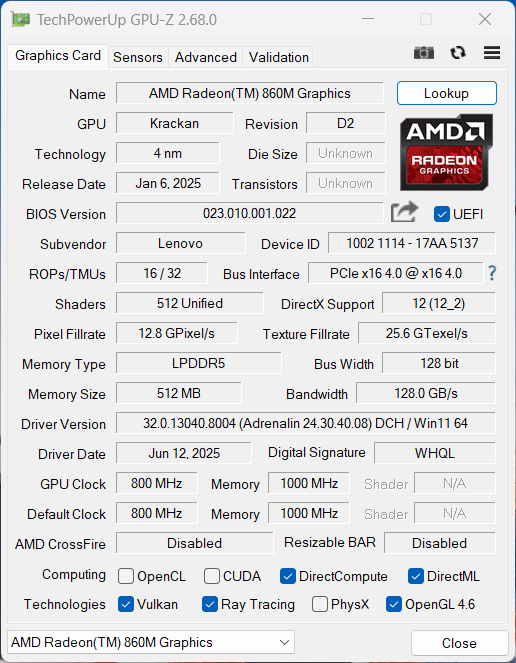
Prestazioni della GPU
L'uscita grafica è gestita dalla AMD Radeon 860Mche offre prestazioni rispettabili, ma non riesce a tenere il passo con i suoi concorrenti Lunar Lake. Le prestazioni della GPU rimangono stabili con l'alimentazione a batteria, anche se c'è un leggero calo sotto carico sostenuto (circa -10%).
| 3DMark 11 Performance | 10993 punti | |
| 3DMark Fire Strike Score | 6707 punti | |
| 3DMark Time Spy Score | 3129 punti | |
| 3DMark Steel Nomad Score | 462 punti | |
| 3DMark Steel Nomad Light Score | 2454 punti | |
Aiuto | ||
| Blender / v3.3 Classroom CPU | |
| Dell Pro 13 Premium PA13250 | |
| Lenovo ThinkPad X1 Carbon Gen 13 21NS0010GE | |
| Microsoft Surface Laptop 7 13.8 Copilot+ | |
| MSI Prestige 13 AI Plus Evo A2VMG | |
| Media della classe Subnotebook (241 - 861, n=59, ultimi 2 anni) | |
| Lenovo ThinkPad X13 G6 AMD | |
| Media AMD Radeon 860M (280 - 427, n=21) | |
| Blender / v3.3 Classroom oneAPI/Intel | |
| Dell Pro 13 Premium PA13250 | |
| Media della classe Subnotebook (105 - 396, n=11, ultimi 2 anni) | |
| Lenovo ThinkPad X1 Carbon Gen 13 21NS0010GE | |
| MSI Prestige 13 AI Plus Evo A2VMG | |
* ... Meglio usare valori piccoli
| Strange Brigade - 1920x1080 ultra AA:ultra AF:16 | |
| Dell Pro 13 Premium PA13250 | |
| MSI Prestige 13 AI Plus Evo A2VMG | |
| Media della classe Subnotebook (19 - 101.3, n=49, ultimi 2 anni) | |
| Lenovo ThinkPad X13 G6 AMD | |
| Microsoft Surface Laptop 7 13.8 Copilot+ | |
Cyberpunk 2077 Ultra - Grafico FPS
| basso | medio | alto | ultra | |
|---|---|---|---|---|
| GTA V (2015) | 167.1 | 158.3 | 67 | 27.9 |
| Dota 2 Reborn (2015) | 155 | 133.6 | 77.2 | 69.6 |
| Final Fantasy XV Benchmark (2018) | 70.2 | 32.4 | 22.3 | |
| X-Plane 11.11 (2018) | 62.2 | 48 | 38.8 | |
| Strange Brigade (2018) | 161.1 | 62.8 | 52.1 | 41.7 |
| Baldur's Gate 3 (2023) | 31.7 | 25.2 | 20.4 | 19.8 |
| Cyberpunk 2077 (2023) | 32.4 | 24.9 | 20 | 16.4 |
| F1 24 (2024) | 60.4 | 56.8 | 42.1 | 8.82 |
Emissioni ed energia
Emissioni di rumore

In generale, il ThinkPad X13 è una macchina molto silenziosa. Quando sono richieste le massime prestazioni della CPU, la ventola diventa chiaramente udibile a poco meno di 40 dB(A). Nelle altre due modalità di alimentazione, tuttavia, rimane sensibilmente più silenziosa (Bilanciato: 33,5 dB(A), Migliore efficienza energetica: 29,3 dB(A)). Non abbiamo osservato altri rumori elettronici sull'unità in prova.
Rumorosità
| Idle |
| 24.1 / 24.1 / 25.5 dB(A) |
| Sotto carico |
| 32.8 / 39.7 dB(A) |
 | ||
30 dB silenzioso 40 dB(A) udibile 50 dB(A) rumoroso |
||
min: | ||
| Lenovo ThinkPad X13 G6 AMD Ryzen AI 7 PRO 350, Radeon 860M | Dell Pro 13 Premium PA13250 Core Ultra 7 268V, Arc 140V | MSI Prestige 13 AI Plus Evo A2VMG Core Ultra 7 258V, Arc 140V | Microsoft Surface Laptop 7 13.8 Copilot+ SD X Elite X1E-80-100, Adreno X1-85 3.8 TFLOPS | Lenovo ThinkPad X1 Carbon Gen 13 21NS0010GE Core Ultra 7 258V, Arc 140V | |
|---|---|---|---|---|---|
| Noise | -1% | -9% | 7% | 3% | |
| off /ambiente * (dB) | 24.1 | 23 5% | 24.1 -0% | 23.8 1% | 23.2 4% |
| Idle Minimum * (dB) | 24.1 | 23 5% | 24.8 -3% | 23.8 1% | 23.2 4% |
| Idle Average * (dB) | 24.1 | 23 5% | 24.8 -3% | 23.8 1% | 23.2 4% |
| Idle Maximum * (dB) | 25.5 | 23 10% | 26.7 -5% | 23.8 7% | 23.2 9% |
| Load Average * (dB) | 32.8 | 37 -13% | 36.8 -12% | 26 21% | 29.9 9% |
| Cyberpunk 2077 ultra * (dB) | 39.7 | 42.74 -8% | 44.5 -12% | 31.5 21% | 43.3 -9% |
| Load Maximum * (dB) | 39.7 | 42.74 -8% | 50.8 -28% | 40.3 -2% | 40.5 -2% |
* ... Meglio usare valori piccoli
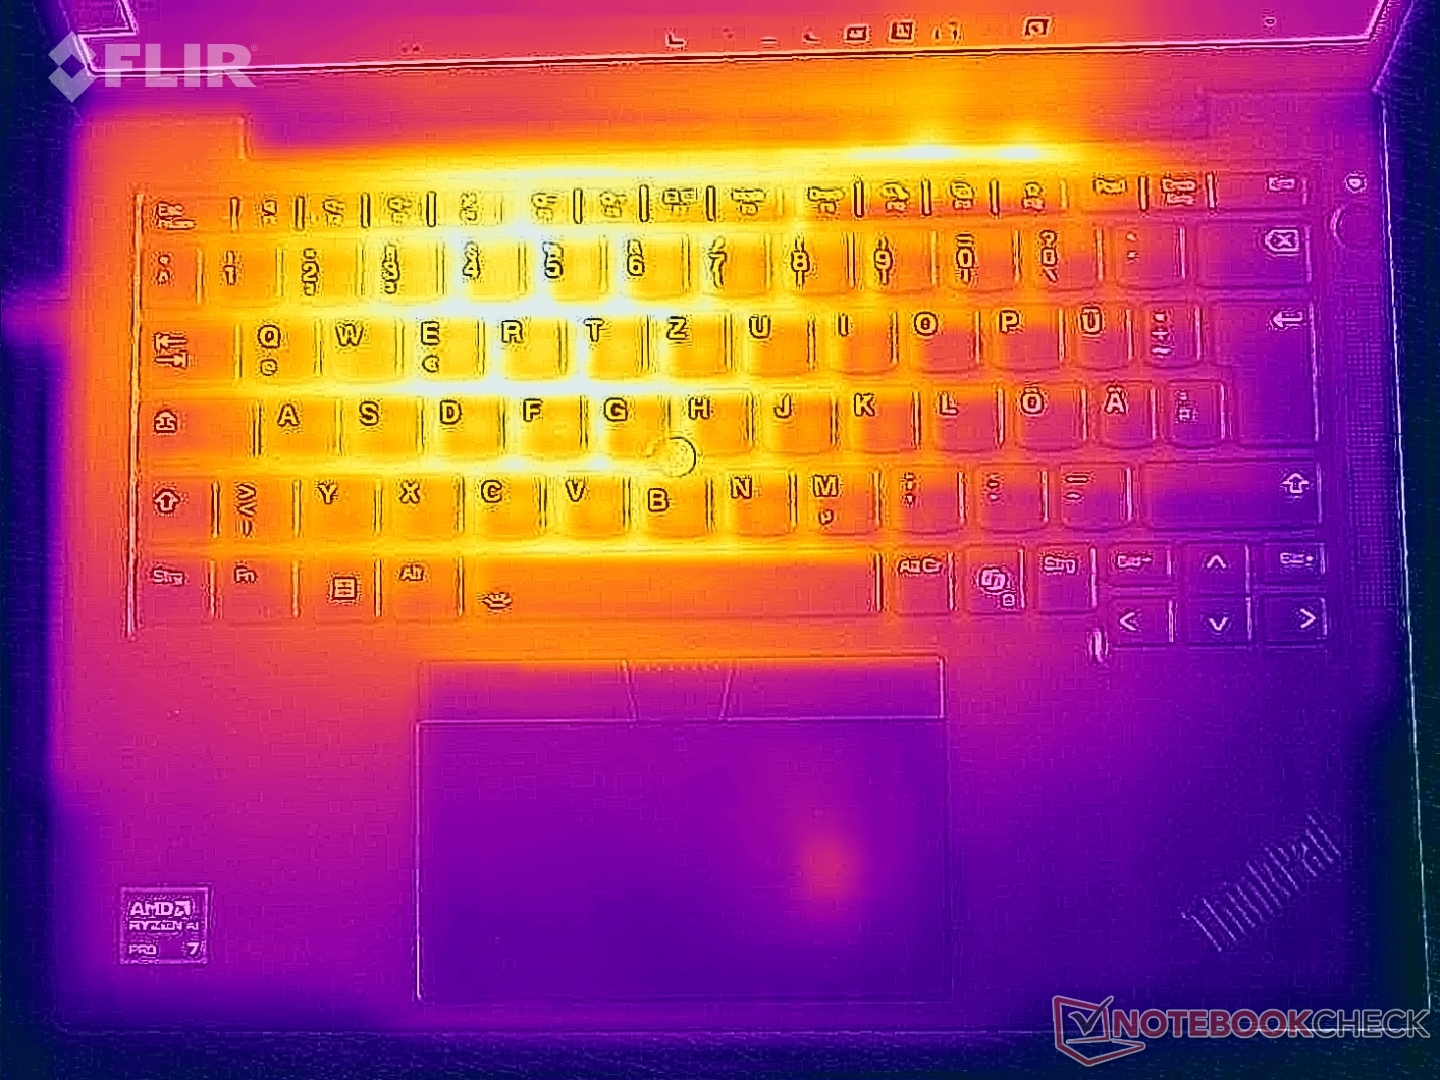
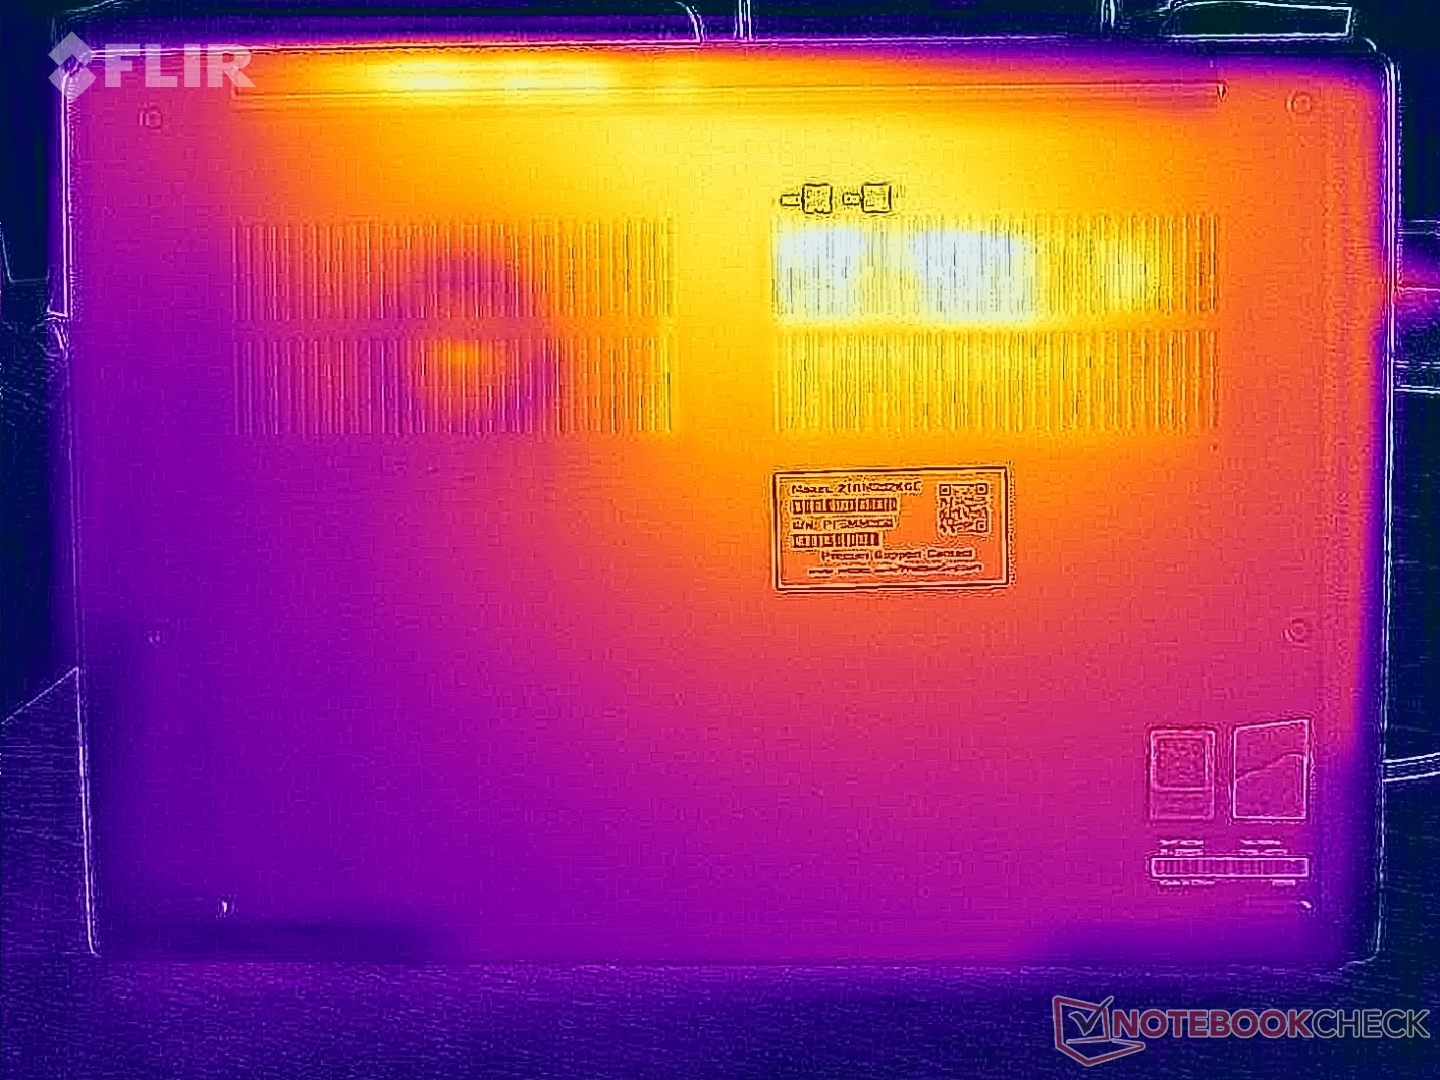
Temperatura
Le temperature di superficie non pongono problemi, né nell'uso quotidiano né sotto carico massimo. Nel test di stress con carico combinato di CPU e GPU, il processore si assesta rapidamente a circa 22 watt.

(±) La temperatura massima sul lato superiore è di 43.5 °C / 110 F, rispetto alla media di 35.9 °C / 97 F, che varia da 21.4 a 59 °C per questa classe Subnotebook.
(-) Il lato inferiore si riscalda fino ad un massimo di 45.9 °C / 115 F, rispetto alla media di 39.2 °C / 103 F
(+) In idle, la temperatura media del lato superiore è di 23.5 °C / 74 F, rispetto alla media deld ispositivo di 30.8 °C / 87 F.
(±) 3: The average temperature for the upper side is 35.2 °C / 95 F, compared to the average of 30.8 °C / 87 F for the class Subnotebook.
(+) I poggiapolsi e il touchpad sono piu' freddi della temperatura della pelle con un massimo di 27.8 °C / 82 F e sono quindi freddi al tatto.
(±) La temperatura media della zona del palmo della mano di dispositivi simili e'stata di 28.2 °C / 82.8 F (+0.4 °C / 0.8 F).
| Lenovo ThinkPad X13 G6 AMD Ryzen AI 7 PRO 350, Radeon 860M | Dell Pro 13 Premium PA13250 Core Ultra 7 268V, Arc 140V | MSI Prestige 13 AI Plus Evo A2VMG Core Ultra 7 258V, Arc 140V | Microsoft Surface Laptop 7 13.8 Copilot+ SD X Elite X1E-80-100, Adreno X1-85 3.8 TFLOPS | Lenovo ThinkPad X1 Carbon Gen 13 21NS0010GE Core Ultra 7 258V, Arc 140V | |
|---|---|---|---|---|---|
| Heat | 16% | -1% | -2% | -4% | |
| Maximum Upper Side * (°C) | 43.5 | 31 29% | 43.4 -0% | 47.1 -8% | 42.3 3% |
| Maximum Bottom * (°C) | 45.9 | 31 32% | 42.4 8% | 44.6 3% | 40.1 13% |
| Idle Upper Side * (°C) | 23.9 | 24 -0% | 25.4 -6% | 24.7 -3% | 27.3 -14% |
| Idle Bottom * (°C) | 24.2 | 24 1% | 25.6 -6% | 24.5 -1% | 28.3 -17% |
* ... Meglio usare valori piccoli
Altoparlanti
I diffusori non offrono molto di cui entusiasmarsi. La riproduzione vocale è accettabile, ma per qualsiasi altra cosa consigliamo di utilizzare cuffie o altoparlanti esterni.
Lenovo ThinkPad X13 G6 AMD analisi audio
(±) | potenza degli altiparlanti media ma buona (78.2 dB)
Bassi 100 - 315 Hz
(-) | quasi nessun basso - in media 15.8% inferiori alla media
(±) | la linearità dei bassi è media (9.3% delta rispetto alla precedente frequenza)
Medi 400 - 2000 Hz
(±) | medi elevati - circa 6.9% superiore alla media
(+) | medi lineari (5.1% delta rispetto alla precedente frequenza)
Alti 2 - 16 kHz
(±) | alti elevati - circa 6.2% superiori alla media
(+) | alti lineari (4.5% delta rispetto alla precedente frequenza)
Nel complesso 100 - 16.000 Hz
(±) | la linearità complessiva del suono è media (21.8% di differenza rispetto alla media
Rispetto alla stessa classe
» 73% di tutti i dispositivi testati in questa classe è stato migliore, 6% simile, 20% peggiore
» Il migliore ha avuto un delta di 5%, medio di 18%, peggiore di 53%
Rispetto a tutti i dispositivi testati
» 62% di tutti i dispositivi testati in questa classe è stato migliore, 7% similare, 31% peggiore
» Il migliore ha avuto un delta di 4%, medio di 23%, peggiore di 134%
Dell Pro 13 Premium PA13250 analisi audio
(+) | gli altoparlanti sono relativamente potenti (87.49 dB)
Bassi 100 - 315 Hz
(-) | quasi nessun basso - in media 15.9% inferiori alla media
(±) | la linearità dei bassi è media (8.3% delta rispetto alla precedente frequenza)
Medi 400 - 2000 Hz
(+) | medi bilanciati - solo only 2.9% rispetto alla media
(+) | medi lineari (4.7% delta rispetto alla precedente frequenza)
Alti 2 - 16 kHz
(±) | alti ridotti - circa 5.2% inferiori alla media
(±) | la linearità degli alti è media (7.1% delta rispetto alla precedente frequenza)
Nel complesso 100 - 16.000 Hz
(+) | suono nel complesso lineare (12.2% differenza dalla media)
Rispetto alla stessa classe
» 15% di tutti i dispositivi testati in questa classe è stato migliore, 5% simile, 81% peggiore
» Il migliore ha avuto un delta di 5%, medio di 18%, peggiore di 53%
Rispetto a tutti i dispositivi testati
» 10% di tutti i dispositivi testati in questa classe è stato migliore, 2% similare, 88% peggiore
» Il migliore ha avuto un delta di 4%, medio di 23%, peggiore di 134%
MSI Prestige 13 AI Plus Evo A2VMG analisi audio
(+) | gli altoparlanti sono relativamente potenti (84.5 dB)
Bassi 100 - 315 Hz
(-) | quasi nessun basso - in media 19.4% inferiori alla media
(±) | la linearità dei bassi è media (9.6% delta rispetto alla precedente frequenza)
Medi 400 - 2000 Hz
(±) | medi elevati - circa 6.4% superiore alla media
(+) | medi lineari (5.1% delta rispetto alla precedente frequenza)
Alti 2 - 16 kHz
(±) | alti elevati - circa 6.1% superiori alla media
(+) | alti lineari (4.6% delta rispetto alla precedente frequenza)
Nel complesso 100 - 16.000 Hz
(±) | la linearità complessiva del suono è media (18.2% di differenza rispetto alla media
Rispetto alla stessa classe
» 52% di tutti i dispositivi testati in questa classe è stato migliore, 7% simile, 40% peggiore
» Il migliore ha avuto un delta di 5%, medio di 18%, peggiore di 53%
Rispetto a tutti i dispositivi testati
» 39% di tutti i dispositivi testati in questa classe è stato migliore, 8% similare, 53% peggiore
» Il migliore ha avuto un delta di 4%, medio di 23%, peggiore di 134%
Microsoft Surface Laptop 7 13.8 Copilot+ analisi audio
(±) | potenza degli altiparlanti media ma buona (81.8 dB)
Bassi 100 - 315 Hz
(±) | bassi ridotti - in media 12.7% inferiori alla media
(±) | la linearità dei bassi è media (9.8% delta rispetto alla precedente frequenza)
Medi 400 - 2000 Hz
(+) | medi bilanciati - solo only 4.1% rispetto alla media
(+) | medi lineari (2.4% delta rispetto alla precedente frequenza)
Alti 2 - 16 kHz
(+) | Alti bilanciati - appena 2.1% dalla media
(+) | alti lineari (2.5% delta rispetto alla precedente frequenza)
Nel complesso 100 - 16.000 Hz
(+) | suono nel complesso lineare (12.1% differenza dalla media)
Rispetto alla stessa classe
» 14% di tutti i dispositivi testati in questa classe è stato migliore, 5% simile, 81% peggiore
» Il migliore ha avuto un delta di 5%, medio di 18%, peggiore di 53%
Rispetto a tutti i dispositivi testati
» 10% di tutti i dispositivi testati in questa classe è stato migliore, 2% similare, 88% peggiore
» Il migliore ha avuto un delta di 4%, medio di 23%, peggiore di 134%
Lenovo ThinkPad X1 Carbon Gen 13 21NS0010GE analisi audio
(+) | gli altoparlanti sono relativamente potenti (84.8 dB)
Bassi 100 - 315 Hz
(±) | bassi ridotti - in media 10.2% inferiori alla media
(±) | la linearità dei bassi è media (9.2% delta rispetto alla precedente frequenza)
Medi 400 - 2000 Hz
(±) | medi elevati - circa 8.9% superiore alla media
(+) | medi lineari (3.6% delta rispetto alla precedente frequenza)
Alti 2 - 16 kHz
(+) | Alti bilanciati - appena 4.3% dalla media
(+) | alti lineari (5.8% delta rispetto alla precedente frequenza)
Nel complesso 100 - 16.000 Hz
(±) | la linearità complessiva del suono è media (15% di differenza rispetto alla media
Rispetto alla stessa classe
» 33% di tutti i dispositivi testati in questa classe è stato migliore, 5% simile, 62% peggiore
» Il migliore ha avuto un delta di 5%, medio di 18%, peggiore di 53%
Rispetto a tutti i dispositivi testati
» 21% di tutti i dispositivi testati in questa classe è stato migliore, 4% similare, 75% peggiore
» Il migliore ha avuto un delta di 4%, medio di 23%, peggiore di 134%
Consumo di energia

Nonostante l'attenzione alla mobilità, il consumo energetico ha ancora un margine di miglioramento, soprattutto a basso carico. Il Dell Pro 13 Premium è notevolmente più efficiente in quest'area. Sotto carico registriamo un picco di poco meno di 66 watt, che si stabilizza rapidamente a circa 42 watt. L'alimentatore GaN molto compatto da 65 watt è quindi adeguatamente dimensionato.
| Off / Standby | |
| Idle | |
| Sotto carico |
|
Leggenda:
min: | |
| Lenovo ThinkPad X13 G6 AMD Ryzen AI 7 PRO 350, Radeon 860M, Western Digital PC SN8000S SDEPNRK-1T00, IPS, 1920x1200, 13.3" | Dell Pro 13 Premium PA13250 Core Ultra 7 268V, Arc 140V, Micron 2550 1TB, IPS, 1920x1200, 13.3" | MSI Prestige 13 AI Plus Evo A2VMG Core Ultra 7 258V, Arc 140V, , OLED, 2880x1800, 13.3" | Microsoft Surface Laptop 7 13.8 Copilot+ SD X Elite X1E-80-100, Adreno X1-85 3.8 TFLOPS, Samsung MZ9L4512HBLU-00BMV, IPS, 2304x1536, 13.8" | Lenovo ThinkPad X1 Carbon Gen 13 21NS0010GE Core Ultra 7 258V, Arc 140V, SK hynix PCB01 HFS001TFM9X179N GL, OLED, 2880x1800, 14" | Media AMD Radeon 860M | Media della classe Subnotebook | |
|---|---|---|---|---|---|---|---|
| Power Consumption | 19% | -12% | 19% | 1% | -20% | -11% | |
| Idle Minimum * (Watt) | 2.7 | 2 26% | 3.5 -30% | 1.4 48% | 4.7 -74% | 3.99 ? -48% | 3.76 ? -39% |
| Idle Average * (Watt) | 5.7 | 4.3 25% | 5.9 -4% | 6.3 -11% | 5.7 -0% | 6.72 ? -18% | 6.54 ? -15% |
| Idle Maximum * (Watt) | 6.3 | 4.75 25% | 10 -59% | 7.6 -21% | 6.1 3% | 7.32 ? -16% | 7.89 ? -25% |
| Load Average * (Watt) | 55.3 | 40 28% | 38.7 30% | 26.9 51% | 29.8 46% | 55.9 ? -1% | 42 ? 24% |
| Cyberpunk 2077 ultra * (Watt) | 41.2 | 36.4 12% | 46.3 -12% | 38.5 7% | 35.3 14% | ||
| Cyberpunk 2077 ultra external monitor * (Watt) | 39.1 | 38 3% | 45.6 -17% | 34.1 13% | |||
| Load Maximum * (Watt) | 65.6 | 57 13% | 61.5 6% | 40.7 38% | 60.1 8% | 75.4 ? -15% | 64.8 ? 1% |
* ... Meglio usare valori piccoli
consumo energetico Cyberpunk / Stress test
consumo energetico con monitor esterno
Durata della batteria
La batteria ha una capacità di 54,7 Wh, e nel nostro test Wi-Fi a 150 cd/m² abbiamo misurato una buona autonomia di poco più di 12 ore (o 8 ore e 20 minuti alla massima luminosità). Tuttavia, quasi tutti i concorrenti durano anche di più, in particolare il modello Dell.

Valutazione complessiva di Notebookcheck
Lenovo ThinkPad X13 G6 AMD
- 11/30/2025 v8
Andreas Osthoff
 Total Sustainability Score:
 Possibili alternative a confronto
Immagine | Modello | Prezzo | Peso | Altezza | Schermo |
|---|---|---|---|---|---|
1. 87.4%  | Lenovo ThinkPad X13 G6 AMD AMD Ryzen AI 7 PRO 350 ⎘ AMD Radeon 860M ⎘ 32 GB Memoria, 1024 GB SSD | Amazon: Prezzo di listino: 1855€ | 1.1 kg | 13 mm | 13.30" 1920x1200 170 PPI IPS |
2. 90%  | Dell Pro 13 Premium PA13250 Intel Core Ultra 7 268V ⎘ Intel Arc Graphics 140V ⎘ 32 GB Memoria, 1024 GB SSD | Amazon: Prezzo di listino: 2700 Euro | 1.1 kg | 17.2 mm | 13.30" 1920x1200 170 PPI IPS |
3. 85%  | MSI Prestige 13 AI Plus Evo A2VMG Intel Core Ultra 7 258V ⎘ Intel Arc Graphics 140V ⎘ 32 GB Memoria | Amazon: 1. $1,149.49 msi Prestige 13 AI Evo Lapto... 2. $31.99 CPU Cooling Fan Replacement ... 3. $1,349.00 HIDevolution [2024] MSI Pres... Prezzo di listino: 1400 USD | 970 gr | 16.9 mm | 13.30" 2880x1800 255 PPI OLED |
4. 86.2%  | Microsoft Surface Laptop 7 13.8 Copilot+ Qualcomm Snapdragon X Elite X1E-80-100 ⎘ Qualcomm SD X Adreno X1-85 3.8 TFLOPS ⎘ 16 GB Memoria, 512 GB SSD | Amazon: Prezzo di listino: 1649€ | 1.3 kg | 17.5 mm | 13.80" 2304x1536 201 PPI IPS |
5. 89.9%  | Lenovo ThinkPad X1 Carbon Gen 13 21NS0010GE Intel Core Ultra 7 258V ⎘ Intel Arc Graphics 140V ⎘ 32 GB Memoria, 1024 GB SSD | Amazon: 1. $1,899.00 Lenovo ThinkPad X1 Carbon Ge... 2. $1,699.99 Lenovo Gen 13 ThinkPad X1 Ca... 3. $1,599.99 Lenovo ThinkPad X1 Carbon Ge... Prezzo di listino: 2700 Euro | 982 gr | 16 mm | 14.00" 2880x1800 243 PPI OLED |
Transparency
La selezione dei dispositivi da recensire viene effettuata dalla nostra redazione. Il campione di prova è stato fornito all'autore come prestito dal produttore o dal rivenditore ai fini di questa recensione. L'istituto di credito non ha avuto alcuna influenza su questa recensione, né il produttore ne ha ricevuto una copia prima della pubblicazione. Non vi era alcun obbligo di pubblicare questa recensione. In quanto società mediatica indipendente, Notebookcheck non è soggetta all'autorità di produttori, rivenditori o editori.
Ecco come Notebookcheck esegue i test
Ogni anno, Notebookcheck esamina in modo indipendente centinaia di laptop e smartphone utilizzando procedure standardizzate per garantire che tutti i risultati siano comparabili. Da circa 20 anni sviluppiamo continuamente i nostri metodi di prova e nel frattempo stabiliamo gli standard di settore. Nei nostri laboratori di prova, tecnici ed editori esperti utilizzano apparecchiature di misurazione di alta qualità. Questi test comportano un processo di validazione in più fasi. Il nostro complesso sistema di valutazione si basa su centinaia di misurazioni e parametri di riferimento ben fondati, che mantengono l'obiettività.