Recensione breve del Portatile HP 15-ay116ng
| SD Card Reader | |
| average JPG Copy Test (av. of 3 runs) | |
| Dell Latitude 14 Rugged 5414 | |
| HP 250 G5 SP X0N33EA | |
| Acer Extensa 2520-59CD | |
| Dell Latitude 15-3570 | |
| HP 15-ay116ng | |
| Lenovo B50-50 80S2000QGE | |
| maximum AS SSD Seq Read Test (1GB) | |
| Dell Latitude 14 Rugged 5414 | |
| Lenovo B50-50 80S2000QGE | |
| Acer Extensa 2520-59CD | |
| HP 15-ay116ng | |
| Dell Latitude 15-3570 | |
| Networking | |
| iperf Server (receive) TCP 1 m | |
| HP 250 G5 SP X0N33EA (jseb) | |
| HP 15-ay116ng (jseb) | |
| iperf Client (transmit) TCP 1 m | |
| Acer Extensa 2520-59CD | |
| HP 250 G5 SP X0N33EA (jseb) | |
| HP 15-ay116ng (jseb) | |
| |||||||||||||||||||||||||
Distribuzione della luminosità: 89 %
Al centro con la batteria: 241 cd/m²
Contrasto: 566:1 (Nero: 0.44 cd/m²)
ΔE ColorChecker Calman: 11.71 | ∀{0.5-29.43 Ø4.71}
ΔE Greyscale Calman: 13.13 | ∀{0.09-98 Ø4.96}
56% sRGB (Argyll 1.6.3 3D)
36% AdobeRGB 1998 (Argyll 1.6.3 3D)
38.58% AdobeRGB 1998 (Argyll 3D)
56.2% sRGB (Argyll 3D)
37.34% Display P3 (Argyll 3D)
Gamma: 2.57
CCT: 15273 K
| HP 15-ay116ng TN LED, 1920x1080, 15.6" | HP 250 G5 SP X0N33EA TN, 1920x1080, 15.6" | Acer Extensa 2520-59CD TN LED, 1366x768, 15.6" | Lenovo B50-50 80S2000QGE TN LED, 1366x768, 15.6" | Dell Latitude 15-3570 TN LED, 1366x768, 15.6" | |
|---|---|---|---|---|---|
| Display | -2% | 9% | 0% | 9% | |
| Display P3 Coverage (%) | 37.34 | 36.51 -2% | 40.71 9% | 37.24 0% | 40.61 9% |
| sRGB Coverage (%) | 56.2 | 55 -2% | 61.1 9% | 56 0% | 61.1 9% |
| AdobeRGB 1998 Coverage (%) | 38.58 | 37.72 -2% | 42.07 9% | 38.48 0% | 41.96 9% |
| Response Times | 2% | -33% | -31% | -27% | |
| Response Time Grey 50% / Grey 80% * (ms) | 40 ? | 40 ? -0% | 52 ? -30% | 58 ? -45% | 37 ? 7% |
| Response Time Black / White * (ms) | 23 ? | 22 ? 4% | 31 ? -35% | 27 ? -17% | 37 ? -61% |
| PWM Frequency (Hz) | 1000 | ||||
| Screen | -4% | -0% | -7% | -11% | |
| Brightness middle (cd/m²) | 249 | 219 -12% | 211 -15% | 204 -18% | 202 -19% |
| Brightness (cd/m²) | 234 | 222 -5% | 200 -15% | 198 -15% | 211 -10% |
| Brightness Distribution (%) | 89 | 85 -4% | 83 -7% | 85 -4% | 88 -1% |
| Black Level * (cd/m²) | 0.44 | 0.39 11% | 0.43 2% | 0.48 -9% | 0.62 -41% |
| Contrast (:1) | 566 | 562 -1% | 491 -13% | 425 -25% | 326 -42% |
| Colorchecker dE 2000 * | 11.71 | 12.67 -8% | 10.53 10% | 11.62 1% | 12.35 -5% |
| Colorchecker dE 2000 max. * | 19.51 | 20.99 -8% | 17.79 9% | 19.97 -2% | 19.9 -2% |
| Greyscale dE 2000 * | 13.13 | 13.82 -5% | 11.85 10% | 12.3 6% | 13.46 -3% |
| Gamma | 2.57 86% | 2.63 84% | 2.25 98% | 2.22 99% | 2.44 90% |
| CCT | 15273 43% | 15633 42% | 13758 47% | 13244 49% | 15217 43% |
| Color Space (Percent of AdobeRGB 1998) (%) | 36 | 35 -3% | 39 8% | 36 0% | 39 8% |
| Color Space (Percent of sRGB) (%) | 56 | 55 -2% | 61 9% | 56 0% | 61 9% |
| Media totale (Programma / Settaggio) | -1% /
-3% | -8% /
-3% | -13% /
-9% | -10% /
-9% |
* ... Meglio usare valori piccoli
Sfarfallio dello schermo / PWM (Pulse-Width Modulation)
| flickering dello schermo / PWM non rilevato | ||
In confronto: 52 % di tutti i dispositivi testati non utilizza PWM per ridurre la luminosita' del display. Se è rilevato PWM, una media di 7741 (minimo: 5 - massimo: 343500) Hz è stata rilevata. | ||
Tempi di risposta del Display
| ↔ Tempi di risposta dal Nero al Bianco | ||
|---|---|---|
| 23 ms ... aumenta ↗ e diminuisce ↘ combinato | ↗ 7 ms Incremento | 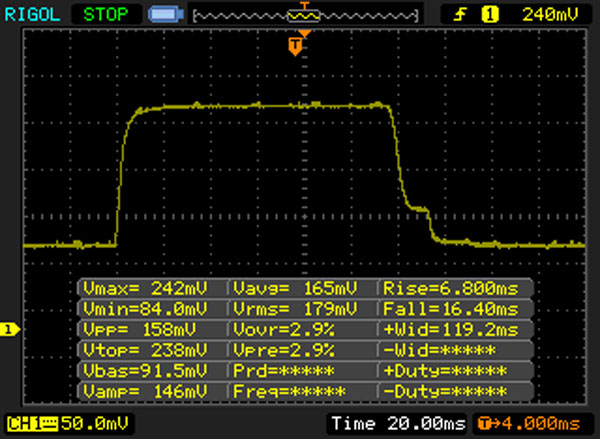 |
| ↘ 16 ms Calo | ||
| Lo schermo mostra buoni tempi di risposta durante i nostri tests, ma potrebbe essere troppo lento per i gamers competitivi. In confronto, tutti i dispositivi di test variano da 0.1 (minimo) a 240 (massimo) ms. » 52 % di tutti i dispositivi è migliore. Questo significa che i tempi di risposta rilevati sono peggiori rispetto alla media di tutti i dispositivi testati (19.8 ms). | ||
| ↔ Tempo di risposta dal 50% Grigio all'80% Grigio | ||
| 40 ms ... aumenta ↗ e diminuisce ↘ combinato | ↗ 20 ms Incremento | 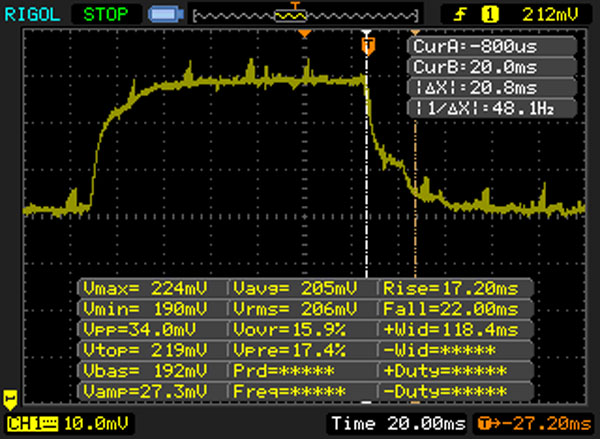 |
| ↘ 20 ms Calo | ||
| Lo schermo mostra tempi di risposta lenti nei nostri tests e sarà insoddisfacente per i gamers. In confronto, tutti i dispositivi di test variano da 0.165 (minimo) a 636 (massimo) ms. » 61 % di tutti i dispositivi è migliore. Questo significa che i tempi di risposta rilevati sono peggiori rispetto alla media di tutti i dispositivi testati (30.9 ms). | ||
| Cinebench R10 | |
| Rendering Multiple CPUs 32Bit | |
| HP 15-ay116ng | |
| Acer Extensa 2520-59CD | |
| Lenovo B50-50 80S2000QGE | |
| Lenovo Ideapad 500-15ACZ | |
| Lenovo G51-35 80M8002HGE | |
| Rendering Single 32Bit | |
| HP 15-ay116ng | |
| Acer Extensa 2520-59CD | |
| Lenovo B50-50 80S2000QGE | |
| Lenovo Ideapad 500-15ACZ | |
| Lenovo G51-35 80M8002HGE | |
| Geekbench 3 | |
| 32 Bit Single-Core Score | |
| HP 15-ay116ng | |
| Acer Extensa 2520-59CD | |
| Lenovo Ideapad 500-15ACZ | |
| Lenovo B50-50 80S2000QGE | |
| 32 Bit Multi-Core Score | |
| HP 15-ay116ng | |
| Acer Extensa 2520-59CD | |
| Lenovo Ideapad 500-15ACZ | |
| Lenovo B50-50 80S2000QGE | |
| Geekbench 4.0 | |
| 64 Bit Single-Core Score | |
| HP 15-ay116ng | |
| 64 Bit Multi-Core Score | |
| HP 15-ay116ng | |
| JetStream 1.1 - 1.1 Total | |
| HP 15-ay116ng | |
| HP 250 G5 SP X0N33EA | |
| Acer Extensa 2520-59CD | |
| Lenovo B50-50 80S2000QGE | |
| Lenovo Ideapad 500-15ACZ | |
| Lenovo G51-35 80M8002HGE | |
| Octane V2 - Total Score | |
| HP 15-ay116ng | |
| Lenovo B50-50 80S2000QGE | |
| Lenovo Ideapad 500-15ACZ | |
| HP 250 G5 SP X0N33EA | |
| Mozilla Kraken 1.1 - Total | |
| HP 250 G5 SP X0N33EA | |
| Lenovo Ideapad 500-15ACZ | |
| Lenovo B50-50 80S2000QGE | |
| HP 15-ay116ng | |
* ... Meglio usare valori piccoli
| PCMark 7 Score | 4977 punti | |
| PCMark 8 Home Score Accelerated v2 | 3315 punti | |
| PCMark 8 Creative Score Accelerated v2 | 4338 punti | |
| PCMark 8 Work Score Accelerated v2 | 4587 punti | |
Aiuto | ||
| PCMark 8 | |
| Home Score Accelerated v2 | |
| Dell Latitude 15-3570 | |
| HP 250 G5 SP X0N33EA | |
| HP 15-ay116ng | |
| Lenovo B50-50 80S2000QGE | |
| Acer Extensa 2520-59CD | |
| Work Score Accelerated v2 | |
| HP 15-ay116ng | |
| Dell Latitude 15-3570 | |
| HP 250 G5 SP X0N33EA | |
| Lenovo B50-50 80S2000QGE | |

| HP 15-ay116ng Samsung CM871a MZNTY256HDHP | HP 250 G5 SP X0N33EA SanDisk Z400s SD8SNAT-256G | Acer Extensa 2520-59CD Toshiba MQ01ABF050 | Lenovo B50-50 80S2000QGE Toshiba MQ02ABF050H (SSHD 500 + 8 GB) | Dell Latitude 15-3570 Samsung CM871 MZNLF128HCHP | |
|---|---|---|---|---|---|
| CrystalDiskMark 3.0 | -21% | -92% | -92% | -56% | |
| Read Seq (MB/s) | 501 | 509 2% | 104.7 -79% | 102.5 -80% | 453.2 -10% |
| Write Seq (MB/s) | 483.9 | 322.1 -33% | 95.7 -80% | 90.7 -81% | 137.7 -72% |
| Read 512 (MB/s) | 413.8 | 321.2 -22% | 33 -92% | 32.58 -92% | 308.5 -25% |
| Write 512 (MB/s) | 294.9 | 289.4 -2% | 38.3 -87% | 35.65 -88% | 134.1 -55% |
| Read 4k (MB/s) | 34.91 | 20.99 -40% | 0.375 -99% | 0.426 -99% | 19.06 -45% |
| Write 4k (MB/s) | 95.7 | 88 -8% | 0.782 -99% | 0.64 -99% | 21.31 -78% |
| Read 4k QD32 (MB/s) | 370.9 | 141.3 -62% | 0.675 -100% | 0.987 -100% | 93.5 -75% |
| Write 4k QD32 (MB/s) | 243.6 | 228.5 -6% | 0.769 -100% | 0.645 -100% | 23.3 -90% |
| 3DMark 06 Standard Score | 8012 punti | |
| 3DMark 11 Performance | 1511 punti | |
| 3DMark Ice Storm Standard Score | 49743 punti | |
| 3DMark Cloud Gate Standard Score | 5542 punti | |
| 3DMark Fire Strike Score | 744 punti | |
Aiuto | ||
| 3DMark 11 - 1280x720 Performance GPU | |
| HP Pavilion 15-aw004ng | |
| HP ProBook 470 G3 | |
| HP 15-ay116ng | |
| Dell Latitude 15-3570 | |
| HP 250 G5 SP X0N33EA | |
| Acer Extensa 2520-59CD | |
| Lenovo B50-50 80S2000QGE | |
| 3DMark | |
| 1280x720 Cloud Gate Standard Graphics | |
| HP 15-ay116ng | |
| HP 250 G5 SP X0N33EA | |
| HP Pavilion 15-aw004ng | |
| HP ProBook 470 G3 | |
| Dell Latitude 15-3570 | |
| Lenovo B50-50 80S2000QGE | |
| 1920x1080 Fire Strike Graphics | |
| HP ProBook 470 G3 | |
| HP Pavilion 15-aw004ng | |
| HP 15-ay116ng | |
| Lenovo B50-50 80S2000QGE | |
| basso | medio | alto | ultra | |
|---|---|---|---|---|
| Tomb Raider (2013) | 67.6 | 33.9 | 19.5 | 9.6 |
| BioShock Infinite (2013) | 45.3 | 25.3 | 20.9 | 6.5 |
| Battlefield 4 (2013) | 31.1 | 24.9 | 16.4 | 5 |
Rumorosità
| Idle |
| 31.3 / 31.3 / 31.3 dB(A) |
| DVD |
| 38.4 / dB(A) |
| Sotto carico |
| 35.6 / 36.15 dB(A) |
 | ||
30 dB silenzioso 40 dB(A) udibile 50 dB(A) rumoroso |
||
min: | ||
| HP 15-ay116ng i5-7200U, HD Graphics 620 | HP 250 G5 SP X0N33EA 6200U, HD Graphics 520 | Acer Extensa 2520-59CD 6200U, HD Graphics 520 | Lenovo B50-50 80S2000QGE 5005U, HD Graphics 5500 | Dell Latitude 15-3570 6200U, HD Graphics 520 | |
|---|---|---|---|---|---|
| Noise | -8% | -1% | -1% | 2% | |
| off /ambiente * (dB) | 30.5 | 31.6 -4% | 31.2 -2% | 31.2 -2% | 31 -2% |
| Idle Minimum * (dB) | 31.3 | 34.5 -10% | 31.5 -1% | 32.5 -4% | 31 1% |
| Idle Average * (dB) | 31.3 | 34.5 -10% | 31.9 -2% | 32.5 -4% | 31 1% |
| Idle Maximum * (dB) | 31.3 | 34.5 -10% | 31.9 -2% | 32.7 -4% | 31 1% |
| Load Average * (dB) | 35.6 | 39 -10% | 34.2 4% | 34.2 4% | 34.2 4% |
| Load Maximum * (dB) | 36.15 | 38.3 -6% | 36.8 -2% | 34.6 4% | 34.3 5% |
* ... Meglio usare valori piccoli
(+) La temperatura massima sul lato superiore è di 33.8 °C / 93 F, rispetto alla media di 34.3 °C / 94 F, che varia da 21.2 a 62.5 °C per questa classe Office.
(+) Il lato inferiore si riscalda fino ad un massimo di 36.6 °C / 98 F, rispetto alla media di 36.8 °C / 98 F
(+) In idle, la temperatura media del lato superiore è di 22.4 °C / 72 F, rispetto alla media deld ispositivo di 29.5 °C / 85 F.
(+) I poggiapolsi e il touchpad sono piu' freddi della temperatura della pelle con un massimo di 31.9 °C / 89.4 F e sono quindi freddi al tatto.
(-) La temperatura media della zona del palmo della mano di dispositivi simili e'stata di 27.6 °C / 81.7 F (-4.3 °C / -7.7 F).
| HP 15-ay116ng i5-7200U, HD Graphics 620 | HP 250 G5 SP X0N33EA 6200U, HD Graphics 520 | Acer Extensa 2520-59CD 6200U, HD Graphics 520 | Lenovo B50-50 80S2000QGE 5005U, HD Graphics 5500 | Dell Latitude 15-3570 6200U, HD Graphics 520 | |
|---|---|---|---|---|---|
| Heat | 7% | -14% | -5% | -27% | |
| Maximum Upper Side * (°C) | 33.8 | 31.1 8% | 33.2 2% | 34.6 -2% | 36.1 -7% |
| Maximum Bottom * (°C) | 36.6 | 31.8 13% | 37.3 -2% | 35.6 3% | 47 -28% |
| Idle Upper Side * (°C) | 23.6 | 22.9 3% | 28.7 -22% | 26.7 -13% | 31.7 -34% |
| Idle Bottom * (°C) | 23.8 | 22.6 5% | 32 -34% | 26 -9% | 32.9 -38% |
* ... Meglio usare valori piccoli
HP 15-ay116ng analisi audio
(±) | potenza degli altiparlanti media ma buona (75 dB)
Bassi 100 - 315 Hz
(-) | quasi nessun basso - in media 27.3% inferiori alla media
(±) | la linearità dei bassi è media (14.7% delta rispetto alla precedente frequenza)
Medi 400 - 2000 Hz
(+) | medi bilanciati - solo only 2.6% rispetto alla media
(+) | medi lineari (5.8% delta rispetto alla precedente frequenza)
Alti 2 - 16 kHz
(±) | alti elevati - circa 6.9% superiori alla media
(+) | alti lineari (5.4% delta rispetto alla precedente frequenza)
Nel complesso 100 - 16.000 Hz
(±) | la linearità complessiva del suono è media (23.4% di differenza rispetto alla media
Rispetto alla stessa classe
» 66% di tutti i dispositivi testati in questa classe è stato migliore, 8% simile, 26% peggiore
» Il migliore ha avuto un delta di 7%, medio di 21%, peggiore di 53%
Rispetto a tutti i dispositivi testati
» 70% di tutti i dispositivi testati in questa classe è stato migliore, 6% similare, 24% peggiore
» Il migliore ha avuto un delta di 4%, medio di 23%, peggiore di 134%
Apple MacBook 12 (Early 2016) 1.1 GHz analisi audio
(+) | gli altoparlanti sono relativamente potenti (83.6 dB)
Bassi 100 - 315 Hz
(±) | bassi ridotti - in media 11.3% inferiori alla media
(±) | la linearità dei bassi è media (14.2% delta rispetto alla precedente frequenza)
Medi 400 - 2000 Hz
(+) | medi bilanciati - solo only 2.4% rispetto alla media
(+) | medi lineari (5.5% delta rispetto alla precedente frequenza)
Alti 2 - 16 kHz
(+) | Alti bilanciati - appena 2% dalla media
(+) | alti lineari (4.5% delta rispetto alla precedente frequenza)
Nel complesso 100 - 16.000 Hz
(+) | suono nel complesso lineare (10.2% differenza dalla media)
Rispetto alla stessa classe
» 7% di tutti i dispositivi testati in questa classe è stato migliore, 2% simile, 90% peggiore
» Il migliore ha avuto un delta di 5%, medio di 18%, peggiore di 53%
Rispetto a tutti i dispositivi testati
» 5% di tutti i dispositivi testati in questa classe è stato migliore, 1% similare, 94% peggiore
» Il migliore ha avuto un delta di 4%, medio di 23%, peggiore di 134%
| Off / Standby | |
| Idle | |
| Sotto carico |
|
Leggenda:
min: | |
| HP 15-ay116ng i5-7200U, HD Graphics 620 | HP 250 G5 SP X0N33EA 6200U, HD Graphics 520 | Acer Extensa 2520-59CD 6200U, HD Graphics 520 | Lenovo B50-50 80S2000QGE 5005U, HD Graphics 5500 | Dell Latitude 15-3570 6200U, HD Graphics 520 | |
|---|---|---|---|---|---|
| Power Consumption | 0% | -54% | -20% | -14% | |
| Idle Minimum * (Watt) | 3.2 | 3.6 -13% | 5.8 -81% | 5.5 -72% | 4.9 -53% |
| Idle Average * (Watt) | 6.3 | 6 5% | 12.6 -100% | 7.6 -21% | 7.2 -14% |
| Idle Maximum * (Watt) | 7.4 | 6.4 14% | 12.8 -73% | 8.5 -15% | 7.5 -1% |
| Load Average * (Watt) | 24 | 26 -8% | 27.6 -15% | 24.5 -2% | 25.4 -6% |
| Load Maximum * (Watt) | 29 | 28.1 3% | 30 -3% | 25.4 12% | 28 3% |
* ... Meglio usare valori piccoli
| HP 15-ay116ng i5-7200U, HD Graphics 620, 41 Wh | HP 250 G5 SP X0N33EA 6200U, HD Graphics 520, 41 Wh | Acer Extensa 2520-59CD 6200U, HD Graphics 520, 37 Wh | Lenovo B50-50 80S2000QGE 5005U, HD Graphics 5500, 32 Wh | Dell Latitude 15-3570 6200U, HD Graphics 520, 65 Wh | |
|---|---|---|---|---|---|
| Autonomia della batteria | -13% | -23% | -29% | 40% | |
| Reader / Idle (h) | 14.5 | 10.6 -27% | 17.1 18% | ||
| H.264 (h) | 7.2 | 5.2 -28% | |||
| WiFi v1.3 (h) | 6.9 | 5.8 -16% | 5.3 -23% | 4.9 -29% | 9 30% |
| Load (h) | 1.5 | 1.8 20% | 2.6 73% |
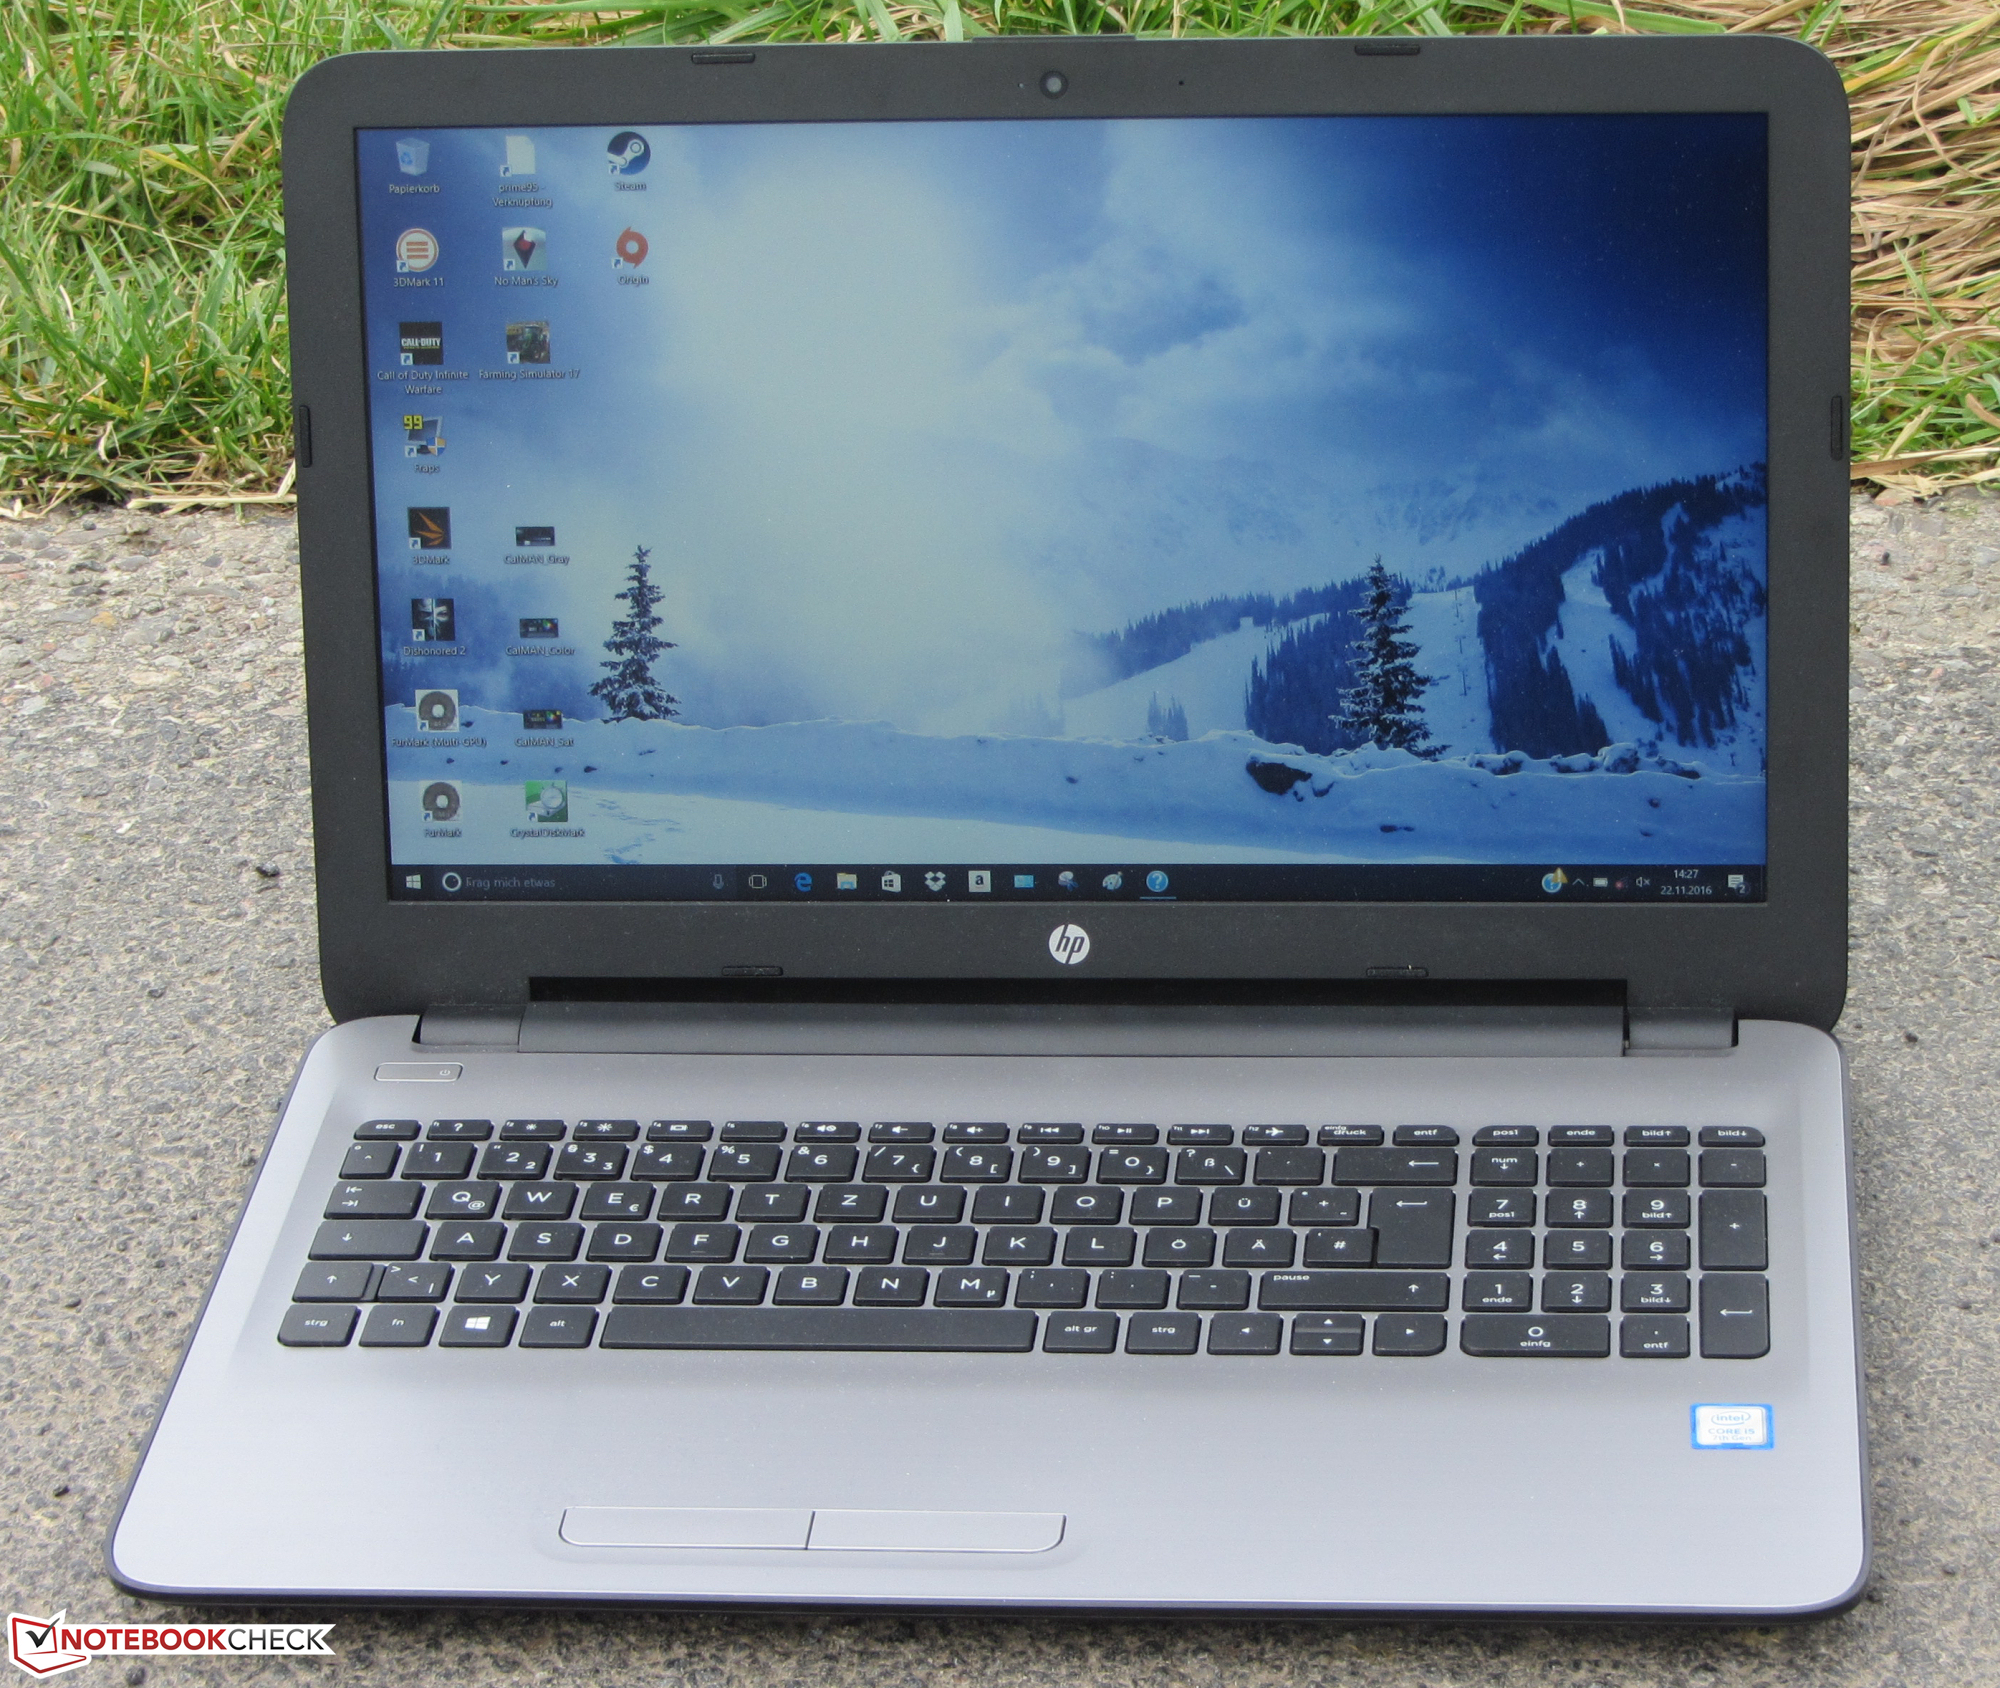
Questo HP 15.6" lascia complessivamente una buona impressione. Grazie al processore Kaby Lake, il portatile è adatto a tutti gli scenari comuni - per adesso e per gli anni a venire. Il portatile resta fresco nonostante abbia una CPU abbastanza potente. Un veloce SSD rende il sistema fluido. La sostituzione dell'SSD è possibile, ma c'è bisogno di aprire il case. La tastiera è adatta all'utilizzo domestico. Ha anche una buona autonomia. Lo schermo matto piace con la risoluzione Full HD, ma è troppo scuro ed ha un contrasto basso. Inoltre, gli angoli di visuale non sono stabili. Tuttavia, il display è accettabile considerando il prezzo del portatile.
Con il 15-ay116ng, HP aggiunge un tuttofare da ufficio nella sua linea seguendo un buon rapporto prezzo-prestazioni.
HP richiede 500 Euro (~$532) per questo notebook. Buona parte del budget è speso per il processore, lo schermo e l'SSD. Questo significa che è stato tagliato in altri punti: il portatile ha un solo anno di garanzia. Anche in un segmento economico, due anni oggi sono lo standard. Inoltre, il portatile ha solo una porta Fast Ethernet. Se la Gigabit Ethernet è un must, dovrete cercare delle alternative. Manca anche un modulo WLAN con supporto del veloce standard AC.
Pro
Contro
HP's 15.6-inch laptop left an overall good impression. Thanks to the Kaby Lake processor, the notebook is equipped for all common use scenarios - for now and in years to come. The notebook stays relatively cool despite the rather powerful CPU. A fast SSD keeps the system running well. Replacing the SSD would be possible, but that would require opening the case. The installed keyboard fulfills the requirements of home use. It also comes with very good battery life. The matte screen pleases with a Full HD resolution, but it is too dark and has low contrasts. In addition, it does not have stable viewing angles. However, the display is acceptable considering the laptop's price.
With the 15-ay116ng, HP adds an all-round office notebook to its lineup that boasts a good price-performance ratio.
HP charges 500 Euros (~$532) for this notebook. A large part of the budget is spent on the processor, screen and SSD. This means that cuts have to be made elsewhere: The laptop comes with only a one-year warranty. Even in the budget-price segment, two years is standard nowadays. Additionally, the laptop only has a Fast Ethernet port. If Gigabit Ethernet is a must, you should look at alternatives. The notebook also lacks a WLAN module supporting the fast AC standard.
HP 15-ay116ng
- 11/25/2016 v5.1 (old)
Sascha Mölck