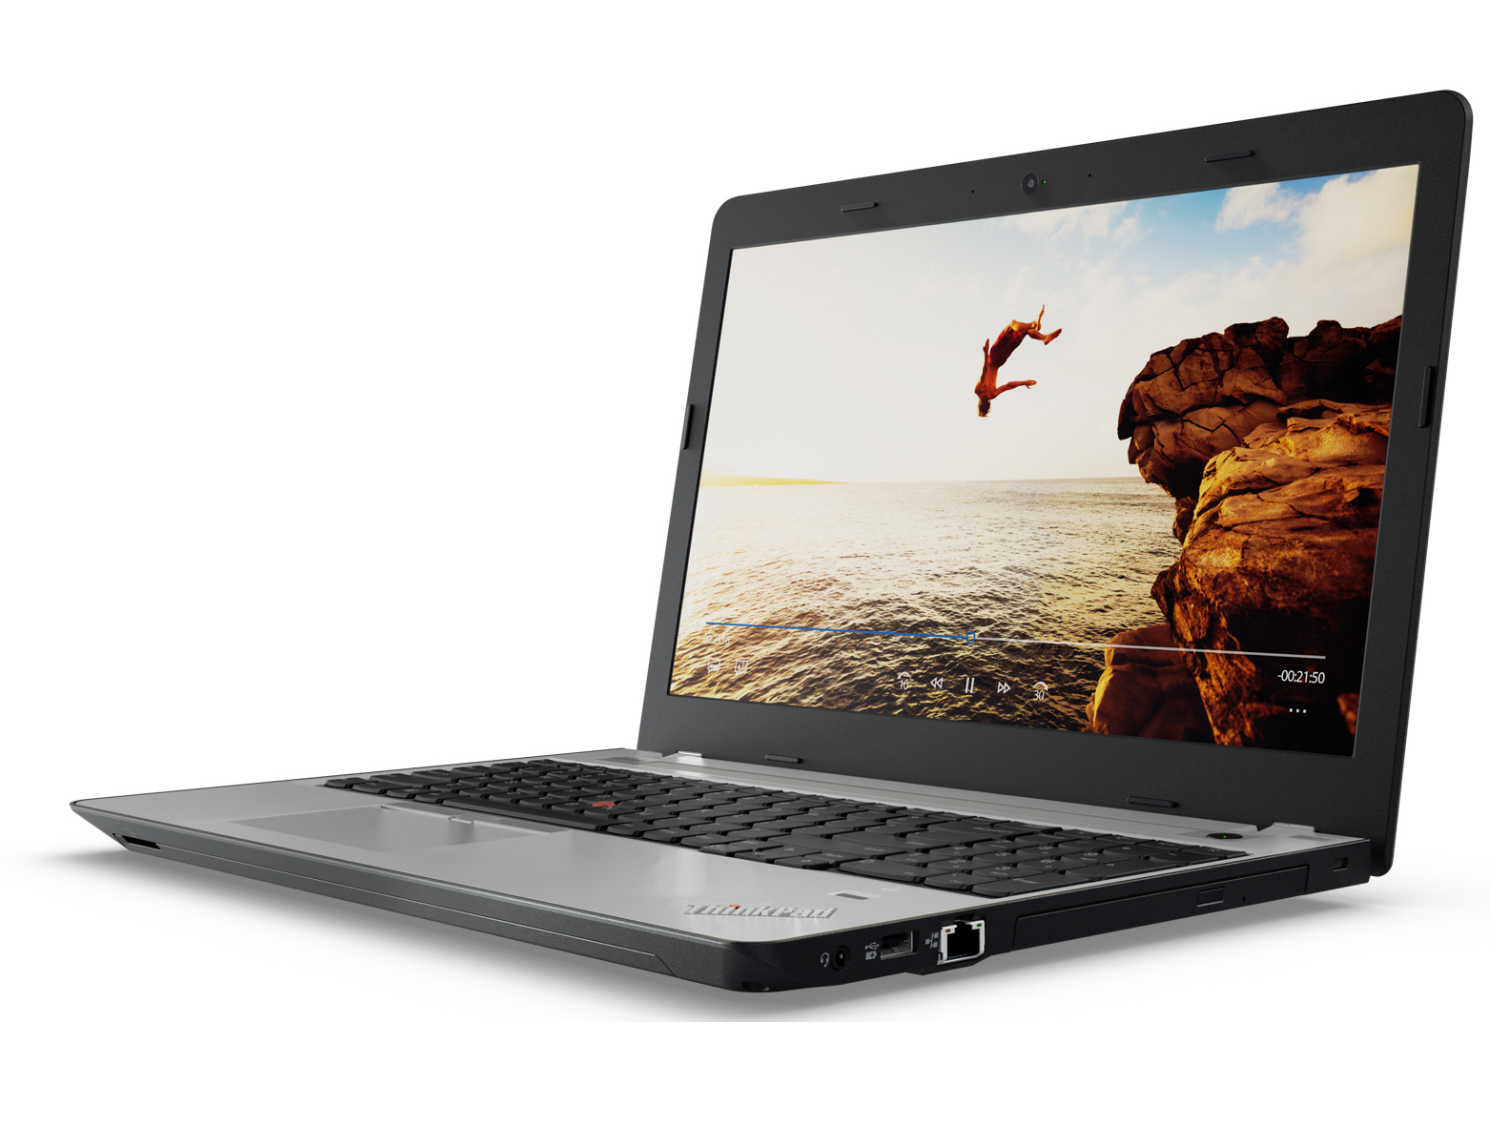
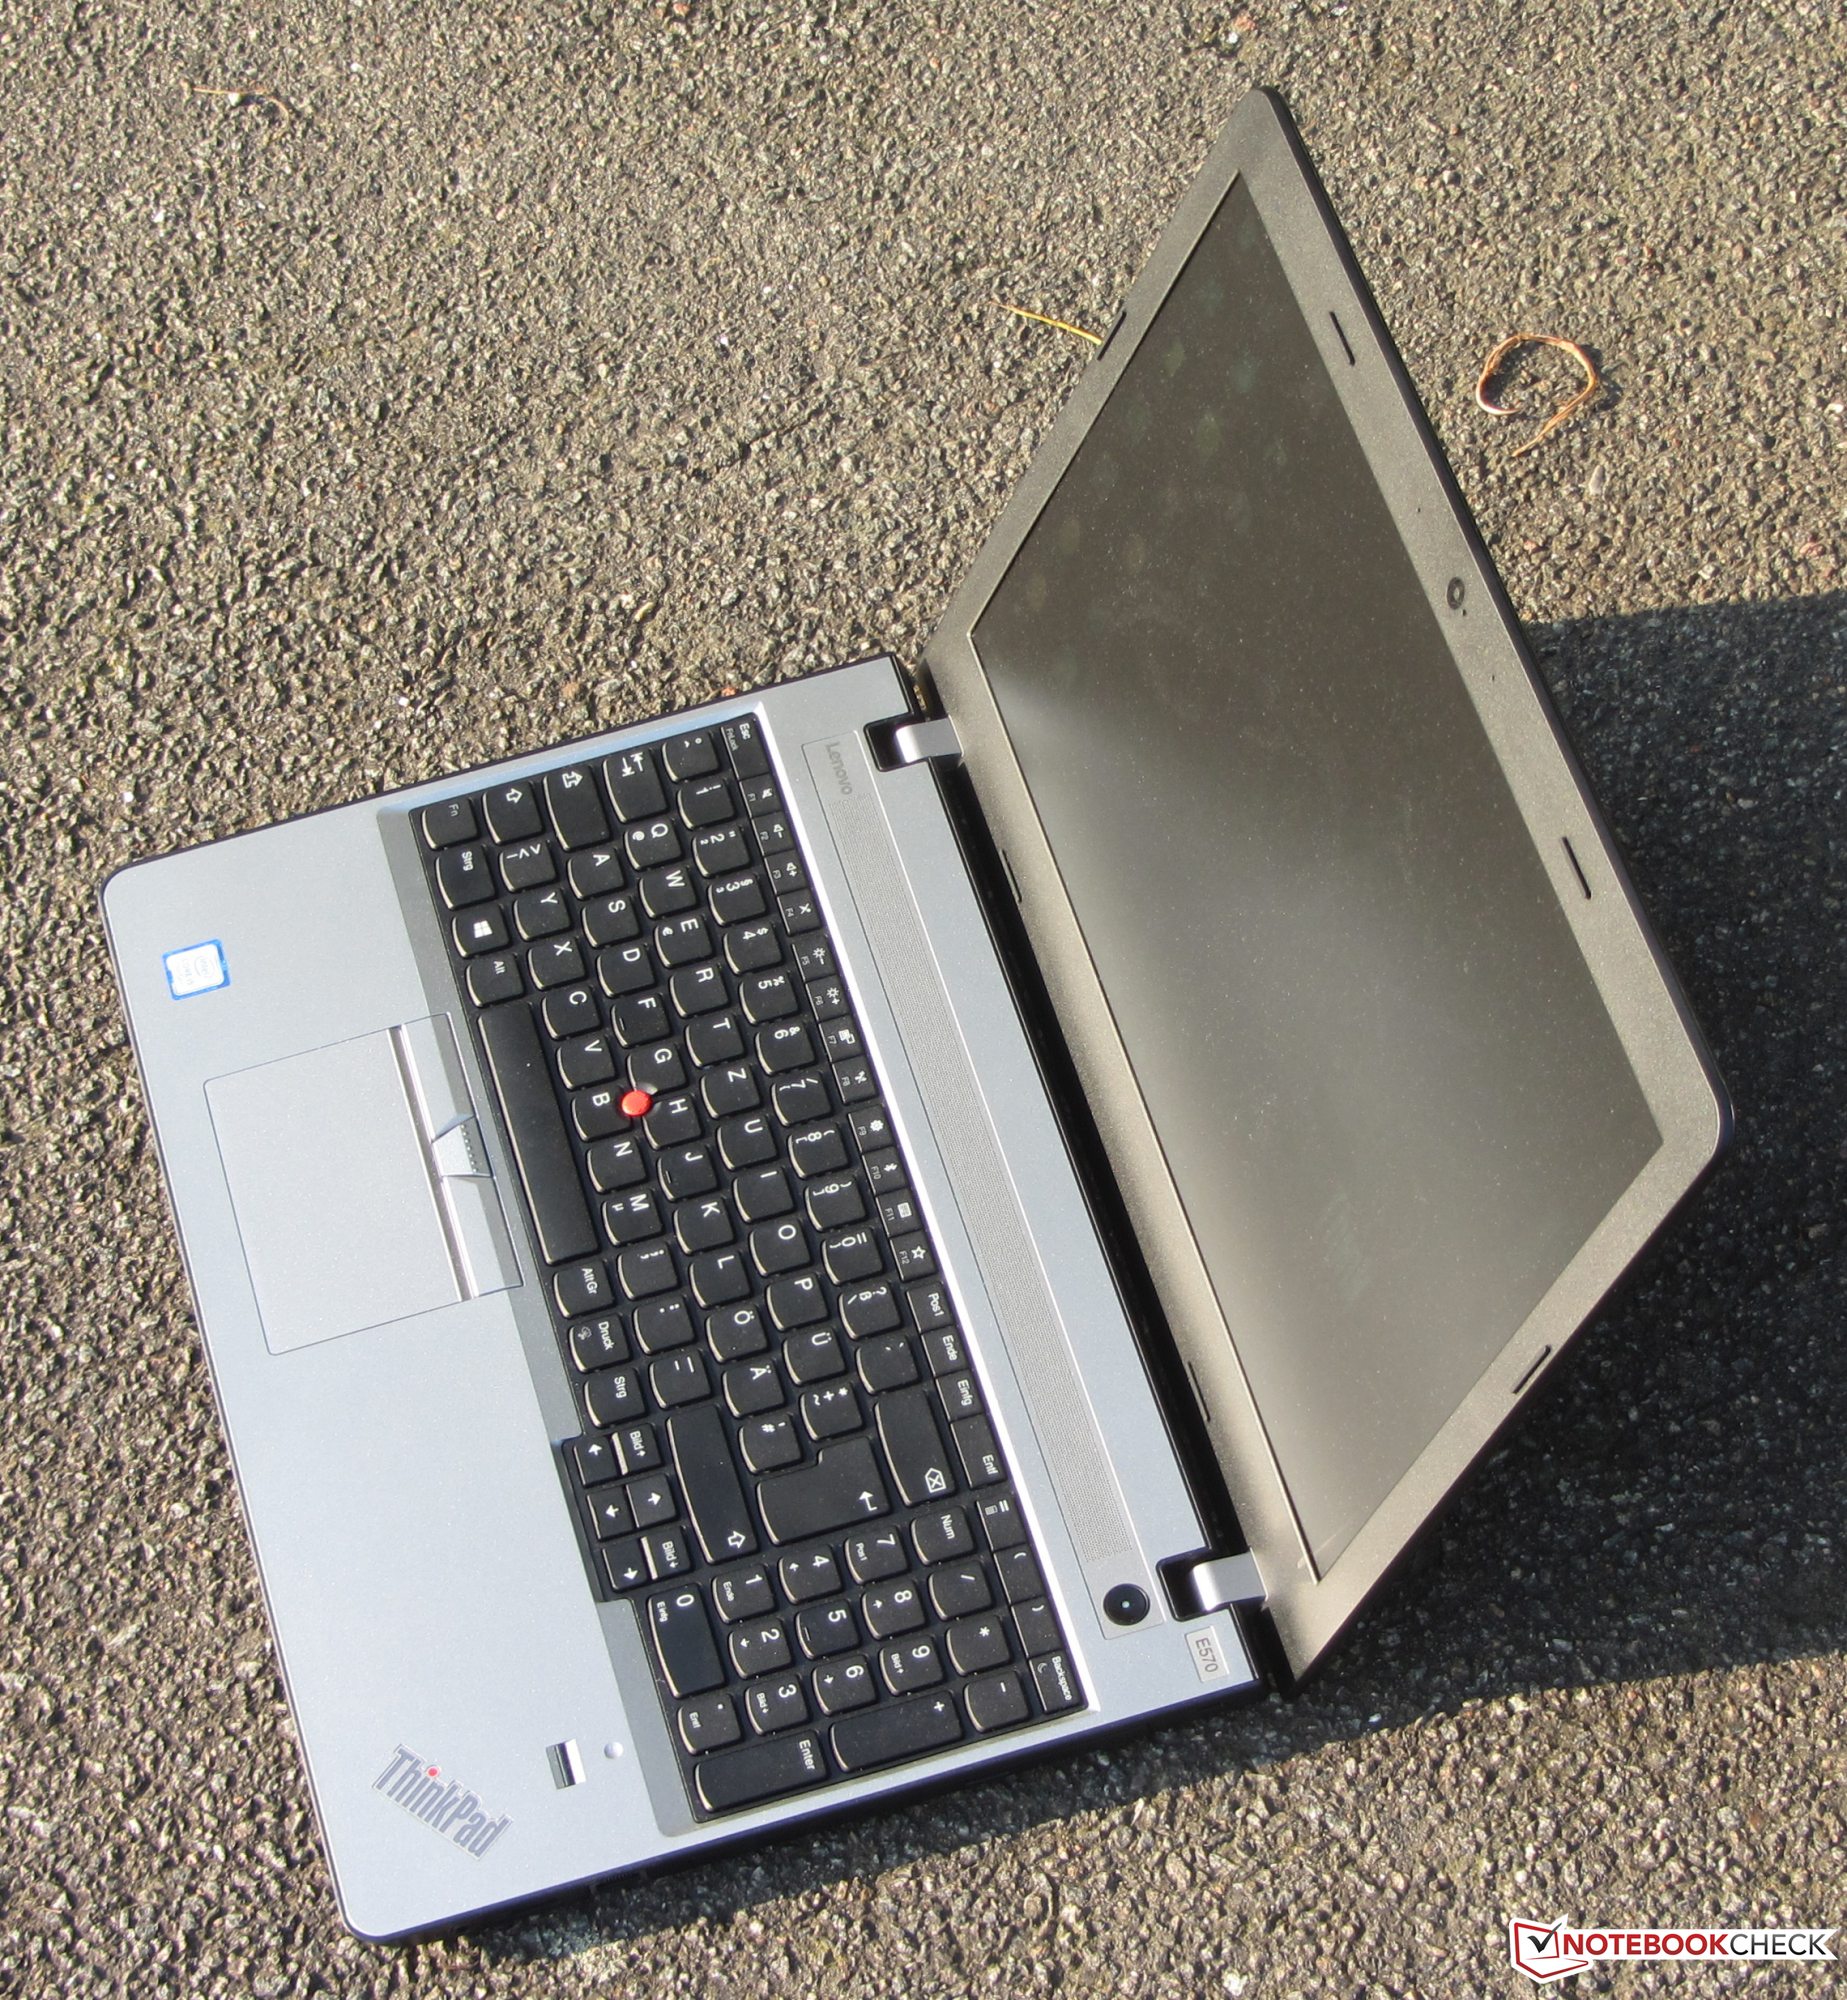
Recensione breve del Portatile Lenovo ThinkPad E570 (7200U, HD Display)
| SD Card Reader | |
| average JPG Copy Test (av. of 3 runs) | |
| HP ProBook 450 G4 Y8B60EA | |
| Acer TravelMate P259-MG-71UU (Toshiba Exceria Pro SDXC 64 GB UHS-II) | |
| Lenovo ThinkPad E570-20H6S00000 (Toshiba Exceria Pro SDXC 64 GB UHS-II) | |
| Dell Latitude 15-3570 | |
| maximum AS SSD Seq Read Test (1GB) | |
| HP ProBook 450 G4 Y8B60EA | |
| Lenovo ThinkPad E570-20H6S00000 (Toshiba Exceria Pro SDXC 64 GB UHS-II) | |
| Dell Latitude 15-3570 | |
| Networking | |
| iperf3 transmit AX12 | |
| Lenovo ThinkPad E570-20H6S02M00 | |
| Acer TravelMate P259-MG-71UU | |
| Lenovo ThinkPad E570-20H6S00000 | |
| iperf3 receive AX12 | |
| Acer TravelMate P259-MG-71UU | |
| Lenovo ThinkPad E570-20H6S02M00 | |
| Lenovo ThinkPad E570-20H6S00000 | |
| |||||||||||||||||||||||||
Distribuzione della luminosità: 73 %
Al centro con la batteria: 242 cd/m²
Contrasto: 410:1 (Nero: 0.59 cd/m²)
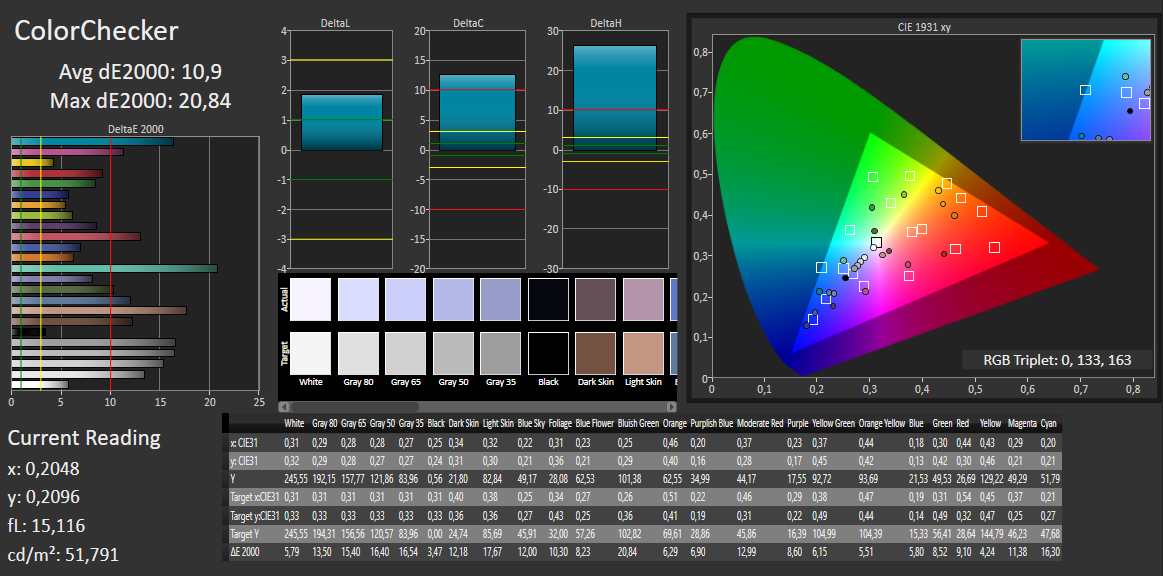
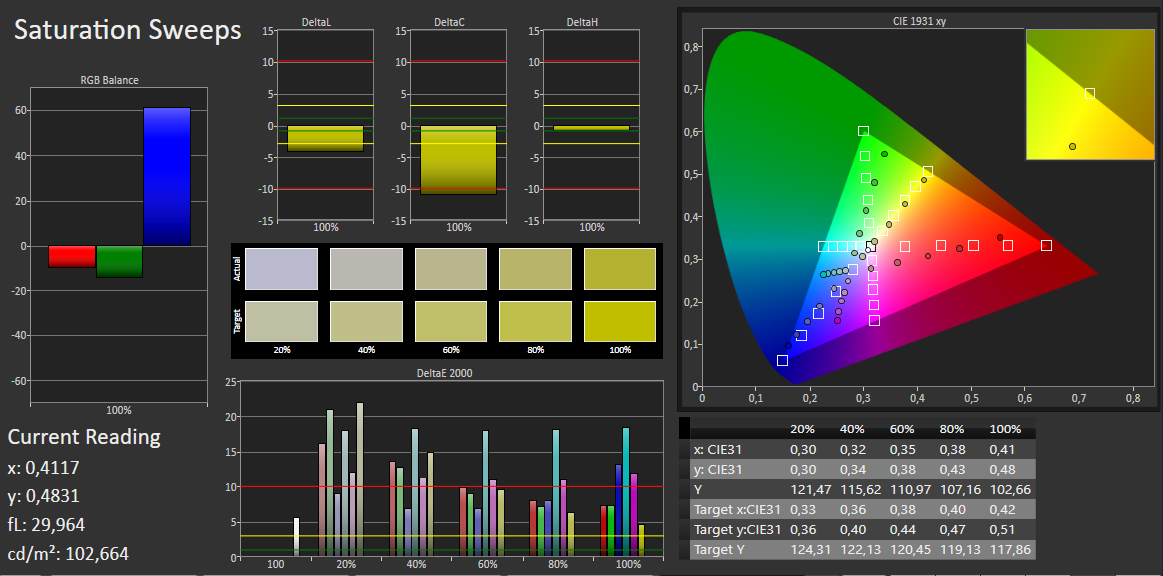
ΔE ColorChecker Calman: 10.9 | ∀{0.5-29.43 Ø4.73}
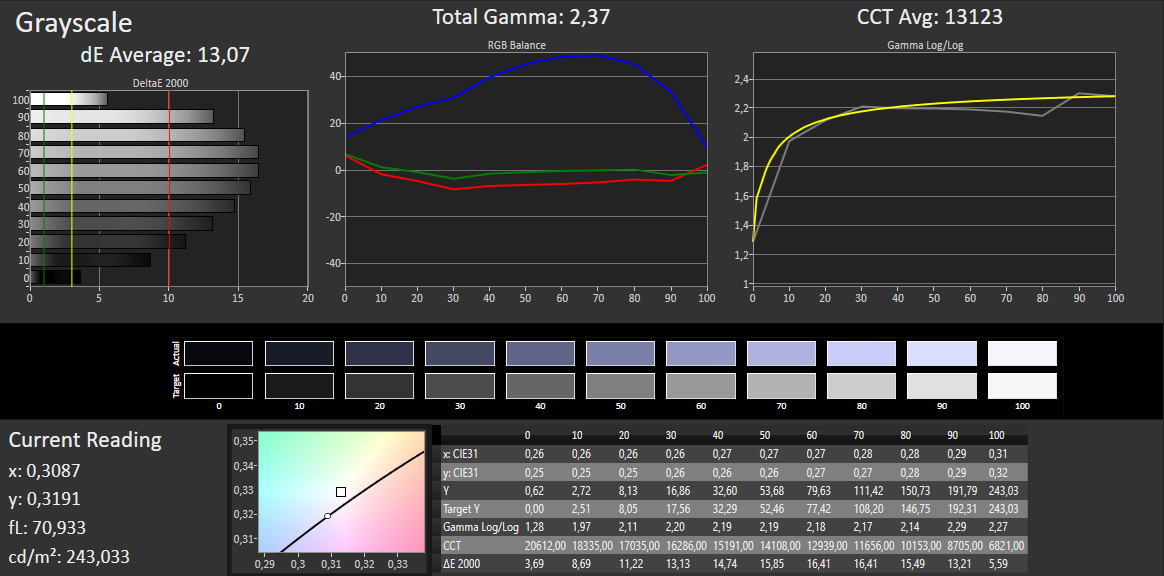
ΔE Greyscale Calman: 13.07 | ∀{0.09-98 Ø4.97}
55% sRGB (Argyll 1.6.3 3D)
35% AdobeRGB 1998 (Argyll 1.6.3 3D)
38.01% AdobeRGB 1998 (Argyll 3D)
55.4% sRGB (Argyll 3D)
36.79% Display P3 (Argyll 3D)
Gamma: 2.37
CCT: 13123 K
| Lenovo ThinkPad E570-20H6S02M00 TN LED, 1366x768, 15.6" | Lenovo ThinkPad E570-20H6S00000 IPS LED, 1920x1080, 15.6" | HP ProBook 450 G4 Y8B60EA TN LED, 1920x1080, 15.6" | Dell Latitude 15-3570 TN LED, 1366x768, 15.6" | Acer TravelMate P259-MG-71UU TN LED, 1920x1080, 15.6" | Fujitsu LifeBook A557 PL IPS, 1920x1080, 15.6" | |
|---|---|---|---|---|---|---|
| Display | 5% | 8% | 10% | 5% | 19% | |
| Display P3 Coverage (%) | 36.79 | 38.65 5% | 39.89 8% | 40.61 10% | 38.58 5% | 44.13 20% |
| sRGB Coverage (%) | 55.4 | 58 5% | 59.5 7% | 61.1 10% | 58 5% | 65.2 18% |
| AdobeRGB 1998 Coverage (%) | 38.01 | 39.94 5% | 41.24 8% | 41.96 10% | 39.85 5% | 45.72 20% |
| Response Times | -47% | -71% | -83% | -31% | ||
| Response Time Grey 50% / Grey 80% * (ms) | 46 ? | 44.8 ? 3% | 51 ? -11% | 37 ? 20% | 43 ? 7% | |
| Response Time Black / White * (ms) | 13 ? | 25.6 ? -97% | 30 ? -131% | 37 ? -185% | 22 ? -69% | |
| PWM Frequency (Hz) | 200 ? | 50 ? | ||||
| Screen | 41% | 7% | -2% | 5% | 52% | |
| Brightness middle (cd/m²) | 242 | 242 0% | 214 -12% | 202 -17% | 180 -26% | 239.5 -1% |
| Brightness (cd/m²) | 233 | 243 4% | 201 -14% | 211 -9% | 178 -24% | 216 -7% |
| Brightness Distribution (%) | 73 | 75 3% | 77 5% | 88 21% | 93 27% | 80 10% |
| Black Level * (cd/m²) | 0.59 | 0.24 59% | 0.43 27% | 0.62 -5% | 0.45 24% | 0.2 66% |
| Contrast (:1) | 410 | 1008 146% | 498 21% | 326 -20% | 400 -2% | 1198 192% |
| Colorchecker dE 2000 * | 10.9 | 4.65 57% | 10.68 2% | 12.35 -13% | 9.91 9% | |
| Colorchecker dE 2000 max. * | 20.84 | 9.64 54% | 18.07 13% | 19.9 5% | 18.19 13% | |
| Greyscale dE 2000 * | 13.07 | 3.39 74% | 11.32 13% | 13.46 -3% | 11.25 14% | |
| Gamma | 2.37 93% | 2.7 81% | 2.26 97% | 2.44 90% | 2.35 94% | |
| CCT | 13123 50% | 6246 104% | 12204 53% | 15217 43% | 12115 54% | |
| Color Space (Percent of AdobeRGB 1998) (%) | 35 | 36.69 5% | 38 9% | 39 11% | 37 6% | |
| Color Space (Percent of sRGB) (%) | 55 | 57.66 5% | 59 7% | 61 11% | 58 5% | |
| Media totale (Programma / Settaggio) | -0% /
22% | -19% /
-3% | -25% /
-10% | -7% /
-0% | 36% /
40% |
* ... Meglio usare valori piccoli
Sfarfallio dello schermo / PWM (Pulse-Width Modulation)
| flickering dello schermo / PWM rilevato | 200 Hz | ≤ 90 % settaggio luminosita' | 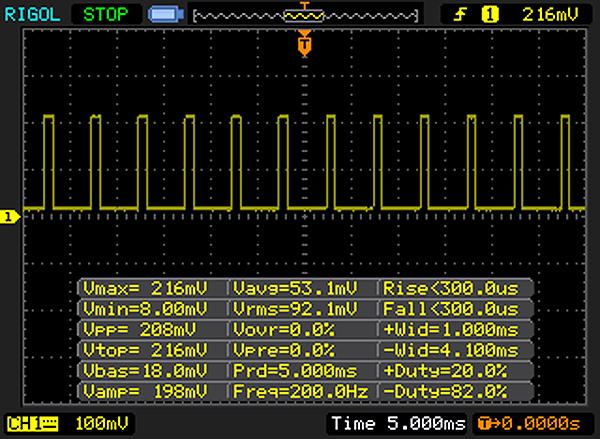 |
Il display sfarfalla a 200 Hz (Probabilmente a causa dell'uso di PWM) Flickering rilevato ad una luminosita' di 90 % o inferiore. Non dovrebbe verificarsi flickering o PWM sopra questo valore di luminosita'. La frequenza di 200 Hz è relativamente bassa, quindi gli utenti sensibili potrebbero notare il flickering ed accusare stanchezza agli occhi a questo livello di luminosità e a livelli inferiori. In confronto: 52 % di tutti i dispositivi testati non utilizza PWM per ridurre la luminosita' del display. Se è rilevato PWM, una media di 7798 (minimo: 5 - massimo: 343500) Hz è stata rilevata. | |||
Tempi di risposta del Display
| ↔ Tempi di risposta dal Nero al Bianco | ||
|---|---|---|
| 13 ms ... aumenta ↗ e diminuisce ↘ combinato | ↗ 8 ms Incremento | 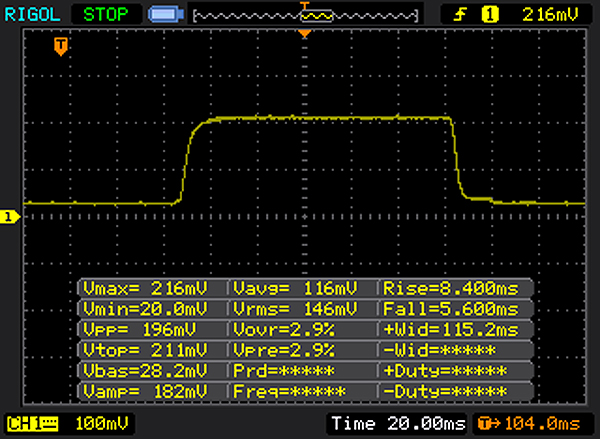 |
| ↘ 5 ms Calo | ||
| Lo schermo mostra buoni tempi di risposta durante i nostri tests, ma potrebbe essere troppo lento per i gamers competitivi. In confronto, tutti i dispositivi di test variano da 0.1 (minimo) a 240 (massimo) ms. » 33 % di tutti i dispositivi è migliore. Questo significa che i tempi di risposta rilevati sono migliori rispettto alla media di tutti i dispositivi testati (19.9 ms). | ||
| ↔ Tempo di risposta dal 50% Grigio all'80% Grigio | ||
| 46 ms ... aumenta ↗ e diminuisce ↘ combinato | ↗ 24 ms Incremento | 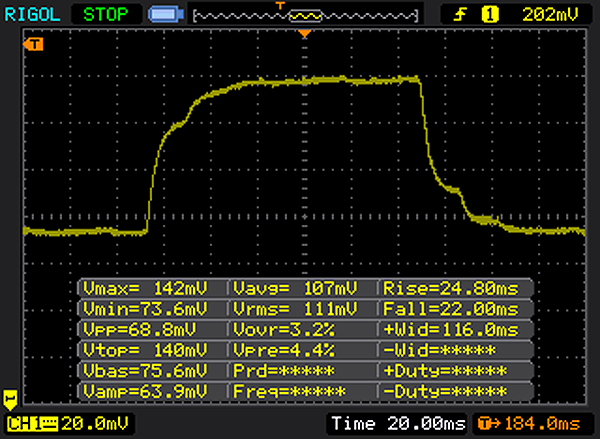 |
| ↘ 22 ms Calo | ||
| Lo schermo mostra tempi di risposta lenti nei nostri tests e sarà insoddisfacente per i gamers. In confronto, tutti i dispositivi di test variano da 0.165 (minimo) a 636 (massimo) ms. » 79 % di tutti i dispositivi è migliore. Questo significa che i tempi di risposta rilevati sono peggiori rispetto alla media di tutti i dispositivi testati (31.1 ms). | ||
| Cinebench R15 | |
| CPU Single 64Bit | |
| HP ProBook 450 G4 Y8B60EA | |
| Acer TravelMate P259-MG-71UU | |
| Lenovo ThinkPad E570-20H6S00000 | |
| Fujitsu LifeBook A557 PL | |
| Lenovo ThinkPad E570-20H6S02M00 | |
| Dell Latitude 15-3570 | |
| CPU Multi 64Bit | |
| HP ProBook 450 G4 Y8B60EA | |
| Lenovo ThinkPad E570-20H6S00000 | |
| Acer TravelMate P259-MG-71UU | |
| Fujitsu LifeBook A557 PL | |
| Lenovo ThinkPad E570-20H6S02M00 | |
| Dell Latitude 15-3570 | |
| Cinebench R11.5 | |
| CPU Multi 64Bit | |
| Lenovo ThinkPad E570-20H6S02M00 | |
| Acer TravelMate P259-MG-71UU | |
| CPU Single 64Bit | |
| Acer TravelMate P259-MG-71UU | |
| Lenovo ThinkPad E570-20H6S02M00 | |
| Cinebench R10 | |
| Rendering Multiple CPUs 32Bit | |
| Acer TravelMate P259-MG-71UU | |
| Lenovo ThinkPad E570-20H6S02M00 | |
| Rendering Single 32Bit | |
| Lenovo ThinkPad E570-20H6S02M00 | |
| Acer TravelMate P259-MG-71UU | |
| Geekbench 3 | |
| 32 Bit Multi-Core Score | |
| Acer TravelMate P259-MG-71UU | |
| Lenovo ThinkPad E570-20H6S02M00 | |
| 32 Bit Single-Core Score | |
| Acer TravelMate P259-MG-71UU | |
| Lenovo ThinkPad E570-20H6S02M00 | |
| Geekbench 4.0 | |
| 64 Bit Multi-Core Score | |
| Acer TravelMate P259-MG-71UU | |
| Lenovo ThinkPad E570-20H6S02M00 | |
| 64 Bit Single-Core Score | |
| Acer TravelMate P259-MG-71UU | |
| Lenovo ThinkPad E570-20H6S02M00 | |
| Geekbench 4.4 | |
| 64 Bit Multi-Core Score | |
| Lenovo ThinkPad E570-20H6S02M00 | |
| 64 Bit Single-Core Score | |
| Lenovo ThinkPad E570-20H6S02M00 | |
| JetStream 1.1 - 1.1 Total | |
| HP ProBook 450 G4 Y8B60EA | |
| Lenovo ThinkPad E570-20H6S02M00 | |
| Lenovo ThinkPad E570-20H6S00000 | |
| Acer TravelMate P259-MG-71UU | |
| PCMark 7 Score | 5232 punti | |
| PCMark 8 Home Score Accelerated v2 | 3714 punti | |
| PCMark 8 Creative Score Accelerated v2 | 4456 punti | |
| PCMark 8 Work Score Accelerated v2 | 4857 punti | |
| PCMark 10 Score | 3235 punti | |
Aiuto | ||

| Lenovo ThinkPad E570-20H6S02M00 Samsung PM961 MZVLW256HEHP | Dell Latitude 15-3570 Samsung CM871 MZNLF128HCHP | Acer TravelMate P259-MG-71UU Liteonit CV3-8D256 | Fujitsu LifeBook A557 PL Samsung CM871a MZNTY256HDHP | Lenovo ThinkPad E570-20H6S00000 Toshiba THNSF5256GPUK | |
|---|---|---|---|---|---|
| CrystalDiskMark 3.0 | -81% | -58% | -55% | -31% | |
| Read Seq (MB/s) | 1589 | 453.2 -71% | 478.5 -70% | 520 -67% | 1140 -28% |
| Write Seq (MB/s) | 1217 | 137.7 -89% | 258.2 -79% | 337 -72% | 468.1 -62% |
| Read 512 (MB/s) | 1155 | 308.5 -73% | 254.3 -78% | 400.8 -65% | 759 -34% |
| Write 512 (MB/s) | 783 | 134.1 -83% | 264.8 -66% | 240.7 -69% | 414 -47% |
| Read 4k (MB/s) | 59.7 | 19.06 -68% | 28.32 -53% | 34.16 -43% | 34.3 -43% |
| Write 4k (MB/s) | 148.8 | 21.31 -86% | 76.3 -49% | 95.4 -36% | 123.4 -17% |
| Read 4k QD32 (MB/s) | 473.6 | 93.5 -80% | 346.2 -27% | 293.9 -38% | 530 12% |
| Write 4k QD32 (MB/s) | 428.7 | 23.3 -95% | 240.2 -44% | 225.1 -47% | 319.2 -26% |
| 3DMark 11 Performance | 1518 punti | |
| 3DMark Ice Storm Standard Score | 55340 punti | |
| 3DMark Cloud Gate Standard Score | 5776 punti | |
| 3DMark Fire Strike Score | 763 punti | |
Aiuto | ||
| 3DMark 11 - 1280x720 Performance GPU | |
| Lenovo ThinkPad E570-20H6S00000 | |
| Acer TravelMate P259-MG-71UU | |
| HP ProBook 450 G4 Y8B60EA | |
| Fujitsu LifeBook A557 PL | |
| Lenovo ThinkPad E570-20H6S02M00 | |
| Dell Latitude 15-3570 | |
| 3DMark | |
| 1280x720 Cloud Gate Standard Graphics | |
| Lenovo ThinkPad E570-20H6S00000 | |
| Acer TravelMate P259-MG-71UU | |
| HP ProBook 450 G4 Y8B60EA | |
| Lenovo ThinkPad E570-20H6S02M00 | |
| Fujitsu LifeBook A557 PL | |
| Dell Latitude 15-3570 | |
| 1920x1080 Fire Strike Graphics | |
| Lenovo ThinkPad E570-20H6S00000 | |
| Acer TravelMate P259-MG-71UU | |
| HP ProBook 450 G4 Y8B60EA | |
| Lenovo ThinkPad E570-20H6S02M00 | |
| Fujitsu LifeBook A557 PL | |
| basso | medio | alto | ultra | |
|---|---|---|---|---|
| Tomb Raider (2013) | 63.6 | 33.8 | 19.2 | |
| BioShock Infinite (2013) | 41.8 | 24.5 | 20.2 | |
| Rise of the Tomb Raider (2016) | 16.7 | 10.4 |
| BioShock Infinite - 1280x720 Very Low Preset | |
| Lenovo ThinkPad E570-20H6S00000 | |
| Acer TravelMate P259-MG-71UU | |
| HP ProBook 450 G4 Y8B60EA | |
| Lenovo ThinkPad E570-20H6S02M00 | |
| Dell Latitude 15-3570 | |
Rumorosità
| Idle |
| 30.6 / 30.6 / 30.6 dB(A) |
| HDD |
| 31.4 dB(A) |
| DVD |
| 33.1 / dB(A) |
| Sotto carico |
| 31.8 / 31.3 dB(A) |
 | ||
30 dB silenzioso 40 dB(A) udibile 50 dB(A) rumoroso |
||
min: | ||
| Lenovo ThinkPad E570-20H6S02M00 i5-7200U, HD Graphics 620 | Lenovo ThinkPad E570-20H6S00000 i5-7200U, GeForce GTX 950M | HP ProBook 450 G4 Y8B60EA i7-7500U, GeForce 930MX | Dell Latitude 15-3570 6200U, HD Graphics 520 | Acer TravelMate P259-MG-71UU 6500U, GeForce 940MX | Fujitsu LifeBook A557 PL i5-7200U, HD Graphics 620 | |
|---|---|---|---|---|---|---|
| Noise | -3% | -12% | -4% | -8% | -13% | |
| off /ambiente * (dB) | 30.6 | 29 5% | 31.6 -3% | 31 -1% | 30.5 -0% | |
| Idle Minimum * (dB) | 30.6 | 29 5% | 32.6 -7% | 31 -1% | 31.6 -3% | 30 2% |
| Idle Average * (dB) | 30.6 | 29 5% | 32.6 -7% | 31 -1% | 31.6 -3% | 32.5 -6% |
| Idle Maximum * (dB) | 30.6 | 29 5% | 33 -8% | 31 -1% | 32 -5% | 35 -14% |
| Load Average * (dB) | 31.8 | 34.3 -8% | 38.9 -22% | 34.2 -8% | 35.5 -12% | 37.5 -18% |
| Load Maximum * (dB) | 31.3 | 40.1 -28% | 38.9 -24% | 34.3 -10% | 38.3 -22% | 40.3 -29% |
* ... Meglio usare valori piccoli
(+) La temperatura massima sul lato superiore è di 33.2 °C / 92 F, rispetto alla media di 34.3 °C / 94 F, che varia da 21.2 a 62.5 °C per questa classe Office.
(+) Il lato inferiore si riscalda fino ad un massimo di 39.4 °C / 103 F, rispetto alla media di 36.8 °C / 98 F
(+) In idle, la temperatura media del lato superiore è di 24.7 °C / 76 F, rispetto alla media deld ispositivo di 29.5 °C / 85 F.
(+) I poggiapolsi e il touchpad raggiungono la temperatura massima della pelle (32.1 °C / 89.8 F) e quindi non sono caldi.
(-) La temperatura media della zona del palmo della mano di dispositivi simili e'stata di 27.5 °C / 81.5 F (-4.6 °C / -8.3 F).
| Lenovo ThinkPad E570-20H6S02M00 i5-7200U, HD Graphics 620 | Lenovo ThinkPad E570-20H6S00000 i5-7200U, GeForce GTX 950M | HP ProBook 450 G4 Y8B60EA i7-7500U, GeForce 930MX | Dell Latitude 15-3570 6200U, HD Graphics 520 | Acer TravelMate P259-MG-71UU 6500U, GeForce 940MX | Fujitsu LifeBook A557 PL i5-7200U, HD Graphics 620 | |
|---|---|---|---|---|---|---|
| Heat | -13% | -15% | -17% | -7% | 1% | |
| Maximum Upper Side * (°C) | 33.2 | 46.6 -40% | 44.3 -33% | 36.1 -9% | 35.1 -6% | 34.8 -5% |
| Maximum Bottom * (°C) | 39.4 | 49.1 -25% | 46.3 -18% | 47 -19% | 46.7 -19% | 38.1 3% |
| Idle Upper Side * (°C) | 25.9 | 24.6 5% | 27.8 -7% | 31.7 -22% | 27 -4% | 25.9 -0% |
| Idle Bottom * (°C) | 27.8 | 25.1 10% | 27.7 -0% | 32.9 -18% | 27.4 1% | 26.6 4% |
* ... Meglio usare valori piccoli
Lenovo ThinkPad E570-20H6S02M00 analisi audio
(-) | altoparlanti non molto potenti (71.4 dB)
Bassi 100 - 315 Hz
(-) | quasi nessun basso - in media 17.1% inferiori alla media
(±) | la linearità dei bassi è media (10.9% delta rispetto alla precedente frequenza)
Medi 400 - 2000 Hz
(+) | medi bilanciati - solo only 3.9% rispetto alla media
(±) | linearità dei medi adeguata (8.2% delta rispetto alla precedente frequenza)
Alti 2 - 16 kHz
(+) | Alti bilanciati - appena 3.4% dalla media
(±) | la linearità degli alti è media (7% delta rispetto alla precedente frequenza)
Nel complesso 100 - 16.000 Hz
(±) | la linearità complessiva del suono è media (20.3% di differenza rispetto alla media
Rispetto alla stessa classe
» 44% di tutti i dispositivi testati in questa classe è stato migliore, 10% simile, 46% peggiore
» Il migliore ha avuto un delta di 7%, medio di 21%, peggiore di 53%
Rispetto a tutti i dispositivi testati
» 53% di tutti i dispositivi testati in questa classe è stato migliore, 8% similare, 39% peggiore
» Il migliore ha avuto un delta di 4%, medio di 24%, peggiore di 134%
Apple MacBook 12 (Early 2016) 1.1 GHz analisi audio
(+) | gli altoparlanti sono relativamente potenti (83.6 dB)
Bassi 100 - 315 Hz
(±) | bassi ridotti - in media 11.3% inferiori alla media
(±) | la linearità dei bassi è media (14.2% delta rispetto alla precedente frequenza)
Medi 400 - 2000 Hz
(+) | medi bilanciati - solo only 2.4% rispetto alla media
(+) | medi lineari (5.5% delta rispetto alla precedente frequenza)
Alti 2 - 16 kHz
(+) | Alti bilanciati - appena 2% dalla media
(+) | alti lineari (4.5% delta rispetto alla precedente frequenza)
Nel complesso 100 - 16.000 Hz
(+) | suono nel complesso lineare (10.2% differenza dalla media)
Rispetto alla stessa classe
» 7% di tutti i dispositivi testati in questa classe è stato migliore, 2% simile, 91% peggiore
» Il migliore ha avuto un delta di 5%, medio di 18%, peggiore di 53%
Rispetto a tutti i dispositivi testati
» 5% di tutti i dispositivi testati in questa classe è stato migliore, 1% similare, 94% peggiore
» Il migliore ha avuto un delta di 4%, medio di 24%, peggiore di 134%
| Off / Standby | |
| Idle | |
| Sotto carico |
|
Leggenda:
min: | |
| Lenovo ThinkPad E570-20H6S02M00 i5-7200U, HD Graphics 620 | Lenovo ThinkPad E570-20H6S00000 i5-7200U, GeForce GTX 950M | HP ProBook 450 G4 Y8B60EA i7-7500U, GeForce 930MX | Dell Latitude 15-3570 6200U, HD Graphics 520 | Acer TravelMate P259-MG-71UU 6500U, GeForce 940MX | Fujitsu LifeBook A557 PL i5-7200U, HD Graphics 620 | |
|---|---|---|---|---|---|---|
| Power Consumption | -45% | -40% | -18% | -71% | -44% | |
| Idle Minimum * (Watt) | 2.9 | 2.8 3% | 3.8 -31% | 4.9 -69% | 7 -141% | 6.3 -117% |
| Idle Average * (Watt) | 5.8 | 6.3 -9% | 6.6 -14% | 7.2 -24% | 8 -38% | 8.1 -40% |
| Idle Maximum * (Watt) | 6.6 | 6.9 -5% | 11.3 -71% | 7.5 -14% | 10.6 -61% | 12.7 -92% |
| Load Average * (Watt) | 29 | 51.6 -78% | 38 -31% | 25.4 12% | 39.7 -37% | 20.7 29% |
| Load Maximum * (Watt) | 29.4 | 69.7 -137% | 45 -53% | 28 5% | 51.9 -77% | 28.9 2% |
* ... Meglio usare valori piccoli
| Lenovo ThinkPad E570-20H6S02M00 i5-7200U, HD Graphics 620, 42 Wh | Lenovo ThinkPad E570-20H6S00000 i5-7200U, GeForce GTX 950M, 41 Wh | HP ProBook 450 G4 Y8B60EA i7-7500U, GeForce 930MX, 45 Wh | Dell Latitude 15-3570 6200U, HD Graphics 520, 65 Wh | Acer TravelMate P259-MG-71UU 6500U, GeForce 940MX, 41 Wh | Fujitsu LifeBook A557 PL i5-7200U, HD Graphics 620, 49 Wh | |
|---|---|---|---|---|---|---|
| Autonomia della batteria | 9% | 6% | 27% | -40% | -10% | |
| Reader / Idle (h) | 18.1 | 14.7 -19% | 12.4 -31% | 17.1 -6% | 10.3 -43% | 16.3 -10% |
| H.264 (h) | 6.5 | 4.1 -37% | ||||
| WiFi v1.3 (h) | 7.2 | 7.7 7% | 8.6 19% | 9 25% | 4.7 -35% | |
| Load (h) | 1.6 | 2.2 38% | 2.1 31% | 2.6 63% | 0.9 -44% | |
| WiFi (h) | 7.4 |
Pro
Contro
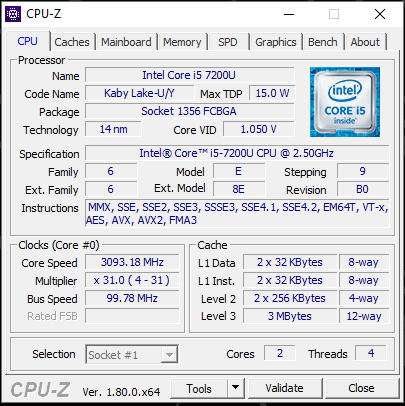
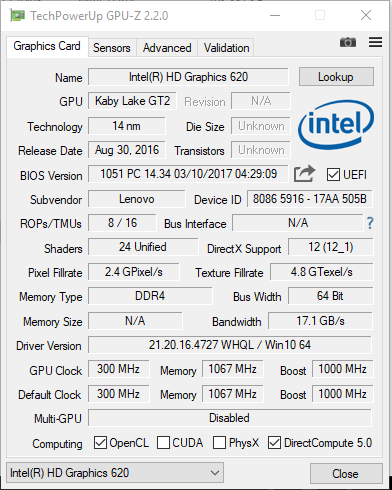
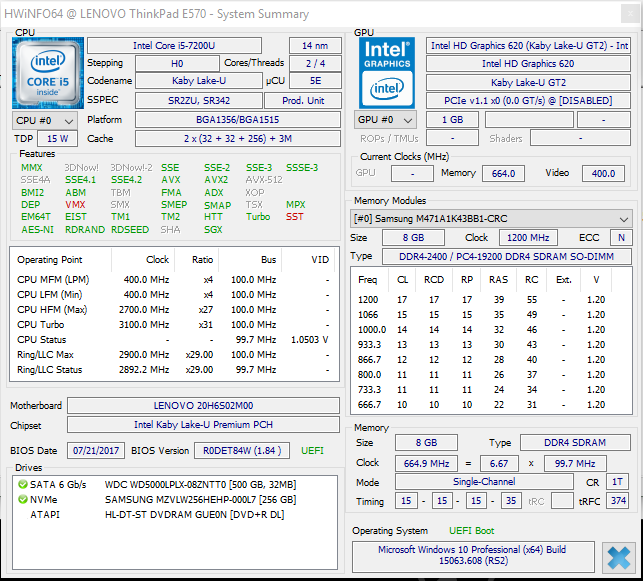
Il ThinkPad ha un processore Core i5 Kaby Lake, con potenza più che sufficiente per ufficio ed applicazioni Internet. Il portatile resta silenzioso sotto carico e difficilmente si scalda.
Un veloce SSD NVMe consente un sistema scattante. Un hard drive da 500 GB in formato 2,5" aggiunge altro spazio Entrambi i drives possono essere facilmente sostituiti grazie alla cover. Come il predecessore, il ThinkPad E570 ha anche una buona tastiera. E l'autonomia è ottima.
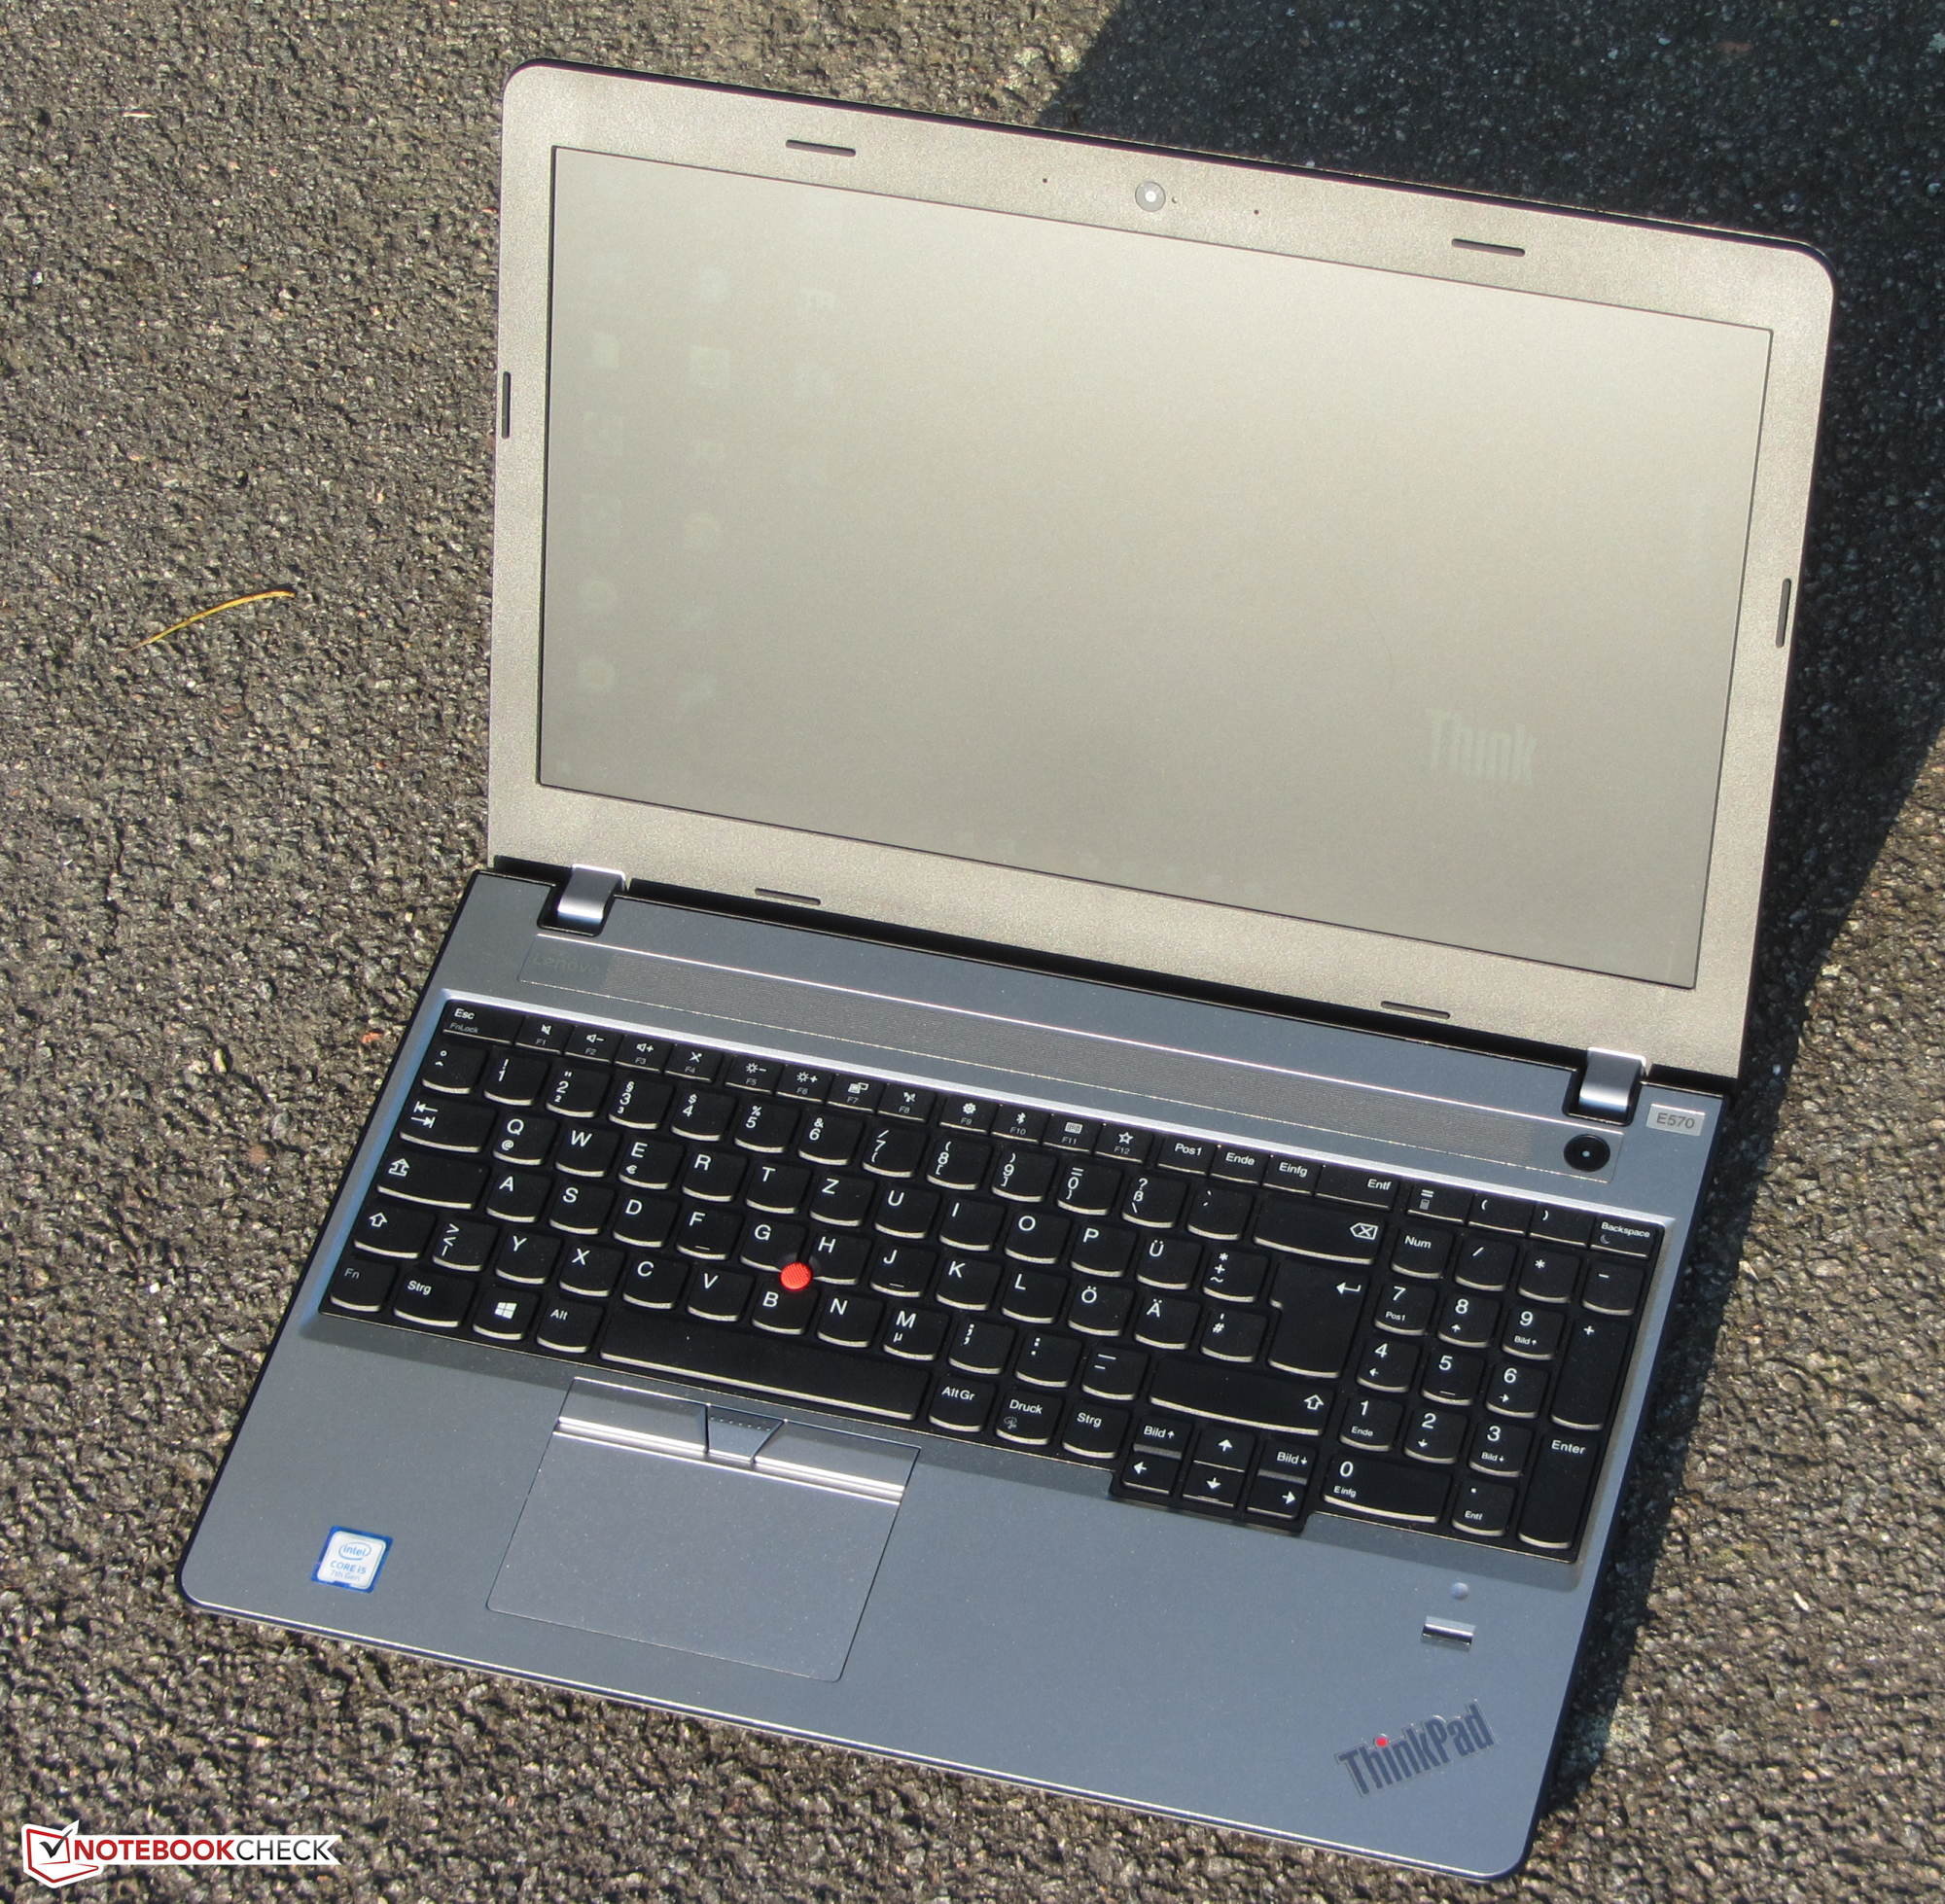
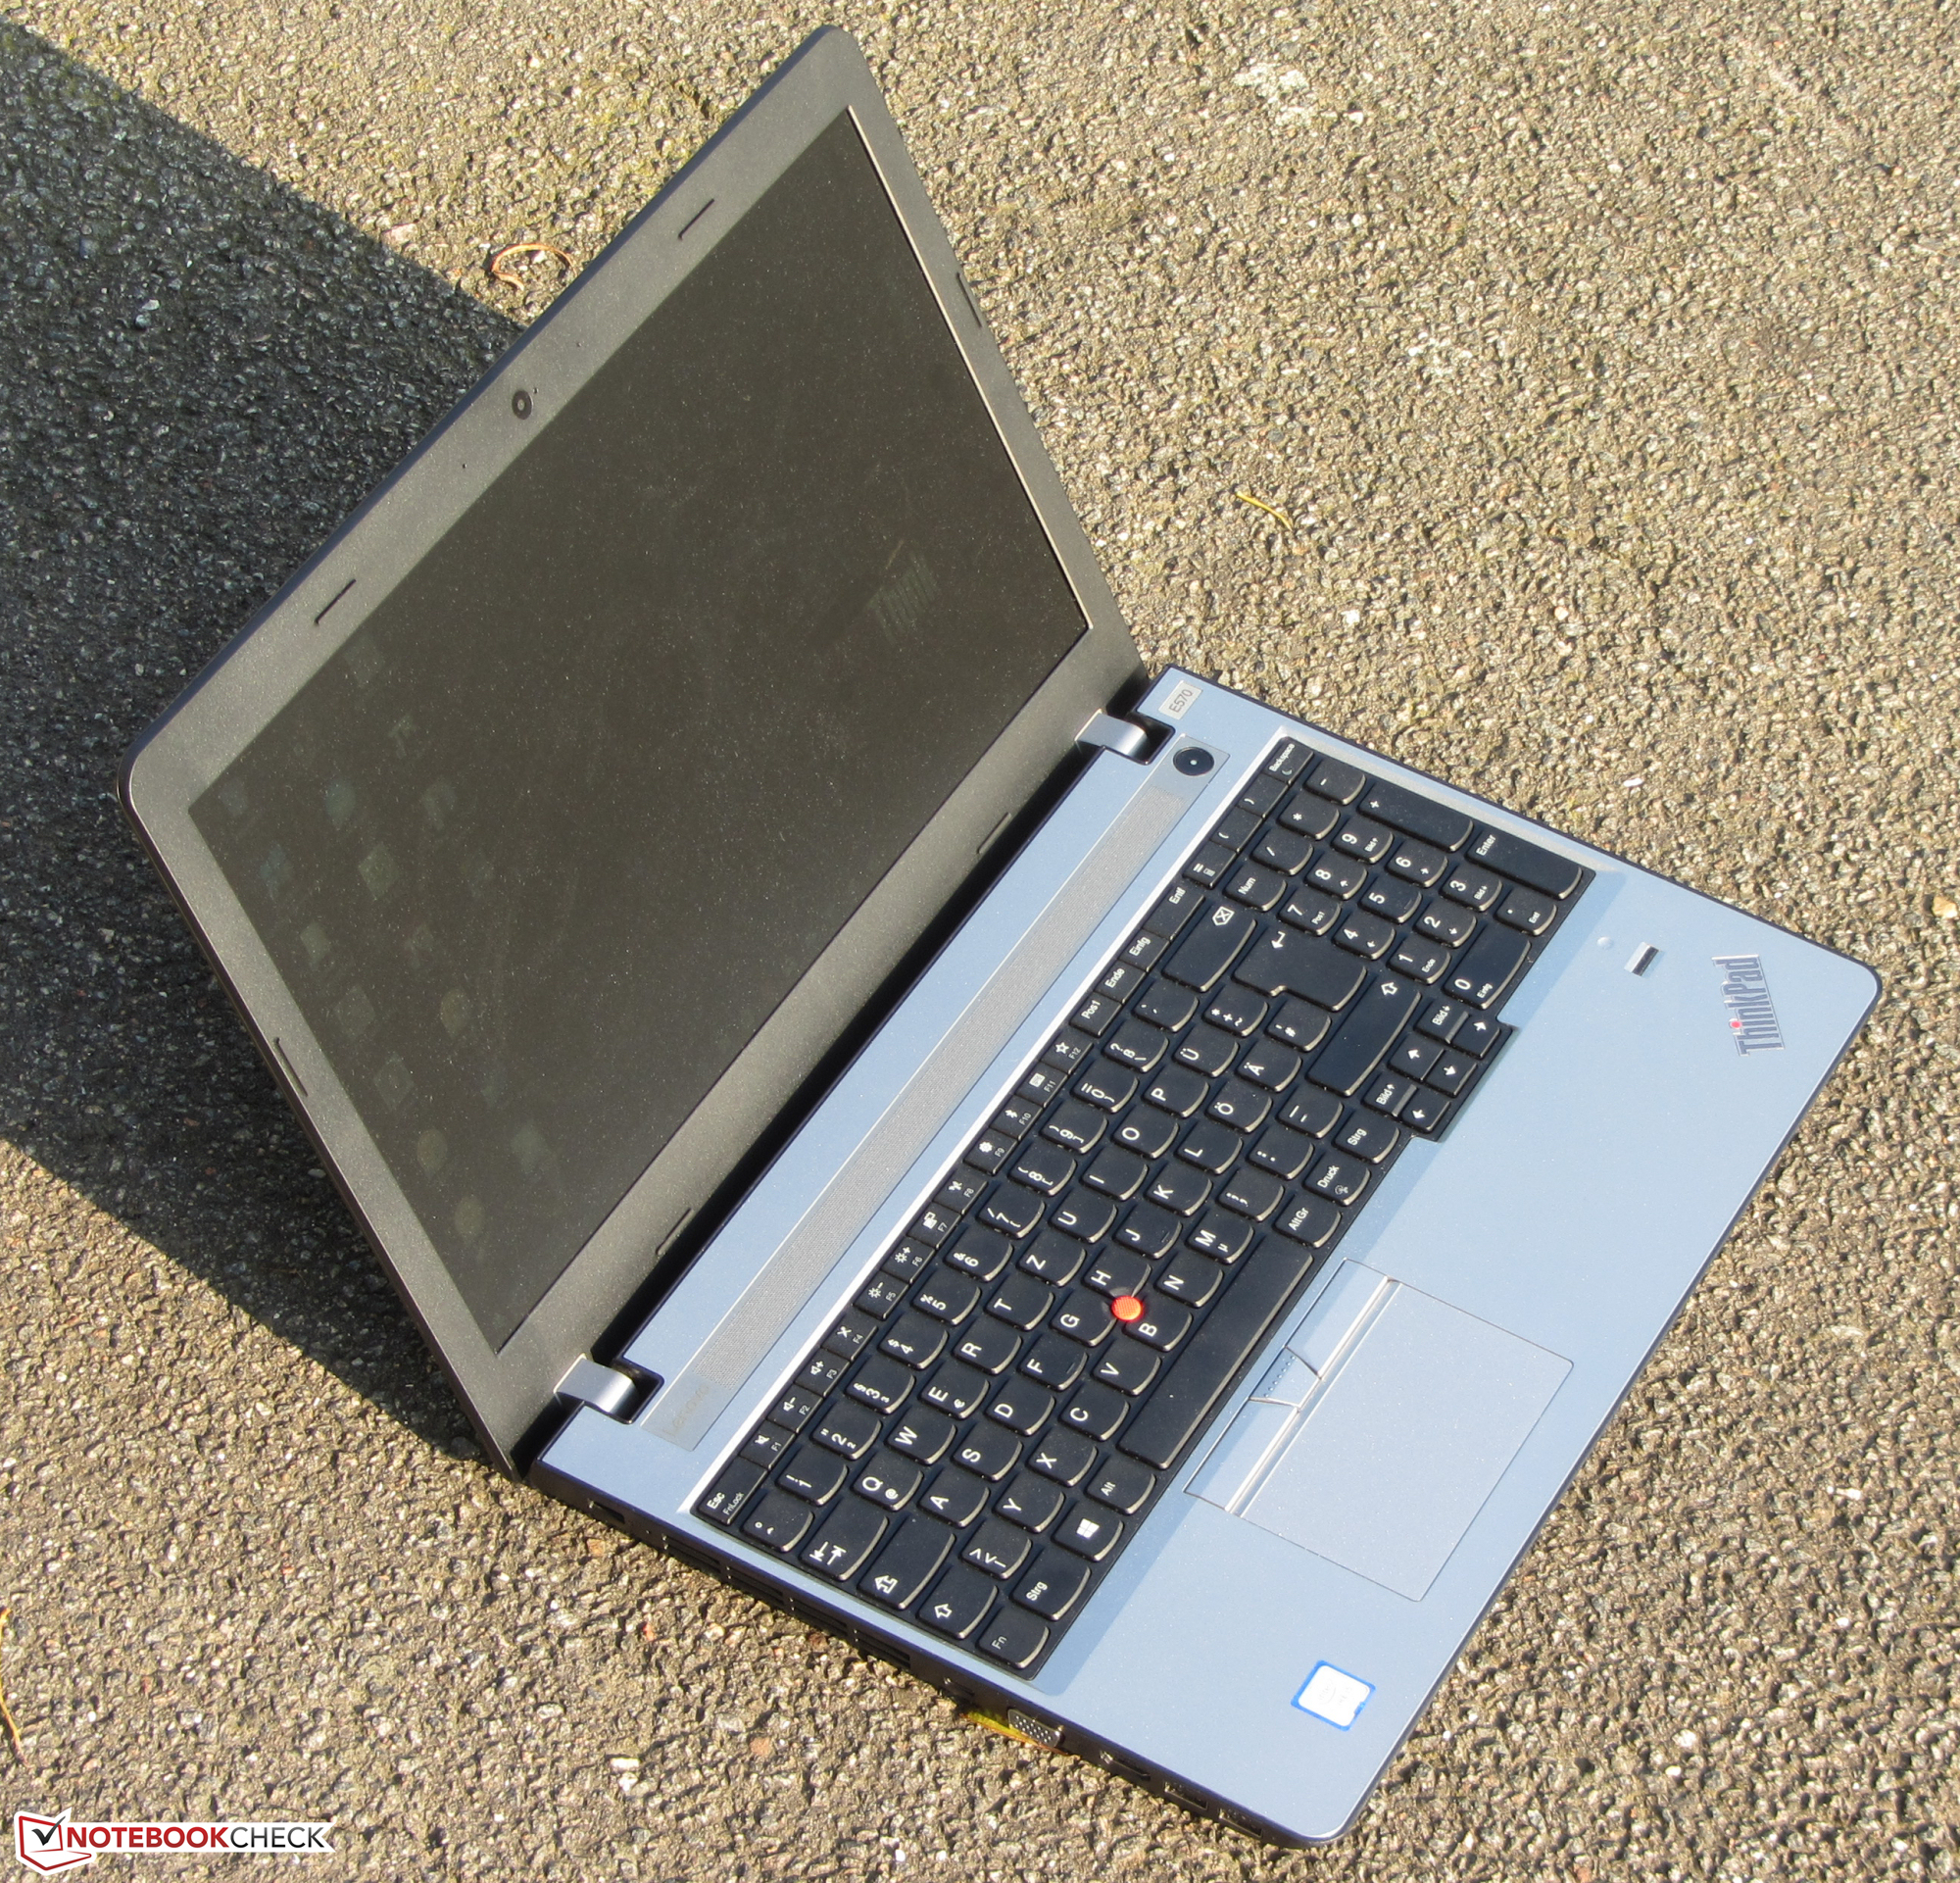
Lenovo ha sbagliato nella scelta dello schermo. Raccomandiamo il modello IPS FHD.
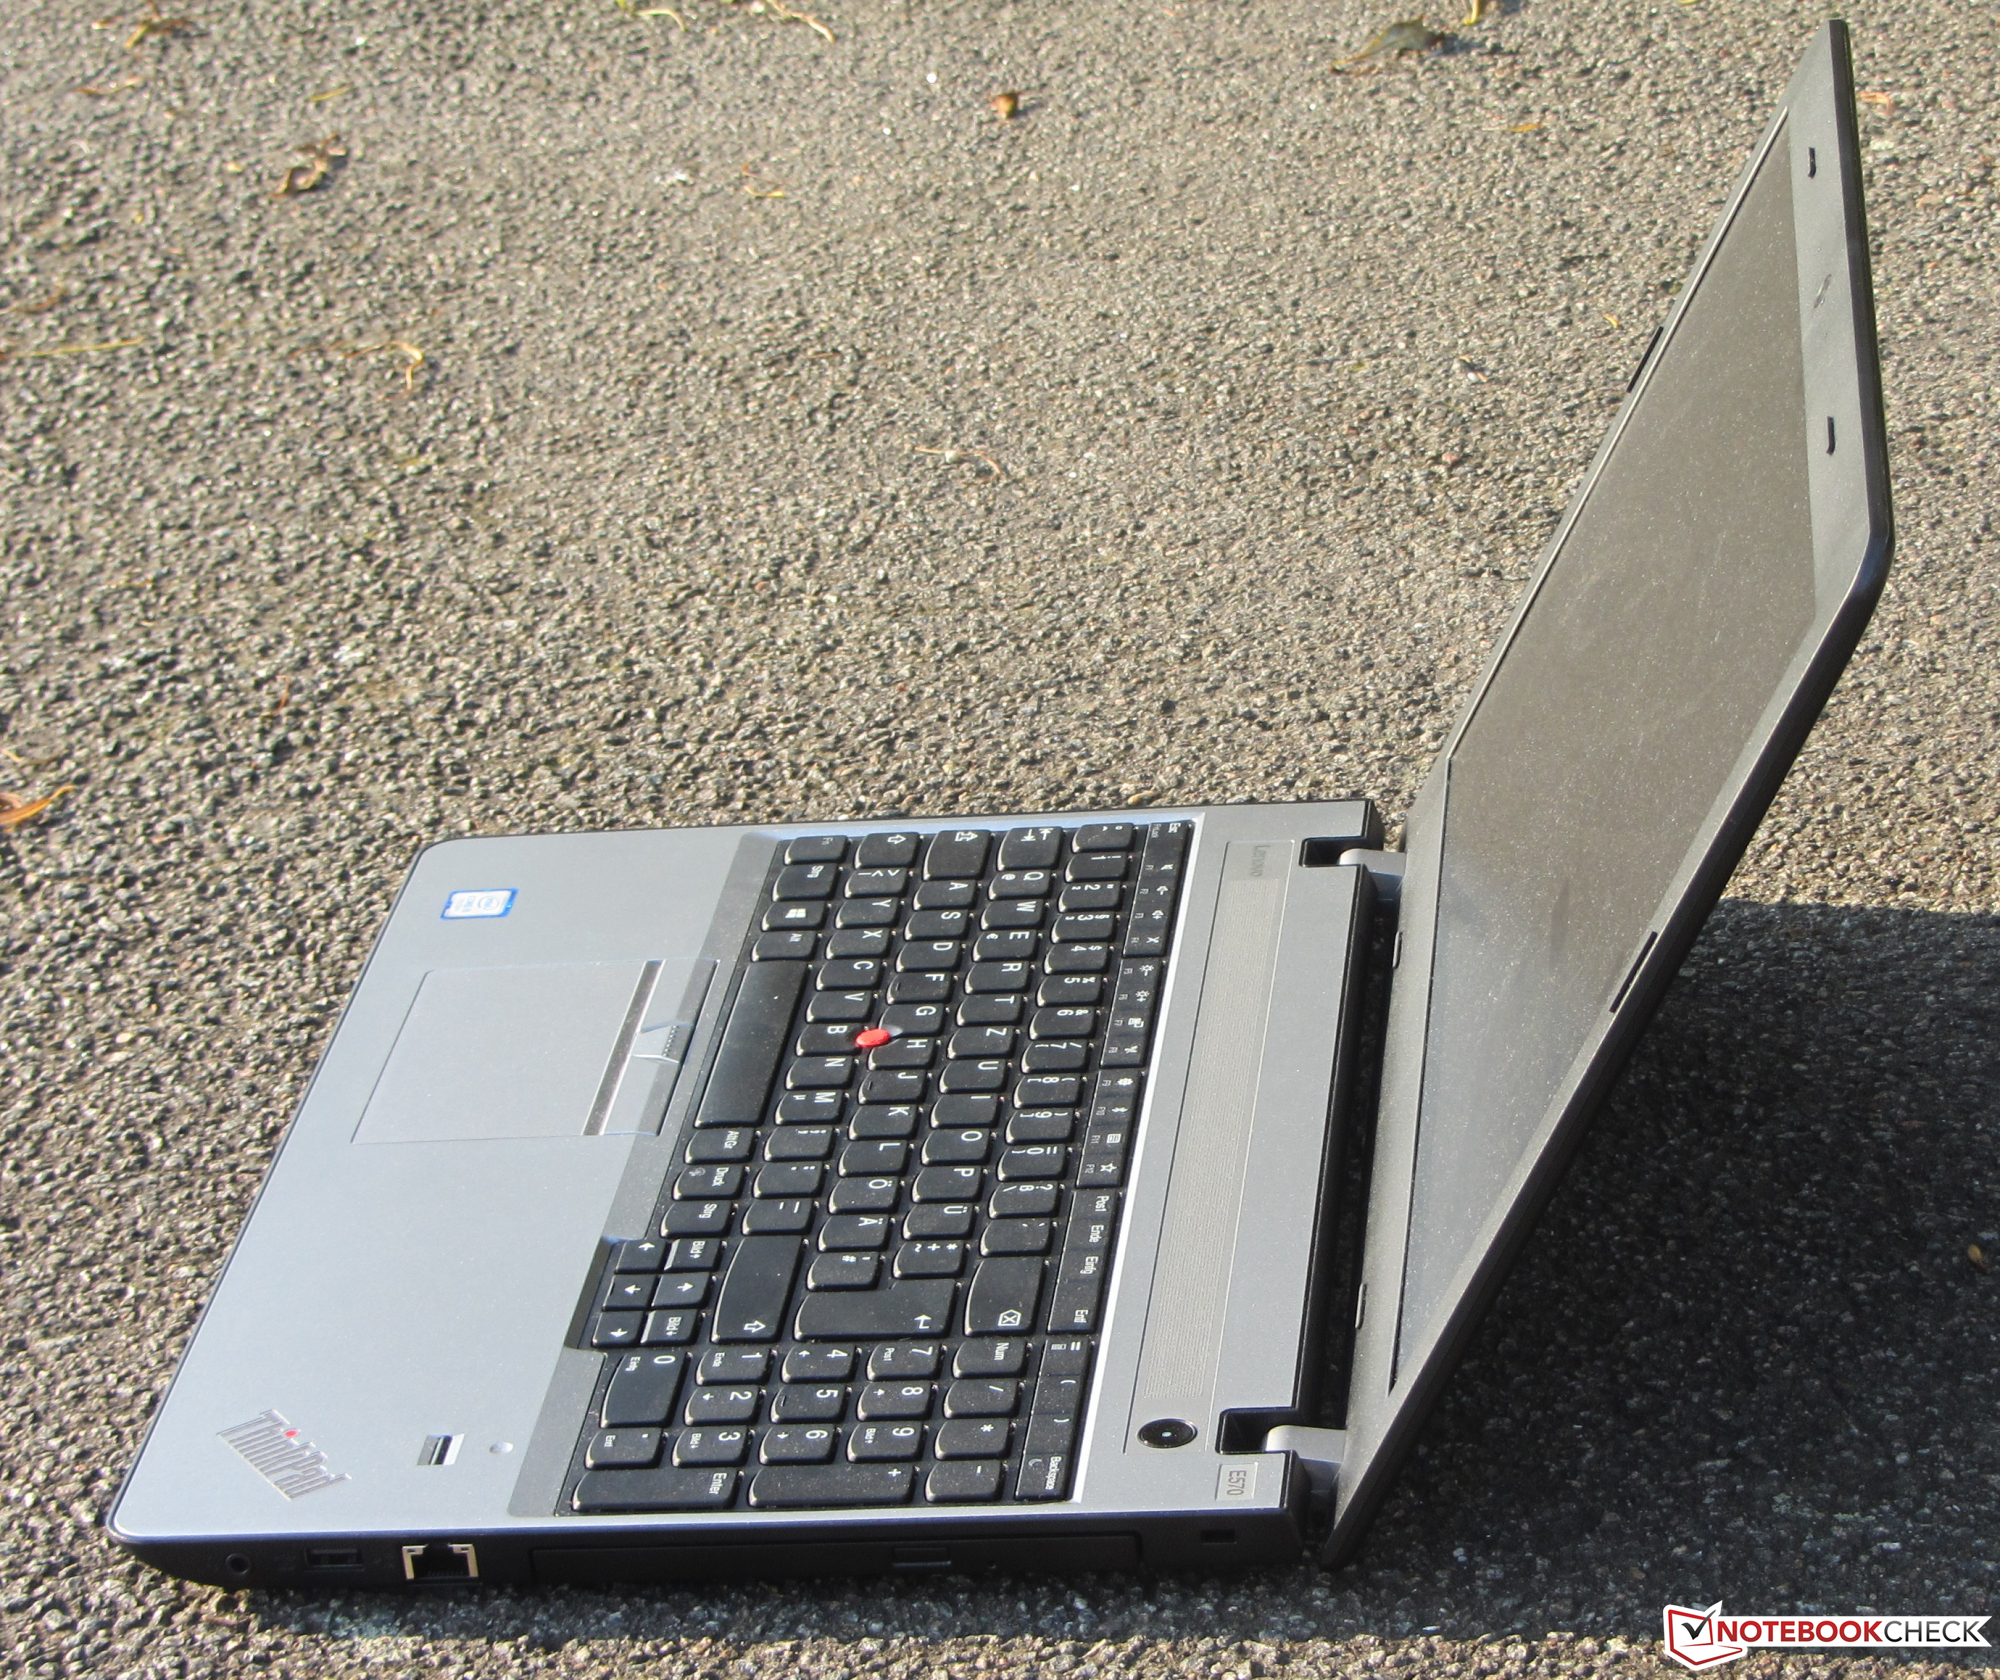
Oltre al colore e all'assenza di unità grafica, la principale differenza tra il modello recensito ed il precedente modello E570 è lo schermo. Lenovo installa un pannello HD poco convincente. E' scuro, con angoli di visuale limitati, e con PWM flickering. Coloro che vogliono il ThinkPad dovrebbero optare per il modello IPS FHD.
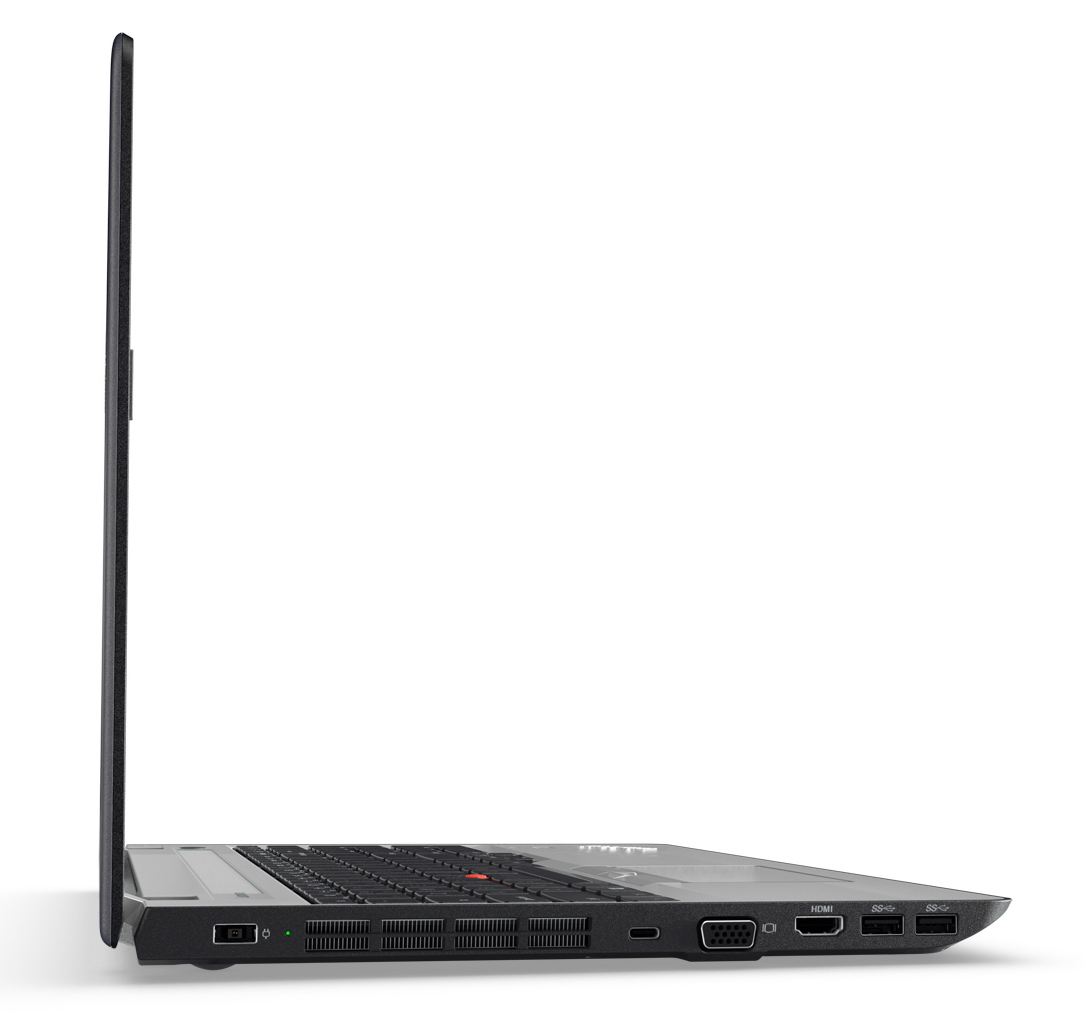
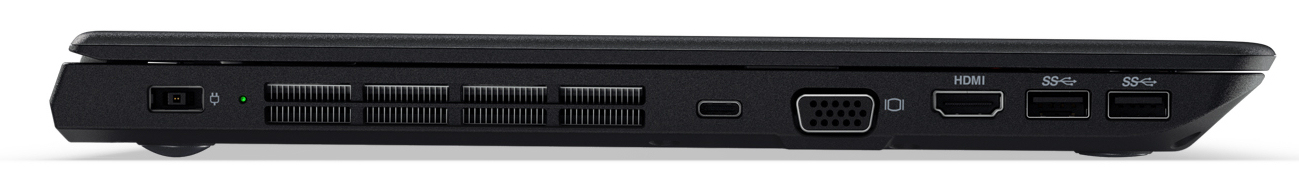
In aggiunta allo schermo, ci sono altre cose da criticare sul ThinkPad. Il case dell'E570 non è particolarmente resistente. Un passo indietro rispetto al predecessore. Un altro passo indietro è l'assenza della porta docking (OneLink). Le docking stations OneLink non possono essere usate e dovranno essere sostituiti con modelli USB se necessario. Nemmeno le batterie del ThinkPad E560 possono essere usate. Inoltre, Lenovo prevede solo un anno di garanzia.
Nota: si tratta di una recensione breve, con alcune sezioni non tradotte, per la versione integrale in inglese guardate qui.
Lenovo ThinkPad E570-20H6S02M00
- 10/02/2017 v6 (old)
Sascha Mölck