Recensione breve del Portatile HP ProBook 470 G5 (i5-8250U, 930MX, SSD, FHD)
| SD Card Reader | |
| average JPG Copy Test (av. of 3 runs) | |
| HP ProBook 470 G5 (Toshiba Exceria Pro SDXC 64 GB UHS-II) | |
| HP ProBook 470 G4 (Toshiba Exceria Pro SDXC 64 GB UHS-II) | |
| Acer Aspire E5-774G-78NA | |
| Lenovo V320-17IKB 81AH0002GE (Toshiba Exceria Pro SDXC 64 GB UHS-II) | |
| HP 17-bs103ng (Toshiba Exceria Pro SDXC 64 GB UHS-II) | |
| maximum AS SSD Seq Read Test (1GB) | |
| HP ProBook 470 G5 (Toshiba Exceria Pro SDXC 64 GB UHS-II) | |
| HP ProBook 470 G4 (Toshiba Exceria Pro SDXC 64 GB UHS-II) | |
| Acer Aspire E5-774G-78NA | |
| Lenovo V320-17IKB 81AH0002GE (Toshiba Exceria Pro SDXC 64 GB UHS-II) | |
| HP 17-bs103ng (Toshiba Exceria Pro SDXC 64 GB UHS-II) | |
| Networking | |
| iperf3 transmit AX12 | |
| HP ProBook 470 G5 | |
| Lenovo V320-17IKB 81AH0002GE | |
| HP 17-bs103ng | |
| iperf3 receive AX12 | |
| HP ProBook 470 G5 | |
| Lenovo V320-17IKB 81AH0002GE | |
| HP 17-bs103ng | |
| |||||||||||||||||||||||||
Distribuzione della luminosità: 87 %
Al centro con la batteria: 400 cd/m²
Contrasto: 635:1 (Nero: 0.63 cd/m²)
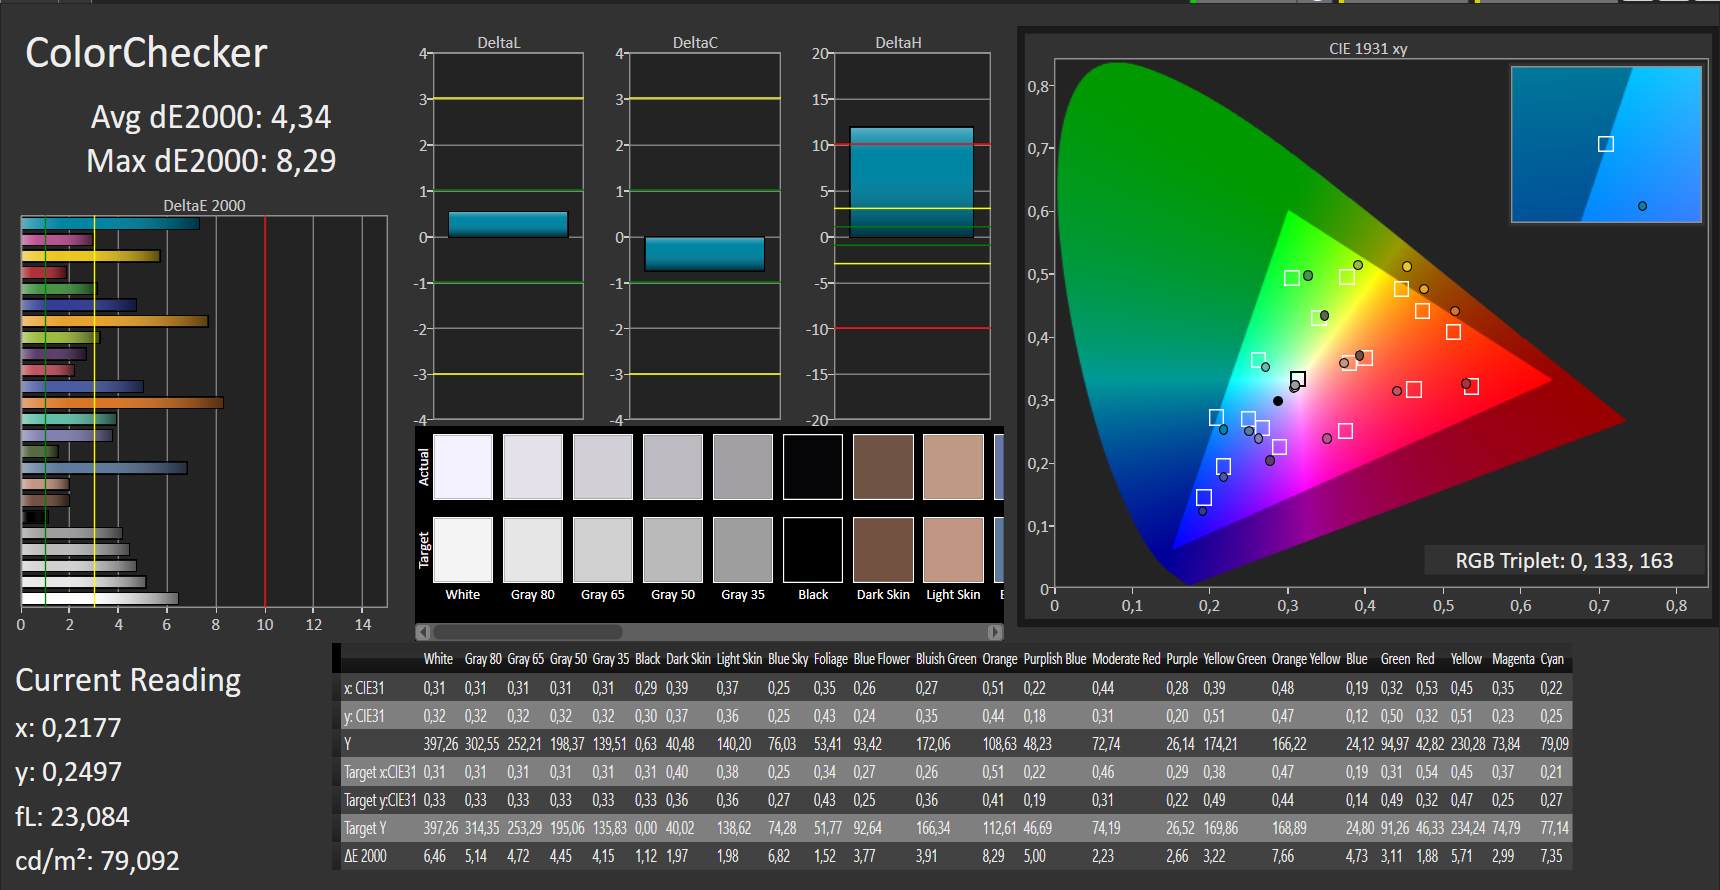
ΔE ColorChecker Calman: 4.34 | ∀{0.5-29.43 Ø4.73}
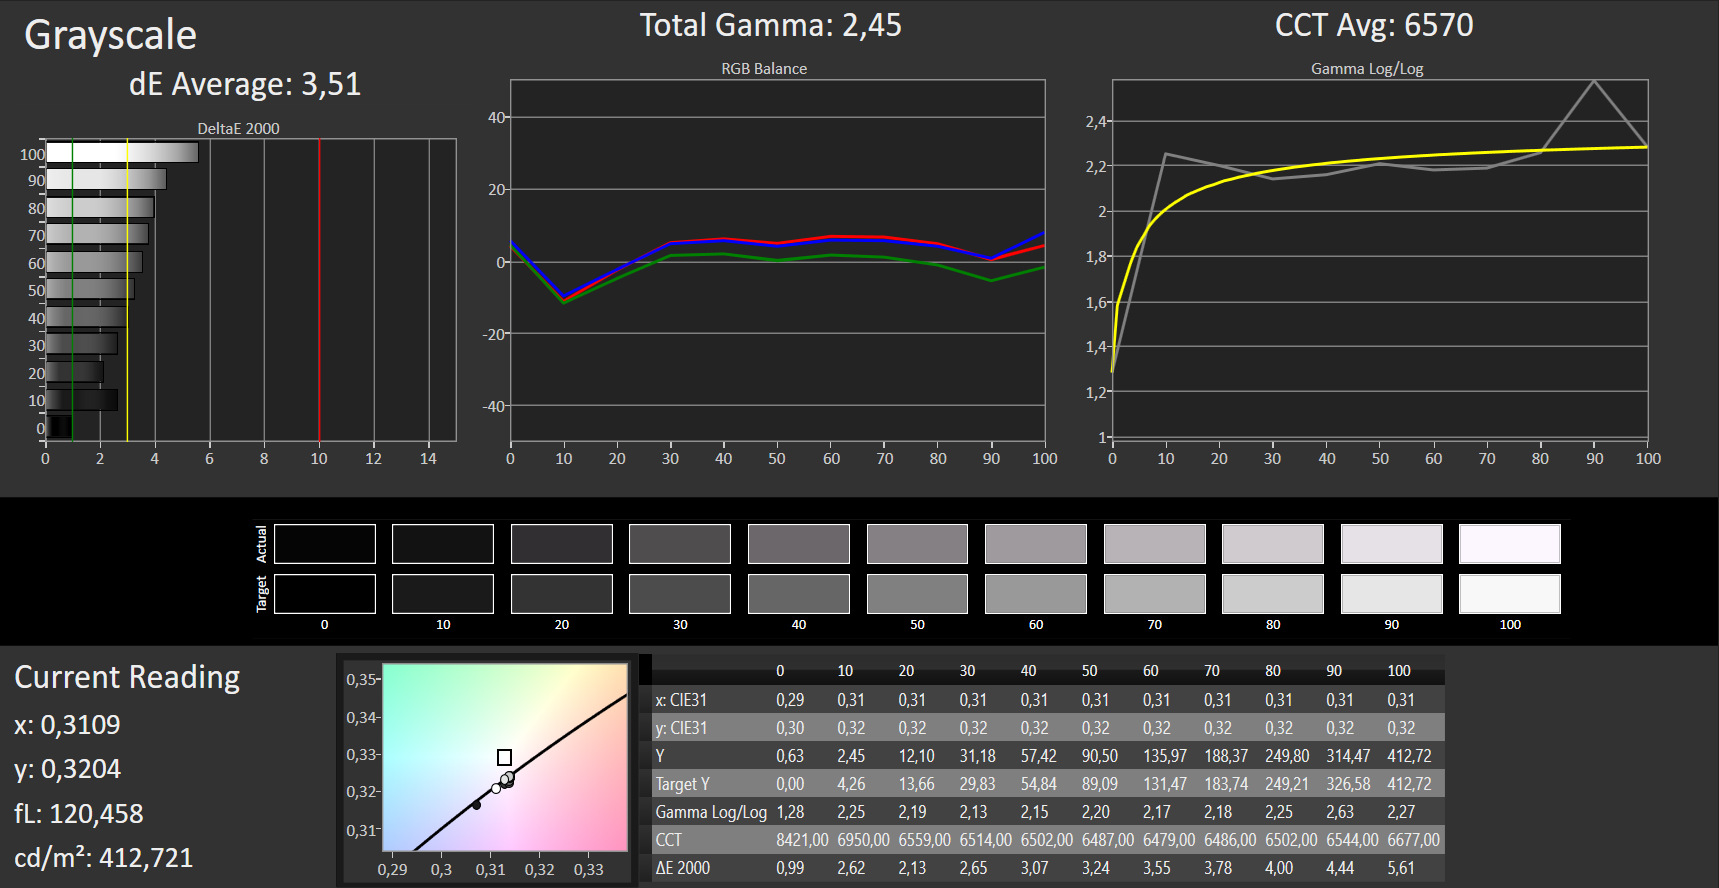
ΔE Greyscale Calman: 3.51 | ∀{0.09-98 Ø4.97}
84% sRGB (Argyll 1.6.3 3D)
55% AdobeRGB 1998 (Argyll 1.6.3 3D)
61.8% AdobeRGB 1998 (Argyll 3D)
84.4% sRGB (Argyll 3D)
66.1% Display P3 (Argyll 3D)
Gamma: 2.45
CCT: 6570 K
| HP ProBook 470 G5 IPS, 1920x1080, 17.3" | HP ProBook 470 G4 LED IPS, 1920x1080, 17.3" | Lenovo V320-17IKB 81AH0002GE IPS, 1920x1080, 17.3" | HP 17-bs103ng TN LED, 1600x900, 17.3" | Acer Aspire E5-774G-78NA TN LED, 1920x1080, 17.3" | |
|---|---|---|---|---|---|
| Display | 4% | 0% | -17% | 11% | |
| Display P3 Coverage (%) | 66.1 | 64.1 -3% | 66.5 1% | 51.2 -23% | 72.3 9% |
| sRGB Coverage (%) | 84.4 | 92 9% | 84.5 0% | 73.8 -13% | 94.8 12% |
| AdobeRGB 1998 Coverage (%) | 61.8 | 65.7 6% | 61.8 0% | 52.8 -15% | 69.3 12% |
| Response Times | -8% | 9% | 16% | 1% | |
| Response Time Grey 50% / Grey 80% * (ms) | 36 ? | 44 ? -22% | 35 ? 3% | 45 ? -25% | 43 ? -19% |
| Response Time Black / White * (ms) | 28 ? | 26 ? 7% | 24 ? 14% | 12 ? 57% | 22 ? 21% |
| PWM Frequency (Hz) | 119000 ? | 1000 ? | |||
| Screen | 22% | 3% | -61% | -24% | |
| Brightness middle (cd/m²) | 400 | 361 -10% | 412 3% | 234 -41% | 320 -20% |
| Brightness (cd/m²) | 374 | 322 -14% | 377 1% | 202 -46% | 302 -19% |
| Brightness Distribution (%) | 87 | 84 -3% | 83 -5% | 74 -15% | 86 -1% |
| Black Level * (cd/m²) | 0.63 | 0.24 62% | 0.39 38% | 0.48 24% | 0.4 37% |
| Contrast (:1) | 635 | 1504 137% | 1056 66% | 488 -23% | 800 26% |
| Colorchecker dE 2000 * | 4.34 | 3.4 22% | 5.04 -16% | 10.28 -137% | 7.78 -79% |
| Colorchecker dE 2000 max. * | 8.29 | 6.6 20% | 8.84 -7% | 18.5 -123% | 12.74 -54% |
| Greyscale dE 2000 * | 3.51 | 4 -14% | 5.28 -50% | 12.78 -264% | 8.87 -153% |
| Gamma | 2.45 90% | 2.17 101% | 2.44 90% | 2.5 88% | 2.27 97% |
| CCT | 6570 99% | 6879 94% | 6900 94% | 13604 48% | 8979 72% |
| Color Space (Percent of AdobeRGB 1998) (%) | 55 | 59.6 8% | 55 0% | 59 7% | 62 13% |
| Color Space (Percent of sRGB) (%) | 84 | 91.6 9% | 84 0% | 92 10% | 95 13% |
| Media totale (Programma / Settaggio) | 6% /
14% | 4% /
3% | -21% /
-42% | -4% /
-13% |
* ... Meglio usare valori piccoli
Sfarfallio dello schermo / PWM (Pulse-Width Modulation)
| flickering dello schermo / PWM non rilevato | ||
In confronto: 52 % di tutti i dispositivi testati non utilizza PWM per ridurre la luminosita' del display. Se è rilevato PWM, una media di 7784 (minimo: 5 - massimo: 343500) Hz è stata rilevata. | ||
Tempi di risposta del Display
| ↔ Tempi di risposta dal Nero al Bianco | ||
|---|---|---|
| 28 ms ... aumenta ↗ e diminuisce ↘ combinato | ↗ 16 ms Incremento | 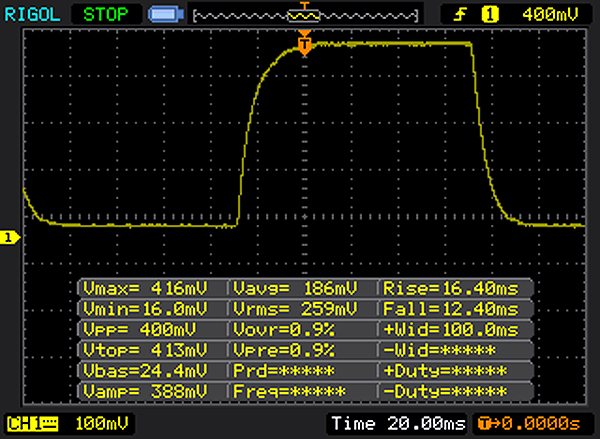 |
| ↘ 12 ms Calo | ||
| Lo schermo mostra tempi di risposta relativamente lenti nei nostri tests e potrebbe essere troppo lento per i gamers. In confronto, tutti i dispositivi di test variano da 0.1 (minimo) a 240 (massimo) ms. » 71 % di tutti i dispositivi è migliore. Questo significa che i tempi di risposta rilevati sono peggiori rispetto alla media di tutti i dispositivi testati (19.9 ms). | ||
| ↔ Tempo di risposta dal 50% Grigio all'80% Grigio | ||
| 36 ms ... aumenta ↗ e diminuisce ↘ combinato | ↗ 18 ms Incremento | 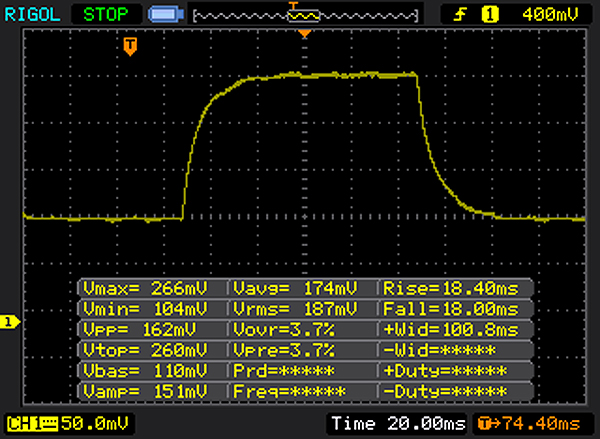 |
| ↘ 18 ms Calo | ||
| Lo schermo mostra tempi di risposta lenti nei nostri tests e sarà insoddisfacente per i gamers. In confronto, tutti i dispositivi di test variano da 0.165 (minimo) a 636 (massimo) ms. » 50 % di tutti i dispositivi è migliore. Questo significa che i tempi di risposta rilevati sono peggiori rispetto alla media di tutti i dispositivi testati (31.1 ms). | ||
| Cinebench R15 | |
| CPU Single 64Bit | |
| Acer Aspire 7 A717-71G-72VY | |
| MSI GS63VR 7RG-005 | |
| Acer Aspire 7 A715-71G-53TU | |
| HP ProBook 470 G4 | |
| HP 17-bs103ng | |
| HP ProBook 470 G5 | |
| Lenovo Legion Y520-15IKBN 80WK0042GE | |
| Acer Aspire E5-774G-78NA | |
| Lenovo V320-17IKB 81AH0002GE | |
| CPU Multi 64Bit | |
| MSI GS63VR 7RG-005 | |
| Acer Aspire 7 A717-71G-72VY | |
| HP ProBook 470 G5 | |
| HP 17-bs103ng | |
| Lenovo Legion Y520-15IKBN 80WK0042GE | |
| Acer Aspire 7 A715-71G-53TU | |
| HP ProBook 470 G4 | |
| Acer Aspire E5-774G-78NA | |
| Lenovo V320-17IKB 81AH0002GE | |
| Cinebench R10 | |
| Rendering Multiple CPUs 32Bit | |
| MSI GS63VR 7RG-005 | |
| HP ProBook 470 G5 | |
| Acer Aspire 7 A715-71G-53TU | |
| Lenovo Legion Y520-15IKBN 80WK0042GE | |
| HP 17-bs103ng | |
| HP ProBook 470 G4 | |
| Lenovo V320-17IKB 81AH0002GE | |
| Acer Aspire E5-774G-78NA | |
| Rendering Single 32Bit | |
| MSI GS63VR 7RG-005 | |
| HP ProBook 470 G4 | |
| Acer Aspire 7 A715-71G-53TU | |
| HP ProBook 470 G5 | |
| HP 17-bs103ng | |
| Lenovo Legion Y520-15IKBN 80WK0042GE | |
| Lenovo V320-17IKB 81AH0002GE | |
| Acer Aspire E5-774G-78NA | |
| Geekbench 3 | |
| 32 Bit Multi-Core Score | |
| MSI GS63VR 7RG-005 | |
| HP 17-bs103ng | |
| HP ProBook 470 G5 | |
| Lenovo Legion Y520-15IKBN 80WK0042GE | |
| Acer Aspire E5-774G-78NA | |
| Lenovo V320-17IKB 81AH0002GE | |
| 32 Bit Single-Core Score | |
| MSI GS63VR 7RG-005 | |
| Acer Aspire E5-774G-78NA | |
| HP 17-bs103ng | |
| HP ProBook 470 G5 | |
| Lenovo V320-17IKB 81AH0002GE | |
| Lenovo Legion Y520-15IKBN 80WK0042GE | |
| Geekbench 4.0 | |
| 64 Bit Multi-Core Score | |
| MSI GS63VR 7RG-005 | |
| HP 17-bs103ng | |
| HP ProBook 470 G5 | |
| Lenovo Legion Y520-15IKBN 80WK0042GE | |
| Lenovo V320-17IKB 81AH0002GE | |
| 64 Bit Single-Core Score | |
| MSI GS63VR 7RG-005 | |
| Lenovo Legion Y520-15IKBN 80WK0042GE | |
| HP ProBook 470 G5 | |
| HP 17-bs103ng | |
| Lenovo V320-17IKB 81AH0002GE | |
| Geekbench 4.4 | |
| 64 Bit Multi-Core Score | |
| MSI GS63VR 7RG-005 | |
| HP 17-bs103ng | |
| HP ProBook 470 G5 | |
| Lenovo Legion Y520-15IKBN 80WK0042GE | |
| Lenovo V320-17IKB 81AH0002GE | |
| 64 Bit Single-Core Score | |
| MSI GS63VR 7RG-005 | |
| HP ProBook 470 G5 | |
| HP 17-bs103ng | |
| Lenovo Legion Y520-15IKBN 80WK0042GE | |
| Lenovo V320-17IKB 81AH0002GE | |
| JetStream 1.1 - 1.1 Total | |
| MSI GS63VR 7RG-005 (Edge 41) | |
| HP 17-bs103ng (Edge 41) | |
| Acer Aspire 7 A715-71G-53TU (EDGE: 41.16299.15.0) | |
| Lenovo Legion Y520-15IKBN 80WK0042GE (Edge 40) | |
| HP ProBook 470 G5 (Edge 41) | |
| Acer Aspire E5-774G-78NA (Edge 38.14393.0.0) | |
| Lenovo V320-17IKB 81AH0002GE (Edge 40) | |
| Octane V2 - Total Score | |
| MSI GS63VR 7RG-005 (Edge 41) | |
| HP ProBook 470 G4 | |
| Acer Aspire 7 A715-71G-53TU (EDGE: 41.16299.15.0) | |
| HP ProBook 470 G5 (Edge 41) | |
| Lenovo Legion Y520-15IKBN 80WK0042GE (Edge 40) | |
| Acer Aspire E5-774G-78NA (Edge 38.14393.0.0) | |
| Lenovo V320-17IKB 81AH0002GE (Edge 40) | |
| Mozilla Kraken 1.1 - Total | |
| Lenovo V320-17IKB 81AH0002GE (Edge 40) | |
| Acer Aspire E5-774G-78NA (Edge 38.14393.0.0) | |
| Lenovo Legion Y520-15IKBN 80WK0042GE (Edge 40) | |
| HP ProBook 470 G5 (Edge 41) | |
| Acer Aspire 7 A715-71G-53TU (EDGE: 41.16299.15.0) | |
| MSI GS63VR 7RG-005 (Edge 41) | |
* ... Meglio usare valori piccoli
| PCMark 7 Score | 5862 punti | |
| PCMark 8 Home Score Accelerated v2 | 3844 punti | |
| PCMark 8 Creative Score Accelerated v2 | 4888 punti | |
| PCMark 8 Work Score Accelerated v2 | 4922 punti | |
| PCMark 10 Score | 3372 punti | |
Aiuto | ||
| PCMark 8 | |
| Home Score Accelerated v2 | |
| HP ProBook 470 G5 | |
| HP 17-bs103ng | |
| Lenovo V320-17IKB 81AH0002GE | |
| Acer Aspire E5-774G-78NA | |
| HP ProBook 470 G4 | |
| Work Score Accelerated v2 | |
| HP ProBook 470 G5 | |
| HP ProBook 470 G4 | |
| HP 17-bs103ng | |
| Lenovo V320-17IKB 81AH0002GE | |
| Acer Aspire E5-774G-78NA | |

| HP ProBook 470 G5 Intel SSD 600p SSDPEKKW256G7 | HP ProBook 470 G4 SanDisk Z400s SD8SNAT-256G | Lenovo V320-17IKB 81AH0002GE SK Hynix HFS256G3BTND | HP 17-bs103ng Seagate Mobile HDD 1TB ST1000LM035 | Acer Aspire E5-774G-78NA Lite-On CV1-8B256 | Schenker XMG Core 15 Samsung SSD 960 Evo 250GB m.2 NVMe | |
|---|---|---|---|---|---|---|
| CrystalDiskMark 3.0 | -46% | -40% | -95% | -33% | 47% | |
| Read Seq (MB/s) | 1113 | 472 -58% | 473.7 -57% | 73 -93% | 520 -53% | 1338 20% |
| Write Seq (MB/s) | 592 | 323 -45% | 260.8 -56% | 80.1 -86% | 332.8 -44% | 1188 101% |
| Read 512 (MB/s) | 831 | 337 -59% | 29.93 -96% | 382.8 -54% | 780 -6% | |
| Write 512 (MB/s) | 596 | 263.3 -56% | 72.3 -88% | 357.7 -40% | 1006 69% | |
| Read 4k (MB/s) | 32.12 | 16.9 -47% | 29.41 -8% | 0.399 -99% | 32.31 1% | 58.3 82% |
| Write 4k (MB/s) | 111.3 | 81.4 -27% | 73.3 -34% | 0.502 -100% | 85.1 -24% | 134 20% |
| Read 4k QD32 (MB/s) | 289.3 | 148 -49% | 298.3 3% | 0.707 -100% | 277.7 -4% | 577 99% |
| Write 4k QD32 (MB/s) | 520 | 254 -51% | 242.5 -53% | 0.704 -100% | 269.8 -48% | 481.9 -7% |
| 3DMark 06 Standard Score | 13529 punti | |
| 3DMark 11 Performance | 2568 punti | |
| 3DMark Ice Storm Standard Score | 71571 punti | |
| 3DMark Cloud Gate Standard Score | 8611 punti | |
| 3DMark Fire Strike Score | 1491 punti | |
| 3DMark Fire Strike Extreme Score | 718 punti | |
| 3DMark Time Spy Score | 564 punti | |
Aiuto | ||
| 3DMark 11 - 1280x720 Performance GPU | |
| Acer Aspire E5-774G-78NA | |
| HP ProBook 470 G5 | |
| HP 17-bs103ng | |
| HP ProBook 470 G4 | |
| Lenovo Ideapad 110-17IKB 80VK0001GE | |
| Lenovo V320-17IKB 81AH0002GE | |
| HP 17-y044ng | |
| 3DMark | |
| 1280x720 Cloud Gate Standard Graphics | |
| Acer Aspire E5-774G-78NA | |
| HP ProBook 470 G4 | |
| HP ProBook 470 G5 | |
| Lenovo V320-17IKB 81AH0002GE | |
| HP 17-bs103ng | |
| 1920x1080 Fire Strike Graphics | |
| Acer Aspire E5-774G-78NA | |
| HP ProBook 470 G5 | |
| HP ProBook 470 G4 | |
| HP 17-bs103ng | |
| Lenovo V320-17IKB 81AH0002GE | |
| basso | medio | alto | ultra | |
|---|---|---|---|---|
| StarCraft 2 (2010) | 300.2 | 83.3 | 45.9 | 24.7 |
| Diablo III (2012) | 139.2 | 94.6 | 80 | 47.1 |
| Tomb Raider (2013) | 136 | 65.4 | 36.4 | 17.7 |
| BioShock Infinite (2013) | 93.7 | 53.1 | 43.9 | 14.6 |
| Sims 4 (2014) | 186 | 81.2 | 40.3 | 30.4 |
| Dragon Age: Inquisition (2014) | 55.2 | 35.8 | 12.1 | 8.2 |
| Battlefield Hardline (2015) | 83.1 | 57.4 | 19.4 | 11.8 |
| The Witcher 3 (2015) | 30.5 | 18.5 | 10 | 6 |
| Dota 2 Reborn (2015) | 91 | 74 | 35.5 | 33.2 |
| World of Warships (2015) | 122 | 85.5 | 38.7 | 24.4 |
| Overwatch (2016) | 74.2 | 52.2 | 23.3 | 14.8 |
| Mirror's Edge Catalyst (2016) | 42.1 | 25.6 | 11.3 | 8.7 |
| Farming Simulator 17 (2016) | 133.8 | 85.1 | 34.6 | 23.8 |
| For Honor (2017) | 43.4 | 14.2 | 13.6 | 10.4 |
| Ghost Recon Wildlands (2017) | 26.4 | 10.8 | 9.7 | 3.1 |
| Prey (2017) | 56 | 21.2 | 17.6 | 14.9 |
| Rocket League (2017) | 89.6 | 30.9 | 21.3 | |
| Team Fortress 2 (2017) | 105 | 100 | 75 | 41 |
| Playerunknown's Battlegrounds (PUBG) (2017) | 41.4 | 16.7 | 14.7 | 9.1 |
| F1 2017 (2017) | 45 | 21 | 16 | 13 |
| FIFA 18 (2017) | 124 | 65.2 | 52 | 49.9 |
| Middle-earth: Shadow of War (2017) | 30 | 12 | 9 | 7 |
| ELEX (2017) | 27.1 | 12.8 | 10.2 | 7.4 |
| Destiny 2 (2017) | 30 | 13.1 | 10.8 | 7.9 |
| Assassin´s Creed Origins (2017) | 23 | 10 | 9 | 7 |
| Call of Duty WWII (2017) | 60 | 36.3 | 16.9 | 11.7 |
| Need for Speed Payback (2017) | 30.9 | 15.3 | 12.5 | 12 |
| Star Wars Battlefront 2 (2017) | 43 | 16.2 | 13.6 | 10 |
| BioShock Infinite - 1366x768 High Preset | |
| Acer Aspire 5 A517-51G-80L | |
| Acer Aspire E5-774G-78NA | |
| HP ProBook 470 G5 | |
| HP 17-bs103ng | |
| Lenovo V320-17IKB 81AH0002GE | |
| HP 17-y044ng | |
| Lenovo Ideapad 110-17IKB 80VK0001GE | |
| Tomb Raider - 1366x768 Normal Preset AA:FX AF:4x | |
| Acer Aspire E5-774G-78NA | |
| HP ProBook 470 G5 | |
| HP 17-bs103ng | |
| Lenovo V320-17IKB 81AH0002GE | |
| Lenovo Ideapad 110-17IKB 80VK0001GE | |
| The Witcher 3 - 1024x768 Low Graphics & Postprocessing | |
| Acer Aspire E5-774G-78NA | |
| HP ProBook 470 G5 | |
| HP ProBook 470 G4 | |
Rumorosità
| Idle |
| 30.5 / 30.5 / 30.5 dB(A) |
| Sotto carico |
| 33 / 38 dB(A) |
 | ||
30 dB silenzioso 40 dB(A) udibile 50 dB(A) rumoroso |
||
min: | ||
| HP ProBook 470 G5 i5-8250U, GeForce 930MX | HP ProBook 470 G4 i7-7500U, GeForce 930MX | Lenovo V320-17IKB 81AH0002GE i5-7200U, HD Graphics 620 | HP 17-bs103ng i5-8250U, Radeon 530 | Acer Aspire E5-774G-78NA 6500U, GeForce 940MX | |
|---|---|---|---|---|---|
| Noise | -6% | 0% | -2% | -7% | |
| off /ambiente * (dB) | 30.5 | 29.7 3% | 30 2% | 30.4 -0% | 31.2 -2% |
| Idle Minimum * (dB) | 30.5 | 29.7 3% | 30.5 -0% | 32.6 -7% | 33.2 -9% |
| Idle Average * (dB) | 30.5 | 31.7 -4% | 30.5 -0% | 32.6 -7% | 33.2 -9% |
| Idle Maximum * (dB) | 30.5 | 31.7 -4% | 30.5 -0% | 32.6 -7% | 33.7 -10% |
| Load Average * (dB) | 33 | 37.8 -15% | 35 -6% | 32.8 1% | 36 -9% |
| Load Maximum * (dB) | 38 | 45.9 -21% | 35.8 6% | 34.2 10% | 40 -5% |
* ... Meglio usare valori piccoli
(+) La temperatura massima sul lato superiore è di 38.4 °C / 101 F, rispetto alla media di 34.3 °C / 94 F, che varia da 21.2 a 62.5 °C per questa classe Office.
(±) Il lato inferiore si riscalda fino ad un massimo di 40.1 °C / 104 F, rispetto alla media di 36.8 °C / 98 F
(+) In idle, la temperatura media del lato superiore è di 24.4 °C / 76 F, rispetto alla media deld ispositivo di 29.5 °C / 85 F.
(+) I poggiapolsi e il touchpad sono piu' freddi della temperatura della pelle con un massimo di 26.3 °C / 79.3 F e sono quindi freddi al tatto.
(±) La temperatura media della zona del palmo della mano di dispositivi simili e'stata di 27.5 °C / 81.5 F (+1.2 °C / 2.2 F).
| HP ProBook 470 G5 i5-8250U, GeForce 930MX | HP ProBook 470 G4 i7-7500U, GeForce 930MX | Lenovo V320-17IKB 81AH0002GE i5-7200U, HD Graphics 620 | HP 17-bs103ng i5-8250U, Radeon 530 | Acer Aspire E5-774G-78NA 6500U, GeForce 940MX | |
|---|---|---|---|---|---|
| Heat | -16% | -6% | 7% | -8% | |
| Maximum Upper Side * (°C) | 38.4 | 40 -4% | 37.3 3% | 30 22% | 37.1 3% |
| Maximum Bottom * (°C) | 40.1 | 46 -15% | 37 8% | 28.3 29% | 48 -20% |
| Idle Upper Side * (°C) | 25.4 | 29.9 -18% | 28.7 -13% | 27.2 -7% | 26.1 -3% |
| Idle Bottom * (°C) | 24.9 | 31.2 -25% | 30.1 -21% | 29 -16% | 27.6 -11% |
* ... Meglio usare valori piccoli
HP ProBook 470 G5 analisi audio
(-) | altoparlanti non molto potenti (71.7 dB)
Bassi 100 - 315 Hz
(-) | quasi nessun basso - in media 25.6% inferiori alla media
(±) | la linearità dei bassi è media (8.8% delta rispetto alla precedente frequenza)
Medi 400 - 2000 Hz
(+) | medi bilanciati - solo only 3.6% rispetto alla media
(±) | linearità dei medi adeguata (7.5% delta rispetto alla precedente frequenza)
Alti 2 - 16 kHz
(+) | Alti bilanciati - appena 4% dalla media
(+) | alti lineari (4.1% delta rispetto alla precedente frequenza)
Nel complesso 100 - 16.000 Hz
(±) | la linearità complessiva del suono è media (22.2% di differenza rispetto alla media
Rispetto alla stessa classe
» 58% di tutti i dispositivi testati in questa classe è stato migliore, 9% simile, 33% peggiore
» Il migliore ha avuto un delta di 7%, medio di 21%, peggiore di 53%
Rispetto a tutti i dispositivi testati
» 64% di tutti i dispositivi testati in questa classe è stato migliore, 6% similare, 29% peggiore
» Il migliore ha avuto un delta di 4%, medio di 24%, peggiore di 134%
Apple MacBook 12 (Early 2016) 1.1 GHz analisi audio
(+) | gli altoparlanti sono relativamente potenti (83.6 dB)
Bassi 100 - 315 Hz
(±) | bassi ridotti - in media 11.3% inferiori alla media
(±) | la linearità dei bassi è media (14.2% delta rispetto alla precedente frequenza)
Medi 400 - 2000 Hz
(+) | medi bilanciati - solo only 2.4% rispetto alla media
(+) | medi lineari (5.5% delta rispetto alla precedente frequenza)
Alti 2 - 16 kHz
(+) | Alti bilanciati - appena 2% dalla media
(+) | alti lineari (4.5% delta rispetto alla precedente frequenza)
Nel complesso 100 - 16.000 Hz
(+) | suono nel complesso lineare (10.2% differenza dalla media)
Rispetto alla stessa classe
» 7% di tutti i dispositivi testati in questa classe è stato migliore, 2% simile, 91% peggiore
» Il migliore ha avuto un delta di 5%, medio di 18%, peggiore di 53%
Rispetto a tutti i dispositivi testati
» 5% di tutti i dispositivi testati in questa classe è stato migliore, 1% similare, 94% peggiore
» Il migliore ha avuto un delta di 4%, medio di 24%, peggiore di 134%
| Off / Standby | |
| Idle | |
| Sotto carico |
|
Leggenda:
min: | |
| HP ProBook 470 G5 i5-8250U, GeForce 930MX | HP ProBook 470 G4 i7-7500U, GeForce 930MX | Lenovo V320-17IKB 81AH0002GE i5-7200U, HD Graphics 620 | HP 17-bs103ng i5-8250U, Radeon 530 | Acer Aspire E5-774G-78NA 6500U, GeForce 940MX | |
|---|---|---|---|---|---|
| Power Consumption | -3% | 12% | 32% | -38% | |
| Idle Minimum * (Watt) | 3.4 | 4.3 -26% | 3.8 -12% | 3.5 -3% | 8.2 -141% |
| Idle Average * (Watt) | 9.6 | 8.8 8% | 9.6 -0% | 6.4 33% | 12.6 -31% |
| Idle Maximum * (Watt) | 11.8 | 9.4 20% | 10.4 12% | 6.9 42% | 13 -10% |
| Load Average * (Watt) | 43 | 51.2 -19% | 35.4 18% | 28.1 35% | 51 -19% |
| Load Maximum * (Watt) | 61 | 60.5 1% | 34 44% | 28.2 54% | 54.6 10% |
* ... Meglio usare valori piccoli
| HP ProBook 470 G5 i5-8250U, GeForce 930MX, 48 Wh | HP ProBook 470 G4 i7-7500U, GeForce 930MX, 48 Wh | Lenovo V320-17IKB 81AH0002GE i5-7200U, HD Graphics 620, 35 Wh | HP 17-bs103ng i5-8250U, Radeon 530, 41.6 Wh | Acer Aspire E5-774G-78NA 6500U, GeForce 940MX, 41 Wh | |
|---|---|---|---|---|---|
| Autonomia della batteria | -2% | -38% | -28% | -40% | |
| Reader / Idle (h) | 18.7 | 14.5 -22% | 12.7 -32% | 11.7 -37% | |
| H.264 (h) | 7.6 | 8.8 16% | 4.8 -37% | 5 -34% | |
| WiFi v1.3 (h) | 8.1 | 7.3 -10% | 5 -38% | 5.8 -28% | 5.4 -33% |
| Load (h) | 2.3 | 2.5 9% | 1.3 -43% | 1 -57% |
Pro
Contro
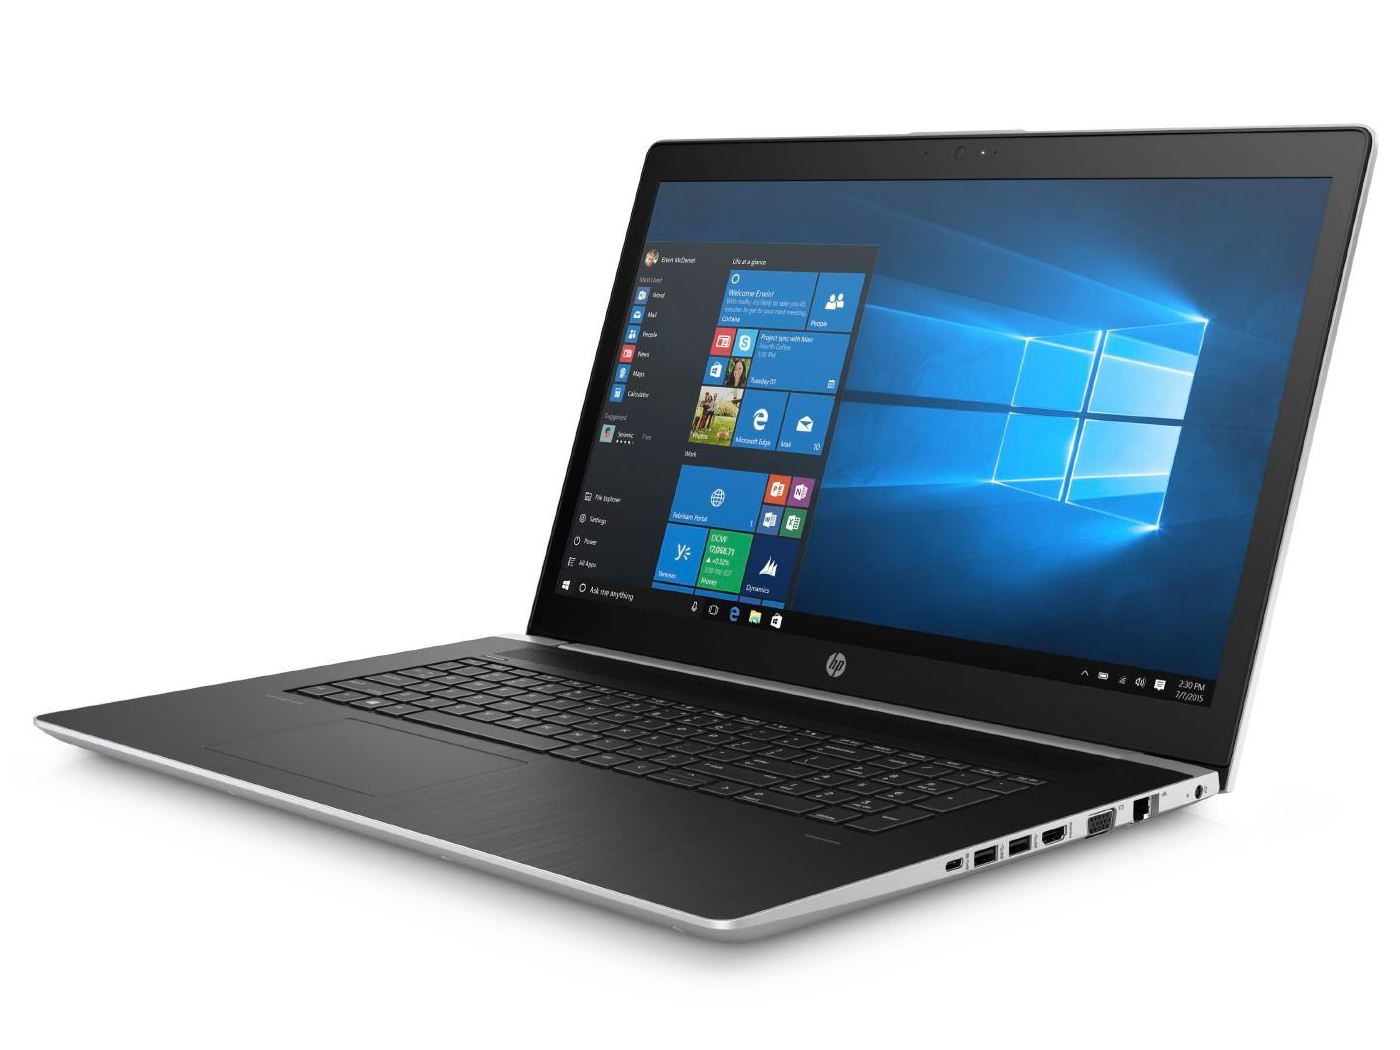
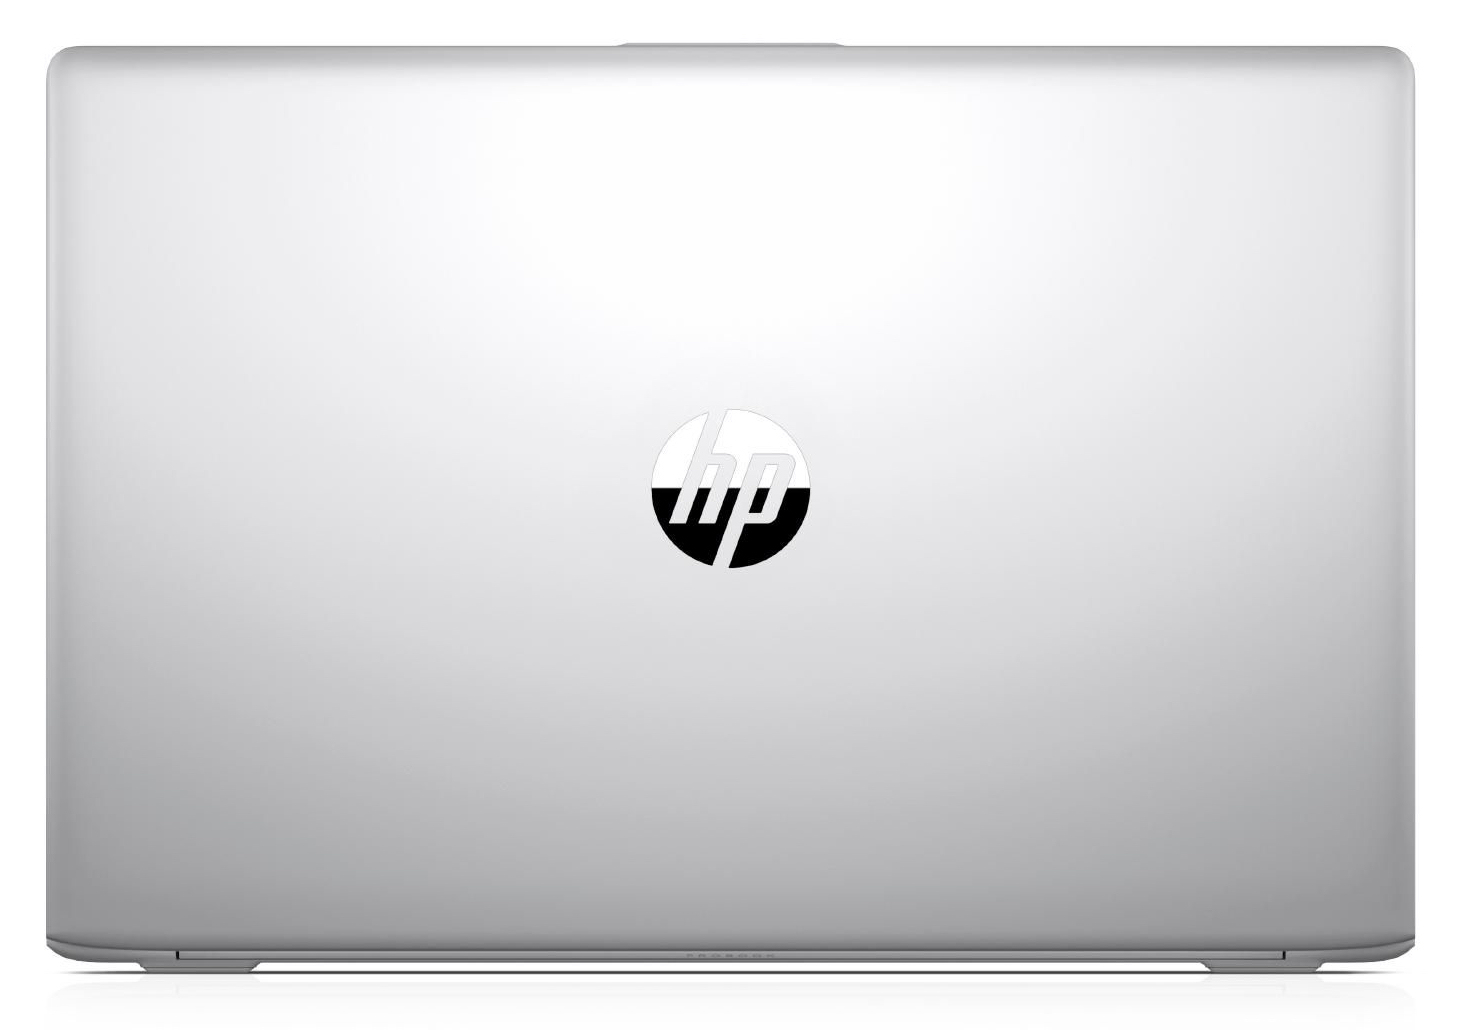
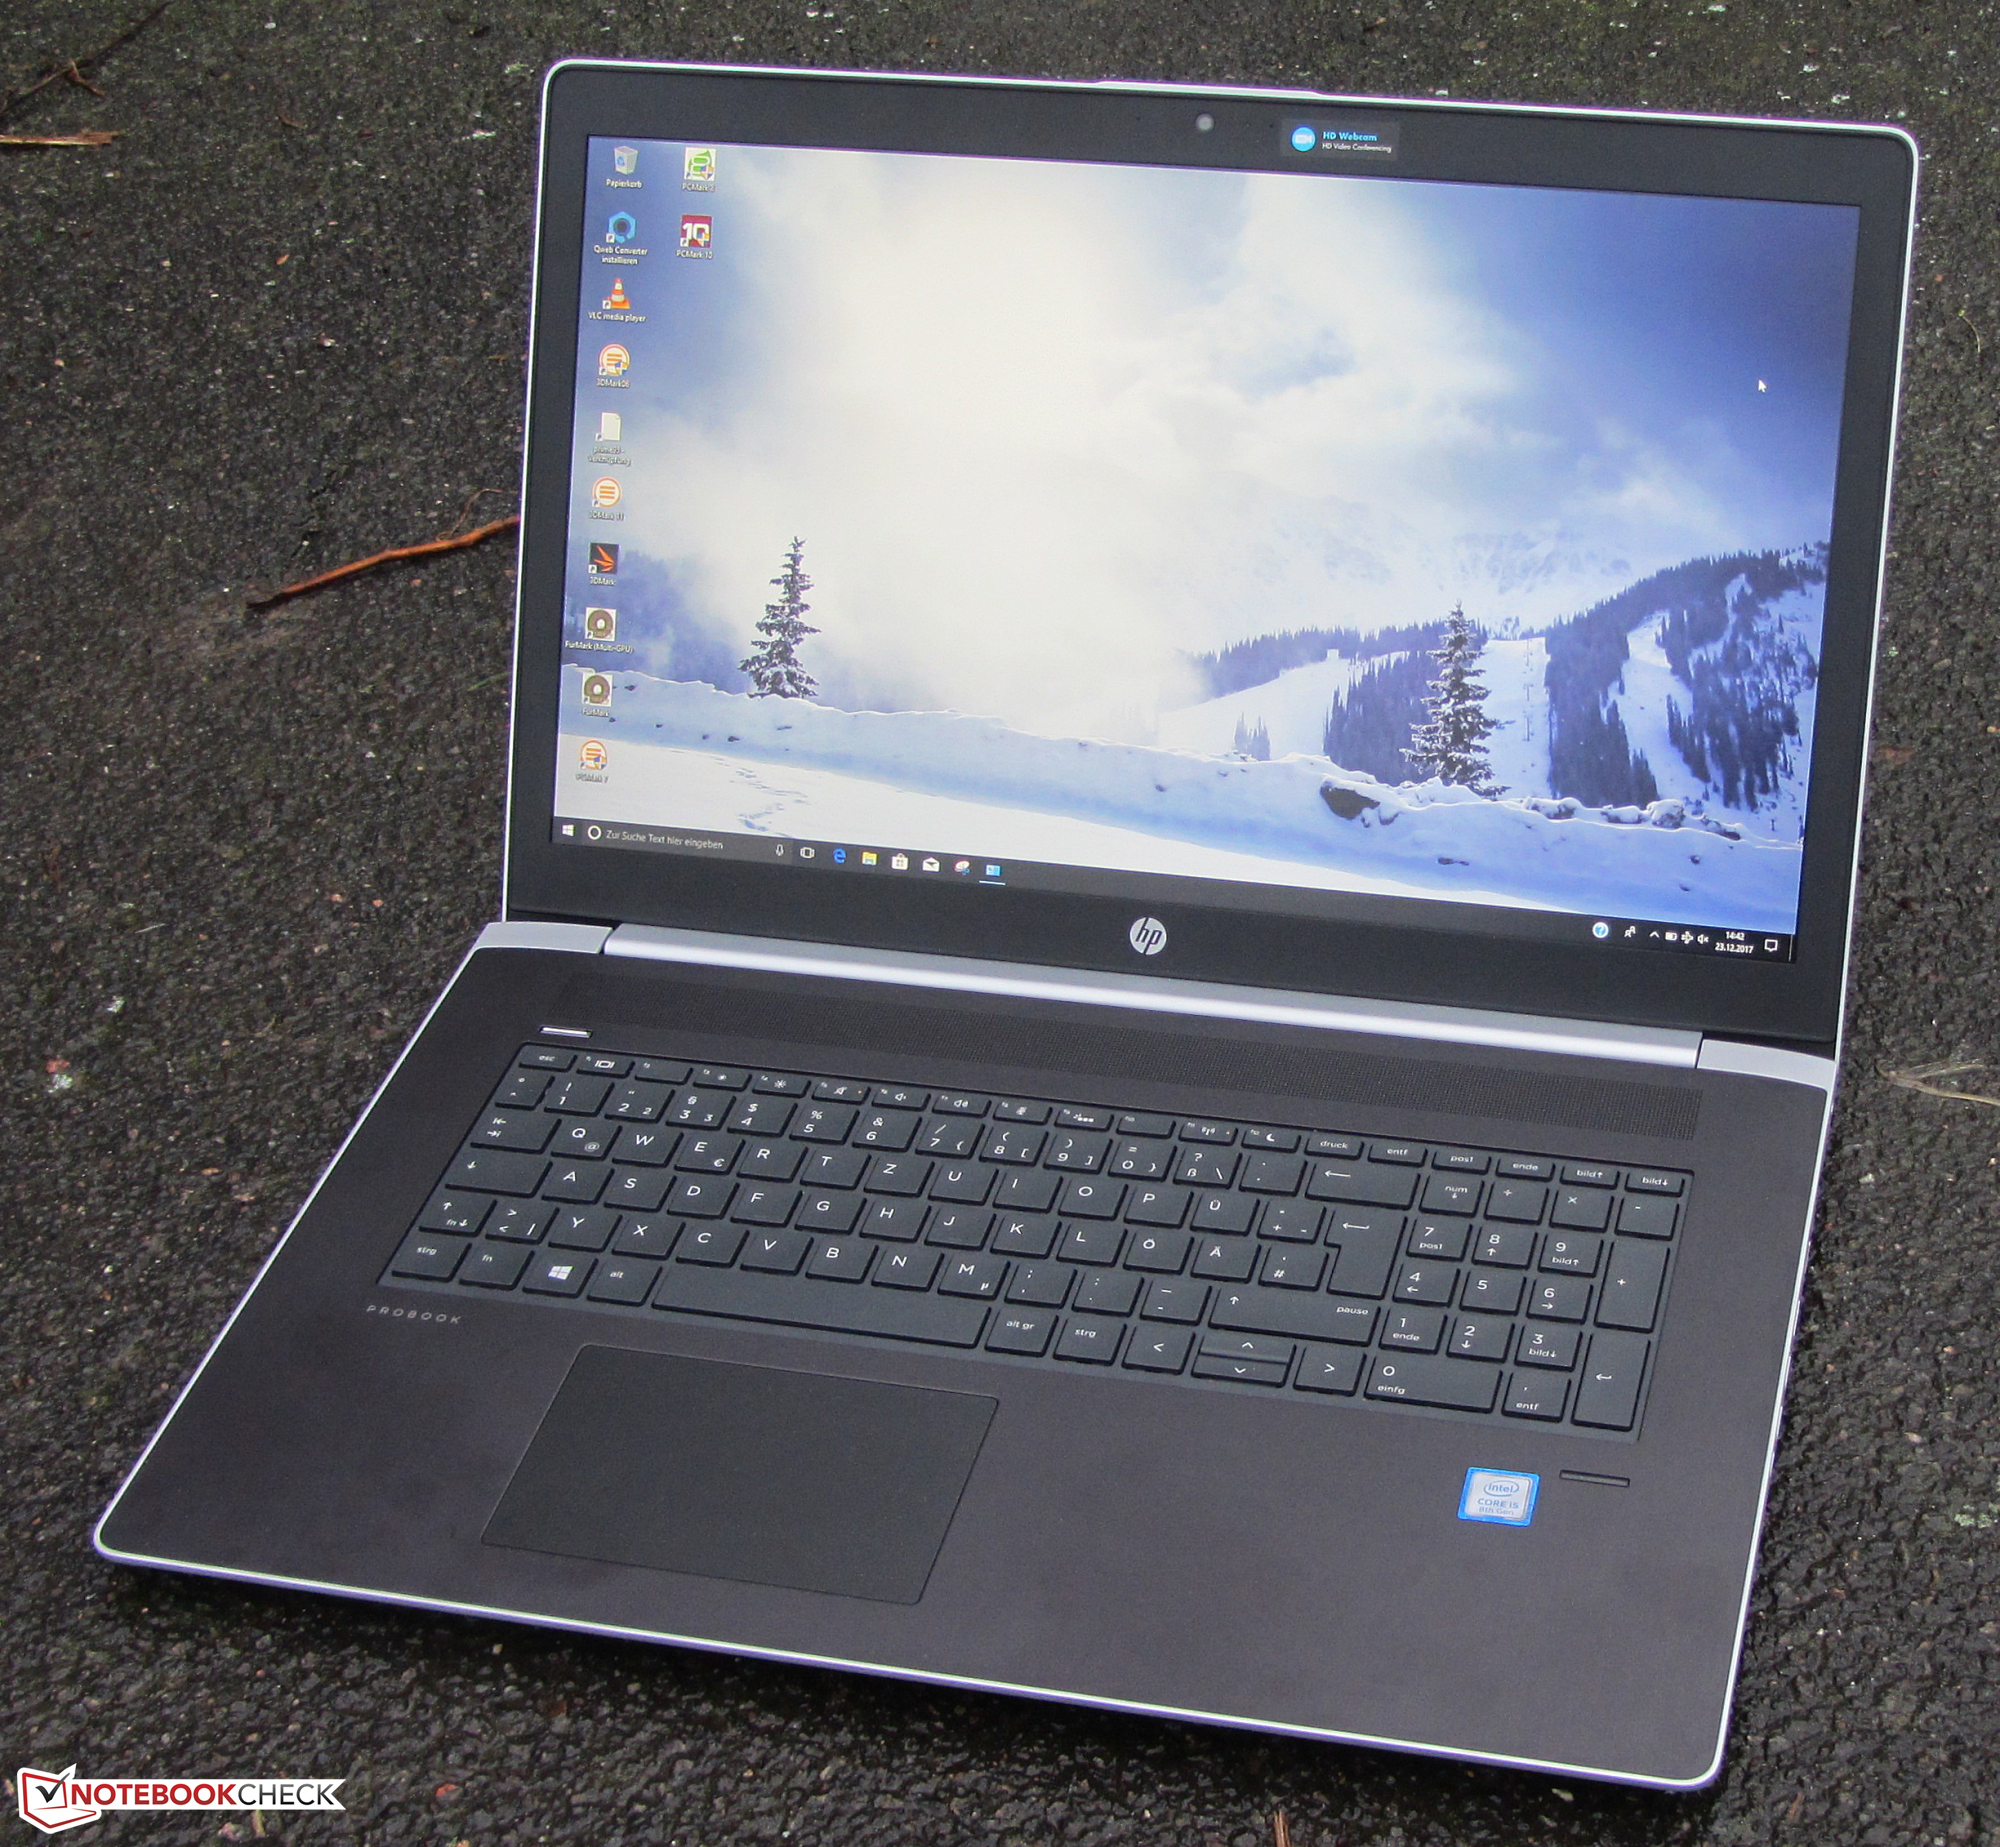
La Probook 470 G5 è la sesta generazione di portatili business HP da 17.3" (il patriarca era conosciuto come Probook 470 G0). Come ci aspettavamo, alcune delle modifiche effettuate da Hewlett Packard - come l'eliminazione del drive ottico o la rimozione di tasti dedicati per abilitare/disabilitare i moduli di comunicazione wireless o le casse - faranno arrabbiare qualche cliente.
Il Probook 470 G5 è un buon tuttofare da 17.3" ma migliorabile ancora.
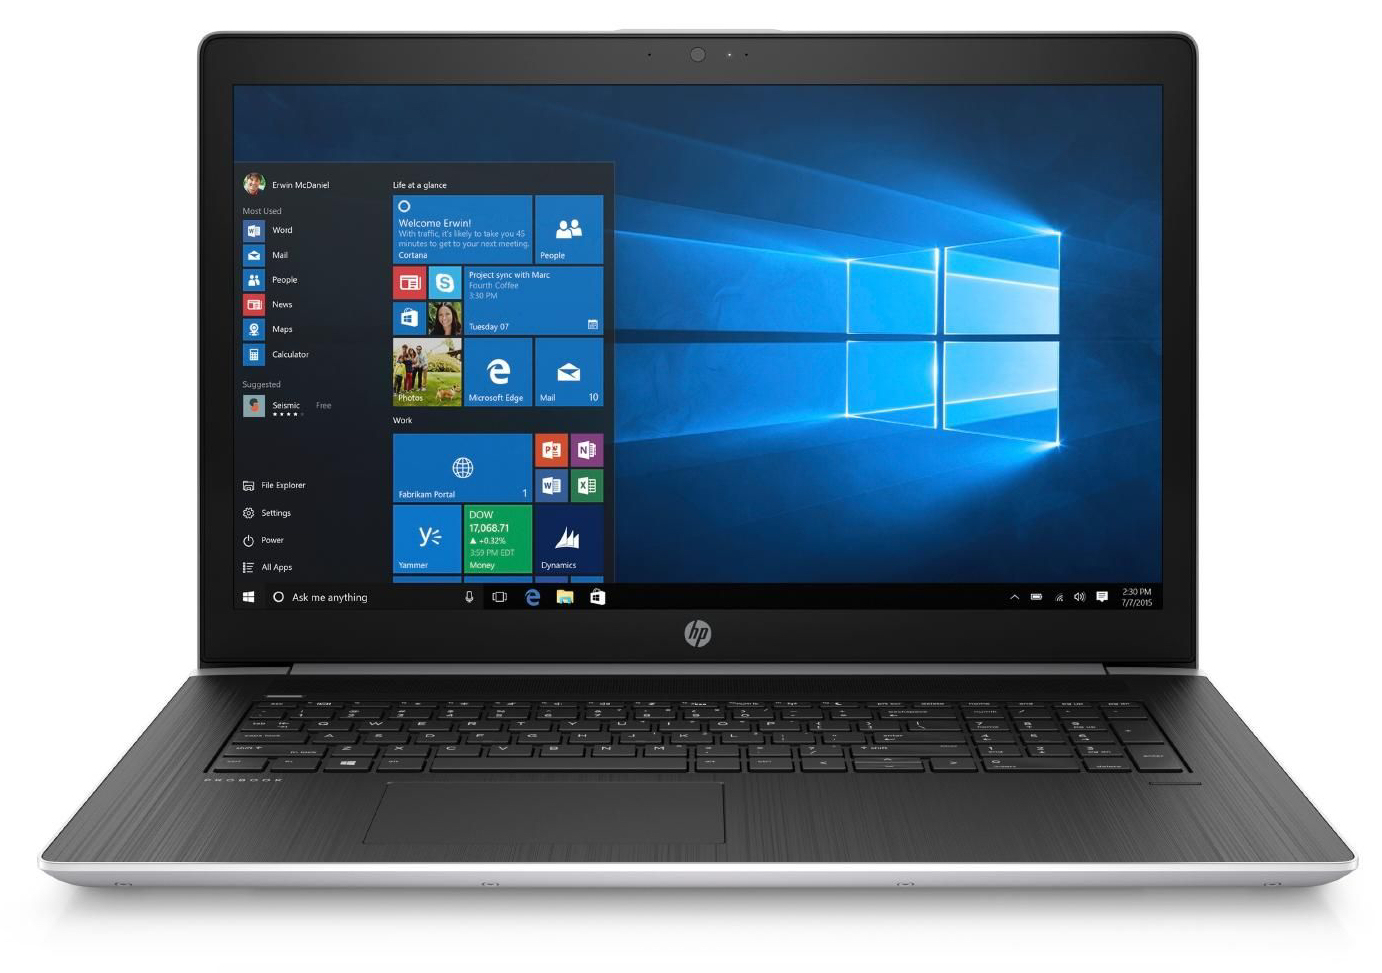
Il portatile è stato progettato sia per il business che per l'uso personale. Grazie al processore ULV quad-core sono sempre disponibili prestazioni elevate, ed il dispositivo riesce a gestire anche un modesto gaming grazie alla sua scheda grafica dedicata GeForce 930MX. Tuttavia, avremmo sperato in una GPU più veloce. Almeno il Probook resta molto fresco e silenzioso indipendentemente dal carico di lavoro.
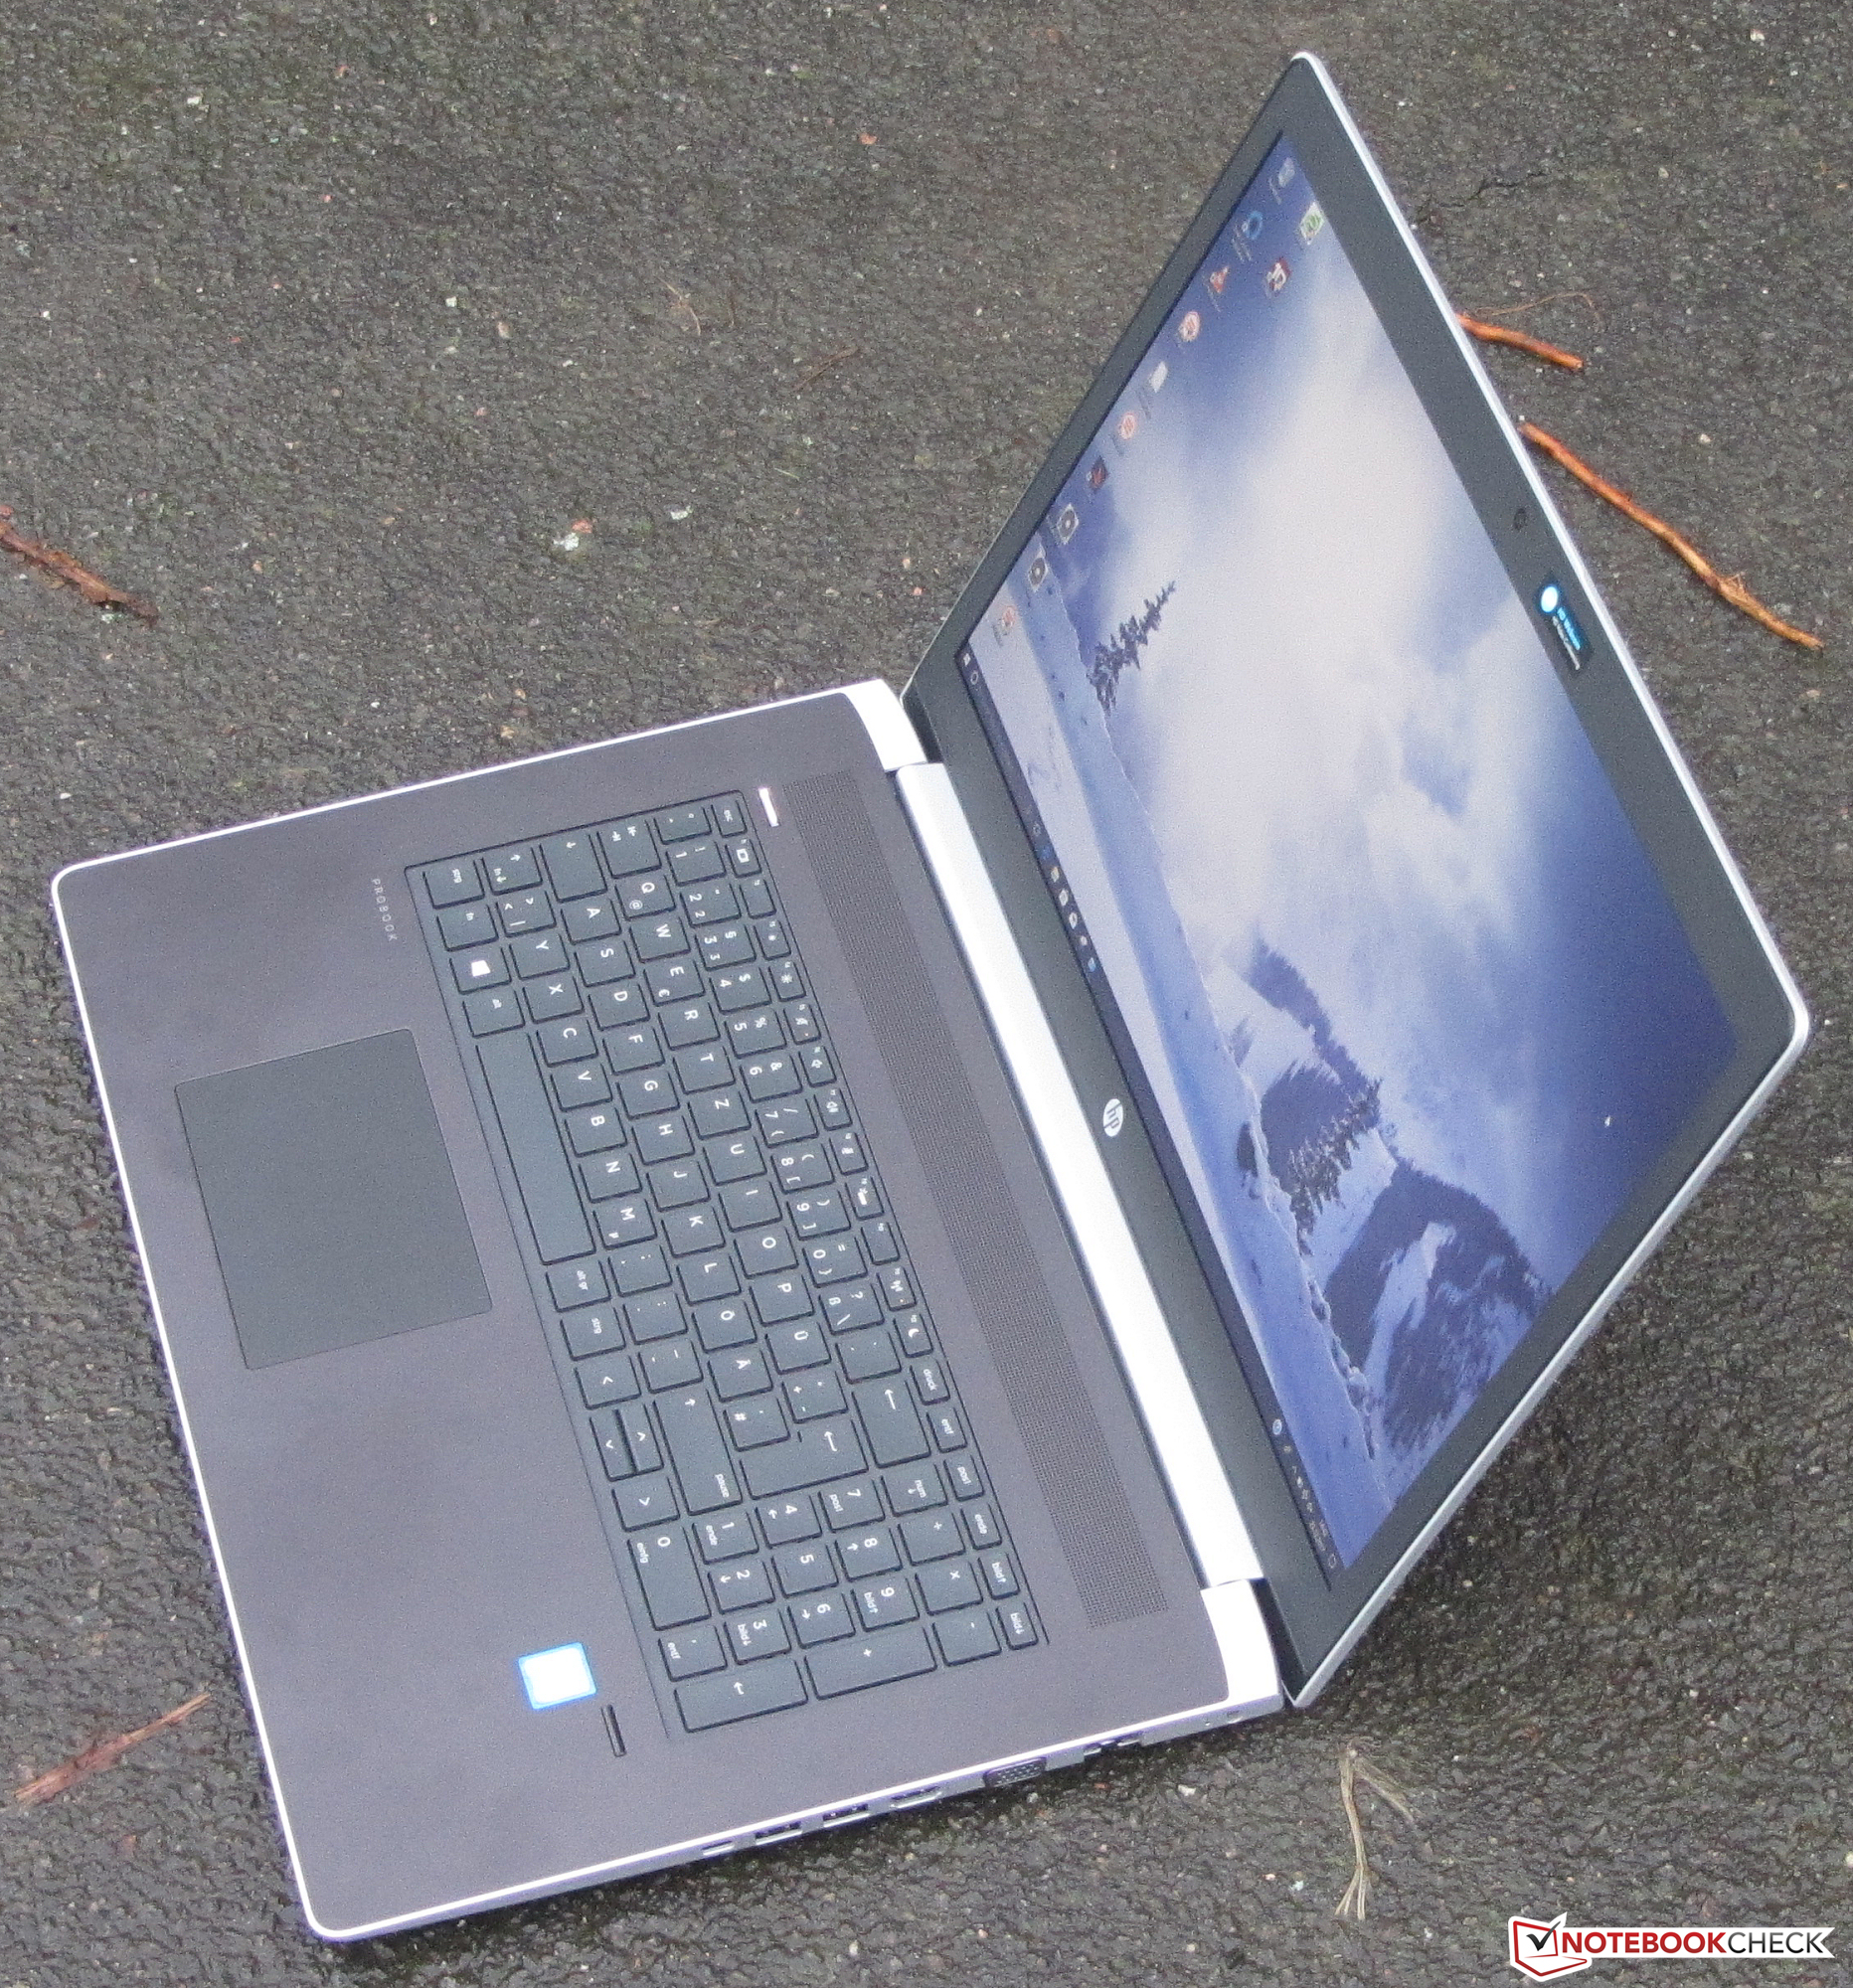
Le prestazioni di sistema sono state adeguate grazie al veloce SSD NVMe, e la sostituzione dell'SSD con un modello più grande è un'operazione molto semplice grazie alle due cover di manutenzione sul lato inferiore. Il display IPS FHD offre ottimi angoli di visuale e una luminosità elevata, tuttavia il contrasto è basso.
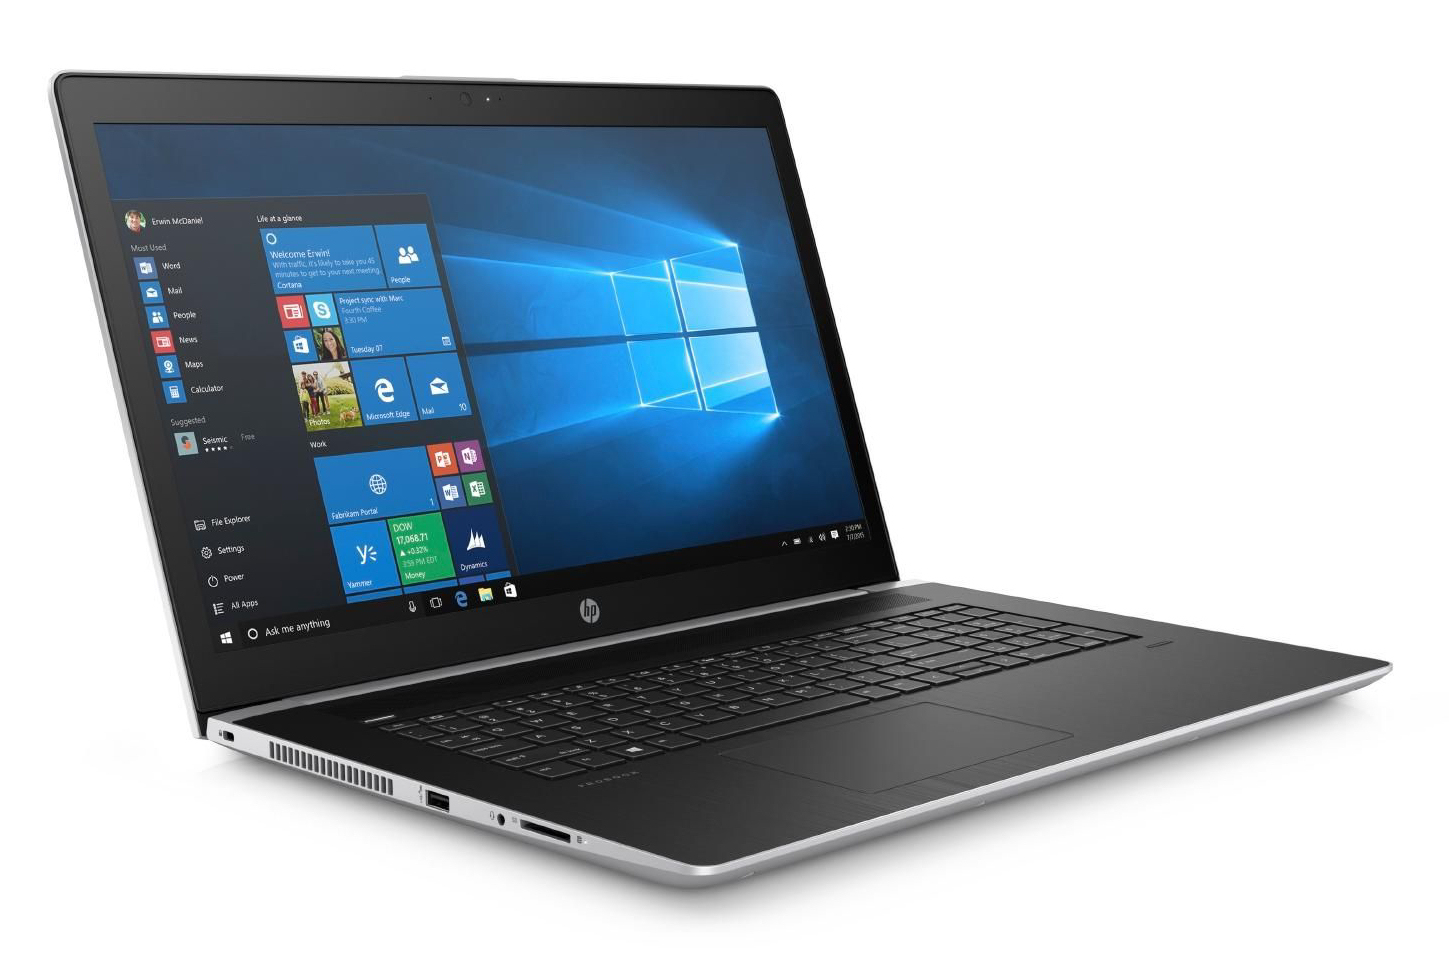
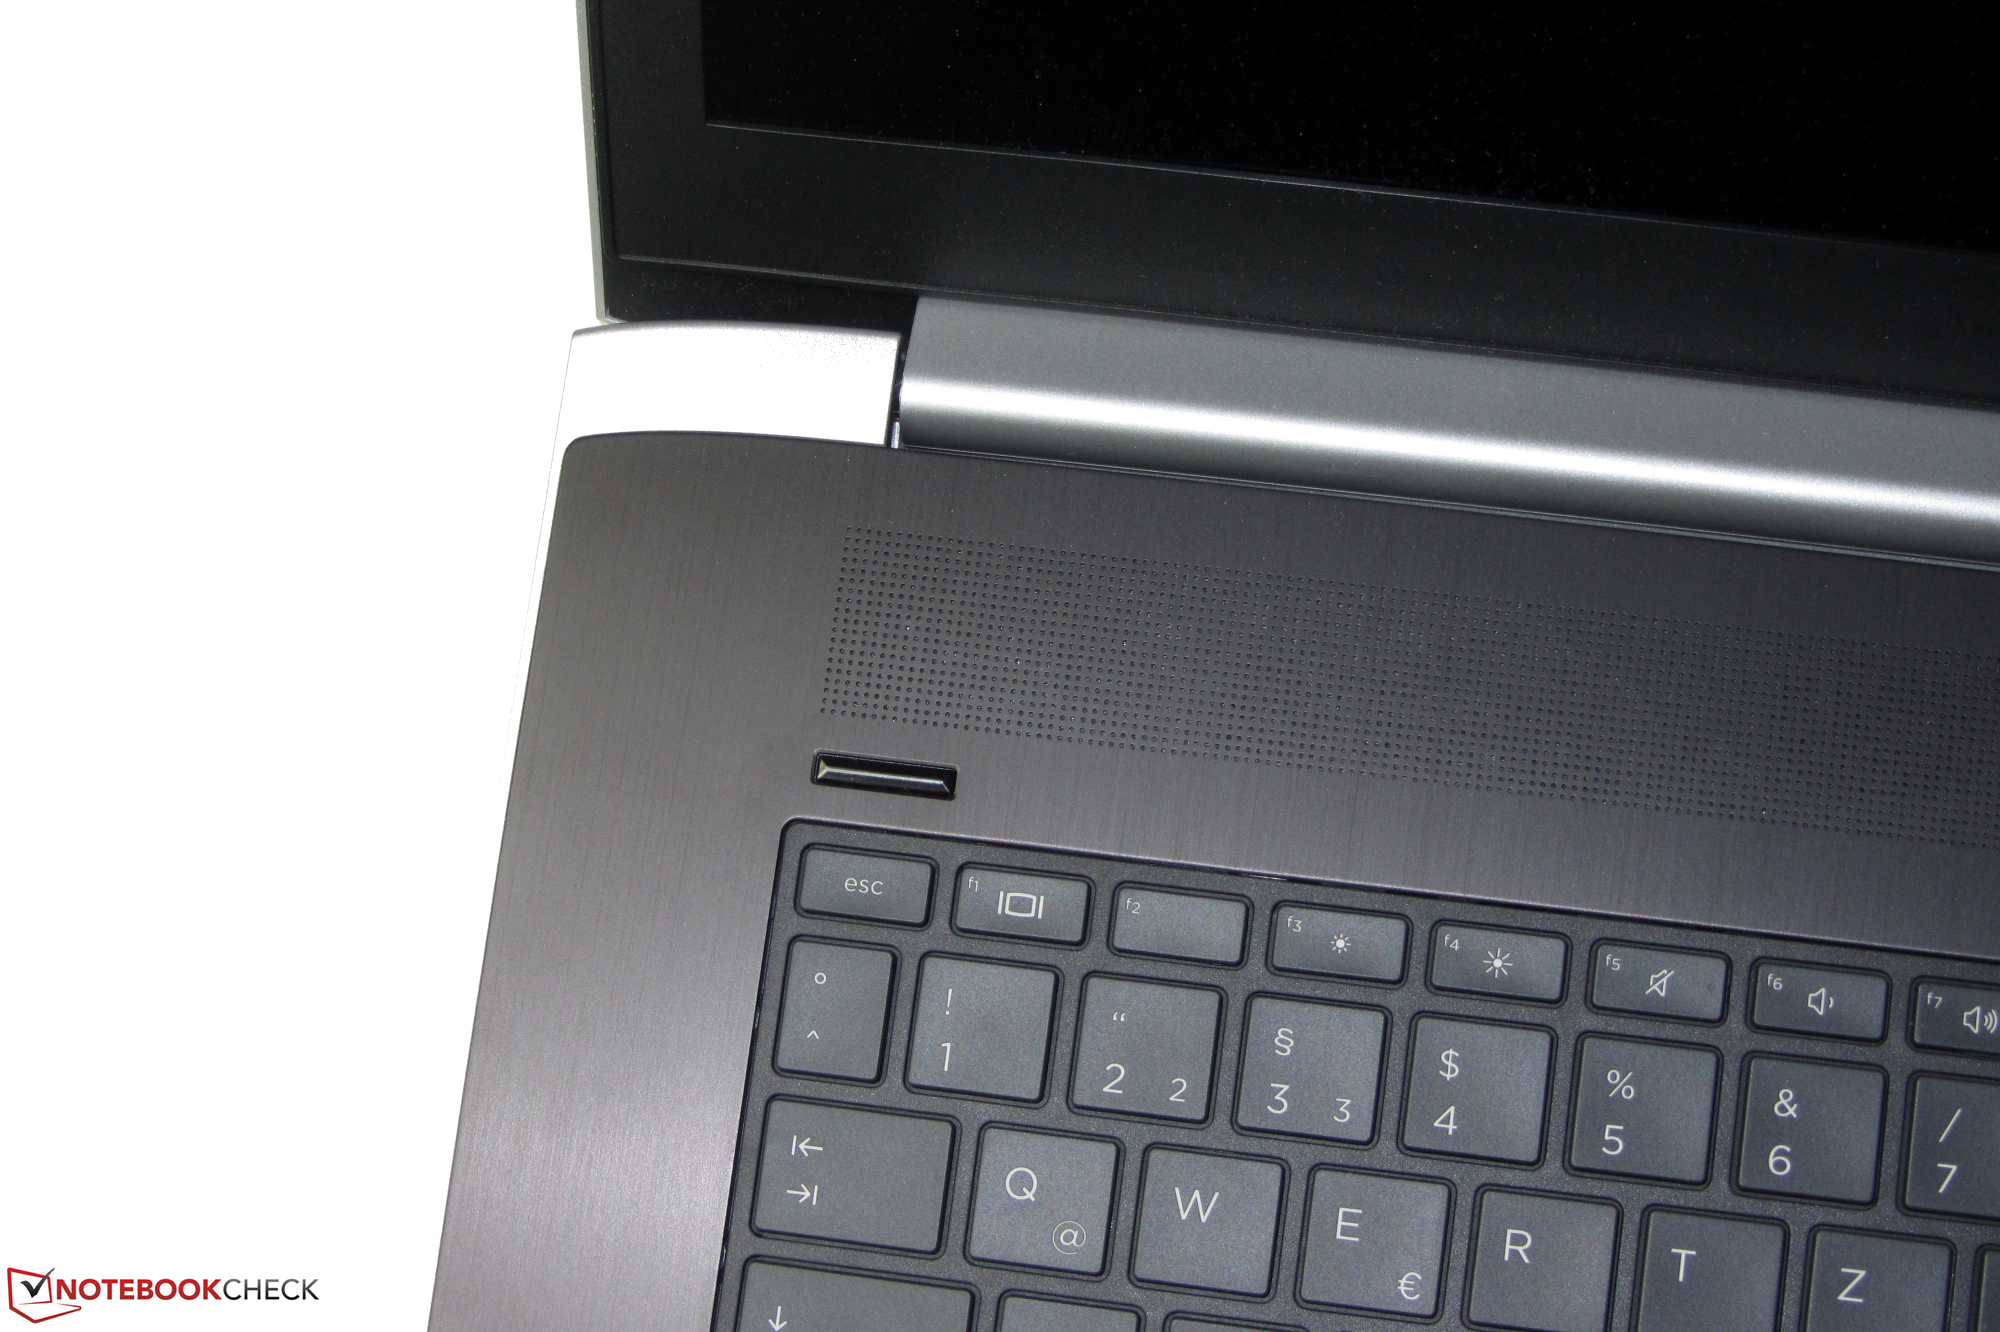
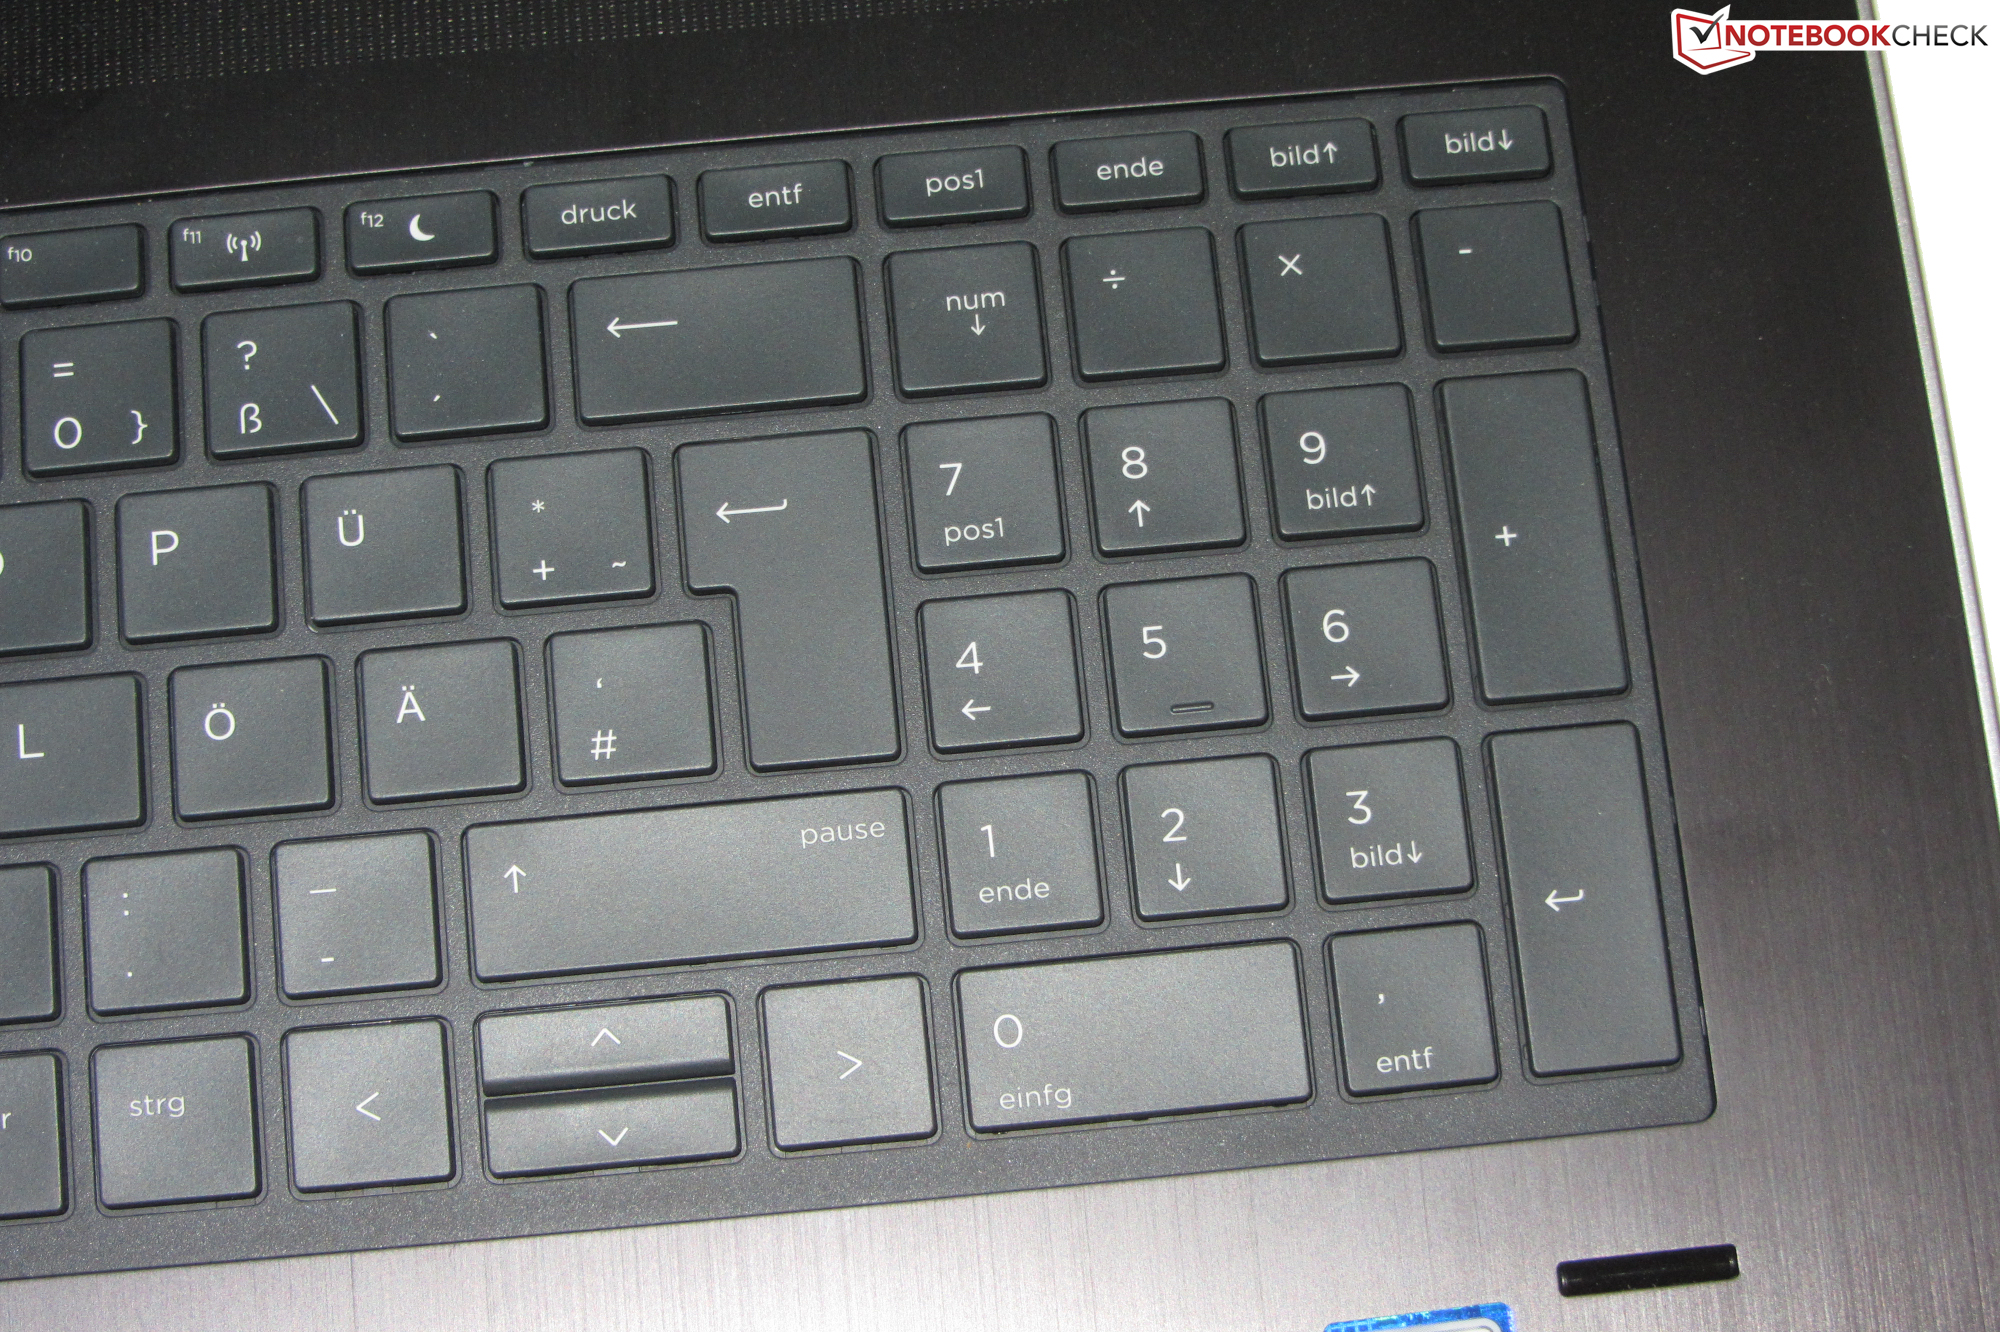
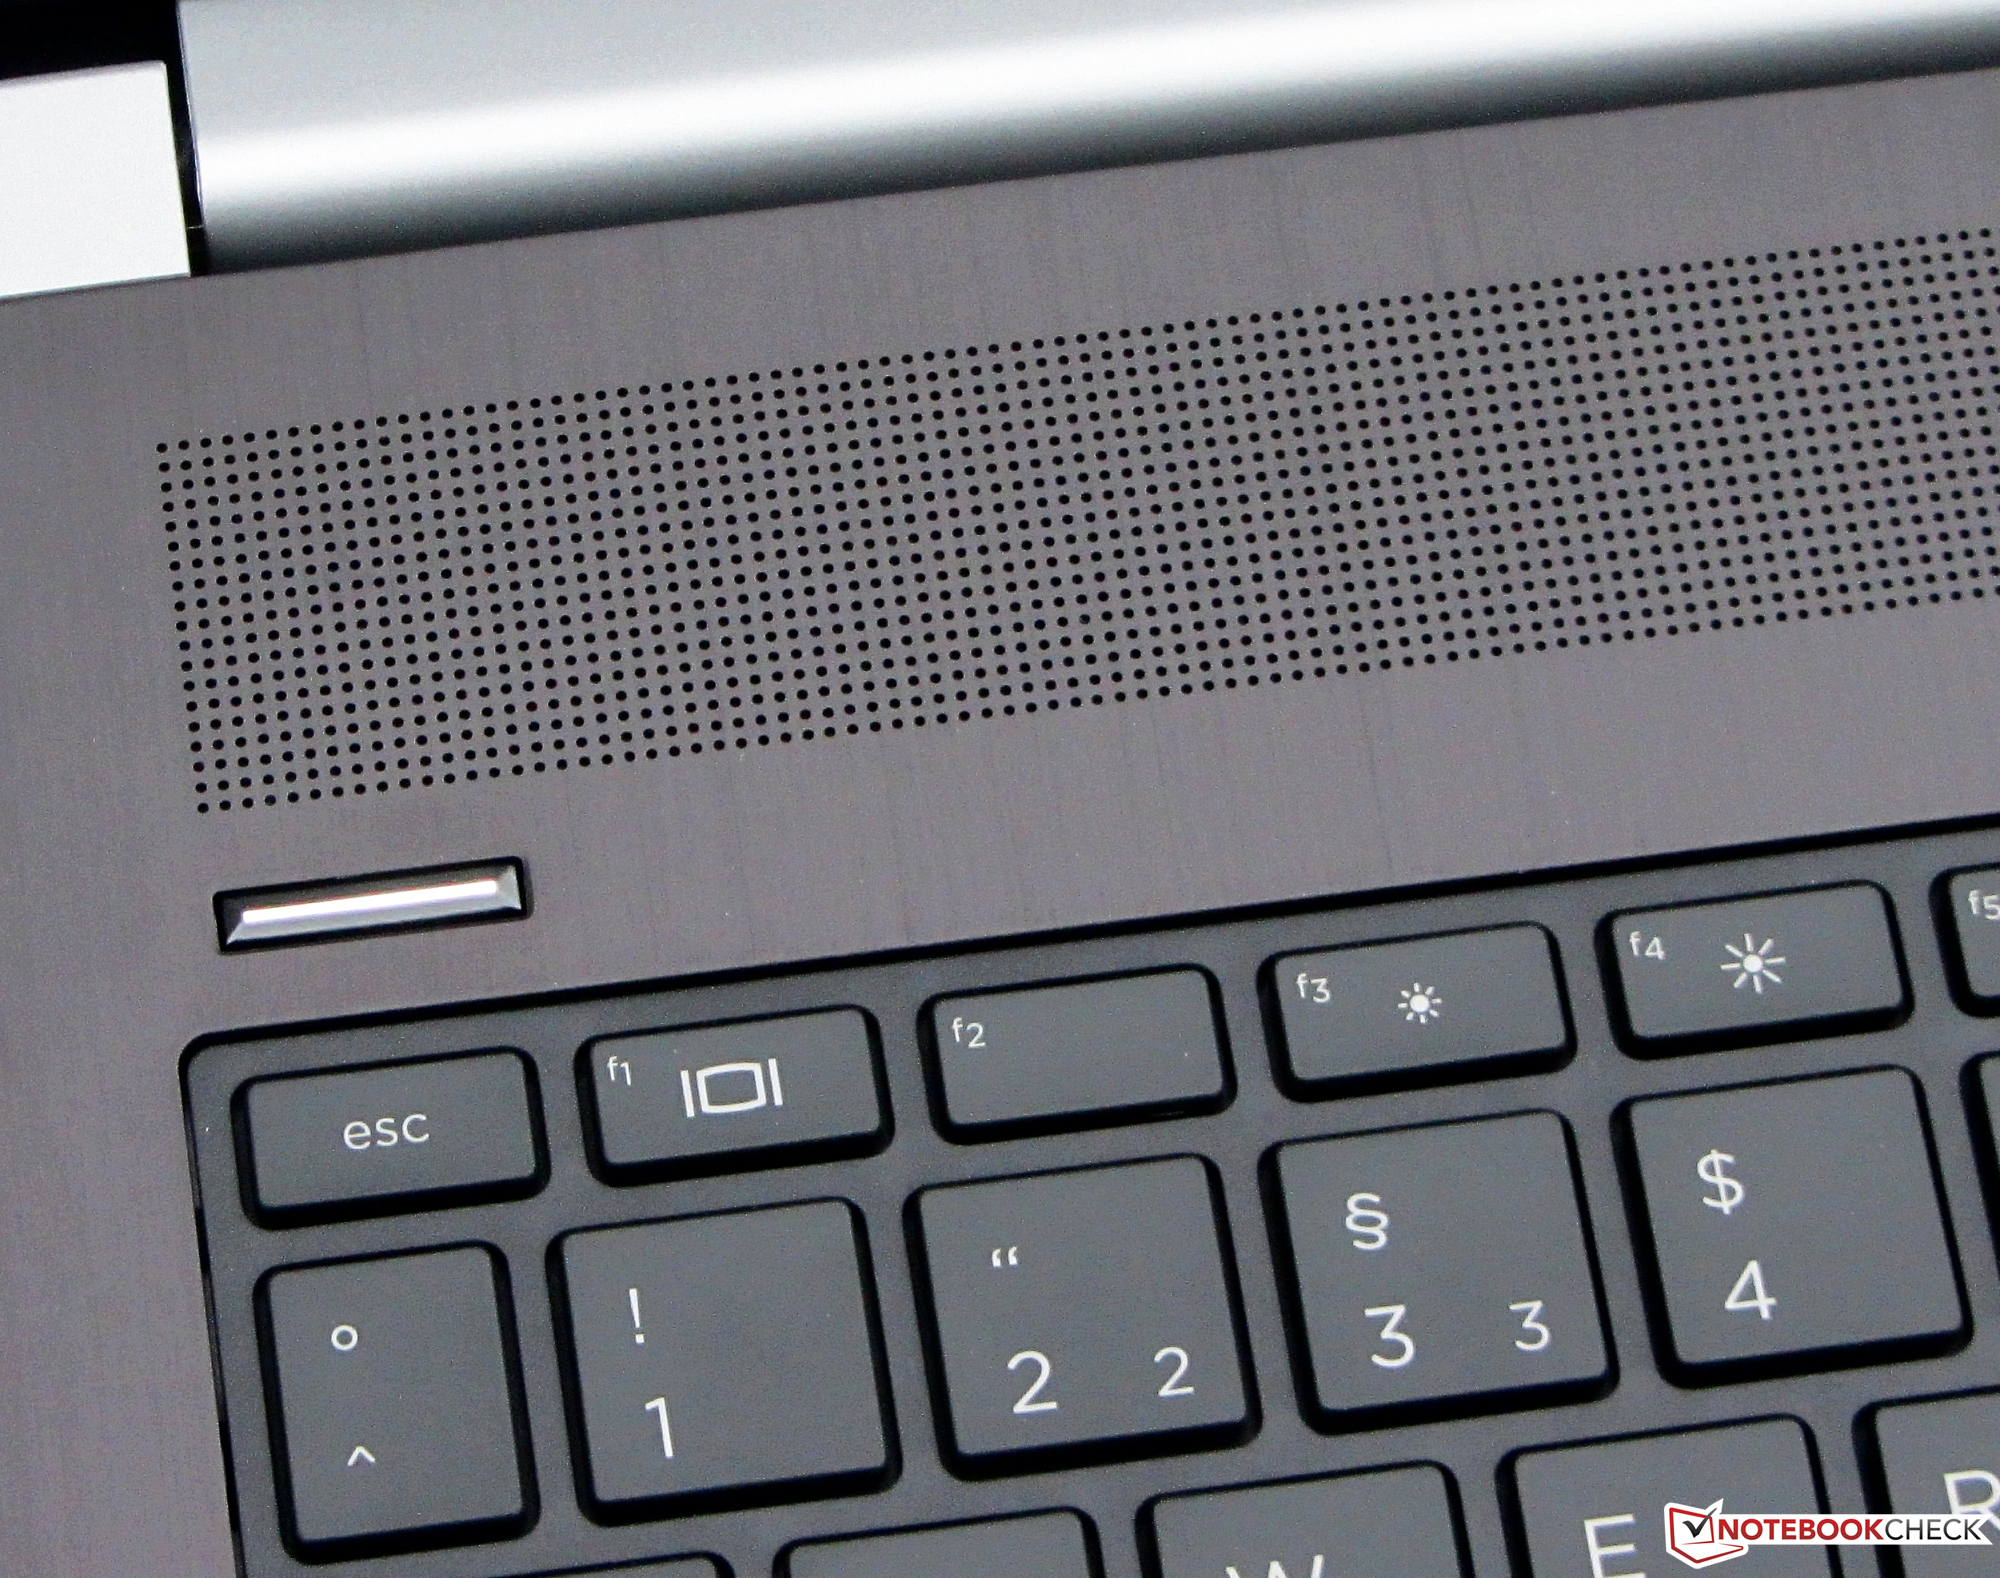
L'autonomia della batteria è eccellente, e il Probook 470 G5 può essere considerato molto "mobile" da questo punto di vista. Proprio come i suoi predecessori, l'ultimo Probook ha una eccellente tastiera con una retroilluminazione a due livelli. La garanzia è limitata ad un solo anno di default invece dei due anni che ci saremmo aspettati da un dispositivo premium come questo. Avremmo inoltre apprezzato una Thunderbolt 3 al posto di una porta USB 3.1 Gen 1. Sarebbe stato più versatile e molto più adatto a proporsi come moderno portatile business.
Nota: si tratta di una recensione breve, con alcune sezioni non tradotte, per la versione integrale in inglese guardate qui.
HP ProBook 470 G5
- 01/01/2018 v6 (old)
Sascha Mölck
Price comparison
