Recensione breve del Portatile HP Omen 15t-ce000 (7700HQ, GTX 1060 Max-Q, UHD)
| SD Card Reader | |
| average JPG Copy Test (av. of 3 runs) | |
| Dell XPS 15 9560 (i7-7700HQ, UHD) | |
| Gigabyte Aero 15 | |
| HP Omen 15t-ce000 | |
| Dell Inspiron 15 7000 7577 | |
| Acer Aspire VN7-593G-73HP V15 Nitro BE | |
| maximum AS SSD Seq Read Test (1GB) | |
| Dell XPS 15 9560 (i7-7700HQ, UHD) | |
| Gigabyte Aero 15 | |
| HP Omen 15t-ce000 | |
| Dell Inspiron 15 7000 7577 | |
| Acer Aspire VN7-593G-73HP V15 Nitro BE | |
| |||||||||||||||||||||||||
Distribuzione della luminosità: 95 %
Al centro con la batteria: 358.5 cd/m²
Contrasto: 919:1 (Nero: 0.39 cd/m²)
ΔE ColorChecker Calman: 4.6 | ∀{0.5-29.43 Ø4.72}
ΔE Greyscale Calman: 5.2 | ∀{0.09-98 Ø4.97}
91.8% sRGB (Argyll 1.6.3 3D)
66.9% AdobeRGB 1998 (Argyll 1.6.3 3D)
66.9% AdobeRGB 1998 (Argyll 3D)
91.8% sRGB (Argyll 3D)
66.1% Display P3 (Argyll 3D)
Gamma: 2.28
CCT: 6410 K
| HP Omen 15t-ce000 AU Optronics AUO23EB, IPS, 15.6", 3840x2160 | Lenovo Legion Y520-15IKBN 80WK0042GE LG Philips LP156WF6-SPK3, IPS, 15.6", 1920x1080 | Dell Inspiron 15 7000 7577 ID: LG Philips LGD053F, Name: 156WF6, Dell P/N: 4XK13, IPS, 15.6", 1920x1080 | Gigabyte Aero 15 N156HCA-EA1 (CMN15D7), IPS, 15.6", 1920x1080 | Acer Aspire VN7-593G-73HP V15 Nitro BE LG Display LP156WF6-SPP1, AH-IPS, Normally Black, Transmissive, 15.6", 1920x1080 | HP Omen 15-ce002ng AUO42ED, IPS, 15.6", 1920x1080 | Aorus X5 v7 AU Optronics B156ZAN02.3 (AUO23EB), IPS, 15.6", 3840x2160 | |
|---|---|---|---|---|---|---|---|
| Display | -39% | -42% | -0% | -5% | -1% | -1% | |
| Display P3 Coverage (%) | 66.1 | 39.01 -41% | 37.07 -44% | 65.2 -1% | 65.8 0% | 65.8 0% | 65.3 -1% |
| sRGB Coverage (%) | 91.8 | 58.4 -36% | 55.6 -39% | 92.5 1% | 85.1 -7% | 90.9 -1% | 91.9 0% |
| AdobeRGB 1998 Coverage (%) | 66.9 | 40.34 -40% | 38.32 -43% | 66.5 -1% | 62.2 -7% | 66.5 -1% | 66.3 -1% |
| Response Times | -11% | -3% | -22% | -23% | -21% | -12% | |
| Response Time Grey 50% / Grey 80% * (ms) | 37.6 ? | 39 ? -4% | 35.6 ? 5% | 42.8 ? -14% | 41 ? -9% | 43.2 ? -15% | 44 ? -17% |
| Response Time Black / White * (ms) | 24.8 ? | 29 ? -17% | 27.6 ? -11% | 32 ? -29% | 34 ? -37% | 31.2 ? -26% | 26.4 ? -6% |
| PWM Frequency (Hz) | 21000 ? | 26000 ? | |||||
| Screen | -22% | -27% | -6% | -3% | 9% | 0% | |
| Brightness middle (cd/m²) | 358.5 | 283 -21% | 235.4 -34% | 320 -11% | 322 -10% | 304 -15% | 307 -14% |
| Brightness (cd/m²) | 350 | 281 -20% | 223 -36% | 316 -10% | 297 -15% | 289 -17% | 297 -15% |
| Brightness Distribution (%) | 95 | 91 -4% | 91 -4% | 90 -5% | 86 -9% | 86 -9% | 92 -3% |
| Black Level * (cd/m²) | 0.39 | 0.39 -0% | 0.28 28% | 0.36 8% | 0.31 21% | 0.26 33% | 0.3 23% |
| Contrast (:1) | 919 | 726 -21% | 841 -8% | 889 -3% | 1039 13% | 1169 27% | 1023 11% |
| Colorchecker dE 2000 * | 4.6 | 6.1 -33% | 5.6 -22% | 4.62 -0% | 4.73 -3% | 3.46 25% | 4.72 -3% |
| Colorchecker dE 2000 max. * | 8.5 | 11.08 -30% | 20.3 -139% | 9.75 -15% | 12.37 -46% | 7.72 9% | 8.07 5% |
| Greyscale dE 2000 * | 5.2 | 5.69 -9% | 3.6 31% | 6 -15% | 2.99 42% | 2.46 53% | 4.79 8% |
| Gamma | 2.28 96% | 2.44 90% | 2.23 99% | 2.46 89% | 2.32 95% | 2.38 92% | 2.42 91% |
| CCT | 6410 101% | 6702 97% | 7214 90% | 6761 96% | 6905 94% | 6915 94% | 7690 85% |
| Color Space (Percent of AdobeRGB 1998) (%) | 66.9 | 37 -45% | 35.2 -47% | 60 -10% | 56 -16% | 59 -12% | 60 -10% |
| Color Space (Percent of sRGB) (%) | 91.8 | 58 -37% | 55.4 -40% | 92 0% | 85 -7% | 91 -1% | 92 0% |
| Media totale (Programma / Settaggio) | -24% /
-24% | -24% /
-27% | -9% /
-7% | -10% /
-6% | -4% /
3% | -4% /
-2% |
* ... Meglio usare valori piccoli
Tempi di risposta del Display
| ↔ Tempi di risposta dal Nero al Bianco | ||
|---|---|---|
| 24.8 ms ... aumenta ↗ e diminuisce ↘ combinato | ↗ 12.4 ms Incremento | 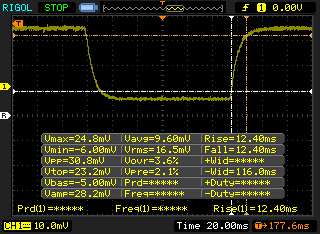 |
| ↘ 12.4 ms Calo | ||
| Lo schermo mostra buoni tempi di risposta durante i nostri tests, ma potrebbe essere troppo lento per i gamers competitivi. In confronto, tutti i dispositivi di test variano da 0.1 (minimo) a 240 (massimo) ms. » 58 % di tutti i dispositivi è migliore. Questo significa che i tempi di risposta rilevati sono peggiori rispetto alla media di tutti i dispositivi testati (19.9 ms). | ||
| ↔ Tempo di risposta dal 50% Grigio all'80% Grigio | ||
| 37.6 ms ... aumenta ↗ e diminuisce ↘ combinato | ↗ 19.6 ms Incremento | 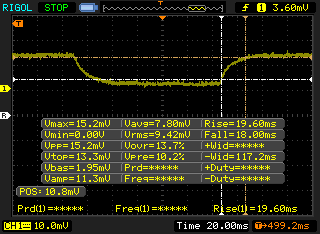 |
| ↘ 18 ms Calo | ||
| Lo schermo mostra tempi di risposta lenti nei nostri tests e sarà insoddisfacente per i gamers. In confronto, tutti i dispositivi di test variano da 0.165 (minimo) a 636 (massimo) ms. » 54 % di tutti i dispositivi è migliore. Questo significa che i tempi di risposta rilevati sono peggiori rispetto alla media di tutti i dispositivi testati (31.1 ms). | ||
Sfarfallio dello schermo / PWM (Pulse-Width Modulation)
| flickering dello schermo / PWM non rilevato | 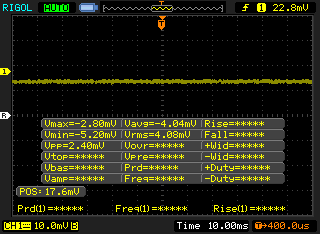 | ||
In confronto: 52 % di tutti i dispositivi testati non utilizza PWM per ridurre la luminosita' del display. Se è rilevato PWM, una media di 7784 (minimo: 5 - massimo: 343500) Hz è stata rilevata. | |||
| Cinebench R10 | |
| Rendering Multiple CPUs 32Bit | |
| HP Omen 15-ce002ng | |
| HP Omen 15t-ce000 | |
| Lenovo Legion Y520-15IKBN 80WK0042GE | |
| Dell Inspiron 15 7000 7577 | |
| HP Spectre x360 15t-bl100 | |
| Rendering Single 32Bit | |
| HP Spectre x360 15t-bl100 | |
| HP Omen 15-ce002ng | |
| HP Omen 15t-ce000 | |
| Lenovo Legion Y520-15IKBN 80WK0042GE | |
| Dell Inspiron 15 7000 7577 | |
| wPrime 2.10 - 1024m | |
| HP Spectre x360 15t-bl100 | |
| Dell Inspiron 15 7000 7577 | |
| HP Omen 15t-ce000 | |
* ... Meglio usare valori piccoli
| PCMark 8 | |
| Home Score Accelerated v2 | |
| HP Omen 15-ce002ng | |
| Aorus X5 v7 | |
| HP Omen 15t-ce000 | |
| Gigabyte Aero 15 | |
| Dell Inspiron 15 7000 7577 | |
| Lenovo Legion Y520-15IKBN 80WK0042GE | |
| Work Score Accelerated v2 | |
| HP Omen 15-ce002ng | |
| Gigabyte Aero 15 | |
| Dell Inspiron 15 7000 7577 | |
| Lenovo Legion Y520-15IKBN 80WK0042GE | |
| HP Omen 15t-ce000 | |
| Creative Score Accelerated v2 | |
| HP Omen 15t-ce000 | |
| Dell Inspiron 15 7000 7577 | |
| Lenovo Legion Y520-15IKBN 80WK0042GE | |
| PCMark 8 Home Score Accelerated v2 | 4325 punti | |
| PCMark 8 Creative Score Accelerated v2 | 6901 punti | |
| PCMark 8 Work Score Accelerated v2 | 2484 punti | |
| PCMark 10 Score | 3969 punti | |
Aiuto | ||
| HP Omen 15t-ce000 Samsung PM961 NVMe MZVLW128HEGR | Lenovo Legion Y520-15IKBN 80WK0042GE Samsung PM961 NVMe MZVLW128HEGR | Dell Inspiron 15 7000 7577 Samsung PM961 MZVLW256HEHP | Aorus X5 v7 Toshiba NVMe THNSN5256GPU7 | HP Spectre x360 15t-bl100 Samsung PM961 NVMe MZVLW512HMJP | |
|---|---|---|---|---|---|
| AS SSD | -9% | 32% | -436% | 133% | |
| Copy Game MB/s (MB/s) | 736 | 197.3 -73% | 382.5 -48% | 988 34% | 1134 54% |
| Copy Program MB/s (MB/s) | 195.4 | 127.3 -35% | 274.8 41% | 424.4 117% | 534 173% |
| Copy ISO MB/s (MB/s) | 1087 | 497.6 -54% | 814 -25% | 1482 36% | 1936 78% |
| Score Total (Points) | 1515 | 1434 -5% | 2405 59% | 490 -68% | 3781 150% |
| Score Write (Points) | 361 | 368 2% | 594 65% | 24 -93% | 1556 331% |
| Score Read (Points) | 789 | 746 -5% | 1241 57% | 361 -54% | 1493 89% |
| Access Time Write * (ms) | 0.034 | 0.032 6% | 0.037 -9% | 1.987 -5744% | 0.026 24% |
| Access Time Read * (ms) | 0.071 | 0.07 1% | 0.058 18% | 0.067 6% | 0.04 44% |
| 4K-64 Write (MB/s) | 175.9 | 158.6 -10% | 375.8 114% | 2.12 -99% | 1262 617% |
| 4K-64 Read (MB/s) | 568 | 463.2 -18% | 929 64% | 112.5 -80% | 1206 112% |
| 4K Write (MB/s) | 111.2 | 127.9 15% | 100.2 -10% | 2.03 -98% | 141.1 27% |
| 4K Read (MB/s) | 43.09 | 46.98 9% | 46.95 9% | 38.45 -11% | 51.9 20% |
| Seq Write (MB/s) | 743 | 814 10% | 1181 59% | 200.3 -73% | 1530 106% |
| Seq Read (MB/s) | 1774 | 2362 33% | 2652 49% | 2103 19% | 2342 32% |
* ... Meglio usare valori piccoli

| 3DMark | |
| 3840x2160 Fire Strike Ultra Graphics | |
| Dell Inspiron 15 7000 7577 | |
| HP Omen 15t-ce000 | |
| Lenovo Legion Y520-15IKBN 80WK0042GE | |
| Fire Strike Extreme Graphics | |
| Dell Inspiron 15 7000 7577 | |
| HP Omen 15t-ce000 | |
| Lenovo Legion Y520-15IKBN 80WK0042GE | |
| 1920x1080 Fire Strike Graphics | |
| Aorus X5 v7 | |
| Acer Aspire VN7-593G-73HP V15 Nitro BE | |
| Gigabyte Aero 15 | |
| HP Omen 15-ce002ng | |
| Dell Inspiron 15 7000 7577 | |
| HP Omen 15t-ce000 | |
| Lenovo Legion Y520-15IKBN 80WK0042GE | |
| 1280x720 Cloud Gate Standard Graphics | |
| Aorus X5 v7 | |
| Gigabyte Aero 15 | |
| Dell Inspiron 15 7000 7577 | |
| HP Omen 15-ce002ng | |
| Acer Aspire VN7-593G-73HP V15 Nitro BE | |
| Lenovo Legion Y520-15IKBN 80WK0042GE | |
| HP Omen 15t-ce000 | |
| 3DMark 11 Performance | 11761 punti | |
| 3DMark Cloud Gate Standard Score | 21508 punti | |
| 3DMark Fire Strike Score | 8725 punti | |
| 3DMark Fire Strike Extreme Score | 4487 punti | |
Aiuto | ||
| Rise of the Tomb Raider | |
| 3840x2160 High Preset AA:FX AF:4x (ordina per valore) | |
| HP Omen 15t-ce000 | |
| HP Omen 15-ce002ng | |
| Aorus X5 v7 | |
| 1920x1080 Very High Preset AA:FX AF:16x (ordina per valore) | |
| HP Omen 15t-ce000 | |
| Dell Inspiron 15 7000 7577 | |
| Acer Aspire VN7-593G-73HP V15 Nitro BE | |
| HP Omen 15-ce002ng | |
| Aorus X5 v7 | |
| HP Spectre x360 15t-bl100 | |
| 1920x1080 High Preset AA:FX AF:4x (ordina per valore) | |
| HP Omen 15t-ce000 | |
| Dell Inspiron 15 7000 7577 | |
| Acer Aspire VN7-593G-73HP V15 Nitro BE | |
| HP Omen 15-ce002ng | |
| Aorus X5 v7 | |
| HP Spectre x360 15t-bl100 | |
| The Witcher 3 | |
| 3840x2160 High Graphics & Postprocessing (Nvidia HairWorks Off) (ordina per valore) | |
| HP Omen 15t-ce000 | |
| HP Omen 15-ce002ng | |
| Aorus X5 v7 | |
| 1920x1080 Ultra Graphics & Postprocessing (HBAO+) (ordina per valore) | |
| HP Omen 15t-ce000 | |
| Lenovo Legion Y520-15IKBN 80WK0042GE | |
| Dell Inspiron 15 7000 7577 | |
| Gigabyte Aero 15 | |
| Acer Aspire VN7-593G-73HP V15 Nitro BE | |
| HP Omen 15-ce002ng | |
| Aorus X5 v7 | |
| HP Spectre x360 15t-bl100 | |
| 1920x1080 High Graphics & Postprocessing (Nvidia HairWorks Off) (ordina per valore) | |
| HP Omen 15t-ce000 | |
| Lenovo Legion Y520-15IKBN 80WK0042GE | |
| Dell Inspiron 15 7000 7577 | |
| Gigabyte Aero 15 | |
| Acer Aspire VN7-593G-73HP V15 Nitro BE | |
| HP Omen 15-ce002ng | |
| Aorus X5 v7 | |
| HP Spectre x360 15t-bl100 | |
| basso | medio | alto | ultra | 4K | |
|---|---|---|---|---|---|
| Dirt 3 (2011) | 140.1 | 126.3 | 112.2 | 64.5 | |
| Sleeping Dogs (2012) | 218.4 | 192.7 | 164.7 | 69.5 | |
| Hitman: Absolution (2012) | 105.8 | 101 | 88.7 | 70 | |
| Tomb Raider (2013) | 308.4 | 277.7 | 170.5 | 115.6 | |
| BioShock Infinite (2013) | 209 | 193.3 | 180.1 | 102.4 | |
| GRID 2 (2013) | 210.8 | 152.8 | 143.3 | 116.7 | |
| Company of Heroes 2 (2013) | 68.9 | 65.7 | 63.4 | 40 | |
| Thief (2014) | 117.2 | 112 | 107.6 | 69 | |
| Middle-earth: Shadow of Mordor (2014) | 170.2 | 139.9 | 96.7 | 76.9 | |
| The Witcher 3 (2015) | 172.3 | 133.8 | 68.5 | 35 | 23.7 |
| Rise of the Tomb Raider (2016) | 148.1 | 117.8 | 67.6 | 54.6 | 24 |
| Ashes of the Singularity (2016) | 75.8 | 62.2 | 53.2 | 20.8 | |
| Deus Ex Mankind Divided (2016) | 110.3 | 93 | 52 | 27.6 | 16.3 |
| Prey (2017) | 116 | 92.9 | 80.2 | 30.7 | |
| Ark Survival Evolved (2017) | 109 | 48 | 35.5 | 25.6 | 8.5 |
| Middle-earth: Shadow of War (2017) | 128 | 81 | 62 | 46 | 27 |
| ELEX (2017) | 108.1 | 83.5 | 69.6 | 57.2 | 17 |
Rumorosità
| Idle |
| 30.4 / 30.4 / 30.5 dB(A) |
| Sotto carico |
| 38.5 / 49 dB(A) |
 | ||
30 dB silenzioso 40 dB(A) udibile 50 dB(A) rumoroso |
||
min: | ||
| HP Omen 15t-ce000 GeForce GTX 1060 Max-Q, i7-7700HQ, Samsung PM961 NVMe MZVLW128HEGR | Lenovo Legion Y520-15IKBN 80WK0042GE GeForce GTX 1050 Ti Mobile, i5-7300HQ, Samsung PM961 NVMe MZVLW128HEGR | Dell Inspiron 15 7000 7577 GeForce GTX 1060 Max-Q, i5-7300HQ, Samsung PM961 MZVLW256HEHP | Gigabyte Aero 15 GeForce GTX 1060 Mobile, i7-7700HQ, Lite-On CX2-8B512-Q11 | Acer Aspire VN7-593G-73HP V15 Nitro BE GeForce GTX 1060 Mobile, i7-7700HQ, Seagate Mobile HDD 1TB ST1000LM035 | HP Omen 15-ce002ng GeForce GTX 1060 Max-Q, i7-7700HQ, Samsung PM961 MZVLW256HEHP | Aorus X5 v7 GeForce GTX 1070 Mobile, i7-7820HK, Toshiba NVMe THNSN5256GPU7 | |
|---|---|---|---|---|---|---|---|
| Noise | -1% | 7% | -7% | -5% | -8% | -18% | |
| off /ambiente * (dB) | 28.2 | 30.6 -9% | 28 1% | 31 -10% | 30.4 -8% | 30 -6% | 30 -6% |
| Idle Minimum * (dB) | 30.4 | 31.9 -5% | 28 8% | 32 -5% | 30.9 -2% | 30 1% | 35 -15% |
| Idle Average * (dB) | 30.4 | 31.9 -5% | 28 8% | 33 -9% | 30.9 -2% | 33 -9% | 36 -18% |
| Idle Maximum * (dB) | 30.5 | 31.9 -5% | 28 8% | 34 -11% | 31.5 -3% | 37 -21% | 40 -31% |
| Load Average * (dB) | 38.5 | 34.6 10% | 30.3 21% | 39 -1% | 40.7 -6% | 41 -6% | 43 -12% |
| Witcher 3 ultra * (dB) | 37.6 | 39.3 -5% | 39.5 -5% | 43 -14% | 45.5 -21% | 42 -12% | 49 -30% |
| Load Maximum * (dB) | 49 | 41.7 15% | 46.5 5% | 50 -2% | 43.9 10% | 50 -2% | 55 -12% |
* ... Meglio usare valori piccoli
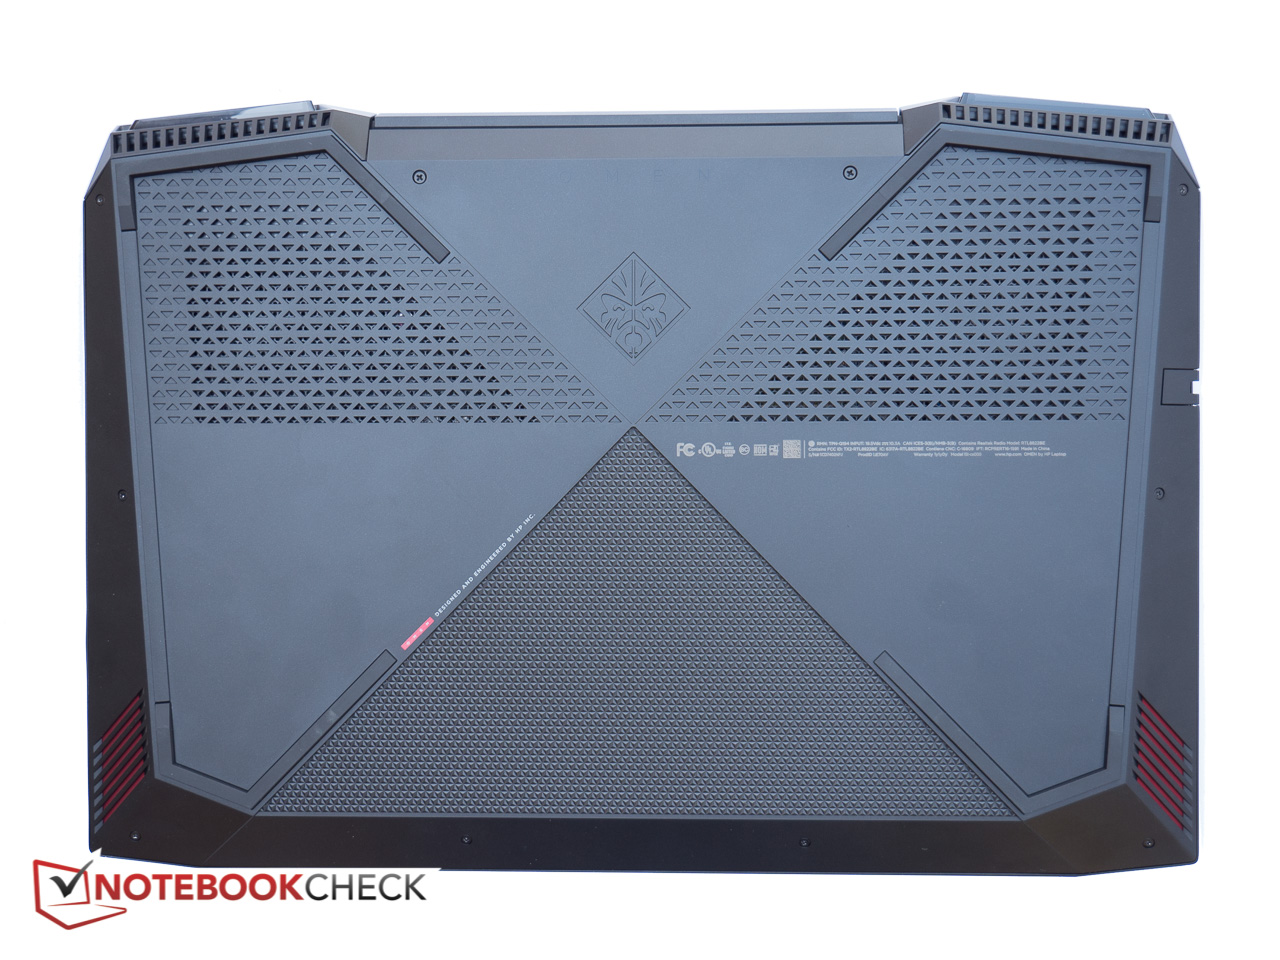
(-) La temperatura massima sul lato superiore è di 46 °C / 115 F, rispetto alla media di 40.4 °C / 105 F, che varia da 21.2 a 68.8 °C per questa classe Gaming.
(-) Il lato inferiore si riscalda fino ad un massimo di 49.2 °C / 121 F, rispetto alla media di 43.2 °C / 110 F
(+) In idle, la temperatura media del lato superiore è di 31.2 °C / 88 F, rispetto alla media deld ispositivo di 33.9 °C / 93 F.
(±) Riproducendo The Witcher 3, la temperatura media per il lato superiore e' di 36.2 °C / 97 F, rispetto alla media del dispositivo di 33.9 °C / 93 F.
(+) I poggiapolsi e il touchpad sono piu' freddi della temperatura della pelle con un massimo di 31 °C / 87.8 F e sono quindi freddi al tatto.
(-) La temperatura media della zona del palmo della mano di dispositivi simili e'stata di 28.8 °C / 83.8 F (-2.2 °C / -4 F).
HP Omen 15t-ce000 analisi audio
(-) | altoparlanti non molto potenti (65.4 dB)
Bassi 100 - 315 Hz
(±) | bassi ridotti - in media 13.8% inferiori alla media
(-) | bassi non lineari (15.7% delta rispetto alla precedente frequenza)
Medi 400 - 2000 Hz
(+) | medi bilanciati - solo only 3.3% rispetto alla media
(±) | linearità dei medi adeguata (10.4% delta rispetto alla precedente frequenza)
Alti 2 - 16 kHz
(+) | Alti bilanciati - appena 3.8% dalla media
(±) | la linearità degli alti è media (7.2% delta rispetto alla precedente frequenza)
Nel complesso 100 - 16.000 Hz
(±) | la linearità complessiva del suono è media (21.7% di differenza rispetto alla media
Rispetto alla stessa classe
» 78% di tutti i dispositivi testati in questa classe è stato migliore, 6% simile, 17% peggiore
» Il migliore ha avuto un delta di 6%, medio di 18%, peggiore di 132%
Rispetto a tutti i dispositivi testati
» 61% di tutti i dispositivi testati in questa classe è stato migliore, 7% similare, 31% peggiore
» Il migliore ha avuto un delta di 4%, medio di 24%, peggiore di 134%
Apple MacBook 12 (Early 2016) 1.1 GHz analisi audio
(+) | gli altoparlanti sono relativamente potenti (83.6 dB)
Bassi 100 - 315 Hz
(±) | bassi ridotti - in media 11.3% inferiori alla media
(±) | la linearità dei bassi è media (14.2% delta rispetto alla precedente frequenza)
Medi 400 - 2000 Hz
(+) | medi bilanciati - solo only 2.4% rispetto alla media
(+) | medi lineari (5.5% delta rispetto alla precedente frequenza)
Alti 2 - 16 kHz
(+) | Alti bilanciati - appena 2% dalla media
(+) | alti lineari (4.5% delta rispetto alla precedente frequenza)
Nel complesso 100 - 16.000 Hz
(+) | suono nel complesso lineare (10.2% differenza dalla media)
Rispetto alla stessa classe
» 7% di tutti i dispositivi testati in questa classe è stato migliore, 2% simile, 91% peggiore
» Il migliore ha avuto un delta di 5%, medio di 18%, peggiore di 53%
Rispetto a tutti i dispositivi testati
» 5% di tutti i dispositivi testati in questa classe è stato migliore, 1% similare, 94% peggiore
» Il migliore ha avuto un delta di 4%, medio di 24%, peggiore di 134%
| Off / Standby | |
| Idle | |
| Sotto carico |
|
Leggenda:
min: | |
| HP Omen 15t-ce000 i7-7700HQ, GeForce GTX 1060 Max-Q, Samsung PM961 NVMe MZVLW128HEGR, IPS, 3840x2160, 15.6" | Lenovo Legion Y520-15IKBN 80WK0042GE i5-7300HQ, GeForce GTX 1050 Ti Mobile, Samsung PM961 NVMe MZVLW128HEGR, IPS, 1920x1080, 15.6" | Dell Inspiron 15 7000 7577 i5-7300HQ, GeForce GTX 1060 Max-Q, Samsung PM961 MZVLW256HEHP, IPS, 1920x1080, 15.6" | Gigabyte Aero 15 i7-7700HQ, GeForce GTX 1060 Mobile, Lite-On CX2-8B512-Q11, IPS, 1920x1080, 15.6" | Acer Aspire VN7-593G-73HP V15 Nitro BE i7-7700HQ, GeForce GTX 1060 Mobile, Seagate Mobile HDD 1TB ST1000LM035, AH-IPS, Normally Black, Transmissive, 1920x1080, 15.6" | HP Omen 15-ce002ng i7-7700HQ, GeForce GTX 1060 Max-Q, Samsung PM961 MZVLW256HEHP, IPS, 1920x1080, 15.6" | Aorus X5 v7 i7-7820HK, GeForce GTX 1070 Mobile, Toshiba NVMe THNSN5256GPU7, IPS, 3840x2160, 15.6" | |
|---|---|---|---|---|---|---|---|
| Power Consumption | 39% | 39% | 4% | 15% | -13% | -58% | |
| Idle Minimum * (Watt) | 15.4 | 5.2 66% | 7.1 54% | 12 22% | 7.2 53% | 18 -17% | 26 -69% |
| Idle Average * (Watt) | 22.4 | 8.3 63% | 7.6 66% | 15 33% | 10.5 53% | 23 -3% | 31 -38% |
| Idle Maximum * (Watt) | 22.4 | 10.1 55% | 8.6 62% | 20 11% | 16 29% | 30 -34% | 36 -61% |
| Load Average * (Watt) | 78.1 | 62.7 20% | 59.5 24% | 82 -5% | 82 -5% | 85 -9% | 93 -19% |
| Witcher 3 ultra * (Watt) | 97.5 | 94 4% | 89 9% | 111 -14% | 124 -27% | 96 2% | 176 -81% |
| Load Maximum * (Watt) | 133.52 | 100 25% | 112.8 16% | 161 -21% | 155 -16% | 158 -18% | 240 -80% |
* ... Meglio usare valori piccoli
| HP Omen 15t-ce000 i7-7700HQ, GeForce GTX 1060 Max-Q, 70 Wh | Lenovo Legion Y520-15IKBN 80WK0042GE i5-7300HQ, GeForce GTX 1050 Ti Mobile, 45 Wh | Dell Inspiron 15 7000 7577 i5-7300HQ, GeForce GTX 1060 Max-Q, 56 Wh | Gigabyte Aero 15 i7-7700HQ, GeForce GTX 1060 Mobile, 94.24 Wh | Acer Aspire VN7-593G-73HP V15 Nitro BE i7-7700HQ, GeForce GTX 1060 Mobile, 69 Wh | HP Omen 15-ce002ng i7-7700HQ, GeForce GTX 1060 Max-Q, 70 Wh | Aorus X5 v7 i7-7820HK, GeForce GTX 1070 Mobile, 94 Wh | |
|---|---|---|---|---|---|---|---|
| Autonomia della batteria | 54% | 77% | 83% | 70% | -9% | -20% | |
| Reader / Idle (h) | 5 | 10.6 112% | 11 120% | 10.6 112% | 8.4 68% | 4.3 -14% | 3.5 -30% |
| WiFi v1.3 (h) | 3.5 | 5.2 49% | 6.9 97% | 7 100% | 6 71% | 3.3 -6% | 2.5 -29% |
| Load (h) | 1.4 | 1.4 0% | 1.6 14% | 1.9 36% | 2.4 71% | 1.3 -7% | 1.4 0% |
Warning: More than one pro / contra elements for this language found
Pro
Contro


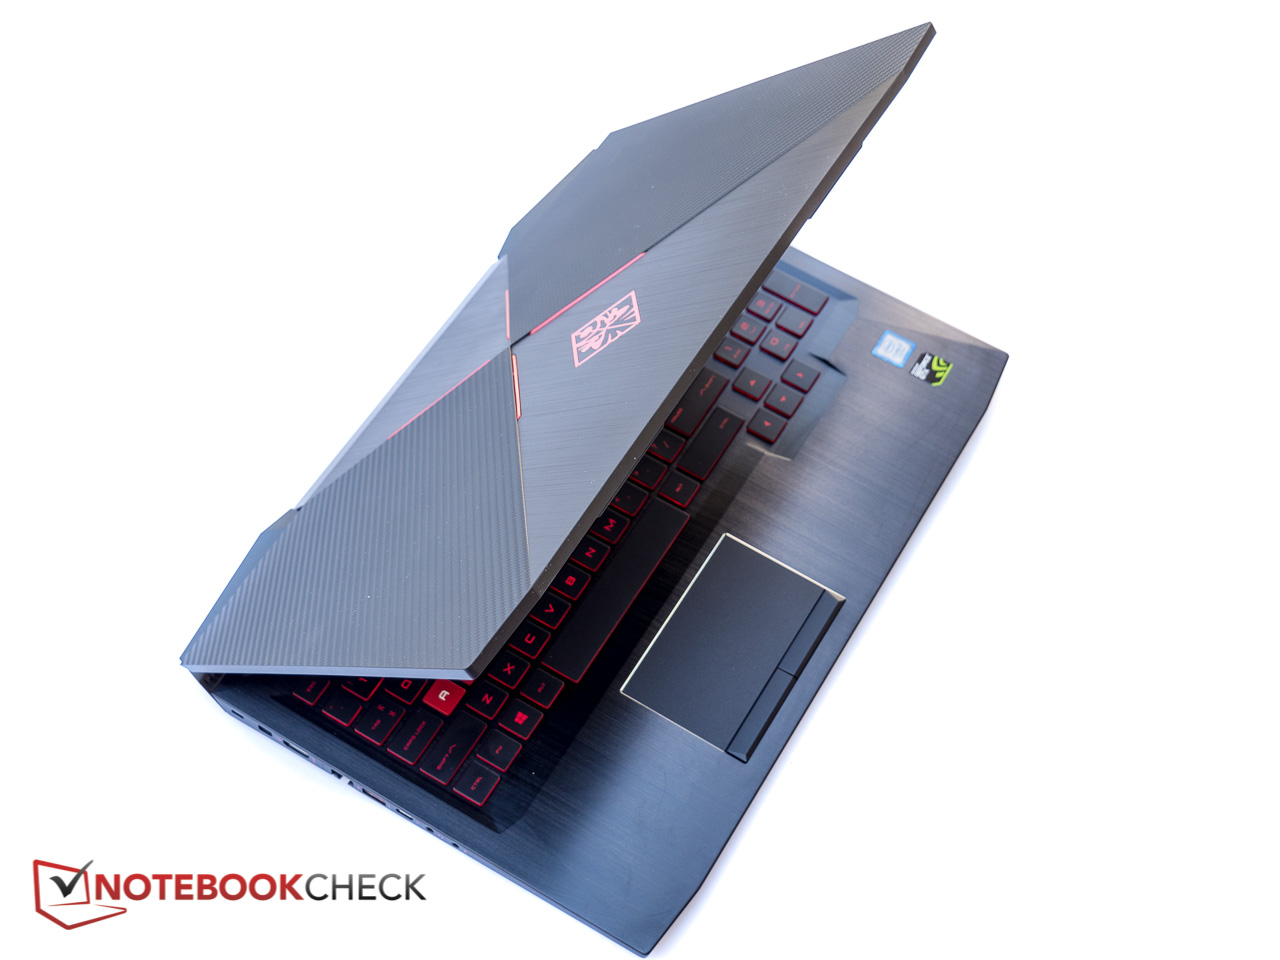
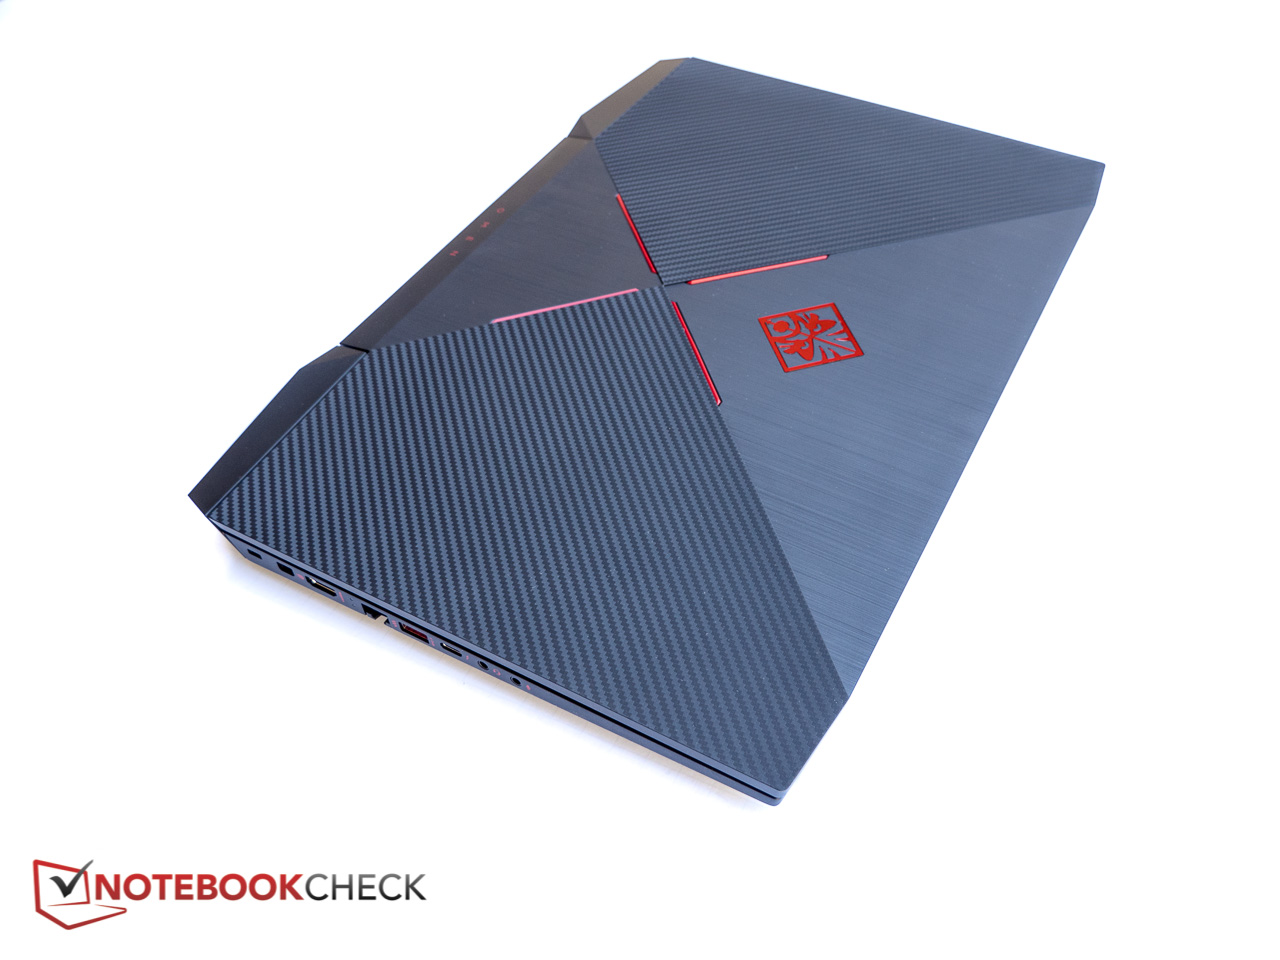
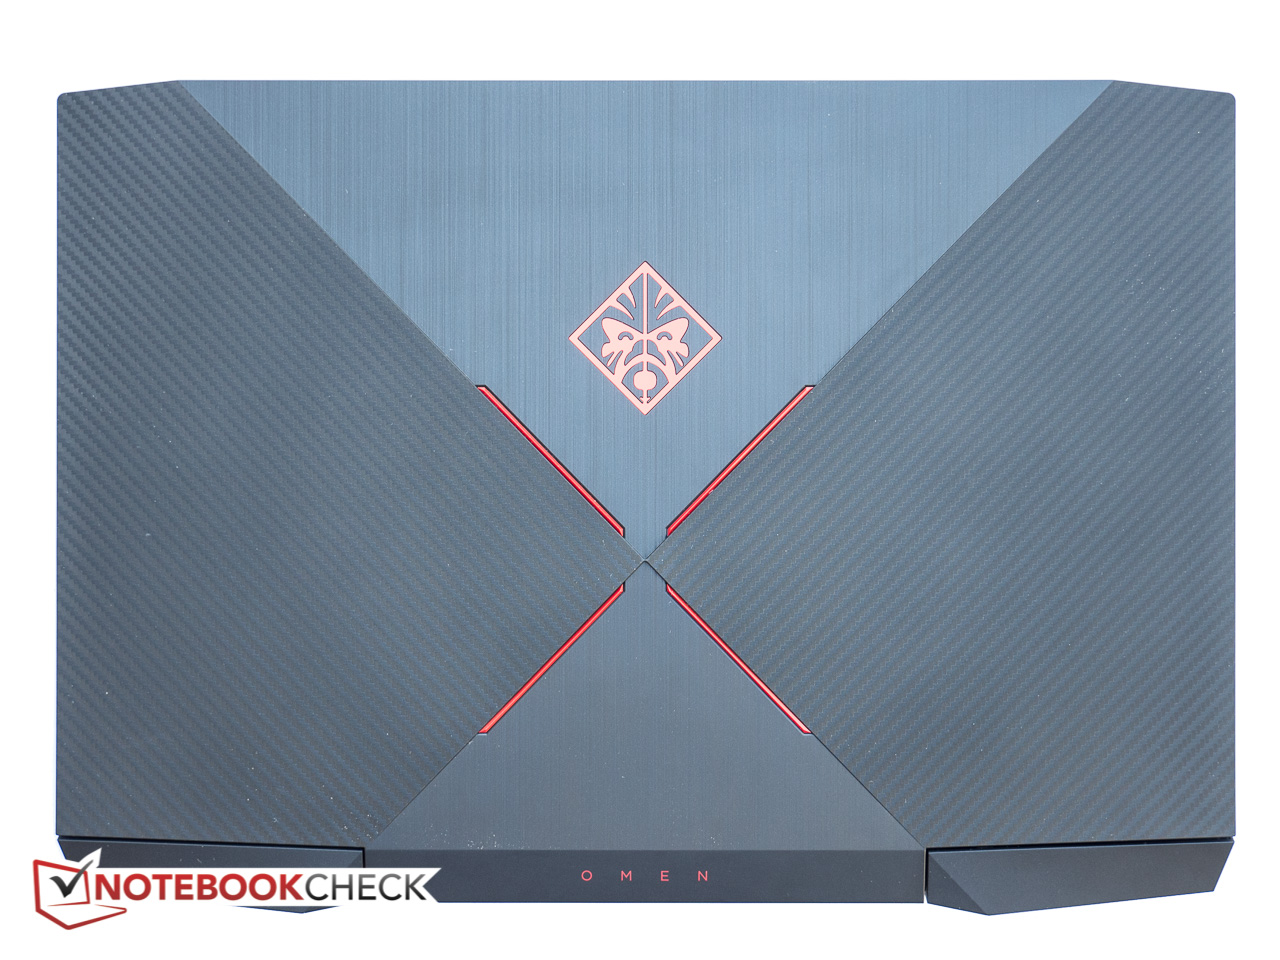
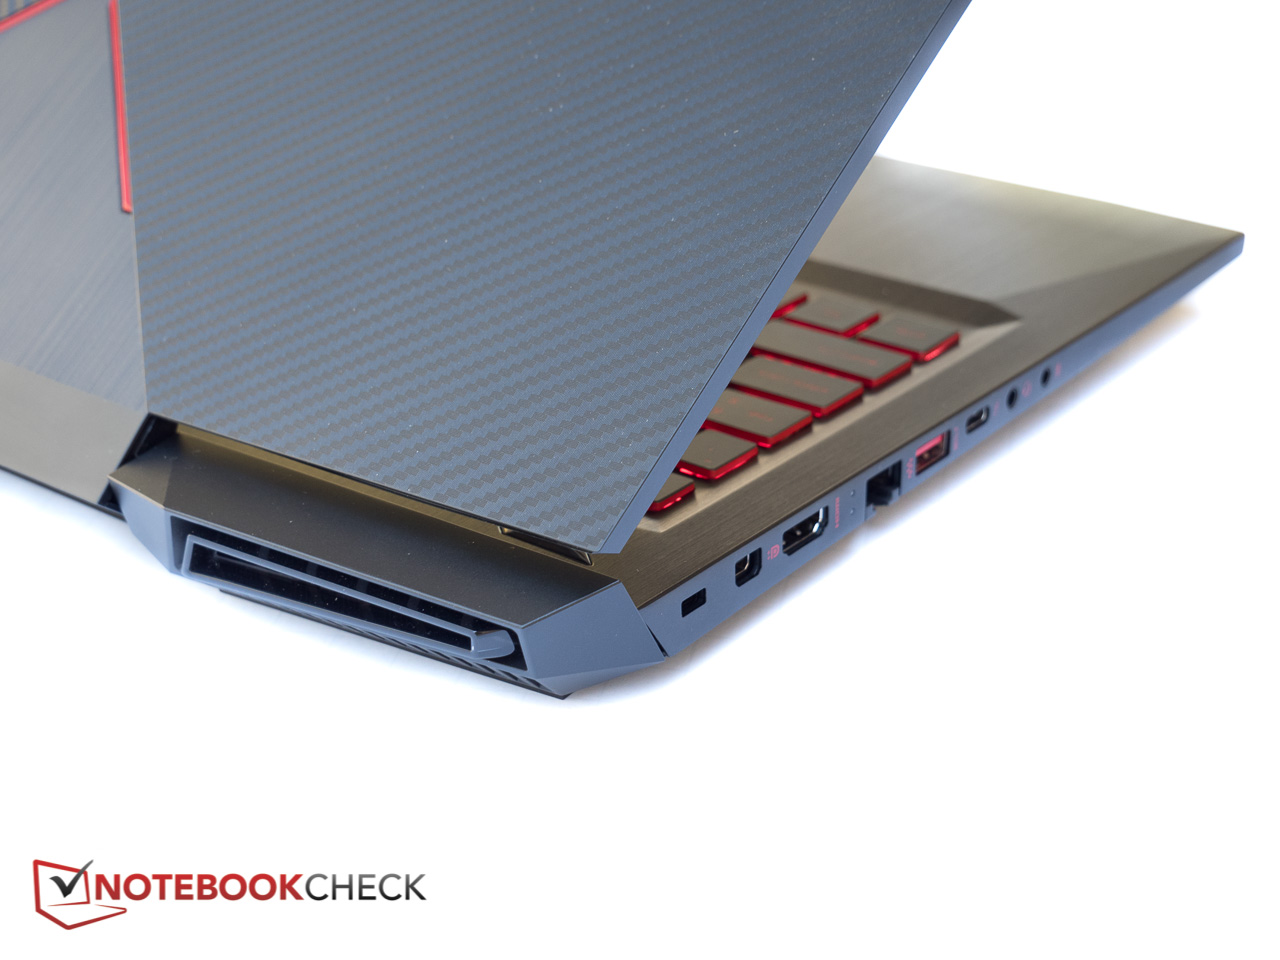
Non è molto difficile trovare pecche quando si guarda un portatile gaming economico, in quanto il produttore cammina su un campo minato per bilanciare materiali economici con aspetto carino e hardware potente per attirare un buon numero di clienti. Per l'Omen 15, possiamo criticare la cover in metallo con estremità spigolose, l'effetto bleeding dello schermo o la ventola. Ma nessuna di queste pecche è davvero decisiva per un sistema gaming: considerando il tutto l'HP Omen 15 è un economico sistema Max-Q con potenza sufficiente per gestire la maggioranza di giochi attuali almeno con risoluzione Full HD.
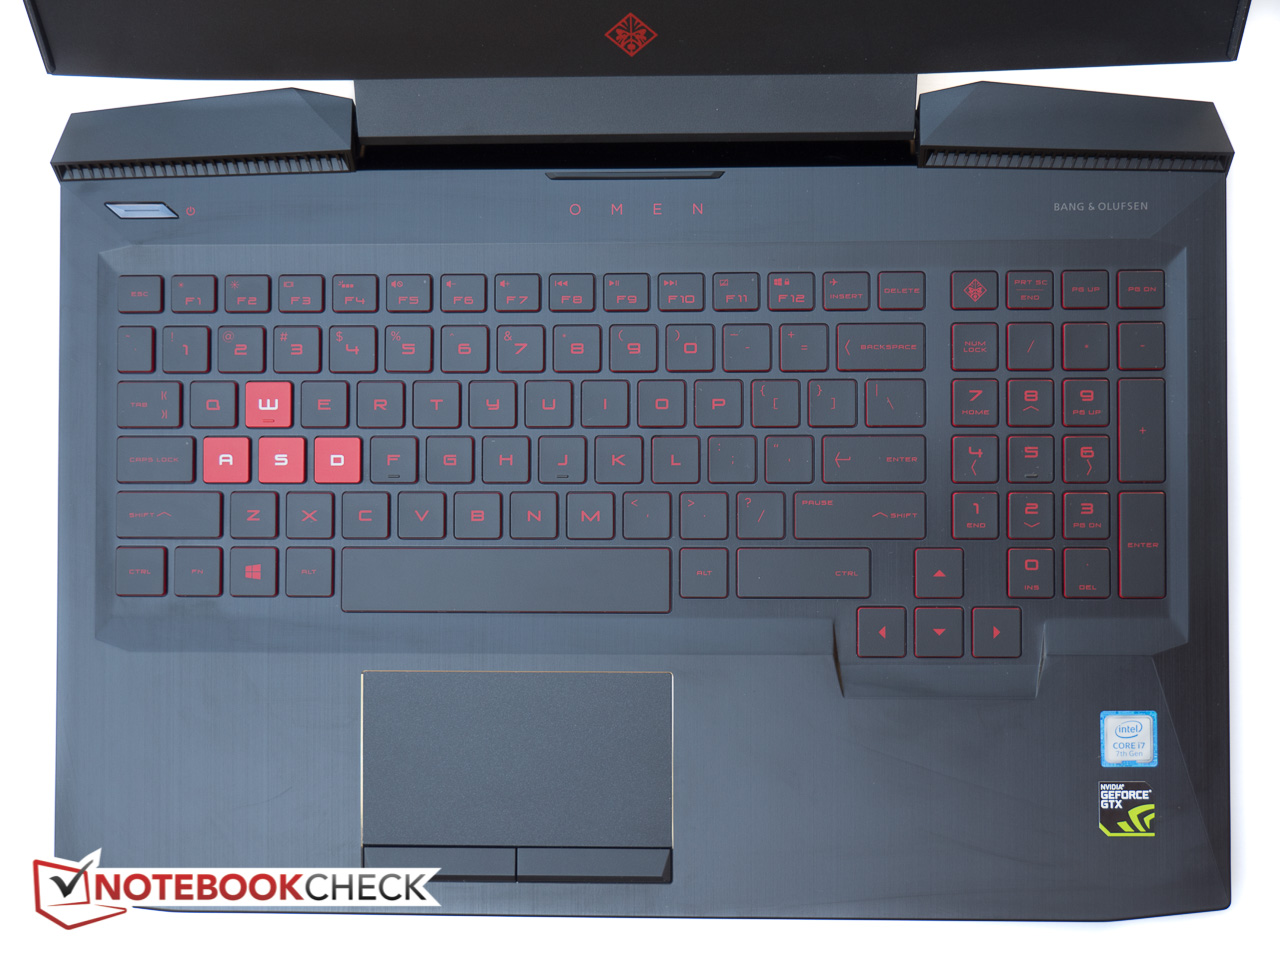
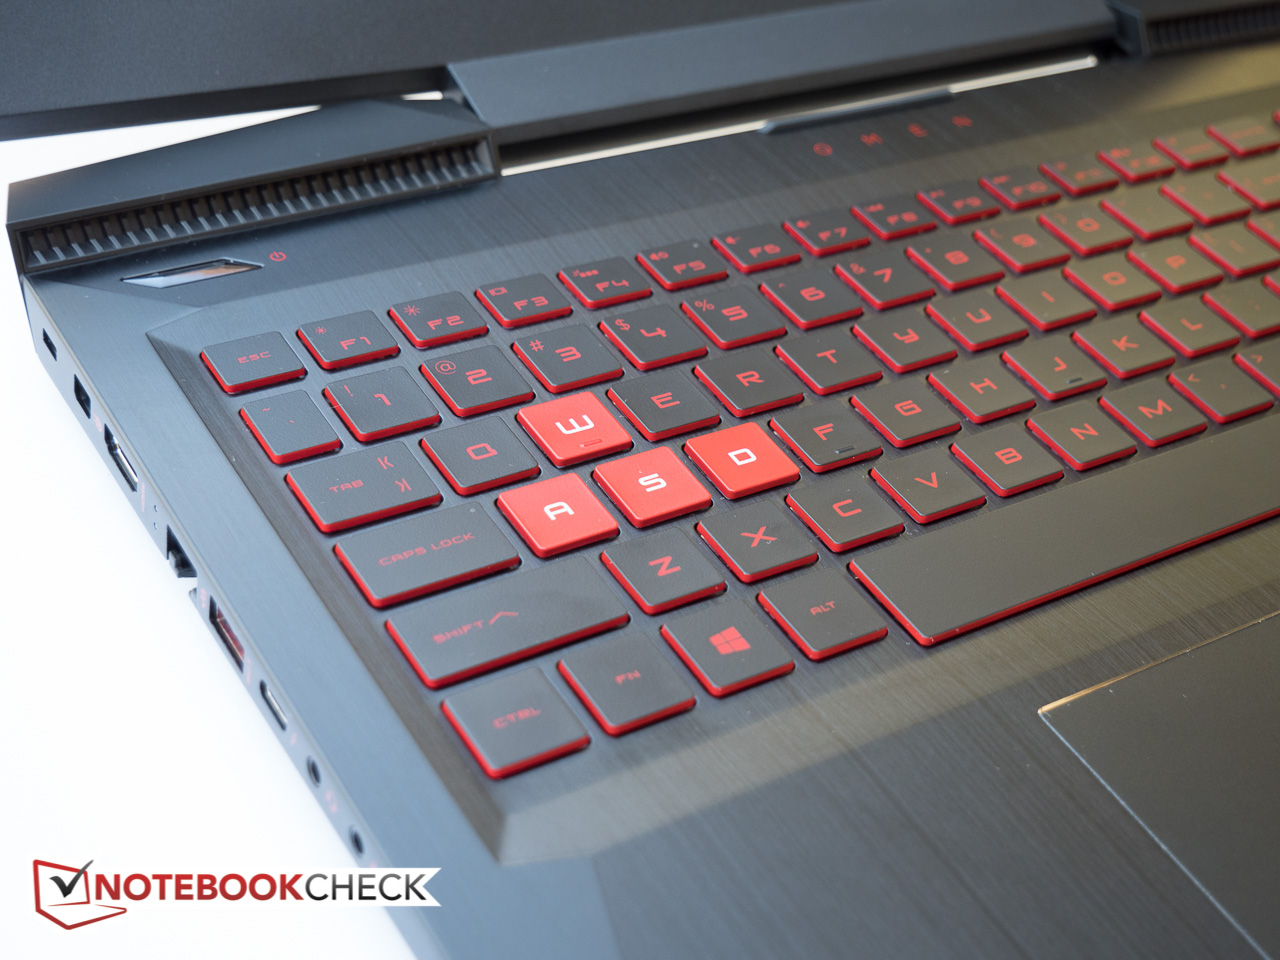
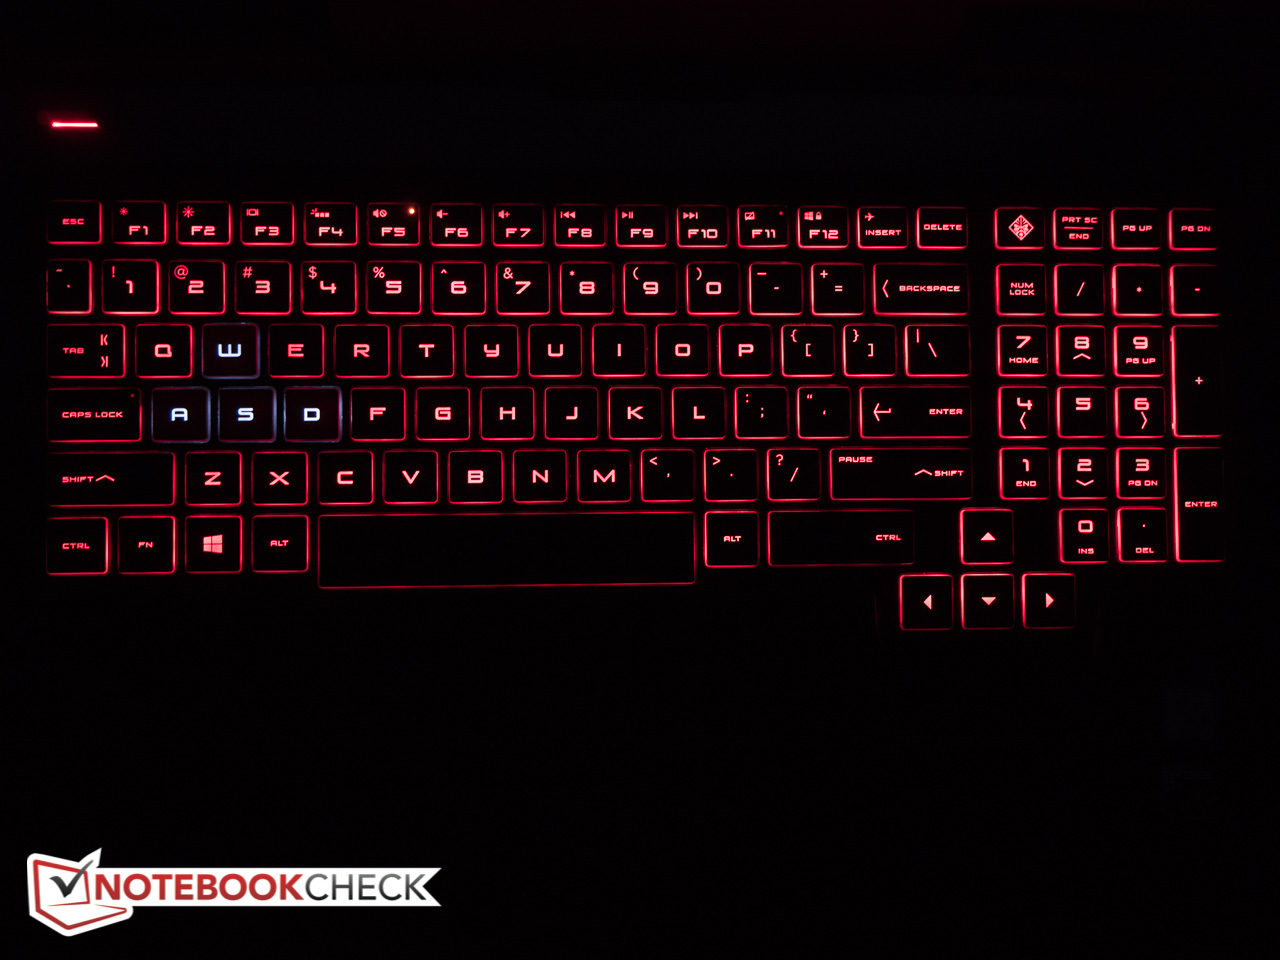
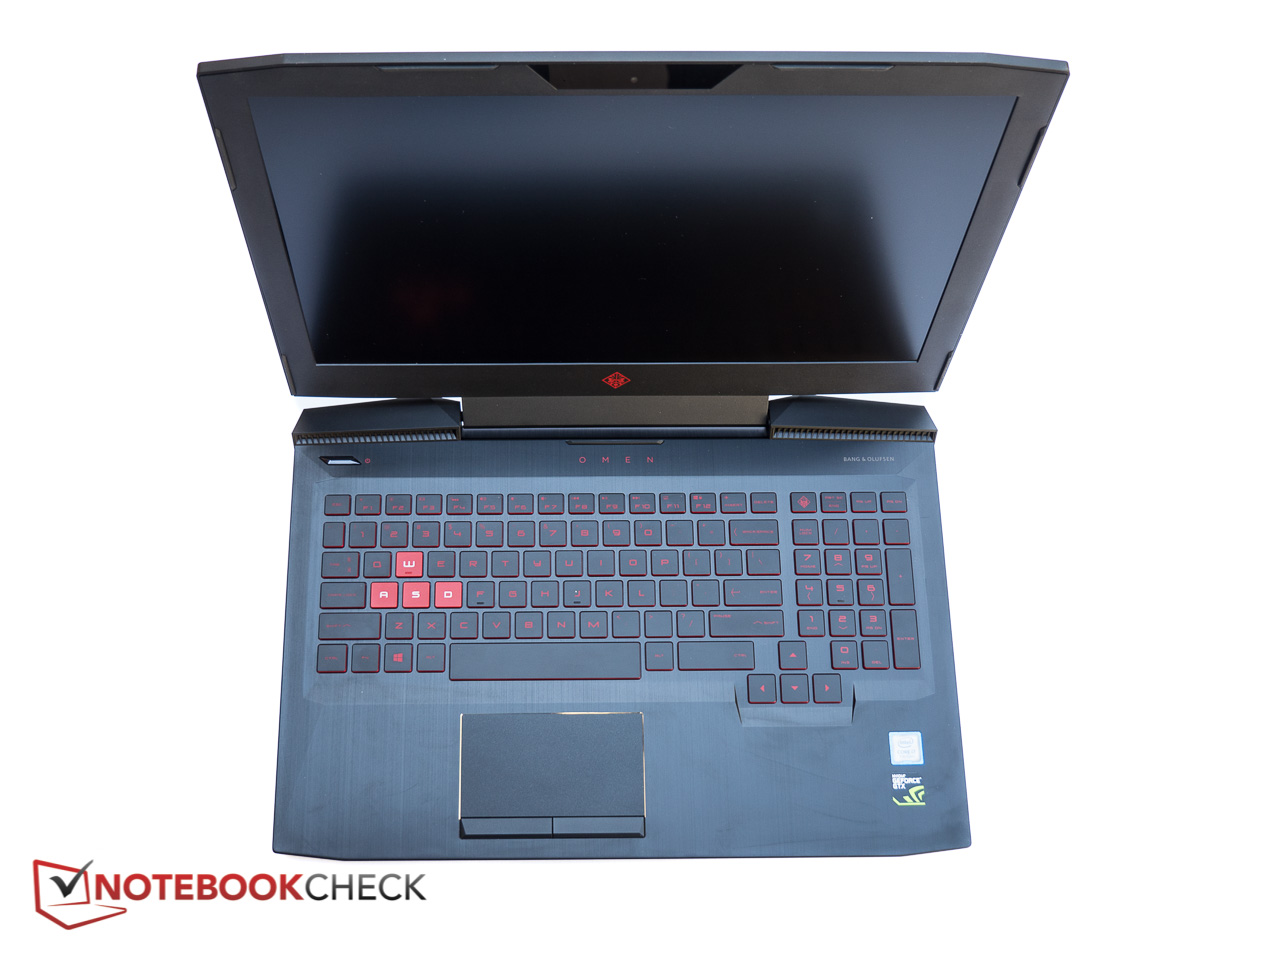
La recente revisione del design potrebbe non piacere a tutti, ma non ci sono dubbi sulla qualità di costruzione che mostra una buona resistenza alla torsione della base e non ci sono cedimenti sulla tastiera. I dispositivi di input funzionano bene, l'hardware è ottimo, e il luminoso display UHD IPS è - specialmente dopo la calibrazione - incredibile considerato il prezzo. L'Omen 15 si scalda abbastanza, ma non diventa caldo come altri sistemi. Le ventole, tuttavia sono abbastanza rumorose, in quanto girano spesso ed emettono un suono che oscilla molto.
Coloro che cercano un economico portatile gaming di fascia medio-bassa con display 4K sicuramente possono inserire l'Omen 15 tra i candidati.
Il portatile gaming Dell Inspiron 15 ha un display inferiore, ma restano le prestazioni buone e la durata della batteria superiore del doppio.
Nota: si tratta di una recensione breve, con alcune sezioni non tradotte, per la versione integrale in inglese guardate qui.
HP Omen 15t-ce000
- 12/01/2017 v6 (old)
Bernhard Pechlaner
