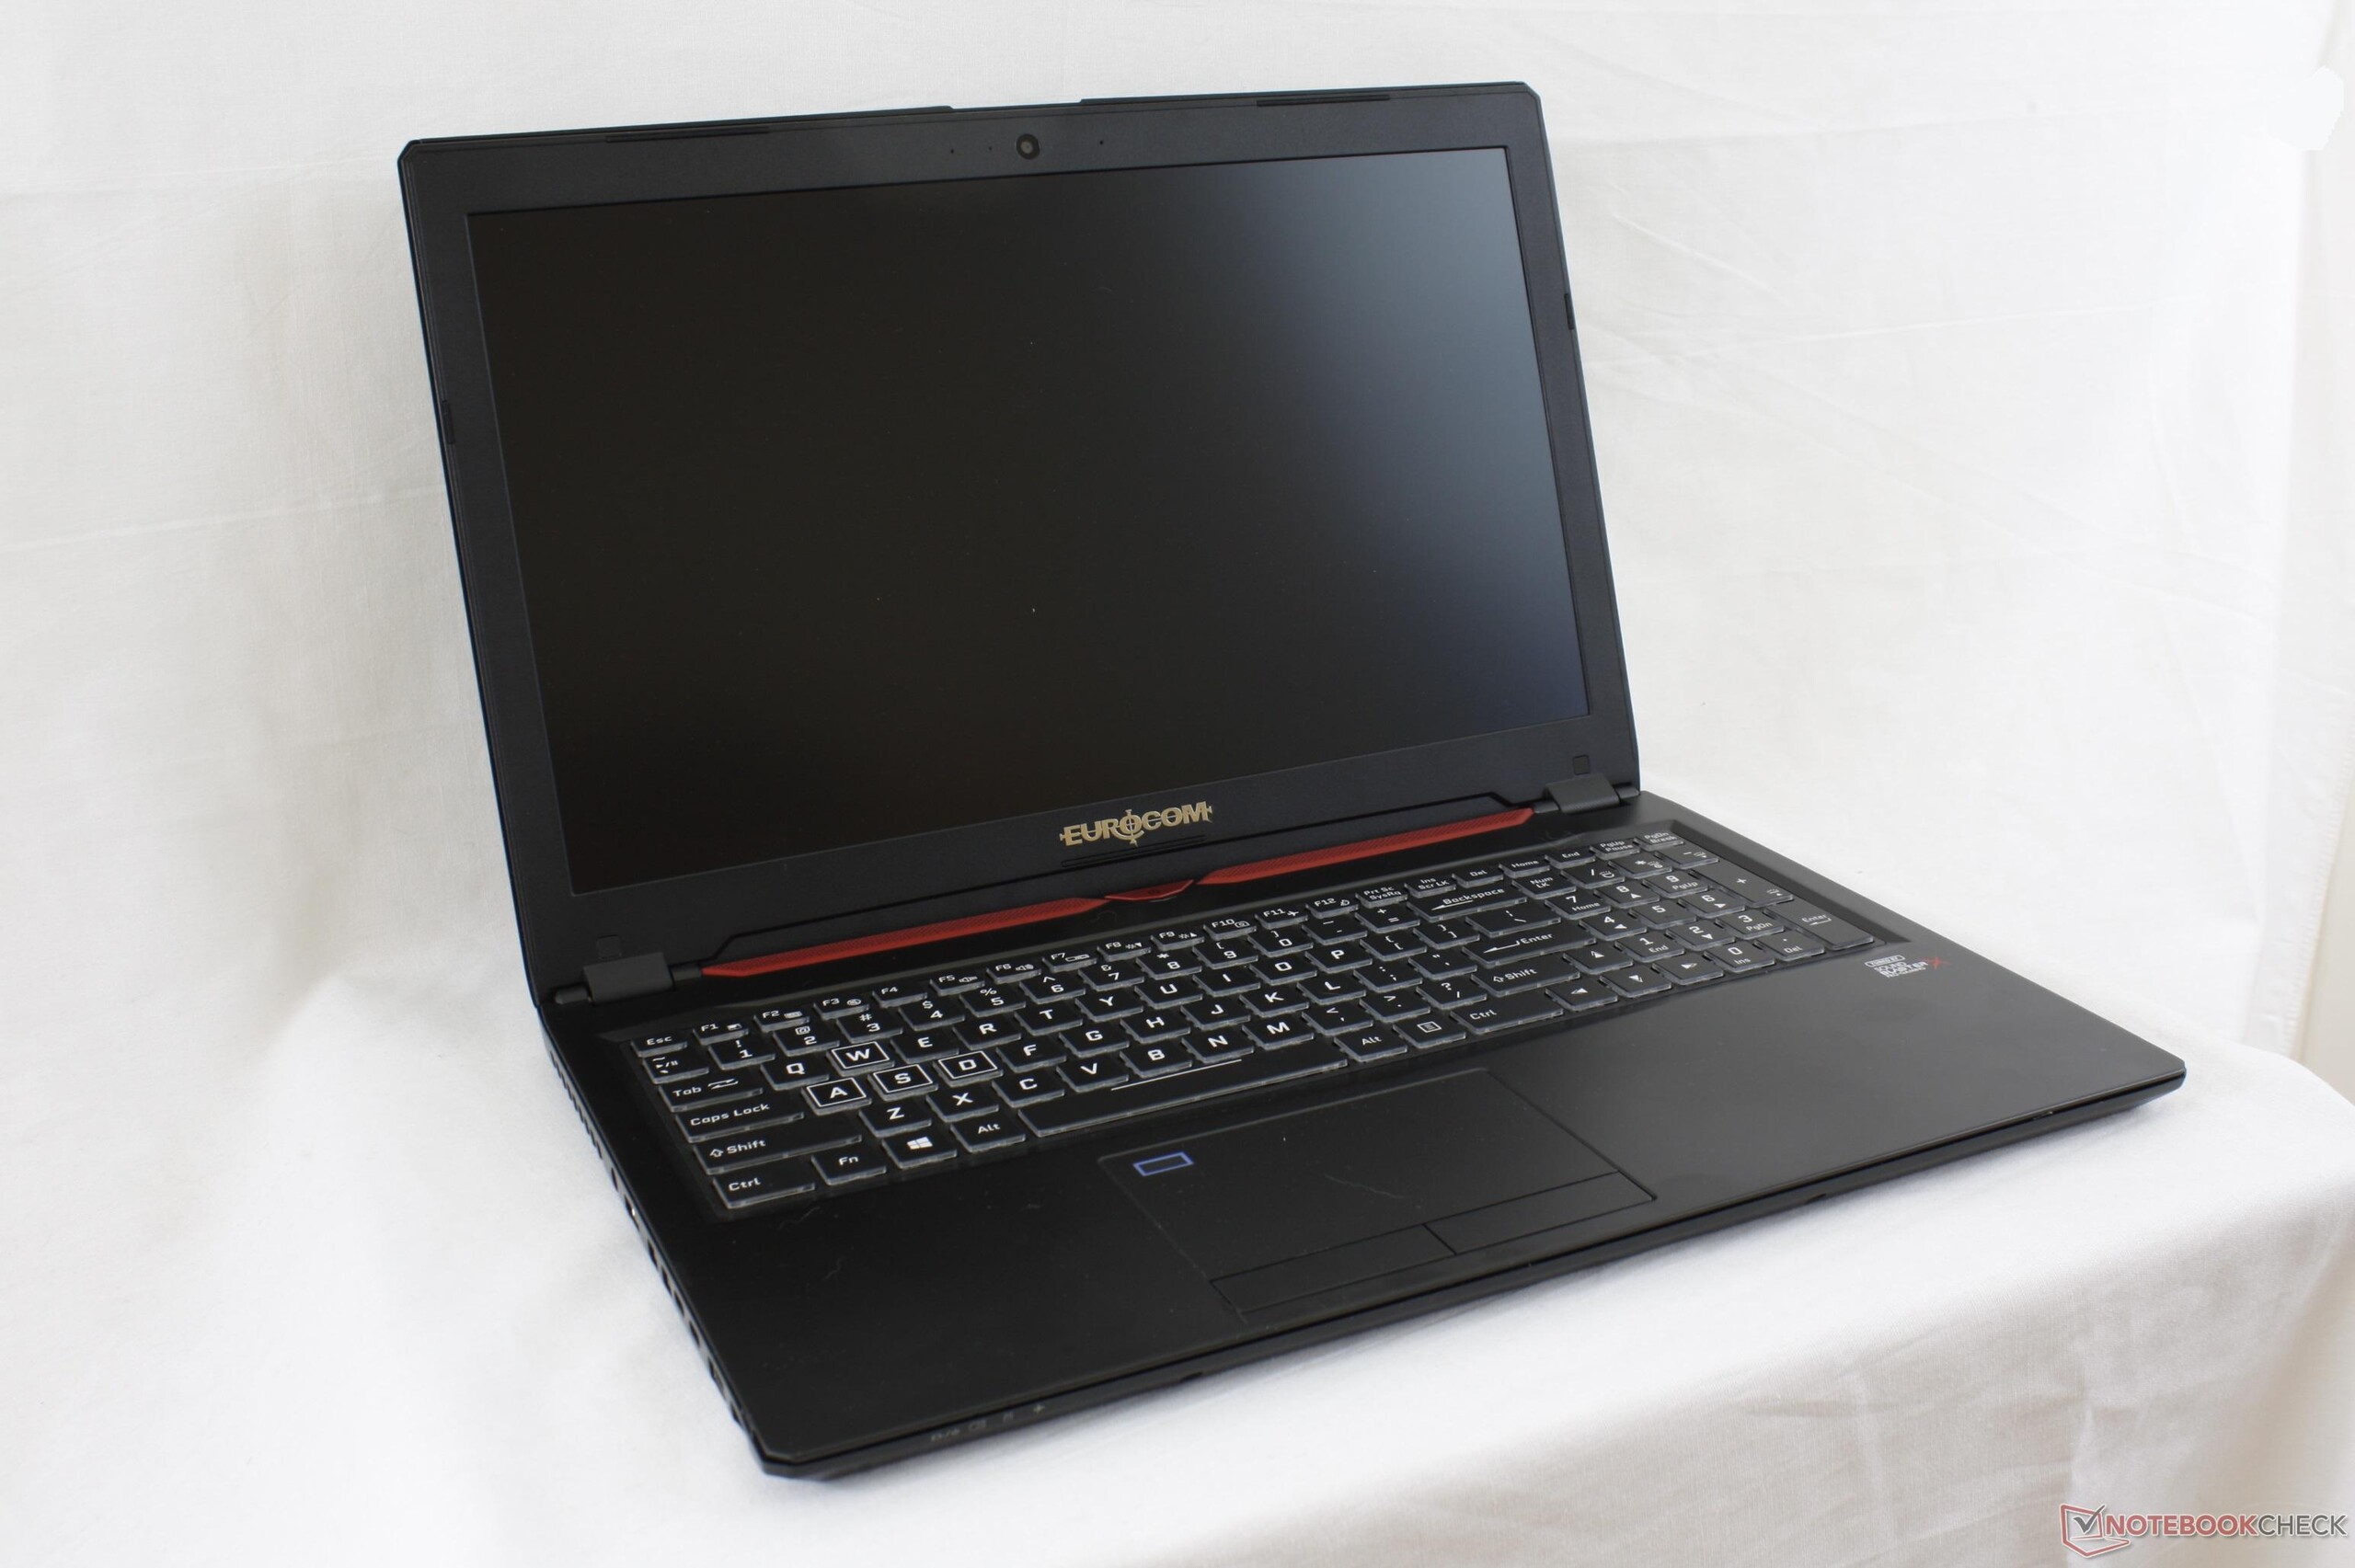
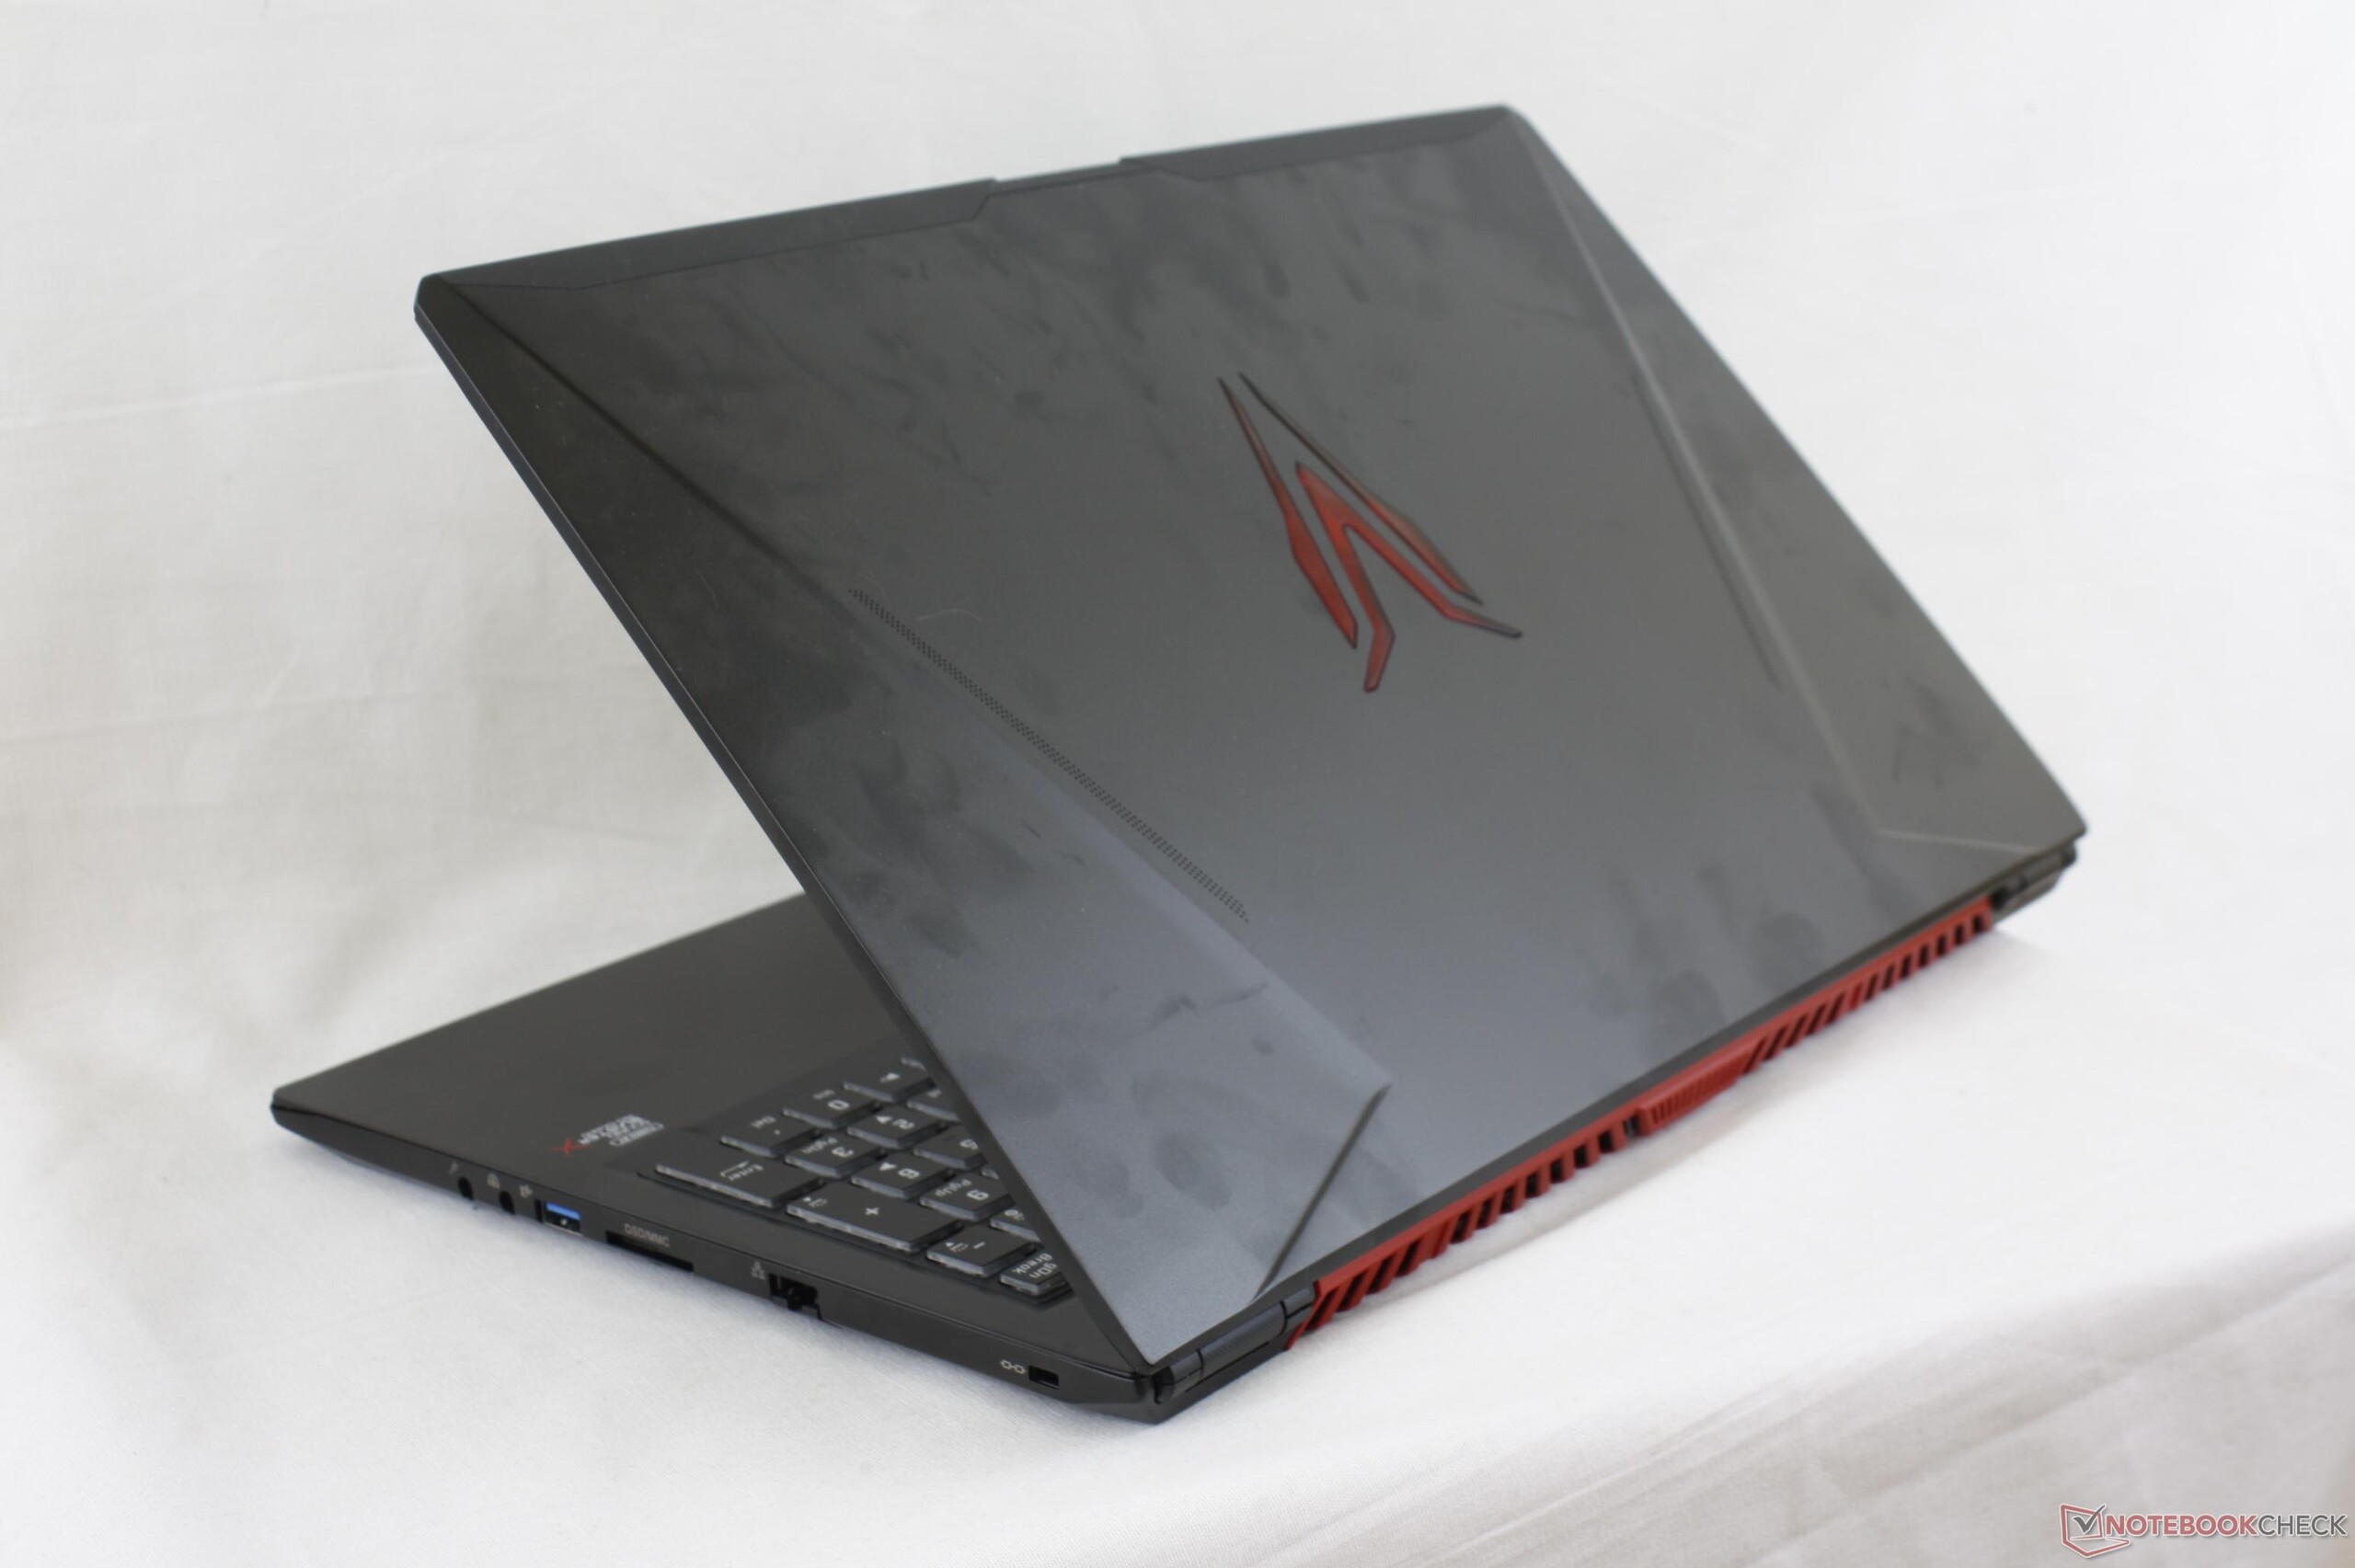
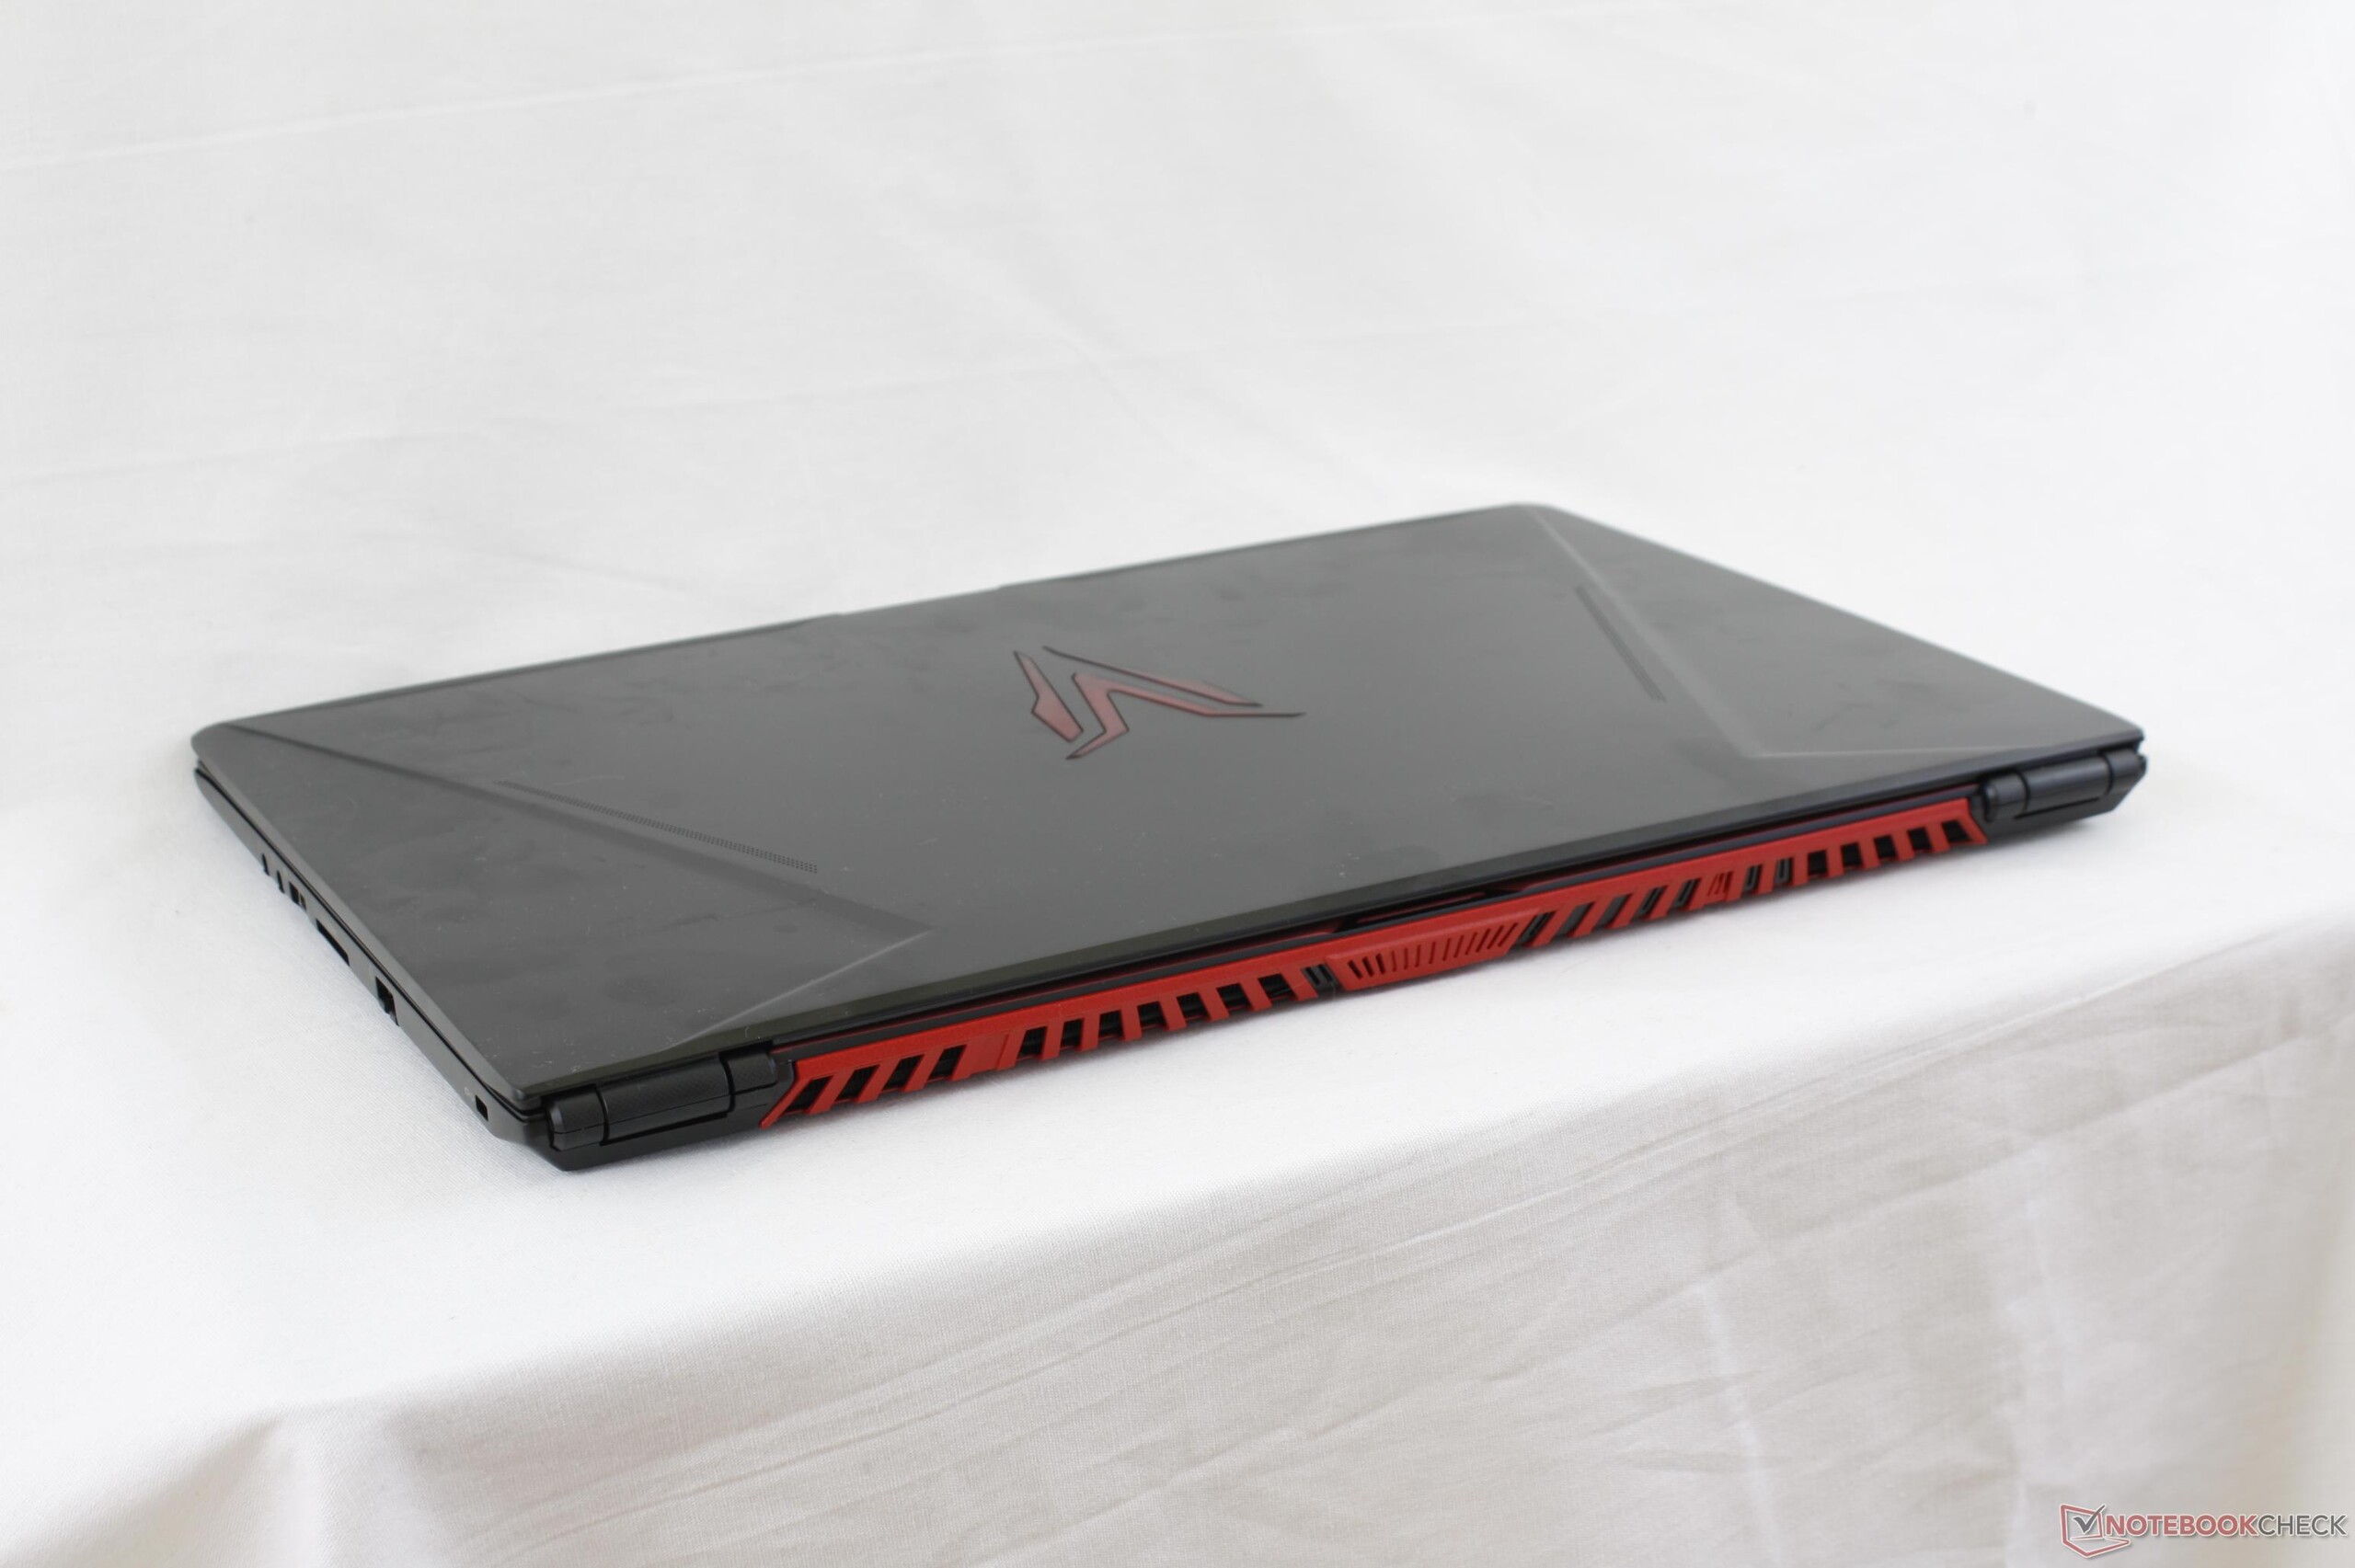
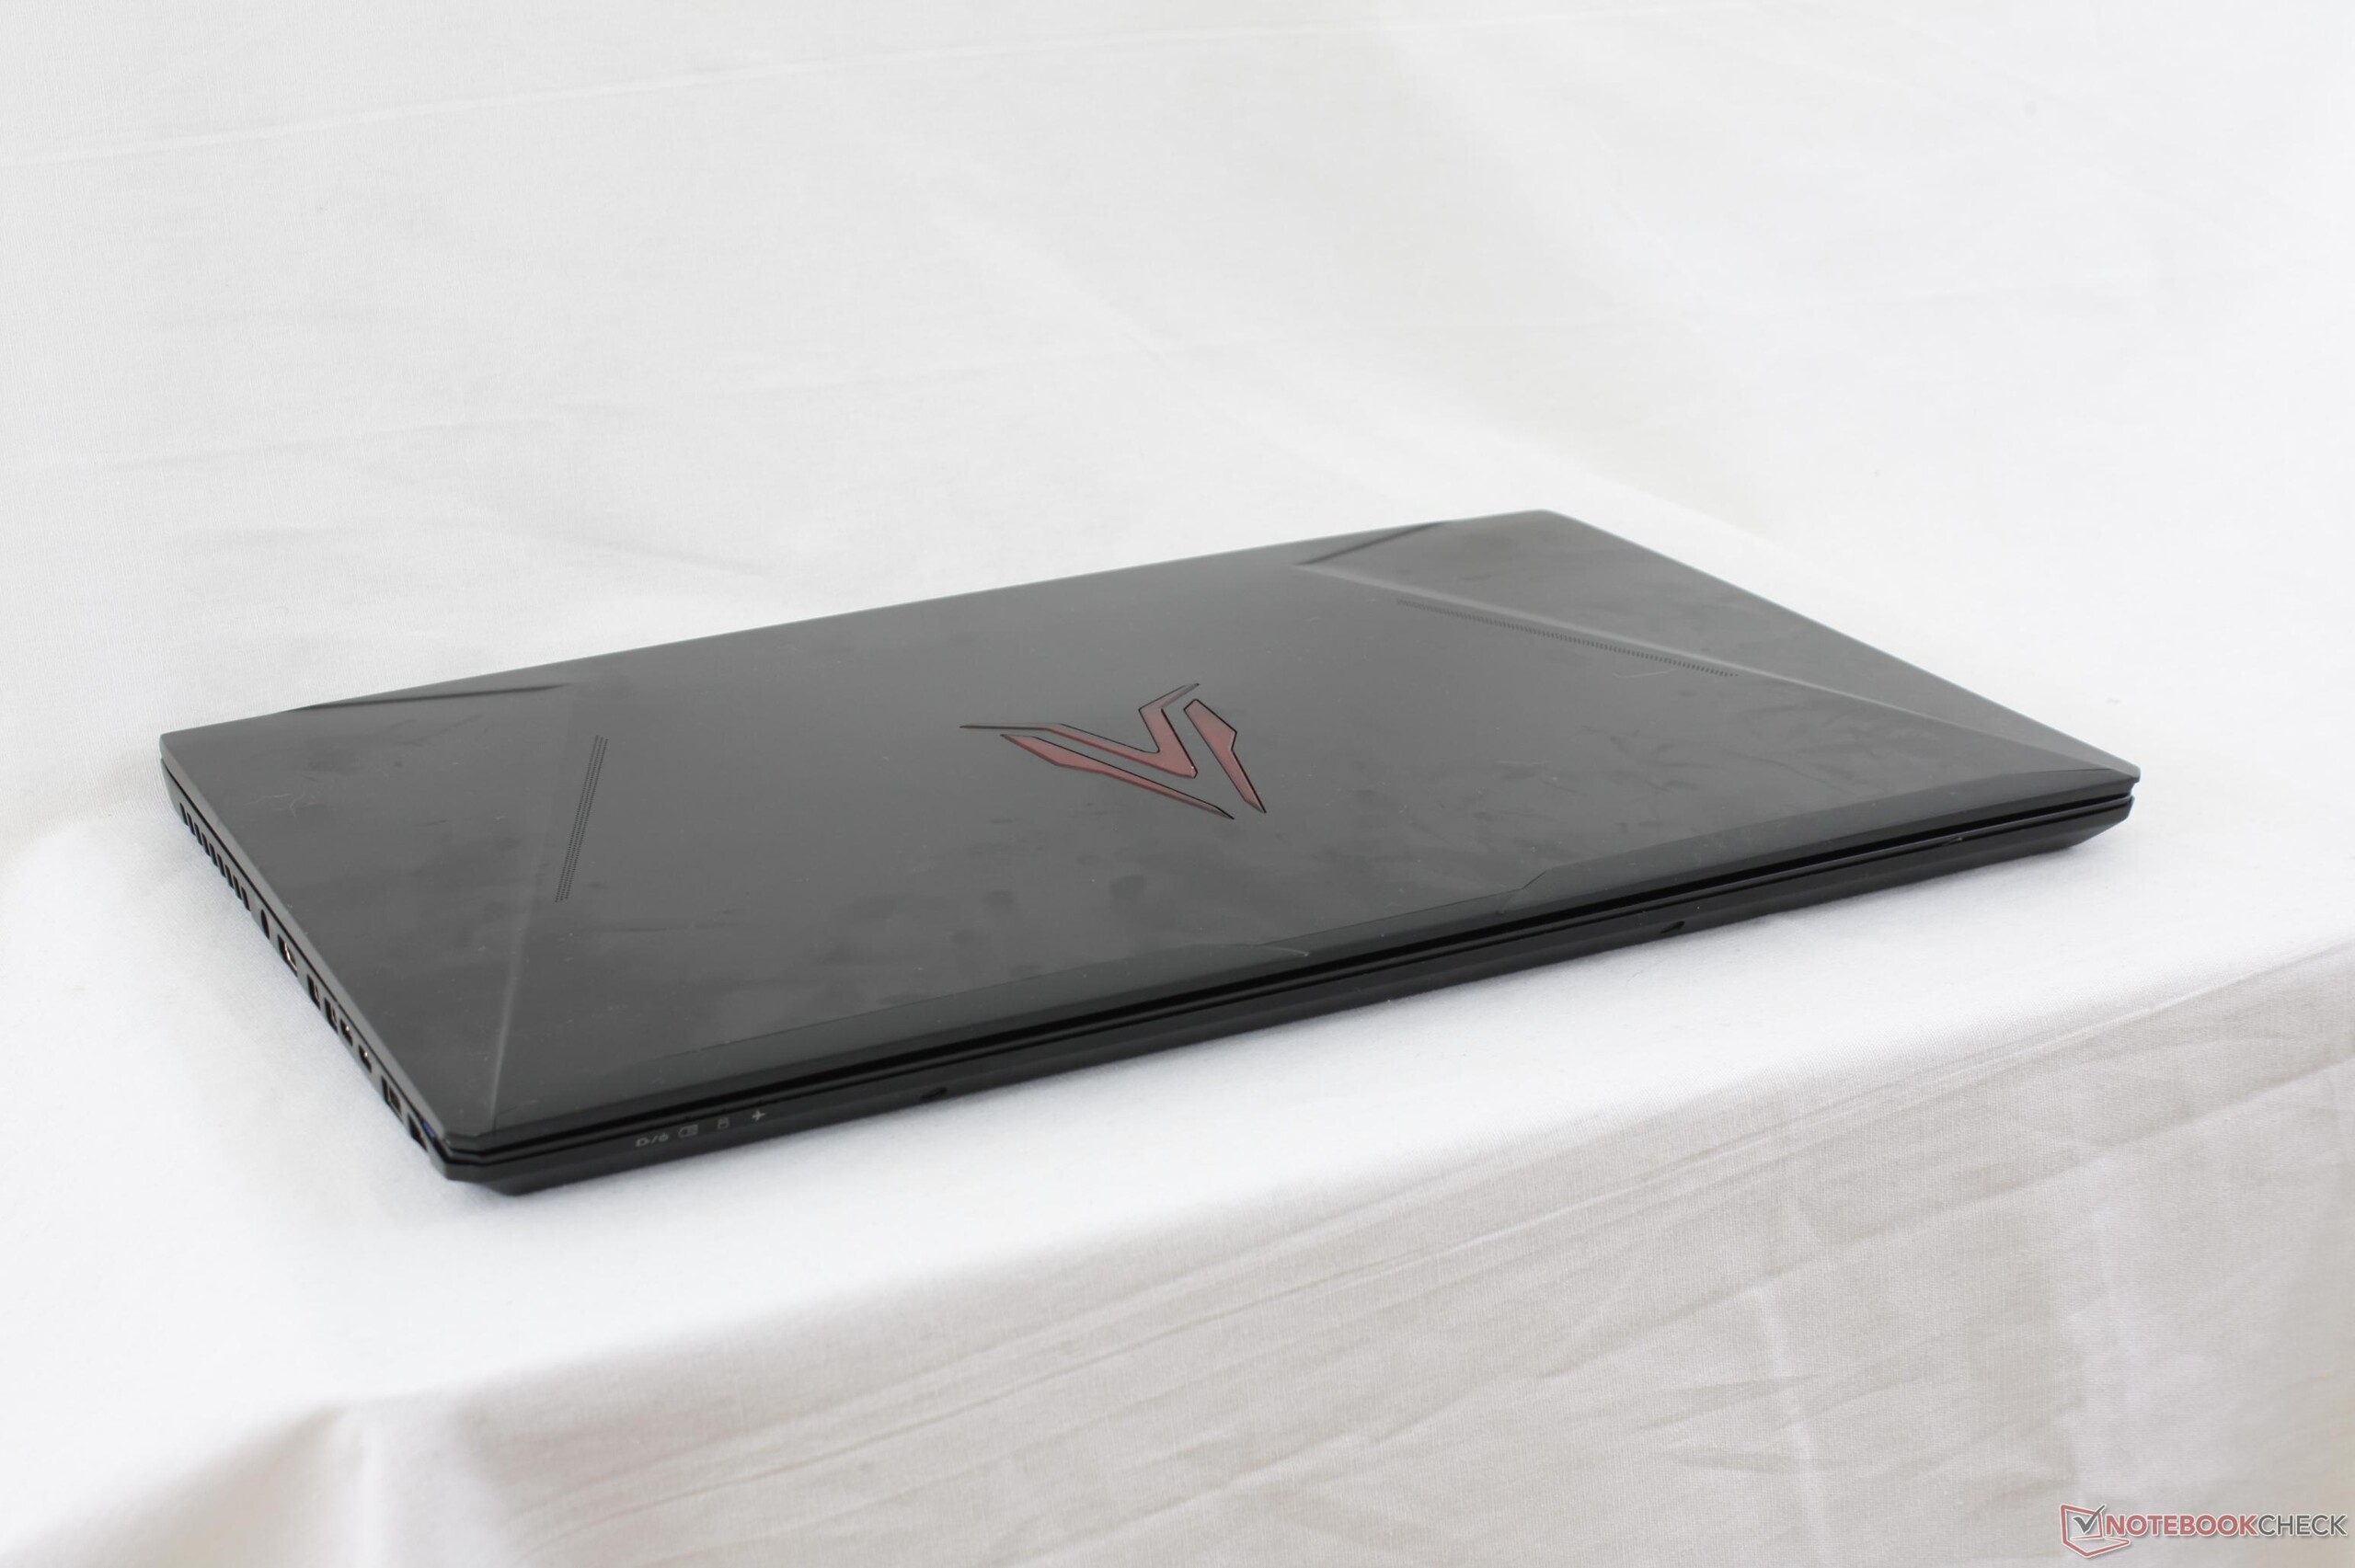
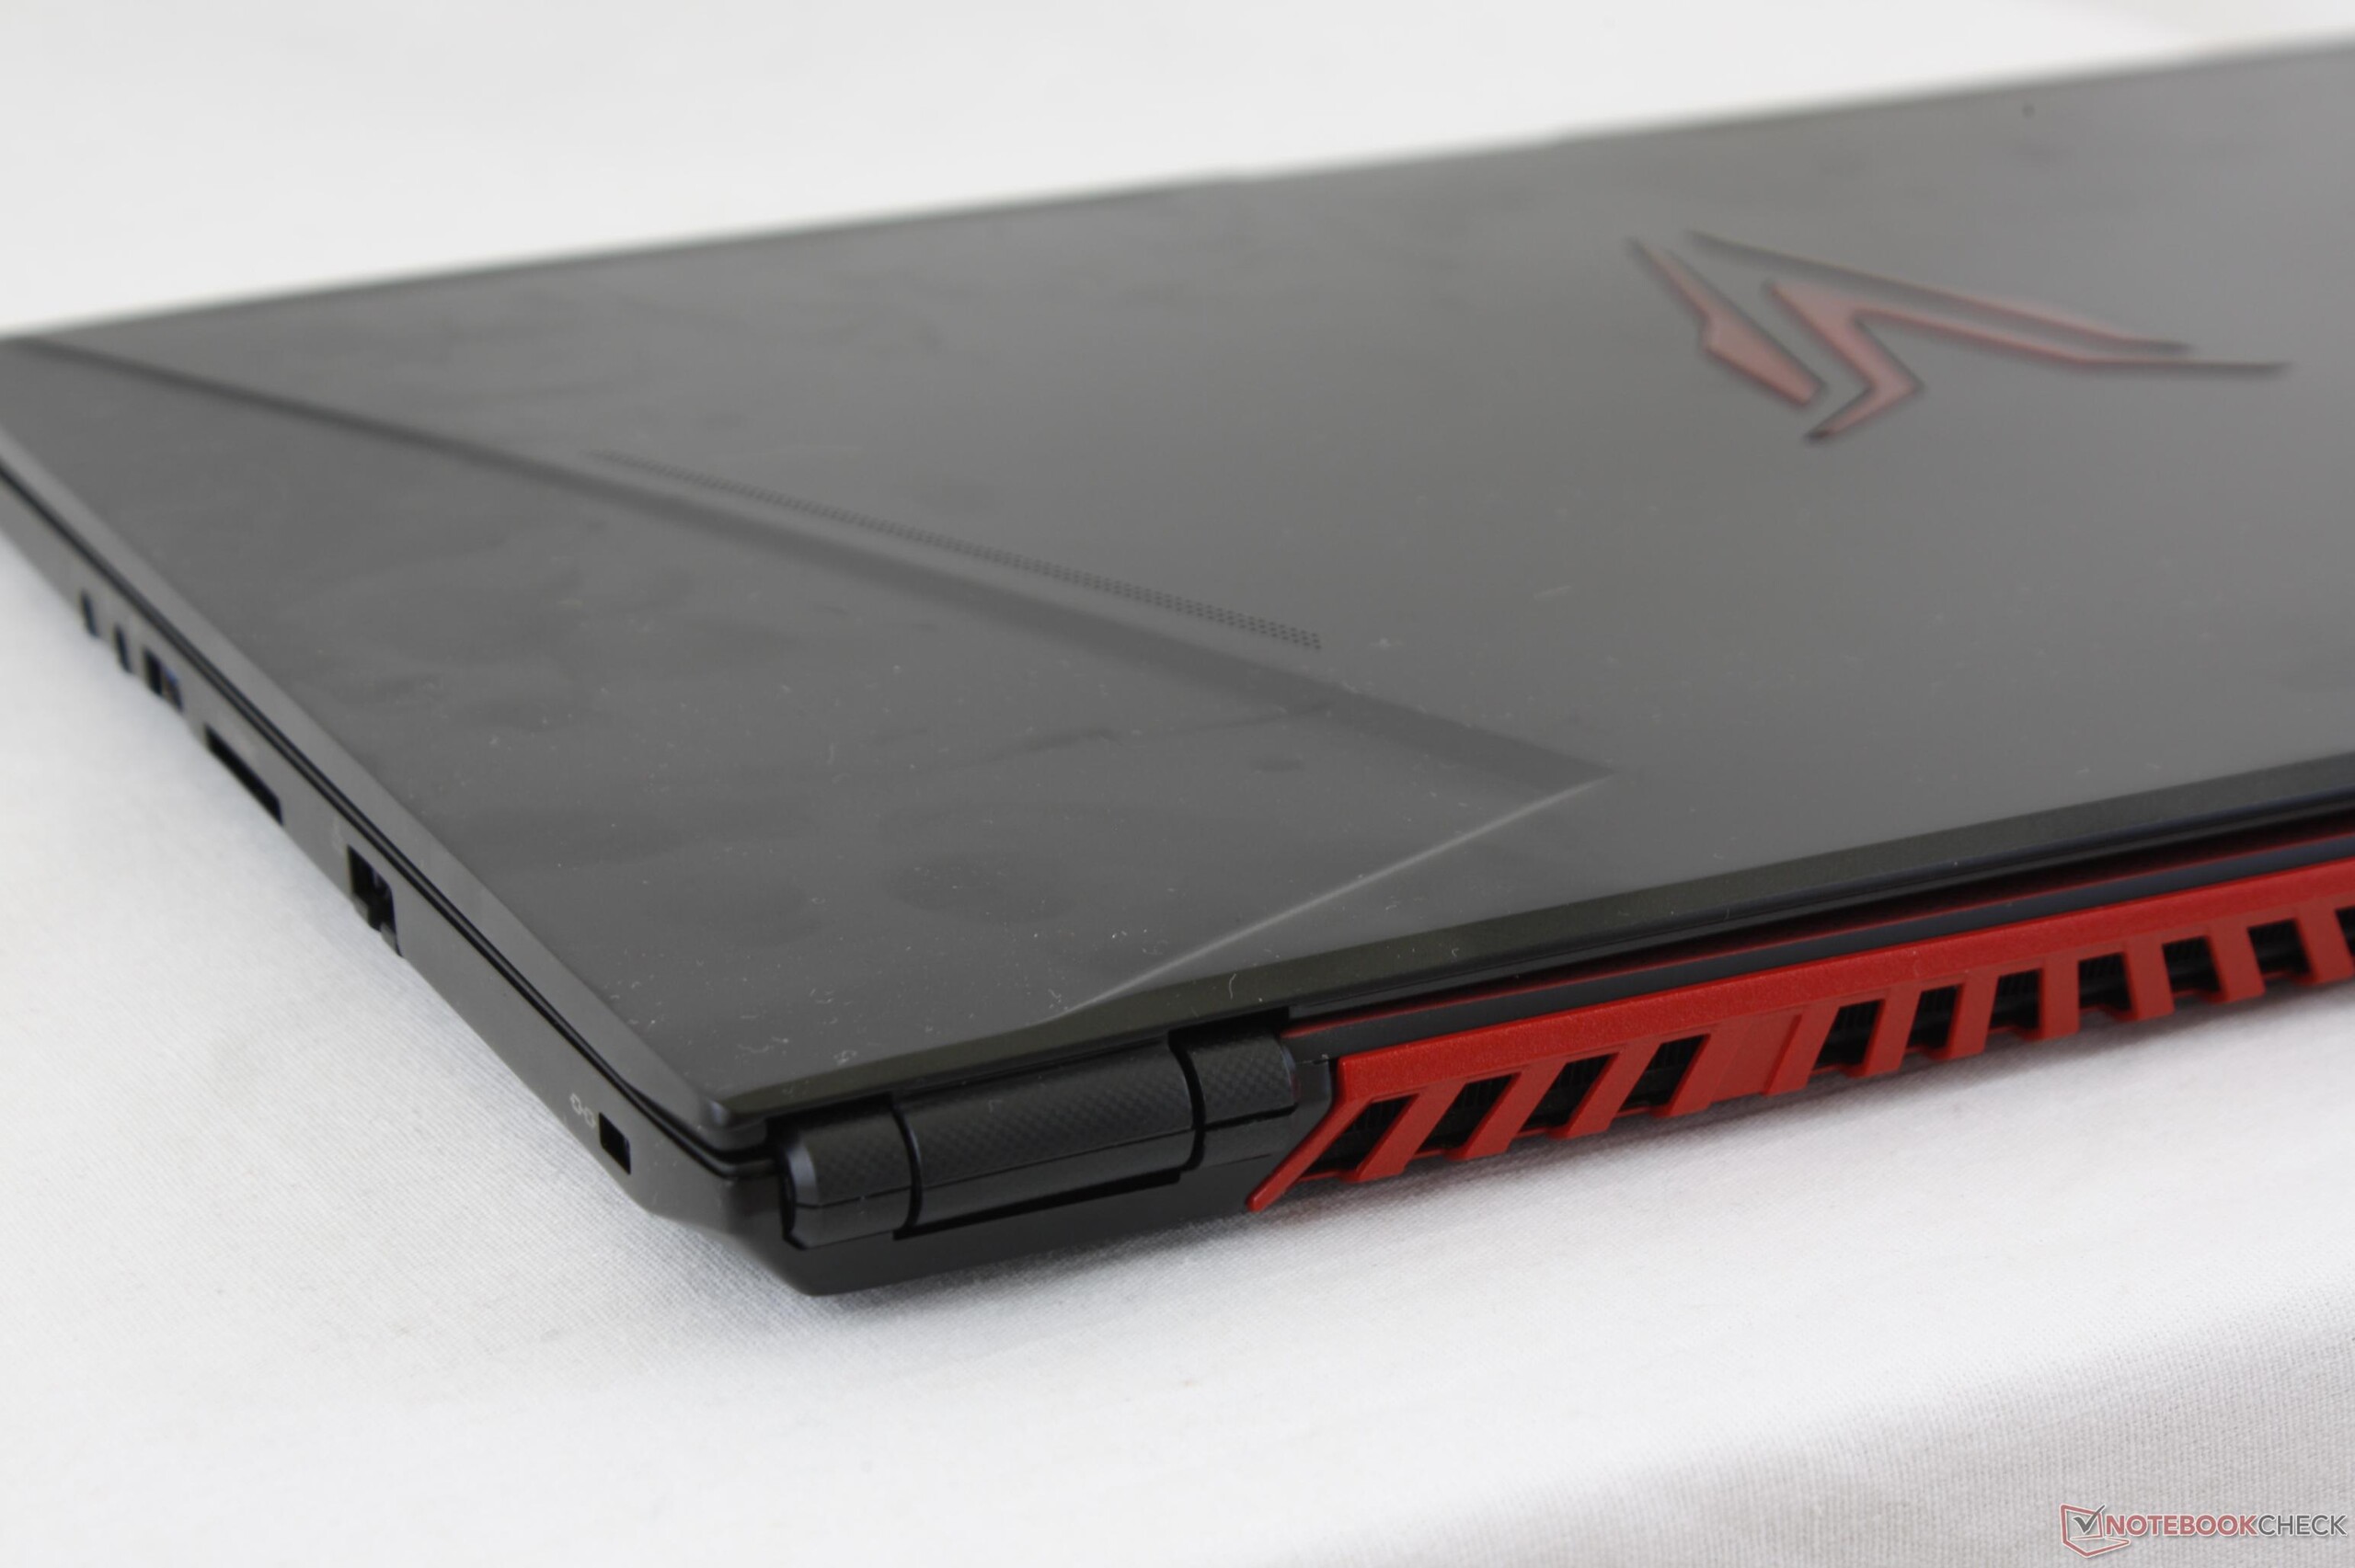
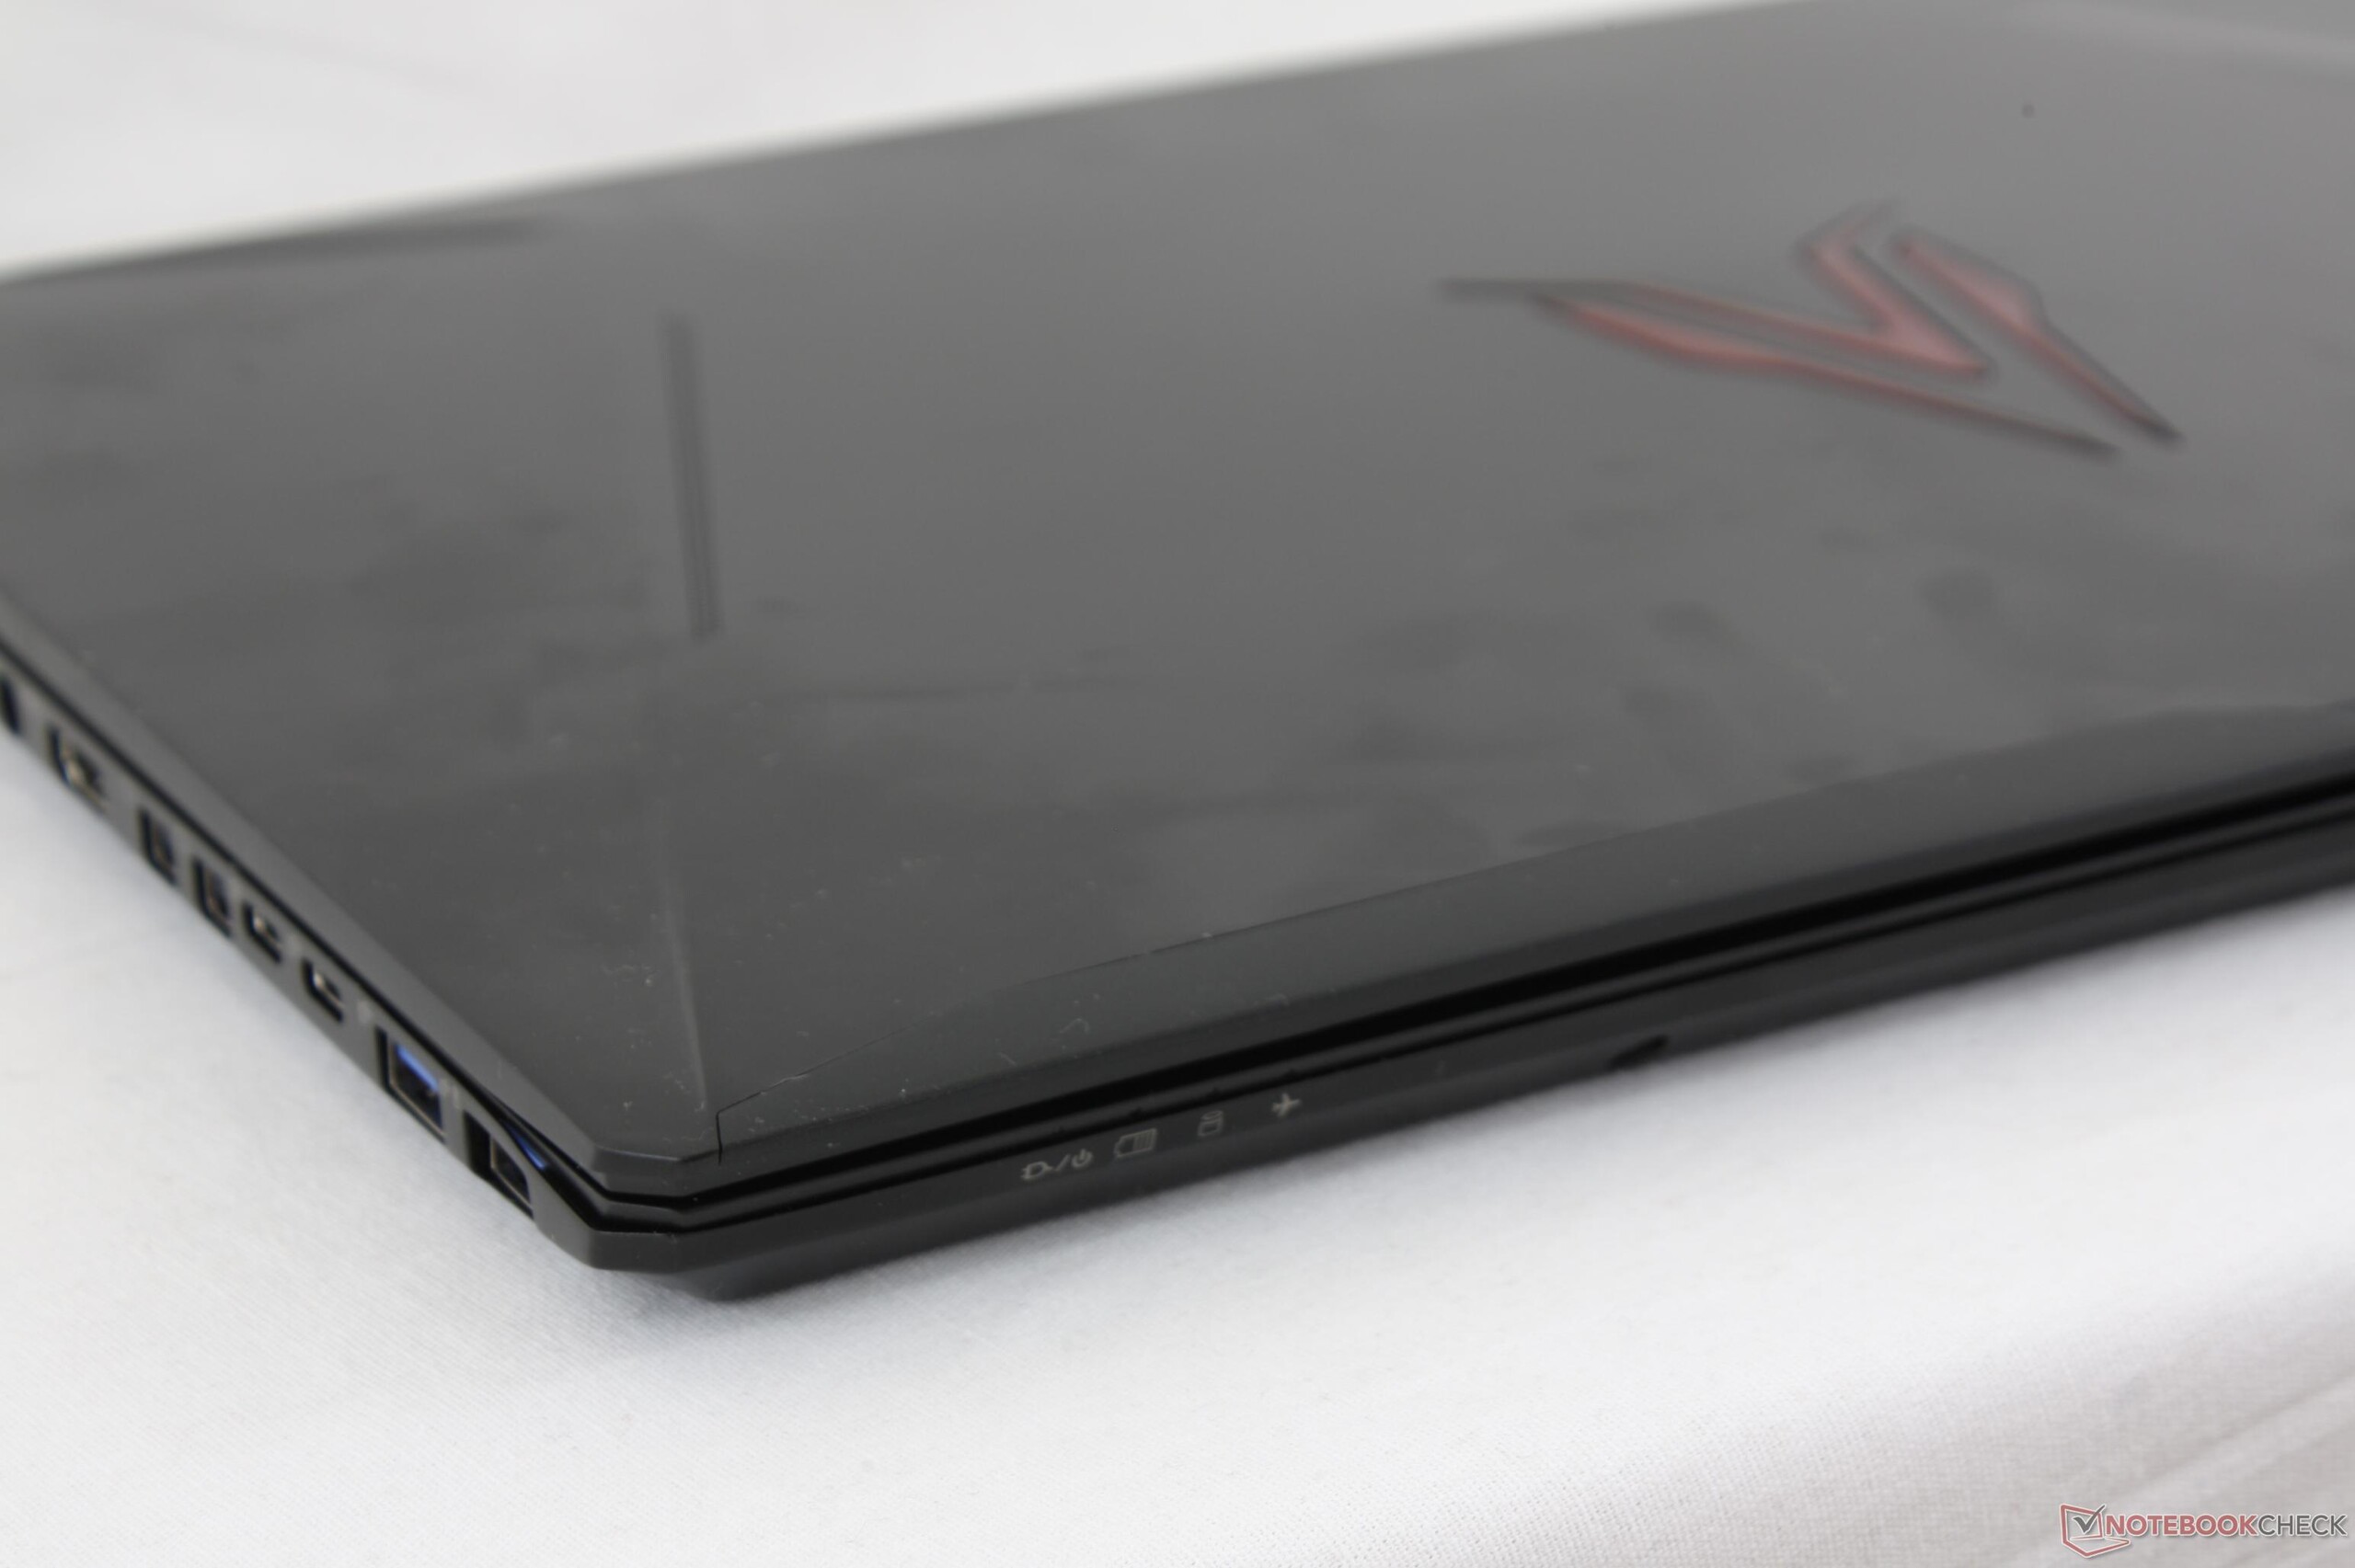
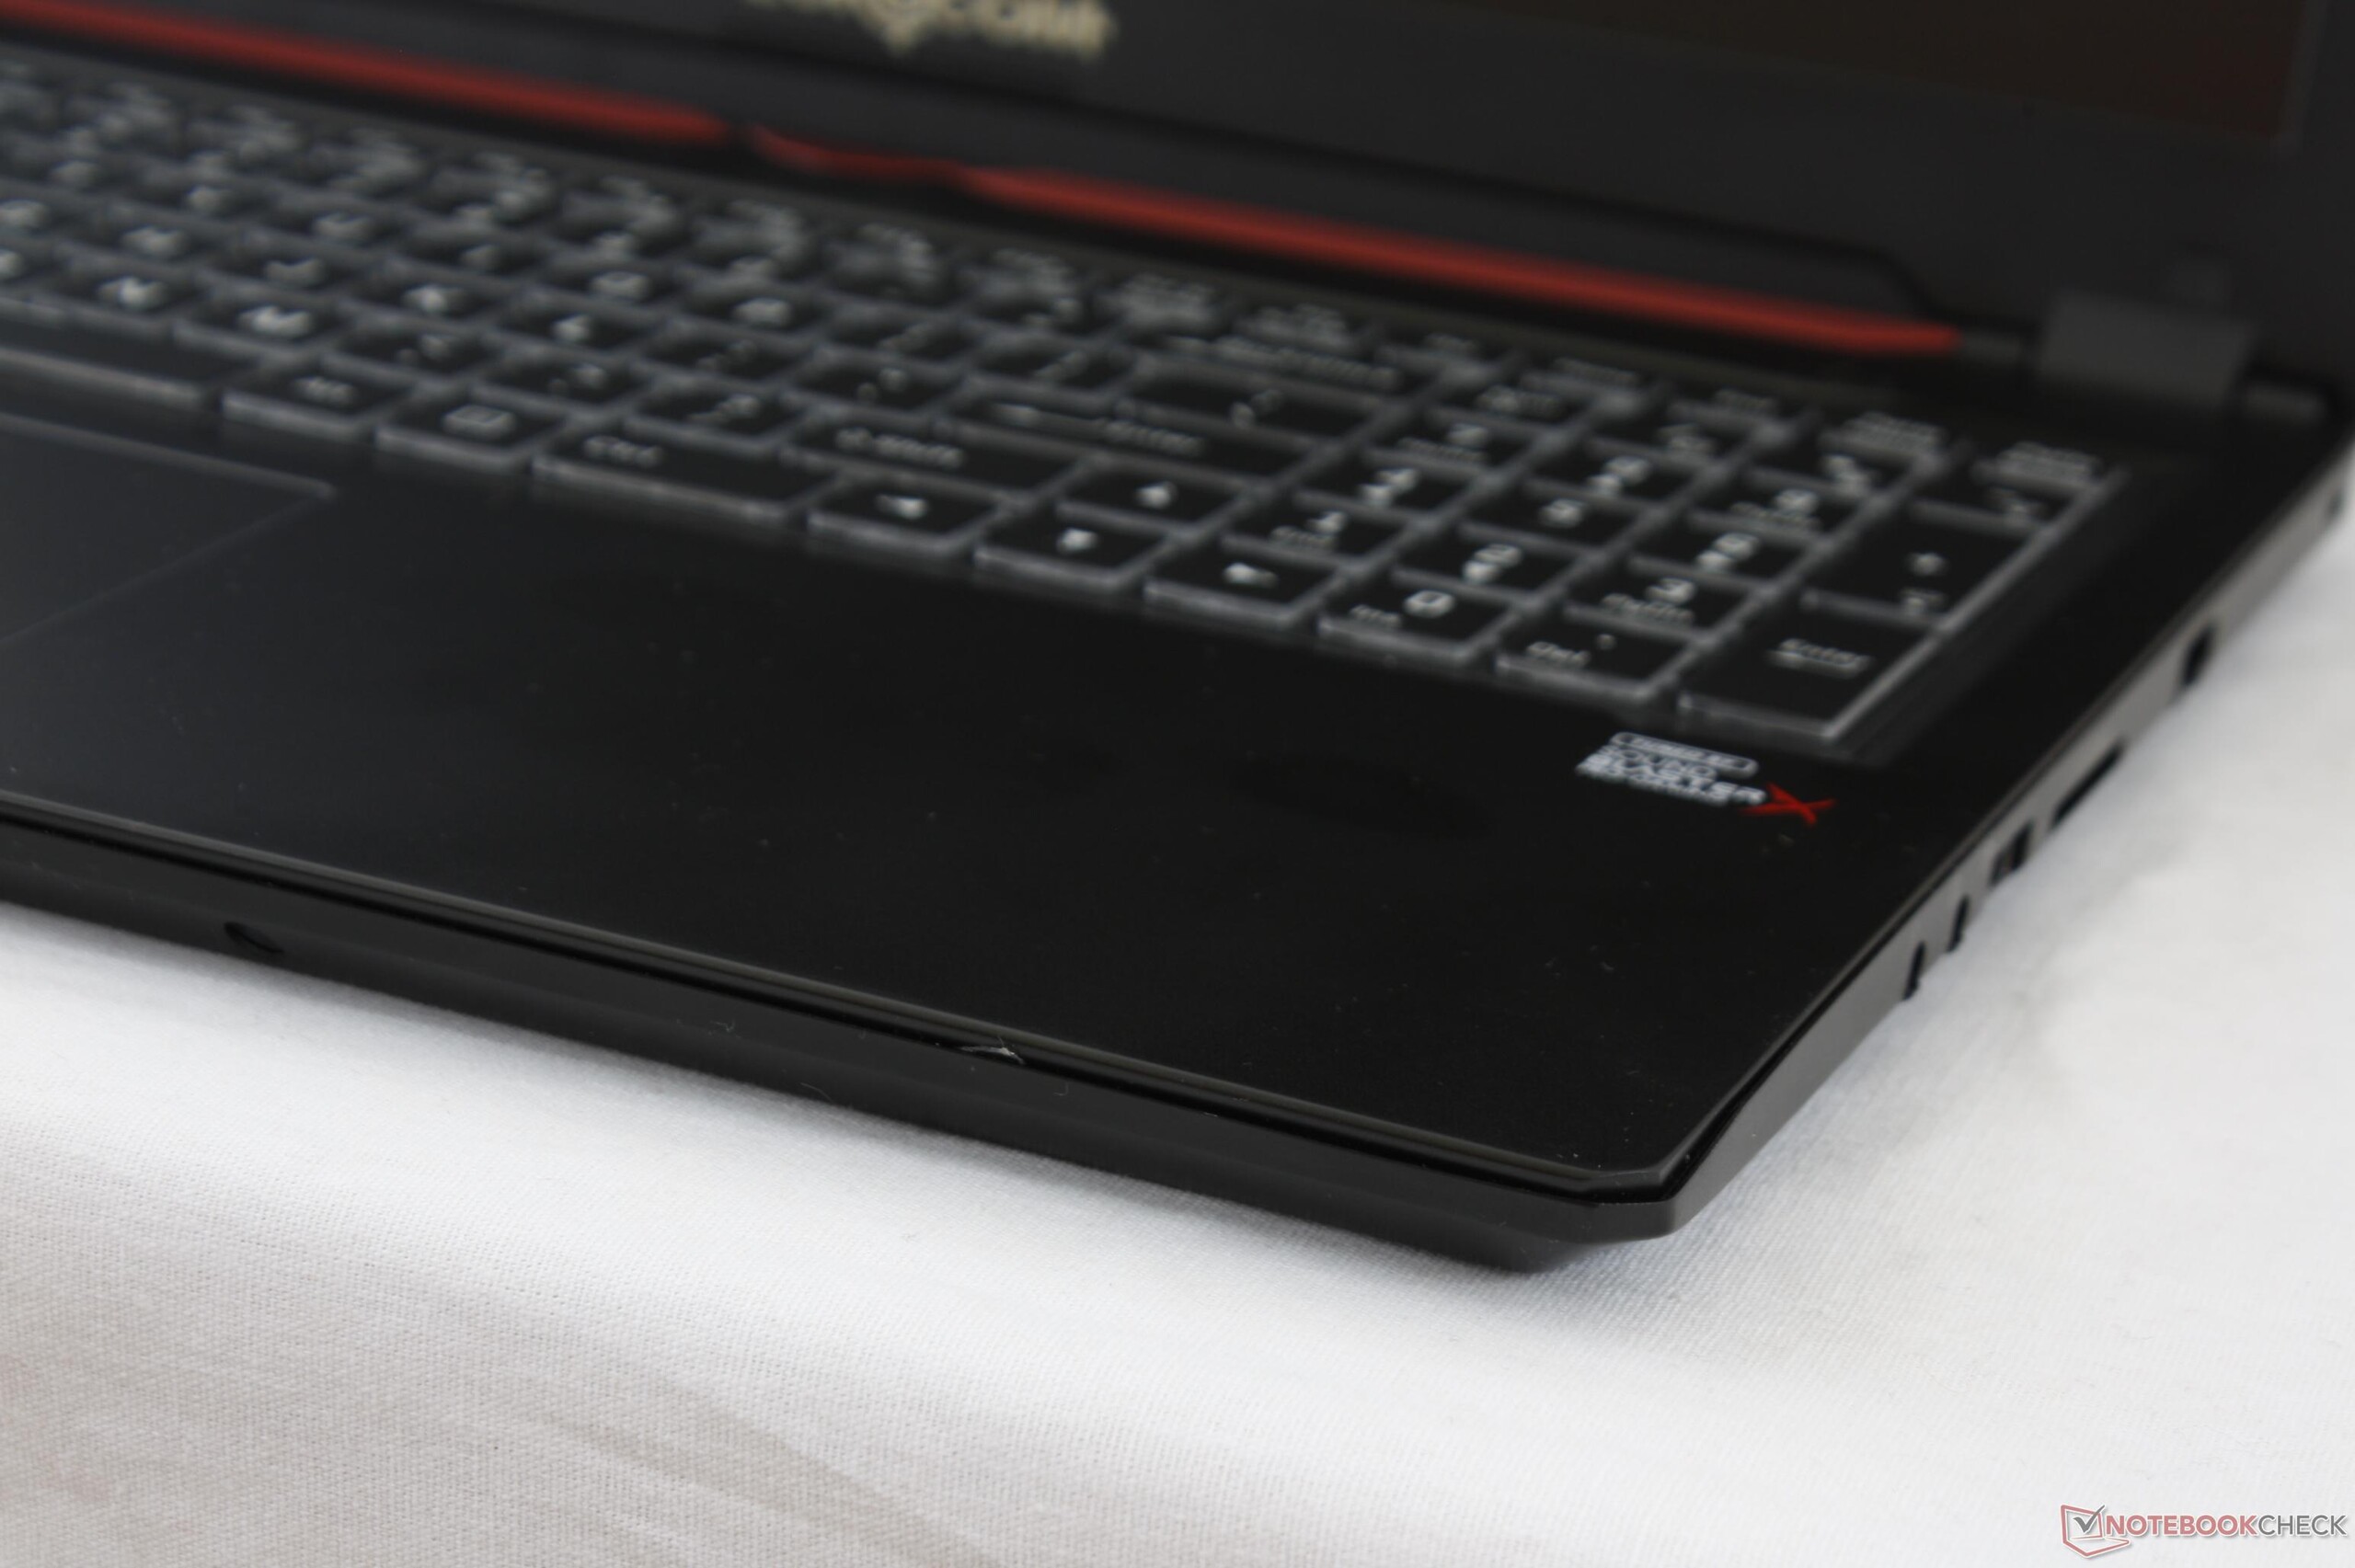
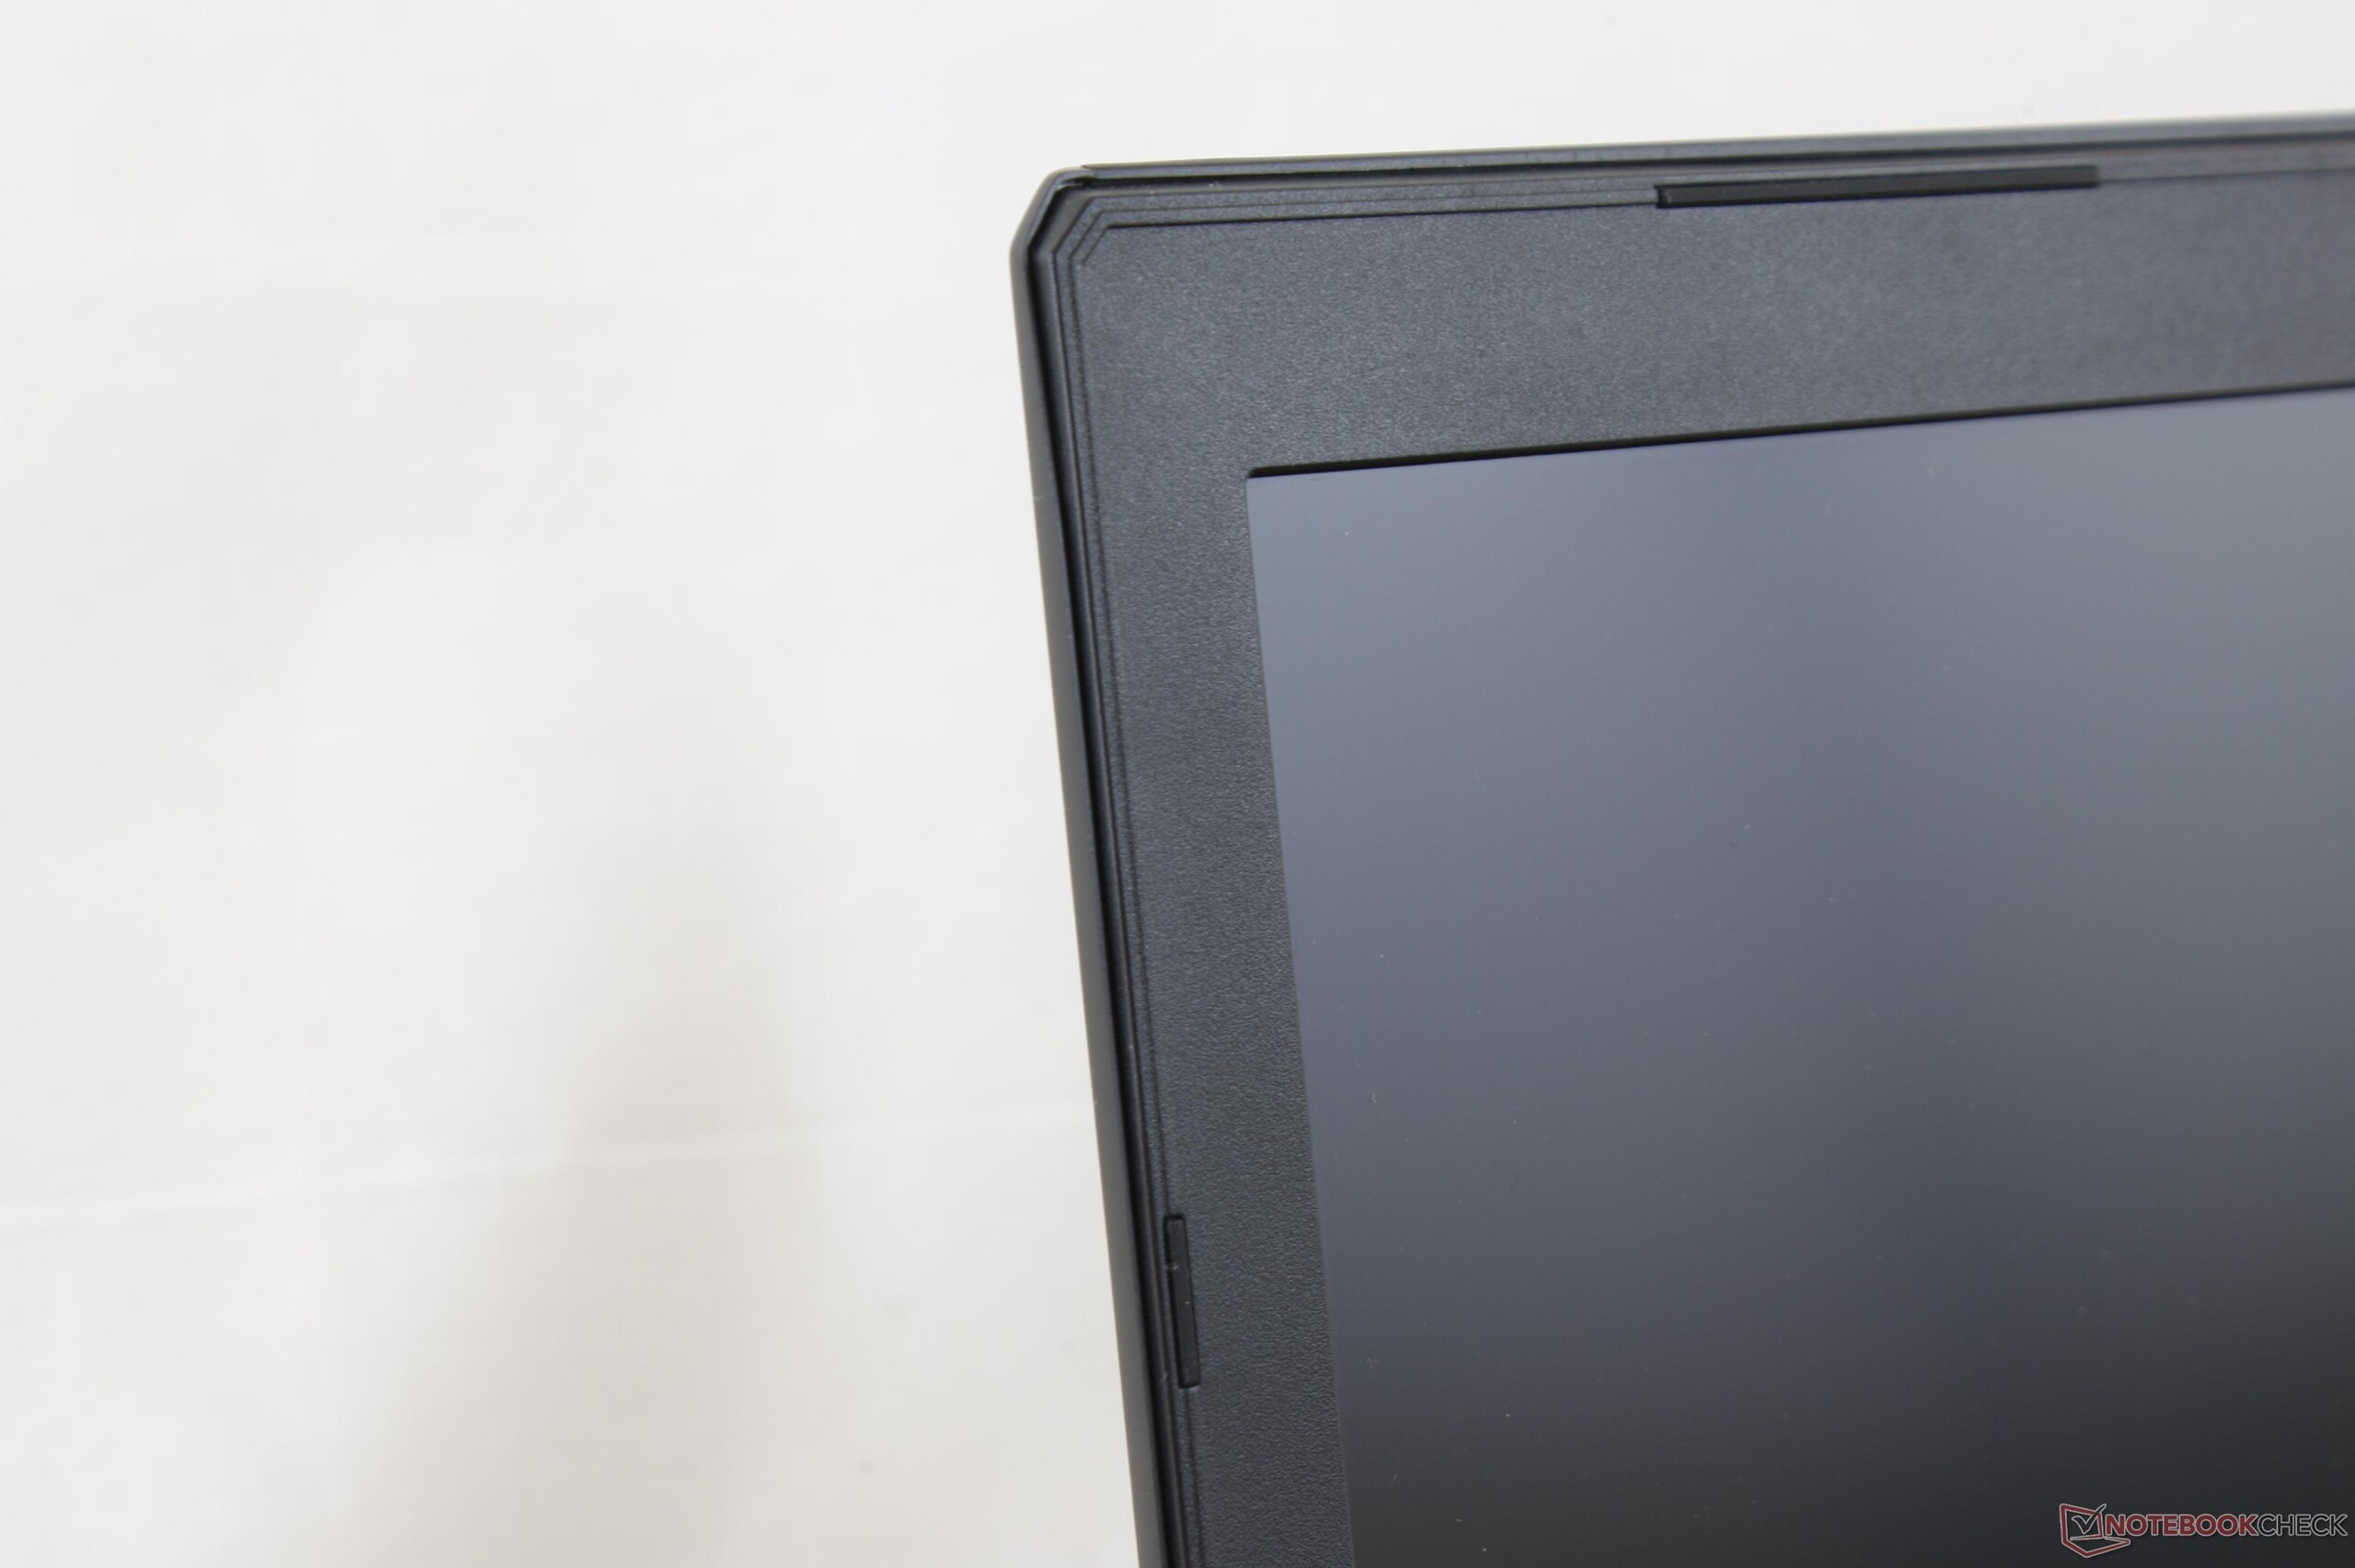
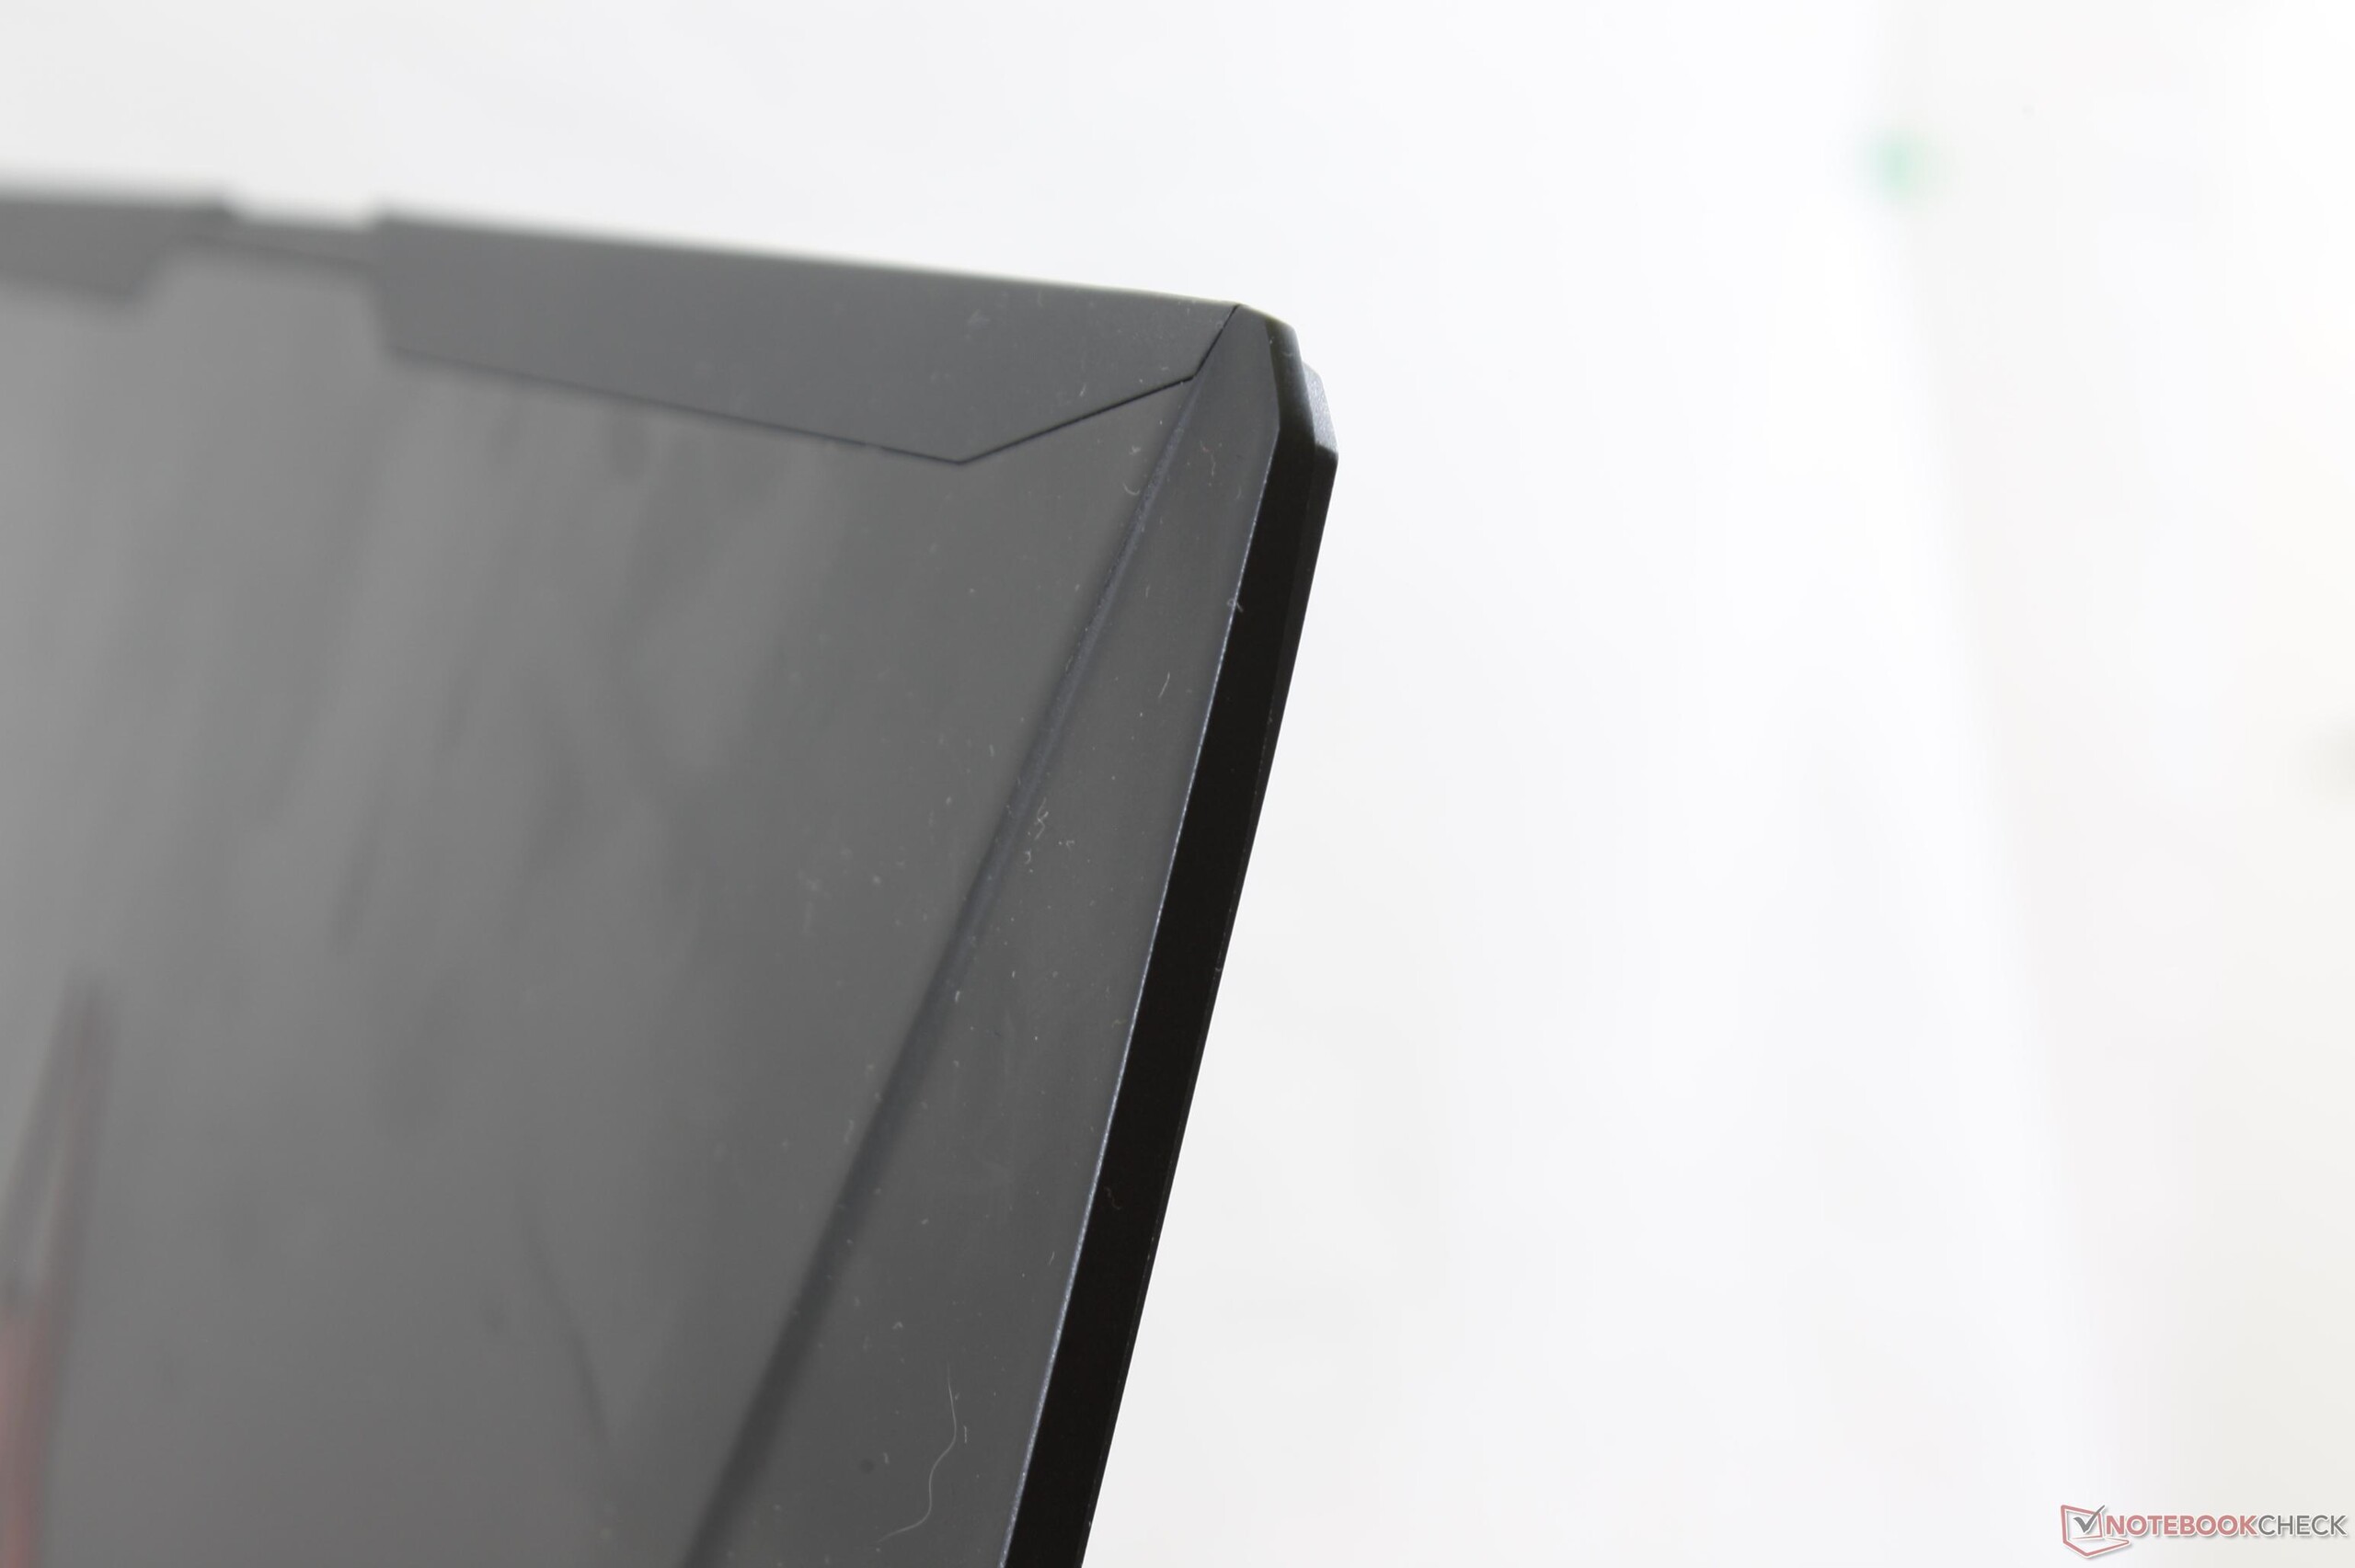
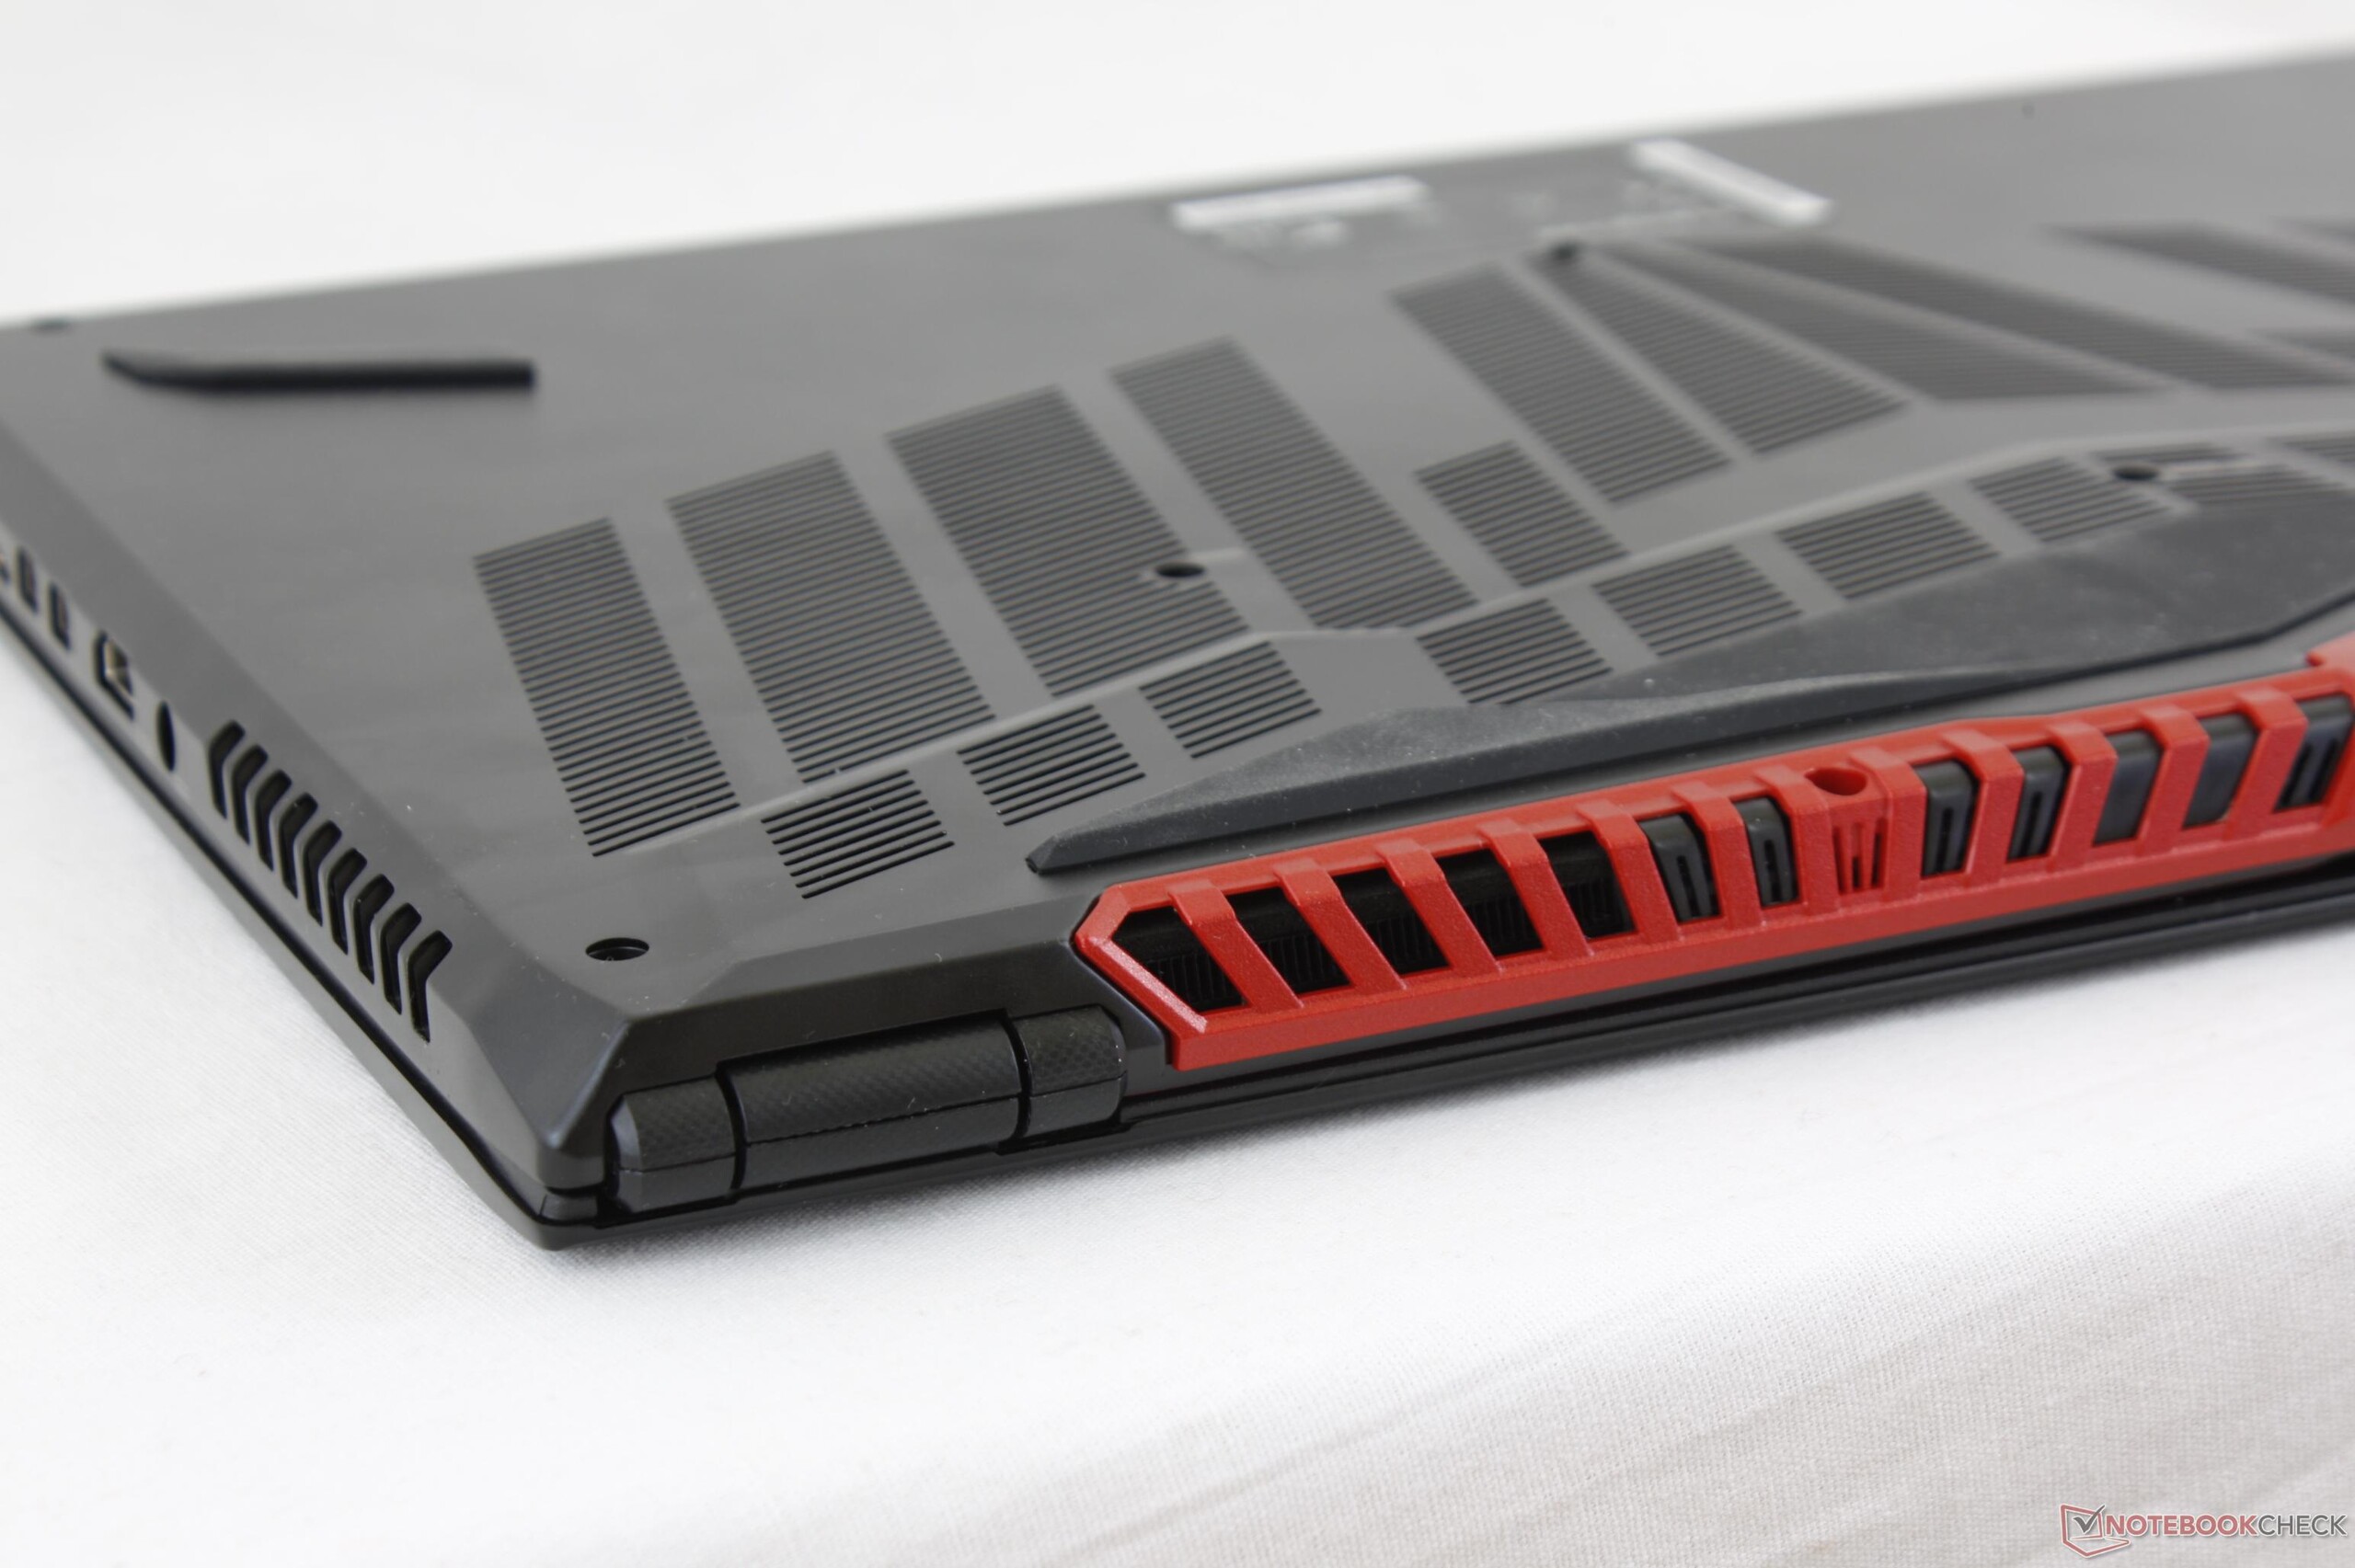
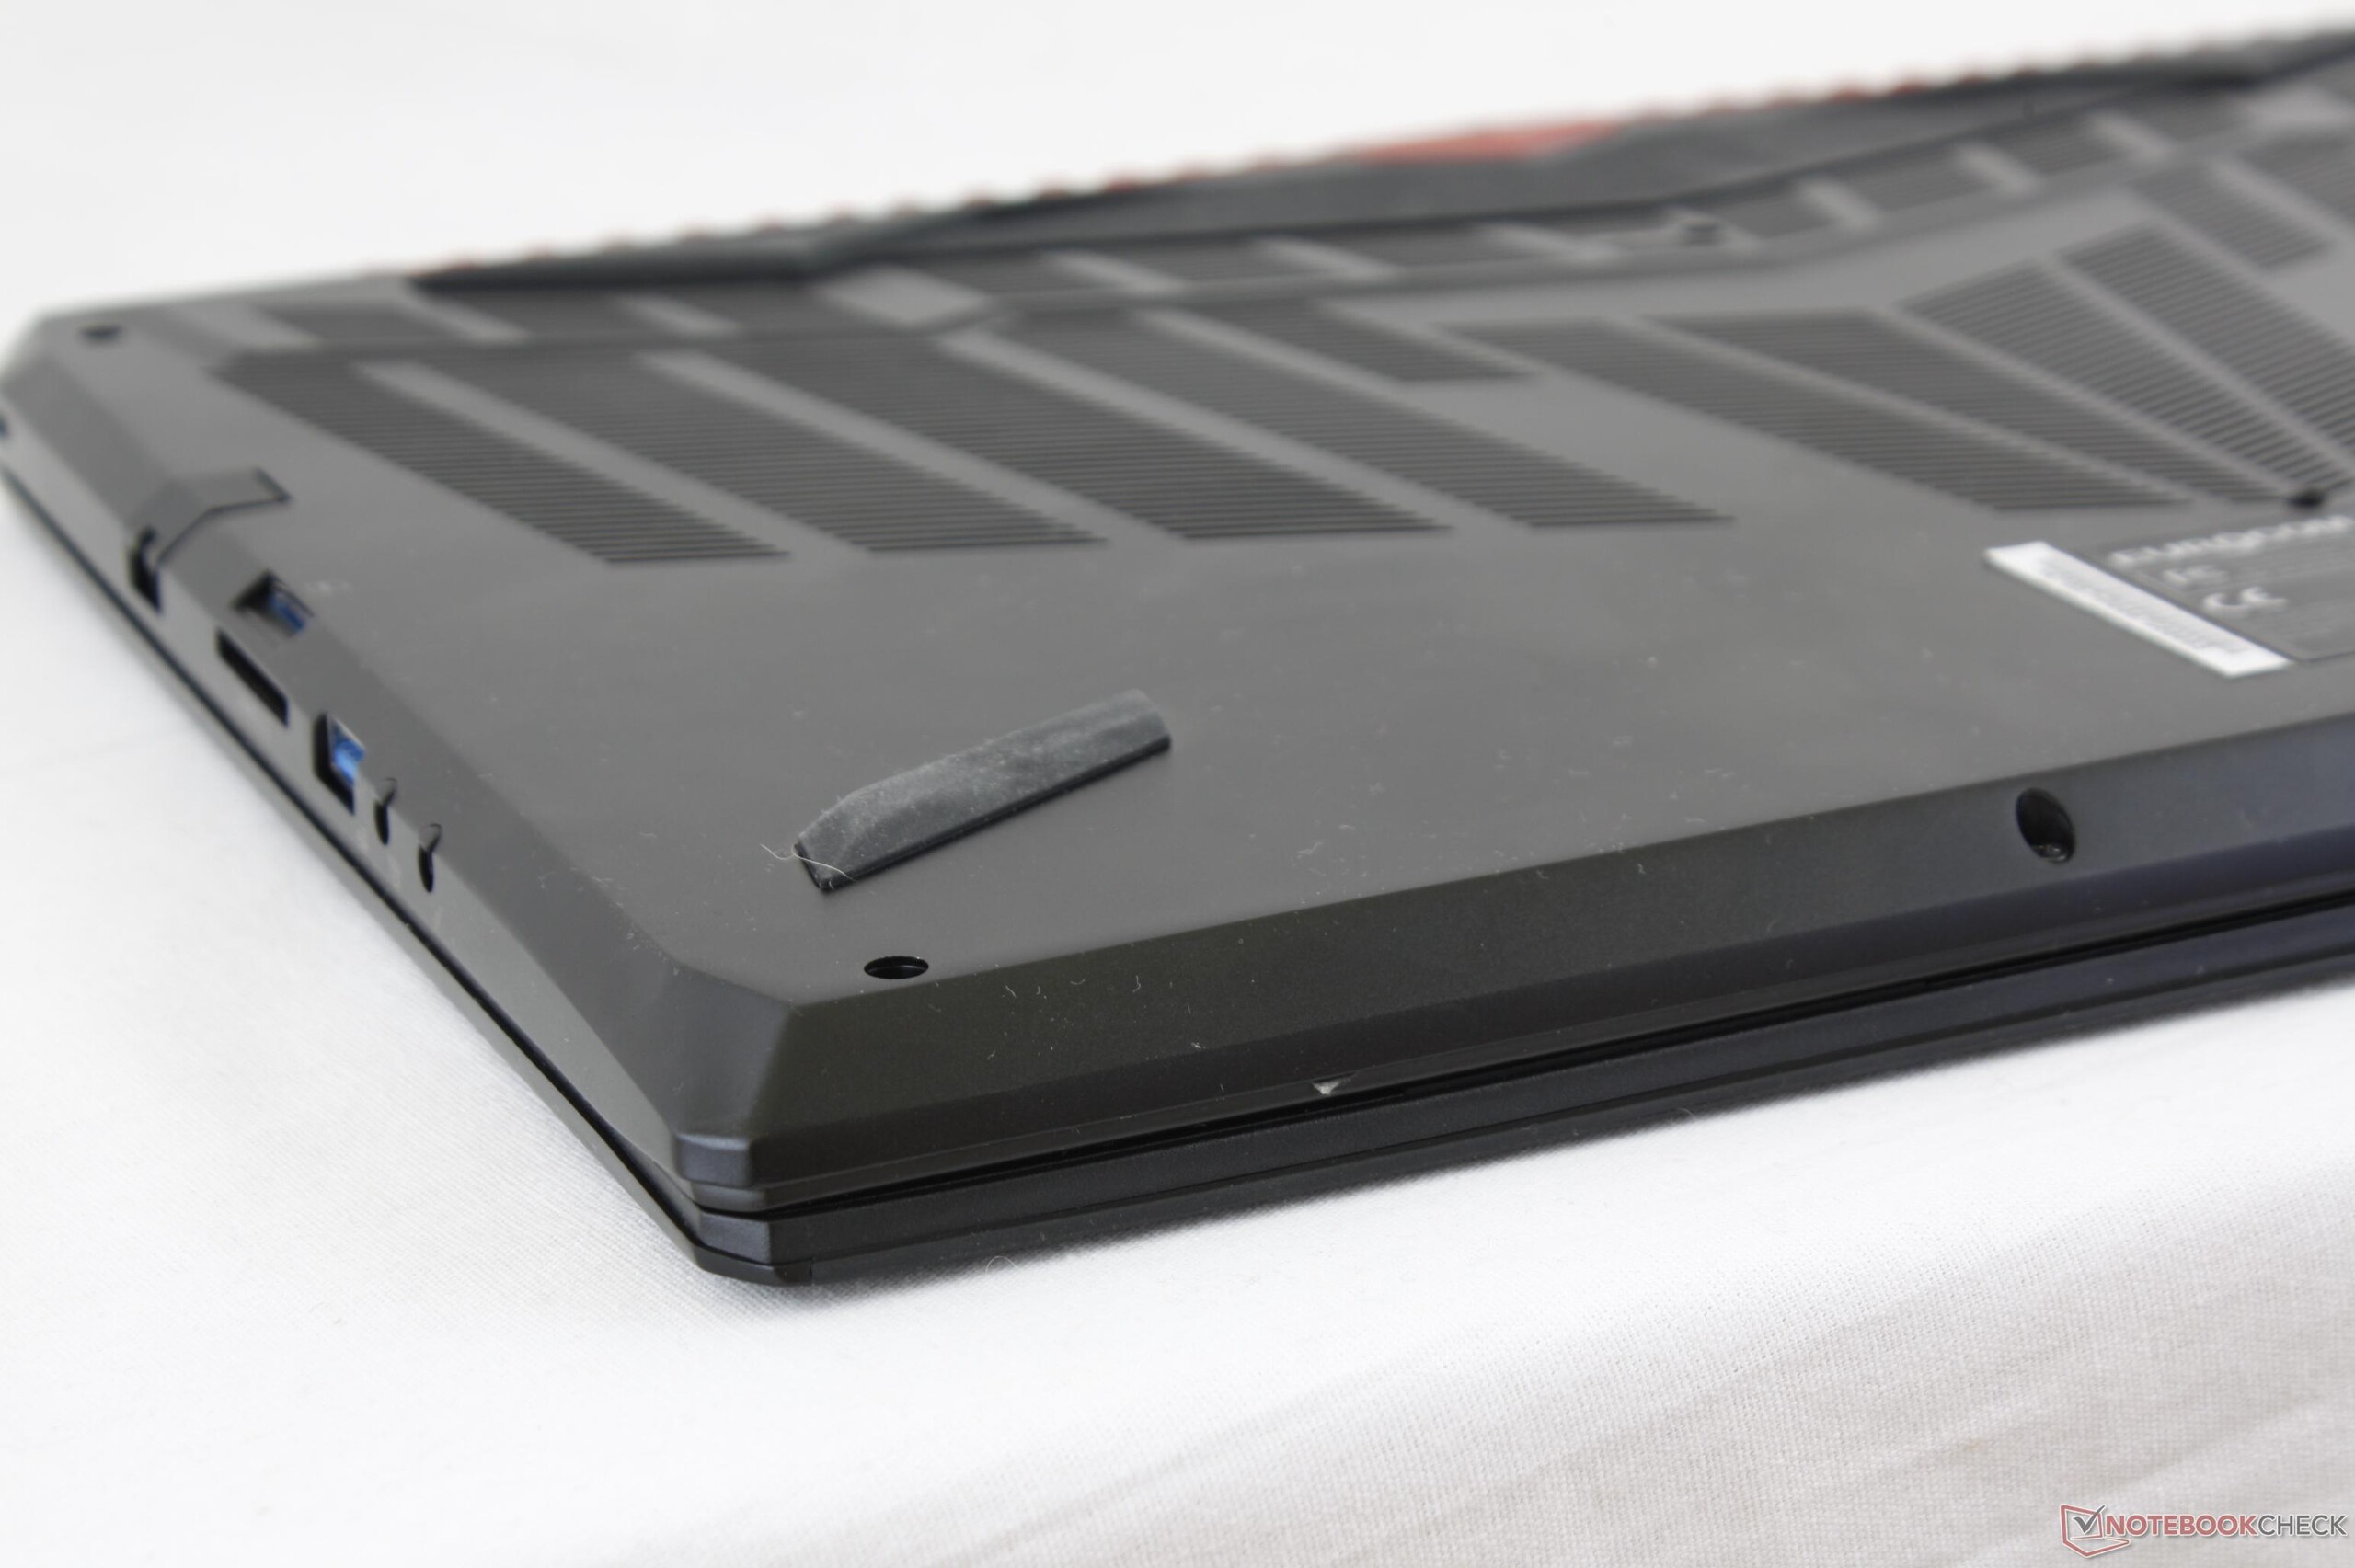
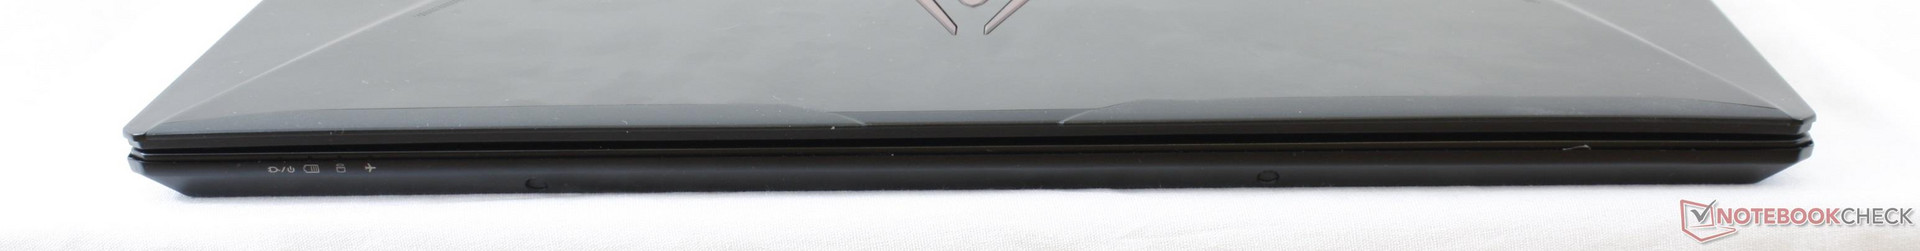
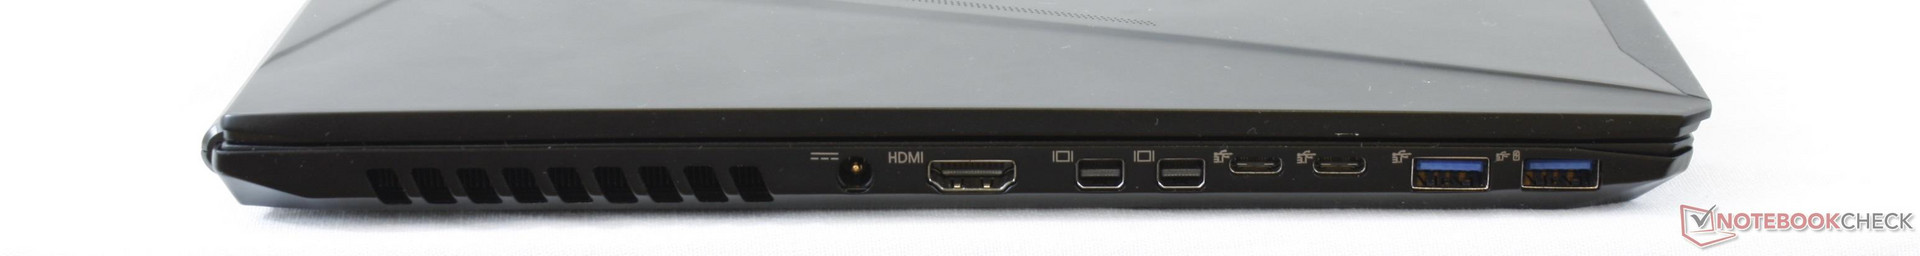
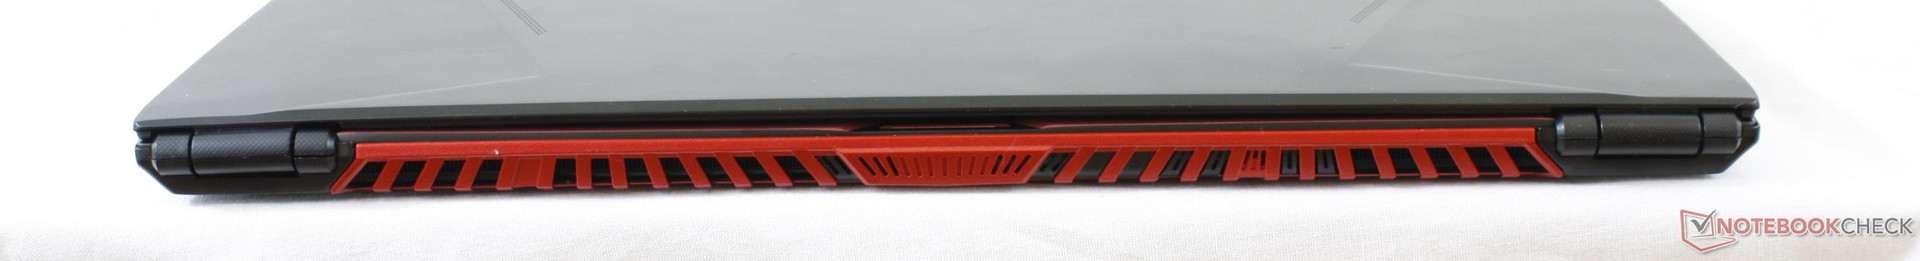
Recensione Breve del Portatile Eurocom Q5 (Clevo P957HR, i7-7700HQ, GTX 1070 Max-Q)


| SD Card Reader | |
| average JPG Copy Test (av. of 3 runs) | |
| Eurocom Q5 | |
| HP Omen 15-ce002ng | |
| MSI GS63VR-6RF16H22 Stealth Pro | |
| maximum AS SSD Seq Read Test (1GB) | |
| Eurocom Q5 | |
| HP Omen 15-ce002ng | |
| MSI GS63VR-6RF16H22 Stealth Pro | |
| Networking | |
| iperf3 transmit AX12 | |
| Alienware 15 R3 | |
| Eurocom Q5 | |
| Asus Zephyrus GX501VS | |
| iperf3 receive AX12 | |
| Alienware 15 R3 | |
| Eurocom Q5 | |
| Asus Zephyrus GX501VS | |
| |||||||||||||||||||||||||
Distribuzione della luminosità: 87 %
Al centro con la batteria: 287.5 cd/m²
Contrasto: 442:1 (Nero: 0.65 cd/m²)
ΔE ColorChecker Calman: 4.5 | ∀{0.5-29.43 Ø4.71}
ΔE Greyscale Calman: 4.6 | ∀{0.09-98 Ø4.96}
92.3% sRGB (Argyll 1.6.3 3D)
59% AdobeRGB 1998 (Argyll 1.6.3 3D)
64.4% AdobeRGB 1998 (Argyll 3D)
92.7% sRGB (Argyll 3D)
63% Display P3 (Argyll 3D)
Gamma: 2.39
CCT: 7393 K
| Eurocom Q5 ID: LGD04D4, Name: LG Philips LP156UD1-SPB1, IPS, 15.6", 3840x2160 | Asus Zephyrus GX501VS ID: AUO42ED, Name: AU Optronics B156HAN04.2, IPS, 15.6", 1920x1080 | HP Omen 15-ce002ng AUO42ED, IPS, 15.6", 1920x1080 | MSI GS63VR-6RF16H22 Stealth Pro Samsung 156HL01-104 (SDC324C) , IPS, 15.6", 1920x1080 | Gigabyte P56XT LG Philips LP156WF6 (LGD046F), IPS, 15.6", 1920x1080 | Alienware 15 R3 HPJGK_B156HTN (AUO51ED), TN, 15.6", 1920x1080 | |
|---|---|---|---|---|---|---|
| Display | -4% | 2% | 7% | -3% | 2% | |
| Display P3 Coverage (%) | 63 | 62.1 -1% | 65.8 4% | 67.8 8% | 64.8 3% | 66 5% |
| sRGB Coverage (%) | 92.7 | 85.6 -8% | 90.9 -2% | 97.4 5% | 84.6 -9% | 90.5 -2% |
| AdobeRGB 1998 Coverage (%) | 64.4 | 62.4 -3% | 66.5 3% | 69.7 8% | 61.8 -4% | 66.2 3% |
| Response Times | 1% | -21% | 10% | -1% | 41% | |
| Response Time Grey 50% / Grey 80% * (ms) | 32.4 ? | 33.2 ? -2% | 43.2 ? -33% | 37.2 ? -15% | 25 ? 23% | |
| Response Time Black / White * (ms) | 28.8 ? | 28 ? 3% | 31.2 ? -8% | 26 ? 10% | 24.8 ? 14% | 12 ? 58% |
| PWM Frequency (Hz) | 202 ? | 20000 ? | ||||
| Screen | 25% | 32% | 23% | 6% | -11% | |
| Brightness middle (cd/m²) | 287.5 | 307.1 7% | 304 6% | 293 2% | 301 5% | 386 34% |
| Brightness (cd/m²) | 279 | 309 11% | 289 4% | 279 0% | 280 0% | 382 37% |
| Brightness Distribution (%) | 87 | 86 -1% | 86 -1% | 84 -3% | 87 0% | 93 7% |
| Black Level * (cd/m²) | 0.65 | 0.35 46% | 0.26 60% | 0.33 49% | 0.32 51% | 0.39 40% |
| Contrast (:1) | 442 | 877 98% | 1169 164% | 888 101% | 941 113% | 990 124% |
| Colorchecker dE 2000 * | 4.5 | 3.4 24% | 3.46 23% | 3.59 20% | 6.21 -38% | 10.2 -127% |
| Colorchecker dE 2000 max. * | 8.9 | 8.2 8% | 7.72 13% | 5.79 35% | 10.78 -21% | 15.81 -78% |
| Greyscale dE 2000 * | 4.6 | 1.4 70% | 2.46 47% | 3.86 16% | 6.08 -32% | 11.28 -145% |
| Gamma | 2.39 92% | 2.19 100% | 2.38 92% | 2.53 87% | 2.31 95% | 2.23 99% |
| CCT | 7393 88% | 6558 99% | 6915 94% | 7229 90% | 7375 88% | 11383 57% |
| Color Space (Percent of AdobeRGB 1998) (%) | 59 | 55.6 -6% | 59 0% | 63 7% | 55 -7% | 59 0% |
| Color Space (Percent of sRGB) (%) | 92.3 | 85 -8% | 91 -1% | 97 5% | 84 -9% | 90 -2% |
| Media totale (Programma / Settaggio) | 7% /
16% | 4% /
19% | 13% /
19% | 1% /
3% | 11% /
-2% |
* ... Meglio usare valori piccoli
Tempi di risposta del Display
| ↔ Tempi di risposta dal Nero al Bianco | ||
|---|---|---|
| 28.8 ms ... aumenta ↗ e diminuisce ↘ combinato | ↗ 18.8 ms Incremento | 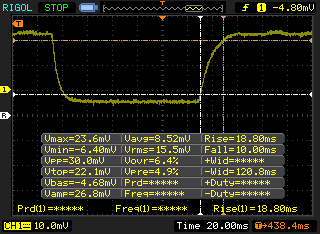 |
| ↘ 10 ms Calo | ||
| Lo schermo mostra tempi di risposta relativamente lenti nei nostri tests e potrebbe essere troppo lento per i gamers. In confronto, tutti i dispositivi di test variano da 0.1 (minimo) a 240 (massimo) ms. » 76 % di tutti i dispositivi è migliore. Questo significa che i tempi di risposta rilevati sono peggiori rispetto alla media di tutti i dispositivi testati (19.8 ms). | ||
| ↔ Tempo di risposta dal 50% Grigio all'80% Grigio | ||
| 32.4 ms ... aumenta ↗ e diminuisce ↘ combinato | ↗ 16 ms Incremento | 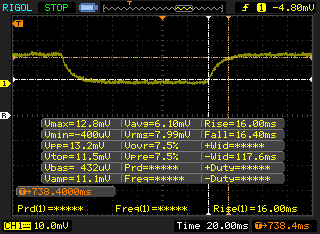 |
| ↘ 16.4 ms Calo | ||
| Lo schermo mostra tempi di risposta lenti nei nostri tests e sarà insoddisfacente per i gamers. In confronto, tutti i dispositivi di test variano da 0.165 (minimo) a 636 (massimo) ms. » 44 % di tutti i dispositivi è migliore. Questo significa che i tempi di risposta rilevati sono simili alla media di tutti i dispositivi testati (31 ms). | ||
Sfarfallio dello schermo / PWM (Pulse-Width Modulation)
| flickering dello schermo / PWM non rilevato | 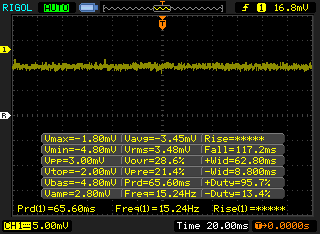 | ||
In confronto: 52 % di tutti i dispositivi testati non utilizza PWM per ridurre la luminosita' del display. Se è rilevato PWM, una media di 7754 (minimo: 5 - massimo: 343500) Hz è stata rilevata. | |||
| wPrime 2.10 - 1024m | |
| Lenovo IdeaPad Y50 | |
| Eurocom Q5 | |
| EVGA SC17 GTX 1070 | |
| Asus Zephyrus GX501VS | |
| Gigabyte P55 V4 | |
| Eurocom Tornado F5 | |
* ... Meglio usare valori piccoli
| PCMark 8 | |
| Home Score Accelerated v2 | |
| Eurocom Tornado F5 | |
| Asus Zephyrus GX501VS | |
| MSI GS63VR-6RF16H22 Stealth Pro | |
| Eurocom Q5 | |
| Work Score Accelerated v2 | |
| Eurocom Tornado F5 | |
| Asus Zephyrus GX501VS | |
| Eurocom Q5 | |
| MSI GS63VR-6RF16H22 Stealth Pro | |
| Creative Score Accelerated v2 | |
| Eurocom Tornado F5 | |
| Asus Zephyrus GX501VS | |
| MSI GS63VR-6RF16H22 Stealth Pro | |
| Eurocom Q5 | |
| PCMark 8 Home Score Accelerated v2 | 3829 punti | |
| PCMark 8 Creative Score Accelerated v2 | 4926 punti | |
| PCMark 8 Work Score Accelerated v2 | 4891 punti | |
| PCMark 10 Score | 5119 punti | |
Aiuto | ||
| Eurocom Q5 Samsung SSD 960 Pro 512 GB m.2 | Asus Zephyrus GX501VS Samsung SM961 MZVPW256HEGL | EVGA SC17 GTX 1070 Samsung SM951 MZVPV256 m.2 | Eurocom Tornado F5 Samsung SSD 960 Pro 512 GB m.2 | Alienware 17 R4 SK Hynix PC300 NVMe 512 GB | |
|---|---|---|---|---|---|
| AS SSD | -5% | -22% | 17% | -53% | |
| Copy Game MB/s (MB/s) | 682 | 719 5% | 1034 52% | 1310 92% | 574 -16% |
| Copy Program MB/s (MB/s) | 301.5 | 383.3 27% | 470 56% | 635 111% | 446.1 48% |
| Copy ISO MB/s (MB/s) | 1967 | 1795 -9% | 1337 -32% | 1614 -18% | 1227 -38% |
| Score Total (Points) | 4001 | 3995 0% | 2328 -42% | 3943 -1% | 2072 -48% |
| Score Write (Points) | 1705 | 1293 -24% | 487 -71% | 1689 -1% | 858 -50% |
| Score Read (Points) | 1529 | 1818 19% | 1238 -19% | 1512 -1% | 831 -46% |
| Access Time Write * (ms) | 0.028 | 0.032 -14% | 0.033 -18% | 0.024 14% | 0.123 -339% |
| Access Time Read * (ms) | 0.036 | 0.047 -31% | 0.049 -36% | 0.03 17% | 0.042 -17% |
| 4K-64 Write (MB/s) | 1366 | 1035 -24% | 260.9 -81% | 1334 -2% | 671 -51% |
| 4K-64 Read (MB/s) | 1231 | 1527 24% | 999 -19% | 1179 -4% | 620 -50% |
| 4K Write (MB/s) | 136.2 | 117.3 -14% | 112.1 -18% | 150.5 10% | 113.4 -17% |
| 4K Read (MB/s) | 49.3 | 50.2 2% | 45.64 -7% | 51 3% | 35.61 -28% |
| Seq Write (MB/s) | 2029 | 1409 -31% | 1144 -44% | 2046 1% | 735 -64% |
| Seq Read (MB/s) | 2493 | 2412 -3% | 1934 -22% | 2819 13% | 1752 -30% |
* ... Meglio usare valori piccoli

| 3DMark | |
| 1920x1080 Fire Strike Graphics | |
| MSI GT75VR 7RF-012 Titan Pro | |
| Asus Zephyrus GX501 | |
| Asus Zephyrus GX501VS | |
| Eurocom Q5 | |
| Nvidia GeForce GTX 1060 Founders Edition 6 GB | |
| HP Omen 15-ce002ng | |
| Eurocom P5 Pro Extreme | |
| MSI GP62 7REX-1045US | |
| Dell Inspiron 15 7000 7567 Gaming (Core i5-7300HQ, GTX 1050) | |
| 3840x2160 Fire Strike Ultra Graphics | |
| Asus Zephyrus GX501 | |
| Asus Zephyrus GX501VS | |
| Eurocom Q5 | |
| Nvidia GeForce GTX 1060 Founders Edition 6 GB | |
| MSI GP62 7REX-1045US | |
| Dell Inspiron 15 7000 7567 Gaming (Core i5-7300HQ, GTX 1050) | |
| 3DMark 11 | |
| 1280x720 Performance GPU | |
| MSI GT75VR 7RF-012 Titan Pro | |
| Asus Zephyrus GX501 | |
| Asus Zephyrus GX501VS | |
| Eurocom Q5 | |
| Nvidia GeForce GTX 1060 Founders Edition 6 GB | |
| HP Omen 15-ce002ng | |
| Eurocom P5 Pro Extreme | |
| MSI GP62 7REX-1045US | |
| Dell Inspiron 15 7000 7567 Gaming (Core i5-7300HQ, GTX 1050) | |
| 1280x720 Performance Combined | |
| Nvidia GeForce GTX 1060 Founders Edition 6 GB | |
| MSI GT75VR 7RF-012 Titan Pro | |
| Eurocom P5 Pro Extreme | |
| Eurocom Q5 | |
| Asus Zephyrus GX501VS | |
| HP Omen 15-ce002ng | |
| Asus Zephyrus GX501 | |
| MSI GP62 7REX-1045US | |
| Dell Inspiron 15 7000 7567 Gaming (Core i5-7300HQ, GTX 1050) | |
| 3DMark 11 Performance | 14947 punti | |
| 3DMark Cloud Gate Standard Score | 25659 punti | |
| 3DMark Fire Strike Score | 12028 punti | |
| 3DMark Fire Strike Extreme Score | 6354 punti | |
Aiuto | ||
| Rise of the Tomb Raider - 1920x1080 Very High Preset AA:FX AF:16x | |
| Aorus X7 DT v6 | |
| Asus Zephyrus GX501 | |
| MSI Gaming Z GeForce GTX 1070 OC Bios Desktop PC | |
| Eurocom Sky MX5 R3 | |
| Asus Zephyrus GX501VS | |
| Eurocom Q5 | |
| MSI GS43VR 7RE-069US | |
| Asus Strix GL502VY-DS71 | |
| HP Omen 15-ce002ng | |
| Asus Strix GL502VT-DS74 | |
| BioShock Infinite - 1920x1080 Ultra Preset, DX11 (DDOF) | |
| Aorus X7 DT v6 | |
| MSI Gaming Z GeForce GTX 1070 OC Bios Desktop PC | |
| Aorus X7 v7 | |
| Eurocom Sky MX5 R3 | |
| Asus Zephyrus GX501VS | |
| Eurocom Q5 | |
| MSI GS43VR 7RE-069US | |
| Asus Strix GL502VY-DS71 | |
| Asus Strix GL502VT-DS74 | |
| Fallout 4 - 1920x1080 Ultra Preset AA:T AF:16x | |
| Aorus X7 DT v6 | |
| MSI Gaming Z GeForce GTX 1070 OC Bios Desktop PC | |
| Eurocom Sky MX5 R3 | |
| Asus Zephyrus GX501VS | |
| Eurocom Q5 | |
| MSI GS43VR 7RE-069US | |
| Asus Strix GL502VY-DS71 | |
| Asus Strix GL502VT-DS74 | |
| basso | medio | alto | ultra | 4K | |
|---|---|---|---|---|---|
| Guild Wars 2 (2012) | 62.2 | ||||
| BioShock Infinite (2013) | 130.5 | ||||
| Metro: Last Light (2013) | 96.5 | ||||
| Thief (2014) | 95.1 | ||||
| The Witcher 3 (2015) | 46 | ||||
| Batman: Arkham Knight (2015) | 73 | 37 | |||
| Metal Gear Solid V (2015) | 60 | 59 | |||
| Fallout 4 (2015) | 88.4 | 34.3 | |||
| Rise of the Tomb Raider (2016) | 79.7 | 33.6 | |||
| Ashes of the Singularity (2016) | 67 | 65.2 | |||
| Overwatch (2016) | 136.2 | 70.1 | |||
| Mafia 3 (2016) | 51.6 | 20.6 | |||
| Prey (2017) | 138.7 | 48.1 | |||
| Dirt 4 (2017) | 71.8 | 40.5 | |||
| F1 2017 (2017) | 80 | 36 |
Rumorosità
| Idle |
| 31.5 / 33.8 / 33.8 dB(A) |
| Sotto carico |
| 41.7 / 54.2 dB(A) |
 | ||
30 dB silenzioso 40 dB(A) udibile 50 dB(A) rumoroso |
||
min: | ||
| Eurocom Q5 GeForce GTX 1070 Max-Q, i7-7700HQ, Samsung SSD 960 Pro 512 GB m.2 | Asus Zephyrus GX501VS GeForce GTX 1070 Max-Q, i7-7700HQ, Samsung SM961 MZVPW256HEGL | Gigabyte P56XT GeForce GTX 1070 Mobile, i7-7700HQ, LiteOn CX2-8B256 | Alienware 15 R3 GeForce GTX 1070 Mobile, i7-7700HQ | EVGA SC15 GeForce GTX 1060 Mobile, i7-7700HQ, Toshiba NVMe THNSN5256GPU7 | HP Omen 15-ce002ng GeForce GTX 1060 Max-Q, i7-7700HQ, Samsung PM961 MZVLW256HEHP | |
|---|---|---|---|---|---|---|
| Noise | 9% | -4% | -5% | 4% | 1% | |
| off /ambiente * (dB) | 29 | 28.5 2% | 30 -3% | 30 -3% | 28 3% | 30 -3% |
| Idle Minimum * (dB) | 31.5 | 28.5 10% | 34 -8% | 31 2% | 31.9 -1% | 30 5% |
| Idle Average * (dB) | 33.8 | 28.5 16% | 35 -4% | 32 5% | 32 5% | 33 2% |
| Idle Maximum * (dB) | 33.8 | 30.1 11% | 39 -15% | 42 -24% | 32 5% | 37 -9% |
| Load Average * (dB) | 41.7 | 35.2 16% | 39 6% | 49 -18% | 36.5 12% | 41 2% |
| Witcher 3 ultra * (dB) | 41.7 | 41.7 -0% | 48 -15% | 40.3 3% | 42 -1% | |
| Load Maximum * (dB) | 54.2 | 48.8 10% | 49 10% | 50 8% | 53.4 1% | 50 8% |
* ... Meglio usare valori piccoli
(-) La temperatura massima sul lato superiore è di 56.2 °C / 133 F, rispetto alla media di 40.4 °C / 105 F, che varia da 21.2 a 68.8 °C per questa classe Gaming.
(-) Il lato inferiore si riscalda fino ad un massimo di 61.2 °C / 142 F, rispetto alla media di 43.2 °C / 110 F
(+) In idle, la temperatura media del lato superiore è di 27.1 °C / 81 F, rispetto alla media deld ispositivo di 33.9 °C / 93 F.
(-) Riproducendo The Witcher 3, la temperatura media per il lato superiore e' di 41.9 °C / 107 F, rispetto alla media del dispositivo di 33.9 °C / 93 F.
(±) I poggiapolsi e il touchpad possono diventare molto caldi al tatto con un massimo di 38.6 °C / 101.5 F.
(-) La temperatura media della zona del palmo della mano di dispositivi simili e'stata di 28.8 °C / 83.8 F (-9.8 °C / -17.7 F).
Eurocom Q5 analisi audio
(-) | altoparlanti non molto potenti (61.7 dB)
Bassi 100 - 315 Hz
(-) | quasi nessun basso - in media 24% inferiori alla media
(+) | bassi in lineaa (3.8% delta rispetto alla precedente frequenza)
Medi 400 - 2000 Hz
(±) | medi elevati - circa 6.2% superiore alla media
(±) | linearità dei medi adeguata (12.9% delta rispetto alla precedente frequenza)
Alti 2 - 16 kHz
(+) | Alti bilanciati - appena 1.5% dalla media
(+) | alti lineari (5.7% delta rispetto alla precedente frequenza)
Nel complesso 100 - 16.000 Hz
(-) | suono nel complesso non lineare (35.3% di differenza rispetto alla media
Rispetto alla stessa classe
» 99% di tutti i dispositivi testati in questa classe è stato migliore, 0% simile, 1% peggiore
» Il migliore ha avuto un delta di 6%, medio di 18%, peggiore di 132%
Rispetto a tutti i dispositivi testati
» 94% di tutti i dispositivi testati in questa classe è stato migliore, 1% similare, 6% peggiore
» Il migliore ha avuto un delta di 4%, medio di 23%, peggiore di 134%
Apple MacBook 12 (Early 2016) 1.1 GHz analisi audio
(+) | gli altoparlanti sono relativamente potenti (83.6 dB)
Bassi 100 - 315 Hz
(±) | bassi ridotti - in media 11.3% inferiori alla media
(±) | la linearità dei bassi è media (14.2% delta rispetto alla precedente frequenza)
Medi 400 - 2000 Hz
(+) | medi bilanciati - solo only 2.4% rispetto alla media
(+) | medi lineari (5.5% delta rispetto alla precedente frequenza)
Alti 2 - 16 kHz
(+) | Alti bilanciati - appena 2% dalla media
(+) | alti lineari (4.5% delta rispetto alla precedente frequenza)
Nel complesso 100 - 16.000 Hz
(+) | suono nel complesso lineare (10.2% differenza dalla media)
Rispetto alla stessa classe
» 7% di tutti i dispositivi testati in questa classe è stato migliore, 2% simile, 90% peggiore
» Il migliore ha avuto un delta di 5%, medio di 18%, peggiore di 53%
Rispetto a tutti i dispositivi testati
» 5% di tutti i dispositivi testati in questa classe è stato migliore, 1% similare, 94% peggiore
» Il migliore ha avuto un delta di 4%, medio di 23%, peggiore di 134%
| Off / Standby | |
| Idle | |
| Sotto carico |
|
Leggenda:
min: | |
| Eurocom Q5 i7-7700HQ, GeForce GTX 1070 Max-Q, Samsung SSD 960 Pro 512 GB m.2, IPS, 3840x2160, 15.6" | Asus Zephyrus GX501VS i7-7700HQ, GeForce GTX 1070 Max-Q, Samsung SM961 MZVPW256HEGL, IPS, 1920x1080, 15.6" | Asus Zephyrus GX501 i7-7700HQ, GeForce GTX 1080 Max-Q, Samsung SSD SM961 1TB M.2 MZVKW1T0HMLH, IPS, 1920x1080, 15.6" | EVGA SC15 i7-7700HQ, GeForce GTX 1060 Mobile, Toshiba NVMe THNSN5256GPU7, , 1920x1080, 15.6" | Gigabyte P56XT i7-7700HQ, GeForce GTX 1070 Mobile, LiteOn CX2-8B256, IPS, 1920x1080, 15.6" | HP Omen 15-ce002ng i7-7700HQ, GeForce GTX 1060 Max-Q, Samsung PM961 MZVLW256HEHP, IPS, 1920x1080, 15.6" | |
|---|---|---|---|---|---|---|
| Power Consumption | -37% | -54% | -61% | -30% | -43% | |
| Idle Minimum * (Watt) | 9 | 19.1 -112% | 18 -100% | 25.8 -187% | 13 -44% | 18 -100% |
| Idle Average * (Watt) | 13.5 | 20.8 -54% | 23 -70% | 26.6 -97% | 17 -26% | 23 -70% |
| Idle Maximum * (Watt) | 13.7 | 21.8 -59% | 31 -126% | 26.7 -95% | 22 -61% | 30 -119% |
| Load Average * (Watt) | 87.8 | 73.7 16% | 79 10% | 80.3 9% | 85 3% | 85 3% |
| Witcher 3 ultra * (Watt) | 129 | 130.2 -1% | 148 -15% | 121.2 6% | 154 -19% | 96 26% |
| Load Maximum * (Watt) | 158.6 | 173.1 -9% | 196 -24% | 159.3 -0% | 208 -31% | 158 -0% |
* ... Meglio usare valori piccoli
| Eurocom Q5 i7-7700HQ, GeForce GTX 1070 Max-Q, 55 Wh | Asus Zephyrus GX501VS i7-7700HQ, GeForce GTX 1070 Max-Q, 50 Wh | HP Omen 15-ce002ng i7-7700HQ, GeForce GTX 1060 Max-Q, 70 Wh | Gigabyte P56XT i7-7700HQ, GeForce GTX 1070 Mobile, 91.2 Wh | EVGA SC15 i7-7700HQ, GeForce GTX 1060 Mobile, 62 Wh | Alienware 15 R3 i7-7700HQ, GeForce GTX 1070 Mobile, 99 Wh | |
|---|---|---|---|---|---|---|
| Autonomia della batteria | -31% | -2% | 74% | -4% | 32% | |
| Reader / Idle (h) | 7.8 | 3.8 -51% | 4.3 -45% | 9.5 22% | 3.7 -53% | 6.4 -18% |
| WiFi v1.3 (h) | 4.3 | 2.5 -42% | 3.3 -23% | 6.4 49% | 2.8 -35% | 4.4 2% |
| Load (h) | 0.8 | 0.8 0% | 1.3 63% | 2 150% | 1.4 75% | 1.7 113% |
Pro
Contro
Apparentemente, il Q5 è quasi tutto quello che possiamo desiderare da un portatile gaming Max-Q. Manutenzione semplice, profilo sottile ed attraente, varie opzioni di display, due bays di archiviazione interni, molte porte, Optimus, ed anche supporto SIM. Andando nel dettaglio, tuttavia, il sistema ha molta strada da fare rispetto ai modelli concorrenti Max-Q come lo Zephyrus.
La modalità automatica di gestione della ventola deve essere modificata per rispondere agli standard di rumorosità Max-Q. Al momento, gli utenti dovranno settare manualmente la velocità della ventola al 55% per una "vera" esperienza Max-Q. In caso contrario il Q5 sarà rumoroso come un portatile gaming non Max-Q che può essere dotato di una GTX 1070 o schede grafiche migliori. Dopo tutti, perché comprare un portatile Max-Q se non sarà più silenzioso rispetto ad una più potente alternativa ultrasottile?
In secondo luogo, le temperature core sono superiori rispetto allo Zephyrus quando si fissa la velocità della ventola al 55%. Pertanto, quando ci si trova nelle stesse condizioni di carico gaming e con la stessa rumorosità, il portatile Asus si scalda di meno.
Infine, la GTX 1070 Max-Q del Q5 è nettamente più lenta rispetto alla stessa GPU dell'alternativa Asus. Il clock rate inferiore unitamente con temperature core superiori potrebbero dare molto fastidio ai giocatori accaniti. Se volete il meglio che ha da offrire una GTX 1070 Max-Q, allora il Q5 non è il portatile giusto. Se sono più importanti features aggiuntive e opzioni di connettività rispetto allo Zephyrus, invece, allora il meno costoso Q5 potrebbe essere un adeguato portatile Max-Q.
E' chiaro che il Q5 e la sua soluzione di raffreddamento non sono completamente ottimizzati per la Max-Q in quanto clock rates e temperature sono peggiori rispetto alla concorrenza. Le future SKUs dotate di una meno potente GTX 1060 Max-Q dovrebbero teoricamente dare risultati migliori in questo particolare chassis. Al di là di questo, le features aggiuntive e le opzioni di configurazione, oltre a CPU e GPU sono le migliori rispetto ad un portatile supersottile Max-Q.
Nota: si tratta di una recensione breve, con alcune sezioni non tradotte, per la versione integrale in inglese guardate qui.
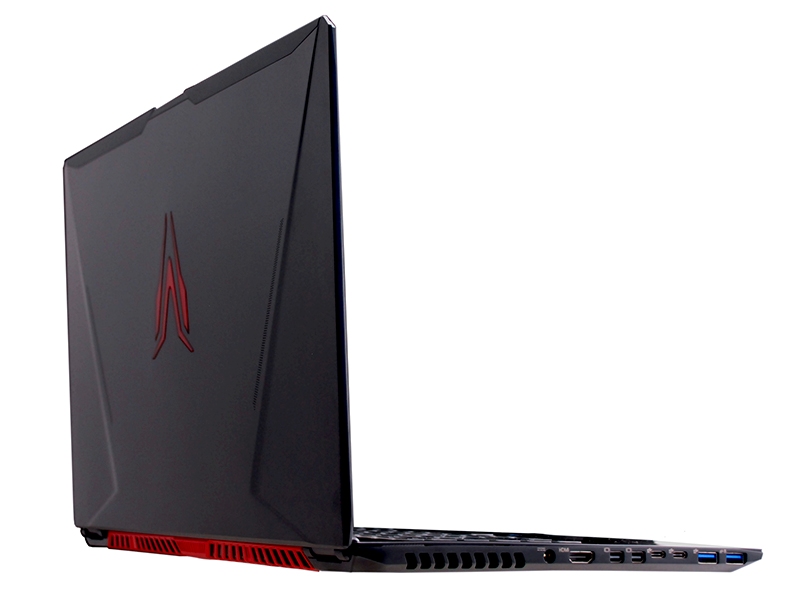
Eurocom Q5
- 09/07/2017 v6 (old)
Allen Ngo
Price comparison
