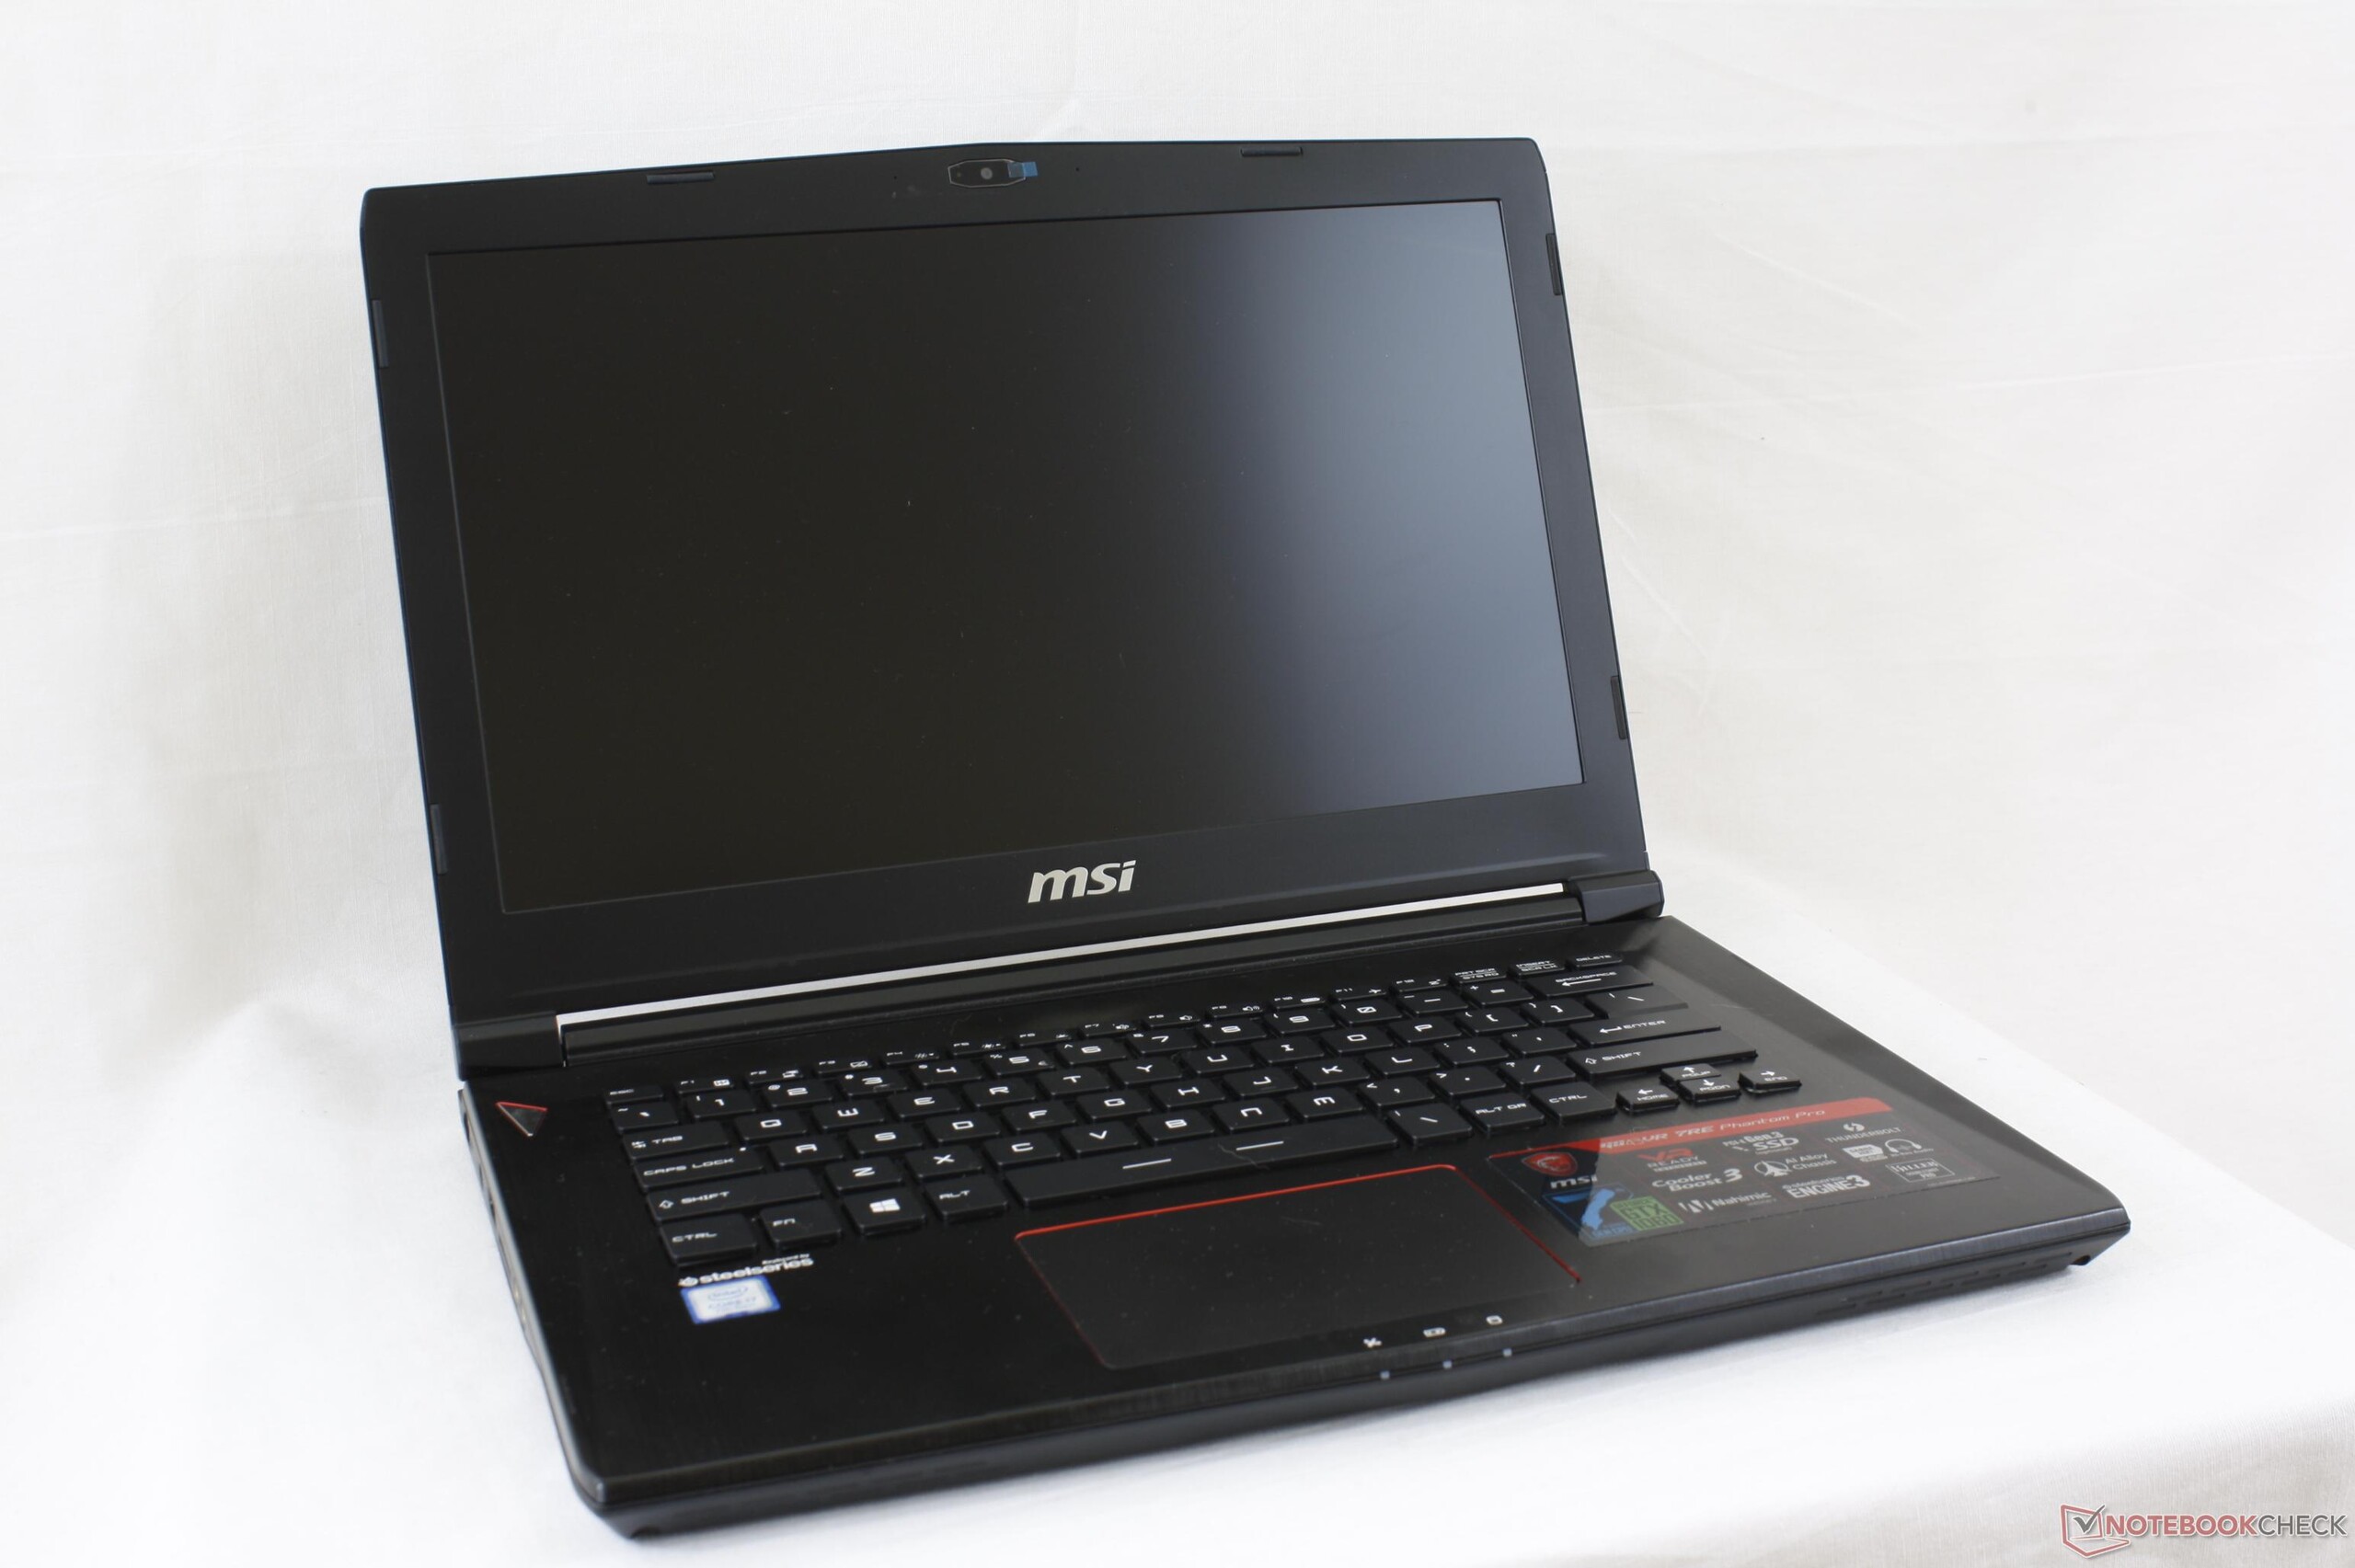
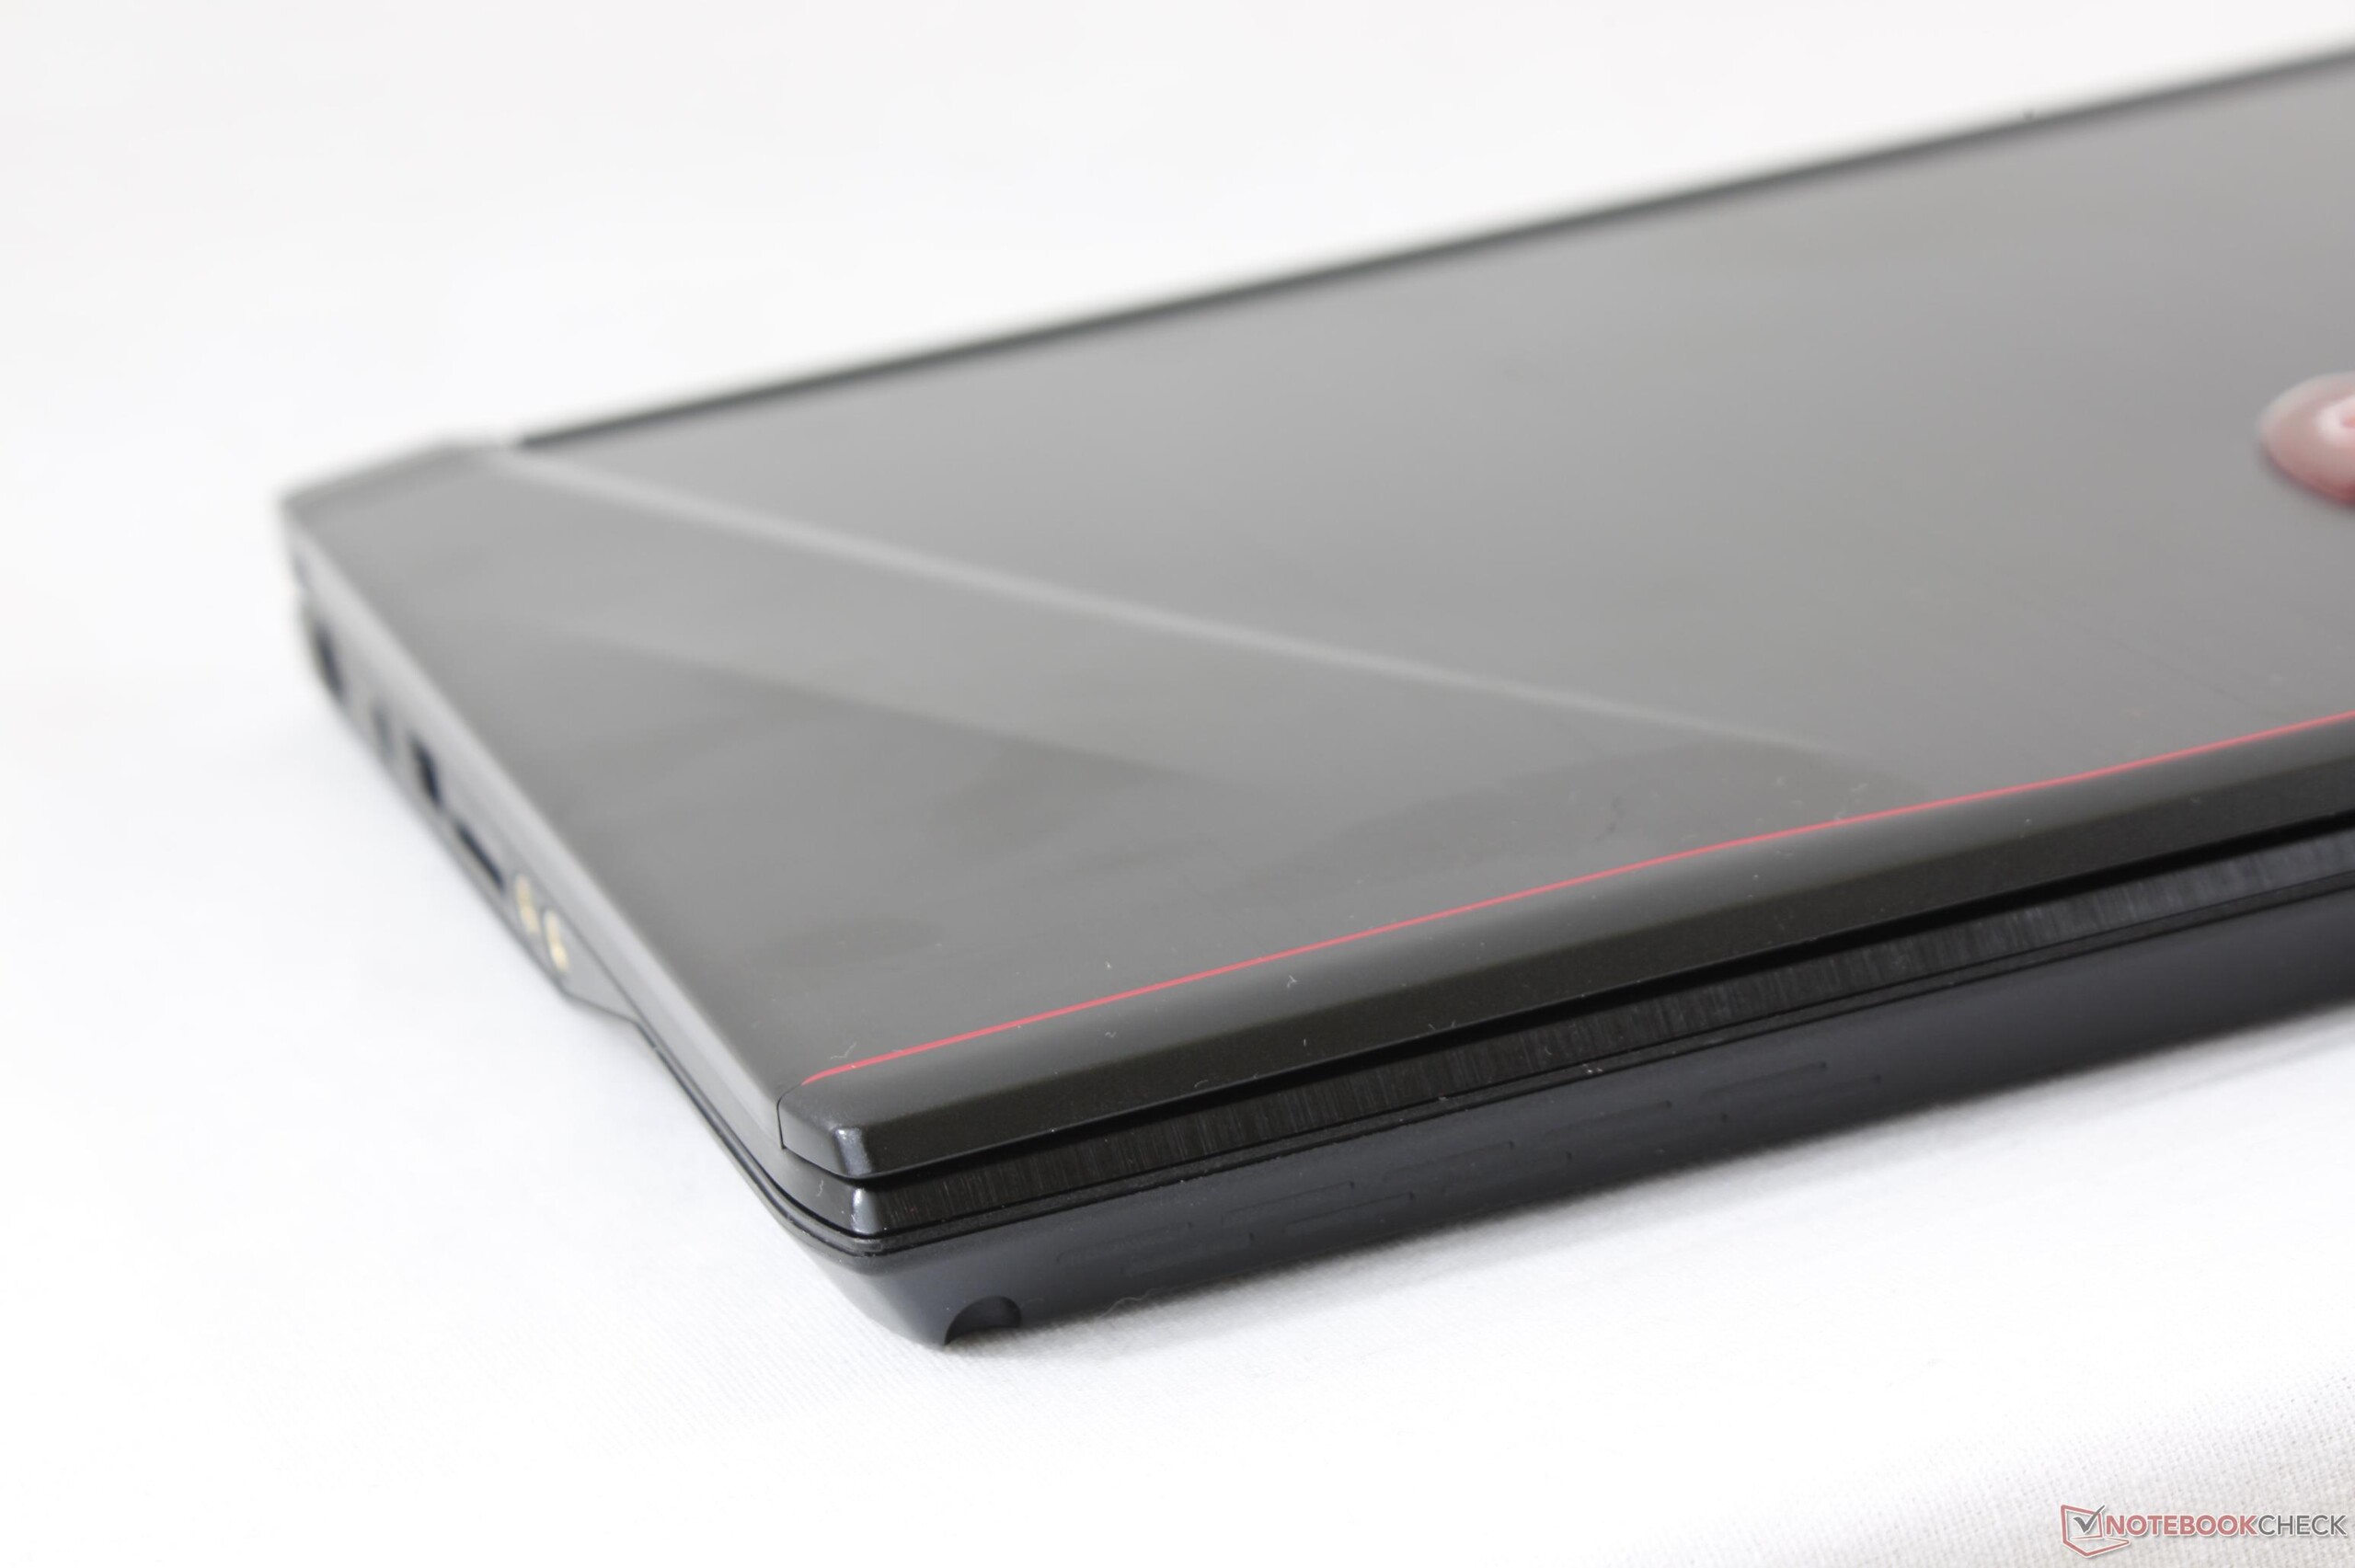
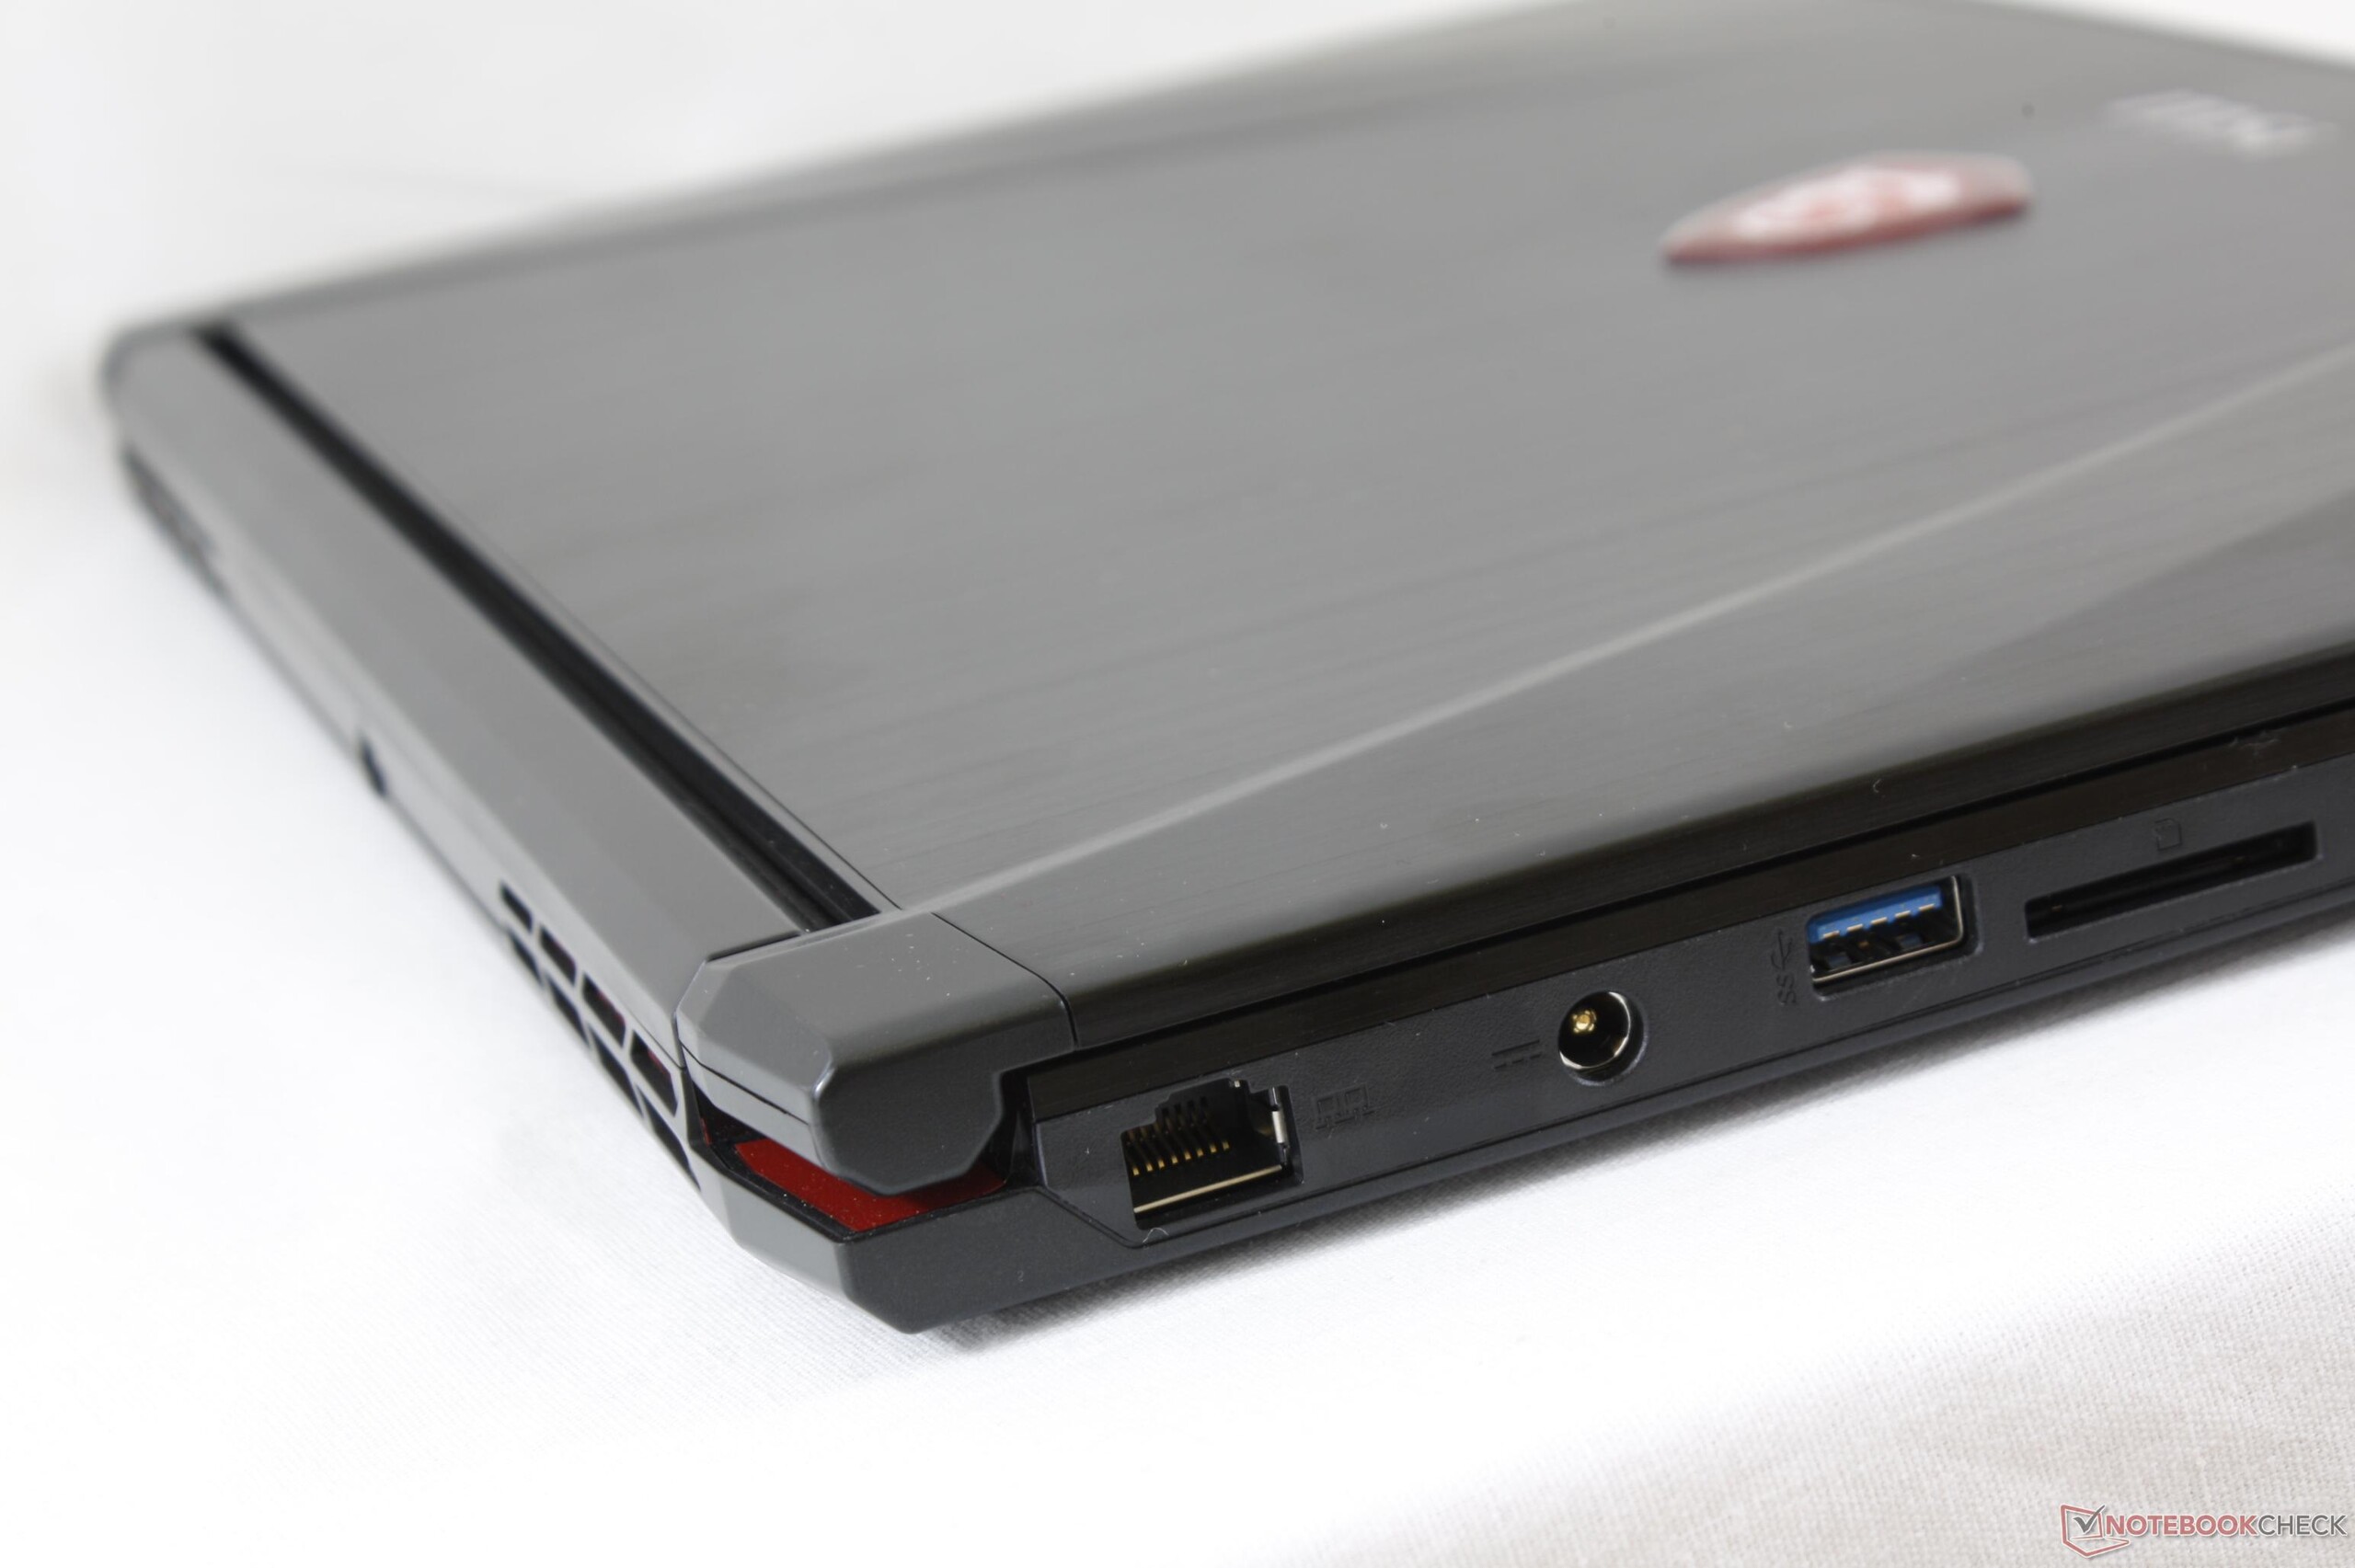
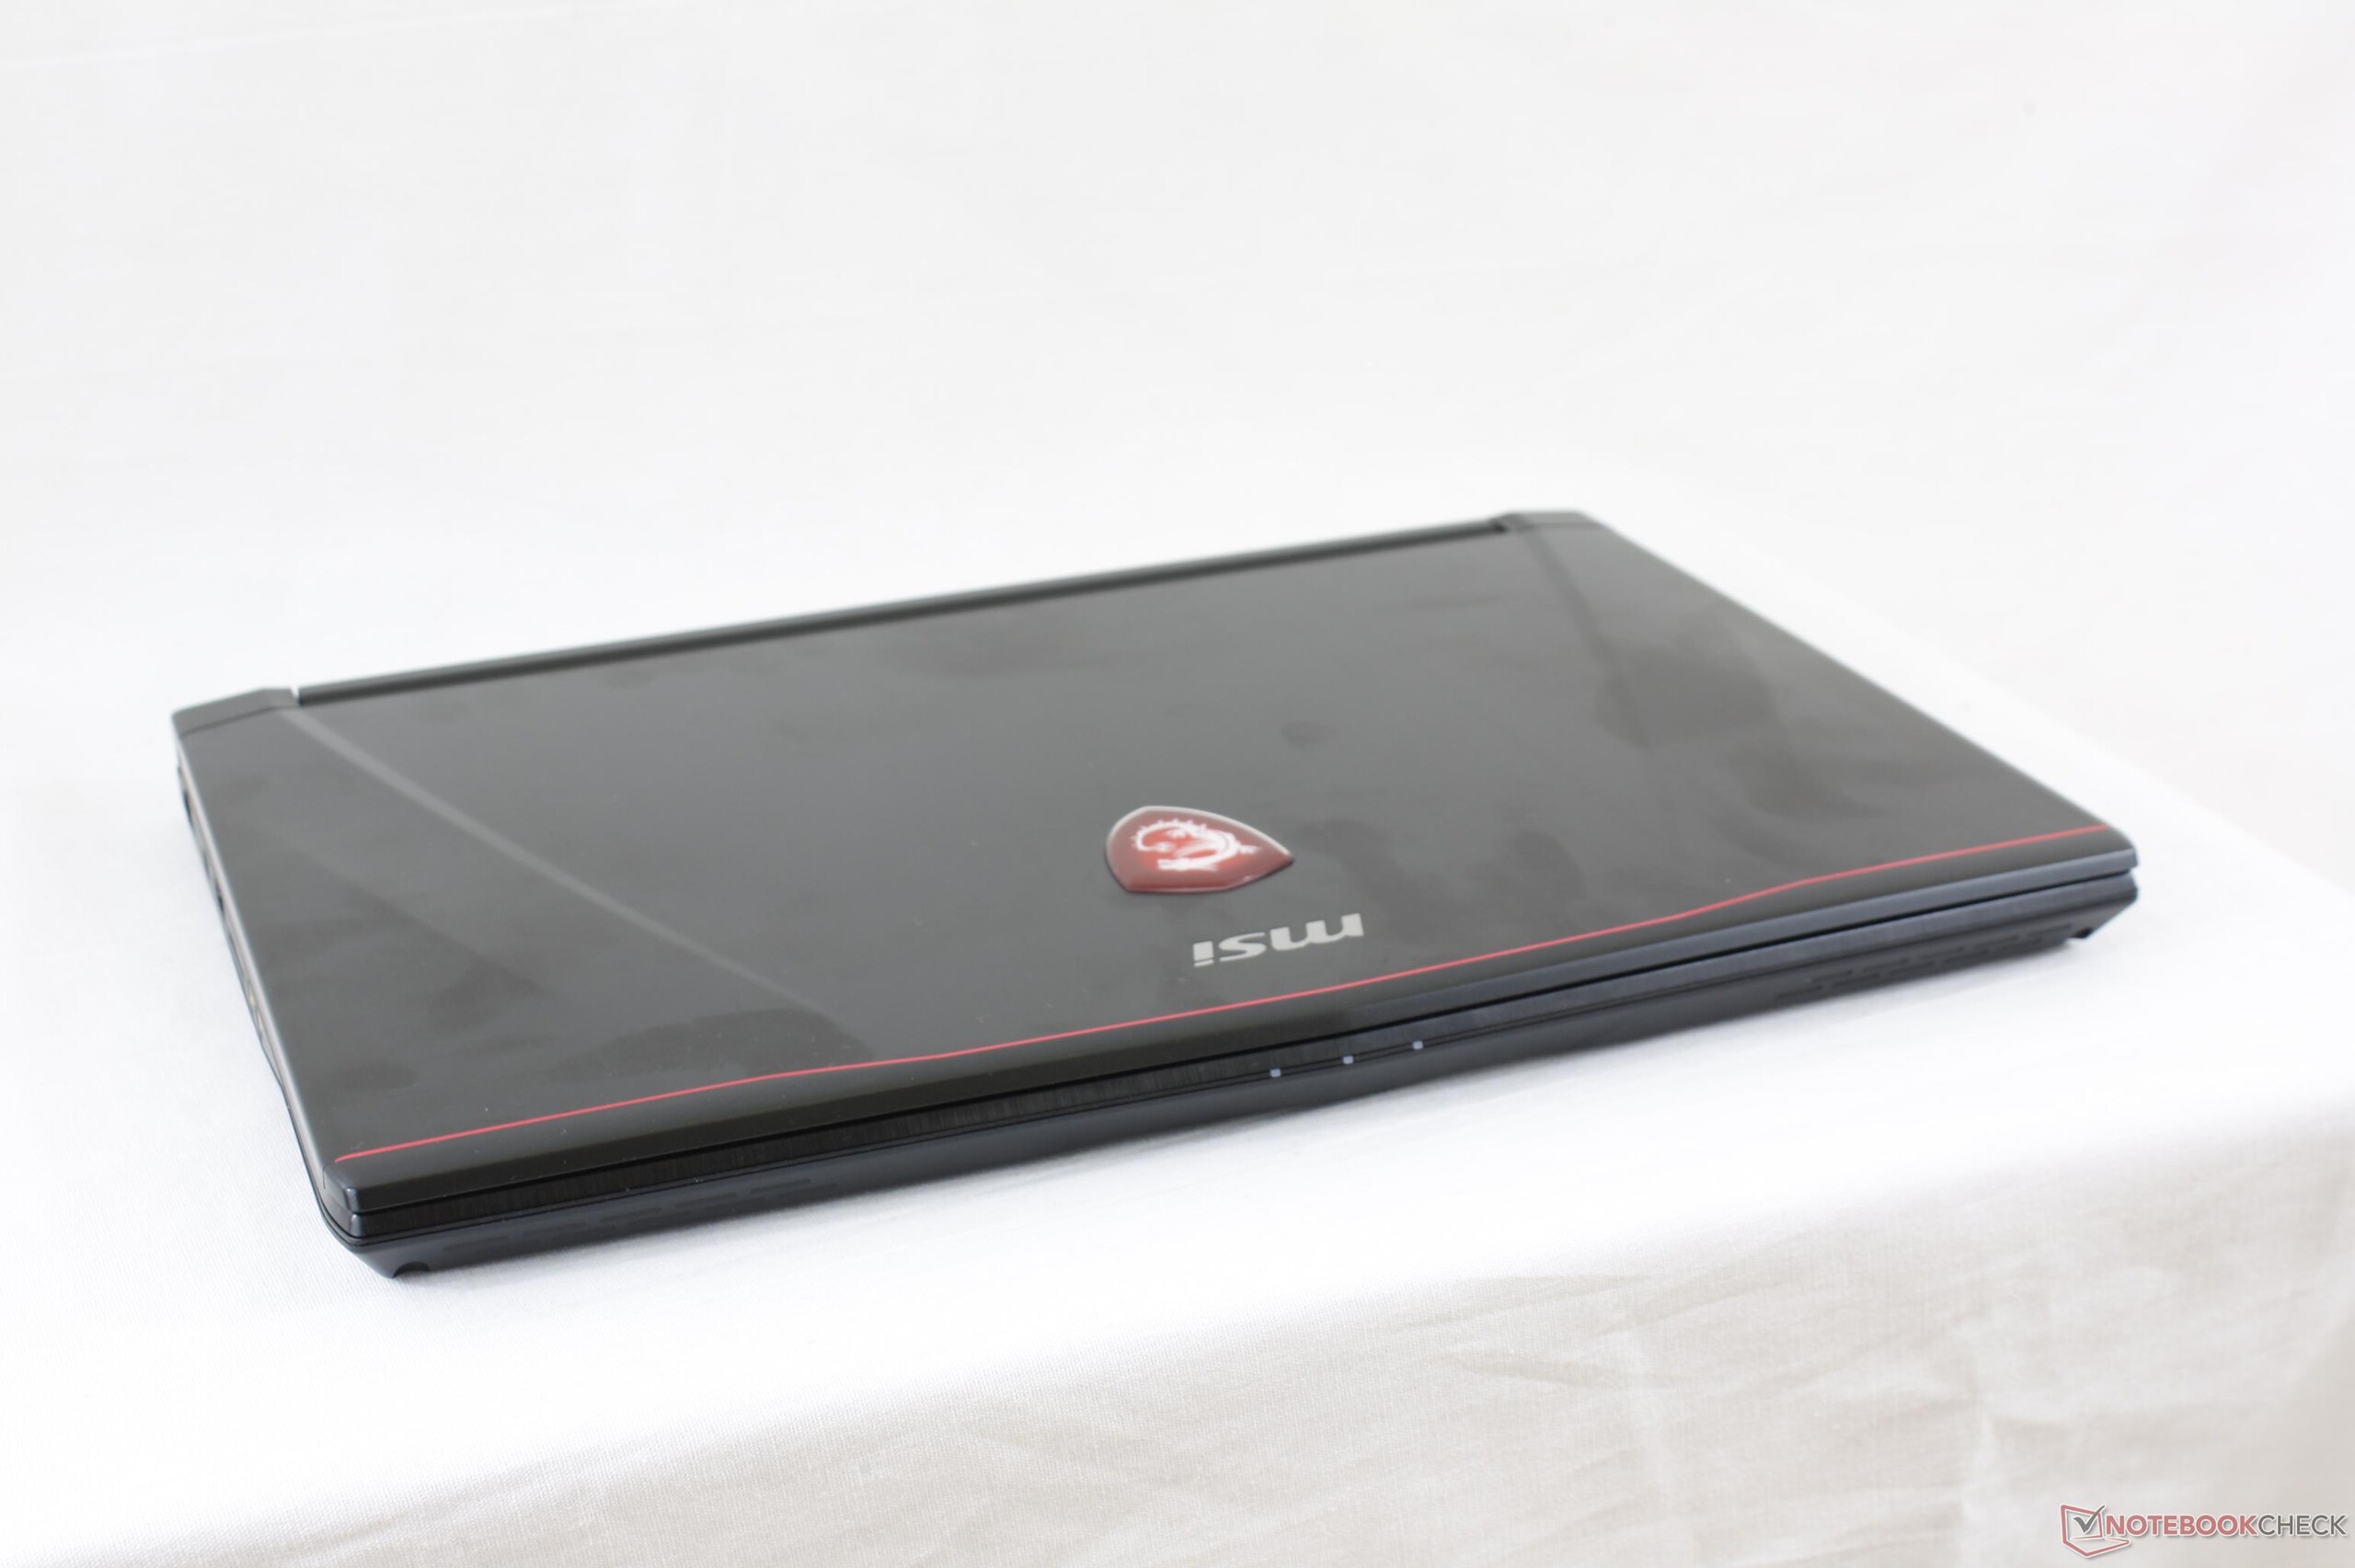
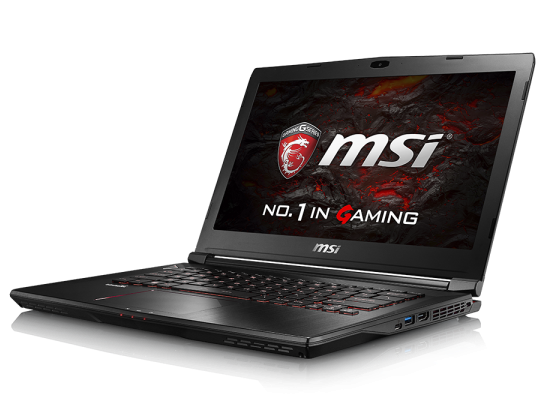
Recensione breve del Portatile MSI GS43VR 7RE (i7-7700HQ, GTX 1060)
| SD Card Reader | |
| average JPG Copy Test (av. of 3 runs) | |
| Dell XPS 15 9560 (i7-7700HQ, UHD) | |
| Eurocom Sky MX5 R3 | |
| MSI GS63VR 7RF-228US | |
| MSI GS43VR 7RE-069US | |
| maximum AS SSD Seq Read Test (1GB) | |
| Dell XPS 15 9560 (i7-7700HQ, UHD) | |
| Eurocom Sky MX5 R3 | |
| MSI GS63VR 7RF-228US | |
| MSI GS43VR 7RE-069US | |
| Networking | |
| iperf3 transmit AX12 | |
| MSI GS63VR 7RF-228US | |
| MSI GS43VR 7RE-069US | |
| Razer Blade (2016) FHD | |
| iperf3 receive AX12 | |
| MSI GS63VR 7RF-228US | |
| MSI GS43VR 7RE-069US | |
| Razer Blade (2016) FHD | |
| |||||||||||||||||||||||||
Distribuzione della luminosità: 86 %
Al centro con la batteria: 306.6 cd/m²
Contrasto: 1095:1 (Nero: 0.28 cd/m²)
ΔE ColorChecker Calman: 3.9 | ∀{0.5-29.43 Ø4.71}
ΔE Greyscale Calman: 2 | ∀{0.09-98 Ø4.96}
86.1% sRGB (Argyll 1.6.3 3D)
56.1% AdobeRGB 1998 (Argyll 1.6.3 3D)
62.8% AdobeRGB 1998 (Argyll 3D)
85.9% sRGB (Argyll 3D)
66.3% Display P3 (Argyll 3D)
Gamma: 2.14
CCT: 6626 K
| MSI GS43VR 7RE-069US ID: LGD046D, Name: LG Philips LP140WF3-SPD1, IPS, 14", 1920x1080 | MSI GS43VR 6RE-006US Name: LG Philips LP140WF3-SPD1, ID: LGD046D, IPS, 14", 1920x1080 | Razer Blade (2016) FHD LG Philips LP140WF3-SPD1 (LGD046D), IPS, 14", 1920x1080 | Aorus x3 Plus v7 Sharp SHP1401, IGZO TFT, 13.9", 3200x1800 | Apple MacBook Pro 15 2016 (2.6 GHz, 450) IPS, 15.4", 2880x1800 | Asus Zephyrus GX501 AUO B156HAN04.2 (AUO42ED), IPS, 15.6", 1920x1080 | |
|---|---|---|---|---|---|---|
| Display | 0% | -3% | 6% | 3% | ||
| Display P3 Coverage (%) | 66.3 | 65.5 -1% | 65.2 -2% | 66.1 0% | 64.8 -2% | |
| sRGB Coverage (%) | 85.9 | 86.4 1% | 83.4 -3% | 96.5 12% | 91.8 7% | |
| AdobeRGB 1998 Coverage (%) | 62.8 | 63.1 0% | 60.9 -3% | 67.5 7% | 65.9 5% | |
| Response Times | -14% | -42% | -24% | -57% | -27% | |
| Response Time Grey 50% / Grey 80% * (ms) | 31.6 ? | 31.6 ? -0% | 47 ? -49% | 38 ? -20% | 47.3 ? -50% | 40.4 ? -28% |
| Response Time Black / White * (ms) | 19.2 ? | 24.4 ? -27% | 26 ? -35% | 24.4 ? -27% | 31.2 ? -63% | 24 ? -25% |
| PWM Frequency (Hz) | 21190 ? | 201.6 ? | 117000 ? | |||
| Screen | 3% | -15% | 12% | 37% | -23% | |
| Brightness middle (cd/m²) | 306.6 | 288.4 -6% | 272 -11% | 348 14% | 483 58% | 328 7% |
| Brightness (cd/m²) | 291 | 282 -3% | 277 -5% | 359 23% | 465 60% | 305 5% |
| Brightness Distribution (%) | 86 | 83 -3% | 84 -2% | 73 -15% | 92 7% | 83 -3% |
| Black Level * (cd/m²) | 0.28 | 0.35 -25% | 0.26 7% | 0.29 -4% | 0.33 -18% | 0.25 11% |
| Contrast (:1) | 1095 | 824 -25% | 1046 -4% | 1200 10% | 1464 34% | 1312 20% |
| Colorchecker dE 2000 * | 3.9 | 2.61 33% | 4.59 -18% | 2.4 38% | 1.4 64% | 6.02 -54% |
| Colorchecker dE 2000 max. * | 9 | 7.34 18% | 8.49 6% | 5.1 43% | 3 67% | 10.14 -13% |
| Greyscale dE 2000 * | 2 | 1.18 41% | 4.28 -114% | 2.3 -15% | 1.5 25% | 6.32 -216% |
| Gamma | 2.14 103% | 2.24 98% | 2.23 99% | 2.21 100% | 2.34 94% | 2.28 96% |
| CCT | 6626 98% | 6506 100% | 6848 95% | 6206 105% | 6650 98% | 8194 79% |
| Color Space (Percent of AdobeRGB 1998) (%) | 56.1 | 56.4 1% | 55 -2% | 62 11% | 60 7% | |
| Color Space (Percent of sRGB) (%) | 86.1 | 86.4 0% | 83 -4% | 96 11% | 92 7% | |
| Media totale (Programma / Settaggio) | -4% /
0% | -20% /
-16% | -2% /
6% | -10% /
18% | -16% /
-18% |
* ... Meglio usare valori piccoli
Tempi di risposta del Display
| ↔ Tempi di risposta dal Nero al Bianco | ||
|---|---|---|
| 19.2 ms ... aumenta ↗ e diminuisce ↘ combinato | ↗ 10 ms Incremento | 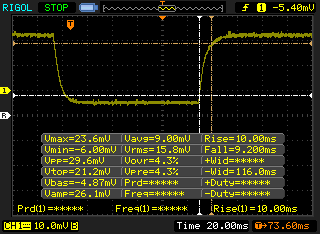 |
| ↘ 9.2 ms Calo | ||
| Lo schermo mostra buoni tempi di risposta durante i nostri tests, ma potrebbe essere troppo lento per i gamers competitivi. In confronto, tutti i dispositivi di test variano da 0.1 (minimo) a 240 (massimo) ms. » 43 % di tutti i dispositivi è migliore. Questo significa che i tempi di risposta rilevati sono simili alla media di tutti i dispositivi testati (19.8 ms). | ||
| ↔ Tempo di risposta dal 50% Grigio all'80% Grigio | ||
| 31.6 ms ... aumenta ↗ e diminuisce ↘ combinato | ↗ 15.6 ms Incremento | 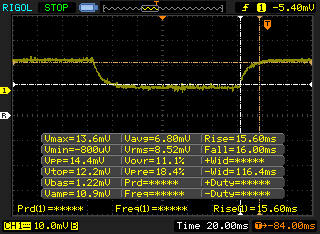 |
| ↘ 16 ms Calo | ||
| Lo schermo mostra tempi di risposta lenti nei nostri tests e sarà insoddisfacente per i gamers. In confronto, tutti i dispositivi di test variano da 0.165 (minimo) a 636 (massimo) ms. » 43 % di tutti i dispositivi è migliore. Questo significa che i tempi di risposta rilevati sono simili alla media di tutti i dispositivi testati (31 ms). | ||
Sfarfallio dello schermo / PWM (Pulse-Width Modulation)
| flickering dello schermo / PWM rilevato | 21190 Hz | ≤ 99 % settaggio luminosita' | 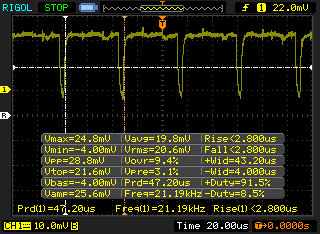 |
Il display sfarfalla a 21190 Hz (Probabilmente a causa dell'uso di PWM) Flickering rilevato ad una luminosita' di 99 % o inferiore. Non dovrebbe verificarsi flickering o PWM sopra questo valore di luminosita'. La frequenza di 21190 Hz è abbastanza alta, quindi la maggioranza degli utenti sensibili al PWM non dovrebbero notare alcun flickering. In confronto: 52 % di tutti i dispositivi testati non utilizza PWM per ridurre la luminosita' del display. Se è rilevato PWM, una media di 7757 (minimo: 5 - massimo: 343500) Hz è stata rilevata. | |||
| Cinebench R10 | |
| Rendering Multiple CPUs 32Bit | |
| Eurocom Tornado F5 | |
| Dell Precision 3520 | |
| MSI GS43VR 7RE-069US | |
| EVGA SC15 | |
| MSI GS43VR 6RE-006US | |
| MSI GP62-2QEi781FD | |
| Eurocom Shark 4 | |
| Lenovo IdeaPad Y50 | |
| Rendering Single 32Bit | |
| Eurocom Tornado F5 | |
| EVGA SC15 | |
| MSI GS43VR 7RE-069US | |
| Dell Precision 3520 | |
| MSI GP62-2QEi781FD | |
| Eurocom Shark 4 | |
| Lenovo IdeaPad Y50 | |
| MSI GS43VR 6RE-006US | |
| wPrime 2.10 - 1024m | |
| Lenovo IdeaPad Y50 | |
| Eurocom Shark 4 | |
| MSI GS43VR 6RE-006US | |
| MSI GS43VR 7RE-069US | |
| EVGA SC15 | |
| MSI GP62-2QEi781FD | |
| Eurocom Tornado F5 | |
* ... Meglio usare valori piccoli
| PCMark 8 | |
| Home Score Accelerated v2 | |
| Eurocom Tornado F5 | |
| EVGA SC15 | |
| MSI GS43VR 7RE-069US | |
| Lenovo IdeaPad Y50 | |
| Work Score Accelerated v2 | |
| Eurocom Tornado F5 | |
| EVGA SC15 | |
| MSI GS43VR 7RE-069US | |
| Lenovo IdeaPad Y50 | |
| Creative Score Accelerated v2 | |
| Eurocom Tornado F5 | |
| EVGA SC15 | |
| MSI GS43VR 7RE-069US | |
| Lenovo IdeaPad Y50 | |
| PCMark 8 Home Score Accelerated v2 | 3918 punti | |
| PCMark 8 Creative Score Accelerated v2 | 5250 punti | |
| PCMark 8 Work Score Accelerated v2 | 4672 punti | |
| PCMark 10 Score | 4807 punti | |
Aiuto | ||
| MSI GS43VR 7RE-069US SK Hynix HFS128G39MNC-3510A | MSI GS63VR 7RF-228US Samsung SM961 MZVKW512HMJP m.2 PCI-e | Razer Blade (2016) FHD | Gigabyte Aero 14 GA-K106Q416-PL-B02 Liteonit CV3-8D256 | Aorus x3 Plus v7 Toshiba NVMe THNSN5512GPU7 | |
|---|---|---|---|---|---|
| AS SSD | 204% | 209% | -11% | 118% | |
| Copy Game MB/s (MB/s) | 332.1 | 1082 226% | 1014 205% | ||
| Copy Program MB/s (MB/s) | 225.4 | 401.9 78% | 399.4 77% | ||
| Copy ISO MB/s (MB/s) | 382.1 | 1666 336% | 1459 282% | ||
| Score Total (Points) | 1126 | 3756 234% | 4067 261% | 917 -19% | 2570 128% |
| Score Write (Points) | 435 | 1468 237% | 1522 250% | 298 -31% | 933 114% |
| Score Read (Points) | 455 | 1549 240% | 1710 276% | 411 -10% | 1112 144% |
| Access Time Write * (ms) | 0.115 | 0.029 75% | 0.032 72% | 0.074 36% | 0.05 57% |
| Access Time Read * (ms) | 0.106 | 0.041 61% | 0.036 66% | 0.089 16% | 0.11 -4% |
| 4K-64 Write (MB/s) | 312.5 | 1185 279% | 1234 295% | 218.9 -30% | 692 121% |
| 4K-64 Read (MB/s) | 373.9 | 1229 229% | 1403 275% | 333 -11% | 857 129% |
| 4K Write (MB/s) | 86.2 | 127.6 48% | 116.6 35% | 50 -42% | 128.6 49% |
| 4K Read (MB/s) | 30.35 | 48.01 58% | 47.65 57% | 26.32 -13% | 41.4 36% |
| Seq Write (MB/s) | 366.6 | 1550 323% | 1715 368% | 291.4 -21% | 1117 205% |
| Seq Read (MB/s) | 509 | 2719 434% | 2594 410% | 517 2% | 2131 319% |
* ... Meglio usare valori piccoli

| 3DMark | |
| 1920x1080 Fire Strike Graphics | |
| Eurocom Sky MX5 R3 | |
| Asus Zephyrus GX501 | |
| Asus G701VO-CS74K | |
| Nvidia GeForce GTX 1060 Founders Edition 6 GB | |
| MSI GS43VR 7RE-069US | |
| EVGA SC15 | |
| HP Omen 15-ce002ng | |
| EVGA SC17 | |
| MSI GP62 7REX-1045US | |
| Asus Strix GL502VT-DS74 | |
| Fire Strike Extreme Graphics | |
| Eurocom Sky MX5 R3 | |
| Asus G701VO-CS74K | |
| MSI GS43VR 7RE-069US | |
| EVGA SC15 | |
| EVGA SC17 | |
| MSI GP62 7REX-1045US | |
| Asus Strix GL502VT-DS74 | |
| 3840x2160 Fire Strike Ultra Graphics | |
| Eurocom Sky MX5 R3 | |
| Asus Zephyrus GX501 | |
| Asus G701VO-CS74K | |
| Nvidia GeForce GTX 1060 Founders Edition 6 GB | |
| MSI GS43VR 7RE-069US | |
| EVGA SC15 | |
| EVGA SC17 | |
| MSI GP62 7REX-1045US | |
| 3DMark 11 | |
| 1280x720 Performance GPU | |
| Asus Zephyrus GX501 | |
| Eurocom Sky MX5 R3 | |
| Nvidia GeForce GTX 1060 Founders Edition 6 GB | |
| Asus G701VO-CS74K | |
| EVGA SC15 | |
| MSI GS43VR 7RE-069US | |
| HP Omen 15-ce002ng | |
| EVGA SC17 | |
| Asus Strix GL502VT-DS74 | |
| MSI GP62 7REX-1045US | |
| 1280x720 Performance Combined | |
| Nvidia GeForce GTX 1060 Founders Edition 6 GB | |
| Eurocom Sky MX5 R3 | |
| EVGA SC17 | |
| Asus G701VO-CS74K | |
| Asus Zephyrus GX501 | |
| EVGA SC15 | |
| MSI GS43VR 7RE-069US | |
| HP Omen 15-ce002ng | |
| Asus Strix GL502VT-DS74 | |
| MSI GP62 7REX-1045US | |
| 3DMark 11 Performance | 12917 punti | |
| 3DMark Ice Storm Standard Score | 85006 punti | |
| 3DMark Cloud Gate Standard Score | 24792 punti | |
| 3DMark Fire Strike Score | 10096 punti | |
| 3DMark Fire Strike Extreme Score | 5293 punti | |
Aiuto | ||
| Rise of the Tomb Raider - 1920x1080 Very High Preset AA:FX AF:16x | |
| Alienware 17 R4 | |
| Asus Zephyrus GX501 | |
| Eurocom Sky MX5 R3 | |
| MSI GS43VR 7RE-069US | |
| Nvidia GeForce GTX 1060 Founders Edition 6 GB | |
| Nvidia GeForce GTX 1060 Founders Edition 6 GB | |
| MSI GT72VR 6RD-063US | |
| Aorus X5S v5 | |
| Lenovo Legion Y520-15IKBN-80WK001KUS | |
| The Witcher 3 - 1920x1080 Ultra Graphics & Postprocessing (HBAO+) | |
| Alienware 17 R4 | |
| Eurocom Sky MX5 R3 | |
| Asus Zephyrus GX501 | |
| Nvidia GeForce GTX 1060 Founders Edition 6 GB | |
| MSI GS43VR 7RE-069US | |
| Lenovo Legion Y520-15IKBN-80WK001KUS | |
| BioShock Infinite - 1920x1080 Ultra Preset, DX11 (DDOF) | |
| Alienware 17 R4 | |
| Eurocom Sky MX5 R3 | |
| MSI GS43VR 7RE-069US | |
| MSI GT72VR 6RD-063US | |
| Aorus X5S v5 | |
| Lenovo Legion Y520-15IKBN-80WK001KUS | |
| basso | medio | alto | ultra | |
|---|---|---|---|---|
| BioShock Infinite (2013) | 105.6 | |||
| Metro: Last Light (2013) | 80.2 | |||
| Thief (2014) | 77.1 | |||
| The Witcher 3 (2015) | 79 | 41 | ||
| Batman: Arkham Knight (2015) | 88 | 60 | ||
| Metal Gear Solid V (2015) | 60 | |||
| Fallout 4 (2015) | 71.5 | |||
| Rise of the Tomb Raider (2016) | 68.8 | |||
| Ashes of the Singularity (2016) | 58.1 | |||
| Overwatch (2016) | 106 | |||
| Mafia 3 (2016) | 42 | |||
| Prey (2017) | 106.7 |
Rumorosità
| Idle |
| 33 / 34.5 / 35 dB(A) |
| Sotto carico |
| 54.2 / 54.2 dB(A) |
 | ||
30 dB silenzioso 40 dB(A) udibile 50 dB(A) rumoroso |
||
min: | ||
| MSI GS43VR 7RE-069US GeForce GTX 1060 Mobile, i7-7700HQ, SK Hynix HFS128G39MNC-3510A | MSI GS63VR 7RF-228US GeForce GTX 1060 Mobile, i7-7700HQ, Samsung SM961 MZVKW512HMJP m.2 PCI-e | Razer Blade (2016) FHD GeForce GTX 1060 Mobile, 6700HQ | Gigabyte Aero 14 GA-K106Q416-PL-B02 GeForce GTX 1060 Mobile, i7-7700HQ, Liteonit CV3-8D256 | Aorus x3 Plus v7 GeForce GTX 1060 Mobile, i7-7820HK, Toshiba NVMe THNSN5512GPU7 | Apple MacBook Pro 15 2016 (2.6 GHz, 450) Radeon Pro 450, 6700HQ, Apple SSD SM0256L | |
|---|---|---|---|---|---|---|
| Noise | 10% | -2% | 7% | -1% | 12% | |
| off /ambiente * (dB) | 28 | 28.8 -3% | 31 -11% | 29.1 -4% | 30.4 -9% | |
| Idle Minimum * (dB) | 33 | 33.1 -0% | 35 -6% | 31.3 5% | 31.4 5% | 30.6 7% |
| Idle Average * (dB) | 34.5 | 33.1 4% | 36 -4% | 31.3 9% | 37 -7% | 30.6 11% |
| Idle Maximum * (dB) | 35 | 34 3% | 37 -6% | 31.3 11% | 40.8 -17% | 30.6 13% |
| Load Average * (dB) | 54.2 | 37.2 31% | 43 21% | 50.3 7% | 50 8% | 34.7 36% |
| Witcher 3 ultra * (dB) | 56.7 | 46.1 19% | 53.6 5% | |||
| Load Maximum * (dB) | 54.2 | 47.1 13% | 57 -5% | 53.4 1% | 53.6 1% | 46.3 15% |
* ... Meglio usare valori piccoli
(-) La temperatura massima sul lato superiore è di 47.8 °C / 118 F, rispetto alla media di 40.4 °C / 105 F, che varia da 21.2 a 68.8 °C per questa classe Gaming.
(-) Il lato inferiore si riscalda fino ad un massimo di 63.2 °C / 146 F, rispetto alla media di 43.2 °C / 110 F
(+) In idle, la temperatura media del lato superiore è di 28.6 °C / 83 F, rispetto alla media deld ispositivo di 33.9 °C / 93 F.
(±) Riproducendo The Witcher 3, la temperatura media per il lato superiore e' di 36.4 °C / 98 F, rispetto alla media del dispositivo di 33.9 °C / 93 F.
(+) I poggiapolsi e il touchpad raggiungono la temperatura massima della pelle (32 °C / 89.6 F) e quindi non sono caldi.
(-) La temperatura media della zona del palmo della mano di dispositivi simili e'stata di 28.8 °C / 83.8 F (-3.2 °C / -5.8 F).
MSI GS43VR 7RE-069US analisi audio
(±) | potenza degli altiparlanti media ma buona (72 dB)
Bassi 100 - 315 Hz
(-) | quasi nessun basso - in media 21.9% inferiori alla media
(±) | la linearità dei bassi è media (7.2% delta rispetto alla precedente frequenza)
Medi 400 - 2000 Hz
(+) | medi bilanciati - solo only 3.5% rispetto alla media
(±) | linearità dei medi adeguata (7.6% delta rispetto alla precedente frequenza)
Alti 2 - 16 kHz
(±) | alti elevati - circa 5.7% superiori alla media
(±) | la linearità degli alti è media (11% delta rispetto alla precedente frequenza)
Nel complesso 100 - 16.000 Hz
(±) | la linearità complessiva del suono è media (27.5% di differenza rispetto alla media
Rispetto alla stessa classe
» 93% di tutti i dispositivi testati in questa classe è stato migliore, 1% simile, 5% peggiore
» Il migliore ha avuto un delta di 6%, medio di 18%, peggiore di 132%
Rispetto a tutti i dispositivi testati
» 84% di tutti i dispositivi testati in questa classe è stato migliore, 3% similare, 13% peggiore
» Il migliore ha avuto un delta di 4%, medio di 23%, peggiore di 134%
Apple MacBook 12 (Early 2016) 1.1 GHz analisi audio
(+) | gli altoparlanti sono relativamente potenti (83.6 dB)
Bassi 100 - 315 Hz
(±) | bassi ridotti - in media 11.3% inferiori alla media
(±) | la linearità dei bassi è media (14.2% delta rispetto alla precedente frequenza)
Medi 400 - 2000 Hz
(+) | medi bilanciati - solo only 2.4% rispetto alla media
(+) | medi lineari (5.5% delta rispetto alla precedente frequenza)
Alti 2 - 16 kHz
(+) | Alti bilanciati - appena 2% dalla media
(+) | alti lineari (4.5% delta rispetto alla precedente frequenza)
Nel complesso 100 - 16.000 Hz
(+) | suono nel complesso lineare (10.2% differenza dalla media)
Rispetto alla stessa classe
» 7% di tutti i dispositivi testati in questa classe è stato migliore, 2% simile, 90% peggiore
» Il migliore ha avuto un delta di 5%, medio di 18%, peggiore di 53%
Rispetto a tutti i dispositivi testati
» 5% di tutti i dispositivi testati in questa classe è stato migliore, 1% similare, 94% peggiore
» Il migliore ha avuto un delta di 4%, medio di 23%, peggiore di 134%
| Off / Standby | |
| Idle | |
| Sotto carico |
|
Leggenda:
min: | |
| MSI GS43VR 7RE-069US i7-7700HQ, GeForce GTX 1060 Mobile, SK Hynix HFS128G39MNC-3510A, IPS, 1920x1080, 14" | Alienware 13 R3 i7-7700HQ, GeForce GTX 1060 Mobile, Toshiba NVMe THNSN5256GPUK, OLED, 2560x1440, 13.3" | Razer Blade (2016) FHD 6700HQ, GeForce GTX 1060 Mobile, , IPS, 1920x1080, 14" | Gigabyte Aero 14 GA-K106Q416-PL-B02 i7-7700HQ, GeForce GTX 1060 Mobile, Liteonit CV3-8D256, , 2560x1440, 14" | Aorus x3 Plus v7 i7-7820HK, GeForce GTX 1060 Mobile, Toshiba NVMe THNSN5512GPU7, IGZO TFT, 3200x1800, 13.9" | Apple MacBook Pro 15 2016 (2.6 GHz, 450) 6700HQ, Radeon Pro 450, Apple SSD SM0256L, IPS, 2880x1800, 15.4" | |
|---|---|---|---|---|---|---|
| Power Consumption | -6% | -33% | -44% | -33% | 32% | |
| Idle Minimum * (Watt) | 9.1 | 7 23% | 14 -54% | 12 -32% | 15.1 -66% | 2.9 68% |
| Idle Average * (Watt) | 11.9 | 12 -1% | 18 -51% | 18.1 -52% | 15.8 -33% | 9.7 18% |
| Idle Maximum * (Watt) | 12.2 | 18 -48% | 21 -72% | 21.3 -75% | 16.7 -37% | 10.1 17% |
| Load Average * (Watt) | 77 | 76 1% | 70 9% | 127.2 -65% | 110.9 -44% | 65 16% |
| Witcher 3 ultra * (Watt) | 126.4 | 135 -7% | ||||
| Load Maximum * (Watt) | 153 | 161 -5% | 146 5% | 149.4 2% | 170.4 -11% | 89.5 42% |
* ... Meglio usare valori piccoli
| MSI GS43VR 7RE-069US i7-7700HQ, GeForce GTX 1060 Mobile, 61 Wh | MSI GS63VR 7RF-228US i7-7700HQ, GeForce GTX 1060 Mobile, 65 Wh | Razer Blade (2016) FHD 6700HQ, GeForce GTX 1060 Mobile, 70 Wh | Gigabyte Aero 14 GA-K106Q416-PL-B02 i7-7700HQ, GeForce GTX 1060 Mobile, 94.24 Wh | Aorus x3 Plus v7 i7-7820HK, GeForce GTX 1060 Mobile, 74 Wh | Apple MacBook Pro 15 2016 (2.6 GHz, 450) 6700HQ, Radeon Pro 450, 76 Wh | |
|---|---|---|---|---|---|---|
| Autonomia della batteria | 2% | 54% | -13% | 30% | 107% | |
| Reader / Idle (h) | 9 | 6.4 -29% | 12.7 41% | 7.8 -13% | 8 -11% | |
| WiFi v1.3 (h) | 2.9 | 3.9 34% | 7.1 145% | 4.9 69% | 10 245% | |
| Load (h) | 1.3 | 1.3 0% | 1 -23% | 1.7 31% | 0.9 -31% | |
| WiFi (h) | 5.2 |
Pro
Contro
Il GS43VR 7RE difficilmente può essere considerato un update rispetto al GS43VR 6RE. Le performance CPU sono leggermente migliori, ma il potenziale Turbo Boost è limitato e quindi non c'è un vero vantaggio con l'upgrade Kaby Lake. Poiché l'esperienza core resta la stessa, la parte più importante di questa Kaby Lake GS43VR e che il vecchio GS43VR diventerà più economica.
MSI avrebbe potuto fare qualche cambio in più per giustificare l'acquisto del Kaby Lake GS43VR rispetto al modello dell'anno scorso. Tasti RGB multizona, HDMI 2.0, SD card reader più veloce, più opzioni di display (G-Sync, tempi di risposta 3 o 5 ms), e forse anche meno sarebbero stati graditi. E' chiaro che l'attuale interazione GS43 potrebbe beneficiare di un rinnovamento completo del design per attirare con un nuovo looks la nota serie GE63VR e GT. Speriamo che si provveda ad integrare le features mancanti e migliorare la rigidità dello chassis oltre alla rumorosità della ventola. In questo caso l'Alienware 13 ed il Razer Blade sono più potenti e robusti rispetto a quello che offre MSI in questa categoria.
Con uno schermo da appena 14", il GS43VR è indicato solo per i giocatori che sono sempre in giro e vogliono le prestazioni di un PC in un portatile. Per il resto, il GT72 o il GT73 sono macchine gaming migliori in termini di rumorosità, qualità del case, connettività ed opzioni. Suggeriamo ai nuovi possessori del GS43VR di familiarizzare con il controllo della ventola ed eliminare il bloatware che sembra ridurre l'autonomia.
Il GS43VR non arriva alla qualità di un 13" Alienware 13 o un 14"- Razer Blade e non è una revisione completa. Con $1500 USD, l'MSI costa quanto i $1550 USD del Dell ed è più economico rispetto ai $1900 USD del Razer. Se MSI è un must, allora investire sul vecchio Skylake GS43VR farà risparmiare qualche centinaio di dollari senza perdere molto in prestazioni.
Nota: si tratta di una recensione breve, con alcune sezioni non tradotte, per la versione integrale in inglese guardate qui.
MSI GS43VR 7RE-069US
- 07/27/2017 v6 (old)
Allen Ngo
Price comparison
