Recensione breve del Portatile MSI GS73VR 7RF (7700HQ, GTX 1060, 4K)
| SD Card Reader | |
| average JPG Copy Test (av. of 3 runs) | |
| Aorus X7 v6 | |
| Gigabyte Aero 15 | |
| Asus Strix GL702VSK | |
| MSI GS73VR 7RF | |
| MSI GS73VR 6RF | |
| Acer Aspire V17 Nitro BE VN7-793G-52XN | |
| maximum AS SSD Seq Read Test (1GB) | |
| Gigabyte Aero 15 | |
| Aorus X7 v6 | |
| Asus Strix GL702VSK | |
| MSI GS73VR 6RF | |
| MSI GS73VR 7RF | |
| Acer Aspire V17 Nitro BE VN7-793G-52XN | |
| Networking | |
| iperf3 transmit AX12 | |
| Acer Aspire V17 Nitro BE VN7-793G-52XN | |
| MSI GS73VR 7RF | |
| Aorus X7 v6 | |
| Asus Strix GL702VSK | |
| Gigabyte Aero 15 | |
| iperf3 receive AX12 | |
| Gigabyte Aero 15 | |
| Asus Strix GL702VSK | |
| MSI GS73VR 7RF | |
| Acer Aspire V17 Nitro BE VN7-793G-52XN | |
| Aorus X7 v6 | |
| |||||||||||||||||||||||||
Distribuzione della luminosità: 86 %
Al centro con la batteria: 371.1 cd/m²
Contrasto: 884:1 (Nero: 0.42 cd/m²)
ΔE ColorChecker Calman: 4.5 | ∀{0.5-29.43 Ø4.73}
ΔE Greyscale Calman: 3.1 | ∀{0.09-98 Ø4.97}
97% sRGB (Argyll 1.6.3 3D)
61% AdobeRGB 1998 (Argyll 1.6.3 3D)
66.4% AdobeRGB 1998 (Argyll 3D)
96.8% sRGB (Argyll 3D)
64.2% Display P3 (Argyll 3D)
Gamma: 2.17
CCT: 7120 K
| MSI GS73VR 7RF AU Optronics AUO109B, IPS, 17.3", 3840x2160 | MSI GS73VR 6RF TN LED, 17.3", 1920x1080 | Asus Strix GL702VSK AU Optronics AUO119D, IPS, 17.3", 1920x1080 | Acer Aspire V17 Nitro BE VN7-793G-52XN AUO B173HAN01.0, a-Si TFT-LCD, WLED, 17.3", 1920x1080 | Aorus X7 v6 B173QTN01.0 (AUO1096), TN LED, 17.3", 2560x1440 | Gigabyte Aero 15 N156HCA-EA1 (CMN15D7), IPS, 15.6", 1920x1080 | |
|---|---|---|---|---|---|---|
| Display | 23% | -7% | -3% | -9% | -1% | |
| Display P3 Coverage (%) | 64.2 | 90 40% | 61.3 -5% | 64 0% | 60.9 -5% | 65.2 2% |
| sRGB Coverage (%) | 96.8 | 99.9 3% | 86.7 -10% | 90.2 -7% | 84.2 -13% | 92.5 -4% |
| AdobeRGB 1998 Coverage (%) | 66.4 | 83.6 26% | 62.3 -6% | 65.4 -2% | 61.2 -8% | 66.5 0% |
| Response Times | 45% | 22% | 3% | 40% | -18% | |
| Response Time Grey 50% / Grey 80% * (ms) | 38 ? | 28 ? 26% | 21.2 ? 44% | 36 ? 5% | 31 ? 18% | 42.8 ? -13% |
| Response Time Black / White * (ms) | 26 ? | 9.6 ? 63% | 26 ? -0% | 26 ? -0% | 10 ? 62% | 32 ? -23% |
| PWM Frequency (Hz) | 26000 ? | |||||
| Screen | 15% | 9% | -1% | -31% | -11% | |
| Brightness middle (cd/m²) | 371.1 | 337.2 -9% | 316.5 -15% | 346 -7% | 343 -8% | 320 -14% |
| Brightness (cd/m²) | 343 | 315 -8% | 306 -11% | 307 -10% | 312 -9% | 316 -8% |
| Brightness Distribution (%) | 86 | 86 0% | 93 8% | 84 -2% | 80 -7% | 90 5% |
| Black Level * (cd/m²) | 0.42 | 0.308 27% | 0.21 50% | 0.26 38% | 0.5 -19% | 0.36 14% |
| Contrast (:1) | 884 | 1095 24% | 1507 70% | 1331 51% | 686 -22% | 889 1% |
| Colorchecker dE 2000 * | 4.5 | 2.96 34% | 4.2 7% | 4.32 4% | 7.33 -63% | 4.62 -3% |
| Colorchecker dE 2000 max. * | 9.7 | 5.45 44% | 7.1 27% | 8.05 17% | 10.79 -11% | 9.75 -1% |
| Greyscale dE 2000 * | 3.1 | 2.57 17% | 3.9 -26% | 5.76 -86% | 7.6 -145% | 6 -94% |
| Gamma | 2.17 101% | 2.25 98% | 2.19 100% | 2.35 94% | 2.19 100% | 2.46 89% |
| CCT | 7120 91% | 7114 91% | 7242 90% | 6447 101% | 9024 72% | 6761 96% |
| Color Space (Percent of AdobeRGB 1998) (%) | 61 | 74.3 22% | 56 -8% | 59 -3% | 55 -10% | 60 -2% |
| Color Space (Percent of sRGB) (%) | 97 | 100 3% | 86 -11% | 90 -7% | 84 -13% | 92 -5% |
| Media totale (Programma / Settaggio) | 28% /
21% | 8% /
8% | -0% /
-1% | 0% /
-17% | -10% /
-10% |
* ... Meglio usare valori piccoli
Tempi di risposta del Display
| ↔ Tempi di risposta dal Nero al Bianco | ||
|---|---|---|
| 26 ms ... aumenta ↗ e diminuisce ↘ combinato | ↗ 16 ms Incremento | 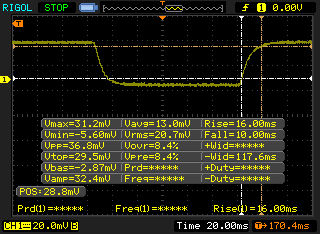 |
| ↘ 10 ms Calo | ||
| Lo schermo mostra tempi di risposta relativamente lenti nei nostri tests e potrebbe essere troppo lento per i gamers. In confronto, tutti i dispositivi di test variano da 0.1 (minimo) a 240 (massimo) ms. » 62 % di tutti i dispositivi è migliore. Questo significa che i tempi di risposta rilevati sono peggiori rispetto alla media di tutti i dispositivi testati (19.9 ms). | ||
| ↔ Tempo di risposta dal 50% Grigio all'80% Grigio | ||
| 38 ms ... aumenta ↗ e diminuisce ↘ combinato | ↗ 19.6 ms Incremento | 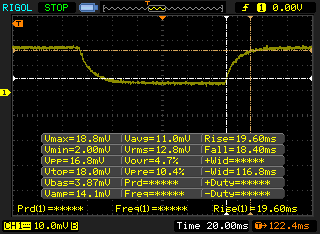 |
| ↘ 18.4 ms Calo | ||
| Lo schermo mostra tempi di risposta lenti nei nostri tests e sarà insoddisfacente per i gamers. In confronto, tutti i dispositivi di test variano da 0.165 (minimo) a 636 (massimo) ms. » 55 % di tutti i dispositivi è migliore. Questo significa che i tempi di risposta rilevati sono peggiori rispetto alla media di tutti i dispositivi testati (31.1 ms). | ||
Sfarfallio dello schermo / PWM (Pulse-Width Modulation)
| flickering dello schermo / PWM non rilevato | 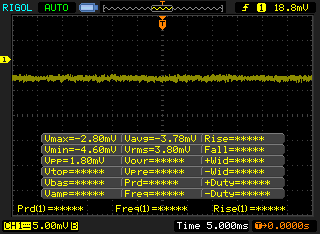 | ||
In confronto: 52 % di tutti i dispositivi testati non utilizza PWM per ridurre la luminosita' del display. Se è rilevato PWM, una media di 7797 (minimo: 5 - massimo: 343500) Hz è stata rilevata. | |||
| Cinebench R10 | |
| Rendering Multiple CPUs 32Bit | |
| Asus Strix GL702VSK | |
| MSI GS73VR 6RF | |
| Acer Aspire V17 Nitro BE VN7-793G-52XN | |
| Rendering Single 32Bit | |
| Asus Strix GL702VSK | |
| MSI GS73VR 6RF | |
| Acer Aspire V17 Nitro BE VN7-793G-52XN | |
| wPrime 2.10 - 1024m | |
| MSI GS73VR 7RF | |
| MSI GS73VR 6RF | |
| Asus Strix GL702VSK | |
* ... Meglio usare valori piccoli
| PCMark 8 | |
| Home Score Accelerated v2 | |
| Asus Strix GL702VSK | |
| Gigabyte Aero 15 | |
| MSI GS73VR 6RF | |
| Acer Aspire V17 Nitro BE VN7-793G-52XN | |
| MSI GS73VR 7RF | |
| Work Score Accelerated v2 | |
| Gigabyte Aero 15 | |
| Acer Aspire V17 Nitro BE VN7-793G-52XN | |
| Asus Strix GL702VSK | |
| MSI GS73VR 6RF | |
| MSI GS73VR 7RF | |
| Creative Score Accelerated v2 | |
| MSI GS73VR 7RF | |
| MSI GS73VR 6RF | |
| Acer Aspire V17 Nitro BE VN7-793G-52XN | |
| PCMark 8 Home Score Accelerated v2 | 3581 punti | |
| PCMark 8 Creative Score Accelerated v2 | 5225 punti | |
| PCMark 8 Work Score Accelerated v2 | 4259 punti | |
Aiuto | ||
| MSI GS73VR 7RF Samsung SM961 MZVKW512HMJP m.2 PCI-e | MSI GS73VR 6RF SanDisk SD8SN8U1T001122 | Asus Strix GL702VSK HGST Travelstar 7K1000 HTS721010A9E630 | Acer Aspire V17 Nitro BE VN7-793G-52XN SK Hynix HFS256G39TND-N210A | Aorus X7 v6 Toshiba NVMe THNSN5512GPU7 | Gigabyte Aero 15 Lite-On CX2-8B512-Q11 | |
|---|---|---|---|---|---|---|
| CrystalDiskMark 3.0 | -63% | -97% | -48% | 28% | 19% | |
| Read Seq (MB/s) | 2459 | 334.3 -86% | 78.3 -97% | 493.1 -80% | 1499 -39% | 1769 -28% |
| Write Seq (MB/s) | 1609 | 319 -80% | 75.5 -95% | 270.2 -83% | 1411 -12% | 1133 -30% |
| Read 512 (MB/s) | 445.2 | 242.3 -46% | 34 -92% | 325.8 -27% | 966 117% | 891 100% |
| Write 512 (MB/s) | 748 | 254.4 -66% | 43.9 -94% | 267.8 -64% | 1103 47% | 1069 43% |
| Read 4k (MB/s) | 48.5 | 20.3 -58% | 0.5 -99% | 28.4 -41% | 44.33 -9% | 44.7 -8% |
| Write 4k (MB/s) | 131.5 | 42.51 -68% | 1.1 -99% | 76.2 -42% | 155.5 18% | 123.3 -6% |
| Read 4k QD32 (MB/s) | 454.1 | 251.6 -45% | 1.1 -100% | 344.6 -24% | 696 53% | 645 42% |
| Write 4k QD32 (MB/s) | 355.3 | 167.1 -53% | 1.1 -100% | 267 -25% | 531 49% | 490.5 38% |

| 3DMark 11 | |
| 1280x720 Performance GPU | |
| Aorus X7 v6 | |
| Asus Strix GL702VSK | |
| MSI GS73VR 6RF | |
| Acer Aspire V17 Nitro BE VN7-793G-52XN | |
| MSI GS73VR 7RF | |
| Gigabyte Aero 15 | |
| 1280x720 Performance Combined | |
| Aorus X7 v6 | |
| Gigabyte Aero 15 | |
| MSI GS73VR 7RF | |
| MSI GS73VR 6RF | |
| Asus Strix GL702VSK | |
| Acer Aspire V17 Nitro BE VN7-793G-52XN | |
| 3DMark | |
| 1280x720 Cloud Gate Standard Graphics | |
| Aorus X7 v6 | |
| Gigabyte Aero 15 | |
| Asus Strix GL702VSK | |
| MSI GS73VR 6RF | |
| Acer Aspire V17 Nitro BE VN7-793G-52XN | |
| MSI GS73VR 7RF | |
| 1920x1080 Fire Strike Graphics | |
| Asus Strix GL702VSK | |
| Aorus X7 v6 | |
| MSI GS73VR 6RF | |
| MSI GS73VR 7RF | |
| Gigabyte Aero 15 | |
| Acer Aspire V17 Nitro BE VN7-793G-52XN | |
| 1920x1080 Ice Storm Extreme Graphics | |
| Asus Strix GL702VSK | |
| MSI GS73VR 6RF | |
| Acer Aspire V17 Nitro BE VN7-793G-52XN | |
| MSI GS73VR 7RF | |
| 3DMark 11 Performance | 12579 punti | |
| 3DMark Ice Storm Standard Score | 28688 punti | |
| 3DMark Cloud Gate Standard Score | 20795 punti | |
| 3DMark Fire Strike Score | 9675 punti | |
| 3DMark Fire Strike Extreme Score | 5100 punti | |
Aiuto | ||
| BioShock Infinite - 1920x1080 Ultra Preset, DX11 (DDOF) (ordina per valore) | |
| MSI GS73VR 7RF | |
| MSI GS73VR 6RF | |
| Asus Strix GL702VSK | |
| Acer Aspire V17 Nitro BE VN7-793G-52XN | |
| Metro: Last Light - 1920x1080 Very High (DX11) AF:16x (ordina per valore) | |
| MSI GS73VR 7RF | |
| MSI GS73VR 6RF | |
| Asus Strix GL702VSK | |
| Thief - 1920x1080 Very High Preset AA:FXAA & High SS AF:8x (ordina per valore) | |
| MSI GS73VR 7RF | |
| MSI GS73VR 6RF | |
| Asus Strix GL702VSK | |
| The Witcher 3 - 1920x1080 Ultra Graphics & Postprocessing (HBAO+) (ordina per valore) | |
| MSI GS73VR 7RF | |
| Asus Strix GL702VSK | |
| Acer Aspire V17 Nitro BE VN7-793G-52XN | |
| Gigabyte Aero 15 | |
| Fallout 4 - 1920x1080 Ultra Preset AA:T AF:16x (ordina per valore) | |
| MSI GS73VR 7RF | |
| MSI GS73VR 6RF | |
| Asus Strix GL702VSK | |
| Rise of the Tomb Raider | |
| 1920x1080 Very High Preset AA:FX AF:16x (ordina per valore) | |
| MSI GS73VR 7RF | |
| MSI GS73VR 6RF | |
| Asus Strix GL702VSK | |
| Acer Aspire V17 Nitro BE VN7-793G-52XN | |
| Aorus X7 v6 | |
| 3840x2160 High Preset AA:FX AF:4x (ordina per valore) | |
| MSI GS73VR 7RF | |
| Hitman 2016 - 1920x1080 Ultra / On AA:SM AF:16x (ordina per valore) | |
| MSI GS73VR 7RF | |
| Ashes of the Singularity | |
| 1920x1080 high (ordina per valore) | |
| MSI GS73VR 7RF | |
| Asus Strix GL702VSK | |
| 3840x2160 crazy (ordina per valore) | |
| MSI GS73VR 7RF | |
| Doom | |
| 1920x1080 Ultra Preset AA:SM (ordina per valore) | |
| MSI GS73VR 7RF | |
| MSI GS73VR 6RF | |
| Asus Strix GL702VSK | |
| Aorus X7 v6 | |
| 3840x2160 High Preset AA:FX (ordina per valore) | |
| MSI GS73VR 7RF | |
| Deus Ex Mankind Divided - 1920x1080 Ultra Preset AA:2xMS AF:8x (ordina per valore) | |
| MSI GS73VR 7RF | |
| Aorus X7 v6 | |
| Mafia 3 - 1920x1080 High Preset (ordina per valore) | |
| MSI GS73VR 7RF | |
| Asus Strix GL702VSK | |
| Civilization 6 | |
| 1920x1080 Ultra Preset AA:4xMS (ordina per valore) | |
| MSI GS73VR 7RF | |
| 3840x2160 High Preset (ordina per valore) | |
| MSI GS73VR 7RF | |
| basso | medio | alto | ultra | 4K | |
|---|---|---|---|---|---|
| BioShock Infinite (2013) | 134 | ||||
| Metro: Last Light (2013) | 76 | ||||
| Thief (2014) | 60 | ||||
| The Witcher 3 (2015) | 41 | ||||
| Fallout 4 (2015) | 71 | ||||
| Rise of the Tomb Raider (2016) | 51 | 16 | |||
| Hitman 2016 (2016) | 57 | ||||
| Ashes of the Singularity (2016) | 54 | 24 | |||
| Doom (2016) | 89 | 30 | |||
| Deus Ex Mankind Divided (2016) | 30 | ||||
| Mafia 3 (2016) | 47 | ||||
| Civilization 6 (2016) | 43 | 37 |
Rumorosità
| Idle |
| 30.8 / 30.8 / 30.9 dB(A) |
| Sotto carico |
| 42.2 / 48.6 dB(A) |
 | ||
30 dB silenzioso 40 dB(A) udibile 50 dB(A) rumoroso |
||
min: | ||
| MSI GS73VR 7RF GeForce GTX 1060 Mobile, i7-7700HQ, Samsung SM961 MZVKW512HMJP m.2 PCI-e | MSI GS73VR 6RF GeForce GTX 1060 Mobile, 6700HQ, SanDisk SD8SN8U1T001122 | Asus Strix GL702VSK GeForce GTX 1070 Mobile, i7-7700HQ, HGST Travelstar 7K1000 HTS721010A9E630 | Acer Aspire V17 Nitro BE VN7-793G-52XN GeForce GTX 1060 Mobile, i5-7300HQ, SK Hynix HFS256G39TND-N210A | Aorus X7 v6 GeForce GTX 1070 Mobile, 6820HK, Toshiba NVMe THNSN5512GPU7 | Gigabyte Aero 15 GeForce GTX 1060 Mobile, i7-7700HQ, Lite-On CX2-8B512-Q11 | |
|---|---|---|---|---|---|---|
| Noise | -5% | 1% | 4% | -12% | -3% | |
| off /ambiente * (dB) | 28.1 | 28.4 -1% | 28.6 -2% | 30.7 -9% | 30 -7% | 31 -10% |
| Idle Minimum * (dB) | 30.8 | 31.9 -4% | 30.6 1% | 30.7 -0% | 33 -7% | 32 -4% |
| Idle Average * (dB) | 30.8 | 32 -4% | 30.6 1% | 30.7 -0% | 35 -14% | 33 -7% |
| Idle Maximum * (dB) | 30.9 | 34 -10% | 30.6 1% | 31.4 -2% | 40 -29% | 34 -10% |
| Load Average * (dB) | 42.2 | 47 -11% | 39.8 6% | 32.1 24% | 43 -2% | 39 8% |
| Witcher 3 ultra * (dB) | 44.4 | 42.8 4% | 43 3% | |||
| Load Maximum * (dB) | 48.6 | 49.4 -2% | 48 1% | 42.8 12% | 54 -11% | 50 -3% |
* ... Meglio usare valori piccoli
(-) La temperatura massima sul lato superiore è di 50.2 °C / 122 F, rispetto alla media di 40.4 °C / 105 F, che varia da 21.2 a 68.8 °C per questa classe Gaming.
(-) Il lato inferiore si riscalda fino ad un massimo di 55.6 °C / 132 F, rispetto alla media di 43.2 °C / 110 F
(+) In idle, la temperatura media del lato superiore è di 25.2 °C / 77 F, rispetto alla media deld ispositivo di 33.9 °C / 93 F.
(+) Riproducendo The Witcher 3, la temperatura media per il lato superiore e' di 28.2 °C / 83 F, rispetto alla media del dispositivo di 33.9 °C / 93 F.
(+) I poggiapolsi e il touchpad sono piu' freddi della temperatura della pelle con un massimo di 30.8 °C / 87.4 F e sono quindi freddi al tatto.
(±) La temperatura media della zona del palmo della mano di dispositivi simili e'stata di 28.8 °C / 83.8 F (-2 °C / -3.6 F).
MSI GS73VR 7RF analisi audio
(+) | gli altoparlanti sono relativamente potenti (82 dB)
Bassi 100 - 315 Hz
(-) | quasi nessun basso - in media 18.1% inferiori alla media
(±) | la linearità dei bassi è media (13.2% delta rispetto alla precedente frequenza)
Medi 400 - 2000 Hz
(±) | medi elevati - circa 5.2% superiore alla media
(±) | linearità dei medi adeguata (8.3% delta rispetto alla precedente frequenza)
Alti 2 - 16 kHz
(±) | alti elevati - circa 7.9% superiori alla media
(±) | la linearità degli alti è media (8.9% delta rispetto alla precedente frequenza)
Nel complesso 100 - 16.000 Hz
(±) | la linearità complessiva del suono è media (26.2% di differenza rispetto alla media
Rispetto alla stessa classe
» 92% di tutti i dispositivi testati in questa classe è stato migliore, 1% simile, 6% peggiore
» Il migliore ha avuto un delta di 6%, medio di 18%, peggiore di 132%
Rispetto a tutti i dispositivi testati
» 80% di tutti i dispositivi testati in questa classe è stato migliore, 4% similare, 16% peggiore
» Il migliore ha avuto un delta di 4%, medio di 24%, peggiore di 134%
Asus Strix GL702VSK analisi audio
(±) | potenza degli altiparlanti media ma buona (78.9 dB)
Bassi 100 - 315 Hz
(±) | bassi ridotti - in media 8.8% inferiori alla media
(±) | la linearità dei bassi è media (14.3% delta rispetto alla precedente frequenza)
Medi 400 - 2000 Hz
(+) | medi bilanciati - solo only 1.5% rispetto alla media
(+) | medi lineari (5.9% delta rispetto alla precedente frequenza)
Alti 2 - 16 kHz
(±) | alti elevati - circa 8.2% superiori alla media
(±) | la linearità degli alti è media (14.2% delta rispetto alla precedente frequenza)
Nel complesso 100 - 16.000 Hz
(±) | la linearità complessiva del suono è media (22.3% di differenza rispetto alla media
Rispetto alla stessa classe
» 80% di tutti i dispositivi testati in questa classe è stato migliore, 6% simile, 14% peggiore
» Il migliore ha avuto un delta di 6%, medio di 18%, peggiore di 132%
Rispetto a tutti i dispositivi testati
» 65% di tutti i dispositivi testati in questa classe è stato migliore, 6% similare, 29% peggiore
» Il migliore ha avuto un delta di 4%, medio di 24%, peggiore di 134%
| Off / Standby | |
| Idle | |
| Sotto carico |
|
Leggenda:
min: | |
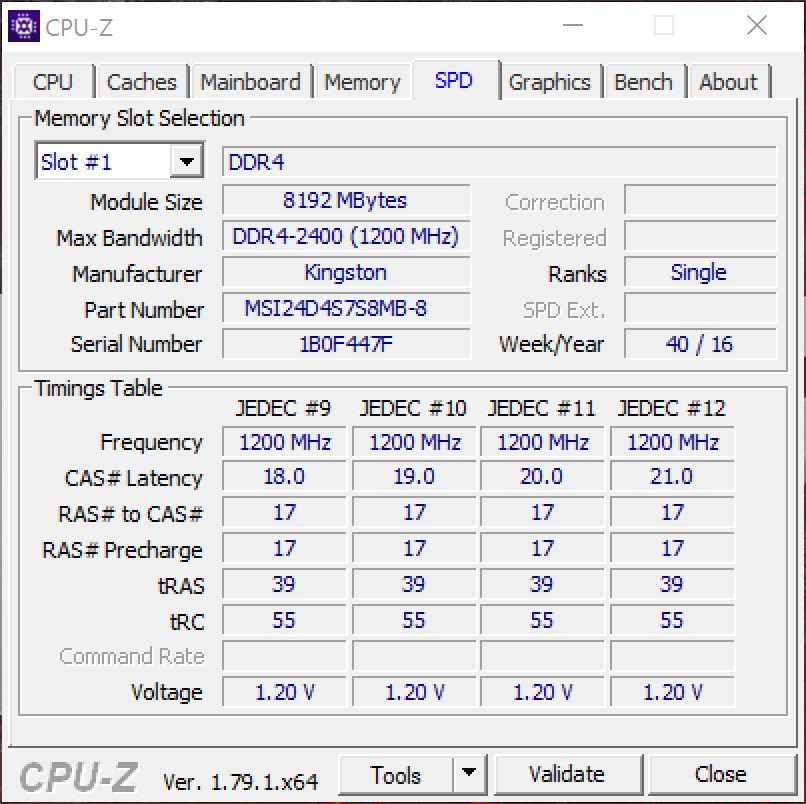
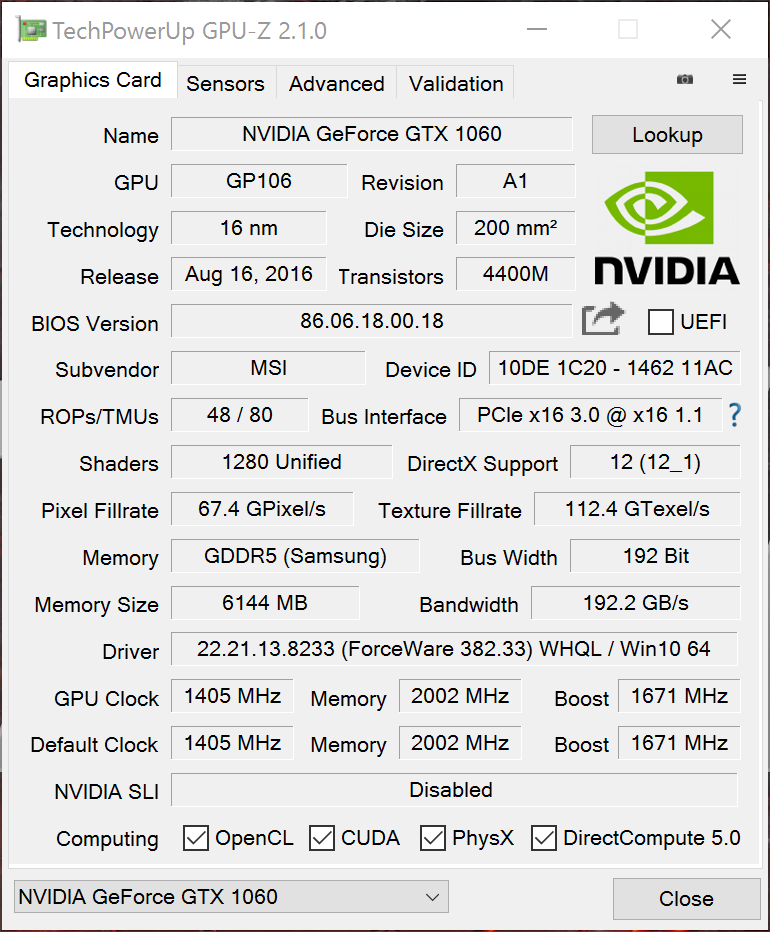
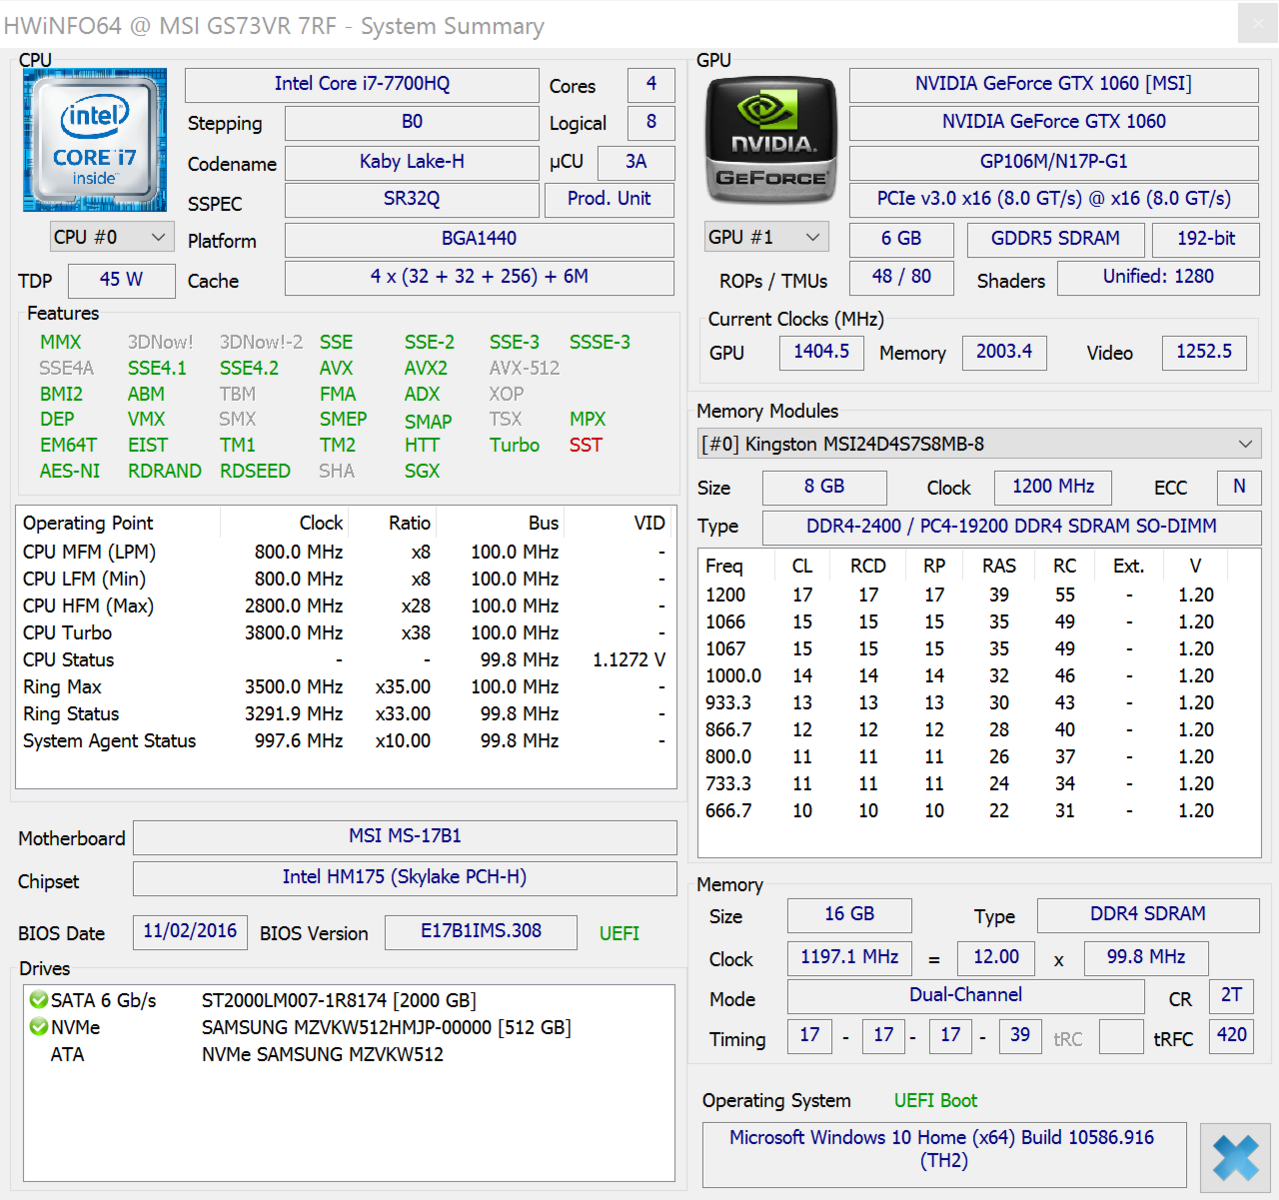
| MSI GS73VR 7RF i7-7700HQ, GeForce GTX 1060 Mobile, Samsung SM961 MZVKW512HMJP m.2 PCI-e, IPS, 3840x2160, 17.3" | MSI GS73VR 6RF 6700HQ, GeForce GTX 1060 Mobile, SanDisk SD8SN8U1T001122, TN LED, 1920x1080, 17.3" | Asus Strix GL702VSK i7-7700HQ, GeForce GTX 1070 Mobile, HGST Travelstar 7K1000 HTS721010A9E630, IPS, 1920x1080, 17.3" | Acer Aspire V17 Nitro BE VN7-793G-52XN i5-7300HQ, GeForce GTX 1060 Mobile, SK Hynix HFS256G39TND-N210A, a-Si TFT-LCD, WLED, 1920x1080, 17.3" | Aorus X7 v6 6820HK, GeForce GTX 1070 Mobile, Toshiba NVMe THNSN5512GPU7, TN LED, 2560x1440, 17.3" | Gigabyte Aero 15 i7-7700HQ, GeForce GTX 1060 Mobile, Lite-On CX2-8B512-Q11, IPS, 1920x1080, 15.6" | |
|---|---|---|---|---|---|---|
| Power Consumption | -32% | -23% | 26% | -53% | 15% | |
| Idle Minimum * (Watt) | 14.2 | 22.6 -59% | 20.9 -47% | 7.8 45% | 29 -104% | 12 15% |
| Idle Average * (Watt) | 23.5 | 32.7 -39% | 22.9 3% | 13.3 43% | 31 -32% | 15 36% |
| Idle Maximum * (Watt) | 23.8 | 32.8 -38% | 23.1 3% | 16.6 30% | 38 -60% | 20 16% |
| Load Average * (Watt) | 90.9 | 114.7 -26% | 147.2 -62% | 73 20% | 111 -22% | 82 10% |
| Witcher 3 ultra * (Watt) | 116 | 118 -2% | 111 4% | |||
| Load Maximum * (Watt) | 171.6 | 167.9 2% | 188.1 -10% | 140 18% | 253 -47% | 161 6% |
* ... Meglio usare valori piccoli
| MSI GS73VR 7RF i7-7700HQ, GeForce GTX 1060 Mobile, 65 Wh | MSI GS73VR 6RF 6700HQ, GeForce GTX 1060 Mobile, 65 Wh | Asus Strix GL702VSK i7-7700HQ, GeForce GTX 1070 Mobile, 76 Wh | Acer Aspire V17 Nitro BE VN7-793G-52XN i5-7300HQ, GeForce GTX 1060 Mobile, 69 Wh | Aorus X7 v6 6820HK, GeForce GTX 1070 Mobile, 94 Wh | Gigabyte Aero 15 i7-7700HQ, GeForce GTX 1060 Mobile, 94.24 Wh | |
|---|---|---|---|---|---|---|
| Autonomia della batteria | 24% | 28% | 127% | 11% | 127% | |
| Reader / Idle (h) | 5 | 5.9 18% | 5.1 2% | 10.3 106% | 10.6 112% | |
| WiFi v1.3 (h) | 2.7 | 3.6 33% | 3.4 26% | 6.2 130% | 3 11% | 7 159% |
| Load (h) | 0.9 | 1.1 22% | 1.4 56% | 2.2 144% | 1.9 111% |
Pro
Contro
L'MSI GS73VR 7RF più che un upgrade è una rifinitura. Se il 6RF era la revisione della linea sottile e leggera MSI da 17,3", il 7RF completa questa idea. Pertanto, migliora gli aspetti positivi del predecessore ma mantiene anche i punti deboli. Ancora una volta lodiamo l'eccellente tastiera, lo chassis premium, e le eccellenti prestazioni gaming. Tuttavia, le possibilità di upgrade sono complicate, le ventole rumorose e le porte sono troppo ravvicinate. Inoltre abbiamo riscontrato un comportamento anomalo durante il test, e abbiamo una sensazione mista rispetto al 7RF.
Lo schermo ha aspetti vari. Colori e qualità dell'immagine sono eccellenti, ma la risoluzione 4K non è necessaria. Come opzione è interessante, ma di base è un orpello. I componenti interni sono più adatti per giocare in Full HD, mentre le risoluzioni superiori creano problemi invece di risolverli. I creatori di contenuti faranno largo uso del pannello UHD, ma la maggioranza degli utenti non noteranno nemmeno la differenza. L'opzione del pannello Full HD è la scelta che raccomandiamo ai giocatori, in quanto impegna di meno il sistema, incrementa l'autonomia, e riduce il costo.
il GS73VR 7RF è un portatile competente che fa bene molte cose. Offre prestazioni eccellenti in un pacchetto molto sottile. Tuttavia, il mercato dei portatili sottili e leggeri è esploso negli ultimi anni. Altre aziende offrono portatili più potenti, come Razer, Gigabyte, ed Asus. Sebbene non ci sia ancora il portatile gaming compatto perfetto, ci sono molti dispositivi fantastici tra cui scegliere.
Sebbene il GS73VR 7RF offra evidenti miglioramenti rispetto al suo predecessore, sono marginali in definitiva. Il GS73VR 6RF è buono ma si possono trovare dispositivi nuovi ed usati a prezzi inferiori. Altre opzioni come il Gigabyte Aero 15, offrono prestazioni simili per un prezzo uguale o inferiore, con aspetti che potrebbero interessare in particolare i giocatori.
L'MSI GS73VR 7RF è una macchina buona ma è frenata da alcune pecche. Nel complesso il portatile va bene, ma ci sono opzioni migliori a disposizione.
Nota: si tratta di una recensione breve, con alcune sezioni non tradotte, per la versione integrale in inglese guardate qui.
MSI GS73VR 7RF
- 06/13/2017 v6 (old)
Sam Medley
Price comparison
