Recensione del Laptop HP Pavilion 13 2020 Core i7 11° gen: è abbastanza buono
Per quanto sia nota la serie HP Pavilion, è da molto tempo che non recensiamo un modello da 13,3 pollici. Abbiamo avuto la nostra bella quantità di computer portatili da 15,6 pollici Pavilion 15 e 17,3 pollici Pavilion 17 nel corso degli anni, ma questo è il nostro primo Pavilion 13 a conchiglia. Come si confronta questo subnotebook di HP con l'oceano di altri subnotebooks presenti sul mercato?
La nostra unità di prova è una configurazione di fascia alta dell'HP 2020 Pavilion 13 con CPU Core i7-1165G7 di 11° generazione, display UHD 4K, 16 GB di RAM ed SSD NVMe da 512 GB e costa circa $900 USD. Configurazioni inferiori con il Core i5-1135G7, display 1080p, 8 GB di RAM ed SSD NVMe da 256 GB sono disponibili per 730 USD o anche meno. Purtroppo, non ci sono opzioni di colore nero al momento della recensioen.
I concorrenti dell'HP Pavilion 13 includono altri subnotebooks economici come il Lenovo IdeaPad S540 13, Dell Inspiron 13, Acer Swift 3 o Asus VivoBook S13.
Altre recensioni HP:
potential competitors in comparison
Punteggio | Data | Modello | Peso | Altezza | Dimensione | Risoluzione | Prezzo |
|---|---|---|---|---|---|---|---|
| 81.5 % v7 (old) | 12/2020 | HP Pavilion 13-bb0015cl i7-1165G7, Iris Xe G7 96EUs | 1.2 kg | 17.7 mm | 13.30" | 3840x2160 | |
| 87.1 % v7 (old) | 12/2020 | HP Envy 13-ba0001ng i7-10510U, GeForce MX350 | 1.3 kg | 16 mm | 13.30" | 1920x1080 | |
| 88.8 % v7 (old) | 03/2020 | Dell XPS 13 9300 i5 FHD i5-1035G1, UHD Graphics G1 (Ice Lake 32 EU) | 1.2 kg | 14.8 mm | 13.40" | 1920x1200 | |
| 85 % v6 (old) | 12/2018 | Asus VivoBook S13 S330UA-EY034T i5-8550U, UHD Graphics 620 | 1.2 kg | 17.9 mm | 13.30" | 1920x1080 | |
| 85 % v7 (old) | 11/2020 | Lenovo IdeaPad S540-13ARE-82DL000YGE R5 4600U, Vega 6 | 1.3 kg | 15.95 mm | 13.30" | 2560x1600 | |
| 87 % v7 (old) | 02/2020 | Acer Swift 3 SF313-52-71Y7 i7-1065G7, Iris Plus Graphics G7 (Ice Lake 64 EU) | 1.2 kg | 16.6 mm | 13.50" | 2256x1504 |
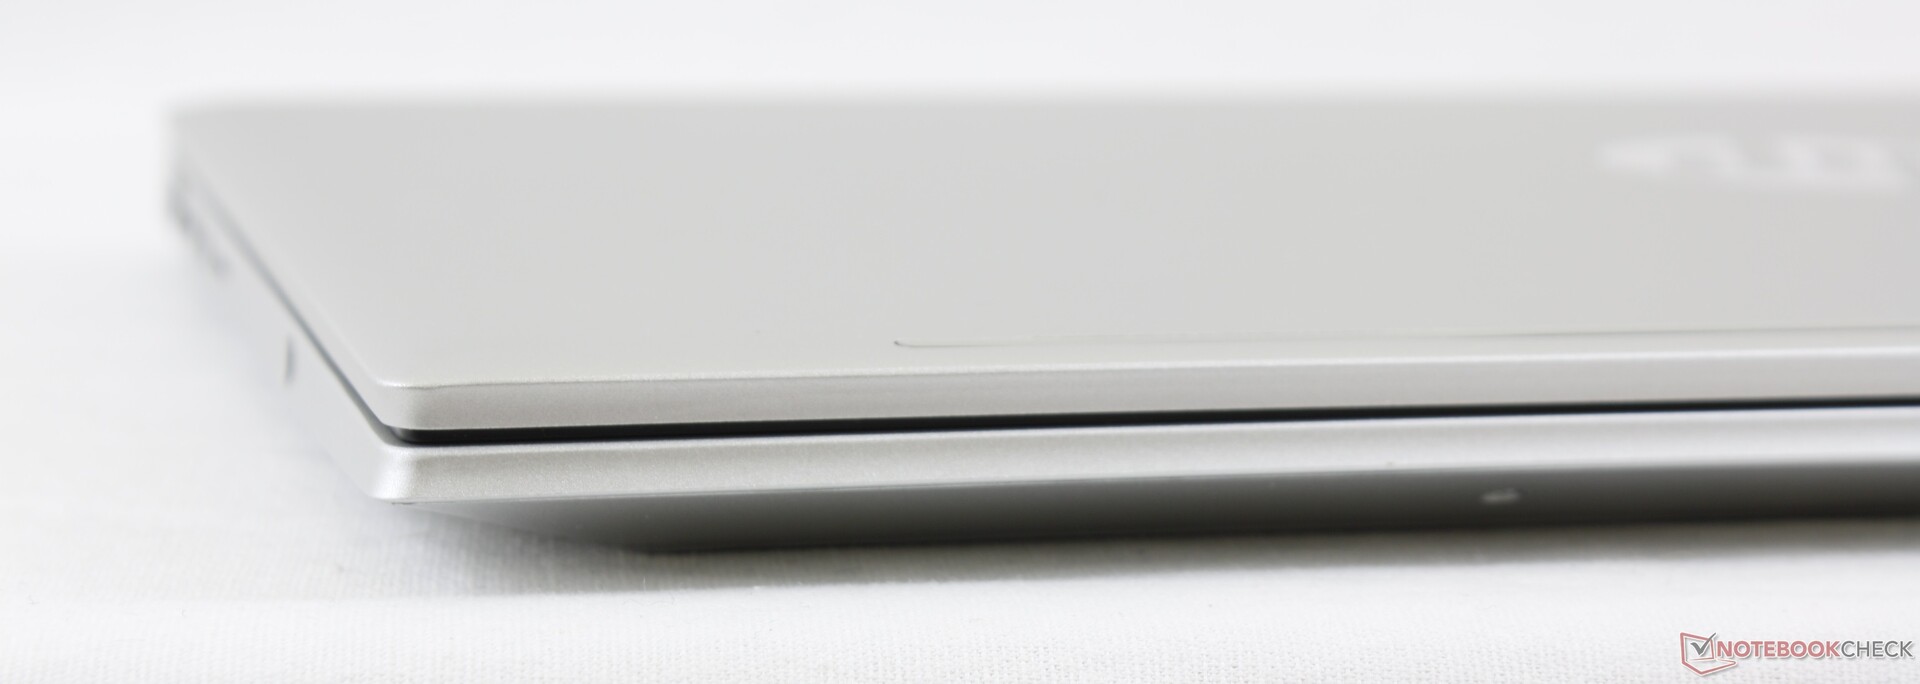
Case
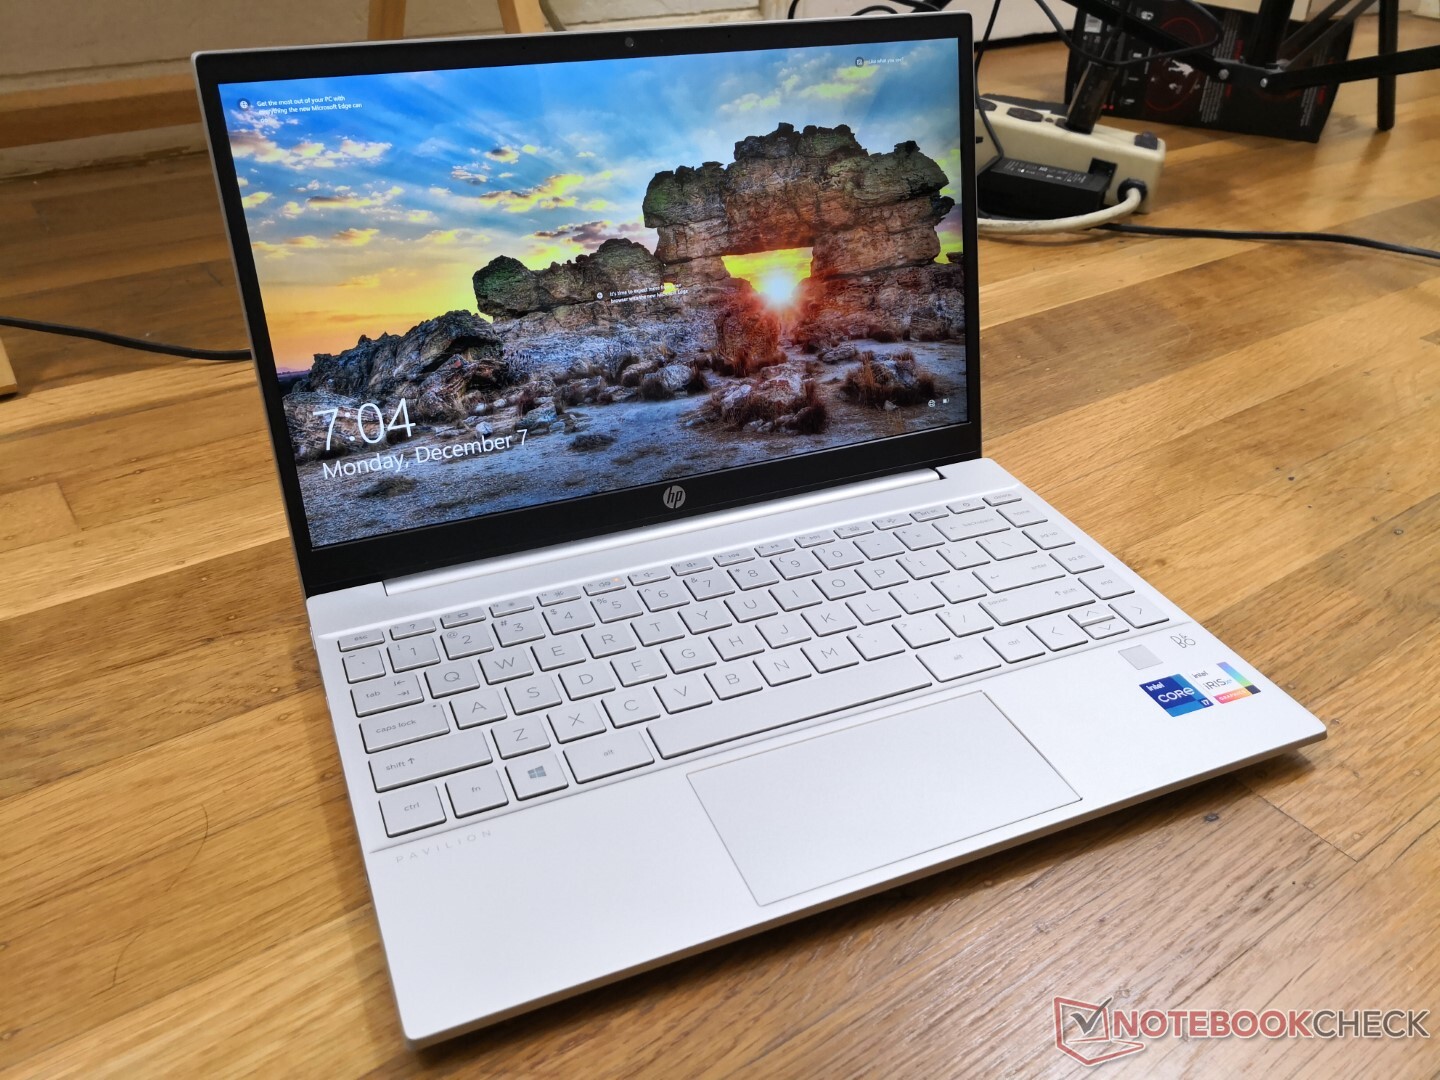
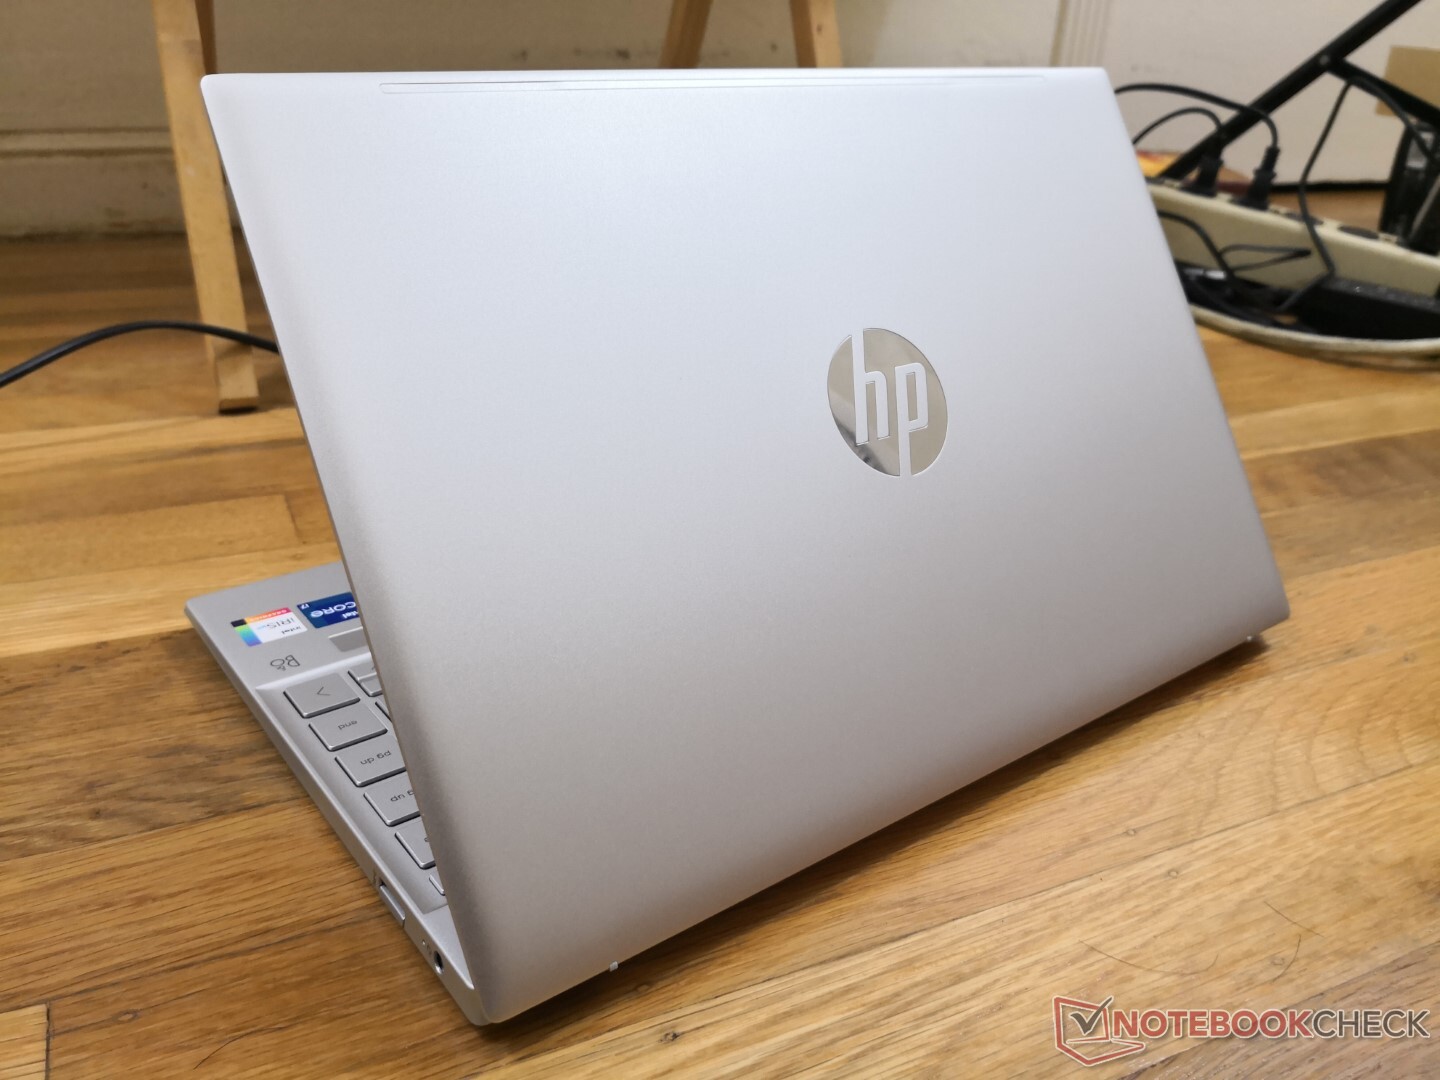
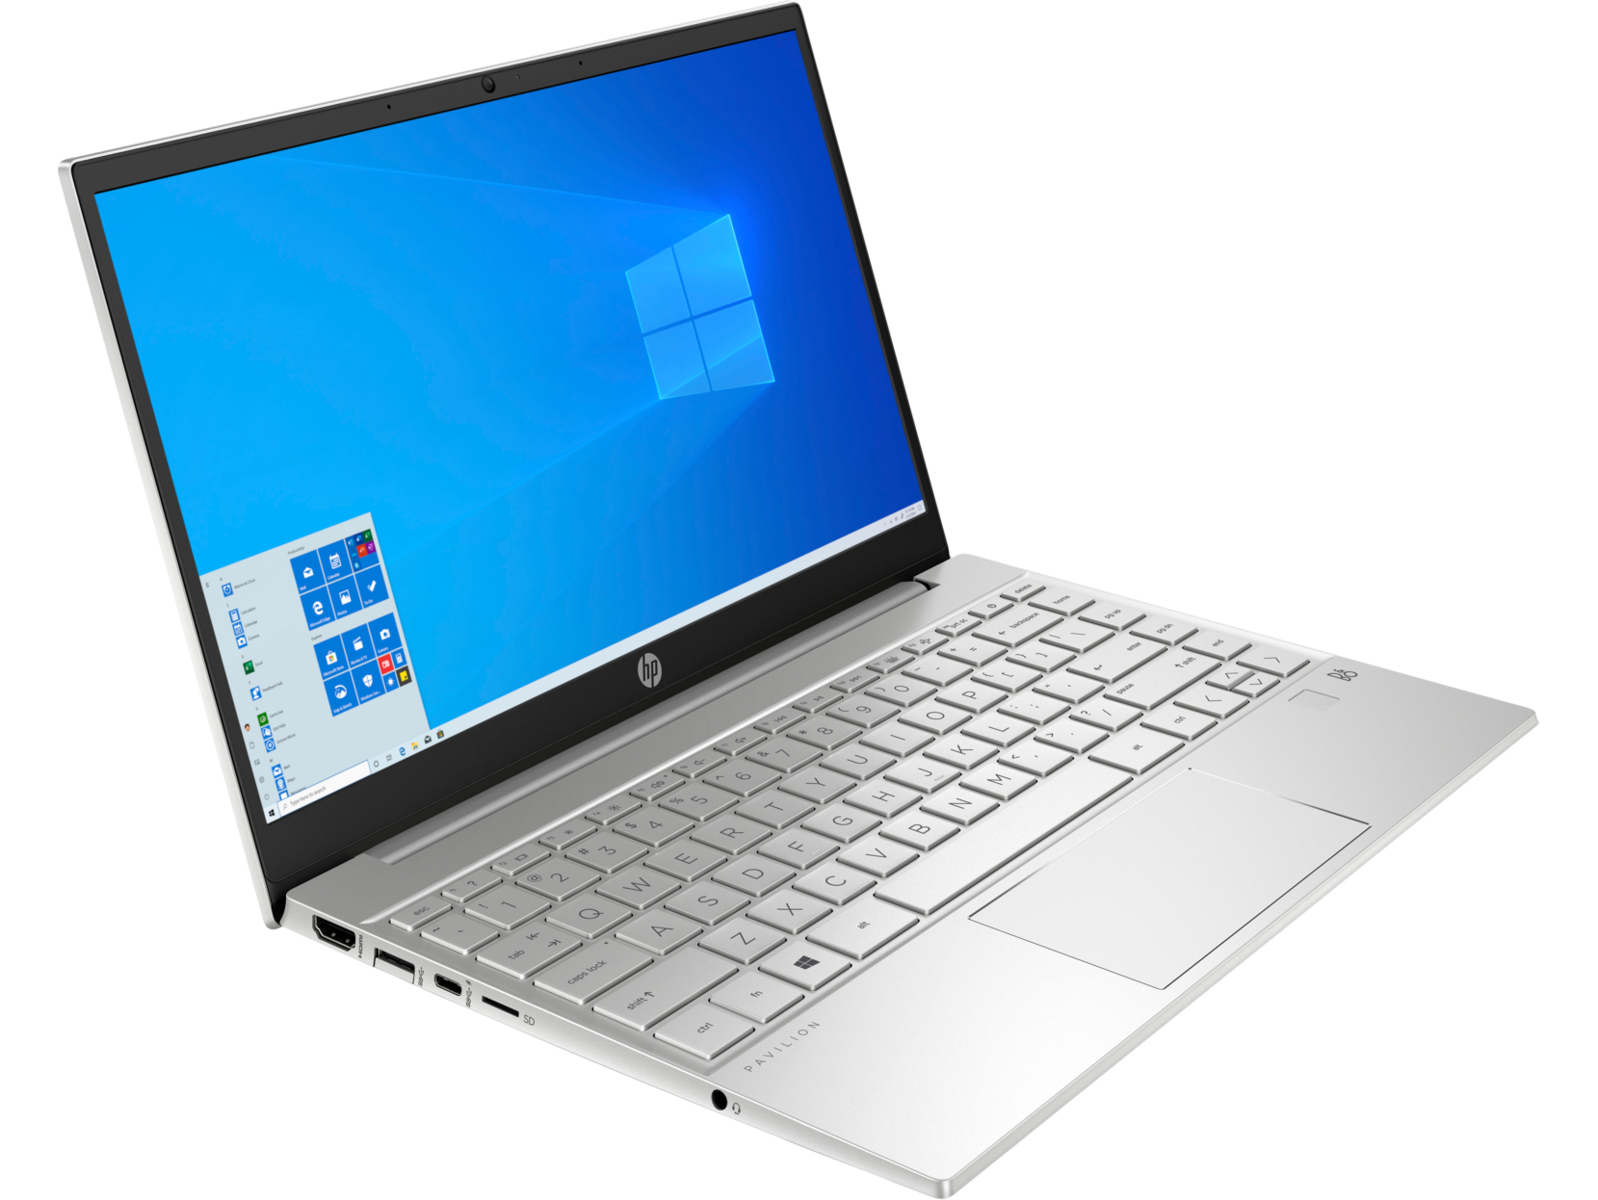
I vecchi computer portatili Pavilion erano spessi e sembravano cheap rispecchiando il loro prezzo contenuto. Su quest'ultimo 2020 Pavilion 13, tuttavia, HP ha eliminato molte delle caratteristiche di design delle serie Envy e Spectre per un look più semplice ed elegante. Il risultato finale è un portatile più snello che sembra più costoso rispetto al suo prezzo reale. Per via della colorazione d'oro e marrone si potrebbe facilmente confondere con un Envy 13 a prima vista.
Trascorrete un po' più di tempo con il Pavilion 13 e i tagli diventano più evidenti. A differenza dell'Envy 13 o dello Spectre 13, a cui questo Pavilion aspira, il case è ancora per lo più in plastica e più suscettibile alle flessioni e alle deformazioni. Spingendo verso il basso al centro della tastiera, ad esempio, la superficie si deforma più che sulle alternative di fascia alta di HP. Anche la cover si flette più facilmente. Le impressioni complessive sono comunque molto migliori di quanto ci si aspettasse da un portatile economico, anche se sono ancora un paio di passi indietro rispetto ai costosi HP Envy, Lenovo Yoga, Asus ZenBook o Dell XPS.
Le dimensioni d'ingombro sono solo un po' più grandi dell'Envy 13, poiché la cornice inferiore del Pavilion è leggermente più spessa. Per il resto, il sistema è leggero come l'XPS 13 nonostante le differenze di dimensioni.
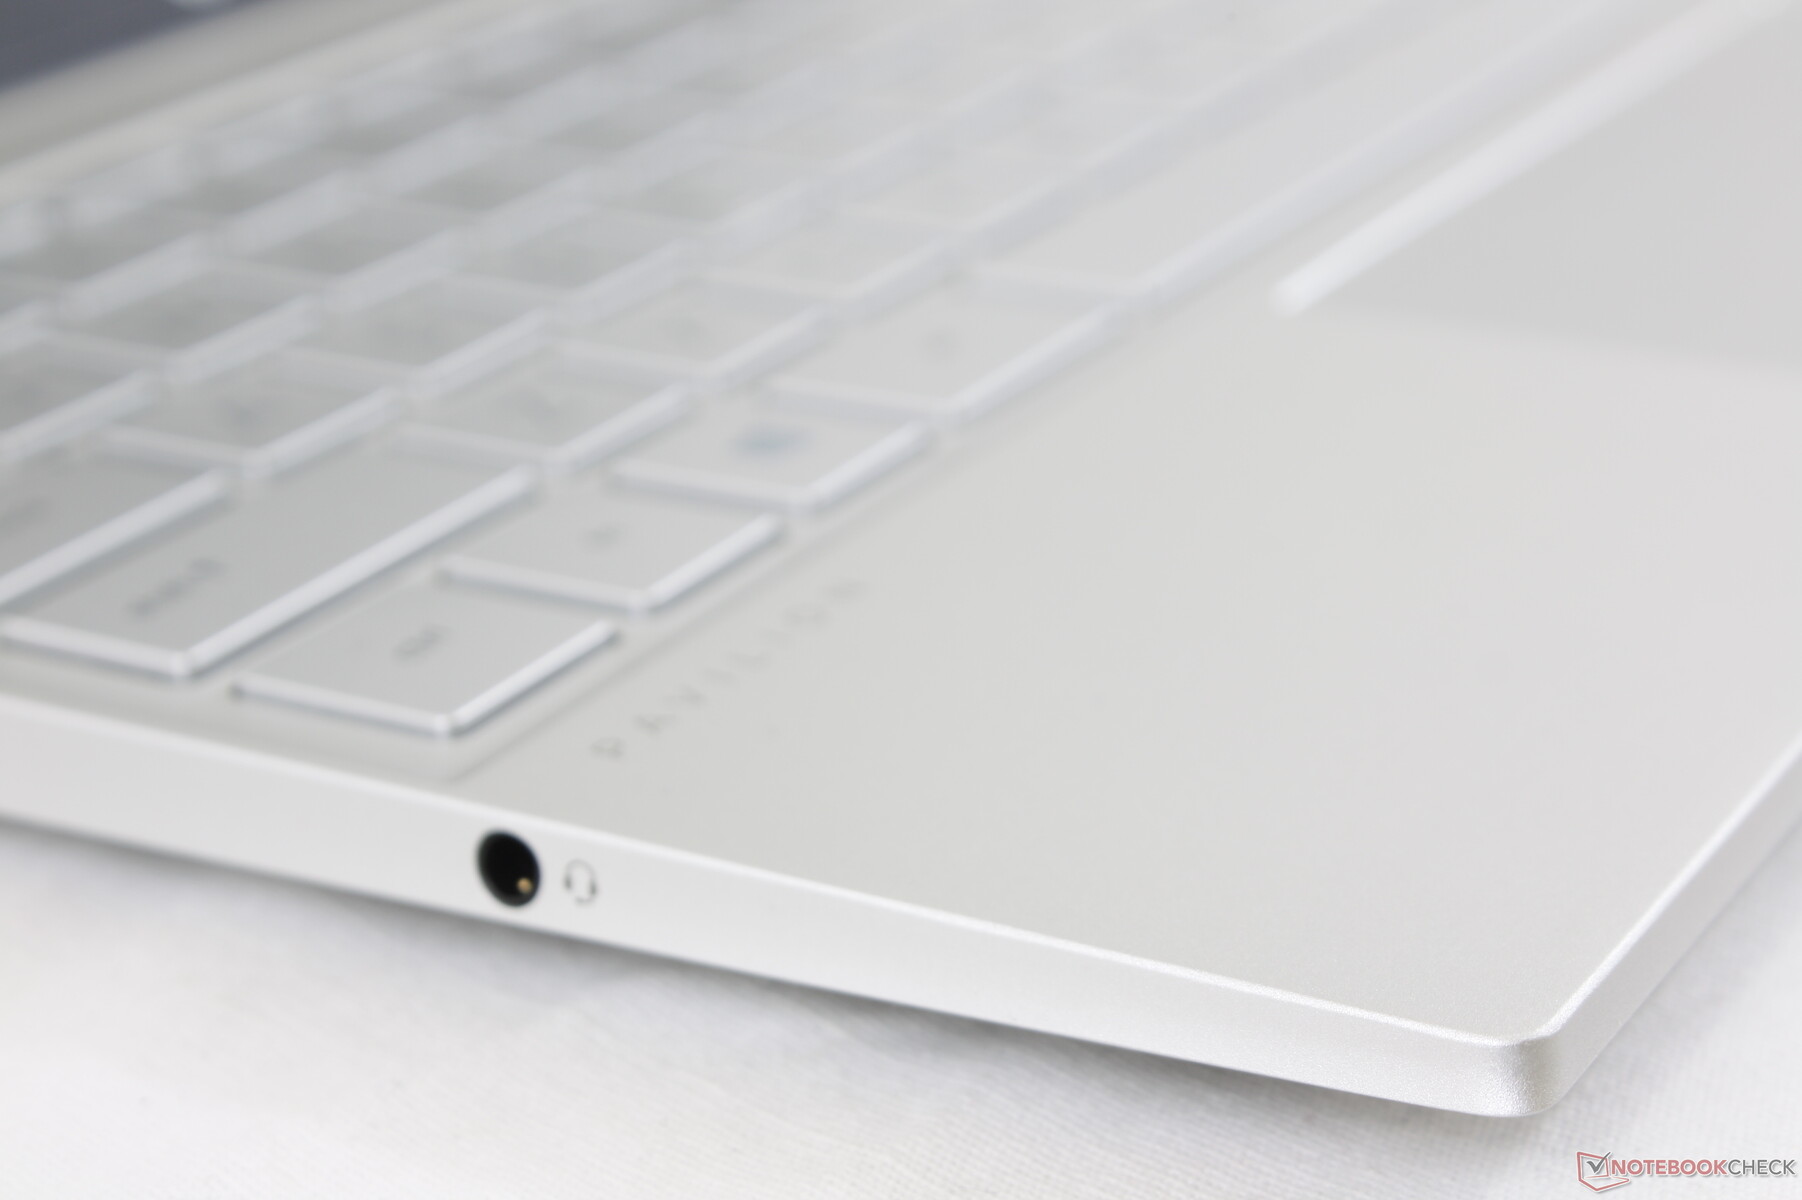
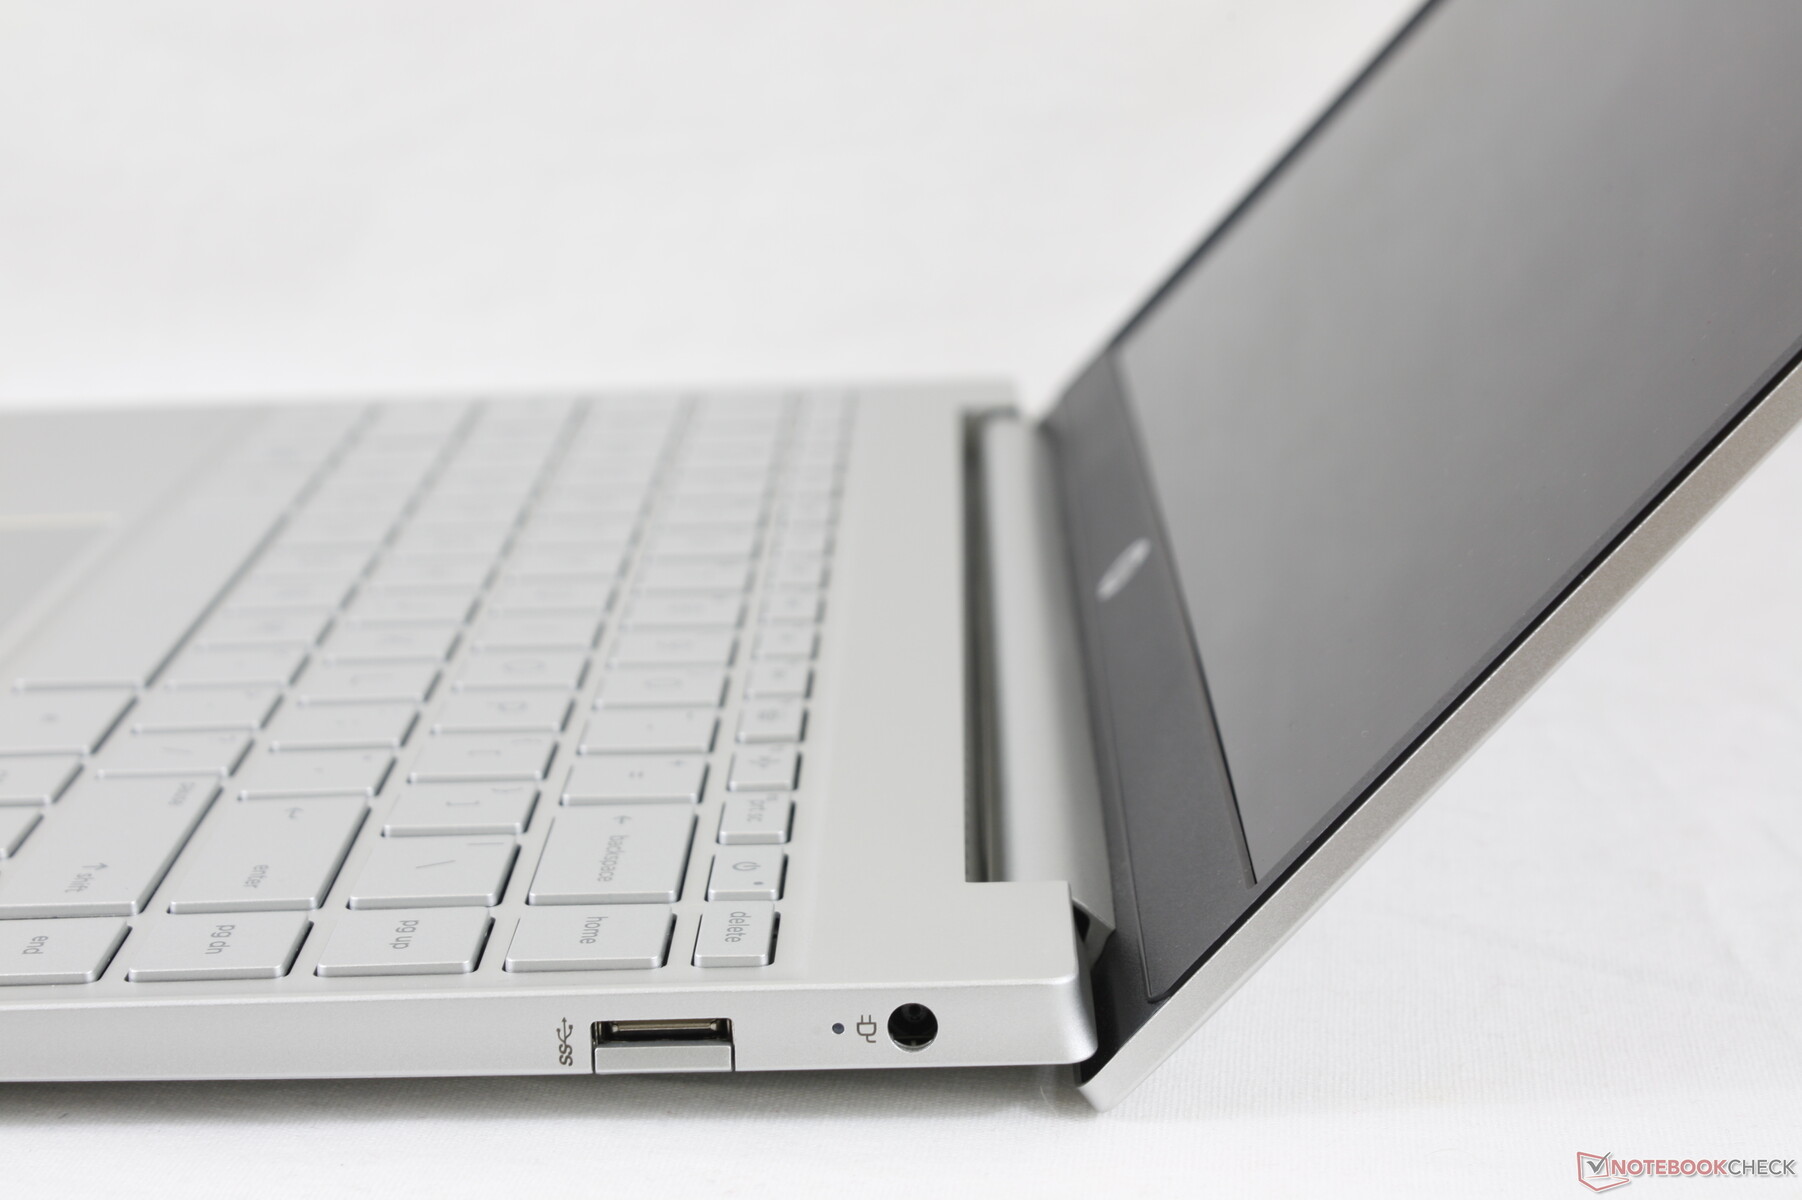
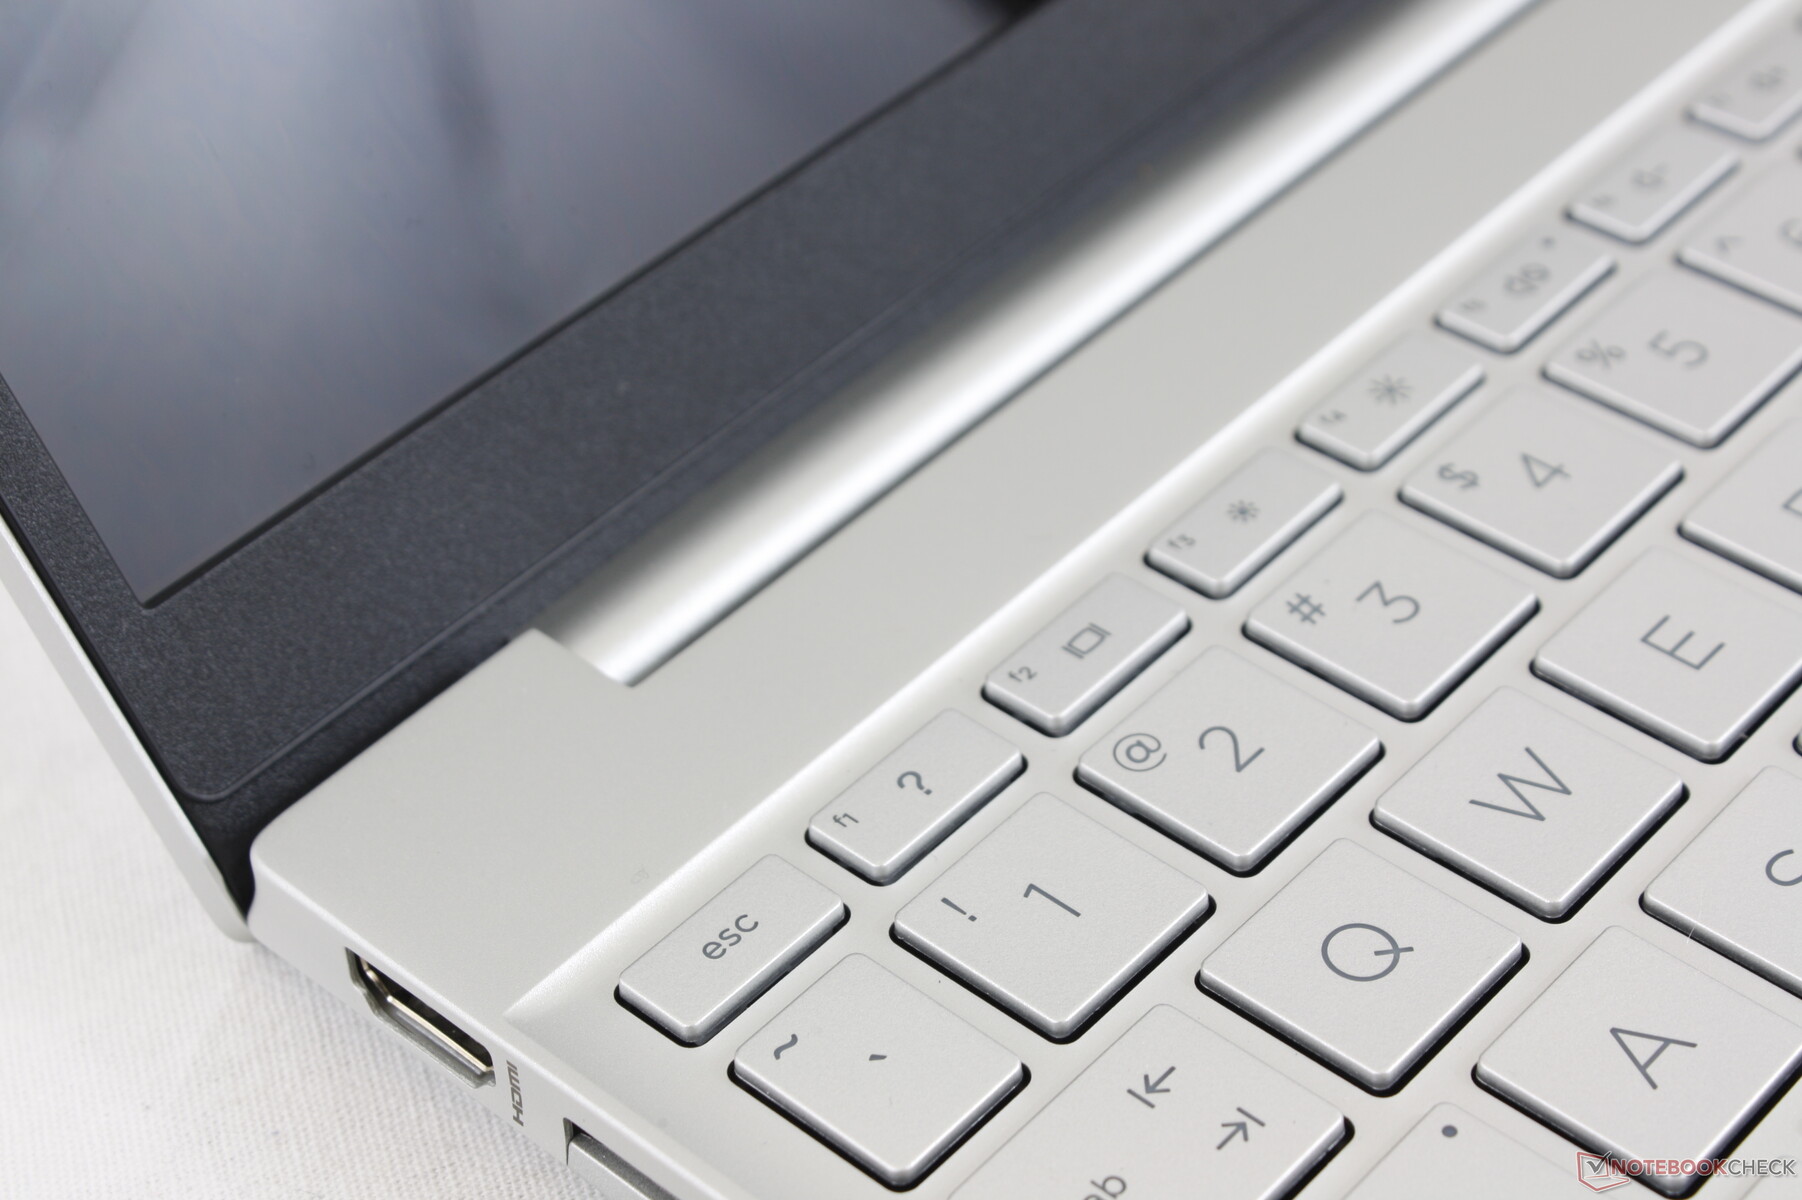
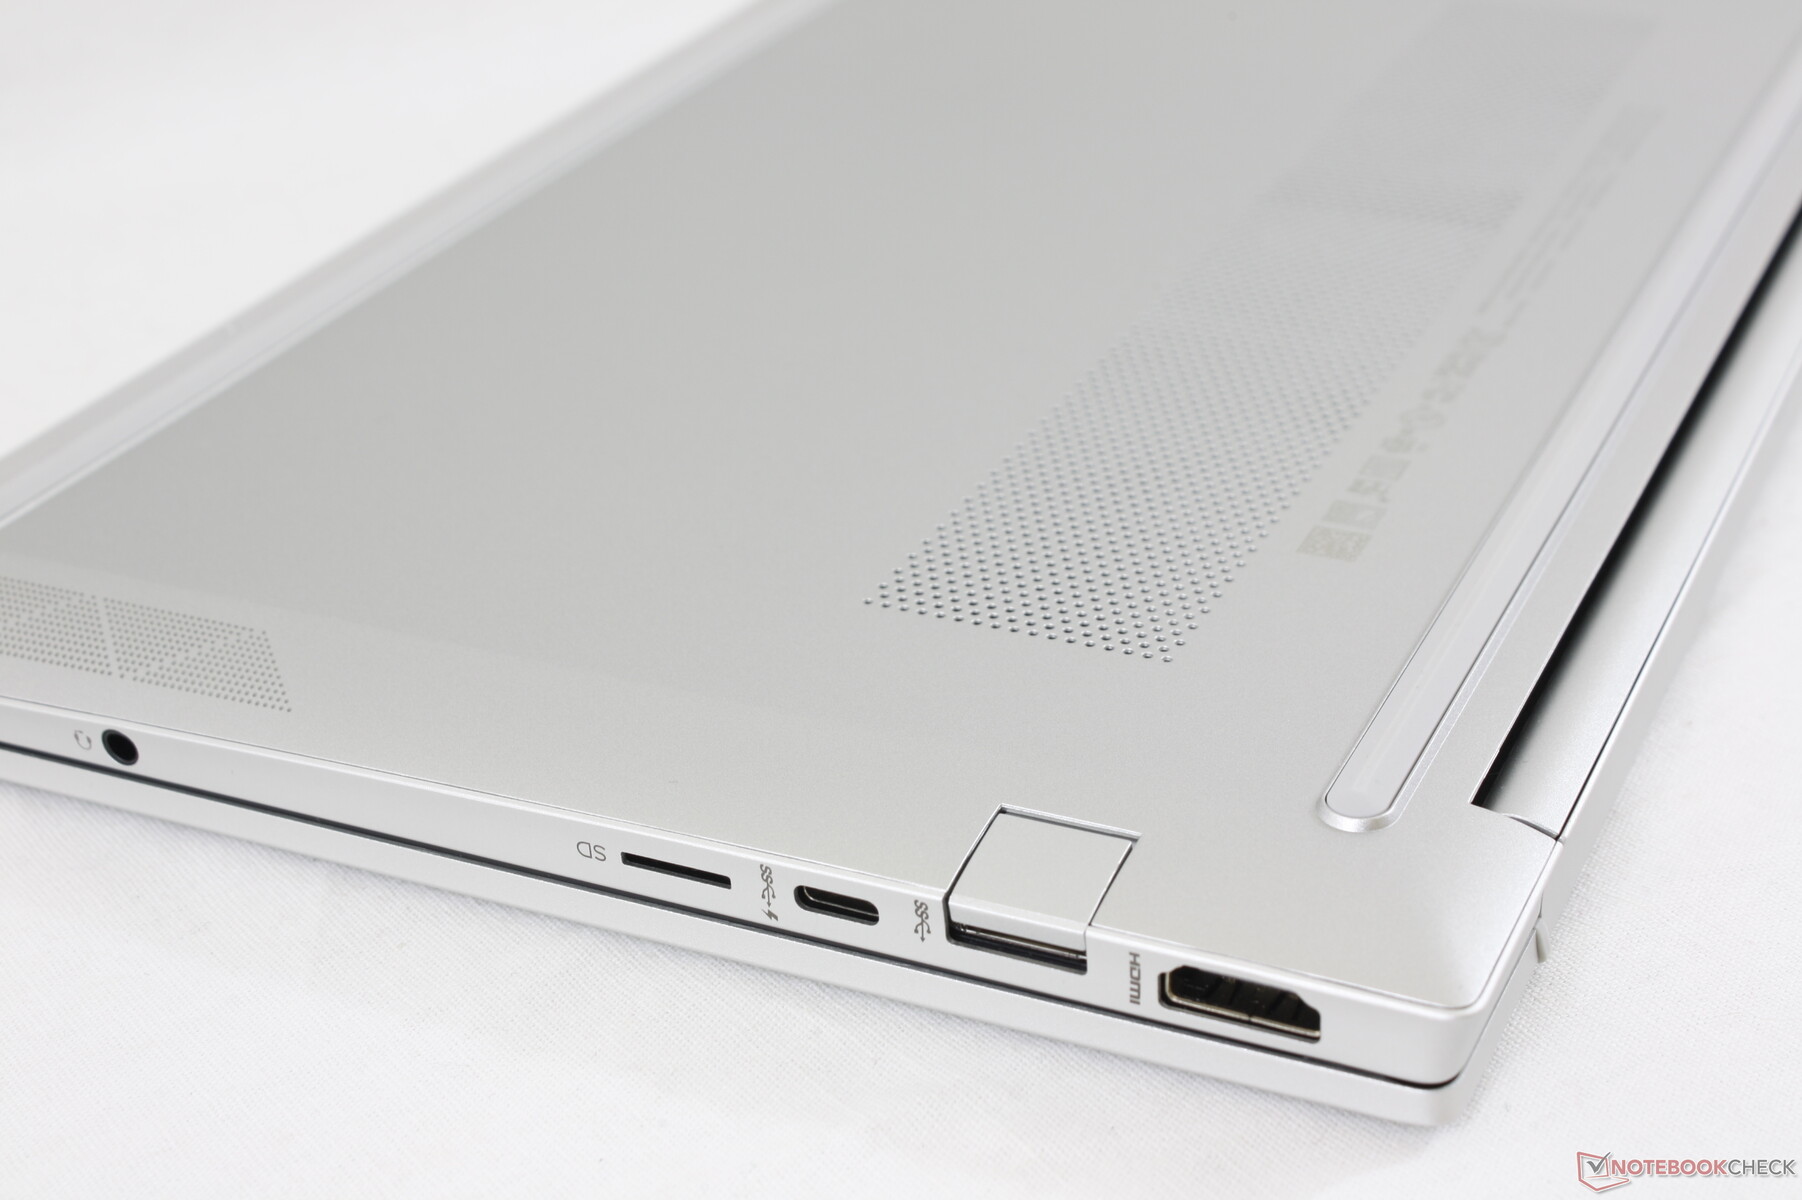
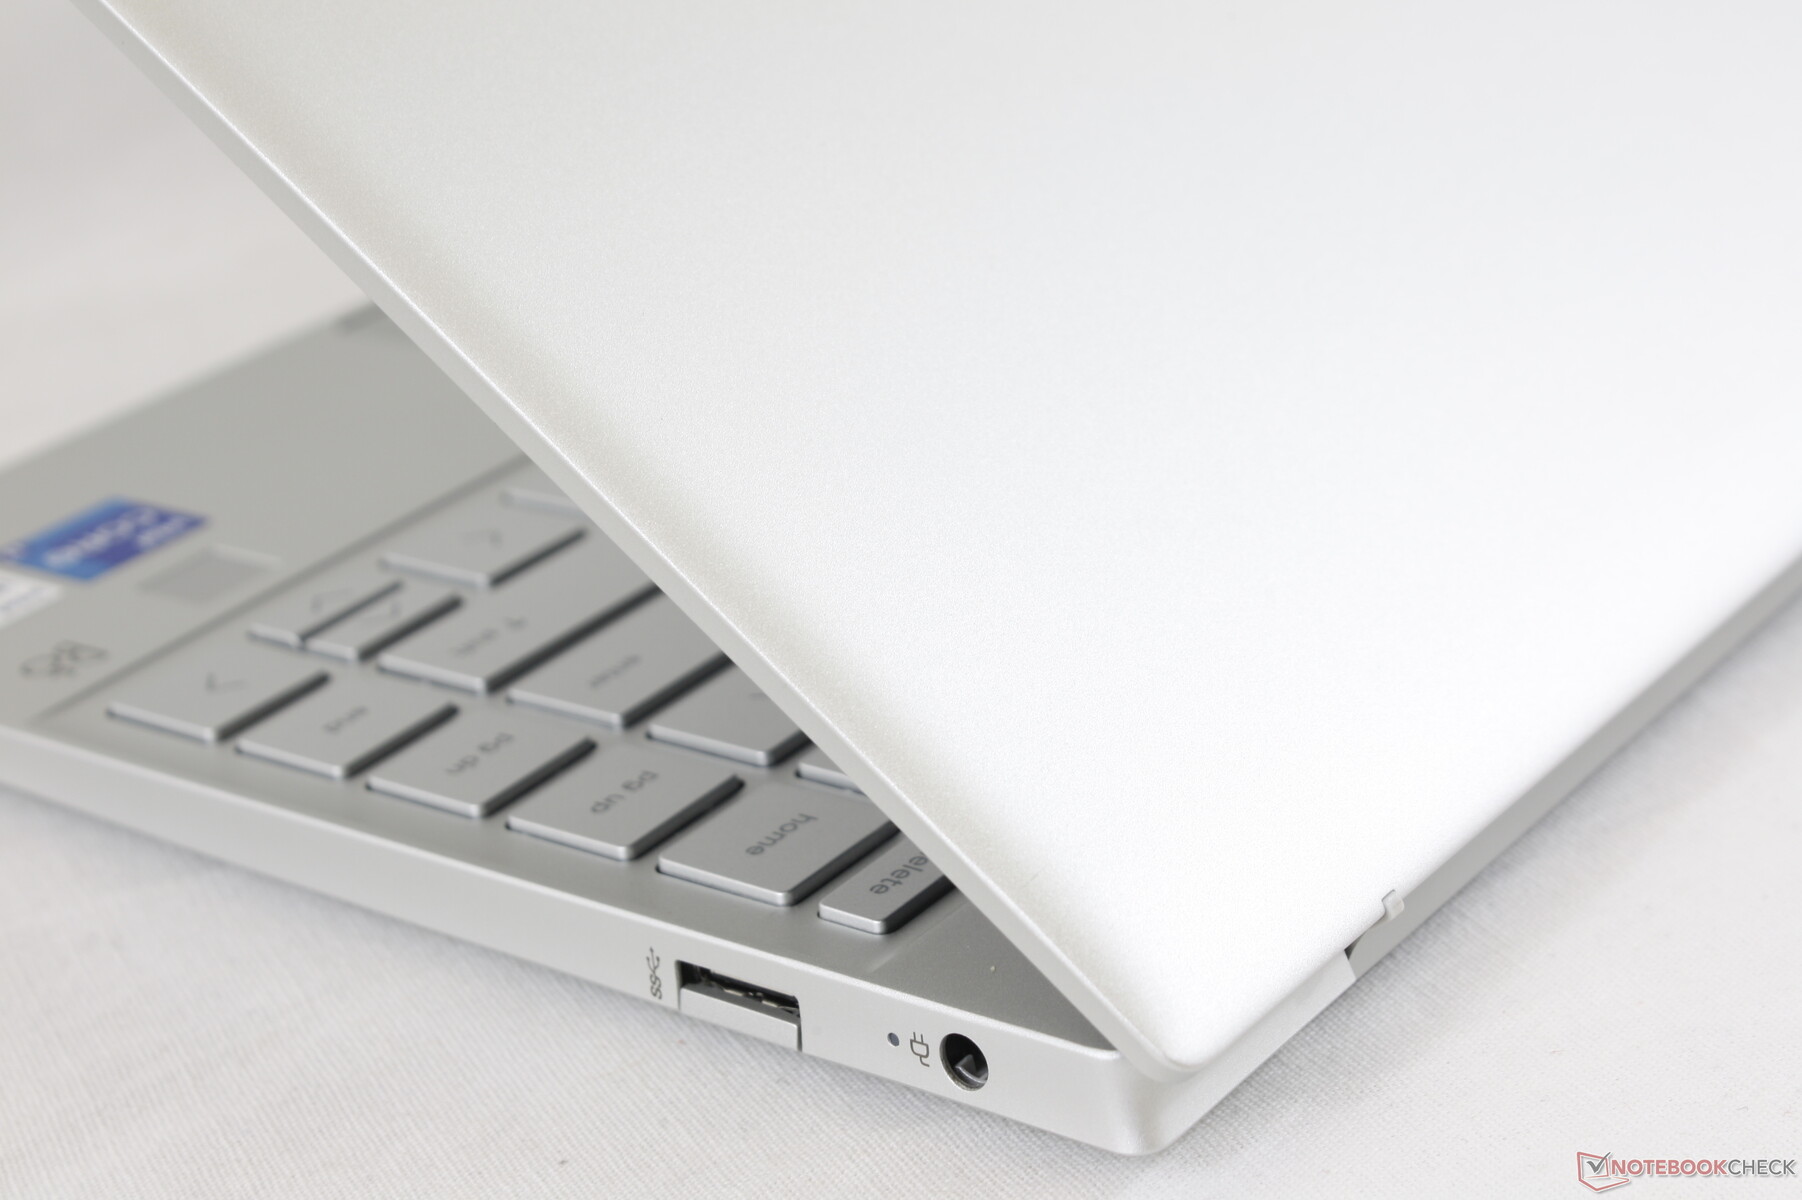
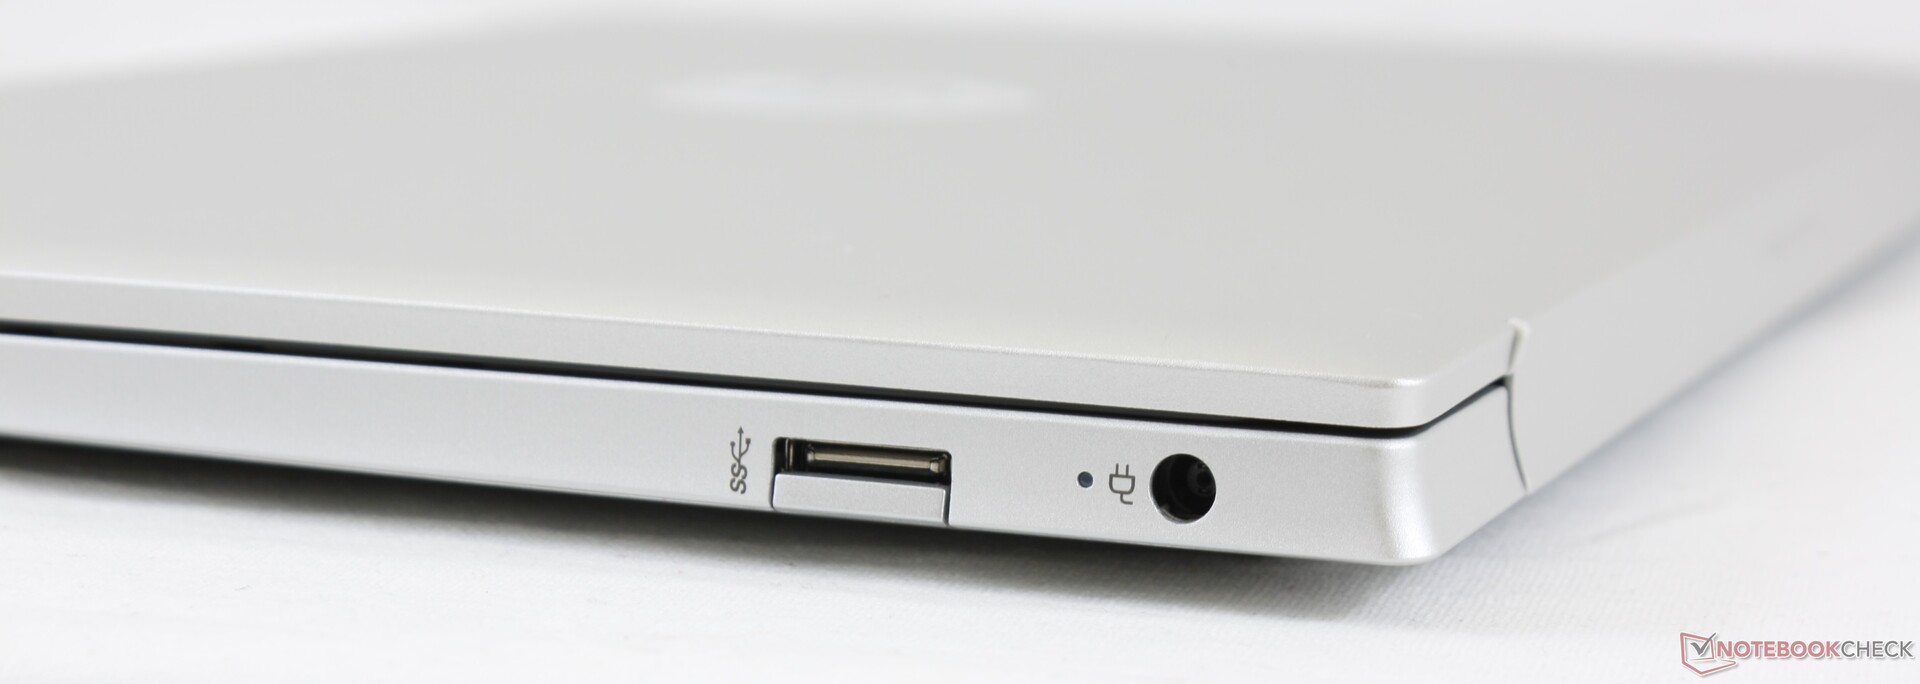
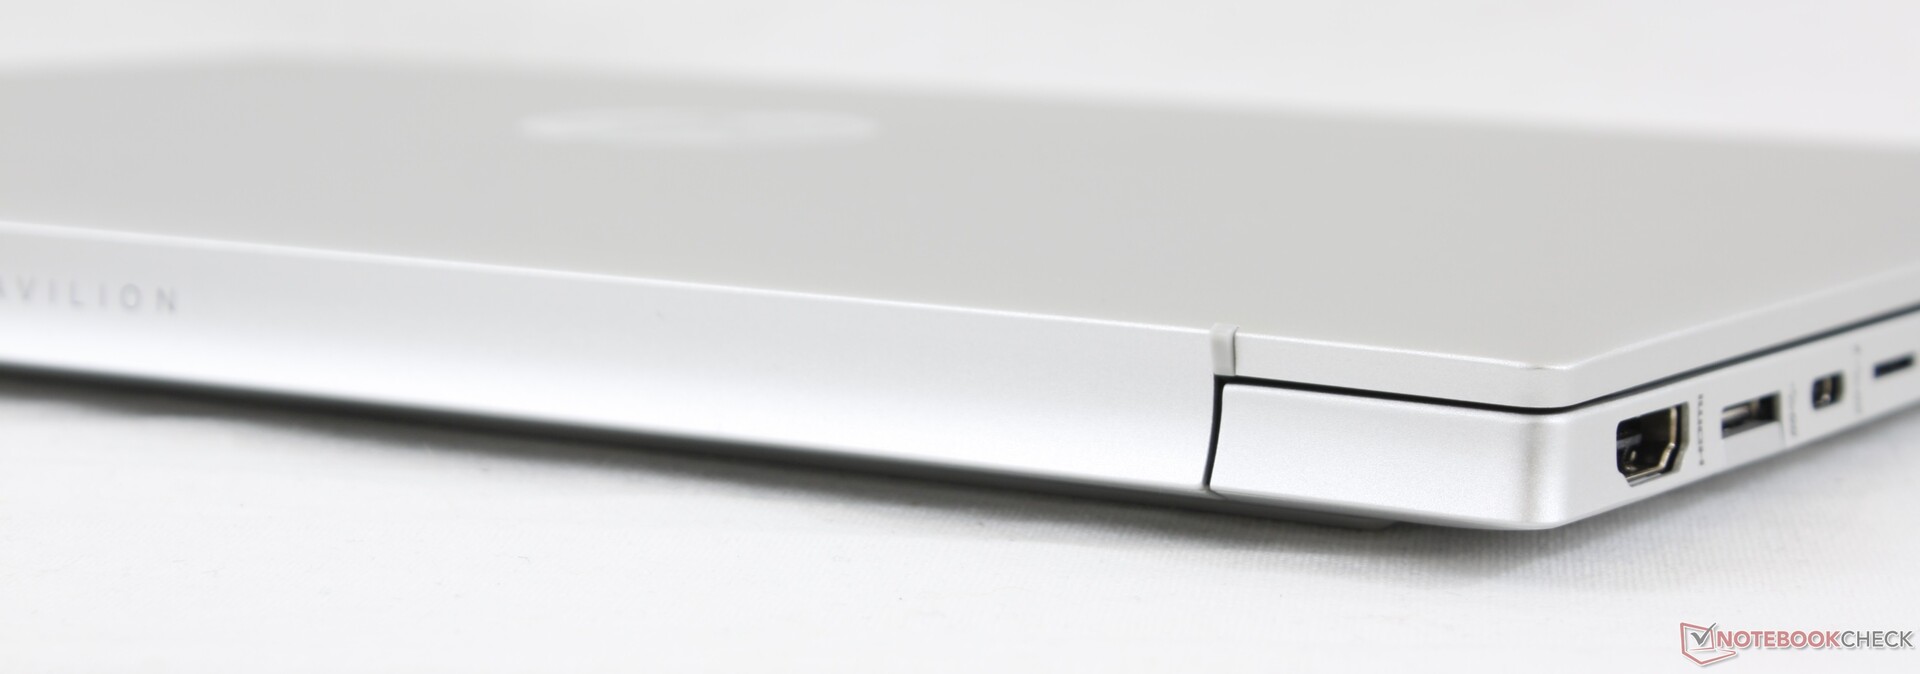
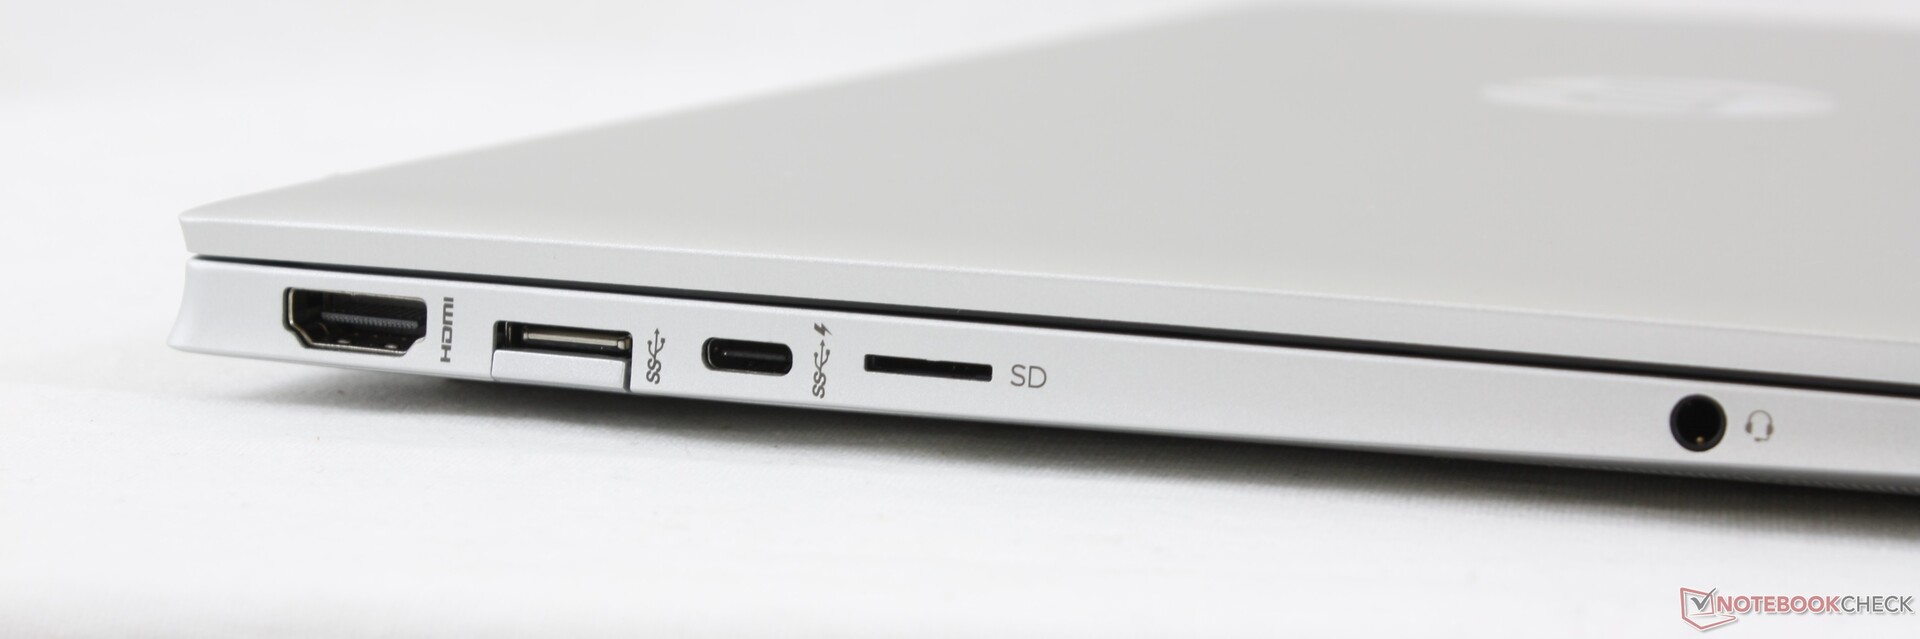
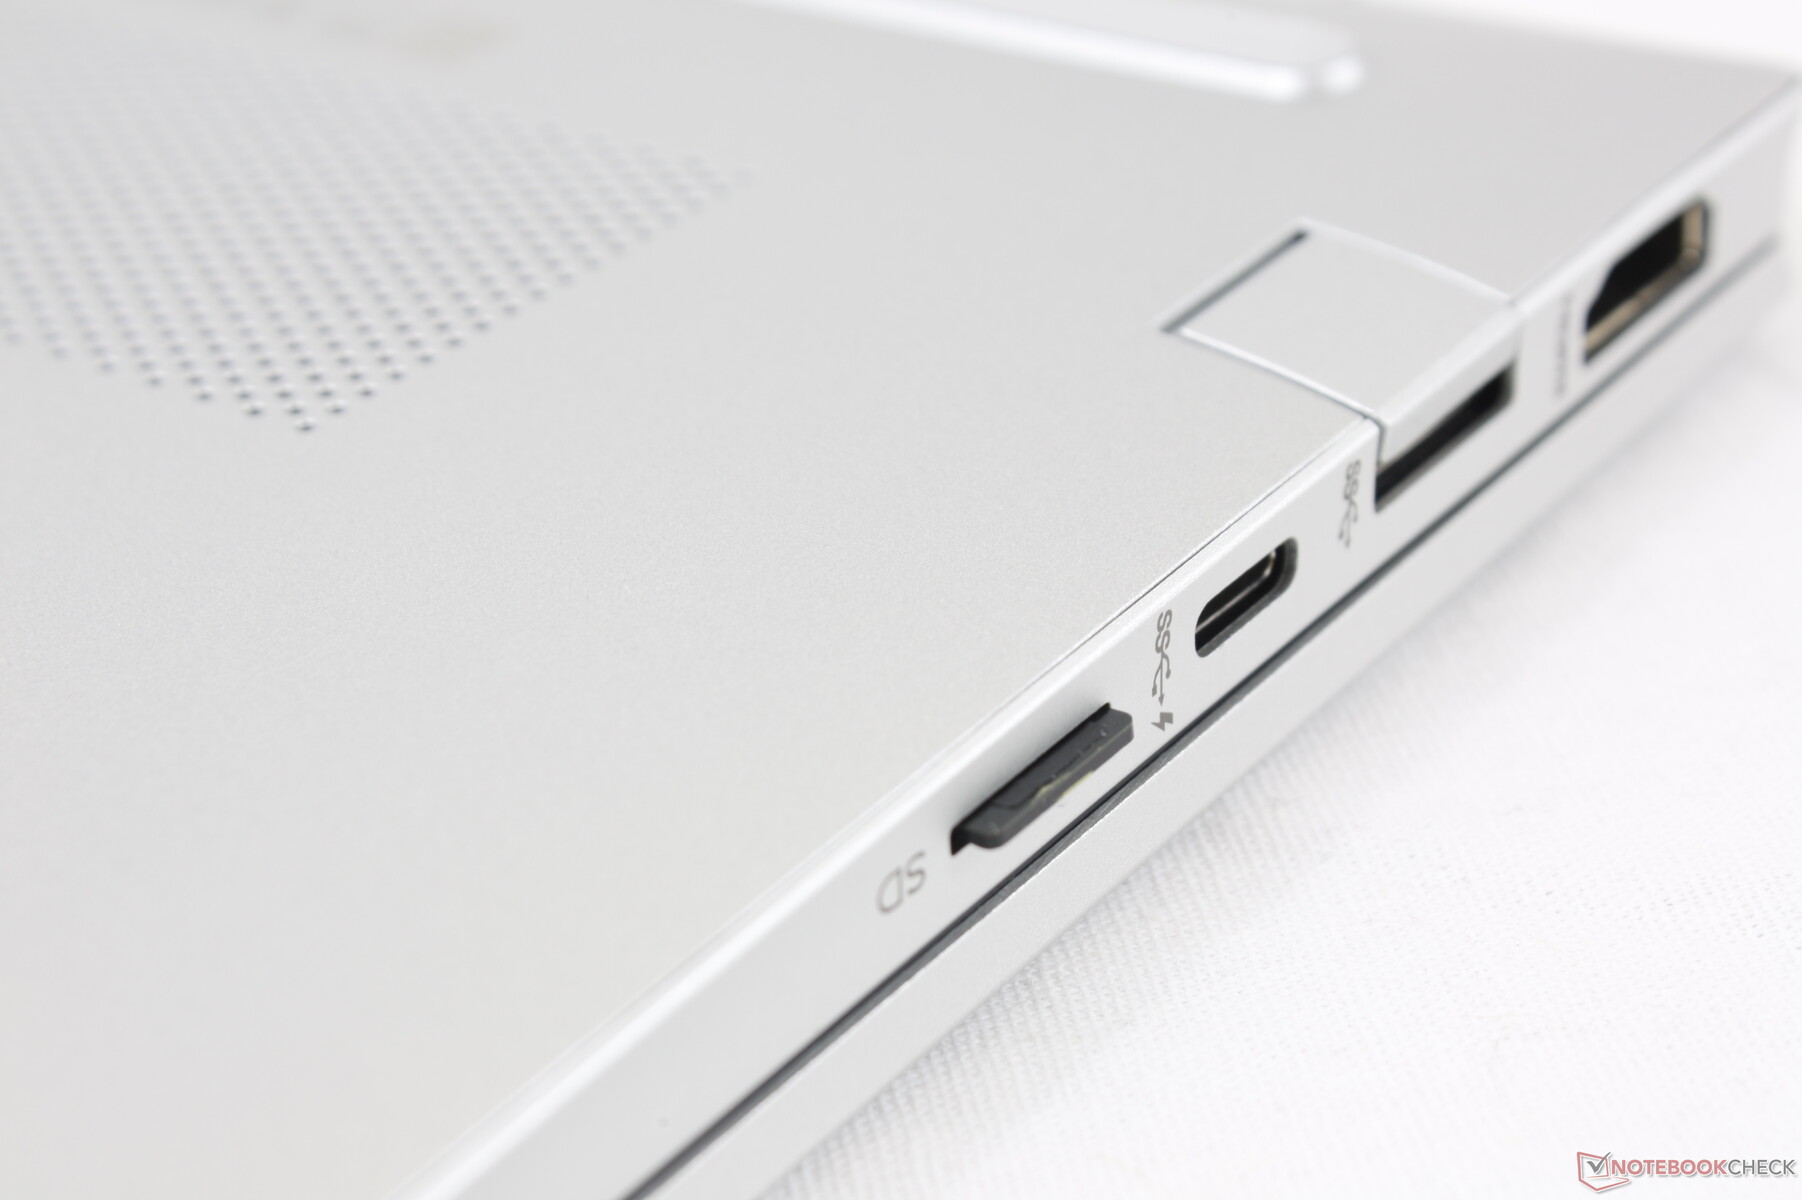
Connessioni
Le opzioni delle porte sono abbondanti per un Ultrabook economico da 13 pollici che include più porte USB-A e una porta USB-C compatibile sia con DisplayPort che con l'alimentazione. Anche il più costoso HP Envy 13 2020 non offre una porta HDMI integrata, a differenza del nostro Pavilion. Lo svantaggio principale è che i dispositivi Thunderbolt non sono supportati in questo caso.
Una fastidiosa caratteristica del sistema è il flap che copre le due porte USB-A. Poiché i flap sono così stretti, è difficile aprirli e collegare i cavi senza prima sollevare l'intero portatile dal tavolo. Tuttavia, supponiamo che sia meglio che non avere nessuna porta USB-A.
Lettore di schede SD
| SD Card Reader | |
| average JPG Copy Test (av. of 3 runs) | |
| Dell XPS 13 9300 i5 FHD (Toshiba Exceria Pro M501 64 GB UHS-II) | |
| HP Pavilion 13-bb0015cl (Toshiba Exceria Pro M501 32 GB UHS-II) | |
| HP Envy 13-ba0001ng (Toshiba Exceria Pro M501 microSDXC 64GB) | |
| Asus VivoBook S13 S330UA-EY034T (Toshiba Exceria Pro M501 64 GB UHS-II) | |
| maximum AS SSD Seq Read Test (1GB) | |
| Dell XPS 13 9300 i5 FHD (Toshiba Exceria Pro M501 64 GB UHS-II) | |
| HP Pavilion 13-bb0015cl (Toshiba Exceria Pro M501 32 GB UHS-II) | |
| HP Envy 13-ba0001ng (Toshiba Exceria Pro M501 microSDXC 64GB) | |
| Asus VivoBook S13 S330UA-EY034T (Toshiba Exceria Pro M501 64 GB UHS-II) | |
Comunicazioni
L'Intel AX201 viene fornito di serie per la connessione Wi-Fi 6 e Bluetooth 5.1. Non abbiamo riscontrato problemi di connessione quando accoppiato al nostro router di prova Netgear RAX200.
Webcam


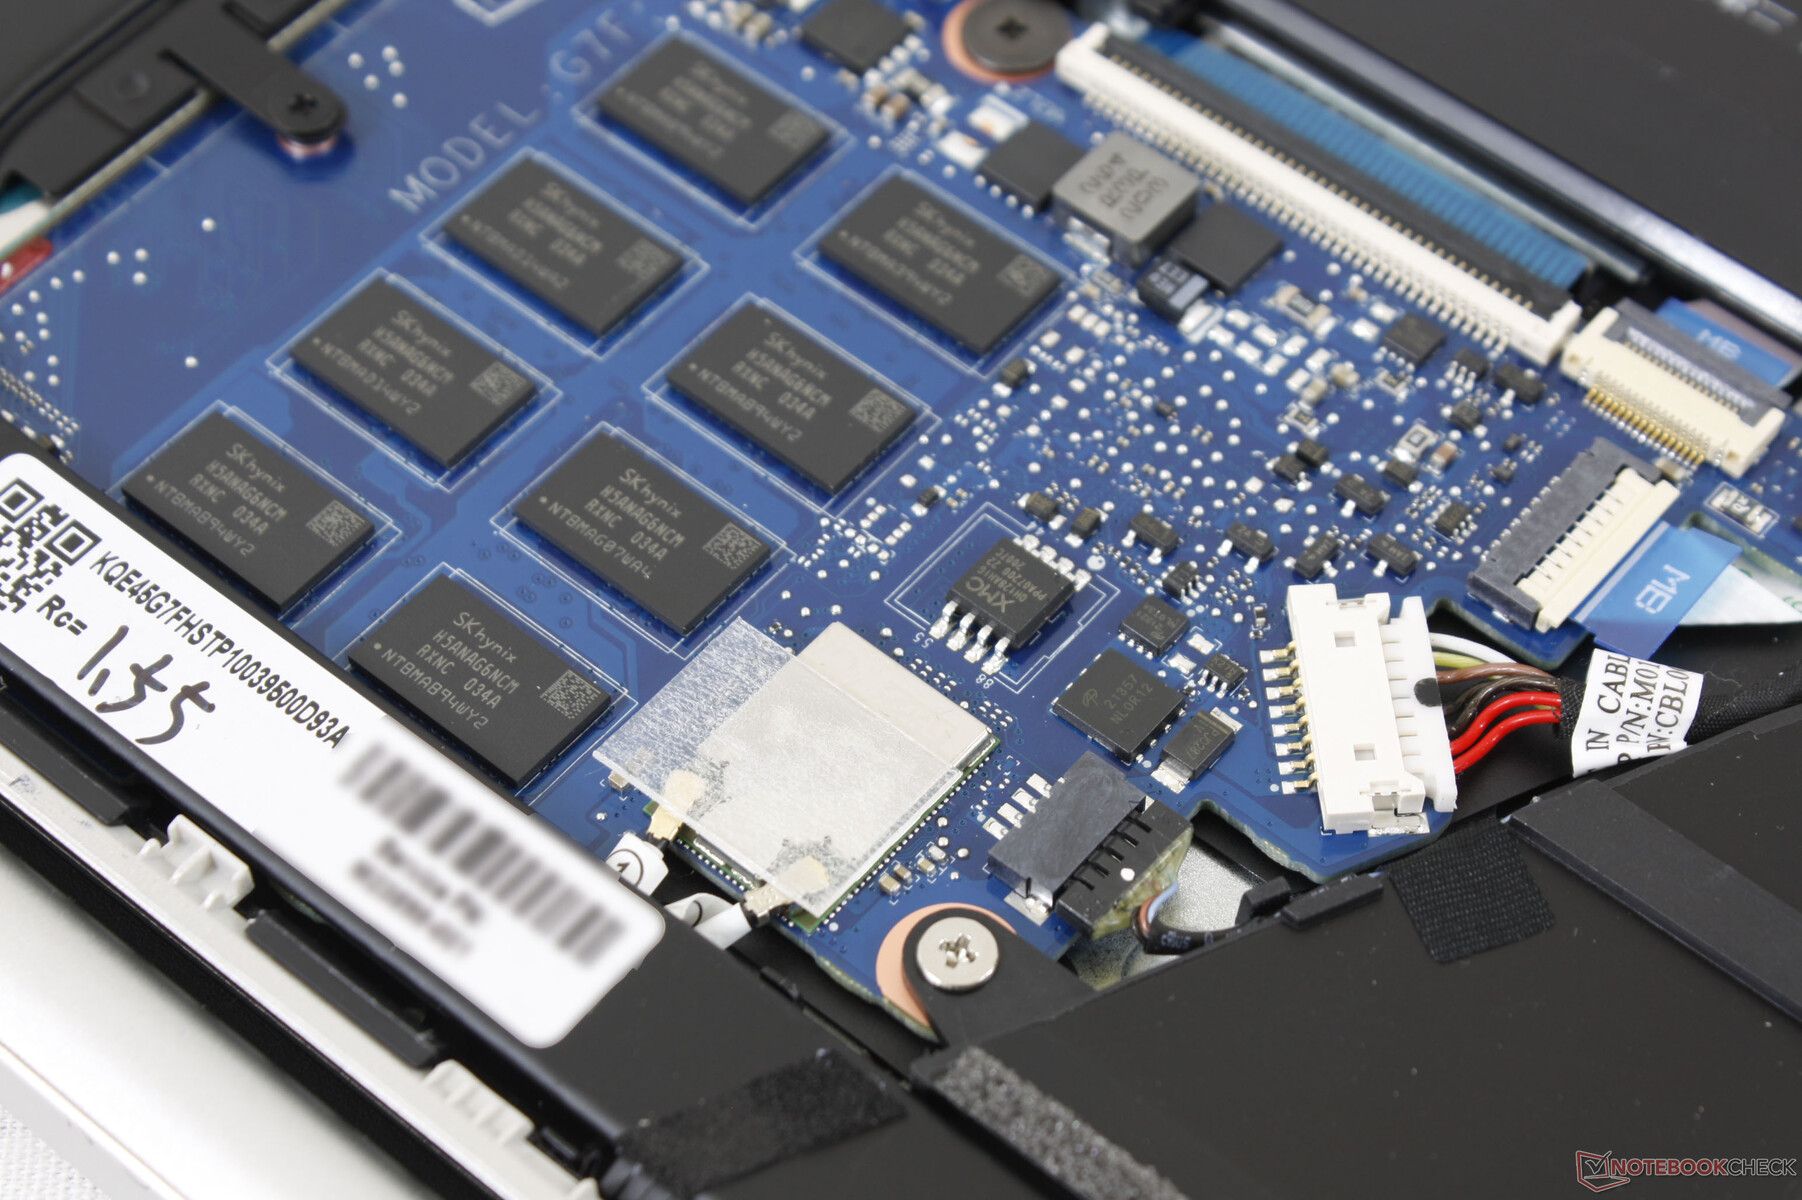
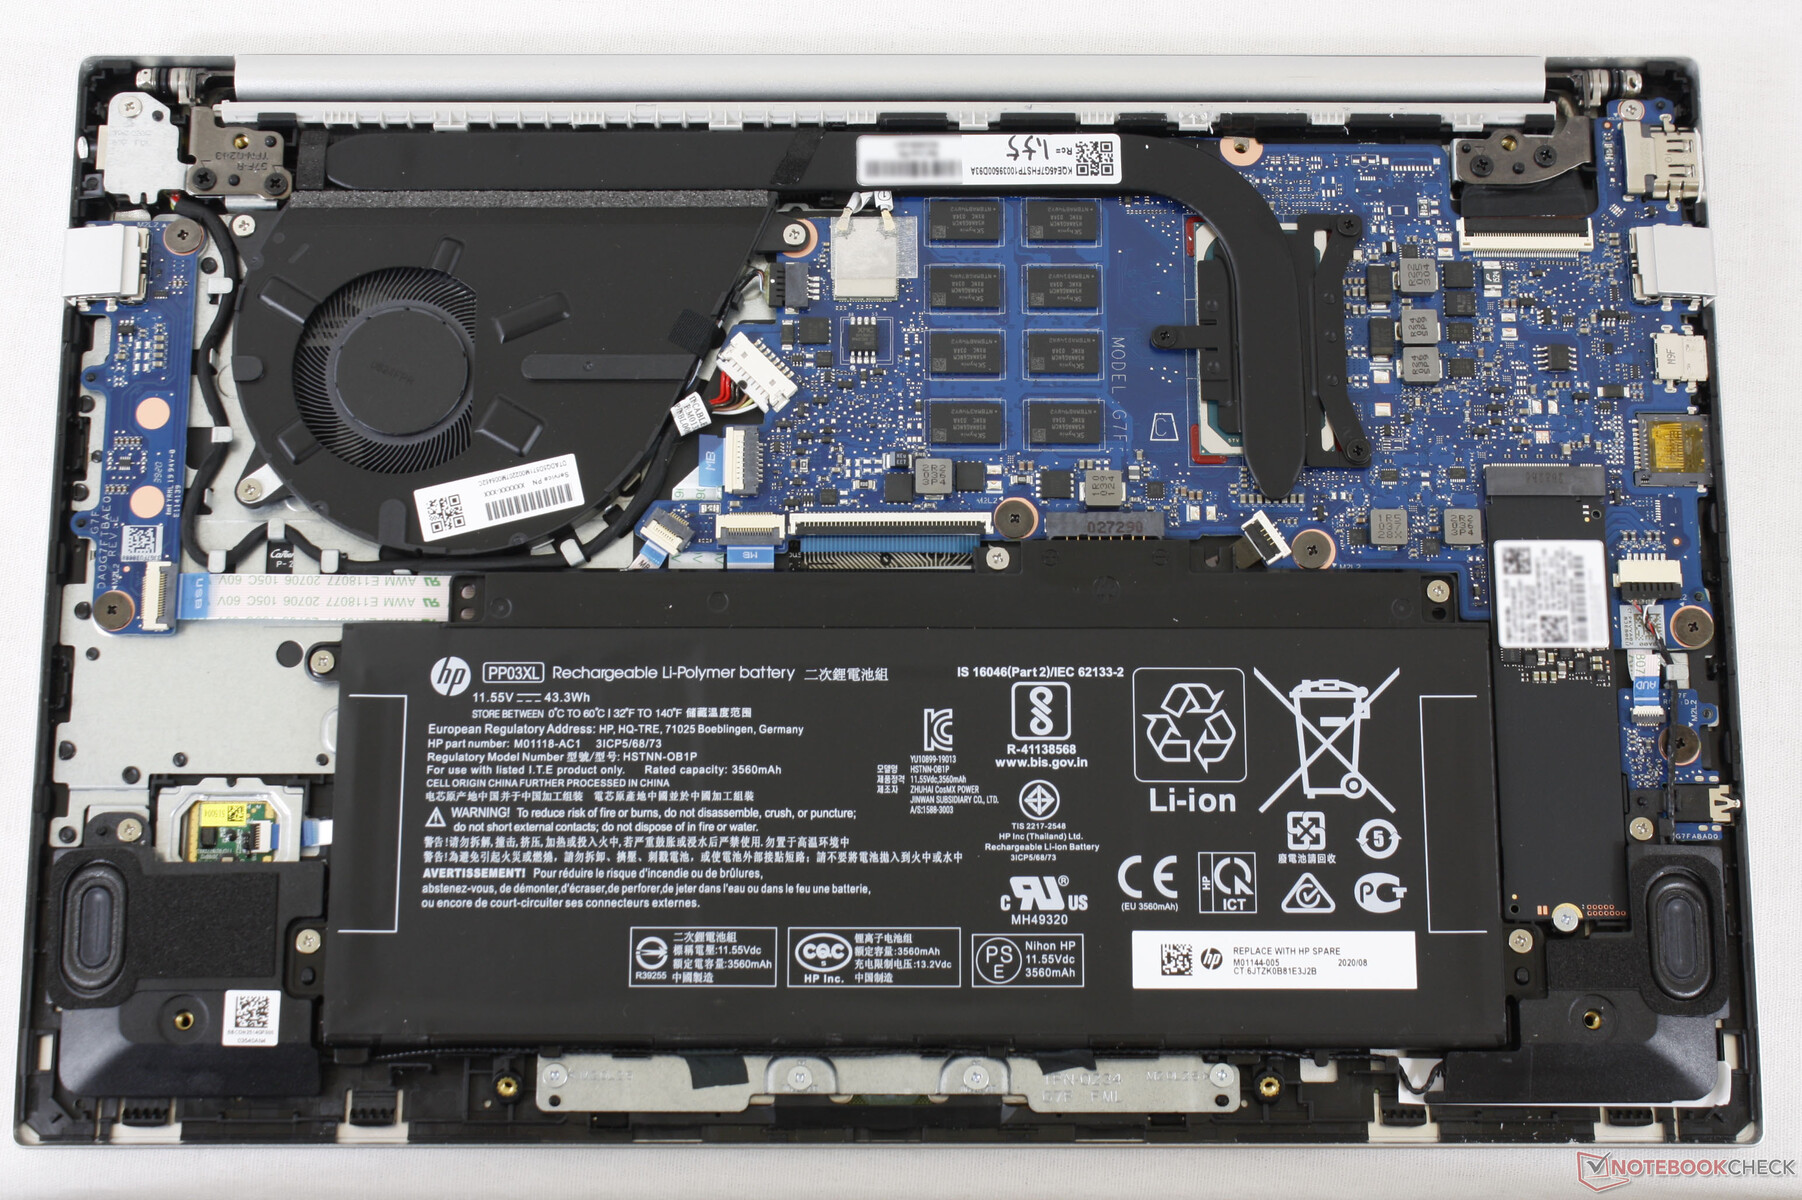
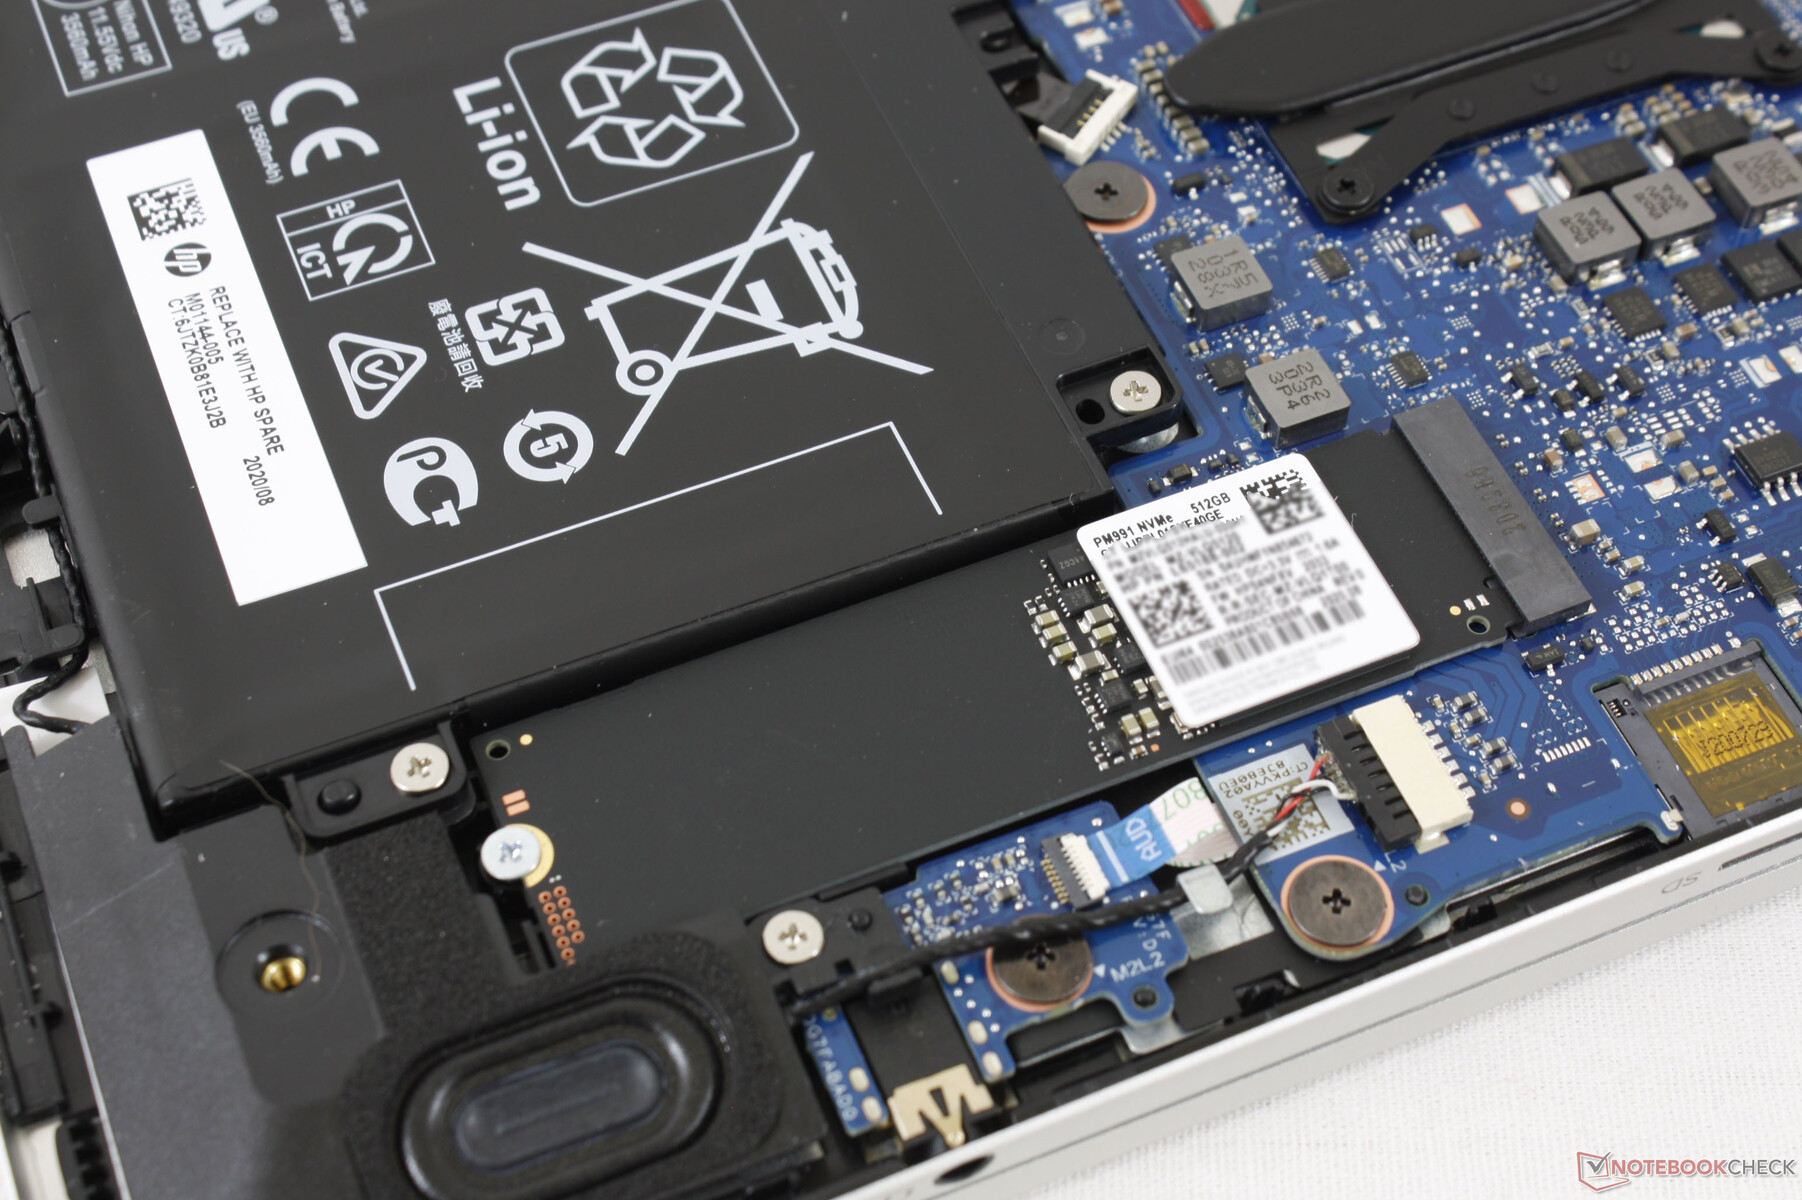
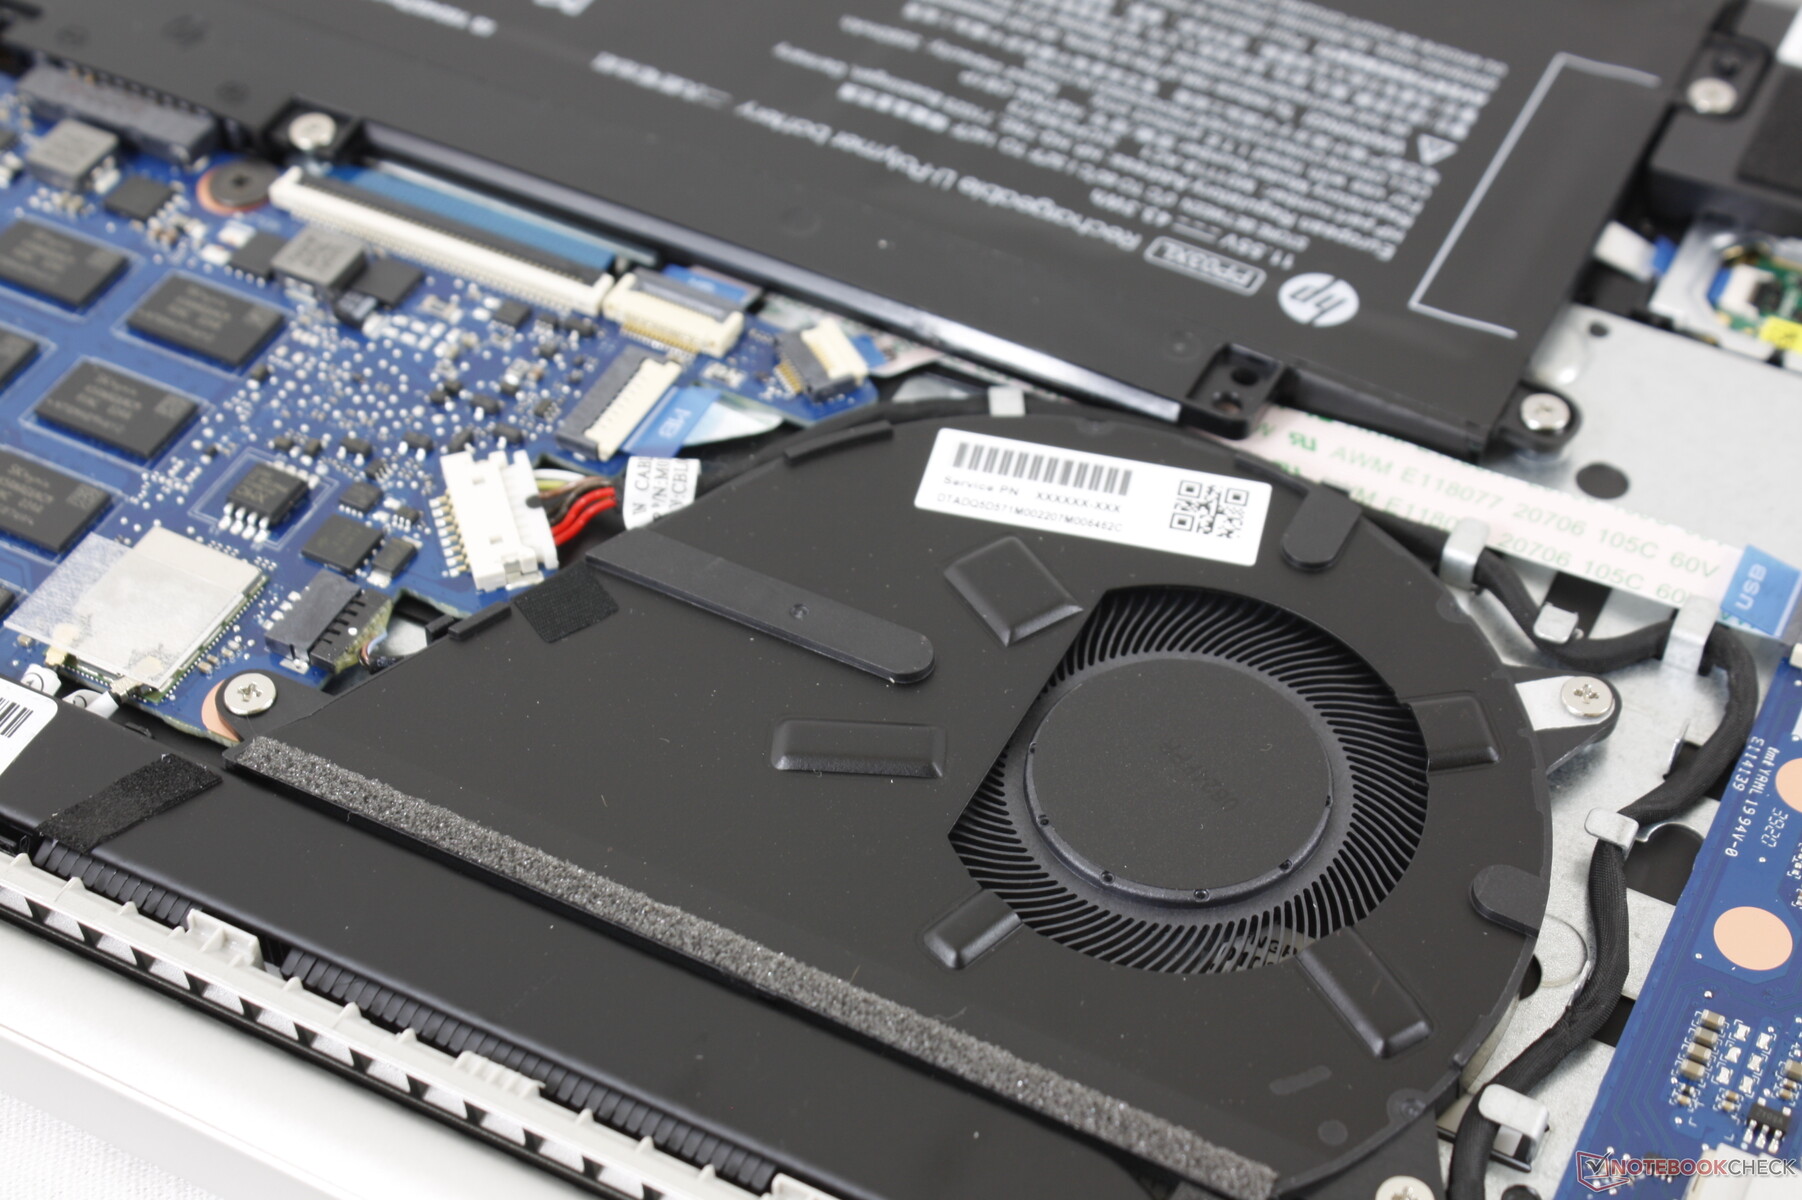
Manutenzione
Il pannello inferiore non è facile da rimuovere in quanto ci sono tre viti nascoste sotto i piedini in gomma posteriori più altre due viti nascoste sotto i piedini anteriori. Anche i bordi e gli angoli sono ben chiusi. Non c'è molto da aggiornare una volta all'interno in quanto sia la RAM che la WLAN sono saldate.
Accessori e garanzia
Non ci sono extra nella confezione oltre alla documentazione e all'adattatore. La garanzia limitata standard di un anno si applica con le opzioni di estensione se acquistate da HP.
Dispositivi di input
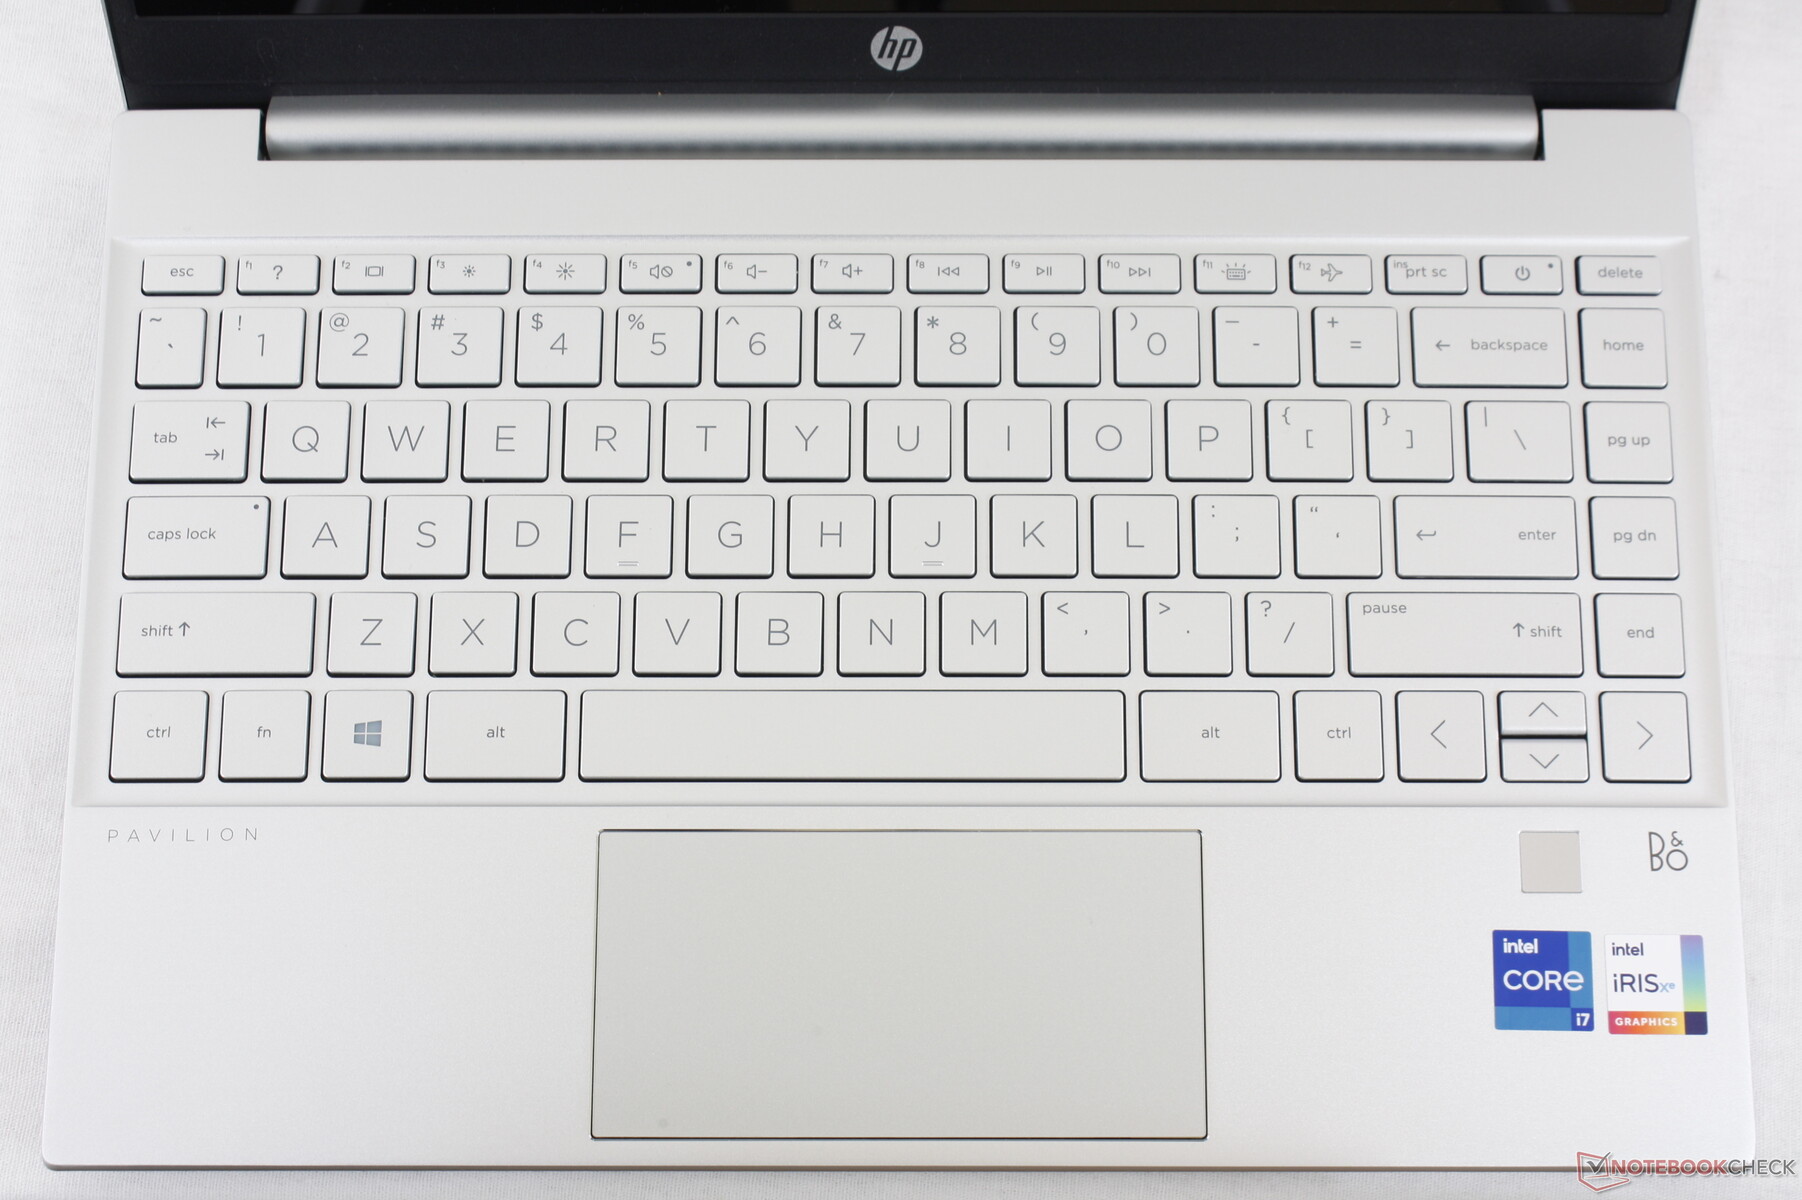
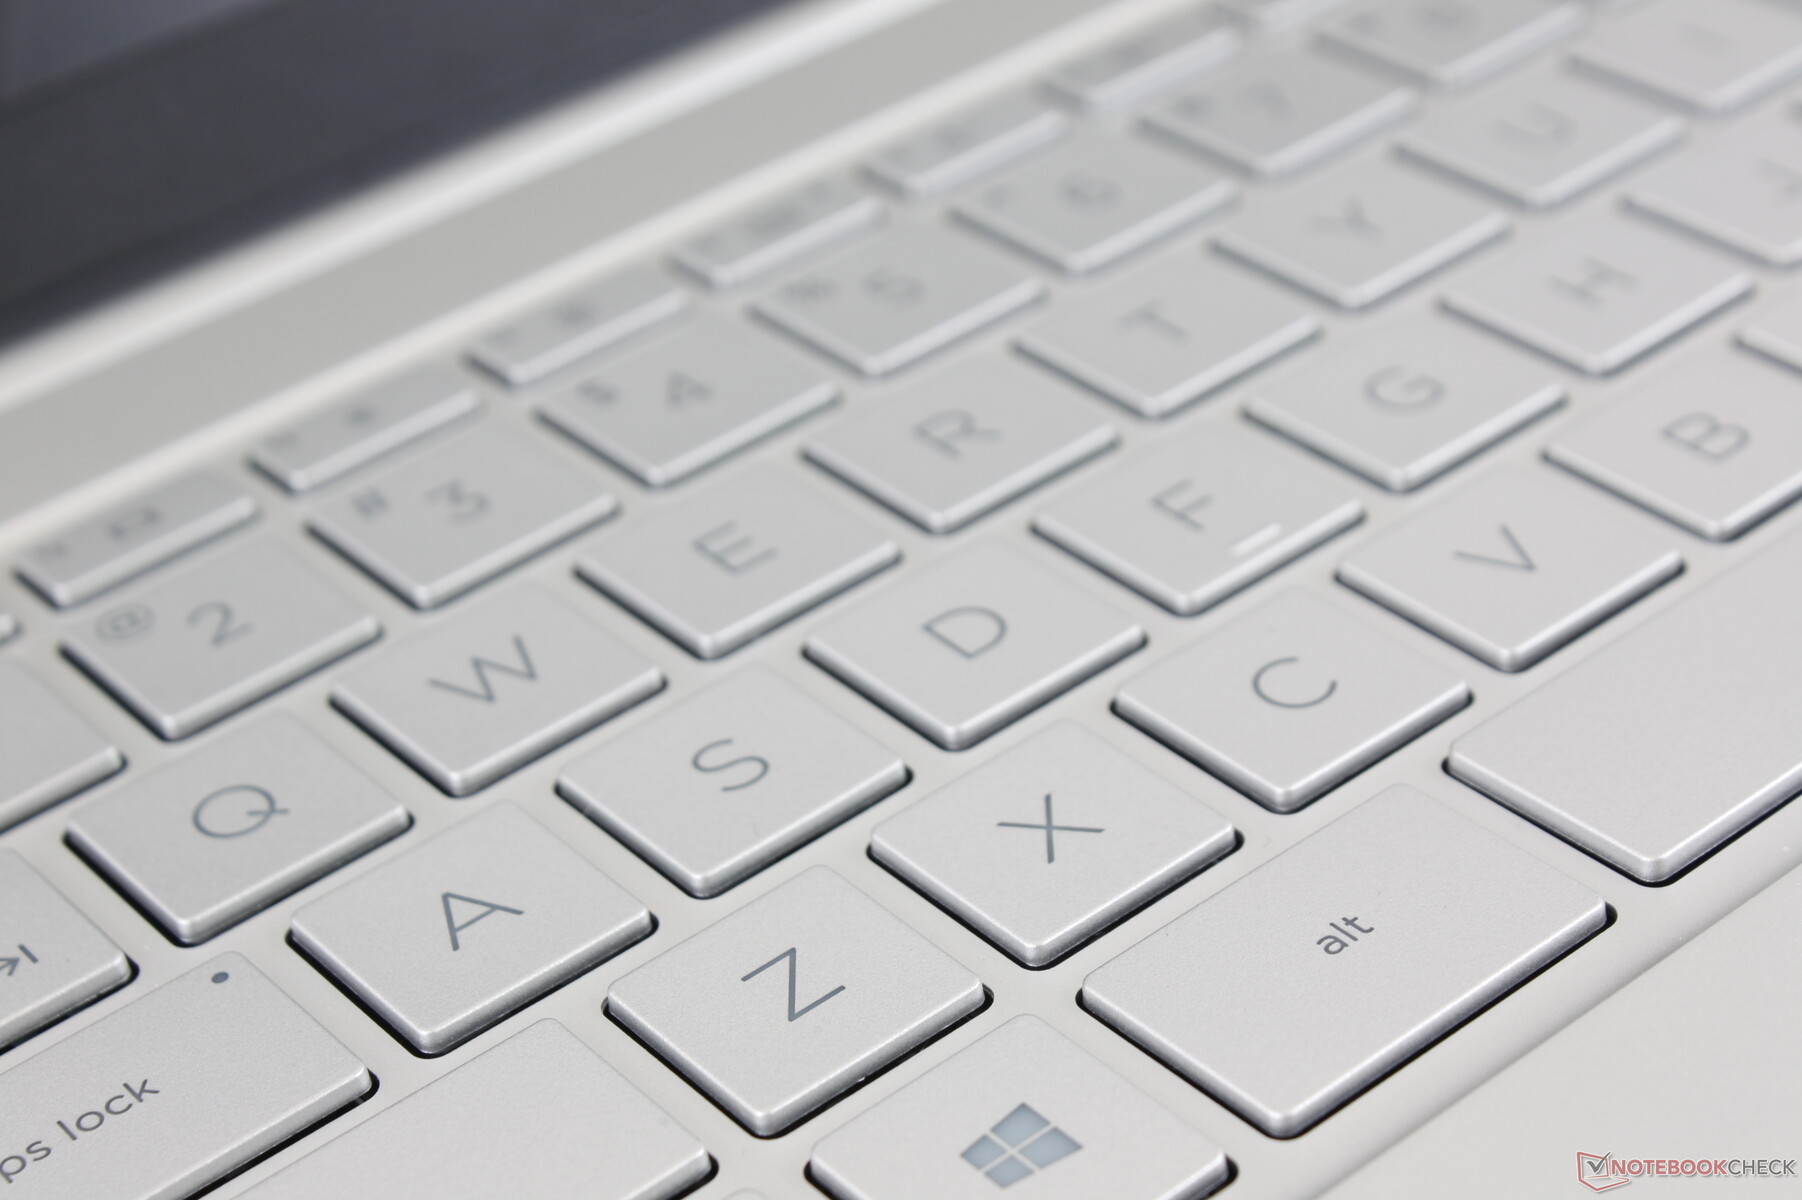
Tastiera
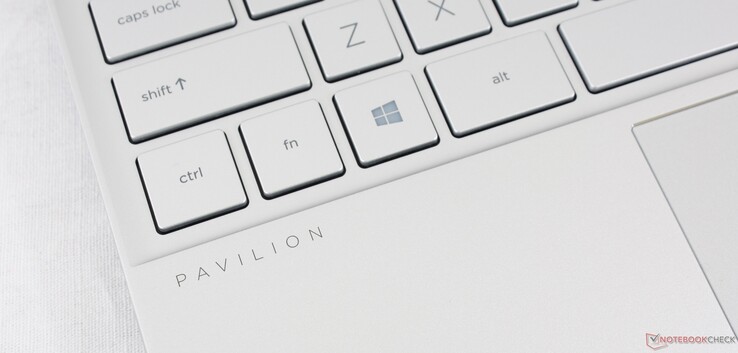
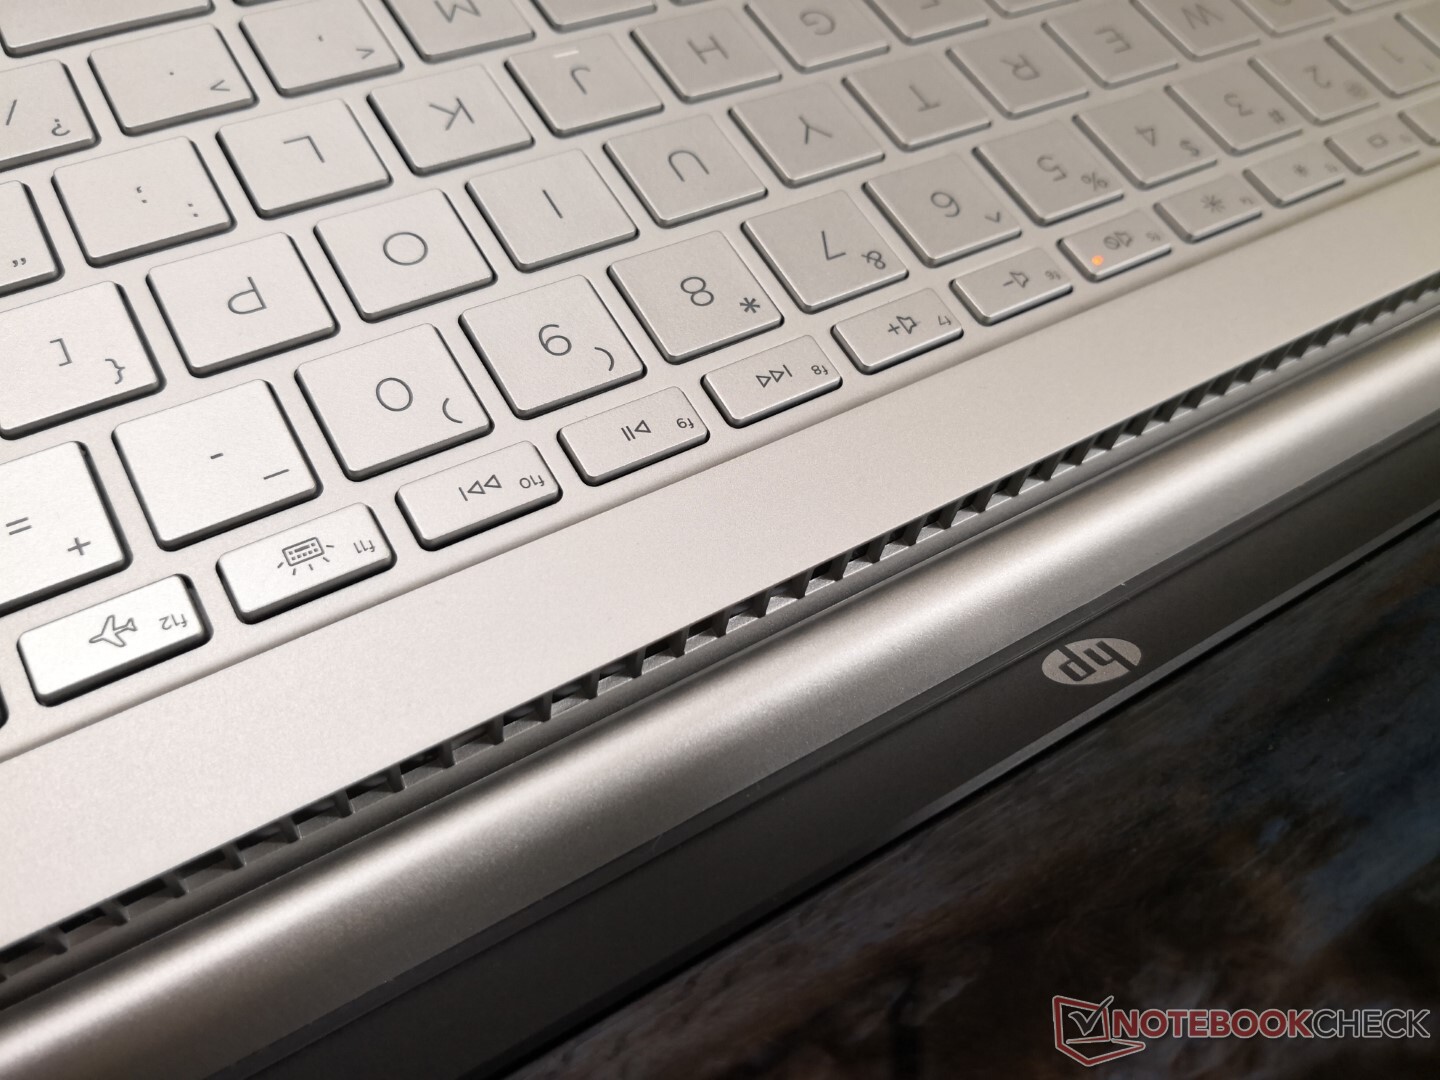
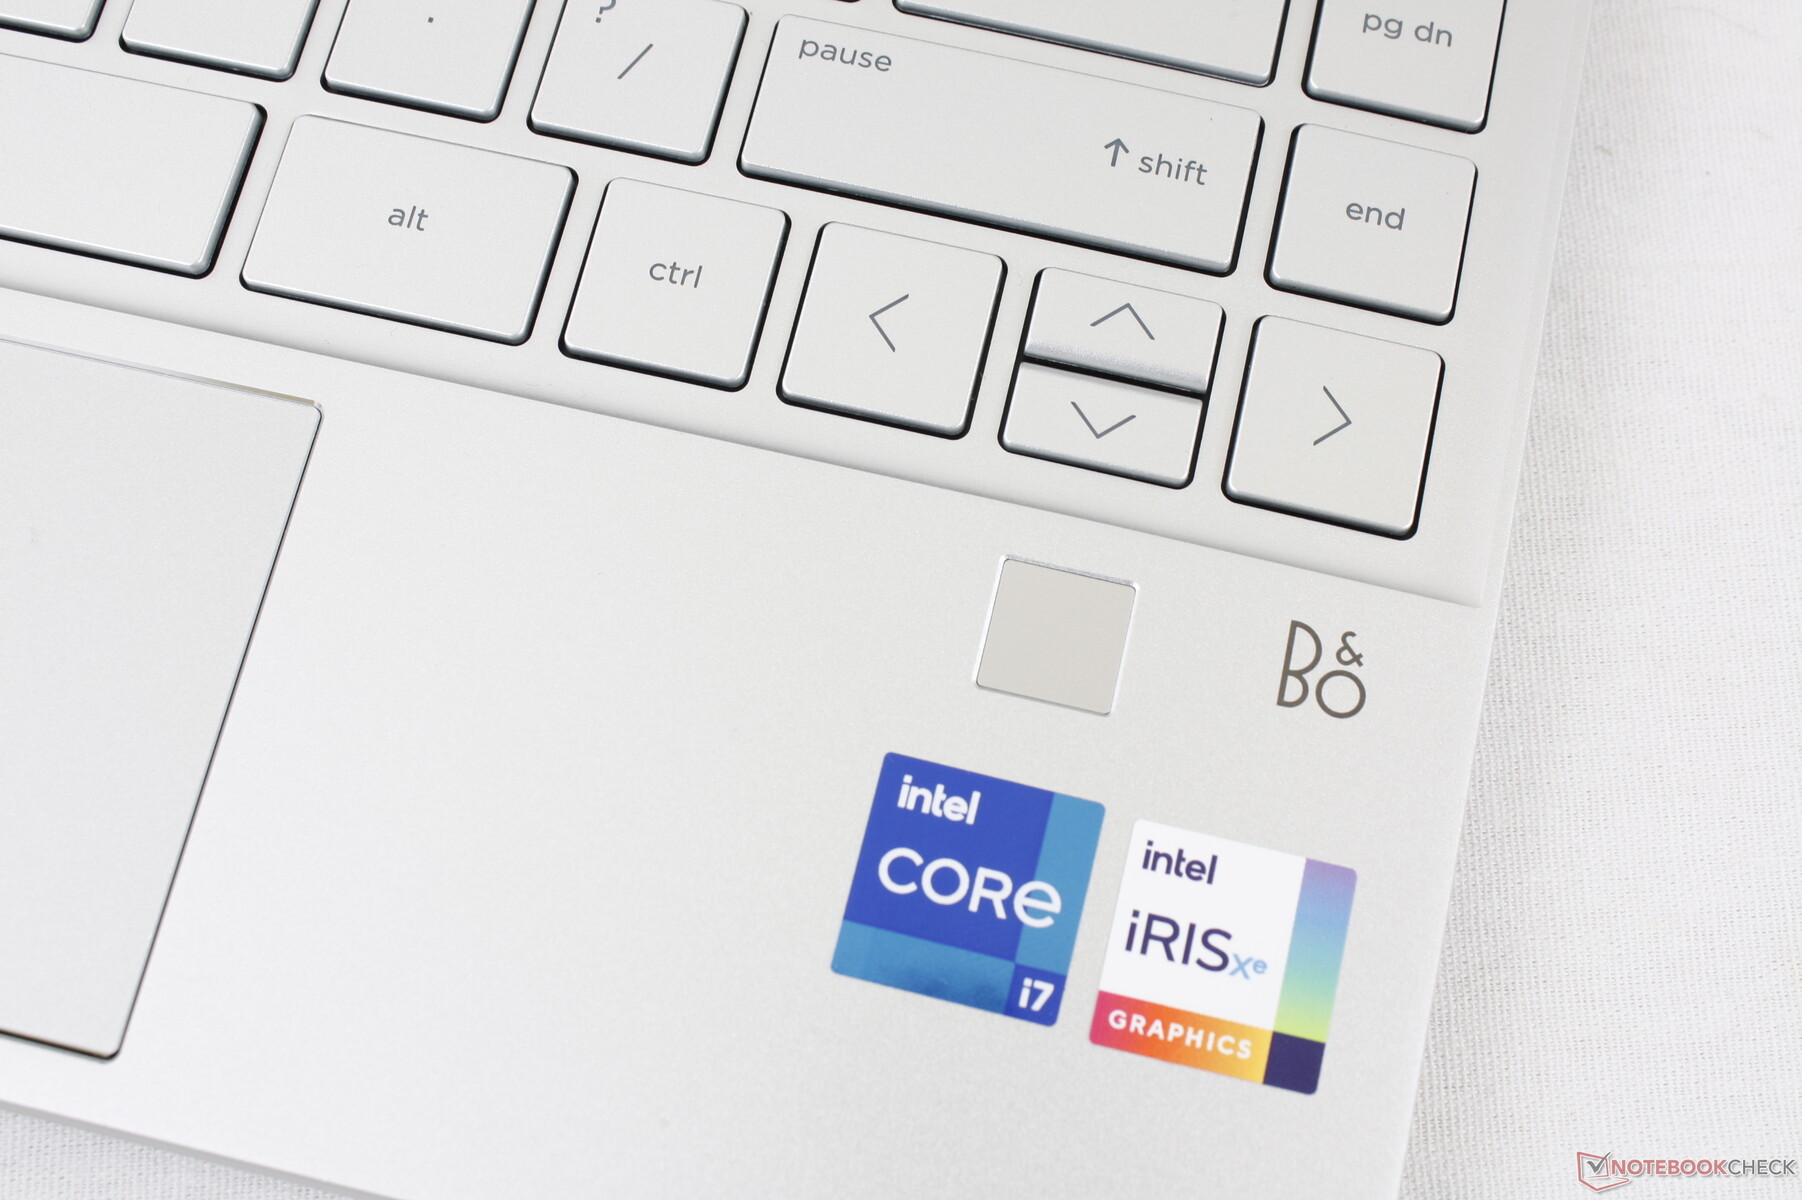
Il feedback chiave e il layout generale sono identici al nuovo Envy 13. La differenza principale sta nel posizionamento del lettore di impronte, in quanto quello sul nostro Pavilion è più piccolo e con un proprio spazio dedicato sul poggiapolsi, mentre il lettore di impronte sull'Envy 13 sostituisce il tasto Ctrl destro.
L'esperienza di digitazione è vicina allo Spectre 13, ma non del tutto. Il feedback dei tasti e il movimento sono rispettivamente leggermente più morbidi e poco profondi, il che rende meno soddisfacente la pressione dei tasti. Lo troviamo ancora più duro dei tasti di un Lenovo IdeaPad o Yoga.
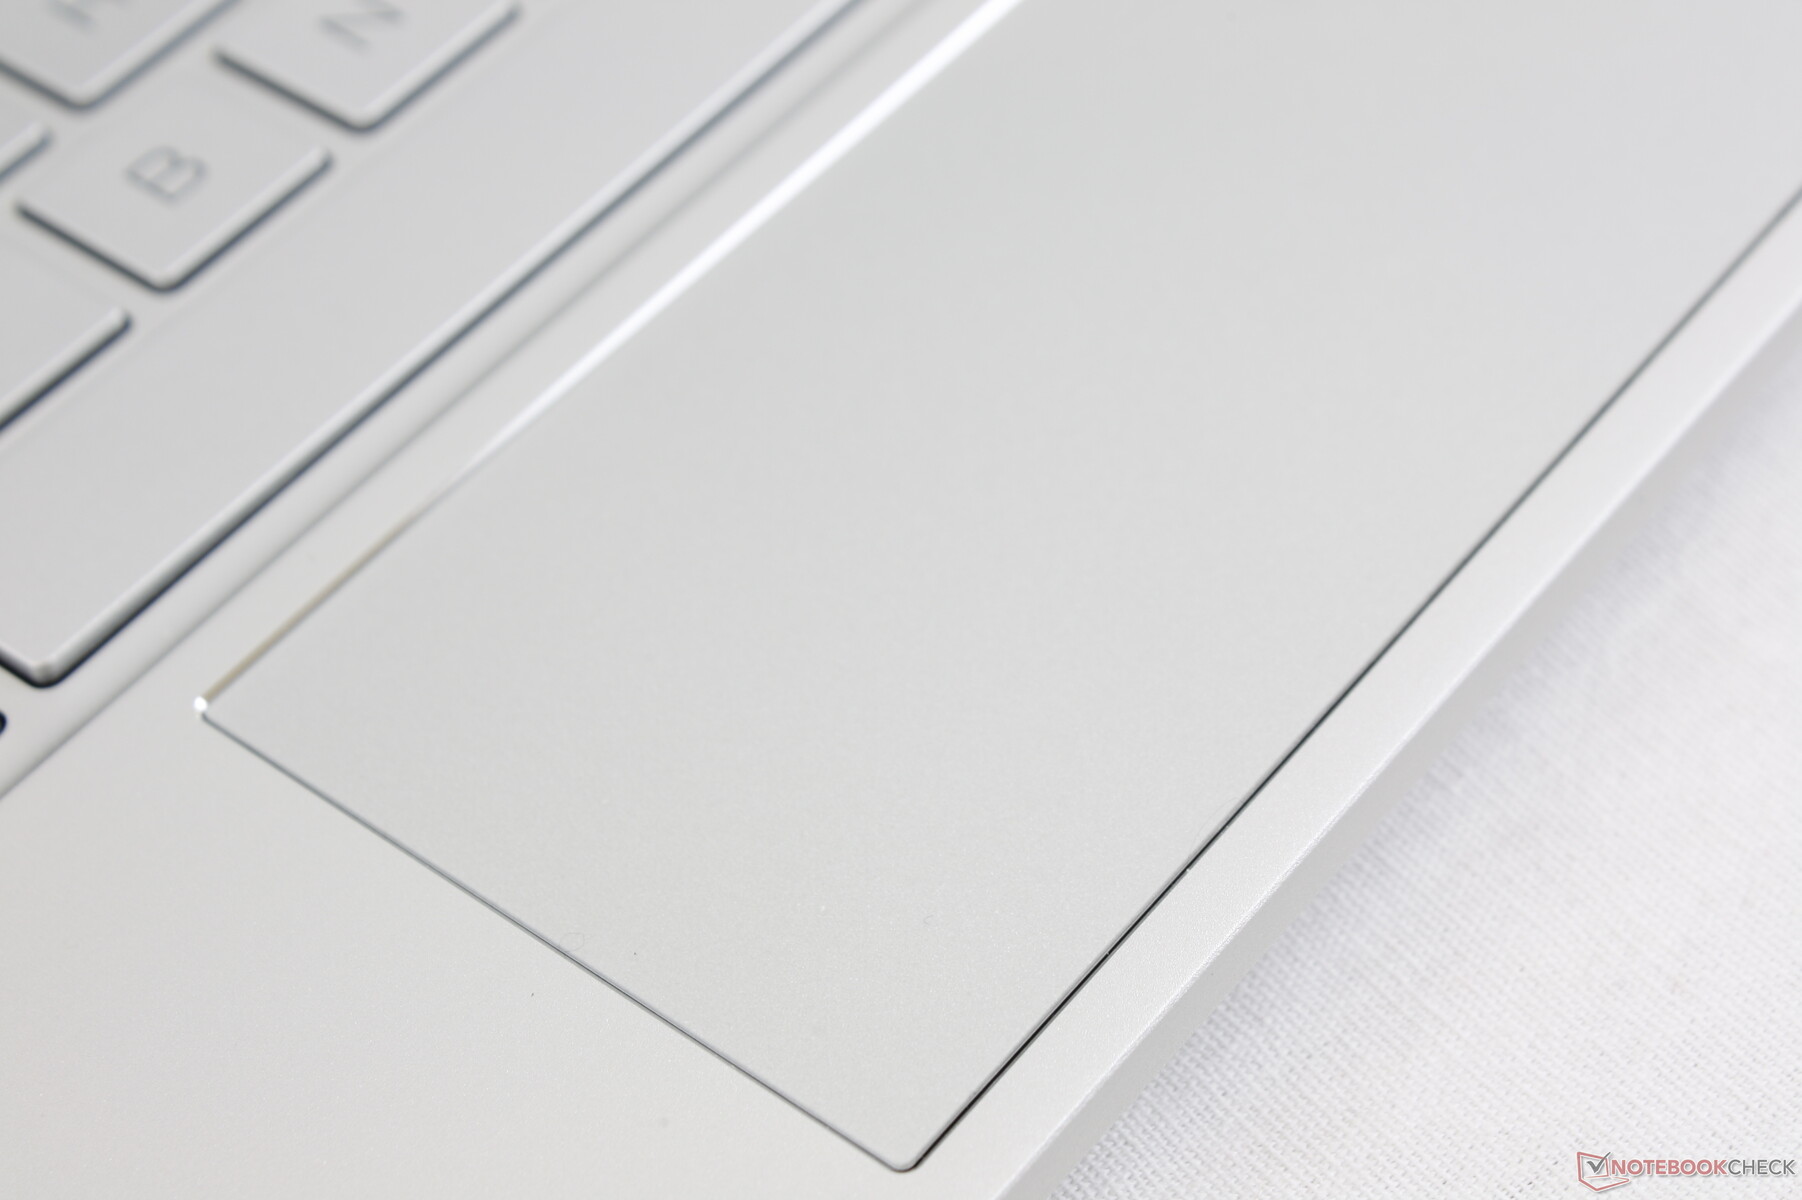
Touchpad
Il clickpad è piccolo a 11 x 5,5 cm contro gli 11 x 6 cm dell'Envy x360 13. Il controllo del cursore è fluido e affidabile con solo un po' di aderenza se si scivola a velocità più basse.
Cliccare con il clickpad avrebbe potuto essere più comodo in quanto il feedback è spugnoso e il viaggio è poco profondo. Inoltre, ci vuole un po' di forza per spingere verso il basso sulla superficie, mentre le dimensioni ridotte lo rendono più difficile da usare per lunghe sessioni. Forse spostando la tastiera verso l'alto per fare spazio a un clickpad più squadrato si potrebbe migliorare la sua usabilità.
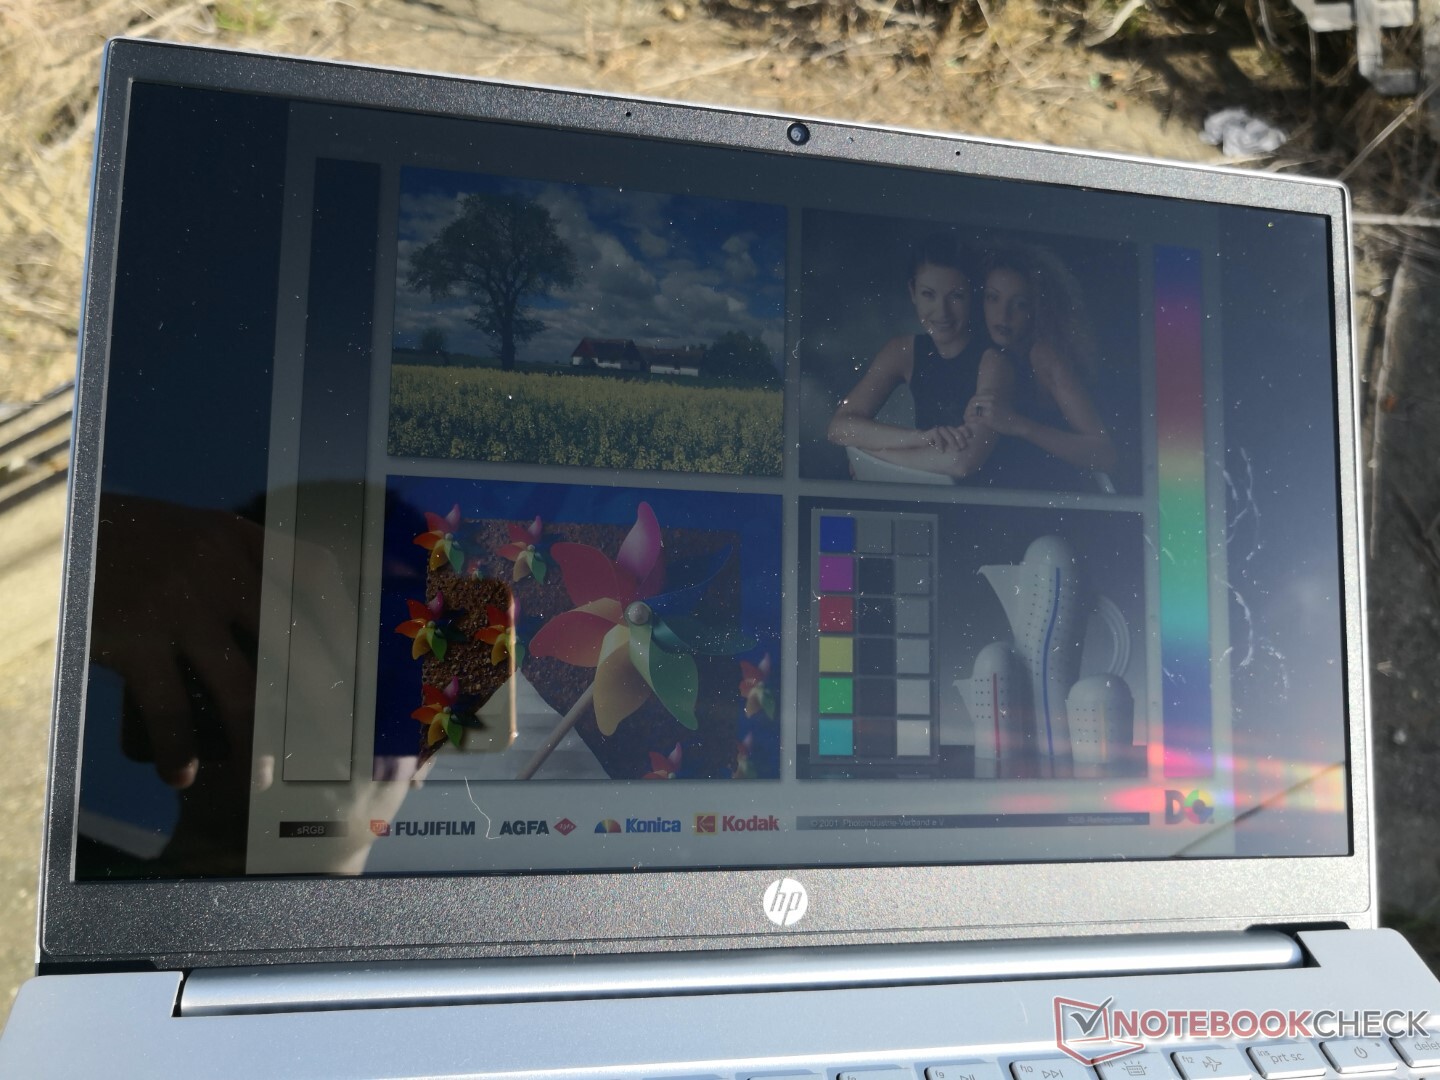
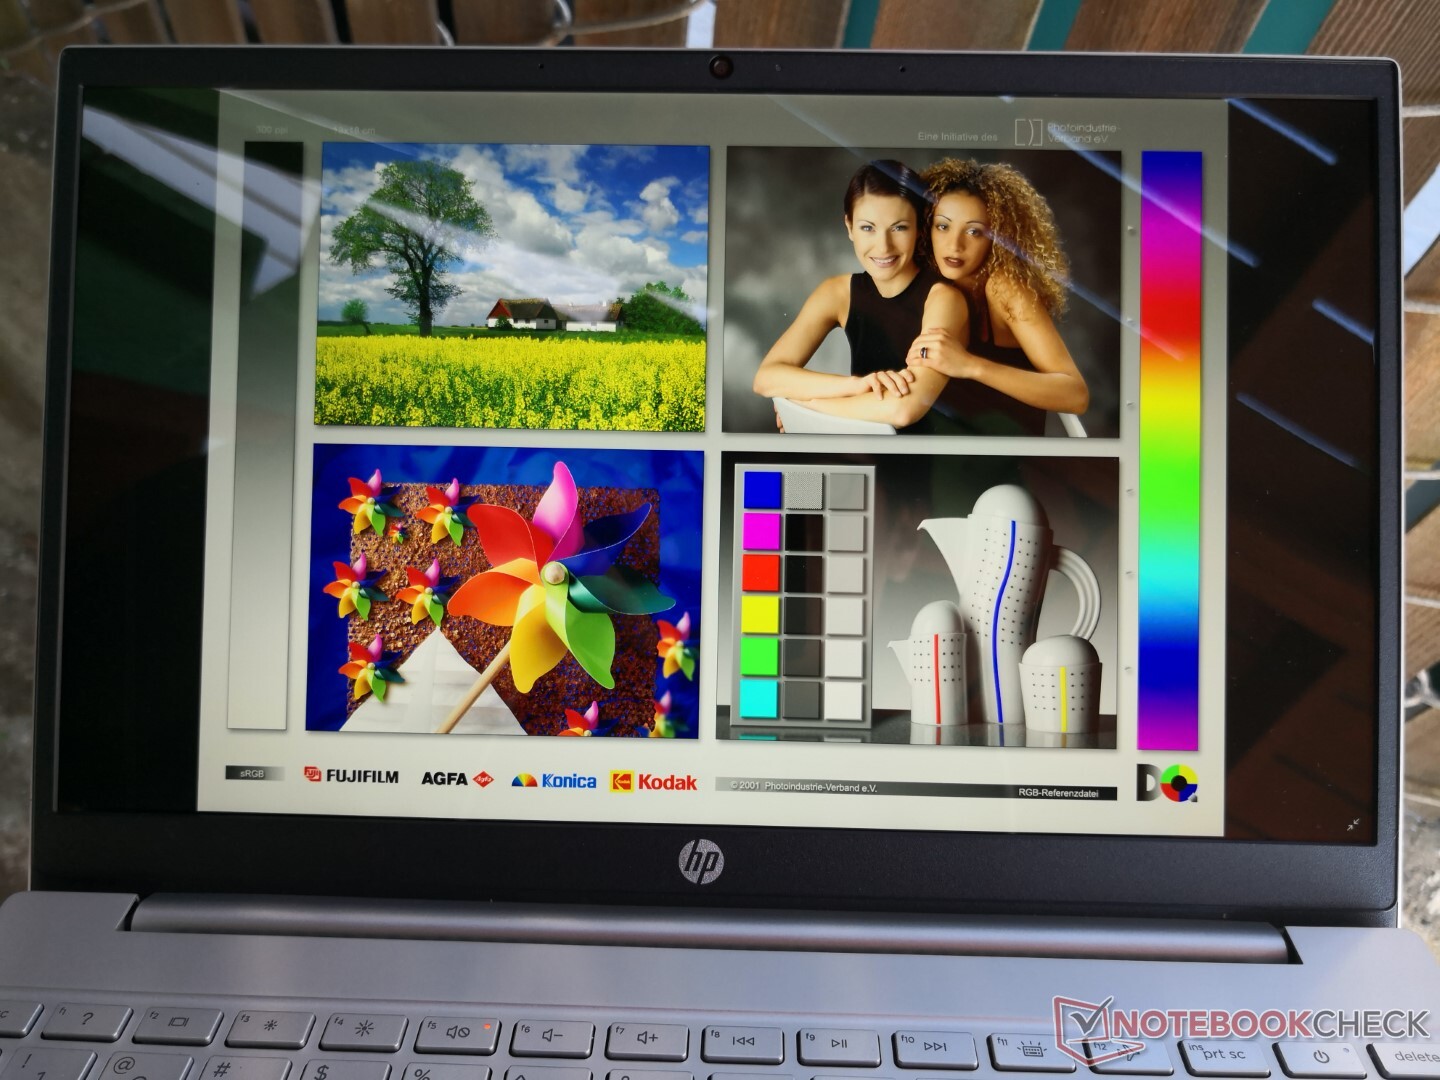
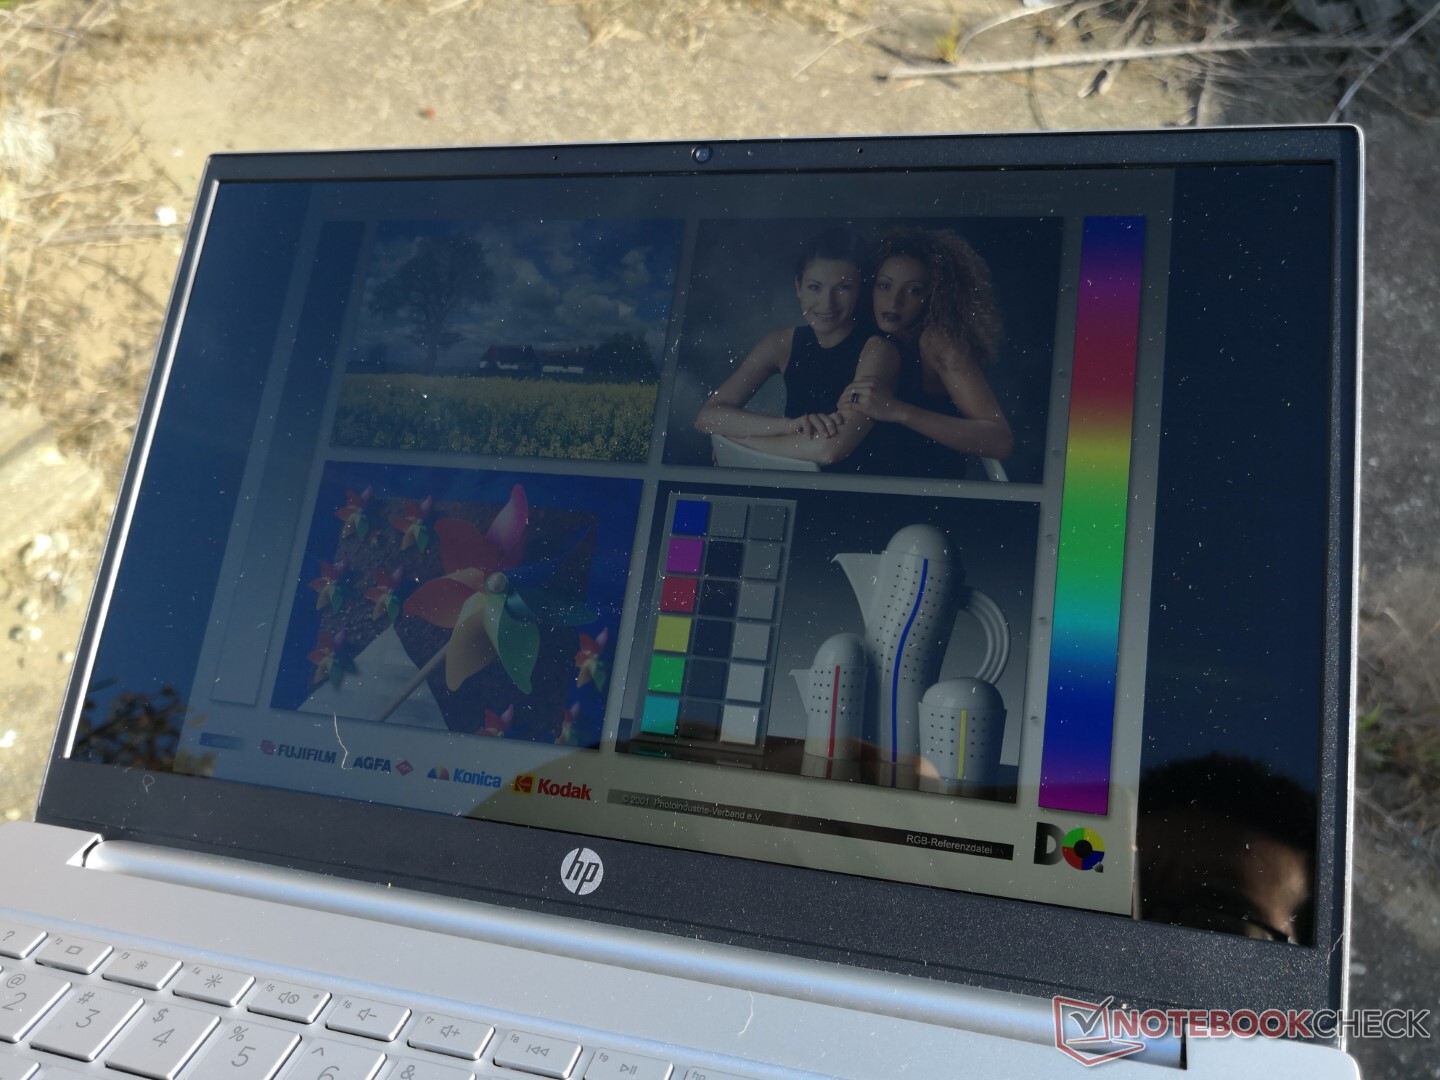
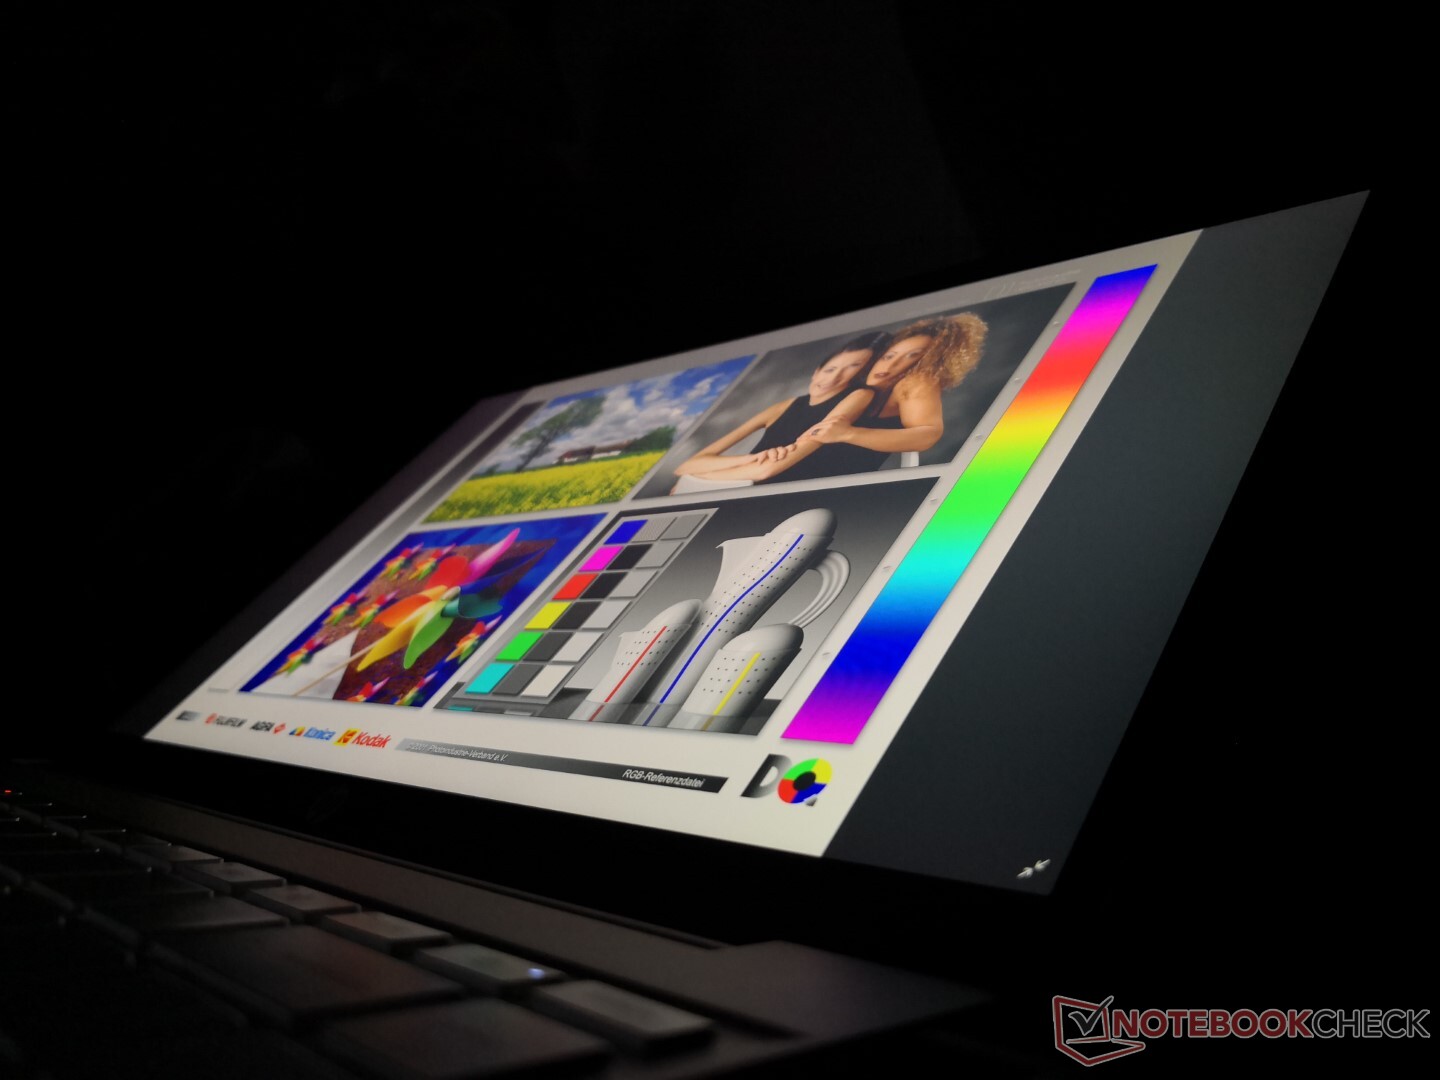
Display
Il pannello 4K UHD è impressionante considerando che il Pavilion 13 è un computer portatile orientato al risparmio. Siamo in grado di misurare una luminosità massima di 514 nits rispetto ai 550 nits pubblicizzati e un eccellente rapporto di contrasto rispetto ai più costosi Ultrabooks di punta della concorrenza come l'XPS 13, Spectre 13, ZenBook S13 o Lenovo Yoga 9i.
Uno svantaggio chiave per il display è il suo lento tempo di risposta in bianco e nero e grigio-grigio per il ghosting evidente, soprattutto se si eseguono giochi veloci.
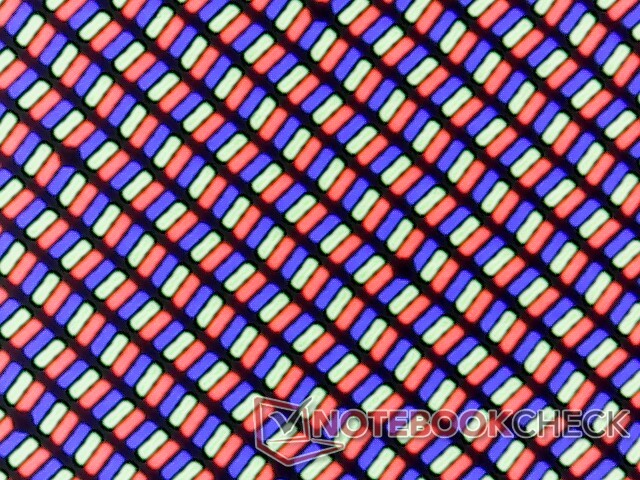
HWiNFO non è in grado di riconoscere il nome esatto del pannello oltre al controller AU Optronics AUOCA8D. Nessun altro portatile nel nostro database ha lo stesso controller di visualizzazione.
Tenete presente che le nostre misure qui sotto riflettono solo il pannello 4K UHD e non il pannello inferiore da 250-nits 1080p che sarà diverso in termini di colori, tempi di risposta, contrasto e altro ancora.

| |||||||||||||||||||||||||
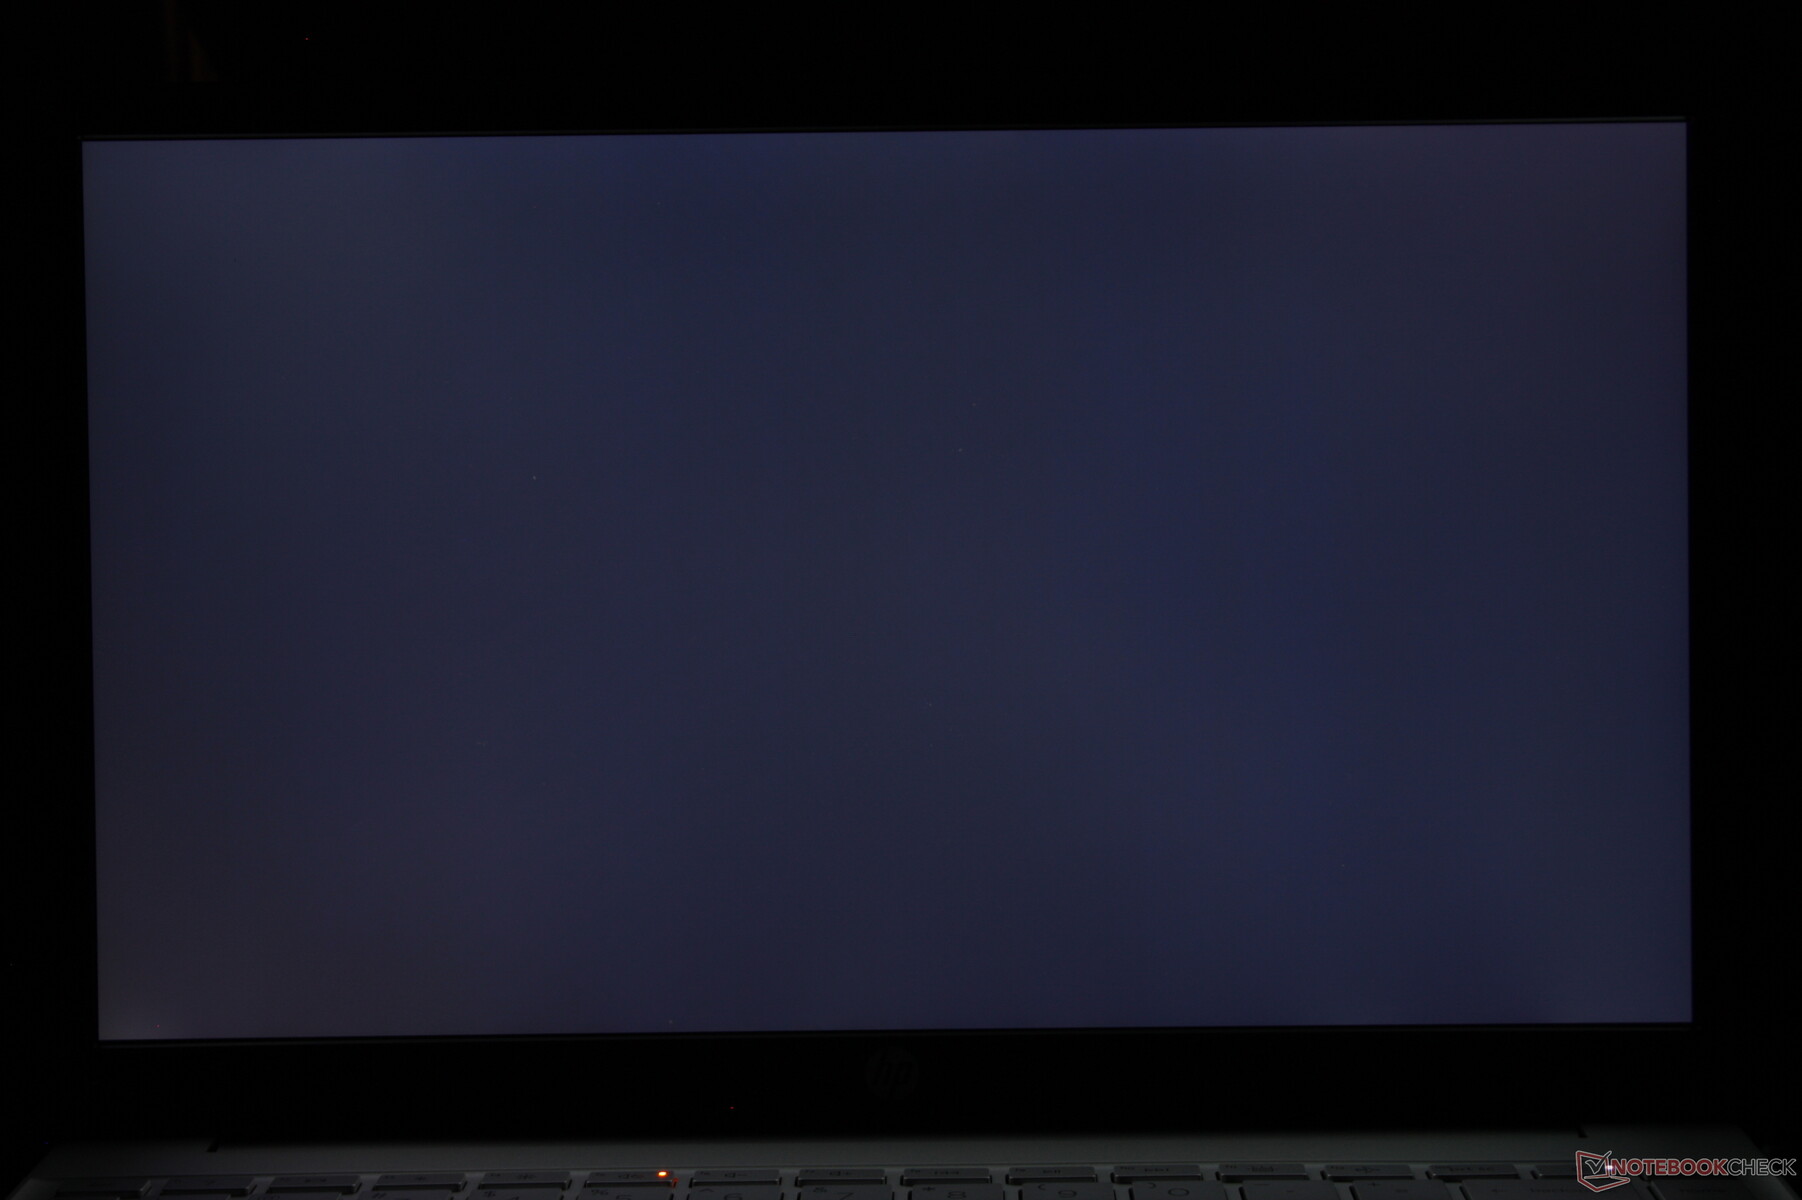
Distribuzione della luminosità: 91 %
Al centro con la batteria: 514.1 cd/m²
Contrasto: 1389:1 (Nero: 0.37 cd/m²)
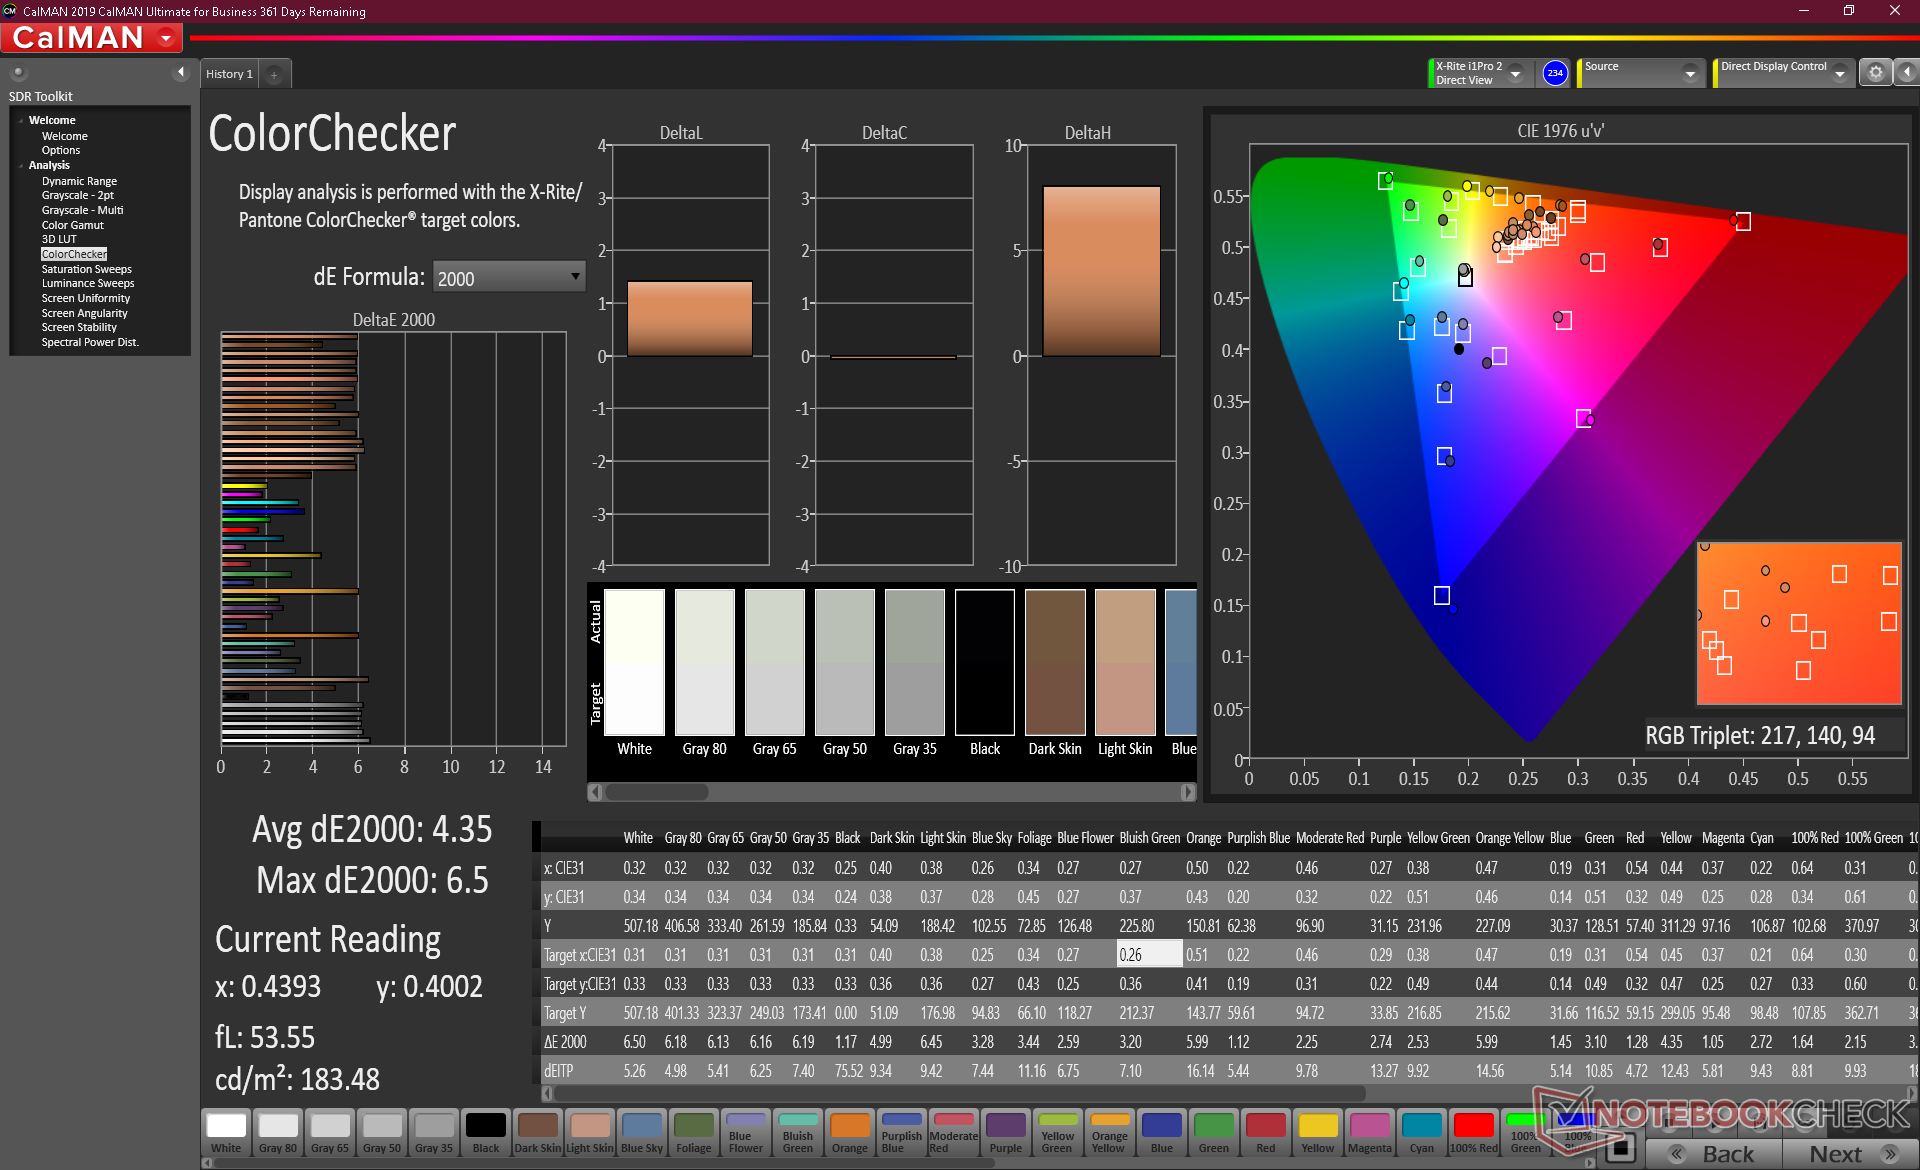
ΔE ColorChecker Calman: 4.35 | ∀{0.5-29.43 Ø4.71}
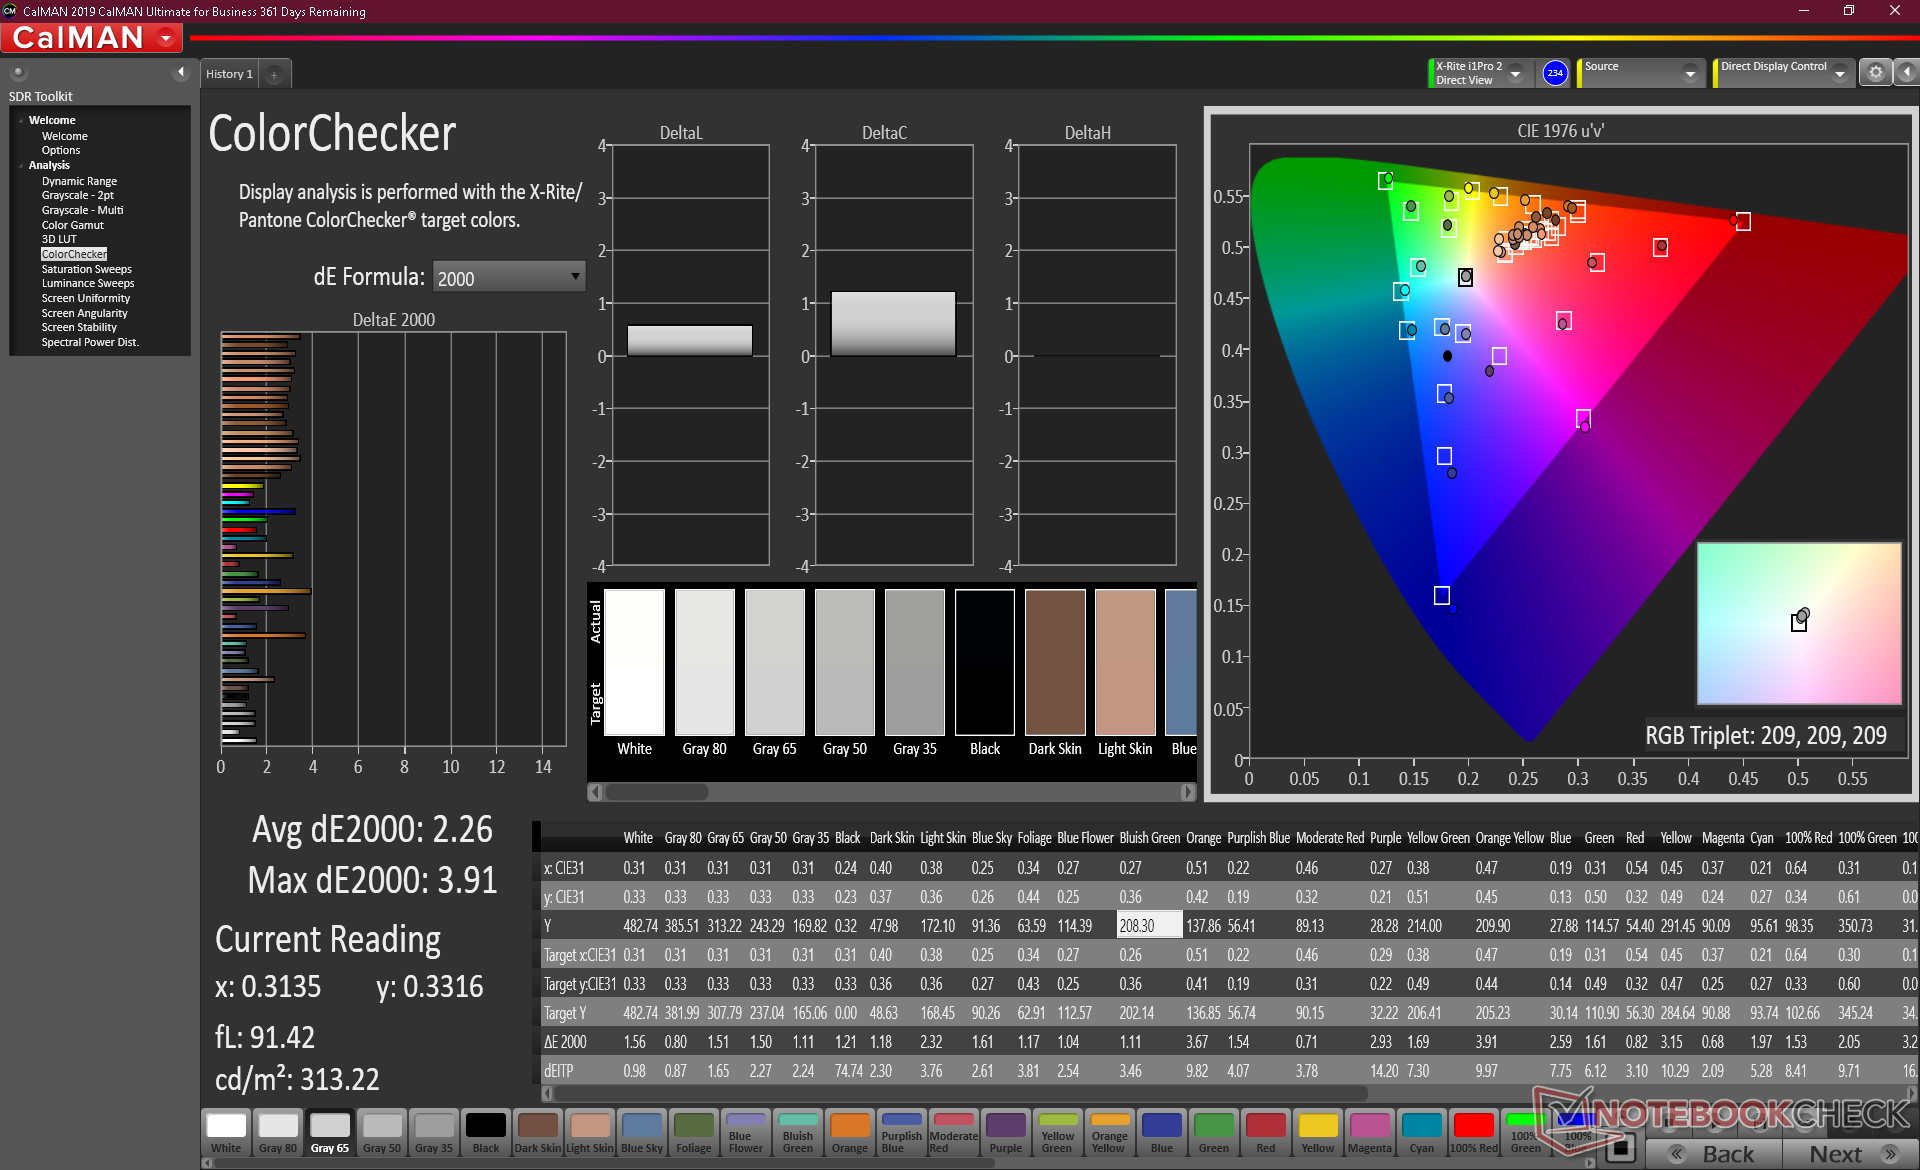
calibrated: 2.26
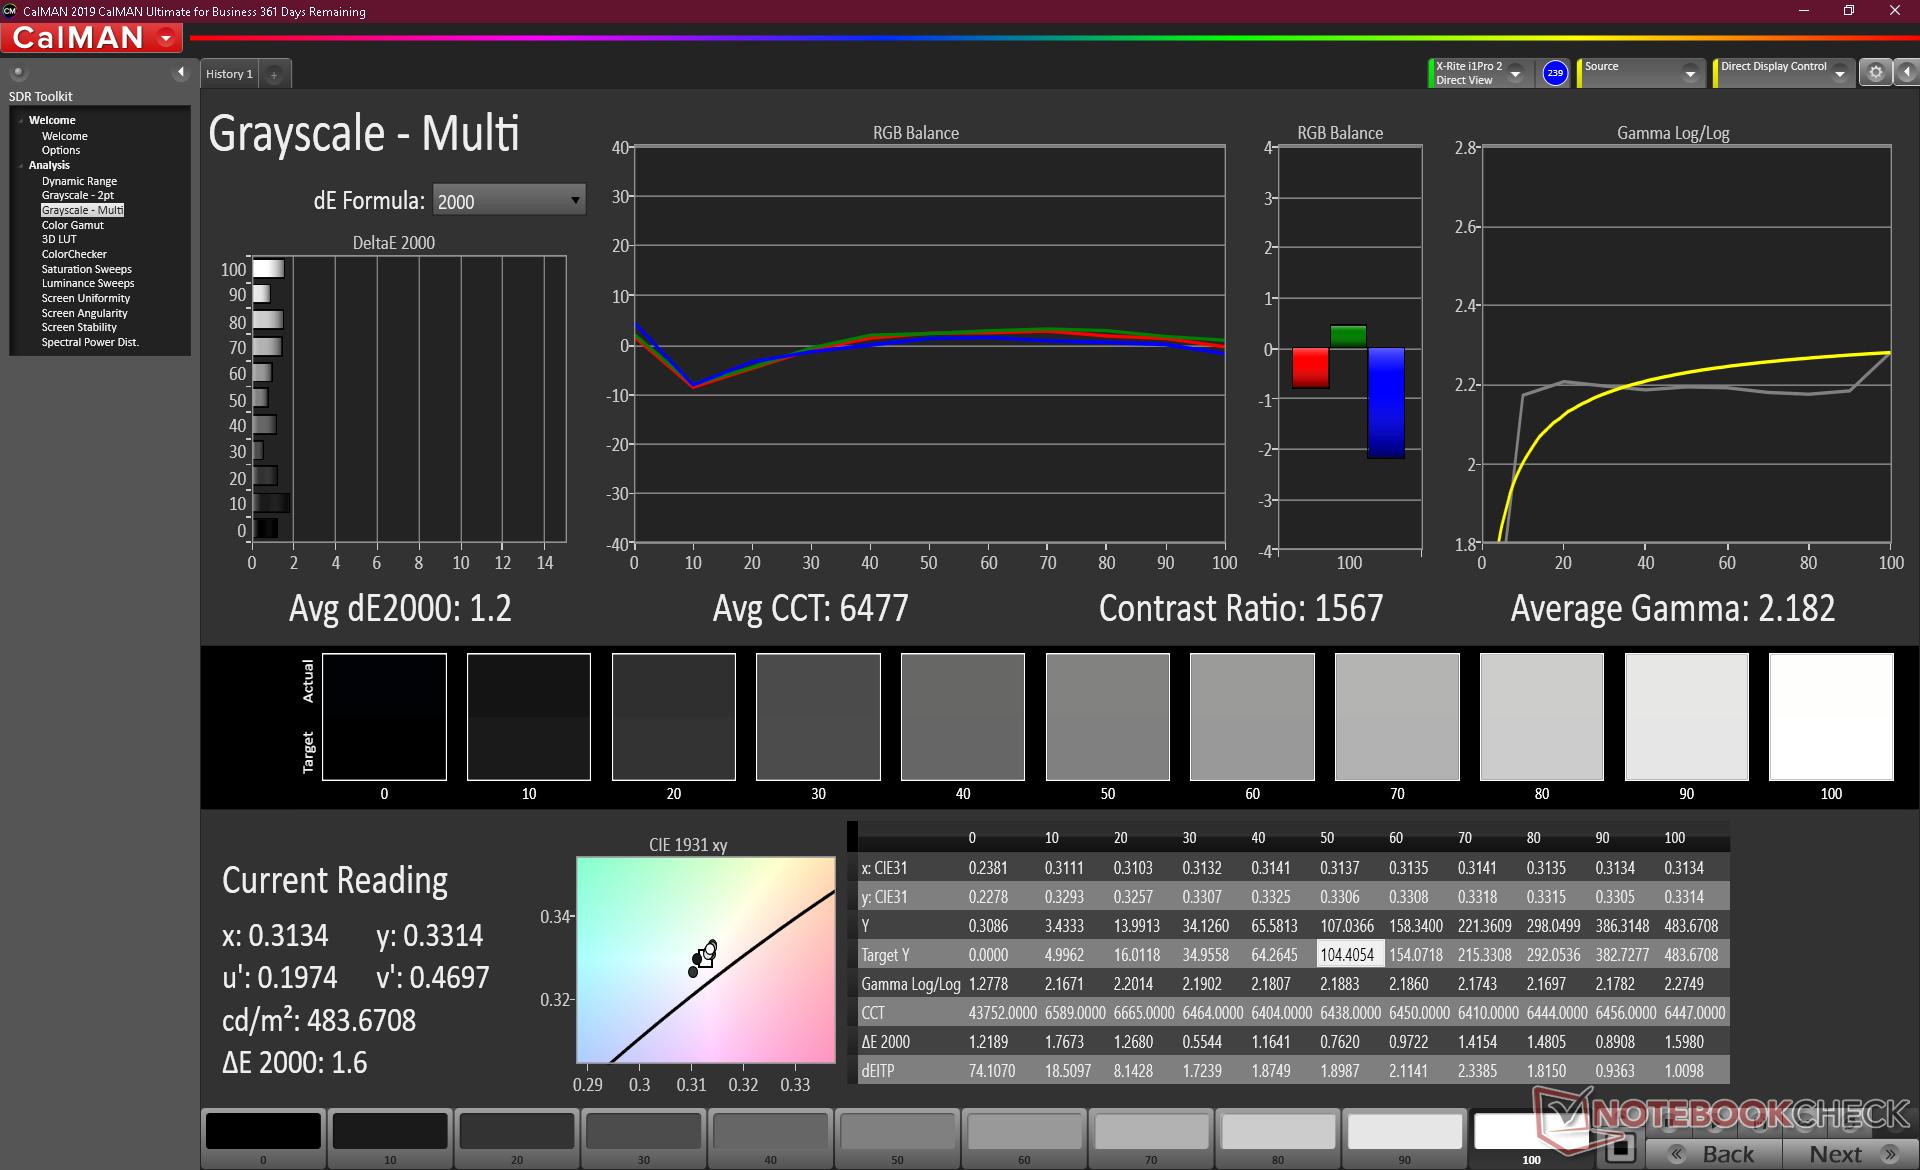
ΔE Greyscale Calman: 5.2 | ∀{0.09-98 Ø4.96}
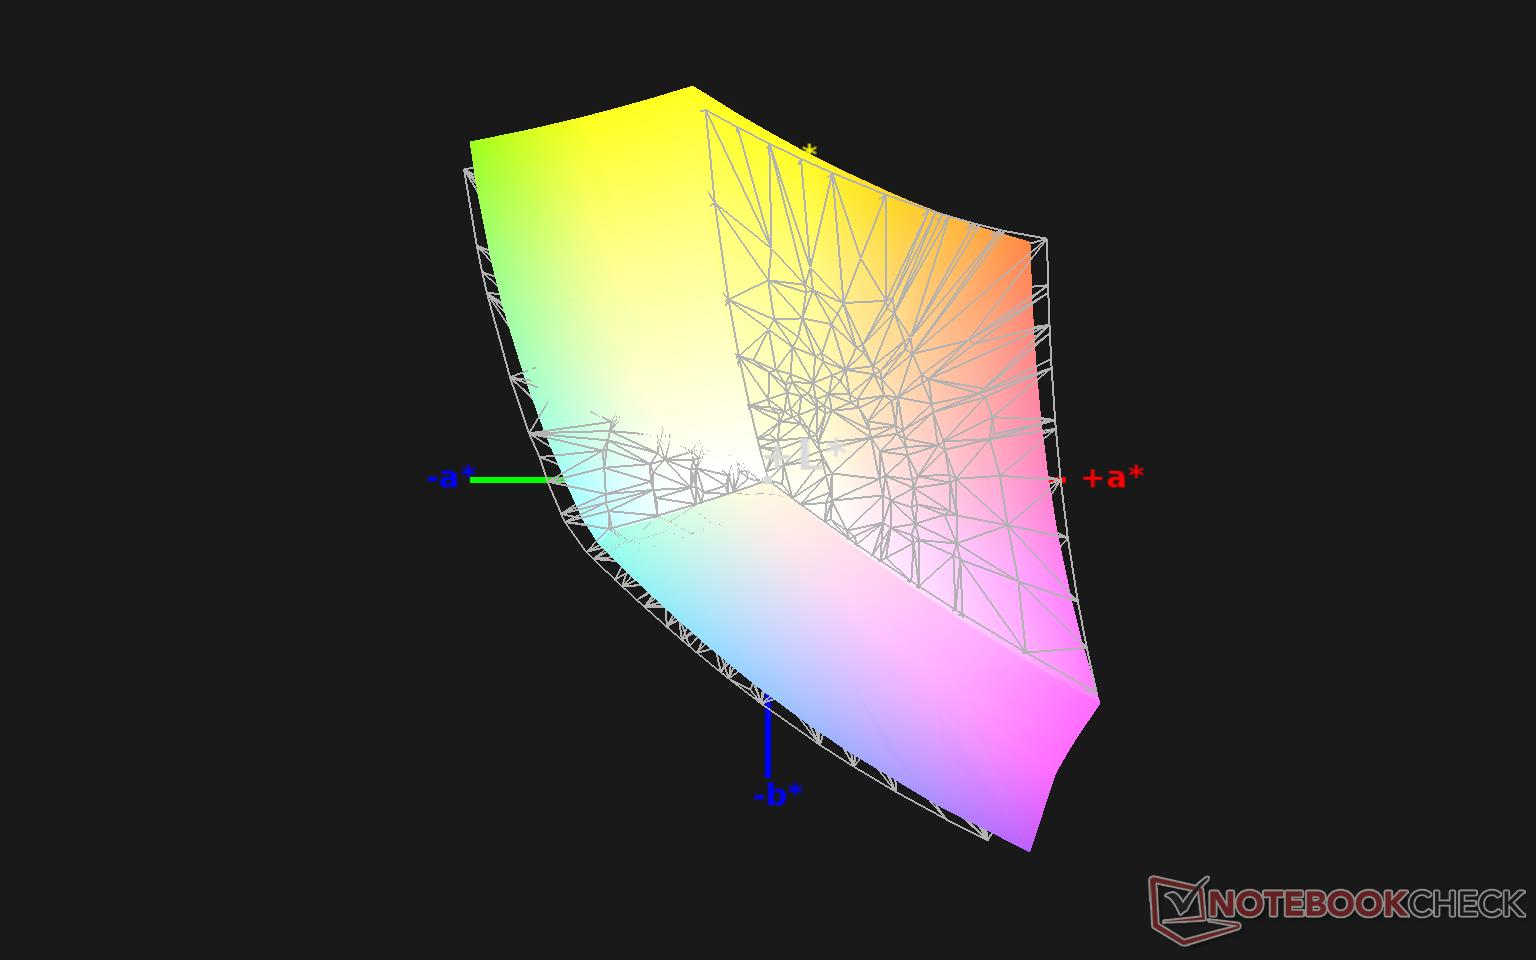
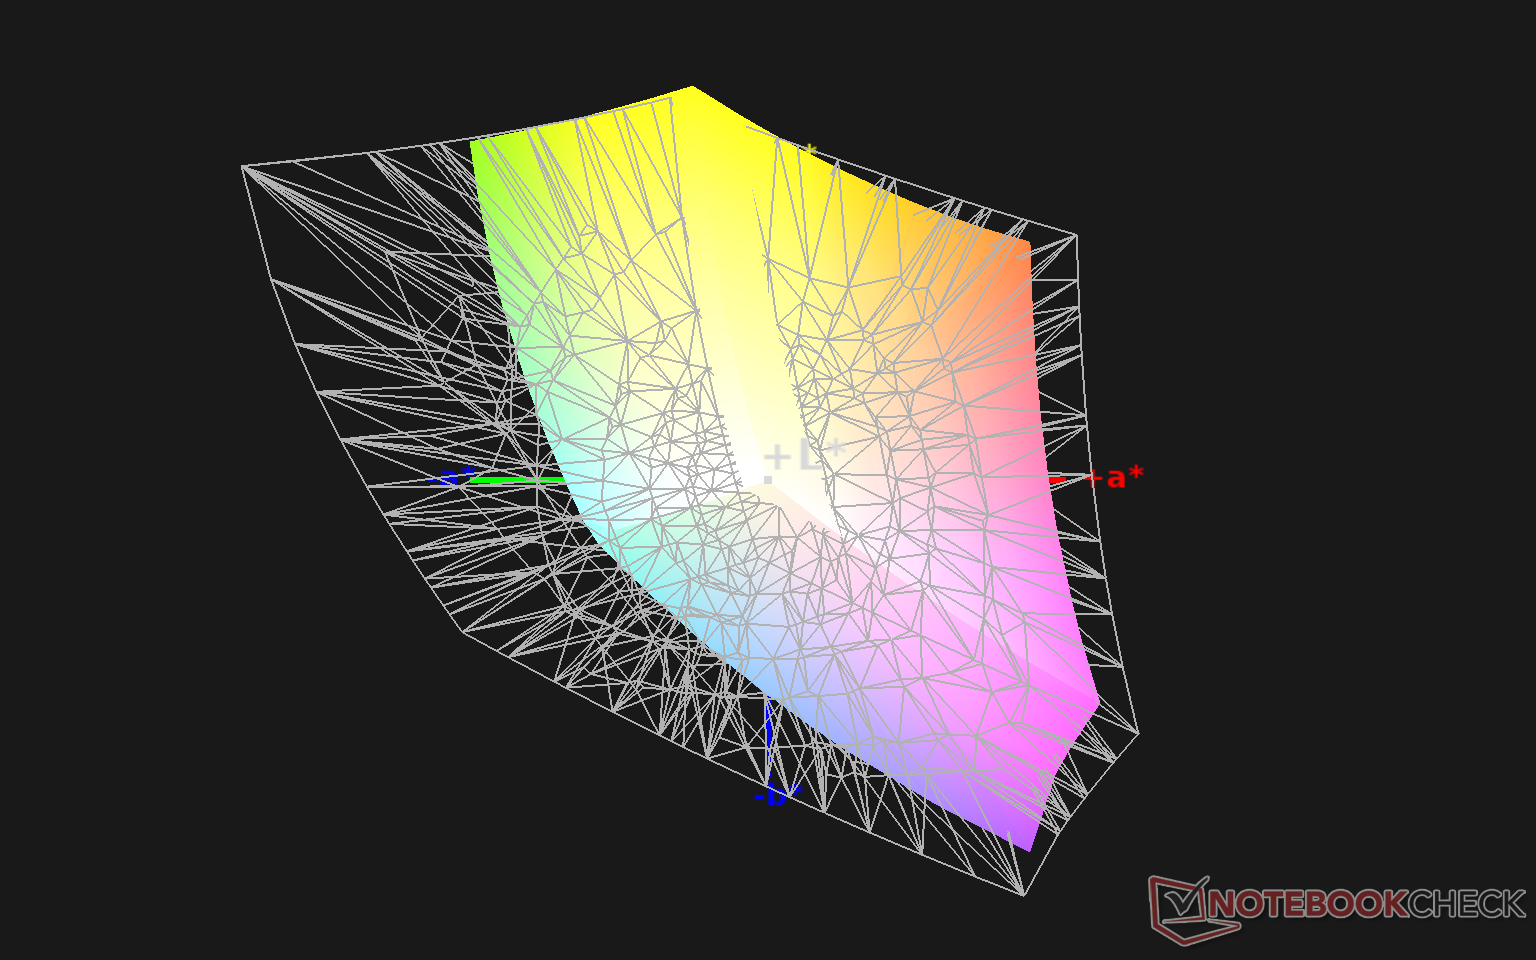
93.3% sRGB (Argyll 1.6.3 3D)
60.6% AdobeRGB 1998 (Argyll 1.6.3 3D)
66.5% AdobeRGB 1998 (Argyll 3D)
93.4% sRGB (Argyll 3D)
65% Display P3 (Argyll 3D)
Gamma: 2.12
CCT: 6308 K
| HP Pavilion 13-bb0015cl AUOCA8D, IPS, 13.3", 3840x2160 | HP Envy 13-ba0001ng AU Optronics AUO3A8C, IPS, 13.3", 1920x1080 | Dell XPS 13 9300 i5 FHD SHP14CB, IPS, 13.4", 1920x1200 | Asus VivoBook S13 S330UA-EY034T N133HCE-EAA, IPS LED, 13.3", 1920x1080 | Lenovo IdeaPad S540-13ARE-82DL000YGE Chi Mei CMN13B0 (N133GCA-GQ1), IPS, 13.3", 2560x1600 | Acer Swift 3 SF313-52-71Y7 BOE, NE135FBM-N41, IPS, 13.5", 2256x1504 | |
|---|---|---|---|---|---|---|
| Display | 4% | 9% | -34% | 0% | 7% | |
| Display P3 Coverage (%) | 65 | 67.1 3% | 71.5 10% | 42.16 -35% | 64.2 -1% | 70.1 8% |
| sRGB Coverage (%) | 93.4 | 99.1 6% | 99.4 6% | 63.2 -32% | 95.7 2% | 99.8 7% |
| AdobeRGB 1998 Coverage (%) | 66.5 | 69.2 4% | 73.5 11% | 43.59 -34% | 66 -1% | 71.2 7% |
| Response Times | 11% | 3% | 26% | 41% | 10% | |
| Response Time Grey 50% / Grey 80% * (ms) | 52.4 ? | 56 ? -7% | 60 ? -15% | 40.8 ? 22% | 33 ? 37% | 55 ? -5% |
| Response Time Black / White * (ms) | 41.6 ? | 30 ? 28% | 33.2 ? 20% | 29.6 ? 29% | 23 ? 45% | 31 ? 25% |
| PWM Frequency (Hz) | 2500 ? | 26040 ? | 208 ? | |||
| Screen | 32% | 13% | -42% | -0% | 8% | |
| Brightness middle (cd/m²) | 514.1 | 466 -9% | 619 20% | 280 -46% | 321 -38% | 474 -8% |
| Brightness (cd/m²) | 501 | 418 -17% | 591 18% | 265 -47% | 304 -39% | 426 -15% |
| Brightness Distribution (%) | 91 | 85 -7% | 91 0% | 89 -2% | 88 -3% | 82 -10% |
| Black Level * (cd/m²) | 0.37 | 0.215 42% | 0.35 5% | 0.24 35% | 0.32 14% | 0.29 22% |
| Contrast (:1) | 1389 | 2167 56% | 1769 27% | 1167 -16% | 1003 -28% | 1634 18% |
| Colorchecker dE 2000 * | 4.35 | 1.06 76% | 3 31% | 5.6 -29% | 3.41 22% | 2.38 45% |
| Colorchecker dE 2000 max. * | 6.5 | 1.59 76% | 8.2 -26% | 20.7 -218% | 5.88 10% | |
| Colorchecker dE 2000 calibrated * | 2.26 | 1.09 52% | 1 56% | 4.3 -90% | 0.66 71% | 2.69 -19% |
| Greyscale dE 2000 * | 5.2 | 1.3 75% | 5.2 -0% | 4.1 21% | 5.54 -7% | 3.75 28% |
| Gamma | 2.12 104% | 2.39 92% | 2.14 103% | 2.44 90% | 2.33 94% | 2.37 93% |
| CCT | 6308 103% | 6699 97% | 6340 103% | 6614 98% | 6476 100% | 6466 101% |
| Color Space (Percent of AdobeRGB 1998) (%) | 60.6 | 63 4% | 66.9 10% | 40.1 -34% | 61 1% | 65 7% |
| Color Space (Percent of sRGB) (%) | 93.3 | 99 6% | 99.3 6% | 63 -32% | 96 3% | 100 7% |
| Media totale (Programma / Settaggio) | 16% /
24% | 8% /
11% | -17% /
-32% | 14% /
5% | 8% /
8% |
* ... Meglio usare valori piccoli
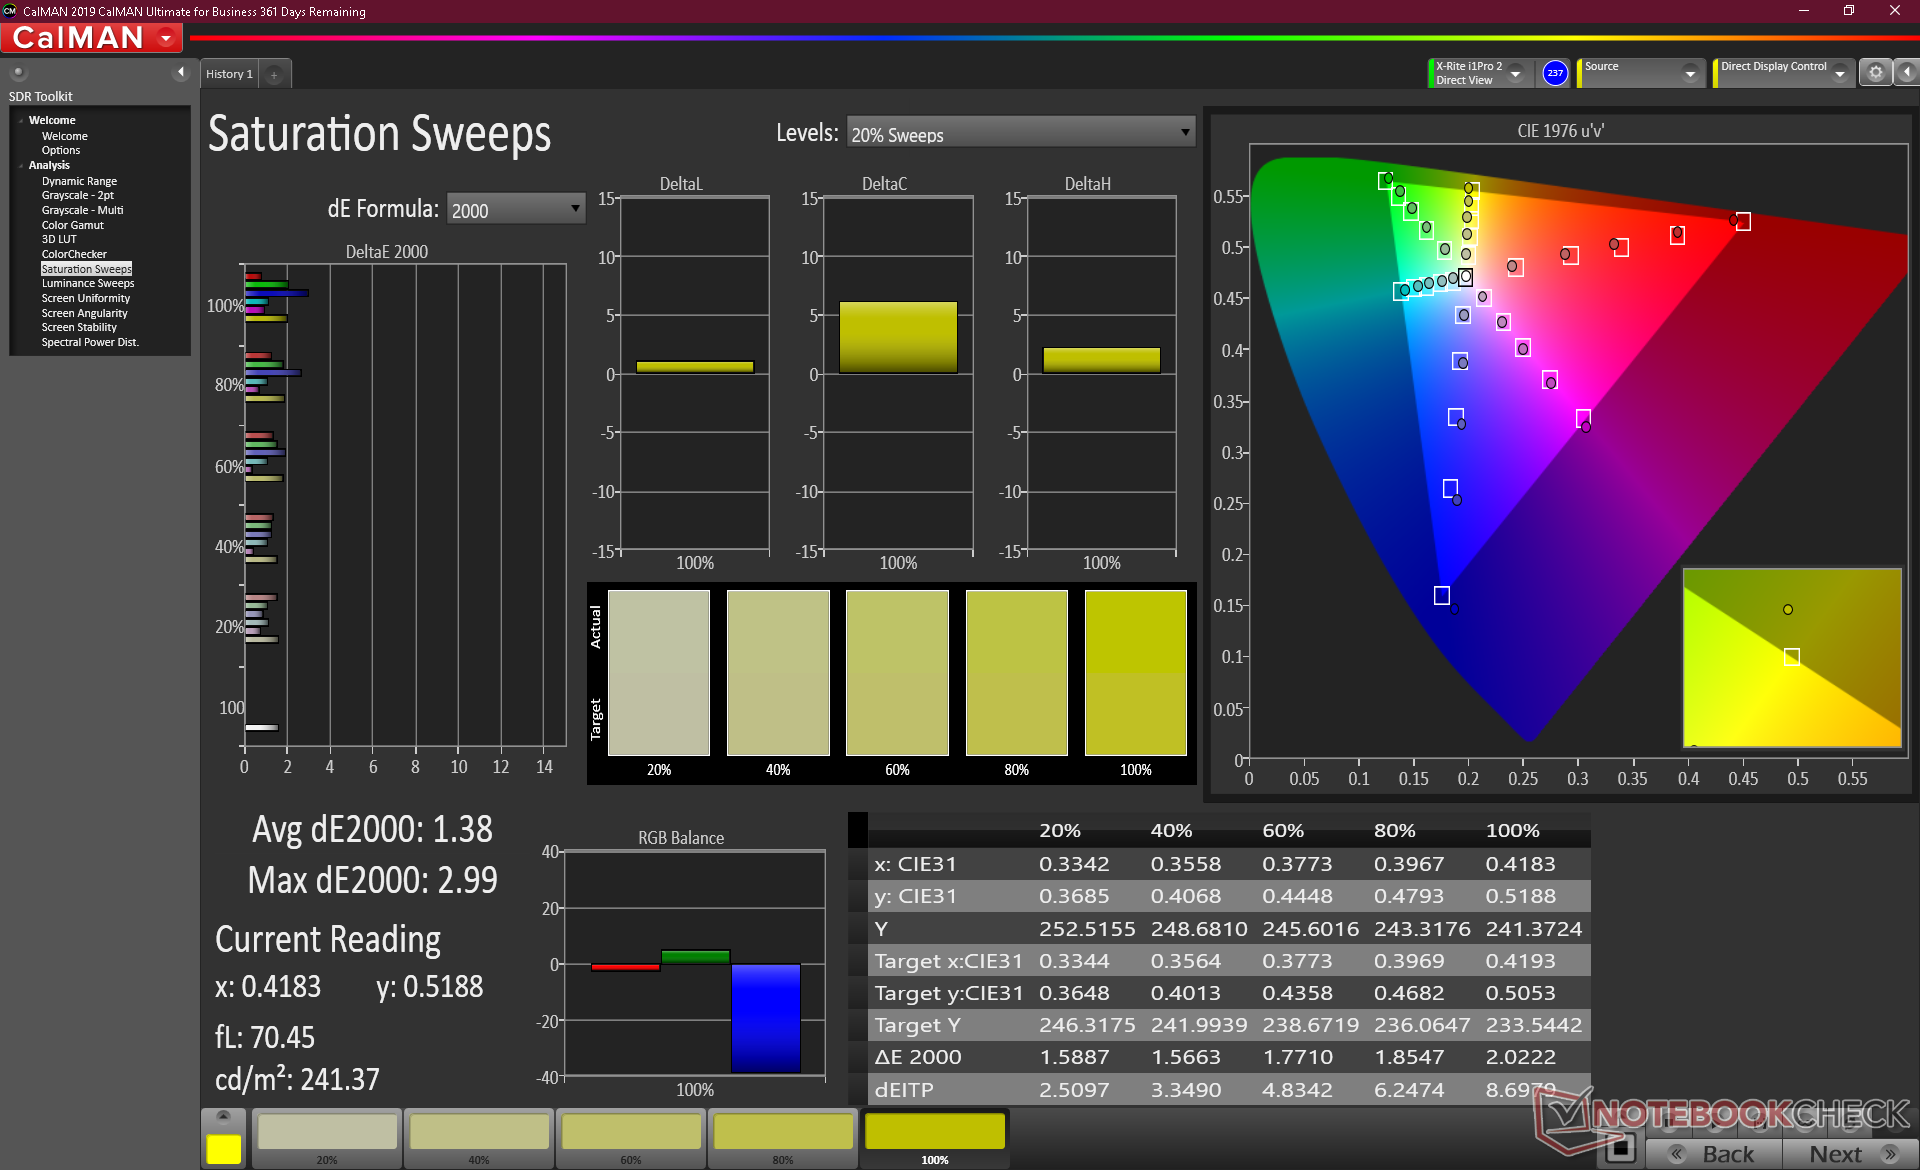
Lo spazio colore copre circa il 93% e il 61% di sRGB e AdobeRGB, rispettivamente, risultando essere simile alla maggior parte dei pannelli FHD su Ultrabooks di fascia alta come l'XPS 13. I pannelli 4K sui laptop più costosi tendono ad offrire una copertura completa di AdobeRGB per colori più profondi e precisi come sull'HP Spectre 13.
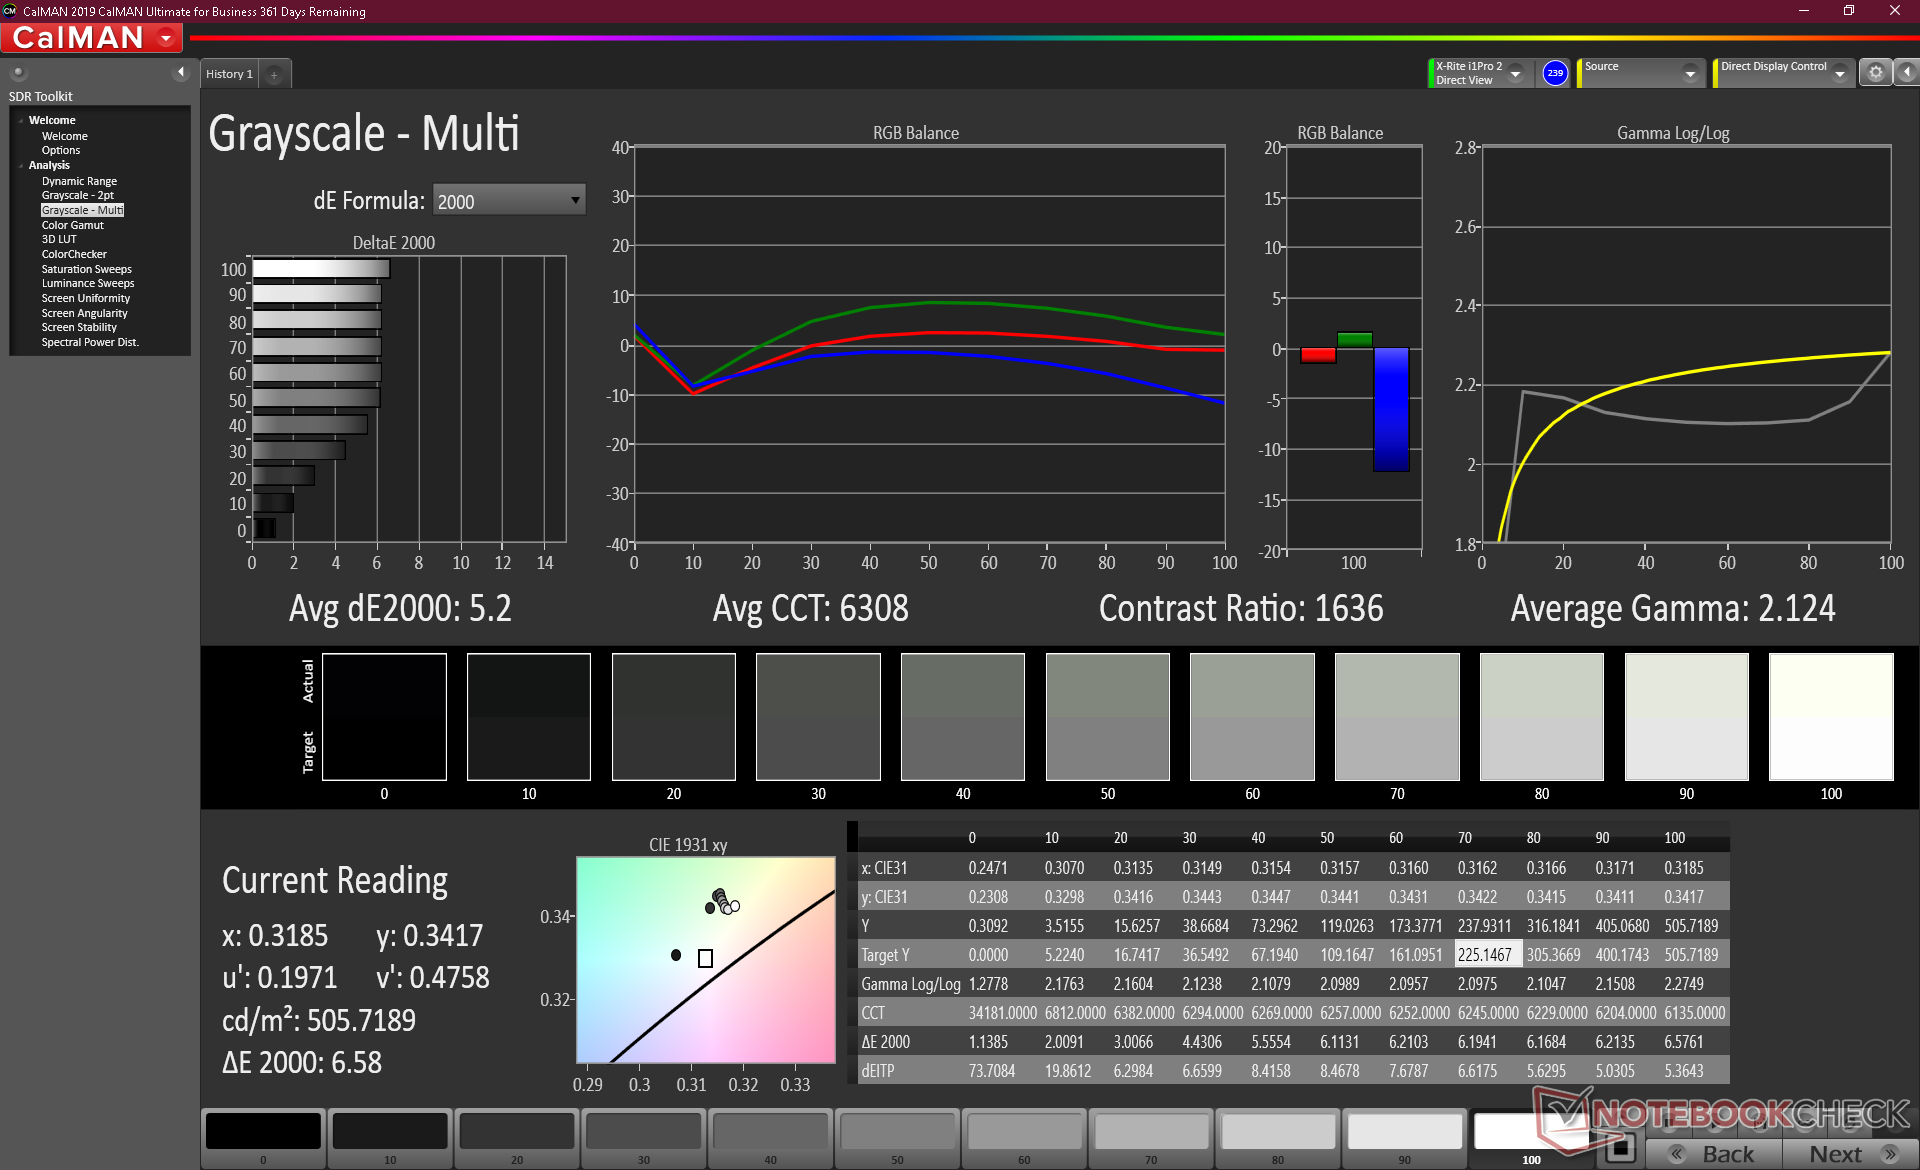
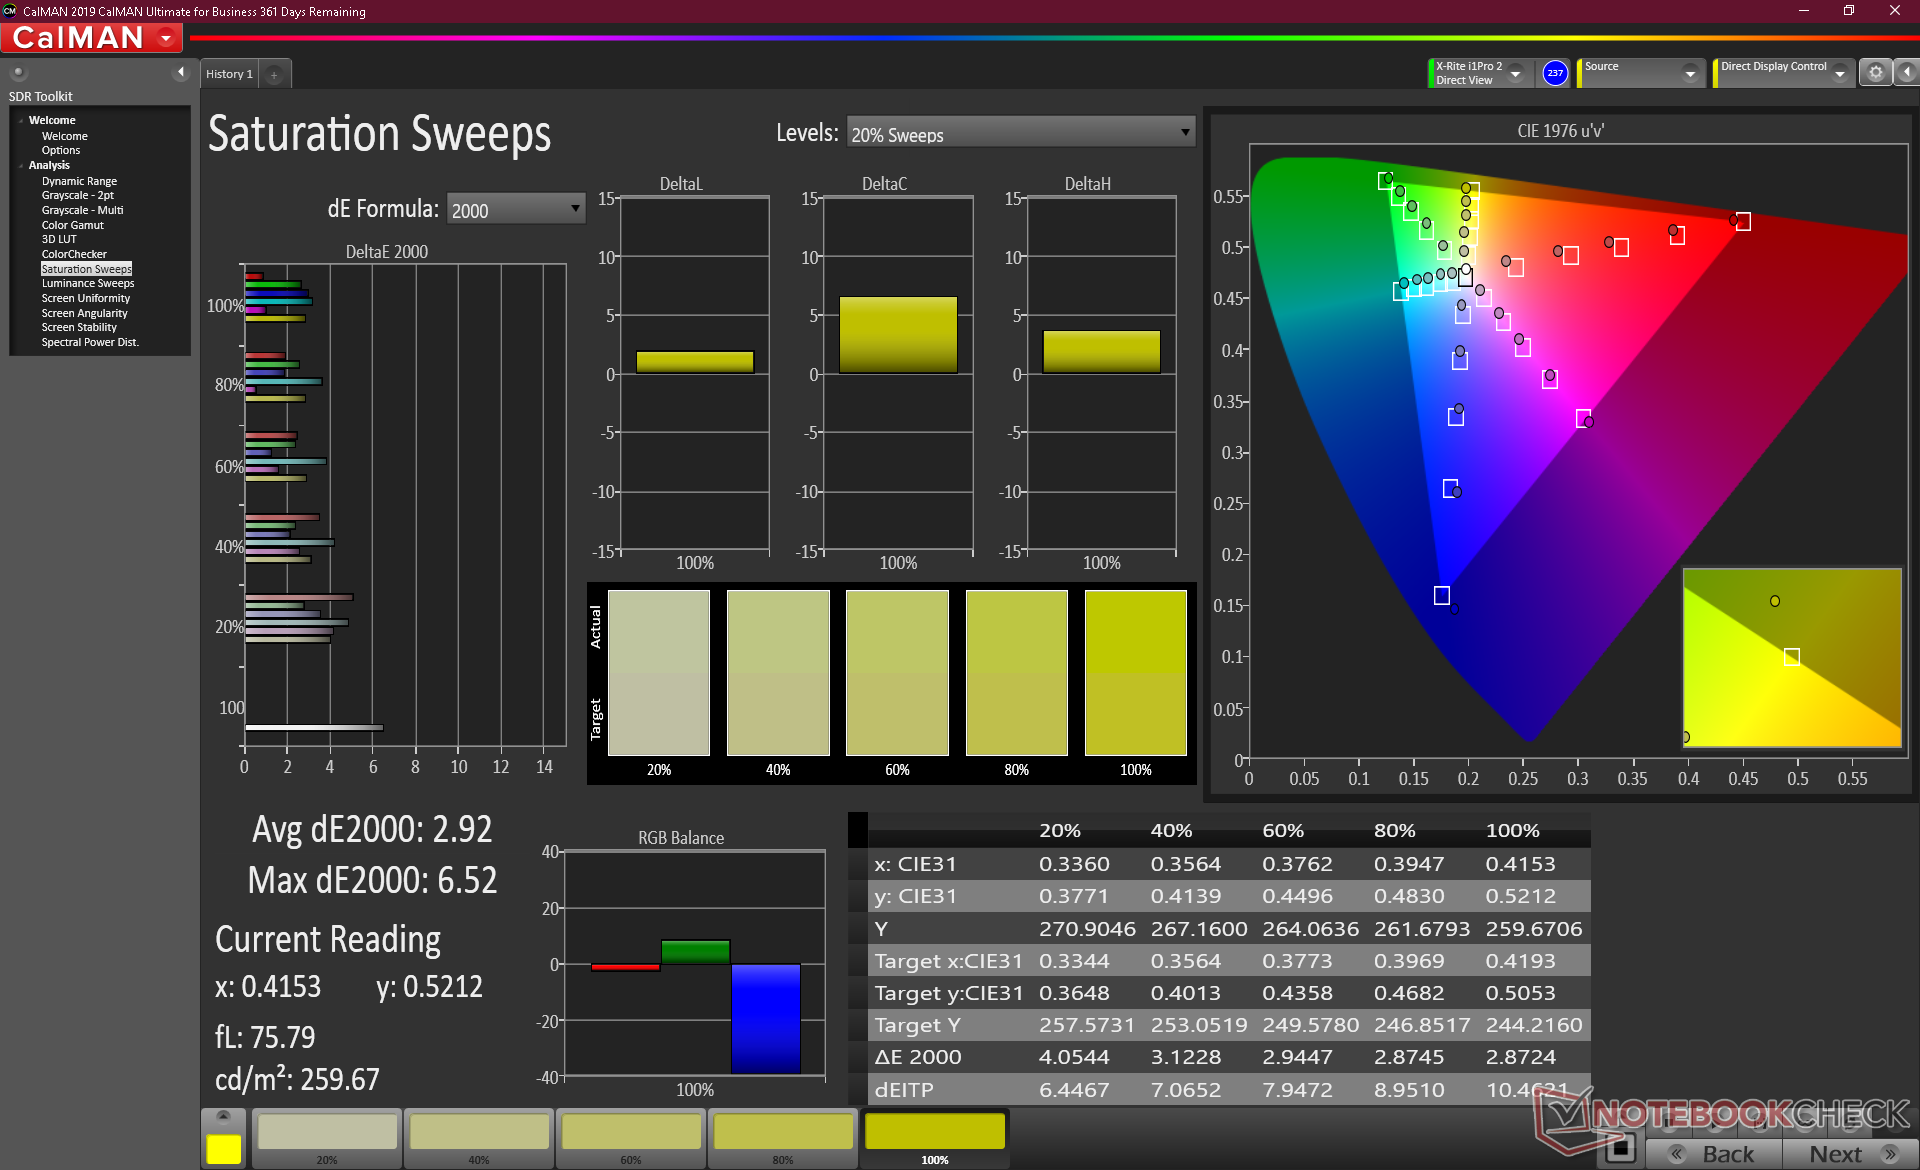
Le misure del colorimetro X-Rite rivelano un display non calibrato con una temperatura di colore troppo calda. Si tratta di un portatile economico, dopotutto, e quindi non ci si aspetta un pannello perfettamente calibrato. Calibrare il pannello da soli migliora notevolmente la scala dei grigi, la temperatura di colore e la bilancia RGB con un nuovo valore medio DeltaE in scala di grigi di appena 1,2. Si consiglia una calibrazione dell'utente finale, se possibile, per ottenere il massimo dal display UHD 4K.
Tempi di risposta del Display
| ↔ Tempi di risposta dal Nero al Bianco | ||
|---|---|---|
| 41.6 ms ... aumenta ↗ e diminuisce ↘ combinato | ↗ 21.2 ms Incremento | 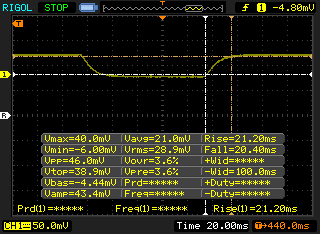 |
| ↘ 20.4 ms Calo | ||
| Lo schermo mostra tempi di risposta lenti nei nostri tests e sarà insoddisfacente per i gamers. In confronto, tutti i dispositivi di test variano da 0.1 (minimo) a 240 (massimo) ms. » 98 % di tutti i dispositivi è migliore. Questo significa che i tempi di risposta rilevati sono peggiori rispetto alla media di tutti i dispositivi testati (19.8 ms). | ||
| ↔ Tempo di risposta dal 50% Grigio all'80% Grigio | ||
| 52.4 ms ... aumenta ↗ e diminuisce ↘ combinato | ↗ 25.2 ms Incremento | 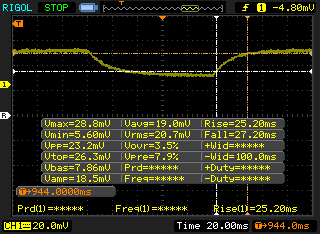 |
| ↘ 27.2 ms Calo | ||
| Lo schermo mostra tempi di risposta lenti nei nostri tests e sarà insoddisfacente per i gamers. In confronto, tutti i dispositivi di test variano da 0.165 (minimo) a 636 (massimo) ms. » 89 % di tutti i dispositivi è migliore. Questo significa che i tempi di risposta rilevati sono peggiori rispetto alla media di tutti i dispositivi testati (31 ms). | ||
Sfarfallio dello schermo / PWM (Pulse-Width Modulation)
| flickering dello schermo / PWM non rilevato | 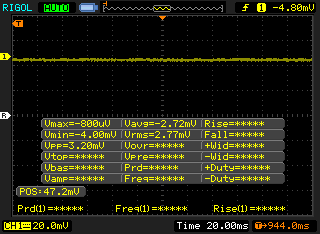 | ||
In confronto: 52 % di tutti i dispositivi testati non utilizza PWM per ridurre la luminosita' del display. Se è rilevato PWM, una media di 7747 (minimo: 5 - massimo: 343500) Hz è stata rilevata. | |||
Prestazioni
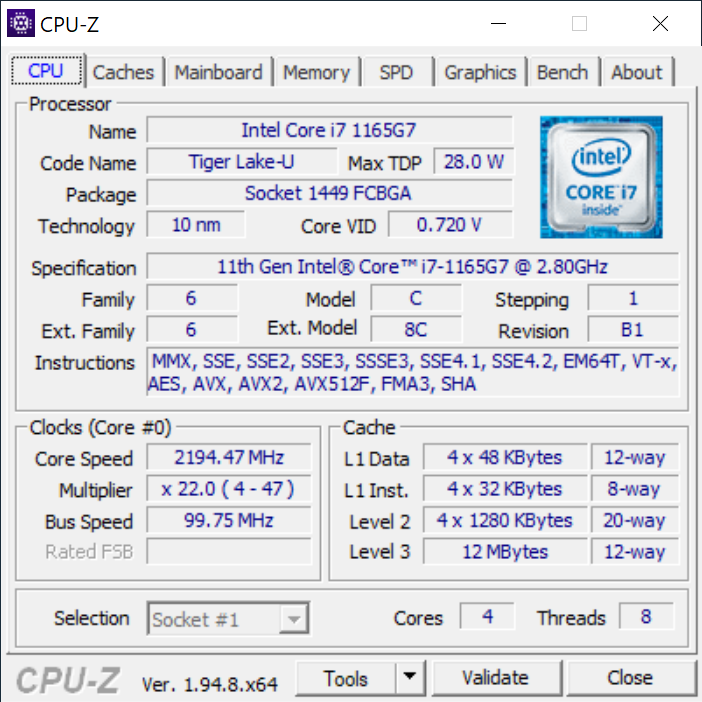
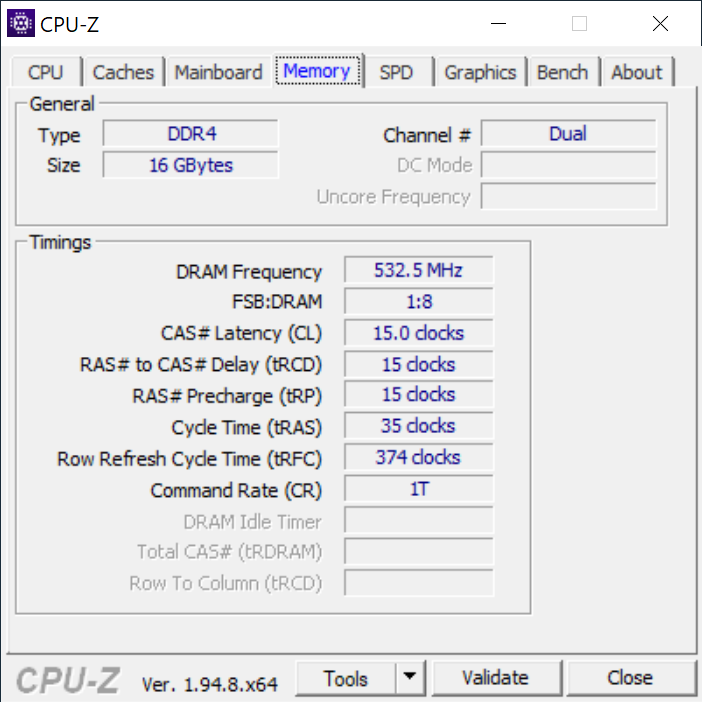
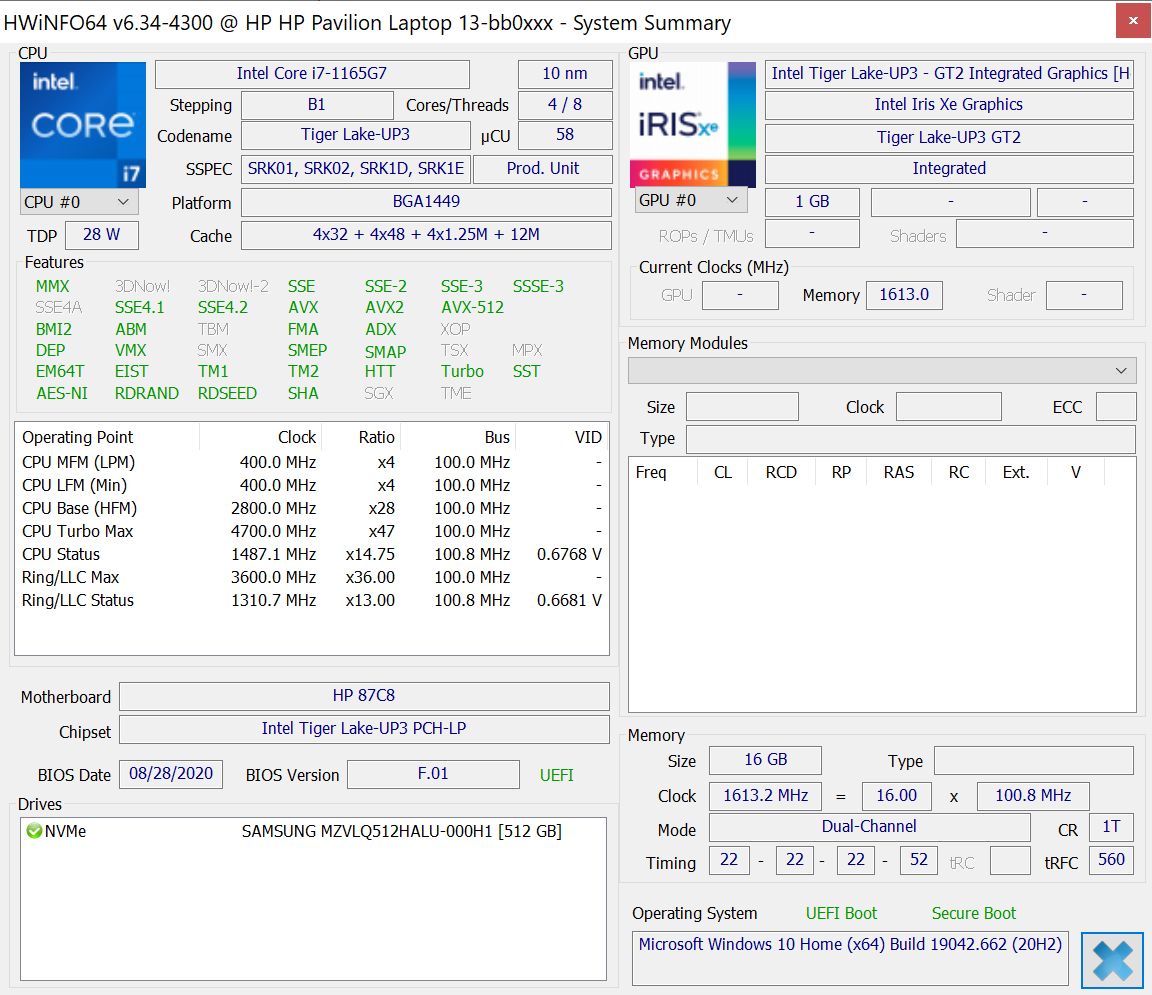
Gli utenti possono scegliere tra Core i5-1135G7 o Core i7-1165G7 per sostituire rispettivamente i5-1035G7 e i7-1065G7 dell'anno scorso. Intel Iris Xe viene fornito di serie su tutte le versioni senza opzioni AMD o Nvidia al momento. Gli utenti devono selezionare la capacità di RAM con attenzione, poiché i moduli sono saldati.
Abbiamo eseguito tutti i benchmarks di performance qui sotto sulla modalità Windows Best performance mode per ottenere i punteggi più alti possibili. HP Command Center non è stato preinstallato sulla nostra unità di prova.
Processore
Le prestazioni della CPU multi-thread sono dal 4 al 15% più lente rispetto alla media del Core i7-1165G7 nel nostro database secondo i benchmarks CineBench. Il potenziale di breve durata del Turbo Boost del processore è da biasimare per le prestazioni leggermente sottotono. Il Razer Blade Stealth con la stessa CPU, ad esempio, può funzionare quasi il 20% più velocemente. Tuttavia, le prestazioni sono ancora circa dal 15 al 20% superiori rispetto al vecchio Core i7-1065G7 nei carichi multi-threaded o il 25% più veloci nei carichi single-threaded.
Si noti che il concorrente Ryzen 7 4700U può superare la nostra CPU Intel del 65-80% nei carichi di lavoro multi-threaded, mentre la CPU Intel ha il vantaggio nei carichi di lavoro single-threaded di un 15-25% più piccolo.
Consulta la nostra pagina dedicata al Core i7-1165G7 per ulteriori informazioni tecniche e confronti di benchmarks.
Cinebench R15: CPU Multi 64Bit | CPU Single 64Bit
Blender: v2.79 BMW27 CPU
7-Zip 18.03: 7z b 4 -mmt1 | 7z b 4
Geekbench 5.5: Single-Core | Multi-Core
HWBOT x265 Benchmark v2.2: 4k Preset
LibreOffice : 20 Documents To PDF
R Benchmark 2.5: Overall mean
| Geekbench 5.5 / Single-Core | |
| HP Pavilion 13-bb0015cl | |
| Media Intel Core i7-1165G7 (1302 - 1595, n=77) | |
| Asus Zenbook S UX393JA | |
| HP Envy 13-ba0001ng | |
| Lenovo Yoga Slim 7-14ARE | |
| Lenovo Yoga Slim 7-14ARE | |
| Lenovo Yoga Slim 7 14ARE05 82A20008GE | |
| Huawei MateBook 13 2020 i5 | |
| Geekbench 5.5 / Multi-Core | |
| Lenovo Yoga Slim 7-14ARE | |
| Lenovo Yoga Slim 7-14ARE | |
| Lenovo Yoga Slim 7 14ARE05 82A20008GE | |
| Media Intel Core i7-1165G7 (3078 - 5926, n=77) | |
| HP Pavilion 13-bb0015cl | |
| Asus Zenbook S UX393JA | |
| Huawei MateBook 13 2020 i5 | |
| HP Envy 13-ba0001ng | |
| HWBOT x265 Benchmark v2.2 / 4k Preset | |
| Lenovo Yoga Slim 7-14ARE | |
| Lenovo Yoga Slim 7 14ARE05 82A20008GE | |
| Media Intel Core i7-1165G7 (1.39 - 8.47, n=80) | |
| Dell XPS 13 7390 Core i7-10710U | |
| HP Pavilion 13-bb0015cl | |
| Asus Zenbook S UX393JA | |
| Huawei MateBook 13 2020 i5 | |
| HP Envy 13-ba0001ng | |
| HP Elite Dragonfly-8MK79EA | |
| HP Envy x360 13-ar0601ng | |
| LibreOffice / 20 Documents To PDF | |
| Lenovo Yoga Slim 7 14ARE05 82A20008GE | |
| Huawei MateBook 13 2020 i5 | |
| Lenovo Yoga Slim 7-14ARE | |
| HP Envy 13-ba0001ng | |
| Media Intel Core i7-1165G7 (21.5 - 88.1, n=78) | |
| Asus Zenbook S UX393JA | |
| HP Pavilion 13-bb0015cl | |
| R Benchmark 2.5 / Overall mean | |
| Huawei MateBook 13 2020 i5 | |
| Asus Zenbook S UX393JA | |
| HP Envy 13-ba0001ng | |
| Lenovo Yoga Slim 7 14ARE05 82A20008GE | |
| Lenovo Yoga Slim 7-14ARE | |
| Media Intel Core i7-1165G7 (0.552 - 1.002, n=80) | |
| HP Pavilion 13-bb0015cl | |
* ... Meglio usare valori piccoli
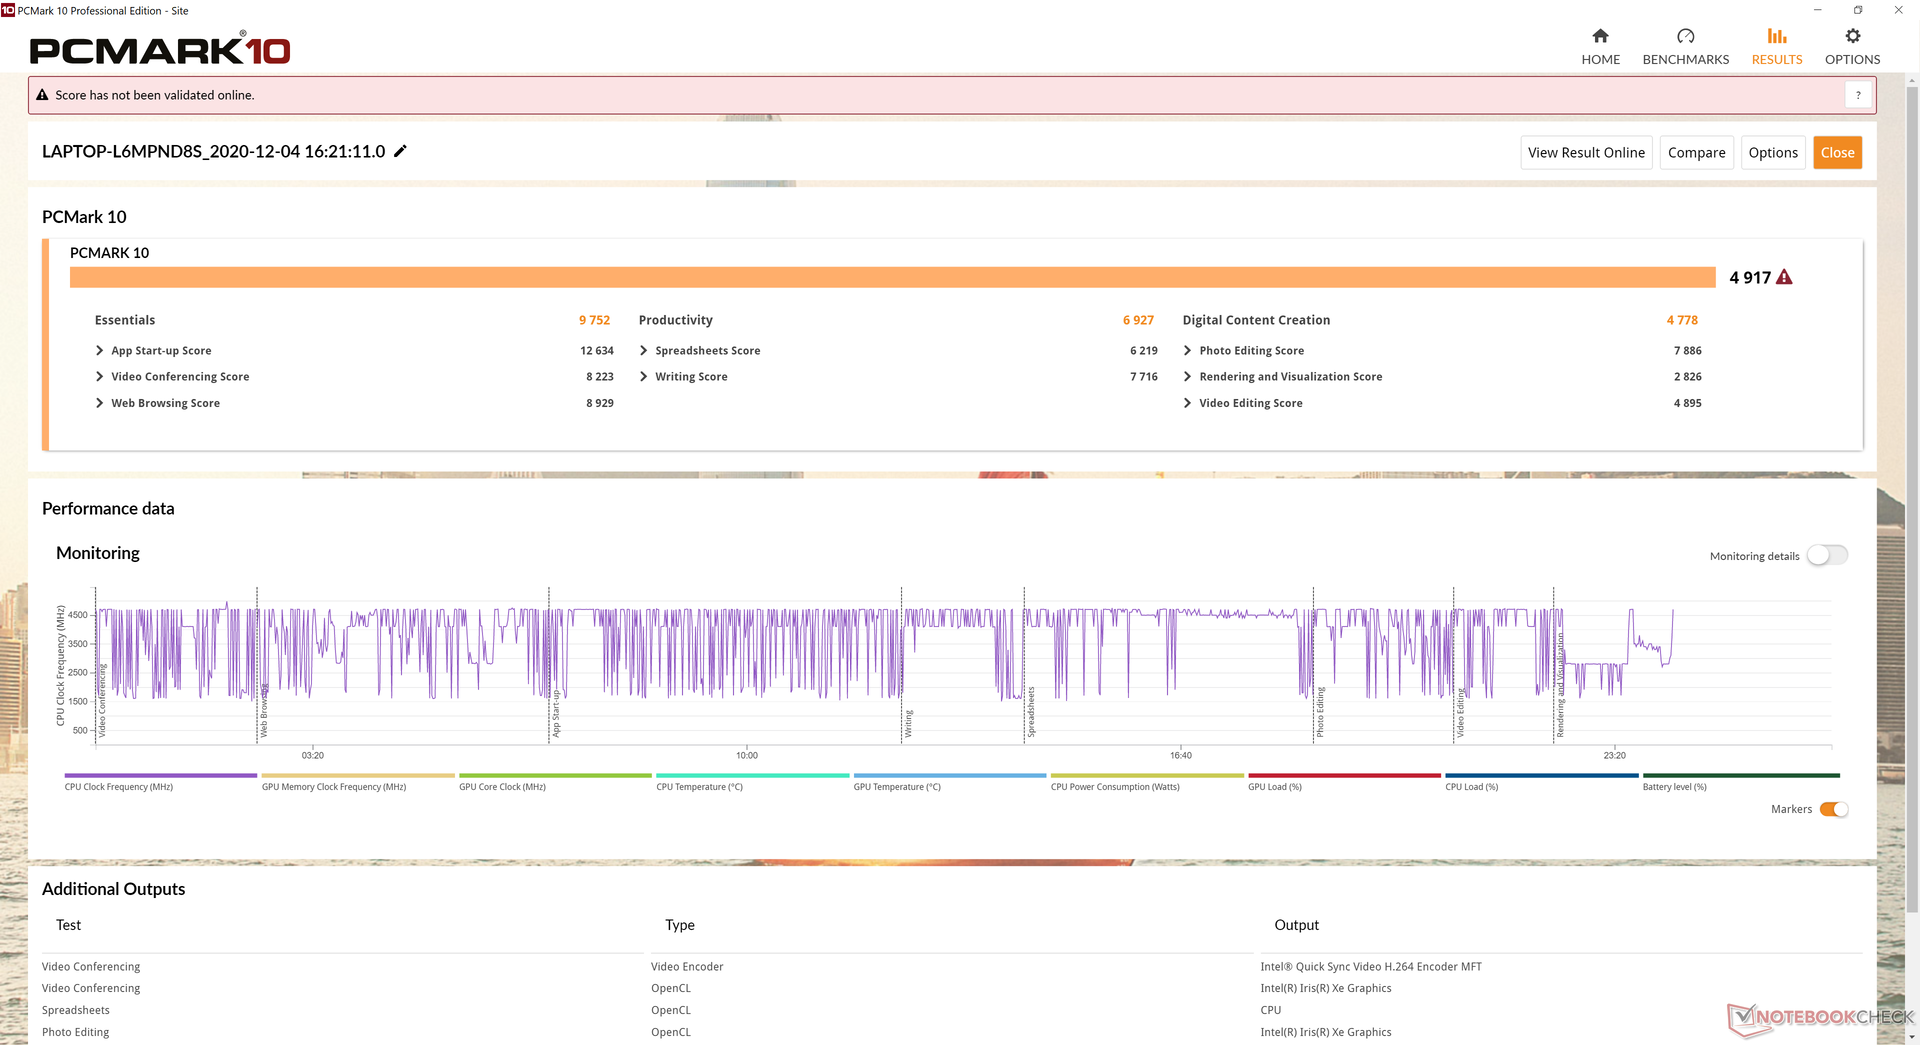
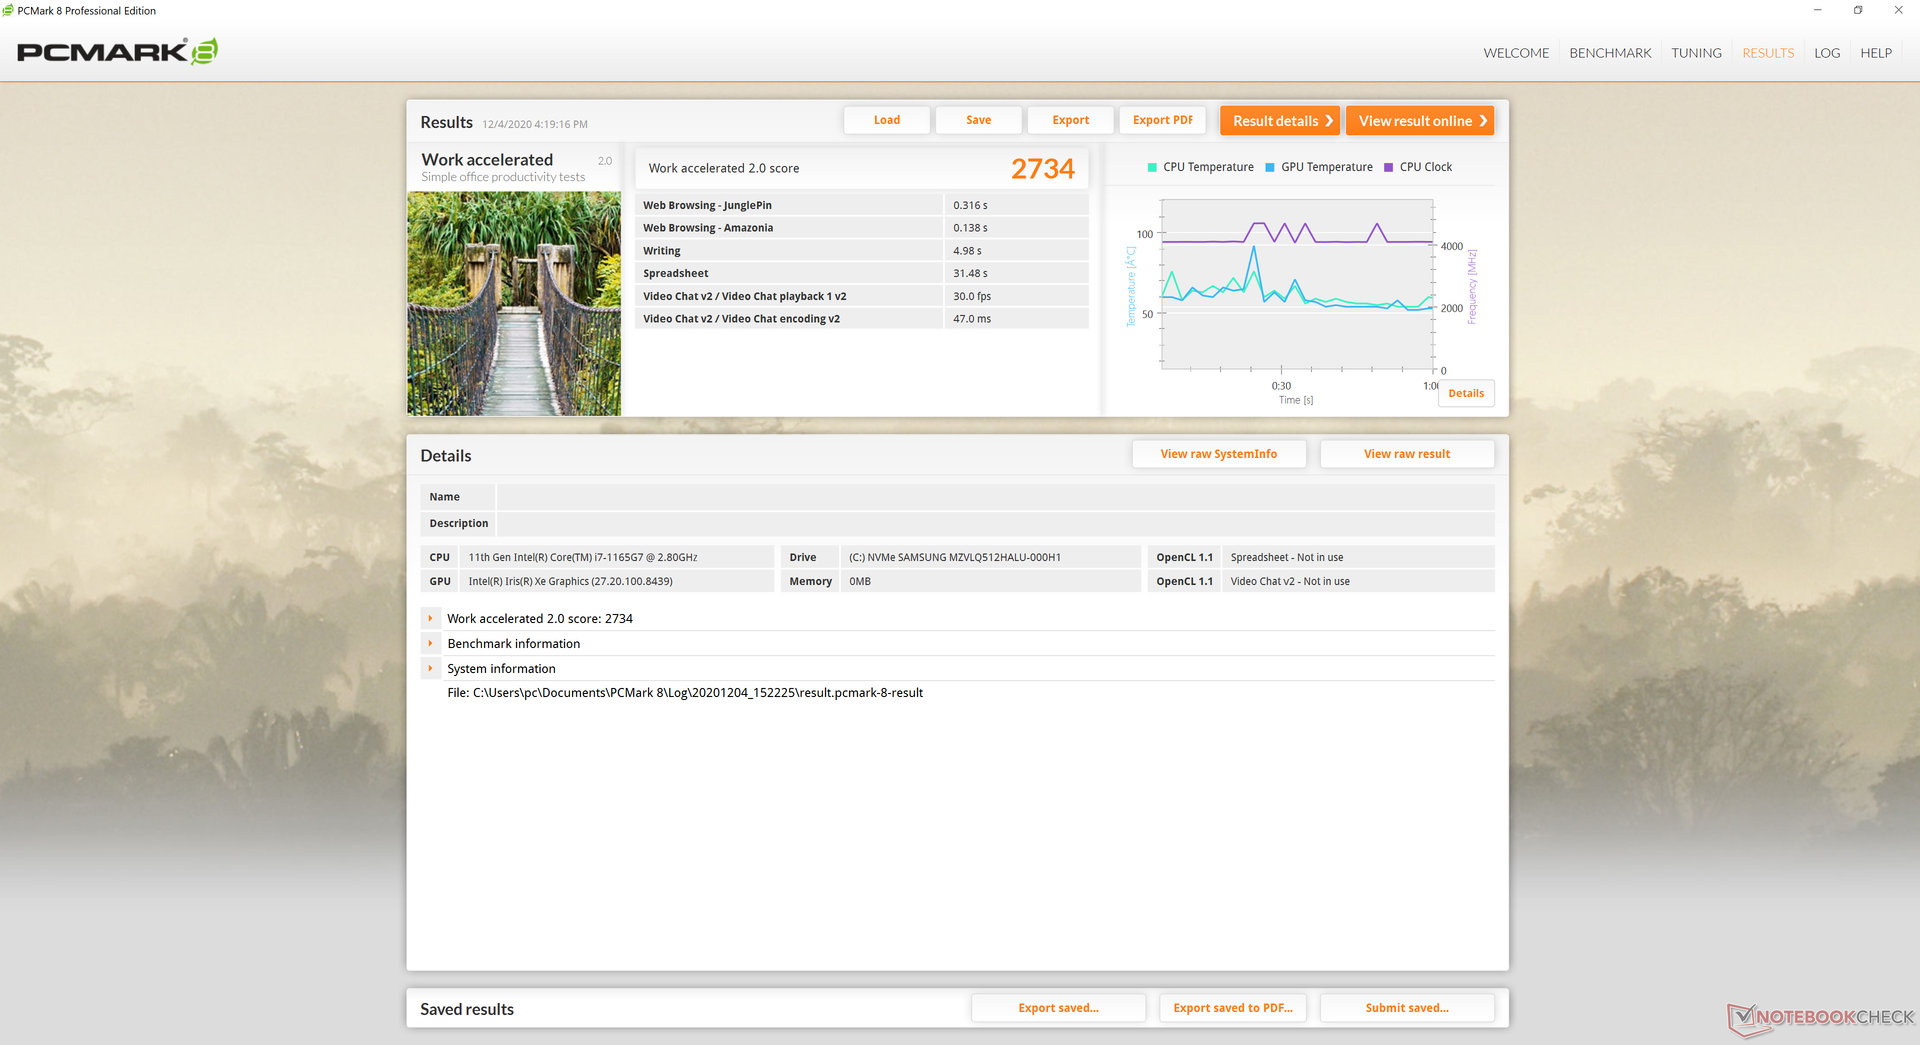
Prestazioni del sistema
I benchmarks PCMark sono in linea con gli altri laptops che abbiamo testato finora, ciascuno dotato della stessa CPU Core i7-1165G7. I risultati sono costantemente superiori a quelli dei laptop Core i7-1065G7 Ice Lake, compreso l'XPS 13 9300, soprattutto nella creazione di contenuti digitali, dove le prestazioni grafiche possono fare una grande differenza.
Non abbiamo avuto problemi di software o hardware durante il nostro periodo di prova. Tuttavia, si è riavviata automaticamente una volta, mentre eravamo nel bel mezzo dell'esecuzione dei benchmarks. Il fatto che questo possa ancora accadere su una macchina Windows 10 è a dir poco frustrante.
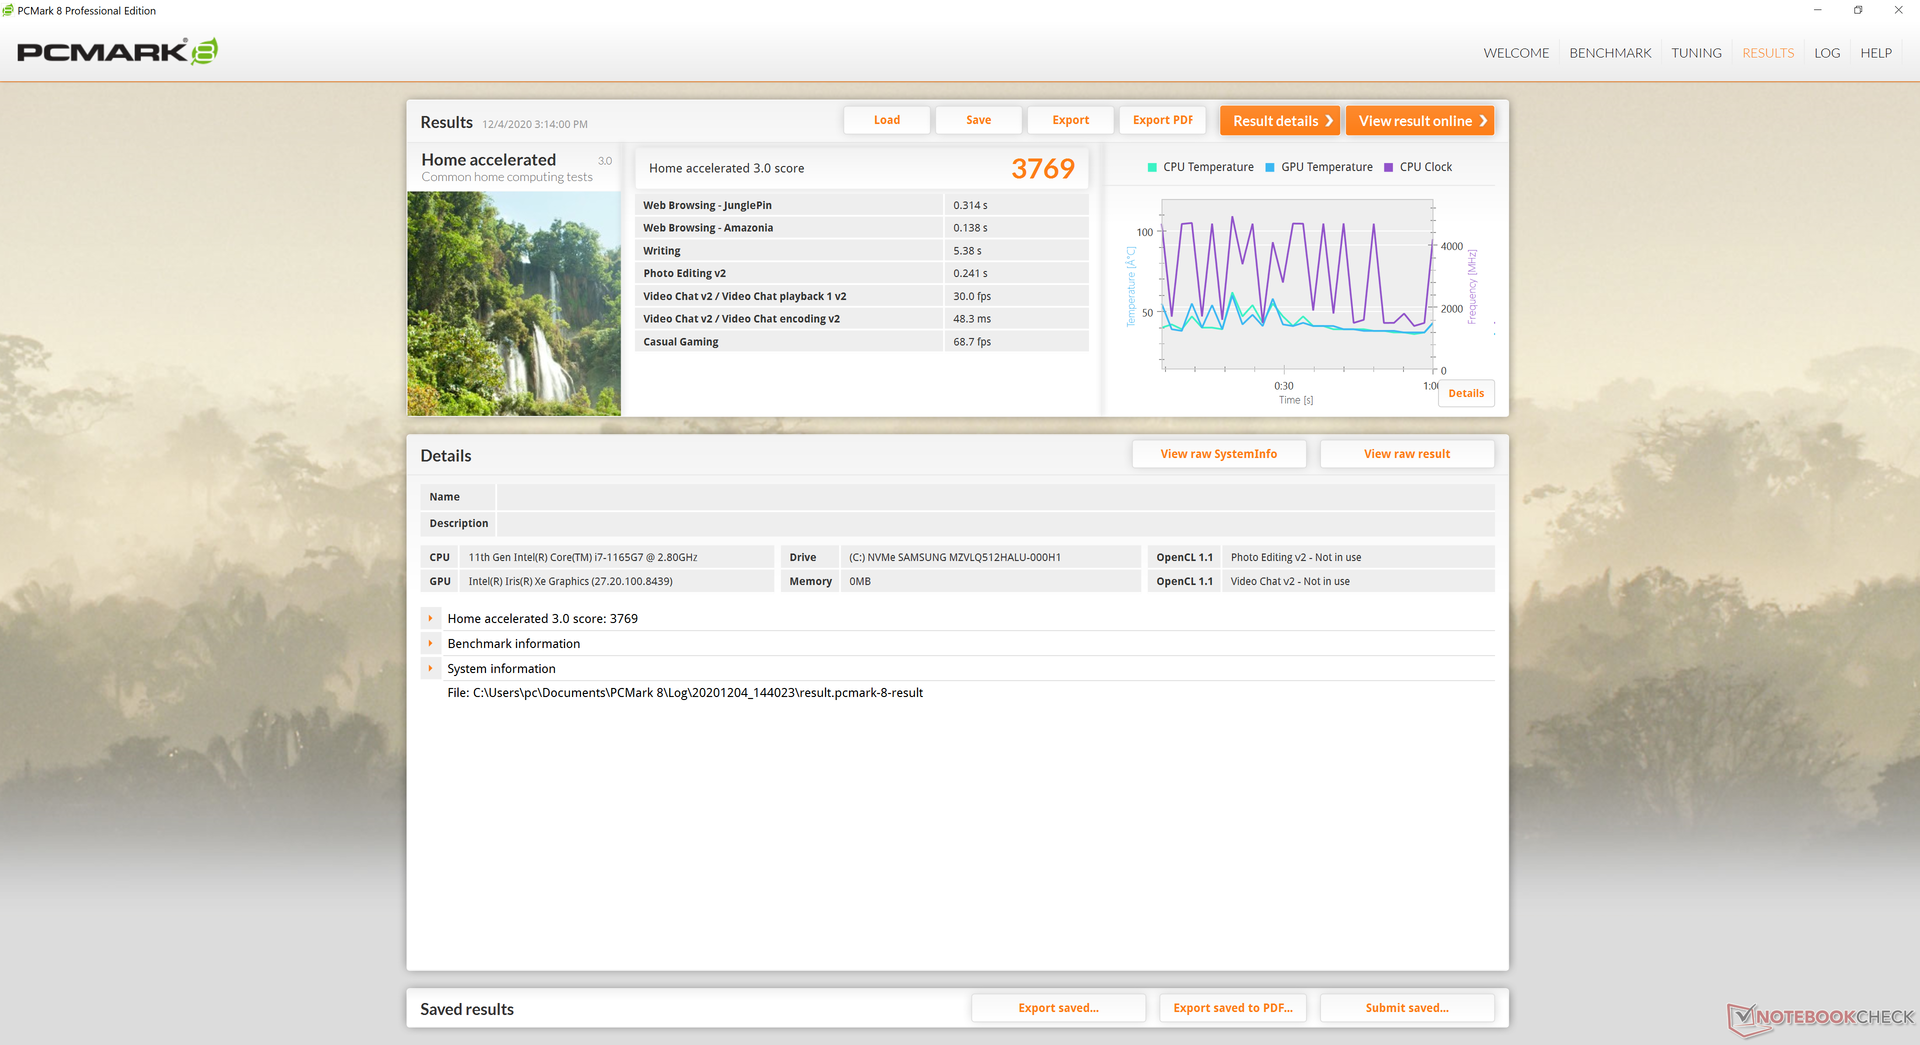
| PCMark 8 Home Score Accelerated v2 | 3769 punti | |
| PCMark 8 Work Score Accelerated v2 | 2734 punti | |
| PCMark 10 Score | 4917 punti | |
Aiuto | ||
Latenza DPC
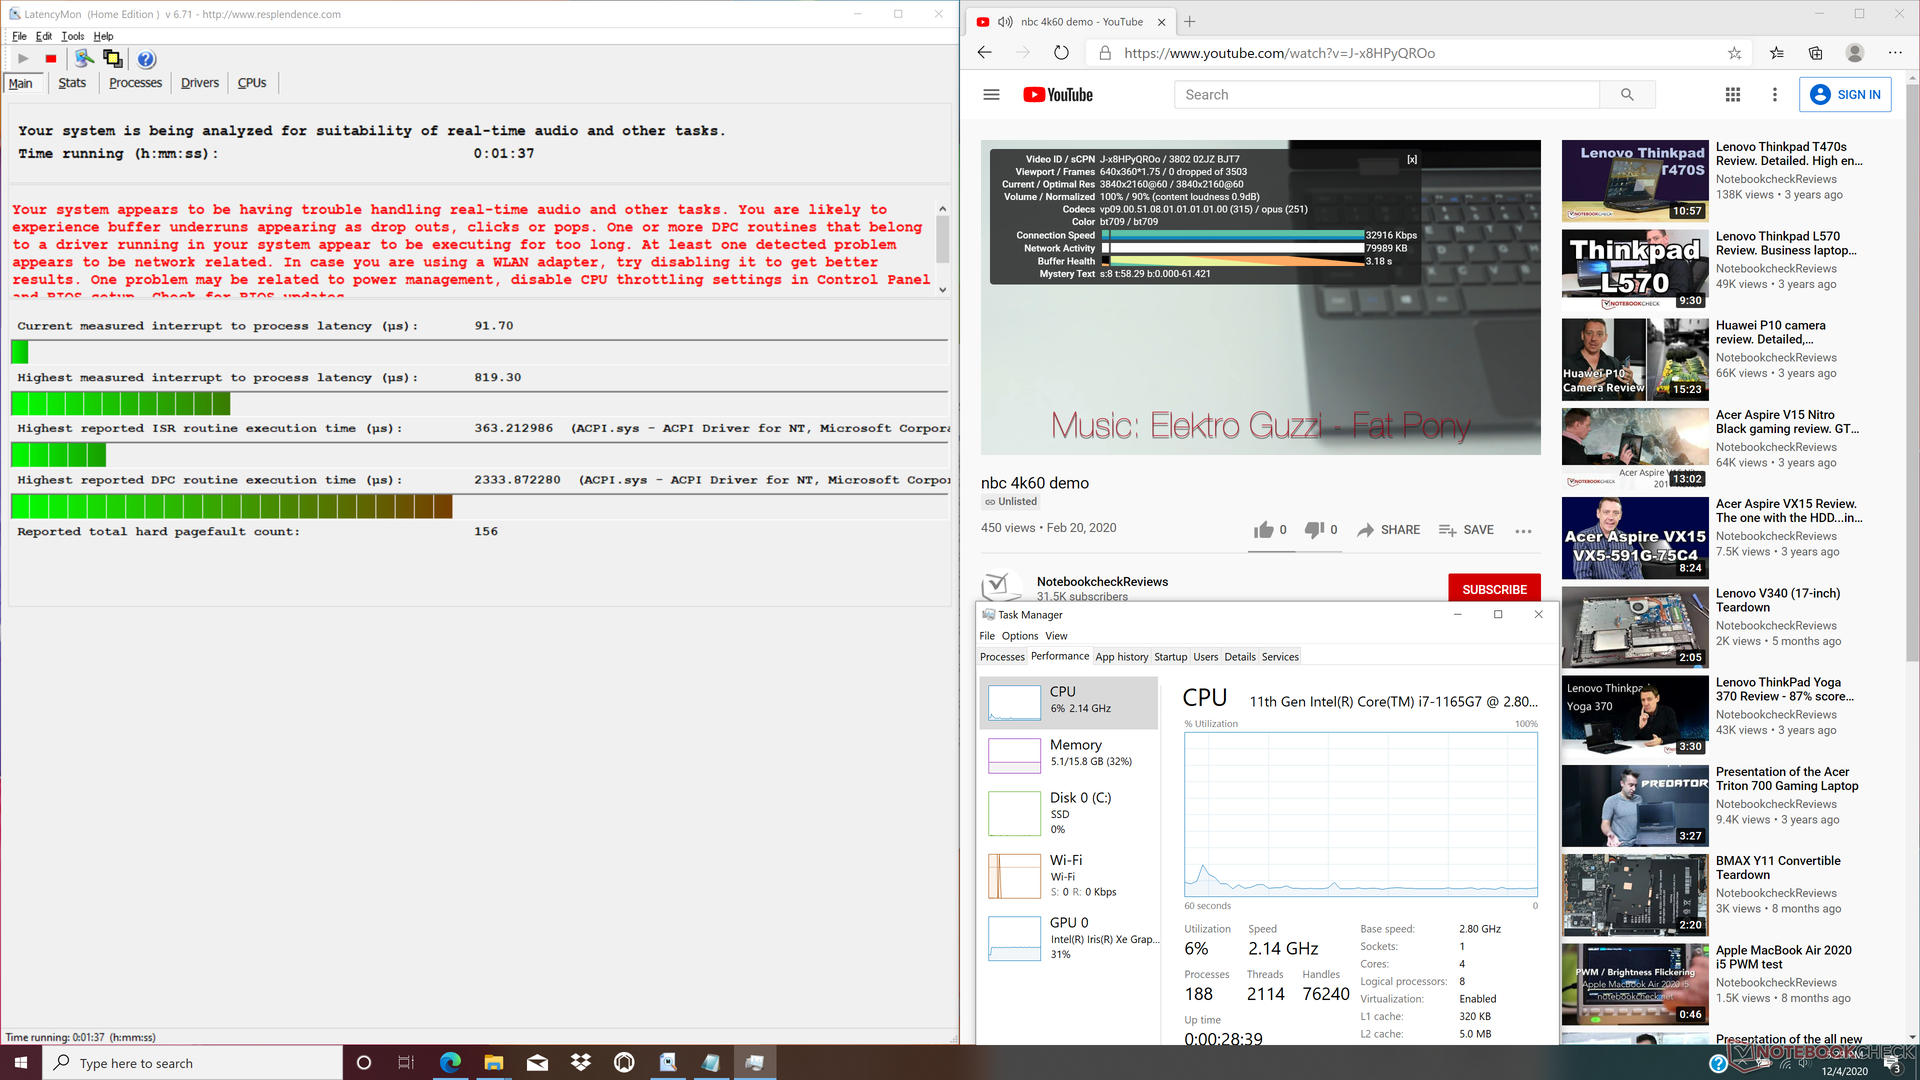
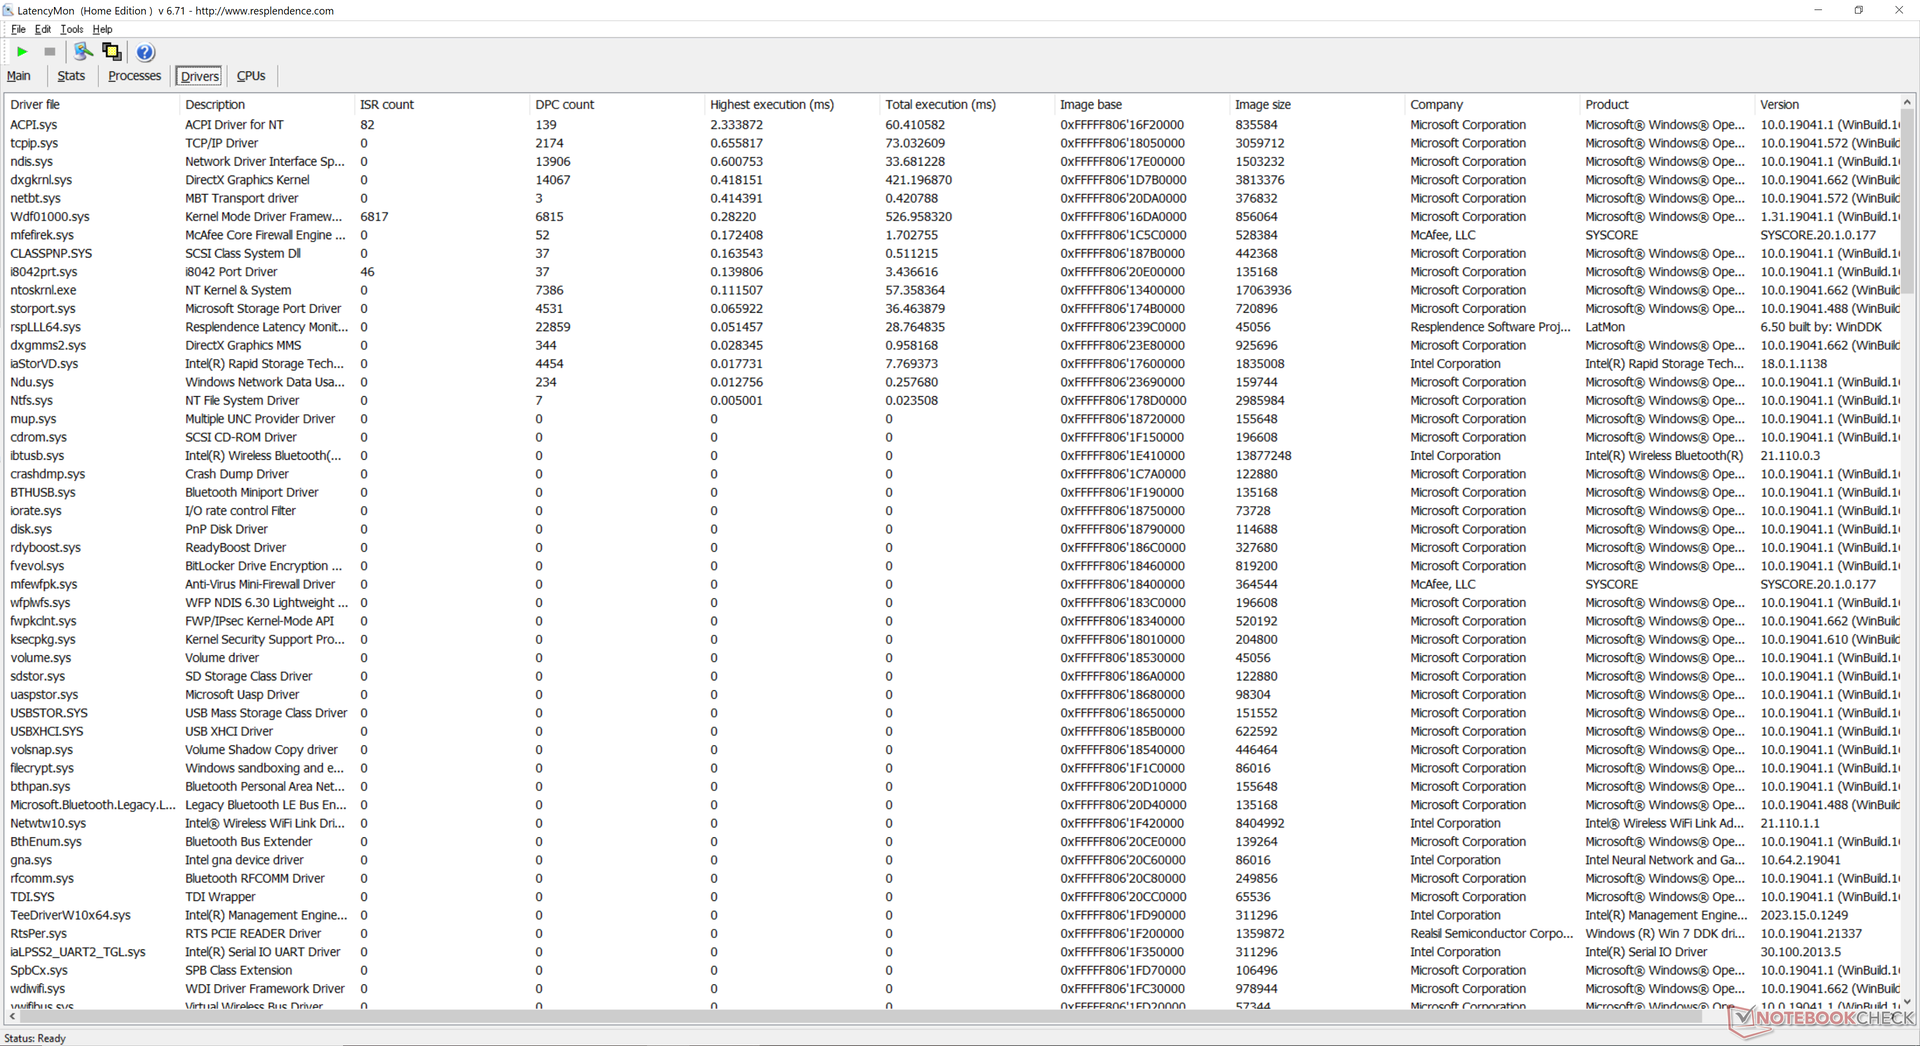
| DPC Latencies / LatencyMon - interrupt to process latency (max), Web, Youtube, Prime95 | |
| HP Envy 13-ba0001ng | |
| HP Pavilion 13-bb0015cl | |
| Dell XPS 13 9300 i5 FHD | |
| Lenovo IdeaPad S540-13ARE-82DL000YGE | |
* ... Meglio usare valori piccoli
Dispositivi di archiviazione
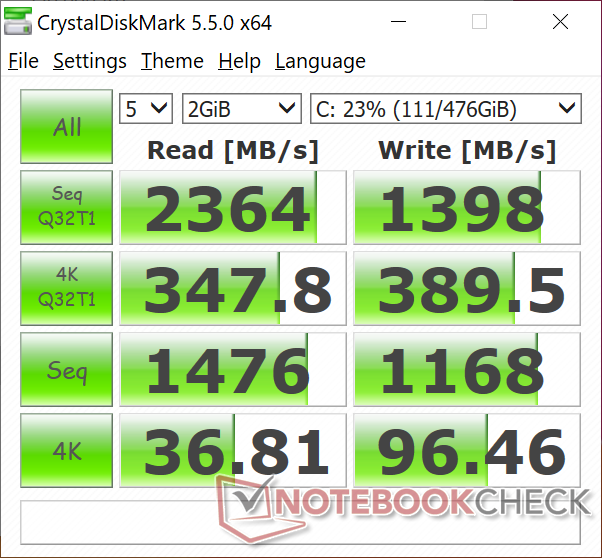
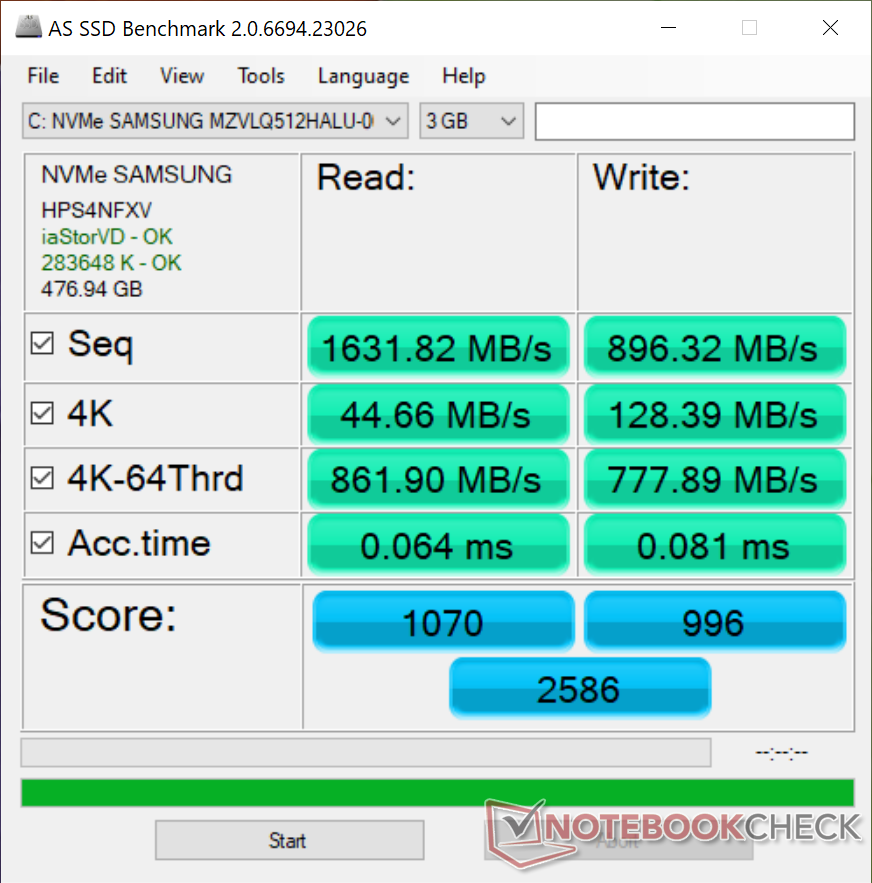
La nostra unità viene dotata dell'SSD NVMe Samsung PM991 di fascia media, invece del costoso e più veloce PM981a, come si trova sui portatili di fascia alta come l'EliteBook 1030 G7 o il Razer Blade Stealth. Le velocità di trasferimento sono paragonabili a quelle dell'Intel 660p, ma sono molto più veloci di qualsiasi soluzione SATA III come l'unità Kingston dell'Asus VivoBook S13. È interessante notare che può essere necessario un po' di tempo per raggiungere le massime velocità di trasferimento teoriche del PM991, come dimostrano i risultati del nostro test DiskSpd Read Loop.
Consultate la nostra tabella di HDD e SSD per ulteriori confronti di benchmarks.
| HP Pavilion 13-bb0015cl Samsung PM991 MZVLQ512HALU | HP Envy 13-ba0001ng Intel SSD 660p SSDPEKNW512G8 | Asus VivoBook S13 S330UA-EY034T Kingston RBU-SNS8180DS3512GJ | Lenovo IdeaPad S540-13ARE-82DL000YGE WDC PC SN730 SDBPNTY-256G | HP EliteBook x360 1030 G7 Samsung SSD PM981a MZVLB512HBJQ | |
|---|---|---|---|---|---|
| AS SSD | -11% | -64% | 0% | 13% | |
| Seq Read (MB/s) | 1632 | 1587 -3% | 485.5 -70% | 2193 34% | 2036 25% |
| Seq Write (MB/s) | 896 | 709 -21% | 351 -61% | 1797 101% | 1422 59% |
| 4K Read (MB/s) | 44.66 | 52 16% | 30.94 -31% | 45.79 3% | 53.8 20% |
| 4K Write (MB/s) | 128.4 | 144 12% | 61.6 -52% | 140.3 9% | 122 -5% |
| 4K-64 Read (MB/s) | 862 | 322.8 -63% | 323.8 -62% | 721 -16% | 680 -21% |
| 4K-64 Write (MB/s) | 778 | 835 7% | 439.9 -43% | 651 -16% | 1445 86% |
| Access Time Read * (ms) | 0.064 | 0.103 -61% | 0.108 -69% | 0.086 -34% | 0.041 36% |
| Access Time Write * (ms) | 0.081 | 0.045 44% | 0.174 -115% | 0.027 67% | 0.091 -12% |
| Score Read (Points) | 1070 | 533 -50% | 403 -62% | 986 -8% | 937 -12% |
| Score Write (Points) | 996 | 1050 5% | 537 -46% | 971 -3% | 1709 72% |
| Score Total (Points) | 2586 | 1832 -29% | 1150 -56% | 2453 -5% | 3111 20% |
| Copy ISO MB/s (MB/s) | 1283 | 1483 16% | 546 -57% | 1201 -6% | 2109 64% |
| Copy Program MB/s (MB/s) | 806 | 730 -9% | 106.2 -87% | 303 -62% | 103.5 -87% |
| Copy Game MB/s (MB/s) | 1182 | 943 -20% | 151 -87% | 436.4 -63% | 387.8 -67% |
| CrystalDiskMark 5.2 / 6 | 3% | -52% | 38% | 42% | |
| Write 4K (MB/s) | 96.5 | 146.3 52% | 64.5 -33% | 157.4 63% | 122.2 27% |
| Read 4K (MB/s) | 36.81 | 55.7 51% | 24.91 -32% | 48.59 32% | 44.56 21% |
| Write Seq (MB/s) | 1168 | 949 -19% | 453.4 -61% | 2199 88% | 2105 80% |
| Read Seq (MB/s) | 1476 | 1494 1% | 424.9 -71% | 2011 36% | 2346 59% |
| Write 4K Q32T1 (MB/s) | 389.5 | 408.5 5% | 257.8 -34% | 265.3 -32% | 349.6 -10% |
| Read 4K Q32T1 (MB/s) | 347.8 | 304 -13% | 200.4 -42% | 478.8 38% | 340.6 -2% |
| Write Seq Q32T1 (MB/s) | 1398 | 984 -30% | 504 -64% | 2193 57% | 2958 112% |
| Read Seq Q32T1 (MB/s) | 2364 | 1779 -25% | 459.6 -81% | 2870 21% | 3564 51% |
| Write 4K Q8T8 (MB/s) | 284.4 | ||||
| Read 4K Q8T8 (MB/s) | 301.2 | ||||
| Media totale (Programma / Settaggio) | -4% /
-6% | -58% /
-60% | 19% /
14% | 28% /
23% |
* ... Meglio usare valori piccoli

Throttling Disco: DiskSpd Read Loop, Queue Depth 8
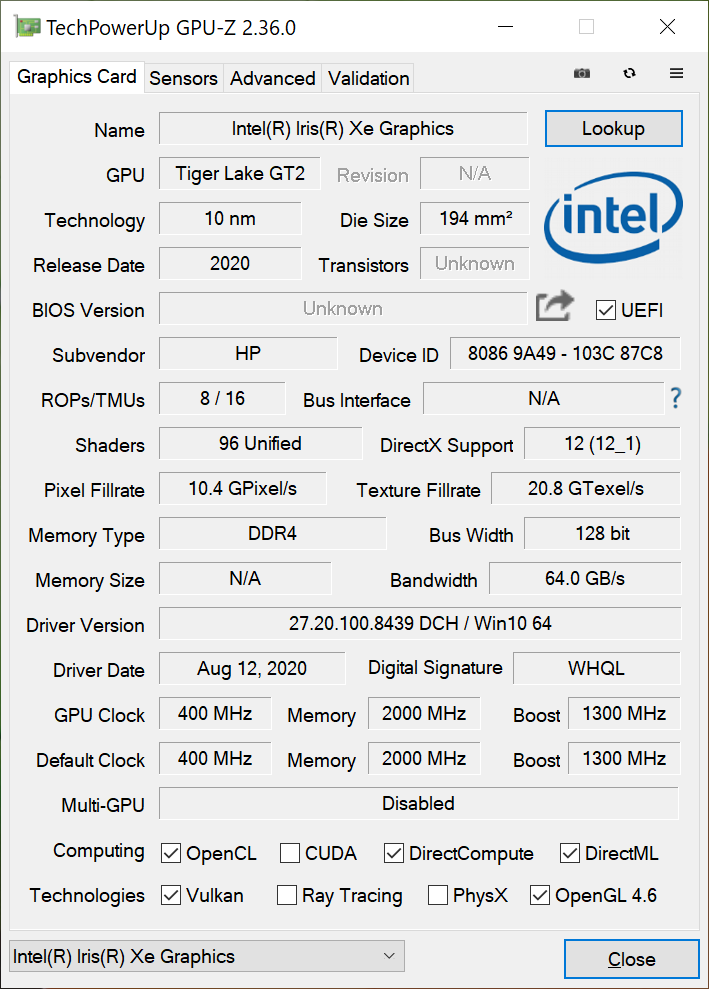
Prestazioni della GPU
I risultati di 3DMark sono ancora una volta eccellenti con punteggi marginalmente superiori a quelli della GeForce MX350 dedicata. Come abbiamo già accennato in precedenza, tuttavia, le prestazioni nei giochi reali sono sempre dietro la stessa GPU Nvidia. Comunque sia, le prestazioni di gioco sono ancora migliori che mai per una GPU integrata Intel.
Altri benchmarks e confronti per Iris Xe possono essere trovati sulla nostra pagina dedicata qui.
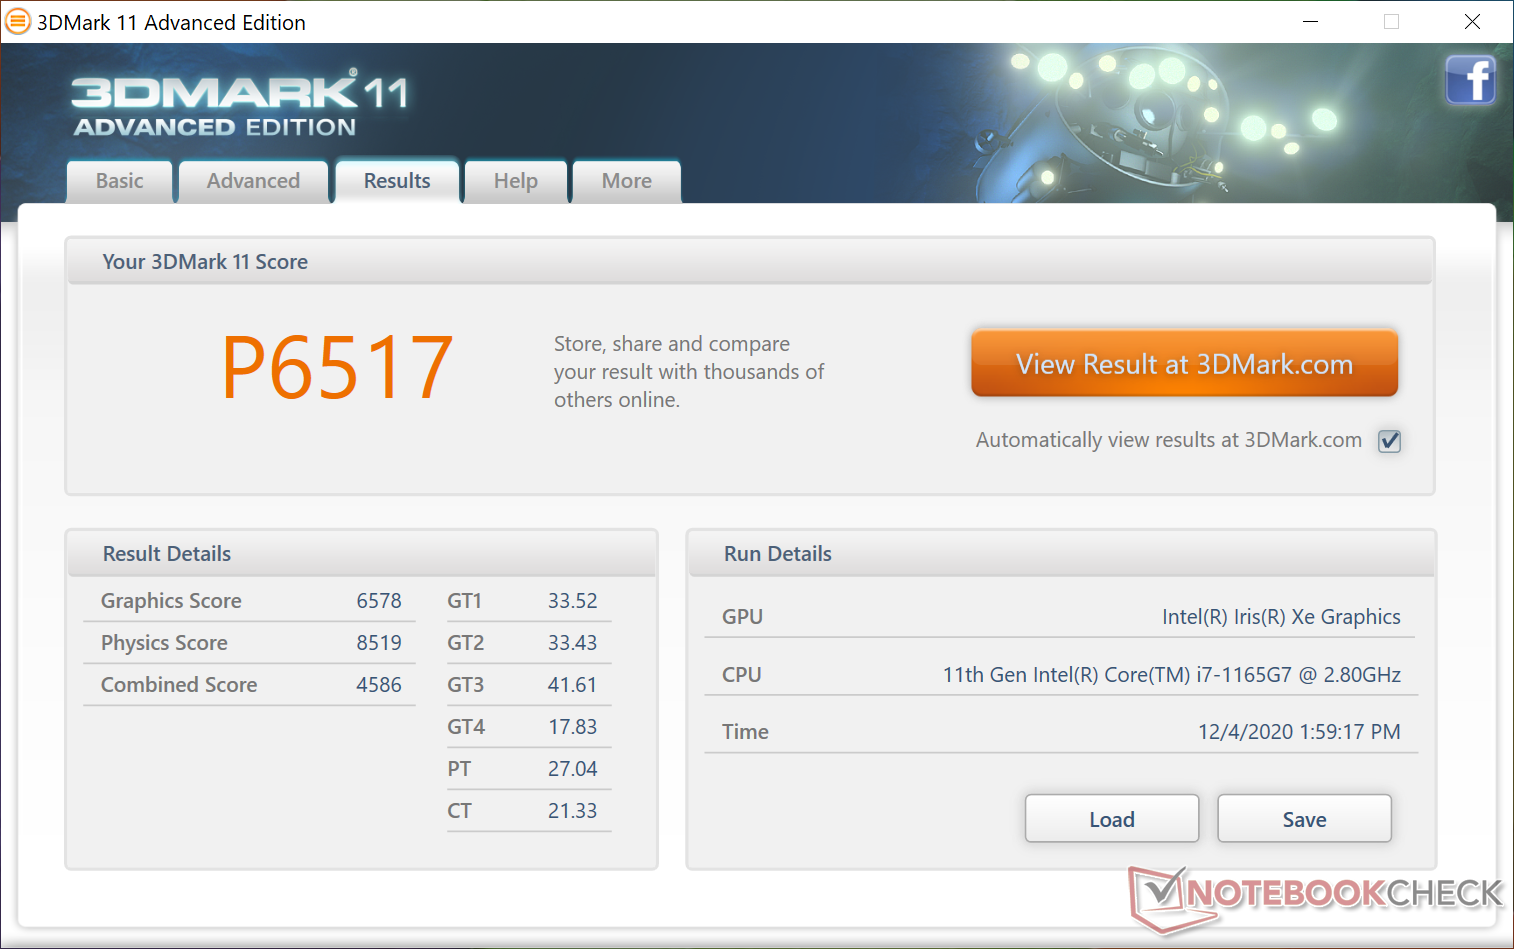
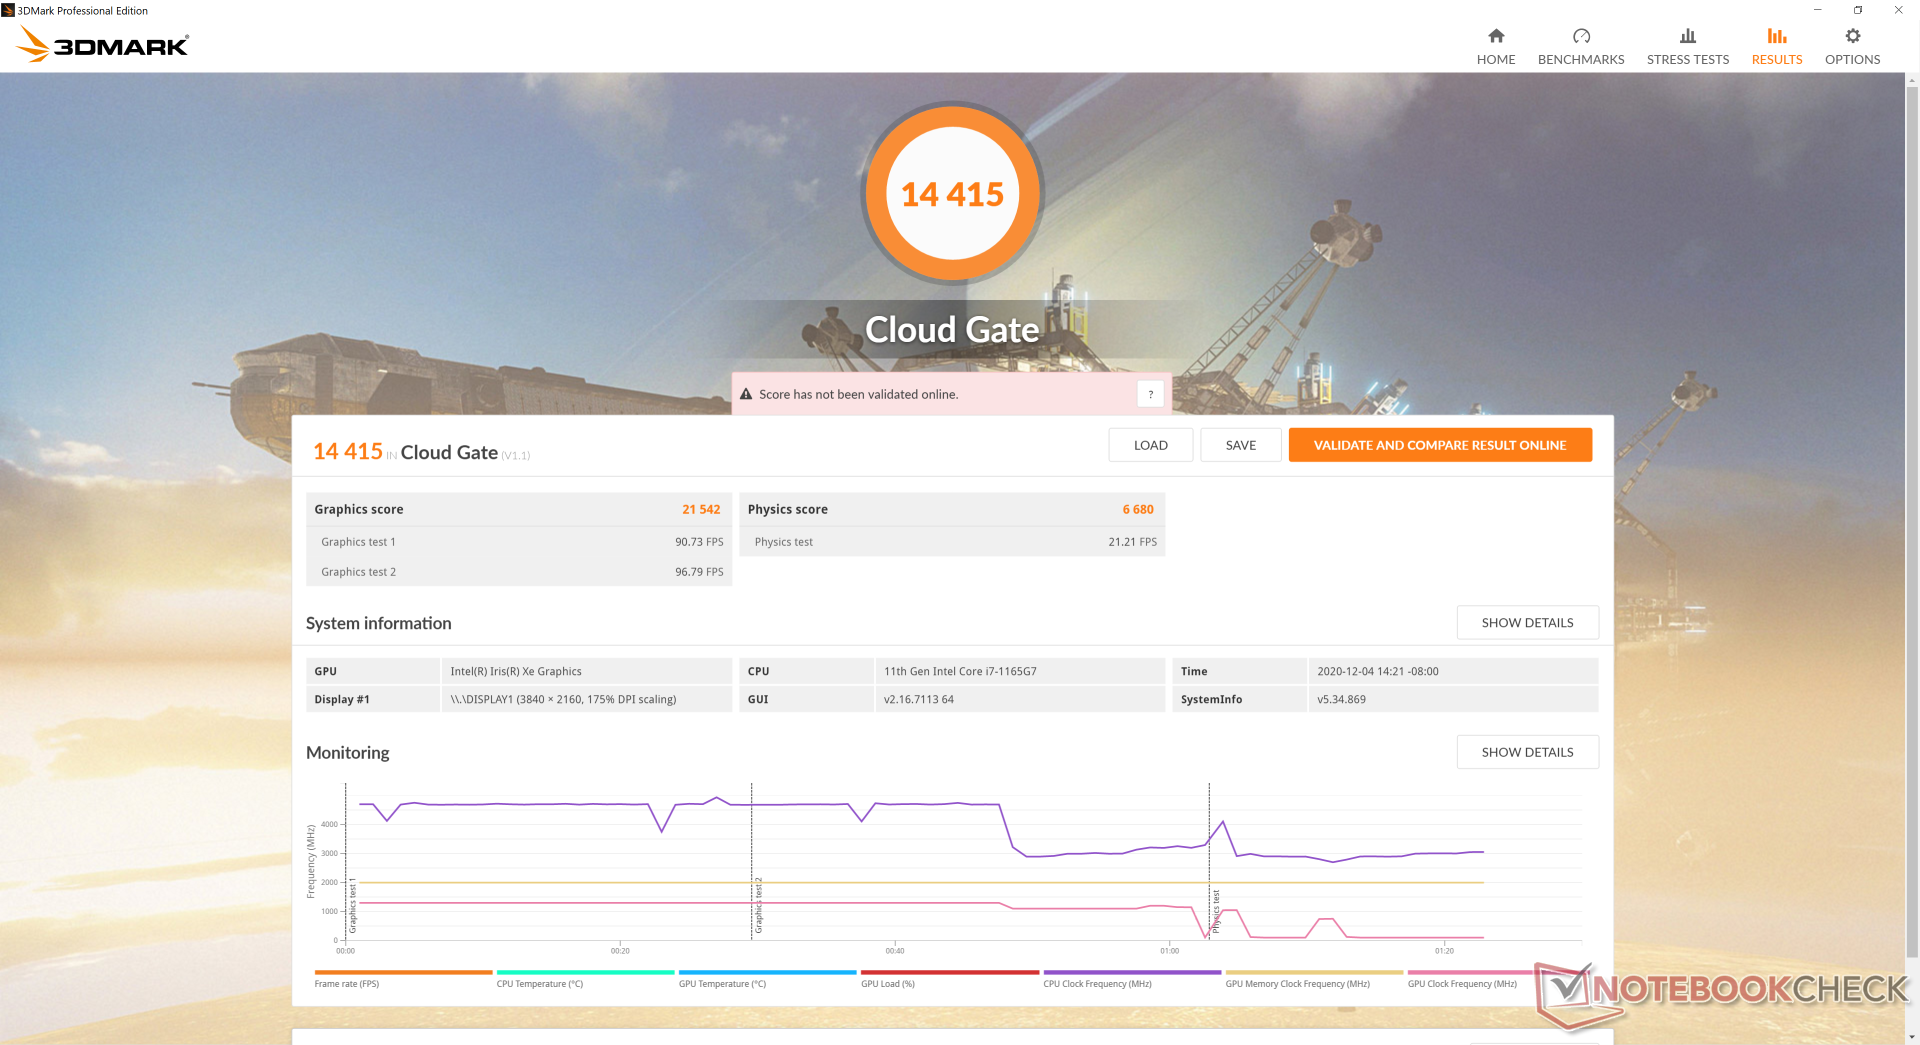
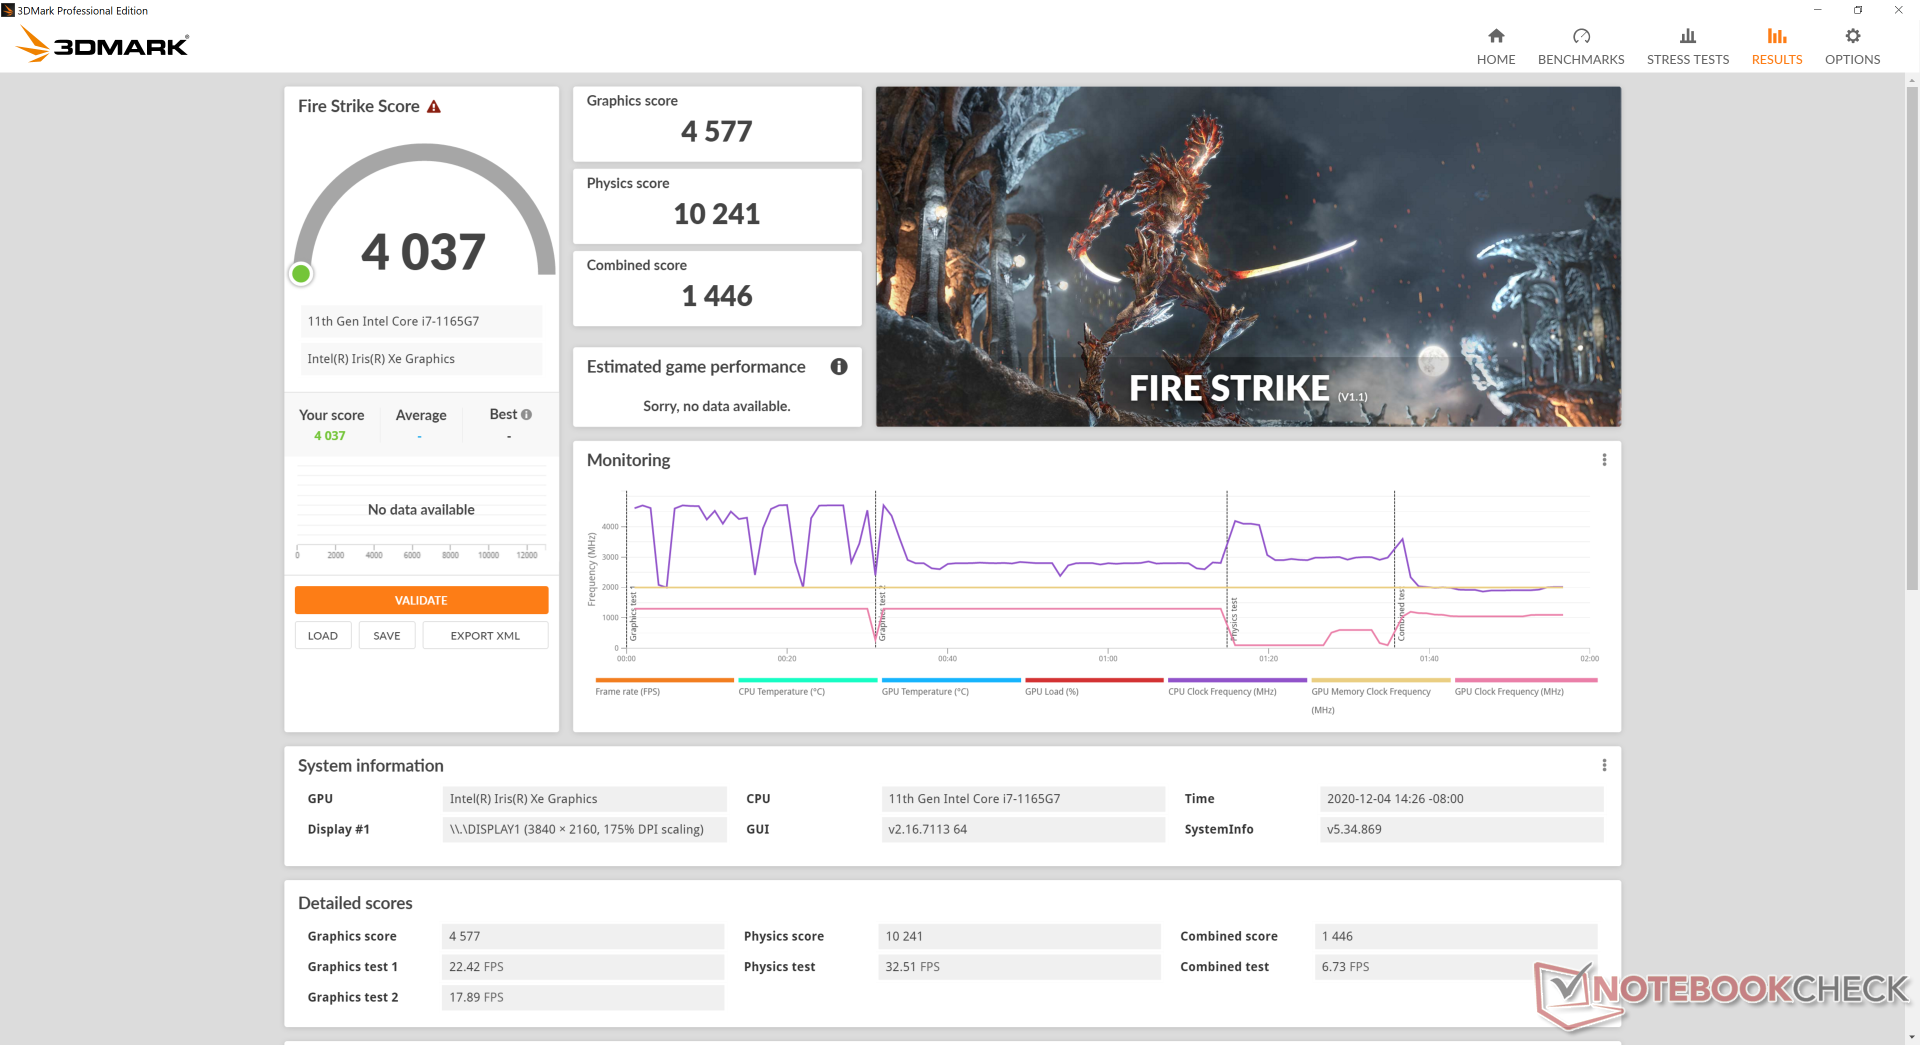
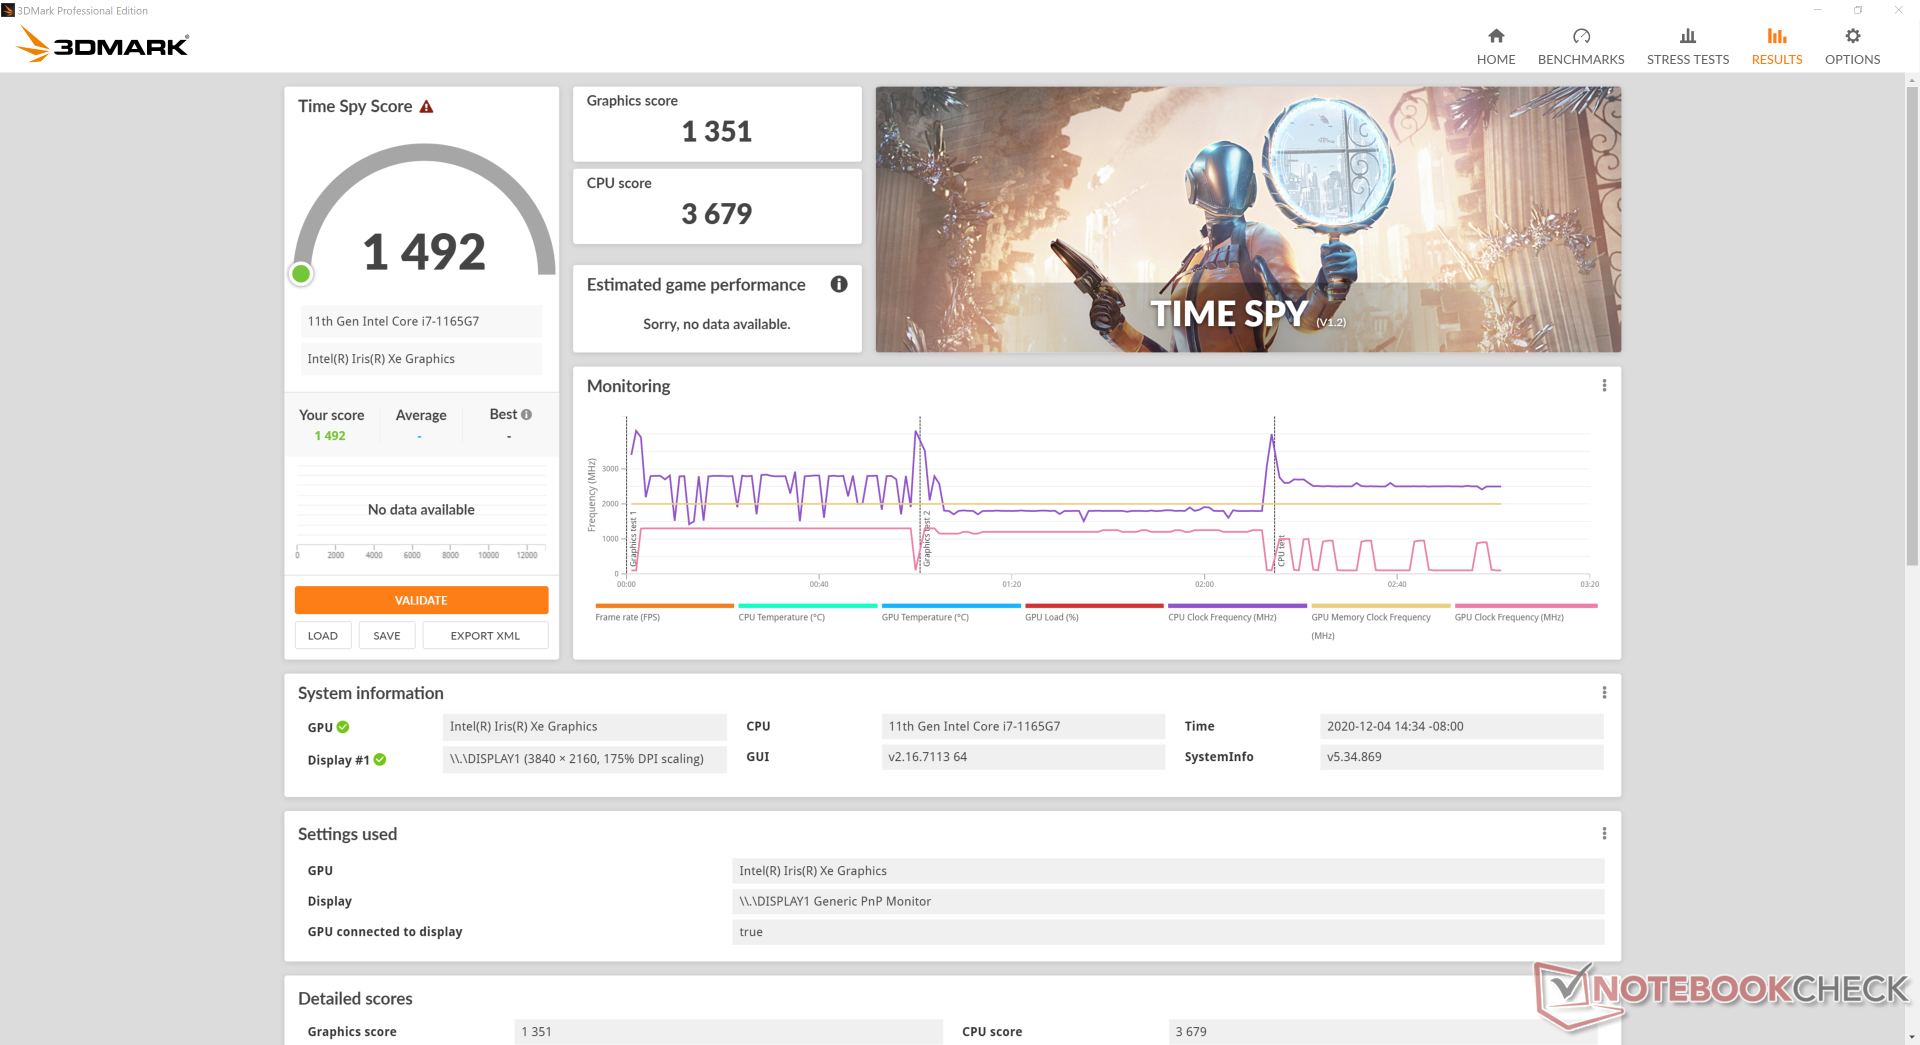
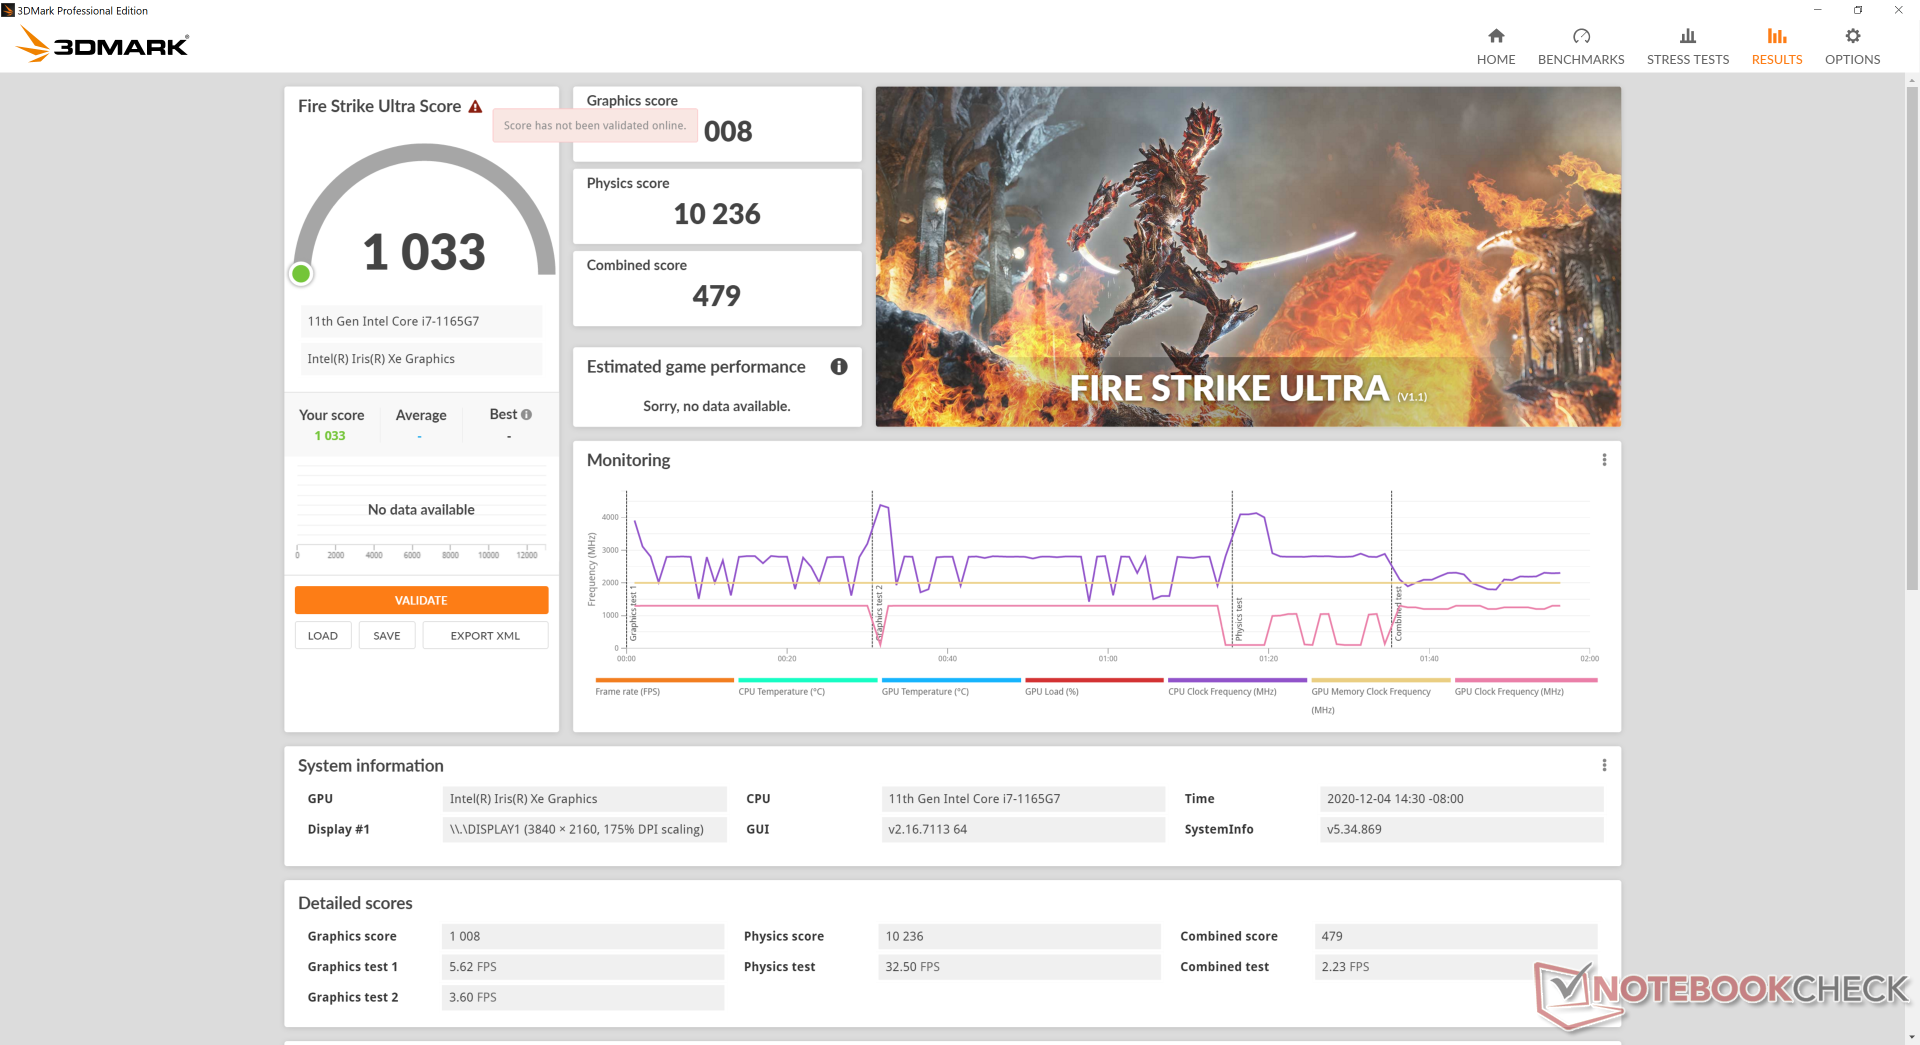
| 3DMark 11 Performance | 6517 punti | |
| 3DMark Cloud Gate Standard Score | 14415 punti | |
| 3DMark Fire Strike Score | 4037 punti | |
| 3DMark Time Spy Score | 1492 punti | |
Aiuto | ||
| basso | medio | alto | ultra | |
|---|---|---|---|---|
| GTA V (2015) | 80.1 | 67 | 19.7 | 7.94 |
| The Witcher 3 (2015) | 72.1 | 48.9 | 29.3 | 12.9 |
| Dota 2 Reborn (2015) | 81.5 | 56.6 | 41.5 | 39.3 |
| Final Fantasy XV Benchmark (2018) | 33.8 | 18.3 | 14.5 | |
| X-Plane 11.11 (2018) | 54.9 | 39.8 | 35.9 |
Emissioni
Rumorosità del sistema
Il rumore della ventola non è un problema in quanto il sistema rimane silenzioso senza alcun comportamento pulsante durante i carichi medio-bassi come la navigazione web o lo streaming video. L'esecuzione di carichi più alti, come 3DMark 06 o giochi, fa aumentare costantemente il rumore delle ventole fino a un massimo di 36 o 37 dB(A) per risultando udibile ma non fastidioso. Una volta che l'impegnativo carico si ferma, le ventole rallentano rapidamente.

| HP Pavilion 13-bb0015cl Iris Xe G7 96EUs, i7-1165G7, Samsung PM991 MZVLQ512HALU | HP Envy 13-ba0001ng GeForce MX350, i7-10510U, Intel SSD 660p SSDPEKNW512G8 | Dell XPS 13 9300 i5 FHD UHD Graphics G1 (Ice Lake 32 EU), i5-1035G1, Toshiba XG6 KXG60ZNV512G | Asus VivoBook S13 S330UA-EY034T UHD Graphics 620, i5-8550U, Kingston RBU-SNS8180DS3512GJ | Lenovo IdeaPad S540-13ARE-82DL000YGE Vega 6, R5 4600U, WDC PC SN730 SDBPNTY-256G | Acer Swift 3 SF313-52-71Y7 Iris Plus Graphics G7 (Ice Lake 64 EU), i7-1065G7, Intel SSD 660p 1TB SSDPEKNW010T8 | |
|---|---|---|---|---|---|---|
| Noise | 2% | 1% | 1% | 5% | -2% | |
| off /ambiente * (dB) | 28 | 25.4 9% | 29.3 -5% | 29 -4% | 25 11% | 30.3 -8% |
| Idle Minimum * (dB) | 28 | 25.4 9% | 29.3 -5% | 29 -4% | 25 11% | 30.3 -8% |
| Idle Average * (dB) | 28 | 25.4 9% | 29.3 -5% | 29 -4% | 25 11% | 30.3 -8% |
| Idle Maximum * (dB) | 28 | 25.4 9% | 29.3 -5% | 29 -4% | 25 11% | 30.3 -8% |
| Load Average * (dB) | 35.2 | 40.6 -15% | 30 15% | 29.9 15% | 32.8 7% | 31.7 10% |
| Witcher 3 ultra * (dB) | 36.8 | |||||
| Load Maximum * (dB) | 36.6 | 39.1 -7% | 32.4 11% | 33.3 9% | 44.5 -22% | 32.7 11% |
* ... Meglio usare valori piccoli
Rumorosità
| Idle |
| 28 / 28 / 28 dB(A) |
| Sotto carico |
| 35.2 / 36.6 dB(A) |
 | ||
30 dB silenzioso 40 dB(A) udibile 50 dB(A) rumoroso |
||
min: | ||
Temperature
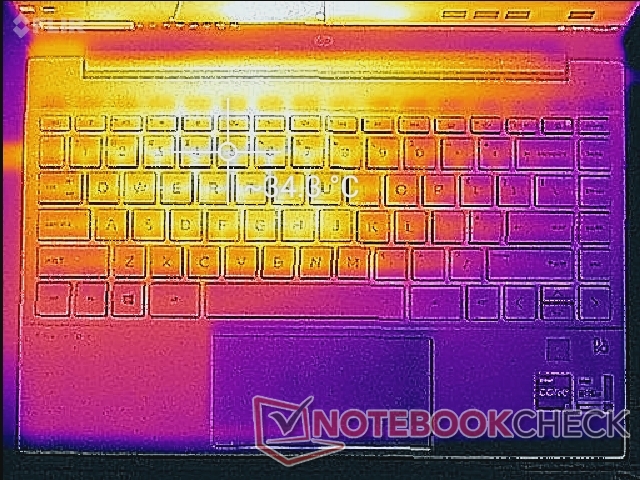
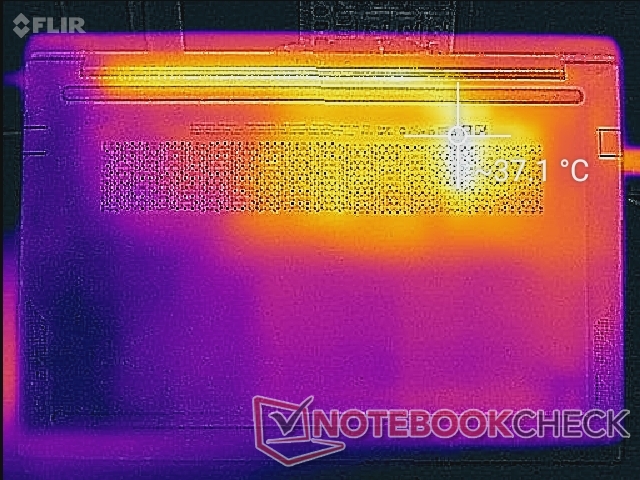
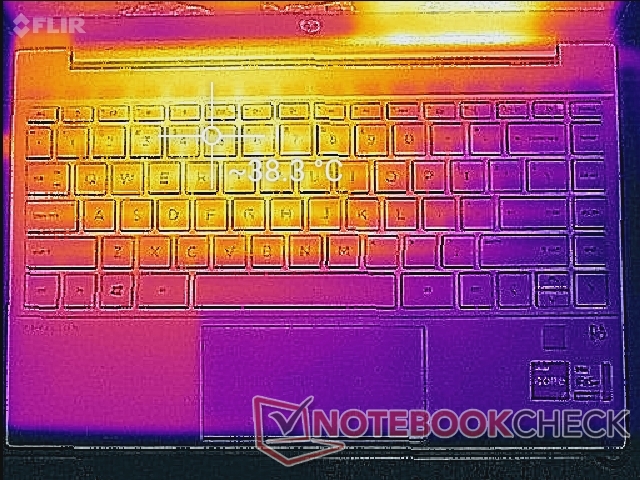
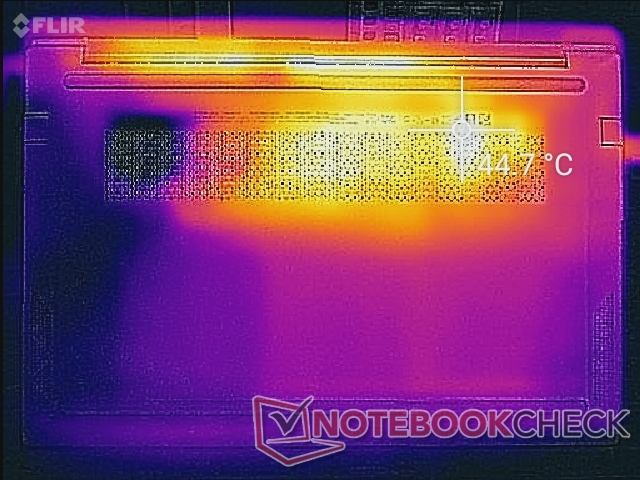
Le temperature di superficie sono più alte nella metà sinistra del telaio rispetto alla metà destra a causa del modo in cui il processore è posizionato all'interno. Questo tipo di profilo è generalmente indesiderabile perché i comuni tasti della tastiera come i tasti WASD saranno molto più caldi del resto del portatile. I punti caldi possono raggiungere i 39 C e i 45 C sulla superficie superiore e inferiore, rispettivamente, quando si eseguono carichi elevati come il gioco. Anche se le temperature sono notevoli, per fortuna non sono abbastanza estreme da distrarre o mettere a disagio.
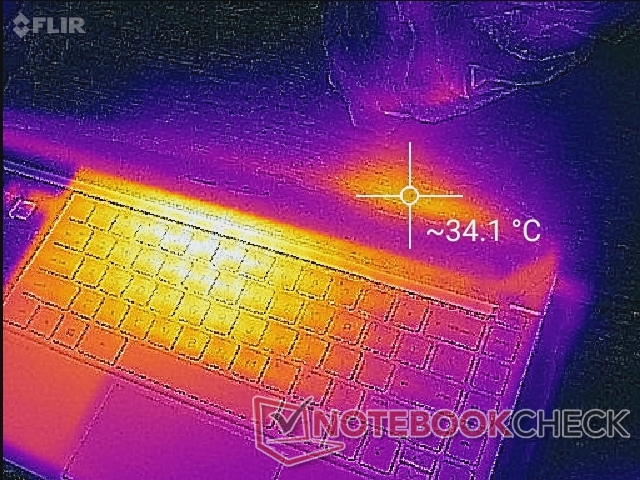
(+) La temperatura massima sul lato superiore è di 37.6 °C / 100 F, rispetto alla media di 35.9 °C / 97 F, che varia da 21.4 a 59 °C per questa classe Subnotebook.
(-) Il lato inferiore si riscalda fino ad un massimo di 45.2 °C / 113 F, rispetto alla media di 39.2 °C / 103 F
(+) In idle, la temperatura media del lato superiore è di 30.1 °C / 86 F, rispetto alla media deld ispositivo di 30.8 °C / 87 F.
(+) I poggiapolsi e il touchpad sono piu' freddi della temperatura della pelle con un massimo di 28.2 °C / 82.8 F e sono quindi freddi al tatto.
(±) La temperatura media della zona del palmo della mano di dispositivi simili e'stata di 28.2 °C / 82.8 F (0 °C / 0 F).
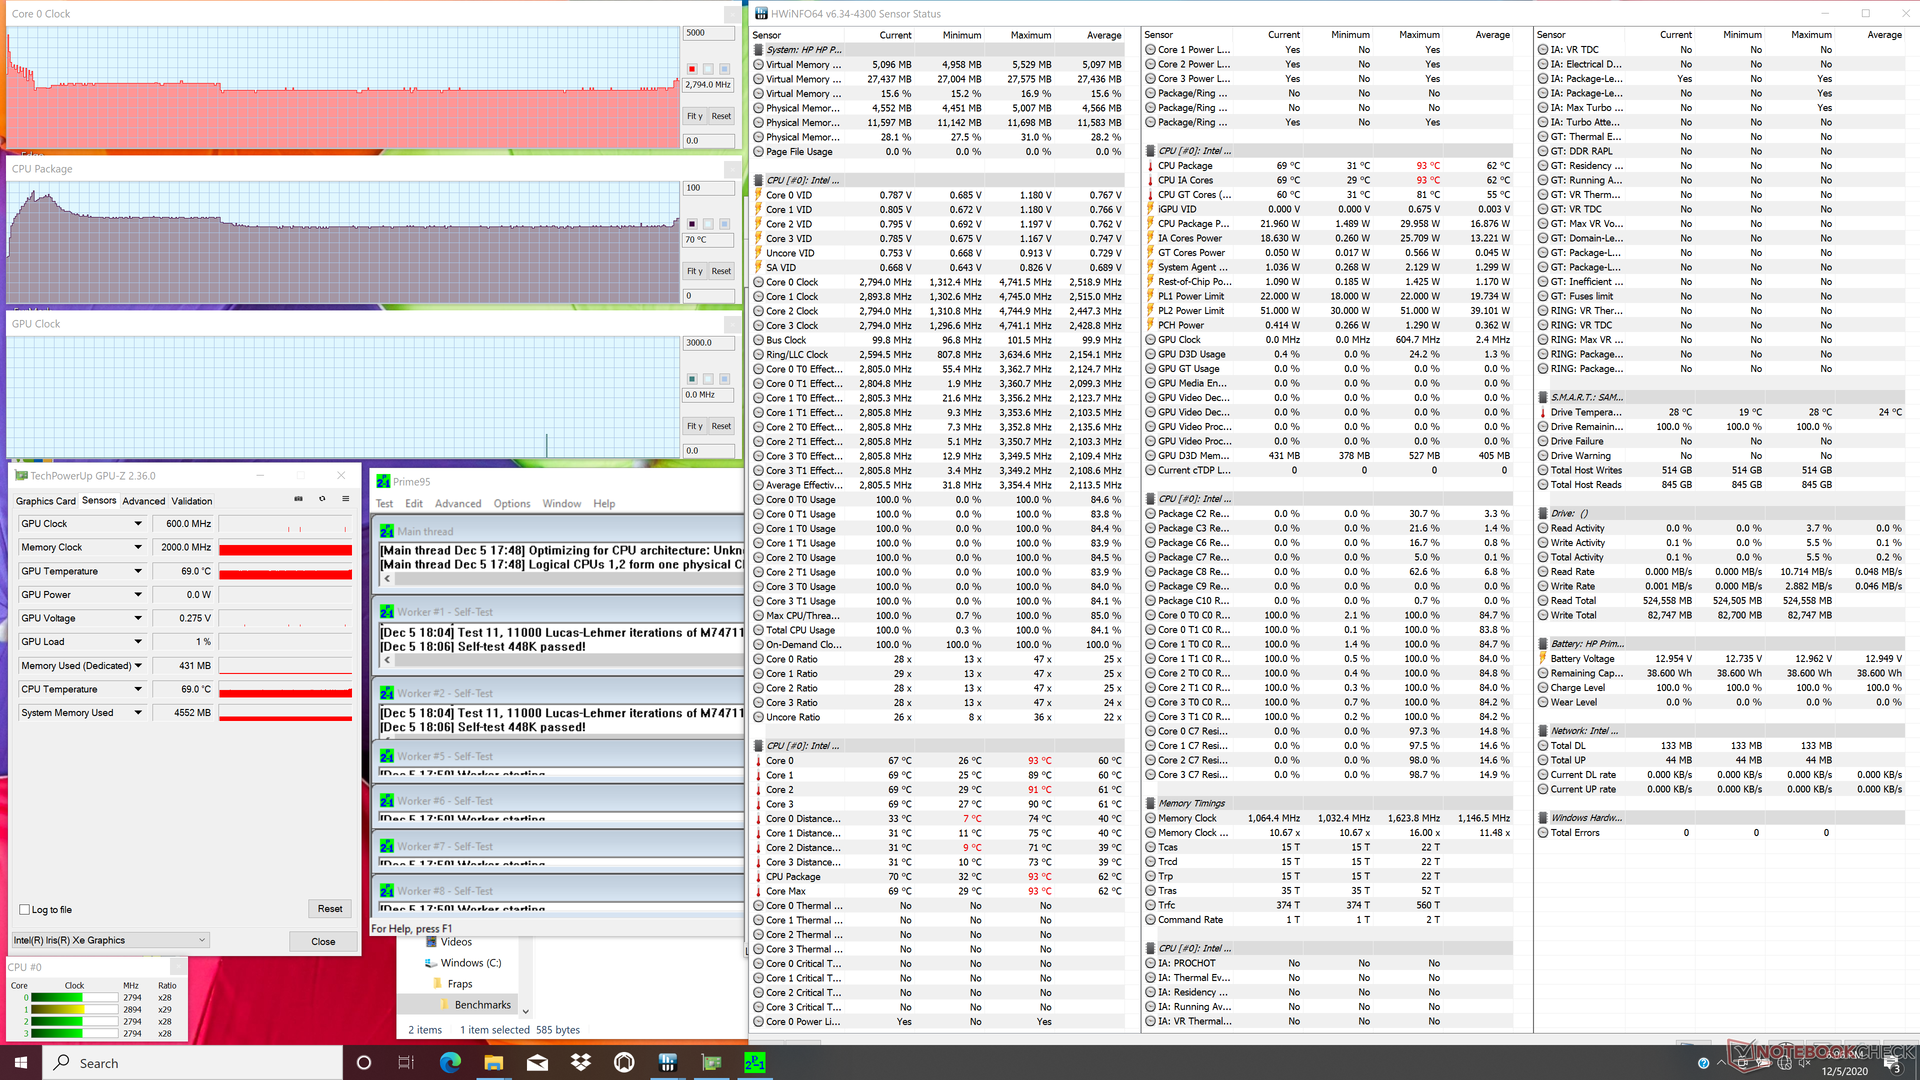
Stress Test
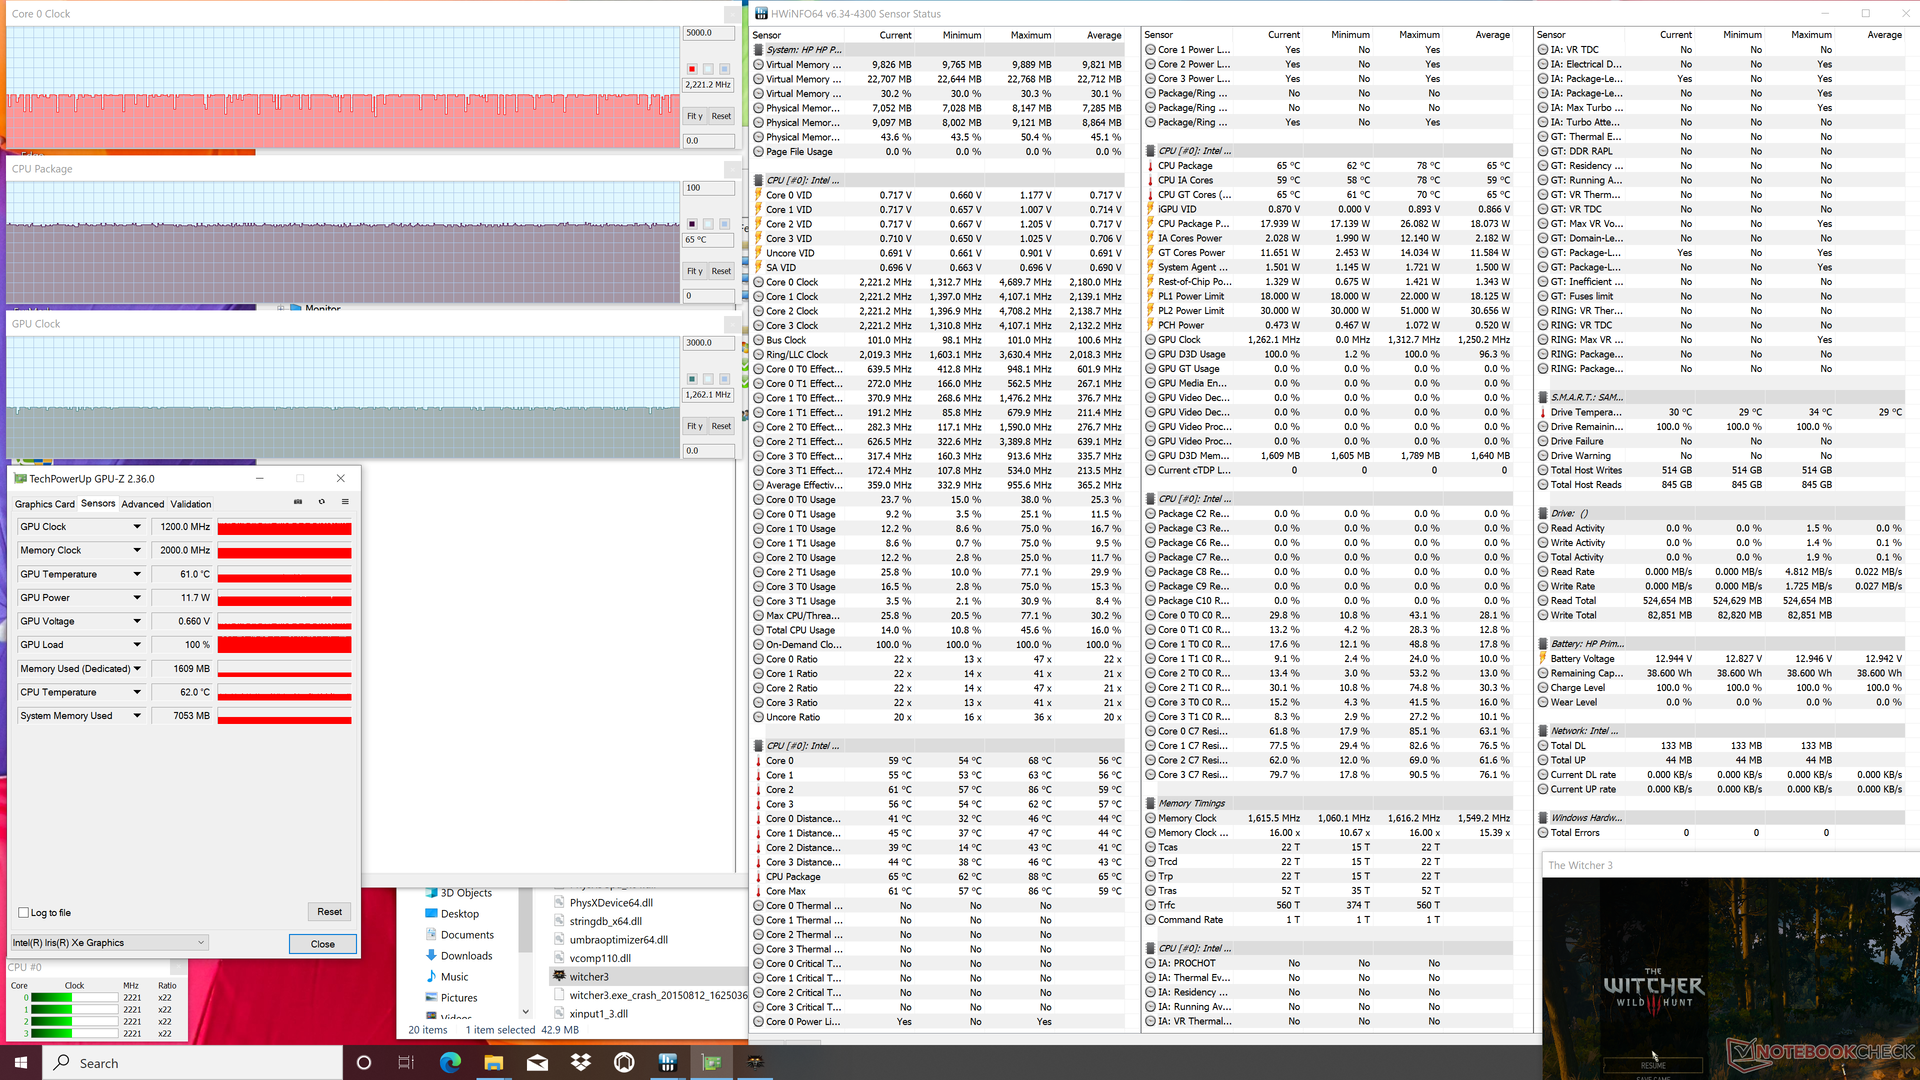
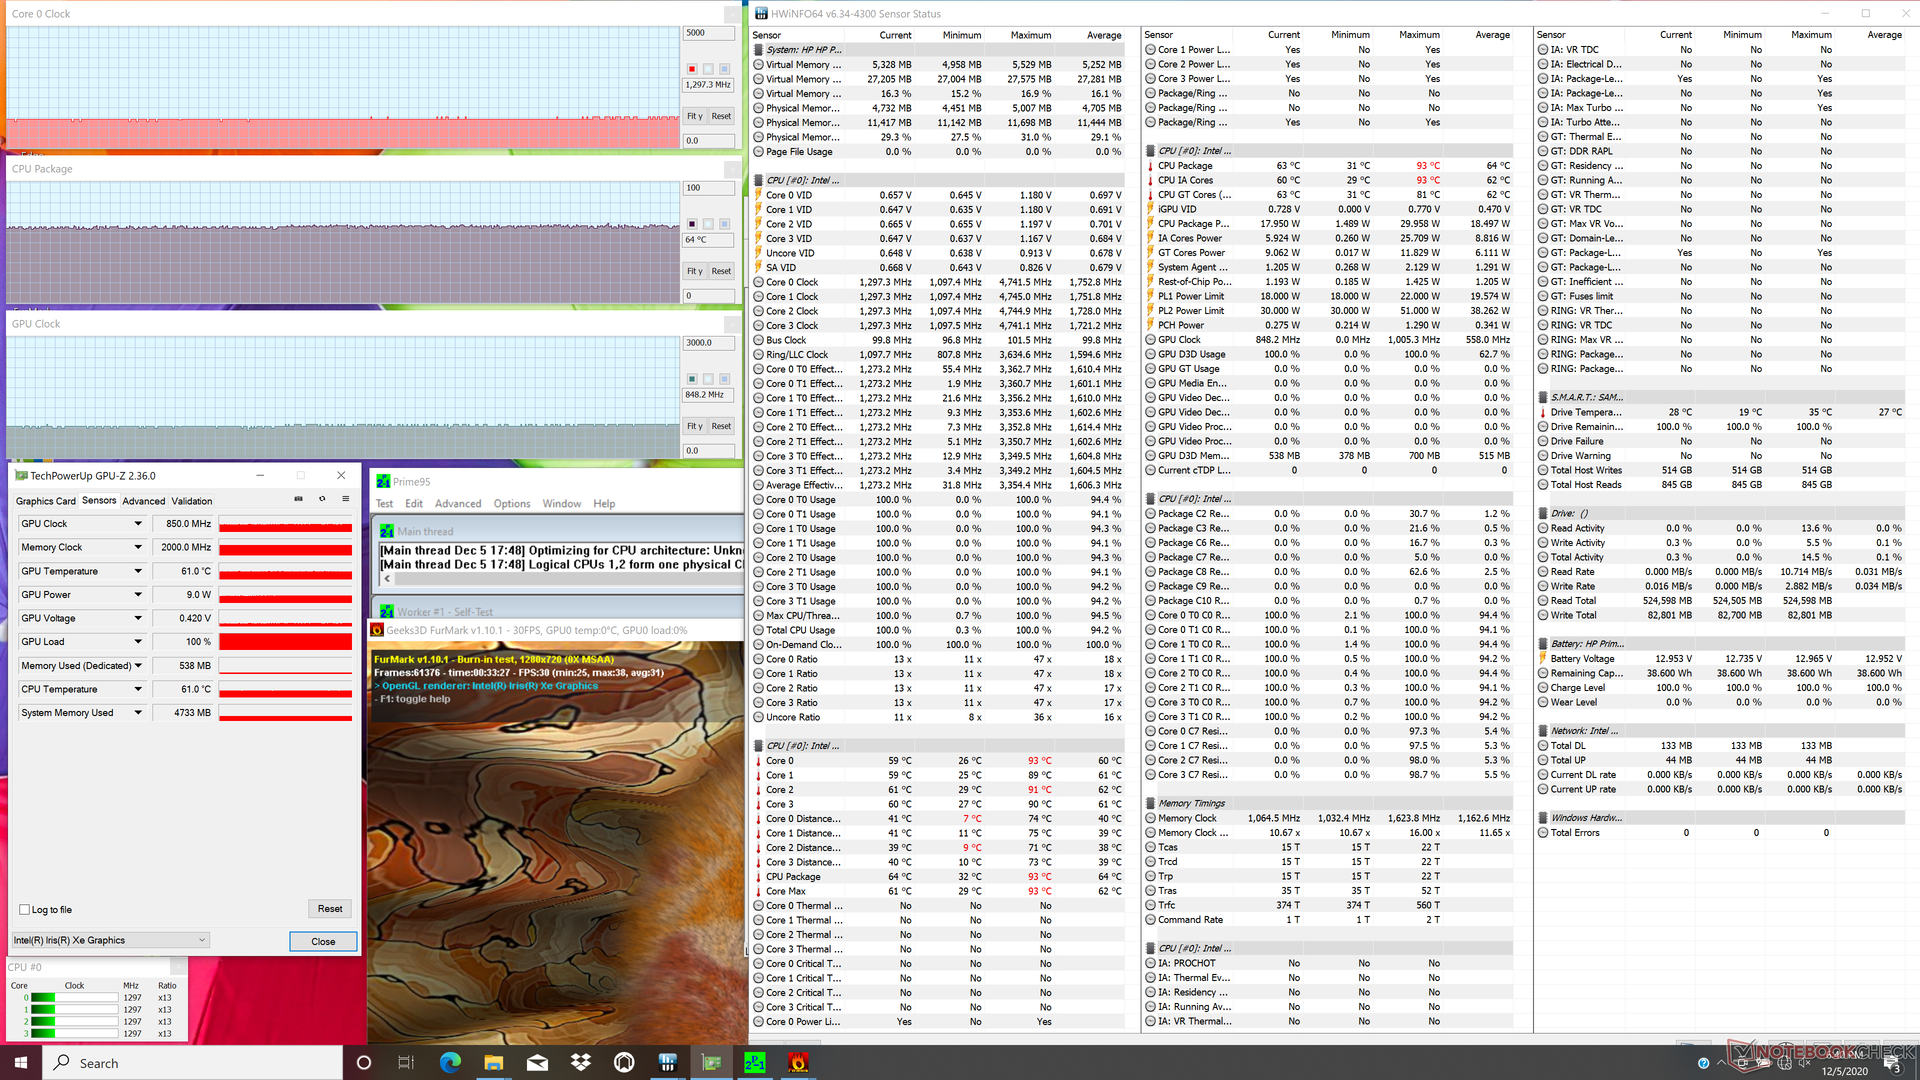
Quando si esegue Prime95 per stressare il processore, le frequenze di clock della CPU arrivano a 3,5 GHz per i primi secondi fino a raggiungere una temperatura del nucleo di 93 °C. Successivamente, le frequenze di clock scenderebbero a 2,7 GHz e infine a 2,4 GHz per mantenere una temperatura del core di 63 °C. I risultati sono abbastanza simili a quelli che abbiamo osservato sull'Asus ZenBook UX425 dotato con la stessa CPU Core i7-1165G7.
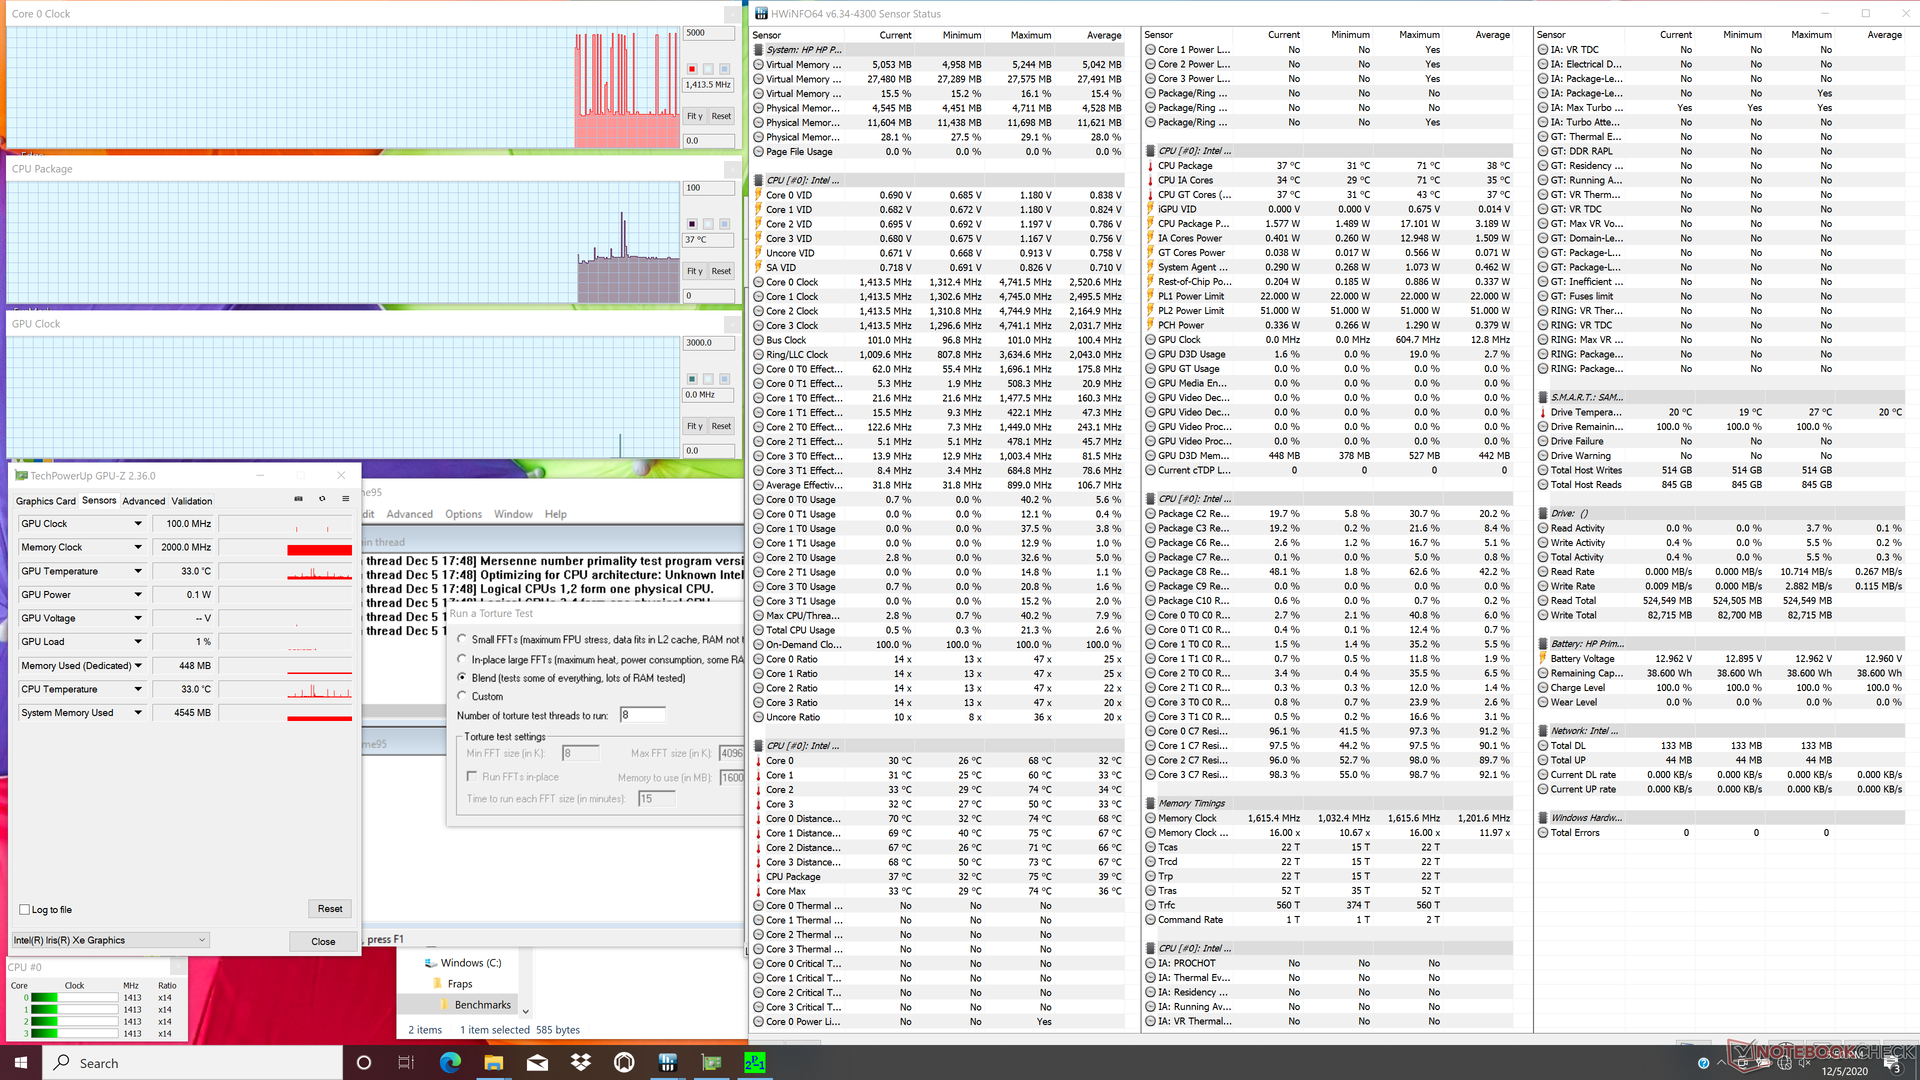
Quando si eseguono Prime95 e FurMark simultaneamente, le frequenze di clock di CPU e GPU si alternano a volte tra 1,2 GHz e 1,5 GHz e 0,8 GHz e 1000 MHz, rispettivamente, invece di rimanere costanti. Questo può anche accadere quando si gioca, il che può spiegare il comportamento del frame rate che oscilla durante l'esecuzione di The Witcher 3 come indicato in precedenza.
Quando si usa la batteria saranno limitate le prestazioni della GPU più pesantemente rispetto a quelle della CPU. Un test 3DMark 11 sulle batterie restituisce punteggi di Physics e Graphics di 8519 e 6578 punti, rispettivamente, rispetto a 8026 e 4714 punti con la rete elettrica.
| Orologio PCU(GHz) | OrologioGPU(MHz) | Temperatura media dellaCPU (°C) | |
| Sistema inattivo | -- | ---- | 37 |
| Prime95 Stress | 2.4 | -- | 63 |
| Prime95 + FurMark Stress | 1,2 | 800 | 64 |
| Witcher 3 Stress | 1.6 - 2.2 | 1200 | 65 |
Casse


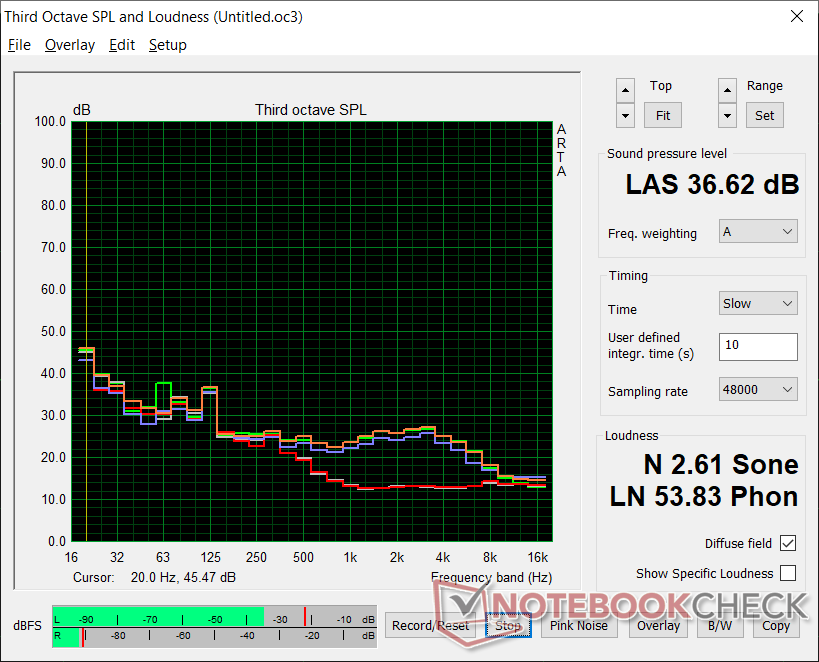
HP Pavilion 13-bb0015cl analisi audio
(+) | gli altoparlanti sono relativamente potenti (82.6 dB)
Bassi 100 - 315 Hz
(-) | quasi nessun basso - in media 17.1% inferiori alla media
(±) | la linearità dei bassi è media (12% delta rispetto alla precedente frequenza)
Medi 400 - 2000 Hz
(+) | medi bilanciati - solo only 1% rispetto alla media
(+) | medi lineari (1.5% delta rispetto alla precedente frequenza)
Alti 2 - 16 kHz
(+) | Alti bilanciati - appena 2.6% dalla media
(+) | alti lineari (6.1% delta rispetto alla precedente frequenza)
Nel complesso 100 - 16.000 Hz
(+) | suono nel complesso lineare (12% differenza dalla media)
Rispetto alla stessa classe
» 14% di tutti i dispositivi testati in questa classe è stato migliore, 4% simile, 81% peggiore
» Il migliore ha avuto un delta di 5%, medio di 18%, peggiore di 53%
Rispetto a tutti i dispositivi testati
» 9% di tutti i dispositivi testati in questa classe è stato migliore, 2% similare, 88% peggiore
» Il migliore ha avuto un delta di 4%, medio di 23%, peggiore di 134%
Apple MacBook 12 (Early 2016) 1.1 GHz analisi audio
(+) | gli altoparlanti sono relativamente potenti (83.6 dB)
Bassi 100 - 315 Hz
(±) | bassi ridotti - in media 11.3% inferiori alla media
(±) | la linearità dei bassi è media (14.2% delta rispetto alla precedente frequenza)
Medi 400 - 2000 Hz
(+) | medi bilanciati - solo only 2.4% rispetto alla media
(+) | medi lineari (5.5% delta rispetto alla precedente frequenza)
Alti 2 - 16 kHz
(+) | Alti bilanciati - appena 2% dalla media
(+) | alti lineari (4.5% delta rispetto alla precedente frequenza)
Nel complesso 100 - 16.000 Hz
(+) | suono nel complesso lineare (10.2% differenza dalla media)
Rispetto alla stessa classe
» 7% di tutti i dispositivi testati in questa classe è stato migliore, 2% simile, 90% peggiore
» Il migliore ha avuto un delta di 5%, medio di 18%, peggiore di 53%
Rispetto a tutti i dispositivi testati
» 5% di tutti i dispositivi testati in questa classe è stato migliore, 1% similare, 94% peggiore
» Il migliore ha avuto un delta di 4%, medio di 23%, peggiore di 134%
Gestione Energetica
Consumo di energia
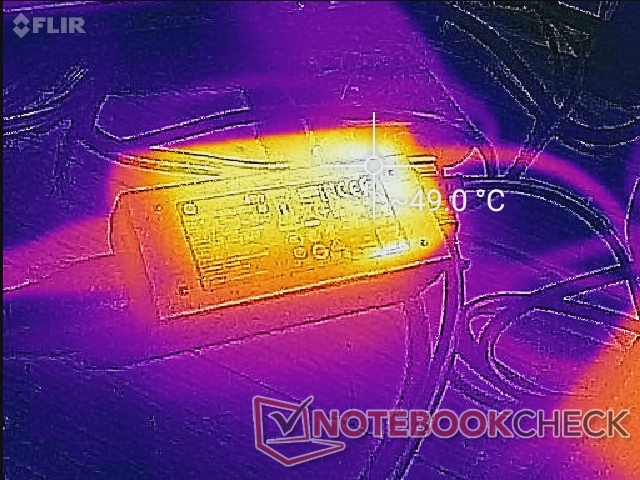
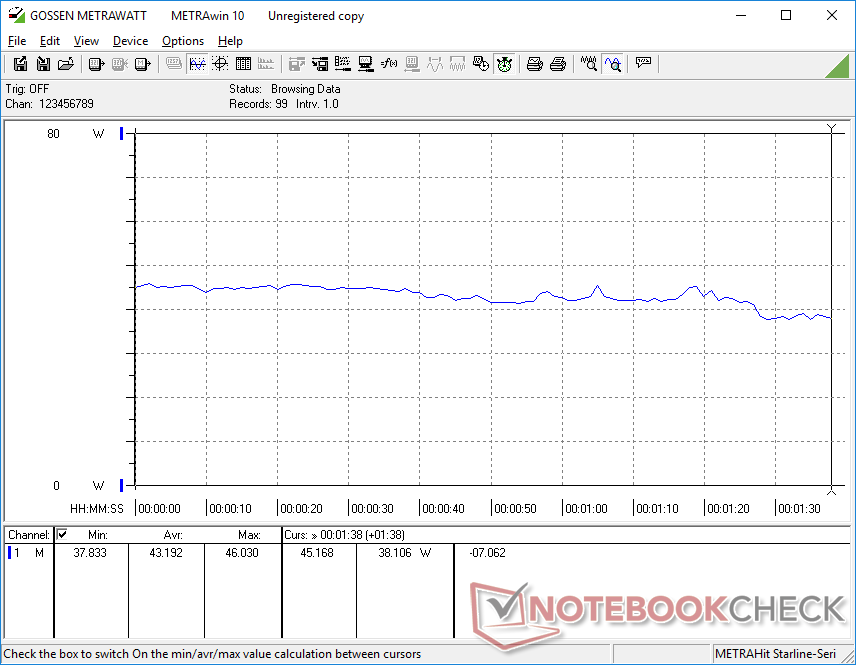
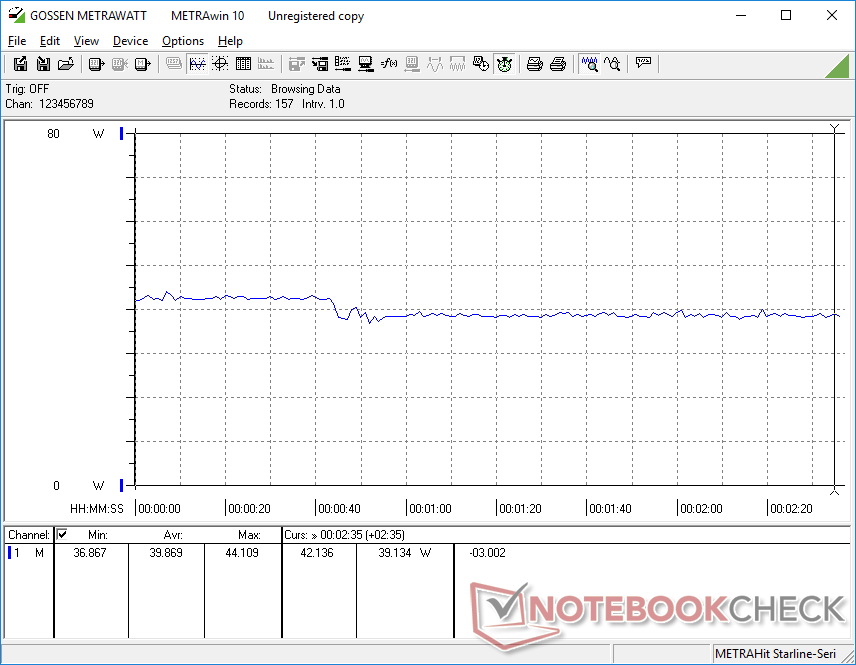
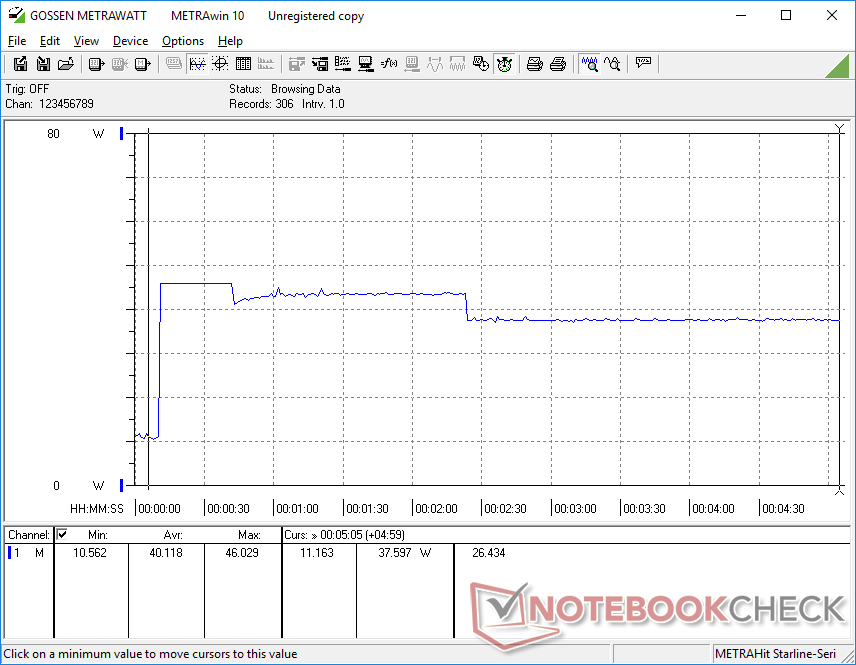
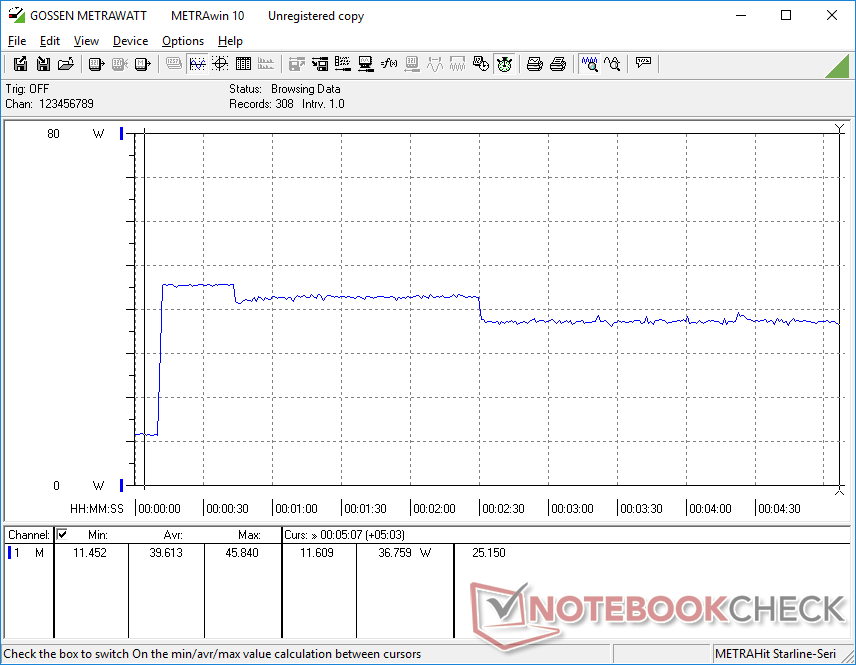
Il funzionamento a vuoto sul desktop consuma tra 4 W e 12 W a seconda del livello di luminosità e del profilo di potenza. Infatti, la differenza tra la luminosità minima e massima può arrivare fino a 6 W. Eseguire carichi più elevati come i giochi consumerà tra i 40 W e i 46 W risultando essere più o meno paragonabile a molti altri portatili da 13 pollici con processori più vecchi e lenti. Così, la più recente CPU Tiger Lake è in grado di fornire enormi guadagni in potenza grafica senza bisogno di attingere di più dalla presa di corrente.
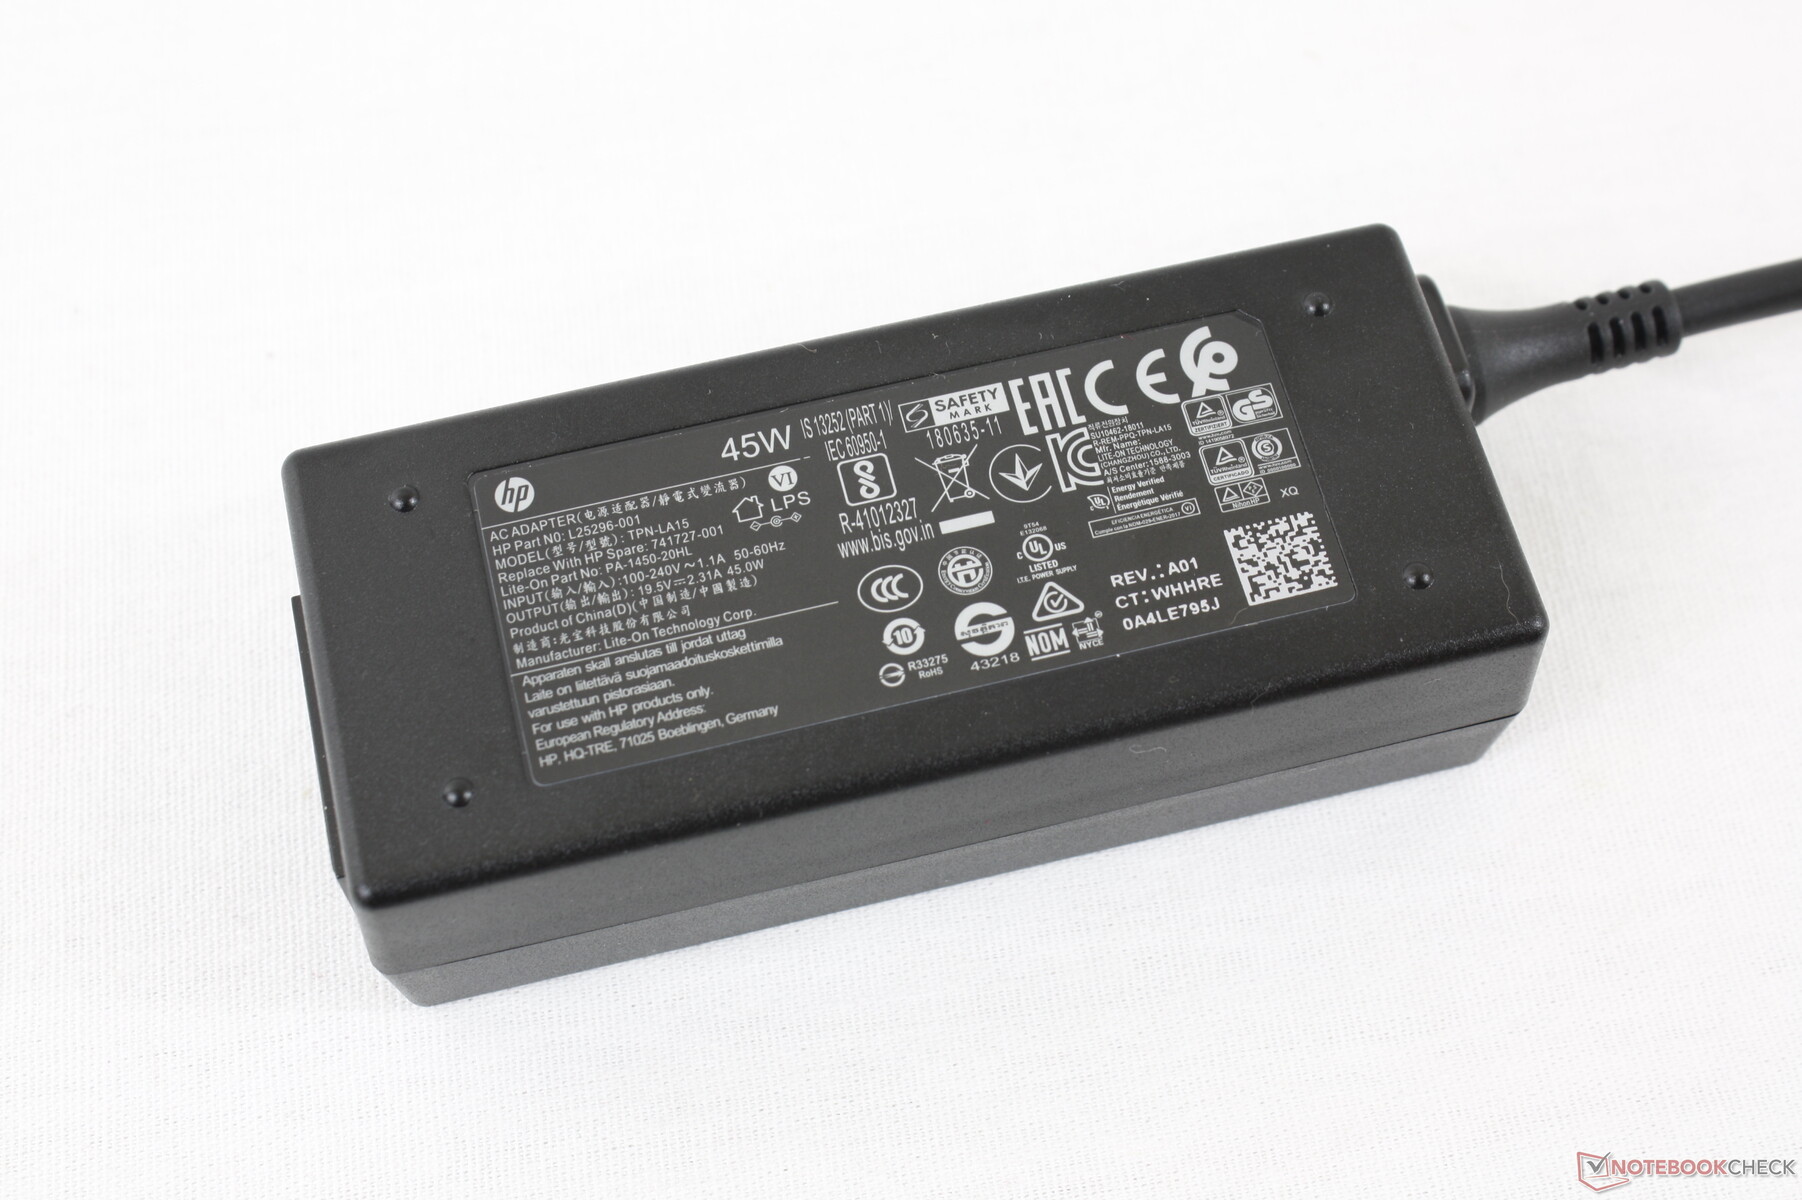
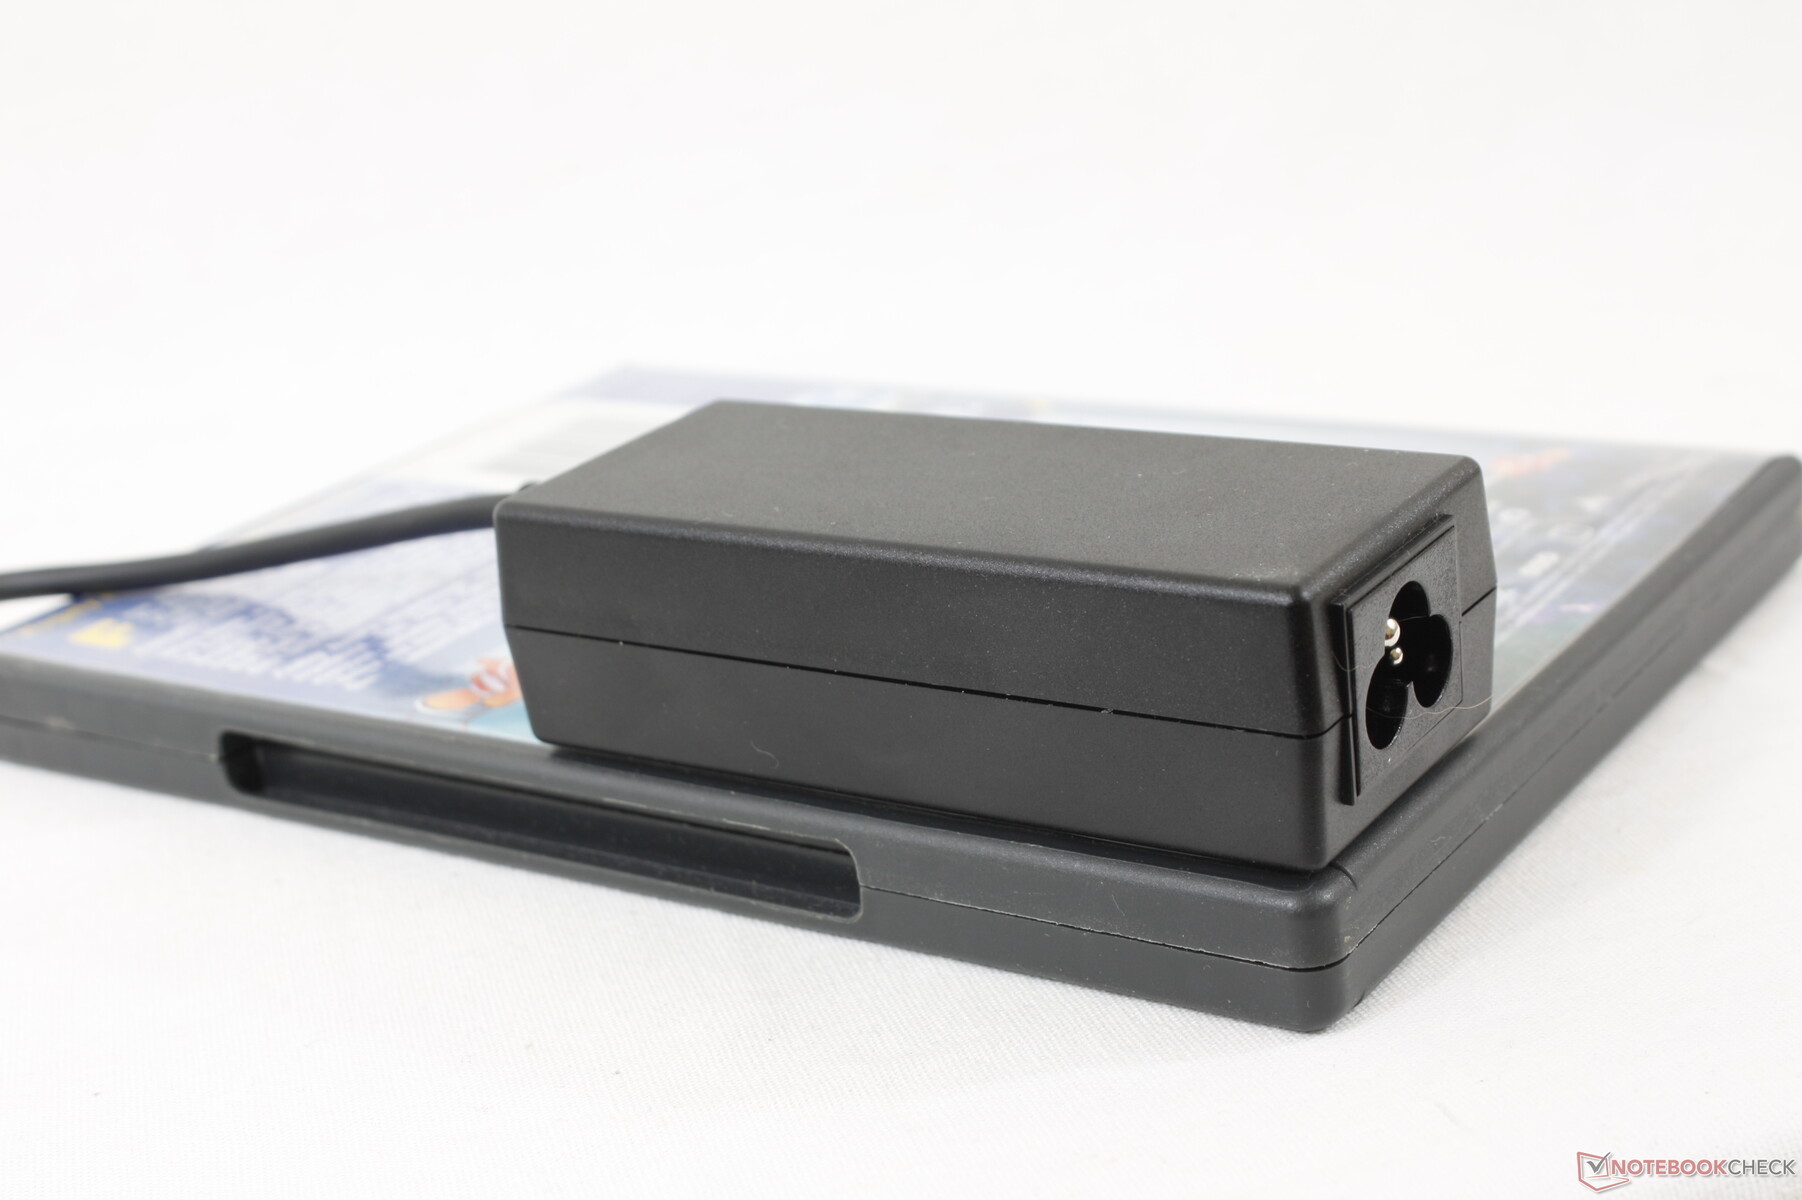
Un massimo temporaneo di 46 W può essere registrato dal piccolo (~10 x 4 x 2,7 cm) adattatore da 45 W.
| Off / Standby | |
| Idle | |
| Sotto carico |
|
Leggenda:
min: | |
| HP Pavilion 13-bb0015cl i7-1165G7, Iris Xe G7 96EUs, Samsung PM991 MZVLQ512HALU, IPS, 3840x2160, 13.3" | HP Envy 13-ba0001ng i7-10510U, GeForce MX350, Intel SSD 660p SSDPEKNW512G8, IPS, 1920x1080, 13.3" | Dell XPS 13 9300 i5 FHD i5-1035G1, UHD Graphics G1 (Ice Lake 32 EU), Toshiba XG6 KXG60ZNV512G, IPS, 1920x1200, 13.4" | Asus VivoBook S13 S330UA-EY034T i5-8550U, UHD Graphics 620, Kingston RBU-SNS8180DS3512GJ, IPS LED, 1920x1080, 13.3" | Lenovo IdeaPad S540-13ARE-82DL000YGE R5 4600U, Vega 6, WDC PC SN730 SDBPNTY-256G, IPS, 2560x1600, 13.3" | Acer Swift 3 SF313-52-71Y7 i7-1065G7, Iris Plus Graphics G7 (Ice Lake 64 EU), Intel SSD 660p 1TB SSDPEKNW010T8, IPS, 2256x1504, 13.5" | |
|---|---|---|---|---|---|---|
| Power Consumption | 28% | 18% | 15% | -0% | 48% | |
| Idle Minimum * (Watt) | 4.6 | 2 57% | 3.4 26% | 2.8 39% | 1.8 61% | |
| Idle Average * (Watt) | 10.6 | 4 62% | 6 43% | 5 53% | 4.6 57% | |
| Idle Maximum * (Watt) | 11.4 | 6.5 43% | 10.2 11% | 8.3 27% | 9.4 18% | 6.1 46% |
| Load Average * (Watt) | 43.2 | 44 -2% | 36.6 15% | 42.8 1% | 37.6 13% | 27.4 37% |
| Witcher 3 ultra * (Watt) | 39.9 | |||||
| Load Maximum * (Watt) | 46 | 55.6 -21% | 49.3 -7% | 65.8 -43% | 60.7 -32% | 27 41% |
* ... Meglio usare valori piccoli
Durata della batteria
La capacità della batteria è ridotta e i tempi di funzionamento sono successivamente ridotti a sole 4,5 ore di utilizzo della WLAN nel mondo reale. In confronto, i computer portatili Envy o Spectre, più costosi, possono durare più del doppio in condizioni simili.
La ricarica da vuoto a pieno carico richiede da 1,5 a 2 ore circa. Il laptop può anche ricaricarsi tramite USB-C, anche se la scatola di vendita al dettaglio include un caricatore brevettato.
| HP Pavilion 13-bb0015cl i7-1165G7, Iris Xe G7 96EUs, 43 Wh | HP Envy 13-ba0001ng i7-10510U, GeForce MX350, 51 Wh | Dell XPS 13 9300 i5 FHD i5-1035G1, UHD Graphics G1 (Ice Lake 32 EU), 52 Wh | Asus VivoBook S13 S330UA-EY034T i5-8550U, UHD Graphics 620, 42 Wh | Lenovo IdeaPad S540-13ARE-82DL000YGE R5 4600U, Vega 6, 56 Wh | Acer Swift 3 SF313-52-71Y7 i7-1065G7, Iris Plus Graphics G7 (Ice Lake 64 EU), 54.5 Wh | |
|---|---|---|---|---|---|---|
| Autonomia della batteria | 88% | 161% | 87% | 79% | 101% | |
| Reader / Idle (h) | 10.8 | 15.7 45% | 21 94% | 21.4 98% | ||
| WiFi v1.3 (h) | 4.5 | 10.5 133% | 11.7 160% | 8.4 87% | 11 144% | 10.3 129% |
| Load (h) | 1.3 | 2.4 85% | 3.4 162% | 1.3 0% | 2.3 77% |
Pro
Contro
Giudizio complessivo
Per 730 USD, il Pavilion 13 viene fornito con la CPU Intel Core i7-1165G7, la grafica integrata Iris Xe, il display 1080p, 16 GB di RAM ed SSD NVMe da 512 GB, il tutto avvolto in un solido chassis che appare migliore rispetto ai modelli della generazione precedente. Il valore che gli acquirenti stanno ottenendo è il punto di forza di Pavilion, soprattutto se si considerano le elevate prestazioni in rapporto al prezzo e le discrete capacità gaming.
Gli utenti rinunceranno alla lunga durata della batteria, a Windows Hello, al supporto Thunderbolt e alla facilità di manutenzione. Anche il tasto Invio spugnoso e il clickpad ci vorrà un po' per abituarsi e speriamo che HP possa rafforzare le cerniere per i modelli futuri. Ma per un portatile economico, il 2020 Pavilion 13 eccelle in quasi tutte le aree giuste.
Il Pavilion 13 2020 offre specifiche e prestazioni elevate in relazione al prezzo e alle dimensioni. Il design del telaio ispirato allo Spectre aiuta il laptop a sembrare e essere simile ad un laptop di fascia media, senza costi altrettanto elevati.
HP Pavilion 13-bb0015cl
- 12/08/2020 v7 (old)
Allen Ngo
Price comparison
